EXHIBIT 99.D
DESCRIPTION OF THE REPUBLIC OF SOUTH AFRICA
DATED DECEMBER 2, 2013
INCORPORATION OF DOCUMENTS BY REFERENCE
This document is an exhibit to the Republic of South Africa’s Annual Report on Form 18-K under the Exchange Act of 1934 for the fiscal year ended March 31, 2013. All amendments to such Annual Report on Form 18-K/A filed by South Africa following the date hereof shall be incorporated by reference into this document. Any statement contained in a document, all or a portion of which is incorporated or deemed to be incorporated by reference herein, shall be deemed to be modified or superseded for purposes of this document to the extent that a statement contained herein or in any other subsequently filed document that also is or is deemed to be incorporated by reference herein modified or supersedes such statement. Any statement so modified or superseded shall not be deemed, except as so modified or superseded, to constitute a part of this document.
TABLE OF CONTENTS
| | | | |
SUMMARY INFORMATION | | | 4 | |
| |
INTRODUCTION | | | 6 | |
| |
REPUBLIC OF SOUTH AFRICA | | | 9 | |
Area and Population | | | 9 | |
Government and Political Parties | | | 9 | |
Land Reform | | | 16 | |
Mining Industry Reform | | | 17 | |
Crime Prevention | | | 19 | |
International Relations | | | 23 | |
Regional Arrangements | | | 26 | |
Development Finance Institutions (DFIs) | | | 28 | |
Public Health | | | 29 | |
| |
THE SOUTH AFRICAN ECONOMY | | | 32 | |
Overview | | | 32 | |
Informal Sector of the Economy | | | 57 | |
Prices and Wages | | | 62 | |
| |
MONETARY AND FINANCIAL SYSTEM | | | 64 | |
The SARB | | | 64 | |
Monetary Policy | | | 64 | |
Financial System Stability | | | 68 | |
Regulation of the Financial Sector | | | 69 | |
Structure of the Banking Industry | | | 71 | |
Financial Sector Charter | | | 72 | |
Credit Allocation | | | 73 | |
Capital Markets | | | 75 | |
Exchange Controls | | | 77 | |
Gold and Foreign Exchange Contingency Reserve Account (GFECRA) | | | 80 | |
| |
THE EXTERNAL SECTOR OF THE ECONOMY | | | 81 | |
Foreign Trade | | | 82 | |
| |
PUBLIC FINANCE | | | 96 | |
Background | | | 96 | |
1
| | | | |
The Budget Process | | | 100 | |
MTBPS | | | 101 | |
Taxation | | | 105 | |
Company Tax | | | 106 | |
Revenue | | | 109 | |
Financing | | | 110 | |
Public Enterprises | | | 112 | |
| |
NATIONAL GOVERNMENT DEBT | | | 120 | |
General | | | 120 | |
Summary of Internal National Government Debt | | | 121 | |
Summary of External National Government Debt | | | 122 | |
Guaranteed Debt | | | 122 | |
Debt Service Costs | | | 123 | |
Debt Record | | | 125 | |
Tables and Supplementary Information | | | 126 | |
2
In this document, the government of the Republic of South Africa is referred to as the “National Government” or the “South African Government”. The currency of the Republic of South Africa (South Africa) is the South African Rand. In this document, all amounts are expressed in South African Rand (R or Rand) or U.S. Dollars (US$, $ or Dollars), except as otherwise specified. See “The External Sector of the Economy — Reserves and Exchange Rates” for the average rates for the Rand against the Dollar for each of the years 2008 through 2012 and for the 11-month period ended November 30, 2013. On November 29, 2013, the exchange rate, as reported by the South African Reserve Bank (SARB), was R10.1911 per Dollar (or 9.812 U.S. cents per Rand).
The Republic’s fiscal year begins on April 1 and ends on March 31. For example, the 2013 fiscal year refers to the fiscal year beginning April 1, 2012 and ending March 31, 2013. Economic data presented in this description is presented on a calendar year basis unless reference is made to the relevant fiscal year or the fiscal year is otherwise indicated by the context. For example, economic data referring to the “first quarter” of 2013 refers to data as at, or for the three months ended, June 30, 2012. Economic data referring to the “first three months” of 2013, by contrast, refers to data as at, or for the three months ended, March 31, 2013.
Unless otherwise indicated, references to gross domestic product (GDP) are to real GDP, calculated using constant prices in order to adjust for inflation (with 2005 as a base year), and % changes in GDP refer to changes as compared to the previous year or the same quarter of the previous year, unless otherwise indicated.
Unless otherwise stated herein, references in this description to the 2013-2014 Budget are to the 2013-2014 National Budget as released in February 2013 and not as amended by the Medium Term Budget Policy Statement (MTBPS) released on October 23, 2013. References to the 2013-2014 Consolidated Budget, which includes the 2013-2014 National Budget as part thereof, shall be construed accordingly.
Some figures included in this document have been subject to rounding adjustments. As a result, sum totals of data presented in this document may not precisely equate to the arithmetic sum of the data being totaled.
3
SUMMARY INFORMATION
The following summary tables do not purport to be complete and are qualified in their entirety by the more detailed information appearing elsewhere in this document.
The following tables set forth certain summary statistics about the economy of South Africa, public finance and debt of the National Government for the periods indicated.
| | | | | | | | | | | | | | | | | | | | | | | | |
| | | As of and for the year ended December 31, | | | As of and for
the six months
ended June 30,(1) | |
| | | 2008 | | | 2009 | | | 2010 | | | 2011 | | | 2012 | | | 2013 | |
| | | Rand (million) (except percentages) | |
The Economy | | | | | | | | | | | | | | | | | | | | | | | | |
Gross Domestic Product (GDP) | | | | | | | | | | | | | | | | | | | | | | | | |
Nominal GDP(2) | | | 2,256,485 | | | | 2,406,401 | | | | 2,659,366 | | | | 2,917,539 | | | | 3,155,195 | | | | 3,312,258 | (3) |
Real GDP(4) | | | 1,814,594 | | | | 1,786,897 | | | | 1,842,052 | | | | 1,905,736 | | | | 1,954,303 | ) | | | 1,980,963 | (3) |
Real % change from prior year | | | 3.6 | % | | | (1.5 | )% | | | 3.1 | % | | | 3.5 | % | | | 2.5 | % | | | 1.7 | % |
Change in per capita earnings (%)(5) | | | 2.9 | % | | | (0.4 | )% | | | 3.9 | % | | | 2.5 | % | | | 0.8 | | | | N/A | |
Total merchandise exports | | | 655,759 | | | | 503,656 | | | | 565,860 | | | | 671,220 | | | | 696,120 | | | | 204,640 | |
Unemployment rate (%) | | | 22.9 | % | | | 24.0 | % | | | 24.9 | % | | | 25.0 | % | | | 25.5 | % | | | 24.7 | %(7) |
Balance of trade (Rand billion) | | | (71.6 | ) | | | (27.3 | ) | | | (4.8 | ) | | | (16.9 | ) | | | (117.7 | ) | | | (75.9 | )(6) |
Balance of payments | | | | | | | | | | | | | | | | | | | | | | | | |
Current account | | | (161,874 | ) | | | (97,062 | ) | | | (74,958 | ) | | | (98,785 | ) | | | (197,595 | ) | | | (54,651 | )(6) |
Financial account | | | 97,815 | | | | 131,324 | | | | 87,434 | | | | 45,889 | | | | 162,430 | (7) | | | 1.023 | (6) |
Change in gross gold and other foreign reserves | | | 92,677 | | | | (24,289 | ) | | | (2,076 | ) | | | 107,194 | | | | 33,123 | | | | 9,595 | |
Rand/Dollar exchange rate (average) | | | 8.25 | | | | 8.62 | | | | 7.32 | | | | 8.58 | | | | 8.64 | | | | 10.2009 | (8) |
Consumer prices (2012/12=100) | | | 80.8 | | | | 85.9 | | | | 88.5 | | | | 92.8 | | | | 97.8 | | | | 101.8 | (9) |
Producer prices (2012/12=100)) | | | 83.5 | | | | 86.6 | | | | 88.6 | | | | 93.5 | | | | 100 | | | | 106.4 | (9) |
Average monthly yields for listed National Government debt securities 5-10 yrs | | | 9.15 | | | | 8.25 | | | | 7.41 | | | | 8.01 | | | | 6.50 | | | | 7.41 | |
Average monthly yields for listed National Government debt securities > 10 yrs | | | 9.10 | | | | 8.70 | | | | 8.38 | | | | 8.51 | | | | 7.37 | | | | 7.97 | |
4
| | | | | | | | | | | | | | | | | | | | | | | | | | | | |
| | | As of and for the fiscal year ended March��31, | |
| | | 2008 | | | 2009 | | | 2010 | | | 2011 | | | 2012 | | | 2013(11) | | | 2014(12) | |
Main Government Revenue | | | 560,794.6 | | | | 608,795.7 | | | | 579,678.6 | | | | 669,737.5 | | | | 740,084,0 | | | | 794,433.0 | | | | 998,900,0 | |
% of GDP(2) | | | 27.1 | % | | | 26.4 | % | | | 23.8 | % | | | 24.3 | % | | | 27.7 | % | | | 28.3 | % | | | 28.7 | % |
Main Government Expenditure | | | 541,498.8 | | | | 635,953.3 | | | | 747,196.8 | | | | 805,141.0 | | | | 888,046.0 | | | | 967,463.0 | | | | 967,463.0 | |
% of GDP(2) | | | 26.2 | % | | | 27.6 | % | | | 30.6 | % | | | 29.3 | % | | | 29.4 | % | | | 29.6 | % | | | 29.6 | % |
Main Budget Deficit | | | 19,315.2 | | | | (27,715.6 | ) | | | (167,518.2 | ) | | | (135,403.4 | ) | | | (147,962.0 | ) | | | (173,031.0 | ) | | | (173,031.0 | ) |
% of GDP(2) | | | 0.9 | % | | | (1.2 | )% | | | (6.7 | )% | | | (4.9 | )% | | | (4.9 | )% | | | (5.3 | )% | | | (5.3 | )% |
Net borrowing requirement | | | 20,425.4 | | | | (23,238.3 | ) | | | (161,754.8 | ) | | | (133,232.3 | ) | | | (144,141.0 | ) | | | (165,533.0 | ) | | | (165,533.0 | ) |
Change in cash and other balances(10) | | | (18,904.7 | ) | | | (8,091.4 | ) | | | (30,128.9 | ) | | | (41,350.1 | ) | | | (22,219.0 | ) | | | 24,328.0 | | | | 24,328.0 | |
Notes:—
N/A = not available
| (1) | First half of 2013, seasonally adjusted and annualized. |
| (3) | Estimate for first half of 2013, seasonally adjusted and annualized. |
| (4) | At constant 2005 prices. |
| (5) | Real growth rate in per capita earnings, at constant 2005 prices. |
| (6) | Estimates to June 30, 2013. |
| (7) | Quarterly Labour Force Survey (QLFS) as of September 30, 2013. |
| (8) | Rand/Dollar rates are averages for the period through November 29, 2013. |
| (9) | As of July 30, 2013. Calculated based on the average values over the seven months. |
| (10) | The total debt of National Government (net) is calculated with due account of the bank balances of the National Revenue Fund (balances of National Government’s accounts with the SARB and the Tax and Loans Accounts with commercial banks). |
| (11) | Final outcome for fiscal year 2013, as reflected in the MTBPS (October 2013). |
| (12) | Estimates as revised and reflected in the MTBPS (October 2013). |
Source: South African National Treasury, SARB and Statistics SA (Stats SA).
5
INTRODUCTION
South Africa has been an established constitutional democracy since 1994, when it held its first fully democratic national elections. South Africa has the most developed economy in Sub-Saharan Africa in terms of total GDP, and accounted for approximately one-third of the aggregate GDP of Sub-Saharan Africa during 2011 (source: IMF, World Economic Outlook Database, October 2013). The South African economy is diverse and supported by a well-developed legal system and a sophisticated financial system. The major strengths of the South African economy are its services and manufacturing sectors, its strong physical and economic infrastructure and its abundant natural resources, including gold, platinum metals and coal.
The country’s fourth fully democratic national elections took place on April 22, 2009, and saw the ruling African National Congress (ANC) maintaining its significant majority in Parliament. On May 9, 2009, ANC President Jacob Zuma was sworn in as the President of South Africa, replacing Kgalema Motlanthe, who became deputy president. The next South African general election will be held on a date in April–July 2014 to elect a new National Assembly, as well as new provincial legislatures in each province. This will be the fifth democratic elections since the apartheid era.
Historically, from 1993 until 2012, the GDP growth rate averaged 3.3% reaching an all time high of 7.6% in December of 1994 and a record low of -6.3% in March of 2009. South Africa’s real gross domestic product (GDP) accelerated to 3.0% in the second quarter of 2013 from 0.9% in the first quarter, driven mainly by the primary sector, which includes agriculture and mining. The 2013 MTBPS projects that South Africa’s GDP growth is expected to improve over the medium term. As a result of the expected impact of improved global growth rates and domestic infrastructure improvements, real GDP growth is forecast to average 2.1% in 2013, down from 2.5% in 2012 and 3.5% in 2011and expected to recover over the next three years, reaching 3.5% in 2016.
As in many other economies, the National Government has taken steps to mitigate the impact of the global economic crisis on the economy through more expansionary fiscal and monetary policies and measures to support ailing industries.
The 2013 Budget Review announced several reforms to help local firms expand into the rest of Africa, and companies have begun to take up opportunities under this provision.
Growth in real gross fixed capital formation slowed to 4.1% in the first half of 2013, compared with 6.0% in the corresponding period of 2012. Unplanned delays and sluggish uptake of new projects slowed investment spending by public corporations. Public-sector investment growth fell to 5.7% in the first half of the year from 8.5% in the first half of 2012. Industrial action at the Medupi power plant in the first quarter, and delays in capital spending by Transnet and the South African National Roads Agency Limited, caused investment growth in the electricity and transport sectors to slow.
Economic growth has been weaker than expected in 2013, but tax revenue collection has shown resilience. Expected gross tax revenue for 2013/14 has been revised down by R3 billion to R895 billion. Personal income tax collection remains strong as a result of high wage settlements, and corporate income tax has been robust. Taxes on imported goods have been buoyant. The revised estimate for corporate income tax revenue is virtually unchanged, but there is a degree of uncertainty about the second half of the fiscal year. In aggregate, nominal gross tax revenues for the first six months of the fiscal year increased by 9.5% year-on-year. In contrast, however, lower domestic VAT and excise duties point to reduced consumer demand and weaker income tax collection over the medium term. The factors driving current buoyancy in other taxes also suggest a weaker outlook. This year’s sharp depreciation of the rand is unlikely to result in a sustained surge in company profits, as cost pressures increase and trade contracts are adjusted.
The Tax Review Committee that was established in July 2013 by the Minister of Finance is mandated to inquire into the role of the tax system in promoting inclusive economic growth, employment creation, development and fiscal sustainability. Its recommendations will inform any changes to tax policy.
The 2013 Budget was the first since 1999 that did not increase spending over previously announced spending plans. During the mid-2000s, actual expenditure in the third year of medium-term expenditure framework (MTEF) periods was typically 15% higher than initial estimates, as buoyant economic growth and revenue allowed for increases. Given the outlook for economic growth and revenue, the Government has indicated that it plans to maintain spending within previously announced limits eliminating wasteful expenditure. To this end, the Cabinet is expected to decide on the details of cost-containment instructions that will be issued with the 2014 Budget.
Over the medium term the Government will seek to ensure that growth in employment and earnings does not threaten the expenditure ceiling. Specific attention will be paid to restraining growth in administrative posts. Since 2005, more than 250,000 personnel have been added to national and provincial government payrolls, with the largest increases in education, health care and criminal justice. While most of the new positions were created for teachers, nurses and police officers, there is concern about the growth of managerial and administrative staffing across government.
6
South Africa believes that its debt-to-GDP ratio remains sustainable. In a recent assessment, the International Monetary Fund reached the same conclusion. Government’s debt management strategy focuses on debt sustainability, keeping the cost of debt as low as possible, maintaining access to global capital markets and diversifying funding instruments. The strategy also seeks to ensure continued bond market development, drawing on the strength of South Africa’s deep and liquid capital markets. To limit external vulnerability, debt is largely denominated in domestic currency. Maturities are increasingly long term. The main budget net borrowing requirement is projected to increase from R168.5 billion in 2013/14 to R183.9 billion in 2014/15, before declining to R164.9 billion in 2016/17. National government net debt is projected to reach 39.3% of GDP in 2013/14 and 43.9% in 2016/17.
State-owned companies are at the centre of South Africa’s infrastructure expansion. State corporations are expected to borrow on the strength of their balance sheets, rather than being funded from the fiscus. Net loan debt, provisions and contingent liabilities are expected to remain well within the Southern African Development Community’s macroeconomic convergence target of 60% of GDP.
The employment rate continued to improve, according to the Quarterly Labour Force Survey, with employment gains of 383,000 jobs as of September 30, 2013 as compared to 2012. Growth in the formal non-agricultural sector, however, remained muted as gains in the public and financial sectors were offset by employment losses in mining, manufacturing and construction.
In July 2013, consumer price inflation rose to 6.3%, breaching the 3- 6% target band for the first time since April 2012. Higher transport costs, administered and food prices, and miscellaneous goods and services were the main contributors to higher inflation.
7
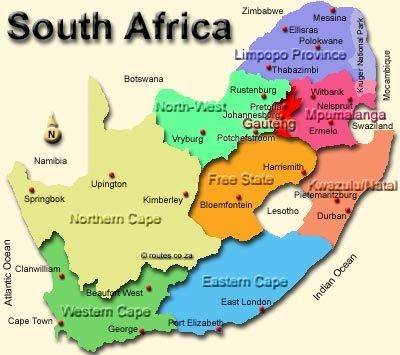
MAP OF THE REPUBLIC OF SOUTH AFRICA
8
REPUBLIC OF SOUTH AFRICA
Area and Population
South Africa is situated on the southern tip of the African continent, with the Atlantic Ocean to the west and the Indian Ocean to the east. The north of the country shares common borders with Namibia, Botswana and Zimbabwe and, to the north east, the country shares a border with Mozambique. South Africa also shares common borders with the kingdoms of Lesotho and Swaziland. The total surface area of South Africa is approximately 1,219,090 square kilometers, with over 3,000 kilometers of coastline.
South Africa comprises nine provinces, which are the Eastern Cape, Free State, Gauteng, KwaZulu-Natal, Limpopo, Mpumalanga, Northern Cape, North West and Western Cape Provinces.
In the former racial classification that formed the basis for the apartheid system, “Black” referred to persons of original African indigenous origin, “Asian” to persons of Asian origin, “White” to persons of Caucasian ethnic origin and “Coloured” to persons of mixed race. While the National Government no longer makes any unfair discrimination based on race, the country’s history of racial division and racial and ethnic differences continues to have social and economic significance. This is because social and economic policies are judged partly by their ability to address disparities and discrimination and to equalize opportunities. Therefore, in this document, reference to such racially classified statistics is made occasionally to illustrate those disparities.
South Africa’s population is approximately 52.98 million people as at 14 May 2013, of which 27.16 million people, representing 51.3% of the population, are female. Approximately 79.8 % are Black, 9.0% are Coloured, 2.5% are Indian/Asian and 8.7% are White (source: Stats SA Mid-year population estimate 2013). The most densely populated parts of South Africa are the four major industrialized areas, the Pretoria/Witwatersrand/Vereeniging area of Gauteng (which includes Johannesburg), the Durban/Pinetown/Pietermaritzburg area of KwaZulu-Natal, the Cape Peninsula area of the Western Cape (which includes Cape Town) and the Port Elizabeth/Uitenhage area of the Eastern Cape.
Stats SA estimates the average life expectancy in South Africa for females to be 61.4 years, and for males to be 57.7 years. However, it should be noted that life expectation estimates vary, primarily due to differences in assumptions about the rapidity with which the HIV epidemic will spread and the morbidity and mortality of the disease (see “— Public Health — HIV, AIDS and Tuberculosis (TB)”).
South Africa has a diverse population consisting of Afrikaans and English-speaking Whites, Asians (including Indians), Coloureds, Khoi, Nguni, San, Sotho-Tswana, Tsonga, Venda and persons that have immigrated to South Africa from across the globe. By virtue of the country’s diversity, South Africa has 11 official languages, namely Afrikaans, English, isiNdebele, isiXhosa, isiZulu, Sepedi, Sesotho, Setswana, siSwati, Tshivenda and Xitsonga. According to the results of the census conducted in 2011, isiZulu is the mother tongue of 22.6% of the population, followed by isiXhosa at 15.9%, Sepedi at 9.1%, Afrikaans at 7.9%, and English and Setswana at 8.2% each. IsiNdebele is the least spoken language in South Africa, at 1.5% (source: Census 2011).
Government and Political Parties
Constitution
Following the repeal of apartheid legislation, South Africa held its first fully democratic national election in 1994. The final Constitution was adopted in 1996 and phased in between 1997 and 1999. South Africa’s Constitution is hailed as one of the most progressive in the world and enjoys high acclaim internationally. The Constitution states that South Africa is “founded on a commitment to achieve equality, to promote and protect human dignity and to advance human rights and freedoms”. The Constitution enshrines the principles of supremacy of the rule of law, universal adult suffrage, regular elections and multi-party democracy. The Bill of Rights contained in Chapter 2 of the Constitution is one of the world’s broadest, guaranteeing freedom of speech, movement and political activity, and providing persons accused of crimes with many legal protections including the right to a speedy trial and the right to remain silent. The Bill of Rights also enshrines the right to access to adequate housing, food, water, education and healthcare, and prohibits discrimination on the basis of race, gender, sexual orientation, age, pregnancy or marital status.
9
The Constitution provides for the separation of powers among the legislative, executive and judicial branches of the National Government. Under the Constitution, the bicameral Parliament, in which the legislative authority of the National Government is vested, is comprised of a National Assembly and a National Council of Provinces.
The National Assembly consists of no fewer than 350 and no more than 400 members elected on the basis of proportional representation pursuant to which political parties receive seats in proportion to the votes cast for the parties concerned. Of the 400 seats in the National Assembly, approximately 200 seats are selected from provincial lists, with a fixed number allocated to each province. The remaining seats are filled from national lists to ensure proportionality in accordance with the total number of votes cast for each party in the national election.
The National Council of Provinces consists of 90 members (namely 54 permanent members and 36 special delegates). Each of the nine provincial legislatures elects ten representatives.
The Constitution provides for national elections every five years and places all elections and referendums in the country for all three spheres of government (national, provincial and local) under the control of the Independent Electoral Commission (IEC). The most recent national and provincial elections were held in April 2009 and municipal elections took place in May 2011. The next national and provincial elections are due to take place in mid-2014.
Each province has its own executive authority, the premier. The premiers are elected by each Provincial legislature from among its members. The powers of the premier are exercised in consultation with a provincial executive council, which is constituted in a manner similar to the Cabinet in the National Government. The provinces exercise limited power on a national level, principally through their representatives in the National Council of Provinces, and also through their power to block Parliamentary action affecting the constitutional position and status of the provinces.
Political Parties
The ANC, which was founded in 1912 and which led the struggle against apartheid, is the ruling party in eight of the nine South African provinces and is the most influential party in South Africa in terms of the size of its electoral constituency support. The ANC occupies 264 of the National Assembly’s 400 seats. Every five years the ANC holds a National Conference, which is its highest decision-making body, and which decides the policies of the ANC, adopts proposed constitutional amendments and elects the National Executive Committee. At its 53rd National Conference, held in Mangaung, Free State Province from December 16-20, 2012, the ANC re-elected the current President of South Africa, Jacob Zuma, as president of the ANC, and Cyril Ramaphosa as his deputy. The 80-member National Executive Committee, which is the party’s highest decision-making body between conferences, was also elected at the National Conference.
The ANC Youth League (ANCYL), under the former leadership of Julius Malema and its principal spokesperson, Floyd Shivambu, made a number of public statements during the last three years calling for the nationalization of mines and mining assets. The ANCYL has also advocated for the nationalization of banks and the expropriation of agricultural land without compensation. Various ANC officials have responded by stating that nationalization is neither government nor ANC policy.
In November 2011, Julius Malema faced disciplinary hearings for allegedly bringing the ANC party into disrepute and sowing division in the party ranks. The disciplinary committee found him guilty and suspended Malema from the ANC for five years. Mr Malema appealed the decision. In April 2012, the National Disciplinary Committee of Appeals (NDCA) dismissed the appeal by Mr Malema. With regards to Mr Malema’s disciplinary hearing held in May 2010, the sanction imposed by the National Disciplinary Committee (NDC) that Mr Malema’s ANC membership be suspended for a period of two years was confirmed. In respect of the hearing held in 2011, the NDCA confirmed the sanction imposed by the NDC that Mr Malema be expelled from the ANC.
Following his expulsion from the ANC, Julius Malema launched the Economic Freedom Fighters (EFF) party, which was officially registered by the Independent Electoral Commission (IEC) on September 5, 2013. The launch of the EFF marked the second headline launch of a new political party during 2013. In February 2013, former World Bank Managing Director and anti-apartheid activist Dr Mamphela Ramphele announced the launch of the Agang party as a challenger to the ANC. Agang was registered with the IEC on August 1, 2013.
The Democratic Alliance (DA), founded in 2000, currently serves as the official opposition in the National Assembly. In the 2004 elections, the DA won 50 of the 400 seats in the National Assembly and after the 2009 national and provincial elections it now holds 67 seats. In early 2007, Helen Zille assumed the leadership of the DA after former leader Tony Leon stepped down.
10
On August 15, 2010, the DA and the Independent Democrats announced that the two parties had ratified a memorandum of understanding, paving the way for complete integration by 2014. The memorandum of understanding makes provision for Independent Democrat members of the National Assembly and Provincial Legislatures to hold dual membership until the next national and provincial elections in 2014.
On November 10, 2008, a faction of the ANC broke away from the party and launched a new political party, called the Congress of the People (COPE), led by former ANC chief whip and Defence Minister Mosiuoa Lekota and former Gauteng Premier Mbhazima Shilowa. COPE won 30 seats in the National Assembly following the April 2009 elections. Since then, there has been a protracted leadership dispute between Mr Lekota and Mr Shilowa. The South Gauteng High Court validated Mr Lekota as the rightful head of COPE in a ruling handed down in October 2013, however Mr Shilowa has indicated that he is likely to continue to challenge for a position within COPE through the courts.
The Inkatha Freedom Party (IFP) was founded in 1975. In 2004, the IFP won 28 seats in the National Assembly which were reduced to 18 after the 2009 elections. In the May 2011 municipal elections, the IFP was unable to lodge the required documentation in time to contest the local government election in Umzumbe, an IFP stronghold. This culminated in an urgent application to the Constitutional Court, the result of which was an affirmation by the Constitutional Court of the Electoral Commission’s view that the IFP could not contest the election in Umzumbe. The current leader of the IFP is Chief Mangosuthu Buthelezi.
A number of minority parties make up the balance of the seats presently held in the National Assembly, including the United Democratic Movement (UDM, 4 seats), the Independent Democrats (ID, 4 seats), the Freedom Front Plus (VF Plus, 4 seats), the African Christian Democratic Party (ACDP, 3 seats), the United Christian Democratic Party (UCDP, 2 seats), the Pan Africanist Congress of Azania (PAC, 1 seat), the Minority Front (MF, 1 seat), Azanian People’s Organisation (AZAPO, 1 seat) and the African People’s Convention (APC, 1 seat).
Presidential Developments
Following the June 1999 elections, Thabo Mbeki of the ANC succeeded Nelson Mandela as President and continued to serve as President following the 2004 elections. Phumzile Mlambo-Ngcuka, who had been serving in the Cabinet as Minister of Minerals and Energy, was appointed as the first female Deputy President of South Africa in July 2005, replacing Deputy President Jacob Zuma who was released from his duties by the then President Thabo Mbeki following allegations of corruption. On September 20, 2006 the charges of corruption against Jacob Zuma were struck from the court roll because the state was not ready to proceed with its case. The National Prosecuting Authority (NPA) attempted to recharge Jacob Zuma, but the Pietermaritzburg High Court ruled on September 12, 2008 that the decision to prosecute Jacob Zuma on corruption, racketeering and tax evasion charges was procedurally invalid.
In September 2008, the ANC recalled Thabo Mbeki from office before his term expired. The ANC stated that the decision had been made in light of a High Court judgment which suggested executive meddling in the decision to prosecute Jacob Zuma. On September 21, 2008 Thabo Mbeki tendered his resignation, which became effective on September 25, 2008.
Following Thabo Mbeki’s resignation, the National Assembly voted by secret ballot to determine which of two nominees (that of the ANC and that of the DA) would fill the vacant office of president. Kgalema Motlanthe, of the ANC, captured the majority of the votes and was sworn in as South Africa’s President on September 25, 2008, with Baleka Mbete, also of the ANC, appointed as his deputy.
On January 12, 2009, the Supreme Court of Appeal held that the Pietermaritzburg High Court had erred in its ruling regarding the declaration that the decision of the NPA to prosecute Jacob Zuma was invalid. The matter was taken on appeal to the Constitutional Court was set to be heard on May 12, 2009, however on April 6, 2009, the NPA announced that it had dropped the corruption charges against Jacob Zuma, citing political interference in the legal process. The circumstances surrounding the NPA’s decision to drop the charges have been called into question by the DA and political action groups including Freedom Under the Law and a court challenge is pending that would require release of records from the NPA relating to the decision.
During 2013, Public Protector Thuli Madonsela conducted an investigation into a R200 million security upgrade of President Zuma’s home in Nkandla, KwaZulu-Natal. The Public Protector has prepared a draft report on the upgrade project but release of the report is currently being challenged in the courts by the state security cluster, which includes security, police and defence.
11
2009 National and Provincial Elections
In April 2009, approximately 23 million South Africans registered to vote in the national and provincial elections, compared to the approximately 20.6 million people registered to vote in the 2004 elections. This included South Africans who were abroad as of March 12, 2009, as the Constitutional Court ordered that all South African citizens who were registered to vote (including those citizens who would be abroad on the election day) would be entitled to vote in the elections.
The IEC approved the candidate lists of 42 political parties that contested the national and provincial elections. Of these parties, 28 political parties were registered to contest the national election for the National Assembly. Of these 28, 11 political parties applied to contest all nine provincial legislatures, 14 political parties applied to contest only some provinces and three parties applied to contest only the election to the National Assembly.
According to IEC data, a total of 17,919,966 South Africans cast their votes in the elections on April 22, 2009. The April 2009 elections were considered fair, transparent and credible by the IEC. The official general election results were announced on April 25, 2009. The ruling ANC won the elections, receiving 65.90% of the votes cast in respect of the national elections. The DA remained the official opposition of the ANC, with 16.66% of the votes, and COPE came in third with 7.42% of the votes.
The table below sets out the National and Provincial Assembly seats secured by political parties following the April 2009 general elections.
| | | | | | | | | | | | | | | | |
| | | Number of seats in
National Assembly | | | Number of seats in
Provincial Assembly | |
Political Party | | | | | | | | | | | | | | | | |
ANC | | | 264 | | | | (66 | %) | | | 126 | | | | (63 | %) |
DA | | | 67 | | | | (16.75 | %) | | | 32 | | | | (16 | %) |
COPE | | | 30 | | | | (7.5 | %) | | | 16 | | | | (8 | %) |
IFP | | | 18 | | | | (4.5 | %) | | | 9 | | | | (4.5 | %) |
UDM | | | 4 | | | | (1 | %) | | | 3 | | | | (1.5 | %) |
VF Plus | | | 4 | | | | (1 | %) | | | 3 | | | | (1.5 | %) |
ID | | | 4 | | | | (1 | %) | | | 3 | | | | (1.5 | %) |
ACDP | | | 3 | | | | (0.75 | %) | | | 3 | | | | (1.5 | %) |
UCDP | | | 2 | | | | (0.5 | %) | | | 1 | | | | (0.5 | %) |
AZAPO | | | 1 | | | | (0.25 | %) | | | 1 | | | | (0.5 | %) |
APC | | | 1 | | | | (0.25 | %) | | | 1 | | | | (0.5 | %) |
MF | | | 1 | | | | (0.25 | %) | | | 1 | | | | (0.5 | %) |
PAC | | | 1 | | | | (0.25 | %) | | | 1 | | | | (0.5 | %) |
| | | | | | | | | | | | | | | | |
Total | | | 400 | | | | 100.0 | % | | | 200 | | | | 100.0 | % |
| | | | | | | | | | | | | | | | |
Source: IEC.
On May 9, 2009, following the ANC’s victory in the elections, Jacob Zuma was inaugurated as the fourth democratically elected President of the Republic, with Kgalema Motlanthe as his deputy.
2011 Municipal Elections
Municipal elections are held every five years. The 2011 municipal elections were held on May 18, 2011 at which 13.66 million South Africans voted. This was the highest voter turnout since the first municipal elections following the reorganization of municipalities in 2000. Before the 2011 elections, the ANC had control of a majority of municipalities in each province, including the Western Cape Province. In the 2011 elections, the DA won a majority (57.08%) of the votes in the Western Cape Province. In the Nelson Mandela Bay municipality, the ANC also obtained a majority of votes. Although the DA increased its presence in the Northern Cape (to 22.27%), the ANC won control of the province as a whole (at 63.57%).
12
COPE, the NFP and the IFP also tried to improve their standings but failed to obtain control of any municipalities. Various smaller parties contested the elections, but made no significant impact.
The end results of the 2011 municipal elections were that, of 35,235,914 votes cast, the ANC won 63.65% of the votes, the DA won 21.97%, the IFP won 3.94%, the NFP won 2.58% and COPE won 2.33%. Each of the remaining parties contesting the elections obtained results below 1%.
Zuma Administration
The Constitution provides for a Cabinet consisting predominantly of members of the National Assembly, who retain their seats while in the Cabinet. Cabinet portfolios are allocated by the President. The Cabinet generally operates by consensus rather than by voting. On May 10, 2009, President Zuma announced his initial Cabinet, which consisted of 34 ministers who are members of Parliament, in addition to the President and the Deputy President, as well as some structural changes to the National Government. Several departments were split and new departments were created. President Zuma also announced his intention to form a National Planning Commission (NPC) which has now been established and is based in the Presidency. The NPC is responsible for strategic planning for the country, and aims to ensure adherence to the “National Plan” by all spheres of the National Government. The NPC is headed up by the former Minister of Finance, Trevor Manuel. Trevor Manuel’s replacement as Minister of Finance was Pravin Gordhan, who has been the Minister of Finance for the last four years.
The mandate of the NPC is contained in the “Revised Green Paper: National Planning Commission” which was released in February 2010. The revised green paper sets out in broad terms how the NPC should work and interact with the government and the broader society. The document lists 11 subjects on which the NPC may want to release detailed reports namely: water, energy, education, health and demography, spatial planning, infrastructure, transport, defence capabilities, climate change and the economy.
The NPC released a diagnostic report on June 9, 2011 that aims to identify the main challenges confronting the country and to examine the underlying causes of such problems. The diagnostic report is not a plan; it provides the basis for a plan.
The diagnostic report covers the following topics:
| | • | | institutions and governance. |
On November 11, 2011, the NPC released its vision statement for 2030 (Vision 2030), as well as a National Development Plan (NDP 2030) for the Cabinet’s consideration. The NDP 2030 focuses on key priority areas and identifies nine primary challenges: high unemployment, poor education outcomes, a high disease burden, divided communities, uneven public-service performance, settlement patterns that marginalise the poor, corruption, an overly resource-intensive economy and crumbling infrastructure.
The key areas of focus for the NDP 2030 are:
| | • | | enhanced capabilities and an active citizenry; |
| | • | | growth, investment and employment; |
| | • | | rising standards of education and a healthy population; |
| | • | | an effective and capable government; |
| | • | | collaborations between the private and public sectors; and |
| | • | | leadership from all sectors of society. |
The Cabinet is reshuffled by the President, from time to time, to reflect the impact on various portfolios of evolution in executive strategy. On October 31, 2010, President Zuma announced a reshuffle of the Cabinet to facilitate effective service delivery, which resulted in seven ministers being replaced and 14 deputy ministers being appointed. Since October 31, 2010, President Zuma has made replacements to the Public Works Minister, the National Police Commissioner, the Minister of Cooperative Governance and Traditional Affairs, the Public Service Administration Minister and the Communications Minister, amongst others. Most recently, on June 12, 2012, President Zuma announced the following replacements:
13
| | • | | Public Service and Administration Minister, Roy Padayachie (deceased) was replaced by former Defence Minister, Ms Lindiwe Sisulu. |
| | • | | Defence Minister Ms Lindiwe Sisulu was replaced by former Correctional Services Minister, Ms Nosiviwe Mapisa-Nqakula. |
| | • | | Correctional Services Minister, Ms Nosiviwe Mapisa – Nqakula was replaced by former Transport Minister, Mr Sibusiso Ndebele. |
| | • | | Transport Minister, Mr Sibusiso Ndebele was replaced by former Deputy Minister of Public Enterprises, Mr Benedict Martin. |
Also on June 12, 2012, President Zuma dismissed the National Police Commissioner, General Bheki Cele, replacing him with Ms Mangwashi Victoria Phiyega. General Cele’s dismissal followed an announcement by President Zuma in October 2011 that the National Police Commissioner would be suspended with immediate effect following allegations by Public Protector Thuli Madonsela of misconduct in the leasing of police accommodation.
On October 3, 2012, following the election by then Minister of Home Affairs, Nkosazana Zuma, to be chairperson of the African Union Commission, President Zuma announced the appointment of two new Ministers:
| | • | | Ms Naledi Pandor, the former Minister of Science and Technology, was appointed as Minister of Home Affairs. |
| | • | | Mr Derek Hanekom, the Deputy Minister of Science and Technology, took over as Minister of Science and Technology. |
On 9 July 2013, President Zuma announced a reshuffle of the Cabinet:
| | • | | Co-operative Governance and Traditional Affairs Minister, Richard Baloyi was replaced by Lechesa Tsenoli; |
| | • | | Communications Minister, Dina Pule was replaced by Yunus Carrim; |
| | • | | Human Settlements Minister, Toyko Sexwale was replaced by Connie September; |
| | • | | Transport Minister, Benedict Martin was replaced by Dipuo Peters; and |
| | • | | Energy Minister, Dipuo Peters was replaced by Benedict Martins. |
Legal System
The South African legal system is based upon Roman-Dutch law and incorporates certain elements of English law, subject to the Bill of Rights contained in the Constitution. Judicial authority in South Africa is vested in the courts, which are established pursuant to the Constitution. The Constitution is the supreme law of the land and no other law can supersede the provisions of the Constitution. The Constitutional Court has jurisdiction as the court of final instance over all matters relating to the interpretation, protection and enforcement of the terms of the Constitution and is the court of first instance on matters such as those concerning the constitutionality of an Act of Parliament referred to it by a member of the National Assembly. Decisions of the Constitutional Court are binding upon all persons and upon all legislative, executive and judicial organs of state. Matters not falling within the jurisdiction of the Constitutional Court fall within the jurisdiction of the Supreme Court, which consists of the Supreme Court of Appeal and various High Courts. Judgments of the Supreme Court of Appeal are binding on all courts of a lower order, including the High Courts, and judgments of the High Courts are binding on the lower courts within their respective areas of jurisdiction.
The Chief Justice and the Deputy Chief Justice of the Constitutional Court are appointed by the President in consultation with the Judicial Service Commission (JSC) and the leaders of parties represented in the National Assembly. The Judge President and Deputy President of the Supreme Court of Appeal are appointed by the President after consulting with the JSC only. The remaining judges of the Constitutional Court, the Supreme Court of Appeal and the High Courts are appointed by the President on the advice of the JSC.
Former Chief Justice Sandile Ngcobo retired on August 12, 2011 and was replaced by the new Chief Justice, Mogoeng Mogoeng, on September 8, 2011. Prior to his retirement, President Zuma had extended Chief Justice Ngcobo’s term of office. However, this decision was declared unconstitutional by the Constitutional Court which held that the section of the Judges’ Remuneration and
14
Conditions of Employment Act, which the President relied on to extend the term of office, was unconstitutional. The appointment of Mogoeng Mogoeng to the position of Chief Justice ahead of Deputy Chief Justice Dikgang Moseneke was controversial and prompted public scrutiny of the JSC and the consultation process. Chief Justice Mogoeng Mogoeng’s appointment was confirmed after an intensive two-day televised interview before the JSC that was chaired by Deputy Chief Justice Moseneke.
Broad Based Black Economic Empowerment
Broad Based Black Economic Empowerment (BBBEE) is a core tenet of the National Government’s initiative to address the economic exclusion of historically disadvantaged South Africans by encouraging the redistribution of wealth and opportunities to historically disadvantaged persons. As part of this initiative, the National Government enacted the Broad Based Black Economic Empowerment Act, 2003 (Act No. 53 of 2003) (BBBEE Act), which came into effect in April 2004. For purposes of the BBBEE Act, “black people” is a generic term which means Africans, Coloureds and Indians. On June 18, 2008, the High Court of South Africa ordered that South African Chinese persons (who are South African citizens or would have obtained citizenship but for the previously applicable discriminatory laws) be included within the ambit of the BBBEE Act. The BBBEE Act aims to facilitate BBBEE and promote economic transformation by: incentivizing meaningful participation by black people in the economy; changing the racial composition of ownership and management structures in enterprises; promoting investment programmes that lead to BBBEE; enabling access to economic activities, infrastructure and skills for black women and rural and local communities; increasing the extent to which workers, communities and cooperatives own and manage enterprises; and promoting access to finance for black economic empowerment (BEE).
The Department of Trade and Industry (the DTI) has, as empowered by the BBBEE Act, issued the BBBEE Codes of Good Practice on Black Economic Empowerment (the Codes). The Codes, which were promulgated in February 2007, require that every organ of national and local government and every public entity must, as far as is reasonably possible, apply best BEE practices in issuing licenses, implementing procurement policies, determining qualification criteria for the sale of state-owned enterprises and developing criteria for entering into public private partnerships. The Codes set out general principles for measuring ownership and management control, preferential procurement, employment equity, skills development, enterprise development and socio-economic development, including special guidance for qualifying small enterprises. The Codes also provide guidance on fronting practices, BEE verification, the recognition of contributions toward BEE of multinationals, and the treatment of public entities and other enterprises wholly owned by organs of state. The Codes are subject to review by the Minister of Finance in 2017.
Multinational Companies
The Codes have given multinational companies flexibility in the manner in which they can implement the Codes should they wish to do so. A multinational company trading in South Africa can retain sole ownership of its South African subsidiary, provided that alternative measures to broaden economic participation by black people, in terms of the Codes, are exercised. This retention of ownership by a multinational over its South African subsidiary can be achieved by implementation of “equity equivalent” programmes which must be pre-approved by the Minister of the DTI as well as the ministry of the industry in which the relevant multinational enterprise operates. Such equity equivalent programmes focus on skills transfer, empowerment of SMME businesses and broader socio-economic empowerment projects.
Public Entities and State Agencies
The BBBEE Act places a legal obligation on state agencies to contribute to BBBEE, including when developing and implementing their preferential procurement policies. The Preferential Procurement Policy Framework Act, 2000 (Act No. 5 of 2000) (PPPFA) was promulgated as a result of Section 217 of the Constitution, which states that all spheres of government must have a mechanism in place that would bring about categories of preference in allocation of contracts when procuring goods and services to advance historically disadvantaged individuals (HDIs). In December 2006, when the Codes were approved for gazetting, Cabinet gave the DTI and the National Treasury a mandate to amend the PPPFA to advance the objectives of the BBBEE Act. The draft amended PPPFA was gazetted for public comment on August 20, 2009. On June 8, 2011, the Minister of Finance gazetted new regulations in terms of the PPPFA which became applicable to all organs of state and public entities as of December 7, 2011, except selected “major public entities” and certain national and provincial government business enterprises set out in the Public Finance Management Act, 1999 (Act No. 1 of 1999) (PFMA), which are exempted until December 7, 2012. In terms of the new regulations, the BBBEE contributorship level of an enterprise (calculated with reference to the Codes) will account for up to 20% of the scorecard in respect of all tenders valued between R30,000 and R1,000,000 and up to 10% of the scorecard in respect of tenders exceeding R1,000,000.
15
Private Sector
Although the BBBEE Act does not place a legal onus on private sector entities to comply with its provisions, a number of sectors within the South African economy anticipated the enactment of the BBBEE Act and its principles and committed themselves to transformation through sector specific charters. The BBBEE Act provides for the DTI to publish and promote any transformation charter (for later development into industry codes) for a particular sector of the economy, provided that charter (or code) is developed by the major stakeholders in that sector and advances the objectives of the BBBEE Act. These charters/codes set out a blueprint and timeline for the transformation of the relevant economic sectors. Examples include the Agri-BEE Charter, the Marketing, Advertising and Communication Sector Charter, the Integrated Transport Sector Codes, the Forest Sector Code, the Construction Sector Code, the Tourism Sector Code, the Chartered Accountancy Sector Code, the Property Sector Charter and the Information and Communication Technology (ICT) Code. Other charters are being developed and draft versions thereof have been released, including the draft Financial Sector Code.
Going forward, some of the biggest challenges facing the National Government in relation to the implementation of BBBEE include educating the South African public on the objectives, opportunities and perceptions relating to BBBEE, providing certainty as to the requirements of BBBEE, ensuring that the objectives of BBBEE are properly adhered to and encouraging investment in South Africa that advances BBBEE and promotes economic and social transformation.
Land Reform
Land reform in South Africa is a complex issue, due both to the apartheid era legacy of dispossessing black South Africans of their land and to current human development challenges. The National Government seeks to, within the framework of the judicial process and the Constitution’s protection of private property rights, facilitate the equitable transfer of land to South Africans who were previously dispossessed of their land as a result of the land dispossession policies of the previous regime in South Africa.
In order to achieve these aims, the National Government has developed a land reform strategy that focuses on restitution, redistribution and land tenure reform, as outlined in a 1997 White Paper on Land Affairs. Restitution involves either returning land or providing alternative compensation to persons who have been deprived of their land; redistribution encourages the acquisition of land by disadvantaged South Africans (with the aid of government grants); and land tenure reform aims to create a unified and secure system of landholding.
The Department of Rural Development and Land Reform had previously set 2014 as the deadline for achieving land reform in South Africa through the redistribution of 30% of white-owned commercial agricultural land to those previously dispossessed of such land. Section 25 of the Constitution provides that property may only be expropriated subject to compensation that is either agreed by those affected or decided or approved by a court. The National Government has been committed, in executing its land reform strategy, to uphold this constitutional principle.
In June 2007, the National Policy Conference of the ANC resolved that it was necessary to develop a detailed strategy in order to meet the 30% target. Pursuant to this, the Department of Public Works released a policy document on the expropriation of land and other property in the public interest or for public purposes. The policy document had two main objectives: (1) to enable the state to use expropriation as a means to affect land reform and (2) to align the Expropriation Act of 1975 with the Constitution. To achieve these goals, the Expropriation Bill was presented before Parliament on April 11, 2008, and after certification of the Bill, was published for public comment. On August 27, 2008, the Portfolio Committee on Public Works withdrew the Bill until further notice, stating that more time was needed to ensure consultation with a wide variety of stakeholders.
It has become apparent that the goal to redistribute 30% of white-owned commercial agricultural land to those previously dispossessed thereof will not be achieved by 2014. As of March 2013, the National Government had redistributed 7.6 million hectares of such land, and it is anticipated that the National Government will extend the deadline to 2020.
The Commission on Restitution of Land Rights has developed a strategic plan to finalize the remaining claims that addresses issues such as price negotiation, untraceable claimants, disputes and jurisdiction. The Department of Rural Development and Land Reform is in the process of verifying all outstanding claims.
The implementation of the land restitution and land reform programmes are supported through allocations to the Department of Rural Development and Land Reform. Expenditure grew from R5.9 billion in 2009 to R 9 billion in 2012, mainly due to the increase in land reform and restitution grants, and is expected to increase to R10.8 billion by 2017.
The National Government is also currently investigating policy options with regards to foreign ownership of South African land and its effect on the National Government’s ability to meet its Constitutional duties to effectively deliver on land reform. The policy options recommend that where land has been earmarked for reform, restitution or integrated human settlement, National Government approval is required for the sale of that land to foreign nationals.
16
Significant strides have been made in the area of land reform:
| | • | | as at March 31, 2013, 696 farms had been recapitalized; |
| | • | | the Department of Rural Development and Land Reform has established a Social, Technical, Rural, Livelihood, Infrastructure and Facilitation (STRIF) branch and a Rural Infrastructure Development (RID) branch to support the comprehensive rural development program; |
| | • | | the Department of Rural Development and Land Reform has developed a model for handling claims with respect to land situated on strategic national assets, such as Kruger National Park, land owned by forestry companies, mining houses and sugar mills where the landowners have made significant capital investment. Such property is valuable and the Department of Rural Development and Land Reform estimated that an amount in excess of R 100 billion would be required to provide restitution in respect of such land; and |
| | • | | in November 2011, the Department of Rural Development and Land Reform, together with the World Bank, launched the local and community driven development program, which empowers communities to take charge of their own development. The department is in the process of reopening restitution claims. The new cutoff date for lodging claims is 31 December 2018. The estimated cost restitution claims reopening is R179 billion. |
Mining Industry Reform
Mining in South Africa has historically been undertaken largely by the private sector. The most important mining houses in South Africa include Anglo American plc, De Beers Corporation, African Mineral Limited, BHP Billiton SA, Gold Fields Limited, Impala Platinum Holdings Limited, Lonmin plc, Kumba Iron Ore Limited, Exxaro Limited, Xstrata plc and Harmony Gold Limited. These corporations, together with their affiliates, are responsible for the majority of the gold, diamond, uranium, zinc, lead, platinum, chrome, iron ore, coal and silver production in South Africa.
As of June 2011, over 500,000 people were directly employed by the mining sector, of which over 169,000 were employed in the gold mining industry. As of January 2012, there were 1,647 registered mines and quarries in South Africa.
The Mineral and Petroleum Resources Development Act (MPRDA) and the Mining Charter
The National Government enacted the MPRDA in 2002. The MPRDA, which came into effect on May 1, 2004, together with the implementation of the Broad-Based Socio-Economic Empowerment Charter for the South African Mining Industry published on August 13, 2004 (the Mining Charter), recognizes the state’s sovereignty and custodianship over the country’s mineral resources. The MPRDA also provides for equitable access to mineral resources, expands opportunities for HDIs (including women-led entities) and promotes economic growth, employment and socio-economic welfare, and security of tenure. The Department of Mineral Resources (DMR) is currently in the advanced stage of reviewing the MPRDA with a view to streamlining mining regulation in South Africa and providing further clarity around such issues as the transfer, amendment, suspension and partitioning of rights. The MPRDA amendments were tabled in Parliament in June 2013.
The Minister of Mineral Resources (previously the Minister of Minerals and Energy) is the competent authority in regard to granting prospecting and mining rights. In granting rights to HDIs, the DMR’s objective for fiscal year 2013 was to grant 200 such rights, 40 of which have been granted as of September 30, 2013.
An online mineral resources administration system was launched in April 2011 to process mining license applications which enables the monitoring of the status and improves overall quality of license applications.
The DMR is also responsible for managing environmental impacts from mining related activities, and by the end of September 2012 conducted 881 environmental inspections out of a target of 1,700 inspections. The Department of Environmental Affairs has transferred some of the functions of the National Environmental Management Act related to mining activities to the DMR, which means the DMR would be the competent authority for environmental impact assessments from the mines and would also be responsible for developing tools and systems for mine environmental management and reporting. The DMR is currently developing measures to streamline licensing process relating to mining environmental issues to improve turnaround times.
The vision of the Mining Charter is to create a globally competitive mining industry that reflects a non-racial South Africa and draws on the human and financial resources of, and offers real benefits to, all South Africans. The Minister of Mineral Resources, the Chamber of Mines and the National Union of Mineworkers signed the stakeholder’s declaration on strategy for the sustainable growth and meaningful transformation of South Africa’s mining industry on June 30, 2010.
17
The Mining Charter was reviewed after its first five years, as agreed by its signatories. The result of the review was the 2010 amendment to the Mining Charter, which reaffirmed the 2014 targets of the Mining Charter (the Revised Mining Charter).
The requirement under the Mining Charter for mining entities to achieve a 26% Historically Disadvantaged South Africans (HDSA) ownership of mining assets by the year 2014 has been retained. Amendments to the Mining Charter in the Revised Mining Charter include, amongst other things, the requirement by mining companies to: (i) facilitate local beneficiation of mineral commodities; (ii) procure a minimum of 40% of capital goods, 70% of services and 50% of consumer goods from HDSA suppliers by 2014 (these targets are exclusive of non-discretionary procurement expenditure); (iii) ensure that multinational suppliers of capital goods contribute a minimum of 0.5% of annual income generated from South African mining companies towards the socioeconomic development of South African communities via a social development fund beginning in 2010; (iv) achieve a minimum of 40% HDSA demographic representation by 2014 at all levels of management; (v) invest up to 5% of annual payroll in essential skills development activities; and (vi) implement measures to improve housing and living standards for mineworkers by converting or upgrading mineworkers’ hostels into family units, attaining an occupancy rate of one person per room and facilitating home ownership options for all mineworkers in consultation with organised labour, all of which must be achieved by 2014. In addition, mining companies are required to monitor and evaluate their compliance to the Revised Mining Charter and must submit annual compliance reports to the DMR.
The Scorecard for the Broad-Based Socio-Economic Empowerment Charter for the South African Mining Industry attached to the Revised Mining Charter (the Scorecard) makes provision for a phased-in approach for compliance with the above targets over the five-year period ending in 2014. For measurement purposes, the Scorecard allocates various weightings to the different elements of the Revised Mining Charter. Failure to comply with the provisions of the Revised Mining Charter will amount to a breach of the MPRDA and may result in the cancellation or suspension of a mining company’s existing mining and/or prospecting rights.
In 2008, the Mineral and Petroleum Resources Development Amendment Act was passed to do the following:
| | • | | transfer environmental regulation of mines to the Minister of Environmental Affairs and Tourism; |
| | • | | deal with challenges of implementing the MPRDA; |
| | • | | implement technical improvements to the MPRDA to improve efficiency in the management of the country’s mineral resources; |
| | • | | improve the handling of residue stockpiles and residue deposits; and |
| | • | | streamline the process of obtaining ministerial approval for cessions, transfers and encumbrances of rights aimed at promoting and protecting new entrants into the mining industry and of facilitating economic development. |
The Mineral and Petroleum Resources Development Amendment Act is yet to come into force. The DMR is currently looking at further possible amendments to the MPRDA to reinforce the objectives of the MPRDA, to promote investment in the mining sector and to improve the system of granting rights.
A mineral beneficiation strategy was adopted by Cabinet in July 2011, focusing on five strategic value chains: iron and steel, energy commodities, jewelry fabrication, autocatalytic converters and diesel particulate filters, and pigment and titanium metal production. The purpose of the strategy is to outline a framework for the orderly development of the country’s mineral value chains, enabling South Africa to develop its mineral wealth to its full potential and to the benefit of the entire population. Its vision is to advance economic development in South Africa through the optimization of linkages in the mineral value chain, facilitate economic diversification, create jobs and promote industrialization. It aims to expedite South Africa’s move towards a knowledge-based economy and contribute to GDP growth through increased mineral value added per capita. The strategy is designed to align with South Africa’s national industrialization programme and aims to create jobs in an economically diverse and environmentally sustainable manner, increase South Africa’s competitiveness and expand its industrial knowledge base.
Following the adoption of the mineral beneficiation strategy, the DMR tabled two of the five pilot value chains (iron and steel and energy) as outlined in the strategy, which were approved by Cabinet in October 2011. The DMR is working on the development of a beneficiation strategy framework which will include the five pilot value chains outlined in the beneficiation strategy. The framework outlines a set of enablers that are intended to bring about the orderly development of mineral value chains domestically and represents an opportunity for South Africa to catalyse industrialisation and contribute towards economic growth
18
Other Mining Industry Initiatives and Legislation
The Mineral and Petroleum Resources Royalty Act of 2008 (the Royalty Act) is aimed at ensuring that the country benefits from the exploitation of its mineral resources by imposing a resource rent on holders of rights. It also seeks to stimulate investment in the sector by addressing potential investors’ need for regulatory certainty. The Royalty Act recognizes that mineral resources are non-renewable and are part of the common heritage of all South Africans, and thus imposes a royalty on the extraction and transfer of mineral resources. The Schedules to the Royalty Act set out the classification of the mineral resources and their corresponding royalty rate. The Royalty Act was passed by the National Assembly on August 21, 2008 and the National Council of Provinces on September 23, 2008. The Royalty Act was assented to by the President on November 24, 2008 and came into force in stages between November 1, 2009 and March 1, 2010.
In addition, National Government launched an organization called the South African Women in Mining Association in 1999, with a focus on assisting informal mining groups in obtaining mining rights, running mining businesses and promoting female empowerment in the mining sector in accordance with the provisions of the Mining Charter. This initiative was followed by the launch in 2007 of the Youth in Energy and Mining (YEM), a programme aimed at young people with an interest in the mining and energy sectors. YEM seeks to promote skills development, procurement, beneficiation enterprise development and small scale mining.
The mining industry has also established the Mining Industry Growth, Development and Empowerment Task Team (MIGDETT) to help manage the negative effects of the global economic crisis and to save jobs, as well as to position the industry for growth and transformation in the medium to long term. Membership of MIGDETT includes the mining industry, the National Government, organised labour and other stakeholders.
Health and safety standards within the industry are governed by the Mine Health and Safety Act (Act 29 of 1996) (MHSA). Mining safety continues to be an area of concern as on average there are approximately 125 mine worker fatalities annually. These fatalities are partially attributable to a lack of stringent safety measures. Fall of ground accidents remains the largest cause of fatalities, followed by transportation and machinery accidents. During 2011, consultations took place to consider amendments to the MHSA. The proposed amendments are designed to strengthen enforcement, simplify the administrative system for the issuing of fines, reinforce offences and penalties, remove ambiguities in certain definitions and expression in the MHSA, and promote consistency with other laws, particularly the MPRDA. The MHSA draft amendments were tabled to Cabinet for approval for publication in the government gazette and public consultation. Under the leadership of Minister Susan Shabangu, the DMR has engaged in enhanced geosciences research and development, promoted mineral beneficiation and mine health and safety policy development and continued promotion and regulation of the diamond and precious metals industries. As part of a strategy of enhancing state participation in the mining industry, Cabinet approved the establishment of the African Exploration Mining and Finance Corporation (AEMFC) to serve as the nucleus of a newly established state-owned mining company.
Successful implementation by the DMR of its development strategy for the mining sector requires stakeholder engagement to address current infrastructure, workforce skill development, and regulatory constraints, as well as to encourage exploration and research and development. As discussed in greater detail, below, under “The South African Economy—Mining and Quarrying”, a significant challenge for the DMR and industry stakeholders is the repairing of industrial relations following wildcat strikes initially sparked by the death of 40 mine workers during an August 2012 strike at the Lonmin mine in Marikana which then led to on and off strikes throughout parts of 2012 and 2013.
A draft framework agreement for a sustainable mining industry was entered into by organised labour, organised business and government on Junes 14, 2013. The aim of the framework agreement is to promote stability in labour relations and ensure the sustainability of the mining sector.
Crime Prevention
Buildings safer communities is one of the focuses of Vision 2030, a priority being to ensure that people in South Africa are and feel safe at home, at school, and at work. It seeks to ensure that the police service is well resourced and professional. Vision 2030 provides a framework for achieving this through strengthening the criminal justice system, professionalizing the police, demilitarization of the police, increasing rehabilitation of offenders and reducing recidivism, promoting an integrated approach to crime prevention, increasing community participation in safety programmes, and emphasising the safety of women, children and the youth.
19
Furthermore, Vision 2030 seeks to see a South Africa with zero tolerance on corruption through the building of a resilient anti-corruption system by way of strengthening the multi-agency anti-corruption approach, protection of whistle blowers, creation of central oversight on large tenders, empowering a tender compliance monitoring office to investigate corruption and strengthening judicial governance and the rule of law. These priority areas will form the backbone of the Government’s medium term strategic framework for the criminal justice system for the period 2014-2019.
The Justice, Crime Prevention and Security (JCPS) cluster coordinates a number of activities aligned to the above focus areas. It has a multiplicity of substructures which have been mandated to focus on specific areas that contribute to the effectiveness of the criminal justice system. These include, the JCPS Directors-General Committee which is made up of heads of departments, as well as the JCPS Development Committee, popularly known as “DevComm”, which oversees the implementation of Outcome 3 in the Government’s Delivery Agreement that “All people in South Africa are and feel safe”. Other substructures include the Integrated Justice System Board, whose mandate is to develop and implement systems integrations across the criminal justice system, that is, to electronically enable and integrate the end-to-end criminal justice business processes from the reporting of a crime to the unconditional release of a convicted person and the related inter-departmental information exchanges.
The other substructures of the JCPS cluster include:
| | • | | Border Control Operational Coordinating Committee; |
| | • | | Criminal Asset Recovery Unit; |
| | • | | Budget Review Task Team; |
| | • | | Management of Awaiting Trial Detainees Task Team; |
| | • | | Integrated Justice System Research Coordinating Committee; |
| | • | | National Integrated Case Flow Management Committee; |
| | • | | Office of the Criminal Justice Review; |
| | • | | Anti-Corruption Task Team; and |
| | • | | Cybersecurity Response Committee. |
These various task teams are integrated forums which provide room for departments and agencies to integrate their plans. Previously, it had been argued that disintegrated and uncoordinated planning in the cluster contributed to the failure in dealing with challenges that were being experienced. This coordinated planning has led to the development of common objectives and targets as spelt out in the cluster’s Delivery Agreement for Outcome 3. This is helping the cluster in focusing relevant resources towards the priority areas collaboratively, thereby enhancing efficiency and effectiveness as the institutions complement each other. For instance, during the 2012/13 financial year, the cluster held a national stakeholders workshop which was facilitated by the NPA with a view to create a platform for coordinated planning. The cluster continues to create an enabling environment for the delivery of service. It further developed protocols on:
| | • | | Criminal Justice System Fingerprint and Photographic Database – this deals with operational matters relating to accessing fingerprints, photographic images and related information to facilitate the detection of crime, investigation of an offence, identification of missing persons and the identification of unidentified human remains. |
| | • | | JCPS-National Department of Health Forensic Chemistry Toxicology – this aims to improve the efficiency of the cluster through accurate and timely processing of samples for toxicological testing in support of judicial inquests and criminal court matters. |
| | • | | Criminal Justice System Blood Alcohol Analysis – this deals with operational matters that relate only to the analysis of samples that are taken when the driver of a vehicle is suspected to be under the influence of alcohol and/or drugs. It seeks to promote, facilitate and regulate cooperation between forensic chemistry labouratories, the NPA, the South Africa Police Service, local Metropolitan police, Military Policing Authorities and the Department of Justice and Constitutional development in order to ensure the optimal utilisation of the forensic chemistry laboratories in the criminal justice system, to define responsibility and accountability and to agree upon service delivery requirements. |
20
As part of the integrations across the cluster, the audio visual remand system has been implemented at 47 courts and 21 correctional facilities so as to facilitate the trial of persons in custody without being at the courts. Usage of this facility has been improving since it was launched. Furthermore, the case administration system (Police) and the integrated case management system (Justice and Constitutional Development) have been rolled out to more than 150 courts and over 500 police stations as of September 2013. The integration between the two systems enables information to flow from police to the courts on a real time basis thereby fast tracking the flow of information and minimises the loss of case dockets.
The fight against corruption remains one of the major priorities of the Government. The cluster has continued to strengthen the single coordinated, Anti-Corruption Task Team (ACTT) with more than 100 dedicated people from different agencies having been assigned to this unit. In June 2013, the cluster released the list of 42 people who have been convicted of fraud and corruption involving amounts exceeding R5 million. The ACTT is in the process of developing an anti-corruption framework which is aligned to the Vision 2030 outlined in the National Development Plan.
South African Police Services
Section 205 of the Constitution of the Republic of South Africa, 1996 (Act 108 of 1996) mandates the South African Police Service (SAPS) to prevent, combat and investigate crime. The Constitution further mandates SAPS to maintain public order, protect and secure the inhabitants of South Africa and their property and to uphold and enforce the law.
To improve the visibility and accessibility of policing services, SAPS has established 24 mobile contact points, in addition to the 1,132 police stations in the country. This initiative is in line with SAPS’s goal of improving its level of service delivery and accessibility by bringing service points closer to communities. Furthermore, SAPS enhanced its organisational capacity by enlisting a total of 5,045 new police officials that will contribute to the provision of proactive and responsive policing services and thereby reducing the levels of crime in the country.
It is the responsibility of SAPS to create and maintain its capacity to respond to all public disorder situations which are not deemed to be “normal” crime. To address the emerging challenge of crowd related incidents and violent protest action around the country, SAPS has established 28 dedicated Public Order Policing units which are located in strategic sites around the country. In 2012/13, there were 4,314 public order policing operational members who were trained and equipped to effectively deal with public order incidents of both violent and non-violent nature. In addition, the department has created a national reserve capacity based at its head office which will be deployed to the relevant sites when need arises.
The Parliamentary Portfolio Committee on Police has recently adopted a policy on the establishment of a DNA database. The policy recommends that the South African Forensic Science service should establish a forensic database as a criminal investigative tool that will contribute to the successful prosecution of crime and thereby increase the detection rate of priority crime. The provisions of this policy include:
| | • | | Linking suspects to crime scenes; |
| | • | | Excluding suspects and exonerating those incorrectly found guilty; |
| | • | | Linking suspects to multiple crime scenes during a DNA trial; |
| | • | | Allowing for someone who is not a suspect to be linked to a crime scene through a DNA database; and |
| | • | | Deterring “would-be” offenders from committing crime for fear of rapid detection. |
In line with the declaration by the Minister of Police of 2012/13 as a “Year of the detective”, 800 forensic analysts and crime experts were appointed to capacitate the expansion of the forensic services unit. Overall, the department increased the number of detectives by 8% to 25,844 to enhance the department’s detective capacity. These initiatives have contributed to the increase in the detection rate for trio crimes (carjacking, robbery residential and robbery other premises/business) from 21% in 2011/12 to 23% in 2012/13 and a significant increase in the detection rate for serious commercial crime-related charges from 65.2% in 2011/12 to 86.1% in 2012/13. In the same period detection rate for contact crimes increased from 60.7% in 2011/12 to 62.1% in 2012/13.
21
Justice and Constitutional Development
The Department of Justice and Constitutional Development continues to protect and promote the rights of the vulnerable groups through legislative amendments and promotion of the adoption of modern financial system. The department has started with a process of the re-establishment and rolling out of the sexual offences court. To date, 47 of the regional courts have been upgraded and equipped with modern technology to operate as dedicated courts for this purpose. The Department has also concentrated quite extensively on the plight of lesbian, gay, bisexual, transgender and intersex communities and the process of formulating a national policy framework is underway. The ultimate aim of the framework is to design a one stop or standalone legal framework that deals with all forms of discrimination and hate speech or crime.
The National Prosecuting Authority has ensured that the number of operational Thuthuzela Care Centres (TCC) increase from 30 in 2011/12 to 35 in 2012/13. The TCCs are one stop facilities established as part of South Africa’s anti rape strategy aiming to reduce secondary trauma for the victims of sexual offences, improve conviction rate and reduce cycle time for finalizing rape cases. One of the major achievements is the implementation of electronic funds transfer system at court level and this facilitate the transfer of funds for maintenance beneficiaries to their own bank accounts within four days of receipts of payment schedules from the obligors and this project will be intensified going forward.
The Office of the Chief Justice was proclaimed a national department in 2010 with the objective to entrench the independence of the judiciary. The independence of the judiciary was further strengthened by the promulgation of the Superior Courts Act and Constitution 17th Amendment Act which came into operation in August 2013. These Acts affirm the Chief Justice as the administrative head of the judiciary and assign him or her, the responsibility to oversee the development and monitoring of norms and standards for the performance of the courts. The Office of the Chief justice has been created, in part, to help promote public trust in the discharging of justice without fear or favor and is intended to further affirm the country’s commitment to the rule of law. A key focus of the Office of the Chief Justice is promoting enhanced case flow management and pilot projects thus far have been extremely successful. Prior to new case management systems, a person in Durban could wait between 18 and 36 months to get a trial date, but now this might be obtained within 15 months, while in Pietermaritzburg it has been reduced from 2 or 3 years to 8 months.
As part of transforming the state legal services, the post of the Solicitor-General was created and the incumbent will be responsible and accountable for the implementation of the state’s litigation strategy. Key objectives in this restructuring of state legal services are to create processes and infrastructure to ensure strategic management of state litigation and to create a process to strategically manage the allocation of instructions or briefs to the legal profession for effectiveness and transformational purposes and for better accountability and oversight.
The work of the Asset Forfeiture Unit (AFU) of the National Prosecuting Authority continues to make great strides in its endeavor to combat corruption by diverting gains earned through illicit means to programmes aimed at strengthening the criminal justice system and organizations supporting the victims of crime. The value of the completed AFU matters was R118.5 million in 2012/13 while the value of new freezing orders stood at R518.5 million in 2012/13 and the unit achieved a success rate of 94.1%. Due to the unfavorable economic climate and the resultant budgetary constraints, the AFU will focus on large procurement corruption cases with huge impacts and it will continue to work closely with other law enforcement agencies such as the Directorate for Priority Crime Investigation and Financial Intelligence Centre.
Department of Correctional Services
The aim of the Department of Correctional Services (DCS) is to contribute to maintaining and protecting a just, peaceful and safe society, by enforcing court-imposed sentences, detaining inmates in safe custody whilst maintaining their human dignity, developing the sense of social responsibility of offenders, and promoting the general development of all offenders and persons subject to community corrections.
As part of ensuring that people living in South Africa are safe at home, at school and at work, the NDP’s Vision 2030 recommends an increase in the rehabilitation of offenders to reduce recidivism as well as the reduction of overcrowding in correctional facilities. These fall within the auspices of the DCS.
During fiscal year 2012/13, the DCS continued to increase the number of parolees that did not violate their parole conditions from 76.1% in 2011/12 to 84.9% in 2012, and increased the percentage of eligible offenders who participate in skills development programmes from 10.5% in 2011/12 to 50.3% in 2012/13
22
In order to promote restorative justice, which fosters dialogue between victims and offenders and brings the highest level of victim satisfaction and offender accountability, the DCS launched the Victim-Offender Dialogue (VOD) programme in November 2012. Since its launch, 85 VOD sessions have been held and 1,342 DCS officials have been trained across the country on the VOD implementation guidelines to help in implementing the project.
After the approval of the DCS Victim Offender Mediation (VOM) model as a restorative justice intervention programme, the department signed a memorandum of understanding with the Foundation of Victims of Crime (FoVoC) to facilitate the tracing of victims of crime so that they can participate in parole hearings. During the 2012/13, FoVoC traced 1,037 victims of crime of which 46 have participated in Parole Board hearings. An additional 52 participated in VOM whilst 875 are ready for participation in either VOM or Parole Board hearings.
The DCS is planning to design an appropriate rehabilitation path/correctional programmes for offenders who have committed trio crimes namely carjacking, robbery at residential premises and robbery at business premises. The department has developed a correctional programme on murder-related offences, named “Changing Lanes” which has already been made available to regions for implementation. Currently a programme for robbery related offences is being developed. Furthermore, the Sexual Offender Treatment Programme was approved and a training schedule has been developed and approved. A total of 23 Social Work Managers and supervisors were trained on the programme in February 2013 and training for employees at lower levels is planned for 2013/14.
One of the major aims of DCS is to educate and provide skills to offenders in preparation for their reintegration into society. To achieve this, the DCS has increased the number of offenders eligible for participation in skills development and has entered into various partnerships with other national departments, the private sector and non-governmental organisations. One such partnership is the Reading for Redemption campaign, which was launched in September 2012 in partnership with various universities around the country. The DCS is implementing the Reading for Redemption programme in phases and is currently raising awareness and encouraging offenders and officials to read. In February 2013, the DCS also signed a memorandum of understanding with the Department of Basic Education (DBE) to use offender labour to build schools and supply furniture. Furthermore, the department has signed a Protocol Agreement for the period of 2012/13 to 2015/16 with the Department of Higher Education and Training (DHET) for the provision of accredited vocational and basic occupational skills programmes to offenders through the National Skills Fund. The programmes include scarce skills such as welding, plumbing, bricklaying, plastering, electrical, carpentry and agricultural skills programmes among others.
As part of skills development, DCS has production workshops which are made up of 10 wood workshops, 10 steel workshop, 19 textile workshops, a shoe factory, 6 bakeries and 3 sanitary towel workshops. Agricultural productivity also takes place within 21 correctional centres. During the 2012 National Senior Certificate (NSC) examinations, inmates achieved 79.3% pass rate compared to 68.1% in 2011. During 2012, 1,762 offenders were studying towards post-matric or higher education, 3,525 towards further education and training qualifications (including electrical, civil, mechanical engineering and marketing), while 4,188 participated in skills development programmes (including basic business skills and entrepreneurship). Prioritising skills development will help offenders to gain relevant skills and experience which they can use after being released from prison.
International Relations
Having emerged from the international isolation of the apartheid era, South Africa has become a leading international actor. Its principal foreign policy objective is to promote a better South Africa and contribute to the development of a better and safer Africa in a better world.
United Nations
South Africa is one of 51 founding members of the United Nations (UN) in 1945. South Africa was re-admitted to the UN in 1994 following the country’s expulsion by the UN General Assembly in November 12, 1974 as opposition to apartheid at the time. Twelve years after re-admittance, South Africa was elected to serve as a non-permanent member of the UN Security Council during the period 2007-2008. And South Africa began its second term as a non-permanent member of the UN’s Security Council for the period 2011-2012 on January 1, 2011.
South Africa is amongst fourteen new countries that were elected to be part of the UN Human Rights Council from 2014 to 2016 in November 12, 2013. The UN Human Rights Council is responsible for strengthening the promotion and protection of human rights around the world. South Africa previously served as a founding member of the Human Rights Council for two consecutive terms from 2006 to 2010. Other countries represented by the 47-member body are, namely: France, Macedonia, Maldives, Mexico, Morocco, Namibia, Britain, China, Russia, Cuba, Saudi Arabia, Algeria and Vietnam.
23
South Africa remains a member of the UN General Assembly to the 47-Member Economic and Social Council of the United Nations (ECOSOC). ECOSOC is a premier organ of the United Nations responsible for economic and social development matters of the world.
International Monetary Fund
With the first fully democratic national elections in 1994, South Africa regained the full rights and obligations of membership of the IMF and the World Bank and its affiliated agencies.
South Africa is a founding member of the IMF and has always been in good standing with full access to technical and financial assistance from the institution. As at October 31, 2013, South Africa’s quota in the IMF is SDR1,868.5 million (equivalent to US$2,873.8 million); and its 19,422 votes account for 0.77% of the total number of votes. South Africa’s current financial position in the IMF reflects no borrowing from the IMF.
South Africa has committed US$2 billion to strengthen the IMF’s resources at the G20 Leaders Summit in Los Cabos, Mexico in June 2012. The commitment is in addition to South Africa’s existing contributions to the IMF’s quota resources. Also, it is a commitment as a new participant in the IMF’s expanded New Arrangements to Borrow (NAB). South Africa is therefore one of 40 participants that have ratified the expanded and amended NAB, to which South Africa committed SDR340 million (US$522.9 million). South Africa transferred funds totalliing SDR40.5 million to the NAB in 2012 and an additional SDR7.6 million in 2013.
In addition to calls for NAB transfers, South Africa has received separate calls for quota funding from the IMF as a member of the Financial Transactions Plan (FTP) since April 2013. The overall maximum amount of resources that South Africa could be expected to contribute to IMF lending under the FTP is limited to its quota share. South Africa’s quota-based contribution to the IMF consists of Rand resources and promissory notes.
South Africa also contributes funds to the Poverty Reduction and Growth Trust (PGRT), the IMF’s instrument for financial support to low-income countries (LICs). In addition, South Africa contributed its distribution in windfall gold sales profits earmarked by the IMF’s Executive Board for the PGRT, effective October 22, 2013.
World Bank
South Africa is the founding member of the World Bank Group, which comprises the International Bank for Reconstruction and Development (IBRD), the International Development Association (IDA), the International Finance Corporation (IFC) and Multilateral Investment Guarantee Agency (MIGA).
Following 2010 governance reforms agreed to by World Bank Governors, South Africa’s voting power in the IBRD stands at 0.83%. South Africa contributed US$27.2 million to the IBRD recapitalisation through the General Capital Increase agreement by World Bank Governors in 2010. The recapitalisation was to strengthen the balance sheet of the IBRD as part of the World Bank Group’s response to the global financial crisis.
Cooperation between South Africa and the World Bank is based on a Country Partnership Strategy (CPS). A new CPS is now in place for the period 2014-2017. The implementation of the partnership agreement will be guided by three pillars based on the key objectives of the National Development 2030. Thus it will focus on reducing inequality through the urban programme, health and financial exclusion; promoting investments through energy, private investments and environment programmes; and strengthening institutions in basic education and asset, debt & risk management programmes. Notable achievement under the previous CPS has been the World Bank’s financing for US$3.75 billion loan of the Medupi power station to produce 4,800 megawatt dry-cooled coal fired energy.
Since inception South Africa has been the only African country to participate as a donor in the International Development Association (IDA), the World Bank’s concessional lending window. In 2010, during IDA replenishment negotiations, South Africa pledged a total contribution of R242 million.
South Africa joined the private investment arm of the World Bank, the International Finance Corporation (IFC) in 1957—one year after the IFC’s foundation. The IFC’s committed portfolio in South Africa stands at US$866 million of which US$563 million is outstanding as of July 2012. South Africa partners with the IFC in delivering technical and advisory assistance to organisations in South Africa and the region, with the aim of reducing poverty through private sector growth.
24
South Africa has benefited, during the global economic crisis, from the IFC’s Global Trade Liquidity Pool. South African financial institutions have also partnered with the IFC to facilitate trade finance in Sub-Saharan Africa. The IFC has pledged to support South African Clean Technology Investment Plan through financing amounting up to US$150 million (split between AfDB and IFC), which is part of the US$500 million financial envelope from the Clean Technology Fund (CTF). The CTF Trust Fund Committee endorsed the South African CTF Investment Plan in October 2009, paving the way for South Africa to move closer to its vision of generating 4% of its electricity from renewable energy by 2013.
General Agreement on Tariffs and Trade
South Africa is a founding member of the General Agreement on Tariffs and Trade (GATT), participated in the Uruguay Round of Multilateral Trade Negotiations and acceded to the Marrakesh Agreement that established the World Trade Organization (WTO) in 1994. It is also part of the generalized system of preferences of Canada, the European Union (EU), Japan, Norway, Russia, Switzerland, Turkey and the U.S. In October 1999, South Africa signed an Agreement on Trade, Development and Cooperation, known as the European Trade Agreement, with the EU so as to consolidate strategic links between South Africa and its largest trade and investment partner. South Africa’s bilateral trading relationship with the EU was elevated to a higher level following the commencement of full implementation of the South Africa EU Trade and Development and Co-operation Agreement, which took effect in May 2004.
Organization for Economic Cooperation and Development
South Africa enjoys strong partnership with the Organization for Economic Cooperation and Development (OECD) and participates in numerous programs and committees. Cooperation is most developed in the areas of competition, tax administration, anti-corruption, innovation, agriculture, statistics, public debt management and bond market, and economic assessment. South Africa is a signatory to the Convention on Combating Bribery of Foreign Public Officials in International Business Transactions, and mutual acceptance of data (MAD). South Africa plays a leading role in the region in the area of tax administration and has played a key role in the establishment of the African Tax Administrators Forum, an initiative aimed at enhancing the capacity and capability of African tax administrators and domestic resource mobilization in general.
Group of Twenty (G-20)
South Africa is a member of the G-20, a permanent forum for informal dialogue on key economic and financial policy issues among systemically significant economies. South Africa is a member of the Financial Stability Board, a structure responsible for setting standards and monitoring of progress in the strengthening of financial regulation globally. South Africa is ahead of many countries globally in the implementation of the key financial standards, especially with regard to bank supervision.
BRICS
South Africa became a member of BRICS in December 2010. The country attended its inaugural Summit in 2011 at the 3rd BRICS Summit in Sanya, China. In March 2013, the 5th BRICS Summit was held in Durban, South Africa where they announced the establishment of (i) a BRICS-led New Development Bank (NDB) and ii) a Contingent Reserve Arrangement. The NDB and CRA negotiations are underway on capital size, capital structure, membership and governance. In September 2013, BRICS leaders made an announcement regarding progress towards the furtherance of their cooperation. The NDB will have an initial subscribed capital of US$50 billion from the BRICS countries. The CRA will have an initial size of US$100 billion, each country’s individual commitments to the CRA will be as follows China (US$ 41 billion); Brazil, India, and Russia (US$ 18 billion each); and South Africa (US$ 5 billion).
Commonwealth
In 1994, South Africa rejoined the Commonwealth, from which it had been obliged to withdraw shortly after it became a Republic in 1961. In the Commonwealth, South Africa’s participation is limited to promoting economic, social and cultural cooperation and enhancing democracy through the Commonwealth Heads of States and Ministers’ meetings.
25
Regional Arrangements
Southern African Customs Union (SACU)
South Africa is a member of the Southern African Customs Union (SACU). The other SACU members are Botswana, Lesotho, Namibia and Swaziland (the BLNS countries). SACU is intended to promote trade among its members within a single customs territory in which tariffs and other barriers are eliminated on substantially all the trade between the member states for products originating in these countries.
There is a common tariff on goods imported from outside the customs union. All import duties or tariffs collected on goods imported from outside the customs union are paid into a common pool.
Some of the key objectives of SACU are to enhance economic development, diversification, industrialization, and to promote the integration of Member States into the global economy.
As interim manager of the Common Revenue Pool, South Africa makes quarterly payments from the pool to the BLNS countries according to a formula agreed to in the 2002 SACU Agreement. The current formula takes into account a variety of variables including GDP size, GDP per capita and the level of intra-SACU trade.
Efforts are currently underway to negotiate a new revenue sharing arrangement; to develop regional industrial and other value chains; and to enhance cross-border trade facilitation.
Common Monetary Area
All SACU members other than Botswana are also members of the Common Monetary Area (CMA). The CMA allows for the unrestricted transfer of funds within the monetary area, a common capital market and substantially uniform exchange control regulations with respect to the rest of the world. The Multilateral Monetary Agreement provides for a uniform exchange control border around the four participating countries. Under certain circumstances, South Africa’s CMA partners may approach the SARB for short-term financial assistance. They also have access to South Africa’s foreign exchange markets.
Southern African Development Community (SADC)
In 1994, South Africa became a member of the Southern African Development Community (SADC), which aims to promote regional economic development and stability. The SADC is currently chaired by Malawi, and other members of the SADC are Angola, Botswana, Democratic Republic of the Congo, Lesotho, Madagascar, Mauritius, Mozambique, Namibia, the Seychelles, Swaziland, Tanzania, Zambia and Zimbabwe. The SADC assigned to South Africa the responsibility of overseeing the finance and investment sector. South Africa’s mandate is to facilitate the process of “community building” in the region through gradual, progressive integration of the region’s financial systems; to harmonize and coordinate the efforts and key policies of individual governments to permit capital to flow freely within the SADC; and to encourage increased inflows of capital from outside the region.
Since 1995, the SARB has participated in the activities of a separate Committee of Central Bank Governors (the Committee) in the SADC to pursue closer monetary cooperation between regional central banks and to promote financial and economic development. The Committee provides a forum for the exchange of ideas on economic development and financial policies and has contributed significantly to better intra-regional cooperation on issues of central banking.
The Committee of SADC Stock Exchanges, established in 1997, is pursuing initiatives such as harmonizing listing requirements, facilitating dual listings, introducing depository receipts, promoting cross-border investment, harmonizing procedures for clearing and settling stock exchange transactions, introducing entry-level qualifications for market practitioners, and establishing e-mail and internet links among the stock exchanges.
The SADC Finance and Investment Protocol (SADC-FIP) was signed on August 18, 2006 in Maseru and entered into force on April 16, 2010 after two thirds of member states have ratified the protocol. Ratification of the SADC-FIP allows its provisions a legal status, and therefore the ability of members to hold each other accountable for not meeting set targets or standards.
The SADC Protocol on Trade was signed at a Heads of State and Government Summit in Maseru in August 1996, was launched in September 2000 and implementation began in 2001. An important component of the Trade Protocol is the SADC Free Trade Area (FTA), which was launched on August 17, 2008.
SADC is currently reviewing the mid-term of its Regional Indicative Development Plan, providing an opportunity to reflect on the effectiveness of the SADC work programme and new priorities up to 2020.
26
Trilateral Free Trade Area (T-FTA)
The SADC, COMESA and EAC are in a process of establishing a Tripartite Free Trade Area (TFTA). The SADC-COMESA-EAC TFTA provides a comparative advantage and a larger market for South African goods. The three regions comprise 26 countries with a combined population of 527 million people, and a GDP per capita average of US$1,184. The 26 countries also make up almost 60% of the AU’s population and contribute just over 58% in terms of GDP.
The Heads of State and Government from three Regional Economic Communities signed a historical declaration launching negotiations for the establishment of the TFTA on June 12, 2011 at the Sandton Convention Centre. The Heads of State also adopted a roadmap establishing the TFTA and the TFTA Negotiating Principles, process and institutional framework.
African Union (AU)
South Africa played a leading role in the establishment of the AU, to which it became a member in July 2002 The AU succeeds the Organisation for African Unity (OAU), which was established in 1963 by African States to accelerate the liberation of the African continent. South Africa hosts one of the organs of the AU, the Pan African Parliament, which was opened in September 2004 and comprises of elected representatives from the five regions of Africa.
South Africa is a member, and was the first chair of, the New Partnership for Africa’s Development (NEPAD). NEPAD is the AU’s policy framework for Africa’s development. Its primary objectives include eradicating poverty, promoting principles of human rights and democracy in Africa, placing African countries, both individually and collectively, on a path of sustainable growth and development; halting the marginalization of Africa in the globalisation process, enhancing integration into the global economy and accelerating the empowerment of women.
United Nations Economic Commission for Africa (UNECA)
As a member of the UN, South Africa is also a member of the UNECA. Through its UNECA membership, South Africa is also a member to the African Institute for Development and Economic Planning (IDEP), a subsidiary body of UNECA with the objective of providing formal training to policy-makers and providing advisory services to African Governments and regional organisations.
African Development Bank (AfDB)
South Africa became a member of the African Development Bank (AfDB) by acceding to the founding articles of the AfDB in 1995. Membership in the AfDB is based on shareholding and shareholders have voting rights. South Africa’s current shareholding at the AfDB is 4.8%. During the AfDB Annual Meetings in May 2010, the Board of Governors allocated South Africa a permanent seat at the Board of Directors of the AfDB. South Africa shares a constituency office with Lesotho and Swaziland.
In 2007, South Africa formalised its membership to the African Development Fund (ADF), an AfDB fund providing concessional lending to low-income African countries from donor contributions that are replenished at three-yearly cycles. South Africa has been the only regional member country that donates to the ADF until ADF-12, when Egypt joined. Other members of the ADF include most of the traditional donors, emerging donors and middle-east countries. The AfDB recently concluded the thirteenth replenishment for the Fund, where South Africa pledged R230 million, a 90% increase from the twelfth replenishment. The ADF-13 sees the number of African countries that contribute to the Fund increase from two under ADF-12 to four with Angola and Libya joining. These developments are important to ensure a greater African voice in the policy discussions and to cushion the financing risk to the African agenda.
The AfDB Country Strategy Paper (CSP) for South Africa covering the period 2013–2017 was approved by the AfDB Board of Directors in December 2012. The 2013-2017 CSP is aimed at enhancing the AfDB’s partnership with South Africa. The strategy paper for the period 2013-2017 is anchored on the country’s new development strategies, the New Growth Path (NGP), the National Development Plan—vision for 2030, and on the Bank’s new long-term strategy (LTS) 2013-2022. This new CSP seeks to position the Bank to continue playing a catalytic role in South Africa’s development process through an enhanced operational focus on innovation and value addition to support manufacturing and job creation. The strategy will continue to build on the AfDB’s comparative advantage in the areas of financial intermediation and infrastructure development. It promotes intensified focus on generating knowledge, sharing best practices, building capacity and fostering regional cooperation.
27
The Pretoria Regional Office that was established in 2009 has been upgraded to a Regional Resource Centre (RCC) to service twelve (12) SADC countries. This followed the decision of the Board of Directors of the AfDB in July 2011, to nominate Pretoria and Nairobi to host the two pilots for the RCCs of the Bank. The RCCs enhance the operational efficiency of the AfDB, through increased technical and specialist skills, and local procurement to enable more rapid support to clients. This will promote regional integration and economic cooperation to enhance the region’s competitiveness and for diversifying economic activities to encourage more inclusion and sustainable growth. The countries supported by the Southern African Regional Resource Centre (SARRC) include South Africa, Botswana, Lesotho, Namibia, Swaziland, Zimbabwe, Angola, Madagascar, Malawi, Mauritius, Mozambique and Zambia. SARRC also serves as a back-up site to house essential services of the AfDB and contribute to the improvement of partner coordination. In November 2009, the AfDB approved a sovereign guaranteed loan of €1.86 billion (approximately R20.7 billion) for the Eskom Medupi Power Project in Lephalale, Limpopo. This followed a US$500 million loan to Eskom from the private sector window of the AfDB. In September 2011, the AfDB signed a US$365 million guaranteed loan with Eskom for its renewable projects. The loan consists of US$265 million from the AfDB’s own resources and US$100 million from the CTF. In September 2012, the AfDB and the Land Bank signed a sovereign guarantee loan of R1 billion to finance part of Land Bank’s lending portfolio to the agricultural sector.
Development Finance Institutions (DFIs)
South Africa has seven national DFIs which are state-owned and which report to their respective National Government shareholder departments (Khula and SAMAF have since been incorporated as the subsidiary of IDC called Small Enterprises Finance Agency (SEFA)). The Independent Development Trust (IDT) was also been removed from the list, as it plays the role of a development agency and not loan disbursing. DFIs were created to promote social and economic development within South Africa. They do so by providing funds related to a variety of development-associated objectives such as job creation, provision of low cost housing, agricultural development, small and medium enterprise development and industrial and infrastructure development.
DFIs are funded through a mixture of National Government funds, such as grants, guarantees, borrowings and state income. Currently only two DFIs, the Development Bank of Southern Africa (DBSA) only SADC) and the IDC (the entire Africa), are allowed to invest outside of South Africa’s borders in other African countries. The DBSA operations are limited to Southern African Development Community (SADC) and the IDC to the entire Africa.
The financial position of the DFIs is as follows: the total asset base of all DFIs as of March 31, 2013 amounted to R221 billion.
| | • | | DFIs, total assets amounted to R222.billion as at March 31, 2013 |
| | • | | 99% (R221 billion) of these total assets are held by major DFIs (Development Bank of Southern Africa, Industrial Development Corporation, Land Bank, National Empowerment Fund & National Housing Finance Corporation). |
| | • | | Of these assets, 41% (R91.7 billion) is channeled towards development lending, and 34% (R 75 billion) is in equity investments. |
| | • | | DBSA’s development lending to its total assets is at 79% (R43 billion), Land Bank at 79% (R27 billion) and NHFC at 42% (R14 billion). |
| | • | | DBSA and Land Bank constitute 76% (R43 billion) and 26% (R27 billion) of all DFIs development lending, respectively. |
| | • | | The resources that IDC deployed to development amount to R91 billion which consists of 80% (R72 billion) of equity investments and 20% (R19 billion) development lending. |
DFIs are governed by, amongst others, the Public Finance Management Act of 1999 (PFMA) and their own individual legislation and regulations. The National Government has emphasized that DFIs need to operate on a financially stable basis and be guided by the National Development Plan and several sectorial government development policy such as IPAP and NGP. It is therefore a policy priority that improvements are made to the coordination, oversight and governance of DFIs, as well as enhanced monitoring of their financial performance and development impact
28
Public Health
South Africa has a well-established health sector which comprises 8.7% of GDP. Private sector facilities are of world class standard. Public health facilities include over 4,000 clinics and 400 hospitals throughout the nation and will be progressively strengthened as the National Health Insurance (NHI) programme is implemented. The public sector has roughly 305,487 employees and there are 18,787 employed doctors and over 134,453 nurses. Public health spending was R142 billion in fiscal year 2013, slightly more than private health spending (R141 billion).
Minister of Health Dr Aaron Motsoaledi, a medical doctor, was appointed in 2009, and subsequently a number of successes have been achieved in the health sector:
| | • | | mortality rates have begun to decline – life expectancy has increased from 51.8 years in 2005 to 60 years in 2011 and infant mortality has significantly declined from 37 deaths per 1000 live births in 2010 to 30 in 2011 (source: Rapid Mortality Surveillance Report 2011); |
| | • | | the number of people on antiretroviral treatment increased from 1,462,527 in March 2011 to 2,309,512 in March 2013; |
| | • | | the Nurse Initiated Management of Antiretroviral Therapy (NIMART) programme was launched which has expanded access to ARVs; |
| | • | | number of visits to primary care facilities have increased by 56%, or 46 million visits, in over a decade (from 82 million to 128 million) and in 2012/13 3 visits per uninsured person per annum was recorded; |
| | • | | health personnel numbers have increased by 21,296 over the past three years, and have stabilised over the past year as a cost containment measure. By September 2013, personnel numbers reached 305,487 in the public sector; |
| | • | | the financial position of provincial Departments of Health has improved; |
| | • | | a Green Paper on National Health Insurance has been published and the White Paper is at an advanced stage and will be released to the public in the coming months; |
| | • | | the National Strategic Plan for HIV, STIs and TB 2012-2016 was launched in 2012 and significant progress has been made; |
| | • | | GeneXpert®, a new TB diagnostic tool has been introduced in the public sector; |
| | • | | introduction of dual and triple therapy has drastically reduced the mother-to-child HIV transmission rate to 3.5% in 2010/12, 2.5% in 2012/13 and continues to decline; |
| | • | | pneumococcal and rotavirus vaccines are being offered to all South African children to protect against pneumonia and diarrhea; and |
| | • | | A new fixed dose combination ARV drug is being offered in the public health sector with the intention to improve treatment compliance. |
HIV, AIDS and Tuberculosis (TB)
The socio-economic impact of the HIV and AIDS epidemic on South Africa is significant and the National Government has made the curtailment and treatment of this disease a high priority. This, along with the treatment and prevention of TB, is part of a multi-pronged strategy to improve public health services which also includes hospital revitalization (64 hospitals are currently being built or upgraded), increasing the numbers of public health workers and the introduction of new-generation child vaccines as well as improved infectious and non-communicable disease control programmes.
A multi-sectoral approach aims to improve prevention programmes and mitigate the impact of AIDS-related morbidity and mortality. The National Strategic Plan for HIV, STIs and TB 2012-2016 (launched in December 2011) aims to build on achievements made in HIV, TB and STI prevention, treatment and care and address social and structural barriers that increase vulnerability to HIV, TB and STI infection and increase protection of human rights. The plan consists of four strategic objectives with numerous sub-objectives and proposed interventions. The broad groups of intervention are:
| | • | | address social and structural drivers; |
| | • | | sustain health and wellness; and |
| | • | | human rights and access to justice. |
29
The primary goals were to reduce the rate of new HIV infections by 50%, initiate at least 80% of eligible patients on antiretroviral treatment (ART), and reduce the number of new TB infections and deaths by 50%. Spending on HIV and AIDS has grown rapidly, to around R24.7 billion per annum in 2013/14, of which R10.5 million comes from the HIV and AIDS conditional grant.
Estimates of the number of people infected with HIV in South Africa vary according to the information supplied by the source in question. Stats SA estimates that the number of new infections as of mid-year 2011 was 380,500 or 0.75% of the population. The HIV incidence rate is declining due to prevention interventions and an increase in treatment, which is primarily attributed to a recent increase in the number of facilities providing ART. The Actuarial Society of South Africa estimates that the change in the number of new infections in 2008 decreased by 1.5% as compared to 2007, which is the tenth consecutive year since 1998 that the number of new infections has decreased. Stats SA has estimated that, by mid-year in 2011, 5.38 million or 10.6% of the population was living with HIV in South Africa.
The highest prevalence rates are found in the public sector pre-natal groups. Pre-natal surveys do suggest, however, that national prevalence rates are leveling off. Prevalence rates vary substantially throughout provinces, with KwaZulu-Natal (39.1%) being the highest and Western Cape (15.1%) the lowest, as measured among pre-natal clinic attendees during the sample period 2004-2006. Variations also exist within districts in provinces.
By end of March 2013, approximately 2.3 million people were on ART in South Africa and this is planned to increase to three million within the next three years. In his National Address on World Aids Day (December 1, 2009), President Zuma announced drastic changes to the National Government policy on the treatment of HIV/AIDS. Effective from April 2010, all HIV positive children under the age of one will receive free ART, regardless of the level of their CD4 count. All pregnant HIV positive women with a CD4 count of 350 or less, or with HIV symptoms (regardless of their CD4 count level) will have access to ARTs. Previously such women were only eligible when their CD4 count levels were less than 200. All TB patients with HIV will receive ART if their CD4 count levels are 350 or less. In the course of 2011, President Zuma expanded the ART policy to all HIV-positive persons with a CD4 count of 350. There is some recent evidence that widespread treatment is beginning to turn around national mortality and life expectancy indicators.
By 2009, 96% of public health facilities offered voluntary counseling and testing services which is a marked improvement from the 64% of facilities offering these services in 2005. The Health Ministry is currently embarking on a large scale HIV counseling and testing programme and is attempting to increase condom distribution from 400 million to 1 billion per annum.
The epidemics of TB and HIV are linked, with a 70% co-infection rate in South Africa. The high overall prevalence of HIV in South Africa has thus contributed to an increasing incidence of active TB. South Africa has experienced a steady increase in the number of TB infections. There has also been an increase in Multi Drug Resistant TB (MDR TB) and Extremely Drug Resistant TB (XDR TB), although together these variants constitute less than 1% of TB infections. The recent introduction of Genexpert® has significantly improved the diagnosis of MDR and XDR TB cases.
The Department of Health has implemented the Directly Observed Treatment Short-Course Strategy, promoted by the International Union against TB and the World Health Organization. Further steps being taken to strengthen the strategy to combat TB include the tracing and treatment of treatment defaulters to improve cure rates, the hospitalization of MDR TB patients and the treatment of such patients with more expensive second line drugs. From 2010 onward, all HIV positive persons with TB are placed on full ART for life.
Provisions have been made for a mass national vaccination campaign to reduce the incidence of measles and to introduce new generation child vaccines to prevent pneumonia and diarrhea. The Department of Health has also introduced a series of interventions to reduce maternal and child morbidity and mortality. Recent progress in preventing mother-to-child HIV transmission (dual and triple prophylaxis) will assist in reducing child mortality. Child nutrition is improving partly due to the availability of social grants (over 15 million South Africans are monthly recipients, mainly children and elderly). School feeding schemes are available to all school children at selected primary and secondary schools.
National Health Insurance (NHI)
The NHI is one of the ten key priorities of the health sector’s Programme of Action. It is to be implemented in phases from 2012 over a 14-year period. The first phase will focus on strengthening the public health sector. The Green Paper on NHI was released in August 2011 for public comment, In February 2012; the Minister of Health announced ten pilot NHI districts. These are OR
30
Tambo (Eastern Cape), Thabo Mofutsanyane (Free State), City of Tshwane (Gauteng), uMgungundlovu and UMzinyathi (KZN), Vhembe (Limpopo), Gert Sibande (Mpumalanga), Dr KK Kaunda (North West), Pixley ka Seme (Northern Cape) and Eden (Western Cape). Kwa Zulu Natal has added Amajuba district as a pilot site. The districts were chosen based on the results of audits of all healthcare facilities as well as the demographic profiles and key health indicators. The NHI’s objective is to put in place necessary funding and health service delivery mechanisms that will enable the creation of an efficient, equitable and sustainable health care system in South Africa. The NHI aims to strengthen and build quality into the health care system through adherence to standards that will cover, inter alia, infection prevention and control; improvement of patient safety and availability of medicines. The first phase will involve improved primary health care services in rural areas and under-served communities and an expanded programme of hospital construction and revitalization.
In preparation, changes have been made to the equitable share formula in order to allow for a more comprehensive health component. Included are subcomponents for primary health care and hospitals. A conditional grant was created in fiscal year 2013/14 to test innovations (e.g. contracting with GPs and strengthening revenue management at central hospitals) in pilot districts in preparation for NHI implementation. The National Treasury has prepared a discussion document on financing aspects of NHI and will be released for public comment in the coming months.
The National Department of Health intends to improve primary health care as part of an enhanced health care delivery system. Areas that are being considered are as follows: district-based clinical specialist support teams, school-based primary health care services, family health teams (including municipal ward-based outreach services, and district-based contracts with doctors (such as GPs and multidisciplinary group practices). Other matters under consideration are the alignment of the procurement of medicines by bulk buying to enable cheaper prices, direct delivery of medicines and medical supplies, and use of private pharmacies in the public sector. In the longer term, a National Health Insurance Fund (NHIF) is likely to be introduced purchasing from a mix of public and private providers.
Office of Health Standards Compliance (OHSC)
An important reform is the proposed Office of Health Standards Compliance (OHSC) to promote quality in the health sector by measuring, benchmarking and accrediting actual performance against a set of norms and standards. The OHSC will be responsible for ensuring that standards are met in all public and private health facilities in South Africa. The OHSC’s functions will include: inspecting and certifying health establishments that comply with prescribed norms and standards, withdrawing certification, investigating complaints relating to the national health system, monitoring indicators of risk as an early warning system relating to serious breaches of norms and standards and reporting any breaches to the Minister, and identifying areas for action by a national or provincial department of health.
Human papillomavirus (HPV) vaccine
In response to the growing incidence of cervical cancer in South Africa, the Minister of Health announced that the HPV vaccine (which prevents the virus that causes cervical cancer) would be provided to 9 - 10 year old girls in quintile one to four schools starting in April 2014. The introduction of the HPV vaccine in the public sector will be funded from the 2014 Budget.
31
THE SOUTH AFRICAN ECONOMY
Overview
General
South Africa has the most developed economy in Sub-Saharan Africa in terms of total GDP, and accounted for approximately one-third of the aggregate GDP of Sub-Saharan Africa during 2012 (source: IMF, World Economic Outlook Database, October 2013). Stable economic policies, healthy public finances and resilient financial institutions pursued steadily over the past 19 years have underpinned long term economic expansion.
A sound banking system, relatively low public debt levels and prudent regulations on household debt insulated the nation from some of the worst effects of the recent global financial crisis. Weakness in the global economy over 2012 has dampened domestic growth. However, growth is expected to pick up over the next three years, supported by resilient household consumption growth, sustained infrastructure investment spending and a gradual recovery in private fixed capital formation. South Africa features a robust regulatory environment, openness to trade, developed capital markets and an attractive position as a gateway to Africa.
The economy includes fast growing and sophisticated finance, wholesale and retail trade, catering and accommodation sectors, as well as a developed manufacturing sector. Financial markets are relatively liquid and both equities and government bonds have been actively traded by domestic and international investors.
South Africa is resource rich. It is the world’s largest producer of platinum and chromium and holds the world’s largest known reserves of manganese, platinum group metals, chromium, vanadium and alumino-silicates. The World Economic Forum Global Competitiveness Report 2013 ranks South Africa third overall out of 148 countries for financial market development, whilst the 2013 UNCTAD World Investment Report noted South Africa was the third largest destination for foreign direct investment in the region after Nigeria.
With the most developed industrial and financial capabilities on the African continent, South Africa plays an important role in regional policies, markets, finance and infrastructure. Outwardly oriented South African companies are among the largest sources of foreign direct investment in Africa and the country’s development finance institutions are playing an increasing role in the funding of regional infrastructure investments. UNCTAD’s 2013 World Investment report showed South Africa was the third largest investor in Least Developed Countries, behind China and India. In a report dated September 19, 2012, PricewaterhouseCoopers also noted that South African banks account for 40% of Africa’s assets and its insurance sector represents 70% of all premiums in Africa.
In 2012, South Africa officially became a member of the BRIC countries (Brazil, Russia, India and China), as an acknowledgement of the economy’s size and regional importance. It is likely that this will lead to closer economic ties between BRICS countries.
The legacy of apartheid era politics and economics is still felt today, despite the progress achieved. The Gini coefficient, which is a measure of economic inequality where 0 indicates no inequality and 1 absolute inequality, was equal to 0.7 for South Africa in 2009, among the highest in the world.
Although, the poor are better off in absolute terms under South Africa’s new constitutional dispensation, thanks in large part to government’s social spending, income inequality remains high, due largely to high unemployment. High rates of unemployment among black South Africans, the less educated and women and individuals from more rural provinces still reflect the impact of the apartheid system on education, income and settlement patterns. For example, as of June 30, 2013, unemployment among the economically active white population was 6.1%, whereas the unemployment rate among the economically active black population was 29.1%.
Progress is being made in restoring imbalances, albeit slowly. The long term labour force participation rate has increased from 48% in 1995 to 55.7% as at June 30, 2013, as more women, black South Africans and youth have entered the labour market – although this remains below a pre-crisis peak of 58% in 2008. There is also a small but rapidly growing black middle class. A study by the Bureau of Market Research at the University of South Africa estimated South Africa’s emerging black middle class stood at 9.3 million individuals in 2007, a 47.6% increase from 6.3 million in 2001.
32
Unemployment, and youth unemployment in particular, remains a critical challenge. Only 42% of the adult population (ages 15 to 64) works, either in the formal or informal sector. Formal sector non-agricultural employment has recovered to levels of employment reached prior to the global financial crisis of 2008, but these recent gains have not kept pace with the growth of the working age population, leaving a structural employment backlog. Youth unemployment is particularly high: as at 30 June 2013, the unemployment rate for 15-34 year olds is nearly 35%, with young people below the age of 35 accounting for nearly 69% of the unemployed. Low domestic savings, inadequate investment in economic infrastructure, skills shortages, the efficient delivery of government services and currency volatility are other challenges. The key challenge for South Africa is to achieve higher levels of inclusive growth that raises employment and reduces inequality.
The administration’s policies are geared to promote employment and growth, which it views as crucial for redressing the structural inequalities of the South African economy. The NDP 2030, endorsed in September 2012 by the Cabinet, outlines a long term set of structural reforms to eliminate poverty, raise growth and enhance competitiveness, through improving the quality of education, skills development and innovation, and building the capability of the state to implement policy and deliver services effectively.
The NDP 2030 sets out ten “critical actions” on which government policy can proceed in partnership with the private sector, trade unions and civil society:
| | • | | A social compact to reduce poverty and inequality, and raise employment and investment. |
| | • | | A strategy to address poverty and its effects by broadening access to employment, strengthening the social wage, improving public transport and raising rural incomes. |
| | • | | Steps by the state to professionalize the public service, strengthen accountability, improve coordination and prosecute corruption. |
| | • | | Boost private investment in labour-intensive areas, competitiveness and exports, with adjustments to lower the risk of hiring younger workers. |
| | • | | An education accountability chain, with lines of responsibility from state to classroom. |
| | • | | Phase in national health insurance, with a focus on upgrading public health facilities, producing more health professionals and reducing the relative cost of private health care. |
| | • | | Public infrastructure investment to reach 10% of GDP financed through tariffs, public-private partnerships, taxes and loans and focused on transport, energy and water. |
| | • | | Interventions to ensure environmental sustainability and resilience to future shocks. |
| | • | | New spatial norms and standards – densifying cities, improving transport, locating jobs closer to where people live, upgrading informal settlements and fixing housing market gaps. |
| | • | | Reduce crime by strengthening criminal justice and improving community environments. |
Sectoral strategies and priorities identified in the NDP 2030 will be translated into practical programmes and policies over time, drawing on the capacity and initiative of both the public and private sectors. The government is currently working on the NDP’s first 5-year plan which will be incorporated in the 2014 Medium-Term Strategic Framework (MTSF).
In the nearer term, the National Government’s New Growth Path includes policies to accelerate growth and employment, focusing on job-creation targets and sector-based initiatives. Jobs drivers include substantial public investment in infrastructure, expansion of labour-absorbing sectors such as agriculture and light manufacturing, “green economy” initiatives and support for rural development and regional integration.
The commitment to enhancing growth potential is reflected in government’s fiscal allocations. South Africa has embarked on a large infrastructure investment program, with R844.5 billion allocated to public sector projects during the next two fiscal years. The programme has a particular focus on network industries including energy, transport and water infrastructure. Over R650 billion has been allocated to education over this period to improve the skills levels of South Africans and boost future employment, while R25 billion over the next six years has been allocated towards a range of initiatives that promote competitiveness.
Implementing the National Development Plan 2030
The NDP 2030 is a framework to accelerate economic growth, eliminate poverty and reduce inequality. It was widely canvassed and endorsed by the South African public prior to its adoption by Cabinet and is being implemented by government. The plan aims to reduce the costs of living and of doing business, resulting in improved consumer and business confidence, rising levels of private investment, and higher growth and employment.
33
The government is acting on key NDP proposals, including:
| | • | | Making sustainable investments in competitive economic infrastructure; |
| | • | | Increasing the pace of job creation, particularly for young job seekers; |
| | • | | Encouraging the expansion of businesses and the development of new enterprises, including small and medium-sized companies; |
| | • | | Transforming human settlements and developing a functioning public transport system; |
| | • | | Providing policy certainty to encourage long-term investment in mining and other sectors; and |
| | • | | Increasing economic integration within sub-Saharan Africa in areas such as energy production, finance, tourism, communications, infrastructure building and customs administration. |
A number of measures are under way to address short- and medium-term concerns in key economic sectors. In mining, there has been progress in resolving labour disputes. Government has taken steps to reduce freight costs, to improve access to finance and support services for small business, to bring private investment into renewable energy development, and to ensure that competition is not undermined by collusive practices. Over the medium term, these steps should increase South Africa’s growth prospects. New electricity generating capacity scheduled to come on line next year is anticipated to remove a key constraint in the economy and Cabinet announced in July its intent to support long term stability of electricity supply by building a third coal-fired power plant, Coal 3, to compliment the supply that is expected to be generated when the Medupi and Kusile plants come online.
GDP
Real GDP growth averaged 3.3% between 1994 and 2012, but average growth rose to 5.2% between 2004 and 2007, supported by strong domestic and international growth rates. The 2008 global financial crisis led to 1.5% contraction in real GDP in 2009, but since 2010, growth has been around 3% per year, averaging 3.1% in 2010, 3.5% in 2011, before slowing to 2.5% in 2012 and 1.8% in the first half of 2013.
Growth has been supported by robust household consumption and government spending although the contribution of household consumption is slowing. Household consumption growth has slowed from 3.5% in 2012 to 2.4% in the first half of 2013. Sluggish job creation, elevated household indebtedness and limited growth in real disposable income continue to constrain household spending.
Growth in public sector investment accelerated in 2012 and in the first half of 2013 while private sector investment growth slowed during the same period. Private sector investment continues to grow, reaching 3.3% in the second half of 2013, as compared to 3.9% for 2012, as South African corporations refrain from significant new project developments in an environment of weaker business confidence, domestic supply constraints and low levels of demand. In contrast, the pace of gross fixed-capital formation by the public sector is expanding, supported by strong spending by the state owned companies and in particular Eskom, Transnet and Sanral.
Exports contributed positively to the growth rebound, although since 2012, momentum has slowed alongside external demand. Domestic supply constraints, including electricity rationing in manufacturing and disruptions to mining output, have exacerbated the pressure on exports. The recovery in imports has been stronger. The volume of imports is now almost 12.0% above pre-crisis highs, while exports are still 6.3% below their highs prior to the crisis.
During the prolonged economic expansion between 1999 and 2007, all sectors, with the exception of mining, grew at a robust pace. Real value added by the secondary and tertiary sectors increased briskly at average annualized rates of 3.4% and 4.2%, respectively, compared to the 0.4% average annualized growth of mining over the same period.
A recovery in the manufacturing sector led the growth rebound in 2010, although its contribution has subsided due to weaker external demand. Real growth in gross value added within the manufacturing sector slowed to 2.4% in 2012, from 3.6% in 2011 and 5.6% in 2010.
34
The financial, real estate and business services sector has been an important positive contribution to overall growth since the recession. The wholesale and retail trade, as well as community services (and in particular general government services) sectors have also been important contributors to growth since then. By contrast, the contribution to growth from mining has been negligible and as of June 2013, mining volumes were 6.8% below their March 2007 peak. Supply disruptions in the first half of 2013, linked to strike activity, have further significantly reduced output from the sector.
The National Treasury projects the South African economy is expected to grow by 2.1% in 2013, according to the 2013 Medium Term Budget Policy Statement, weighed down by a weak global economy and domestic output disruptions. Continuing violence at Lonmin’s Marikana mine and the spread of industrial action since August 2012 (see “—Mining and Quarrying” below) have dented confidence and lowered growth prospects for the sector. Declining mining output and the spread of strike activity have depressed activity in related industries including manufacturing, logistics and services, with negative consequences for GDP, tax revenues, exports and employment.
An initiative by the President has recently brought together government, business and labour representatives to respond with urgency to the underlying causes of worker discontent and civil unrest, and to find collaborative solutions to address the country’s longer-term economic and social needs.
Assuming a return to relatively peaceful industrial relations, domestic conditions are largely supportive of growth. Real interest rates are low, the banking sector remains well capitalized and the corporate sector holds high levels of cash on its balance sheets. Expanding public-sector investment in infrastructure, the activation of new electricity-generating capacity, improving private-sector confidence, relatively low inflation and interest rates, and strong growth in the southern African region should support growth in later years.
To improve confidence in the economy, expand trade and investment, increase employment and broaden participation in the economic recovery, government announced in its October 2013 Medium Term Budget Policy Statement (MTBPS) that it will target progress in several areas:
| | • | | Managing risk in a constrained fiscal environment, while building a foundation for faster and more inclusive long-term growth; |
| | • | | Maintaining the expenditure ceiling set in the 2013 Budget and narrowing the budget deficit through 2016/2017; |
| | • | | Investing in electricity and transport capacity to support faster growth; |
| | • | | Promoting industrial competitiveness; and |
| | • | | Facilitating broad social cooperation to address challenges in mining and community development. |
The National Government plans to continue efforts to combat waste, inefficiency and corruption. Reforms will focus on procurement systems that prioritizes value for money and strengthening the anti-corruption system as a whole. Over the MTEF period, further steps will be taken to strengthen the capacity and efficiency of government departments. Particular attention will be paid to implementing reforms in provincial and municipal infrastructure planning and delivery.
Prudent fiscal management, a flexible exchange rate and an effective inflation targeting regime serve as the macroeconomic foundation for these reforms. These initiatives will take place within a disciplined spending trajectory partially financed through a budget deficit of 4.2% of GDP in 2013/14, narrowing to 3.8% of GDP in line with improved economic growth by 2015/16.
The following tables show nominal and real GDP and expenditures for the periods indicated.
GDP Summary
| | | | | | | | | | | | | | | | | | | | | | | | |
| | | As of and for the year ended December 31 | | | As of and for the
six months ended
June 30 | |
| | | 2008 | | | 2009 | | | 2010 | | | 2011 | | | 2012 | | | 2013(1) | |
Nominal GDP (millions of Rand) at market prices | | | 2,256,485 | | | | 2,406,401 | | | | 2,659,366 | | | | 2,917,539 | | | | 3,155,195 | | | | 3,312,258 | |
Real GDP (millions of Rand) at 2000 prices | | | 1,814,594 | | | | 1,786,897 | | | | 1,842,052 | | | | 1,905,736 | | | | 1,954,303 | | | | 1,980,963 | |
Real GDP Growth (percentages) | | | 3.6 | | | | (1.5 | ) | | | 3.1 | | | | 3.5 | | | | 2.5 | | | | 1.7 | |
Population (million) | | | 49.6 | | | | 50.2 | | | | 50.9 | | | | 51.6 | | | | 52.3 | | | | 51.8 | |
Per Capita GDP (nominal) | | | 45,254 | | | | 47,676 | | | | 52,087 | | | | 56,504 | | | | 60,419 | | | | 63,980.2 | |
Per Capita GDP (real) | | | 36,392 | | | | 35,402 | | | | 36,079 | | | | 36,908 | | | | 37,423 | | | | N/A | |
35
Note: —
| (1) | Seasonally adjusted and annualized. |
Sources: SARB and Stats SA
GDP and Expenditures (at constant 2005 prices)
| | | | | | | | | | | | | | | | | | | | | | | | |
| | | As of and for the year ended December 31 | | | As of and for the
six months ended
June 30 | |
| | | 2008 | | | 2009 | | | 2010 | | | 2011 | | | 2012 | | | 2013(3) | |
Rand (million) | | | | | | | | | | | | | | | | | | | | | | | | |
Real GDP at 2005 prices | | | 1,814,594 | | | | 1,786,897 | | | | 1,842,052 | | | | 1,905,736 | | | | 1,954,303 | | | | 1,980,963 | |
Add: Imports of goods and services | | | 572,490 | | | | 472,927 | | | | 518,120 | | | | 568,476 | | | | 604,209 | | | | 643,256 | |
Total supply of goods and services | | | 2,387,084 | | | | 2,259,824 | | | | 2,360,172 | | | | 2,474,212 | | | | 2,558,512 | | | | 2,624,219 | |
Less: Exports of goods and services | | | 501,196 | | | | 403,304 | | | | 421,589 | | | | 446,615 | | | | 447,131 | | | | 474,483 | |
Total goods and services available for domestic expenditure | | | 1,885,888 | | | | 1,856,520 | | | | 1,938,583 | | | | 2,027,597 | | | | 2,111,381 | | | | 2,149,736 | |
Domestic Expenditure | | | | | | | | | | | | | | | | | | | | | | | | |
Final consumption expenditure by households | | | 1,157,715 | | | | 1,139,556 | | | | 1,189,832 | | | | 1,247,281 | | | | 1,291,081 | | | | 1,315,178.5 | |
Final consumption expenditure by general government(1) | | | 348,894 | | | | 365,711 | | | | 383,929 | | | | 401,492 | | | | 418,181 | | | | 427,006.5 | |
Total Final consumption expenditure | | | 1,506,609 | | | | 1,505,267 | | | | 1,573,761 | | | | 1,648,773 | | | | 1,709,262 | | | | 1,742,185 | |
Gross fixed capital formation | | | 380,909 | | | | 364,622 | | | | 357,226 | | | | 373,293 | | | | 394,450 | | | | 405,432.5 | |
Change in inventories | | | -8,229 | | | | -23,984 | | | | -1,398 | | | | 5,058 | | | | 3,304 | | | | 3,382.0 | |
Residual item(2) | | | 6,599 | | | | 10,615 | | | | 8,994 | | | | 473 | | | | 4,365 | | | | -1,263.5 | |
Total gross domestic expenditure | | | 1,885,888 | | | | 1,856,520 | | | | 1,938,583 | | | | 2,027,597 | | | | 2,111,381 | | | | 2,149,736.0 | |
Real GDP (at 2005 prices) | | | 1,814,594 | | | | 1,786,897 | | | | 1,842,052 | | | | 1,905,736 | | | | 1,954,303 | | | | 1,980,962.5 | |
Notes: —
| (1) | Seasonally adjusted and annualized. |
| (2) | Consumption expenditure by general government includes current expenditure on salaries and wages and on goods and other services of a non-capital nature of the general departments (not business enterprises) of the National Government authorities, provincial government authorities, local government authorities and extra-budgetary institutions. |
| (3) | Represents the difference between the calculation of GDP according to the expenditure and production method. |
Source: SARB and Stats SA.
36
GDP and Expenditures as Percentage of Real GDP (at constant 2005 prices)
| | | | | | | | | | | | | | | | | | | | | | | | |
| | | As of and for the year ended December 31 | | | As of and for the
six months ended
June 30 | |
| | | 2008 | | | 2009 | | | 2010 | | | 2011 | | | 2012 | | | 2013(3) | |
Real GDP at 2000 prices | | | 100 | | | | 100 | | | | 100 | | | | 100 | | | | 100 | | | | 100 | |
Add: Imports of goods and services | | | 31.5 | | | | 26.5 | | | | 28.1 | | | | 29.8 | | | | 30.9 | | | | 32.5 | |
Total supply of goods and services | | | 131.5 | | | | 126.5 | | | | 128.1 | | | | 129.8 | | | | 130.9 | | | | 132.5 | |
Less: Exports of goods and services | | | 27.6 | | | | 22.6 | | | | 22.9 | | | | 23.4 | | | | 22.9 | | | | 24.0 | |
Total goods and services available for domestic expenditure | | | 103.9 | | | | 103.9 | | | | 105.2 | | | | 106.4 | | | | 108.0 | | | | 108.5 | |
Domestic Expenditure | | | | | | | | | | | | | | | | | | | | | | | | |
Final consumption expenditure by households | | | 63.8 | | | | 63.8 | | | | 64.6 | | | | 65.4 | | | | 66.1 | | | | 66.4 | |
Final consumption expenditure by general government(1) | | | 19.2 | | | | 20.5 | | | | 20.8 | | | | 21.1 | | | | 21.4 | | | | 21.6 | |
Total Final consumption expenditure | | | 83.0 | | | | 84.2 | | | | 85.4 | | | | 86.5 | | | | 87.5 | | | | 87.9 | |
Gross fixed capital formation | | | 21.0 | | | | 20.4 | | | | 19.4 | | | | 19.6 | | | | 20.2 | | | | 20.5 | |
Change in inventories | | | -0.5 | | | | -1.3 | | | | -0.1 | | | | 0.3 | | | | 0.2 | | | | 0.2 | |
Residual item(2) | | | 0.4 | | | | 0.6 | | | | 0.5 | | | | 0.0 | | | | 0.2 | | | | -0.1 | |
Total gross domestic expenditure | | | 103.9 | | | | 103.9 | | | | 105.2 | | | | 106.4 | | | | 108.0 | | | | 108.5 | |
Notes: —
| (1) | Consumption expenditure by general government includes current expenditure on salaries and wages and on goods and other services of a non-capital nature of the general departments (not business enterprises) of public authorities. Public authorities include National Government authorities, provincial government authorities, local government authorities and extra-budgetary institutions. |
| (2) | Represents the difference between the calculation of GDP according to the expenditure and production methods. |
| (3) | First half of 2013, seasonally adjusted and annualized. |
Sources: SARB and Stats SA
Gross Domestic Expenditure (GDE)
GDE grew at an average annualized rate of 5.5% between 2000 and 2007, driven predominantly by strong growth in household consumption and robust investment growth. Household spending was boosted by rising employment, improved access to financial products and the growing black middle class, whilst investment accelerated in response to stronger growth. Public spending has been positive, but became an important support for growth during the recession, both in terms of government consumption and investment by state owned companies, who had begun to significantly expand investments since 2007.
Households’ expenditure made up 67.5% of GDP in real terms during the six months ended June 30, 2013. Growth in households’ expenditure accelerated from 4.4% in 2010 to 4.6% in 2011 before slowing to 4.1% in 2012. Much of the post-recession growth in consumption has been sustained by the recovery in employment for higher-skilled workers and low interest rates, which have also enabled households to accumulate more debt. In the first half of 2013, spending growth moderated to 2.4% annualized as high food and fuel prices reduced household’s disposable income and the sluggish employment growth.
Expenditure on durable goods, especially motor vehicles, is slowing. Following an increase of 18.8% in 2010, growth in real spending on durable goods edged lower to a still buoyant 15.8% in 2011, decreasing to 11.0% in 2012 and 7.1% in the first half of 2013. The slowdown reflects higher prices due to the depreciation of the rand and moderate household disposable income growth.
37
Real expenditure on non-durable goods increased by 3.1% in 2011, decreasing to 2.5% in 2012 and to 2.0% in the first half of 2013 as high inflation reduced disposable income. Growth in real spending by households on services also declined, from 3.5% in 2012 to 1.8% in 2013. A lower rate of increase in spending on miscellaneous services was partly offset by higher growth in spending on all other service related spending categories.
Consumers have access to sophisticated credit markets. Credit extension to households continues to grow, but the pace of this growth is waning as a result of deteriorating affordability, tightening lending criteria and poor job growth. Growth in credit extension to households was 8.2% during the first eight months of 2013, a decrease from 8.7% in the same period of 2012. Weakness in the housing market has resulted in sluggish mortgage finance. By contrast annual growth in unsecured credit has exceeded 20% since 2011 before falling below this level in August. Unsecured credit is a relatively small portion (9%) of total household debt. Most of the increase in unsecured loans reflects larger loans over longer time periods. Currently, levels of unsecured lending do not pose a significant risk to financial stability; however, measures to improve responsible lending and borrowing are required to support access and affordability of credit. In lower- and middle-income communities, concerns related to the garnishee system require attention. The garnishee system is the system through which banks are granted court orders requiring the employer of a person in debt to pay part of their wages, with interest, directly over to their lender. Financial sector regulators are investigating these matters and on November 2, 2012, leading South African retail banks and the Banking Association of South Africa (BASA) signed an agreement with the National Treasury not to seek garnishee orders. Anticipated “twin peaks” regulatory reform in the financial sector, according to which prudential risk and market conduct are separately regulated, may help ensure better coordination among regulators and facilitate regulatory correction in response to consumer complaints.
While households have incurred more debt, their disposable income rose more quickly than their indebtedness, resulting in a decline in the household debt-to-income ratio. Total household debt averaged 75.6% of disposable income in the first half of 2013, down from 75.4% in the first half of 2012 and 6.9% lower than its peak of 82.7% in the first quarter of 2008. Leverage has also been rising with the ratio of debt to total assets increasing to an average of 20.1% in the first half of 2013 from 19.4% in 2012. Debt-service costs fell from an average of 6.8% of disposable income in the first half of 2012 to an average of 6.4% in the first half of 2013. The gross saving rate of the household sector remained at 1.7% of disposable income in the first half of 2013. On a net basis, taking into account depreciation, household savings were 0.0% of disposable income in the first half of 2013, an improvement from a dissaving of 0.1% of disposable income in the same period of 2012.
Gross fixed capital formation constituted 20.6% of total GDP in real terms in the six months ended June 2013, well above the level of 13.8% recorded in 2000 but below the post-crisis peak of 21% in 2008. This ratio reflects the continued existence of surplus capacity in most sectors of the economy. Private sector investment constitutes around 62% of total investment spending in real terms. Growth in fixed investment decelerated in the first half of 2013, rising by an average of 2.5% from 5.2% in the first half of 2012.
Private investment growth measured 2.9% in the first half of 2013, 3.9% in 2012 and 5.3% in 2011, indicating a rebound during the last three years from a decline of 0.8% in 2010 and an even larger decline of 8.6% in 2009. The somewhat weaker pace of growth since 2012 reflects South African corporations refraining from significant new project developments in an environment of weaker business confidence, domestic supply constraints and low levels of demand. The increase in capital spending in 2011 extended to most sectors of the economy, but was most prominent in the agricultural, mining and manufacturing sectors.
Gross fixed capital formation constituted 20.7% of total GDP in real terms in the six months ended June 2013, well above the level of 13.8% recorded in 2000, when inflation targeting began. Private sector investment constitutes around 63% of total investment spending in real terms. In the first half of 2013, real gross fixed capital formation slowed to 4.1% when compared with 6.0% in the corresponding period of 2012.
After growing by 8.5% in the first half of 2012, investment by the public sector eased to 5.7% in the first six months of 2013. This was mainly due to slower investment by public corporations with industrial action at the Medupi power plant in the first quarter, slowing ESKOM’s activity in the electricity, sector while Transnet and SANRAL lowered their capital spending in the second quarter of the year. In turn, investment in the electricity and transport sectors fell to 6.6% and 7.0% in the first half of 2013 after growth of 11.6% and 18.0% respectively in the same period of 2012. Investment by the general government slowed to 5.6% in the first six months of the year from 9.0% in the corresponding period of 2012.
Private investment declined to 3.2% in the first half of 2013 from 3.9% in 2012. This was due to a broad-based decline in outlays of all sectors except for agriculture, manufacturing and finance. The mining sector remained negatively affected by volatility in the exchange rate, weak global demand as well as industrial action domestically. Activity in the construction sector also slowed
38
with contractions in spending on residential and non-residential buildings. In contrast, manufacturers in the fuel, motor vehicle, paper and food sub-sectors increased their spending on machinery and capital equipment while business services increased outlays on information technology and computer software.
Real inventory holdings remain relatively low at 12.7% of GDP when compared with an average rate of 15.9% between 2000 and 2008. Real inventory investment decelerated from R9.7 billion in the first half of 2012 to R6.7 billion in the first half of 2013. This was mainly on account of developments in the mining sector while manufacturing inventories increased in response to heightened production levels of various manufactured products. Possible reasons for the declining trend in the overall inventory ratio include the deterioration in economic growth and an increasingly competitive business environment, which has necessitated the implementation of steps to curtail the cost of holding inventories. Advanced technology also made provision for more effective inventory management techniques.
Over the past decade, real consumption expenditure by general government increased at an average annualized rate of 4.7% (from the second quarter of 2003 through the second quarter of 2013), resulting in an increase in general government spending as a proportion of GDP from an average of 18.1% in 2000 to 22.7% in the first half of 2013. Most of the National Government’s spending is focused around the provision of social services such as education and health. Compensation of employees constitutes 35.6% of total government spending in nominal terms and debt service payments constitute around 8.3% of total spending. Growth in the National Government’s outlays on the compensation of employees increased from 9.1% in 2012 to 9.7% in the first half of 2013. The 2013 Medium Term Budget Policy Statement has highlighted the importance of maintaining the current state of fiscal framework without expanding overall spending in the face of poor economic environment.
The rate of increase in the gross operating surplus has slowed from 7.2% in 2011 to 5.8% in 2012. Quarterly data from the Reserve Bank also shows that growth in the gross operating surplus slowed from 6.2% in the first quarter of 2013 to 3.8% in the second quarter. This moderation is mainly attributable to the mining sector, where business conditions remained challenging due to ongoing labour disputes, falling commodity prices and rising production costs.
Measured over one year, growth in total nominal factor income slowed to at 8.3% in 2012 from 8.8% in 2011, following growth of 13.5% in 2008 and 7.4% in 2009. During the second quarter of 2013, factor income growth decelerated somewhat as the annual rate of increase in operating surplus slowed to 3.8% in the first second quarter of 2013 from 6.2% in the first quarter. The slower pace of compensation growth occurred as wage settlements rates moderated. The ratio of compensation of employees to total factor income was 51.7% in 2012 from 51.5% in 2011 as whole.
Principal Sectors of the Economy
The following two tables set forth real gross value added and the percentage increase in gross value added for the periods indicated.
Real Gross Value Added by Sector
(at constant 2005 prices)
| | | | | | | | | | | | | | | | | | | | | | | | | | | | |
| | | As of and for the year ended December 31 | | | As of and for the six months
ended June 30 | |
| | | 2008 | | | 2009 | | | 2010 | | | 2011 | | | 2012 | | | 2013(1) | | | Contribution
in 2013 (%) | |
Agriculture, forestry and fishing | | | 42,143 | | | | 41,454 | | | | 41,629 | | | | 41,580 | | | | 42,539 | | | | 43,178 | | | | 2.4 | |
Mining and quarrying | | | 99,396 | | | | 94,057 | | | | 99,383 | | | | 99,672 | | | | 95,637 | | | | 96,405 | | | | 5.5 | |
Manufacturing | | | 297,889 | | | | 267,723 | | | | 282,509 | | | | 292,733 | | | | 299,705 | | | | 300,677 | | | | 17.0 | |
Electricity, gas and water | | | 34,196 | | | | 33,712 | | | | 34,421 | | | | 34,798 | | | | 34,382 | | | | 34,172 | | | | 1.9 | |
Construction | | | 53,145 | | | | 57,279 | | | | 57,707 | | | | 57,985 | | | | 59,422 | | | | 60,031 | | | | 3.4 | |
Wholesale and retail trade, catering and accommodation | | | 219,749 | | | | 217,074 | | | | 225,338 | | | | 235,404 | | | | 243,824 | | | | 247,552 | | | | 14.0 | |
Transport, storage and communication | | | 162,522 | | | | 163,999 | | | | 167,313 | | | | 172,549 | | | | 176,508 | | | | 178,951 | | | | 10.1 | |
Finance, insurance, real estate & business services | | | 375,240 | | | | 378,987 | | | | 387,152 | | | | 402,500 | | | | 415,789 | | | | 424,700 | | | | 24.1 | |
General gov. services | | | 233,416 | | | | 242,539 | | | | 249,531 | | | | 259,346 | | | | 267,324 | | | | 271,324 | | | | 15.4 | |
Personal services | | | 102,106 | | | | 101,233 | | | | 101,679 | | | | 104,260 | | | | 106,419 | | | | 107,943 | | | | 6.1 | |
| | | | | | | | | | | | | | | | | | | | | | | | | | | | |
Gross value added at basic prices | | | 1,619,802 | | | | 1,598,057 | | | | 1,646,664 | | | | 1,700,826 | | | | 1,741,549 | | | | 1,764,932 | | | | 100.0 | |
| | | | | | | | | | | | | | | | | | | | | | | | | | | | |
39
Note:—
Source: Stats SA.
Percentage Growth in Real Gross Value Added by Sector
(at constant 2005 prices)
| | | | | | | | | | | | | | | | | | | | | | | | |
| | | As of and for the year ended December 31 | | | As of and for the
six months ended
June 30 | |
| | | 2008 | | | 2009 | | | 2010 | | | 2011 | | | 2012 | | | 2013(1) | |
Agriculture, forestry and fishing | | | 16.1 | | | | -1.6 | | | | 0.4 | | | | -0.1 | | | | 2.3 | | | | -1.1 | |
Mining and quarrying | | | -5.6 | | | | -5.4 | | | | 5.7 | | | | 0.3 | | | | -4.0 | | | | 3.0 | |
Manufacturing | | | 2.6 | | | | -10.1 | | | | 5.5 | | | | 3.6 | | | | 2.4 | | | | -0.2 | |
Electricity, gas and water | | | -3.1 | | | | -1.4 | | | | 2.1 | | | | 1.1 | | | | -1.2 | | | | -0.8 | |
Construction | | | 8.5 | | | | 7.8 | | | | 0.7 | | | | 0.5 | | | | 2.5 | | | | 0.8 | |
Wholesale and retail trade, catering and accommodation | | | 1.0 | | | | -1.2 | | | | 3.8 | | | | 4.5 | | | | 3.6 | | | | 2.1 | |
Transport, storage and communication | | | 4.0 | | | | 0.9 | | | | 2.0 | | | | 3.1 | | | | 2.3 | | | | 2.0 | |
Finance, insurance, real estate & business services | | | 7.4 | | | | 1.0 | | | | 2.2 | | | | 4.0 | | | | 3.3 | | | | 3.2 | |
General gov. services | | | 4.5 | | | | 3.9 | | | | 2.9 | | | | 3.9 | | | | 3.1 | | | | 1.7 | |
Personal services | | | 3.9 | | | | -0.9 | | | | 0.4 | | | | 2.5 | | | | 2.1 | | | | 1.8 | |
| | | | | | | | | | | | | | | | | | | | | | | | |
Gross value added at basic prices | | | 3.8 | | | | -1.3 | | | | 3.0 | | | | 3.3 | | | | 2.4 | | | | 1.7 | |
| | | | | | | | | | | | | | | | | | | | | | | | |
Note:—
| (1) | The seasonally adjusted first half of 2013 compared to the second half of 2012. |
Source: Stats SA.
Finance, Insurance, Real Estate and Business Services
The finance, insurance, real estate and business services sector includes all monetary, financial and insurance institutions and retirement funds, as well as real estate, law, accounting, auditing, data processing and other business services, such as labour brokers. Also included in this sector are renting and leasing of agricultural, mining, manufacturing, construction, office and other machinery and equipment.
This sector is the largest in the South African economy according to GVA, constituting 23.9% of total economy.
Growth in real value added by the finance, insurance, real estate and business services sector slowed to 3.3% in 2012 following a 4% increase in 2011. The sector’s contribution to growth in overall gross domestic production accordingly rose from 0.2 of a percentage point in 2009 to 0.7 of a percentage point in 2012, stemming mainly from increased activity in the equity and bond markets as well as in the banking industry. The banking industry in particular benefited from the introduction of more innovative products and services offered to clients. Affordable new-generation products for low-income customers and those with more sophisticated financial needs were launched by a number of banks. In the first half of 2013, the sector recorded average annual growth of 3% compared to the second half of 2012 (seasonally adjusted and annualized). The sector contributed 0.7 percentage points to the 1.7% growth in the first half of 2013.
40
According to the 2013 Quarterly Employment Statistics (QES) surveys published by Stats SA, which surveys enterprises registered for income tax, the finance, insurance, real estate and business services sector employed 1,818,000 persons in the second quarter of 2013 – roughly 13% of total employment.
South Africa has a well-developed financial services sector – one of the largest among emerging market economies – with sophisticated banking, bond and insurance markets which have been key strengths in the country’s economic development. The World Economic Forum Global Competitiveness Report 2013 ranks South Africa third overall out of 148 countries for financial market development. This high overall ranking is underpinned by South Africa ranking second in respect of soundness of banks, first for regulation of securities exchanges (for the third year in a row), and second for the availability of financial services.
The financial services sector is characterized by a highly concentrated structure, with five banks, ABSA Bank Limited, The Standard Bank of South Africa Limited, FirstRand Bank Limited, Nedbank Limited and Capitec, and three insurance companies, Sanlam Limited, Old Mutual South Africa Limited and Liberty Life Limited, dominating the financial services and insurance industry. See “Monetary and Financial System — Structure of the Banking Industry.”
South African banks are well regulated, have sophisticated liquidity management systems, and limited reliance on funding in foreign currency. South African regulators have tended to maintain more conservative capital adequacy ratios in excess of global standards such as Basel 2.5, and banks have chosen to maintain reserve ratios in excess of these higher required minimums. “Tier one” capital adequacy of South African banks stood at 12% as at June 30, 2013 (well in excess of Basel III’s 7% requirement) and total capital adequacy stood at 14.9%.
South Africa’s domestic financial sector weathered the global financial crisis relatively well thanks to this caution which also limited banks’ exposures to subprime assets; low reliance on overseas bank financing also helped insulate the domestic financial sector. Nonetheless, the banking sector, similar to other sectors, experienced a difficult operating environment in the latter part of 2008 and for most of 2009. The sector has now largely recovered. The average annual increase in gross loans and advances for the first eight months of 2013 stood at 8.9% when compared with a 8.3% average increase in 2012. A strong increase in corporate loans and advances as well as unsecured lending to households underpinned growth in credit extension.
Non-performing loans have been declining, averaging 4.0% of gross loans and advances in the first seven months of 2013, compared to 4.4% in 2012 and 5.4% in 2011. Credit losses (the actual loss experienced by a bank) averaged 0.11% of gross loans and advances in the first seven months of 2013, unchanged from 0.11% in 2012 and a recent peak of 0.14% in September 2009.
After struggling from the effects of the global financial crisis, conditions in the long-term insurance sector remain sound. Growth in the number of policies rose by 16% year-on-year in the first half of 2013, from 13% in the first half of 2012. Net premium growth rose by 26% year-on-year in the first half of 2013 from a 20% year-on-year growth in the first half of 2012. All long-term insurers meet the minimum regulatory requirements.
In the short term insurance sector, net premiums increased by 7.0% in the first half of 2013, from a 0.3% increase in the same period of 2012. Underwriting profits, as a percentage of net written premiums rose to 11.0% in the first half of 2013 from 8.0% in 2011 and 10.0% in 2012, while claims as a percentage of net written premiums rose marginally from 57.5% in 2012, to 57.6% in the second half of 2013.
The Financial Sector Charter, in which the financial sector committed itself to addressing historical imbalances, was released in October 2003. For further information regarding this sector and the Financial Sector Charter, see “Republic of South Africa — Broad Based Black Economic Empowerment” and “Monetary and Financial System — Financial Sector Charter.”
To further strengthen regulation to support financial stability, the National Government is currently focused on four main areas of reform in the banking sector: strengthening financial stability, broadening financial services for the poor; increasing competitiveness and efficiency; and promoting investor and consumer protection.
Progress has been made in preparations for the implementation of a “twin-peak” approach to regulation with the central bank being responsible for prudential regulation and the financial services regulator for market conduct regulation. Prudential regulation of the insurance sector will be strengthened through the introduction of “Solvency Assessment and Management”, an approach similar to Solvency II in Europe. In addition, a framework to facilitate moving OTC derivative trading to an exchange and the approach to oversight of shadow banking, hedge fund and private equity industries will be reviewed.
The amended Regulations relating to banks to give effect to Basel 2.5 became effective in South Africa in 2011. The new requirements and standards were aimed addressing the fundamental weaknesses that have been identified following the global financial crisis. The implementation of the Basel III framework in South Africa is based on a phased-in approach which
41
commenced on January 1, 2013 and will continue up to 2018, in line with the timelines determined by the Basel Committee. The Basel III Liquidity Coverage Ratio will be implemented from January 1, 2015, while the Net Stable Funding Ratio will be effective from January 1, 2018.
The new regulatory requirements include the QIS and assessments of the availability of high-quality liquid assets and banks’ ability to adhere to the required standards. The SARB is also following the work being done by the Financial Services Board in Basel to develop a formalised framework of identifying systemically significant institutions so that it may implement standards for identifying systemic risk as they are developed by the FSB. Crisis management arrangements are being strengthened between the National Treasury and the SARB. A review of the contingency framework has been conducted as part of a World Bank/First Initiative project.
Manufacturing
Manufacturing is South Africa’s second largest sector, constituting approximately 15% of GDP in 2012. Much of the production in manufacturing is concentrated in upstream sectors such as metal products, wood processing, and petrochemicals which account for approximately 55% of production. However, the manufacturing sector does exhibit good diversification as the remainder of production is focused on consumer-orientated sub sectors such as food and beverages, motor vehicles, and furniture. The sector is a large job creator, providing employment for approximately 1.1 million people or 14% of total employment according to the QES.
Growth in the real value added by the manufacturing sector continues to struggle since the recession in 2008/2009 and grew only 2.4% in 2012, in line with overall GDP growth. The sector therefore maintained its current share of GDP composition (compared to other sectors), but was not a major driver of GDP growth. Manufacturers faced a difficult environment during 2012, as the petrochemical sub sector accounted for more than half of growth in 2012, while the rest of the sub-sectors struggled with low growth by comparison. Production continued to be hampered in 2012 by unplanned production stoppages in a number of sectors, a fairly depressed global demand for South African manufactured products and rising production costs.
In the first seven months of 2013, manufacturing production rose by 2.1%, a decrease from 2.4% annual growth in 2012. Production has been volatile in 2013, following production stoppages in the metals sector during the first quarter (due to a fire at a major producer) and maintenance at oil refineries. The sector recovered strongly during the second quarter, as production came back online and companies tried to regain lost output. The main driver of growth during 2013 has been the food and beverage sector, which grew by 3.4% in the first seven months of the year.
The relatively weaker currency, greater export potential into other Southern African Development Community (SADC) countries, and government support through incentives and local procurement targets should help lift production over time.
Composition of Manufacturing Sector Growth
| | | | | | | | | | | | | | | | | | | | |
| | | | | | Average growth (%) | | | Contribution to growth (%) | |
| | | Weights(1) | | | 2012 | | | 2013(2) | | | 2012 | | | 2013(2) | |
Petrochemicals | | | 25.1 | % | | | 5.4 | | | | 2.1 | | | | 1.3 | | | | 0.5 | |
Food & beverage | | | 22.1 | % | | | 2.0 | | | | 3.4 | | | | 0.4 | | | | 0.7 | |
Metals products | | | 20.3 | % | | | -0.4 | | | | 2.1 | | | | 0.1 | | | | 0.4 | |
Wood & paper | | | 10.2 | % | | | 2.3 | | | | -0.3 | | | | 0.2 | | | | 0.0 | |
Motor vehicles & parts | | | 7.9 | % | | | 2.4 | | | | 6.1 | | | | 0.2 | | | | 0.5 | |
Glass & non-metallic | | | 4.9 | % | | | 0.1 | | | | 0.8 | | | | 0.0 | | | | 0.0 | |
Clothing & textiles | | | 3.5 | % | | | -0.2 | | | | 2.7 | | | | 0.0 | | | | 0.1 | |
Furniture | | | 3.2 | % | | | 0.2 | | | | -8.0 | | | | 0.0 | | | | -0.3 | |
Electrical machinery | | | 2.4 | % | | | -1.6 | | | | 0.5 | | | | 0.0 | | | | 0.0 | |
Radio & TV | | | 1.1 | % | | | 4.9 | | | | 2.7 | | | | 0.1 | | | | 0.0 | |
| | | | | | | | | | | | | | | | | | | | |
Total | | | 100.0 | | | | 2.4 | | | | 2.1 | | | | 2.4 | | | | 2.1 | |
| | | | | | | | | | | | | | | | | | | | |
42
Notes: —
| (1) | Weighting is based on the large sample manufacturing survey of 2010. |
| (2) | Through July 31, 2012. |
Source: Stats SA
Manufacturing exports have grown by 14.0% in the first seven months of 2013 as compared to the same period in 2012. Exports to Europe – which formed approximately 20.3% of total manufacturing exports in 2012 – have increased by 5% during the first seven months of 2013, as European economies have begun to show some signs of recovery following the recession. The SADC region – which forms 16.6% of manufacturing exports – continues to show strong demand for South African goods. Exports to SADC have grown by 23.0% during the first seven months of 2013 as compared to the corresponding period during 2012.
Capacity utilisation of large manufacturers appears to have settled at a post crises level of approximately 80 to 82%, where it has been since mid-2010. This is still below the mid-80% utilisation rates experienced between 2005 and 2008. According to the most recent survey, capacity utilisation in May 2013 was 81.4%, mainly due to insufficient demand (accounting for 11.0% of unused capacity) and a shortage of raw materials (accounting for 1.9% of unused capacity).
Manufacturing remains an important part of the South African economy. The importance of this sector is also reflected in the level of support it receives from government. The government’s support for the manufacturing sector is guided by the National Industrial Policy Framework and the Industrial Policy Action Plan (an annually published action plan focusing on a three-year rolling period). The most recent IPAP (IPAP 2013/14 – 2015/16) has added a focus on supporting advanced manufacturing (e.g. advanced materials and aerospace) along with the existing focus on midstream and downstream processing activities, sector specific support, exports promotion, the green economy, and local procurement – particularly for black economic empowerment. Producers are able to obtain grants for marketing of exports, tax relief for capital expenditure and R&D, funding for small business development, business incubation, assistance for critical infrastructure, funding for job creation, and funding through sector-specific support programmes (for example automobiles and clothing and textiles). Local manufacturers are also supported through preferential procurement policies, and the designation of several sectors for local procurement.
Petroleum Products, Chemicals, Rubber and Plastic
The petrochemicals sub sector is the biggest in manufacturing, forming approximately 25.1% of output according to the most recent StatsSA large sample survey (based on 2010 data). This is a large gain from the previous survey, completed in 2005, which estimated that petrochemicals formed 22.1% of output.
Production in this sub sector expanded by 2.1% in the seven months ending July 2013, and was lower than the 5.4% achieved in 2012 – where it was the main driver of growth in the manufacturing sector. Refinery maintenance at both the Engen refinery in Durban and Chevron’s Cape Town refinery in February led to a large decline in output in February. Although this maintenance was planned, the aging refinery infrastructure means that unplanned outages may increase in the future.
This is one of the few sub sectors where output is higher than pre-crises levels, supported by large investments into the sector (including chemicals and pharmaceuticals). During 2012, the largest export market for this sub sector was the SADC, which made up 30.9% of petrochemicals exports, followed by the EU, which accounted for 15.3% of total petrochemicals exports.
Food, Beverages and Tobacco
The food sub sector includes processed foods, dairy products, oils, sugar and animal feeds. The beverages sector includes distilleries, wineries and the carbonated drinks industry. This sub sector accounted for approximately 22.1%.
The food and beverages sub sector has been the best performing manufacturing sub sector in 2013, growing by 3.4% in the first seventh months of 2013 and contributing 0.7 percentage points to overall manufacturing growth. Growth has been supported by strong export gains, which have grown by 20% year to date. SADC forms South Africa’s major export market for the food subsector, accounting for 36.7% of exports during 2012. The EU represented 26.5% of food sub sector exports during 2012, with the U.S. accounting for 3.8%.
43
Basic Iron and Steel, Non-ferrous Metal Products, Metal Products and Machinery
The metal products sub sector comprises the working of metal, including structural metal products, engines and turbines, agricultural machinery, and electrical industrial machinery. This sector forms approximately 20% of total manufacturing output and is a large generator of exports, accounting for 12.0% of total exports in the first seven months of 2013.
Production of metal products in 2013 has been difficult. A fire at Arcelor Mittal’s Vanderbijlpark steel mill in February caused major disruptions in the supply chain. The steel mill, which produces a major portion of steel in South Africa, only came online in April. Since then output has increased sharply and overall the sector has grown by 2.1% in the first seven months of the year. Despite this growth the sector remains 14.0% below pre-crisis levels in 2007. The sub sector is struggling against high input costs (for example electricity and wages), lower international output prices, and low domestic and international demand.
Despite the economic slowdown, the European Union remains the sub sector’s largest export market, accounting for 17% of metal exports in 2012. Asia and Africa also form major trading partners, as the SADC accounted for 21% of exports, and Japan and China 10% and 4% respectively.
Wood and Paper; Publishing and Printing
This sub sector has struggled in 2013 and output has declined by 0.3% during the first seven months of the year. Growth in this sector has also been constrained in past years, growing by 1.2% in 2011 and 2.3% in 2012. The sector remains 14.0% below pre-crisis levels in 2007.
Export growth has also been relatively subdued, with exports in the sub sector growing by 5.0% during the first seven months of the year. During 2012, the largest share of wood and paper product exports were delivered to the SADC region, which received 22.4% of total wood and paper exports, while Asia, in particular China (10.6%) and Japan (10.3%), also represented key markets for wood and paper exports.
Motor Vehicles, Parts and Accessories and Other Transport Equipment
The sector includes the manufacture of motor vehicles, ships and boats, railway locomotives and rolling stock, and transport equipment parts and accessories.
This sub sector has grown strongly in the first seven months of 2013, growing by 6.1% despite being negatively affected by the metals disruptions earlier in the year. Output in the second half of the year is expected to be significantly lower due to production. In August, production stoppages connected to strike activity impacting both automotive and components manufacturers resulted in a 28.9% drop in production from July and preliminary estimates are that September data will also show weakness in the sub sector. There is expected to be some recovery during the fourth quarter of 2013 as manufacturers attempt to recover output losses from the third quarter.
During 2012, Europe and the U.S. were the major export markets for this sub sector, representing 28.8% and 27.6% of exports, respectively. Exports to the SADC formed 10.8% of export markets in 2012, up from 8% in 2011.
The motor industry is the recipient of the bulk of support available within the manufacturing industry, benefiting from an estimated R22 billion in tax and custom incentives during the 2010/2011 fiscal year. The Automotive Production Development Programme (ADPD) replaced the Motor Industry Development Programme in 2013 and will extend to 2020. Both these programmes are comprehensive, covering investment grants, tariff protection and import rebates. Part of the ADPD, the Automotive Investment Scheme (AIS), has already resulted in increased investment in the sub sector. Between July 2009 and the end of 2012, the AIS is estimated to have resulted in planned investments of R13.6 billion – mainly from automotive assemblers, but also by component companies.
Textiles, Clothing and Leather Goods
This sector comprises the manufacturing of clothing by cutting and sewing fabrics, leather, fur, plastic, rubber and other materials, and textiles production using wool, cotton and synthetic fibers.
44
Production of textiles and clothing has grown by 2.7% in the first seven months of 2013, recovering from contraction in 2012 and 2011 (-0.2% and -3.7% respectively). The rand depreciation over the past year has helped the sector considerably, with exports increasing by 21% in 2013. Substantial government support through the Clothing and Textile Competitiveness Program, launched in March 2010, has also had a positive impact. The support programme provides grant funding for investment in new machinery and equipment, interest subsidies for working capital, and support for clustering. The programme has a budget of R750 million for fiscal year 2013 and replaced the Duty Credit Certificates scheme which was available to the sub sector.
SADC is the biggest export destination for textiles, clothing and leather goods, accounting for 31.4% of exports in this sub sector in 2012, and is also a fast growing market (the SADC share having increased from 24.0% in 2010). Despite the increasing importance of the SADC as a market for textile exports, the EU remains crucial to the sector, accounting for 30.6% of exports.
Furniture
The furniture sector continues to struggle during 2012, following a flat performance during 2012. Output has declined by 8.0% so far in 2013, following growth in 2012 of 0.2% and 2.1% in 2011. The sub sector is struggling with low domestic demand due to over-indebted households attempting to correct their balance sheets. International demand, particularly from the EU also remains low. The EU is by far the largest importer of these products, accounting for in 67.0% of exports in 2012. There is some potential upside for furniture production given the weaker rand and a slow recovery in Europe. SADC countries make up the most of the other exports, accounting for 22.0%.
Electrical Machinery and Apparatus
The manufacturing of electric motors and generators, electricity distribution and control systems, insulated wire and cable, and lights and lighting equipment are included in this sector.
This sector grew by 0.5% in the first seven months of 2013, following a decline in output (-1.6%) in 2012.
SADC is the main export destination of electrical machinery products, accounting for 50.9% of exports in 2012. Europe (11.6%) and the U.S. (6.1%) are also important destinations.
Wholesale and Retail Trade, Catering and Accommodation
This sector comprises of wholesale and retail trade and allied services, catering and accommodation services and motor trade and repair services. Activities include the resale of new and used goods and the rendering of repair services. The overall sector contributed 0.4 percentage point to the economic growth rate in the second quarter of 2013. Real output growth of the sector continued to grow at a pace of 3.0% in the first half of 2013 compared with the same period a year ago from 5.8% in 2012 and 5.2% in 2011. In the second quarter of 2013 the sector contributed 15.8% to GDP from 14.5% in the second quarter of 2012. Generally, South African household spend close to 27% to 30% of their income on the retail sector. Growth in the industry is largely influenced by economic conditions that consumers face. Amongst others includes, household indebtedness, employment, consumer confidence, interest rate, inflation and economic growth. Throughout 2011 to 2013, global uncertainty has dampened domestic sentiment, which resulted in a muted growth rate of the wholesale and retail industry.
According to the QES, wholesale and retail trade, catering and accommodation employed 1,689,000 people in the second quarter of 2013, increasing by 0.1% when compared with the second quarter of 2012. Gross earnings paid to employees in the industry had an annual increase of R4,773 million (10.5%) for the quarter ended June 30, 2013 as compared to same period during 2012.
Wholesale and retail trade industry
Growth in the wholesale and retail industry has been supported by an increase in both the supply of retail space and the number of shopping centres in the country.
Retail trade sales remained fairly subdued during the first half of 2013, attributed primarily to low consumer confidence, together with reduced disposable income (due to petrol and electricity price hikes and muted job creation) and limits on access to credit (due to stricter lending criteria by financial institutions). Growth in the total retail sales volume declined to 3.1% year-on-year in the first half 2013 from 3.8% year-on-year in the first half of 2012. Sales of semi-durable goods grew by 7.3% in the first half of 2013 and contributed the most to the overall growth in the sector. Non-durable and durable goods increased by 1.5% and 0.8% respectively over the same period. Similarly, wholesale trade sales increased by 6.0% in the first half of 2013 compared with the first half of 2012 in real terms. The grocery retailers continued to drive growth in the sector during 2012.
45
In 2011, retail sales growth was underpinned by the increase in the unit price across all the retail sub-sector. Also, the combination of the double digit wage growth in the public sector, increase of the unsecured loan of 21%, relative low inflation (averaged 5.0%) and some improvement in employment contributed to the growth rate of 5.8% in the sector. Buoyant growth in unsecured credit in 2012 as well as moderate inflation in the second half of 2012 boosted household purchases.
The major wholesale industry players are Edcon Pty (Ltd), Pick n Pay Holdings Ltd, Shoprite Holdings Ltd, Spar Group Ltd, Woolworths Holdings Ltd and Massmart Holdings Ltd. According to the Global Power Retailing, the top five retailers in South Africa were ranked in the top 250 retailers worldwide. Shoprite was ranked 92nd; Massmart was 126th, Pick n Pay 133rd, Spar 179th and Woolworths 222nd.
Shoprite group is one of Africa’s largest food retailers that dominated the wholesale retail sector. Shoprite Holdings contributed significantly to the overall wholesale and retail trade sales, reaching a value share of 11% in 2012. This was due to the company’s lower unit price strategy that helped in its success within the market. The company operates 1,303 corporate and 427 franchise outlets in 16 countries across Africa. The Massmart group consists of nine wholesale and retail chains with 265 stores in South Africa and 13 in other countries. Pick n Pay is one of the largest Mass Grocery Retail (MGR) companies in Africa. It operates in seven African countries. The Spar Group is the third largest MGR. It operates six distribution centres, supplies goods and services to approximately 800 stores in South Africa. Woolworths is the fourth largest MGR and it operates in 18 countries. Lastly, Edcon Pty (LTD) is the largest clothing, footwear and textiles retailing group in South Africa. The company has approximately 1,228 stores operating in South Africa, Botswana, Namibia, Swaziland and Lesotho.
Catering and Accommodation Services
Despite tough global economic conditions, the tourism industry grew in 2012, with 9.2 million international tourists. In the 2012 World Travel Awards for Africa, South Africa’s tourism industry won 32 awards out of a total 57 categories, including leading African airport, beach destination, family resort, city hotel, conference venue, safari lodge and spa resort. The catering and accommodation industry is widely regarded as carrying potential for rapid growth. Its solid performance in recent years has been driven by strong consumer demand which has been reinforced by a growing middle class population and tourism has emerged as a competitive strength for South Africa.
According to the World Travel and Tourism Council, tourism’s total contribution (direct and indirect) is approximately 7% of GDP. Direct contribution of the tourism industry to the country’s GDP increased by 5% to R84.3 billion in 2011. Its revenue increased from R766.8 million in 2011/12 to R866.9 million in 2012/13. In 2011, direct employment in the sector as a percentage of overall employment in the country increased by 4.5%. In 2012, 9% of sustainable employment was created and the sector’s growth rate of 5.4% was more than that of global tourist growth of about 4% as estimated by the United Nations World Tourism Organisation. The main contribution to the tourist sector growth rate was from SADC tourists (70.2%) and African tourists (2.3%). Residents from countries other than Africa contributed 27.3%.
Transport, Storage and Communications
Gross value added in the transport, storage and communications sectors increased by 2.0% in the first half of 2013 as compared to the first half of 2012, by 2.3% in 2012 and by 3.1% in 2011. Employment in the transport, storage and communication sector increased by approximately 3000 people, from approximately 374,000 in June 2012 to approximately 377, 000 in June 2013, according to the QES.
Transport and Storage
South Africa’s modern and extensive transport and logistics system plays an important role in the national economy and in the economy of southern Africa, both through transporting freight for use within the domestic or regional economy and for export, as well as through enabling the movement of people within and between cities and rural areas. The transport system comprises airports, sea ports, roads, rail and public transport networks. Transnet, the horizontally integrated state-owned company plays a central role in freight transportation through its rail, port and pipeline operations. Intercity passenger land transportation is provided by PRASA, which incorporates Metrorail, Shosholoza Meyl and Autopax. SANRAL is responsible for the upgrading and expansion of the national road system whilst provincial and municipal governments are responsible for secondary roads.
Transportation in South Africa is coordinated by the Department of Transport, which determines policy and sets guidelines for the industry. The Department of Transport is also responsible for overseeing regulation of the sector through a number of regulatory bodies including the Ports Regulator, the Regulatory Committee (for Aviation), Railway Safety Regulator (RSR), and the South African Civil Aviation Authority (SACAA).
46
Transnet is a public company, wholly owned by the South African Government and is the custodian of rail, ports and pipelines. Transnet is responsible for enabling competiveness, growth and development of the South African economy through delivering reliable freight transport and handling services that satisfy customer. Transnet has five operating divisions: Transnet Freight Rail (transporting bulk and containerised freight), Transnet Engineering (refurbishment, conversion, upgrades and manufacturing of rail related rolling stock), Transnet National Ports Authority (port infrastructure and marine services), Transnet Port Terminals (cargo terminal operations) and Transnet Pipelines (petroleum and gas pipeline business). The company is overseen by the Department of Public Enterprises.
Transnet Freight Rail (TFR) transports bulk and containerised freight along approximately 20,500 route kilometre rail network. Its strategic advantage lies in the movement of heavy haul and bulk commodities over long distances, where flow densities provide economies of scale thereby lowering the cost of doing business. The division also provides the network for long distance passenger rail agency as well as haulage capacity for other private passenger services. TFR does not operate passenger service except for the Blue Train luxury passenger services which is operated as a strategic positioning tool for the tourism industry in Southern Africa.
Transnet Engineering (TE) provides maintenance, repair, upgrade, manufacturing and support services to TFR in South Africa and to other rail and terminal operators both regionally and internationally. It consists of nine businesses, namely wagon, locomotive, coach, rolling stock equipment, rotating machines, wheels, auxiliary foundry and port equipment maintenance. The wagon, locomotive and coach businesses are the primary customer-facing entities and revenue generators, while the other seven operational businesses provide a supportive role within the organisation with the exception of the auxiliary business which has a substantial portion of its activity focused directly on serving TFR. The port equipment maintenance business is a newly established business unit. There was an improvement in operational efficiency for the total fleet in both locomotive and wagon availability and reliability.
Transnet National Ports Authority (NPA) operates as a landlord port authority, which manages, controls and administers the South African port system on behalf of the state. The NPA owns and operates eight commercial ports in South Africa situated in Durban, Richards Bay, Cape Town, Port Elizabeth, Ngqura, Mossel Bay, Saldanha and East London. The business is divided into two key operational areas: port infrastructure and maritime operations. Port infrastructure is responsible for the planning, development and maintenance of port infrastructure. The maritime business manages marine operations, lighthouse services and dredging services. On a wider economic front NPA seeks to continually enhance its role in pursuing large scale market collaboration in partnership with customers and stakeholders including the Ports Regulator for the benefit of the national economy.
Transnet Pipelines owns and operates South Africa’s 3,800 kilometres of strategic petroleum and gas pipeline infrastructure, traversing five provinces with the strategic objective of ensuring security of supply of petroleum products to the inland market. The pipeline system is the preferred mode of transportation of petroleum products as it is the most efficient for carrying large volumes, and is environmentally friendly and reliable. The business is regulated by the National Energy Regulator of South Africa (Nersa) and is governed by the Petroleum Pipelines Act, No 60 of 2003 (Petroleum Pipelines Act), and the Gas Act, No 48 of 2001 (Gas Act).
Transnet is undertaking an investment programme including the expansion of port infrastructure, the extension of new rail links, the upgrading of locomotives and rolling stock and the completion of the first phase of the new multi-product pipeline connecting Durban to Gauteng with construction on phase two expected to commence in 2017. Transnet plans to invest R307.5 billion over the next seven years as part of its capital investment plan. This capital expenditure will require Transnet to raise additional funding in the capital markets.
SANRAL, a state-owned company reporting to the Department of Transport, is responsible for planning, designing and constructing national roads. It is also charged with raising the financing required to develop and manage the road network and non-current assets estimated to be worth R270.9 billion in the 2012/13 financial year. The national road system connects all the major centres in the country to each other and to neighbouring countries. The South African road network comprises approximately 754,600 kilometres of roads. There is a national road network of 19,704 kilometres, with plans to extend this to 35,000 kilometres. South Africa has the longest road network of any country in Africa.
47
SANRAL’s capital investments amounted to R1.8 billion in relation to toll roads and R5.9 billion in relation to non-toll roads during the 2012/13 financial year. The South African government has allocated R32.9 billion to SANRAL over the MTEF period for national road improvements and R2 billion for rehabilitation of coal haulage roads in Mpumalanga. The user charges collected through toll fees will remain an important additional source of funding for national roads. The proposed electronic tolling system, popularly known as “e-tolling”, has sparked political controversy. Drive-slow protest have been organised by Cosatu and political groups, including the DA, have challenged the constitutionality of the bill empowering the Cross-Border Road Transport Agency to collect tolls on behalf of SANRAL, signed into law by the President in September 2013. The final outcome of such challenges to the e-tolling system is not yet known.
The road transport industry dominates the freight transport market, mainly due to its flexibility. Approximately 80% of all freight transport, 75% of all commuter transport and 95% of all other passenger travel in South Africa takes place by road. The pipeline network is responsible for the transport of more than 85% of refined fuel and gas products. The income from freight transportation for the three months ended August 2013 increased by 9.5% compared with the three months ended August 2012. The increase was largely attributable to primary mining and quarrying products according to Statistic SA’s Land Transport Survey of August 2013.
The National Government’s Taxi Recapitalization Programme is part of the National Government’s broad integrated public transport network system. It is aimed at replacing South Africa’s minibus taxi fleet with new vehicles adhering to stricter safety standards. The programme allowed for a scrapping allowance to be paid to assist taxi operators in buying replacement vehicles. A total of 135,894 taxis had been scrapped by end March 2013 and 81,735 still needed to be scrapped under the program
Bus Rapid Transport (BRT) systems provide an exciting and innovative mechanism for implementing high-quality public transportation networks that operate on exclusive lanes and incorporate current bus and minibus operators. The first phases of the BRT in Johannesburg (Rea Vaya), Soweto to CBD, and Cape Town (MyCITI), from the CBD along the West Coast and to the airport, have been in operation since 2009 and 2011 respectively. The success of this initiative has led to it being adapted and implemented in other South African cities, including Nelson Mandela Bay, Rustenburg, Tshwane and Ekurhuleni.
The Passenger Rail Agency of South Africa (PRASA) was established in 2009, following the Cabinet’s approval of the consolidation of passenger rail entities, in a bid to provide better mobility and accessibility to transport for South Africans in pursuit of a better life for all.
PRASA is the parent company of the following businesses that serve the South African travelling public:
| | • | | Rail operations, which includes Metrorail which provides commuter rail services, and Shosholoza Meyl which provides long distance passenger rail services. |
| | • | | Autopax, which provides long distance bus services offered by Translux and City to City. |
| | • | | PRASA Corporate Real Estate Solutions (CRES), which is responsible for facilities management. |
| | • | | PRASA Technical, which is responsible for Rolling Stock upgrade and maintenance and depot and fleet management. |
| | • | | Intersite Asset Investments, which is responsible for the development of the PRASA property portfolio and asset investments. |
PRASA has embarked on a process of procuring new rolling stock amounting to R51 billion over the next ten years, with the delivery of the first coaches expected in 2015. The South African government has allocated R4.2 billion towards this project over the next three years. The National Government has also co-funded the R28 billion Gautrain Rapid Rail Link between Johannesburg and Pretoria. This project has linked Johannesburg, Tshwane and the OR Tambo International Airport through high-speed rail services. The final Gautrain link was completed in 2012.
South Africa Airways (SAA) is wholly state-owned company reporting to the Department of Public Enterprises. SAA’s core business is the movement of people and goods by air. The Group operates a dual-brand airline model, with SAA as its premium brand and the low cost carrier, Mango, targeting price sensitive markets. The premium four-star-rated airline connects 30 countries across the world as well as major destinations within South Africa from its Johannesburg hub. It provides an extensive network of air services to all major centres in South Africa, as well as between Johannesburg and most neighboring countries. SAA also provides regular services between South Africa and Australia, Europe, the Far East, the Middle East, South America and the United States. SAA became the first airline in Africa to join the Star Alliance Group in April 2006.
The commercial airport infrastructure in South Africa consists primarily of nine airports which are owned and operated on a commercial basis by the Airports Company of South Africa Limited (ACSA). Previously, the sole shareholder of ACSA, the National Government sold 20% of its equity stake in 1998 to Aeroporti di Roma (ADR) for R819 million. In 2005 the Public Investment Corporation Limited (PIC), a body charged with the administration of the state’s pension fund, purchased ADR’s 20%
48
equity stake for R1.67 billion. The Department of Transport is responsible for overseeing the state’s stake in ACSA. ACSA posted a profit of R991 million for the financial year March 31, 2013. This is a significant increase when compared to the prior year’s profit of R188 million. ACSA has attributed this increase to the benefits of the 2006 to 2010 capital investment program
The budget allocations to the Department of Transport will increase from R42.3 billion in 2012/13 to R53.4 billion in 2005/16. This reflects the growth in the allocations to PRASA and SANRAL.
Communications
The communications sub-sector consists of postal, broadcasting and telecommunications services. Telecommunication services can be further separated into fixed line and mobile services providers.
In terms of postal services the South African Post Office Limited (SAPO) is responsible for postal services which are regulated through the Postal Act and the Postal Services Act of 1998. SAPO enjoys a monopoly on the delivery of mail under 1kg. Private sector licensees are able to compete in the delivery of mail weighing 1kg or more.
SAPO was established on October 1, 1991 as a public company in terms of the Companies Act, No. 61 of 1973. The government of South Africa is the sole shareholder and is represented by the Minister of Communications. As a state owned company (SOC), SAPO is expected to comply with the Public Finance Management Act (PFMA) and it is regulated by the Independent Communications Authority of South Africa (ICASA). SAPO was granted a license to operate as South Africa’s postal services provider in 2001. The license is valid for a period of 25 years and is reviewed every three years with the next review in 2014.
SAPO’s delivery network includes 1578 branches, 26 mail centres and 876 agencies. Overall the SAPO services 13.8 million households. Like many postal companies internationally, SAPO faces a decline in its traditional mail business. It is thus looking to diversify its revenue sources primarily through growing its logistics business as well as strengthening its financial service offerings through the Postbank.
The Postbank Act of 2010 sought to establish the Postbank as a separate state-owned company; it became effective in July 2011. In effecting the provisions of the Postbank Act, the Postbank is currently being corporatized and submitted its banking license application to the Registrar of Banks (within the Reserve Bank) in September 2013. The Postbank is also implementing the necessary IT systems to ensure sound risk management. In October 2013, the Postbank Amendment was tabled in Parliament. The bill seeks to remove inconsistencies with the Banks Act.
As at March 31, 2013, Postbank deposits amounted to R4.5 billion and customer accounts increased from R6.9 to R7.3 million. The Postbank has also managed to obtain a VISA license and is a full member of the Payments Association of South Africa.
Telkom SA Limited (Telkom) is the leading provider of fixed line telecommunications services. The government owns a 39.8% stake in Telkom. There is also a second national fixed-line operator – Neotel. There are five licensed mobile operators: Vodacom, MTN, Cell-C, Virgin Mobile and Telkom Mobile (previously 8ta), owned by Telkom.
Telkom is listed on the Johannesburg Stock Exchange (JSE). The delisting from the New York Stock Exchange was informed by its desire to reduce its cost base. The Telkom Group consists of three business units, namely, Telkom Consumer, Telkom Business and Telkom Wholesale and Networks. The Group is further made up of three subsidiaries namely, Trudon (Pty) Ltd, Switfnet (Pty) Ltd and iWayAfrica. As at March 31, 2013, Telkom had a headcount of 24,481 employees.
Telkom is currently undergoing a turnaround that started with the appointment of a new Board and Management in August and September of 2013. According to Telkom’s annual report for the year ended March 2013, its strategy going forward will focus on: (1) financial performance in a declining revenue and high cost environment; (2) regulatory environment; (3) stakeholder management; (4) mobile positioning; and (5) customer service and brand perception.
In April 2013, Telkom and the Competition Commission agreed on a settlement involving an abuse of dominant market position case that was originally brought by the Commission in October 2009. The terms of the settlement agreement include an admission of guilt by Telkom, a R200 million penalty, a functional separation between Telkom’s retail and wholesale divisions, and wholesale and retail pricing commitments for the next five years estimated to yield R875 million in savings to customers. Telkom has welcomed the settlement and will work on delivering on the terms that have been agreed.
South Africa’s mobile phone industry network currently comprises of five licensees: Vodacom (Pty) Limited, MTN Group Limited, Cell-C (Pty) Limited, Virgin Mobile South Africa (Pty) Limited and Telkom. Mobile telephony is among the fastest-growing sub sectors of the South African economy. The Telecommunications Amendment Act of 1997 enabled various telecommunication facilities, including interconnection and roaming, and required two telecommunications providers to share and make available facilities and utilities for one another. Mobile number portability allows customers to switch networks without changing numbers.
49
Vodacom was initially established as Telkom’s mobile communications joint venture with Vodafone. Vodacom is the largest mobile communications network operator in South Africa. Vodacom has mobile presence in a number of African countries and in South Africa. Vodacom has 30.3 million active users, a 93.8% share of the mobile market and a mobile penetration of 144%. The Department of Communications is currently undertaking an ICT Policy Review which will review the functioning of the policy and regulatory framework of telecommunication, broadcasting, postal and e-commerce in South Africa and assess its effectiveness in achieving government’s policy objectives for a knowledge-based society.
Mining and Quarrying
The mining sector accounted for 4.9% of GDP during the first six months of 2013 and employed 511,106 individuals as at June 30, 2013. Although the sector’s importance to the South African economy has been declining over the long term, it remains an important contributor to export revenues and employment and provides support to various downstream industries (e.g. the steel value chain and electricity production).
South Africa’s mineral wealth is found in diverse geological formations, some of which are unique and very extensive by world standards. The most important of these formations is the Witwatersrand Basin in Gauteng, which yields approximately 90% of South Africa’s gold output as well as much of its uranium, silver, pyrite and osmiridium. The Transvaal Super group, also in Gauteng, contains large deposits of manganese and iron ore and the Bushveld Complex of Gauteng, Mpumalanga and the North West holds a large percentage of the world’s reserves of platinum-group metals, coal, chromium, vanadium, nickel, copper, fluorspar and andalusite. South Africa holds approximately 87.7% of the world’s platinum-group metals reserves, 80% of the global manganese and 72.4% of the world’s chrome ore reserves. South Africa has substantial reserves of other important industrial metals and minerals, including alumino-silicates, antimony, fluorspar, lead, nickel, phosphates, titanium, uranium, vanadium, vermiculite, zinc and zirconium. The Waterberg region in Limpopo contains a large amount of untapped coal reserves and initial estimates suggest that the Karoo Basin may be a commercially viable source of shale gas.
The table below shows the rand value of mineral sales for the years indicated.
Mineral Production
| | | | | | | | | | | | | | | | |
Year | | Index of
Production
Volume Including
Gold(1) | | | Index of
Production
Volume Excluding
Gold(1) | | | Total Value of
Mineral Sales
Including Gold
(R million) | | | Total Value of
Mineral Sales
Excluding Gold
(R million) | |
2008 | | | 102.1 | | | | 100.4 | | | | 299,630.8 | | | | 254,722.3 | |
2009 | | | 95.4 | | | | 93.8 | | | | 241,843.9 | | | | 192,668.9 | |
2010 | | | 100.0 | | | | 100.0 | | | | 299,876.8 | | | | 247,199.2 | |
2011 | | | 99.1 | | | | 99.9 | | | | 370,465.0 | | | | 301,939.9 | |
2012 | | | 96.0 | | | | 99.1 | | | | 364,862.9 | | | | 287,457.9 | |
2013(3) | | | 97.0 | | | | 100.4 | | | | 222197.8 | | | | 181,223.9 | |
Notes: —
| (2) | Through July 31, 2013 for sales and August 31, 2013 for production. |
Source: Stats SA.
Quarter-on-quarter mining production fell by 5.6% in the second quarter of 2013. The mining sector’s subdued performance in the second quarter is partially the result of a normalisation in growth. The large expansion recorded in the first quarter, which was driven by base effects owing to low production in the fourth quarter due to production stoppages linked to labour disputes. Further, the sector is likely to record subdued growth in the upcoming months as fundamentals drive the sector’s performance. Mineral sales, particularly gold sales, may continue to decline as demand from India and China moderates. However, cost inflation, soft commodity prices and the prospect of any re-opening of wage negotiations continue to pose concerns for the sector.
50
In the NDP 2030, the government identified mining as one of the key sectors for the acceleration of domestic industrialization and the acceleration of job creation. A number of binding constraints to growth that require policy intervention have been identified, including rail and port infrastructure, the stability of energy supply, skills constraints and poor regulatory framework.
Upgrades to the iron ore, coal and manganese rail lines and investment in new rolling stock will contribute to addressing the existing transport constraints. Rail infrastructure is to be improved through the upgrading of two critical coal lines (in the Waterberg and Richards Bay). Investments in improved rail capacity are envisioned to be supported by Eskom’s two new coal-fired stations that are expected to come on line in 2014 and 2015 and which should reduce the risk of power shortages.
The efficiency, pricing and capacity of local ports is being improved to reduce transport costs and enhance competitiveness. The ports regulator maintained 2013/14 port tariffs at their 2012/13 levels and decreased container export tariffs by 43.2%, container import tariffs by 14.3% and vehicle export tariffs by 21.1%. A new tariff structure will be phased in from 2014 to 2018 and handling capacity at the Durban container terminal is being expanded.
In an attempt to create an environment conducive to improved labour relations, Deputy President Kgalema Motlanthe brought together various stakeholders in the mining sector and drafted a mining accord to govern the wage negotiations. Although strikes were not completely averted and AMCU has not signed the accord to date, the negotiations were less disruptive compared to 2012. An enhanced wage negotiation process, improvements in working conditions and greater policy certainty (as amendments to the Mineral and Petroleum Resources Development Act are finalized in 2014) will contribute to a more robust mining sector.
Agriculture, Forestry and Fishing
The Agriculture, forestry and fishing sector is crucial to the economy in that it contributes to employment, food security and economic growth. Gross value added by the agricultural fishing and forestry sectors increased by 3.6% in the first half of 2013 as compared to the same period of 2012. The Department of Agriculture, Forestry and Fisheries (DAFF) suggests that commercial farmers produce approximately 95% of the country’s formal marketed agricultural produce. Total employment in the agriculture was approximately 712,000 in the second quarter of 2013, 11.6% higher than employment in same period last year. Production under irrigation takes place on approximately 1.4 million hectares (3.2 million acres).
Approximately 12% of the country can be used for crop production and high-potential arable land comprises only 22% of total arable land. Rainfall is unreliable and the country as a whole is subject to severe periodic droughts. Yet South Africa remains a major food exporter to the Southern African region, mainly due to the sector’s relative maturity and global competitiveness. There are a number of farming regions that vary according to climate, natural vegetation, type of soil and type of farming practiced. Agricultural activities range from intensive crop production and mixed farming in winter rainfall and high summer rainfall areas, to cattle farming in the bushveld and sheep farming in the more arid regions.
Pure agricultural companies such as ZZ2, Karsten, Westfalia and AFGRI are well-established and have existed since the 1960s. There are also many small-holder farmers who, although currently challenged by limited access to finance, markets and technology, could potentially significantly contribute to the productivity and employment of the sector.
From a trade perspective, South Africa is self-sufficient in many agricultural products and has always been a net exporter of agricultural products. However, largely due to erratic weather conditions, increasing costs of production and declining levels of investment, growth in agricultural production over the last decade has tended to be lower than population growth over the same period. Exports of processed agricultural products have outweighed exports of unprocessed agricultural products- in 2012, processed products made up about 69% of the value of total agricultural exports. Agricultural exports totaled R52.5 billion in 2012 signaling a 3.5% increase from the 2011 value of about R50.8 billion.
The NGP and NDP policy frameworks identify the agriculture as a key driver of job creation and will introduce measures to support growth of commercial farming and smallholder schemes with comprehensive support around infrastructure, marketing, extension services and finance. As agriculture is a high-risk business, access to finance has been a key challenge for farmers, particularly emerging or smallholder farmers. A number of platforms therefore exist to improve farmers’ access to finance. These include the Land Bank, the Industrial Development Corporation (IDC) and the Micro-Agricultural Financial Institutions of South Africa (MAFISA) and the Comprehensive Agriculture Support Programme (CASP). The DAFF aims to enhance agricultural development by coordinating the comprehensive funding and technical support to 22,000 existing and 80,000 new smallholder producers for food production over the medium term though its Food security and agrarian reform program.
51
Following financial breakdown, the Land Bank has stabilised its financial position and will increase its developmental lending to emerging farmers over the medium term. At the same time, the IDC is targeting the agriculture through its R10-billion Gro-E Scheme, and the number of farmers awarded production loans under MAFISA increased from 5,310 in fiscal year 2011/12 to 4,176 in fiscal year 2012/13. The DAFF has targeted 6,000 small-holder and subsistence farmers to be receiving MAFISA loans in fiscal year 2013/14 and 7,000 in fiscal year 2014/15.
The agriculture is also being supported through investments in research and development. One of the underlying principles of the Green Paper on Land Reform is the preservation and enhancement of agricultural productivity whilst institutions such as the Agricultural Research Council (ARC) and the Water Research Commission receive support from government. The ARC received R943.0 million from DAFF in fiscal year 2012/13 for its operations.
Empowerment policies are encouraging large corporations to take on or work with black and small-scale partners in order to encourage greater diversity. Agricultural Broad-Based Black Economic Empowerment (AgriBEE) is the agricultural sector’s approach to BBBEE and is envisaged to support other initiatives such as farmer development support and land reform, although the impact has been limited as it was not legally binding. The AgriBEE Sector Code was effected in December 2012 and is expected to improve the efficacy of AgriBEE.
Forestry
There are approximately 500,000 hectares of indigenous or natural forests in the country which occur mainly along the southern and eastern escarpment, the coastal belt and in sheltered kloofs or ravines. There has been an increase in the use of natural forests as sources of medicine, building material, fuel and food. It is estimated that around 80% of South Africa’s population still use medicinal plants, most of which are sourced from natural forests.
Forestry is an important contributor to GDP and employment. According to DAFF’s Strategic Plan 2012/13-2016-17, the forestry sector employs about 201,025 people and contributes approximately 1.2% to the country’s GDP.
South Africa now has a detailed inventory of all its natural forests, which are not commercially utilised extensively for forest products, but which are very important in supporting communities in subsistence needs and which also provide unique eco-tourism opportunities. These forests represent 24 broad forest types. The natural forests protected areas system, which was completed for all forests in 2004, will guide the setting-aside and re-demarcation of natural forests into protected areas. South Africa also has extensive woodland (deciduous fire-climax wooded areas as opposed to evergreen natural forests) areas throughout about 29 million hectares of the country, of which approximately three quarters is privately owned.
The Department of Agriculture, Forestry and Fisheries plans to transfer the management and control of all state-owned indigenous forests, primarily to provincial government departments or national and provincial conservation agencies such as South African National Parks, SANParks, which will manage about 97,000 hectares of state forest land in the southern Cape and Tsitsikamma areas.
The Forestry 2030 Roadmap aims to achieve the effective and sustainable development of all forestry resources in South Africa. It serves as the guiding policy of the forestry sector. The Forestry BBBEE Charter, which was launched at the Forestry Indaba in April 2005, was gazetted in June 2009. The Charter envisages that forestry will be inclusive and equitable, and all people, regardless of race, will fully participate through the sustainable use of resources, sustainable growth, international competitiveness and profitability for all its participants and a forestry sector that contributes meaningfully to poverty eradication, job creation, rural development and economic value-adding activities in the country. Under the Charter, the national government aims to process about 15,000 hectares per year until 2019 to get a net increase in forestry of about 10,000 hectares per year.
Fishing
South Africa’s industrial fisheries are widely regarded as being among the best managed in the world. The commercial fishing industry, which includes fish, molluscs, seaweed and shellfish, contributes approximately 0.5% to GDP, according to DAFF’s Strategic Plan for 2012/13-2016/17, and directly employs about 27,000 people, while another 100,000 people are estimated to find employment in secondary and tertiary functions related to the fishing subsector (for example, processing and transport). Marine life that is not harvested, such as whales, dolphins and seabirds, is increasingly recognized as a valuable resource for nature-based tourism.
The South African fishing industry, which was once concentrated in the hands of a few, largely white-owned companies, has undergone intensive transformation over the past ten years. It is estimated that at least 60% of commercial fishing rights have been allocated to HDIs or majority HDI-owned companies. Transformation has taken place in a very short space of time, without compromising the principle of sustainable utilisation that is fundamental to the management of fisheries.
52
The Integrated Coastal Management Act of 2008 replaced the Seashore Act of 1935 and the Dumping at Sea Control Act of 1980, and introduces a comprehensive national system for planning and managing South Africa’s valuable coastal areas. The Integrated Coastal Management Act declares the seashore, coastal waters (including estuaries) and South Africa’s territorial seas to be coastal public property. It therefore also requires the state to act as the trustee of coastal public property.
Exports in the fishing industry have shown consistently strong growth over the past few years and it is estimated that approximately 54% of the annual fish catch is exported, mainly to Europe, the Far East and North America.
The primary objective of the national government’s fisheries policy, as outlined in the Marine Living Resources Act of 1998, is the improvement of impoverished coastal communities through increased access to, and sustainable development of marine resources.
The Integrated Growth and Development Plan 2012 (IGDP) was developed by DAFF to provide a long-term strategy for the agriculture, forestry and fisheries sector. Its aim is to provide a coordinated implementation framework across the sector. DAFF is currently in the process of finalizing the Agricultural Policy Action Plan (APAP), which will set out the interventions DAFF will make, along with their associated implementation time-frames, in order to meet its strategic objectives. The APAP will clearly align the interventions that the department plans to implement to broader industrial and economic strategies such as the IPAP and the NDP. The APAP will also assist in coordinating related policies that are under other departments such as land reform and rural development, this should assist in addressing some of the challenges that these related issues pose to the sector.
Electricity, Gas and Water
Real value added by the electricity, gas and water sector increased by an annualized rate of 0.4% in the second half of 2012, from previously recorded increases of 1.4% in 2011 and 1.7% in 2010. According to the QES, the number of persons employed in this sector was 127,000 as at September 30, 2013 (however, due to sampling challenges, this figure is particularly volatile).
Electricity output for the 9 months of 2013 declined by 0.3% compared with the same period in 2012. This can be attributed to lower domestic demand arising from a prolonged economic slowdown, unplanned outages at Koeberg’s Unit 2 (900MW) and interrupted supply from Mozambique’s Cahora Bassa due to damaged transmission infrastructure. Lower output was also due, in part, to Eskom embarking upon increased summer maintenance. Eskom entered into 11 power buy-back deals with ferrochrome and alloys producers for the period December 2012 to March 2013, securing over 900MW of capacity to create space for much needed maintenance.
Electricity
South Africa generates two-thirds of Africa’s electricity. According to the 2011 census, 85% of households in South Africa had access to electricity, up from 58% in 1996. The province with the highest levels of electrification was the Western Cape (93%), followed by the Free State (90%), whilst the Eastern Cape (75%) and KwaZulu Natal (78%) had the lowest levels of household electrification.
More than 85% of South Africa’s electricity is coal-generated. Koeberg (1800MW), a large nuclear station near Cape Town, provides about 5% of capacity. A further 5% is provided by hydro-electric and pumped storage schemes.
Generation of electricity in South Africa is currently dominated by Eskom, the national state-owned utility, which also owns and operates the national electricity grid. The company supplies about 95% of South Africa’s electricity. Eskom is among the top 11 global companies in terms of generation capacity, among the top seven in terms of sales, and has one of the world’s biggest dry-cooled power stations, the Matimba Power Station.
Electricity supply constraints are being met with government policies to support the development of generation and transmission capacity. In response to supply constraints, Eskom embarked on massive build program. In the short term, South Africa’s increased power needs are expected to be met by two new coal-fired power stations, Medupi (4800MW) and Kusile (4800MW). Medupi is expected to come online in the second half of 2014. The projects have been financed by a mix of higher tariffs for electricity as well as debt issued by Eskom, backed with a government guarantee, as well as loans from multilateral development banks.
53
Electricity tariffs have been increasing at levels above inflation since 2008 to reach cost reflectivity. In October 2012 Eskom submitted its Multi Year Price Determination (MYPD) application to the National Energy Regulator (NERSA). The application requested an increase in the determination period from three to five years and an increase in tariffs of 16% per year from 2013 to 2018. In February, NERSA granted Eskom yearly increases of 8% for the period from 2013/14 to 2017/18, instead of the 16% it had requested. This translated into allowable revenue for the period of R862 billion, rather than the nearly R1.1 trillion sought.
Over the longer term, South Africa’s envisaged energy generation and transmission needs and provision are outlined in the Department of Energy’s Integrated Resources Plan (IRP). The IRP seeks to diversify the energy mix in South Africa to include gas, imports, nuclear, biomass, renewables, as well as use to the existing coal resources more efficiently and in a more environmentally friendly manner. The IRP envisages creating an additional 42.6 GW of total capacity by 2030: 17.8 GW from renewable energy sources, 9.6 GW from nuclear power, 6.3 GW from coal and the remainder from other generation sources. This mix should help South Africa to meet its commitments to climate change imperatives such as the Copenhagen Accord.
Under its Renewable Energy Independent Power Producer Programme (REIPPP) South Africa will add 2,459 MW between 2014 and 2016 through a total of 47 projects including solar photovoltaic (PV), concentrated solar power, wind and small-hydro. The first two rounds of the REIPPP have been completed and have demonstrated significant appetite for private investment in South Africa’s energy sector under competitive and transparent conditions. According to the United Nations Environment Programme, South Africa recorded the world’s highest growth in renewable energy investment in 2012. The first two rounds have attracted an estimated R75 billion in private and public investment. Total investment for current determination of 3,725 MW is estimated to reach R100 billion.
South Africa is also planning on procuring base-load electricity from Independent Power Producers (IPPs). In December 2012, the Minister of Energy made a determination that would allow for the procurement of 2,500 MW of coal, 2,652 MW of gas and 2,609 MW of regionally imported hydro capacity. This capacity is expected to be connected to the grid between 2021 and 2025. The country’s first base-load gas-fired power plant was recently commissioned by Sasol and half of the plant’s 140 MW capacity will be fed into the national grid. This milestone paves the way for further gas-fired generation options, including regionally sourced gas from Mozambique and Angola as well as the exploitation of shale-gas potential in the Karoo following the lifting of the moratorium on exploration. Initial estimates suggest that shale-gas has the potential to add R960 billion to the South Africa’s GDP over a 20-30 year period.
Oil and Gas
Oil and gas continue to play an important role in the South African economy, contributing close to 80% of transport fuel sources. South Africa has the capacity to refine 703 kilo barrels per day (kbpd) from four crude oil refineries with total refining capacity of 508 kbpd, one coal-to-liquid refinery (150 bpd) and one gas to liquid refinery (45 kbpd). However, oil and gas are largely imported and thus have significant balance of payment implications. It is for this reason that South Africa continues to support efforts to enhance the exploration of mineral resources, especially energy sources. The Petroleum Agency of South Africa, a state-owned company responsible for the promotion of gas and oil exploration, has granted 11 international companies exploration licenses to date. Following the lifting of the moratorium on prospecting for shale gas in the Karoo in September 2012, draft technical regulations for petroleum exploration were published for public comments. This augments gaps in the current regulatory framework and paves the way for the exploitation of the country’s shale gas potential, estimated at 485 trillion cubic feet, presenting significant economic opportunities for the country.
PetroSA is a subsidiary of the Central Energy Fund (CEF) and is the National Oil Company (NOC) of South Africa. CEF is wholly owned by the State and reports to the Minister of Energy. PetroSA’s flagship operation and main contributor to its revenue is its Gas to Liquid (GTL) plant located in Mossel Bay. The Mossel Bay plant is the third largest out of the five such plants globally and is capable of producing a crude oil equivalent of 45,000 barrels per day. The refinery employs over 2,000 people, mainly from the surrounding area, and increasingly from its Centre of Excellence.
The diesel retail price is unregulated; the petrol retail price is fixed on a monthly basis, with adjustments made each month with respect to international refined fuel prices in benchmarked markets and the Rand/Dollar exchange rate. The administration of the pricing regulation is done by the Central Energy Fund on behalf of the Department of Energy.
In response to heightened sanctions on the importing of crude oil from Iran that came into effect during 2012, South Africa shifted its crude oil import volumes from Iran to other countries in the MENA region, including Saudi Arabia, Angola and Nigeria.
NERSA approved Sasol Gas’ application for maximum prices. NERSA determined a maximum gas energy price of R117.69/GJ in March 2013. This was determined using weighted price indicators derived from various fuel alternatives, including coal, electricity, liquid petroleum gas, diesel and heavy fuel oil. The new framework aims to aims to offer price visibility and certainty, while balancing consumer protection with returns that are reasonable for both Sasol Gas and possible future suppliers.
54
Water
South Africa’s inland water resources include 22 major rivers, 165 large dams, more than 4,000 medium and small dams on public and private land and hundreds of small rivers. South Africa has a range of projects for surface and underground water extraction and storage. The Department of Water Affairs (DWA) is the government department with the mandate to regulate the water sector nationally, develop national policy, standards and guidelines, and provide targeted support and information management. In 2010, the DWA was restructured to focus its attention on its core functions of policy formulation, water resource management, infrastructure development, capacity building intergovernmental and intra-sectoral coordination, and water regulation. As a result of the restructuring, the forestry function was moved to the Department of Agriculture, Forestry and Fisheries, while the sanitation function was moved to the Department of Human Settlements.
One of the ways in which South Africa addresses issues of water resource management is for the DWA to provide strategic direction for water resources management in the country. This is reflected in the National Water Resource Strategy (NWRS). The first edition of the NWRS was published in 2004 and set out the ‘blueprint’ for water resources management in the country for the first time. However, since its publication, one of the key areas where the aims of water policy and the NWRS-1 have not been effectively achieved is in relation to equity and redress in access to water. While the provision of safe domestic water supplies has reached 95% of the population, showing remarkable strides since 1994, the allocation and reallocation of raw water to historically disadvantaged communities for productive purposes has not progressed as it should. This was one of the reasons which led to a review of the NWRS-1 and the drafting of the NWRS-2. The NWRS-2 is premised on 11 core strategies with enabling, governance, and technical support strategies. Some of the key areas are that of equity, allocation and licensing, regulation, pricing and institutions. The final draft of the NWRS-2 was approved by Cabinet in June 2013 and published in the national gazette in August 2013.
The DWA is in the process of developing a comprehensive investment plan which will inform budgeting and integrated planning from construction through to operation and maintenance. Capital investment in new water and sanitation infrastructure for the entire value chain including the refurbishment of existing infrastructure is projected to require an estimated R670 billion over the next ten years. The Regional Bulk Infrastructure Grant covers the provision of water from water resources to Municipal reticulation systems. In 2013, the department implemented 159 projects to the value of R2.5 billion.
The DWA is in the process of reviewing the raw water pricing strategy, developing an infrastructure funding model and investigating the establishment of an economic regulation for the sector. DWA is also in the process of reviewing key water sector policy positions with the aim of determining any unintended oversight and gaps in current policies. The proposed positions address three overarching issues, namely developmental water management, how the entire water sector value chain should be addressed, and the establishment of a singular national legislative framework under one act.
The Constitution provides that everyone has the right to have access to sufficient water and it enjoins the state to make reasonable legislative and other measures within its available resources to achieve the progressive realization of this right. Substantial progress has been made by the water sector in providing universal access to water and sanitation services in South Africa. South Africa has met the Millennium Development Goals of halving the population without access to water and sanitation. In 1994, only about 59% of South Africa’s population had access to water supply infrastructure, meaning that almost 15.9 million people had no access to a basic water supply. As of March 2012, 94.7% of people had access to a basic water supply. Similarly, access to basic sanitation services increased from 49% in 1994 to 79% in 2010.
While substantial progress has been made in reducing the backlog in the provision of basic water and sanitation services, greater focus is now being placed on regulating the quality of water. In 2008, the DWA introduced a system of incentive-based regulation which is aimed at assessing the quality of water within various municipalities and municipal systems in line with international best practice. The system was defined by two programmes: the Blue Drop Certification Programme for drinking water quality management regulation and the Green Drop Certification Programme for wastewater quality management regulation.
A Blue Drop assessment was done for 2012 in which 931 water systems were audited within 153 municipalities. The results indicated an upward trend in the number of blue drop awards. A full assessment report is available once every two years. A Green Drop progress assessment was also done for 2012 in which 831 plants were assessed within 153 municipalities
55
Construction
The construction sector’s contribution to overall GDP growth remained unchanged at 3.4% in the first half of 2013, compared to the same period in 2012. According to QES surveys, the construction industry employed just over 1 million people as at June 30, 2013, a 7% increase as compared to the same period during 2012.
Growth in real value added by construction moderated to 1.7% in the first half of 2013, from 1.9% in 2012 and 0.2% in 2011. The public sector remained the leading source of construction work, whilst construction work from the private sector remained weak. This was coupled with persistent labour unrests which might have caused some delays in construction work. Conditions in the residential market have improved somewhat in the first half of 2013 compared to the same period in 2012, mirrored by improved activity levels and house prices growth. Growth in household mortgage advance also improved notably, rising by 2.8% in the first half of 2013, from 1.6% in 2012 and 3.7% in 2011.
Building Construction
Building construction primarily comprises the activities of general contractors engaged in the building, alteration, repair or demolition of buildings. Subcontractors appointed to perform work such as painting, plumbing, electrical installation, bricklaying and other related work are also included in this sector. Enterprises operating in this sector vary from large building contractors to many smaller contractors and subcontractors. Major inputs to this sector are non-metallic mineral products, electrical machinery and basic iron and steel. Although its contribution to GDP is relatively low, this sector is labour-intensive and utilises mainly semi-skilled or unskilled labour.
The National Government has implemented a housing subsidy policy, tender procedures and contract procurement policies that are directed towards facilitating the growth of the emerging construction sector. Further, the government remains committed to providing housing to low-income groups. Over the medium-term, government will provide R3 billion for social housing (medium-density rental housing in urban areas), R30.3 billion to upgrade informal housing in metropolitan municipalities.
The Housing Accord in 1994 established procedures to ensure the delivery of 350,000 low-cost houses per year, with a goal of delivering 1 million houses by 1999. To date, over 3 million housing units have been delivered since 1994, although there is an estimated backlog of 2.1 million houses remaining. According to the 2013 Estimates of National Expenditure, it is projected that an additional 409,143 low income houses and an upgrade of 198,779 sites in informal settlements will be delivered over the medium term. The National Government is also committed to improving water and sanitation infrastructure as part of the rural housing program.
Civil Engineering
Civil engineering includes contractors primarily engaged in construction work such as airports, dams, electricity networks, harbors, pipelines, railway lines and roads. The demand for labour consists mainly of production workers and artisans (unskilled and semi-skilled workers). The civil engineering sector provides most of its own raw materials, but also uses non-metallic mineral products, iron and steel.
The civil construction industry is characterized by a high degree of economic concentration. As such, the government implemented the Construction Charter, which took effect from June 6, 2009, aiming to involve historically disadvantaged individuals and smaller businesses in construction activities. Moreover, the Construction Industry Development Board (CIDB) has developed standards and procedures for government tenders which are intended to help simplify tender procedures, particularly for small construction contractors.
The civil engineering sector’s share of production is very sensitive to cyclical economic activity, with almost three-quarters of the domestic demand for the sector’s output generated by domestic fixed investment. In the face of weakened private activity, improved investment by the general government and public corporations has proved helpful in keeping the construction sector afloat. Investment by the public sector grew by 5.7% in the first half of 2013, compared to 3.2% investment growth by the private sector. The government has instituted various capacity-building initiatives, such as the infrastructure delivery improvement programme (IDIP), the infrastructure skills development grant and the municipal infrastructure support agency. Since the inception of IDIP, R255 million has been spent on the programme and a further R98 million a year will be spent over the next three years.
56
The NDP recommends that, in order to achieve higher and inclusive growth, investment levels need to reach 30% of GDP, with public investment reaching 10% of GDP. The Cabinet has established the Presidential Infrastructure Coordinating Commission (PICC) in 2011, which integrates and coordinates long-term infrastructure builds, raising the level of investment spending and contributing to industrial and regional development. In addition, the government has budgeted R827 billion for infrastructure projects over the medium term. This represents projects in energy, transport, education, health, communication and water sectors.
The economic outlook improves, it is expected that demand from civil works will improve. This together with government’s implementation of announced infrastructure projects will support growth in the overall construction sector.
Informal Sector of the Economy
Informal enterprises encompass a very wide range of activities in South Africa, including the production of marketable products, the distribution of merchandise and the provision of services. Informal enterprise is an important haven for self-employment in rural areas, as well as for the newly urbanised and for the formally unemployed. In addition, informal enterprises mobilize capital at a grass-roots level for the provision of dwellings and community-based services. The businesses in this sector typically operate at a low level of organization and on a small scale, with little or no division between labour and capital. Where more than one individual is involved, labour relations are based mostly on casual employment, kinship or personal and social relations rather than on contractual arrangements with formal guarantees. Formal sector economic activity, by contrast, is conducted within the formal structures created by the legal system of the country.
The informal sector’s annual contribution to GDP, though difficult to estimate with any certainty, has been estimated at approximately 8% to 10% in recent years. This sector employs approximately 2.1 million people (excluding agriculture and domestic service) and, as September 30, 2013, accounted for 16% of total employment.
Employment and Trade Unions
Employment
Employment remains one of the key challenges for the South African economy. There are key structural challenges which must be overcome if unemployment is to be reduced, namely up-skilling the labour force and engendering faster growth rate to increase labour demand.
Employment has recovered somewhat since the end of the recession, with formal sector non-agricultural employment 4.3% higher than its low in March 2010. Over the last year, private sector job losses, most notably in the mining sector, have been offset by employment gains in in the public sector. A large proportion of net job creation since the onset of the crisis has been in the informal sector, highlighting the sector’s importance in employment and livelihood creation.
Total employment per sector
| | | | | | | | | | | | | | | | |
Total employed per sector as at June 30, 2013 | | Total employed
(000s) | | | Proportion
employed | | | Change since
December 2008
(000s) | | | Percentage
change since
December 2008 | |
Agriculture | | | 712 | | | | 5 | % | | | -61 | | | | -8 | % |
Mining and quarrying | | | 374 | | | | 3 | % | | | 48 | | | | 15 | % |
Manufacturing | | | 1,735 | | | | 13 | % | | | -253 | | | | -13 | % |
Electricity, gas and water supply | | | 115 | | | | 1 | % | | | 25 | | | | 28 | % |
Construction | | | 1,083 | | | | 8 | % | | | -136 | | | | -11 | % |
Wholesale and retail trade | | | 2,906 | | | | 21 | % | | | -293 | | | | -9 | % |
Transport and communication | | | 832 | | | | 6 | % | | | 37 | | | | 5 | % |
Financial services | | | 1,818 | | | | 13 | % | | | 146 | | | | 9 | % |
Community and social services | | | 3,050 | | | | 22 | % | | | 367 | | | | 14 | % |
Private households | | | 1,093 | | | | 8 | % | | | -186 | | | | -15 | % |
Other | | | 3 | | | | 0 | % | | | -2 | | | | -31 | % |
| | | | | | | | | | | | | | | | |
Total | | | 13,721 | | | | 100 | % | | | -306 | | | | -2 | % |
| | | | | | | | | | | | | | | | |
Source: Stats SA
57
One of the key challenges facing South Africa is the structural trend of the labour force as a whole. In the table below, it can be seen that the proportion of the working age population that is not economically active (NEA) is persistently high, nearly matching the proportion of the labour force that is employed. Taken together with the fact that the long term unemployed (those who have been unemployed for longer than a year) has been increasing over the last five years, this indicates that, without significant job creation, the unemployed face a considerable risk of being permanently excluded from the labour force altogether.
| | | | | | | | | | | | | | | | | | | | | | | | |
Proportion of Working Age Population that are: | | Q2 2008 | | | Q2 2009 | | | Q2 2010 | | | Q2 2011 | | | Q2 2012 | | | Q2 2013 | |
Unemployed | | | 45 | % | | | 43 | % | | | 41 | % | | | 40 | % | | | 41 | % | | | 41 | % |
Not Economically Active or Discouraged | | | 13 | % | | | 13 | % | | | 14 | % | | | 14 | % | | | 14 | % | | | 14 | % |
Proportion of unemployed that are: | | | 42 | % | | | 43 | % | | | 45 | % | | | 46 | % | | | 46 | % | | | 45 | % |
Long term unemployed | | | 59 | % | | | 60 | % | | | 64 | % | | | 68 | % | | | 68 | % | | | 67 | % |
Source: Quarterly Labour Force Survey, Stats SA
The National Government has placed job creation at the heart of its policies, by promoting an environment that is conducive to both labour demand and supply issues. To address the structural skills problem, Further Education and Training (FET) colleges offer a varied range of courses/programmes that have been developed to respond to the scarce skills needed by employers. Colleges offer courses in industry fields such as agriculture, arts and culture, business, commerce and management, education, training and development, engineering, manufacturing and technology, services, building construction and security. To assist talented students who are in financial need, the government runs the FET Colleges Bursary Scheme, which funds between 80% and 100% of the total cost to the student. The government has created twenty-one sector education and training authorities (SETAs), each designed to develop a series of sector specific skills plans to ensure that all training is accredited and reflects current sectoral needs and requirements. They disburse funds to employers and training bodies, and to learners in the form of discretionary grants and bursaries. These skills based interventions are aligned with the Industrial Policy Action Plan, thus ensuring that the IPAP priority areas are supplied with the specialized skills they need for economic growth.
To assist with obtaining first jobs and getting the required work experience, the Government intends to launch the Employment Tax Incentive in January 2014. The Government will share the initial cost of hiring with employers to boost job creation. The work experience gained will improve long term employment prospects of the youth, whose struggle to attain a first job significantly affects their long term prospect for employment. Legislation to give effect to the incentive is in the final stages of parliamentary review.
The Expanded Public Works Programme runs through all spheres of government to provide productive work and targets 3 million work opportunities. There is also a skills aspect to this through two initiatives run within the EPWP. The National Youth Service Programme trains youth in artisan work for the built environment, whilst Vuk’uphile trains contractors in labour intensive construction techniques.
More broadly, the National Government has strengthened small business financial and advisory support, drawing on both public and private sector capacity, given their importance for job creation and continues to provide significant support for education. The Small Enterprise Development Agency supports small businesses by enhancing the competitiveness and capabilities of small enterprises. The Small Enterprise Financing Agency, services small businesses in need of funding up to R3 million. Other support programmes include the SME Development Programme, the Export Marketing Incentive, the Business Regulatory Compliance Advice program, the Technology Transfer Guarantee Fund, and GODISA (an incubator program).
Education
Education is one of the National Government’s priority areas. This prioritization is reflected in the total government expenditure on education – at 19.6% of total National Government expenditure in fiscal year 2013, South Africa’s total expenditure on education lies in the upper part of the 15% to 20% threshold as set by the Education for All initiative in 2008.
58
The former Department of Education was split into two separate departments in 2009 – the Department of Basic Education and the Department of Higher Education and Training (DHET). This has allowed the Government to have dedicated structures supporting education in schools (basic education) and intermediate and high-level skills development at post-school level, which includes Further Education and Training (FET) Colleges; higher education institutions and the skills development agencies (Sector Education and Training Authorities and the National Skills Fund) previously with the Department of Labour.
At the start of the 2013 academic year, the South African education system had 12.5 million students, 425,023 educators and 25,720 schools, of which 1,584 were independent schools. With enrolment and gender parity virtually achieved, particularly at primary school level where the gross enrolment ratio is 96 for girls and 101 for boys, access to education is less of a problem in South Africa and the focus has moved to improving the quality of education.
This shift in focus is reflected in the National Government’s commitment to “improve the quality of basic education”, one of the key elements in the National Development Plan. Improving learner performance in literacy and numeracy is central to the overall improvement in education outcomes at all levels. Workbooks for grades 1 to 6 that aim to raise levels of literacy and numeracy were introduced in 2011 and were extended to grade 9 in 2012. These workbooks are complemented by the introduction of annual national assessments in literacy and numeracy for learners in grades 1 to 6 in 2011, and these assessments have been conducted for grade 9 since 2012. Ensuring that the developmental needs of the very young are met is a key objective, hence the expansion of Early Childhood Development and grade R programmes continue to be prioritized over the medium term.
To address the impact of poverty on educational opportunities, a “no-fee schools” policy was introduced in 2007 that ensured that the poorest 40% did not have to pay school fees. Since the start of 2011, this now covers the poorest 60% of learners. These “no-fee schools” receive additional resources to provide the necessary learner and teacher support materials.
Another key poverty alleviation programme is the National School Nutrition Programme (NSNP), which provided daily meals to 9.2 million learners (73.7% of total learners) in the 2012 fiscal year. The NSNP is funded by means of a conditional grant, with a total budget of R4.9 billion for fiscal year 2012, with the aim of enhancing the learning capacity of poor students by providing them with a nutritious meal every school day.
The Ministry of Basic Education issued the Action Plan to 2014: Towards the Realization of Schooling 2025 in 2010, in which the 27 goals for basic education are outlined. These goals include:
| | • | | increasing the number of Grade 12 learners who become eligible for a bachelors programme at a university; |
| | • | | increasing the number of Grade 12 learners who pass mathematics and physical science; and |
| | • | | ensuring that all children remain effectively enrolled in school up to the year in which they turn 15 years of age. |
A safe and secure learning environment is a critical element to improving the quality of learning and teaching. A dedicated fund of R9.1 billion over the 2013 MTEF is made available to ensure that all schools are made safe and secure sites with access to water and electricity. This complements funds already in the baselines of provincial education departments for school infrastructure.
There is also recognition that performance in mathematics and science, the gateway subjects to science, engineering and technology, needs to be substantially improved. In 2004, the National Government introduced the Dinaledi Schools, which channel additional resources to 500 disadvantaged schools to increase the quality of education and student performance with regards to mathematics and science. Dinaledi Schools are provided with additional learner and teacher support materials as well as teacher development and support. In 2012, 54% of Dinaledi students studying mathematics achieved high level scores and 63% of students studying science achieved high level scores. A dedicated funding stream for Dinaledi Schools in the form of a conditional grant was introduced in fiscal year 2011 with an initial allocation of R70 million, increasing to R122.5 million in fiscal year 2016, to further strengthen this program.
A second education-related outcome in the National Government’s outcomes approach is to “develop a skilled and capable workforce to support an inclusive growth path”. FET Colleges are recognized as primary sites for skills development and R1.9 billion was spent on recapitalizing a consolidated FET College sector between fiscal year 2006 and fiscal year 2008. Quality is also a concern at these colleges and the DHET has committed to implement measures that aim to address poor performance at these FET Colleges. The Sector Education and Training Authorities (SETAs) and the National Skills Fund, the key skills development agencies, intend to spend R 12.3 billion in fiscal year 2013 and R 44.3 billion over the 2014 MTEF on a range of skills development programmes.
Access to higher education has steadily increased, with enrollment up from 578,134 in 2000 to 938,201 in 2012. One of the key outputs identified under this priority outcome is to specifically increase the number of science, engineering and technology graduates because of the contribution that these graduates can make to the economic growth that the country seeks. Additional grant funding is provided to those universities that are able to increase enrollment and graduation numbers in these key areas.
59
In order to ensure that the poor are also able to access opportunities at universities and FET Colleges, a total of R18.9 billion will be made available over the 2014 MTEF for poor learners to access programmes at these institutions.
Trade Unions and Labour Disputes
The Labour Relations Act promotes collective bargaining through, among other things, protecting organizational rights for unions and the right to strike. Trade union representation is a widely spread industrial practice in South Africa. Almost all sectors of the economy, including the public service, have representative unions which engage employers over issues affecting their workforce.
Union density serves as an indication of the strength and potential influence of unions in the economy. South Africa’s union density is quite high. Although the number of registered trade unions initially increased from 248 in the mid-1990s to about 500 in calendar year 2004, it has declined over the last few years. As at October 2013, the number of registered trade unions was 189, as compared to 205 registered trade unions in calendar year 2009. Most trade unions in South Africa are organised in federations, of which there were approximately 31 affiliated to the Department of Labour as at the time of the most recently available information. The largest federation is the Congress of South African Trade Unions (COSATU), which has 20 affiliates and over 2 million members. COSATU includes the National Union of Mineworkers, the National Union of Metalworkers of South Africa, the South African Clothing and Textile Workers Union, the Food and Allied Workers Union and the National Education, Health and Allied Workers Union. Other significant federations include the Federation of Unions of South Africa and the National Council of Trade Unions. Federations are not required by law to register, so it is difficult to accurately estimate the total number of federations or the total membership of all of South Africa’s trade unions.
The Labour Relations Act of 1995 (Labour Relations Act) promotes collective bargaining through, among other things, protecting organizational rights for unions and the right to strike. The right to strike is contingent on the exhaustion of dispute procedures and on the condition that the industry does not provide essential services. The Labour Relations Act also establishes a framework for the formation of bargaining councils to determine matters within the public sector and each industrial sector, the criteria for which are to be established by the National Economic Development and Labour Council. When employers and employees cannot agree on the formation of a bargaining council, a statutory council may be formed. In addition, the Labour Relations Act sets out the procedures for instituting legal strikes, introduces special requirements for the use of secondary strikes, picketing, protest action and replacement labour and protects an employer’s right to have recourse to lockout. The Labour Relations Act also introduces workplace forums to promote ongoing dialogue between workers and management and simplifies the procedures for the registration of unions.
The Labour Relations Act permits the use of privately negotiated dispute resolution procedures and also encourages centralized dispute resolution mechanism. The Commission for Conciliation, Mediation and Arbitration (CCMA) is responsible for attempting to resolve industrial disputes through conciliation and mediation. If these attempts fail, the CCMA may determine the dispute by arbitration or the parties may refer the dispute to the Labour Court unless it falls into the categories that must be resolved finally by arbitration and may not be referred to the Labour Court. The Labour Court is comprised of both trial and appellate divisions and, together with the High Court of South Africa and Supreme Court of Appeals, has jurisdiction over all matters referred to it under the Labour Relations Act.
The following table shows the number of man-days lost as a result of strikes and work stoppages for the periods indicated.
Work days Lost to Strikes and Work Stoppages (millions)
| | | | | | | | |
| | | Year ended
December 30 | | | Six months ended
June 30 | |
2008 | | | 0.99 | | | | 0.26 | |
2009 | | | 2.9 | | | | 0.53 | |
2010 | | | 14.6 | | | | 1.25 | |
2011 | | | 6.2 | | | | 0.4 | |
2012 | | | 3.5 | | | | 0.75 | |
2013 | | | | | | | 1.8 | |
Note: —
Source: The Wage Settlement Survey Quarterly Report, Andrew Levy Employment Publications.
60
South Africa experienced a high number of work stoppages in 2012 and 2013. Industrial action in 2012 was focused on the mining sector, though in previous years public sector and manufacturing have had significant industrial action. In 2013, there have been significant strikes in the vehicle production, vehicle component manufacturing, and vehicle retail sectors. The major strike trigger remains wages, accounting for 92% of working days lost and 56% of the number of strikes. Nevertheless, the negotiation climate was viewed by 59% of companies as of June 2013 as being focused, accommodating and constructive, an improvement on the 50% who held such view as of June 2012.
Labour Legislation
Significant legislation has been adopted since 1994 designed to improve labour relations, the quality of employment, skills development and employment equality. South African labour legislation promotes equity in employment and prohibits discrimination in the workplace on the grounds of race, gender, sex, pregnancy, marital status, family responsibility, ethnic or social origin, color, sexual orientation, age, disability, religion, HIV status, conscience, belief, political opinion, culture, language or birth.
To realize these objectives, legislation requires all employers to take steps to end unfair discriminatory practices and policies. In addition, legislation mandates designated employers to prepare and implement employment equity plans and to report to the Department of Labour on their progress in ending unfair discriminatory practices and in promoting equity.
Post-1994, legislation was put into place to govern labour market activity and these include:
| | • | | the Basic Conditions of Employment Act of 1997, which applies to all workers and regulates leave, working hours, employment contracts, deductions, pay slips and termination; |
| | • | | the Employment Equity Act of 1998, which protects workers and job seekers against unfair discrimination and provides a framework for the implementation of affirmative action; |
| | • | | the Labour Relations Act of 1995, which applies to all workers and employees and aims to promote economic development, social justice, labour peace and democracy in the workplace. It affords workers protection in line with international standards; |
| | • | | the Skills Development Act of 1998 and Skills Development Levies Act of 1999, which aims to develop the skills in the South African labour force as well as outlines how employers should contribute to the NSF; |
| | • | | the Unemployment Insurance Act of 2001 and Unemployment Insurance Contribution Act of 2002 outlines the security available to workers when they become unemployed as well as how to contribute to the UIF Contribution Fund; and |
| | • | | the Compensation for Occupational Injuries and Diseases Act of 1993, which regulates safety and health matters in the workplace. |
Since the original acts, there have been various amendments and refinements to the legislation. Most recently, the Labour Relations Act and the Employment Equity Act have been amended. The amendments to the Labour Relations Act state that Temporary Employment Services (labour broker) employees can be hired on a temporary contract basis for a maximum period of three months after, which such employees will be deemed to be permanent employees of the labour broker’s client. Thereafter, a failure to retain those employees will be viewed as a dismissal, thus bringing the law in line with the amended Basic Conditions of Employment Act. The amendments also allow the CCMA to award organizational rights that traditionally require majority membership to minority unions who are the most representative union in the workplace. The amendments to the Employment Equity Act requires stricter adherence to employment equity targets, as well as making more explicit the different terms and conditions of employment that would be considered as unfair discrimination. The proposed Employment Services Bill aims to keep a record of job seekers and record of vacancies in private enterprise to facilitate the matching process in the labour market.
61
Benefits
Although the National Government has not established a comprehensive welfare system of the type found in many industrialised countries, it does maintain a variety of social benefit schemes relating to, among other things, compensation for occupational injuries and diseases, occupational health and safety, unemployment insurance, old age, disability and survivor benefits, child support grants, unemployment, sickness and maternity benefits, worker injury benefits and various health care benefits targeted to certain persons. Other programmes provide for a developmental social welfare programme to ensure, among other things, delivery of benefits to the poorest South Africans and improved social insurance. These programmes are funded largely from budgetary allocations and through efficiency savings, subsidies or payments.
Education, skills, employment and unemployment
Individuals with lower skills levels represent the majority of the unemployed. Those who have not completed secondary education make up 60% of the unemployed, and are the most likely to lose jobs. In the quarter ended June 2013, there was a net quarterly increase in employment of 100,000, yet those who hadn’t completed secondary studies were the only group to lose jobs.
Recognising the importance of education, the National Government allocates its largest share of the budget to education, equal to 22% of total allocated expenditure in fiscal year 2013/14. The National Government has dedicated structures supporting education in schools (basic education) and intermediate and high level skills development at post-school level, which includes FET Colleges, higher education institutions and the skills development agencies such as SETA and the NSF.
Prices and Wages
Targeted consumer price inflation has increased slightly from an annual average rate of 5.7% in 2012 to an average rate of 5.9% in the first 8 months of 2013. Headline CPI inflation (for all urban areas), however, breached the upper limit of the inflation target range in July and August, recording 6.3 and 6.4% respectively. With domestic demand remaining subdued, the outlook for inflation has been mainly subject to movements in the exchange rate and oil prices. Annual food inflation has eased from 7.4% in 2012 to 6.7% in the first 8 months of 2013, while core inflation has increased gradually from 4.6% in 2012 to 5.1% in the first 8 months of 2013. Although the Rand is highly volatile, it has gained somewhat over October and November, with petrol prices set to moderate slightly. In addition, tempered global growth and consumer spending should keep overall inflation in 2013 broadly in line with the 2012 pace of 5.9%.
The year-on-year rate of change in the producer price index (PPI) for domestic output increased from a year-on-year rate of 5.8% in January 2013, to 6.7% in August 2013 as a result of the weaker exchange rate and higher petrol prices.
Growth in average nominal remuneration per worker in the formal non-agricultural sectors of the economy amounted to 6.6% in 2012, accelerating to 7.4% through the first quarter of 2013.
Increases in average remuneration per worker in the private sector accelerated to 7% and public sector decelerated to 7.8%, respectively, through the first quarter of 2013.
Nominal remuneration increases remained above the upper limit of the inflation target range in the third quarter of 2013: the construction sector (9%); non-gold mining sector (7%); manufacturing sector (8%); wholesale and retail (11%), community, social and personal services sector (14%) and electricity (11%). Remuneration growth was within the target range in the financial sector (4%); private transport, storage and communication sector at 5% and in the gold mining sector (4%) in the third quarter of 2013.
According to Andrew Levy Employment Publications, the average level of settlement for the first half of 2013 moved to 7.9% in June 2013, up from 7.7% in the first quarter of 2012 and 7.6% average for 2012.
Labour productivity growth increased to 0.8% in the first quarter of 2013 on a year-on-year basis. Given a slightly higher rate of increase in average salaries and wages per worker during the first quarter of 2013, unit labour cost also increased from 5.2% in the year to the fourth quarter of 2012 to 6.6% in the first quarter of 2013. Average wage settlements of 7.9% in the first six months to June 2013 were higher than average CPI inflation of 5.7% between January and June 2013. High wage settlements may have reduced the incentive of companies to rehire workers laid off during the recession and to create new jobs. In the past, employment growth has been associated with strong GDP growth and moderate growth in real earnings.
62
Prices and Wages
| | | | | | | | | | | | | | | | | | | | | | | | |
| | | For the year ended December 31, | |
| | | 2008 | | | 2009 | | | 2010 | | | 2011 | | | 2012 | | | As of
September 30,
2013 (1) | |
Consumer Prices(2) | | | 78.9 | | | | 84.6 | | | | 88.2 | | | | 92.6 | | | | 97.8 | | | | 104.8 | |
Percentage change from prior year | | | 11.5 | | | | 7.1 | | | | 4.3 | | | | 5.0 | | | | 5.7 | | | | 6.0 | |
Production Prices(3) | | | 180.8 | | | | 180.8 | | | | 191.7 | | | | 207.7 | | | | 220.5 | | | | 107.6 | |
Percentage change from prior year | | | 14.3 | | | | 0.0 | | | | 6.0 | | | | 8.4 | | | | 6.2 | | | | 6.7 | |
Salaries and wages | | | | | | | | | | | | | | | | | | | | | | | | |
At current prices | | | 12.8 | % | | | 11.8 | % | | | 13.5 | % | | | 7.2 | % | | | 7.5 | % | | | 7.5 | %(4) |
At constant prices | | | 2.8 | % | | | 2.6 | % | | | 5.5 | % | | | 1.6 | % | | | 1.9 | % | | | 2.4 | %(4) |
Notes: —
| (1) | The average values over the first nine months. |
| (3) | New PPI series as from 2013. |
| (4) | As of September 30, 2013. |
Source: SARB and Stats SA
63
MONETARY AND FINANCIAL SYSTEM
The South African financial system consists of banks and non-bank financial institutions such as investment funds, portfolio management companies, securities investment firms, insurance companies, development funding institutions and pension funds.
The South African Reserve Bank (SARB)
The SARB is the central bank of South Africa, with its head office in Pretoria and branches in Bloemfontein, Cape Town, Durban, East London, Johannesburg, Port Elizabeth and Pretoria North. The Constitution established the SARB as an independent central bank, subject only to acts of Parliament and to regular consultation with the Minister of Finance. The principal responsibilities of the SARB include: formulating and implementing monetary policy; issuing banknotes and coins; acting as banker to the National Government; acting as a bank to banks licensed under the Banks Act of 1990; providing facilities for the clearing and settlement of claims between banks; acting as custodian of the country’s gold and other foreign reserves; acting as a lender of last resort; conducting open-market operations; supervising banks; supervising large primary, secondary and tertiary co-operative banks that collect, process and interpret economic statistics and related information; and formulating and implementing exchange rate policies in cooperation with the Minister of Finance and the National Treasury. See “ — Regulation of the Financial Sector” below.
Unlike many other central banks, shares in the SARB are held privately, with no shares held by the National Government. The SARB was listed on the JSE from its inception in 1921 until May 2002, when it was de-listed. Currently, approximately 630 shareholders, including companies, institutions and individuals, hold SARB shares. No single shareholder may hold more than R10,000 in nominal value of the SARB’s shares. Dividends are paid to shareholders out of net profits at a rate of 10% per annum of the nominal value of the shares. After certain provisions, 10% of the SARB’s surplus in any year is paid into a reserve fund, and the balance is paid to the National Government.
The SARB is managed by a 15-member board of directors. The Governor and three Deputy Governors of the SARB are appointed by the President for five-year terms. Of the remaining ten directors, four are appointed by the President, with the remaining six elected by the SARB’s shareholders, two of whom represent the interests of commerce and finance, two of whom represent industry, one of whom represents labor, one of whom represents mining and one of whom represents agriculture. These directors hold office for a period of three years. The Governor has a vote on the board of directors and an additional vote to be used only in the event of a tie. The National Government therefore appoints persons controlling most of the effective votes to the board of directors of the SARB.
President Zuma appointed Ms. Gill Marcus as Governor of the SARB with effect from November 9, 2009. Ms. Marcus has extensive knowledge of the SARB, having served as a Deputy Governor from 1999 to 2004. In addition, she served as Deputy Minister of Finance from 1996 to 1999. Ms. Marcus has also served as chairperson of the Joint Standing Committee on Finance and held a number of executive positions in the private sector.
The South African Reserve Bank Act was amended in 2010 (through Amendment Act No. 4 of 2010) to provide mechanisms to ensure that shareholders contribute to the functioning of the SARB without adversely influencing the SARB’s decision-making capabilities through group or block formations.
Monetary Policy
The main objective of the SARB’s monetary policy has been the pursuit of price stability. This policy contributes to the broader macroeconomic policies of the National Government by creating a stable financial environment and improving the standard of living of all inhabitants of the country. The SARB does not have fixed exchange rate targets and allows the Rand to float freely against international currencies.
In 2000, an inflation-targeting monetary framework replaced the SARB’s previous approach to monetary policy-making. The previous approach involved the public announcement of guidelines for growth of the money supply in general, supplemented by regular, wide-ranging assessments of economic conditions and reports on the outlook for inflation. The current inflation-targeting framework is a broad-based strategy for achieving price stability, centered on an analysis of price developments, and is characterised by the announcement of a numerical target for the inflation rate that is to be achieved over a specified period of time. In light of the weakening relationship between money growth and nominal income growth, monetary policy decisions are guided by the deviation of the expected rate of increase in headline CPI from a specified target range. An important factor in determining monetary policy is the forecast generated by the SARB’s macroeconomic models, although monetary policy is not decided mechanically according to the forecast of economic developments. In the application of inflation-targeting as a monetary policy framework, allowance is made for the price effects of serious supply shocks, such as changes in the international price of crude oil, higher food prices resulting from unfavourable weather conditions and inordinate changes in the international exchange value of the Rand. The current inflation target is 3-6%.
64
Having plateaued at 12% from early June to early December 2008, the repurchase rate was reduced by 50 basis points to 11.5% in December 2008, and by a further 450 basis points to 7.0% by August 2009, remaining at that level until February 2010. Although cost-push pressures in the economy continued to pose risks to the inflation outlook, the MPC decided to keep the monetary policy stance unchanged because the risks to inflation outlook appeared to be fairly evenly balanced. The frequency of meetings for most of 2009 changed from bi-monthly to monthly (excluding July 2009) in order to monitor and respond appropriately to the rapidly changing economic environment. However, in the first meeting under the newly appointed Governor Gill Marcus in November 2009, the MPC decided to revert back to its policy of meeting every alternate month, as the global economic environment appeared to have stabilised.
Amid concerns about increased downside risks to the domestic economic outlook emanating from the uncertain global economic environment, the MPC again reduced the repurchase rate by 50 basis points in March and September 2010, bringing the rate to 6%. At the November 2010 MPC meeting, the repurchase rate was reduced further by 50 basis points to 5.5%. The decision to lower the repurchase rate stemmed from relative improvement in the inflation outlook, which continued to be supported by weak, though recovering, domestic demand conditions, the appreciating exchange rate of the Rand and a persistent negative output gap. Administered price developments and the possible impact of high wage settlements continue to be viewed as potential threats to the inflation outlook. The repurchase rate was subsequently kept unchanged at a rate of 5.5% between January and June 2012.
At the July meeting of the MPC, the repurchase rate was lowered by 50 basis points to 5.0% with effect from July 20, 2012. The decision to cut the repurchase rate was brought about by concerns over continued sluggishness in the domestic economy, aggravated by the protracted problems in the euro area and possible knock-on effects to the domestic economy. The MPC viewed the more accommodative policy stance to be appropriate under prevailing economic conditions, as it was consistent with the Bank’s price stability mandate and conducive to encouraging growth and domestic investment. Although global and domestic growth conditions continued to weaken in subsequent months, the MPC kept the repurchase rate unchanged through the July 2012 meeting.
Year-on-year CPI inflation decreased gradually from 6.2% in January 2010 to 3.2% in September 2010, before rising to 6.3% in January 2012. Since then, CPI inflation again declined to 4.9% in July 2012 before increasing gradually to 6.3% and 6.4% in July and August 2013, respectively. CPI inflation decreased to 6.0% in October 2013. At the September 2013 MPC meeting, the inflation forecast for 2013 remained unchanged at an average of 5.9%, but the expected average for 2014 deteriorated to 5.8% from 5.5% in the previous forecast. The forecast for 2015 was raised from 5.2% to 5.4%, and inflation was expected to average 5.3% in the final two quarters of 2015.
In its role of implementing monetary policy, the SARB monitors and influences conditions in the South African money and credit markets and affects interest rates, growth in lending and growth of deposits. The SARB uses open market operations to determine the amount of liquidity available to banks on a weekly basis in repurchase transactions. The interest rate for such repurchase transactions is set by the SARB’s MPC and has a significant impact on all short-term interest rates in the economy. The monetary policy stance is decided at the bi monthly meetings of the MPC. There exists, however, a continuous process of review that takes new information and developments into consideration.
Open market operations entail the buying and selling of securities by the SARB in the open market in order to regulate the conditions in the money market or the level and pattern of interest rates. By injecting or absorbing funds through purchases and sales of securities, the SARB may increase or decrease liquidity in the banking system. Although these transactions are primarily undertaken to achieve long-term monetary objectives, a further objective may be to stabilise temporary money-market fluctuations. Currently, nine primary dealers make markets in government paper, five of which are domestic banks and four of which are international banks. Since its appointment of primary dealers in 1998, the SARB no longer acts as agent for the National Government in buying or selling its securities. The SARB may purchase and sell National Government securities for the SARB’s own account, providing it with an effective means of influencing money market liquidity. Other techniques used by the SARB to influence liquidity include purchasing securities outright, varying the amount of National Government bills offered at tender each week, allocating National Government deposits between the SARB and private banks, issuing SARB debentures and entering into foreign exchange swaps with banks.
During 2004 the SARB conducted a review of its money-markets operations, which were last reviewed in September 2001. As a result, on May 25, 2005, following extensive consultations with market participants, the SARB implemented several changes to its refinancing operations with three aims: to streamline the SARB’s refinancing operations to make them simpler and more transparent; to encourage banks to take more responsibility for managing their own individual liquidity needs in the market; and to promote a more active money market in South Africa. These changes include, among other things, the announcement of an estimate of the average daily market liquidity requirement by the SARB and the estimated range within which the daily requirement is expected to fluctuate in the coming week on the Wednesday morning prior to the main weekly repurchase auction, and the introduction of standing facilities (previously referred to as final clearing or reverse repurchase tenders) at a spread of 50 basis points above or below the prevailing repurchase rate to accommodate banks with short or long liquidity positions.
However, the central feature of the SARB’s operational arrangements — the conduct of repurchase auctions on Wednesdays, with one-week maturity at a repurchase rate fixed at the level announced by the MPC — remains unchanged.
65
Before the introduction of the changes to the SARB’s refinancing operations, the accommodation amount provided at the main weekly repurchase auction was stable at around R13 billion, which was also the approximate level of the average daily liquidity requirement of the private sector banks. Thereafter, the amounts on offer at the weekly main refinancing auctions varied, with generally higher levels around month-end and lower levels towards the middle of the month. In order to even out the banks’ end-of-day positions, standing facilities and cash reserve accounts were utilised.
Following the evening out of the oversold forward foreign exchange book in February 2004, the SARB continued to increase its foreign exchange reserves through the measured buying of foreign exchange from the market, thereby creating Rand liquidity. The banks’ required cash reserve balances with the SARB rose considerably in September 2004, as vault cash was no longer allowed as part of qualifying cash reserves due to the phase-out of vault cash concessions, which started in September 2001.
The outstanding amount and composition of interest-bearing instruments utilised by the SARB were changed to drain liquidity from the money market. Debentures with a 56-day maturity were first issued on December 1, 2004, and 56-day reverse repurchase transactions were first conducted on March 24, 2005.
The outstanding amount of South African Government bonds in the SARB monetary policy portfolio has declined over the years and currently amounts to R7.4 billion as at June 2012. This followed an agreement between the National Treasury and the SARB on October 20, 2003, which allowed the SARB to restructure and shorten the average maturity of interest-bearing government bonds held in its monetary policy portfolio by conducting cash-neutral auctions.
The following table sets forth the rate at which the SARB provided liquidity to banks as of each month-end indicated.
Repurchase Transaction Rate
| | | | |
2012 | | (%) | |
January | | | 5.5 | |
February | | | 5.5 | |
March | | | 5.5 | |
April | | | 5.5 | |
May | | | 5.5 | |
June | | | 5.5 | |
July | | | 5.0 | |
August | | | 5.0 | |
September | | | 5.0 | |
October | | | 5.0 | |
November | | | 5.0 | |
December | | | 5.0 | |
| | | | |
2013 | | (%) | |
January | | | 5.0 | |
February | | | 5.0 | |
March | | | 5.0 | |
April | | | 5.0 | |
May | | | 5.0 | |
June | | | 5.0 | |
July | | | 5.0 | |
August | | | 5.0 | |
September | | | 5.0 | |
October | | | 5.0 | |
November | | | 5.0 | |
Source: SARB.
66
In May 2007, the SARB began to accept certain parastatal bonds in its repurchase auctions, thereby extending the range of securities which may be used as collateral in the refinancing system. This included a selection of bonds included in the All Bond Index, as determined by the Bond Exchange of South Africa Limited (BESA), excluding those issued by commercial banks. The added securities do not qualify as liquid assets in terms of the Banks Act. The table below lists the assets which were added as eligible collateral. However, at the end of August 2010, the SARB implemented certain changes to its monetary policy operational procedures, including the phasing out of parastatal bonds included in the All Bond Index as eligible collateral in the SARB’s refinancing operations. As a result, with effect from March 1, 2011, these bonds were no longer accepted as collateral.
Additional securities accepted in repurchase auctions
Rand denominated
| | |
Assets previously and still included as eligible collateral | | Assets which have been added from May 23,
2007 but which will be phased out with effect
from March 1, 2010. |
Government bonds | | DBSA (DV07) |
Land Bank bills | | Eskom Holdings Ltd. (ES09, E170, ES33) |
Separate trading of registered interest and principal of securities (STRIPS) | | SANRAL (SZ25) |
SARB debentures | | Transnet Ltd. (T011) |
Treasury bills | | Trans-Caledon Tunnel Authority (WS03, WS04) |
Source: SARB.
In August 2010, further changes to the monetary policy operational procedures of the SARB were made. These included the use of longer-term foreign exchange swaps with maturities of up to 12 months as an instrument to manage money market liquidity more effectively. The consequence of conducting longer-term foreign exchange swap transactions to drain liquidity from the market is that the SARB reflects an overbought forward position on its monthly releases of official gold and foreign exchange reserves. In addition, the estimated ranges of the weekly liquidity requirement were discounted and the spread between the rates for standing facilities and the repurchase rate was widened from 50 basis points to 100 basis points below and above the prevailing repurchase rate.
The following table sets forth the money supply (M1A, M1, M2 and M3) of South Africa during the periods indicated.
Money Supply
| | | | | | | | | | | | | | | | | | | | | | | | |
| | | As of December 31, | | | As of Sep
30, 2013 | |
| | | 2008 | | | 2009 | | | 2010 | | | 2011 | | | 2012 | | |
| | | Rand (million) | |
Coin and banknotes in circulation | | | 57,362 | | | | 61,784 | | | | 65,079 | | | | 69,853 | | | | 81,042 | | | | 82,533 | |
Check and transmission deposits | | | 362,492 | | | | 359,637 | | | | 40,7448 | | | | 410,263 | | | | 495,885 | | | | 528,804 | |
Total: M1A(1) | | | 419,854 | | | | 421,421 | | | | 472,527 | | | | 512,368 | | | | 576,9286 | | | | 611,336 | |
Other demand deposits(2) | | | 333,774 | | | | 384,840 | | | | 390,260 | | | | 434,537 | | | | 458,109 | | | | 511,335 | |
Total: M1(3) | | | 753,628 | | | | 806,261 | | | | 862,788 | | | | 946,906 | | | | 1,035,036 | | | | 1,122,671 | |
Other short and medium-term deposits(4) | | | 807,983 | | | | 782,004 | | | | 814,541 | | | | 850,597 | | | | 832,768 | | | | 887,746 | |
Total: M2(5) | | | 1,561,612 | | | | 1,588,265 | | | | 1,677,329 | | | | 1,797,503 | | | | 1,867,804 | | | | 2,010,418 | |
Long-term deposits(6) | | | 352,589 | | | | 359,957 | | | | 405,785 | | | | 457,796 | | | | 504,390 | | | | 496,965 | |
Total: M3(7) | | | 1,914,200 | | | | 1,948,222 | | | | 2,083,114 | | | | 2,255,299 | | | | 2,372,194 | | | | 2,507,383 | |
67
Notes: —
| (1) | Notes and coins in circulation plus check and transmission deposits of the domestic private sector with monetary institutions. |
| (2) | Demand deposits (other than check and transmission deposits) of the domestic private sector with monetary institutions. |
| (3) | M1A plus other demand deposits held by the domestic private sector. |
| (4) | Short-term deposits (other than demand deposits) and medium-term deposits (including all savings deposits) of the domestic private sector with monetary institutions, including savings deposits with and savings bank certificates issued by the Postbank (a division of the SAPO). |
| (5) | M1 plus other short-term and medium-term deposits held by the domestic private sector. |
| (6) | Long-term deposits of the domestic private sector with monetary institutions, including national saving certificates issued by the Postbank. |
| (7) | M2 plus long-term deposits held by the domestic private sector. |
Source: SARB.
Since the introduction of inflation-targeting monetary framework, growth in the most broadly defined money supply (M3) has not been used as an intermediate target for monetary policy purposes. Nevertheless, money supply and credit may provide useful information about prospective spending plans and inflationary pressures.
The Basel II capital-adequacy framework and the accompanying regulatory reforms were implemented in January 2008. In the time leading up to the implementation date, banks refined their information and technology systems for the classification and reporting of balance sheet items. Improved classification caused some discontinuities in a few subcategories of the monetary and credit aggregates, but these were limited. In line with the requirements of Basel II, the South African banking sector remains well capitalised. The “tier one” capital adequacy ratio stood at 12.1% in August 2011. Total capital adequacy currently stands at 14.3% such that the South African banks meet the minimum capital adequacy requirements. The implementation of the Basel III framework in South Africa is based on a phased-in approach which commenced on January 1, 2013 and will continue up to 2018, in line with the timelines determined by the Basel Committee. The Basel III Liquidity Coverage Ratio will be implemented from January 1, 2015, while the Net Stable Funding Ratio will be effective from January 1, 2018.
M3 accelerated from a record low of 0.1% in February 2010 to 8.2% in January 2011, signaling a turnaround in the decelerating growth that commenced in 2008, and persisted throughout 2009. The growth rate thereafter fluctuated broadly between 6% and 8% in the ensuing months to December 2012, partly reflecting the weaker pace of growth in income and expenditure and economic growth conditions which had failed to significantly accelerate. Subsequently, growth in M3 gained some momentum during 2013 and accelerated to a post-recession high of 10.0 per cent in April 2013, whereafter it moderated to 7.0 per cent in September. On a quarterly basis, growth in M3 reached a most recent high of 12.5% in the second quarter of 2013, before slowing to 4.7% in the third quarter. Growth in other demand deposits, together with cheque and transmission deposits, underpinned the bulk of the increase in the growth in M3 during the third quarter of 2013.
Financial System Stability
The SARB regards the achievement and maintenance of price stability as its primary goal. A necessary parallel objective to this is financial system stability, without which monetary policy cannot be effectively implemented. To pursue the maintenance of financially stable conditions and contain systemic risk, the SARB continuously assesses the stability and efficiency of the key components of the financial system and formulates and reviews policies for intervention and crisis resolution. In 1999, the SARB established a Financial Stability Committee with the specific mandate to strive to enhance financial stability by continuously assessing the stability and efficiency of the financial system, formulating and reviewing appropriate policies for intervention and crisis resolution, and strengthening the key components of the financial system. A Financial Stability Department was established within the SARB with effect from August 1, 2001 to help monitor the stability of the financial system as a whole by identifying inherent weaknesses and the build-up of risks that may result in financial system disturbances. Central to the SARB’s increased focus on, and contribution to, the financial stability discourse, a semi-annual Financial Stability Review is published that covers both a quantitative and qualitative assessment of the strength and weakness of the South African financial system.
A cross-sectoral body was created in 2002 to facilitate cooperation in identifying threats to the stability of the South African financial sector and in proposing and obtaining approval for appropriate plans, mechanisms and structures to mitigate such threats. This body creates a coordinated network of contingency planning contacts throughout the financial services industry, and has the capacity to act as a crisis management team to deal with tactical situations affecting one or more firms. It also facilitates cooperation between key financial sector institutions and regulators in times of catastrophic events or disasters through business continuity planning, which serves to better protect staff, facilitate recovery and sustain both a stable financial market and consumer confidence.
68
Regulation of the Financial Sector
Since 1994, South Africa has made a dedicated effort to deregulate the financial sector. The new market-based approach to regulation relies heavily on the use of strengthened corporate governance and accountability principles, enhanced disclosure systems, and market discipline as an incentive to compliance. Although increased deregulation has encouraged both competition and innovation, it has simultaneously demanded heightened supervision, more explicit market integrity and strengthened consumer protection mechanisms.
The two main regulatory authorities, the Financial Services Board (FSB) and the SARB, apply measures to secure the financial soundness of the financial system of South Africa as a whole. The regulatory instruments that they use include entry and other standard requirements, ownership constraints, fit and proper persons tests, limitations on certain activities, jurisdictional constraints, pricing constraints and operational constraints (such as capital and liquidity requirements and trading capacity requirements). Domestic supervision also incorporates international standards. South African financial institutions must comply fully with the majority of the Basel capital adequacy principles and standards. Basel II (developed by the Basel Committee on Banking Supervision and endorsed by central bank governors and the heads of bank supervisory authorities in the G-10 countries) was implemented in South Africa in January 2008, in accordance with the Basel Committee timeframe. Since the commencement of the sub-prime and financial market crisis, the oversight body of the Basel Committee announced a substantial strengthening of existing capital requirements and the introduction of new global capital and liquidity standards, sometimes referred to as Basel 2.5 and Basel III. The Basel Committee on Banking Supervision required that Basel 2.5 be implemented by January 2012. The Minister of Finance approved the SARB Bank Supervision Department’s amended regulations, which were implemented before the deadline. The phase-in period for the Basel III requirements began on January 1, 2013 and is anticipated to last through 2019. South Africa is already in compliance with the capital requirements of Basel III and will be aiming at meeting the other requirements within the stipulated timeline. South African financial institutions must also comply with the financial reporting and disclosure standards incorporated in the international accounting standards, adopted by the International Organisation of Securities Commissions. The various financial markets, financial institutions and financial instruments are regulated by a series of general, specific and enabling legislation.
Legislation enacted in 1998 provides for an independent competition authority, comprising an investigative division and an adjudicative division with broad powers to, among other things, issue compliance orders and interdicts, levy fines, impose structural remedies such as divestitures and prohibit mergers. The legislation also provides for a right of appeal to a specially-constituted judicial authority. In the majority of cases, the adjudicative divisions have sole jurisdiction over competition matters. Amendments to the legislation enacted in 1999 require pre-merger notification in particular cases.
The Companies Act of 1973 was repealed and replaced with the Companies Act of 2008, which became effective on May 1, 2011. The Companies and Intellectual Property Commission is the regulatory organ charged with the administration and enforcement of the Companies Act of 2008. The Office of the Registrar of Banks forms part of the SARB and conducts the supervision of banks. The FSB regulates the financial markets for equity, debt and derivative securities, as well as non-bank financial institutions registered under specific legislation. Advisory committees serve the various offices and boards, and a Policy Board for Financial Services and Regulation coordinates the institutional and functional aspects of regulation. Appeal boards are provided for if and when they are needed, but responsibility for regulation remains with the Minister of Finance.
Recent legislative and regulatory initiatives coming into force since 2000 include the following:
| | • | | As of January 2008, South African registered banks were required to comply with Basel II. The Banks Act was thus substantially amended to comply with the principles of Basel II. The Banks Amendment Act of 2007 was assented to by the President of the Republic of South Africa and published in November 2007. Following the sub-prime and financial market crisis, the oversight body of the Basel Committee announced a substantial strengthening of existing capital requirements and the introduction of global capital standards, in the form of Basel 2.5 and Basel III. The phase-in period for these further requirements began on January 1, 2012. |
| | • | | Since the publication of the South African National Payment System Framework and Strategy document in 1995, major payment system milestones have been achieved and all major domestic risk-reduction objectives have been met. This framework and strategy document contained a ten-year vision up to 2004. The main objective of the new framework and strategy document, known as Vision 2010, is to provide high-level strategic guidance for the payment system up to 2010. By September 2011, most of the strategic objectives contained in Vision 2010 were met. However, the SARB realised that several of the strategies, fundamental principles and critical success factors contained in Vision 2010 continue to be relevant. Although the South African payment system was unaffected by the global financial crisis, the SARB used the many new initiatives in the international regulatory environment that resulted from these events, as well as the recommendations relating to the national payment system (NPS) contained in the Banking Enquiry Report, published in 2008, to review, refine and adjust Vision 2010 for future developments to create a vision and strategy for 2015. The updated framework and strategy document is referred to as Vision 2015. |
69
| | • | | The JSE demutualised in July 2005 and listed in June 2006, allowing it to operate as a company with share capital. This put the JSE on par with its international competitors, the majority of which had already been demutualised and converted to companies. In February 2009, the majority of the shareholders of BESA accepted an offer by the JSE to acquire BESA. In June 2009, the JSE and BESA merged. BESA has now been fully integrated into the JSE and currently forms part of the JSE’s Interest Rate and Currency Market. The JSE published new Debt Listing Requirements in 2011 which apply in relation to the listing of government and corporate bonds on the JSE’s Interest Rate and Currency Market. A new set of rules of conduct has also been published (the Interest Rate and Currency Rules). It is expected that the merger will realise, among other things, benefits of greater liquidity, reduction of costs through economies of scale and better risk management for users of a single exchange. |
| | • | | The DTI commenced the process of reviewing the corporate laws in South Africa in fiscal year 2006 so as to bring the South African corporate law framework closer to full compliance with international standards and best practices, provide the necessary protection to all corporate stakeholders, maximise the opportunities for companies to attract capital and stimulate economic growth. The Companies Act of 2008 was passed by the national legislature, assented to by the then President of the Republic of South Africa, Kgalema Motlanthe and published on April 9, 2009. The Companies Act of 2008 entered into effect on May 1, 2011. The Companies Act of 2008 replaced the existing Companies Act of 1973 and some of its significant changes include provisions for the facilitation of business rescue proceedings in respect of companies in financial distress and the reduction of the regulatory burdens placed on small and medium enterprises. |
| | • | | The Competition Amendment Act of 2009 was enacted in August 2009 and amends the Competition Act of 1998, through the introduction of provisions dealing with concurrent jurisdictions of industry regulators, complex monopolies and market inquiries. |
| | • | | The Consumer Protection Act of 2008 provides for a consumer protection regime designed to promote and advance the social and economic welfare of consumers. The Consumer Protection Act entered into effect on March 1, 2011. |
| | • | | The revised King Code and Report on Corporate Governance for South Africa (King III Code) was launched on September 1, 2009 and came into effect on March 1, 2010, replacing its predecessor, King II Code and Report on Corporate Governance (King II Code). King III Code sets out various corporate governance guidelines and principles applicable to listed companies, financial institutions, and public sector enterprises, agencies and government departments (compliance with King III Code is mandatory for listed companies). The review of King II Code was prompted by changes in international governance trends and the reform of South Africa’s company laws with the promulgation of the New Companies Act. |
| | • | | In July 2010, the Bank Supervision Department of the SARB released the proposed draft Banks Amendment Bill. The purpose of the proposed Bill is to align the provisions of the existing Banks Act of 1990 with the New Companies Act as well as to ensure that the legal framework for the regulation and supervision of banks and bank controlling companies is based on international standards and best practice. Following a process of extensive public consultation, the Bill should come into effect in early 2014. |
| | • | | Regulation 28, issued in terms of section 36 of the Pension Funds Act of 1956, governs the asset-spreading requirements of retirement funds. An amended version of Regulation 28 was approved by the Minister in March 2011. The new Regulation 28 takes into account a significantly changed financial sector and enhances member protection. The effective date of the new Regulation 28 was July 1, 2011, subject to a six month transition period until December 31, 2011 to enable funds to adjust their monitoring and reporting systems, as well as their investments. The new Regulation 28 covers many asset classes (such as hedge funds, private equity investments and derivatives) which were not otherwise covered by previous regulation relating to pension funds. |
| | • | | The National Treasury is exploring options to promote entry into the banking sector as South Africa’s highly concentrated banking sector may compromise the level of competition needed to bring about efficiency improvements and greater access to financial services. |
Financial markets such as the foreign exchange market and the money market are not regulated by specific legislation but are subject to general legislation and regulation by agencies such as the SARB. Institutions currently not required to register under any particular legislation are not subject to specific regulation. However, it is expected that all individuals and firms conducting an investment business will in future be required to comply with certain minimum requirements in respect of disclosure and capital adequacy. These individuals and firms will also be required to adhere to a strict and coherent code of business conduct imposed to strengthen supervision.
70
The Minister of Finance released, together with the 2011 Budget, a comprehensive discussion document titled ‘A Safer Financial Sector to serve South Africa better’, which put forward a range of proposals to strengthen the financial regulatory system in South Africa. The Minister of Finance requested a review of any gaps or weaknesses in the current financial regulatory system, as well as recommendations arising from a recent financial sector assessment conducted by the IMF. The following proposals were presented in the discussion document for public comment and have since been implemented:
| | • | | Move to twin peaks regulatory structure. The financial sector regulators will be re-organised into a twin peaks structure. While the exact details are still to be finalised, it is likely that the responsibility for prudential regulation will reside in the SARB, while the FSB will be responsible for market conduct regulation; |
| | • | | Macro prudential approach to supervision. The economic crisis demonstrated the need to develop an approach that focuses on the risks in relation to the entire financial sector, rather than only the risks pertaining to individual institutions. The SARB is the lead institution in this regard and will be taking appropriate steps to strengthen financial stability. In addition, the SARB has established a committee to promote financial stability; |
| | • | | Establishing a Council of Financial Regulators. One of the key proposals to strengthen the financial regulatory system is to create a Council of Financial Regulators, jointly chaired by the Minister of Finance and the Governor of the SARB. All regulatory agencies in the financial sector will form part of the Council. It will promote coordination and the sharing of information between regulators, particularly in the case of diversified financial services conglomerates; |
| | • | | Prudential regulation of banking and insurance. Basel III will tighten the prudential supervision of banks by imposing stricter capital requirements and introducing liquidity and leverage ratios. Similar requirements will also pertain to insurance – the FSB has released a paper on the introduction of a revised prudential regime for insurers, based on Solvency II, to ensure that regulation of the South African insurance sector remains in line with international best practice; |
| | • | | Improving the domestic regulatory system and entrenching operational independence. Regulators should be operationally independent when licensing and supervising the financial sector. A number of initiatives are planned to improve the accountability and governance of domestic financial regulators. Policy will still be the responsibility of the National Government, which will determine the framework within which domestic regulators will operate; |
| | • | | Market conduct. The National Government will strengthen market conduct regulation, particularly in retail banking and insurance. The 2008 report of the Banking Enquiry Panel set up by the Competition Commission set out a number of recommendations to lower banking charges and greater transparency in pricing, which the National Treasury and the SARB are currently facilitating. The treating customers fairly initiative from the FSB is an important step in strengthening market conduct objectives in the financial sector; |
| | • | | Expanding the scope of regulation. Many activities, such as over-the-counter derivative trading, hedge funds and credit rating agencies previously fell outside the regulatory framework. In line with our international commitments, new legislation has been and will continue to be introduced to regulate such activities in a way that strengthens and promotes the stability of the financial system. This includes the replacement of the Securities Services Act with a Financial Markets Act, which came into operation in June 2013, and the Credit Rating Services Act, which was signed into law in January 2013. Improvements in governance in other sectors posing systemic risks, such as the payment system, are also being considered; and |
| | • | | Broadening access to financial services for all. The National Treasury is planning a number of new interventions to ensure the accessibility of financial services to a greater reach of people. This includes taking forward the Financial Sector Charter process, supporting the development of Co-operative Banks and providing mechanisms for increased competition in the formal banking arena through dedicated banks and the introduction of deposit insurance. |
Structure of the Banking Industry
At the end of financial year 2012, 16 banks, three mutual banks and 14 local branches of foreign banks were registered with the Office of the Registrar of Banks. In addition, 41 foreign banks had authorised representative offices in South Africa.
The four largest banking groups dominating the South African banking sector are ABSA Bank Limited, the Standard Bank of South Africa Limited, FirstRand Bank Limited and Nedbank Limited. The four largest banks constituted 83.1% of total banking-sector assets at the end of August 2013. The four largest banks offer a wide range of services to both individual and corporate customers at branches across all nine provinces.
The South African banks remained profitable and adequately capitalised throughout 2012 and into 2013. Total stock of outstanding loans and advances in the banking sector increased by 10.6% to R2,927 billion as at August 31, 2013 from R2,647 billion as at August 31, 2013. Impaired advances to gross loans and advances, a key indicator of credit risk, has declined from a peak of 6.0% in November 2009 to 3.9% in August 2013. The capital adequacy ratio for the banking sector was 14.8% in August 2013 (after the implementation of Basel III capital requirements), exceeding the 9.5% minimum capital adequacy requirements and therefore indicating adequate systemic capitalisation. The banking sector’s capital consists mainly of share capital and reserves (the highest loss-absorbing capital).
71
Total banking sector assets increased from R3,559 billion at the end of August 2012 to R3,799 billion at the end of August 2013, representing a 6.8% increase. Annualised growth in total assets declined from double digit levels recorded during 2012, largely due to contractions in foreign currency derivative financial assets. Growth in loans and advances in the banking sector decreased significantly at the onset of the financial crisis, but has begun to return to pre-crisis levels.
Through the crisis, impaired advances rose sharply as households and businesses came under increasing financial strain. Credit risk, as measured by impaired advances to gross loans and advances, has declined since peaking in November 2009, largely due to declines in residential mortgage default exposures. Certain loan categories are, however, showing marginal increases in impaired advances since the beginning of 2013, namely the retail revolving credit category (which mostly consists of credit cards) and other retail categories (which include unsecured personal term loans). The sector has seen continually increasing specific and portfolio credit impairments since August 2013.
Financial Sector Charter
In August 2002, the financial sector voluntarily committed itself to developing a charter to address historical sector imbalances, particularly with reference to human resource development, broadening economic participation and access to financial services. Thereafter, key industry stakeholders came together to develop the Financial Sector Charter, which was launched by the industry and the Minister of Finance in October 2003. The Financial Sector Charter was built around a central vision of promoting a transformed, vibrant and globally-competitive financial sector that reflects the socioeconomic demographics of South Africa and contributes to the establishment of an equitable society by effectively providing accessible financial services to black people and directing investment into targeted areas in the economy.
The Financial Sector Charter established sector transformation goals, emphasising targets for human resource development, procurement and enterprise development, access to financial services and ownership transfer. In order to provide access to financial services, the country’s four major retail banks – ABSA, FirstRand, Nedbank and Standard Bank – as well as the Postbank, launched the Mzansi account in October 2004. Mzansi is a low-cost national bank account aimed at ensuring that those falling within the lower socio-economic groups have access to first-order retail banking products that would provide them with entry-level banking services. There have been approximately 6 million Mzansi accounts opened, 4.5 million of which were opened by South Africa’s four major commercial banks. It is estimated that 72% of these were first-time accounts. Major banks have since de-emphasised Mzansi and are promoting their own branded low-income accounts. The percentage of adult South Africans who use banking services has improved from 51% as at June 30, 2006 to 75% as at June 30, 2013.
In addition, the financial sector committed to ensuring that 80% of the population in lower income groups has access to full-service banking points of presence within at least 15 kilometres of every poor South African and cash-withdrawal points of presence such as automatic teller machines within at least 10 kilometres. By December 2010 91.6% of poor households had access to points of presence of banks and Postbank within 10 kilometres of their home. This percentage was 84.7% if only the big four banks are considered.
In addition, a framework has been developed for extending R42 billion in housing finance on favourable terms to households largely excluded from the mortgage market until now. The Financial Sector Charter Council’s (Council) 2008 Annual review (the most recent review that has been completed) indicates that as at December 31, 2008, the financial sector originated over R45.7 billion in low-income housing loans.
One of the principal sector transformation goals of the Financial Sector Charter relates to targets of ownership transfer. The Financial Sector Charter required that each financial institution must transfer 25% ownership to historically disadvantaged South Africans, including 10% through direct ownership transfers, by 2010. As of the end of 2008, the average direct ownership percentage of historically disadvantaged South Africans was 23.3%.
Through the Financial Sector Charter, over R200 billion has been invested in the South African economy since 2005. The financial sector has also invested over R101 billion through BBBEE financing in other sectors of the economy, including vendor-financed ownership deals in the financial sector itself.
Since 2008, the Council, which had been constituted to oversee implementation of the Financial Sector Charter from 2004, has been in the process of renegotiating and redrafting the Financial Sector Charter to become the the Financial Sector Code to be in alignment with the Codes of Good Practice, which provide a standard framework for the measurement of BBBEE. A two-year stalemate regarding the equity ownership issue has been broken and the draft Financial Sector Code, which represents not only an agreement on the ownership but also provides updated targets and places a greater focus on the low-income segment, was gazetted in March 2013.
72
Credit Allocation
Growth in total banking sector loans and advances extended to the private sector by the banking sector slowed considerably from the middle of 2007 and reached an annual record low of negative 1.6% in November 2009, as lending and borrowing conditions became unfavorable. Tightening in monetary policy increased the debt-service costs for an already indebted private sector. Lending standards for the household sector were raised in accordance with the National Credit Act, while recently, household balance sheets began to be undermined by stagnant real estate prices and increasingly volatile financial markets. Consumer purchasing power was also eroded by inflation. The deteriorating economic climate was evident in weakening business and consumer confidence. Annual growth in installment sale and leasing finance as well as other loans and advances decelerated and recorded negative rates from April and May 2009, respectively. Growth in total banking sector loans and advances slowed over the past two years as a result of a cumulative 500 basis points increase in interest rates since the beginning of 2006. As indicated below, credit exposure to the public sector is small in comparison to that of the private sector. Tentative evidence of a recovery in credit extension emerged towards the end of 2009 when year-on-year growth in total loans and advances picked up from a nadir of minus 1.6% in November and gained further momentum thereafter to reach a positive growth rate of 4.7% in January 2011. Between February and September 2011 growth in total loans and advances fluctuated between 5% and 6%, constrained by high household indebtedness, the slow recovery in job creation and weaker working capital requirements of the non-financial corporate sector. Growth recovered to 9.2% in March 2012 and reached a recent peak of 10.0% in December 2012. During the first nine months of 2013 growth in total loans and advances fluctuated around a more subdued pace of between 8% and 9%, broadly aligned with the rate of growth in nominal gross domestic product and expenditure. Growth in other loans and advances, as well as installment sale and leasing finance which turned positive in August and September 2010 respectively surpassed growth in mortgage advances during 2011 and the first nine months of 2012. Growth in mortgage advances, which remained positive during the economic downturn, has been fluctuating between 1.6% and 2.6% between August 2011 and September 2013, consistent with the sluggish levels of activity observed in the residential and commercial property sectors.
Percentage distribution of total credit extended (as of June 30, 2013)
| | | | |
| | | Percentage distribution of total
gross credit exposure of banks | |
| | | % | |
Corporate exposure | | | 33.1 | |
Public sector entities | | | 1.3 | |
Local government and municipalities | | | 0.6 | |
Sovereign (including central government and central bank) | | | 7.2 | |
Banks | | | 14.5 | |
Securities firms | | | 3.6 | |
Retail exposure | | | 38.9 | |
Securitisation exposure | | | 1.0 | |
Source: SARB BA210 Credit Risk Surveys, June 2013.
73
Total loans and advances to the domestic private sector consist of installment sale credit, leasing finance, mortgage advances, overdrafts, credit card and general advances. The first three categories are referred to as asset-backed credit, while the last three categories together are referred to as other loans and advances.
The National Credit Act was fully implemented on June 1, 2007, with the aim of facilitating access to credit while preventing over-indebtedness and reckless lending in the credit market.
The following table sets out a sector classification of gross credit exposure at the end of June 2013.
Sectorial and geographic distribution of bank gross credit exposure as of June 30, 2013
| | | | | | | | |
Sectorial distribution of credit | | Rand (billion) | | | As a percentage of total
credit | |
Agriculture, hunting, forestry and fishing | | | 67.9 | | | | 1.5 | |
Mining and quarrying | | | 183.4 | | | | 4.0 | |
Manufacturing | | | 210.6 | | | | 4.6 | |
Electricity | | | 51.7 | | | | 1.1 | |
Construction | | | 67.9 | | | | 1.5 | |
Wholesale, retail trade and accommodation | | | 211.5 | | | | 4.6 | |
Transport and communication | | | 152.9 | | | | 3.3 | |
Financial intermediation and insurance | | | 1,119.1 | | | | 24.2 | |
Real estate | | | 230.5 | | | | 5.0 | |
Business services | | | 164.0 | | | | 3.6 | |
Community, social and personal services | | | 284.5 | | | | 6.2 | |
Private households | | | 1,628.0 | | | | 35.3 | |
Other | | | 246.2 | | | | 5.3 | |
| | | | | | | | |
Total | | | 4,618.1 | | | | 100.00 | |
| | | | | | | | |
| | | | | | | | |
Geographical distribution of credit | | Rand (billion) | | | As a percentage of total
credit | |
South Africa | | | 4,028.4 | | | | 87.2 | |
Other African countries | | | 87.1 | | | | 1.9 | |
Europe | | | 361.3 | | | | 7.8 | |
Asia | | | 48.4 | | | | 1.0 | |
North America | | | 73.7 | | | | 1.6 | |
South America | | | 12.6 | | | | 0.3 | |
Other | | | 7.1 | | | | 0.2 | |
| | | | | | | | |
Total | | | 4,618.1 | | | | 100.00 | |
| | | | | | | | |
Source: SARB BA210 Credit Risk Surveys, June 2013.
74
Capital Markets
The JSE was established in 1887 and is South Africa’s only licensed exchange for all securities. The JSE is governed externally by South African legislation and internally by its own rules and regulations. The JSE listed itself on June 5, 2006. The listing included a proposal regarding the implementation of a BBBEE initiative. In February 2011, the JSE launched the Black Economic Empowerment (BEE) Board, offering a facility for BEE-compliant parties to list and trade BEE scheme shares. Only one BEE share scheme has thus far been listed.
The introduction of the Johannesburg Equities Trading system (JET), an electronic, automated and central order-driven system, culminated in the closure of the trading floor in 1996. Subsequently, the trading system and real-time information dissemination system (InfoWiz) of the London Stock Exchange (LSE), replaced JET in May 2002. In calendar year 2007 the JSE and the LSE both moved onto the LSE’s new trading platform, TradElectTM. JSE members connected to JSE TradElectTM and InfoWiz through a hub at the JSE in South Africa. In July 2012 the JSE moved its equity market trading activity onto Millennium ExchangeTM after concluding a licence agreement with technology solutions provider MillenniumIT. Consequently, the JSE’s trading system relocated from London to Johannesburg.
In June 2003 the JSE announced the first alternative “exchange” in Africa that would list small and medium sized companies, specifically targeting BBBEE and junior mining companies. The Alternative Exchange (AltX) opened in October 2003 and runs parallel to the main exchange, with separate listings requirements and reduced fees. As of September 30, 2013, 58 companies were listed on AltX with a market capitalisation of R15.7 billion.
The South African Futures Exchange (SAFEX) is the forum for trading futures and options contracts. The JSE acquired SAFEX in August 2001 and merged it into the JSE as the Equity Derivatives Division and the Commodity Derivatives Division. Colloquially, the term “SAFEX” is still used to refer to the JSE’s derivatives market. In February 2005 the JSE launched Yield-X, which is the platform for trading of all interest rate-related and currency derivative products. Subsequent to the BESA merger, Yield-X has been collapsed into the JSE’s Interest Rate and Currency Derivatives Markets.
Regulation of insider trading is vested in the FSB, which has extensive surveillance and detection capability and was established in partnership with the JSE.
Since 1995, the JSE has permitted limited liability corporate memberships and has phased out citizenship requirements for members of the JSE. Several banks, both domestic and international, have acquired or established stock-brokering businesses as members of the JSE. Stockbrokers are required to meet stringent capital adequacy requirements and to keep client funds in trust accounts separate from the stockbroker’s own funds. The Stock Exchange Guarantee Fund was established to protect investors and may be used to discharge certain liabilities of members relating to the buying and selling of securities.
Since 1999, companies have been permitted to buy back their own shares and are required to disclose security interests, directors’ pensions and compensation, and in the case of public companies, to appoint a secretary. Legislation restricts objectionable advertising and canvassing relating to securities.
In 2009 the requirement for auditors of listed companies to register with the JSE was changed to a system of accreditation, and registration for the purpose of providing audit and advisory services is now administered by the IRBA. The JSE implemented a dark pool block-trading system, Block X, in July 2010 which aims to ensure that large share trades do not have an impact on prices. They also introduced an online financial reporting portal in June 2010 called the ‘eXtensible Business Reporting Language’ to enable companies to file their financial reports according to a global electronic reporting standard.
In the 2011 MTBPS, the Minister of Finance announced that all inward-listed shares on the JSE will henceforth be classified as domestic assets and are eligible for inclusion in the JSE indices.
The JSE implemented a methodology change to the FTSE/JSE Africa Index Series with effect from 15 March 2013, in line with a global change to index methodology applied by the FTSE Group. The indices are now constructed with individual share prices weighted according to actual free float rounded up to the next 1 per cent, rather than with a banded free float.
Pursuant to the amalgamation of the BESA and the JSE in June 2009, it has been resolved that the trading platforms of the two interest rate markets operated by the JSE, namely the Yield-X market and the BESA market, will be integrated in 2011. As a result, the old BESA BTB system was decommissioned and the reporting of bond transactions migrated onto the JSE Nutron platform on May 9, 2011. The rules and directives covering the integrated markets (Yield-X and BESA) known as the ‘JSE Interest Rate and Currency (IRC) rules and directives’ also came into effect on May 9, 2011, thus repealing the old rules and directives previously applicable to the BESA market.
The JSE closed its Africa Board in May 2012 when the two remaining listings were incorporated into the main board.
75
On March 25, 2013, the JSE published additional listing requirements which make provision for the listing of a special purpose acquisition company (SPAC).
The following table sets forth the market capitalisation and number of companies listed on the equity market of the JSE as well as the trading volumes and values for the period indicated.
JSE
| | | | | | | | | | | | | | | | | | | | | | | | |
| | | As of December 31, | | | As of
September 30, | |
| | | 2008 | | | 2009 | | | 2010 | | | 2011 | | | 2012 | | | 2013 | |
Market capitalisation(1) | | | 4,541.9 | | | | 5,929.1 | | | | 6,698.7 | | | | 6,908.5 | | | | 8,383.6 | | | | 9,565.3 | |
Trading volume(2) | | | 83,778 | | | | 82,855 | | | | 71,252 | | | | 71,464 | | | | 61,844 | | | | 49,917 | |
Trading values(3) | | | 3,263,065 | | | | 2,796,077 | | | | 2,990,123 | | | | 3,286,828 | | | | 3,431,584 | | | | 3,082,132 | |
Listed companies(4) | | | 425 | | | | 410 | | | | 407 | | | | 406 | | | | 400 | | | | 384 | |
Notes: —
| (1) | In billions of Rand at end of period. |
| (2) | In millions of shares traded. |
| (4) | Actual figures at the end of period. |
Source: JSE.
According to the World Federation of Exchanges, the JSE was the 19th largest stock exchange in the world, in terms of market capitali, as of August 31, 2013.
The market capitali of the JSE at the end of September 2013 was R9,565.3 billion. In the first nine months of 2013, the total value of share capital raised by companies listed on the JSE was R62.3 billion, an increase of R8.4 billion compared with the first nine months of 2012. Turnover of shares listed on the JSE amounted to R3,431.6 billion in 2012 and R3,082.1 billion in the first nine months of 2013 (32% of market capitali as of September 30, 2013). Around 49 foreign companies which have their primary listing on other exchanges maintain a secondary listing on the JSE, such as Anglo American Plc and Old Mutual Plc. New listings in recent months include GoGlobal Properties and Giyani Gold Corporation. Non-residents made net purchases of local shares amounting to R27.0 billion in the first nine months of 2013, as compared with net sales of R4.4 billion in the corresponding period of 2012. On average, non-resident participation in the secondary share market of the JSE has accounted for 16% of the value of all shares traded in the nine months to September 2013. Annualised liquidity on the JSE declined from 44.8% in September 2012 to 43% in September 2013, while the closing value of the All-Share Price Index on the JSE increased by 23% over the same period. In the nine months to September 2013, 20 de-listings and four new listings contributed to the 613 companies that have de-listed from the JSE compared with only 329 new listings since 1999.
The main index charting the performance of the JSE is the FTSE/JSE Africa All-Share Price Index. At September 30, 2013, the FTSE/JSE All-Share Price Index included 165 companies and accounted for approximately 60% of the market capital of the JSE. As at September 30, 2013, the ten largest companies by market capitalisation represented approximately 51% of total market capitalisation.
The nominal value of turnover in the bond market in the nine months to September 30, 2013 was approximately R15,897 billion. The turnover in the secondary bond market in 2012 was R22,786 billion, compared with R20,879 billion in 2011 and R16,901 billion in 2010. Non-residents’ net purchases of South African bonds amounted to R17.5 billion in the first nine months of 2013, compared with net purchases of a marked R78.0 billion in the corresponding period of 2012. Although at a slower pace, non-resident investors continued to show interest in South African bonds in 2013, boosted by their search for yield. The non-resident participation rate in the domestic secondary bond market declined from 12% in 2011 to 11% in 2012, and continued to decrease to an average of 10% in the first nine months of 2013.
Derivative instruments are traded either on an over-the-counter basis or on an exchange. The Equity and Commodity Derivatives Markets of the JSE, together with the Interest rate and Currency Derivatives Markets are responsible for trade in all futures contracts and options on futures. SAFEX Clearing Company (Pty) Limited (Safcom) is the clearing house for SAFEX and also provides compliance, surveillance and other exchange services. SAFEX introduced commodity futures in South Africa in July 1995, Rand-Dollar futures in May 1997, and individual equity futures in February 1999. On June 18, 2007 the JSE began trading in various foreign currency derivatives. Financial market infrastructure was modernised through the replacement by the JSE of its 15-year-old derivatives system with a multiple instrument online trading system, Nutron, in 2008.
76
Safcom achieved a global standard of risk management by complying with the CPSS-IOSCO principles for financial market infrastructures (published by the Bank for International Settlements) in December 2012. In March 2013 Safcom announced the promulgation of further rules relating to the establishment of a derivatives market default fund. As trading activity in the Equity Derivatives Market increased in the first nine months of 2013, turnover was also higher compared with the corresponding period in 2012. While trade in single-stock contracts (including IDX products) accounted for 3% of total turnover by value in the first nine months of 2013, they accounted for 41% of total number of contracts traded. Turnover in commodity futures and options contracts declined by 2% in the nine months to September 2013, compared with the same period in 2012, along with generally lower domestic and international grain prices. Turnover in derivatives traded on the JSE for the first nine months of 2013 is indicated in the accompanying table.
Derivatives turnover on the JSE, January to September 2013
| | | | | | | | |
| | | Value | | | Change over one year | |
| | | Rand (billions) | | | Percentage | |
Equity derivatives | | | 3,796 | | | | 19 | |
Warrants | | | 0.4 | | | | (10 | ) |
Commodity derivatives | | | 376 | | | | (2 | ) |
Interest rate derivatives | | | 390 | | | | 66 | |
Currency derivatives | | | 267 | | | | 148 | |
Source: JSE.
Exchange Controls
South African law provides for exchange controls, which, among other things, restrict the outward flow of capital from South Africa, the Kingdoms of Lesotho and Swaziland and the Republic of Namibia, known as the common monetary area (CMA). The Exchange Control Regulations are applied throughout the CMA and regulate transactions involving South African residents, including companies and institutional investors. The basic purpose of the Exchange Control Regulations is to mitigate the negative effects caused by a decline of foreign capital reserves in South Africa, which could result in the devaluation of the Rand. The National Government has, however, committed itself to gradually relaxing exchange controls. On November 1, 2010 the Exchange Control Voluntary Disclosure Programme was implemented for a period of 12 months. The primary objective was to encourage applicants to disclose their contraventions and to provide them with a window of opportunity to regularise any contraventions of the Exchange Control Regulations.
The SARB, on behalf of the Minister of Finance, administers South Africa’s exchange control regulations. It is assisted by a number of banking institutions that have been appointed by the Minister of Finance as Authorised Dealers in foreign exchange (Authorised Dealers) and/or Authorised Dealers in foreign exchange with limited authority (ADLAs). Such banking institutions undertake foreign exchange transactions for their own account with their clients, subject to conditions established by the SARB. Until 1995, control over non-residents’ capital transactions was based mainly on the Financial Rand System, which was reintroduced in 1985 at the time of the proclamation of the debt standstill. In March 1995, the National Government abolished the Financial Rand System and the resulting dual exchange rate. No capital controls are, therefore, applied to non-residents, who may freely invest in and disinvest from South Africa. This applies to portfolio investment as well as foreign direct investment into South Africa.
Since the abolition of the Financial Rand System in 1995, South Africa has had a unitary exchange rate that applies to both current and capital transactions between residents and non-residents. As discussed below, South African residents still face certain restrictions. However, these restrictions have gradually been eased to foster macroeconomic stability, a stronger balance of payments and financial sector development. The proposed strategy going forward is characterised by a fundamental shift from a system where a substantial fraction of cross-border transactions are subject to restrictions, approvals and administrative requirements to a more open regime where transactions are generally permitted with a narrow set of regulations targeted at specific national interests, macroeconomic and financial risks.
The broad principles for exchange control reforms are as follows:
| | • | | Support the overarching strategy for increasing investment and growth; |
| | • | | Reflect a fundamental shift in the approach to regulation; |
77
| | • | | Recognise the different objectives that are supported by exchange controls (e.g. contributing to systemic stability; supporting prudential regulation of financial institutions; protecting the tax base; and supporting the prevention of financial crime); |
| | • | | Address the distortions created by exchange controls; |
| | • | | Holistic approach and taking into account interactions between institutions and individuals, residents and non-residents; and |
| | • | | Proportionate reporting requirements. |
The present exchange control system in South Africa is used primarily to control movements of capital by South African residents. In order to ensure that capital transfers are not disguised as current payments, controls and limits are placed on transfers of a current nature, such as the single discretionary allowance of up to R1 million per annum that may be apportioned for travel for vacation and business purposes, study allowances, donations to missionaries, maintenance transfers, monetary gifts/loans to non-residents and residents temporary abroad, alimony and child support payments, wedding expenses and special occasions and foreign capital allowance (without the requirement to obtain a Tax Clearance Certificate). In addition, private individuals may invest up to R4 million per calendar year for any purpose outside the CMA, provided that the individual is over the age of 18 years and subject to obtaining a Tax Clearance Certificate, which is issued by the South African Revenue Service.
Furthermore, in order to eliminate the bias against residents, the South African Reserve Bank’s Financial Surveillance Department will consider investments by residents in excess of the R4 million foreign capital allowance, subject to certain conditions, such as tax compliance and annual reporting.
The Minister of Finance also announced the removal of controls on emigrants’ blocked assets. South African emigrants were previously allowed to remit up to R4 million per single person or R8 million per family unit upon emigration. Emigrants can now transfer the allowance per calendar year and emigrants can also apply to the Financial Surveillance Department for the transfer of all their assets without any exit levy applying to free those assets, provided their tax obligations were met.
With effect from October 2004, limits on foreign direct investments by South African corporates were abolished. Dividends declared by offshore subsidiaries of South African companies after October 26, 2004 may be retained offshore. Foreign dividends repatriated to South Africa after October 26, 2004 may be retransferred offshore again at any time for any purpose. Corporates are allowed, on application, to transfer funds from South Africa for each new and approved foreign investment outside the CMA. Authorised Dealers administer the directives and guidelines on foreign direct investments under R500 million. Application to the SARB’s Financial Surveillance Department for prior approval of a foreign investment is still required for foreign direct investments over R500 million. These applications, which permit the SARB to monitor the level of foreign investment, are considered on merit and are granted if South African exchange control authorities believe the investments would be of long-term economic benefit to South Africa and at least 10% of the foreign target entity’s voting rights must be obtained. The SARB reserves the right to stagger capital outflows relating to very large foreign investments to manage any potential impact on the foreign exchange market. In order to reduce the administrative costs and procedures of doing business for corporates, the Minister of Finance, in the 2011 MTBPS, allowed corporates to be able to top up capital in their offshore business from South Africa, provided the additional funding is authorised within the same calendar year in which the original investment was approved and as long as they remain within the annual limit of R500 million. South African corporates are also allowed to make bona fide new outward foreign direct investments outside their current line of business.
In the 2009 MTBPS, reforms to reduce red tape on business transactions were announced. The prohibition on SADC loop structures was abolished and recently, in the 2011 MTBPS, the Minister of Finance announced that transactions which result in ‘loop’ structures not exceeding a threshold of 10% - 20% equity, and/or voting rights, whichever is higher, in the foreign target entity, will be processed by Authorised Dealers without the need for prior approvals.
In the 2010 MTBPS, the Minister of Finance announced measures to encourage global diversification from a domestic base by using South Africa as a gateway to Africa. In this regard, from January 1, 2010, qualifying internationally headquartered companies are allowed to raise and deploy capital offshore without the need to obtain exchange control approval, subject to reporting requirements. With effect from November 2012, the shares and/or debt of a headquarter company may be listed on the JSE Limited or be held directly or indirectly by a shareholder with shares or debt listed on the JSE Limited.
The 3:1 ratio applicable to local financial assistance in respect of affected persons was withdrawn. The 1:1 ratio remains applicable for the acquisition of residential properties and any other financial transactions (such as portfolio investments, securities lending, hedging and repurchase agreements, among others) by non-residents and affected persons. Local financial assistance made available to emigrants also remains subject to the 1:1 ratio.
Authorised Dealers are allowed to approve the granting of credit terms in respect of exports only for periods not exceeding six months, with an extension of a further six months in certain circumstances without reference to the SARB. In an endeavor to reduce barrier to trade, the Minister allowed corporates to do advance payments for capital goods for up to 100% of ex-factory cost of goods to be imported not exceeding a total value of R10 million. Payments for importation of capital goods in excess of R10 million may only be provided up to 50% of the ex-factory cost of the goods to be imported. Furthermore, corporates are allowed to cover forward (using forward exchange contracts) up to 75% of budgeted import commitments or export accruals in
78
respect of the forthcoming financial year without an application to the SARB. The R250,000 limit on advance payments for permissible imports, other than capital goods, was removed and South African companies are allowed to open foreign bank accounts for permissible purposes without prior approval, subject to reporting obligations.
South African companies involved in international trade are permitted to operate a single customer foreign currency (CFC) account for both the trade and services and use it for a wider variety of permissible transactions. This reduced the transaction costs associated with multi CFC accounts and their restricted use.
Corporates engaged in exportation and importation has been permitted to offset costs of imports against proceeds from exports within a specified period over a CFC account. The requirement that companies must convert foreign exchange credited to CFC account to Rand within 180 days was removed. South African companies are, however, still required to repatriate export proceeds to South Africa.
Various measures aimed at easing certain of the country’s remaining exchange control regulations became effective in the late 1990s. The measures included abolishing most of the remaining quantitative limits on current account transactions; permitting South African institutions to invest funds abroad; permitting trading of Rand-dollar futures contracts on SAFEX, with participation initially restricted to individuals and institutional investors; and relaxing the application of local borrowings limits to foreign controlled South African companies.
Retirement funds and underwritten policies of long-term insurers are permitted, without prior SARB approval, to invest up to 25% of their total retail assets under management in foreign assets and an additional 5% in Africa. Collective investment scheme management companies, investment managers registered as institutional investors for exchange control purposes and investment-linked business of long-term insurers are permitted to invest up to 35% of their total retail assets under management in foreign assets and an additional 5% in Africa.
The macro-prudential limit for Authorised Dealers was introduced in 2010 and enabled Authorised Dealers to acquire direct and indirect foreign exposure of up to a macro-prudential limit of 25% of their total liabilities excluding total shareholder’s equity.
In the 2013 Budget Speech, the Minister of Finance announced that Authorised Dealers may invest an additional 5% of their total liabilities, excluding total shareholder’s equity, for expansion into Africa, in addition to the current macro-prudential limit of 25%.
Foreign companies, governments and institutions are permitted to list equity, bond and derivative instruments on South Africa’s securities exchanges. Furthermore, South African private individuals, corporates, trusts and partnerships are permitted to invest without restrictions in approved inward listed instruments on South African exchanges.
In the 2011 MTBPS, the Minister of Finance announced further significant reforms of inward listings in order to promote the development of the South African capital markets. The Minister announced that all listed shares on the JSE, traded and settled in Rand, will be classified as domestic assets for the purpose of trading on the JSE and inclusion in its indices. This new dispensation does not affect companies currently classified as domestic, which have a primary listing on a foreign exchange (e.g. the ‘London 5’), which will continue to be included in the indices on the current basis. This initiative is meant to improve South Africa’s position as a financial gateway into Africa. However, in order to balance between capital market growth and development and the objective of managing exposure to foreign risk, prudential institutions would still be required to report their foreign exposure to regulatory authorities.
These changes also herald a shift in the regulatory regime from control measures to prudential regulation.
The restrictions on South African companies and other entities to participate in foreign inward-listed securities on the JSE, including participation in the Rand futures, were removed. These changes enable South African companies, trusts, partnerships and banks to manage their foreign exposure, since they were permitted to participate in Rand futures market on the JSE without restrictions. These changes allow companies to diversify and hedge their currency exposure, which support macroeconomic stability, reduce exchange-rate volatility and deepen domestic financial markets. This dispensation was also extended to investment in inward-listed (foreign) instruments on the JSE and the Bond Market of the JSE.
Furthermore, the Minister of Finance allowed the JSE Limited to offer to non-resident and qualifying South African and other CMA corporate entities directly and actively involved in the agricultural grain industry, Zambian referenced grain derivative contracts for trading and settlement in USD.
To promote SA further as a hub for regional investments, since February 27, 2013 listed entities on the JSE Limited were allowed to establish one subsidiary in South Africa to hold African and offshore operations, which will be granted certain tax and foreign exchange dispensations.
In an effort to promote competition and reduce the cost of remittances to neighboring and other countries, ownership restrictions on international participation in Authorised Dealers in foreign exchange with limited authority (ADLAs) (i.e., foreign exchange bureaus) were removed. In addition to this, the requirement for money remittance agencies to partner with existing Authorised Dealers in order to do remittance work will no longer be obligatory.
79
Gold and Foreign Exchange Contingency Reserve Account (GFECRA)
GFECRA reflects the Rand currency and gold price valuation profits and losses on all transactions which the SARB had entered into in terms of the SARB Act on behalf of the National Treasury. The GFECRA comprises credit and debit balances on three different accounts: a gold price adjustment account (GPAA); a foreign exchange adjustment account (FEAA); and a forward exchange contracts adjustment account (FECAA).
The GPAA reflects any valuation profit or loss on the gold held by the SARB. The volume of the gold holdings has been fairly static over the past decade at around four million fine ounces. The FEAA account reflects any profit or loss on assets of the SARB-denominated in currencies other than the Rand as a result of depreciation or appreciation, as the case may be, of the Rand against the currency of such assets. In terms of the SARB Act, the SARB can calculate an exchange commission on all foreign exchange transactions conducted on behalf of the National Treasury. This commission or exchange margin is also reflected in the FEAA.
The FECAA reflects profits or losses on any forward exchange contract entered into by the SARB, valuation profits and losses on foreign exchange liabilities of the SARB, and any profit or loss due to changes in the value of the Rand against the currency of the United States on certain agreements for the reinsurance of export contracts. Since early 1997, the SARB has terminated the extension of forward cover with respect to future external commitments.
During the 1980s and 1990s, the SARB intervened in the foreign exchange market via the forward book. This policy was abandoned in August 1998. Currently, the SARB purchases foreign exchange from the Authorised Dealers to accumulate reserves when market conditions allow. However, the SARB does not intervene in the foreign exchange market with a view to influence the value of the Rand.
Prior to calendar year 2002, upon the agreement of the Minister of Finance and the Governor of the SARB, the balance of the GFECRA could be reduced through the National Government to the SARB by the issuance of zero-coupon bonds convertible into interest-bearing bonds in situations where the SARB wants to use the bonds in its open market operations. With respect to the GFECRA balance on March 31, 2002, and in accordance with the Gold and Foreign Exchange Contingency Reserve Defrayal Act, the National Treasury settled the negative balance amounting to R28.0 billion in four tranches, partly in cash and partly in bonds, over a four-year period that commenced in 2003. The National Treasury paid the final tranche of the outstanding balance of R28 billion in April 2005.
In 2005, a new methodology for the settlement of GFECRA balances was agreed between the National Treasury and the SARB. Under this new settlement methodology, the balance on the GFECRA as of March 31 each year is split into transactions with a cash flow (money market liquidity) impact and a non-cash flow (revaluation) component. Valuation gains and losses are not settled but reflected, either as an asset or as a liability on the financial statements of the two institutions. As a result, only transactions with a cash flow impact are settled. The outstanding balance to be settled accumulates interest at the prevailing repurchase rate. The gross gold and foreign exchange reserves decreased to US$50 billion at the end of September 2013, down from US$51 billion a year earlier. This decline is mainly as a result of a decline in the U.S. Dollar gold price, the depreciation of the U.S. Dollar against other major currencies and the normal foreign exchange operations of the SARB.
As at March 31, 2012, the GFECRA showed a positive balance of R67.7 billion, which represents the net of valuation gains of R67.8 million and cash flow losses of R150.4 million. These cash flow losses were settled on June 29, 2012. As at March 31, 2013, the GFECRA balance had increased to R125.6 billion, mainly due to the depreciation of the exchange rate of the Rand over the period. Cash flow losses to be settled by the National Government amounted to R28.1 million for the year to March 31, 2013.
The negative net open foreign currency position of the SARB amounted to US$23.2 billion in September 1998, which then changed from negative to positive in May 2003. The net open foreign currency position, which is now referred to as the International Liquidity Position, reflected a positive balance of US$48.7 billion at the end of September 2012, declining to US$45.8 billion as at September 30, 2013.
In February 2004, the SARB balanced its previously oversold forward foreign exchange book, eliminating a key source of external vulnerability and pressure on money market operations. With a reduced need for the sterilisation of excess liquidity arising from maturing forward contracts, the SARB has normalised its money market activities and has been able to increase the official net international reserves of the country. The SARB currently has an overbought (positive) forward foreign exchange book.
80
THE EXTERNAL SECTOR OF THE ECONOMY
Foreign Trade
South Africa’s imports and exports (including gold) amounted to 53.5% of GDP in real terms in the first half of 2013.
In the first half of 2013, import volume and prices rose by 7.1% and 7.3%, respectively, compared to the same period in 2012. Export volumes and prices increased by 6.4% and 7.3%, respectively, in the first half of 2013 compared to the previous period.
In nominal terms, exports increased by 11.7% in the first seven months of 2013 compared to the same period last year, driven mainly by the marginal improvement in terms of trade, the depreciation in the Rand exchange rate, the increased demand from the African markets and the recovery in exports to some European countries and China.
Since the recession in 2009, domestic demand has grown at a faster pace than external demand, resulting in a stronger increase in import volumes relative to exports and a deterioration of the trade balance. The volume of imports is now almost 12% above pre-crisis highs, while exports are still 6.3% below their highs prior to the crisis.
Some of the factors that contributed to the recent decline in export volume are domestic supply constraints, including electricity rationing in manufacturing, and severe disruptions to mining output due to industrial action and wage disputes.
Export prices, excluding gold, rose 8.5% in the first half of 2013, compared with the same period a year earlier, while import prices increased by 7.3%. As at June 30, 2013, the terms of trade have declined by almost 5.7% since their peak in the third quarter of 2010.
As a consequence, the trade balance has shifted to a substantial deficit, reaching R107.3 billion in the year to August 2013 – its highest level since the 1990s. This is significantly higher than the deficit since the crisis, which averaged 1% of GDP in 2010 and 0.6% of GDP in 2011.
The following table sets forth South Africa’s balance of trade for the periods indicated.
Balance of Trade
| | | | |
Year | | Balance of Trade | |
| | | Rand (billion) | |
2008 | | | (71.6 | ) |
2009 | | | (27.3 | ) |
2010 | | | (4.8 | ) |
2011 | | | (16.9 | ) |
2012 | | | (117.7 | ) |
20131 | | | (75.9 | ) |
Note: —
81
The following table presents a breakdown of South Africa’s balance of trade by sector for the periods indicated.
Foreign Trade
| | | | | | | | | | | | | | | | | | | | | | | | |
| | | Year ended December 31, | |
| | | Rand (billion) | |
Sector | | 2008 | | | 2009 | | | 2010 | | | 2011 | | | 2012 | | | 2013² | |
Exports | | | | | | | | | | | | | | | | | | | | | | | | |
Total merchandise exports | | | 637.8 | | | | 507.7 | | | | 580.1 | | | | 691.6 | | | | 700.9 | | | | 372.0 | |
Agriculture, forestry & fishing | | | 23.4 | | | | 22.3 | | | | 22.1 | | | | 28.0 | | | | 29.0 | | | | 19.6 | |
Total: Mining | | | 111.5 | | | | 97.1 | | | | 121.2 | | | | 165.2 | | | | 168.7 | | | | 90.4 | |
Coal mining | | | 39.1 | | | | 35.7 | | | | 40.1 | | | | 53.8 | | | | 57.4 | | | | 25.7 | |
Gold & uranium ore mining | | | 0.0 | | | | 0.0 | | | | 0.0 | | | | 0.0 | | | | 0.0 | | | | 0.0 | |
Other mining | | | 72.3 | | | | 61.4 | | | | 81.1 | | | | 111.4 | | | | 111.3 | | | | 64.8 | |
Total: Manufacturing | | | 501.5 | | | | 387.1 | | | | 435.2 | | | | 495.6 | | | | 500.1 | | | | 259.9 | |
Food | | | 15.3 | | | | 16.8 | | | | 17.5 | | | | 17.5 | | | | 20.0 | | | | 10.9 | |
Beverages | | | 8.6 | | | | 8.6 | | | | 8.5 | | | | 8.1 | | | | 9.0 | | | | 5.3 | |
Tobacco | | | 0.9 | | | | 1.5 | | | | 1.4 | | | | 1.1 | | | | 1.5 | | | | 0.7 | |
Textiles | | | 2.7 | | | | 2.4 | | | | 2.3 | | | | 2.4 | | | | 2.5 | | | | 1.4 | |
Wearing apparel | | | 1.0 | | | | 0.7 | | | | 0.6 | | | | 0.7 | | | | 0.8 | | | | 0.5 | |
Leather & leather products | | | 0.7 | | | | 0.4 | | | | 0.5 | | | | 0.8 | | | | 0.9 | | | | 0.7 | |
Footwear | | | 0.2 | | | | 0.2 | | | | 0.4 | | | | 0.2 | | | | 0.3 | | | | 0.1 | |
Wood & wood products | | | 3.2 | | | | 2.2 | | | | 2.4 | | | | 2.4 | | | | 2.3 | | | | 1.2 | |
Paper & paper products | | | 11.2 | | | | 9.6 | | | | 10.3 | | | | 10.8 | | | | 10.3 | | | | 5.6 | |
Printing, publishing & recorded media | | | 1.1 | | | | 0.7 | | | | 0.7 | | | | 0.8 | | | | 0.7 | | | | 0.3 | |
Coke & refined petroleum products | | | 16.3 | | | | 12.9 | | | | 11.8 | | | | 13.8 | | | | 18.7 | | | | 9.3 | |
Basic chemicals | | | 35.8 | | | | 23.8 | | | | 26.5 | | | | 31.6 | | | | 34.0 | | | | 18.2 | |
Other chemicals | | | 10.4 | | | | 9.4 | | | | 9.1 | | | | 11.2 | | | | 13.8 | | | | 6.7 | |
Rubber products | | | 2.6 | | | | 2.1 | | | | 2.0 | | | | 3.0 | | | | 3.1 | | | | 1.5 | |
Plastic products | | | 2.8 | | | | 2.3 | | | | 2.4 | | | | 2.8 | | | | 3.2 | | | | 1.7 | |
Glass & glass products | | | 0.8 | | | | 1.1 | | | | 1.0 | | | | 1.0 | | | | 1.0 | | | | 0.6 | |
Non-metallic minerals | | | 2.0 | | | | 1.6 | | | | 1.8 | | | | 2.2 | | | | 2.1 | | | | 1.1 | |
Basic iron & steel | | | 79.9 | | | | 48.6 | | | | 60.2 | | | | 60.7 | | | | 56.6 | | | | 27.0 | |
Basic non-ferrous metals | | | 147.5 | | | | 127.0 | | | | 151.3 | | | | 176.0 | | | | 154.4 | | | | 79.4 | |
Metal products excluding machinery | | | 10.6 | | | | 8.3 | | | | 8.8 | | | | 9.3 | | | | 11.5 | | | | 5.2 | |
Machinery & equipment | | | 44.9 | | | | 29.5 | | | | 32.5 | | | | 40.9 | | | | 43.9 | | | | 22.5 | |
Electrical machinery | | | 6.6 | | | | 5.0 | | | | 5.1 | | | | 6.7 | | | | 7.5 | | | | 3.5 | |
Television, radio & communication equipment | | | 4.0 | | | | 3.3 | | | | 2.8 | | | | 3.4 | | | | 3.4 | | | | 1.8 | |
Professional & scientific equipment | | | 3.5 | | | | 3.6 | | | | 2.9 | | | | 3.6 | | | | 4.5 | | | | 1.8 | |
Motor vehicles, parts & accessories | | | 65.9 | | | | 43.8 | | | | 50.5 | | | | 56.5 | | | | 63.9 | | | | 35.7 | |
Other transport equipment | | | 3.5 | | | | 2.5 | | | | 2.3 | | | | 4.6 | | | | 4.2 | | | | 2.4 | |
82
| | | | | | | | | | | | | | | | | | | | | | | | |
| | | Year ended December 31, | |
| | | Rand (billion) | |
Sector | | 2008 | | | 2009 | | | 2010 | | | 2011 | | | 2012 | | | 2013² | |
Furniture | | | 4.0 | | | | 3.3 | | | | 3.9 | | | | 3.2 | | | | 2.8 | | | | 1.3 | |
Other industries | | | 15.8 | | | | 16.0 | | | | 15.7 | | | | 20.2 | | | | 23.0 | | | | 13.4 | |
Electricity, gas & steam | | | 0.9 | | | | 1.0 | | | | 1.0 | | | | 1.5 | | | | 2.0 | | | | 1.6 | |
Undefined | | | 0.5 | | | | 0.3 | | | | 0.5 | | | | 1.2 | | | | 1.2 | | | | 0.5 | |
Imports | | | | | | | | | | | | | | | | | | | | | | | | |
Total merchandise imports | | | 728.9 | | | | 542.4 | | | | 586.0 | | | | 726.2 | | | | 833.3 | | | | 458.2 | |
Agriculture, forestry & fishing | | | 10.3 | | | | 8.8 | | | | 8.7 | | | | 12.4 | | | | 13.2 | | | | 5.9 | |
Total: Mining | | | 145.1 | | | | 94.6 | | | | 89.3 | | | | 113.4 | | | | 139.7 | | | | 72.8 | |
Coal mining | | | 4.1 | | | | 1.4 | | | | 0.4 | | | | 1.8 | | | | 1.1 | | | | 1.1 | |
Gold & uranium ore mining | | | 0.0 | | | | 0.0 | | | | 0.0 | | | | 0.0 | | | | 0.0 | | | | 0.0 | |
Other mining | | | 141.0 | | | | 93.2 | | | | 88.9 | | | | 111.6 | | | | 138.6 | | | | 71.7 | |
Total: Manufacturing | | | 571.2 | | | | 436.5 | | | | 485.9 | | | | 598.1 | | | | 678.1 | | | | 378.5 | |
Food | | | 26.1 | | | | 23.5 | | | | 24.5 | | | | 30.5 | | | | 38.3 | | | | 18.8 | |
Beverages | | | 4.1 | | | | 4.5 | | | | 3.3 | | | | 3.9 | | | | 4.6 | | | | 2.2 | |
Tobacco | | | 0.3 | | | | 0.5 | | | | 0.4 | | | | 0.3 | | | | 0.5 | | | | 0.3 | |
Textiles | | | 7.1 | | | | 6.5 | | | | 7.2 | | | | 8.6 | | | | 9.3 | | | | 4.8 | |
Wearing apparel | | | 8.5 | | | | 9.2 | | | | 10.2 | | | | 11.4 | | | | 13.5 | | | | 8.0 | |
Leather & leather products | | | 2.1 | | | | 1.7 | | | | 2.1 | | | | 2.4 | | | | 2.6 | | | | 1.3 | |
Footwear | | | 4.8 | | | | 4.8 | | | | 5.2 | | | | 6.7 | | | | 7.8 | | | | 4.0 | |
Wood & wood products | | | 3.0 | | | | 2.2 | | | | 2.2 | | | | 2.6 | | | | 2.9 | | | | 1.6 | |
Paper & paper products | | | 8.3 | | | | 7.3 | | | | 7.3 | | | | 8.0 | | | | 8.7 | | | | 4.8 | |
Printing, publishing & recorded media | | | 2.3 | | | | 2.2 | | | | 2.2 | | | | 2.3 | | | | 2.7 | | | | 1.6 | |
Coke & refined petroleum products | | | 31.7 | | | | 24.2 | | | | 29.6 | | | | 46.8 | | | | 53.0 | | | | 34.2 | |
Basic chemicals | | | 37.7 | | | | 24.8 | | | | 28.6 | | | | 36.1 | | | | 40.0 | | | | 20.1 | |
Other chemicals | | | 36.2 | | | | 34.5 | | | | 36.6 | | | | 40.7 | | | | 47.6 | | | | 27.2 | |
Rubber products | | | 6.8 | | | | 5.8 | | | | 7.0 | | | | 8.4 | | | | 10.0 | | | | 5.9 | |
Plastic products | | | 7.2 | | | | 6.2 | | | | 7.0 | | | | 8.4 | | | | 9.7 | | | | 5.3 | |
Glass & glass products | | | 2.1 | | | | 1.8 | | | | 1.9 | | | | 2.1 | | | | 2.3 | | | | 1.2 | |
Non-metallic minerals | | | 7.6 | | | | 5.7 | | | | 6.2 | | | | 6.9 | | | | 7.4 | | | | 4.0 | |
Basic iron & steel | | | 13.0 | | | | 8.8 | | | | 9.8 | | | | 13.4 | | | | 14.0 | | | | 10.6 | |
Basic non-ferrous metals | | | 14.4 | | | | 8.0 | | | | 10.7 | | | | 12.4 | | | | 13.7 | | | | 7.6 | |
Metal products excluding machinery | | | 13.3 | | | | 10.4 | | | | 11.6 | | | | 13.9 | | | | 15.4 | | | | 8.6 | |
Machinery & equipment | | | 118.2 | | | | 84.4 | | | | 88.2 | | | | 114.6 | | | | 135.3 | | | | 71.7 | |
83
| | | | | | | | | | | | | | | | | | | | | | | | |
| | | Year ended December 31, | |
| | | Rand (billion) | |
Sector | | 2008 | | | 2009 | | | 2010 | | | 2011 | | | 2012 | | | 2013² | |
Electrical machinery | | | 27.2 | | | | 21.5 | | | | 19.8 | | | | 21.7 | | | | 26.9 | | | | 16.3 | |
Television, radio & communication equipment | | | 36.5 | | | | 30.1 | | | | 35.7 | | | | 37.9 | | | | 38.6 | | | | 23.6 | |
Professional & scientific equipment | | | 19.6 | | | | 16.9 | | | | 16.6 | | | | 19.5 | | | | 21.4 | | | | 11.6 | |
Motor vehicles, parts & accessories | | | 95.3 | | | | 66.3 | | | | 86.6 | | | | 104.6 | | | | 118.0 | | | | 69.2 | |
Other transport equipment | | | 24.0 | | | | 14.1 | | | | 13.3 | | | | 20.1 | | | | 16.6 | | | | 6.2 | |
Furniture | | | 4.0 | | | | 3.0 | | | | 3.6 | | | | 3.9 | | | | 4.6 | | | | 2.3 | |
Other industries | | | 9.9 | | | | 7.6 | | | | 8.5 | | | | 9.9 | | | | 12.8 | | | | 5.8 | |
Electricity, gas & steam | | | 1.3 | | | | 1.8 | | | | 1.6 | | | | 1.7 | | | | 1.6 | | | | 0.7 | |
Undefined | | | 0.9 | | | | 0.6 | | | | 0.6 | | | | 0.7 | | | | 0.7 | | | | 0.3 | |
Note: —
Source: Quantec
Exports
South Africa’s exports have traditionally consisted largely of primary products, especially mining products, with gold, diamonds, platinum group metals, coal and iron exported in large quantities. Since 2012, the fastest growing markets for South African exports have been Africa and Asia.
The value of exports increased at a significantly slower pace of 8.8% in the first six months of 2013 compared with the same period in 2012, with moderate growth across major export categories. Exports of vehicles and machinery remained strong, while exports of precious metals and base metals, which slowed during 2012, increased by 4.0% and 1.2%, respectively, in the first six months of 2013.
The pattern of trade in the first half of 2013 shows a broad-based increase in exports to the eurozone and Japan, flat exports to the U.S. and growing exports to China and the SADC. In the first six months of the year, exports to the SADC rose by 27.6% compared with the same period in 2012, with strong growth in exports to Mozambique (50.4%), Zambia (20.8%) and Zimbabwe (17.3%) leading the increase in total SADC exports.
Exports to China, after slowing during 2011 and 2012, increased by 19.7 per cent in the first half of 2013 as compared to the same period during 2012, largely as a result of a 16% increase in mineral products exports and a fivefold increase in vehicle exports year-on-year. The growth in exports to China during 2013 indicates a trend in the export basket to China being increasingly composed of manufactured goods.
The SADC region continued to absorb more manufactured goods from South Africa with a share of 22.3% in the first six months of 2013, marginally behind the EU with a share of 24%. The EU remains the largest destination for South African exports, with approximately R144 billion worth of goods exported to the region in the first six months of 2013, representing 20.5% of total exports. The U.S. remains an important export destination, with around 9% of South Africa’s exports going to the U.S. during the first half of 2013.
Imports
Between 2010 and 2012, imports increased by 42.2%, or 36.8% excluding mineral products. Major import categories were mineral products (oil), machinery and appliances, food and beverages, transport equipment and original equipment. Consumption goods comprised the largest share of imports during this period (33%), followed by investment goods (23%), energy goods (18%) and intermediate goods (8%). The increase in imports during this period corresponded to recovery in the domestic economy recovered from the 2008 global financial crisis, which was reflected in increased domestic consumption that coincided with an increase in the value of imports by 7.4% in 2010 and 14.4% in 2011.
84
In nominal terms, import growth increased by 15.8% in the first six months of 2013 as compared to same period during 2012, driven by strong domestic demand, investment and depreciation of the Rand exchange rate.
South Africa’s Commitment to the WTO
South Africa is a founding member of the General Agreement of Trade and Tariffs (GATT) and has been an active participant for decades in the various GATT rounds of multilateral trade negotiations. In line with the need to open up the economy and increase competition in the economy, South Africa has liberalised most sectors of the economy since the 1990s.
Since the early 1990s, the tariff regime has undergone significant liberalisation. The average applied rate declined from approximately 24% in 1990 to approximately 8% in 2007. Specific and formula duties that comprised 25% of all tariffs in 1990 comprised only 3.1% of all tariffs in 1990; and the proportion of duty-free lines was 53% in 2007 compared to 45% in 1990.
South Africa has phased out support measures and subsidies inconsistent with the principles expressed in the GATT. This encourages South African industries to improve their competitiveness in domestic and foreign markets, while at the same time benefiting from cost reductions, supply side support measures and reduced import duties of trading partner countries that were negotiated in the Uruguay Round, as well as from certain market access preferences that have been granted to South Africa by Canada, the EU, Japan, Norway, Russia, Switzerland and the U.S.
South Africa enjoys beneficial trade agreements with a number of countries, both multilateral and bilateral. It enjoys preferential treatment under the African Growth and Opportunity Act when trading with the United States.
In Africa, South Africa drives growth and has a number of free trade agreements with African countries. These include Botswana, Namibia, Lesotho and Namibia, under the auspices of the Southern African Customs Union. South Africa is also an important member of the SADC, which, amongst other things, allows for preferential trading access to Zimbabwe. It is anticipated that the TFTA between the SADC, COMESA and EAC will help to facilitate market access and increased trade within the continent.
South Africa also has an agreement with the EU to export most of its goods duty free under the Trade Development and Cooperation and is in the process of negotiating a new trade agreement and a new economic partnership agreement.
China, India and Brazil are also important markets for South Africa. Thus South Africa has strengthened diplomatic ties and trade cooperation with these countries.
Geographic Distribution of Trade
The following table sets forth the distribution of South Africa’s exports and imports of merchandise for the periods indicated.
Distribution of Merchandise Trade
| | | | | | | | | | | | | | | | | | | | | | | | |
| | | 2008 | | | 2009 | | | 2010 | | | 2011 | | | 2012 | | | 2013² | |
| | | (Rand billions) | |
Exports | | | | | | | | | | | | | | | | | | | | | | | | |
China | | | 34.4 | | | | 48.7 | | | | 58.6 | | | | 85.3 | | | | 81.1 | | | | 50.2 | |
Not allocated | | | 51.0 | | | | 57.6 | | | | 66.0 | | | | 79.7 | | | | 76.8 | | | | 34.0 | |
US | | | 65.5 | | | | 41.1 | | | | 51.5 | | | | 59.6 | | | | 61.6 | | | | 32.8 | |
Japan | | | 65.6 | | | | 34.0 | | | | 46.3 | | | | 55.3 | | | | 44.3 | | | | 24.1 | |
Germany | | | 45.9 | | | | 32.4 | | | | 42.7 | | | | 43.2 | | | | 38.0 | | | | 19.9 | |
India | | | 18.0 | | | | 17.9 | | | | 22.2 | | | | 24.3 | | | | 30.1 | | | | 14.4 | |
UK | | | 39.5 | | | | 25.1 | | | | 26.4 | | | | 28.7 | | | | 27.1 | | | | 14.3 | |
85
| | | | | | | | | | | | | | | | | | | | | | | | |
| | | 2008 | | | 2009 | | | 2010 | | | 2011 | | | 2012 | | | 2013² | |
| | | (Rand billions) | |
Netherlands | | | 27.0 | | | | 18.5 | | | | 17.2 | | | | 21.5 | | | | 24.7 | | | | 15.9 | |
Zambia | | | 15.4 | | | | 11.2 | | | | 11.4 | | | | 16.2 | | | | 20.1 | | | | 10.9 | |
Zimbabwe | | | 13.6 | | | | 13.3 | | | | 15.1 | | | | 17.1 | | | | 18.9 | | | | 10.0 | |
Mozambique | | | 13.0 | | | | 13.0 | | | | 13.9 | | | | 17.2 | | | | 18.9 | | | | 13.0 | |
Imports | | | | | | | | | | | | | | | | | | | | | | | | |
China | | | 82.4 | | | | 70.8 | | | | 84.1 | | | | 103.1 | | | | 120.1 | | | | 69.3 | |
Germany | | | 82.6 | | | | 63.2 | | | | 66.1 | �� | | | 77.3 | | | | 84.0 | | | | 50.7 | |
Saudi Arabia | | | 46.0 | | | | 26.7 | | | | 23.7 | | | | 32.3 | | | | 64.6 | | | | 34.9 | |
US | | | 58.3 | | | | 41.5 | | | | 41.9 | | | | 58.4 | | | | 61.2 | | | | 30.2 | |
Japan | | | 40.6 | | | | 26.3 | | | | 31.0 | | | | 34.5 | | | | 37.9 | | | | 18.2 | |
India | | | 18.8 | | | | 15.4 | | | | 20.7 | | | | 29.2 | | | | 37.6 | | | | 22.7 | |
Nigeria | | | 15.7 | | | | 15.6 | | | | 16.1 | | | | 22.7 | | | | 30.5 | | | | 15.1 | |
UK | | | 29.7 | | | | 21.6 | | | | 22.1 | | | | 29.1 | | | | 28.9 | | | | 15.4 | |
Angola | | | 22.4 | | | | 11.7 | | | | 14.6 | | | | 11.5 | | | | 23.0 | | | | 9.8 | |
Thailand | | | 14.6 | | | | 12.1 | | | | 13.4 | | | | 16.5 | | | | 22.2 | | | | 12.2 | |
Italy | | | 17.8 | | | | 13.6 | | | | 14.7 | | | | 19.6 | | | | 21.1 | | | | 12.9 | |
Note:—
| (1) | Through June 30, 2013. |
Source: www.quantec.co.za.
Balance of Payments
The following table sets forth the balance of payments for South Africa for the periods indicated.
Balance of Payments (1)
| | | | | | | | | | | | | | | | | | | | | | | | |
| | | For the year ended December 31 | | | For the six
months ended
June 30 | |
| | | 2008 | | | 2009 | | | 2010 | | | 2011 | | | 2012 | | | 2013 | |
| | | (Rand millions) | |
Current account | | | | | | | | | | | | | | | | | | | | |
Merchandise exports (f.o.b.)(2) | | | 655,759 | | | | 503,656 | | | | 565,860 | | | | 671,220 | | | | 696,180 | | | | 204,640 | |
Net gold exports(3) | | | 48,534 | | | | 52,776 | | | | 59,499 | | | | 75,298 | | | | 71,050 | | | | 16,505 | |
Service receipts | | | 105,351 | | | | 100,760 | | | | 102,362 | | | | 107,825 | | | | 124,332 | | | | 31,842 | |
Income receipts | | | 48,254 | | | | 34,075 | | | | 34,099 | | | | 38,118 | | | | 48,501 | | | | 15,156 | |
Less: Merchandise imports (f.o.b)(2) | | | 739,852 | | | | 554,161 | | | | 598,151 | | | | 730,128 | | | | 842,775 | | | | 241,553 | |
86
| | | | | | | | | | | | | | | | | | | | | | | | |
Less: Payments for services | | | 138,885 | | | | 124,147 | | | | 134,843 | | | | 142,230 | | | | 145,006 | | | | 40,743 | |
Less: Income payments | | | 122,129 | | | | 87,593 | | | | 87,022 | | | | 104,689 | | | | 118,508 | | | | 32,594 | |
Current transfers (net receipts (+)) | | | -18,906 | | | | -22,428 | | | | -16,762 | | | | -14,199 | | | | -31,369 | | | | -7,904 | |
Balance on current account | | | -161,874 | | | | -97,062 | | | | -74,958 | | | | -98,785 | | | | -197,595 | | | | -54,651 | |
Capital transfer account (net receipts (+)) | | | 208 | | | | 216 | | | | 225 | | | | 241 | | | | 239 | | | | 60 | |
Financial account | | | | | | | | | | | | | | | | | | | | | | | | |
Direct investment | | | | | | | | | | | | | | | | | | | | | | | | |
Liabilities(4) | | | 76,079 | | | | 63,570 | | | | 26,617 | | | | 30,808 | | | | 37,540 | | | | 17,444 | |
Assets(5) | | | 25,888 | | | | -9,757 | | | | 554 | | | | 1,865 | | | | -35,867 | | | | -8,863 | |
Net direct investment | | | 101,967 | | | | 53,813 | | | | 27,171 | | | | 32,673 | | | | 1,673 | | | | 8,581 | |
Portfolio investment | | | | | | | | | | | | | | | | | | | | | | | | |
Liabilities | | | -71,540 | | | | 107,234 | | | | 107,876 | | | | 45,878 | | | | 94,655 | | | | -5,342 | |
Assets | | | -63,325 | | | | -13,470 | | | | -33,374 | | | | -62,223 | | | | -40,002 | | | | -6,381 | |
Net portfolio investment | | | -134,865 | | | | 93,764 | | | | 74,502 | | | | -16,345 | | | | 54,653 | | | | -11,723 | |
Other investment | | | | | | | | | | | | | | | | | | | | | | | | |
Liabilities | | | 47,730 | | | | -39,956 | | | | 7,899 | | | | 43,005 | | | | 65,736 | | | | -411 | |
Assets | | | 82,983 | | | | 23,703 | | | | -22,138 | | | | -13,444 | | | | 40,368 | | | | 4,576 | |
Net other investment | | | 130,713 | | | | -16,253 | | | | -14,239 | | | | 29,561 | | | | 106,104 | | | | 4,165 | |
Balance on financial account | | | 97,815 | | | | 131,324 | | | | 87,434 | | | | 45,889 | | | | 162,430 | | | | 1,023 | |
Unrecorded transactions(6) | | | 89,917 | | | | -17,441 | | | | 18,605 | | | | 85,359 | | | | 43,881 | | | | 38,419 | |
Change in net gold and other foreign reserves owing to balance of payments transactions | | | 26,066 | | | | 17,037 | | | | 31,306 | | | | 32,704 | | | | 8,955 | | | | -15,149 | |
Change in liabilities related to reserves(7) | | | -7,761 | | | | -2,724 | | | | -2,683 | | | | 7 | | | | 16 | | | | 8 | |
SDR allocations and valuation adjustments | | | 74,214 | | | | -38,647 | | | | -30,712 | | | | 74,441 | | | | 24,141 | | | | 24,735 | |
Net monetisation (+) / demonetisation (-) of gold | | | 158 | | | | 45 | | | | 13 | | | | 42 | | | | 11 | | | | 1 | |
Change in gross gold and other foreign reserves | | | 92,677 | | | | -24,289 | | | | -2,076 | | | | 107,194 | | | | 33,123 | | | | 9,595 | |
Change in capital transfer and financial accounts including unrecorded transactions | | | 187,940 | | | | 114,099 | | | | 106,264 | | | | 131,489 | | | | 206,550 | | | | 39,502 | |
87
Notes:—
| (1) | Data for the previous four years are preliminary and subject to revision. |
| (2) | Published customs figures adjusted for balance of payments purposes. |
| (3) | Commodity gold. Prior to 1981 net gold exports comprised net foreign sales of gold plus changes in gold holdings of the SARB and other banking institutions. |
| (4) | Investment by foreigners in undertakings in South Africa in which they have individually or collectively in the case of affiliated organisations or persons at least 10% of the voting rights. |
| (5) | Investment by South African residents in undertakings abroad in which they have at least 10% of the voting rights. |
| (6) | Transactions on the current, capital transfer and financial accounts. |
| (7) | Liabilities related to foreign reserves include all foreign liabilities of the SARB and short-term foreign loans to the National Government by international organisations. |
Source: SARB.
Current Account
South Africa’s trade patterns and volumes changed notably during the past decade. These changes were brought about by, among other factors, uneven growth performance of the country’s most important trading-partner countries in the aftermath of the most recent recession, substantial infrastructure development projects and a number of trade agreements concluded to promote international trade.
Notwithstanding various policy measures to enhance external competitiveness, to promote trade, and to raise the country’s growth performance, the South African economy has become more dependent on surplus saving from the rest of the world to finance the much-needed increase in gross fixed capital formation. The country’s import penetration ratio (i.e., the extent to which the country relies on merchandise imports to satisfy domestic expenditure) increased sharply between 2003 and 2008 before receding temporarily in 2009. Subsequently, this ratio regained its upward momentum and surpassed the most recent peak in 2008 in the first quarter of 2013.
Owing to stronger growth in import volumes surpassing that of merchandise exports, the trade balance switched from a surplus in 2003 to a deficit in subsequent years up to 2008. The trade balance temporarily switched back to a surplus from 2009 to 2011 due to lower domestic demand before moving into a deficit in 2012 and the first half of 2013. During this period, the relatively slower growth in the volume of merchandise exports was partly countered by favourable terms of trade, which trended upward from 2001 to 2011. During 2012, however, the terms of trade weakened somewhat before recovering slightly in the first half of 2013.
The value of merchandise exports advanced steadily from 2003 up to the first half of 2013 with brief interruptions in 2009 and 2010. The increase in export proceeds could largely be attributed to higher Rand prices of merchandise exports along with a slower increase in export volumes over the period. The sustained recovery of the U.S. economy further boosted export proceeds in 2012 and the first half of 2013.
Notwithstanding the dwindling volume of net gold exports, domestic gold producers benefited from a surge in the international price of gold since 2006. Further to demand and supply conditions, the price of gold benefited during the past few years from the ongoing uncertainty in global financial markets, as well as geopolitical tensions. The price of gold on the London market, which averaged US$310 per fine ounce in 2002, rose steadily to US$1 668 per fine ounce in 2012. In Rand terms, the price of gold advanced at an even faster pace due to the depreciation in the exchange value of the Rand over the period. The upward trend in the US-dollar price of gold, however, lost some momentum in late 2012 and the first half of 2013, partly due to the expectations of less buoyant global demand and lower inflation.
Owing mainly to strong domestic demand, the value of merchandise imports increased at a steady pace during the period of 2010 to 2012. Having contracted by no less than 25.1% in 2009, growth in merchandise import values amounted to 7.9% in 2010 and 22.1% in 2011, before moderating somewhat to 15.4% in 2012. Although manufactured goods remained the largest component of merchandise imports in value terms, it declined as a ratio of total merchandise imports, from 73.9% in 2003 to 66% in 2012. The three main subcategories of manufactured imports, which jointly account for roughly 75% of the total import value of manufactured goods, are machinery and electrical equipment, vehicles and transport equipment, and chemical products.
The deficit on the services, income and current transfer account of the balance of payments has remained relatively stable at approximately 4% of gross domestic product during the past decade. In the past four years, this ratio benefited from a notable influx of foreign tourists following the successful hosting of international sport events like the FIFA World Cup Soccer
88
tournament. However, gross dividend payments to non-resident investors rose somewhat during the past four years. Moving more towards 2013, the deficit on this account widened from R112.7 billion in the first quarter of 2013 to R119.6 billion in the second quarter, the latter value equaling 3.6% of South Africa’s gross domestic product. The widening in the deficit during the second quarter could partly be explained by a contraction of almost 19% in dividend receipts following a significant increase in dividend income in the first quarter of 2013.
Gross payments for “other services” increased further during the second quarter of 2013 due to higher payments for technical-related services rendered by non-residents and higher transportation costs associated with the continued increase in merchandise imports. The higher gross payments for services in the second quarter of 2013 were partly cushioned by an increase in travel receipts benefitting, among other factors, from the more competitive external value of the Rand.
Financial Account
Sentiment in global financial markets in 2011 and the first half of 2012 was dominated by uncertainty about the outcome of the sovereign debt crisis in the eurozone. Furthermore, the second half of 2011 was characterised by the downgrading of the sovereign debt of the U.S., Japan and Italy, and negotiations about the bailout of, and adherence to austerity measures by, some peripheral countries in the eurozone. Simultaneously, the banking system in Europe continued to remain fragile, inhibiting liquidity and restricting bank lending to the real economy. As a result, capital flows from advanced economies to emerging-market economies shrank considerably in the second half of 2011. In addition, tension in the Middle East and the subsequent rise in international crude oil prices raised concerns about the prospects for global economic growth. The annual cumulative capital inflows into South Africa were higher in 2011 than those recorded in 2010 as a whole. The total financial flows amounted to R131.2 billion in 2011. In the first half of 2012, the inflows on the financial account including unrecorded transactions amounted to R98.5 billion despite the downgrading of the sovereign debt of six European countries and certain Spanish banks in May. The South African economy continued to attract foreign capital inflows during the first half of 2013. Including unrecorded transactions, the net inward movement of capital amounted to R94.9 billion in the first half of 2013. This sizeable inflow of foreign capital occurred against mainly in the first quarter against the backdrop of interest rate differentials with the mature economies which continued to favour South Africa. When the U.S. Federal Reserve indicated in the second quarter of 2013 that it could start tapering its accommodative monetary policy measures by slowing asset purchases towards the end of the year, it negatively influenced capital flows into emerging-market debt securities. The negative sentiment among foreign investors partly arose from uncertainty regarding the pace at which monetary stimulus measures would be reduced as well as the extent to which these policy actions could weaken growth in emerging-market economies. Net capital inflows into South Africa slowed in the second quarter of 2013 as a result of lower-than-expected first-quarter economic growth data, exchange-rate volatility and a decline in commodity prices.
The following table sets forth capital movements into and out of South Africa for the periods indicated.
Capital Movements (1)
| | | | | | | | | | | | | | | | | | | | | | | | |
| | | For the year ended December 31 | | | For the six
months ended
June 30 | |
| | | 2008 | | | 2009 | | | 2010 | | | 2011 | | | 2012 | | | 2013 | |
| | | Rand (million) | |
Liabilities(2) | | | | | | | | | | | | | | | | | | | | | | | | |
Direct investment(3) | | | 76,079 | | | | 63,570 | | | | 26,617 | | | | 30,808 | | | | 37,540 | | | | 17,444 | |
Public corporations | | | — | | | | — | | | | — | | | | — | | | | — | | | | — | |
Banking sector | | | 36,141 | | | | 1,151 | | | | -335 | | | | -305 | | | | 1 970 | | | | 321 | |
Private non-banking sector | | | 39,938 | | | | 62,419 | | | | 26,952 | | | | 31,113 | | | | 35,570 | | | | 17,123 | |
Portfolio investment | | | -71,540 | | | | 107,234 | | | | 107,876 | | | | 45,878 | | | | 94,655 | | | | -5,342 | |
Monetary authorities | | | — | | | | — | | | | — | | | | — | | | | — | | | | — | |
89
| | | | | | | | | | | | | | | | | | | | | | | | |
| | | For the year ended December 31 | | | For the six
months ended
June 30 | |
| | | 2008 | | | 2009 | | | 2010 | | | 2011 | | | 2012 | | | 2013 | |
| | | Rand (million) | |
Public authorities | | | -23,349 | | | | 26,983 | | | | 60,239 | | | | 49,777 | | | | 91,156 | | | | -22,770 | |
Public corporations | | | -2,559 | | | | 2,961 | | | | 7,790 | | | | 20,367 | | | | 13,310 | | | | -437 | |
Banking sector | | | -4,771 | | | | 9,841 | | | | 4,070 | | | | -2,627 | | | | -4,221 | | | | 4,368 | |
Private non-banking sector | | | -40,861 | | | | 67,449 | | | | 35,777 | | | | -21,639 | | | | -5,590 | | | | 13,497 | |
Other investments | | | 47,730 | | | | -39,956 | | | | 7,899 | | | | 43,005 | | | | 65,736 | | | | -411 | |
Monetary authorities(4) | | | -2,218 | | | | -174 | | | | 621 | | | | 549 | | | | 1,646 | | | | -542 | |
Public authorities | | | 199 | | | | -2,535 | | | | -2,320 | | | | -2,929 | | | | -3,394 | | | | -2,308 | |
Public corporations | | | 2,147 | | | | 8,303 | | | | 12,145 | | | | 16,772 | | | | 20,015 | | | | 6,404 | |
Banking sector | | | 43,572 | | | | -35,783 | | | | 6,701 | | | | 10,320 | | | | 42,153 | | | | -7,129 | |
Private non-banking sector | | | 4,030 | | | | -9,767 | | | | -9,248 | | | | 18,293 | | | | 5,316 | | | | 3,164 | |
Assets(5) | | | | | | | | | | | | | | | | | | | | | | | | |
Direct investment(6) | | | 25,888 | | | | -9,757 | | | | 554 | | | | 1,865 | | | | -35 867 | | | | -8,863 | |
Public corporations | | | -87 | | | | -301 | | | | -1 008 | | | | -131 | | | | — | | | | — | |
Banking sector | | | -14 | | | | 138 | | | | 12 | | | | -164 | | | | -117 | | | | -1 | |
Private non-banking sector | | | 25,989 | | | | -9,594 | | | | 1,550 | | | | 2,160 | | | | -35,750 | | | | -8,862 | |
Portfolio investment | | | -63,325 | | | | -13,470 | | | | -33,374 | | | | -62,223 | | | | -40,002 | | | | -6,381 | |
Monetary authorities | | | — | | | | — | | | | — | | | | — | | | | — | | | | — | |
Public authorities | | | — | | | | — | | | | — | | | | — | | | | — | | | | — | |
Public corporations | | | — | | | | — | | | | — | | | | — | | | | — | | | | — | |
Banking sector | | | -4 930 | | | | -342 | | | | -5,244 | | | | 1,310 | | | | -245 | | | | 186 | |
Private non-banking sector | | | -58,395 | | | | -13,128 | | | | -28,130 | | | | -63,533 | | | | -39,757 | | | | -6,567 | |
Other investments | | | 82,983 | | | | 23,703 | | | | -22,138 | | | | -13,444 | | | | 40,368 | | | | 4,576 | |
Monetary authorities | | | — | | | | 1 | | | | -1 | | | | 6 | | | | — | | | | — | |
Public authorities | | | 1,636 | | | | 1,342 | | | | 1,785 | | | | 1,982 | | | | -903 | | | | — | |
Public corporations | | | -1,271 | | | | -293 | | | | -517 | | | | -2,425 | | | | -187 | | | | -51 | |
Banking sector | | | 80,842 | | | | -187 | | | | -29,584 | | | | -1,913 | | | | 53,080 | | | | 6,384 | |
Private non-banking sector | | | 1,776 | | | | 22,840 | | | | 6,179 | | | | -11,094 | | | | -11,622 | | | | -1,757 | |
90
Notes: —
| (1) | Identified capital movements. |
| (2) | A decrease in liabilities (outflow of capital) is indicated by parentheses. Investment by foreigners in undertakings in South Africa in which they have individually (or collectively in the case of affiliated organisation or persons) at least 10% of the voting rights. |
| (3) | These transactions comprise only the liabilities of the Corporation of Public Deposits. |
| (4) | An increase in assets (outflow of capital) is indicated by parentheses. |
| (5) | Investment by South African residents in undertakings abroad in which they have individually (or collectively in the case of affiliated organisation or persons) at least 10% of the voting rights. |
| (6) | Including the long-term assets of the SARB and the Corporation of Public Deposits. |
| (7) | Note that the figures in these columns are for the first and second quarters of 2012 |
Source: SARB.
The following table sets forth total foreign direct investment by South African entities and total foreign direct investment in South Africa by foreign entities for the periods indicated. Data beyond 2011 is not yet available.
Foreign Direct Investment
| | | | | | | | | | | | | | | | | | | | |
| | | 2007 | | | 2008 | | | 2009 | | | 2010 | | | 2011 | |
| | | Rand (million) | |
South African foreign direct investment | | | | | | | | | | | | | | | | | | | | |
Europe | | | 195,439 | | | | 239,700 | | | | 195,067 | | | | 229 767 | | | | 368,858 | |
Africa | | | 87,770 | | | | 105,892 | | | | 120,080 | | | | 126 776 | | | | 185,518 | |
Americas | | | 30,757 | | | | 38,446 | | | | 51,354 | | | | 48 994 | | | | 72,082 | |
Asia | | | 44,696 | | | | 53,812 | | | | 129,238 | | | | 122 242 | | | | 127,313 | |
Oceania | | | 17,203 | | | | 22,046 | | | | 22,907 | | | | 24 153 | | | | 36,475 | |
Other | | | 140 | | | | 131 | | | | 138 | | | | 138 | | | | 27 | |
| | | | | | | | | | | | | | | | | | | | |
Total | | | 376,005 | | | | 460,027 | | | | 518,784 | | | | 552,070 | | | | 790,273 | |
| | | | | | | | | | | | | | | | | | | | |
Foreign direct investment in South Africa | | | | | | | | | | | | | | | | | | | | |
| Europe | | | 586,884 | | | | 712,769 | | | | 550,652 | | | | 762,690 | | | | 929,414 | |
| Americas | | | 88,597 | | | | 104,907 | | | | 103,803 | | | | 121,603 | | | | 115,807 | |
91
| | | | | | | | | | | | | | | | | | | | |
| | | 2007 | | | 2008 | | | 2009 | | | 2010 | | | 2011 | |
| | | Rand (million) | |
Asia | | | 712,769 | | | | 550,652 | | | | 762,690 | | | | 929,414 | | | | 1,015,324 | |
Africa | | | 104,907 | | | | 103,803 | | | | 121,603 | | | | 115,807 | | | | 129,522 | |
Oceania | | | 36,134 | | | | 81,304 | | | | 96,041 | | | | 99,572 | | | | 98,119 | |
Other | | | 144 | | | | 165 | | | | 195 | | | | 202 | | | | 469 | |
| | | | | | | | | | | | | | | | | | | | |
Total | | | 897,773 | | | | 778,355 | | | | 1,023,982 | | | | 1,190,799 | | | | 1,297,901 | |
| | | | | | | | | | | | | | | | | | | | |
Source: SARB.
South Africa’s total outstanding external debt declined moderately from US$142.3 billion at the end of December 2012 to US$140.6 billion at the end of March 2013 – the first quarterly decline in the country’s external debt since the third quarter of 2011. The decline could mainly be ascribed to a decrease in the foreign-currency denominated debt, as Rand-denominated debt increased marginally in the first quarter of 2013. Relative to the country’s gross domestic product, the amount of outstanding debt simultaneously receded from 37.0% in the fourth quarter of 2012 to 36.6% in the first quarter of 2013.
South Africa’s outstanding Rand-denominated debt increased from US$81.3 billion at the end of December 2012 to US$81.6 billion at the end of March 2013, mainly on account of nonresidents’ net purchases of domestic government bonds on the secondary market. At the end of March 2013, Rand-denominated bond liabilities amounted to 56.3% of total Rand-denominated debt compared with a ratio of 21.0% at the end of March 2008.
Foreign currency-denominated debt declined from US$61.0 billion at the end of December 2012 to US$59.0 billion at the end of March 2013 due to the redemption of short-term foreign loans and a reduction in deposit holdings of non-resident investors with the South African private-banking sector. These capital outflows more than neutralised inflows in the form of long-term loan financing over the period. In addition, international bonds also matured over the period, contributing to the reduction in the foreign currency-denominated debt.
Foreign Currency-Denominated Debt of South Africa(1)
| | | | | | | | | | | | | | | | | | | | | | | | |
| | | As of December 31 | | | As of
June 30, | |
| | | 2008 | | | 2009 | | | 2010 | | | 2011 | | | 2012 | | | 2013 | |
| | | Rand (million)(2) | |
Foreign-currency-denominated debt | | | | | | | | | | | | | | | | | | | | | | | | |
Public sector | | | 49,020 | | | | 41,741 | | | | 43,310 | | | | 62,014 | | | | 76,482 | | | | 93,527 | |
Monetary sector(3) | | | 119,225 | | | | 78,048 | | | | 68,118 | | | | 80,595 | | | | 117,323 | | | | 117,245 | |
Non-monetary private sector | | | 127,672 | | | | 102,450 | | | | 114,653 | | | | 133,916 | | | | 134,045 | | | | 174,297 | |
Bearer bonds and notes | | | 129,831 | | | | 113,818 | | | | 109,044 | | | | 169,883 | | | | 190,030 | | | | 189,275 | |
Long-term loans | | | — | | | | — | | | | — | | | | — | | | | — | | | | — | |
Total foreign-currency-denominated debt | | | 410,388 | | | | 310,505 | | | | 299,099 | | | | 413,580 | | | | 517,880 | | | | 574,344 | |
92
Notes: —
| (1) | Excluding blocked Rand accounts, ordinary and non-redeemable preference shares, quoted domestic debentures and quoted domestic loan stock. |
| (2) | Valued at middle-market exchange rates as of the end of period. |
| (3) | Including lending to other sectors. |
Source: SARB.
Reserves and Exchange Rates
Since the abolition of the Financial Rand System and the dual exchange rate in 1995, South Africa has had a unitary market-determined exchange rate that applies to both current and capital transactions between residents and non-residents.
The Rand appreciated in the first quarter of 2012, boosted by, among other factors, the IMF’s commitment to increasing its lending capacity to countries in need together with the US$430 billion pledged to the IMF by G-20 countries. The Rand received further impetus from the announcement by Citigroup in April 2012 that South Africa’s government bonds may in future be included in its World Government Bond Index. However, from March 31, 2012 to June 30, 2012 the Rand depreciated, partly on account of renewed concerns about the euro area and global growth prospects alongside declining commodity prices. The currencies of most emerging-market economies continued to be adversely affected by the uncertainty emanating from unresolved economic issues in the eurozone countries, and the unsatisfactory and partial solution to the reduction of the fiscal deficit in the U.S. Over and above these factors, lower international prices of some key export commodities, concerns about the sustainability of the financing of South Africa’s current-account deficit and ongoing tension in the domestic labor market have put further pressure on the domestic currency which, in the first quarter of 2013, declined, on balance, by 5.7% against a basket of trading-partner currencies. The nominal effective exchange rate of the Rand displayed increased levels of volatility in the first quarter of 2013 when the currency declined, on balance, by 6.6% in January 2013, increased by 4.3% in February before declining again by 3.2% in March. The Rand was among the emerging-market currencies that were negatively impacted by the ‘tapering’ remarks of the U.S. Federal Reserve in May 2013. This weighed down the performance of the domestic currency during the second quarter of 2013, together with the decline in the international prices of key South African export commodities, the sizeable fiscal and current-account deficits, weak economic growth, persistent high unemployment levels and ongoing labor union rivalry. The nominal effective exchange rate of the Rand consequently declined by 6.8% from the end of March 2013 to the end of June; this represented the fifth consecutive quarterly decline, with the most significant depreciation recorded in May 2013.
93
The following table sets forth, for the periods indicated, the exchange rate of the Rand per U.S. Dollar.
Rand
(against the U.S. Dollar)
| | | | | | | | | | | | | | | | |
Year | | Low | | | High | | | Average | | | Period End | |
2008 | | | 6.7211 | | | | 11.4740 | | | | 8.2517 | | | | 9.3035 | |
2009 | | | 7.2439 | | | | 10.5948 | | | | 8.4372 | | | | 7.3721 | |
2010 | | | 6.6224 | | | | 7.9704 | | | | 7.3222 | | | | 6.6224 | |
2011 | | | 6.5962 | | | | 8.5423 | | | | 7.2531 | | | | 8.1319 | |
2012 | | | 7.4777 | | | | 8.9432 | | | | 8.2099 | | | | 8.4838 | |
January 2013 | | | 8.4478 | | | | 9.0908 | | | | 8.7857 | | | | 9.0582 | |
February 2013 | | | 8.8109 | | | | 8.9690 | | | | 8.8827 | | | | 8.8410 | |
March 2013 | | | 9.0296 | | | | 9.3247 | | | | 9.1747 | | | | 9.2521 | |
April 2013 | | | 8.8762 | | | | 9.3004 | | | | 9.1125 | | | | 8.9686 | |
May 2013 | | | 8.9527 | | | | 10.1985 | | | | 9.3560 | | | | 10.1985 | |
June 2013 | | | 9.7660 | | | | 10.2832 | | | | 10.0307 | | | | 9.9655 | |
July 2013 | | | 9.6933 | | | | 10.2698 | | | | 9.9101 | | | | 9.8551 | |
August 2013 | | | 9.8098 | | | | 10.4363 | | | | 10.0826 | | | | 10.3348 | |
September 2013 | | | 9.6222 | | | | 10.2977 | | | | 9.9830 | | | | 10.1012 | |
October 2013 | | | 9.7743 | | | | 10.1287 | | | | 9.9172 | | | | 9.9560 | |
November 2013(1) | | | 10.0631 | | | | 10.4147 | | | | 10.2009 | | | | 10.1911 | |
Notes:
| (1) | Up to and including November 29, 2013. |
Source: South African Reserve Bank.
Change in Reserves
South Africa’s overall balance-of-payments position was in surplus in the amount of R32.7 billion in 2011, following an improvement of R31.3 billion in 2010. In 2012, the country’s net international reserves rose by R9.0 billion and by a further R4.7 billion in the first nine months of 2013. The gross gold and other foreign-exchange reserves, measured in U.S. Dollar, increased from US$43.8 billion at the end of 2010 to US$48.9 billion at the end of 2011 to US$50.7 billion at the end of 2012. However, the country’s foreign reserves declined to US$49.7 billion by the end of October 2013. Expressed in Rand terms, gross gold and other foreign exchange reserves increased from R397.8 billion at the end of December 2011 to R431.0 billion at the end of 2012 to R495.6 billion at the end of October 2013, on account of the depreciation of the exchange rate of the Rand. The ratio of imports covered by reserves improved marginally from 19.7 weeks of import cover at the end of December 2011 to 19.8 weeks at the end of December 2012, before decreasing to 19.3 weeks at the end of June 2013.
The following table sets forth the gold and foreign exchange reserves of South Africa in each of the periods indicated.
94
Foreign Exchange Reserves
| | | | | | | | | | | | | | | | | | | | | | | | | | | | |
| | | For the year ended December 31, | | | As of
October 31, | |
| | | 2007 | | | 2008 | | | 2009 | | | 2010 | | | 2011 | | | 2012 | | | 2013 | |
| | | Rand (million) | |
SARB gold reserves(1) | | | 22,843 | | | | 32,426 | | | | 32,753 | | | | 37,492 | | | | 51,076 | | | | 56,982 | | | | 53,163 | |
Foreign exchange reserves | | | | | | | | | | | | | | | | | | | | | | | | | | | | |
SDRs(2) | | | 2,397 | | | | 3,213 | | | | 20,613 | | | | 18,262 | | | | 22,284 | | | | 23,873 | | | | 28,195 | |
Other(3) | | | 199,073 | | | | 281,352 | | | | 239,335 | | | | 234,872 | | | | 324,459 | | | | 350,087 | | | | 414 211 | |
| | | | | | | | | | | | | | | | | | | | | | | | | | | | |
Total | | | 201,470 | | | | 284,565 | | | | 259,948 | | | | 253 134 | | | | 346,743 | | | | 373,960 | | | | 442,406 | |
| | | | | | | | | | | | | | | | | | | | | | | | | | | | |
National Government(3)(4) | | | 12 | | | | 11 | | | | 12 | | | | 11 | | | | 12 | | | | 12 | | | | 12 | |
Gross gold and other foreign reserves | | | 224,325 | | | | 317,002 | | | | 292,713 | | | | 290,637 | | | | 397,831 | | | | 430,954 | | | | 495,581 | |
Notes: —
| (1) | Until March 5, 2005 gold reserves were valued at 90% of the last ten London fixing prices preceding end of period. From March 6, 2005, gold reserves are valued at market price taken at 14:30 on each valuation date. |
| (3) | Non-gold reserves are valued at the middle market exchange rate applicable at end of period. |
| (4) | Including both the reserve and super reserve tranche position in the IMF. |
Source: SARB.
95
PUBLIC FINANCE
Background
South Africa’s public finances are organised into three spheres: the National Government, provincial governments and local governments, the latter two of which are generally funded from the national budget, except as described below, by transfer payments from the National Government and from their own revenue collections. Together with various extra-budgetary accounts and institutions as well as social security funds, these three levels of government comprise the general government.
The Division of Revenue Act (DORA) provides for the equitable division of revenue raised nationally among the national, provincial and local spheres of government and the responsibilities of all three spheres pursuant to such division; and to provide for matters connected therewith. The objects of DORA are to: (a) provide for the equitable division of revenue raised nationally among the three spheres of government; (b) promote predictability and certainty in respect of all allocations to provinces and municipalities, in order that provinces and municipalities may plan their budgets over a multi-year period and thereby promote better coordination between policy, planning and budgeting; and (c) promote transparency and accountability in the resource allocation process by ensuring that all allocations are reflected in the budgets of provinces and municipalities and by ensuring that the expenditure of conditional allocations is reported on by the receiving provincial departments and municipalities. Government finances are presented in two ways, each highlighting key aspects of the budget. The main budget determines national government’s borrowing requirement. It consists of two elements. The first, appropriations by Parliament through budget votes, are mainly for national departments and include transfers to provinces, local government and public entities. The second, direct charges against the National Revenue Fund, includes the provincial equitable share and debt service costs, as well as the salaries of judges and public representatives. The consolidated budget provides a fuller picture of government’s contribution to the economy. It takes into account of the main budget as well as spending of provinces, social security funds and public entities financed from their own revenue.
Provincial budgets are largely financed by the provincial equitable shares and conditional grants from the main budget. But provinces supplement these funds with their own revenues, such as gambling taxes, hospital fees and sales of goods and services. Also excluded from the consolidation is expenditure by metros and other large municipalities, which is financed from their own revenue, such as property rates and services charges. The consolidated budget includes 187 public entities. These include large entities such as South African National Roads Agency Limited, the Passenger Rail Agency, the South African Revenue Services and agencies that provide bulk water infrastructure. Public entities receive some transfers from the main budget but are also financed from own revenue. State-owned companies that function as standalone operations largely on a commercial basis, such as Eskom and Transnet, are not included in the consolidated accounts. Social security funds include Unemployment Insurance Fund, compensation funds and the Road Accident Fund. They are financed mainly by statutory levies or contributions but receive some transfers from the main budget.
National, provincial and local governments are responsible for delivering public services. Some of these services are the exclusive responsibility of one level of government, while others — known as concurrent functions — are shared. Nationally raised revenue is divided with the aim of providing for appropriate funding at each level of government — for example by taking into account their service delivery responsibilities and other sources of revenue available to them. In the 2013/14 fiscal year, national governments departments are to be allocated 47.6% of available funds after debt costs, and the contingency reserve has been provided for. Provincial government is to be allocated 43.5% of available funds, mainly for education, health and social welfare. Local government is to receive 8.9% of the available funds, primarily for the provision of basic services to low income households. Most municipalities fund the majority of their spending through charges and taxes.
Between the 2009/10 and 2015/16 fiscal years, there was an allocation of R6.1 trillion for the three spheres of government. National government accounted for R2.9 trillion (47.79%), provincial government R2.7 billion (43.56%) and local government R535 billion (8.65%). Equitable share accounted to R260 million (48.60%) of the total local government allocation.
General government finances in South Africa represent a consolidation of the following: the National Budget; the budgets of the nine provincial governments; extra-budgetary accounts and funds; social security funds; and the budgets of local authorities. The National Government, provincial governments, social security funds, RDP accounts and extra-budgetary accounts are jointly referred to in this document as the “Consolidated Government Budget.” The Consolidated Government Budget includes transfer payments to local governments but does not constitute a consolidation of local government accounts. Municipalities, universities, polytechnics and various extra-budgetary funds derive substantial shares of their revenue from fees and charges or other sources. The Consolidated Government Budget presents a broader measure of government finances in South Africa. The public sector borrowing requirement shows the budget balance for the entire public sector, including general government and the non-financial public enterprises.
96
The borrowing powers of provincial and local governments are regulated by law. Provinces and municipalities generally may borrow for capital projects only. Under the Constitution, provinces have their own limited taxing powers and they are responsible for preparing their own budgets and for ensuring prudent financial management at the provincial level. Provinces receive agreed shares of nationally collected revenue and a framework for ensuring an equitable division to local government. The National Treasury introduced generally recognised accounting practices and uniform treasury norms and standards, the prescription of measures to ensure transparency and expenditure control in all spheres of government, and operational procedures for borrowing, guarantees, procurement and oversight over various national and provincial revenue funds.
In terms of Section 230 of the Constitution, provinces are allowed to take out loans for either current expenditure, in the form of a bridging loan that must be repaid within a 12-month period, or capital projects. The Borrowing Powers of Provincial Governments Act of 1996 (Borrowing Powers Act) lists the conditions under which a province may take out loans for capital projects. The Act stipulates that loans must be approved by a loan coordinating committee, which is chaired by the Minister of Finance. Loans may be taken out as direct borrowing from the national government or from private banks and financial institutions. Provinces may not take out loans in foreign currency unless they are specifically authorised to do so by the Minister of Finance. As provinces are accountable in their own right, the National Government does not guarantee loans taken out by provincial governments and will not bail out any province that is unable to repay its loans.
The PFMA regulates the National Government’s financial administration and outlines the various roles of the National Treasury, the Minister of Finance (as head of the National Treasury), the National Revenue Fund, accounting officers, auditors, executive authorities, public entities and other government officials. This legislation also addresses, among other things, regulation of loans, guarantees and other commitments as well as penalties for financial misconduct. Legislation aimed at regulating local government spending, known as the Municipal Finance Management Act of 2003 (MFMA), took effect in July 2004. The legislation seeks to secure sound and sustainable management of the financial affairs of municipalities and other institutions in the local sphere of government, and to establish treasury norms and standards for the local sphere of government.
Municipalities can borrow over the long term to finance capital projects, acquire capital assets or refinance existing debt pursuant to Section 46 of the MFMA. Short-term borrowing (not for more than 12 months) is also possible for operational purposes only. However, the debt needs to be repaid within the financial year in which the debt was incurred pursuant to Section 45 of the MFMA. Furthermore, the Regulatory Framework for Municipal Borrowing (1999) recommends that every municipality should adopt a written debt policy when planning to issue debt. The policy assists in determining borrowing limits that a municipality can cope with. The MFMA further requires that all municipalities seek written comments from the relevant provincial and National Treasury in terms of proposed debt.
As of June 30, 2013, the local government debt market stood at R50.1 billion, of which municipal bonds accounted for R14.4 billion, short term loans/overdrafts accounted for R207 million and long term loans accounted for the remaining R35.2 billion. Private sector banks contributed R29.3 billion (58.5%) of the total borrowing, followed by the Development Bank of Southern Africa at R13.6 billion (27.2%). New borrowing constituted R46.8 billion (93.2%) and the conversion of the existing borrowing amounted to R2.8 billion (5.5%).
The Constitution provides that the provincial and local governments are entitled to such percentages of nationally raised revenue as may be determined by Parliament (allocated among the provinces on an equitable basis). Allocations through this “local government equitable share” (LGES) formula are primarily based on how many poor households a municipality provides services to. The formula also makes provision for a contribution towards the administration and governance costs of running a municipality. Allocations also take account of the greater ability of some municipalities to cross-subsidise services to their poor households and less funding is allocated to these (relatively wealthy) municipalities. The new LGES formula which was implemented in the 2013/14 financial year, also taking into account the 2011 census figures, provides a subsidy of R275 for every household with a monthly income less than R2,300, which is about 59% of all households. The previous formula for the local government equitable share targeted 47% of households. Revisions are under way that take into account varying local circumstances: some municipalities have difficulty identifying which households are eligible for free services or do not yet maintain accurate records of service provision. While census data indicates steady progress towards universal access to electricity and clean water, achievement of free basic service standards still has some way to go.
The budgets of the provincial governments are financed through such nationally collected revenue, together with other allocations or grants from the National Government, the provinces’ own revenue collections, unspent balances from previous fiscal years and proceeds from loans for capital outlays. The Constitution provides for the assignment of taxation powers to provinces within a national, regulated framework that is intended to ensure that all taxes are consistent with national economic policy. The Provincial
97
Tax Regulation Process Act of 2001 provides a framework through which provinces can introduce and collect certain fees and taxes. These include automobile license and traffic fees, hospital fees, gambling fees and other user charges and levies. The Financial and Fiscal Commission, a constitutionally established body, has the responsibility of monitoring and overseeing intergovernmental fiscal relations. Additionally, the Intergovernmental Fiscal Relations Act of 1997 established the Budget Council and the Budget Forum to consider intergovernmental budget issues.
Progress continues to be made in extending access to electricity, water, sanitation and refuse removal services. The Government’s aim is to ensure that all citizens receive at least a basic level of amenities. Drawing on international benchmarks, minimum standards of 50kWh of free electricity and 6,000 litres of water per month per household have been adopted. However, the level of free services provided to poor households varies, depending on local circumstances and municipal capacity. The national budget contributes to the financing of household amenities through the local government equitable share, which is mainly allocated for provision of free basic services. There has been a significant growth in allocations to the local government equitable share over the past four years, from R20 billion in 2009/10 to an estimated R35 billion in 2013/14.
The new local government equitable share formula which was implemented in the 2013/14 financial year, also taking into account the 2011 census figures, provides a subsidy of R275 for every household with a monthly income less than R2,300, which is about 59% of all households. The previous formula for the local government equitable share targeted 47% of households. Revisions are under way that take into account varying local circumstances: some municipalities have difficulty identifying which households are eligible for free services or do not yet maintain accurate records of service provision. While census data indicates steady progress towards universal access to electricity and clean water, achievement of free basic service standards still has some way to go.
The 2011 Census shows that there has been considerable population growth and internal migration over the past decade. This new data assists in improving the targeting of municipal funding. The new equitable share formula reflects these changes and makes allocations for free basic services more transparent. Municipalities need to prioritise funding for the provision and maintenance of these services. The funding and provision of infrastructure are also important requirements for continued improvement in basic service delivery. It is not possible to give households free access to services if the supporting infrastructure – such as water distribution systems – is not in place.
Unemployment Insurance Fund (UIF)
In 2001, the Minister of Labour tabled legislation to strengthen the administration of the UIF, target benefits more effectively to the poor and extend the coverage of the fund. Since the UIF was given an estimated amount of R605 million in 2001 to address its outstanding financial debts, it has been experiencing positive financial performances. The UIF was able to meet its operational expenditure requirement and recorded an operating cash surplus of R10.6 billion in fiscal year 2013. The March 2013 actuarial evaluation indicated that the UIF is in a sound position to meet its cash-flow requirements over the next ten years for a wide range of possible scenarios. The UIF had capital and reserves amounting to R78.5 billion as of March 31, 2013. It is estimated that the UIF’s financial performance surplus prior to reserving over the next three fiscal years will be R6.4 billion in fiscal year 2014, R5.6 billion in fiscal year 2015 and R4.5billion in fiscal year 2016.
The projected decrease in the operational surplus is mainly attributable to the implementation of the Unemployment Insurance Amendment Bill, 2013. The Bill is presently going through the South African Parliamentary process and is envisaged to be law by 2014. The key changes introduced by this Bill includes the extension of the period of payment of benefits to the contributor from 8 – 12 months with a flat rate payment after eight months; and allows beneficiaries to claim if they have credits regardless of when last they claimed; extends the period during which dependents may apply for benefits on behalf of a deceased contributor from 6 – 18 months; extends the period in which a contributor can lodge a claim from 6 – 12 months and the date of unemployment is deemed to be the date when the claimant applies for benefits.
The UIF is committed to bringing services closer to its client base in all Provinces and provides services at 125 Department of Labour centres with processing functions and 823 visiting points. The number of decentralised processing sites increased from 57 in fiscal year 2008 to 91 in fiscal year 2013. The new virtual office project system introduced smart forms, which are expected to eventually lead to speedy processing and a reduction in paper usage. Employers will be accredited to participate in the online service in order to leverage the full value of this system. Another priority for the medium term is the recruitment and re-allocation of appropriate resources to manage the new business environment. The UIF added 205,185 new employees to its database, raising the total to 8,330,760 registered employees as at fiscal year 2013. A total of 1,465,218 employers are registered with the UIF and they are categorised mainly as commercial, domestic and taxi employers, with the majority in the commercial sector.
98
In response to the global economic crisis, the UIF (which formed part of the National Government’s Framework for South Africa’s Response to the International Economic Crisis) continues to play a pivotal role in schemes designed to inject funding into job creation and retention. The UIF issued R3,561 billion in placement bonds with the Industrial Development Corporation (IDC) as at the end of fiscal year 2013. The UIF/IDC bond is expected to save and create a combined total of 41,395 UIF paying jobs, in addition to the R1.2 billion committed by the UIF towards the Training Layoff Scheme which is designed to provide support to companies that are in distress due to the economic downturn with training and skills development as important elements of this response. The UIF also earmarked R400 million for the Training of Unemployed UIF beneficiaries to improve their chances of being reintegrated back into the labor market. During the 2012/13 financial year, three training initiatives were rolled out:
| | • | | Training of 1000 UIF beneficiaries and unemployed youth on various ICT related training programmes in a collaboration with the MICT SETA; |
| | • | | Training of 1000 UIF beneficiaries and unemployed youth on mining related artisan programmes in a collaboration with the Mining Qualification Authority; and |
| | • | | Training 1500 beneficiaries and unemployed youth in various artisan trades in collaboration with the MERSETA. |
Compensation Fund (CF)
The CF supports employees who experience loss of income as a result of injuries, death or disease in the course of employment. Funds are raised through assessed levies on companies.
While the CF remains financially sound with an accumulated surplus of R23.3 billion as of March 31, 2013, it has experienced administrative inefficiencies and challenges which are being addressed through a turnaround strategy, including the stabilisation of the new SAP system for the processing and payment of compensation claims and the upgrading of the Call Centre in order to improve access. The CF registered 196,509 claims and paid benefits to the value of R1.4billion in fiscal year 2013. The CF recorded a 3.5% increase in the number of registered employers at the end of fiscal year 2013 with a concomitant increase in revenue. The increase in revenue is attributed to the implementation of the e-Return On Earnings system, a system to help determine employer assessment and premiums based on the number of accidents and claims made so that those with less exposure to diseases and injuries pay less premiums. In response to the dissatisfaction expressed by the public regarding the unjustifiably long turnaround time in processing claims for occupational injuries and diseases, the CF is speeding up the process of restructuring the Fund and upgrading its information technology infrastructure. To ensure equity of access to services and to improve the claims turnaround time, the CF has piloted the decentralisation of its services to all nine provinces in fiscal year 2012 and has commenced with decentralisation of services in 2013. The Compensation Board reviewed existing benefits in fiscal year 2013 increasing the salary ceiling from R292,032 to R312,480 per annum; pension of employees and widow/ers was set at a minimum of R1000 per month; as well as increases to the monthly compensation pension by 6% in addition to 100% purchasing power of the low pension earners.
Road Accident Fund (RAF)
Understanding that there is a need to reform the unlimited liability system of compensation for road accident victims and supported by the reports of the RAF Commission in 2002, the Government set out on a reform path. In 2005, Parliament passed the RAF Amendment Act, which provided for a limited liability scheme to ensure the viability of the Fund. Five years after the promulgation of the RAF Amendment Act, the estimated reduced liability is R12.9 billion. The cabinet approved the strategy for the reform of the RAF in June 2006.
On February 8, 2013, the Department of Transport published the Road Accident Benefit Scheme (RABS) Bill, which creates a no-fault road accident system that aims to establish a fairer and more cost-effective system of statutory protection for road users, for public comment.
The provision for outstanding claims increased to R60.3 billion in the 2012/13 fiscal year, excluding provisions for accidents incurred but not reported. The 2013 valuation included changes to the methodology for grouping personal calms and provision for changes relating to the Amendment Act. The liability is expected to decrease of the medium term due to claim being finalised and claims handling capacity being increased.
99
South African Social Security Agency (SASSA)
The South African Social Security Agency (SASSA) derives its mandate from the South African Social Security Agency Act (2004). It became functional in 2006, taking over the mandate of administration and payments of grants from the provincial departments. The core business of the agency is to administer and pay social grants to beneficiaries. Social assistance means assistance or a financial award in the form of grants provided by the National Government to residents who are unable to sustain themselves. The agency is also required to develop and implement policies, programmes, standard operating procedures and systems for an efficient and effective social assistance benefits administration system.
Expenditure on social assistance increased from R44.9 billion at the end of the 2005/06 fiscal year to about R103.9 billion as at March 31, 2013, constituting 3.2% of GDP.
The Budget Process
The National Government’s fiscal year ends on March 31 of each year. The Minister of Finance and National Treasury prepare the Budget with the assistance of the Minister of Finance’s Committee on the Budget and approval of Cabinet. The National Treasury is responsible for the fiscal framework within which the budget is constructed and also coordinates the preparation of expenditure estimates.
The Minister of Finance presents the National Budget to Parliament in February of each year, with provincial treasuries separately presenting their budgets shortly after the National Budget is proposed. Since the presentation of the 1998-1999 Budget, Parliament has been presented each year with a set of three-year spending plans, but is asked to vote only on the budget for the coming year. Each year’s National Budget is based on certain key economic assumptions regarding, among other things, GDP growth, inflation, employment growth, taxable income, private consumption expenditure, government consumption expenditure, import and export levels and investment.
In addition to presenting expenditure estimates to Parliament, the Minister of Finance is responsible for estimating the revenue that existing taxes and tax rates will raise and for proposing tax amendments, if any. The National Budget then takes the form of an appropriations bill authorising National Government expenditures. The appropriations bill originates in the National Assembly and then goes to the Standing Committee on Appropriations of the National Assembly and the Select Committee on Appropriations of the National Council of Provinces before being debated and finally passed by both houses of Parliament towards the end of the Parliamentary session.
In April 2009, Parliament assented to the Money Bills Amendment Procedure and Related Matters Act of 2009 (the Money Bills Act). The Money Bills Act reconciles Parliament’s legislative and oversight mandate provided for in the Constitution and provides for, amongst others, a procedure to amend money bills before Parliament. In general, the new Money Bills Act is viewed as a legislative milestone that will afford Parliament powers to adjust the National Budget. In exercising its powers Parliament must ensure that: (a) there is an appropriate balance between revenue, expenditure and borrowing; (b) levels of debt and debt interest cost are reasonable; (c) the cost of recurrent spending is not deferred to future generations; and (d) there is adequate provision for spending on infrastructure development, overall capital spending and maintenance. In addition, Parliament must consider the short, medium and long-term implications of the fiscal framework, division of revenue and the long-term growth potential of the economy and the development of the country and must take into account cyclical factors that may impact on the prevailing fiscal position, public revenue and expenditure.
As in the case of the National Budget, the budgets of the provincial governments have been accompanied by three-year expenditure projections since 1999. The MTEF is intended to illustrate forward trends in expenditure priorities and to provide a firmer foundation for fiscal planning and review purposes.
The Minister of Finance is required to indicate each year how the expected deficit between consolidated government expenditure and revenue is to be financed or how any surplus is to be applied. The annual Consolidated Government Budget deficit financing requirement is principally met through the issue of long-term fixed and non-fixed-rate National Government debt in the domestic capital market. The South African bond market is well-developed and highly liquid, and has attracted considerable foreign investor interest. The National Government also borrows from time to time in foreign capital markets, in which case the interest due and final repayment must be repaid in foreign currency.
During the course of each fiscal year, government departments and other spending agencies are held to the spending plans approved in the National Budget by a system of expenditure controls under the direction of the National Treasury. Subsequently, audits of all government accounts provide Parliament and the public with verification of the uses to which public funds have been
100
put. The auditor-general, a constitutionally independent official, supervises this auditing process. Accountability is further promoted by the breakdown of expenditures into “votes” for particular government departments, whose director-generals are the accounting officers responsible for these monies. Further breakdowns into departmental programmes and into so-called economic classification items (for example, employee compensation and payments for capital assets) serve to indicate in more detail the commitment of funds to defined purposes.
The Treasury Committee, comprising the President, Deputy President, the Minister of Finance, the Deputy Minister of Finance and other Cabinet members who have been assigned the task of assisting the Cabinet in evaluating additional expenditure requests that arise during the course of a budget year, seeks to ensure prudent fiscal management. In order for the Treasury Committee to approve an additional expenditure request, the expenditure must be deemed to be unforeseeable and unavoidable, or to fall within another legally prescribed category to qualify for inclusion in the Adjustments Budget. A contingency reserve is set aside each year of the MTEF to deal with such requests. Such amendments to some elements of the current year’s budget and the Consolidated Budget (in departmental allocations) are made by Parliament in an Adjustments Budget towards the middle of the fiscal year.
Also around the end of October of each year, the Minister of Finance presents the MTBPS. This policy statement outlines the priority policy proposals and the new MTEF that will underpin the next year’s budget.
MTBPS
In the 2013 MTBPS, the National Treasury projects consolidated budget revenue for fiscal year 2013 to amount to R999.1 billion, or R8.4 billion higher than the February 2013 estimate. Taking into account projected under spending, declared unspent money and the adjusted state debt cost estimate, the revised estimate of total consolidated expenditure in fiscal year 2013 is R1143.7 billion. In February 2013, an expenditure of R1149.4 billion was budgeted for fiscal year 2013. The budget balance of the consolidated Government for fiscal year 2013 has been revised to a deficit of 4.2% of GDP. As the economy recovers over the next three years, the budget balance projection declines to 3.0% of GDP in fiscal year 2016.
The audited tax revenue outcome of R813.8 billion for fiscal year 2012 was R12.6 billion lower than the original budget estimate in February 2012 and R3.7 billion higher than the revised 2013 Budget Review estimate.
Despite the weaker economic outlook and downward revisions to the in-year estimates, tax revenue collections continue to show resilience. While high wage settlements have boosted corporate income tax collections, risks to tax revenue over the MTEF include weaker consumer demand, which will impact value-added tax, and increased SACU transfers to the BLNS states. The Tax Review Committee established earlier this year, will inform any changes to tax policy. The 2013 MTBPS sets out the macroeconomic, fiscal and public-expenditure priorities for the medium term. The 2013 MTBPS illustrates a budget framework that seeks to transform the quality of spending in order to support the implementation of the National Development Plan. While the growth in expenditure will be contained over the MTEF period, expenditure on key social and economic programmes will continue to be maintained. There will also be an increased emphasis on the quality of government spending. Consolidated government expenditure of R1243.8 billion is proposed for fiscal year 2014, 8.8% more than the revised expenditure estimate for fiscal year 2013. An amount of R10.5billion is provided in addition to baselines over the MTEF. Public spending growth will continue to support investment in physical infrastructure, as well as increased investment in education and health. Expenditure on infrastructure by general government and non-financial public enterprises will continue to rise by an average annual nominal growth of 7% over the medium term. The public-sector borrowing requirement for 2013/14 is expected to remain relatively unchanged from the 2013 Budget estimates.
There is a resource allocation of R953.1 billion across the three spheres of government in fiscal year 2013. This increases to R1.2 trillion by fiscal year 2016. The local share of nationally raised revenue grows from 8.9% in fiscal year 2013 to 9.2% by fiscal year 2016, while the provincial share of 43.6% remains relatively constant over the same period. The proposed allocations aim to:
| | • | | cover the higher wage costs of 900 000 provincial public-sector employees, particularly those in education and health; |
| | • | | fund shelter for abuse victims; and |
| | • | | facilitate the roll-out of a new vaccine for human papillomavirus. |
Debt-service costs have fallen from nearly 5.6% of GDP in fiscal 1998 to 2.9% of GDP in fiscal year 2013. Declining deficits and fiscal surpluses in recent years have resulted in a particularly pronounced drop in debt-service costs. This created significant fiscal space, enabling the government to preserve the real value of previous allocations and make available additional resources to improve the availability and delivery of public services without having to increase taxes. The National Government’s decision to
101
sustain spending in key areas, following the recession of fiscal year 2010, meant additional borrowing was required to cover the slowdown in revenue collections. Over the 2014 MTEF debt-service costs will average 2.9% of GDP and is the fastest growing area of expenditure. The paying down of debt-service costs will create fiscal space if the economic environment should deteriorate further.
2014 MTEF
The MTBPS have announced the 2014 MTEF, which sets out the consolidated expenditure framework for fiscal year 2013/14 through to fiscal year 2016/17. The framework consists of revised baseline estimates reflecting the government’s current spending priorities, including education, social protection, transport and health services (which take up the largest of planned expenditure). Strong growth over the future spending period can be seen in employment and social security, economic infrastructure and local government, housing and community amenities.
2013-2014 National Budget and Consolidated Government Budgets
2013-2014 National Budgets
In February 2013, the South African Minister of Finance submitted the 2013-2014 National Budget to Parliament.
The 2013-2014 National Budget and the three-year MTEF estimates continued the Government’s countercyclical fiscal stance and gave effect to budgetary priorities such as continued spending on social services, developing infrastructure, creating jobs, developing human resources, ensuring the safety and security of the state and citizenry, broadening access to economic opportunities and ensuring support for local development.
The 2013-2014 National Budget allocated an additional R6.8 billion to the nine provincial governments for the first two years of the 2014 MTEF, each of which has responsibility for developing its own budget and financial administration within the constraints of national fiscal policy. Although the 2013-2014 National Budget continues the process of devolution of expenditure and revenue-raising authority to the provincial governments, the National Government exercises budgetary control over these governments and has prepared standardised sets of accounts for use by all levels of government.
The National Government estimates that total national revenues for fiscal year 2013 will amount to R881.1billion. National budget expenditures for fiscal year 2013 were estimated at R1,049.6 billion. Consequently, a main budget deficit of R168.5billion, or 4.8% of GDP, was forecast. The inclusion of extraordinary receipts and payments into the new reporting format means that there is no longer a distinction between the main budget deficit and the borrowing requirement.
2013-2014 Consolidated Government Budget
The amounts reflected in the budget votes of the national departments whose functions are partially devolved to the provinces do not illustrate total allocations to such functions. By contrast, the Consolidated Government Budget presents a more relevant measure of trends and priorities in government finances in South Africa, particularly in the socio-economic field, and hence the tables and discussion below focus on this measure of government expenditure. See “Public Finance — Background.”
The 2013-2014 consolidated government expenditure was budgeted at R1,143.7 billion for fiscal year 2013. The deficit on the Consolidated Government Budget is lower than that in the main National Budget due to surpluses in the provinces and the social security funds, primarily the Unemployment Insurance Fund and Compensation Funds.
The estimated 2013-2014 Consolidated Government Budget continues to build on policy priorities established in 2001, with a special emphasis on growth-enhancing spending as well as spending programmes that target the poor and vulnerable groups. Growth in all categories of social services spending reflects the National Government’s commitment in improving the social well-being of South Africans.
Education remained the largest category of expenditure, followed by welfare and social security services. Health care expenditure remained significant.
102
The following table sets forth the Consolidated Government Expenditure as set out in the MTBPS for the periods indicated.
| | | | | | | | | | | | | | | | | | | | | | | | |
Fiscal year R million | | 2010
Outcome | | | % of
total | | | 2011
Outcome | | | % of
total | | | 2012
Outcome | | | % of
total | |
Economic classification | | | | | | | | | | | | | | | | | | | | | | | | |
Current payments | | | 522,391 | | | | 59.4 | % | | | 580,995 | | | | 61.1 | % | | | 633,724 | | | | 60.8 | % |
Compensation of employees | | | 309,878 | | | | 35.2 | % | | | 345,537 | | | | 36.3 | % | | | 375,397 | | | | 36.0 | % |
Goods and services | | | 137,177 | | | | 15.6 | % | | | 153,703 | | | | 16.2 | % | | | 165,113 | | | | 15.8 | % |
Interest and rent on land | | | 75,336 | | | | 8.6 | % | | | 81,755 | | | | 8.6 | % | | | 93,214 | | | | 8.9 | % |
Transfers and subsidies | | | 279,319 | | | | 31.8 | % | | | 306,346 | | | | 32.2 | % | | | 337,855 | | | | 32.4 | % |
Provinces and municipalities | | | 66,357 | | | | 7.5 | % | | | 73,312 | | | | 7.7 | % | | | 82,636 | | | | 7.9 | % |
of which: Local government share | | | 60,904 | | | | 6.9 | % | | | 68,251 | | | | 7.2 | % | | | 76,440 | | | | 7.3 | % |
Departmental agencies and accounts | | | 18,470 | | | | 2.1 | % | | | 22,170 | | | | 2.3 | % | | | 25,000 | | | | 2.4 | % |
Higher education institutions | | | 17,891 | | | | 2.0 | % | | | 19,758 | | | | 2.1 | % | | | 22,095 | | | | 2.1 | % |
Public corporations and private enterprises | | | 18,089 | | | | 2.1 | % | | | 19,329 | | | | 2.0 | % | | | 22,327 | | | | 2.1 | % |
Foreign governments and international organisations | | | 1,248 | | | | 0.1 | % | | | 1,547 | | | | 0.2 | % | | | 1,743 | | | | 0.2 | % |
Non-profit institutions | | | 21,277 | | | | 2.4 | % | | | 23,062 | | | | 2.4 | % | | | 24,050 | | | | 2.3 | % |
Households | | | 135,986 | | | | 15.5 | % | | | 147,168 | | | | 15.5 | % | | | 160,004 | | | | 15.3 | % |
Payments for capital assets | | | 55,705 | | | | 6.3 | % | | | 61,165 | | | | 6.4 | % | | | 67,962 | | | | 6.5 | % |
Buildings and other capital assets | | | 42,233 | | | | 4.8 | % | | | 44,153 | | | | 4.6 | % | | | 50,853 | | | | 4.9 | % |
Machinery and equipment | | | 9,914 | | | | 1.1 | % | | | 13,262 | | | | 1.4 | % | | | 13,921 | | | | 1.3 | % |
Land and sub-soil assets | | | 2,169 | | | | 0.2 | % | | | 2,533 | | | | 0.3 | % | | | 1,737 | | | | 0.2 | % |
Software and other intangible assets | | | 1,237 | | | | 0.1 | % | | | 1,186 | | | | 0.1 | % | | | 1,382 | | | | 0.1 | % |
Other assets | | | 151 | | | | 0.0 | % | | | 32 | | | | 0.0 | % | | | 69 | | | | 0.0 | % |
Payments for financial assets | | | 22,331 | | | | 2.5 | % | | | 2,796 | | | | 0.3 | % | | | 3,317 | | | | 0.3 | % |
| | | | | | | | | | | | | | | | | | | | | | | | |
Total consolidated expenditure | | | 879,746 | | | | 100.0 | % | | | 951,303 | | | | 100.0 | % | | | 1,042,858 | | | | 100.0 | % |
| | | | | | | | | | | | | | | | | | | | | | | | |
Note: —
| (1) | These figures were estimated by the National Treasury and may differ from data published by Stats SA and the SARB. The numbers in this table are not strictly comparable to those published in previous years due to the reclassification of expenditure items for previous years. Data for the history years have been adjusted accordingly. |
Source: South African National Treasury
The following table sets forth the Consolidated Government Expenditure as set out in the MTBPS for the periods indicated. Please note that, while the line items may differ from the 2010-2012 Consolidated Government Budget table, the categories remain the same and can be compared.
103
Consolidated Government Expenditure for Fiscal year 2010 – 2016
| | | | | | | | | | | | | | | | | | | | | | | | | | | | | | | | |
R billion | | 2010/11 | | | | | | | | | 2013/14 | | | 2014/15 | | | 2015/16 | | | 2016/17 | | | Average annual growth 2013/14 – | |
| | Outcome | | | 2011/12 | | | 2012/13 | | | Revised | | | Medium-term estimates | | | 2016/17 | |
Defense, public order and safety | | | 118.8 | | | | 129.8 | | | | 141.7 | | | | 154.5 | | | | 163.6 | | | | 172.7 | | | | 184.4 | | | | 6.1 | % |
Defense and state security | | | 34.0 | | | | 37.8 | | | | 41.3 | | | | 44.9 | | | | 47.5 | | | | 50.4 | | | | 53.6 | | | | 6.1 | % |
Law courts | | | 12.5 | | | | 13.5 | | | | 15.1 | | | | 16.9 | | | | 18.1 | | | | 19.1 | | | | 20.6 | | | | 6.8 | % |
Police services | | | 57.6 | | | | 62.1 | | | | 68.0 | | | | 74.1 | | | | 78.2 | | | | 82.4 | | | | 88.0 | | | | 5.9 | % |
Prisons | | | 14.7 | | | | 16.3 | | | | 17.3 | | | | 18.5 | | | | 19.7 | | | | 20.8 | | | | 22.1 | | | | 6.1 | % |
Economic infrastructure | | | 87.6 | | | | 71.4 | | | | 78.6 | | | | 84.3 | | | | 94.1 | | | | 102.7 | | | | 105.8 | | | | 7.9 | % |
Communication | | | 2.2 | | | | 1.8 | | | | 2.6 | | | | 3.3 | | | | 2.9 | | | | 3.2 | | | | 3.5 | | | | 1.3 | % |
Fuel and energy | | | 26.5 | | | | 7.2 | | | | 7.9 | | | | 7.9 | | | | 8.9 | | | | 9.6 | | | | 10.3 | | | | 8.9 | % |
Transport | | | 59.0 | | | | 62.3 | | | | 68.2 | | | | 73.0 | | | | 82.3 | | | | 89.9 | | | | 92.0 | | | | 8.0 | % |
Economic services | | | 35.7 | | | | 39.3 | | | | 43.7 | | | | 47.3 | | | | 48.7 | | | | 51.1 | | | | 53.4 | | | | 4.2 | % |
Education and related functions | | | 176.8 | | | | 199.7 | | | | 216.1 | | | | 233.6 | | | | 250.2 | | | | 267.8 | | | | 286.5 | | | | 7.0 | % |
Employment and social security | | | 33.8 | | | | 33.8 | | | | 39.0 | | | | 50.6 | | | | 60.0 | | | | 66.7 | | | | 74.6 | | | | 13.8 | % |
General public services | | | 47.6 | | | | 54.9 | | | | 57.9 | | | | 62.1 | | | | 65.3 | | | | 69.4 | | | | 71.0 | | | | 4.6 | % |
Health | | | 100.6 | | | | 113.3 | | | | 126.0 | | | | 133.3 | | | | 144.2 | | | | 153.9 | | | | 164.2 | | | | 7.2 | % |
Social protection | | | 103.7 | | | | 114.1 | | | | 122.9 | | | | 132.7 | | | | 145.0 | | | | 154.6 | | | | 164.2 | | | | 7.3 | % |
Local government, housing and community amenities | | | 96.6 | | | | 105.3 | | | | 115.2 | | | | 128.1 | | | | 141.2 | | | | 153.8 | | | | 163.2 | | | | 8.4 | % |
Housing development | | | 21.4 | | | | 25.2 | | | | 28.1 | | | | 31.4 | | | | 34.5 | | | | 37.1 | | | | 39.1 | | | | 7.6 | % |
Local government and community development | | | 53.9 | | | | 59.7 | | | | 66.7 | | | | 71.9 | | | | 77.8 | | | | 84.7 | | | | 89.2 | | | | 7.4 | % |
Water supply | | | 21.3 | | | | 20.4 | | | | 20.4 | | | | 24.8 | | | | 28.8 | | | | 32.0 | | | | 34.9 | | | | 12.1 | % |
Science and technology and environmental affairs | | | 12.3 | | | | 13.4 | | | | 13.7 | | | | 16.8 | | | | 18.1 | | | | 19.5 | | | | 19.5 | | | | 5.2 | % |
| | | | | | | | | | | | | | | | | | | | | | | | | | | | | | | | |
Allocated by function | | | 813.5 | | | | 874.8 | | | | 954.7 | | | | 1,043.2 | | | | 1,130.4 | | | | 1,212.3 | | | | 1,286.8 | | | | 7.2 | % |
State debt cost | | | 66.2 | | | | 76.5 | | | | 88.1 | | | | 100.5 | | | | 110.4 | | | | 122.2 | | | | 135.4 | | | | 10.4 | % |
Contingency reserve | | | — | | | | — | | | | — | | | | — | | | | 3.0 | | | | 6.0 | | | | 18.0 | | | | | |
| | | | | | | | | | | | | | | | | | | | | | | | | | | | | | | | |
Consolidated expenditure1 | | | 879.7 | | | | 951.3 | | | | 1,042.9 | | | | 1,143.7 | | | | 1,243.8 | | | | 1,340.4 | | | | 1,440.2 | | | | 8.0 | % |
| | | | | | | | | | | | | | | | | | | | | | | | | | | | | | | | |
Economic classification | | | | | | | | | | | | | | | | | | | | | | | | | | | | | | | | |
Current payments | | | 522.4 | | | | 581.0 | | | | 633.7 | | | | 694.2 | | | | 742.0 | | | | 793.8 | | | | 851.8 | | | | 7.1 | % |
Compensation of employees | | | 309.9 | | | | 345.5 | | | | 375.4 | | | | 409.0 | | | | 437.2 | | | | 466.9 | | | | 498.9 | | | | 6.8 | % |
Goods and services | | | 137.2 | | | | 153.7 | | | | 165.1 | | | | 178.6 | | | | 188.2 | | | | 198.1 | | | | 211.8 | | | | 5.9 | % |
Interest and rent on land | | | 75.3 | | | | 81.8 | | | | 93.2 | | | | 106.6 | | | | 116.6 | | | | 128.8 | | | | 141.0 | | | | 9.8 | % |
of which: state debt cost | | | 66.2 | | | | 76.5 | | | | 88.1 | | | | 100.5 | | | | 110.4 | | | | 122.2 | | | | 135.4 | | | | 10.4 | % |
Transfers and subsidies | | | 279.3 | | | | 306.3 | | | | 337.9 | | | | 370.1 | | | | 407.6 | | | | 442.0 | | | | 468.7 | | | | 8.2 | % |
104
| | | | | | | | | | | | | | | | | | | | | | | | | | | | | | | | |
R billion | | 2010/11 | | | | | | | | | 2013/14 | | | 2014/15 | | | 2015/16 | | | 2016/17 | | | Average annual growth 2013/14 – | |
| | Outcome | | | 2011/12 | | | 2012/13 | | | Revised | | | Medium-term estimates | | | 2016/17 | |
Provinces and municipalities | | | 66.4 | | | | 73.3 | | | | 82.6 | | | | 92.2 | | | | 99.5 | | | | 110.1 | | | | 116.4 | | | | 8.0 | % |
Departmental agencies and accounts | | | 18.5 | | | | 22.2 | | | | 25.0 | | | | 22.4 | | | | 25.3 | | | | 27.5 | | | | 28.0 | | | | 7.7 | % |
Higher education institutions | | | 17.9 | | | | 19.8 | | | | 22.1 | | | | 23.6 | | | | 25.3 | | | | 27.0 | | | | 29.0 | | | | 7.2 | % |
Foreign governments and international organisations | | | 1.2 | | | | 1.5 | | | | 1.7 | | | | 2.0 | | | | 2.0 | | | | 2.1 | | | | 2.2 | | | | 3.0 | % |
Public corporations and private enterprises | | | 18.1 | | | | 19.3 | | | | 22.3 | | | | 24.9 | | | | 26.2 | | | | 28.3 | | | | 29.4 | | | | 5.6 | % |
Non-profit institutions | | | 21.3 | | | | 23.1 | | | | 24.1 | | | | 28.5 | | | | 30.0 | | | | 31.7 | | | | 33.2 | | | | 5.3 | % |
Households | | | 136.0 | | | | 147.2 | | | | 160.0 | | | | 176.6 | | | | 199.3 | | | | 215.3 | | | | 230.6 | | | | 9.3 | % |
Payments for capital assets | | | 55.7 | | | | 61.2 | | | | 68.0 | | | | 75.7 | | | | 87.9 | | | | 95.6 | | | | 101.7 | | | | 10.3 | % |
Buildings and other capital assets | | | 45.8 | | | | 47.9 | | | | 54.0 | | | | 59.8 | | | | 70.8 | | | | 76.9 | | | | 81.7 | | | | 11.0 | % |
Machinery and equipment | | | 9.9 | | | | 13.3 | | | | 13.9 | | | | 16.0 | | | | 17.1 | | | | 18.7 | | | | 20.0 | | | | 7.8 | % |
Payments for financial assets | | | 22.3 | | | | 2.8 | | | | 3.3 | | | | 3.6 | | | | 3.3 | | | | 3.0 | | | | 0.0 | | | | | |
| | | | | | | | | | | | | | | | | | | | | | | | | | | | | | | | |
Total | | | 879.7 | | | | 951.3 | | | | 1,042.9 | | | | 1,143.7 | | | | 1,240.8 | | | | 1,334.4 | | | | 1,422.2 | | | | 7.5 | % |
Contingency reserve | | | — | | | | — | | | | — | | | | — | | | | 3.0 | | | | 6.0 | | | | 18.0 | | | | | |
| | | | | | | | | | | | | | | | | | | | | | | | | | | | | | | | |
Consolidated expenditure1 | | | 879.7 | | | | 951.3 | | | | 1,042.9 | | | | 1,143.7 | | | | 1,243.8 | | | | 1,340.4 | | | | 1,440.2 | | | | 8.0 | % |
| | | | | | | | | | | | | | | | | | | | | | | | | | | | | | | | |
| 1. | Consisting of national, provincial, social security funds and selected public entities. |
Source: South African National Treasury
During the past decade, growth in consolidated National Government expenditure has exceeded both nominal GDP growth and population growth in South Africa due to the occurrence of various extraordinary items. In fiscal 1993 and fiscal 1994, public-sector borrowing amounted to approximately 10% of GDP. These extraordinary items have included the costs of early retirement offers to former civil servants, losses incurred by the SARB on its foreign exchange forward cover operations and various costs associated with political transition in 1994 and the establishment of a new democratic order. If Consolidated Government expenditure is broadened to include all expenditures by universities and polytechnics (including those in the former TBVC states) and local governments, total government expenditure (technically referred to as general government expenditure) rose from 30% of GDP in fiscal 1983 to 40.9% of GDP in fiscal 1994, of which 3.8% represented settlements of extraordinary liabilities to National Government pension funds and the SARB. Consolidated government expenditure was 30.8% of GDP in fiscal year 2008 and the public-sector borrowing requirement was in deficit at R93.4 billion, or 4% of GDP.
Taxation
Taxation in South Africa is administered by SARS, an autonomous body managed by a board of directors and established by legislation to collect revenue and ensure compliance with tax law. SARS’ vision is to be an innovative revenue and customs agency that enhances economic growth and social development and supports South Africa’s integration into the global economy in a way that benefits all South African citizens. Amongst others, SARS collects personal income tax, company tax, value-added tax, customs duties on imports, excise duties on prescribed goods, fuel levies and various other taxes.
While most tax revenues are collected at the national level, municipalities impose and collect property taxes. In addition, the main sources of revenue (although limited in scope) for provinces are motor vehicle licence fees and gambling taxes. Non-tax user charges are levied principally by municipalities and extra-budgetary institutions, such as universities, museums, statutory research councils and public entities.
The National Government aims to maintain and strengthen a tax system that is fair, efficient and internationally competitive, while meeting fiscal policy requirements. Recognising that improving tax administration and collection are essential steps towards achieving meaningful tax reform in the future, the National Government seeks to narrow the tax compliance gap and broaden the tax base. It is the National Government’s policy to keep tax law as simple as possible in order to minimise collection and compliance costs and to monitor the tax system on a continuous basis.
105
Tax Revenue
Audited results show that tax revenue for fiscal year 2011/12 of R742.7 billion 10.2% higher than the amount collected in fiscal year 2010/11. The revised tax revenue estimate for fiscal year 2012/13 of R810.2 billion is 9.1% higher than collected in fiscal year 2011/12, but R16.3 billion lower than the budget estimate for 2012. Personal income tax (R250.4 billion), value added tax (R191 billion) and corporate income tax (R173.7 billion) made the biggest contribution to total tax revenue for fiscal year 2011/12.
Continued global uncertainty and the fiscal crisis in Europe have dampened growth in South Africa resulting in lower than budgeted tax revenue.
Personal Income Tax
South Africa has a progressive personal income tax system whereby income categories in different brackets are taxed at different rates. As of 2013 for individuals earning between 0 and R165,600, a tax rate of 18% is levied. This is the lowest tax bracket, with four other brackets being applied to higher income earners. The top bracket has a tax rate of 40%, and it applies to individuals earning more than R638,600. The tax system also provides primary rebates for all taxpayers, as well as secondary rebates for people aged 65 years and older, and a tertiary rebate for people 75 years or older. In practice it means that people earning less than R67,111 will not pay any tax, while those aged 65 years and older will not pay tax if they earn less than R104,611. For those older than 75 years, the tax threshold is R117,111.
The National Government has over the past ten years adjusted income tax brackets to take account of the effects of inflation on income tax paid by individuals. In fiscal year 2012/13, budget proposals resulted in net tax relief of R4.1 billion. Personal income tax bracket adjustments amounted to R8.9 billion in revenue loss. Most of the relief was provided to the lower-income brackets.
Tax deductions on personal income tax include deductions for pension contributions, while tax credits are provided for individuals belonging to medical aids. In addition interest income of up to R22,800 is tax exempt for individuals younger than 65 years, and R33,000 for those 65 years and older.
Company Tax
Over the past few years, South Africa has reduced the headline corporate income tax rate from 40% to 35% in fiscal year 1995/96, 30% in fiscal year 2000/01, 29% in fiscal year 2006/07 and 28% in fiscal year 2009/10. Currently, the rate is still 28%, and the secondary tax on companies (STC) has been replaced by a 15% tax on dividends, taxable in the hands of investors and not at company level anymore.
Small business corporations (SBCs) with an annual turnover less than R20 million have certain special tax provisions. They are taxed on a graduated scale with the first R67,000 being tax free. There are also 7% and 21% brackets, with only earnings in excess of R550,000 taxed at 28%. In addition SBC’s may benefit from accelerated depreciation of assets. There is also a turnover tax option for businesses with an annual turnover of less than R1 million, in an attempt to minimise their compliance burden, while investors are encouraged to fund small businesses through a Venture Capital Company regime. Investments in VCC’s are tax deductible, provided that the investments meet the necessary requirements.
South African tax legislation contains certain corporate reorganisation rollover rules. These rules are intended to facilitate the tax free transfer of assets in specified circumstances. Taxpayers may not generally deduct interest incurred in respect of loan funding used to acquire shares because shares generally only produce exempt income. However, taxpayers can indirectly obtain a deduction for interest when acquiring shares of a target company when the acquisition is associated with certain rollover reorganisation. The rollover rules were never intended to enable interest deductions when those deductions would not otherwise be available. A measure to control interest deductions in respect of debt used to procure, enable, facilitate or fund certain reorganisation transactions has been introduced. to prevent the misuse of acquisition debt, interest deductions associated with this debt are currently subject to discretionary limits as determined by SARS. These limits are designed to target potential base erosion caused by excessive debt. From April 1, 2014 the aggregate deductions for interest paid or incurred in respect of acquisition debt will become subject to an annual limitation pursuant to a defined formula.
The new concept of “headquarter company” was introduced with effect from January 1, 2011. Headquarter companies enjoy certain tax and exchange control relief and the concept is aimed at positioning South Africa as a holding company gateway for foreign multinationals into Africa.
106
As of January 1, 2011, in order to qualify as a headquarter company, certain requirements must be met, inter alia:
| | • | | a headquarter company must be a South African resident company; |
| | • | | each shareholder of the company (whether alone or together with any other company forming part of the same group of companies as the shareholder) holds 10% or more of the equity shares and voting rights in that company; |
| | • | | at least 80% or more of the cost of the total assets of the company is attributable to any interest in equity shares in, any amount loaned or advanced to, or any intellectual property as defined that is licensed by the headquarter company to, any foreign company in which the headquarter company held at least 10% of the equity shares and voting rights; |
| | • | | where the gross income of the headquarter company exceeds R5 million, at least 50% or more of its gross income consists of rental, dividends, interest, royalty or service fees paid by a foreign company, and/or proceeds from the disposal of equity shares in a foreign company or of any intellectual property which had been licensed by the headquarter company to the foreign company. |
As of January 1, 2010, the distributions from collective investment schemes (CIS), follow the flow-through principle, meaning that the income (e.g. interest, dividends, etc.) received by the CIS in securities will retain its nature when distributed to the CIS unit holders. A withholding tax on interest was introduced which took effect on January 1, 2013. As a result all interest paid to non-residents is taxed at a final withholding tax rate of 10% and is payable within 14 days after the end of the month during which the interest is paid. However, this 10% withholding charge is subject to some exemptions.
The exemption of interest owed by domestic banks does not include back-to-back loan agreements designed to circumvent the 10% withholding tax e.g., if the bank acts as an intermediary to facilitate the unlisted borrowing of funds by a domestic company from a foreign lender. In addition to the exemption for mobile portfolio debt capital, cross-border interest withholding contains three additional exemptions which apply to: (i) trade finance, (ii) certain foreign payors and foreign payees, and (iii) certain forms of debt owed by a headquarter company. South African double tax agreements with low tax jurisdictions that provide for a zero withholding rate will be renegotiated.
International transactions are currently subject to rules dealing with transfer pricing and controlled foreign companies.
As of January 1, 2011, a controlled foreign company includes a foreign company where more than 50% of the total participation rights in that foreign company is not only directly held, but also indirectly held by one or more persons that are South African residents other than persons that are headquarter companies. If one or more South African residents hold more than 50% of the participation rights in an offshore cell, the cell will be deemed to be a controlled foreign company without regard to ownership in the other cells. As of April 1, 2012, the ownership threshold in respect of the dividend and capital gain participation exemptions in relation to foreign shares was reduced from 20% down to 1%. This lower threshold is consistent with global economic concept of direct foreign investment and that of the South African exchange control requirements. It is important to note that the foreign dividend participation exemption provision contains so-called anti-cycle scheme rules within the participation exemption so as to prevent the offshore cycling of funds. The participation exemption does not apply if the foreign dividends at issue arose directly or indirectly from a South African deductible payment that is not subject to South African normal tax in the hands of the offshore recipients.
With effect from January 1, 2012, the domestic corporate restructuring rollover rules were extended to fully include the restructuring of offshore companies that remain under the control of the same South African group companies. The asset-for-share, amalgamation, unbundling and liquidation rules will be revised to cover offshore restructurings.
A new uniform system of source rules was introduced on January 1, 2012. The new uniform system combines the common law, pre-existing rules and tax treaty principles. These source rules will loosely reflect implicit tax treaty principles, with a few added built-in protections, so that the South African system is globally aligned. The new source rules eliminate the concept of deemed source. South African sources of income are now fully defined and items of income falling outside these definitions will be treated as foreign source income, unless a particular category of income is not expressly defined, in which case the common rules will continue to apply.
South Africa has also introduced a new limited foreign tax credit that was effective as of January 1, 2012. This foreign tax credit is limited solely to foreign withholding taxes imposed in respect of services rendered in South Africa. These tax credits are limited solely to South African taxes otherwise imposed on the same service income after taking applicable deductions into account.
South Africa has introduced specific provisions in the various tax acts (Income tax Act, Value Added Tax and Securities Transfer Tax) to cater for Islamic finance. The changes focus on certain commonly used Shari’a compliant arrangements within South Africa, particularly Mudaraba, Murabaha and Diminishing Musharaka. Also proposed in 2011 was the introduction of a government Sukuk (an Islamic bond) that will be issued domestically. The changes seek to place the above mentioned products on an equal footing with conventional finance products. These changes will be effective from a date to be announced by the Minister of Finance by notice in the Gazette.
107
Effective April 1, 2012, transfer pricing rules were modernised to be in line with the OECD guidelines. The amendment will shift the focus from goods and services to a broader category of “cross-border transactions, operations, schemes, agreements or understandings” that have been effected between, or undertaken for the benefit of connected persons. SARS will publish new guidelines dealing with transfer pricing in the form of an Interpretation Note. The new transfer pricing rules are closely aligned with the wording of the OECD and UN Model Tax Conventions and are in line with tax treaties and other international tax principles.
In relation to the thin-capitalisation provisions, the new amendments effectively take away the Commissioner’s discretion to determine whether or not financial assistance provided to a South African resident by a non-resident who is connected to the resident, is excessive in relation to the fixed capital of the recipient of the financial assistance. The taxpayer will now be obliged to ensure that all its transactions are done on an arm’s length basis. Further, the thin capitalisation rules have now been merged directly into the transfer pricing rules. The transfer pricing rules will henceforth be used to deny deductions for interest that would not have existed had a South African entity not been thinly capitalised with excessive debt.
Investors in equity funds constituted as partnerships or trusts will be granted tax relief and will be regarded as having a permanent establishment in South Africa merely by virtue of their investment. This tax relief places limited partners of trust beneficiaries in the same position had these investors invested directly in the underlying assets of the partnership or trust. The investors will not be exposed to South African tax merely because of the portfolio management activities carried on in South Africa. However, management fees of the South African manager, general partner or trustee will remain taxable in South Africa. To qualify for this relief the investor must satisfy the following requirements: (i) the partner or trust beneficiary must have limited liability like a shareholder of a company; (ii) the partner or trust beneficiary must not participate in the effective management of the business of the partnership or trust; (iii) the partner or the trust beneficiary must not have the authority to act on behalf of the partnership or trust or on behalf of the members of the partnership or trust and (iv) the partner or trust beneficiary must not render any services to or on behalf of the partnership or trust.
A new definition of a “foreign partnership” was introduced into the Income Tax Act for tax years commencing after October 1, 2010. The purpose of the new definition is to ensure that entities like limited liability partnerships or limited liability companies and similar hybrid entities are not treated as companies when they are in fact partnerships. The new definition therefore synchronises the South African tax treatment of these entities with foreign tax practice. To qualify as a foreign partnership, an entity must be a partnership, association or body of persons established or formed under foreign law.
In an effort to encourage conservation of South Africa’s rich biodiversity, the Income Tax Act contains tax incentives (introduced in the 2008–2009 Budget) for private landowners that have entered into bilateral agreements to conserve and maintain a particular area of land on behalf of the National Government under the terms of the National Environmental Management: the Biodiversity Act of 2004 and: National Environmental Management: the Protected Areas Act of 2003. Landowners are eligible for income tax deductions for environmental maintenance and rehabilitation expenses as well as the loss of the right to use land associated with biodiversity conservation and management under the terms of these agreements. Furthermore, the mineral and petroleum royalty regime came into effect in two phases: Section 1 of the Royalty Act came into effect on November 1, 2009, and the rest of the Royalty Act came into effect on March 1, 2010. Variable royalty rates will apply according to two separate formulae for refined and unrefined minerals. The tax base is gross sales less certain expenses.
Previously, two sets of transaction taxes applied to trading in investment securities: (1) stamp duty, in the case of unlisted shares and (2) un-certificated securities tax, in the case of exchange-traded securities. To simplify administration and to eliminate anomalies created by this dual treatment, with effect from July 1, 2008, all secondary trading in shares (listed or otherwise) are, under the terms of the Securities Transfer Tax Act (replacing the Stamp Duties Act and Un-certificated Securities Tax Act), were subject to a single securities transfer tax, at a rate of 0.25%. Amendments to simplify exemptions and clarify the impact on derivative products and partial disposals were also introduced.
Depreciation allowances, including the accelerated depreciation relief for urban development zones, are available to taxpayers that invest in (by erecting or refurbishing) any commercial or residential building within specified urban development zones. The allowance is deductible in the year the erected building or the refurbished part of the building is brought into use by the taxpayer for purposes of trade, and this depreciation relief will benefit owners, users or lessors of such buildings.
The amount of the allowance is dependent on whether the taxpayer erects a new commercial or residential building or refurbishes an existing commercial or residential building. Taxpayers that erect a new commercial or residential building within a specified urban development zone will be allowed an 11-year write-off period. In addition, 20% of the cost to the taxpayer of the erection or extension of or addition to that building, which is deductible in the year of assessment during which that building is brought into use by that taxpayer solely for the purposes of that taxpayer’s trade and 8% of that cost in each of the 10 succeeding years of assessment. Depreciation relief has also been afforded to environmental production and post-production assets. Both sets of assets must be ancillary to the manufacturing process, of a permanent nature and utilised to fulfill environmental obligations. Environmental production assets are eligible for a 40:20:20:20 rate of depreciation, while the rate of relief for environmental post-production assets (e.g. dams or disposal facilities) is 5% per annum (i.e., a 20 year straight-line write off period).
108
A voluntary disclosure programme was introduced by the SARS from November 2010 to October 2011. This programme allowed taxpayers who had defaulted on their tax payments to make voluntary disclosure to the SARS and avoid additional tax, penalties and interest being levied against them. The taxpayer participating in the voluntary disclosure programme had to meet certain requirements, such as the SARS not having been aware of the default prior to the taxpayer being allowed to participate in the voluntary disclosure programme. Criminal prosecution will not be initiated against the non-compliant taxpayers but the full amount in default will still have to be paid. The relief will apply to those who defaulted on their taxpayers before February 17, 2011.
Revenue
In fiscal year 2013, total tax revenue amounted to R813.8 billion, a 9.6% or R71.2 billion improvement from fiscal year 2012. In the 2013 Budget Review, revenue for the 2014 fiscal year was estimated to amount to R898.0 billion. Against a background of mixed economic growth, revenue for 2014 has been revised downwards R3 billion as shown in the table below.
Consolidated Government Revenue
| | | | | | | | | | | | | | | | | | | | |
| | | Summary of Revenue Collections for the Fiscal Year Ending 31 March, | |
| | | 2010 | | | 2011 | | | 2012 | | | 2013 | | | 2014 | |
| | | Actual | | | MTBPS
Estimate | |
| Source of Revenue | | Rand (thousand) | |
Taxes on income and profits | | | 359,044,851 | | | | 379,941,233 | | | | 426,584,730 | | | | 457,317,482 | | | | 496,828,526 | |
Persons and individuals | | | 205,145,022 | | | | 226,925,026 | | | | 250,399,638 | | | | 275,790,755 | | | | 307,700.000 | |
Companies | | | 134,883,421 | | | | 132,901,680 | | | | 151,626,678 | | | | 158,917,232 | | | | 170,200,000 | |
Secondary tax on companies | | | 15,467,796 | | | | 17,178,189 | | | | 21,965,406 | | | | 19,738,709 | | | | 17,000,000 | |
Tax on retirement funds | | | 42,699 | | | | 2,772 | | | | 6,665 | | | | 0.159 | | | | — | |
Interest on overdue income tax | | | 3,433,024 | | | | 2,904,485 | | | | 2,585,012 | | | | 2,870,029 | | | | 1,928,526 | |
Small business tax amnesty | | | 72,889 | | | | 29,080 | | | | 0,330 | | | | 0,597 | | | | — | |
Taxes on payroll and workforce | | | 7,804,828 | | | | 8,652,340 | | | | 10,173,133 | | | | 11,378,478 | | | | 12,300,000 | |
Skills development levy(1) | | | 7,804,828 | | | | 8,652,340 | | | | 10,173,133 | | | | 11,378,478 | | | | 12,300,000 | |
Taxes on property | | | 8,827,037 | | | | 9,102,302 | | | | 7,817,499 | | | | 8,645,211 | | | | 10,385,754 | |
Donations tax | | | 60,084 | | | | 64,584 | | | | 52,657 | | | | 82,101 | | | | 119,961 | |
Estate duty | | | 759,273 | | | | 782,325 | | | | 1,045,163 | | | | 1,012,978 | | | | 965,793 | |
Marketable securities tax | | | 3,324,633 | | | | 2,932,906 | | | | 2,886,114 | | | | 3,271,855 | | | | 4,000,000 | |
Transfer duties | | | 4,683,047 | | | | 5,322,487 | | | | 3,833,565 | | | | 4,278,277 | | | | 5,300,000 | |
Domestic Taxes on Goods and Services | | | 203,666,757 | | | | 249,490,376 | | | | 263,949,858 | | | | 297,725,819 | | | | 329,763,789 | |
Value added tax | | | 147,941,324 | | | | 183,571,439 | | | | 191,020,199 | | | | 215,839,965 | | | | 242,500,000 | |
Specific excise duties | | | 21,289,279 | | | | 22,967,617 | | | | 25,411,148 | | | | 28,458,622 | | | | 29,200,000 | |
Ad valorem excise duties | | | 1,275,942 | | | | 1,596,229 | | | | 1,828,347 | | | | 2,231,941 | | | | 2,231,941 | |
Fuel levy | | | 28,832,536 | | | | 34,417,577 | | | | 36,602,263 | | | | 10,320,197 | | | | 40,320,197 | |
Departure tax | | | 580,326 | | | | 647,810 | | | | 873,060 | | | | 873,060 | | | | 873,060 | |
Electricity levy | | | 3,341,691 | | | | 4,996,366 | | | | 6,429,721 | | | | 7,983,940 | | | | 7,983,940 | |
Other(2) | | | 405,658 | | | | 1,293,339 | | | | 2,018,764 | | | | 2,018,094 | | | | 2,018,094 | |
109
| | | | | | | | | | | | | | | | | | | | |
| | | Summary of Revenue Collections for the Fiscal Year Ending 31 March, | |
| | | 2010 | | | 2011 | | | 2012 | | | 2013 | | | 2014 | |
| | | Actual | | | MTBPS
Estimate | |
| Source of Revenue | | Rand (thousand) | |
Taxes on international trade and transactions | | | 19,318,561 | | | | 26,977,132 | | | | 34,125,493 | | | | 38,767,259 | | | | 45,725,931 | |
Customs duties | | | 19,577,115 | | | | 26,637,438 | | | | 34,197,901 | | | | 38,152,402 | | | | 45,100,000 | |
Import Surcharge | | | 35,766 | | | | 70,390 | | | | 64,229 | | | | 55,375 | | | | 103,940 | |
Miscellaneous customs and excise | | | (294,319 | ) | | | 2698,304 | | | | (141,146 | ) | | | 521,794 | | | | 521,991 | |
Stamp duties and fees | | | 49,457 | | | | 3,069 | | | | (2,894 | ) | | | 0,494 | | | | — | |
State miscellaneous revenue(3) | | | (5,724 | ) | | | 16,698 | | | | 7,403 | | | | 37,194 | | | | — | |
| | | | | | | | | | | | | | | | | | | | |
Total Gross Revenue | | | 598,705,767 | | | | 674,183,150 | | | | 742,649,713 | | | | 813,834,250 | | | | 895,004,000 | |
| | | | | | | | | | | | | | | | | | | | |
Departmental Revenue(4) | | | 8,888,521 | | | | 12,698,703 | | | | 19,193,092 | | | | 15,512,271 | | | | 17,949,586 | |
Of which Mineral Royalties and Mining leases | | | * | | | | 3,555,000 | | | | 5,691,586 | | | | 5,026,144 | | | | 6,188,634 | |
Less: SACU payments(5) | | | (27,915,405 | ) | | | (17,905,679 | ) | | | (21759,964 | ) | | | (42,151,276 | ) | | | (43,270,118 | ) |
Provinces, social security and selected public entities | | | 84,603,000 | | | | 89,228,000 | | | | 96,966,039 | | | | 108,513,546 | | | | 119,521,645 | |
| | | | | | | | | | | | | | | | | | | | |
Total budget revenue | | | 664,281,883 | | | | 758,204,173 | | | | 836,848,880 | | | | 895,708,791 | | | | 989,205,113 | |
| | | | | | | | | | | | | | | | | | | | |
Notes: —
| (1) | Levy on payroll dedicated to skills development. |
| (2) | Including turnover tax on small business, various levies: environmental levy on plastic bags, incandescent light bulb levy, vehicle emissions tax as well as receipts of the Universal Service Fund. |
| (3) | Revenue received by SARS from taxation which could not be allocated to specific revenue types. |
| (4) | Revenue generated from non-tax activities such as fines and dividends. Mineral royalty was effective from March 1, 2010. |
| (5) | South African Custom Union payments. |
Source: 2012-2013 Budget, the MTBPS and the South African National Treasury.
Between 2006 and 2009 gross tax revenues recorded an average annual nominal growth rate of 15.3%. This growth was on the back of an economic upswing driven by strong commodity prices, healthy exports and domestic consumption. In 2010 gross tax revenues declined by 4.2%, largely due to a collapse in corporate income tax (by 18.4%), value-added tax (by 4.1%) and import duty revenues (by 13.6%). Between 2011 and 2012, gross tax revenues grew by 12.6% and 10.2% respectively. In the 2013 fiscal year, the growth in nominal gross tax revenues decelerated to 9.6% largely due to labor unrest in the mining sector during the second half of calendar year 2013.
As highlighted earlier, nominal gross tax revenue for 2014 have been revised marginally downwards by R3 billion to R895 billion. This is primarily the result of downward revisions in dividend withholding tax revenues by (R5.9 billion) and Specific Excise Duties (R2.1 billion) below the 2013 Budget Review estimates. Fuel levy revenues have been revised downwards (R1.5 billion) mainly due to increased diesel refunds. Customs duty and personal income tax revenues are revised upwards by R3.7 billion and R1.5 billion respectively. Net VAT collections remain relatively unchanged but the composition of VAT reflects a slowdown in domestic VAT and growth in import VAT.
Financing
The following table sets forth the financing of the net borrowing requirement of the National Government for the six fiscal years ended March 31, 2013 and budgeted amounts for the fiscal year ending March 31, 2014.
110
Financing of the Net Borrowing Requirement of the National Government
| | | | | | | | | | | | | | | | | | | | | | | | | | | | |
| | | 2008 | | | 2009 | | | 2010 | | | 2011 | | | 2012 | | | 2013 | | | Budget
estimates
2014 | |
Borrowing | | | | | | | | | | | | | | | | | | | | | | | | | | | | |
Revenue | | | 560,794.6 | | | | 608,795.7 | | | | 579,684.5 | | | | 669,737.5 | | | | 740,084.0 | | | | 787,849.0 | | | | 869,683.5 | |
Expenditure | | | 541,443.4 | | | | 635,953.3 | | | | 747,196.8 | | | | 805,141.5 | | | | 888,523.0 | | | | 962,977.0 | | | | 1,049,393.3 | |
Budget balance(1) | | | 19,315.2 | | | | (27,157.6 | ) | | | (167,512.3 | ) | | | (135,403.0 | | | | (148,439.0 | ) | | | (175,128.0 | ) | | | (179,710.0 | ) |
% of GDP | | | 0.9 | % | | | (1.2 | )% | | | (6.8 | )% | | | (5.0 | )% | | | (5.0 | )% | | | (5.6 | )% | | | (5.2 | )% |
Plus: Extraordinary payments | | | (775.6 | ) | | | (4,284.1 | ) | | | (671.2 | ) | | | (838.6 | ) | | | (1,388.0 | ) | | | (2,587.2 | ) | | | (200.0 | ) |
Less: Extraordinary receipts | | | 1,849.8 | | | | 8,203.4 | | | | 6,428.6 | | | | 3,009.7 | | | | 5,209.0 | | | | 11,533.6 | | | | 11,401.0 | |
Net borrowing requirement | | | 20,425.4 | | | | (23,238.3 | ) | | | (161,754.9 | ) | | | (133,231.9 | ) | | | (144,618.0 | ) | | | (166,182.0 | ) | | | (168,509.0 | ) |
Financing | | | | | | | | | | | | | | | | | | | | | | | | | | | | |
Domestic short-term loans (net) | | | 5,672.9 | | | | 12,225.1 | | | | 49,770.3 | | | | 34,893.0 | | | | 18,725.0 | | | | 22,555.0 | | | | 23,000.0 | |
Domestic long-term loans (net) | | | (2,448.2 | ) | | | 23,059.0 | | | | 118,855.8 | | | | 136,849.8 | | | | 138,501.0 | | | | 125,771.0 | | | | 149,516.0 | |
Market loans | | | 26,820.2 | | | | 42,354.3 | | | | 132,394.9 | | | | 150,385.3 | | | | 154,108.0 | | | | 157,709.0 | | | | 170,059.0 | |
Extraordinary issues | | | — | | | | — | | | | — | | | | — | | | | — | | | | — | | | | — | |
Redemptions | | | (29,268.4 | ) | | | (19,295.3 | ) | | | (13,539.1 | ) | | | (13,535.6 | ) | | | (15,607.0 | ) | | | (31,938.0 | ) | | | (20,543.0 | ) |
Foreign loans (net) | | | (4,745.4 | ) | | | (3,954.4 | | | | 23,257.5 | | | | 2,839.6 | | | | 9,135.0 | | | | (11,622.0 | | | | 531.0 | |
Market loans | | | — | | | | — | | | | 30,872.4 | | | | 5,151.1 | | | | 12,025.0 | | | | — | | | | 19,619.0 | |
Arms procurement loan agreements | | | 2,426.5 | | | | 3,057.3 | | | | 800.0 | | | | 470.4 | | | | 569.0 | | | | 61.0 | | | | — | |
World Bank loans | | | 20.0 | | | | 1.4 | | | | — | | | | — | | | | — | | | | — | | | | — | |
Redemptions (including revaluation of loans) | | | (7,191.9 | ) | | | (7,013.1 | ) | | | (8,414.9 | ) | | | (2,781.9 | | | | (3,459.0 | | | | (29,683.0 | | | | (19,088.0 | ) |
Change in cash and other balances(2) | | | (18,904.7 | ) | | | (8,091.4 | ) | | | (30,128.9 | ) | | | (41,350.6 | ) | | | (21,743.0 | | | | 29,478.0 | | | | (4,538.0 | ) |
| | | | | | | | | | | | | | | | | | | | | | | | | | | | |
Total | | | (20,425.4 | ) | | | 23,238.3 | | | | 161,754.9 | | | | 133,231.9 | | | | 144,618.0 | | | | 166,182.0 | | | | 168,509.0 | |
| | | | | | | | | | | | | | | | | | | | | | | | | | | | |
Notes: —
| (1) | A negative number reflects a deficit and a positive number a surplus. |
| (2) | A positive change indicates a reduction in cash balances. |
Source: South African National Treasury.
In addition to transfers received from the National Budget and their own provinces’ revenue collections, Provincial Budgets are financed by means of opening balances and concessionary and non-concessionary funding such as loans by the DBSA. The deficit of the National Budget is financed mainly by domestic and foreign loans. The provinces are barred constitutionally from raising loans for current expenditure. Loans for bridging finance may be advanced, however, provided that the provinces redeem such loans within 12 months following the date on which they are obtained, and any special conditions be specified in an act of Parliament which is required to be recommended by the Financial and Fiscal Commission. In addition, the National Government may not guarantee any provincial or local government loans, unless the guarantee complies with the norms and conditions for such guarantee as set out in an act of Parliament. See “Public Finance — Background.”
111
Public Enterprises
The National Government owns a number of public enterprises (otherwise known as state-owned entities). The ministers under whose departments these enterprises fall act as the “Executive Authority” over these entities, taking up the role of shareholder on behalf of government. The ministers that act as the Executive Authority include the Minister of Public Enterprises, the Minister of Communications, the Minister of Energy, the Minister of Transport and various other ministers of the National Government.
The Executive Authority oversees the affairs of the public enterprise, including the appointment of board members, the entering into of shareholder compacts with the public enterprise, approving major transactions, and the monitoring of performance. The National Treasury is responsible for financial oversight over all the public enterprises, including the review of major transactions, funding requests and applications for guarantees.
Parliament plays a significant role in the oversight of public enterprises through a number of committees that have been assigned responsibility for oversight over public enterprises. These committees include the Parliamentary Portfolio Committee on Public Enterprises, which is responsible for oversight over the Department of Public Enterprises and the key public enterprises that report to the department, the Parliamentary Portfolio Committees responsible for oversight of the various sectors in which public enterprises operate, and the Select Committee on Public Accounts, which is responsible for financial oversight.
The infrastructure investment programmes of the public enterprises are aimed at delivering infrastructure to enhance economic growth and alleviate poverty. Public enterprises are expected to invest approximately R495 billion through fiscal year 2016/17, with R382 billion expected over the next three MTEF year periods. The main public enterprises responsible for delivering this growth are the electricity utility Eskom, the freight transportation company Transnet, the national oil company the Petroleum, Oil and Gas Corporation of South Africa (Pty) Limited (PetroSA), which is a subsidiary of the Central Energy Fund and the South African National Roads Agency Limited (SANRAL).
The National Government has issued formal contractual guarantees in respect of certain indebtedness of the public enterprises, inter alia to support the capital investment programmes of the public enterprises. Such guarantees are issued in accordance with the Public Finance Management Act (PFMA). All guarantees are issued jointly by the Minister of Finance and Executive Authority for the relevant public enterprise in terms of the PFMA. The National Government’s aim is for public enterprises to borrow on the strength of their own balance sheets without explicit recourse from the National Government. However, if a clear need for shareholder support is identified, a guarantee for a public enterprise may be provided on application. In such applications, the public enterprise is required to provide a sound business case, ensuring long-term financial sustainability. In extending guarantees, the National Government remains mindful of the guideline of 60% of GDP that has been set for total debt, provisions and contingent liabilities.
112
Over and above Eskom, Transnet and SANRAL, who have guarantees from the National Government, the current status of some of the more significant public enterprises over the last four fiscal years is set out below.
Guarantees of Public Enterprises
| | | | | | | | | | | | | | | | | | | | | | | | | | | | | | | | |
| | | 2010/11 | | | 2011/12 | | | 2012/13 | | | 2013/14 | |
| | | Total
Guarantee
Amount | | | Total
Exposure
Amount | | | Total
Guarantee
Amount | | | Total
Exposure
Amount | | | Total
Guarantee
Amount | | | Total
Exposure
Amount | | | Total
Guarantee
Amount | | | Total
Exposure
Amount | |
| | | Rand (million) | |
SANRAL | | | 39,989 | | | | 18,605 | | | | 39,943 | | | | 19,426 | | | | 39,943 | | | | 18,623 | | | | 38,687 | | | | 19,449 | |
TCTA | | | 25,434 | | | | 18,490 | | | | 25,461 | | | | 19,886 | | | | 25,530 | | | | 20,460 | | | | 25,589 | | | | 19,943 | |
CEF | | | — | | | | — | | | | — | | | | — | | | | — | | | | — | | | | — | | | | — | |
Eskom | | | 350,000 | | | | 67,057 | | | | 350,000 | | | | 77,230 | | | | 350,000 | | | | 103,523 | | | | 350,000 | | | | 110,799 | |
DBSA | | | 28,349 | | | | 25,867 | | | | 28,931 | | | | 25,692 | | | | 29,366 | | | | 25,497 | | | | 30,021 | | | | 25,799 | |
IDC | | | 1,662 | | | | 740 | | | | 1,824 | | | | 647 | | | | 2,146 | | | | 575 | | | | 1,700 | | | | 634 | |
Landbank | | | 3,800 | | | | 1,844 | | | | 3,800 | | | | 1,093 | | | | 4,600 | | | | 893 | | | | 4,600 | | | | 1,393 | |
Denel | | | 1,850 | | | | 1,850 | | | | 1,850 | | | | 1,850 | | | | 1,850 | | | | 1,850 | | | | 1,850 | | | | 1,850 | |
PRASA | | | 1,400 | | | | 468 | | | | 1,400 | | | | 264 | | | | 1,400 | | | | 133 | | | | 1,400 | | | | 123 | |
SAA | | | 2,900 | | | | 1,916 | | | | 2,900 | | | | 1,300 | | | | 7,901 | | | | 2,238 | | | | 7,901 | | | | 3,232 | |
Transnet | | | 9,500 | | | | 9,887 | | | | 3,500 | | | | 3,757 | | | | 3,500 | | | | 3,757 | | | | 3,500 | | | | 3,591 | |
SABC | | | 1,000 | | | | 1,000 | | | | 1,000 | | | | 889 | | | | 1,000 | | | | 167 | | | | 1,000 | | | | 83 | |
Telkom | | | 233 | | | | 90 | | | | 248 | | | | 85 | | | | 245 | | | | 90 | | | | 316 | | | | 100 | |
Other Entities | | | 3,551 | | | | 1,786 | | | | 3,567 | | | | 1,587 | | | | 4,414 | | | | 1,561 | | | | 3,795 | | | | 2,116 | |
| | | | | | | | | | | | | | | | | | | | | | | | | | | | | | | | |
Total | | | 469,668 | | | | 149,600 | | | | 464,424 | | | | 153,706 | | | | 471,895 | | | | 179,367 | | | | 470,359 | | | | 189,112 | |
| | | | | | | | | | | | | | | | | | | | | | | | | | | | | | | | |
Source: South African National Treasury
Eskom Limited (Eskom)
Eskom is responsible for electricity generation, transmission and distribution in South Africa. Eskom generates approximately 95% of electricity used in South Africa and approximately 45% of the electricity is used in Africa. Eskom directly provides electricity to about 45% of all end-users in South Africa. The other 55% is resold by redistributors (including municipalities).
While most of Eskom’s business is within South Africa, the company also buys and sells electricity in the SADC region. Eskom’s involvement in African markets beyond South Africa is currently limited to projects that have a direct impact on ensuring a secure supply of electricity for South Africa itself. Eskom is investigating additional opportunities in the SADC region.
113
Eskom’s capital expenditure (capex) programme is well underway. The budget for the programme from inception in 2005 until up until 2017/18 is approximately R340 billion. The Ingula, Medupi and Kusile power stations are now projected to be completed by 2015, 2017 and 2019 respectively. The synchronisation dates for both Medupi and Kusile have been pushed back by approximately six months due to construction delays. The power utility spent R60.1 billion (2011/12: R63.4 billion) on capital expenditure during 2012/13, excluding borrowing costs capitalised, during the year.
As at March 2013, R249 billion of the R300 billion of funding plan that Eskom needed to raise to complete the capital expenditure programme up to 2017 had been secured. Eskom has largely identified sources from which the remainder of the funding can be raised: in particular the bulk will come from further local and international bond issuances. Eskom’s projections indicate that the company has sufficient cash on hand, investments, net operational cash flows and current secured facilities available to fund the business through to the beginning of the 2014 calendar year. Eskom had planned to raise R9 billion issuance of domestic debt off the listed domestic medium-term note programme in 2012/13. Due to favourable market conditions and investor appetite, Eskom raised R11.9 billion.
In March 2011, Cabinet approved the Integrated Resource Plan (IRP2010), which is a 20 year plan for balancing electricity supply and demand. The country will double its electricity generation capacity from 40,000MW to 80,000MW by 2025, ensuring that the economy benefits from a reliable supply of electricity. The plan demonstrates how the proportion of coal in South Africa’s generation mix is expected to decrease steadily in favour of renewable energy and nuclear power. The IRP 2010 is in the process of being revised. The Cabinet appointed Eskom as the owner and operator of a future nuclear generation fleet.
In February 2013, NERSA allowed Eskom tariff increases of 8% per annum over the MYPD 3 (third Multi-Year Price Determination) period, which ends in 2018. Eskom had applied for a 16% tariff increase. The impact of the NERSA decision was that Eskom’s revenues will be R255 billion lower than the utility had projected in its MYPD3 application. In line with NERSA’s recommendations, Eskom will be reducing expenditure in some areas and the company will be re-engineering the business to achieve further cost savings. Some elements of the tariff are premised on assumptions and adjustments based on actual performance will be addressed through the Regulatory Clearing Account in line with the regulatory rules. In addition, Eskom will borrow additional funding. Any policy and mandate implications of such measures will be evaluated in collaboration the shareholder.
The National Government has made available to Eskom a subordinated loan of R60 billion, all of which has been disbursed, and a guarantee facility totaling R350 billion to assist Eskom in raising the financing it requires for the capex programme. One implication of the lower tariff is that it will extend Eskom’s reliance on state support by a number of years and the company will not achieve a standalone investment grade credit rating by 2018, as premised in Eskom’s MYPD3 tariff application.
During fiscal year 2012/2013, the company recorded a profit of R5.1 billion in that year, which was lower than that recorded in the 2011 financial year (R13.2 billion). As Eskom continues with its capex programme, the company’s gearing is expected to increase as it raises more borrowings to finance the investments. Furthermore, Eskom board approved a new borrowing programme of R250 billion over the five years. This new borrowing programme will address the re-phasing of the funding draw-downs from the ECA and DFI facilities and will aim to maintain a liquidity buffer of approximately R20 billion.
During fiscal year 2012/13, Eskom’s credit rating was downgraded by Moody’s and Standard and Poors following the downgrade in the sovereign rating.
Transnet SOC Limited (Transnet)
Transnet is a public company, wholly owned by the South African Government, and is the custodian of rail, ports and pipelines. Transnet is responsible for enabling competiveness, growth and development of the South African economy through delivering reliable freight transport and handling services. Transnet has five operating divisions: Transnet Freight Rail (transporting bulk and containerised freight), Transnet Rail Engineering (refurbishment, conversion, upgrades and manufacturing of rail related rolling stock), Transnet National Ports Authority (port infrastructure and marine services), Transnet Port Terminals (cargo terminal operations) and Transnet Pipelines (petroleum and gas pipeline business).
Transnet Pipelines is regulated by NERSA, with tariffs being reviewed annually. The tariffs charged by Transnet Ports Authority and Transnet Port Terminals are regulated by the National Ports Regulator on an annual basis.
Transnet adopted the Market Demand Strategy (MDS) in 2012, which entails the company investing R300.1 billion in infrastructure to support a ramp up in freight volumes, operational efficiencies, jobs and skills while championing transformation and delivering sustainable economic, social and environmental outcomes. In 2013, the MDS capital investment target was increased: the company is now expected to invest R307.5 billion by 2020.
114
The year ended 31 March 2013, marks the first year of executing the seven-year MDS, Transnet achieved 91.8% of the ambitious MDS volume targets for the year. Despite challenging economic and operating conditions Transnet still delivered volume growth of 3.3%, driven by a revised operating philosophy at Transnet Freight Rail, strong financial results with revenue of R50.2 billion, and a record level of R27.5 billion capital investment. Revenue for the year increased by 9.4% (2013: R50.2 billion; 2012: R45.9 billion), mainly as a result of a 3.3% increase in total volumes railed to (2013: 207.7mt; 2012: 201.0mt), which is higher than the GDP growth rate of 2.5%. Unfortunately, the poor economic conditions affected volumes handled by the ports with container volumes increasing by a marginal 1.2%, whilst petroleum volumes declined mainly as a result of supply constraints at a major refinery. Earnings Before Interest, Taxation, Depreciation, Derecognition and Amortisation (EBITDA) increased by 11.5% to R21.1 billion (2012: R18.9 billion), resulting in an EBITDA margin of 41.9%. This represents real growth in EBITDA as it exceeds inflation and is almost five times domestic GDP growth.
Transnet Freight Rail (Freight Rail) is the largest of Transnet’s Operating divisions and transports bulk and containerised freight by rail. The network and rail services provide strategic links between ports and production hubs and connect with the railways of the SADC region. Freight Rail’s strategic advantage lies in the movement of heavy haul and bulk commodities over long distances where flow densities provide economies of scale thereby lowering unit costs. Freight Rail’s key objective is to shift rail-friendly freight traffic from road to rail by creating capacity ahead of demand and offering a reliable rail service. This will enable Freight Rail to meet its mission of transporting large parcel size commodities over longer distances in Southern Africa. The Rail network unit manages Freight Rail’s rail infrastructure and focuses on the maintenance, modernisation and expansion of the approximately 20,500 route kilometre (31,000 track km) rail network. Approximately 1,500 kilometres comprises heavy haul lines for export coal and export iron ore. The network includes 3,928 kilometres of branch lines.
In accordance with the MDS and the aim of shifting traffic from road to rail, significant capital has been invested in assets to support traffic growth in the General Freight business. Total investment amounted to R13.0 billion. To date, an amount of R3.2 billion has been invested in the acquisition of the Class 43 locomotives. All of the 100 Class 43 new diesel electric mainline locomotives have been delivered and accepted into operations. Freight Rail concluded a contract for the supply of 95 electric locomotives for General Freight at a cost of R2.7 billion, which will further support improved operational performance, reliability and overall efficiency of the rail service. The delivery of locomotives is expected to commence in February 2014. The capital investment for the acquisition of these locomotives amounted to R269 million for the year to 31 March 2013. The acquisition of wagons to support MDS volume growth projections was approved at a total cost of R2.1 billion and required the building of 2 346 wagons during the year. A total of R3.1 billion was invested in interventions to sustain the company’s infrastructure. Upgrades to the General Freight network included the replacement of 284 kilometres of rail and 403 kilometres of ballast screening. In addition, 383 661 sleepers and 167 turnouts were replaced. To maintain the condition of existing rolling stock at acceptable levels, R3.7 billion was invested in the upgrade and overhauling of wagons and locomotives.
Total investment for the transportation of export coal amounted to R3 303 million. The coal line programme, which aims to expand capacity to 81mt, is in the final planning stages, with some work packages already in execution. Total investment in export iron ore amounted to R2 011 million. The iron ore line project to expand capacity to 60mt is already operational.
International credit rating agency Standard & Poor’s (S&P) reaffirmed Transnet’s investment grade credit rating based on the company’s stand-alone credit profile, confirming the company’s attractiveness for investors and the success of its efforts to strengthen the balance sheet.
PetroSA
The Petroleum Oil and Gas Corporation of South Africa (SOC) Limited (PetroSA) is the national oil company (NOC). PetroSA is a wholly owned subsidiary of the Central Energy Fund (CEF), which in turn is wholly owned by the State and reports to the Department of Energy. PetroSA was formed in 2002 upon the merger of Soekor E and P (Pty) Limited, Mossgas (Pty) Limited and parts of the Strategic Fuel Fund, another subsidiary of CEF.
PetroSA’s Vision 2020 strategic objective is to become a fully integrated, commercially competitive NOC, supplying at least 25% of South Africa’s liquid fuel needs by 2020. This will be accomplished through a number of strategic projects including ensuring the sustainability of the GTL refinery.
PetroSA’s core activities include:
115
| | • | | Exploration and production of oil and natural gas; |
| | • | | Participation in and acquisition of local as well as international upstream petroleum ventures; |
| | • | | Production of synthetic fuels from offshore gas at the GTL refinery in Mossel Bay; |
| | • | | Development of domestic refining and liquid fuels logistical infrastructure; and |
| | • | | Marketing and trade of oil petrochemicals. |
The GTL refinery at Mossel Bay, South Africa, has been the main focal point of PetroSA’s current production activities. It was commissioned in 1992 as the world’s first GTL refinery and remains the third largest GTL refinery among the five now operating worldwide. It is a recognised centre of GTL excellence where specialist teams produce some of the cleanest fuels on the market, utilising environmentally friendly processes. Using Fischer Tropsch technology, the refinery converts natural, methane-rich gas into ultra-clean, low-sulphur, low-aromatic synthetic fuels and high value products. It sources its feedstock from PetroSA’s FA-EM and South Coast gas fields, as well as the Oribi and Oryx oil fields in Block 9, offshore South Africa. It is capable of producing a crude oil equivalent of 45,000 barrels per day.
The final products include unleaded petrol, kerosene (paraffin), diesel, propane, liquid oxygen and nitrogen, distillates, eco-fuels, process oils and alcohols. Its world-class synthetic fuels and petrochemicals are marketed internationally.
The refinery is woven into the fabric of Mossel Bay life and continues to support a wide range of initiatives designed to improve the quality of life among local communities. The refinery employs over 2,000 people, most of them from the surrounding area. A growing number of young recruits are graduates from PetroSA’s Centre of Excellence.
PetroSA’s long term strategies are designed to address issues related to sustainability, rationalisation and growth. In terms of sustainability, PetroSA is currently addressing the declining feedstock from its FA-EM field through the development of the F-O field in order to restore the GTL refinery to full capacity in 2014. Further the entity is also evaluating gas feed possibilities in its West Coast blocks, another alternative is the importation of liquefied natural gas (LNG).
As part of its diversification drive, PetroSA will seek to grow organically through the acquisition of producing assets. Areas of interest include Angola, Mozambique and the Orange Basin on the West Coast of Africa amongst other areas.
As part of its growth strategy, PetroSA has advised that it will seek opportunities to enter the downstream market through the pursuit of Project Mthombo. PetroSA has been investigating the possibility of building a crude oil refinery in Coega in the Eastern Cape dubbed Project Mthombo. Initial plans for Project Mthombo were for capacity of 400,000 barrels per day but subsequent studies have been for reduced capacity of about 360,000 barrels per day. PetroSA is exploring options to finance the project, including seeking support from government and/or equity partners.
As part of its downstream growth strategy, the entity has entered talks with fuel retailer for the acquisition of its operations. This will also positively contribute to the diversification efforts of the entity as it tries to secure feedstock for its GTL refinery.
For the fiscal year 2012/13, the entity’s group revenue was R19.7 billion (2012: R14.4 billion). Group operating profit was R604 million, mainly as a result of a significant increase in cost of sales and operating expenses. Group net profit was R683 million, (2012:R1.3 billion). Cash and cash equivalents for the year ended were at R7.4 billion down from R12.8 billion in 2012. This is in line with PetroSA’s planned expenditure related to the sustainability of its GTL refinery. Total assets were R34.2 billion (2012:R26.5 billion), supporting its strategic goal of organic growth through acquisitions. Capital expenditure amounted to R4.4 billion for the year ended March 2013. Most of the entity’s capital expenditure has been towards the development of gas fields in an effort to secure feedstock for the GTL plant. Capital expenditure related to Assets under Development equated to R2.9 billion
ACSA
Department of Transport. The company is legally and financially autonomous and operates under commercial law. ACSA owns and operates South Africa’s nine principal airports, including the three major international airports at Johannesburg, Cape Town and Durban (King Shaka). As a result, ACSA is responsible for processing 93%-95% of all passengers departing on commercial airlines from airports within South Africa. The company added Pilanesberg International Airport to its network in 1998 under a 30-year concession with the North West Province. However, ACSA has returned the operation of the airport to the province with effect from October 1, 2011.
116
ACSA’s revenue is generated from aeronautical and non-aeronautical sources. The former is derived from regulated charges, which consists of aircraft landing and parking charges, and passenger service charges. The non-aeronautical income is derived from commercial undertakings including retail operations, car rental concessions, property leases, car parking, hotel operations and advertising. Another component of non-aeronautical revenue is generated from international operations. ACSA formed part of a consortium that took over the expansion and management of Chhatrapati Shivaji International Airport in Mumbai, India. The success of the venture in India encouraged the company to seek similar opportunities elsewhere. In 2011/12 ACSA in partnership with the Brazilian company Invepar, was successful in a bid to manage the development, maintenance and operation of Guarulhos International Airport in Sao Paulo, Brazil. The consortium will own 51% of the airport concession, with 49% being held by Infraero, the current airport operator. ACSA owns 10% of the consortium with Invepar
ACSA posted a R991 million profit for the financial year ended March 31, 2013. This is a significant improvement when compared to the prior year’s profit of R188 million. The increase in profit is an indication that the Group is starting to reap the benefits of the 2006 to 2010 capital investment programme. The results in the 2013 financial year are driven primarily by an increase in aeronautical revenue as a result of the tariff increase of 34.8% implemented during the 2012 financial year (i.e. from 1 October 2011) and a further increase of 6.5% implemented during the 2013 financial year.
During the reporting period, ACSA expended R990 million on capital projects. The focus was mainly on the refurbishment and maintenance of infrastructure to maintain a high quality standard of infrastructure and to extend the useful lifespan to enable on-going, safe, operating conditions for all stakeholders. O.R. Tambo International Airport saw the completion of refurbishment work to aircraft stands on the main apron in front of the terminal buildings at the end of 2012, at a cost of R76 million, work that commenced during the previous reporting period. Further refurbishment work to various taxiways and airside roads at O.R. Tambo International Airport, to the value R50 million, was completed, whilst refurbishment work on the landside ingress/egress road system commenced and is ongoing.
The size of ACSA’s funding requirement will be driven principally by three factors, namely: capital expenditure investments, debt service costs, and redemption payments of maturing debt. Current projections indicate that ACSA will have a cash surplus for the first two financial years of the planning horizon, and will only require external funding in the 2014/15 financial year.
SANRAL
SANRAL is responsible for the planning, design, construction, rehabilitation and maintenance of South Africa’s national roads to support socio-economic development. From time to time the company also finances, plans, constructs, operates and maintains roads in neighboring countries on the request of the Minister of Transport and those countries.
The national road system connects all the major centres in the country to each other and to neighboring countries. The South African road network comprises approximately 754,600 kilometres of roads. There is a national highway network of 16,170 kilometres, which is expected to grow to 35,000 kilometres. South Africa has the longest road network of any country in Africa.
In accordance with the SANRAL Act (1998), the agency is responsible for toll and non-toll roads. These operations are funded separately. Non-toll roads are funded by government allocations, and are not allowed to be cross-subsidised from toll road income, and vice versa. Toll operations can be divided into two types – those funded by SANRAL itself and operated on its behalf, and roads concessioned to private parties under public-private partnerships. Hence SANRAL’s revenue comes from two primary sources: grants from the National Government for all non-toll roads, and the tolling revenue received from toll roads.
During the reporting period, SANRAL awarded 255 contracts worth R11.6 billion for new works, rehabilitation, improvement, professional consulting engineering, maintenance, community development and other activities. A total of R2 billion was spent on contracts with Small, Micro and Medium Enterprises (SMMEs). SANRAL’s skills development programme trained 18 161 people in road-building projects at a cost of about R21 million, of which 7 252 were women and created 110 401 job opportunities of varying duration at a total cost of about R2 billion. SANRAL spent R3.6 billion on maintaining non-toll roads and R5.9 billion on strengthening, improving and providing new facilities on these roads.
SANRAL’s credit worthiness is rated and published by Moody’s Investor Service. SANRAL’s international long term rating was downgraded in May 2012 to Baa2 with negative outlook. The downgrade was a result of the uncertainty and delays with regard to the commencement of electronic tolling on the Gauteng network and the accompanying political and public resistance. However, the President of the Republic of South Africa has subsequently signed the Transport Laws and Related Matters Amendment Bill into law and implementation of the e-tolling system is expected to commence before the end of the 2013.
117
Trans-Caledon Tunnel Authority (TCTA)
The TCTA was established in 1986. The entity is a specialised liability management entity responsible for bulk raw water infrastructure development. TCTA was originally established to implement a single project, the Lesotho Highlands Water Project (LHWP). In March 2000, TCTA’s notice of establishment was amended to allow for the Minister of Water Affairs to issue directives to TCTA in terms the National Water Act and the entity has since evolved into being responsible for multiple projects. To date the following directives have been received:
| | • | | Lesotho Highlands Water Project*; |
| | • | | Advisory services to Umgeni Water, Water Management Institutions, Water Boards and DWA; |
| | • | | Berg Water Project (BWP); |
| | • | | Vaal River Eastern Subsystem Project* (VRESAP); |
| | • | | Refurbishment of Mooi-Mgeni Transfer Scheme Phase 1* (MMTS1) and implementation of Phase 2* (MMTS2); |
| | • | | Olifants River Water Resources Development Project Phase 2C* (ORWRDP2C); |
| | • | | Komati Water Scheme Augmentation Project* (KWSAP); |
| | • | | Mokolo-Crocodile Water Augmentation Project* (MCWAP); |
| | • | | Metsi Bophelo Borehole Project*; |
| | • | | Acid Mine Drainage* (AMD); and |
| | • | | Coordination of Strategic Infrastructure Project 3* (SIP3). |
| * | Implementation of these projects is still ongoing |
The government guarantees in place on the LHWP amount to R25 billion. Commercial funding for the rest of the projects is secured on the basis of income agreements between TCTA and DWA and these determine how costs may be charged on each project. In the 2013 financial year, TCTA saw liquidity on the LHWP improve significantly, mainly due to an increase in water tariff receipts. This was used mainly to build the redemption portfolio further and to service existing debt.
The VRESAP project aims to supply water to the coal fields in the east of the country where Eskom’s thermal power stations and Sasol’s petrochemical installations are strategic users of water. In the preceding year, the Minister of Water and Environmental Affairs, with the concurrence of the Minister of Finance, approved an increase in the borrowing limit for VRESAP. As of August 31, 2013, R3,096 million had been utilised on the project’s long term loan facilities leaving unutilised long-term facilities of R522 million. The project is now in the close-out phase.
The MMTS-2 project seeks to augment the water supply to municipalities in the Kwazulu Natal province and includes the construction of the Spring Grove dam and associated water transfer system. TCTA drew down R597 million from the long-term facilities provided by international Development Finance Institutions for the MMTS-2 project. Tariff billing commenced from 1 July 2012 following consultations with the users and approval by the Minister of Water Affairs. Impoundment of the reservoir commenced in March 2013.
KWSAP augments the Komati Water Scheme for the sole benefit of Eskom. The project has an approved borrowing limit of R2,700 million and the utilisation levels at the end of the financial year stood at R1,031 million. Most of the funding secured for the KWSAP was sourced from the local financial market, together with funding obtained from the Development Bank of Southern Africa (DBSA).
Financial close for Phase 1 of the Mokolo-Crocodile Water Augmentation Project was achieved timeously and at financial year end MCWAP had unutilised facilities of R2 000 million (equivalent to the approved borrowing limit)
The first tariff was set and successfully negotiated with the off-takers. This will take effect upon completion of construction, which is anticipated in the 2013/14 financial year.
In terms of Acid Mine Drainage (AMD), TCTA’s involvement has been in the implementation of the short term action plan in the affected basins of Witwatersrand Goldfields where the plan is to prevent the decanting of water and the breaching of the Environmental Critical Level (ECL).
118
In 2013, TCTA realised a deficit of R698 million, which reduced its retained surpluses to R4,877 million. The deficit is a function of accounting entries, made up of deficits in projects where construction is complete, and arises from finance costs which exceed the surpluses in the projects that are under construction. Typically, projects will initially reflect net deficits during construction and this will be wound down with surplus during the operational period ultimately resulting in a retained surplus of nil when the debt for a project is fully repaid.
TCTA’s continues to operate as a financially sound entity that is able to execute its projects in line with its mandate and with government’s development agenda.
119
NATIONAL GOVERNMENT DEBT
General
The legal authorisation for the incurrence of debt by the National Government is set forth in the PFMA. The National Treasury administers the National Government debt of South Africa. In February of each year the annual budget is tabled in Parliament, including the government’s anticipated borrowing requirements and financing strategy for the current financial year and over the medium-term period (three years). Pursuant to Section 66 of the PFMA, the Minister of Finance needs to approve each issuance of debt. The PFMA also sets out for which purposes the Minister may borrow. There is no statutory cap on the stock of debt.
In addition to its direct indebtedness, the National Government is also a guarantor of certain third-party indebtedness. South Africa has issued formal contractual guarantees of certain indebtedness, primarily on behalf of partially or wholly state-owned entities. In this document, the National Government debt does not include debt that is guaranteed by the National Government. However, the guaranteed debt is summarised in the table entitled “Outstanding National Government Guaranteed Debt”. In addition, the National Government debt does not include debts incurred by the nine Provincial Governments.
In this section, “external debt” means debt initially incurred or issued outside South Africa, regardless of the currency of denomination, and “internal debt” means debt initially incurred or issued in South Africa. “Floating debt” means debt that had a maturity at issuance of less than one year. “Funded debt” means debt that had a maturity at issuance of one year or more.
The following table summarises the National Government debt as of March 31 in each of the years 2009 through 2013 and as of September 30, 2013.
| | | | | | | | | | | | | | | | | | | | | | | | |
| | | As of March 31, | | | As of
September
30, | |
| | | 2009 | | | 2010 | | | 2011 | | | 2012 | | | 2013 | | | 2013 | |
| | | Rand (million) | |
Government bonds | | | 462,751 | | | | 585,992 | | | | 733,438 | | | | 890,256 | | | | 1,038,838 | | | | 1,140,105 | |
Treasury bills | | | 65,000 | | | | 114,540 | | | | 136,150 | | | | 155,159 | | | | 171,985 | | | | 189,687 | |
| | | | | | | | | | | | | | | | | | | | | | | | |
Marketable internal debt | | | 527,751 | | | | 700,532 | | | | 869,588 | | | | 1,045,415 | | | | 1,210,823 | | | | 1,329,792 | |
Non-marketable internal debt | | | 1,956 | | | | 4,943 | | | | 23,133 | | | | 25,524 | | | | 30,300 | | | | 17,675 | |
| | | | | | | | | | | | | | | | | | | | | | | | |
Total internal debt | | | 529,707 | | | | 705,475 | | | | 892,721 | | | | 1,070,939 | | | | 1,241,123 | | | | 1,347,467 | |
Total external debt(1) | | | 97,268 | | | | 99,454 | | | | 97,851 | | | | 116,851 | | | | 124,556 | | | | 139,265 | |
| | | | | | | | | | | | | | | | | | | | | | | | |
Total gross loan debt | | | 626,975 | | | | 804,929 | | | | 990,572 | | | | 1,187,790 | | | | 1,365,679 | | | | 1,486,732 | |
Cash balances(2) | | | (101,349 | ) | | | (131,889 | ) | | | (170,163 | ) | | | (198,059 | ) | | | (184,082 | ) | | | (180,799 | ) |
Total net loan debt(3) | | | 525,626 | | | | 673,040 | | | | 820,409 | | | | 989,7301 | | | | 1,181,597 | | | | 1,486,732 | |
| | | | | | | | | | | | | | | | | | | | | | | | |
GFECRA | | | (101,585 | ) | | | (35,618 | ) | | | (28,283 | ) | | | (67,655 | ) | | | (125,552 | ) | | | (125,552 | )(4) |
| | | | | | | | | | | | | | | | | | | | | | | | |
As percentages of nominal GDP: | | | | | | | | | | | | | | | | | | | | | | | | |
Net loan debt | | | 22.9 | % | | | 27.4 | % | | | 30.0 | % | | | 33.3 | % | | | 36.8 | % | | | 39.3 | % |
External debt | | | 4.2 | % | | | 4.1 | % | | | 3.6 | % | | | 3.9 | % | | | 3.9 | % | | | 4.0 | % |
As percentage of gross loan debt: | | | | | | | | | | | | | | | | | | | | | | | | |
External debt | | | 15.5 | % | | | 12.4 | % | | | 9.9 | % | | | 9.8 | % | | | 9.1 | % | | | 9.4 | % |
120
Notes:
| (1) | Valued using the applicable foreign exchange rates as at the end of each period. |
| (2) | This represents surplus cash of the National Revenue Fund on deposit at the commercial banks and the SARB. Bank balances in foreign currencies are revaluated using forward estimates of exchange rates. |
| (3) | The total net loan debt is calculated with due account of the bank balances of the National Revenue Fund (balances of the National Government’s accounts with the SARB and with commercial banks). |
| (4) | Represents the balance on the GFECRA on March 31, 2013. A negative balance indicates a profit and a positive balance reflects a loss. |
Sources: South African National Treasury and the SARB.
Summary of Internal National Government Debt
Total internal National Government debt as of March 31, 2013 was R1.241 billion, an increase of 16.0% over the corresponding amount of R1,070.9 billion as of March 31, 2012.
The following table sets forth the total internal National Government debt, divided into floating debt and funded debt, for the periods indicated.
Gross National Government Internal Debt
| | | | | | | | | | | | | | | | | | | | | | | | |
| | | As of March 31, | | | As of
September
30, | |
| | | 2009 | | | 2010 | | | 2011 | | | 2012 | | | 2013 | | | 2013 | |
| | | Rand (million) | |
Marketable securities | | | | | | | | | | | | | | | | | | | | | | | | |
Floating | | | 65,000 | | | | 114,540 | | | | 136,150 | | | | 155,159 | | | | 171,985 | | | | 189,687 | |
Funded | | | 462,751 | | | | 585,992 | | | | 733,438 | | | | 890,257 | | | | 1,038,838 | | | | 1,140,105 | |
| | | | | | | | | | | | | | | | | | | | | | | | |
Total(1) | | | 527,751 | | | | 700,532 | | | | 869,588 | | | | 1,045,415 | | | | 1,210,823 | | | | 1,329,792 | |
| | | | | | | | | | | | | | | | | | | | | | | | |
Non-marketable securities | | | | | | | | | | | | | | | | | | | | | | | | |
Floating | | | 27 | | | | 258 | | | | 13,541 | | | | 13,209 | | | | 18,985 | | | | 7,259 | |
Funded | | | 1,929 | | | | 4,686 | | | | 9,592 | | | | 12,268 | | | | 11,315 | | | | 10,416 | |
Total(2) | | | 1,956 | | | | 4,943 | | | | 23,133 | | | | 25,524 | | | | 30,300 | | | | 17,675 | |
Total internal National Government debt | | | 529,707 | | | | 705,475 | | | | 892,721 | | | | 1,070,939 | | | | 1,241,123 | | | | 1,347,467 | |
| | | | | | | | | | | | | | | | | | | | | | | | |
Notes: —
| (1) | Treasury bills are classified as floating marketable securities. Government bonds are classified as funded marketable securities. |
| (2) | Short-term loans to public entities that include the Public Investment Corporation and the Corporation for Public Deposits are classified as floating non-marketable securities. Floating rate and retail government bonds (since May 2004), together with debt and liabilities of the former TBVC states and the Republic of Namibia that were assumed by the National Government in connection with South Africa’s transition to a constitutional democracy, are classified as funded non-marketable securities. |
Sources: South African National Treasury and SARB.
121
Summary of External National Government Debt
South Africa’s external National Government debt as a percentage of total debt remains low. External debt as a percentage of total gross loan debt decreased from 15.5% as of March 31, 2009 to 9.1% as of March 31, 2013.
The following table sets forth a breakdown of National Government external debt by currency as of March 31 in each of the years 2009 through 2013 and as of September 30, 2013.
External Debt by Currency
| | | | | | | | | | | | | | | | | | | | | | | | |
| | | As of March 31, | | | As of
September 30, | |
| Currency in which debt is held | | 2009 | | | 2010 | | | 2011 | | | 2012 | | | 2013 | | | 2013 | |
| | | (million) | |
Euro | | | 3,283 | | | | 3,104 | | | | 2,925 | | | | 2,735 | | | | 2,544 | | | | 1,206 | |
Pound Sterling | | | 102 | | | | 106 | | | | 105 | | | | 100 | | | | 83 | | | | 70 | |
Swedish Kroner | | | 5,849 | | | | 6,000 | | | | 5,959 | | | | 5,528 | | | | 4,858 | | | | 4,511 | |
US Dollars | | | 4,324 | | | | 7,690 | | | | 8,396 | | | | 9,842 | | | | 8,768 | | | | 10,731 | |
Gold Ounces — XAU | | | 1 | | | | 1 | | | | — | | | | — | | | | — | | | | — | |
Yen | | | 61,176 | | | | 61,082 | | | | 60,988 | | | | 60,894 | | | | 60,800 | | | | 60,753 | |
| | | | | | | | | | | | | | | | | | | | | | | | |
Total (in Rand)(1) | | | 97,268 | | | | 99,454 | | | | 97,851 | | | | 116,851 | | | | 124,555 | | | | 139,265 | |
| | | | | | | | | | | | | | | | | | | | | | | | |
Note: —
| (1) | The conversion into Rand is calculated at the exchange rate published by the SARB on the last business day of the fiscal year. |
Source: South African National Treasury.
Notwithstanding the return of the National Government to the international capital markets since the end of apartheid, the National Government does not intend to rely to a large extent on external debt as a means of financing. In September 2013 the Republic of South Africa issued a US$2 billion 12-year global bond.
Total external debt, as a percentage of GDP is relatively low by international standards, amounting to approximately 4.0% of GDP as at September 30, 2013. This number is, however, indicative only and does not represent an upper or lower limit on the borrowing authority of the National Treasury.
An incidental but important consequence of the receipt of any net proceeds from issuances in the foreign market in the past has been an increase in South Africa’s foreign currency reserves. In addition, because the proceeds of external borrowings provide a substitute for a portion of domestic finance, these borrowings helped relieve pressure off the domestic financial markets at such times that it was required. Furthermore, borrowings by the National Treasury abroad also establish valuable benchmarks in various currencies and maturities against which other South African issuers may reference themselves.
Guaranteed Debt
In addition to its direct indebtedness, the National Government is also a guarantor of certain third-party indebtedness. The National Government has issued formal contractual guarantees in respect of certain indebtedness of wholly or partially state-owned companies.
122
The following table sets forth the debt guaranteed by the National Government outstanding in each of the years indicated:
Outstanding National Government Guaranteed Debt
| | | | | | | | | | | | | | | | | | | | |
| | | As of March 31, | |
| | | 2009 | | | 2010 | | | 2011 | | | 2012 | | | 2013 | |
| | | Rand (million) | |
Internal | | | 43,723 | | | | 111,940 | | | | 127,709 | | | | 126,901 | | | | 141,513 | |
External | | | 19,315 | | | | 17,159 | | | | 21,891 | | | | 27,023 | | | | 39,266 | |
| | | | | | | | | | | | | | | | | | | | |
Total | | | 63,038 | | | | 129,099 | | | | 149,600 | | | | 153,924 | | | | 180,779 | |
| | | | | | | | | | | | | | | | | | | | |
Source: South African National Treasury.
The following table sets forth the National Government’s external guaranteed debt outstanding as of March 31, 2013.
Analysis of National Government External Guaranteed Debt
| | | | | | | | | | | | | | | | |
| | | As of March 31, 2013 | |
Guarantees Issued on Behalf of | | ZAR | | | U.S. Dollars | | | Euro | | | Equivalent
in Rand(1) | |
| | | Amount (million) | |
Transnet | | | 3,500 | | | | — | | | | — | | | | 3,500 | |
Telkom | | | — | | | | — | | | | 8 | | | | 90 | |
IDC | | | — | | | | 36 | | | | 20 | | | | 575 | |
Lesotho Highlands Development Authority | | | 77 | | | | — | | | | 4 | | | | 130 | |
DBSA | | | 8,543 | | | | 94 | | | | 74 | | | | 10,279 | |
Trans-Caledon Tunnel Authority | | | 121 | | | | — | | | | — | | | | 121 | |
ESKOM | | | 9,932 | | | | 1,144 | | | | 326 | | | | 24,292 | |
| | | | | | | | | | | | | | | | |
Total(2) | | | 22,177 | | | | 1,274 | | | | 432 | | | | 38,980 | |
| | | | | | | | | | | | | | | | |
Notes: —
| (1) | Conversion of amounts into Rand have been made at the following rates: U.S. Dollar = R9.197900; euro = R11.776071. |
| (2) | Does not include guaranteed interest to the amount of R279 million. |
Source: South African National Treasury.
Debt Service Costs
As a percentage of the National Government expenditure, debt service costs increased from 7.6% during fiscal year 2010/11 to 8.6% and 8.5% during fiscal years 2012/13 and 2013/14, respectively. As a percentage of the National Government revenue, debt service costs on the National Government debt increased from 9.9% during fiscal year 2010 to 10.3% and 9.7% during fiscal years 2012/13 and 2013/14, respectively. As a percentage of GDP, debt service costs on National Government debt have increased from 2.3% during fiscal year 2010 to 2.5% and 2.7% during fiscal years 2012/13 and 2013/14, respectively. The following table sets forth such percentages for the periods indicated.
123
| | | | | | | | | | | | | | | | | | | | |
| | | For the year ended March 31, | |
| | | 2009 | | | 2010 | | | 2011 | | | 2012 | | | 2013 | |
Expenditure | | | 8.6 | % | | | 7.6 | % | | | 8.2 | % | | | 8.6 | % | | | 8.5 | % |
Revenue | | | 8.9 | % | | | 9.9 | % | | | 9.9 | % | | | 10.3 | % | | | 9.7 | % |
GDP | | | 2.4 | % | | | 2.3 | % | | | 2.4 | % | | | 2.5 | % | | | 2.7 | % |
Source: South African National Treasury.
The aggregate amount of scheduled repayments in respect of principal and interest on the funded National Government debt outstanding as of September 30, 2013, is set forth in the table below.
| | | | | | | | | | | | | | | | | | | | | | | | |
| | | | | | External Debt | |
Year(1) | | Rand | | | U.S.$ | | | EURO | | | YEN | | | GBP | | | SEK | |
| | | Amount (million) | |
2014 | | | 98,373 | | | | 354 | | | | 88 | | | | 1,196 | | | | 10 | | | | 463 | |
2015 | | | 116,929 | | | | 1,673 | | | | 182 | | | | 2,391 | | | | 21 | | | | 899 | |
2016 | | | 101,728 | | | | 635 | | | | 146 | | | | 2,388 | | | | 20 | | | | 864 | |
2017 | | | 122,517 | | | | 612 | | | | 849 | | | | 2,386 | | | | 9 | | | | 829 | |
2018 | | | 154,209 | | | | 732 | | | | 36 | | | | 2,384 | | | | 8 | | | | 792 | |
2019 | | | 143,756 | | | | 583 | | | | 22 | | | | 2,381 | | | | 8 | | | | 756 | |
2020 | | | 144,133 | | | | 4,498 | | | | 12 | | | | 2,379 | | | | 2 | | | | 491 | |
2021 | | | 136,148 | | | | 305 | | | | 6 | | | | 31,807 | | | | 1 | | | | 236 | |
2022 | | | 75,592 | | | | 293 | | | | — | | | | 30,618 | | | | — | | | | — | |
2023 | | | 81,291 | | | | 1,263 | | | | — | | | | — | | | | — | | | | — | |
2024 | | | 105,660 | | | | 1,734 | | | | — | | | | — | | | | — | | | | — | |
2025 | | | 46,787 | | | | 164 | | | | — | | | | — | | | | — | | | | — | |
2026 | | | 79,104 | | | | 2,105 | | | | — | | | | — | | | | — | | | | — | |
2027 | | | 74,497 | | | | 46 | | | | — | | | | — | | | | — | | | | — | |
2028 | | | 111,809 | | | | 46 | | | | — | | | | — | | | | — | | | | — | |
2029 | | | 20,313 | | | | 1,348 | | | | — | | | | — | | | | — | | | | — | |
2030 | | | 20,313 | | | | — | | | | — | | | | — | | | | — | | | | — | |
2031 | | | 90,812 | | | | — | | | | — | | | | — | | | | — | | | | — | |
124
| | | | | | | | | | | | | | | | | | | | | | | | |
| | | | | | External Debt | |
Year(1) | | Rand | | | U.S.$ | | | EURO | | | YEN | | | GBP | | | SEK | |
| | | Amount (million) | |
2032 | | | 15,378 | | | | — | | | | — | | | | — | | | | — | | | | — | |
2033 | | | 15,378 | | | | — | | | | — | | | | — | | | | — | | | | — | |
2034 | | | 78,616 | | | | — | | | | — | | | | — | | | | — | | | | — | |
2035 | | | 13,197 | | | | — | | | | — | | | | — | | | | — | | | | — | |
2036 | | | 87,756 | | | | — | | | | — | | | | — | | | | — | | | | — | |
2037 | | | 15,787 | | | | — | | | | — | | | | — | | | | — | | | | — | |
2038 | | | 21,711 | | | | — | | | | — | | | | — | | | | — | | | | — | |
2039 | | | 7,610 | | | | — | | | | — | | | | — | | | | — | | | | — | |
2040 and later | | | 157,249 | | | | — | | | | — | | | | — | | | | — | | | | — | |
Total | | | 2,136,653 | | | | 16,391 | | | | 1,341 | | | | 77,930 | | | | 79 | | | | 5,330 | |
| | | | | | | | | | | | | | | | | | | | | | | | |
Principal | | | 1,139,279 | | | | 10,731 | | | | 1,206 | | | | 60,752 | | | | 70 | | | | 4,510 | |
Interest | | | 997,374 | | | | 5,660 | | | | 135 | | | | 17,178 | | | | 9 | | | | 820 | |
Note: —
| (1) | Fiscal years ending March 31. |
Source: South African National Treasury.
Debt Record
On September 1, 1985, in response to a foreign currency liquidity crisis, South Africa prohibited repayment of certain foreign indebtedness to foreign creditors, while interest payments were made as they became due. Final settlement of affected indebtedness was agreed in 1993. Other than this isolated situation, South Africa has not defaulted in the payment of principal or interest on any of its internal or external indebtedness since becoming a Republic in 1961.
125
Tables and Supplementary Information
Funded Internal Debt of the Republic of South Africa (Domestic Marketable Bonds — in Rand) As of September 30, 2013
| | | | | | | | |
Interest Rate | | Date of Issue | | Maturity Date | | Nominal Amount | |
Zero Coupon | | December 8, 1993 | | November 30, 2013 | | | 8,917,688 | |
7.50% | | August 15, 2005 | | January 15, 2014 | | | 16,525,672,594 | |
Zero Coupon | | April 21, 1994 | | March 31, 2014 | | | 6,800,000 | |
Zero Coupon | | April 21, 1994 | | June 30, 2014 | | | 25,000,000 | |
13.50% | | October 24, 1991 | | September 15, 2014 | | | 23,981,059,364 | |
13.50% | | September 16, 2012 | | September 15, 2014 | | | 13,961,064 | |
13.50% | | February 28, 2002 | | September 15, 2014 | | | 760,000,000 | |
Zero Coupon | | May 18, 1994 | | November 30, 2014 | | | 32,620,000 | |
8.75% | | May 27, 2003 | | December 21, 2014 | | | 11,523,800,696 | |
Zero Coupon | | March 14, 1994 | | June 30, 2015 | | | 152,300,000 | |
Zero Coupon | | September 14, 1995 | | July 1, 2015 | | | 500,000,000 | |
13.50% | | October 24, 1991 | | September 15, 2015 | | | 23,981,059,364 | |
13.50% | | September 16, 2012 | | September 15, 2015 | | | 13,961,064 | |
13.50% | | February 28, 2002 | | September 15, 2015 | | | 760,000,000 | |
Zero Coupon | | April 19, 1994 | | October 19, 2015 | | | 77,877,914 | |
13.50% | | October 24, 1991 | | September 15, 2016 | | | 23,981,059,364 | |
13.50% | | September 16, 2012 | | September 15, 2016 | | | 13,961,064 | |
13.50% | | February 28, 2002 | | September 15, 2016 | | | 760,000,000 | |
2.50% | | June 9, 2010 | | January 31, 2017 | | | 24,861,682,949 | (1) |
8.25% | | May 7, 2004 | | September 15, 2017 | | | 85,271,933,836 | |
8.00% | | August 13, 2004 | | December 21, 2018 | | | 81,854,000,000 | |
Zero Coupon | | April 18, 1996 | | September 30, 2019 | | | 150,000,000 | |
7.25% | | June 20, 2005 | | January 15, 2020 | | | 88,629,603,937 | |
6.75% | | September 1, 2006 | | March 31, 2021 | | | 87,219,709,007 | |
126
| | | | | | | | |
Interest Rate | | Date of Issue | | Maturity Date | | Nominal Amount | |
2.75% | | June 17, 2010 | | January 31, 2022 | | | 32,551,539,287 | (1) |
7.75% | | June 22, 2012 | | February 28, 2023 | | | 39,145,000,000 | |
5.50% | | May 30, 2001 | | December 7, 2023 | | | 66,548,182,515 | (1) |
2.00% | | July 4, 2012 | | January 31, 2025 | | | 11,335,711,923 | |
10.50% | | May 22, 1998 | | December 21, 2025 | | | 43,778,957,115 | |
10.50% | | October 31, 2002 | | December 21, 2025 | | | 100,000,000 | |
10.50% | | May 22, 1998 | | December 21, 2026 | | | 43,778,957,115 | |
10.50% | | October 31, 2002 | | December 21, 2026 | | | 100,000,000 | |
10.50% | | May 22, 1998 | | December 21, 2027 | | | 43,778,957,115 | |
10.50% | | October 31, 2002 | | December 21, 2027 | | | 100,000,000 | |
2.60% | | September 27, 2007 | | March 31, 2028 | | | 41,919,886,767 | |
7.00% | | May 28, 2010 | | February 28, 2031 | | | 70,498,879,862 | |
3.45% | | August 15, 2003 | | December 7, 2033 | | | 63,237,665,014 | (1) |
6.25% | | July 21, 2006 | | March 31, 2036 | | | 74,559,552,145 | |
8.50% | | July 19, 2013 | | January 31, 2037 | | | 7,250,000,000 | |
2.25% | | July 4, 2012 | | January 31, 2038 | | | 13,790,985,673 | |
6.50% | | June 4, 2010 | | February 28, 2041 | | | 61,710,957,597 | |
2.50% | | July 24, 2013 | | March 31, 2046 | | | 1,808,225,745 | |
8.75% | | June 29,2012 | | February 28, 2047 | | | 11,981,333,333 | |
8.75% | | June 29, 2012 | | February 28, 2048 | | | 11,981,333,333 | |
8.75% | | June 20,2012 | | February 28, 2049 | | | 11,981,333,333 | |
2.50% | | July 11, 2012 | | December 31, 2049 | | | 5,412,209,113 | |
2.50% | | July 11, 2012 | | December 31, 2050 | | | 5,412,209,113 | |
2.50% | | July 11, 2012 | | December 31, 2051 | | | 5,412,209,113 | |
4.50% | | December 1, 1986 | | Perpetual | | | 31,930 | |
5.00% | | December 1, 1986 | | Perpetual | | | 131,979 | |
127
| | | | | | | | |
Interest Rate | | Date of Issue | | Maturity Date | | Nominal Amount | |
9.75% | | April 10, 1980 | | Perpetual | | | 17,670,000 | |
10.00% | | January 31, 1978 | | Perpetual | | | 5,700,000 | |
10.00% | | January 31, 1978 | | Perpetual | | | 2,800,000 | |
Total Funded Internal Debt | | | | | | | 1,139,305,399,030 | |
| | | | | | | | |
Note: —
| (1) | Inflation-linked bonds have been revalued using the relevant “reference CPI.” |
Source: South African National Treasury.
128
Floating Internal Debt of the Republic of South Africa
(Treasury Bills — in Rand)
As of September 30, 2013
| | | | | | | | |
Interest Rate | | Date of Issue | | Maturity Date | | Nominal Amount | |
5.05% | | October 3, 2012 | | October 2, 2013 | | | 880,000,000 | |
5.04% | | October 10, 2012 | | October 9, 2013 | | | 880,000,000 | |
5.06% | | October 17, 2012 | | October 16, 2013 | | | 880,000,000 | |
5.05% | | October 24, 2012 | | October 23, 2013 | | | 880,000,000 | |
5.06% | | October 31, 2012 | | October 30, 2013 | | | 880,000,000 | |
5.06% | | November 7, 2012 | | November 6, 2013 | | | 880,000,000 | |
5.05% | | November 14, 2012 | | November 13, 2013 | | | 880,000,000 | |
5.05% | | November 21, 2012 | | November 20, 2013 | | | 800,000,000 | |
5.17% | | November 28, 2012 | | November 27, 2013 | | | 880,000,000 | |
5.15% | | December 5, 2012 | | December 4, 2013 | | | 880,000,000 | |
5.23% | | December 12, 2012 | | December 11, 2013 | | | 550,000,000 | |
5.25% | | December 19, 2012 | | December 18, 2013 | | | 880,000,000 | |
5.23% | | December 27, 2012 | | December 26, 2013 | | | 880,000,000 | |
5.26% | | January 2, 2013 | | January 1, 2014 | | | 880,000,000 | |
5.25% | | January 2, 2013 | | October 2, 2013 | | | 1,130,000,000 | |
5.33% | | January 9, 2013 | | January 8, 2014 | | | 500,100,000 | |
5.27% | | January 9, 2013 | | October 9, 2013 | | | 700,000,000 | |
5.24% | | January 16, 2013 | | January 15, 2014 | | | 880,000,000 | |
5.23% | | January 16, 2013 | | October 16, 2013 | | | 1,130,000,000 | |
5.22% | | January 23, 2013 | | January 22, 2014 | | | 880,000,000 | |
5.21% | | January 23, 2013 | | October 23, 2013 | | | 1,130,000,000 | |
5.22% | | January 30, 2013 | | January 29, 2014 | | | 880,000,000 | |
5.23% | | January 30, 2013 | | October 30, 2013 | | | 1,130,000,000 | |
129
| | | | | | | | |
Interest Rate | | Date of Issue | | Maturity Date | | Nominal Amount | |
5.24% | | February 6, 2013 | | February 5, 2014 | | | 862,000,000 | |
5.26% | | February 6, 2013 | | November 6, 2013 | | | 1,130,000,000 | |
5.25% | | February 13, 2013 | | February 12, 2014 | | | 450,000,000 | |
5.26% | | February 13, 2013 | | November 13, 2013 | | | 1,130,000,000 | |
5.24% | | February 20, 2013 | | February 19, 2014 | | | 880,000,000 | |
5.24% | | February 20, 2013 | | November 20, 2013 | | | 1,130,000,000 | |
5.24% | | February 27, 2013 | | February 26, 2014 | | | 880,000,000 | |
5.24% | | February 27, 2013 | | November 27, 2013 | | | 1,130,000,000 | |
5.24% | | March 6, 2013 | | March 5, 2014 | | | 1,000,000,000 | |
5.24% | | March 6, 2013 | | December 4, 2013 | | | 1,300,000,000 | |
5.22% | | March 13, 2013 | | March 12, 2014 | | | 1,120,000,000 | |
5.25% | | March 13, 2013 | | December 11, 2013 | | | 1,300,000,000 | |
5.26% | | March 20, 2013 | | March 19, 2014 | | | 600,000,000 | |
5.26% | | March 20, 2013 | | December 18, 2013 | | | 1,300,000,000 | |
5.32% | | March 27, 2013 | | March 26, 2014 | | | 810,000,000 | |
5.27% | | March 27, 2013 | | December 25, 2013 | | | 1,300,000,000 | |
5.36% | | April 3, 2013 | | April 2, 2014 | | | 800,000,000 | |
5.35% | | April 3, 2013 | | January 1, 2014 | | | 1,150,000,000 | |
5.30% | | April 3, 2013 | | October 2, 2013 | | | 1,665,000,000 | |
5.42% | | April 10, 2013 | | April 9, 2014 | | | 1,120,000,000 | |
5.36% | | April 10, 2013 | | January 8, 2014 | | | 1,300,000,000 | |
5.31% | | April 10, 2013 | | October 9, 2013 | | | 1,665,000,000 | |
5.42% | | April 17, 2013 | | April 16, 2014 | | | 1,120,000,000 | |
5.35% | | April 17, 2013 | | January 15, 2014 | | | 1,300,000,000 | |
5.31% | | April 17, 2013 | | October 16, 2013 | | | 1,665,000,000 | |
130
| | | | | | | | |
Interest Rate | | Date of Issue | | Maturity Date | | Nominal Amount | |
5.35% | | April 24, 2013 | | April 23, 2014 | | | 1,120,000,000 | |
5.30% | | April 24, 2013 | | January 22, 2014 | | | 1,300,000,000 | |
5.26% | | April 24, 2013 | | October 23, 2013 | | | 1,665,000,000 | |
5.31% | | May 1, 2013 | | April 30, 2014 | | | 1,120,000,000 | |
5.27% | | May 1, 2013 | | January 29, 2014 | | | 1,300,000,000 | |
5.24% | | May 1, 2013 | | October 30, 2013 | | | 1,665,000,000 | |
5.22% | | May 8, 2013 | | May 7, 2014 | | | 1,120,000,000 | |
5.18% | | May 8, 2013 | | February 5, 2014 | | | 1,300,000,000 | |
5.19% | | May 8, 2013 | | November 6, 2013 | | | 1,665,000,000 | |
5.09% | | May 15, 2013 | | May 14, 2014 | | | 1,120,000,000 | |
5.08% | | May 15, 2013 | | February 12, 2014 | | | 1,300,000,000 | |
5.01% | | May 15, 2013 | | November 13, 2013 | | | 1,665,000,000 | |
5.11% | | May 22, 2013 | | May 21, 2014 | | | 1,120,000,000 | |
5.09% | | May 22, 2013 | | February 19, 2014 | | | 1,300,000,000 | |
5.10% | | May 22, 2013 | | November 20, 2013 | | | 1,665,000,000 | |
5.20% | | May 29, 2013 | | May 28, 2014 | | | 1,120,000,000 | |
5.17% | | May 29, 2013 | | February 26, 2014 | | | 1,300,000,000 | |
5.15% | | May 29, 2013 | | November 27, 2013 | | | 1,665,000,000 | |
5.47% | | June 5, 2013 | | June 4, 2014 | | | 1,120,000,000 | |
5.41% | | June 5, 2013 | | March 5, 2014 | | | 1,300,000,000 | |
5.34% | | June 5, 2013 | | December 4, 2013 | | | 1,665,000,000 | |
5.63% | | June 12, 2013 | | June 11, 2014 | | | 1,120,000,000 | |
5.55% | | June 12, 2013 | | March 12, 2014 | | | 1,300,000,000 | |
5.33% | | June 12, 2013 | | December 11, 2013 | | | 1,665,000,000 | |
5.70% | | June 19, 2013 | | June 18, 2014 | | | 1,120,000,000 | |
131
| | | | | | | | |
Interest Rate | | Date of Issue | | Maturity Date | | Nominal Amount | |
5.55% | | June 19, 2013 | | March 19, 2014 | | | 1,300,000,000 | |
5.31% | | June 19, 2013 | | December 18, 2013 | | | 1,665,000,000 | |
5.76% | | June 26, 2013 | | June 25, 2014 | | | 1,120,000,000 | |
5.65% | | June 26, 2013 | | March 26, 2014 | | | 1,300,000,000 | |
5.39% | | June 26, 2013 | | December 25, 2013 | | | 1,165,000,000 | |
5.67% | | July 3, 2013 | | July 2, 2014 | | | 1,120,000,000 | |
5.57% | | July 3, 2013 | | April 2, 2014 | | | 1,300,000,000 | |
5.38% | | July 3, 2013 | | January 1, 2014 | | | 1,665,000,000 | |
5.22% | | July 3, 2013 | | October 2, 2013 | | | 3,685,000,000 | |
5.70% | | July 10, 2013 | | July 9, 2014 | | | 1,120,000,000 | |
5.59% | | July 10, 2013 | | April 9, 2014 | | | 1,300,000,000 | |
5.40% | | July 10, 2013 | | January 8, 2014 | | | 1,665,000,000 | |
5.21% | | July 10, 2013 | | October 9, 2013 | | | 3,685,000,000 | |
5.69% | | July 17, 2013 | | July 16, 2014 | | | 1,120,000,000 | |
5.55% | | July 17, 2013 | | April 16, 2014 | | | 1,300,000,000 | |
5.39% | | July 17, 2013 | | January 15, 2014 | | | 1,665,000,000 | |
5.19% | | July 17, 2013 | | October 16, 2013 | | | 3,685,000,000 | |
5.71% | | July 24, 2013 | | July 23, 2014 | | | 1,120,000,000 | |
5.55% | | July 24, 2013 | | April 23, 2014 | | | 1,300,000,000 | |
5.39% | | July 24, 2013 | | January 22, 2014 | | | 1,665,000,000 | |
5.17% | | July 24, 2013 | | October 23, 2013 | | | 3,685,000,000 | |
5.71% | | July 31, 2013 | | July 30, 2014 | | | 1,120,000,000 | |
5.57% | | July 31, 2013 | | April 30, 2014 | | | 1,300,000,000 | |
5.39% | | July 31, 2013 | | January 29, 2014 | | | 1,665,000,000 | |
5.16% | | July 31, 2013 | | October 30, 2013 | | | 3,685,000,000 | |
132
| | | | | | | | |
Interest Rate | | Date of Issue | | Maturity Date | | Nominal Amount | |
5.76% | | August 7, 2013 | | August 6, 2014 | | | 1,120,000,000 | |
5.53% | | August 7, 2013 | | May 7, 2014 | | | 1,300,000,000 | |
5.40% | | August 7, 2013 | | February 5, 2014 | | | 1,665,000,000 | |
5.16% | | August 7, 2013 | | November 6, 2013 | | | 3,685,000,000 | |
5.80% | | August 14, 2013 | | August 13, 2014 | | | 1,120,000,000 | |
5.57% | | August 14, 2013 | | May 14, 2014 | | | 1,300,000,000 | |
5.43% | | August 14, 2013 | | February 12, 2014 | | | 1,665,000,000 | |
5.16% | | August 14, 2013 | | November 13, 2013 | | | 3,685,000,000 | |
5.80% | | August 21, 2013 | | August 20, 2014 | | | 1,120,000,000 | |
5.58% | | August 21, 2013 | | May 21, 2014 | | | 1,300,000,000 | |
5.46% | | August 21, 2013 | | February 19, 2014 | | | 1,665,000,000 | |
5.17% | | August 21, 2013 | | November 20, 2013 | | | 3,685,000,000 | |
5.16% | | August 28, 2013 | | August 27, 2014 | | | 1,120,000,000 | |
5.71% | | August 28, 2013 | | May 28, 2014 | | | 1,300,000,000 | |
5.51% | | August 28, 2013 | | February 26, 2014 | | | 1,665,000,000 | |
5.16% | | August 28, 2013 | | November 27, 2013 | | | 3,685,000,000 | |
5.99% | | September 4, 2013 | | September 3, 2014 | | | 1,120,000,000 | |
5.78% | | September 4, 2013 | | June 4, 2014 | | | 1,300,000,000 | |
5.52% | | September 4, 2013 | | March 5, 2014 | | | 1,665,000,000 | |
5.15% | | September 4, 2013 | | December 4, 2013 | | | 3,685,000,000 | |
5.98% | | September 11, 2013 | | September 10, 2014 | | | 1,120,000,000 | |
5.74% | | September 11, 2013 | | June 11, 2014 | | | 1,300,000,000 | |
5.51% | | September 11, 2013 | | March 12, 2014 | | | 1,665,000,000 | |
5.12% | | September 11, 2013 | | December 11, 2013 | | | 3,685,000,000 | |
5.81% | | September 18, 2013 | | September 17, 2014 | | | 1,120,000,000 | |
133
| | | | | | | | |
Interest Rate | | Date of Issue | | Maturity Date | | Nominal Amount | |
5.64% | | September 18, 2013 | | June 18, 2014 | | | 1,250,000,000 | |
5.48% | | September 18, 2013 | | March 19, 2014 | | | 1,665,000,000 | |
5.12% | | September 18, 2013 | | December 18, 2013 | | | 3,685,000,000 | |
5.78% | | September 25, 2013 | | September 24, 2014 | | | 1,120,000,000 | |
5.53% | | September 25, 2013 | | June 25, 2014 | | | 1,300,000,000 | |
5.46% | | September 25, 2013 | | March 26, 2014 | | | 1,665,000,000 | |
5.12% | | September 25, 2013 | | December 25, 2013 | | | 3,685,000,000 | |
Total Floating Internal Debt | | | | | | | 189,687,100,000 | (1)) |
| | | | | | | | |
Note: —
| (1) | Excludes borrowing from the Corporation for Public Deposits to the amount of R7,235,991,034. |
Source: South African National Treasury.
134
Funded External Debt of the Republic of South Africa
as of September 30, 2013
| | | | | | | | |
Interest Rate | | Date of Issue | | Maturity Date | | Nominal Amount | |
Capital market loans | | | | | | | | |
8.50% | | June 23, 1997 | | June 23, 2017 | | $ | 140,683,000 | |
2.50% | | February 2, 1998 | | May 20, 2021 | | ¥ | 752,640,000 | |
3.80% | | June 1, 2000 | | June 1, 2020 | | ¥ | 30,000,000,000 | |
3.80% | | June 12, 2001 | | September 7, 2021 | | ¥ | 30,000,000,000 | |
6.50% | | June 2, 2004 | | June 2, 2014 | | $ | 1,000,000,000 | |
4.50% | | April 5, 2006 | | April 5, 2016 | | € | 750,000,000 | |
5.875% | | May 30, 2007 | | May 30, 2022 | | $ | 1,000,000,000 | |
6.875% | | May 27, 2009 | | May 27, 2019 | | $ | 1,500,000,000 | |
6.875% | | September 4, 2009 | | May 27, 2019 | | $ | 500,000,000 | |
5.50% | | March 5, 2010 | | September 3, 2020 | | $ | 2,000,000,000 | |
6.25% | | March 8, 2011 | | March 8, 2041 | | $ | 750,000,000 | |
4.665% | | January 17, 2012 | | January 17, 2024 | | $ | 1,500,000,000 | |
5.875% | | September 16, 2013 | | September 16, 2025 | | $ | 2,000,000,000 | |
Fixed | | | | | | | | |
4.89% | | May 5, 2000 — April 28, 2006 | | February 28, 2005 — August 28, 2014 | | € | 7,378,499.45 | |
4.89% | | May 5, 2000 — July 15, 2006 | | May 30, 2005 — November 28, 2014 | | € | 5,369,631.28 | |
4.89% | | May 5, 2000 — August 25, 2006 | | September 30, 2005 — March 30,2015 | | € | 5,618,373.21 | |
4.89% | | May 5, 2000 — August 25, 2006 | | November 28, 2002 — May 28, 2015 | | € | 7,256,074.67 | |
Floating — Non-CIRR | | August 21, 2000 — August 21, 2006 | | January 25, 2006 — July 25, 2015 | | € | 48,737,803.13 | |
Floating — Non-CIRR | | August 21, 2000 — August 29, 2006 | | January 25, 2007 — July 25, 2016 | | € | 72,239,293.24 | |
Floating — Non-CIRR | | August 21, 2000 — August 29, 2006 | | January 25, 2008 — July 25, 2017 | | € | 91,065,136.22 | |
5.97% Eur—CIRR Fixed | | August 21, 2000 — August 21, 2006 | | January 25, 2006 — July 25, 2015 | | € | 5,621,801.80 | |
5.97% Eur—CIRR Fixed | | August 21, 2000 — August 29, 2006 | | January 25, 2007 — July 25, 2016 | | € | 8,332,648.44 | |
135
| | | | | | | | |
Interest Rate | | Date of Issue | | Maturity Date | | Nominal Amount | |
5.97% Eur-CIRR Fixed | | August 21, 2000 — August 29, 2006 | | January 25, 2008 — July 25, 2017 | | € | 10,504,169.65 | |
7.32% $-CIRR Fixed | | August 21, 2000 — August 21, 2006 | | January 25, 2006 — July 25, 2015 | | $ | 1,673,036.89 | |
7.32% $-CIRR Fixed | | August 21, 2000 — August 29, 2006 | | January 25, 2007 — July 25, 2016 | | $ | 2,629,665.48 | |
7.32% $-CIRR Fixed | | August 21, 2000 — August 29, 2006 | | January 25, 2008 — July 25, 2017 | | $ | 3,435,571.76 | |
Floating Non-CIRR | | April 29, 2002 — April 28, 2003 | | May 31, 2004 — November 30, 2013 | | € | 6,290,939.29 | |
Floating Non-CIRR | | June 23, 2003 — September 15, 2006 | | October 29, 2004 — April 29, 2014 | | € | 8,971,773.47 | |
5.97% Eur-CIRR Fixed | | April 29, 2002 — April 28, 2003 | | May 31, 2004 — November 30, 2013 | | € | 1,063,015.84 | |
5.97% Eur-CIRR Fixed | | June 23, 2003 — September 15, 2006 | | October 29, 2004 — April 29, 2014 | | € | 1,516,011.61 | |
7.32% $-CIRR Fixed | | April 29, 2002 — April 28, 2003 | | May 31, 2004 — November 30, 2013 | | $ | 298,084.22 | |
7.32% $-CIRR Fixed | | June 23, 2003 — September 15, 2006 | | October 29, 2004 — April 29, 2014 | | $ | 484,962.95 | |
7.14% CIRR Fixed | | April 17, 2000 — March 5, 2001 | | April 15, 2006 — October 15, 2018 | | $ | 15,914,900.02 | |
4.70% MC CIRR | | July 17, 2000 — July 17, 2001 | | April 15, 2006 — October 15, 2015 | | € | 25,983,301.20 | |
4.77% Commercial Fixed | | April 15, 2001 | | April 15, 2009 — October 15, 2018 | | € | 6,270,174.04 | |
5.15% Commercial Fixed | | April 15, 2002 — May 21, 2003 | | April 15, 2009 — October 15, 2018 | | $ | 15,439,557.45 | |
5.03% Commercial Fixed | | July 15, 2002 — July 15, 2003 | | October 15, 2006 — April 15, 2016 | | $ | 32,360,722.69 | |
5.63% CIRR – Fixed | | July 15, 2002 – September 28, 2006 | | April 15, 2006 — October 15, 2015 | | € | 10,599,609.95 | |
5.63% MC CIRR | | April 15, 2004 – July 17, 2006 | | April 15, 2009 — October 15, 2018 | | € | 19,783,117.31 | |
6.485% Commercial Fixed | | December 15, 2001 – January 15, 2003 | | April 17, 2006 — October 15, 2015 | | £ | 6,362,290.07 | |
6.545% Sec – CIRR | | July 21, 2004 – July 22, 2005 | | April 15, 2009 — October 15, 2018 | | £ | 10,277,522.52 | |
6.545% Sec – CIRR | | November 26, 2003 – August 24, 2006 | | April 15, 2006 — October 15, 2015 | | £ | 9,417,066.14 | |
6.545% Sec – CIRR | | August 24, 2006 | | October 15, 2006 — April 15, 2016 | | £ | 67,099.22 | |
5.50% Commercial Fixed | | July 21, 2004 | | April 15, 2009 — October 15, 2018 | | € | 14,937,998.08 | |
4.72% Commercial Fixed | | April 18, 2006 | | April 15, 2009 — October 15, 2018 | | € | 25,202.82 | |
3.57% Commercial Fixed | | November 26, 2006 — March 5, 2008 | | April 15, 2008 — October 15, 2015 | | £ | 1,581,977.56 | |
3.59% Commercial Fixed | | March 24, 2009 — August 19, 2009 | | April 15, 2009 — October 15, 2015 | | £ | 1,499,851.15 | |
136
| | | | | | | | |
3.65% Commercial Fixed | | March 5, 2008 — October 1, 2008 | | April 15, 2008 — April 15, 2016 | | £ | 1,459,935.38 | |
4.23% Commercial Fixed | | December 15, 2008 | | April 15, 2009 — October 15, 2018 | | £ | 90,986.33 | |
4.28% Commercial Fixed | | December 4, 2008 | | April 15, 2009 — October 15, 2018 | | £ | 9,230,424.46 | |
4.61% Commercial Fixed | | July 31, 2008 — April 15, 2010 | | April 15, 2009 — October 15, 2018 | | £ | 5,480,556.01 | |
4.90% Commercial Fixed | | December 15, 2009 | | April 15, 2010 — October 15, 2018 | | £ | 1,719,042.56 | |
4.92% Commercial Fixed | | April 6, 2010 | | April 15, 2011 — April 15, 2020 | | £ | 1,944,668.47 | |
5.10% Commercial Fixed | | December 15, 2009 – October 15, 2010 | | April 15, 2011 — April 15, 2020 | | £ | 3,283,215.78 | |
5.25% Commercial Fixed | | March 23, 2011 | | October 15, 2011 — April 15, 2020 | | £ | 2,909,159.36 | |
6.77% MC CIRR | | July 22, 2005 | | April 15, 2009 — October 15, 2018 | | £ | 63,079.90 | |
5.79% Commercial Fixed | | July 15, 2002 — April 15, 2004 | | April 15, 2009 — October 15, 2018 | | $ | 2,035,548.68 | |
5.97% Commercial Fixed | | October 16, 2006 | | April 15, 2009 — October 15, 2018 | | $ | 883,303.75 | |
5.55% Commercial Fixed | | October 15, 2003 — April 15, 2004 | | April 15, 2009 — October 15, 2018 | | $ | 20,208,730.03 | |
5.315% Commercial Fixed | | April 15, 2009 | | April 15, 2011 — April 15, 2020 | | $ | 128,496.81 | |
5.39% Commercial Fixed | | December 15, 2009 | | April 15, 2010 — October 15, 2018 | | $ | 103,763.28 | |
5.40% Commercial Fixed | | June 22, 2007 — August 19, 2009 | | April 15, 2009 — October 15, 2018 | | $ | 5,826,083,75 | |
5.45% Commercial Fixed | | October 15, 2001 — July 15, 2002 | | April 15, 2006 — October 15, 2015 | | $ | 9,115,302.73 | |
5.53% Commercial Fixed | | November 26, 2003 — April 26, 2004 | | October 15, 2006 — April 15, 2016 | | $ | 17,600,265.02 | |
5.16% Commercial Fixed | | June 6, 2008 — August 19, 2009 | | April 15, 2009 — October 15, 2018 | | $ | 8,938,364.01 | |
5.61% Commercial Fixed | | December 15, 2009 | | April 15, 2010 — October 15, 2018 | | $ | 67,632.93 | |
5.49% Commercial Fixed | | April 17, 2001 — July 15, 2003 | | April 15, 2009 — October 15, 2018 | | SEK | 240,493,555.61 | |
3.90% Commercial Fixed | | April 15, 2005 — July 22, 2005 | | April 15, 2011 — April 15, 2020 | | SEK | 123,186,572.62 | |
4.30% Commercial Fixed | | October 17, 2005 — January 17, 2006 | | April 15, 2011 — April 15, 2020 | | SEK | 292,894,294.41 | |
3.81% Commercial Fixed | | October 26, 2004 — July 22, 2005 | | April 15, 2009 — October 15, 2018 | | SEK | 289,611,996.34 | |
4.24% Commercial Fixed | | October 17, 2005 — January 16, 2006 | | April 15, 2009 — October 15, 2018 | | SEK | 98,852,743.30 | |
4.57% Commercial Fixed | | April 18, 2006 — October 16, 2006 | | April 15, 2009 — October 15, 2018 | | SEK | 119,502,785.80 | |
5.03% Commercial Fixed | | January 15, 2007 — April 16, 2007 | | April 15, 2009 — October 15, 2018 | | SEK | 31,464,838.65 | |
137
| | | | | | | | |
4.60% Commercial Fixed | | April 18, 2006 — October 16, 2006 | | April 15, 2011 — April 15, 2020 | | SEK | 883,419,637.91 | |
5.05% Commercial Fixed | | January 16, 2007 | | April 15, 2011 — April 15, 2020 | | SEK | 203,712,542.91 | |
5.60% Commercial Fixed | | June 25, 2007 | | April 15, 2011 — April 15, 2020 | | SEK | 403,794,992.38 | |
5.50% Commercial Fixed | | August 24, 2004 | | October 15, 2006 — April 15, 2016 | | $ | 3,108,553.77 | |
4.42% Commercial Fixed | | November 29, 2004 — December 23, 2005 | | October 15, 2006 — April 15, 2016 | | € | 4,508,268.89 | |
5.48% Commercial Fixed | | December 23, 2005 — June 29, 2006 | | October 15, 2006 — April 15, 2016 | | € | 3,447,130.97 | |
4.52% Commercial Fixed | | July 21, 2004 — October 17, 2005 | | April 15, 2009 — October 15, 2018 | | € | 217,886.50 | |
4.57% Commercial Fixed | | April 15, 2005 — January 17, 2006 | | April 15, 2011 — April 15, 2020 | | € | 22,762,808.32 | |
4.76% Commercial Fixed | | April 18, 2006 — July 17, 2006 | | April 15, 2011 — April 15, 2020 | | € | 36,550,460.79 | |
6.315% Commercial Fixed | | November 1, 2006 — March 20, 2007 | | April 15, 2007 — October 15, 2015 | | £ | 4,546,192.03 | |
5.13% Commercial Fixed | | October 15, 2006 — March 20, 2007 | | April 15, 2007 — October 15, 2015 | | € | 40,093.49 | |
5.16% Commercial Fixed | | October 15, 2006 — April 16, 2007 | | April 15, 2009 — October 15, 2018 | | € | 5,301,884.53 | |
5.175% Commercial Fixed | | January 15, 2007 | | April 15, 2011 — April 15, 2020 | | € | 11,376,333.79 | |
6.28% Commercial Fixed | | December 21, 2006 | | April 15, 2007 — April 15, 2016 | | £ | 99,149.16 | |
6.28% Commercial Fixed | | October 16, 2006 — January 15, 2007 | | April 15, 2009 — October 15, 2018 | | £ | 12,378.17 | |
6.42% Commercial Fixed | | December 15, 2008 | | April 15, 2011 — April 15, 2020 | | $ | 10,098,588.15 | |
6.61% Commercial Fixed | | July 15, 2002 — April 15, 2004 | | April 15, 2009 — October 15, 2018 | | $ | 9,256,792.32 | |
6.65% Commercial Fixed | | June 22, 2007 | | October 15, 2010 — April 15, 2020 | | $ | 40,985,775.28 | |
5.89% Commercial Fixed | | October 23, 2009 — April 15, 2010 | | April 15, 2010 — October 15, 2018 | | $ | 4,675,682.39 | |
5.98% Commercial Fixed | | October 16, 2006 | | October 15, 2010 — April 15, 2020 | | $ | 19,335,493.37 | |
5.475% Commercial Fixed | | June 27, 2007 — September 27, 2007 | | October 15, 2007 — October 15, 2015 | | € | 95,524.96 | |
5.515% Commercial Fixed | | July 24, 2007 | | April 15, 2009 — October 15, 2018 | | € | 2,908,438.80 | |
4.93% Commercial Fixed | | April 16, 2007 | | April 15, 2009 — October 15, 2018 | | € | 1,066,128.22 | |
5.29% Commercial Fixed | | June 25, 2007 — July 24, 2007 | | April 15, 2009 — October 15, 2018 | | SEK | 39,385,868.78 | |
4.64% Commercial Fixed | | November 26, 2007 — December 20, 2007 | | April 15, 2008 — April 15, 2016 | | $ | 5,338,432.84 | |
3.26% Commercial Fixed | | March 19, 2008 — June 17, 2008 | | April 15, 2008 — April 15, 2016 | | $ | 2,880,796.19 | |
5.09% Commercial Fixed | | April 15, 2009 | | April 15, 2011 — April 15, 2020 | | $ | 197,141.33 | |
138
| | | | | | | | |
5.51% Commercial Fixed | | December 15, 2009 | | April 15, 2011 — April 15, 2020 | | $ | 235,062.25 | |
5.70% Commercial Fixed | | September 15, 2009 | | April 15, 2011 — April 15, 2020 | | $ | 153,213.70 | |
5.70% Commercial Fixed | | December 15, 2009 — April 15, 2010 | | April 15, 2010 — October 15, 2018 | | $ | 6,750,704.30 | |
6.50% Commercial Fixed | | April 16, 2007 | | April 15, 2009 — October 15, 2018 | | £ | 18,507.93 | |
5.35% Commercial Fixed | | October 17, 2011 | | April 15, 2012 — April 15, 2020 | | £ | 3,730,047.66 | |
5.18% Commercial Fixed | | May 15, 2007 — October 15, 2007 | | April 15, 2011 — April 15, 2020 | | € | 10,352,716.74 | |
6.66% Commercial Fixed | | October 15, 2007 | | April 15, 2011 — April 15, 2020 | | $ | 14,298,034.40 | |
6.75% Commercial Fixed | | July 31, 2008 | | April 15, 2011 — April 15, 2020 | | $ | 31,280,319.98 | |
6.50% Commercial Fixed | | September 16, 2008 | | April 15, 2011 — April 15, 2020 | | $ | 20,367,082.63 | |
7.89% Commercial Fixed | | December 15, 2009 | | April 15, 2011 — April 15, 2020 | | $ | 7,149,018.54 | |
5.34% Commercial Fixed | | May 15, 2007 — October 15, 2007 | | April 15, 2011 — April 15, 2020 | | SEK | 156,277,872.488 | |
5.64% Commercial Fixed | | October 15, 2007 | | April 15, 2011 — April 15, 2020 | | SEK | 145,845,488.646 | |
6.06% Commercial Fixed | | July 31, 2008 | | April 15, 2011 — April 15, 2020 | | SEK | 300,392,488.853 | |
5.79% Commercial Fixed | | September 16, 2008 | | April 15, 2011 — April 15, 2020 | | SEK | 205,629,598.355 | |
5.45% Commercial Fixed | | December 15, 2008 | | April 15, 2011 — April 15, 2020 | | SEK | 108,646,640.991 | |
5.50% Commercial Fixed | | July 31, 2008 — August 18, 2009 | | April 15, 2009 — October 15, 2018 | | SEK | 296,610,686.928 | |
5.60% Commercial Fixed | | December 15, 2009 | | April 15, 2010 — October 15, 2018 | | SEK | 2,157,186.197 | |
5.62% Commercial Fixed | | December 15, 2009 | | April 15, 2011 — April 15, 2020 | | SEK | 4,886,826.531 | |
5.335% Commercial Fixed | | April 15, 2009 | | April 15, 2011 — April 15, 2020 | | SEK | 3,966,809.879 | |
5.425% Commercial Fixed | | October 23, 2009 — April 15, 2010 | | April 15, 2011 — April 15, 2020 | | SEK | 41,543,688.560 | |
5.80% Commercial Fixed | | October 23, 2009 — April 15, 2010 | | April 15, 2010 — October 15, 2018 | | SEK | 161,967,300.920 | |
6.30% Commercial Fixed | | December 15, 2009 | | April 15, 2011 — April 15, 2020 | | SEK | 72,804,759.899 | |
5.475% Commercial Fixed | | May 20, 2010 — October 15, 2010 | | April 15, 2011 — April 15, 2020 | | SEK | 55,920,556.403 | |
5.525% Commercial Fixed | | December 13,2010-April 16, 2012 | | October 15, 2011 — April 15, 2020 | | SEK | 64,220,236.756 | |
5.565% Commercial Fixed | | October 17, 2011 | | April 15, 2012 — April 15, 2020 | | SEK | 82,629,204.260 | |
5.595% Commercial Fixed | | December 07, 2011—March 20, 2012 | | April 15, 2011 — April 15, 2020 | | SEK | 43,409,828.729 | |
5.575% Commercial Fixed | | December 13,2010-April 16, 2012 | | October 15, 2011 — April 15, 2020 | | $ | 3,089,070.758 | |
139
| | | | | | | | |
5.355% Commercial Fixed | | April 6, 2010 | | April 15, 2011 — April 15, 2020 | | $ | 1,998,301.471 | |
5.47% Commercial Fixed | | March 8, 2010 — October 15, 2010 | | April 15, 2011 — April 15, 2020 | | $ | 2,689,846.180 | |
5.58% Commercial Fixed | | April 6, 2010 | | April 15, 2011 — April 15, 2020 | | $ | 1,302,493.848 | |
5.695% Commercial Fixed | | March 8, 2010 — October 15, 2010 | | April 15, 2011 — April 15, 2020 | | $ | 1,753,243.017 | |
5.80% Commercial Fixed | | December 13, 2010 –April 16, 2012 | | October 15, 2011 — April 15, 2020 | | $ | 2,013,457.811 | |
5.905% Commercial Fixed | | October 17, 2011 | | April 15, 2012 — April 15, 2020 | | $ | 2,590,622.831 | |
5.68% Commercial Fixed | | October 17, 2011 | | April 15, 2012 — April 15, 2020 | | $ | 3,974,564.288 | |
5.775% Commercial Fixed | | December 07, 2011—March 20, 2012 | | April 15, 2011 — April 15, 2020 | | $ | 2,088,065.029 | |
6.00% Commercial Fixed | | December 07, 2011—March 20, 2012 | | April 15, 2011 — April 15, 2020 | | $ | 1,361,055.187 | |
5.43% Commercial Fixed | | December 07, 2011—March 20, 2012 | | April 15, 2011 — April 15, 2020 | | £ | 3,068,223.960 | |
Variable — CIRR Libor +0.40 | | | | | | | | |
| | April 15, 2009 — November 17, 2009 | | April 15, 2011 — April 15, 2020 | | $ | 399,376.703 | |
| | May 08, 2012 – September 11, 2012 | | October 15, 2012 — April 15, 2020 | | $ | 1,626,369.492 | |
| | April 16, 2012 | | October 15, 2012 — October 15, 2018 | | € | 139,754.749 | |
| | October 23, 2009 — March 22, 2011 | | April 15, 2010 — October 15, 2015 | | £ | 527,343.809 | |
| | March 4, 2009 — March 22, 2011 | | April 15, 2009 — April 15, 2016 | | £ | 1,869,176.759 | |
| | May 08, 2012 – September 11, 2012 | | October 15, 2012 — April 15, 2020 | | £ | 1,218,149.399 | |
| | May 08, 2012 – September 11, 2012 | | April 15, 2011 — April 15, 2020 | | $ | 2,452,613.313 | |
| | October 23, 2009 | | April 15, 2010 — October 15, 2018 | | SEK | 1,815,794.94 | |
| | May 08, 2012 – September 11, 2012 | | October 15, 2012 — April 15, 2020 | | SEK | 35,848,199.26 | |
Note: —
Commercial Interest Reference Rate (CIRR). The CIRR is determined monthly by the OECD and published on the 14th day of each month. Each CIRR is fixed based on the previous 30-day treasury rate of each currency.
Source: South African National Treasury.
140
Total External Debt by Currency as of September 30, 2013
| | | | |
Euro | | € | 1,206,332,005 | |
Pound Sterling | | £ | 70,476,043 | |
Swedish Krone | | SEK | 4,510,892,997 | |
U.S. Dollars | | $ | 10,731,295,815 | |
Yen | | ¥ | 60,752,640,000 | |
Source: South African National Treasury.
141