SECURITIES AND EXCHANGE COMMISSION
Washington, D.C. 20549
FORM 6-K
REPORT OF FOREIGN PRIVATE ISSUER
Pursuant to Rule 13a-16 or 15d-16
of the Securities Exchange Act of 1934
For the month of November 2021
Commission File Number: 001-13464
Telecom Argentina S.A.
(Translation of registrant’s name into English)
Alicia Moreau de Justo, No. 50, 1107
Buenos Aires, Argentina
(Address of principal executive offices)
Indicate by check mark whether the registrant files or will file annual reports under cover of Form 20-F or Form 40-F:
| Form 20-F | X | Form 40-F |
Indicate by check mark if the registrant is submitting the Form 6-K in paper as permitted by Regulation S-T Rule 101(b)(1):
| Yes | No | X |
Indicate by check mark if the registrant is submitting the Form 6-K in paper as permitted by Regulation S-T Rule 101(b)(7):
| Yes | No | X |
Telecom Argentina S.A.
TABLE OF CONTENTS
Item
| 1. | Telecom Argentina S.A. announces consolidated results for the nine-month period (“9M21”) and third quarter of fiscal year 2021 (“3Q21”). |

Contacts: Fernando Balmaceda (5411) 4968 5222 Luis Fernando Rial Ubago (5411) 5112 7218
| Market Cap (NYSE: TEO): US$2,279 million*
|
announces consolidated results for the nine month period (“9M21”) and third quarter of fiscal year 2021 (“3Q21”)**
Note: For the figures included in their FFSS, the Company has accounted for the effects of inflation adjustment adopted by Resolution 777/18 of the Comisión Nacional de Valores (“CNV”), which establishes that the restatement will be applied to the annual financial statements, for intermediate and special periods ended as of December 31, 2018 inclusive. Accordingly, the reported figures corresponding to 9M21 include the effects of the adoption of inflationary accounting in accordance with IAS 29. Finally, comments related to variations of results of 9M21 and vs. 9M20 mentioned in this press release correspond to “figures restated by inflation” or “constant”. Moreover, Table 3 contemplates information broken down by segment for periods ended as of September 30 of 2021 and 2020, as analyzed by the Executive Committee and the CEO, who receive periodically the financial information of Telecom and its subsidiaries (in historical values). For further details, please refer to the titles of the financial tables beginning from page 10.
| § | For comparative purposes, it is important to highlight that the results adjusted by inflation corresponding to September 2020 contain the effect of the year over year inflation as of September 2021, which amounted to 52.5%. |
| § | Consolidated Revenues amounted to P$292,983 million in 9M21. Service Revenues totaled P$272,173 million (-9.4% in constant currency vs. 9M20), in a context where inflation is still high. Service revenues for 3Q21 totaled P$89,578 million (+0.5% in constant currency vs 2Q21). |
| § | Mobile clients in Argentina reached 19.5 million in 9M21 (+266 thousand vs. 2Q21), cable TV subscribers totaled approximately 3.6 million (+16 thousand vs. 2Q21), while broadband accesses amounted to almost 4.2 million (+14 thousand vs. 2Q21). |
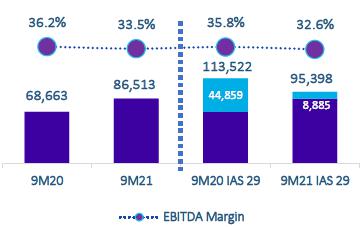
| § | Operating Income before Depreciation and Amortization amounted to P$95,398 million in 9M21 (-16.0% vs. 9M20). Operating Income totaled P$1,185 million (-96.0% vs. 9M20). |
| § | The Company’s Net Income amounted to P$1,025 million in 9M21. Income tax expense totaled P$30,960 million, which was partially offset by positive net financial results of P$30,590 million. |
| § | Investments (including rights of use assets) reached P$66,519 million in 9M21, equivalent to 22.7% of Consolidated Revenues. |
| § | Net Financial Debt amounted to P$223,416 million in 9M21, (-6.8% in constant currency vs. FY20). |
*Market Cap as of November 8th, 2021 **Unaudited non financial data
|
1
| (in million P$ adjusted by inflation, except where noted)** | IAS 29 As of September 30, 2021 | IAS 29 As of September 30, 2020 |
Δ $ |
Δ % |
| Consolidated Revenues | 292,983 | 317,476 | (24,493) | -7.7% |
| Operating Income before D&A | 95,398 | 113,522 | (18,124) | -16.0% |
| Operating Income | 1,185 | 29,568 | (28,383) | -96.0% |
| Net income before income tax expense | 31,985 | 9,957 | 22,028 | - |
| Net income (loss) attributable to Controlling Company | 358 | (2,508) | 2,866 | -114.3% |
| Shareholders' equity attributable to Controlling Company | 484,846 | 565,265 | (80,419) | -14.2% |
| Net Financial Debt | (223,416) | (201,948) | (21,468) | 10.6% |
| Investments in PP&E, intangible assets & rights of use assets * | 66,519 | 62,054 | 4,465 | 7.2% |
| Fixed lines in service (in thousand lines) *** | 2,524 | 2,938 | (414) | -14.1% |
| Mobile customers (in thousand) | 21,722 | 20,889 | 833 | 4.0% |
| Personal (Argentina) | 19,522 | 18,654 | 868 | 4.7% |
| Núcleo (Paraguay) -including Wimax customers - | 2,200 | 2,235 | (34) | -1.5% |
| Broadband accesses in Argentina (in thousand) | 4,248 | 4,185 | 64 | 1.5% |
| Pay TV Suscribers (in thousand) | 3,561 | 3,568 | (7) | -0.2% |
| Average Billing per user (ARBU) Fixed Telephony / voice (in P$ - Restated by inflation) | 708.2 | 827.5 | (119.3) | -14.4% |
| Average Revenue per user (ARPU) Mobile Services - Personal (in P$ - Restated by inflation) | 568.0 | 611.7 | (43.7) | -7.1% |
| Average Revenue per user (ARPU) Broadband (in P$ - Restated by inflation) | 1,580.5 | 1,829.2 | (248.7) | -13.6% |
| Average Revenue per user (ARPU) Cable TV (in P$ - Restated by inflation) | 1,749.2 | 1,959.7 | (210.5) | -10.7% |
| * (in constant measuring unit.) |
| **(Figures may not sum up due to rounding) |
| *** (does not include IP telephony lines, which as of September 30, 2021 amounted to approximately 647 thousand) |
Consolidated Revenues (in million P$)
|
EBITDA (in million P$)
| |
EBIT (in million P$)
| Net Income (Loss) (in million P$)
|


2
Buenos Aires, November 9, 2021 - Telecom Argentina S.A. (‘Telecom Argentina’) - (NYSE: TEO; BASE: TECO2), announced today a net income of P$1,025 million for the period ended September 30, 2021. The net loss attributable to the controlling company was P$358 million.
It is worth mentioning that the comparative figures for the previous fiscal year have been restated so that the resulting comparative information is presented in terms of the current measurement unit as of September 30, 2021.
The following table shows the evolution of the consumer price index (National CPI - according to INDEC’s official statistics) for the last two fiscal years and as of September 30, 2020 and 2021, which were used to restate the figures in constant currency:
| As of December 31, 2019 | As of December 31, 2020 | As of September 30, 2020 | As of September 30, 2021 | |
| Price Index Variation | ||||
| Annual | 53.8% | 36.1% | 36.6% | 52.5% |
| 3 month cumulative (since June) | n/a | n/a | 7.7% | 9.3% |
| 9 month cumulative | n/a | n/a | 22.3% | 37.0% |
During 9M21, Consolidated Revenues amounted to P$292,983 million, from which Service Revenues totaled P$272,173 million.
| IAS 29 9M21 | IAS 29 9M20 | Δ $ | Δ % | |
| Consolidated Revenues (MMP$) | 292,983 | 317,476 | (24,493) | (7.7%) |
| Net Income (loss) attributable to Controlling Company (MMP$) | 358 | (2,508) | 2,866 | (114.3%) |
| Net income (loss) attributable to Controlling Company per Share (P$) | 0.2 | (1.2) | 1.4 | |
| Net income (loss) attributable to Controlling Company per ADR (P$) | 0.8 | (5.8) | 6.7 | |
| Operating income before D&A * | 32.6% | 35.8% | ||
| Operating income * | 0.4% | 9.3% | ||
| Net income * | 0.3% | -0.6% |
| *As a percentage of Consolidated Revenues | ||||
| Note: The average of ordinary shares outstanding considered amounted to and 2,153,688,011 as of 9M21 and 9M20 | ||||
Consolidated Operating Revenues
Mobile Services
As of September 30, 2021, mobile clients in Argentina and Paraguay amounted to 21.7 million. In 9M21, mobile services revenues represented P$110,898 million (-P$10,631 million vs. 9M20).
Mobile Services in Argentina
As of September 30, 2021, mobile subscribers reached more than 19.5 million in Argentina (+266 thousand vs. 2Q21). Postpaid clients represented 42% of our subscriber base.
In 9M21, mobile service revenues in Argentina amounted to P$98,547 million (-6.8% vs 9M20). Mobile internet revenues reached 73% of mobile service revenues. The average monthly revenue per user (‘ARPU’ – restated in constant currency as of September 30, 2021) amounted to P$568 during 9M21 (-7.1% vs. 9M20). The effect generated by the inflation adjustment as of September 30, 2021 (included in the ARPU) amounted to P$65.8 and P$246.3, for the 9M21 and 9M20, respectively. Mobile churn was 1.1% (vs. 2.2% in 9M20).
Mobile Services Revenues
(in billion P$)

3

| Commercial Initiatives |  | |
| Aiming to promoting financial inclusion through the Fintech industry in Argentina, during this quarter, Personal announced its new Personal Pay virtual wallet service to Beta format. This product is now available to all users with Android operating system. Users can now register and start using the application. | ||
| Personal in Paraguay (‘Núcleo’) | ||
| As of September 30, 2021, Núcleo’s subscriber base reached 2.2 million clients. Prepaid and postpaid customers represented 82% and 18%, respectively. | ||
| Núcleo generated mobile service revenues equivalent to P$12,351 million during 9M21 (-21.6% vs. 9M20), mainly due to a decrease in the number of clients as well as a slight decrease in ARPU, which was partially offset by the appreciation of the Guaraní against the Argentine peso. |
 | ||
| Cable TV Services | ||
| Cable TV service revenues reached P$57,433 million in 9M21 (-P$4,707 million vs. 9M20). Cable TV subscribers totaled approximately 3.6 million (+16 thousand vs.2Q21). Moreover, the monthly Cable TV ARPU (restated in constant currency as of September 30, 2021) reached P$1,749.2 during 9M21 (vs P$1,959.7 in 9M20). The effect generated by the restatement in terms of the measuring unit as of September 30, 2021 included in the ARPU amounts to P$211.5 and P$789.1, for the 9M21 and 9M20, respectively. Additionally, the average monthly churn during 9M21 and 9M20 was 1.1% and 0.9%, respectively. | ||
| During the third quarter of the year, the strategy to close alliances with OTT platforms in order to integrate them to Flow continued. Paramount +, Star + and Amazon Prime Video were incorporated to Flow’s integrated applications offer. | ||
| Fixed Telephony and Data Services |  | |
| Revenues generated by fixed telephony and data reached P$41,082 million in 9M21 (-P$7,640 million vs. 9M20). | ||
| As a result, the average monthly revenue billed per user (‘ARBU’ - restated in constant currency as of September 30, 2021) of fixed telephony reached P$708.2 (vs. P$827.5 in 9M20). The effect generated by the restatement in terms of the measuring unit as of September 30, 2021, included in the ARBU amounted to P$88.3 and P$333.3 for the 9M21 and 9M20, respectively. | ||
| Regarding the corporate segment, Telecom continued to develop different initiatives to support companies in their productivity and growth. | ||
| In the third quarter, and within the framework of commercial initiatives focused on the corporate segment, a strategic alliance was announced with the IBM Cloud business unit, improving the access to hybrid cloud solutions while also adding new IoT products. |
4
| Internet Services | 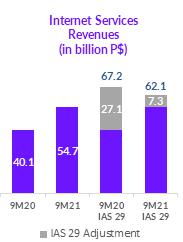 | |
| Internet services revenues totaled P$62,077 million during 9M21 (-P$5,091 million vs. 9M20). As of September 30, 2021, total broadband accesses reached approximately 4.2 million (+14 thousand vs. 2Q21). | ||
| Additionally, broadband ARPU (restated in constant currency as of September 30, 2021) amounted to P$1,580.5 per month in 9M21 (vs. P$1,829.2 in 9M20). The effect generated by the restatement in terms of the measuring unit as of September 30, 2021, included in the ARPU amounted to approximately P$187.4 and P$736.5, for the 9M21 and 9M20, respectively. | ||
| The average monthly churn rate for the 3Q21 was 1.5% (vs. 1.2% in 9M20). As of 9M21, 77.2% of our total customer base had a broadband service of 20Mb or higher (increasing from 69.3% as of 9M20). | ||
Revenues from equipment sales
Equipment revenues amounted to P$20,810 million (+P$3,770 million vs. 9M20). Said increase was mainly due to an increase in the number of units sold (+43%), and by the increase in the average prices of handsets.
Consolidated Operating Costs
Consolidated Operating Costs (including D&A and impairment of fixed assets) totaled P$291,798 million in 9M21 (+P$3,890 million or +1.4% vs. 9M20). Excluding D&A and impairment of fixed assets, operating costs showed a reduction of 3.1%.
The cost breakdown was as follows:
- Employees benefits and severance payments: P$60,347 million (+2.4% vs. 9M20). Total employees amounted to 22,846 as of 9M21.
- Interconnection and transmission costs (including roaming, international settlement charges and lease of circuits) totaled P$10,678 million (-8.8% vs. 9M20). This, was mainly due to a decrease in the number of links and sites, partially offset by the FX effect related to services to be paid in US dollars.
- Fees for services, maintenance, materials and supplies: P$33,448 million (+0.4% vs. 9M20). Fees for services decreased by P$455 million and maintenance and material costs increased by P$591 million compared to 9M20.
- Taxes and fees with regulatory authorities: P$22,602 million (-6.0% vs. 9M20). This decrease was mainly due to lower sales in 9M21 vs 9M20.
5
- Commissions and advertising (Commissions paid to agents, collection fees and other commissions): P$16,530 million (-5.7% vs. 9M20). Said decrease was mainly explained by lower agent commission charges and lower advertising costs.
- Cost of handsets sold: P$14,752 million (+33.7% vs. 9M20). P$14,046 million correspond to the cost of sales of devices in Argentina which increased 39.4% vs. 9M20 mainly due to the increase in prices and quantities sold.
- Programming and content costs: P$20,031 million (-3.7% vs. 9M20). This reduction was explained mainly by commercial efficiencies, which were partially offset by price increases of approximately 40% in almost all of our broadcasting signals.
- Other Costs totaled P$19,197 million (-27.7% vs. 9M20), from which bad debt expenses reached P$5,362 million (-55.4% vs. 9M20).
Our bad debt ratio was 1.8% as of September 30, 2021 (vs. 3.8% in 9M20) thanks to a strong strategy followed by the company to improve its collections.
Other operating costs (including charges for lawsuits and other contingencies, energy and other public services, insurance, rents and internet capacity) totaled P$13,835 million (-4.9% vs. 9M20).
- Depreciation, amortization and impairment of fixed assets amounted to P$94,213 million (+12.2% vs. 9M20). This increase was due to the impact of the amortization of assets incorporated after September 30, 2020.
Net Financial Results
Net Financial Results (including Financial Expenses on Debt and Other Financial Results, net) generated an income of P$30,590 million in 9M21 (vs. a loss of P$20,178 million in 9M20). This variation was mainly due to:
| in million of p$ | 9M20 | 9M21 | Var |
| FX results | (6,539) | 37,350 | 43,889 |
| Net Interests | (16,950) | (12,078) | 4,872 |
| Results of investments | 4,795 | (492) | (5,287) |
| RECPAM | 6,454 | 11,458 | 5,004 |
| Debt refinancing results | (4,704) | - | 4,704 |
| Others | (3,234) | (5,648) | (2,414) |
| Total | (20,178) | 30,590 | 50,768 |
Income Tax
Income tax loss amounted to P$30,960 million in 9M21 (vs. P$11,861 million in 9M20). Said loss mainly includes the effect of the change in the tax rate pursuant to the requirements of Law No. 27,630, which replaced the 25% rate with a scale of increasing rates based on the taxable income of each taxpayer, reaching 35% as of fiscal year 2021.
6

Consolidated Net Financial Debt
As of September 30, 2021, our net financial debt position (cash, cash equivalents plus financial investments and financial NDF & interest rate swaps minus loans) totaled P$223,416 million, decreasing P$16,627 million or equally -6.8% when compared to the consolidated net financial debt position as of December 31, 2020, which totaled P$239,683 million (restated in terms of the measuring unit as of September 30, 2021).
Investments in PP&E, intangible assets and rights of use assets
During 9M21, the Company invested P$66,519 million (+7.2% vs. 9M20). These investments represented 22.7% of consolidated revenues in 9M21, and were focused on:
 | ||
| · | Projects associated with the expansion of TV and internet services to improve our transmission and access speeds offered to our customers. | |
| · | Deployment of 4G coverage and capacity to support the growth of our mobile internet service and the improvement of its quality. | |
| · | Extension of our transmission networks in order to unify the different access technologies, reconverting the copper fixed networks into fiber or hybrid fiber-coaxial networks. | |
| · | Investments in our customer contact systems. |
New corporate identity and brands
In October, the company presented a new institutional visual identity and changed its commercial brands. This re-branding aims to better express and enhance the synergy of our services.
Personal now offers full connectivity to its customers with the best service experience, regardless of whether they are at home or elsewhere, thanks to fixed and mobile networks. Flow is currently a true meeting point for entertainment, where the contents of the most important streaming platforms on the market are also integrated. Finally, the company continues to offer digital solutions for the corporate and government segments through its brand Telecom.
In line with this evolution, the company renewed its institutional and investor relations websites, improving the contact and communication with investors.
Relevant Matters
Dividend distribution and reserve withdrawal
On August 11, 2021, the General Extraordinary Shareholders’ Meeting of Telecom Argentina resolved:
| 1. | To distribute dividends in kind as follows: (i) Global Bonds of the Argentine Republic amortizable in US Dollars maturing on 07/09/2030 (the “2030 Global Bonds”), for a nominal value of US$ 370,386,472, and (ii) Global Bonds of the Argentine Republic amortizable in US Dollars maturing on 07/09/2035 (the “2035 Global Bonds”) for a nominal value of US$ 186,621,565, at a ratio of US$ 0.171977775 2030 Global Bonds and US$ 0.086652089 2035 Global Bonds per share of the Company. |
7
| 2. | Consequently, to partially withdraw the “Voluntary reserve to maintain the capital investments level and the Company’s current level of solvency” in the amount of ARS 35,068,340,043. |
Change of registered office
On August 11, 2021, the Board of Directors of the Company decided to change the Registered Office of Telecom Argentina to General Hornos 690, City of Buenos Aires, effective as of September 1, 2021.
Irrevocable contribution to controlled company
On September 22, 2021, Telecom Argentina made an irrevocable contribution in cash to its controlled company Micro Sistemas S.A.U., on account of the future subscription of shares of said company fora total amount of P$260,000,000.
Other Relevant Matters
Extension of preliminary injunction
On October 21, 2021, the Company was served with notice of the decision rendered by the Federal Court of Appeals on Administrative Litigation Matters No. 8 in the proceedings “Telecom Argentina S.A. a/EN-Enacom and other re. preliminary injunction (Autonomous)” (Docket No. 12,881/2020) whereby the Court decided to extend for a period of 6 (six) months the preliminary injunction previously granted in this proceedings, pursuant to section 5 of Law N° 26,854.
Acquisition of shares of AVC Continente Audiovisual
On October 27, 2021, Telecom Argentina completed the acquisition of 497,479 ordinary, book-entry shares with a nominal value of ARS 1 each and with the right to one (1) vote each, representing forty percent (40%) of the capital stock and votes of its subsidiary AVC Continente Audiovisual S.A. (the “Shares”), given that Miguel Angel De Biasi and Alejandra E. Becerra de De Biasi have exercised their option to sell such shares.
*******
8
Telecom Argentina is a leading telecommunications company in Argentina, where it offers, either itself or through its controlled subsidiaries local and long distance fixed-line telephony, cellular, data transmission, and pay TV and Internet services, among other services. Additionally, Telecom Argentina offers mobile, broadband and satellite TV services in Paraguay and pay TV services in Uruguay. The Company commenced operations on November 8, 1990, upon the Argentine government’s transfer of the telecommunications system in the northern region of Argentina.
 | As of September 30, 2021, Telecom Argentina had 2,153,688,011 shares issued and outstanding. |
* Cablevisión Holding S.A. owns 18.89% of the total capital stock directly and owns
9.27% of the total capital stock indirectly through VLG S.A.U.
** Trustees: Hector Horacio Magnetto and David Manuel Martínez Guzmán
For more information, please contact Investor Relations:
Fernando Balmaceda (5411) 4968 5222 | Luis Fernando Rial Ubago (5411) 5112 7218 | Tomás Pellicori (5411) 5524 7692 |
For information about Telecom Argentina’s services, visit:
www.telecom.com.ar
www.personal.com.ar
www.personal.com.py
Disclaimer
This document may contain statements that could constitute forward-looking statements, including, but not limited to (i) the Company’s expectations for its future performance, revenues, income, earnings per share, capital expenditures, dividends, liquidity and capital structure; (ii) the continued synergies expected from the merger between the Company and Cablevisión S.A. (or the Merger); (iii) the implementation of the Company’s business strategy; (iv) the changing dynamics and growth in the telecommunications and cable markets in Argentina, Paraguay, Uruguay and the United States; (v) the Company’s outlook for new and enhanced technologies; (vi) the effects of operating in a competitive environment; (vii) the industry conditions; (viii) the outcome of certain legal proceedings; and (ix) regulatory and legal developments. Forward-looking statements may be identified by words such as “anticipate,” “believe,” “estimate,” “expect,” “intend,” “plan,” “project,” “will,” “may” and “should” or other similar expressions. Forward-looking statements are not guarantees of future performance and involve certain risks and uncertainties that are difficult to predict. In addition, certain forward-looking statements are based upon assumptions as to future events that may not prove to be accurate. Many factors could cause actual results, performance or achievements of the Company to be materially different from any future results, performance or achievements that may be expressed or implied by forward-looking statements. These factors include, among others: (i) the Company’s ability to successfully implement our business strategy and to achieve synergies resulting from the Merger; (ii) the Company’s ability to introduce new products and services that enable business growth; (iii) uncertainties relating to political and economic conditions in Argentina, Paraguay, Uruguay and the United States, including the policies of the new government in Argentina; (iv) the impact of political developments, including the policies of the new government in Argentina, on the demand for securities of Argentine companies; (v) inflation, the devaluation of the peso, the Guaraní and the Uruguayan peso and exchange rate risks in Argentina, Paraguay and Uruguay; (vi) restrictions on the ability to exchange Argentine or Uruguayan pesos or Paraguayan guaraníes into foreign currencies and transfer funds abroad; (vii) the impact of currency and exchange measures or restrictions on our ability to access the international markets and our ability to repay our dollar-denominated indebtedness; (viii) the creditworthiness of our actual or potential customers; (ix) the nationalization, expropriation and/or increased government intervention in companies; (x) technological changes; (xi) the impact of legal or regulatory matters, changes in the interpretation of current or future regulations or reform and changes in the legal or regulatory environment in which the Company operates, including regulatory developments such as sanctions regimes in other jurisdictions (e.g., the United States) which impact on the Company’s suppliers; (xii) the effects of increased competition; (xiii) reliance on content produced by third parties; (xiv) increasing cost of the Company’s supplies; (xv) inability to finance on reasonable terms capital expenditures required to remain competitive; (xvi) fluctuations, whether seasonal or in response to adverse macro-economic developments, in the demand for advertising; (xvii) the Company’s ability to compete and develop our business in the future; (xviii) the impact of increased national or international restrictions on the transfer or use of telecommunications technology; and (xix) the impact of the outbreak of COVID-19 on the global economy and specifically on the economies of the countries in which we operate, as well as on our operations and financial performance. Many of these factors are macroeconomic and regulatory in nature and therefore beyond the control of the Company’s management. Should one or more of these risks or uncertainties materialize, or underlying assumptions prove incorrect, actual results may vary materially from those described herein as anticipated, believed, estimated, expected, intended, planned or projected. The Company does not intend and does not assume any obligation to update the forward-looking statements contained in this document. These forward-looking statements are based upon a number of assumptions and other important factors that could cause our actual results, performance or achievements to differ materially from our future results, performance or achievements expressed or implied by such forward-looking statements. Readers are encouraged to consult the Company’s Annual Report on Form 20-F and the periodic filings made on Form 6-K, which are periodically filed with or furnished to the United States Securities and Exchange Commission, as well as the presentations periodically filed before the Argentine Securities and Exchange Commission (Comisión Nacional de Valores) and the Buenos Aires Stock Exchange (Bolsas y Mercados Argentinos), for further information concerning risks and uncertainties faced by the Company.
(Financial tables follow)
*******
9
TELECOM ARGENTINA S.A.
Consolidated Information
Nine month period and third quarter - Fiscal Year 2021
(In million of Argentine pesos)
| 1- | Consolidated Balance Sheet | |||||||
| (Restated by inflation, comparative figures in constant currency as of September 2021) | ||||||||
| 09/30/21 | 12/31/20 | Δ$ | Δ% | |||||
| Cash and cash equivalents | 17,071 | 25,374 | (8,303) | -32.7% | ||||
| Financial Investments | 8,220 | 8,962 | (742) | -8.3% | ||||
| Trade receivables | 19,941 | 25,962 | (6,021) | -23.2% | ||||
| Other Receivables | 6,250 | 7,552 | (1,302) | -17.2% | ||||
| Inventories | 3,349 | 5,098 | (1,749) | -34.3% | ||||
| Total current assets | 54,831 | 72,948 | (18,117) | -24.8% | ||||
| Financial Investments | - | 172 | (172) | -100.0% | ||||
| Trade receivables | 84 | 81 | 3 | 3.7% | ||||
| Goodwill | 344,644 | 345,008 | (364) | -0.1% | ||||
| Property, plant and equipment ('PP&E') | 409,778 | 439,448 | (29,670) | -6.8% | ||||
| Intangible assets | 133,760 | 142,472 | (8,712) | -6.1% | ||||
| Right-of-use assets | 29,168 | 24,341 | 4,827 | 19.8% | ||||
| Other Receivables | 6,253 | 5,530 | 723 | 13.1% | ||||
| Total non-current assets | 923,687 | 957,052 | (33,365) | -3.5% | ||||
| TOTAL ASSETS | 978,518 | 1,030,000 | (51,482) | -5.0% | ||||
| Trade payables | 43,946 | 53,904 | (9,958) | -18.5% | ||||
| Financial debt | 66,696 | 56,978 | 9,718 | 17.1% | ||||
| Salaries and social security payables | 16,568 | 19,634 | (3,066) | -15.6% | ||||
| Taxes payables | 13,470 | 5,121 | 8,349 | 163.0% | ||||
| Dividend Payable | 324 | - | 324 | - | ||||
| Lease liabilities | 5,226 | 4,569 | 657 | 14.4% | ||||
| Other liabilities | 2,830 | 2,824 | 6 | 0.2% | ||||
| Provisions | 1,907 | 2,214 | (307) | -13.9% | ||||
| Total current liabilities | 150,967 | 145,244 | 5,723 | 3.9% | ||||
| Trade payables | 1,313 | 3,353 | (2,040) | -60.8% | ||||
| Financial debt | 182,011 | 217,213 | (35,202) | -16.2% | ||||
| Salaries and social security payables | 1,399 | 1,151 | 248 | 21.5% | ||||
| Deferred income tax liabilities | 127,494 | 109,120 | 18,374 | 16.8% | ||||
| Taxes payables | - | 7 | (7) | -100.0% | ||||
| Lease liabilities | 12,162 | 9,540 | 2,622 | 27.5% | ||||
| Other liabilities | 1,559 | 1,584 | (25) | -1.6% | ||||
| Provisions | 9,034 | 10,220 | (1,186) | -11.6% | ||||
| Total non-current liabilities | 334,972 | 352,188 | (17,216) | -4.9% | ||||
| TOTAL LIABILITIES | 485,939 | 497,432 | (11,493) | -2.3% | ||||
| Equity attributable to Controlling Company | 484,846 | 523,804 | (38,958) | -7.4% | ||||
| Non-controlling interest | 7,733 | 8,764 | (1,031) | -11.8% | ||||
| TOTAL EQUITY | 492,579 | 532,568 | (39,989) | -7.5% | ||||
| TOTAL LIABILITIES AND EQUITY | 978,518 | 1,030,000 | (51,482) | -5.0% | ||||
| 2- | Consolidated Loans | |||||||
| (Monetary items) | ||||||||
| 09/30/21 | 12/31/20 | Δ$ | Δ% | |||||
| Bank overdrafts - principal | 13,733 | 5,414 | 8,319 | 153.7% | ||||
| Bank and other financial entities loans - principal | 32,726 | 10,434 | 22,292 | - | ||||
| Notes - principal | 1,800 | 18,885 | (17,085) | -90.5% | ||||
| NDF | 185 | 707 | (522) | -73.8% | ||||
| Loans for purchase of equipment | 3,436 | 3,364 | 72 | 2.1% | ||||
| Accrued interest and related expenses | 14,816 | 18,174 | (3,358) | -18.5% | ||||
| Total Current Loans | 66,696 | 56,978 | 9,718 | 17.1% | ||||
| Notes - principal | 91,395 | 77,427 | 13,968 | 18.0% | ||||
| Bank and other financial entities loans - principal | 62,172 | 100,589 | (38,417) | -38.2% | ||||
| NDF | - | 14 | (14) | -100.0% | ||||
| Loans for purchase of equipment | 4,318 | 5,697 | (1,379) | -24.2% | ||||
| Accrued interest and related expenses | 24,126 | 33,486 | (9,360) | -28.0% | ||||
| Total Non Current Loans | 182,011 | 217,213 | (35,202) | -16.2% | ||||
| Total Loans | 248,707 | 274,191 | (25,484) | -9.3% | ||||
| Cash and cash equivalents, and Financial Investments | 25,291 | 34,508 | (9,217) | -26.7% | ||||
| Net Financial Debt | (223,416) | (239,683) | 16,267 | -6.8% | ||||
10
TELECOM ARGENTINA S.A.
Consolidated Information
Nine month period and third quarter - Fiscal Year 2021
(In million of Argentine pesos)
| 3- Segment Information | ||||||||
| (Segment information for periods ended as of September 30 of 2021 and 2020 as analyzed by the CEO, who receive periodically the financial information of Telecom and its subsidiaries (in historical values)) | ||||||||
| As of September 30, 2021 | Services rendered in Argentina | Services rendered in Argentina - Inflation restatement | Services rendered in Argentina restated for inflation | Other abroad segments | Other abroad segments - restatement for inflation | Other abroad segments restated for inflation | Eliminations | Total | |
| Revenues | 241,078 | 31,593 | 272,671 | 17,859 | 3,849 | 21,708 | (1,396) | 292,983 | |
| Operating costs (without depreciation, | |||||||||
| amortization, and impairment of fixed | (161,910) | (23,656) | (185,566) | (10,514) | (2,901) | (13,415) | 1,396 | (197,585) | |
| assets) | |||||||||
| Operating income before D&A | 79,168 | 7,937 | 87,105 | 7,345 | 948 | 8,293 | - | 95,398 | |
| Depreciation, amortization and impairment of fixed assets | (32,832) | (55,929) | (88,761) | (4,605) | (847) | (5,452) | - | (94,213) | |
| Operating income | 46,336 | (47,992) | (1,656) | 2,740 | 101 | 2,841 | - | 1,185 | |
| Earnings from associates | 210 | ||||||||
| Debt financial expenses | 21,219 | ||||||||
| Other financial results, net | 9,371 | ||||||||
| Net income before income tax expenses | 31,985 | ||||||||
| Income tax expense | (30,960) | ||||||||
| Net Income | 1,025 | ||||||||
| Attributable to: | |||||||||
| Controlling Company | 358 | ||||||||
| Non-controlling interest | 667 |
| As of September 30, 2020 | Services rendered in Argentina | Services rendered in Argentina - Inflation restatement | Services rendered in Argentina restated for inflation | Other abroad segments | Other abroad segments - restatement for inflation | Other abroad segments restated for inflation | Eliminations | Total | |
| Revenues | 177,666 | 119,339 | 297,005 | 13,004 | 8,766 | 21,770 | (1,299) | 317,476 | |
| Operating costs (without depreciation, | |||||||||
| amortization, and impairment of fixed | (113,782) | (77,704) | (191,486) | (8,225) | (5,542) | (13,767) | 1,299 | (203,954) | |
| assets) | |||||||||
| Operating income before D&A | 63,884 | 41,635 | 105,519 | 4,779 | 3,224 | 8,003 | - | 113,522 | |
| Depreciation, amortization and impairment of fixed assets | (22,958) | (55,642) | (78,600) | (3,048) | (2,306) | (5,354) | - | (83,954) | |
| Operating income | 40,926 | (14,007) | 26,919 | 1,731 | 918 | 2,649 | - | 29,568 | |
| Earnings from associates | 567 | ||||||||
| Debt financial expenses | (31,514) | ||||||||
| Other financial results, net | 11,336 | ||||||||
| Net income before income tax expenses | 9,957 | ||||||||
| Income tax expense | (11,861) | ||||||||
| Net Loss | (1,904) | ||||||||
| Attributable to: | |||||||||
| Controlling Company | (2,508) | ||||||||
| Non-controlling interest | 604 |
11

TELECOM ARGENTINA S.A.
Consolidated Information
Nine month period and third quarter - Fiscal Year 2021
(In million of Argentine pesos)
4- Consolidated Income Statements - restated by inflation (constant figures)
(Allows the understanding of the variations of the Income Statement in real terms)
| 09/30/21 | 09/30/20 | Δ$ | Δ% | ||||
| Revenues | 292,983 | 317,476 | (24,493) | -7.7% | |||
| Consolidated Operating Costs | (291,798) | (287,908) | (3,890) | 1.4% | |||
| Operating income | 1,185 | 29,568 | (28,383) | -96.0% | |||
| Net Financial results and earnings from associates | 30,800 | (19,611) | 50,411 | - | |||
| Net income before income tax expense | 31,985 | 9,957 | 22,028 | - | |||
| Income tax expense | (30,960) | (11,861) | (19,099) | 161.0% | |||
| Net Income (loss) | 1,025 | (1,904) | 2,929 | -153.8% | |||
| Attributable to: | |||||||
| Controlling Company | 358 | (2,508) | 2,866 | -114.3% | |||
| Non-controlling interest | 667 | 604 | 63 | 10.4% | |||
| Operating income before D&A | 95,398 | 113,522 | (18,124) | -16.0% | |||
| As % of Revenues | 32.6% | 35.8% | |||||
| 09/30/21 | 09/30/20 | Δ$ | Δ% | ||||
| Net Financial results | |||||||
| Debt financial expenses | |||||||
| Interests on financial debt | (10,891) | (15,953) | 5,062 | -31.7% | |||
| Foreign currency exhange losses on financial debt | 32,110 | (10,857) | 42,967 | - | |||
| Debt refinancing results | - | (4,704) | 4,704 | -100.0% | |||
| Total Debt financial expenses | 21,219 | (31,514) | 52,733 | -167.3% | |||
| Other financial results, net | |||||||
| Gains (losses) for operations with notes and bonds | (492) | 4,795 | (5,287) | -110.3% | |||
| Other foreign currency exhange gains (losses) | 5,240 | 4,318 | 922 | 21.4% | |||
| Other net interests and gains of investments | (1,187) | (997) | (190) | 19.1% | |||
| Taxes and bank expenses | (2,921) | (2,912) | (9) | 0.3% | |||
| Financial expenses on pension benefits | (247) | (252) | 5 | -2.0% | |||
| Financial discounts on assets, debts and other | (2,480) | (70) | (2,410) | - | |||
| RECPAM* | 11,458 | 6,454 | 5,004 | 77.5% | |||
| Total other financial results, net | 9,371 | 11,336 | (1,965) | -17.3% | |||
| Total Net Financial results | 30,590 | (20,178) | 50,768 | - | |||
* Inflation restatement gain / (loss)
5- Consolidated Income Statements - restated by inflation (constant figures)
Three Months Comparison
| 09/30/21 | 09/30/20 | Δ$ | Δ% | |
| Revenues | 96,254 | 102,190 | (5,936) | -5.8% |
| Consolidated Operating Costs | (100,867) | (96,407) | (4,460) | 4.6% |
| Operating (loss) income | (4,613) | 5,783 | (10,396) | -179.8% |
| Net Financial results and earnings from associates | 10,359 | (4,446) | 14,805 | - |
| Net income before income tax expense | 5,746 | 1,337 | 4,409 | - |
| Income tax expense | (2,894) | (6,459) | 3,565 | -55.2% |
| Net income (loss) | 2,852 | (5,122) | 7,974 | -155.7% |
| Attributable to: | ||||
| Controlling Company | 2,549 | (5,370) | 7,919 | -147.5% |
| Non-controlling interest | 303 | 248 | 55 | 22.2% |
| Operating income before D&A | 28,457 | 34,978 | (6,521) | -18.6% |
| As % of Revenues | 29.6% | 34.2% |
12

TELECOM ARGENTINA S.A.
Consolidated Information
Nine month period and third quarter - Fiscal Year 2021
(In million of Argentine pesos)
| 6- | Breakdown of consolidated revenues - restated by inflation (constant figures) |
| (Revenues as of 2020 restated to 2021 values include a variation coming from the restatement of approximately 67.2% vs. a restatement variation of 13.5% for revenues as of 2021) | |
| 09/30/21 | 09/30/20 | 9M21 IAS 29 vs. 9M20 IAS 29 | |||||||
| 9M21 IAS 29 | IAS 29 Adjustment |
9M20 IAS 29
| IAS 29 Adjustment | Δ $
| Δ %
| |||
| REVENUES FROM SERVICES | 272,173 | 32,403 | 300,436 | 179,641 | (28,263) | -9.4% | |||
| Mobile Services | 110,898 | 13,124 | 121,529 | 72,774 | -10,631 | -8.7% | |||
| Internet Services | 62,077 | 7,336 | 67,168 | 40,112 | (5,091) | -7.6% | |||
| Cable TV Services | 57,433 | 6,921 | 62,140 | 37,073 | (4,707) | -7.6% | |||
| Fixed Telephony and Data Services | 41,082 | 4,969 | 48,722 | 29,153 | (7,640) | -15.7% | |||
| Other service revenues | 683 | 53 | 877 | 529 | (194) | -22.1% | |||
| REVENUES FROM EQUIPMENT SALES | 20,810 | 2,442 | 17,040 | 10,255 | 3,770 | 22.1% | |||
| REVENUES | 292,983 | 34,845 | 317,476 | 189,896 | (24,493) | -7.7% | |||
| 7- | Breakdown of consolidated revenues - restated by inflation (constant figures) | |||||||
| Three Months Comparison | ||||||||
| 09/30/21 | 09/30/20 | 3Q21 IAS 29 vs. 3Q20 IAS 29 | |||||||
| 3Q21 IAS 29 | IAS 29 Adjustment | 3Q20 IAS 29 | IAS 29 Adjustment | Δ $ | Δ % | |||
| REVENUES FROM SERVICES | 89,578 | 2,742 | 95,819 | 34,732 | (6,241) | -6.5% | |||
| Mobile Services | 36,987 | 1,169 | 40,389 | 14,657 | -3,402 | -8.4% | |||
| Internet Services | 21,058 | 636 | 20,564 | 7,448 | 494 | 2.4% | |||
| Cable TV Services | 18,457 | 559 | 18,877 | 6,844 | (420) | -2.2% | |||
| Fixed Telephony and Data Services | 12,795 | 392 | 15,740 | 5,694 | (2,945) | -18.7% | |||
| Other service revenues | 281 | (14) | 249 | 89 | 32 | 12.9% | |||
| REVENUES FROM EQUIPMENT SALES | 6,676 | 221 | 6,371 | 2,301 | 305 | 4.8% | |||
| REVENUES | 96,254 | 2,963 | 102,190 | 37,033 | (5,936) | -5.8% | |||
13
TELECOM ARGENTINA S.A.
Consolidated Information
Nine month period and third quarter - Fiscal Year 2021
(In million of Argentine pesos)
8- Consolidated Income Statements - restated by inflation (constant figures)
(Allows the understanding of the variations of the Income Statement in real terms)
| 09/30/21 | 09/30/20 | 9M21 IAS 29 vs. 9M20 IAS 29 | |||||||||||||||||
| 9M21 IAS 29 | IAS 29 Adjustment | 9M20 IAS 29 | IAS 29 Adjustment | Δ $ | Δ % | ||||||||||||||
| Revenues | 292,983 | 34,845 | 317,476 | 127,581 | (24,493) | -7.7% | |||||||||||||
| Employee benefit expenses and severance payments | (60,347) | (7,020) | (58,958) | (23,712) | (1,389) | 2.4% | |||||||||||||
| Interconnection and transmission costs | (10,678) | (1,300) | (11,702) | (4,655) | 1,024 | -8.8% | |||||||||||||
| Fees for services, maintenance, materials and supplies | (33,448) | (4,823) | (33,312) | (13,846) | (136) | 0.4% | |||||||||||||
| Taxes and fees with the regulatory authority | (22,602) | (2,702) | (24,046) | (9,661) | 1,444 | -6.0% | |||||||||||||
| Commissions and advertising | (16,530) | (1,922) | (17,536) | (7,037) | 1,006 | -5.7% | |||||||||||||
| Cost of equipments and handsets | (14,752) | (3,031) | (11,033) | (4,852) | (3,719) | 33.7% | |||||||||||||
| Programming and content costs | (20,031) | (2,474) | (20,805) | (8,415) | 774 | -3.7% | |||||||||||||
| Bad debt expenses | (5,362) | (589) | (12,019) | (4,844) | 6,657 | -55.4% | |||||||||||||
| Other operating income and expenses | (13,835) | (2,099) | (14,543) | (5,701) | 708 | -4.9% | |||||||||||||
| Subtotal Operating costs before D&A | (197,585) | (25,960) | (203,954) | (82,722) | 6,369 | -3.1% | |||||||||||||
| Operating income before D&A | 95,398 | 8,885 | 113,522 | 44,859 | (18,124) | -16.0% | |||||||||||||
| Depreciation, amortization ('D&A') and impairment of fixed assets | (94,213) | (56,776) | (83,954) | (57,948) | (10,259) | 12.2% | |||||||||||||
| Operating income | 1,185 | (47,891) | 29,568 | (13,089) | (28,383) | -96.0% | |||||||||||||
| Earnings from associates | 210 | 5 | 567 | 233 | (357) | -63.0% | |||||||||||||
| Net financial results | 30,590 | 82,163 | (20,178) | 27,872 | 50,768 | - | |||||||||||||
| Net income before income tax expense | 31,985 | 34,277 | 9,957 | 15,016 | 22,028 | - | |||||||||||||
| Income tax expense | (30,960) | (30,605) | (11,861) | (5,236) | (19,099) | 161.0% | |||||||||||||
| Net income (loss) | 1,025 | 3,672 | (1,904) | 9,780 | 2,929 | -153.8% | |||||||||||||
| Attributable to: | |||||||||||||||||||
| Controlling Company | 358 | 3,798 | (2,508) | 9,578 | 2,866 | -114.3% | |||||||||||||
| Non-controlling interest | 667 | (126) | 604 | 202 | 63 | 10.4% | |||||||||||||
9- Consolidated Income Statements - restated by inflation (constant figures)
Three Months Comparison
| 09/30/21 | 09/30/20 | 3Q21 IAS 29 vs. 3Q20 IAS 29 | |||||||||||||||||
| 3Q21 IAS 29 | IAS 29 Adjustment | 3Q20 IAS 29 | IAS 29 Adjustment | Δ $ | Δ % | ||||||||||||||
| Revenues | 96,254 | 2,963 | 102,190 | 37,033 | (5,936) | -5.8% | |||||||||||||
| Employee benefit expenses and severance payments | (21,876) | (780) | (18,876) | (6,842) | (3,000) | 15.9% | |||||||||||||
| Interconnection and transmission costs | (3,415) | (106) | (4,149) | (1,498) | 734 | -17.7% | |||||||||||||
| Fees for services, maintenance, materials and supplies | (11,040) | (490) | (10,760) | (4,025) | (280) | 2.6% | |||||||||||||
| Taxes and fees with the regulatory authority | (7,371) | (228) | (7,758) | (2,808) | 387 | -5.0% | |||||||||||||
| Commissions and advertising | (5,547) | (170) | (6,027) | (2,186) | 480 | -8.0% | |||||||||||||
| Cost of equipments and handsets | (4,675) | (359) | (3,813) | (1,554) | (862) | 22.6% | |||||||||||||
| Programming and content costs | (6,318) | (197) | (6,047) | (2,189) | (271) | 4.5% | |||||||||||||
| Bad debt expenses | (1,960) | (51) | (3,223) | (1,157) | 1,263 | -39.2% | |||||||||||||
| Other operating income and expenses | (5,595) | (528) | (6,559) | (2,327) | 964 | -14.7% | |||||||||||||
| Subtotal Operating costs before D&A | (67,797) | (2,909) | (67,212) | (24,585) | (585) | 0.9% | |||||||||||||
| Operating income before D&A | 28,457 | 54 | 34,978 | 12,448 | (6,521) | -18.6% | |||||||||||||
| Depreciation, amortization ('D&A') and impairment of fixed assets | (33,070) | (19,221) | (29,195) | (19,957) | (3,875) | 13.3% | |||||||||||||
| Operating (loss) income | (4,613) | (19,167) | 5,783 | (7,509) | (10,396) | -179.8% | |||||||||||||
| Earnings from associates | 84 | 29 | 213 | 92 | (129) | -60.6% | |||||||||||||
| Net financial results | 10,275 | 23,831 | (4,659) | 12,613 | 14,934 | - | |||||||||||||
| Net income before income tax expense | 5,746 | 4,693 | 1,337 | 5,196 | 4,409 | - | |||||||||||||
| Income tax expense | (2,894) | 1,677 | (6,459) | (2,352) | 3,565 | -55.2% | |||||||||||||
| Net income (loss) | 2,852 | 6,370 | (5,122) | 2,844 | 7,974 | -155.7% | |||||||||||||
| Attributable to: | |||||||||||||||||||
| Controlling Company | 2,549 | 6,373 | (5,370) | 2,766 | 7,919 | -147.5% | |||||||||||||
| Non-controlling interest | 303 | (3) | 248 | 78 | 55 | 22.2% | |||||||||||||
14
SIGNATURES
Pursuant to the requirements of the Securities Exchange Act of 1934, the registrant has duly caused this report to be signed on its behalf by the undersigned, thereunto duly authorized.
| Telecom Argentina S.A. | |||
| Date: November 9, 2021 | By: | /s/ Fernando J. Balmaceda | |
| Name: | Fernando J. Balmaceda | ||
| Title: | Responsible for Market Relations | ||