
July 31, 2013 Third Quarter 2013 Earnings Conference Call July 31, 2013
July 31, 2013 2 This presentation contains certain forward-looking statements that management believes to be reasonable as of today’s date only. Actual results may differ significantly because of risks and uncertainties that are difficult to predict and many of which are beyond management’s control. You should read AmeriGas’ Annual Report on Form 10-K for a more extensive list of factors that could affect results. Among them are adverse weather conditions, cost volatility and availability of propane, increased customer conservation measures, the impact of pending and future legal proceedings, political, regulatory and economic conditions, the timing and success of our commercial initiatives and investments to grow our business, and our ability to successfully integrate acquired businesses and achieve anticipated synergies. AmeriGas undertakes no obligation to release revisions to its forward- looking statements to reflect events or circumstances occurring after today. About This Presentation

July 31, 2013 Jerry Sheridan CEO of AmeriGas
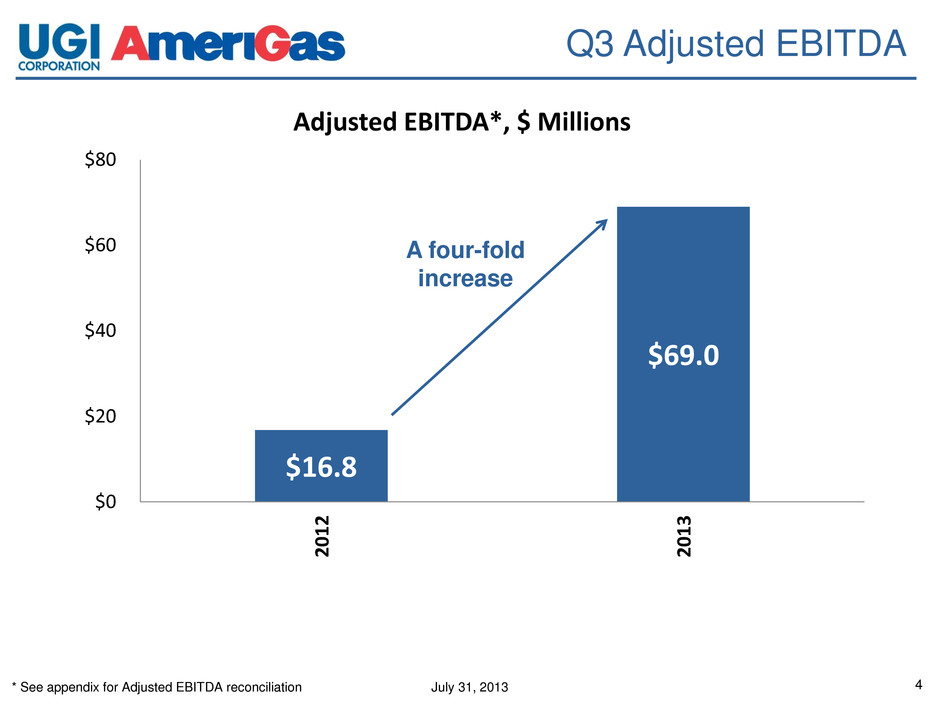
July 31, 2013 4 Q3 Adjusted EBITDA $16.8 $69.0 $0 $20 $40 $60 $80 2 0 1 2 2 0 1 3 Adjusted EBITDA*, $ Millions A four-fold increase * See appendix for Adjusted EBITDA reconciliation
July 31, 2013 5 Operational Update Operations • Volume increase up over 10% versus last year’s quarter • Significant decrease in operating expenses: • $18.5 MM decrease from Q3 of fiscal 2012 ($13.3 MM decrease excluding the impact of $5.2 MM in lower transition expenses) Growth Initiatives • AmeriGas Cylinder Exchange (ACE): Volume growth of 9% y/y despite unfavorable weather • National Accounts: Volume increased 32% y/y
July 31, 2013 6 Guidance & Heritage Update • FY13 Guidance remains $620MM - $635MM • Completed final stages of Heritage integration: Consolidation of over 200 stores • Merged operating partnerships into one legal entity, streamlining operations • ETP sold 7.5MM APU units on July 12
July 31, 2013 Q&A
July 31, 2013 Appendix
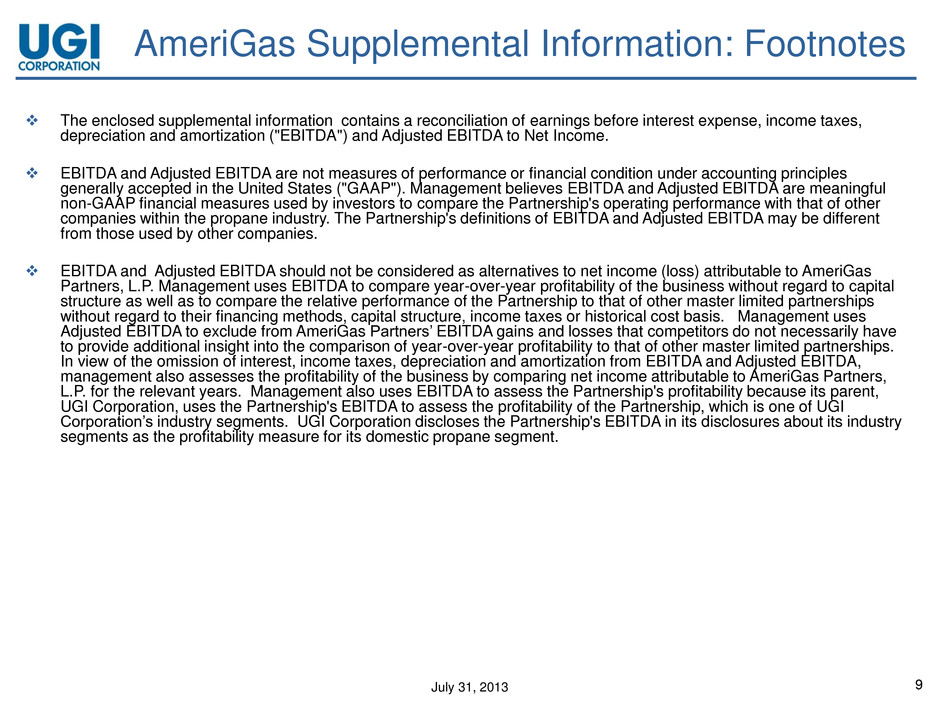
July 31, 2013 9 AmeriGas Supplemental Information: Footnotes The enclosed supplemental information contains a reconciliation of earnings before interest expense, income taxes, depreciation and amortization ("EBITDA") and Adjusted EBITDA to Net Income. EBITDA and Adjusted EBITDA are not measures of performance or financial condition under accounting principles generally accepted in the United States ("GAAP"). Management believes EBITDA and Adjusted EBITDA are meaningful non-GAAP financial measures used by investors to compare the Partnership's operating performance with that of other companies within the propane industry. The Partnership's definitions of EBITDA and Adjusted EBITDA may be different from those used by other companies. EBITDA and Adjusted EBITDA should not be considered as alternatives to net income (loss) attributable to AmeriGas Partners, L.P. Management uses EBITDA to compare year-over-year profitability of the business without regard to capital structure as well as to compare the relative performance of the Partnership to that of other master limited partnerships without regard to their financing methods, capital structure, income taxes or historical cost basis. Management uses Adjusted EBITDA to exclude from AmeriGas Partners’ EBITDA gains and losses that competitors do not necessarily have to provide additional insight into the comparison of year-over-year profitability to that of other master limited partnerships. In view of the omission of interest, income taxes, depreciation and amortization from EBITDA and Adjusted EBITDA, management also assesses the profitability of the business by comparing net income attributable to AmeriGas Partners, L.P. for the relevant years. Management also uses EBITDA to assess the Partnership's profitability because its parent, UGI Corporation, uses the Partnership's EBITDA to assess the profitability of the Partnership, which is one of UGI Corporation’s industry segments. UGI Corporation discloses the Partnership's EBITDA in its disclosures about its industry segments as the profitability measure for its domestic propane segment.
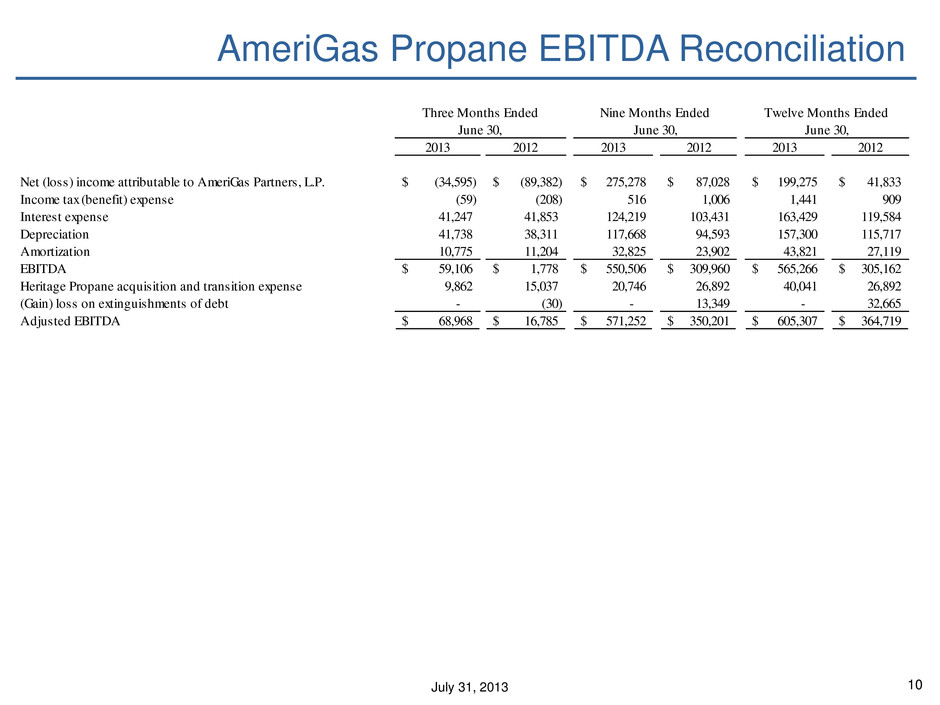
July 31, 2013 10 AmeriGas Propane EBITDA Reconciliation 2013 2012 2013 2012 2013 2012 Net (loss) income attributable to AmeriGas Partners, L.P. (34,595)$ (89,382)$ 275,278$ 87,028$ 199,275$ 41,833$ Income tax (benefit) expense (59) (208) 516 1,006 1,441 909 Intere t expense 41,247 41,853 124,219 103,431 163,429 119,584 Depreciation 41,738 38,311 117,668 94,593 157,300 115,717 Amortization 10,775 11,204 32,825 23,902 43,821 27,119 EBITDA 59,106$ 1,778$ 550,506$ 309,960$ 565,266$ 305,162$ Heritage Propane acquisition and transition expense 9,862 15,037 20,746 26,892 40,041 26,892 (Gain) loss on extinguishments of debt - (30) - 13,349 - 32,665 Adjusted EBITDA (1) 68,968$ 16,785$ 571,252$ 350,201$ 605,307$ 364,719$ June 30, Twelve Months Ended June 30, Three Months Ended Nine Months Ended June 30,
July 31, 2013 Investor Relations: 610-337-1000 Simon Bowman (x3645) bowmans@ugicorp.com


