
Insight Enterprises, Inc. Fourth Quarter and Full Year 2020 Earnings Conference Call and Webcast Exhibit 99.2
Agenda Disclosures CEO Commentary Fourth Quarter and Full Year 2020 Consolidated Financials 2020 Full Year Highlights Commitment to Long-Term Priorities CFO Commentary Fourth Quarter and Full Year 2020 Financial Results by Region Business Strategy Impacts to Profitability Cashflow and Debt Covenants 2020 Business Highlights Closing Comments
Disclosures Safe harbor statement This presentation includes “forward-looking statements” within the meaning of the Private Securities Litigation Reform Act of 1995 related to Insight’s plans and expectations. Statements that are not historical facts, including those related to Coronavirus strain (“COVID-19”), our future responses to and the impact of COVID-19 on our Company, our expectations about future financial results, our expectations about future benefits relating to the PCM integration, future expected trends in the IT market and our opportunities for growth, are forward-looking statements. These forward-looking statements are subject to assumptions, risks and uncertainties which could cause actual results or future events to differ materially from such statements. The Company undertakes no obligation to update publicly or revise any of the forward-looking statements, except as otherwise required by law. More detailed information about risk factors is included in today’s press release and discussed in the Company’s most recently filed periodic reports and subsequent filings with the Securities and Exchange Commission. Non-GAAP measures This presentation will reference certain non-GAAP financial information as ‘Adjusted’. A reconciliation of non-GAAP financial measures presented in this document to our actual GAAP results is attached to the back of this presentation and included in the press release issued today, which you may find on the Investor Relations section of our website at investor.insight.com. Constant currency In some instances the Company refers to changes in net sales, gross profit and earnings from operations on a consolidated basis and in North America, EMEA and APAC excluding the effects of fluctuating foreign currency exchange rates. In computing these changes and percentages, the Company compares the current year amount as translated into U.S. dollars under the applicable accounting standards to the prior year amount in local currency translated into U.S. dollars utilizing the weighted average translation rate for the current period.
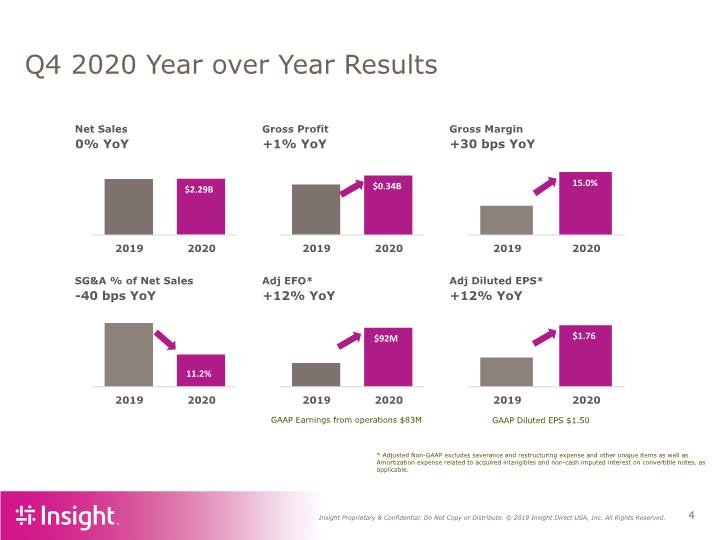
Q4 2020 Year over Year Results GAAP Earnings from operations $83M GAAP Diluted EPS $1.50 * Adjusted Non-GAAP excludes severance and restructuring expense and other unique items as well as Amortization expense related to acquired intangibles and non-cash imputed interest on convertible notes, as applicable.
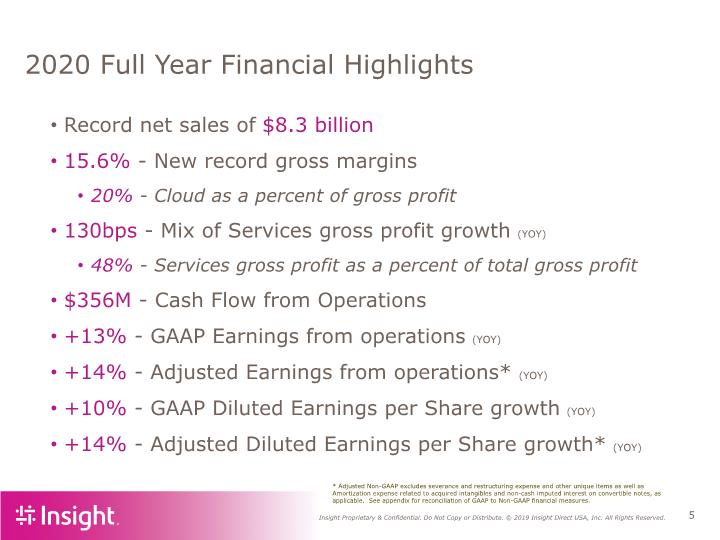
2020 Full Year Financial Highlights Record net sales of $8.3 billion 15.6% - New record gross margins 20% - Cloud as a percent of gross profit 130bps - Mix of Services gross profit growth (YOY) 48% - Services gross profit as a percent of total gross profit $356M - Cash Flow from Operations +13% - GAAP Earnings from operations (YOY) +14% - Adjusted Earnings from operations* (YOY) +10% - GAAP Diluted Earnings per Share growth (YOY) +14% - Adjusted Diluted Earnings per Share growth* (YOY) * Adjusted Non-GAAP excludes severance and restructuring expense and other unique items as well as Amortization expense related to acquired intangibles and non-cash imputed interest on convertible notes, as applicable. See appendix for reconciliation of GAAP to Non-GAAP financial measures.
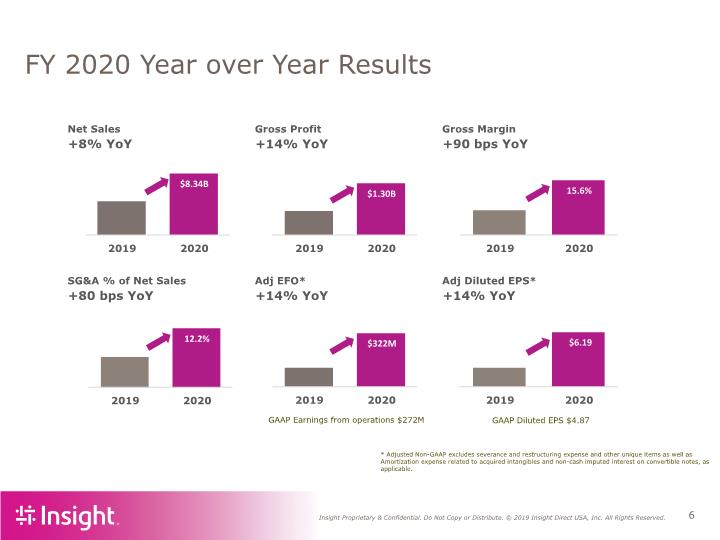
FY 2020 Year over Year Results GAAP Earnings from operations $272M GAAP Diluted EPS $4.87 * Adjusted Non-GAAP excludes severance and restructuring expense and other unique items as well as Amortization expense related to acquired intangibles and non-cash imputed interest on convertible notes, as applicable.
2020 Full Year Highlights Completed integration of PCM Retired 9 ERP systems Exited year with approximately $70 million in annualized run rate cost savings, ahead of schedule to meet 2-year target Response to COVID-19 was solutions focused Modernized online experience ensured strong client engagement Invested in sales force and technical talent Hardware bookings started to recover Recognized for our continued focus on culture and employee benefits and leadership development
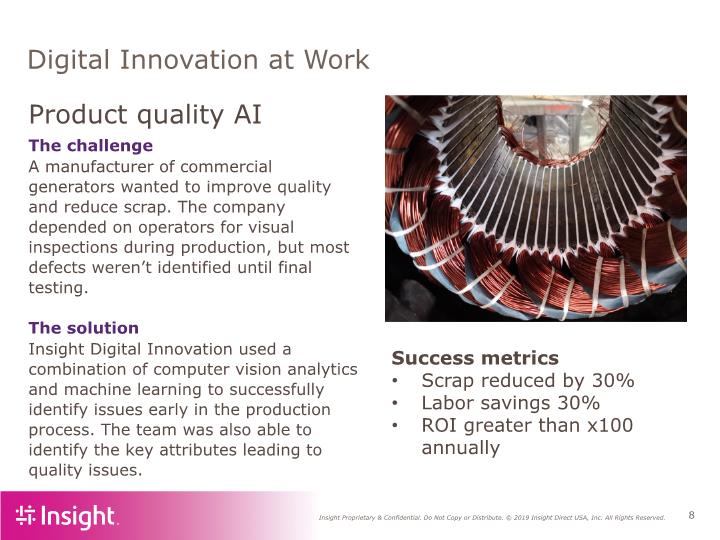
Digital Innovation at Work The challenge A manufacturer of commercial generators wanted to improve quality and reduce scrap. The company depended on operators for visual inspections during production, but most defects weren’t identified until final testing. The solution Insight Digital Innovation used a combination of computer vision analytics and machine learning to successfully identify issues early in the production process. The team was also able to identify the key attributes leading to quality issues. Success metrics Scrap reduced by 30% Labor savings 30% ROI greater than x100 annually Product quality AI
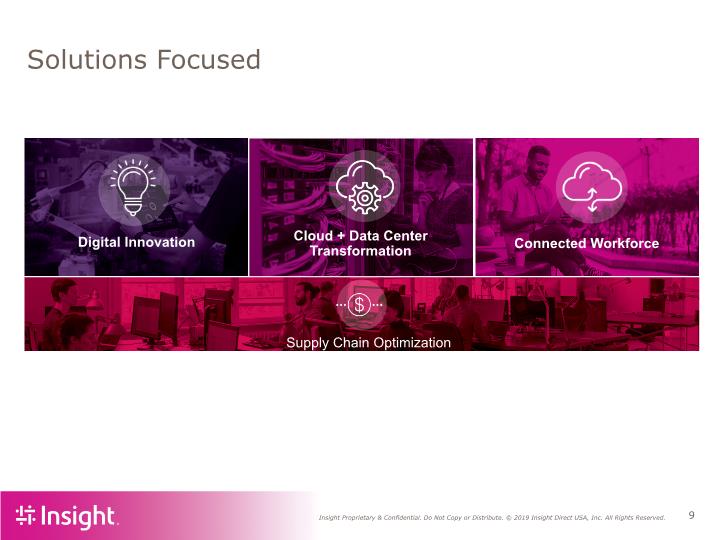
Solutions Focused
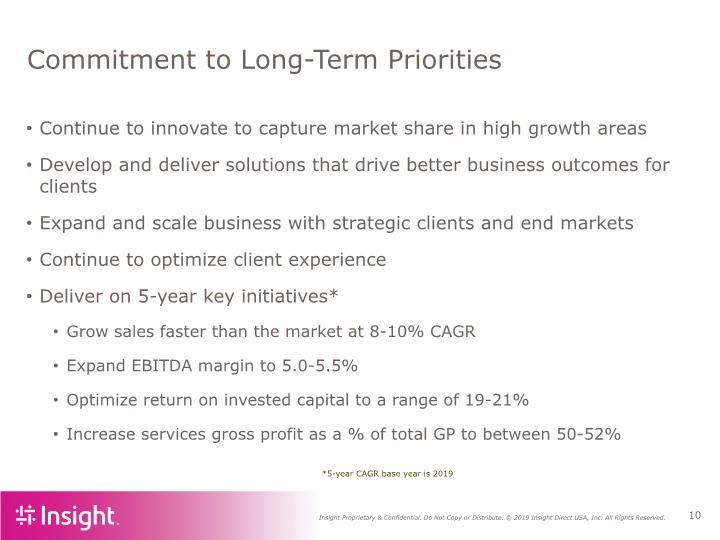
Commitment to Long-Term Priorities Continue to innovate to capture market share in high growth areas Develop and deliver solutions that drive better business outcomes for clients Expand and scale business with strategic clients and end markets Continue to optimize client experience Deliver on 5-year key initiatives* Grow sales faster than the market at 8-10% CAGR Expand EBITDA margin to 5.0-5.5% Optimize return on invested capital to a range of 19-21% Increase services gross profit as a % of total GP to between 50-52% *5-year CAGR base year is 2019
CFO Commentary Fourth Quarter and Full Year 2020 Financial Highlights by Region Business Strategy Impacts to Profitability Cashflow and Debt Covenants 2020 Business Highlights
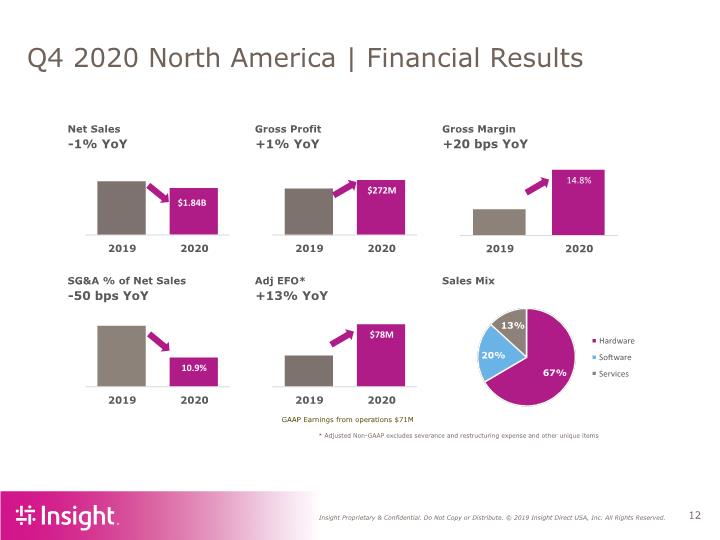
* Adjusted Non-GAAP excludes severance and restructuring expense and other unique items Q4 2020 North America | Financial Results GAAP Earnings from operations $71M
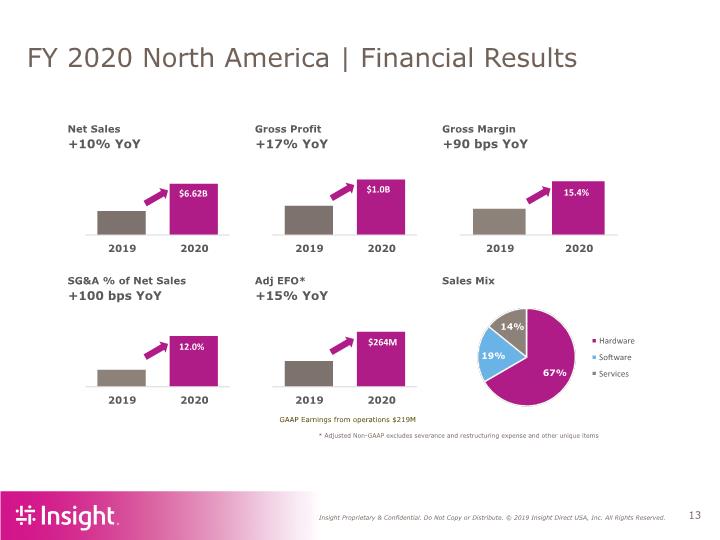
* Adjusted Non-GAAP excludes severance and restructuring expense and other unique items FY 2020 North America | Financial Results GAAP Earnings from operations $219M
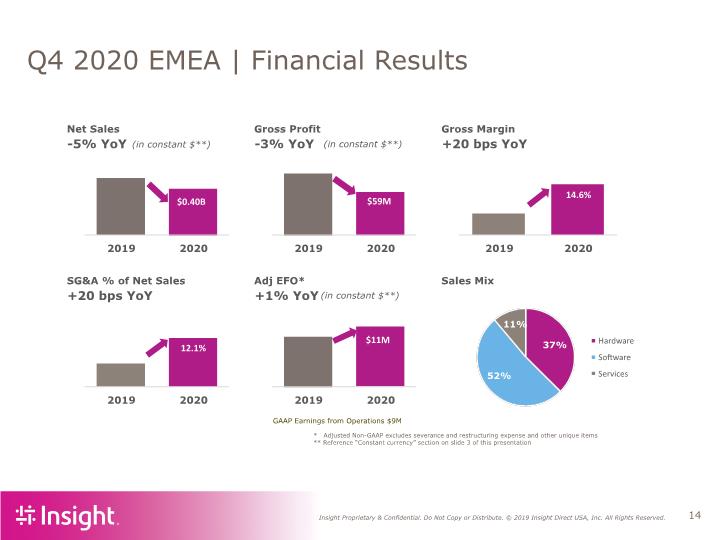
* Adjusted Non-GAAP excludes severance and restructuring expense and other unique items ** Reference “Constant currency” section on slide 3 of this presentation Q4 2020 EMEA | Financial Results (in constant $**) (in constant $**) GAAP Earnings from Operations $9M (in constant $**)
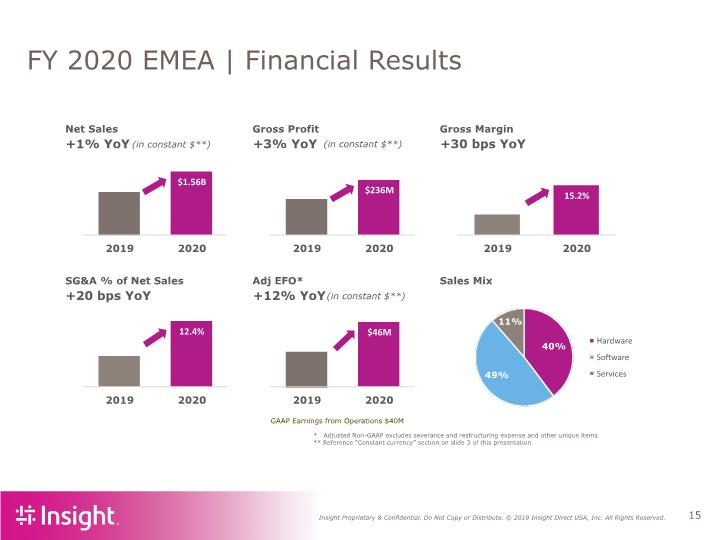
* Adjusted Non-GAAP excludes severance and restructuring expense and other unique items ** Reference “Constant currency” section on slide 3 of this presentation FY 2020 EMEA | Financial Results (in constant $**) (in constant $**) GAAP Earnings from Operations $40M (in constant $**)
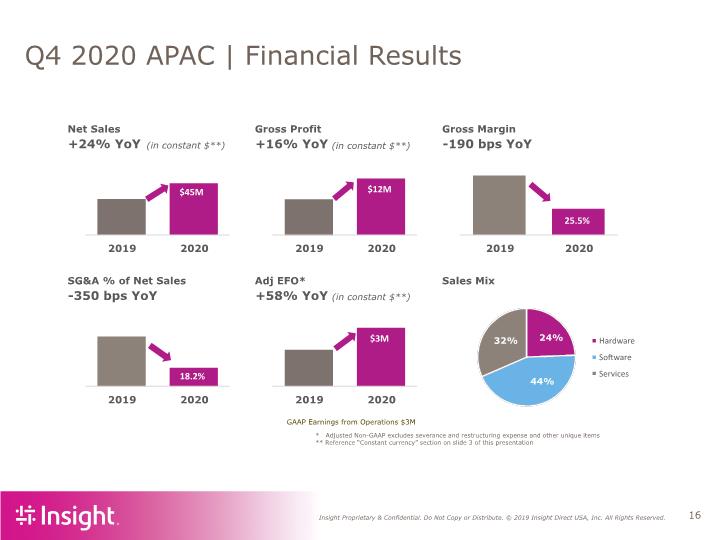
* Adjusted Non-GAAP excludes severance and restructuring expense and other unique items ** Reference “Constant currency” section on slide 3 of this presentation Q4 2020 APAC | Financial Results (in constant $**) (in constant $**) GAAP Earnings from Operations $3M (in constant $**)
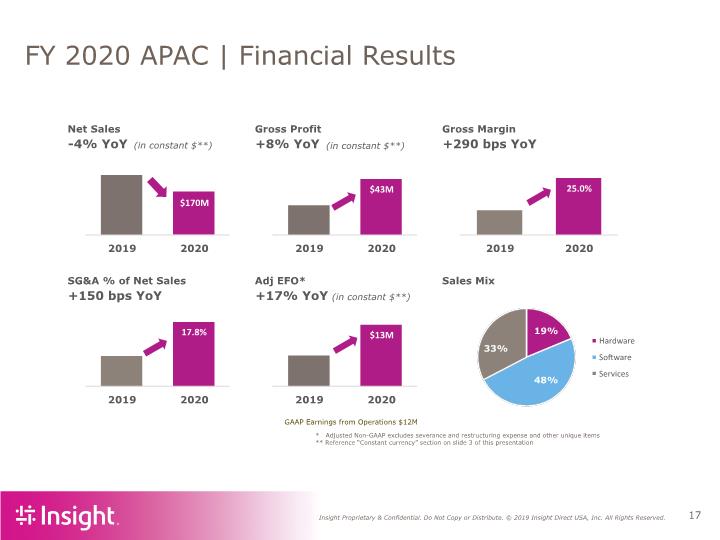
* Adjusted Non-GAAP excludes severance and restructuring expense and other unique items ** Reference “Constant currency” section on slide 3 of this presentation FY 2020 APAC | Financial Results (in constant $**) (in constant $**) GAAP Earnings from Operations $12M (in constant $**)
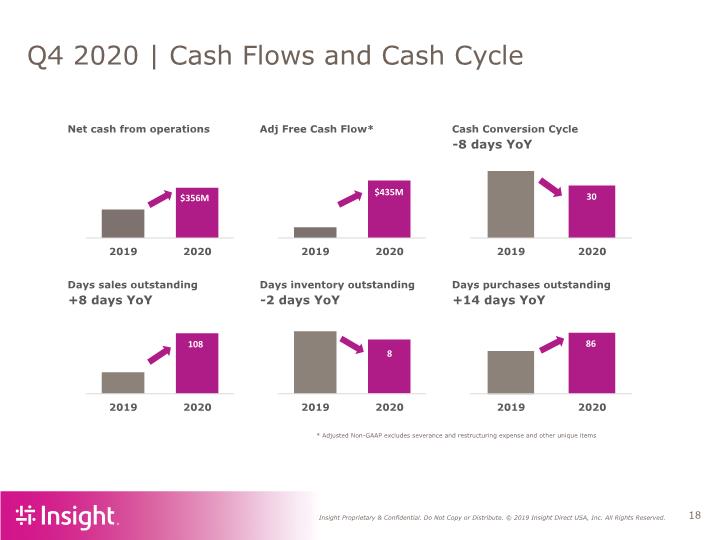
* Adjusted Non-GAAP excludes severance and restructuring expense and other unique items Q4 2020 | Cash Flows and Cash Cycle
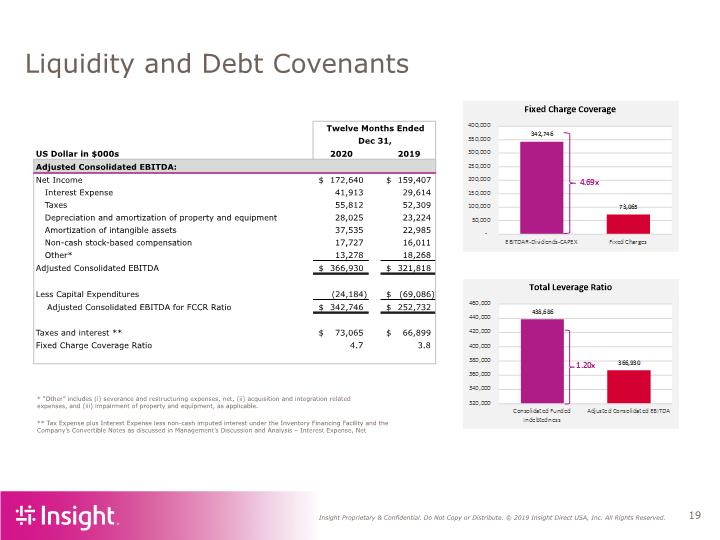
Liquidity and Debt Covenants ** Tax Expense plus Interest Expense less non-cash imputed interest under the Inventory Financing Facility and the Company’s Convertible Notes as discussed in Management’s Discussion and Analysis – Interest Expense, Net * “Other” includes (i) severance and restructuring expenses, net, (ii) acquisition and integration related expenses, and (iii) impairment of property and equipment, as applicable.
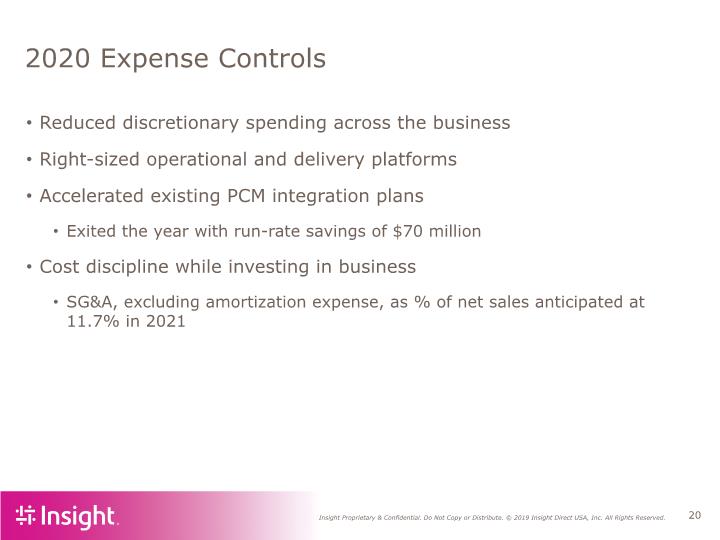
2020 Expense Controls Reduced discretionary spending across the business Right-sized operational and delivery platforms Accelerated existing PCM integration plans Exited the year with run-rate savings of $70 million Cost discipline while investing in business SG&A, excluding amortization expense, as % of net sales anticipated at 11.7% in 2021
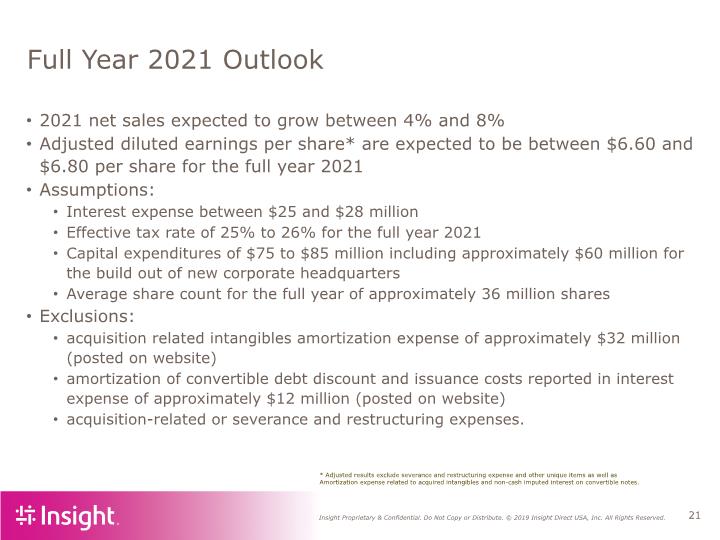
Full Year 2021 Outlook 2021 net sales expected to grow between 4% and 8% Adjusted diluted earnings per share* are expected to be between $6.60 and $6.80 per share for the full year 2021 Assumptions: Interest expense between $25 and $28 million Effective tax rate of 25% to 26% for the full year 2021 Capital expenditures of $75 to $85 million including approximately $60 million for the build out of new corporate headquarters Average share count for the full year of approximately 36 million shares Exclusions: acquisition related intangibles amortization expense of approximately $32 million (posted on website) amortization of convertible debt discount and issuance costs reported in interest expense of approximately $12 million (posted on website) acquisition-related or severance and restructuring expenses. * Adjusted results exclude severance and restructuring expense and other unique items as well as Amortization expense related to acquired intangibles and non-cash imputed interest on convertible notes.
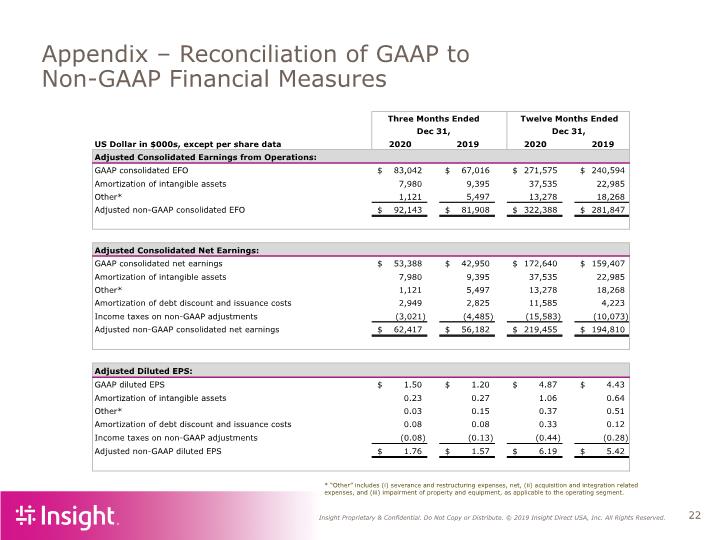
Appendix – Reconciliation of GAAP to Non-GAAP Financial Measures * “Other” includes (i) severance and restructuring expenses, net, (ii) acquisition and integration related expenses, and (iii) impairment of property and equipment, as applicable to the operating segment.
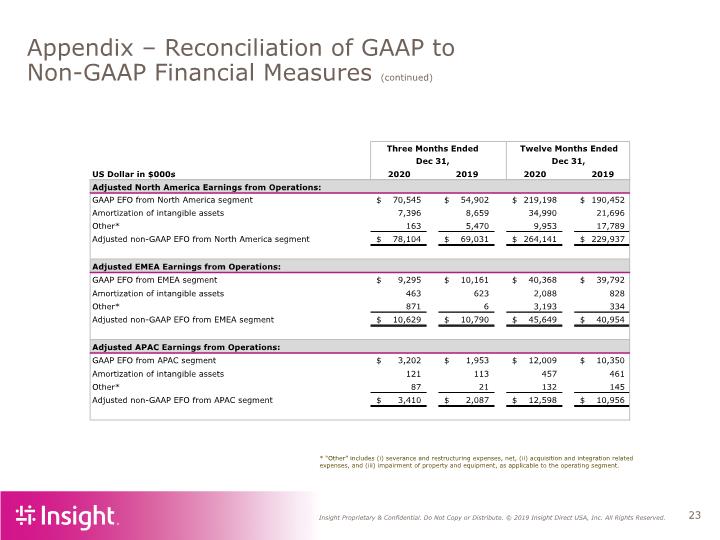
Appendix – Reconciliation of GAAP to Non-GAAP Financial Measures (continued) * “Other” includes (i) severance and restructuring expenses, net, (ii) acquisition and integration related expenses, and (iii) impairment of property and equipment, as applicable to the operating segment.
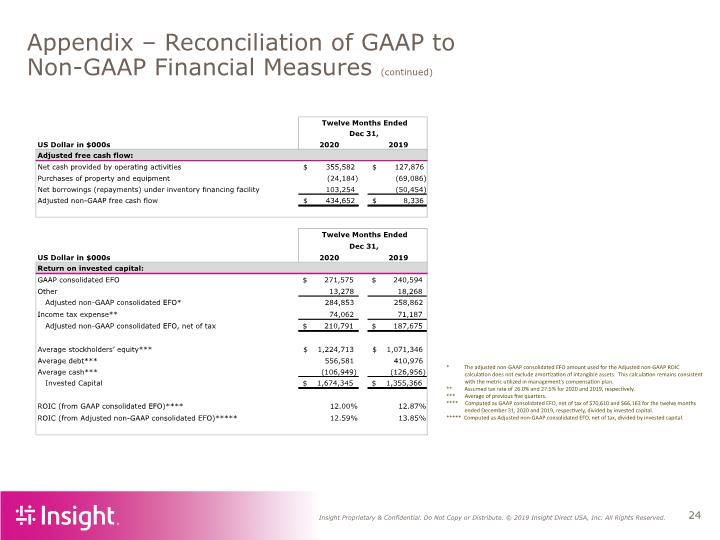
Appendix – Reconciliation of GAAP to Non-GAAP Financial Measures (continued) * The adjusted non-GAAP consolidated EFO amount used for the Adjusted non-GAAP ROIC calculation does not exclude amortization of intangible assets. This calculation remains consistent with the metric utilized in management’s compensation plan. ** Assumed tax rate of 26.0% and 27.5% for 2020 and 2019, respectively. *** Average of previous five quarters. **** Computed as GAAP consolidated EFO, net of tax of $70,610 and $66,163 for the twelve months ended December 31, 2020 and 2019, respectively, divided by invested capital. ***** Computed as Adjusted non-GAAP consolidated EFO, net of tax, divided by invested capital.


