
Insight Enterprises, Inc. Third Quarter 2021 Earnings Conference Call and Webcast Exhibit 99.2

Insight Enterprises, Inc. Third Quarter 2021 Earnings Conference Call and Webcast
Agenda Disclosures CEO Commentary Commitment to Long-Term Priorities Third Quarter 2021 Highlights Cloud Migration – Shift to Digital Headquarters Diverse Solutions Offerings Business and Leadership Recognitions CFO Commentary Third Quarter 2021 Financial Highlights by Region Cashflow and Debt Covenants 2021 Outlook Closing Comments
Disclosures Safe harbor statement This presentation includes “forward-looking statements” within the meaning of the Private Securities Litigation Reform Act of 1995 related to Insight’s plans and expectations. Statements that are not historical facts, including those related to coronavirus strain COVID-19 (“COVID-19”), our future responses to and the impact of COVID-19 on our Company, our expectations about future financial results, our expectations regarding current supply constraints, our expectations regarding backlog shipments, future expected trends in the IT market and our opportunities for growth, are forward-looking statements. These forward-looking statements are subject to assumptions, risks and uncertainties which could cause actual results or future events to differ materially from such statements. The Company undertakes no obligation to update publicly or revise any of the forward-looking statements, except as otherwise required by law. More detailed information about risk factors is included in today’s press release and discussed in the Company’s most recently filed periodic reports and subsequent filings with the Securities and Exchange Commission. Non-GAAP measures This presentation will reference certain non-GAAP financial information as ‘Adjusted’. A reconciliation of non-GAAP financial measures presented in this document to our actual GAAP results is attached to the back of this presentation and included in the press release issued today, which you may find on the Investor Relations section of our website at investor.insight.com. These non-GAAP measures are used by the Company and its management to evaluate financial performance against budgeted amounts, to calculate incentive compensation, to assist in forecasting future performance and to compare the Company’s results to those of the Company’s competitors. The Company believes that these non-GAAP financial measures are useful to investors because they allow for greater transparency, facilitate comparisons to prior periods and the Company’s competitors’ results and assist in forecasting performance for future periods. These non-GAAP financial measures are not prepared in accordance with GAAP and may be different from non-GAAP financial measures presented by other companies. Non-GAAP financial measures should not be considered as a substitute for, or superior to, measures of financial performance prepared in accordance with GAAP. Constant currency In some instances the Company refers to changes in net sales, gross profit and earnings from operations on a consolidated basis and in North America, EMEA and APAC excluding the effects of fluctuating foreign currency exchange rates. In computing these changes and percentages, the Company compares the current year amount as translated into U.S. dollars under the applicable accounting standards to the prior year amount in local currency translated into U.S. dollars utilizing the weighted average translation rate for the current period.
Commitment to Long-Term Priorities Continue to innovate to capture market share in high growth areas Develop and deliver solutions that drive better business outcomes for clients Expand and scale business with strategic clients and in end markets Continue to optimize client experience
Third Quarter 2021 Highlights and Expectations Top line growth driven by hardware net sales which were up 36% compared to prior year Gross margin 14.9% GAAP EFO up 35% from last year Adjusted EFO* up 30% from last year Adjusted return on invested capital* 14.4%, up from 11.9% last year Hardware booking trends strong throughout the quarter Elevated hardware backlog at the end of the quarter and pipeline for future sales at healthy levels Expect about 50% of backlog to ship out during Q4 Clients continued to leverage cloud solutions 21%** - Cloud as a percentage of total gross profit up more than 200 bps year over year * See Appendix for reconciliation of non-GAAP measures ** For the twelve-month period ended September 30, 2021
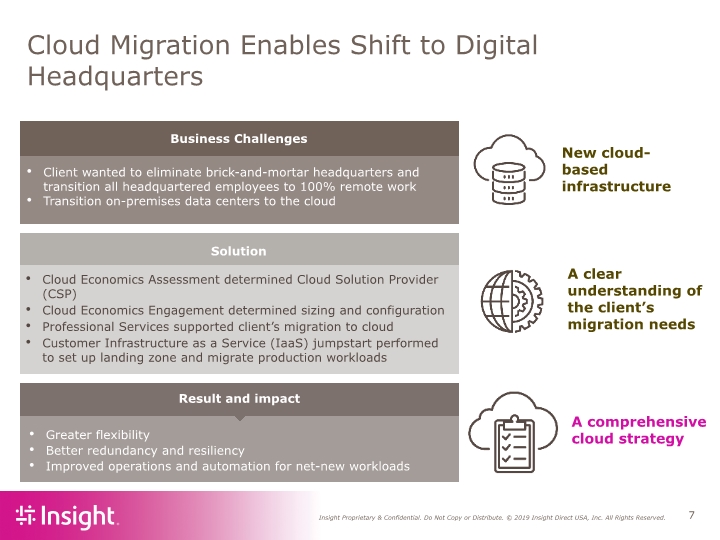
Cloud Migration Enables Shift to Digital Headquarters Client wanted to eliminate brick-and-mortar headquarters and transition all headquartered employees to 100% remote work Transition on-premises data centers to the cloud Greater flexibility Better redundancy and resiliency Improved operations and automation for net-new workloads Cloud Economics Assessment determined Cloud Solution Provider (CSP) Cloud Economics Engagement determined sizing and configuration Professional Services supported client’s migration to cloud Customer Infrastructure as a Service (IaaS) jumpstart performed to set up landing zone and migrate production workloads New cloud-based infrastructure A clear understanding of the client’s migration needs A comprehensive cloud strategy
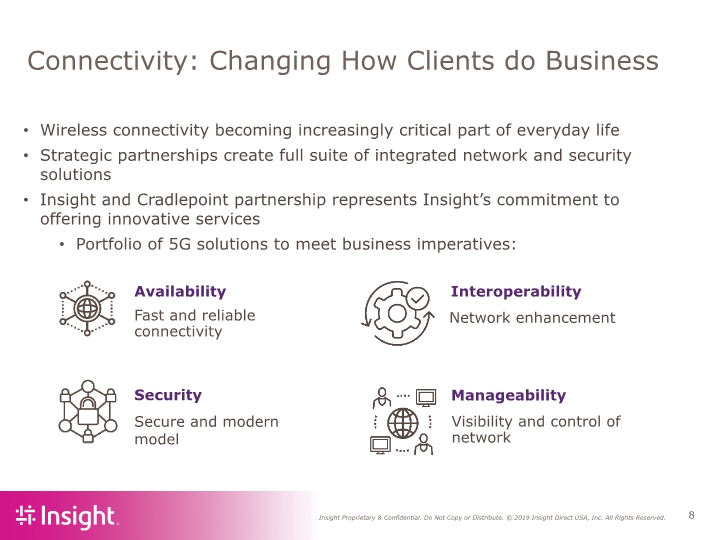
Connectivity: Changing How Clients do Business Wireless connectivity becoming increasingly critical part of everyday life Strategic partnerships create full suite of integrated network and security solutions Insight and Cradlepoint partnership represents Insight’s commitment to offering innovative services Portfolio of 5G solutions to meet business imperatives: Availability Fast and reliable connectivity Security Secure and modern model Manageability Visibility and control of network Interoperability Network enhancement
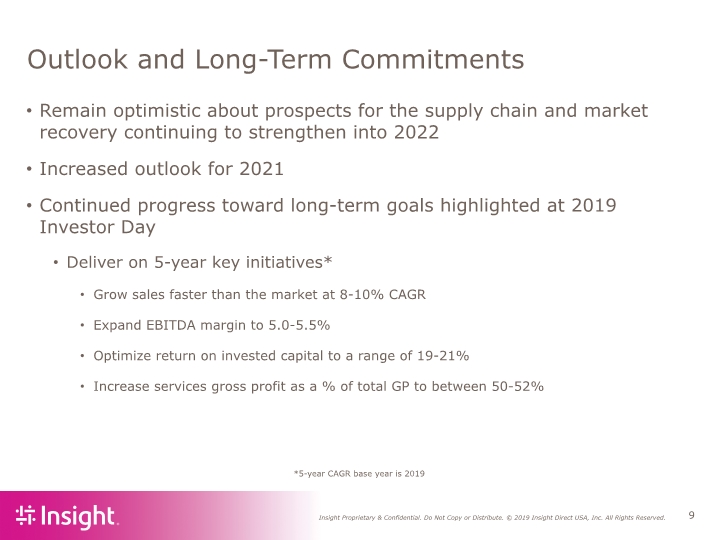
Outlook and Long-Term Commitments Remain optimistic about prospects for the supply chain and market recovery continuing to strengthen into 2022 Increased outlook for 2021 Continued progress toward long-term goals highlighted at 2019 Investor Day Deliver on 5-year key initiatives* Grow sales faster than the market at 8-10% CAGR Expand EBITDA margin to 5.0-5.5% Optimize return on invested capital to a range of 19-21% Increase services gross profit as a % of total GP to between 50-52% *5-year CAGR base year is 2019
CFO Commentary Third Quarter 2021 Financial Highlights by Region Cashflow and Debt Covenants 2021 Outlook
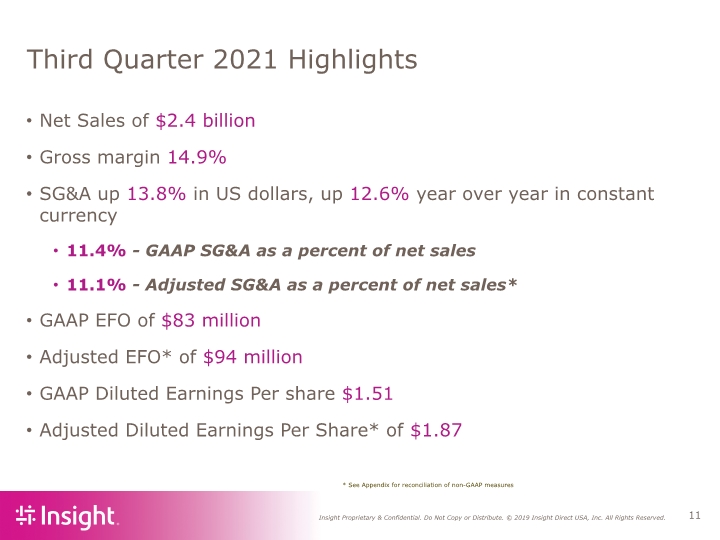
Third Quarter 2021 Highlights Net Sales of $2.4 billion Gross margin 14.9% SG&A up 13.8% in US dollars, up 12.6% year over year in constant currency 11.4% - GAAP SG&A as a percent of net sales 11.1% - Adjusted SG&A as a percent of net sales* GAAP EFO of $83 million Adjusted EFO* of $94 million GAAP Diluted Earnings Per share $1.51 Adjusted Diluted Earnings Per Share* of $1.87 * See Appendix for reconciliation of non-GAAP measures
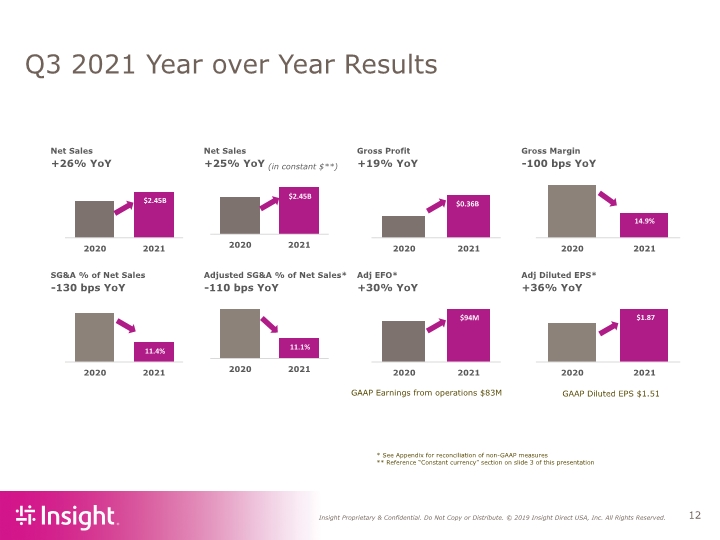
Net Sales Net Sales Gross Profit Gross Margin +26% YoY +25% YoY +19% YoY -100 bps YoY SG&A % of Net Sales Adjusted SG&A % of Net Sales* Adj EFO* Adj Diluted EPS* -130 bps YoY -110 bps YoY +30% YoY +36% YoY $2.45B 2020 2021 $0.36B 2020 2021 $94M 2020 2021 11.4% 2020 2021 14.9% 2020 2021 $1.87 2020 2021 $2.45B 2020 2021 11.1% 2020 2021 Q3 2021 Year over Year Results GAAP Earnings from operations $83M GAAP Diluted EPS $1.51 * See Appendix for reconciliation of non-GAAP measures ** Reference “Constant currency” section on slide 3 of this presentation (in constant $**)
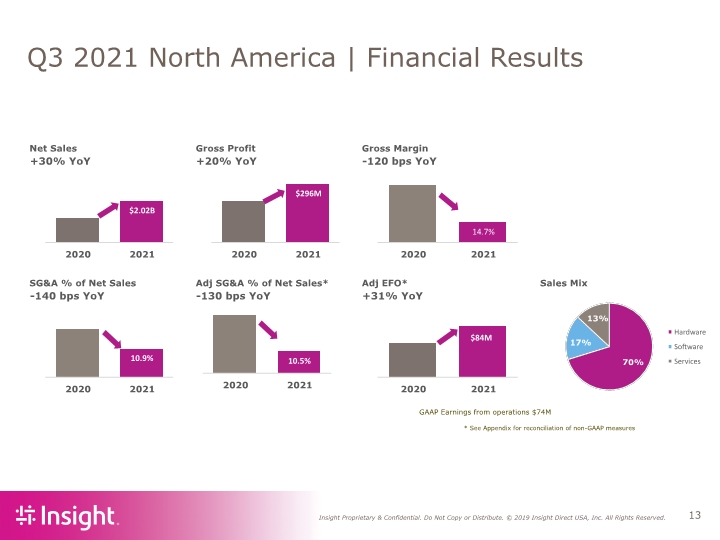
* See Appendix for reconciliation of non-GAAP measures Q3 2021 North America | Financial Results GAAP Earnings from operations $74M
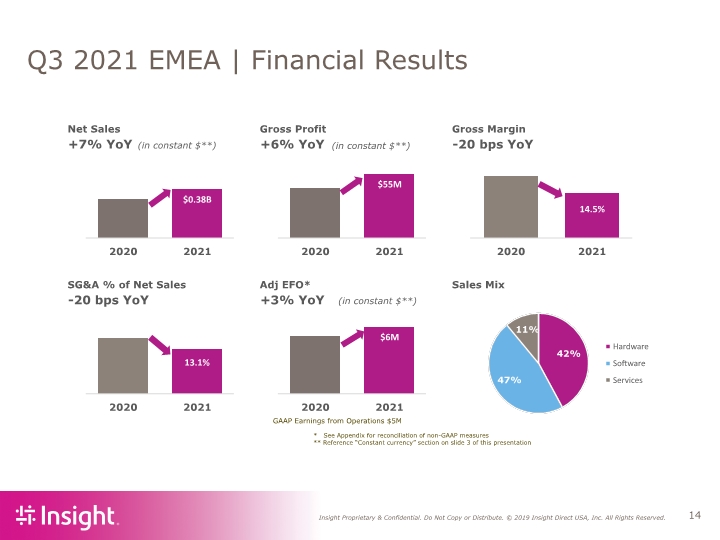
* See Appendix for reconciliation of non-GAAP measures ** Reference “Constant currency” section on slide 3 of this presentation Q3 2021 EMEA | Financial Results GAAP Earnings from Operations $5M (in constant $**) (in constant $**) (in constant $**)
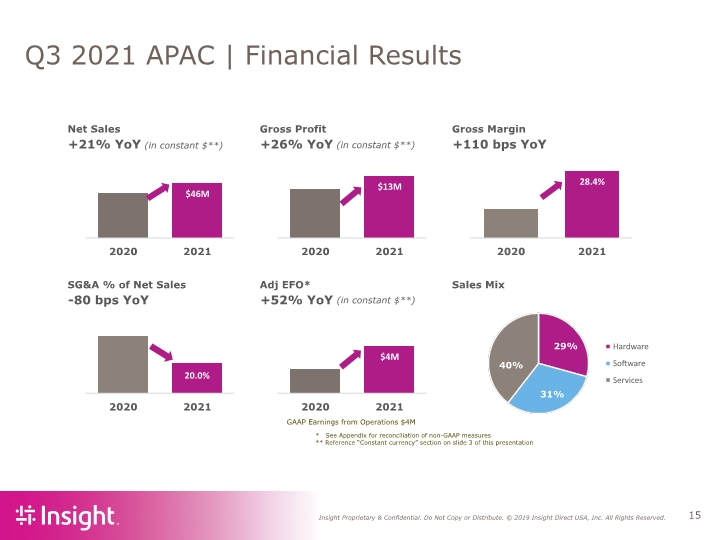
* See Appendix for reconciliation of non-GAAP measures ** Reference “Constant currency” section on slide 3 of this presentation Q3 2021 APAC | Financial Results (in constant $**) (in constant $**) GAAP Earnings from Operations $4M (in constant $**)
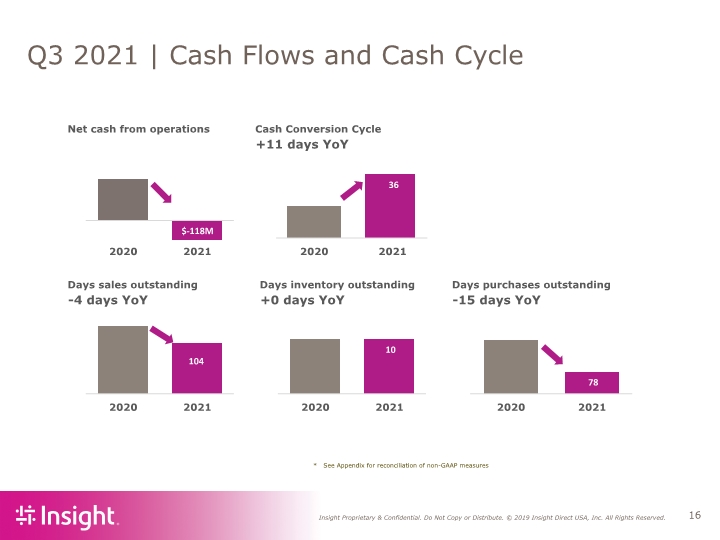
Net cash from operations Cash Conversion Cycle +11 days YoY Days sales outstanding Days inventory outstanding Days purchases outstanding -4 days YoY +0 days YoY -15 days YoY $ - 118M 2020 2021 36 2020 2021 104 2020 2021 10 2020 2021 78 2020 2021 Q3 2021 | Cash Flows and Cash Cycle * See Appendix for reconciliation of non-GAAP measures
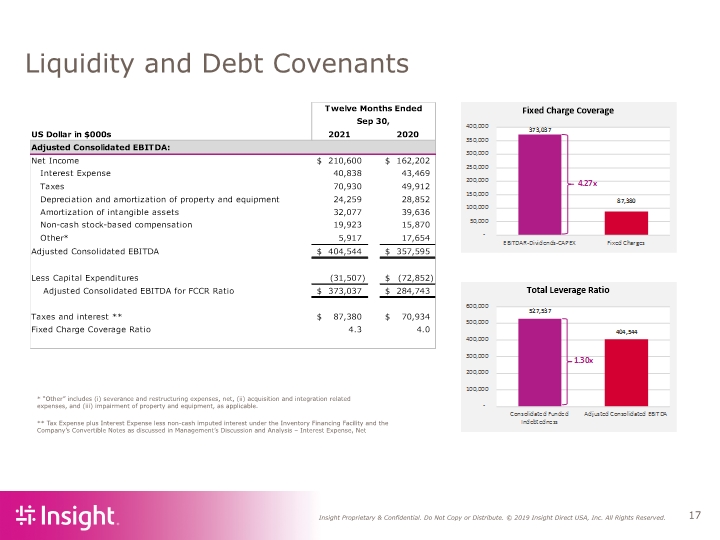
Liquidity and Debt Covenants ** Tax Expense plus Interest Expense less non-cash imputed interest under the Inventory Financing Facility and the Company’s Convertible Notes as discussed in Management’s Discussion and Analysis – Interest Expense, Net * “Other” includes (i) severance and restructuring expenses, net, (ii) acquisition and integration related expenses, and (iii) impairment of property and equipment, as applicable.
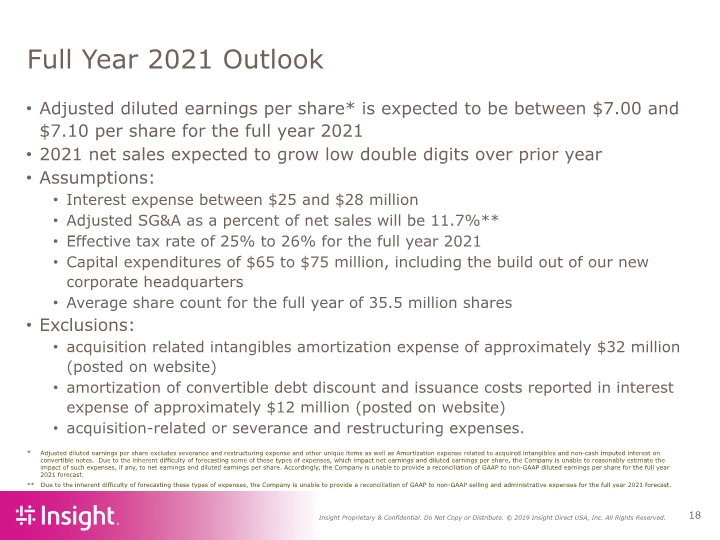
Full Year 2021 Outlook Adjusted diluted earnings per share* is expected to be between $7.00 and $7.10 per share for the full year 2021 2021 net sales expected to grow low double digits over prior year Assumptions: Interest expense between $25 and $28 million Adjusted SG&A as a percent of net sales will be 11.7%** Effective tax rate of 25% to 26% for the full year 2021 Capital expenditures of $65 to $75 million, including the build out of our new corporate headquarters Average share count for the full year of 35.5 million shares Exclusions: acquisition related intangibles amortization expense of approximately $32 million (posted on website) amortization of convertible debt discount and issuance costs reported in interest expense of approximately $12 million (posted on website) acquisition-related or severance and restructuring expenses. Adjusted diluted earnings per share excludes severance and restructuring expense and other unique items as well as Amortization expense related to acquired intangibles and non-cash imputed interest on convertible notes. Due to the inherent difficulty of forecasting some of these types of expenses, which impact net earnings and diluted earnings per share, the Company is unable to reasonably estimate the impact of such expenses, if any, to net earnings and diluted earnings per share. Accordingly, the Company is unable to provide a reconciliation of GAAP to non-GAAP diluted earnings per share for the full year 2021 forecast. ** Due to the inherent difficulty of forecasting these types of expenses, the Company is unable to provide a reconciliation of GAAP to non-GAAP selling and administrative expenses for the full year 2021 forecast.

Appendix
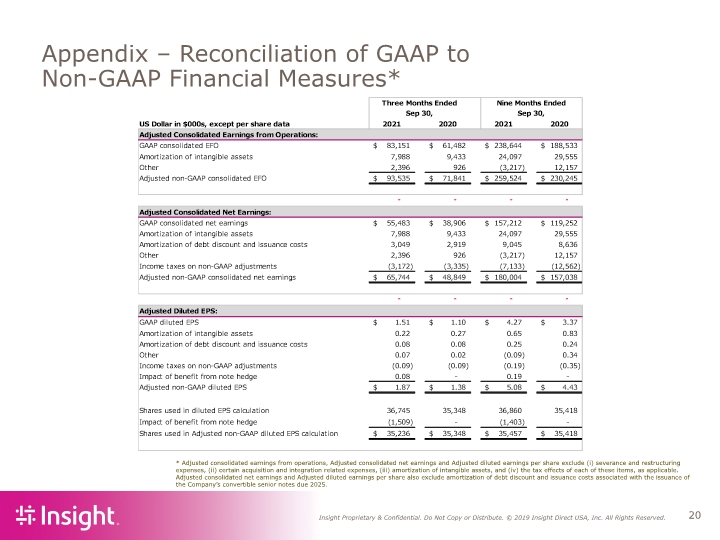
Appendix – Reconciliation of GAAP to Non-GAAP Financial Measures* * Adjusted consolidated earnings from operations, Adjusted consolidated net earnings and Adjusted diluted earnings per share exclude (i) severance and restructuring expenses, (ii) certain acquisition and integration related expenses, (iii) amortization of intangible assets, and (iv) the tax effects of each of these items, as applicable. Adjusted consolidated net earnings and Adjusted diluted earnings per share also exclude amortization of debt discount and issuance costs associated with the issuance of the Company’s convertible senior notes due 2025.
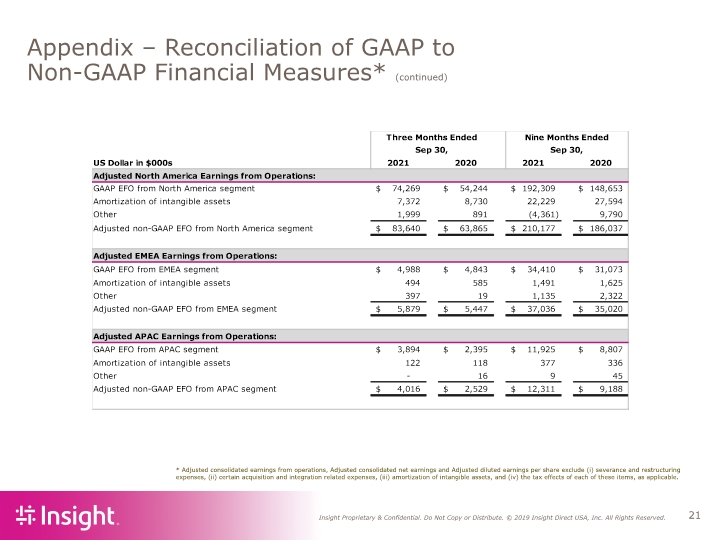
Appendix – Reconciliation of GAAP to Non-GAAP Financial Measures* (continued) * Adjusted consolidated earnings from operations, Adjusted consolidated net earnings and Adjusted diluted earnings per share exclude (i) severance and restructuring expenses, (ii) certain acquisition and integration related expenses, (iii) amortization of intangible assets, and (iv) the tax effects of each of these items, as applicable.
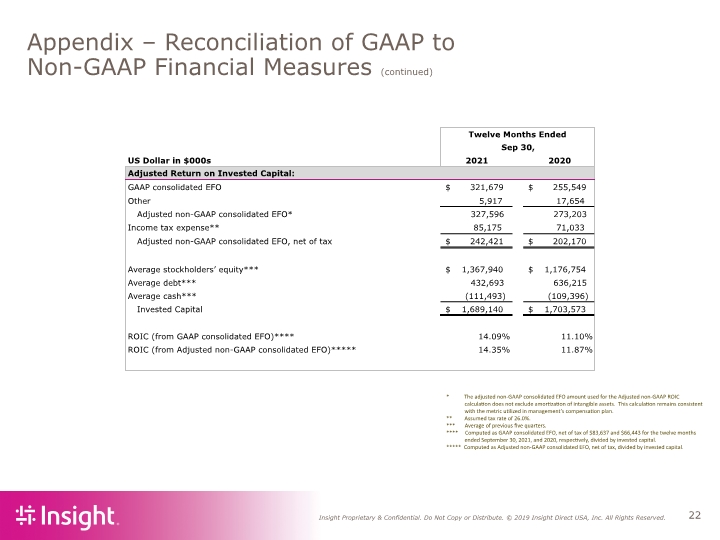
Appendix – Reconciliation of GAAP to Non-GAAP Financial Measures (continued) * The adjusted non-GAAP consolidated EFO amount used for the Adjusted non-GAAP ROIC calculation does not exclude amortization of intangible assets. This calculation remains consistent with the metric utilized in management’s compensation plan. ** Assumed tax rate of 26.0%. *** Average of previous five quarters. **** Computed as GAAP consolidated EFO, net of tax of $83,637 and $66,443 for the twelve months ended September 30, 2021, and 2020, respectively, divided by invested capital. ***** Computed as Adjusted non-GAAP consolidated EFO, net of tax, divided by invested capital.
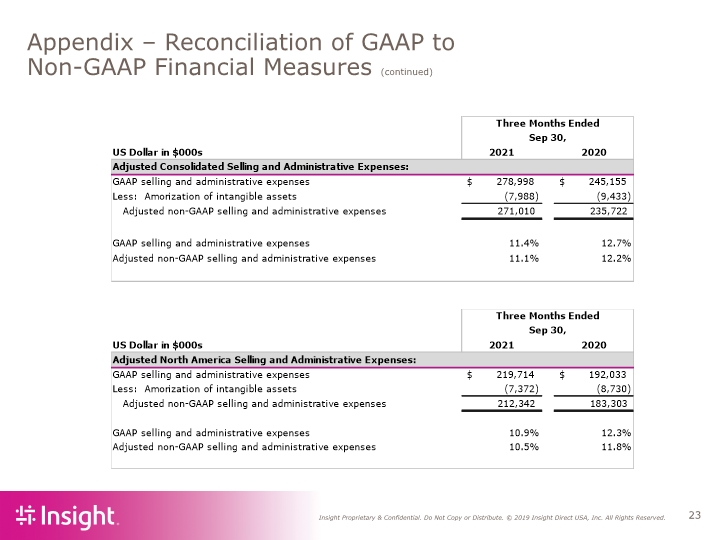
Appendix – Reconciliation of GAAP to Non-GAAP Financial Measures (continued)
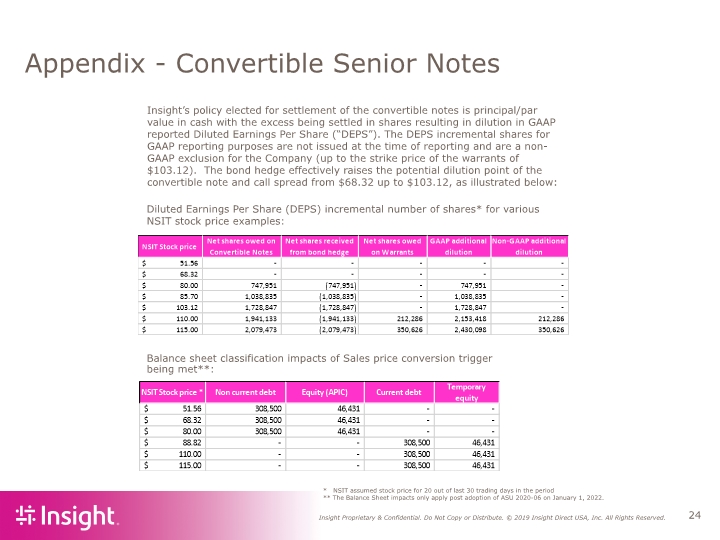
Appendix - Convertible Senior Notes * NSIT assumed stock price for 20 out of last 30 trading days in the period ** The Balance Sheet impacts only apply post adoption of ASU 2020-06 on January 1, 2022. Diluted Earnings Per Share (DEPS) incremental number of shares* for various NSIT stock price examples: Insight’s policy elected for settlement of the convertible notes is principal/par value in cash with the excess being settled in shares resulting in dilution in GAAP reported Diluted Earnings Per Share (“DEPS”). The DEPS incremental shares for GAAP reporting purposes are not issued at the time of reporting and are a non-GAAP exclusion for the Company (up to the strike price of the warrants of $103.12). The bond hedge effectively raises the potential dilution point of the convertible note and call spread from $68.32 up to $103.12, as illustrated below: Balance sheet classification impacts of Sales price conversion trigger being met**:
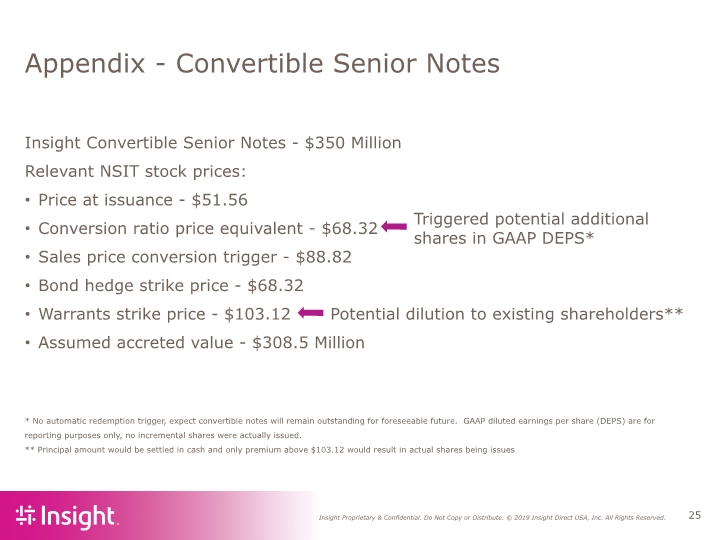
Appendix - Convertible Senior Notes * No automatic redemption trigger, expect convertible notes will remain outstanding for foreseeable future. GAAP diluted earnings per share (DEPS) are for reporting purposes only, no incremental shares were actually issued. ** Principal amount would be settled in cash and only premium above $103.12 would result in actual shares being issues Insight Convertible Senior Notes - $350 Million Relevant NSIT stock prices: Price at issuance - $51.56 Conversion ratio price equivalent - $68.32 Sales price conversion trigger - $88.82 Bond hedge strike price - $68.32 Warrants strike price - $103.12 Potential dilution to existing shareholders** Assumed accreted value - $308.5 Million Triggered potential additional shares in GAAP DEPS*


