
Insight Proprietary & Confidential. Do Not Copy or Distribute. © 2022 Insight Direct USA, Inc. All Rights Reserved. 1 Insight Enterprises, Inc. First Quarter 2022 Earnings Conference Call and Webcast Exhibit 99.2
Insight Proprietary & Confidential. Do Not Copy or Distribute. © 2022 Insight Direct USA, Inc. All Rights Reserved. 2 Disclosures • Safe harbor statement This presentation includes “forward-looking statements” within the meaning of the Private Securities Litigation Reform Act of 1995 related to Insight’s plans and expectations. Statements that are not historical facts, including those related to coronavirus strain COVID-19 (“COVID-19”), our future responses to and the impact of COVID-19 on our Company, our expectations about future financial results, our expectations regarding current supply constraints, our expectations regarding backlog shipments, future expected trends in the IT market and our opportunities for growth, are forward-looking statements. These forward-looking statements are subject to assumptions, risks and uncertainties which could cause actual results or future events to differ materially from such statements. The Company undertakes no obligation to update publicly or revise any of the forward-looking statements, except as otherwise required by law. More detailed information about forward-looking statements and risk factors is included in today’s press release and discussed in the Company’s most recently filed periodic reports and subsequent filings with the Securities and Exchange Commission. • Non-GAAP measures This presentation will reference certain non-GAAP financial information as ‘Adjusted’. A reconciliation of non-GAAP financial measures presented in this document to our actual GAAP results is attached to the back of this presentation and included in the press release issued today, which you may find on the Investor Relations section of our website at investor.insight.com. These non-GAAP measures are used by the Company and its management to evaluate financial performance against budgeted amounts, to calculate incentive compensation, to assist in forecasting future performance and to compare the Company’s results to those of the Company’s competitors. The Company believes that these non-GAAP financial measures are useful to investors because they allow for greater transparency, facilitate comparisons to prior periods and the Company’s competitors’ results and assist in forecasting performance for future periods. These non-GAAP financial measures are not prepared in accordance with GAAP and may be different from non-GAAP financial measures presented by other companies. Non-GAAP financial measures should not be considered as a substitute for, or superior to, measures of financial performance prepared in accordance with GAAP. • Constant currency In some instances, the Company refers to changes in net sales, gross profit and earnings from operations on a consolidated basis and in North America, EMEA and APAC excluding the effects of fluctuating foreign currency exchange rates. In computing these changes and percentages, the Company compares the current year amount as translated into U.S. dollars under the applicable accounting standards to the prior year amount in local currency translated into U.S. dollars utilizing the weighted average translation rate for the current period.

3Insight Proprietary & Confidential. Do Not Copy or Distribute. © 2022 Insight Direct USA, Inc. All Rights Reserved. Agenda Insight Proprietary & Confidential. Do Not Copy or Distribute. © 2021 Insight Direct USA, Inc. All Rights Reserved. • Disclosures • CEO Commentary ◦ Areas of Expertise ◦ Solutions at Work • CFO Commentary ◦ First Quarter 2022 Financial Highlights ◦ Cashflow and Debt Covenants ◦ 2022 Outlook • Closing Comments
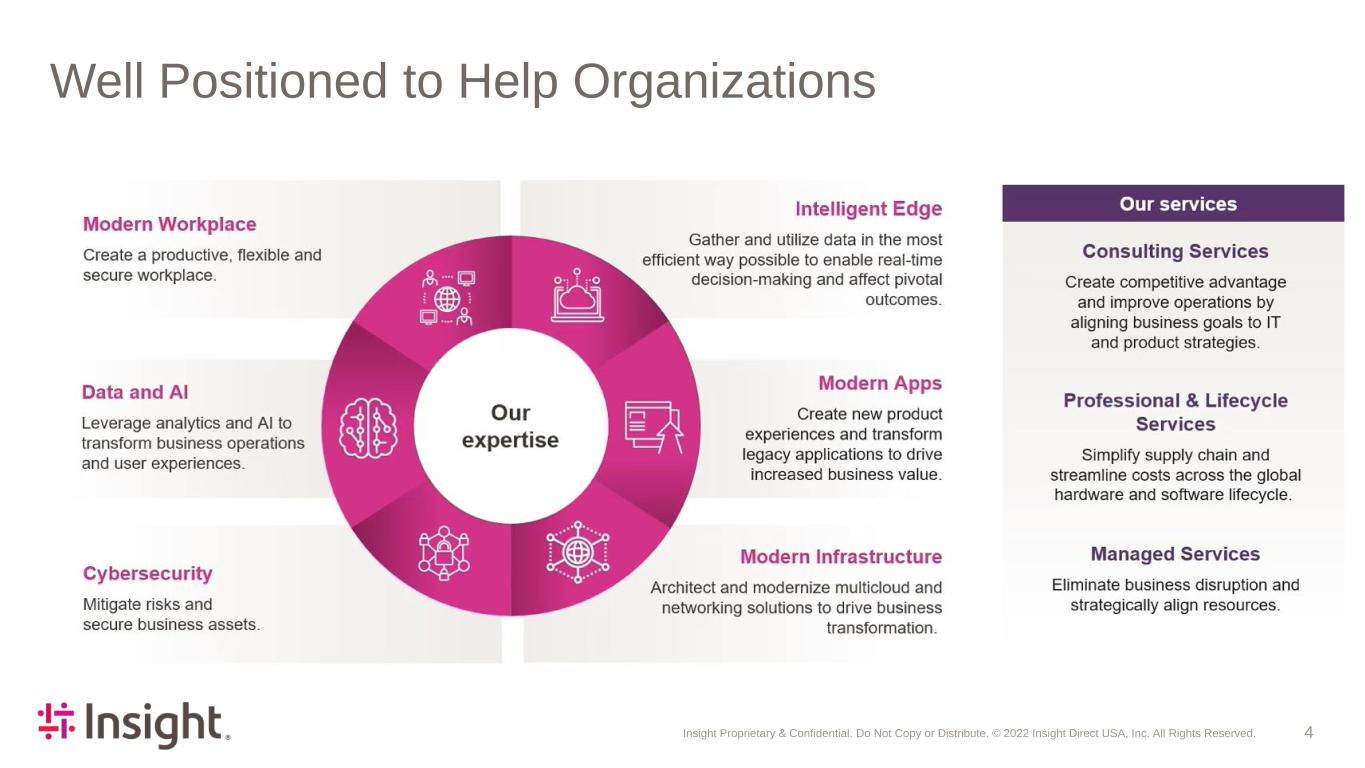
Insight Proprietary & Confidential. Do Not Copy or Distribute. © 2022 Insight Direct USA, Inc. All Rights Reserved. 4 Well Positioned to Help Organizations

Insight Proprietary & Confidential. Do Not Copy or Distribute. © 2022 Insight Direct USA, Inc. All Rights Reserved. 5 Retailer Improves Security with Improved Cloud Ops & Modern IT • Streamline and secure back- end operations • Modernize global e-commerce experience • Modern Infrastructure • Cybersecurity • Consulting and Security Services • Strategy Long-standing fashion retailer operating in over 30 countries • Client passed 44 controls for regulatory compliance • Tripled identity secure score (Azure metric) • Improved overall efficiency and user experience • Insight continues to help with ongoing global digital transformation Client Client Objectives Outcomes Solution and Services
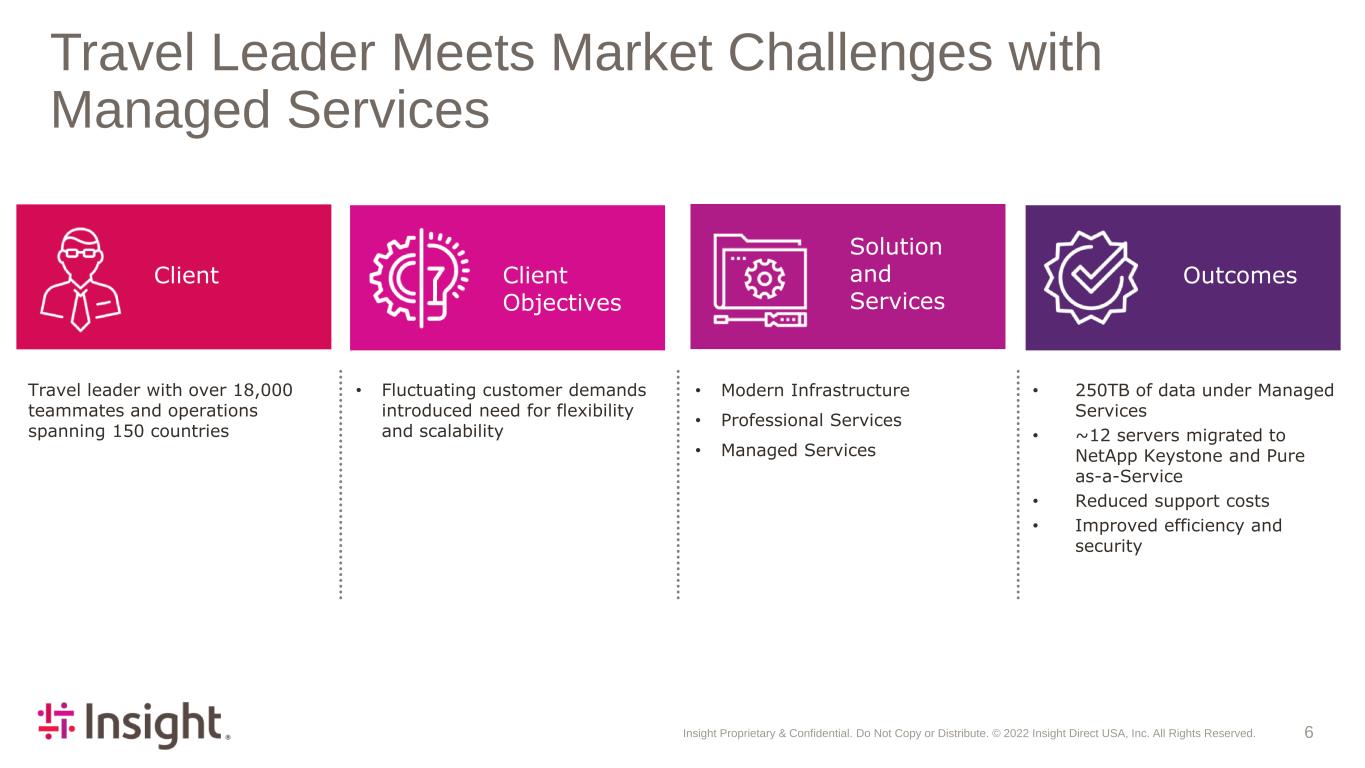
Insight Proprietary & Confidential. Do Not Copy or Distribute. © 2022 Insight Direct USA, Inc. All Rights Reserved. 6 Travel Leader Meets Market Challenges with Managed Services Travel leader with over 18,000 teammates and operations spanning 150 countries • Fluctuating customer demands introduced need for flexibility and scalability • 250TB of data under Managed Services • ~12 servers migrated to NetApp Keystone and Pure as-a-Service • Reduced support costs • Improved efficiency and security • Modern Infrastructure • Professional Services • Managed Services Client Client Objectives Outcomes Solution and Services

Insight Proprietary & Confidential. Do Not Copy or Distribute. © 2022 Insight Direct USA, Inc. All Rights Reserved. 7Insight Proprietary & Confidential. Do Not Copy or Distribute. © 2022 Insight Direct USA, Inc. All Rights Reserved. CFO Commentary • First Quarter 2022 Financial Highlights • Cashflow and Debt Covenants • 2022 Outlook
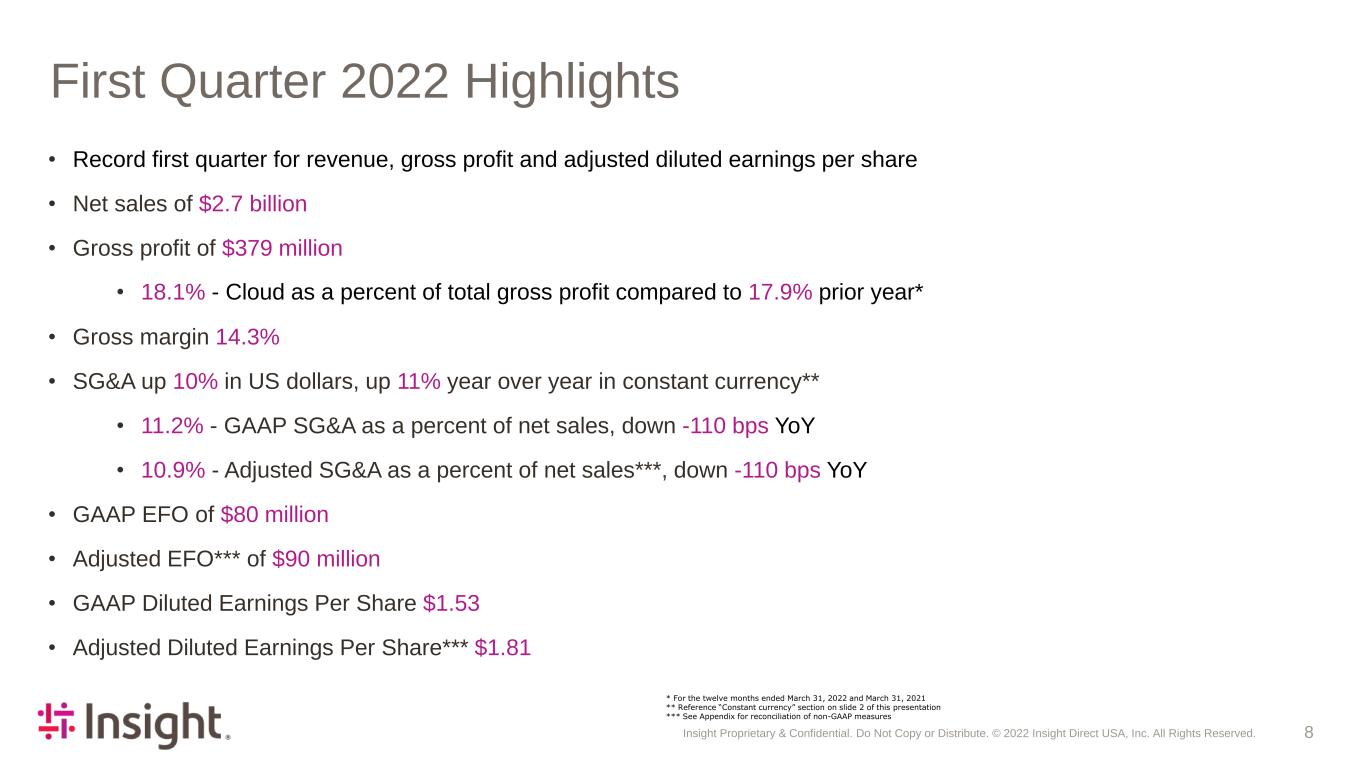
Insight Proprietary & Confidential. Do Not Copy or Distribute. © 2022 Insight Direct USA, Inc. All Rights Reserved. 8 First Quarter 2022 Highlights • Record first quarter for revenue, gross profit and adjusted diluted earnings per share • Net sales of $2.7 billion • Gross profit of $379 million • 18.1% - Cloud as a percent of total gross profit compared to 17.9% prior year* • Gross margin 14.3% • SG&A up 10% in US dollars, up 11% year over year in constant currency** • 11.2% - GAAP SG&A as a percent of net sales, down -110 bps YoY • 10.9% - Adjusted SG&A as a percent of net sales***, down -110 bps YoY • GAAP EFO of $80 million • Adjusted EFO*** of $90 million • GAAP Diluted Earnings Per Share $1.53 • Adjusted Diluted Earnings Per Share*** $1.81 * For the twelve months ended March 31, 2022 and March 31, 2021 ** Reference “Constant currency” section on slide 2 of this presentation *** See Appendix for reconciliation of non-GAAP measures
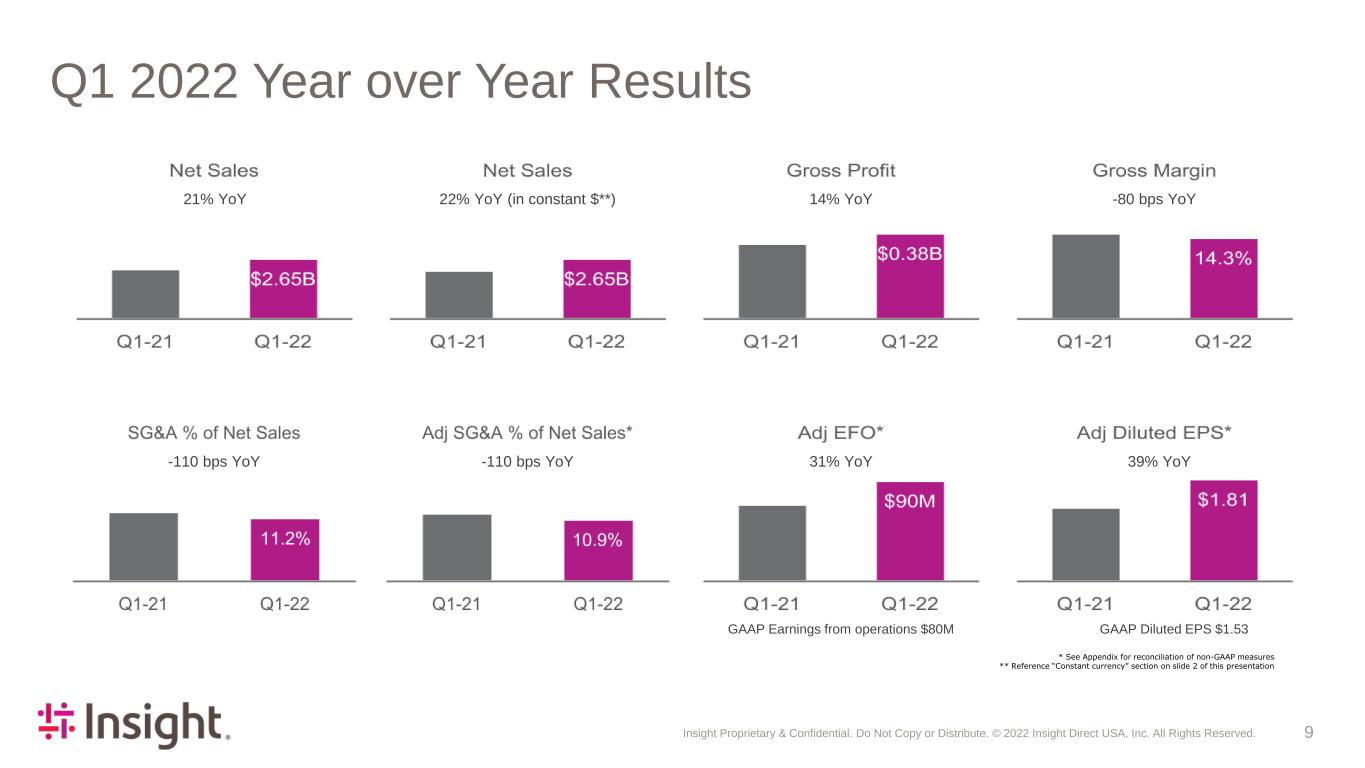
Insight Proprietary & Confidential. Do Not Copy or Distribute. © 2022 Insight Direct USA, Inc. All Rights Reserved. 9 Q1 2022 Year over Year Results * See Appendix for reconciliation of non-GAAP measures ** Reference “Constant currency” section on slide 2 of this presentation 21% YoY 22% YoY (in constant $**) 14% YoY -80 bps YoY 31% YoY GAAP Earnings from operations $80M GAAP Diluted EPS $1.53 -110 bps YoY -110 bps YoY 39% YoY

Insight Proprietary & Confidential. Do Not Copy or Distribute. © 2022 Insight Direct USA, Inc. All Rights Reserved. 10 * See Appendix for reconciliation of non-GAAP measures Q1 2022 North America | Financial Results 25% YoY 18% YoY -80 bps YoY 34% YoY GAAP Earnings from operations $65M -110 bps YoY -100 bps YoY
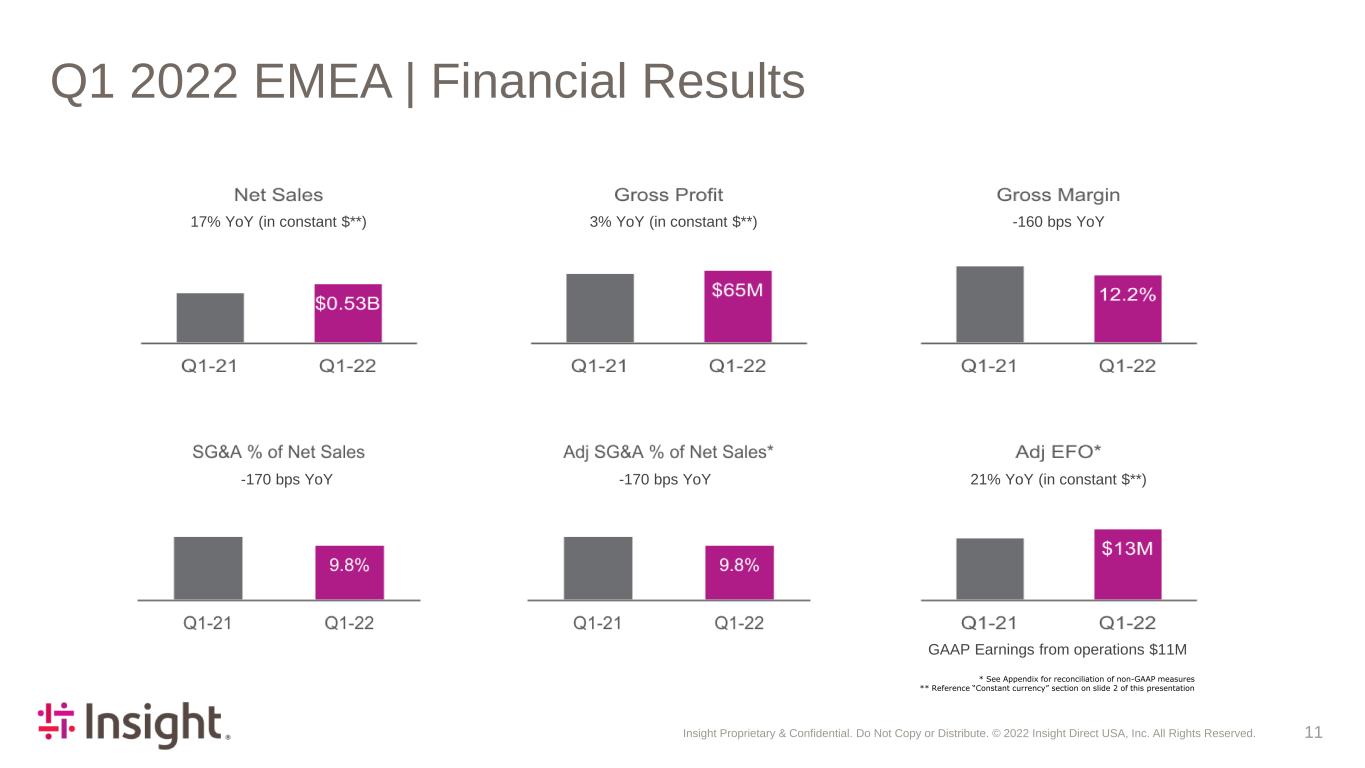
Insight Proprietary & Confidential. Do Not Copy or Distribute. © 2022 Insight Direct USA, Inc. All Rights Reserved. 11 Q1 2022 EMEA | Financial Results 17% YoY (in constant $**) 3% YoY (in constant $**) -160 bps YoY 21% YoY (in constant $**) GAAP Earnings from operations $11M -170 bps YoY -170 bps YoY * See Appendix for reconciliation of non-GAAP measures ** Reference “Constant currency” section on slide 2 of this presentation
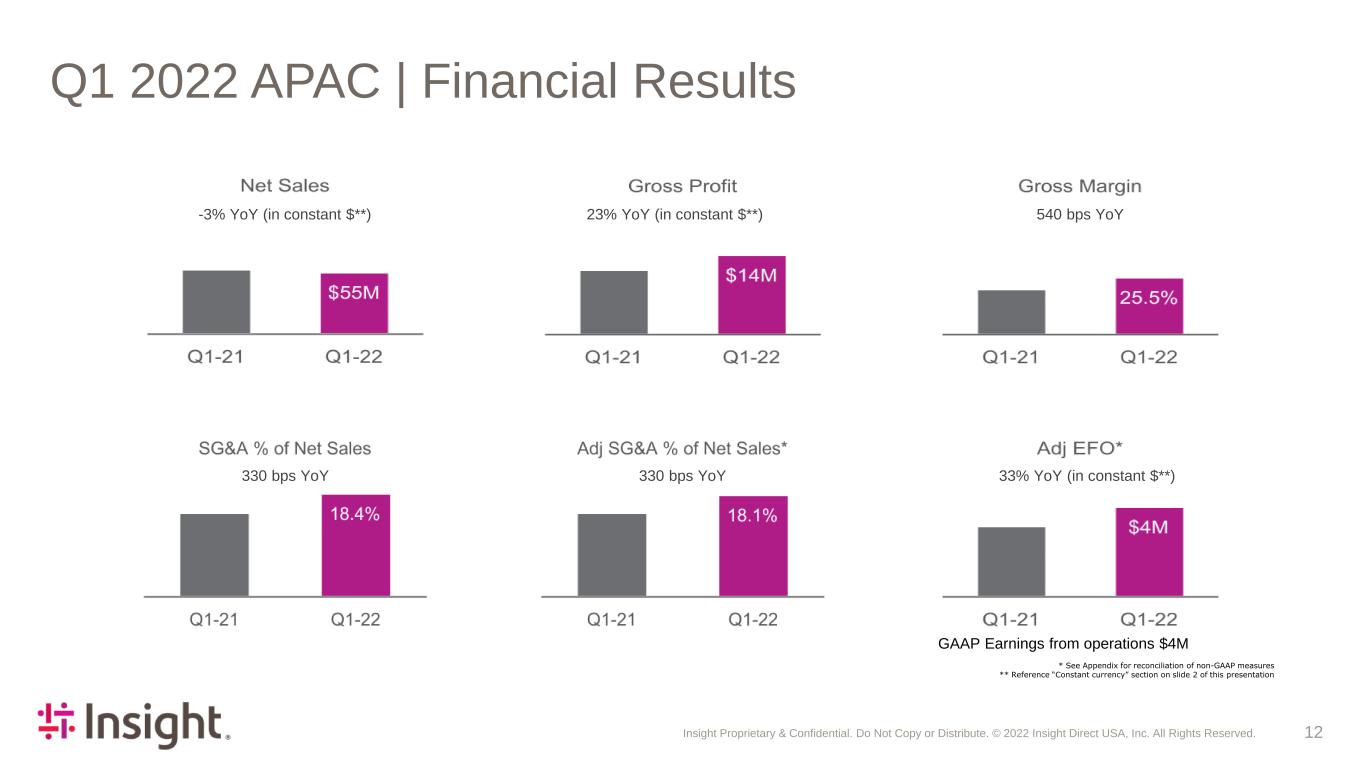
Insight Proprietary & Confidential. Do Not Copy or Distribute. © 2022 Insight Direct USA, Inc. All Rights Reserved. 12 Q1 2022 APAC | Financial Results -3% YoY (in constant $**) 23% YoY (in constant $**) 540 bps YoY 33% YoY (in constant $**) GAAP Earnings from operations $4M 330 bps YoY 330 bps YoY * See Appendix for reconciliation of non-GAAP measures ** Reference “Constant currency” section on slide 2 of this presentation
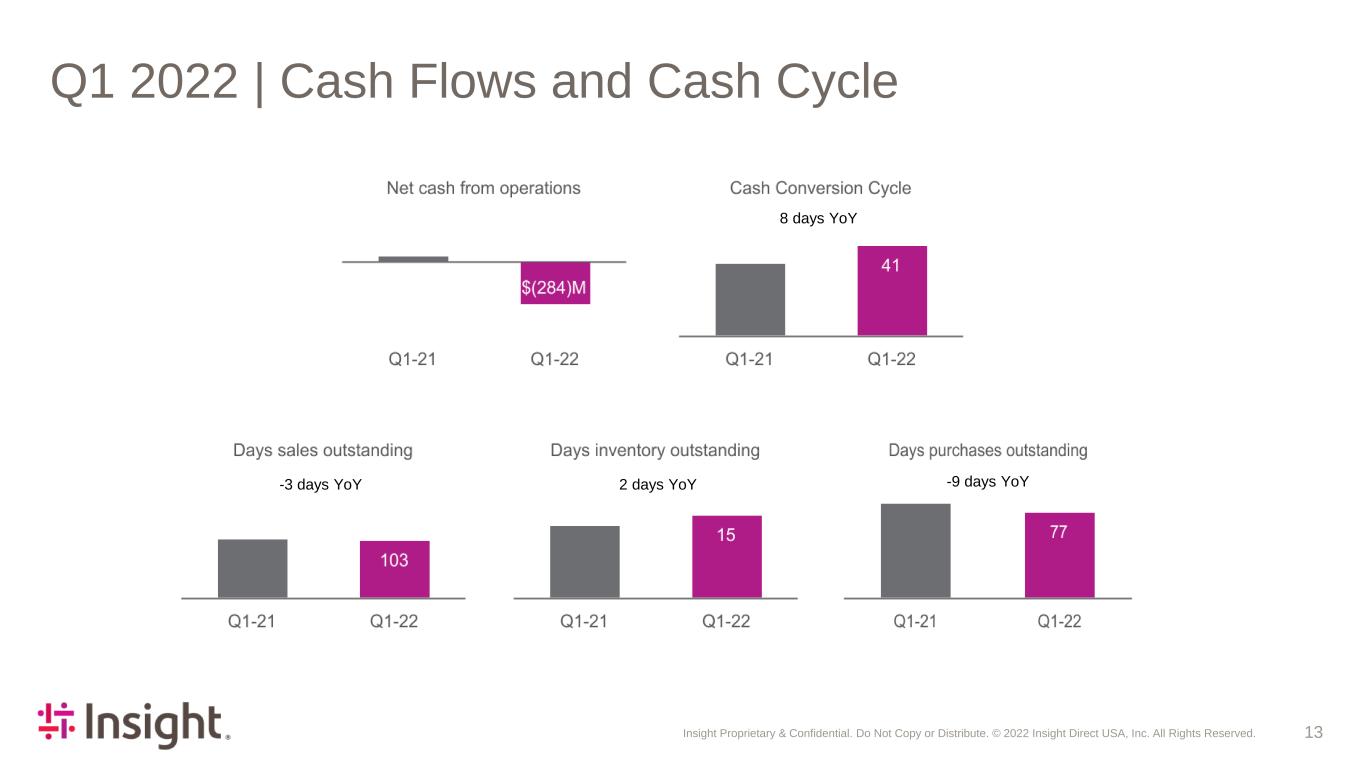
Insight Proprietary & Confidential. Do Not Copy or Distribute. © 2022 Insight Direct USA, Inc. All Rights Reserved. 13 Q1 2022 | Cash Flows and Cash Cycle 8 days YoY -3 days YoY 2 days YoY -9 days YoY

Insight Proprietary & Confidential. Do Not Copy or Distribute. © 2022 Insight Direct USA, Inc. All Rights Reserved. 14 Liquidity and Debt Covenants ** Tax Expense plus Interest Expense less non-cash imputed interest under the Company’s inventory financing facilities and the Company’s convertible notes. * “Other” includes (i) severance and restructuring expenses, net, (ii) acquisition and integration related expenses, and (iii) impairment of property and equipment, as applicable. Twelve Months Ended March 31, US Dollar in $000s 2022 2021 Adjusted Consolidated EBITDA Net income $ 232,808 $ 181,847 Interest expense 39,460 40,081 Taxes 77,706 60,672 Depreciation and amortization of property and equipment 22,584 26,917 Amortization of intangible assets 31,929 35,468 Non-cash stock-based compensation 18,492 18,034 Other 6,889 2,928 Adjusted consolidated EBITDA $ 429,868 $ 365,947 Less: Capital expenditures (69,977) (24,649) Adjusted consolidated EBITDA for FCCR Ratio $ 359,891 $ 341,298 Taxes and interest** $ 91,593 $ 75,054 Fixed Charge Coverage Ratio 3.9 4.5 3.93x 1.67x

Insight Proprietary & Confidential. Do Not Copy or Distribute. © 2022 Insight Direct USA, Inc. All Rights Reserved. 15 Full Year 2022 Outlook Other Assumptions and Exclusions: • No significant change in our debt instruments or the macro economic outlook • Excludes acquisition related intangibles amortization expense of approximately $31 million (posted on website) • Excludes acquisition-related or severance and restructuring expenses • Adjusted diluted earnings per share excludes severance and restructuring expense and other unique items as well as amortization expense related to acquired intangibles. Due to the inherent difficulty of forecasting some of these types of expenses, which impact net earnings and diluted earnings per share, the Company is unable to reasonably estimate the impact of such expenses, if any, to net earnings and diluted earnings per share. Accordingly, the Company is unable to provide a reconciliation of GAAP to non-GAAP diluted earnings per share for the full year 2022 forecast. Assumptions: As of May 5, 2022 As of February 10, 2022 Full year net sales growth % over prior year Low double digit Mid-single digit Interest expense $30 - $35 million $30 - $35 million Effective tax rate 24% - 25% 25% - 26% Adjusted diluted EPS $7.95 - $8.15 $7.65 - $7.85 Average share count 35.6 million 35.6 million Capital expenditures $65 - $70 million $75 - $80 million

Insight Proprietary & Confidential. Do Not Copy or Distribute. © 2022 Insight Direct USA, Inc. All Rights Reserved. 16 Appendix
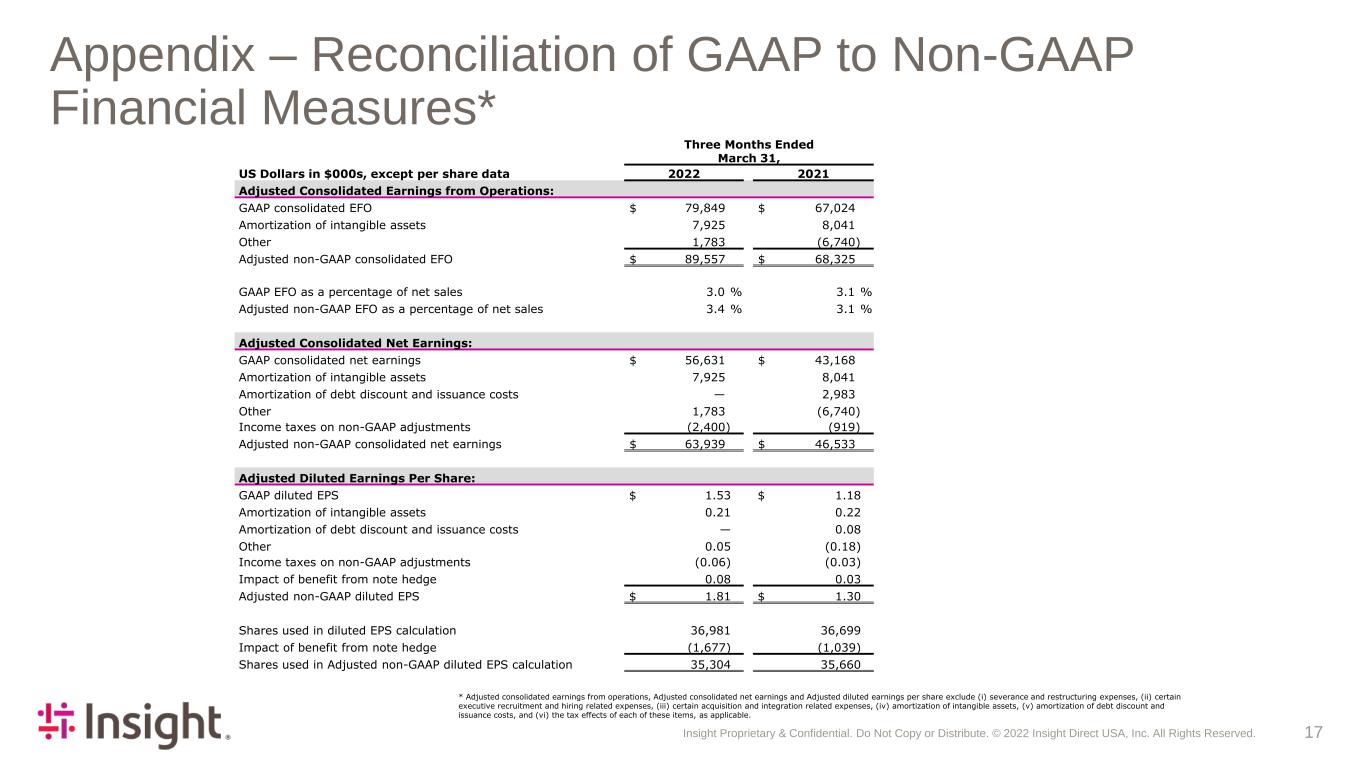
Insight Proprietary & Confidential. Do Not Copy or Distribute. © 2022 Insight Direct USA, Inc. All Rights Reserved. 17 Appendix – Reconciliation of GAAP to Non-GAAP Financial Measures* Three Months Ended March 31, US Dollars in $000s, except per share data 2022 2021 Adjusted Consolidated Earnings from Operations: GAAP consolidated EFO $ 79,849 $ 67,024 Amortization of intangible assets 7,925 8,041 Other 1,783 (6,740) Adjusted non-GAAP consolidated EFO $ 89,557 $ 68,325 GAAP EFO as a percentage of net sales 3.0 % 3.1 % Adjusted non-GAAP EFO as a percentage of net sales 3.4 % 3.1 % Adjusted Consolidated Net Earnings: GAAP consolidated net earnings $ 56,631 $ 43,168 Amortization of intangible assets 7,925 8,041 Amortization of debt discount and issuance costs — 2,983 Other 1,783 (6,740) Income taxes on non-GAAP adjustments (2,400) (919) Adjusted non-GAAP consolidated net earnings $ 63,939 $ 46,533 Adjusted Diluted Earnings Per Share: GAAP diluted EPS $ 1.53 $ 1.18 Amortization of intangible assets 0.21 0.22 Amortization of debt discount and issuance costs — 0.08 Other 0.05 (0.18) Income taxes on non-GAAP adjustments (0.06) (0.03) Impact of benefit from note hedge 0.08 0.03 Adjusted non-GAAP diluted EPS $ 1.81 $ 1.30 Shares used in diluted EPS calculation 36,981 36,699 Impact of benefit from note hedge (1,677) (1,039) Shares used in Adjusted non-GAAP diluted EPS calculation 35,304 35,660 * Adjusted consolidated earnings from operations, Adjusted consolidated net earnings and Adjusted diluted earnings per share exclude (i) severance and restructuring expenses, (ii) certain executive recruitment and hiring related expenses, (iii) certain acquisition and integration related expenses, (iv) amortization of intangible assets, (v) amortization of debt discount and issuance costs, and (vi) the tax effects of each of these items, as applicable.
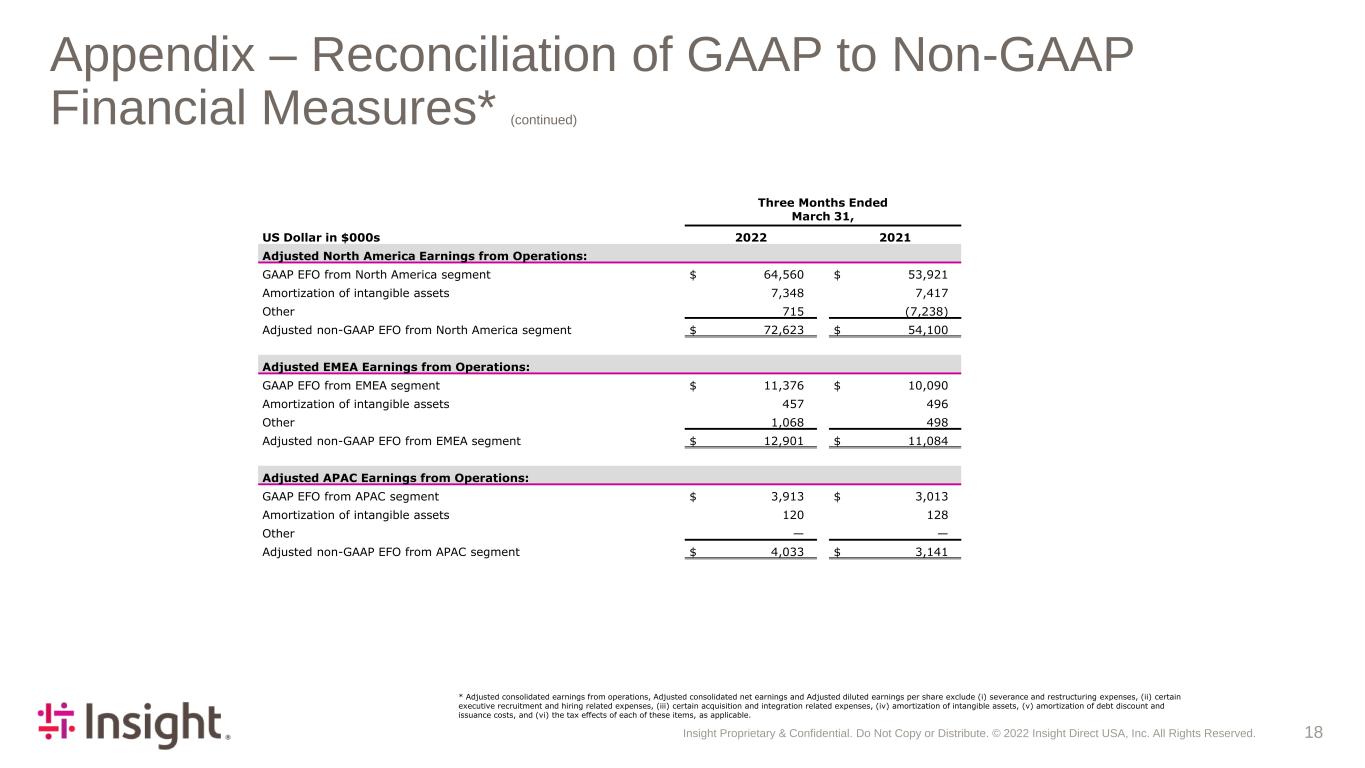
Insight Proprietary & Confidential. Do Not Copy or Distribute. © 2022 Insight Direct USA, Inc. All Rights Reserved. 18 Appendix – Reconciliation of GAAP to Non-GAAP Financial Measures* (continued) Three Months Ended March 31, US Dollar in $000s 2022 2021 Adjusted North America Earnings from Operations: GAAP EFO from North America segment $ 64,560 $ 53,921 Amortization of intangible assets 7,348 7,417 Other 715 (7,238) Adjusted non-GAAP EFO from North America segment $ 72,623 $ 54,100 Adjusted EMEA Earnings from Operations: GAAP EFO from EMEA segment $ 11,376 $ 10,090 Amortization of intangible assets 457 496 Other 1,068 498 Adjusted non-GAAP EFO from EMEA segment $ 12,901 $ 11,084 Adjusted APAC Earnings from Operations: GAAP EFO from APAC segment $ 3,913 $ 3,013 Amortization of intangible assets 120 128 Other — — Adjusted non-GAAP EFO from APAC segment $ 4,033 $ 3,141 * Adjusted consolidated earnings from operations, Adjusted consolidated net earnings and Adjusted diluted earnings per share exclude (i) severance and restructuring expenses, (ii) certain executive recruitment and hiring related expenses, (iii) certain acquisition and integration related expenses, (iv) amortization of intangible assets, (v) amortization of debt discount and issuance costs, and (vi) the tax effects of each of these items, as applicable.
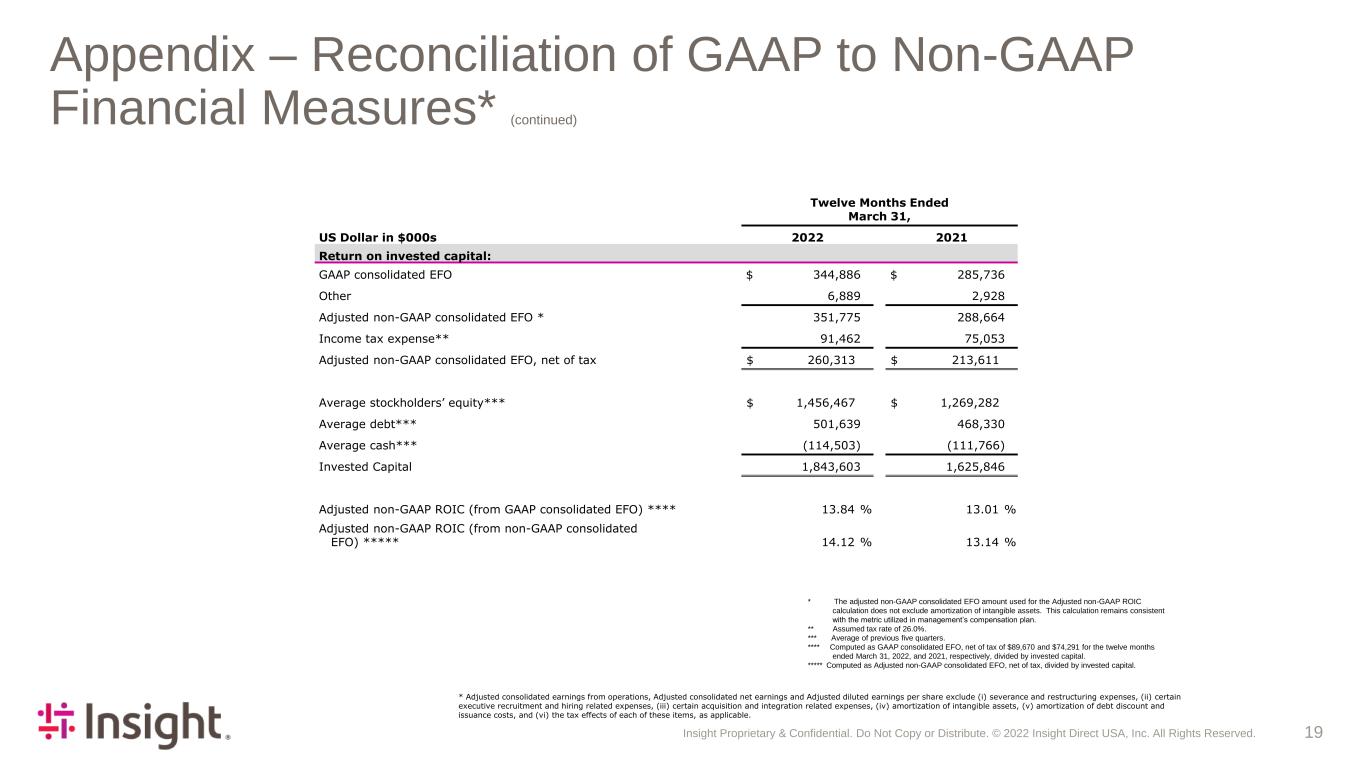
Insight Proprietary & Confidential. Do Not Copy or Distribute. © 2022 Insight Direct USA, Inc. All Rights Reserved. 19 Appendix – Reconciliation of GAAP to Non-GAAP Financial Measures* (continued) * The adjusted non-GAAP consolidated EFO amount used for the Adjusted non-GAAP ROIC calculation does not exclude amortization of intangible assets. This calculation remains consistent with the metric utilized in management’s compensation plan. ** Assumed tax rate of 26.0%. *** Average of previous five quarters. **** Computed as GAAP consolidated EFO, net of tax of $89,670 and $74,291 for the twelve months ended March 31, 2022, and 2021, respectively, divided by invested capital. ***** Computed as Adjusted non-GAAP consolidated EFO, net of tax, divided by invested capital. Twelve Months Ended March 31, US Dollar in $000s 2022 2021 Return on invested capital: GAAP consolidated EFO $ 344,886 $ 285,736 Other 6,889 2,928 Adjusted non-GAAP consolidated EFO * 351,775 288,664 Income tax expense** 91,462 75,053 Adjusted non-GAAP consolidated EFO, net of tax $ 260,313 $ 213,611 Average stockholders’ equity*** $ 1,456,467 $ 1,269,282 Average debt*** 501,639 468,330 Average cash*** (114,503) (111,766) Invested Capital 1,843,603 1,625,846 Adjusted non-GAAP ROIC (from GAAP consolidated EFO) **** 13.84 % 13.01 % Adjusted non-GAAP ROIC (from non-GAAP consolidated EFO) ***** 14.12 % 13.14 % * Adjusted consolidated earnings from operations, Adjusted consolidated net earnings and Adjusted diluted earnings per share exclude (i) severance and restructuring expenses, (ii) certain executive recruitment and hiring related expenses, (iii) certain acquisition and integration related expenses, (iv) amortization of intangible assets, (v) amortization of debt discount and issuance costs, and (vi) the tax effects of each of these items, as applicable.
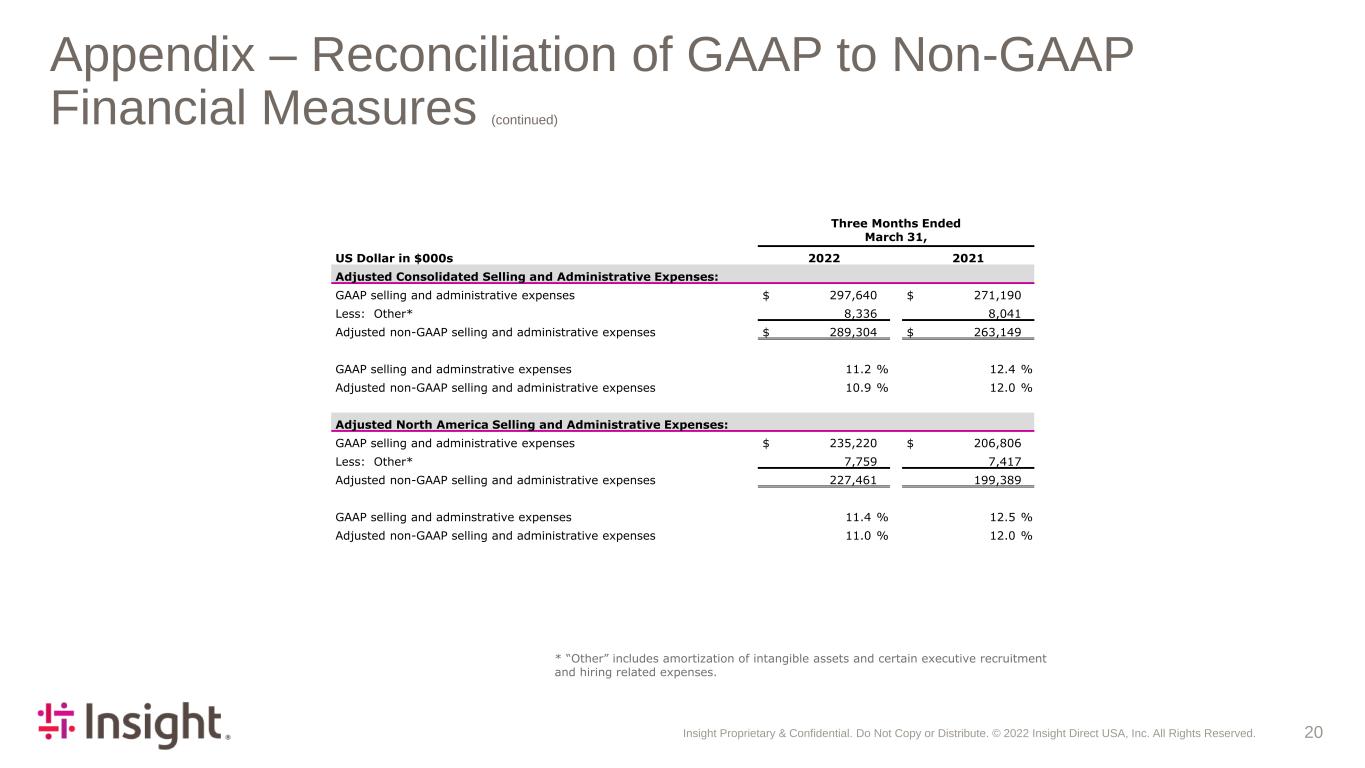
Insight Proprietary & Confidential. Do Not Copy or Distribute. © 2022 Insight Direct USA, Inc. All Rights Reserved. 20 Appendix – Reconciliation of GAAP to Non-GAAP Financial Measures (continued) Three Months Ended March 31, US Dollar in $000s 2022 2021 Adjusted Consolidated Selling and Administrative Expenses: GAAP selling and administrative expenses $ 297,640 $ 271,190 Less: Other* 8,336 8,041 Adjusted non-GAAP selling and administrative expenses $ 289,304 $ 263,149 GAAP selling and adminstrative expenses 11.2 % 12.4 % Adjusted non-GAAP selling and administrative expenses 10.9 % 12.0 % Adjusted North America Selling and Administrative Expenses: GAAP selling and administrative expenses $ 235,220 $ 206,806 Less: Other* 7,759 7,417 Adjusted non-GAAP selling and administrative expenses 227,461 199,389 GAAP selling and adminstrative expenses 11.4 % 12.5 % Adjusted non-GAAP selling and administrative expenses 11.0 % 12.0 % * “Other” includes amortization of intangible assets and certain executive recruitment and hiring related expenses.
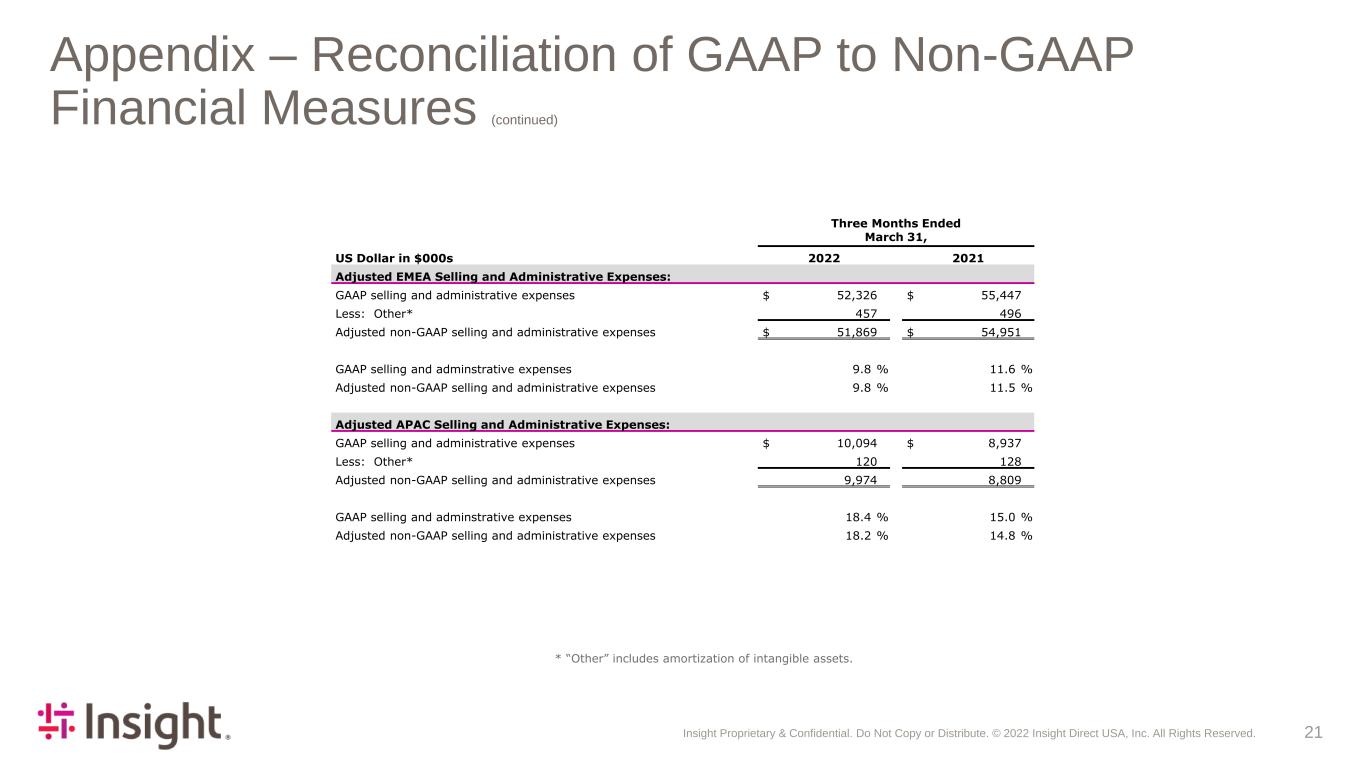
Insight Proprietary & Confidential. Do Not Copy or Distribute. © 2022 Insight Direct USA, Inc. All Rights Reserved. 21 Appendix – Reconciliation of GAAP to Non-GAAP Financial Measures (continued) Three Months Ended March 31, US Dollar in $000s 2022 2021 Adjusted EMEA Selling and Administrative Expenses: GAAP selling and administrative expenses $ 52,326 $ 55,447 Less: Other* 457 496 Adjusted non-GAAP selling and administrative expenses $ 51,869 $ 54,951 GAAP selling and adminstrative expenses 9.8 % 11.6 % Adjusted non-GAAP selling and administrative expenses 9.8 % 11.5 % Adjusted APAC Selling and Administrative Expenses: GAAP selling and administrative expenses $ 10,094 $ 8,937 Less: Other* 120 128 Adjusted non-GAAP selling and administrative expenses 9,974 8,809 GAAP selling and adminstrative expenses 18.4 % 15.0 % Adjusted non-GAAP selling and administrative expenses 18.2 % 14.8 % * “Other” includes amortization of intangible assets.
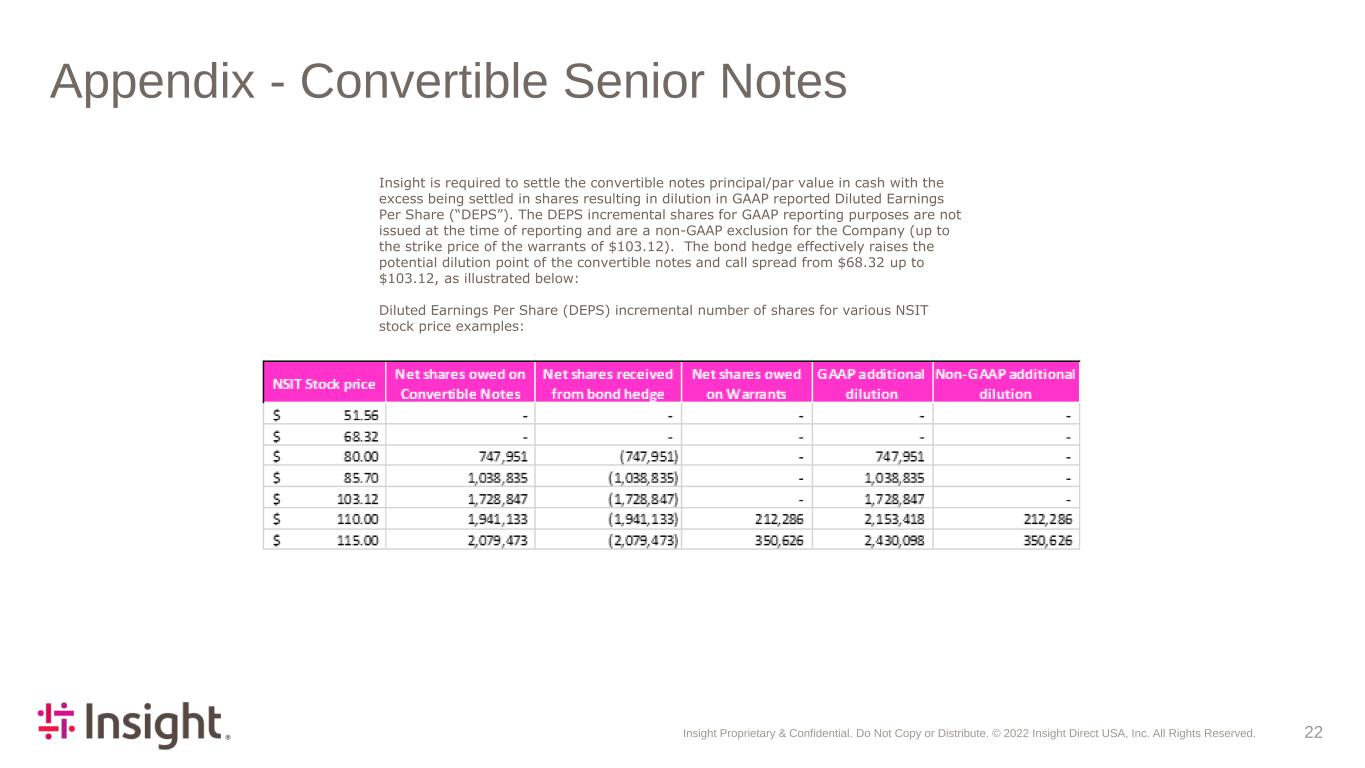
Insight Proprietary & Confidential. Do Not Copy or Distribute. © 2022 Insight Direct USA, Inc. All Rights Reserved. 22 Appendix - Convertible Senior Notes Insight is required to settle the convertible notes principal/par value in cash with the excess being settled in shares resulting in dilution in GAAP reported Diluted Earnings Per Share (“DEPS”). The DEPS incremental shares for GAAP reporting purposes are not issued at the time of reporting and are a non-GAAP exclusion for the Company (up to the strike price of the warrants of $103.12). The bond hedge effectively raises the potential dilution point of the convertible notes and call spread from $68.32 up to $103.12, as illustrated below: Diluted Earnings Per Share (DEPS) incremental number of shares for various NSIT stock price examples:
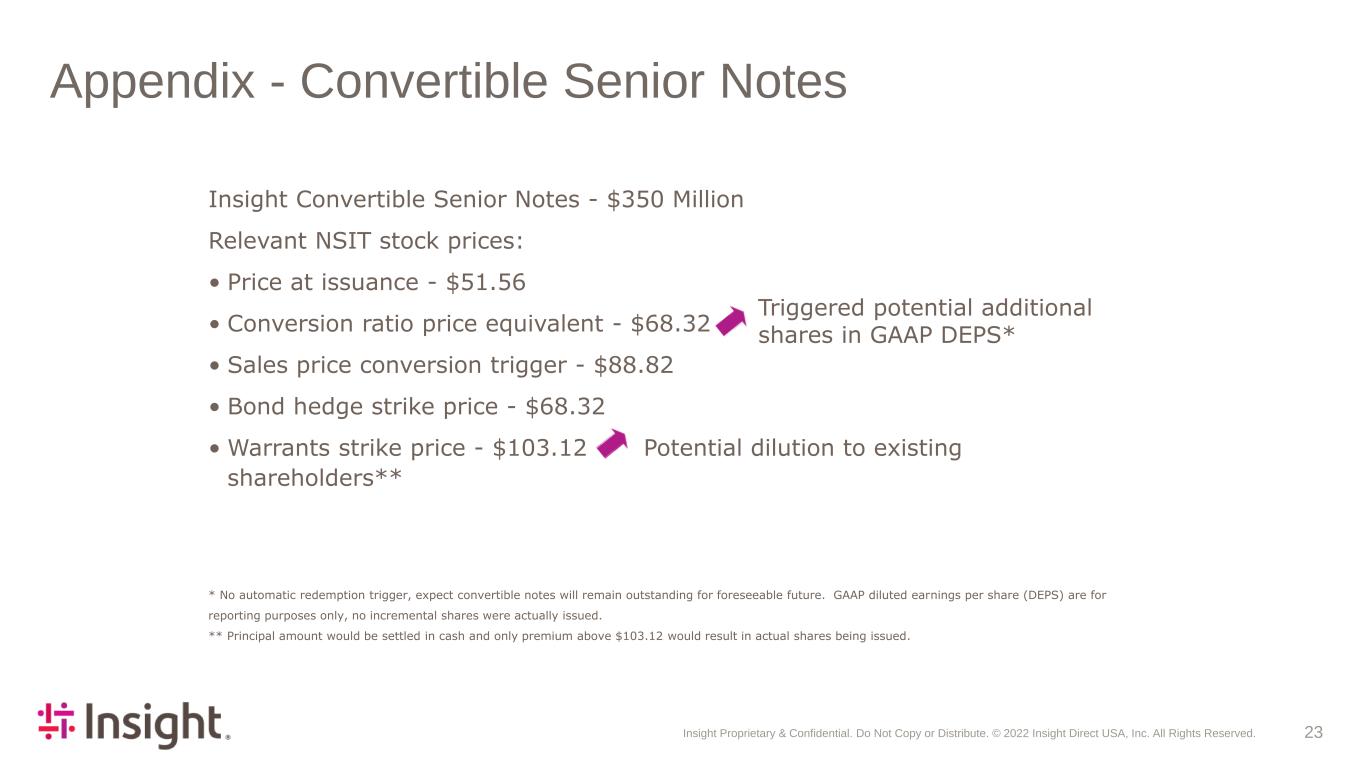
Insight Proprietary & Confidential. Do Not Copy or Distribute. © 2022 Insight Direct USA, Inc. All Rights Reserved. 23 Appendix - Convertible Senior Notes * No automatic redemption trigger, expect convertible notes will remain outstanding for foreseeable future. GAAP diluted earnings per share (DEPS) are for reporting purposes only, no incremental shares were actually issued. ** Principal amount would be settled in cash and only premium above $103.12 would result in actual shares being issued. Insight Convertible Senior Notes - $350 Million Relevant NSIT stock prices: • Price at issuance - $51.56 • Conversion ratio price equivalent - $68.32 • Sales price conversion trigger - $88.82 • Bond hedge strike price - $68.32 • Warrants strike price - $103.12 Potential dilution to existing shareholders** Triggered potential additional shares in GAAP DEPS*


