Exhibit 99.1

Link to searchable text of slide shown above
Link to searchable text of slide shown above
Link to searchable text of slide shown above
Link to searchable text of slide shown above
Link to searchable text of slide shown above
Link to searchable text of slide shown above
Link to searchable text of slide shown above
Link to searchable text of slide shown above

Link to searchable text of slide shown above
Link to searchable text of slide shown above
Link to searchable text of slide shown above
Link to searchable text of slide shown above

Link to searchable text of slide shown above
Link to searchable text of slide shown above

Link to searchable text of slide shown above
Link to searchable text of slide shown above

Link to searchable text of slide shown above
Link to searchable text of slide shown above
Link to searchable text of slide shown above
Link to searchable text of slide shown above
Link to searchable text of slide shown above
Link to searchable text of slide shown above
Link to searchable text of slide shown above
Link to searchable text of slide shown above
Link to searchable text of slide shown above
Link to searchable text of slide shown above
Link to searchable text of slide shown above

Link to searchable text of slide shown above
Link to searchable text of slide shown above
Link to searchable text of slide shown above

Link to searchable text of slide shown above
Link to searchable text of slide shown above
Link to searchable text of slide shown above

Link to searchable text of slide shown above

Link to searchable text of slide shown above
Link to searchable text of slide shown above
Link to searchable text of slide shown above
Link to searchable text of slide shown above
Link to searchable text of slide shown above
Link to searchable text of slide shown above
Searchable text section of graphics shown above
[LOGO]
Come See the Difference
Our Vision
• To be the premier community bank in the markets we serve.
• Markets as communities and neighborhoods that have a local identity.
• Vision is best realized through the daily interactions between our employees & customers.
• High expectations, grounded in the things we know we can trust.
• “The Difference”
• Full range of financial products
• Keen interest in the community
• A warm smile from someone you know.
[LOGO]
Highlights
• Founded in 1995
• Total Assets $262 Million (as of 9/30/04)
• Total Return on Stock is 162.0%
(since inception)
• EPS Growth Rate is 17.4%
(12/31/99 — 9/30/04 annualized)
• Listed on NASDAQ Small Cap (FCCO)
• Maintained “Well Capitalized” Status
[LOGO] | | Come See the Difference |
[GRAPHIC]
[GRAPHIC]
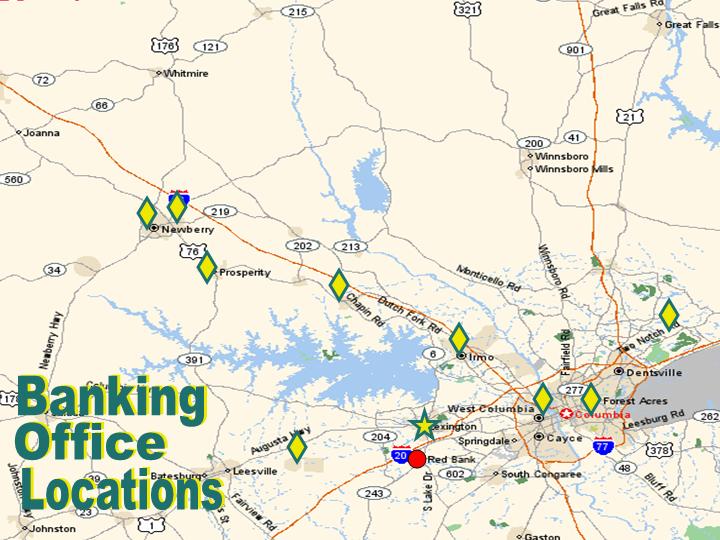
Banking Office Locations
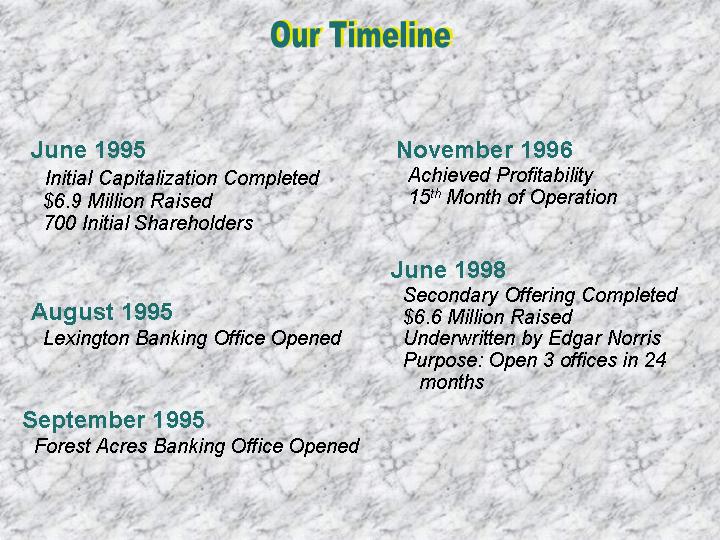
Our Timeline
June 1995
Initial Capitalization Completed
$6.9 Million Raised
700 Initial Shareholders |
|
August 1995
Lexington Banking Office Opened |
|
September 1995
Forest Acres Banking Office Opened |
|
November 1996
Achieved Profitability
15th Month of Operation |
|
June 1998
Secondary Offering Completed
$6.6 Million Raised
Underwritten by Edgar Norris Purpose: Open 3 offices in 24 months |
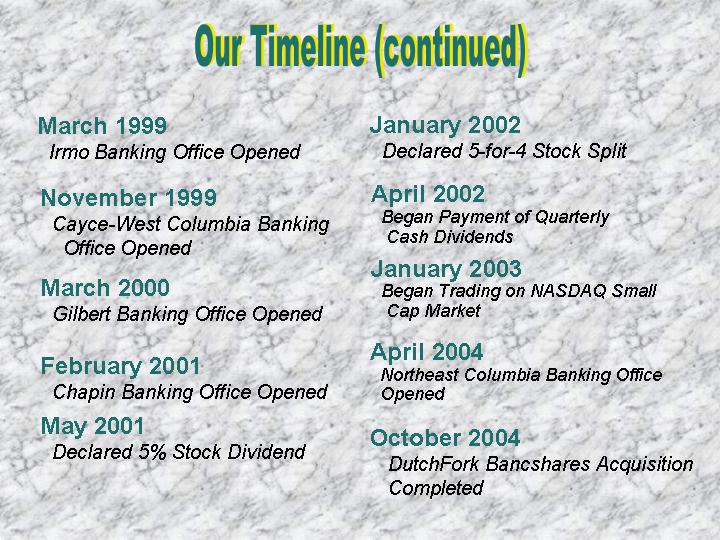
March 1999 |
Irmo Banking Office Opened |
|
November 1999 |
Cayce-West Columbia Banking Office Opened |
|
March 2000 |
Gilbert Banking Office Opened |
|
February 2001 |
Chapin Banking Office Opened |
|
May 2001 |
Declared 5% Stock Dividend |
|
January 2002 |
Declared 5-for-4 Stock Split |
|
April 2002 |
Began Payment of Quarterly Cash Dividends |
|
January 2003 |
Began Trading on NASDAQ Small Cap Market |
|
April 2004 |
Northeast Columbia Banking Office Opened |
|
October 2004 |
DutchFork Bancshares Acquisition Completed |
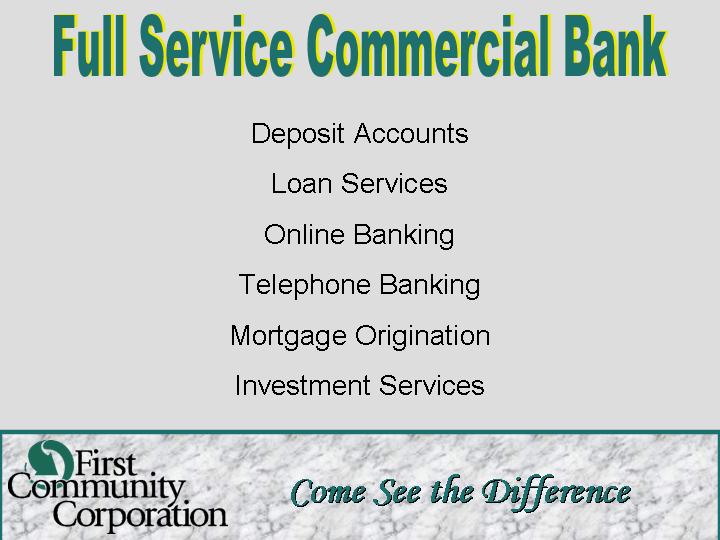
Full Service Commercial Bank
Deposit Accounts
Loan Services
Online Banking
Telephone Banking
Mortgage Origination
Investment Services
[LOGO] | | Come See the Difference |
[LOGO]
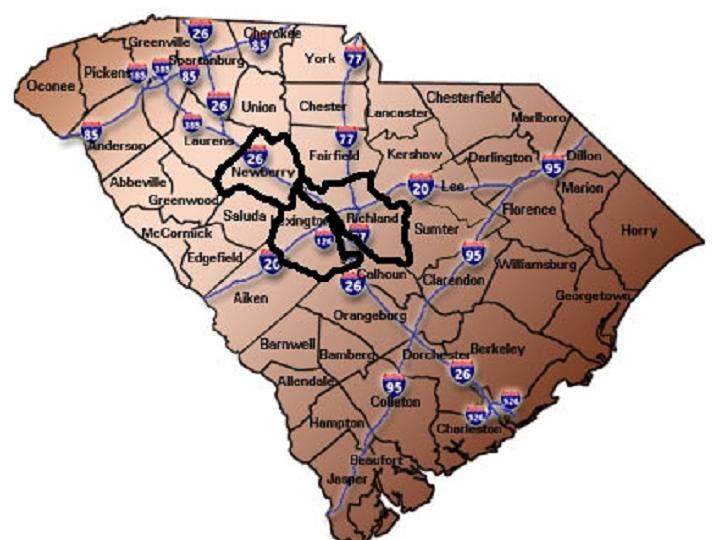
Midlands Market
Come See the Difference
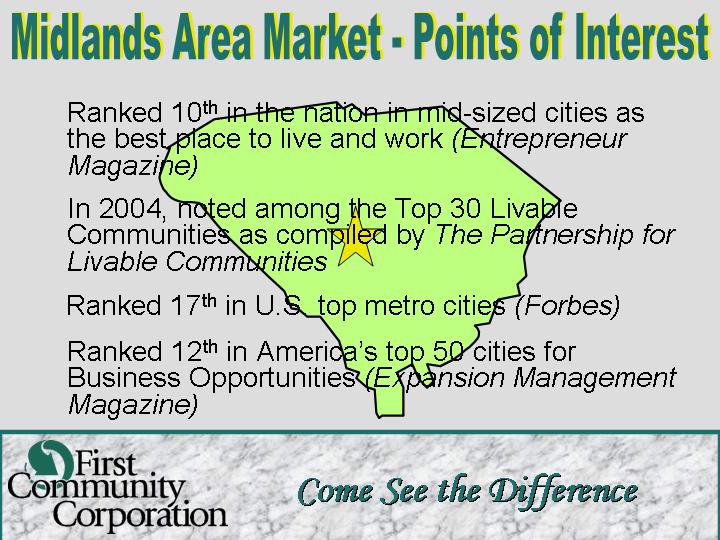
Midlands Area Market - Points of Interest
Ranked 10th in the nation in mid-sized cities as the best place to live and work (Entrepreneur Magazine)
In 2004, noted among the Top 30 Livable Communities as compiled by The Partnership for Livable Communities
Ranked 17th in U.S. top metro cities (Forbes)
Ranked 12th in America’s top 50 cities for Business Opportunities (Expansion Management Magazine)
[LOGO] | | Come See the Difference |
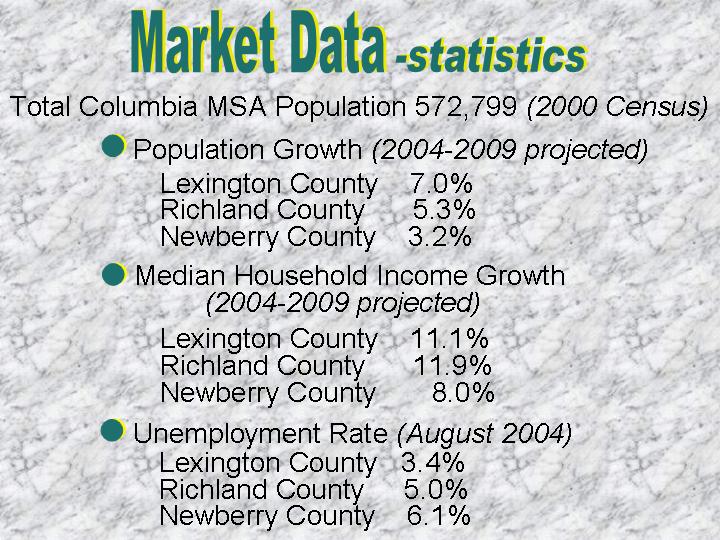
Market Data - statistics
Total Columbia MSA Population 572,799 (2000 Census)
| • | Population Growth (2004-2009 projected) |
| | | Lexington County | 7.0% | |
| | | Richland County | 5.3% | |
| | | Newberry County | 3.2% | |
| | | | | |
| • | Median Household Income Growth | | |
| | | (2004-2009 projected) | | |
| | | Lexington County | 11.1% | |
| | | Richland County | 11.9% | |
| | | Newberry County | 8.0% | |
| | | | | |
| • | Unemployment Rate (August 2004) | | |
| | | Lexington County | 3.4% | |
| | | Richland County | 5.0% | |
| | | Newberry County | 6.1% | |
| | | | | | |
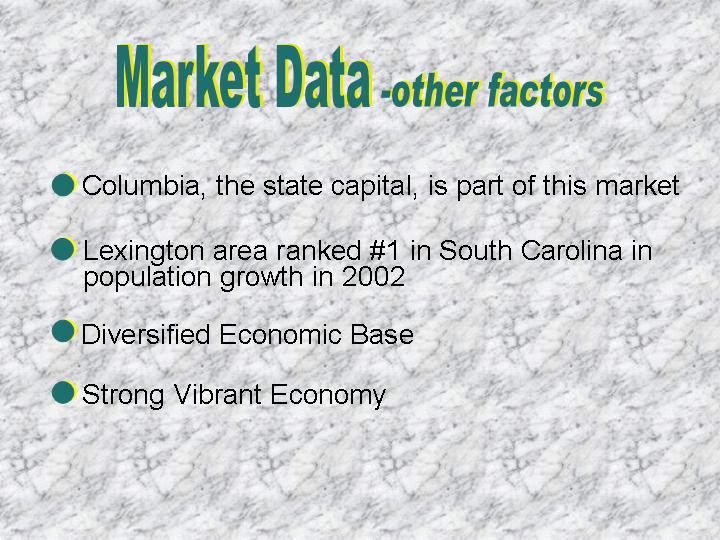
Market Data - other factors
• Columbia, the state capital, is part of this market
• Lexington area ranked #1 in South Carolina in population growth in 2002
• Diversified Economic Base
• Strong Vibrant Economy
Midlands Banking Market | |
(Richland and Lexington Countries) | |
[CHART]
[LOGO] | Total Market Deposits are $7.8 Billion with $1.0 Billion in Growth (14.7%) Since June of ‘02 |
| |
| *percentage of market share |
[LOGO]
Financial Highlights
[LOGO] | Total Assets (in thousands) | |
[CHART]
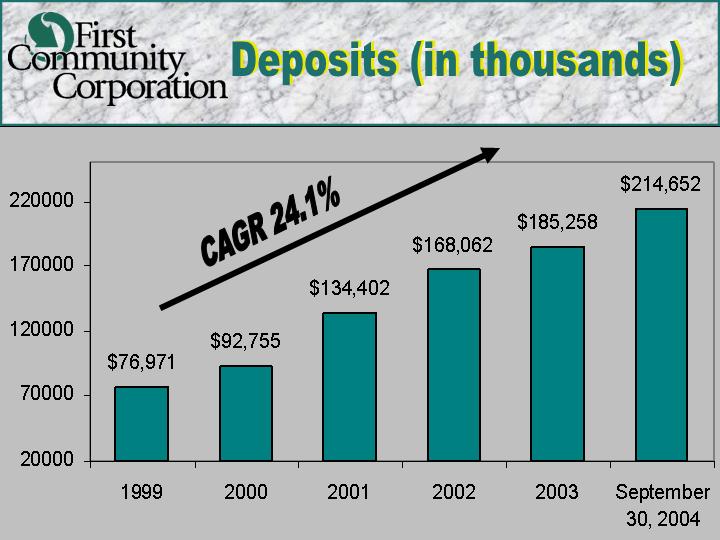
[LOGO] | Deposits (in thousands) | |
[CHART]
[LOGO] | Funding Mix 9/30/04 | |
[CHART]
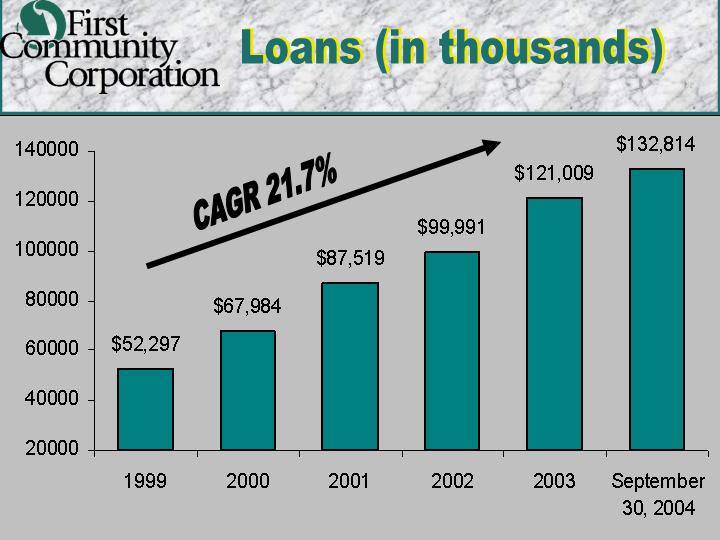
[LOGO] | Loans (in thousands) | |
[CHART]
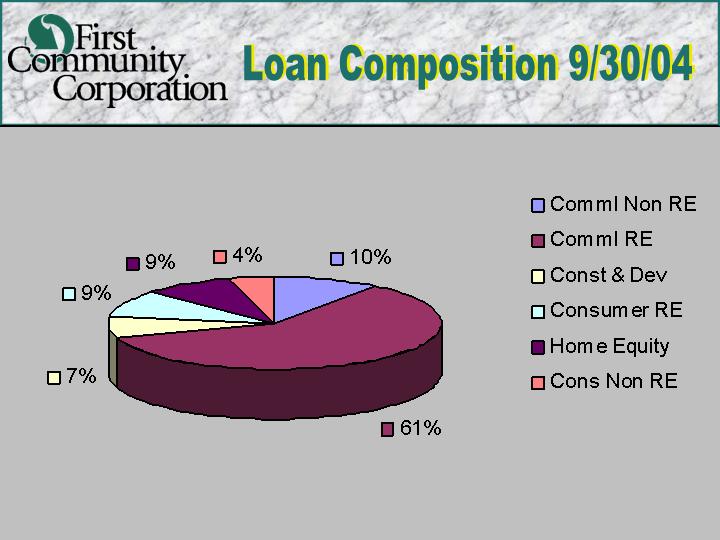
[LOGO] | Loan Composition 9/30/04 | |
[CHART]
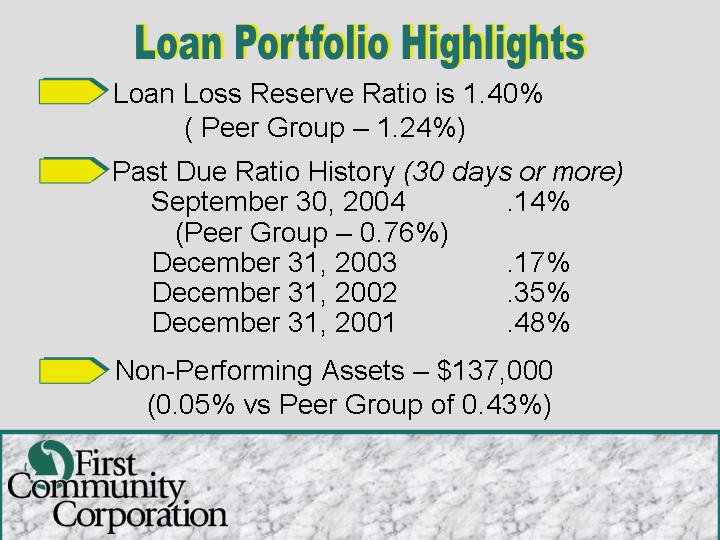
Loan Portfolio Highlights
• | Loan Loss Reserve Ratio is 1.40% |
| | | (Peer Group – 1.24%) | | |
| |
• | Past Due Ratio History (30 days or more) |
| | September 30, 2004 | | |
| | | (Peer Group – 0.76%) | .14% | |
| | December 31, 2003 | .17% | |
| | December 31, 2002 | .35% | |
| | December 31, 2001 | .48% | |
| |
• | Non-Performing Assets – $137,000 |
| (0.05% vs Peer Group of 0.43%) |
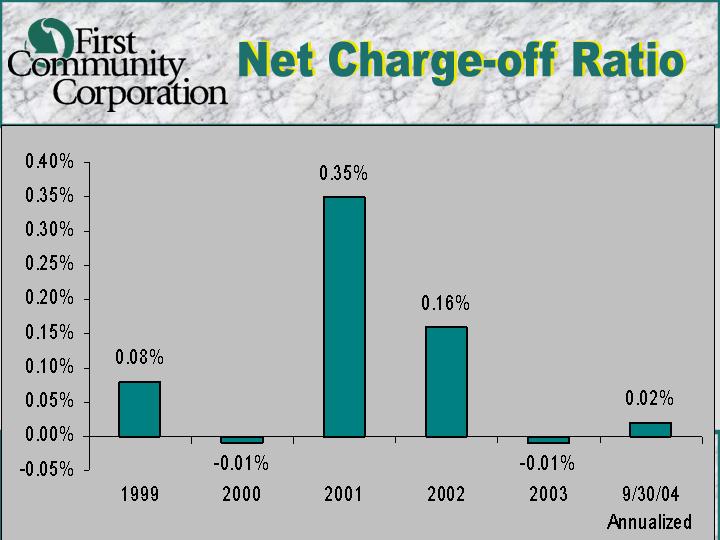
[LOGO] | Net Charge-off Ratio | |
[CHART]
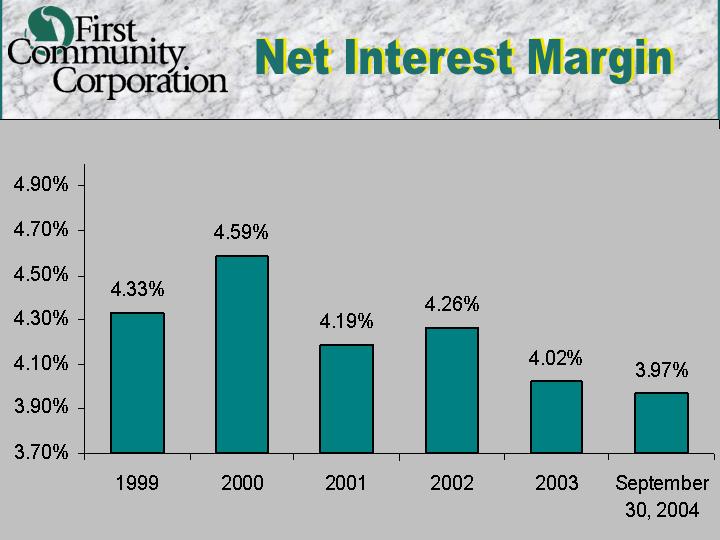
[LOGO] | Net Interest Margin | |
[CHART]
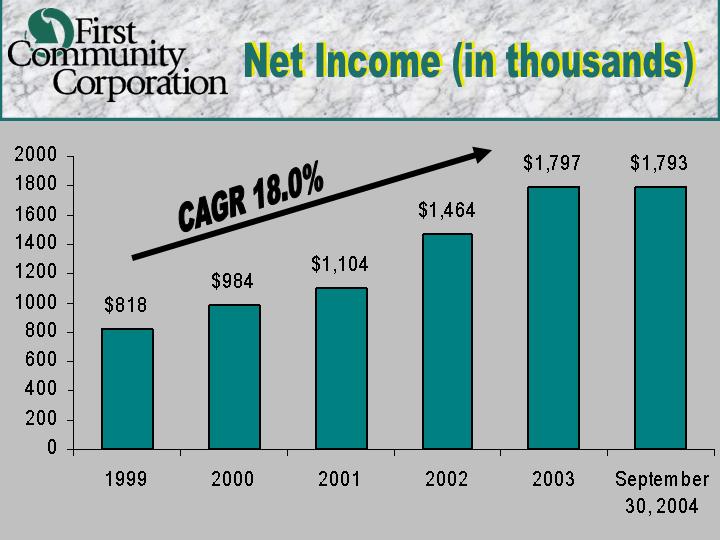
[LOGO] | Net Income (in thousands) | |
[CHART]
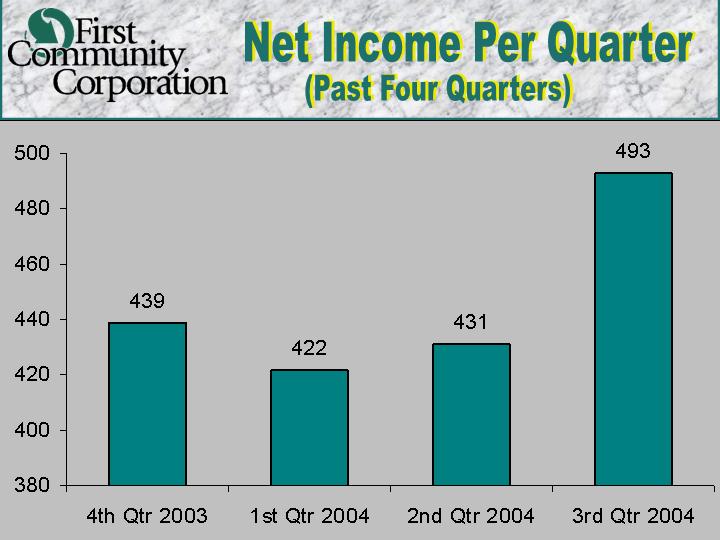
[LOGO] | Net Income Per Quarter
(Past Four Quarters) | |
[CHART]
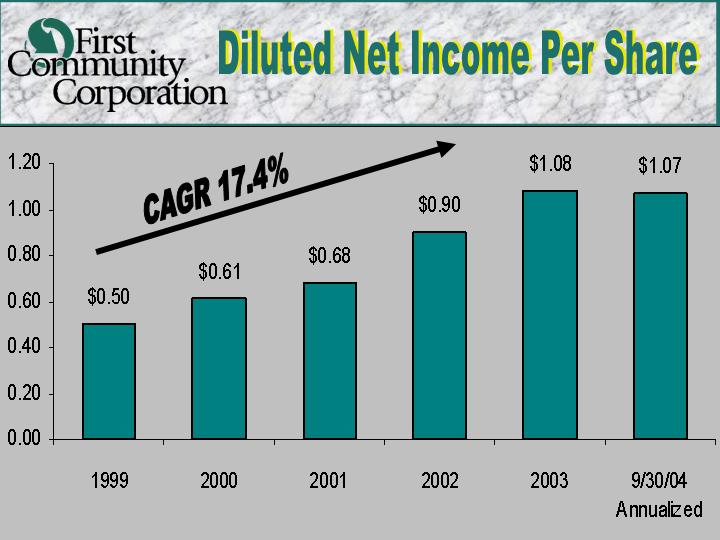
[LOGO] | Diluted Net Income Per Share | |
[CHART]
[CHART]
[CHART]
Stock Information
Come See the Difference
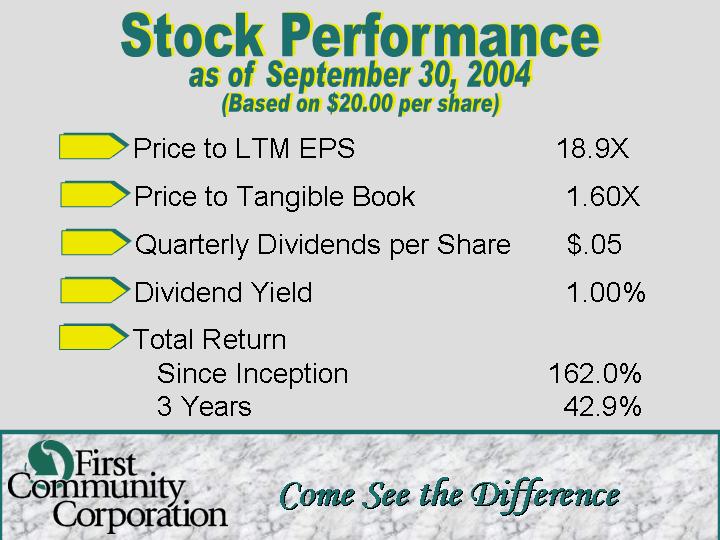
Stock Performance
as of September 30, 2004
(Based on $20.00 per share)
• | Price to LTM EPS | | 18.9 | X |
| | | | |
• | Price to Tangible Book | | 1.60 | X |
| | | | |
• | Quarterly Dividends per Share | | $ | .05 | |
| | | | |
• | Dividend Yield | | 1.00 | % |
| | | | |
• | Total Return | | | |
| Since Inception | | 162.0 | % |
| 3 Years | | 42.9 | % |
| | | | | |
[LOGO] | | Come See the Difference |
[CHART]
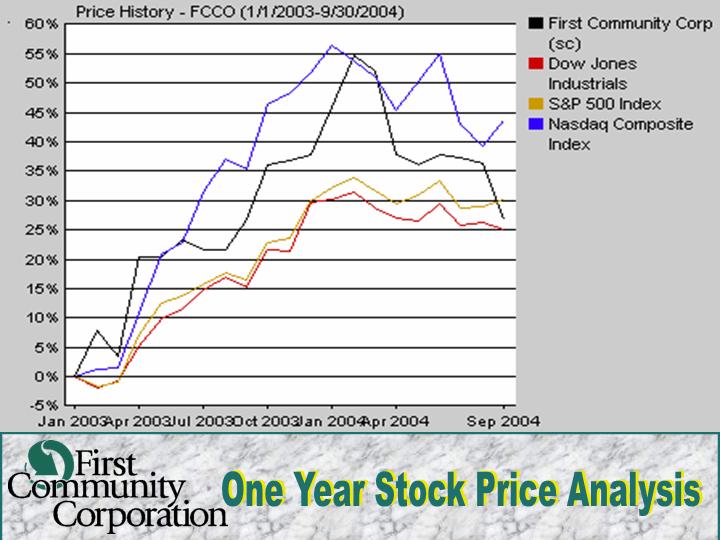
[LOGO] | One Year Stock Price Analysis | |
[LOGO]
DutchFork Bancshares
(Newberry Federal Savings Bank)
Come See the Difference
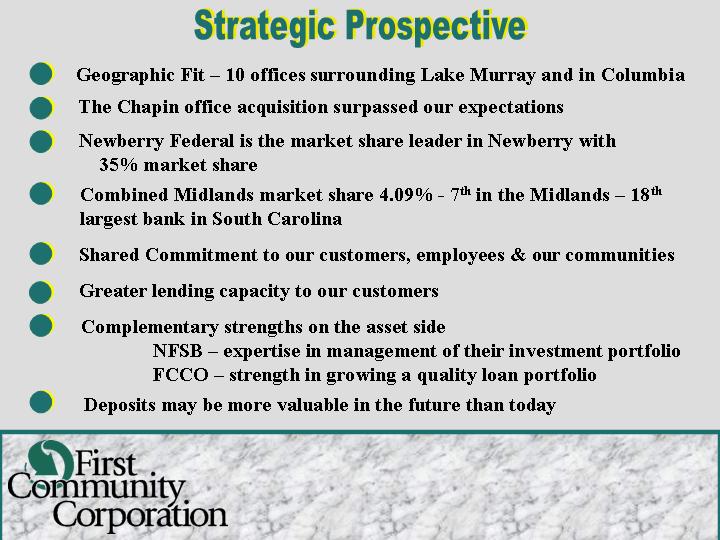
Strategic Prospective
• Geographic Fit – 10 offices surrounding Lake Murray and in Columbia
• The Chapin office acquisition surpassed our expectations
• Newberry Federal is the market share leader in Newberry with 35% market share
• Combined Midlands market share 4.09% - 7th in the Midlands – 18th largest bank in South Carolina
• Shared Commitment to our customers, employees & our communities
• Greater lending capacity to our customers
• Complementary strengths on the asset side
NFSB – expertise in management of their investment portfolio
FCCO – strength in growing a quality loan portfolio
• Deposits may be more valuable in the future than today
[LOGO]
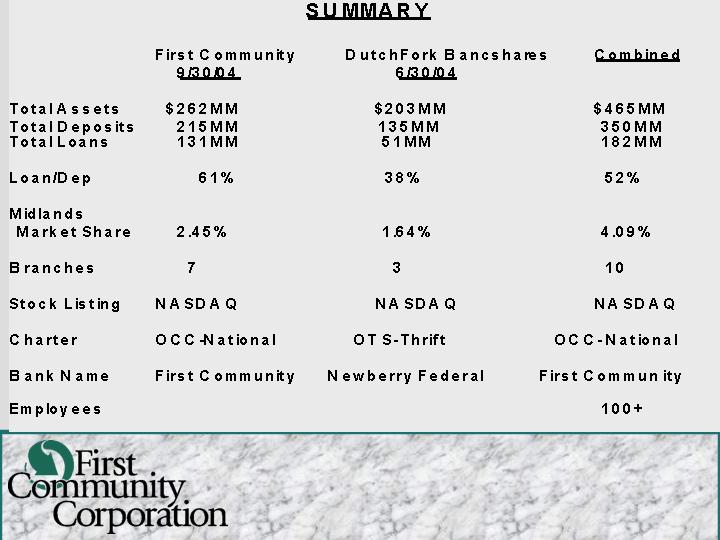
SUMMARY
| | First Community
9/30/04 | | DutchFork Bancshares
6/30/04 | | Combined | |
| | | | | | | |
Total Assets | | $ | 262 | MM | $ | 203 | MM | $ | 465 | MM |
Total Deposits | | 215 | MM | 135 | MM | 350 | MM |
Total Loans | | 131 | MM | 51 | MM | 182 | MM |
| | | | | | | |
Loan/Dep | | 61 | % | 38 | % | 52 | % |
| | | | | | | |
Midlands Market Share | | 2.45 | % | 1.64 | % | 4.09 | % |
| | | | | | | |
Branches | | 7 | | 3 | | 10 | |
| | | | | | | |
Stock Listing | | NASDAQ | | NASDAQ | | NASDAQ | |
| | | | | | | |
Charter | | OCC-National | | OTS-Thrift | | OCC-National | |
| | | | | | | |
Bank Name | | First Community | | Newberry Federal | | First Community | |
| | | | | | | |
Employees | | | | | | 100 | + |
| | | | | | | | | | |
[LOGO]
Other | |
| |
Tommy Johnson | Newberry Federal CEO is now First Community EVP and Vice Chairman of the Board |
| |
Steve Sligh | Newberry Fed. CFO is now First Community SVP and on the Board. Steve’s primary responsibility is management of the investment portfolio |
[LOGO]
• Accretive to our earnings in first 12 months (GAAP and Cash)
• With assets over $460 million and a market cap. of nearly $60 million, we will capture increased analyst coverage and market maker interest
• 6th Largest publicly traded BHC in SC
• Increased Float and Liquidity
• De-Novo branching dilution is less material
• Size where more acquisitions are possible
[LOGO]
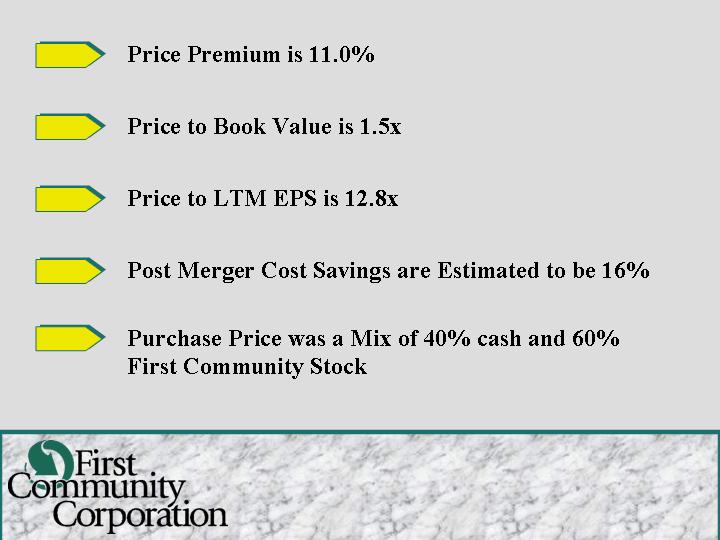
• Price Premium is 11.0%
• Price to Book Value is 1.5x
• Price to LTM EPS is 12.8x
• Post Merger Cost Savings are Estimated to be 16%
• Purchase Price was a Mix of 40% cash and 60% First Community Stock
[LOGO]
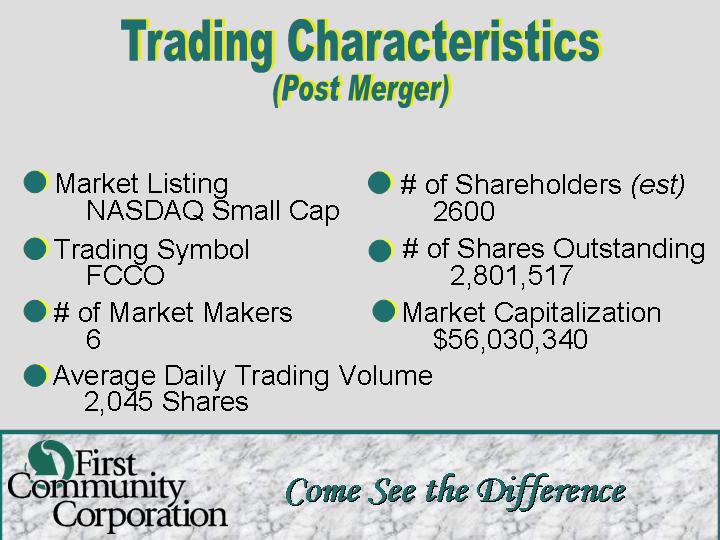
Trading Characteristics
(Post Merger)
• Market Listing NASDAQ Small Cap
• Trading Symbol FCCO
• # of Market Makers 6
• Average Daily Trading Volume 2,045 Shares
• # of Shareholders (est) 2600
• # of Shares Outstanding 2,801,517
• Market Capitalization $56,030,340
[LOGO] | | Come See the Difference |
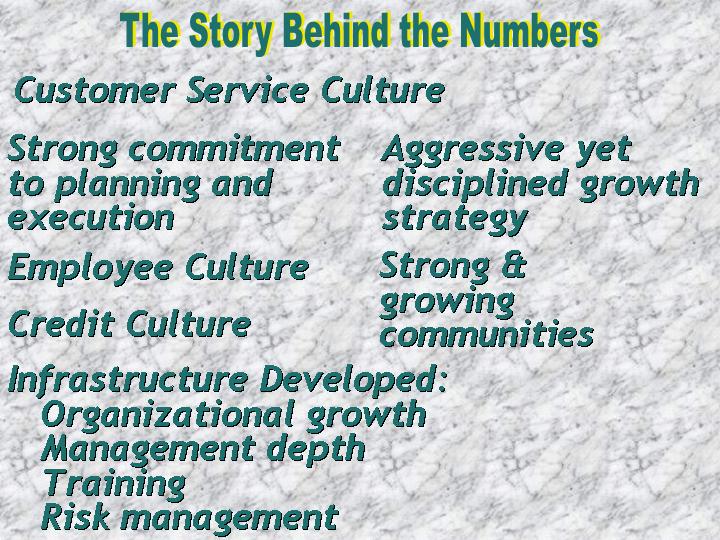
The Story Behind the Numbers
Customer Service Culture
Strong commitment to planning and execution
Employee Culture
Credit Culture
Aggressive yet disciplined growth strategy
Strong & growing communities
Infrastructure Developed:
Organizational growth
Management depth
Training
Risk management
SAFE HARBOR STATEMENT – INCLUDING ALL DOCUMENTS INCORPORATED HEREIN BY REFERENCE, CONTAINS FORWARD-LOOKING STATEMENTS. ADDITIONAL WRITTEN OR ORAL FORWARD-LOOKING STATEMENTS MAY BE MADE BY THE COMPANY FROM TIME TO TIME IN FILINGS WITH THE SECURITIES & EXCHANGE COMMISSION OR OTHERWISE. THE WORDS “BELIEVE,” “EXPECT,” “SEEK,” AND “INTEND” AND SIMILAR EXPRESSIONS IDENTIFY FORWARD-LOOKING STATEMENTS, WHICH SPEAK ONLY AS OF THE DATE THE STATEMENT IS MADE. SUCH FORWARD-LOOKING STATEMENTS ARE WITHIN THE MEANING OF THAT TERM IN SECTION 27A OF THE SECURITIES ACT OF 1933, AS AMENDED, & SECTION 21E OF THE SECURITIES EXCHANGE ACT OF 1934, AS AMENDED. SUCH STATEMENTS MAY INCLUDE, BUT ARE NOT LIMITED TO, PROJECTIONS OF INCOME OR LOSS, EXPENDITURES, ACQUISITIONS, PLANS FOR FUTURE OPERATIONS, FINANCING NEEDS OR PLANS RELATING TO SERVICES OF THE COMPANY, AS WELL AS ASSUMPTIONS RELATING TO THE FOREGOING. FORWARD-LOOKING STATEMENTS ARE INHERENTLY SUBJECT TO RISKS AND UNCERTAINTIES, SOME OF WHICH CANNOT BE PREDICTED OR QUANTIFIED. FUTURE EVENTS AND ACTUAL RESULTS COULD DIFFER MATERIALLY FROM THOSE SET FORTH IN, CONTEMPLATED BY OR UNDERLYING THE FORWARD-LOOKING STATEMENTS. A DISCUSSION OF FACTORS THAT COULD CAUSE ACTUAL RESULTS TO DIFFER MATERIALLY FROM THOSE EXPRESSED IN FORWARD-LOOKING STATEMENTS IS INCLUDED IN FILINGS WITH THE SECURITIES AND EXCHANGE COMMISSION.
[LOGO] | | Come See the Difference |
[LOGO]
Come See the Difference