Mike Crapps President and CEO 2015 US BANK CONFERENCE September 9, 2015 Joe Sawyer EVP and CFO
2 OUTLINE I. First Community 3 II. 2014 – Transformative Year 6 IV. Risk Management 25 • Commercial and Retail Banking 12 • Residential Mortgage Banking 19 • Financial Planning and Investment Advisory Services 22 III. Line of Business Review 11 V. Results 28 VI. Capital & Shareholder Return 32 VII. Summary 36 • Credit Quality 26 • Compliance / BSA 26
3 FIRST COMMUNITY
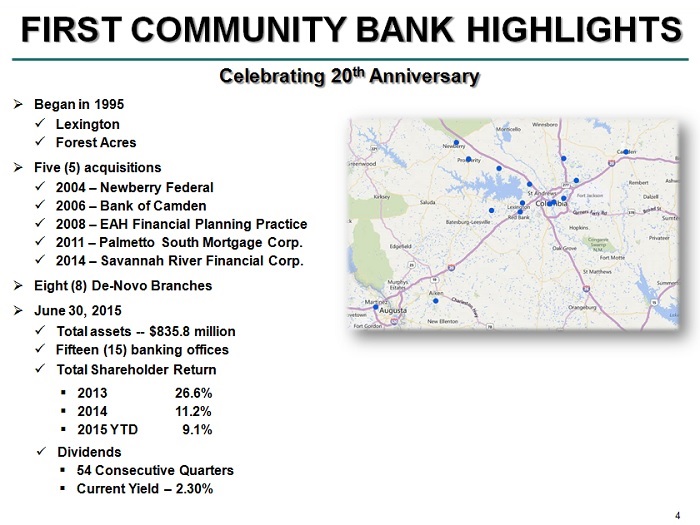
4 FIRST COMMUNITY BANK HIGHLIGHTS » Began in 1995 x Lexington x Forest Acres » Five (5) acquisitions x 2004 – Newberry Federal x 2006 – Bank of Camden x 2008 – EAH Financial Planning Practice x 2011 – Palmetto South Mortgage Corp. x 2014 – Savannah River Financial Corp. » Eight (8) De - Novo Branches » June 30, 2015 x Total assets -- $835.8 million x Fifteen (15) banking offices x Total Shareholder Return ▪ 2013 26.6% ▪ 2014 11.2% ▪ 2015 YTD 9.1% x Dividends ▪ 54 Consecutive Quarters ▪ Current Yield – 2.30% Celebrating 20 th Anniversary
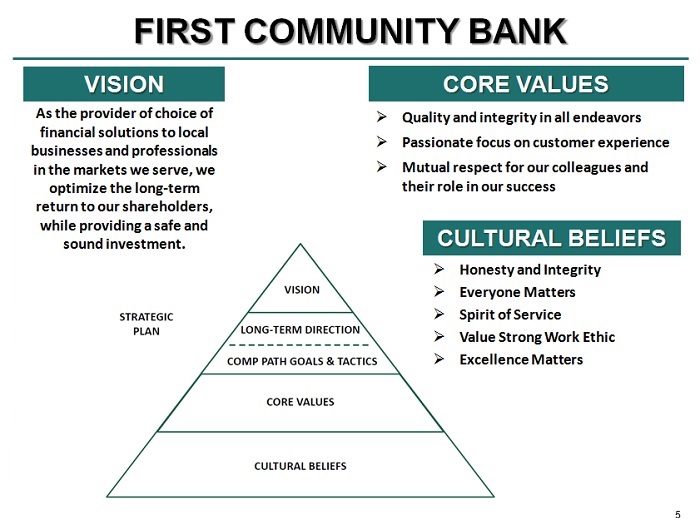
5 As the provider of choice of financial solutions to local businesses and professionals in the markets we serve, we optimize the long - term return to our shareholders, while providing a safe and sound investment. VISION » Quality and integrity in all endeavors » Passionate focus on customer experience » Mutual respect for our colleagues and their role in our success CORE VALUES FIRST COMMUNITY BANK » Honesty and Integrity » Everyone Matters » Spirit of Service » Value Strong Work Ethic » Excellence Matters CULTURAL BELIEFS

6 2014 TRANSFORMATIVE YEAR
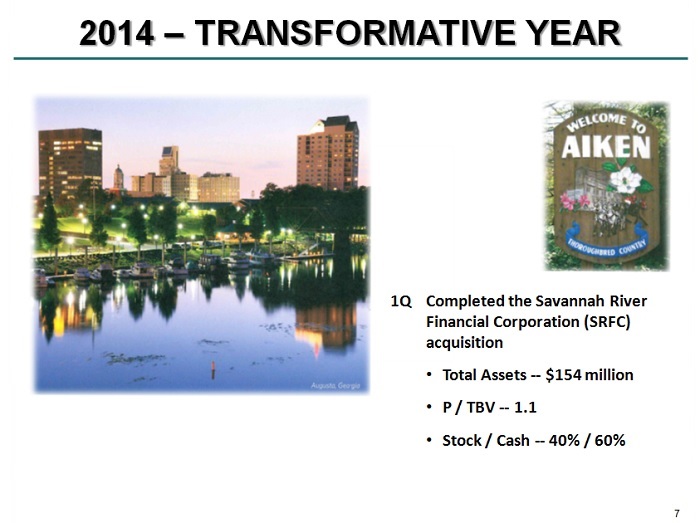
7 2014 – TRANSFORMATIVE YEAR 1Q Completed the Savannah River Financial Corporation (SRFC) acquisition • Total Assets -- $154 million • P / TBV -- 1.1 • Stock / Cash -- 40% / 60%
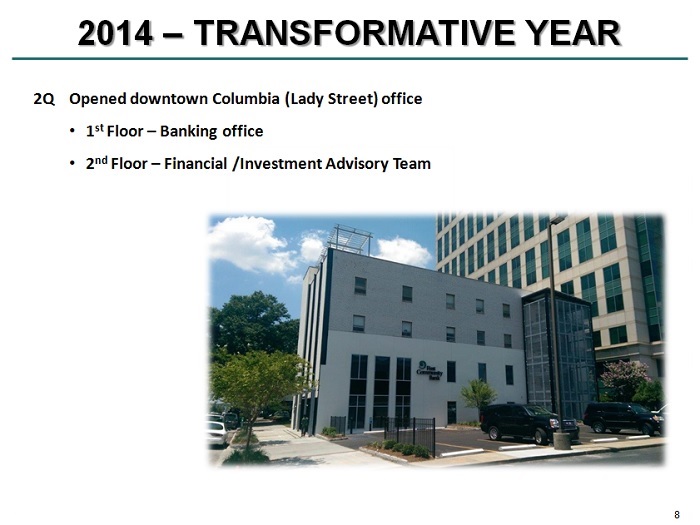
8 2014 – TRANSFORMATIVE YEAR 2Q Opened downtown Columbia (Lady Street) office • 1 st Floor – Banking office • 2 nd Floor – Financial /Investment Advisory Team
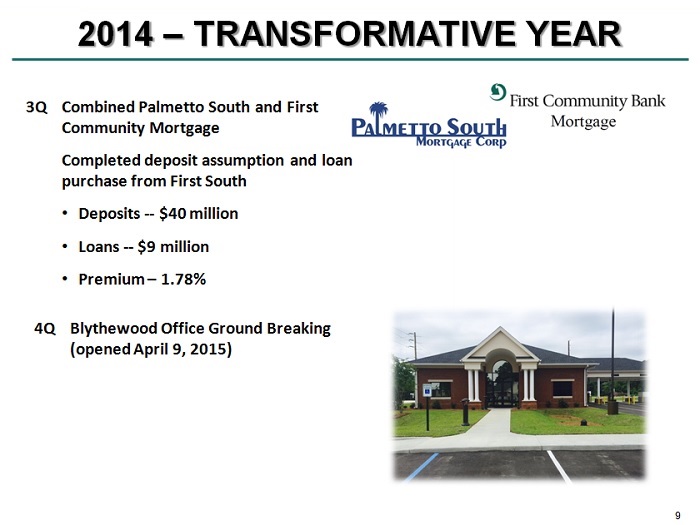
9 3Q Combined Palmetto South and First Community Mortgage Completed deposit assumption and loan purchase from First South • Deposits -- $40 million • Loans -- $9 million • Premium – 1.78% 2014 – TRANSFORMATIVE YEAR 4Q Blythewood Office Ground Breaking (opened April 9, 2015)
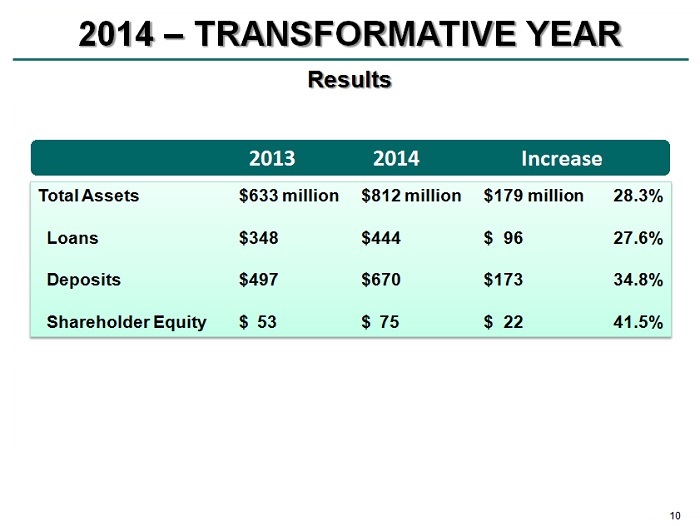
10 Results 2014 – TRANSFORMATIVE YEAR Total Assets $633 million $812 million $179 million 28.3% Loans $348 $444 $ 96 27.6% Deposits $497 $670 $173 34.8% Shareholder Equity $ 53 $ 75 $ 22 41.5% 2013 2014 Increase

11 LINE OF BUSINESS REVIEW
12 LINE OF BUSINESS REVIEW » Commercial and Retail Banking » Residential Mortgage Banking » Financial Planning & Investment Advisory Services
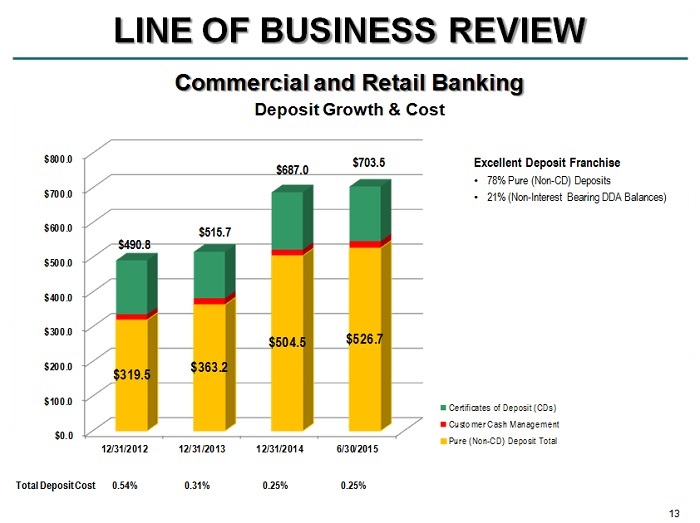
13 LINE OF BUSINESS REVIEW Commercial and Retail Banking Deposit Growth & Cost Total Deposit Cost 0.54% 0.31% 0.25% 0.25% $0.0 $100.0 $200.0 $300.0 $400.0 $500.0 $600.0 $700.0 $800.0 12/31/2012 12/31/2013 12/31/2014 6/30/2015 $319.5 $363.2 $504.5 $526.7 Certificates of Deposit (CDs) Customer Cash Management Pure (Non-CD) Deposit Total $490.8 $515.7 $687.0 $703.5 Excellent Deposit Franchise • 78% Pure (Non - CD) Deposits • 21% (Non - Interest Bearing DDA Balances)
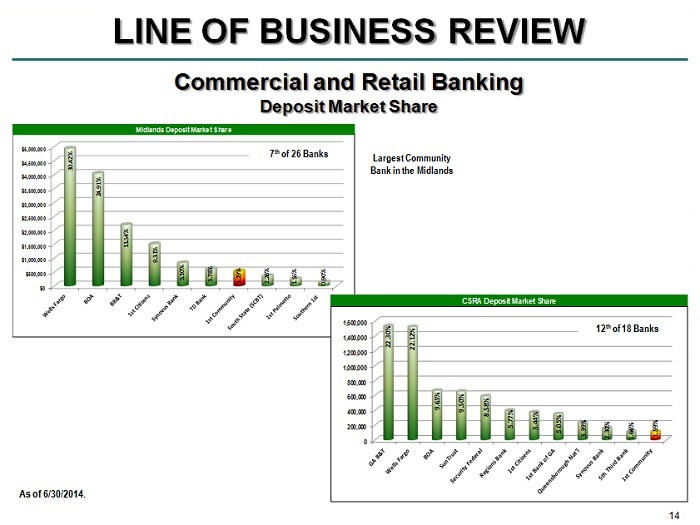
14 LINE OF BUSINESS REVIEW Deposit Market Share $0 $500,000 $1,000,000 $1,500,000 $2,000,000 $2,500,000 $3,000,000 $3,500,000 $4,000,000 $4,500,000 $5,000,000 30.42% 24.91% Midlands Deposit Market Share 13.54% 9.31% 5.10% 3.78% 3.29% 2.26% 1.55% 0.90% CSRA Deposit Market Share 0 200,000 400,000 600,000 800,000 1,000,000 1,200,000 1,400,000 1,600,000 22.30% 22.12% 9.65% 9.50% 5.77% 5.44% 5.05% 3.39% 2.30% 1.59% 1.66% 8.58% 7 th of 26 Banks Commercial and Retail Banking Largest Community Bank in the Midlands 12 th of 18 Banks As of 6/30/2014.
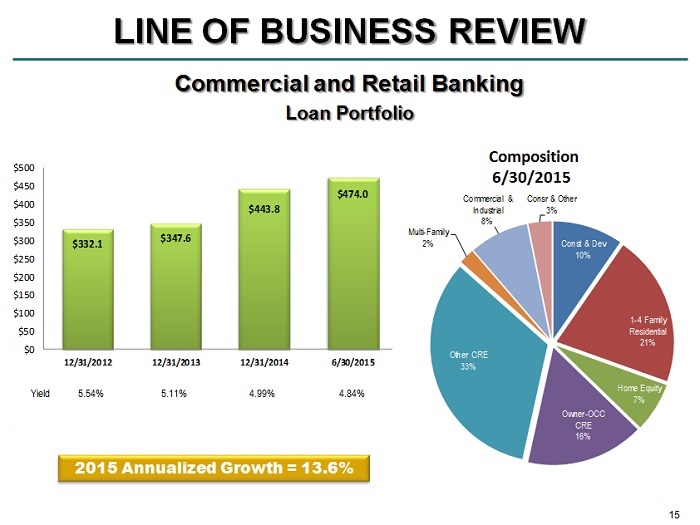
15 LINE OF BUSINESS REVIEW Commercial and Retail Banking Composition 6/30/2015 Yield 5.54% 5.11% 4.99% 4.84% Loan Portfolio 2015 Annualized Growth = 13.6% $332.1 $347.6 $443.8 $474.0 $0 $50 $100 $150 $200 $250 $300 $350 $400 $450 $500 12/31/2012 12/31/2013 12/31/2014 6/30/2015 Const & Dev 10% 1 - 4 Family Residential 21% Home Equity 7% Owner - OCC CRE 16% Other CRE 33% Multi - Family 2% Commercial & Industrial 8% Consr & Other 3%
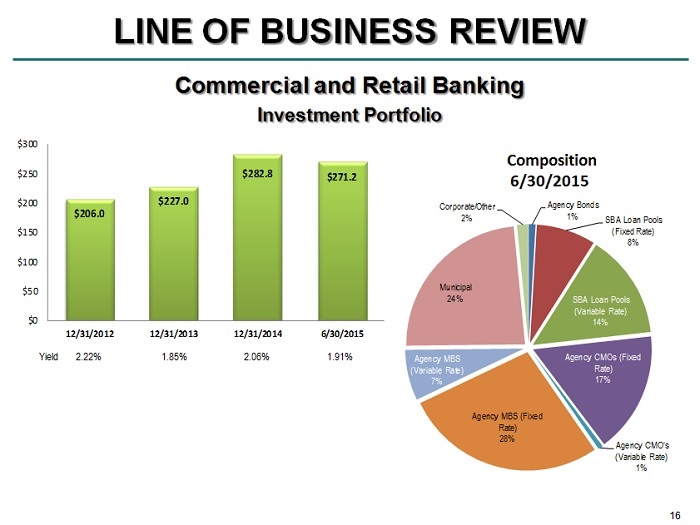
16 Agency Bonds 1% SBA Loan Pools (Fixed Rate) 8% SBA Loan Pools (Variable Rate) 14% Agency CMOs (Fixed Rate) 17% Agency CMO's (Variable Rate) 1% Agency MBS (Fixed Rate) 28% Agency MBS (Variable Rate) 7% Municipal 24% Corporate/Other 2% LINE OF BUSINESS REVIEW Yield 2.22% 1.85% 2.06% 1.91% Composition 6/30/2015 Commercial and Retail Banking Investment Portfolio $206.0 $227.0 $282.8 $271.2 $0 $50 $100 $150 $200 $250 $300 12/31/2012 12/31/2013 12/31/2014 6/30/2015
17 LINE OF BUSINESS REVIEW Commercial and Retail Banking Strategy » Focus on re - mix of the asset side of the balance sheet » Leverage our low cost deposit base and excess liquidity to more aggressively price loan opportunities » 2015 Marketing Plan has a more singular focus » Recruiting a high level of talent » Loan production office - Greenville » Future M&A x Actively recruiting, but also patient
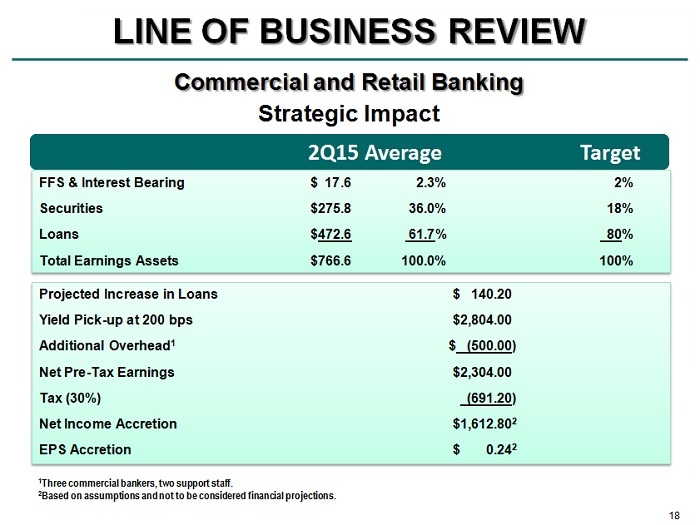
18 LINE OF BUSINESS REVIEW Commercial and Retail Banking Strategic Impact FFS & Interest Bearing $ 17.6 2.3% 2% Securities $275.8 36.0% 18% Loans $ 472.6 61.7 % 80 % Total Earnings Assets $766.6 100.0% 100% 2Q15 Average Target Projected Increase in Loans $ 140.20 Yield Pick - up at 200 bps $2,804.00 Additional Overhead 1 $ (500.00 ) Net Pre - Tax Earnings $2,304.00 Tax (30%) (691.20 ) Net Income Accretion $1,612.80 2 EPS Accretion $ 0.24 2 1 Three commercial bankers, two support staff. 2 Based on assumptions and not to be considered financial projections.
19 LINE OF BUSINESS REVIEW » Commercial and Retail Banking » Residential Mortgage Banking » Financial Planning & Investment Advisory Services
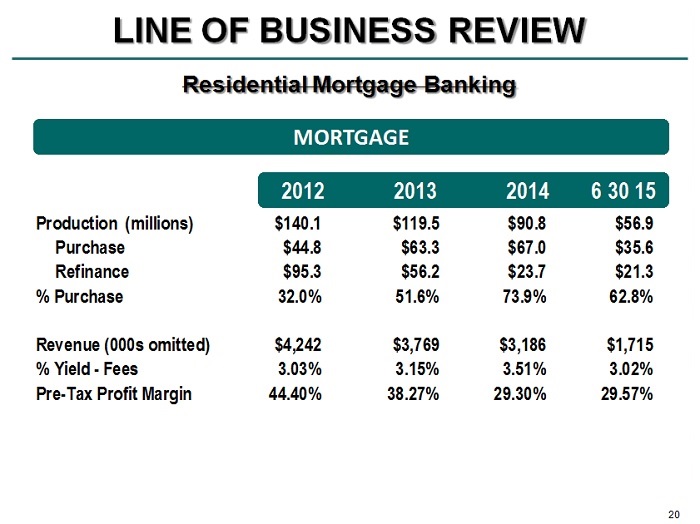
20 Residential Mortgage Banking LINE OF BUSINESS REVIEW MORTGAGE 2012 2013 2014 6 30 15 Production (millions) $140.1 $119.5 $90.8 $56.9 Purchase $44.8 $63.3 $67.0 $35.6 Refinance $95.3 $56.2 $23.7 $21.3 % Purchase 32.0% 51.6% 73.9% 62.8% Revenue (000s omitted) $4,242 $3,769 $3,186 $1,715 % Yield - Fees 3.03% 3.15% 3.51% 3.02% Pre-Tax Profit Margin 44.40% 38.27% 29.30% 29.57%
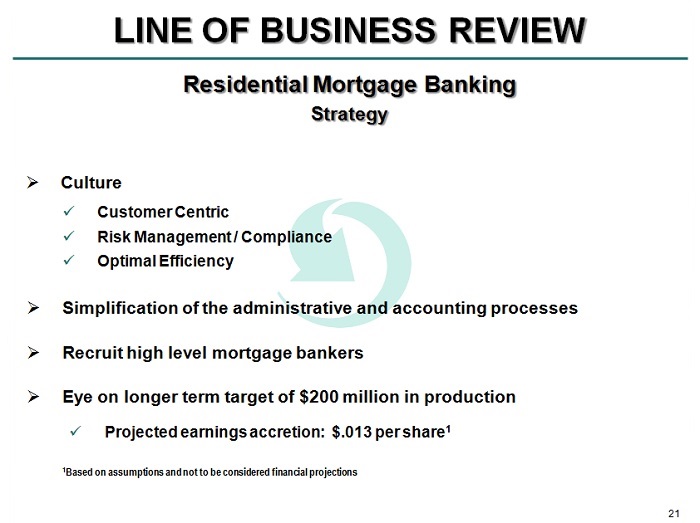
21 LINE OF BUSINESS REVIEW Strategy » Culture » Simplification of the administrative and accounting processes » Recruit high level mortgage bankers » Eye on longer term target of $200 million in production Residential Mortgage Banking x Customer Centric x Risk Management / Compliance x Optimal Efficiency x Projected earnings accretion: $.013 per share 1 1 Based on assumptions and not to be considered financial projections
22 LINE OF BUSINESS REVIEW » Commercial and Retail Banking » Residential Mortgage Banking » Financial Planning & Investment Advisory Services
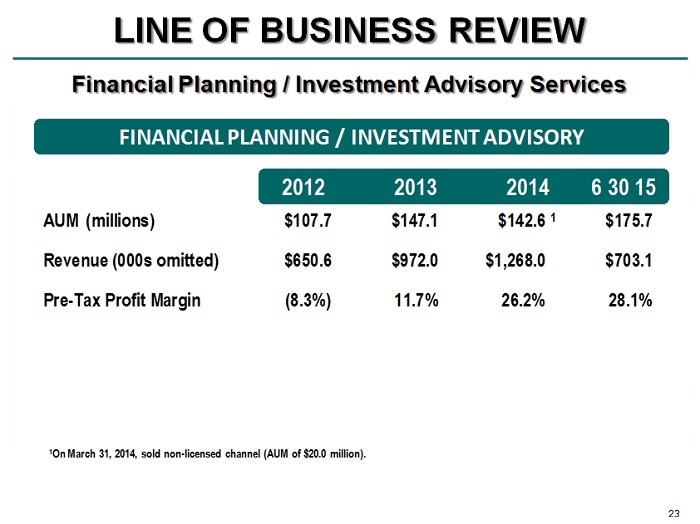
23 Financial Planning / Investment Advisory Services LINE OF BUSINESS REVIEW 1 On March 31, 2014, sold non - licensed channel (AUM of $20.0 million). FINANCIAL PLANNING / INVESTMENT ADVISORY AUM (millions) $107.7 $147.1 $142.6 1 $175.7 Revenue (000s omitted) $650.6 $972.0 $1,268.0 $703.1 Pre-Tax Profit Margin (8.3%) 11.7% 26.2% 28.1% 2012 2013 2014 6 30 15
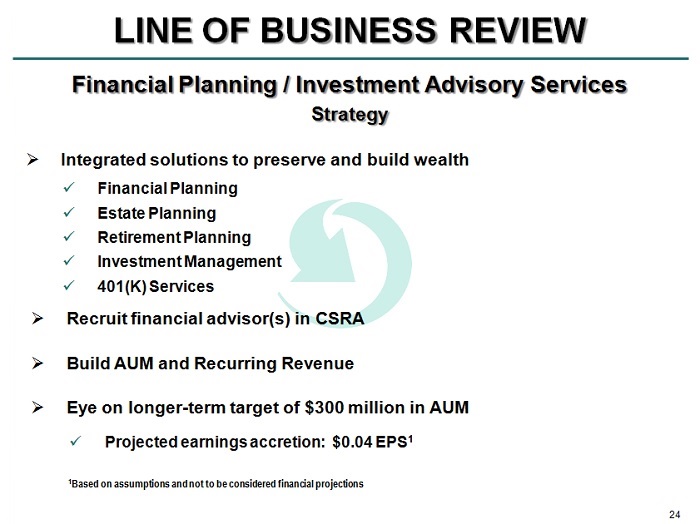
24 LINE OF BUSINESS REVIEW Strategy » Integrated solutions to preserve and build wealth » Recruit financial advisor(s) in CSRA » Build AUM and Recurring Revenue » Eye on longer - term target of $300 million in AUM x Financial Planning x Estate Planning x Retirement Planning x Investment Management x 401(K) Services Financial Planning / Investment Advisory Services x Projected earnings accretion: $0.04 EPS 1 1 Based on assumptions and not to be considered financial projections
25 RISK MANAGEMENT

26 RISK MANAGEMENT Credit Quality 1 Includes provision expense, OREO expenses, write - downs, and gain/loss on sale of assets. Credit Quality 12/31/2012 12/31/2013 12/31/2014 6/30/2015 NPAs 1.46% 1.39% 1.18% 0.94% Charge-Offs 0.17% 0.27% 0.28% 0.28% Classified Loan Ratio 32.68% 20.30% 20.28% 15.94% Credit Costs 1 $1.5 MM $1.3 MM $1.5 MM $1.1 MM

27 Compliance / BSA » Compliance / BSA » Compliance and BSA Staff Cross - Training » Developing an Enterprise Risk Model » Investing in additional cyber security fraud protection x BSA Consent Order RISK MANAGEMENT • Background • Status
28 RESULTS
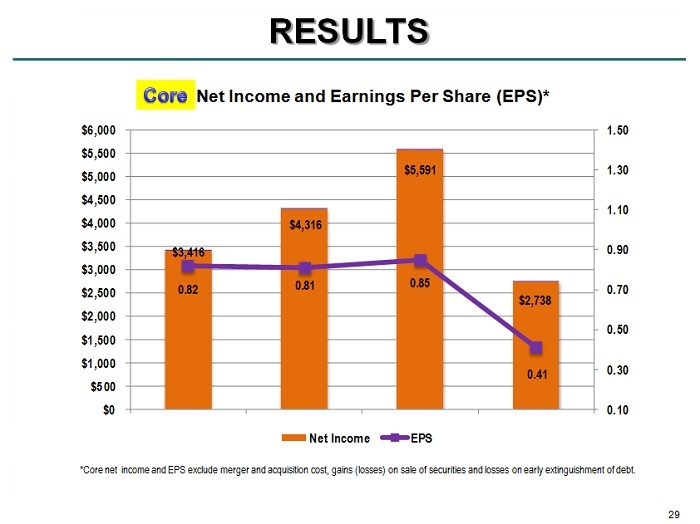
29 RESULTS *Core net income and EPS exclude merger and acquisition cost, gains (losses) on sale of securities and losses on early extinguishment o f d ebt. Net Income and Earnings Per Share (EPS)* $3,416 $4,316 $5,591 $2,738 0.82 0.81 0.85 0.41 0.10 0.30 0.50 0.70 0.90 1.10 1.30 1.50 $0 $500 $1,000 $1,500 $2,000 $2,500 $3,000 $3,500 $4,000 $4,500 $5,000 $5,500 $6,000 Net Income EPS
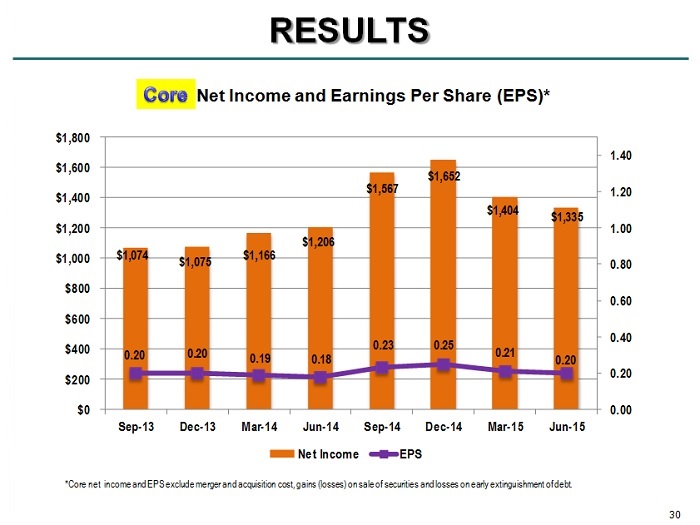
30 *Core net income and EPS exclude merger and acquisition cost, gains (losses) on sale of securities and losses on early extinguishment o f d ebt. RESULTS Net Income and Earnings Per Share (EPS)* $1,074 $1,075 $1,166 $1,206 $1,567 $1,652 $1,404 $1,335 0.20 0.20 0.19 0.18 0.23 0.25 0.21 0.20 0.00 0.20 0.40 0.60 0.80 1.00 1.20 1.40 $0 $200 $400 $600 $800 $1,000 $1,200 $1,400 $1,600 $1,800 Sep-13 Dec-13 Mar-14 Jun-14 Sep-14 Dec-14 Mar-15 Jun-15 Net Income EPS
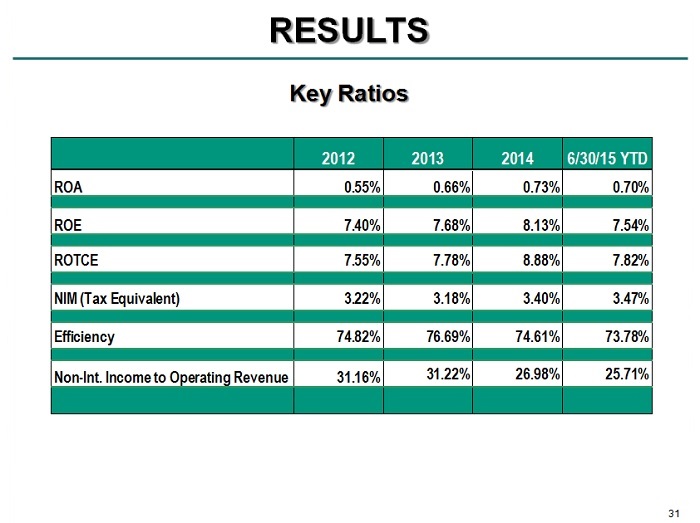
31 Key Ratios RESULTS 2012 2013 2014 6/30/15 YTD ROA 0.55% 0.66% 0.73% 0.70% ROE 7.40% 7.68% 8.13% 7.54% ROTCE 7.55% 7.78% 8.88% 7.82% NIM (Tax Equivalent) 3.22% 3.18% 3.40% 3.47% Efficiency 74.82% 76.69% 74.61% 73.78% Non-Int. Income to Operating Revenue 31.16% 31.22% 26.98% 25.71%

32 CAPITAL & SHAREHOLDER RETURN
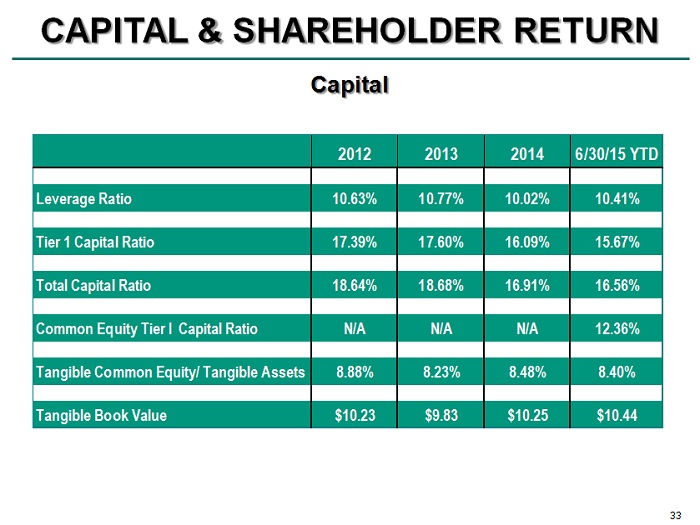
33 CAPITAL & SHAREHOLDER RETURN Capital 2012 2013 2014 6/30/15 YTD Leverage Ratio 10.63% 10.77% 10.02% 10.41% Tier 1 Capital Ratio 17.39% 17.60% 16.09% 15.67% Total Capital Ratio 18.64% 18.68% 16.91% 16.56% Common Equity Tier I Capital Ratio N/A N/A N/A 12.36% Tangible Common Equity/ Tangible Assets 8.88% 8.23% 8.48% 8.40% Tangible Book Value $10.23 $9.83 $10.25 $10.44
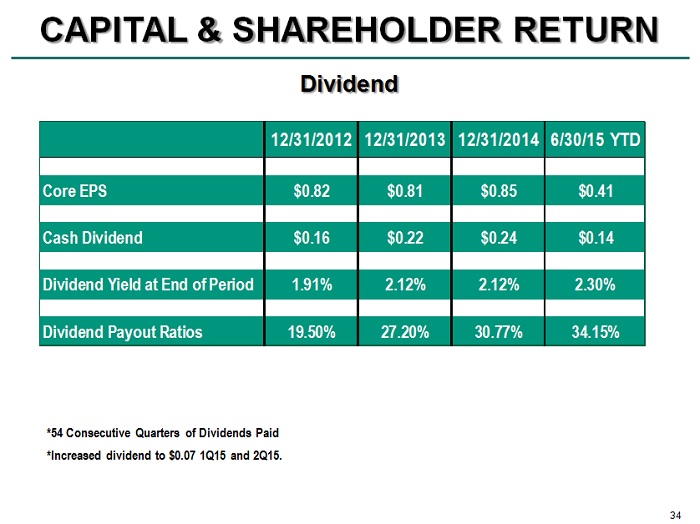
34 Dividend * 54 Consecutive Quarters of Dividends Paid *Increased dividend to $0.07 1Q15 and 2Q15. CAPITAL & SHAREHOLDER RETURN 12/31/2012 12/31/2013 12/31/2014 6/30/15 YTD Core EPS $0.82 $0.81 $0.85 $0.41 Cash Dividend $0.16 $0.22 $0.24 $0.14 Dividend Yield at End of Period 1.91% 2.12% 2.12% 2.30% Dividend Payout Ratios 19.50% 27.20% 30.77% 34.15%
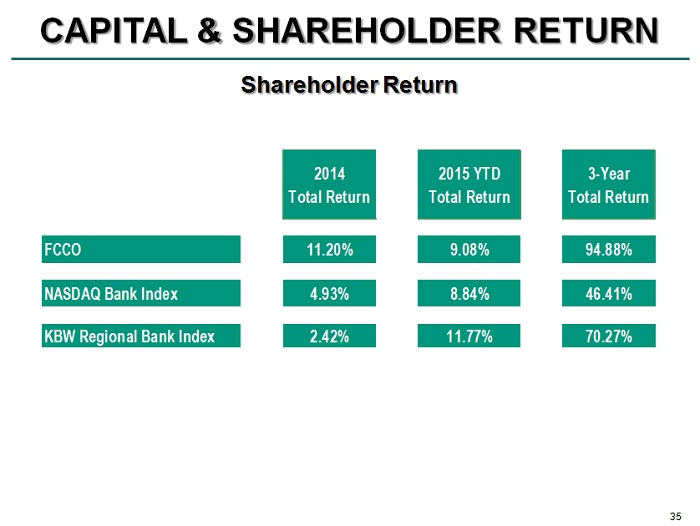
35 Shareholder Return CAPITAL & SHAREHOLDER RETURN 2014 Total Return 2015 YTD Total Return 3-Year Total Return FCCO 11.20% 9.08% 94.88% NASDAQ Bank Index 4.93% 8.84% 46.41% KBW Regional Bank Index 2.42% 11.77% 70.27%
36 SUMMARY
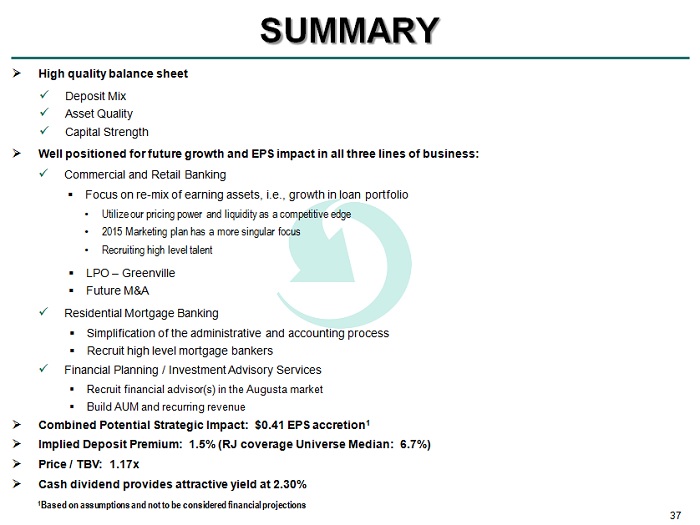
37 SUMMARY » High quality balance sheet » Well positioned for future growth and EPS impact in all three lines of business: x Commercial and Retail Banking » Combined Potential Strategic Impact: $0.41 EPS accretion 1 » Implied Deposit Premium: 1.5% (RJ coverage Universe Median: 6.7%) » Price / TBV: 1.17x » Cash dividend provides attractive yield at 2.30% x Residential Mortgage Banking ▪ Focus on re - mix of earning assets, i.e., growth in loan portfolio x Financial Planning / Investment Advisory Services ▪ Simplification of the administrative and accounting process ▪ Recruit high level mortgage bankers ▪ Recruit financial advisor(s) in the Augusta market ▪ Build AUM and recurring revenue x Deposit Mix x Asset Quality x Capital Strength ▪ LPO – Greenville ▪ Future M&A • Utilize our pricing power and liquidity as a competitive edge • 2015 Marketing plan has a more singular focus • Recruiting high level talent 1 Based on assumptions and not to be considered financial projections
38 FORWARD - LOOKING STATEMENTS SAFE HARBOR STATEMENT – The Local Bank for Local Business This presentation, as well as other written communications made from time to time by First Community Corporation (the “ Company ”), and oral communications made from time to time by or on behalf of the Company, contain or may contain statements relating to the future results of the Company (including certain strategic targets and projections) that are considered “forward - looking statements” as defined in the Private Securities Litigation Reform Act of 1995 (the PSLRA) . Such forward - looking statements may be identified by the use of words such as “target,” “projected,” “objectives, ” “believe,” “expect,” “anticipate,” “should,” “planned,” “estimated,” “intend,” “potential” and similar expressions . For these statements, the Company claims the protection of the safe harbor for forward - looking statements contained in the PSLRA . The Company cautions you that a number of important factors could cause actual results to differ materially from those anticipated in any forward - looking statement . Such factors include, but are not limited to : prevailing economic and geopolitical conditions ; changes in interest rates, loan demand, real estate values and competition ; changes in accounting principles, policies, and guidelines ; changes in any applicable law, rule, regulation or practice with respect to tax, bank regulatory or other legal issues ; and other economic, competitive, governmental, regulatory and technological factors affecting the Company’s operations, pricing, products and services and other factors that may be described in the Company’s most recent Annual Report on Form 10 - K, Quarterly Reports on Form 10 - Q and Current Reports on Form 8 - K, which are filed with the Securities and Exchange Commission . The forward - looking statements speak only as of the date of the date that they are made, and, except as may be required by applicable law or regulation, the Company assumes no obligation to update the forward - looking statements or to update the reasons why actual results could differ from those projected in the forward - looking statements .