The Bank Behind Your Business 2019 COMMUNITY BANK FORUM November 3 - 5, 2019 Mike Crapps President and CEO Ted Nissen Chief Commercial & Retail Banking Officer

HIGHLIGHTS 2
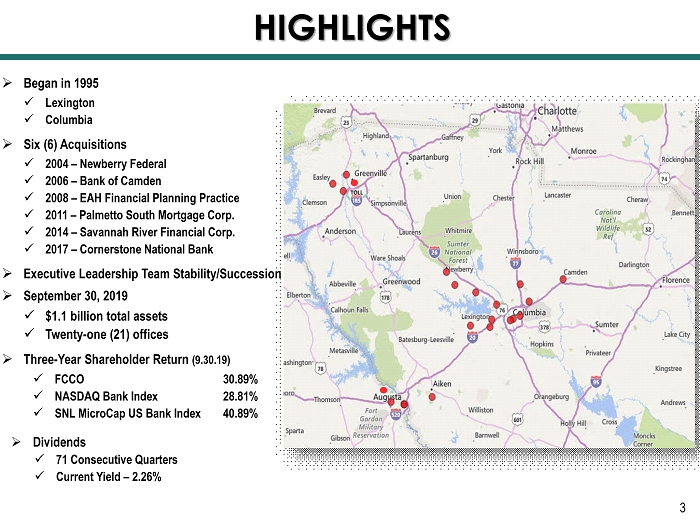
» Began in 1995 x Lexington x Columbia » Six (6) Acquisitions x 2004 – Newberry Federal x 2006 – Bank of Camden x 2008 – EAH Financial Planning Practice x 2011 – Palmetto South Mortgage Corp. x 2014 – Savannah River Financial Corp. x 2017 – Cornerstone National Bank » Executive Leadership Team Stability/Succession » September 30, 2019 x $1.1 billion total assets x Twenty - one (21) offices » Three - Year Shareholder Return (9.30.19) » Dividends x 71 Consecutive Quarters x Current Yield – 2.26% HIGHLIGHTS x FCCO 30.89% x NASDAQ Bank Index 28.81% x SNL MicroCap US Bank Index 40.89% 3

OUR IDENTITY 4
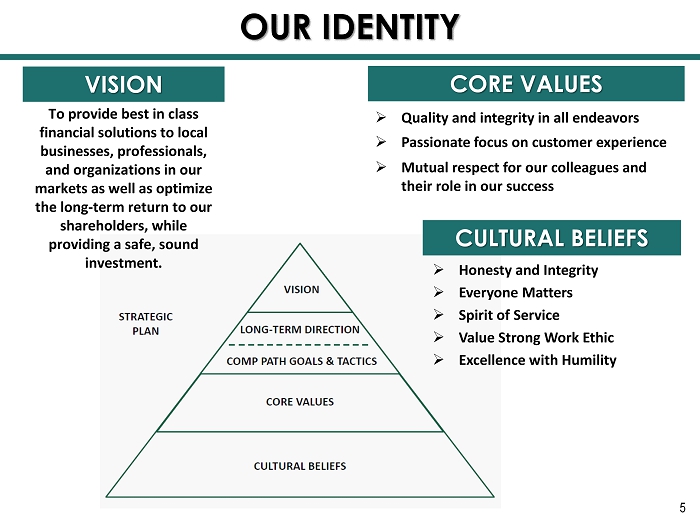
To provide best in class financial solutions to local businesses, professionals, and organizations in our markets as well as optimize the long - term return to our shareholders, while providing a safe, sound investment. VISION » Quality and integrity in all endeavors » Passionate focus on customer experience » Mutual respect for our colleagues and their role in our success CORE VALUES OUR IDENTITY » Honesty and Integrity » Everyone Matters » Spirit of Service » Value Strong Work Ethic » Excellence with Humility CULTURAL BELIEFS 5

THREE GEOGRAPHICALLY DIVERSE MARKETS 6

» Columbia (Midlands of SC) ▪ State Capitol ▪ University of SC ▪ Fort Jackson ▪ Quality Public Schools ▪ Lake Murray » Greenville (Upstate of SC) ▪ Great Pure Business Market ▪ Attractive to Millennials » Augusta (CSRA) ▪ Cybersecurity x Fort Gordon x Private Sector ▪ Augusta University ▪ Excellent Medical Community ▪ The Masters Tournament THREE GEOGRAPHICALLY DIVERSE MARKETS 7

LINES OF BUSINESS 8
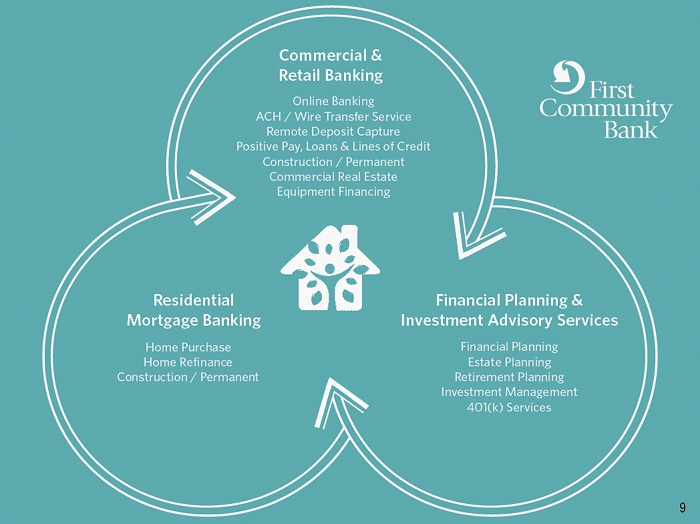
9

FOUNDATIONAL FRANCHISE VALUE 10
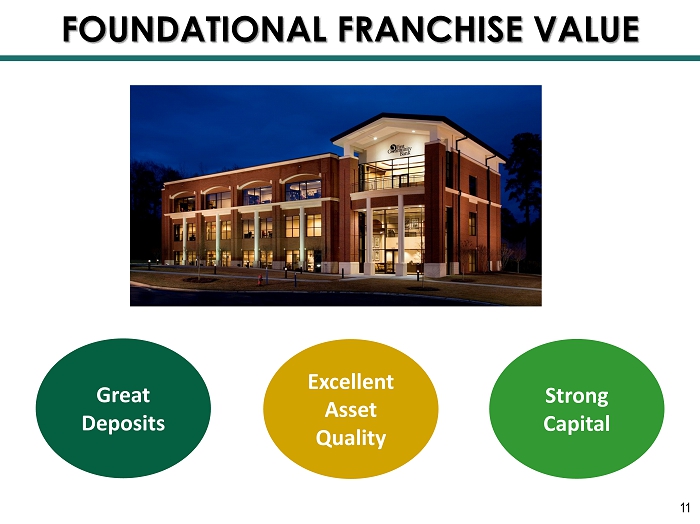
FOUNDATIONAL FRANCHISE VALUE Great Deposits Excellent Asset Quality Strong Capital 11

$0.0 $100.0 $200.0 $300.0 $400.0 $500.0 $600.0 $700.0 $800.0 $900.0 $1,000.0 1 2 3 4 5 $563.1 $611.9 $729.5 $777.2 $804.1 $153.0 $154.7 $158.8 $148.4 $144.7 Pure (Non-CD) Deposit Total Customer Cash Management Certificates of Deposit (CDs) Pure Deposit Growth $737.1 $786.1 $907.6 2 $953.6 1 Total Deposit Cost 0.25% 0.24% 0.22% 0.39% 0.52% (Quarter ending) Commercial and Retail Banking 1 Cornerstone Merger: $102MM 2 Cornerstone Merger: $126MM Excellent Deposit Franchise • 85% Pure (Non - CD) Deposits • 28% (Non - Interest Bearing DDA Balances) • Largest Community Bank in the Midlands of SC FOUNDATIONAL FRANCHISE VALUE $983.1 12/31/15 12/31/16 12/31/17 12/31/18 09/30/19 Millions 12
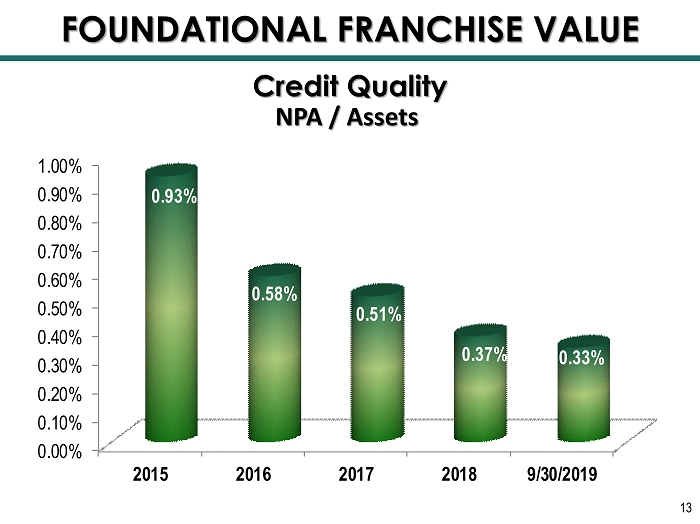
0.00% 0.10% 0.20% 0.30% 0.40% 0.50% 0.60% 0.70% 0.80% 0.90% 1.00% 2015 2016 2017 2018 9/30/2019 0.93% 0.58% 0.51% 0.37% 0.33% Credit Quality NPA / Assets FOUNDATIONAL FRANCHISE VALUE 13
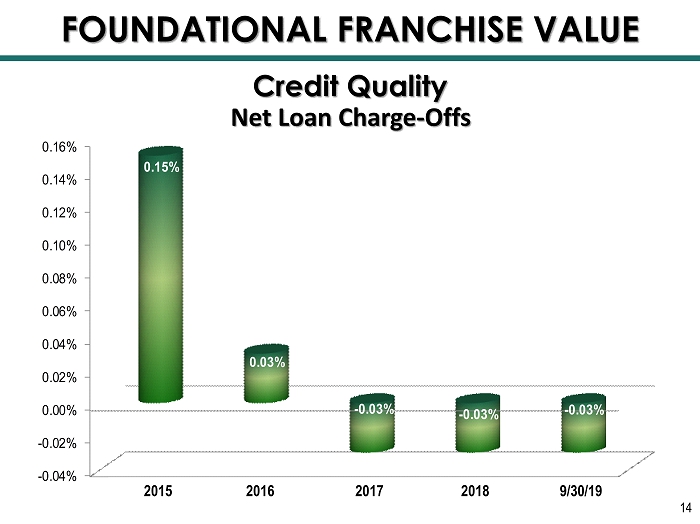
-0.04% -0.02% 0.00% 0.02% 0.04% 0.06% 0.08% 0.10% 0.12% 0.14% 0.16% 0.15% 0.03% - 0.03% - 0.03% - 0.03% Credit Quality Net Loan Charge - Offs 2015 2016 2017 2018 9/30/19 FOUNDATIONAL FRANCHISE VALUE 14
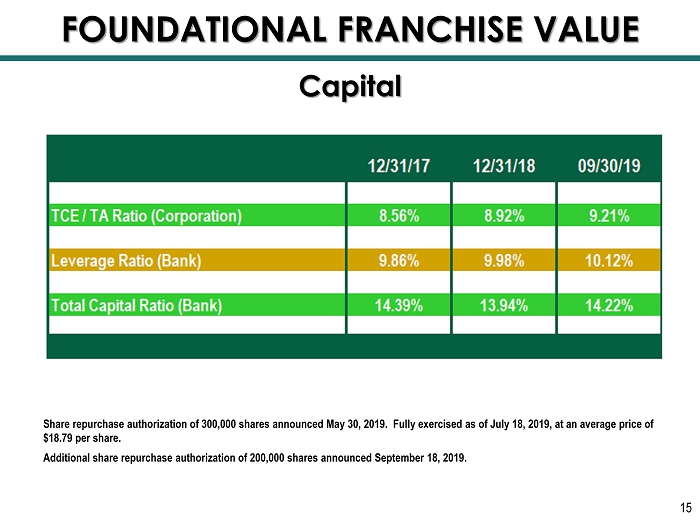
FOUNDATIONAL FRANCHISE VALUE Share repurchase authorization of 300,000 shares announced May 30, 2019. Fully exercised as of July 18, 2019, at an average pri ce of $18.79 per share. Additional share repurchase authorization of 200,000 shares announced September 18, 2019. 15 Capital

ENHANCE EARNINGS 16
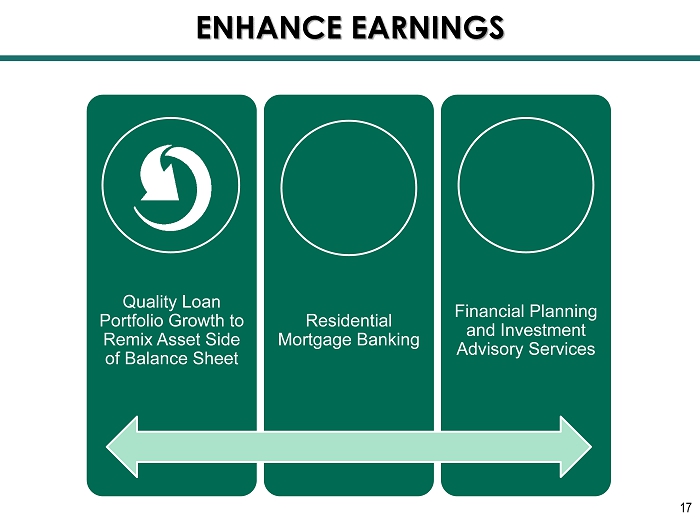
ENHANCE EARNINGS Quality Loan Portfolio Growth to Remix Asset Side of Balance Sheet Residential Mortgage Banking Financial Planning and Investment Advisory Services 17
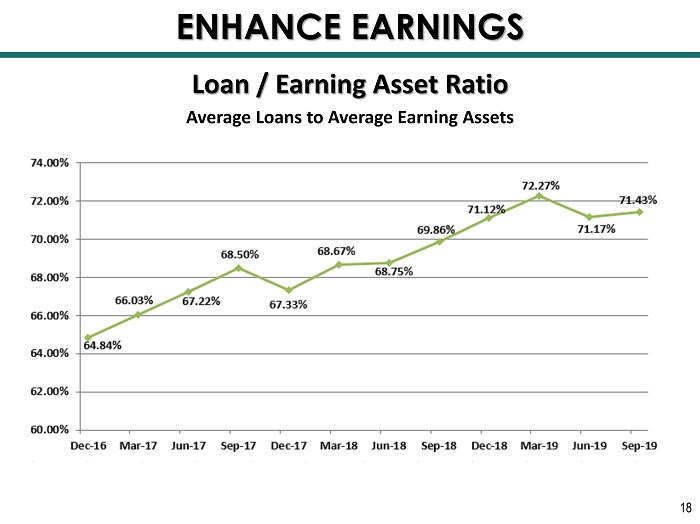
Loan / Earning Asset Ratio ENHANCE EARNINGS Average Loans to Average Earning Assets 18
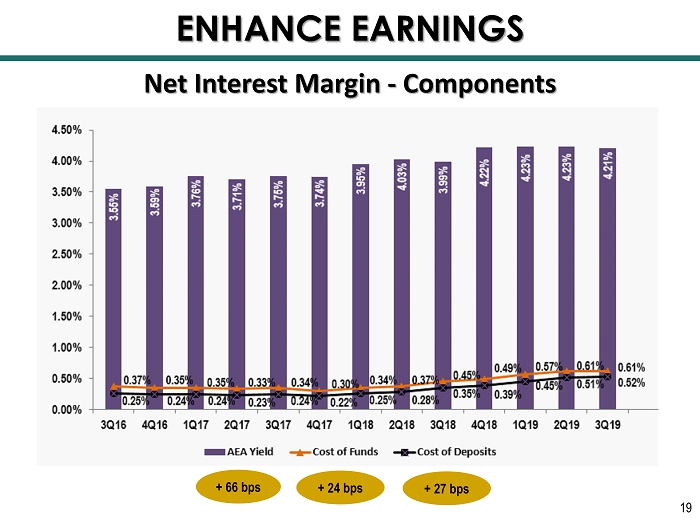
ENHANCE EARNINGS Net Interest Margin - Components + 66 bps + 24 bps + 27 bps 19
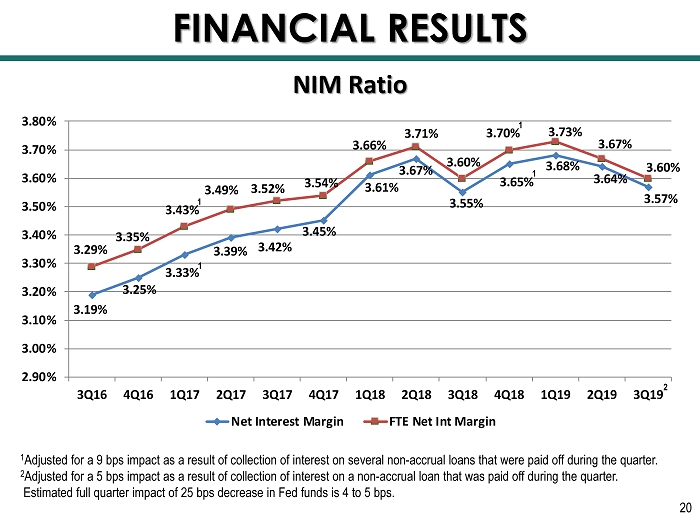
3.19% 3.25% 3.33% 3.39% 3.42% 3.45% 3.61% 3.67% 3.55% 3.65% 3.68% 3.64% 3.57% 3.29% 3.35% 3.43% 3.49% 3.52% 3.54% 3.66% 3.71% 3.60% 3.70% 3.73% 3.67% 3.60% 2.90% 3.00% 3.10% 3.20% 3.30% 3.40% 3.50% 3.60% 3.70% 3.80% 3Q16 4Q16 1Q17 2Q17 3Q17 4Q17 1Q18 2Q18 3Q18 4Q18 1Q19 2Q19 3Q19 Net Interest Margin FTE Net Int Margin NIM Ratio 1 Adjusted for a 9 bps impact as a result of collection of interest on several non - accrual loans that were paid off during the qua rter. 2 Adjusted for a 5 bps impact as a result of collection of interest on a non - accrual loan that was paid off during the quarter. Estimated full quarter impact of 25 bps decrease in Fed funds is 4 to 5 bps. FINANCIAL RESULTS 1 1 1 1 20 2
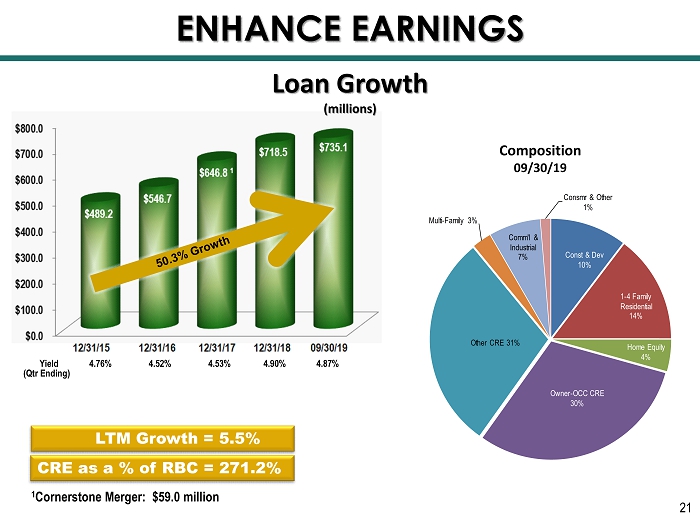
Loan Growth (millions) LTM Growth = 5.5% 1 Cornerstone Merger: $59.0 million CRE as a % of RBC = 271.2% Yield 4.76% 4.52% 4.53% 4.90% 4.87% (Qtr Ending) ENHANCE EARNINGS Composition 09/30/19 21 Const & Dev 10% 1 - 4 Family Residential 14% Home Equity 4% Owner - OCC CRE 30% Other CRE 31% Multi - Family 3% Comm'l & Industrial 7% Consmr & Other 1%
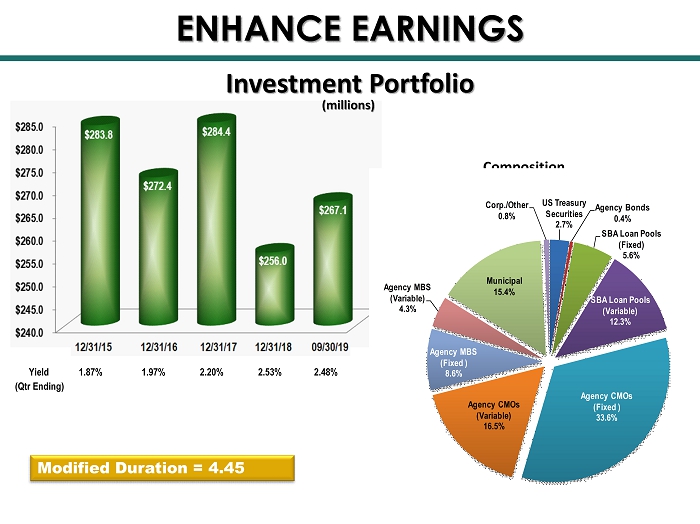
Investment Portfolio ENHANCE EARNINGS Yield 1.87% 1.97% 2.20% 2.53% 2.48% (Qtr Ending) Composition 09/30/19 Modified Duration = 4.45 (millions) 22 US Treasury Securities 2.7% Agency Bonds 0.4% SBA Loan Pools (Fixed) 5.6% SBA Loan Pools (Variable) 12.3% Agency CMOs (Fixed ) 33.6% Agency CMOs (Variable) 16.5% Agency MBS (Fixed ) 8.6% Agency MBS (Variable) 4.3% Municipal 15.4% Corp./Other 0.8%
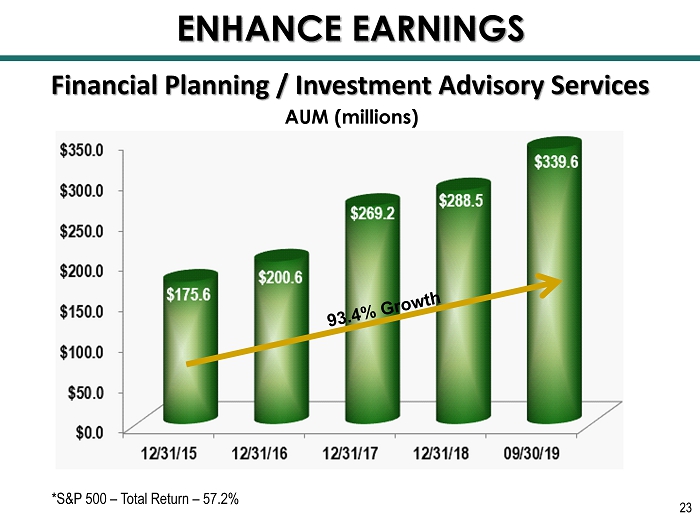
Financial Planning / Investment Advisory Services AUM (millions) ENHANCE EARNINGS *S&P 500 – Total Return – 57.2% 23
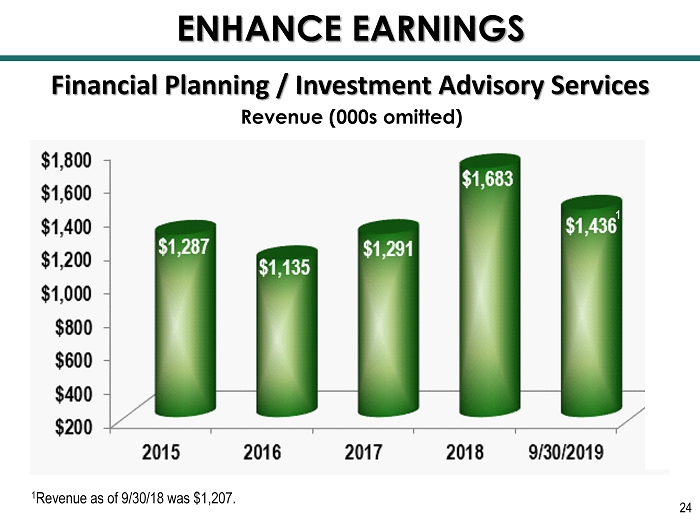
Financial Planning / Investment Advisory Services Revenue (000s omitted) ENHANCE EARNINGS 1 Revenue as of 9/30/18 was $1,207. 1 24
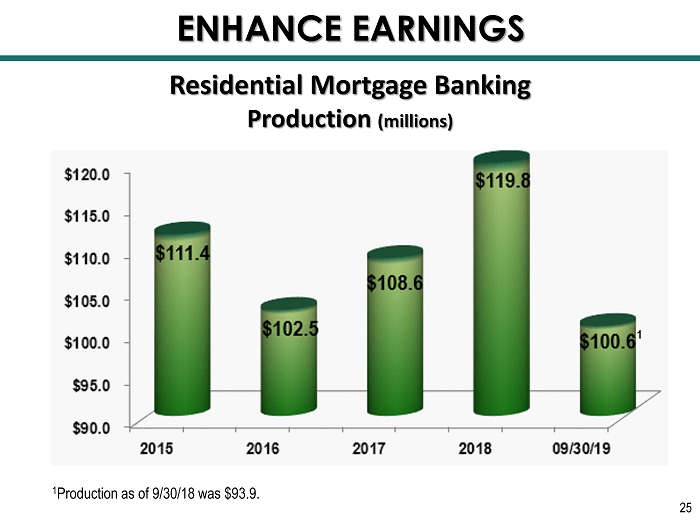
Residential Mortgage Banking Production (millions) ENHANCE EARNINGS 1 Production as of 9/30/18 was $93.9. 1 25
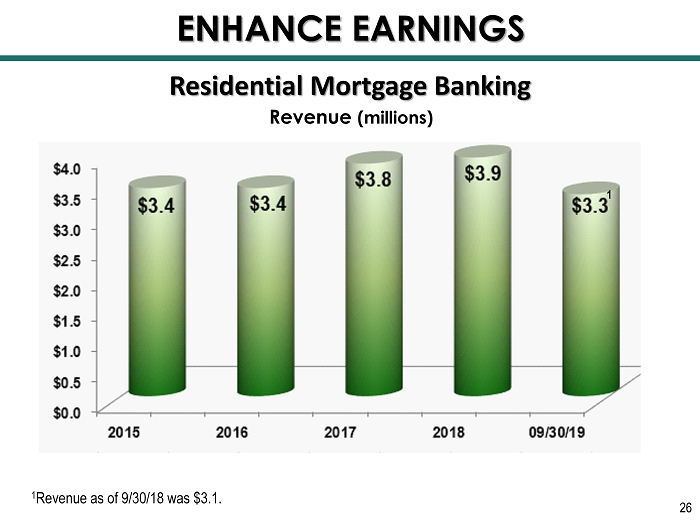
Residential Mortgage Banking Revenue (millions) ENHANCE EARNINGS 1 Revenue as of 9/30/18 was $3.1. 1 26
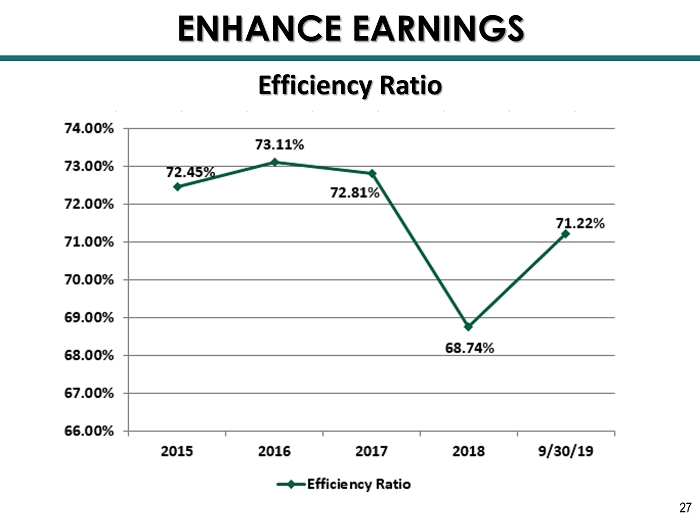
Efficiency Ratio ENHANCE EARNINGS 27

RISK MANAGEMENT & TECHNOLOGY 28
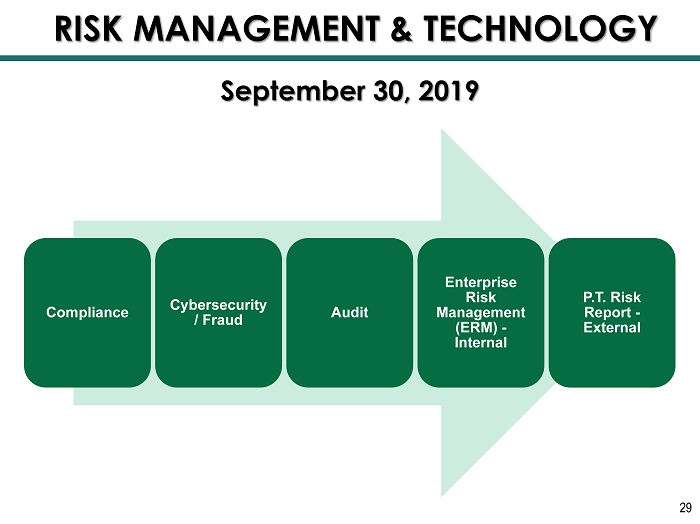
RISK MANAGEMENT & TECHNOLOGY Compliance Cybersecurity / Fraud Audit Enterprise Risk Management (ERM) - Internal P.T. Risk Report - External September 30, 2019 29
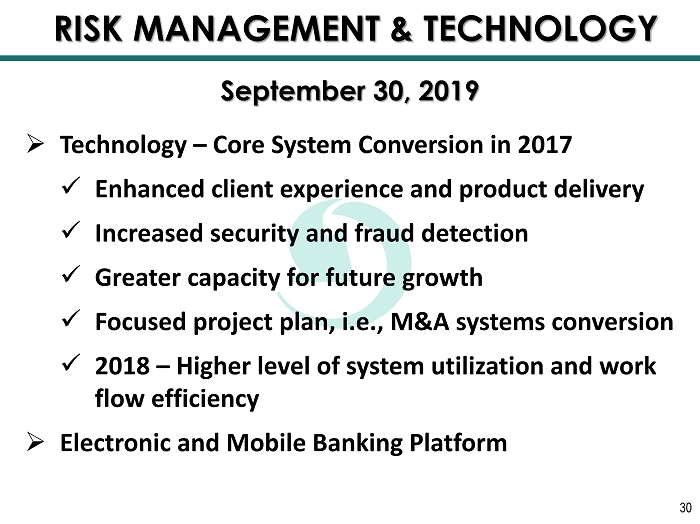
RISK MANAGEMENT & TECHNOLOGY » Technology – Core System Conversion in 2017 x Enhanced client experience and product delivery x Increased security and fraud detection x Greater capacity for future growth x Focused project plan, i.e., M&A systems conversion x 2018 – Higher level of system utilization and work flow efficiency » Electronic and Mobile Banking Platform September 30, 2019 30

FINANCIAL RESULTS 31

$6,027 $6,458 $7,796 $11,496 $8,168 $500 $2,500 $4,500 $6,500 $8,500 $10,500 $12,500 2015 2016 2017 2018 9/30/2019 Core Net Income and Earnings Per Share (EPS)* 1 *Core net income and EPS exclude merger and acquisition cost, gains (losses) on sale of securities and losses on early exting uis hment of debt, and SC State income tax credit. 1 See Non - GAAP reconciliation on page 52. 2 Core net income and EPS year - to - date, as of 9/30/18, were $8,551 and $1.11, respectively. 0.90 0.95 1.11 1.49 FINANCIAL RESULTS 1.07 2 32 Millions
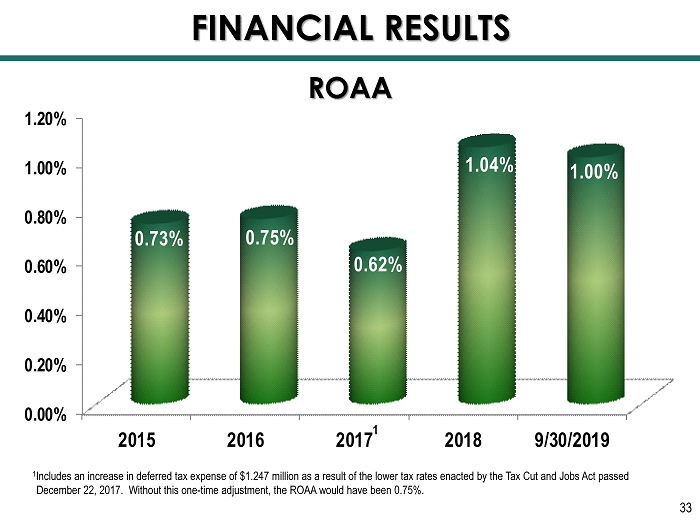
0.00% 0.20% 0.40% 0.60% 0.80% 1.00% 1.20% 2015 2016 2017 2018 9/30/2019 0.73% 0.75% 0.62% 1.04% 1.00% ROAA FINANCIAL RESULTS 1 Includes an increase in deferred tax expense of $1.247 million as a result of the lower tax rates enacted by the Tax Cut and Job s Act passed December 22, 2017. Without this one - time adjustment, the ROAA would have been 0.75%. 1 33
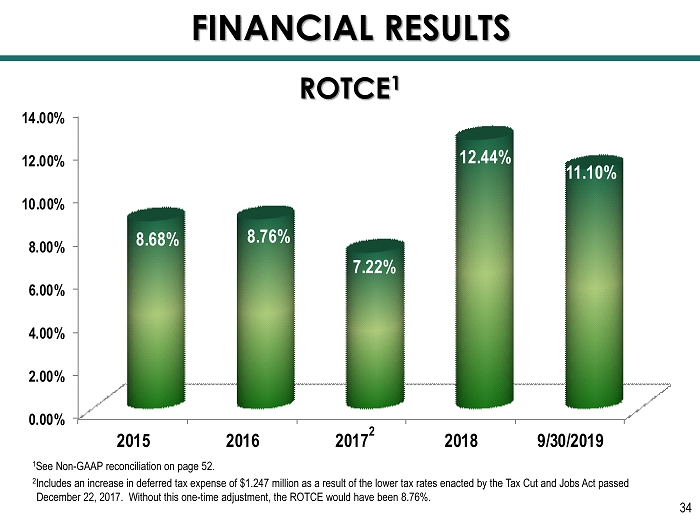
0.00% 2.00% 4.00% 6.00% 8.00% 10.00% 12.00% 14.00% 2015 2016 2017 2018 9/30/2019 8.68% 8.76% 7.22% 12.44% 11.10% ROTCE 1 FINANCIAL RESULTS 1 See Non - GAAP reconciliation on page 52. 2 Includes an increase in deferred tax expense of $1.247 million as a result of the lower tax rates enacted by the Tax Cut and Job s Act passed December 22, 2017. Without this one - time adjustment, the ROTCE would have been 8.76%. 2 34
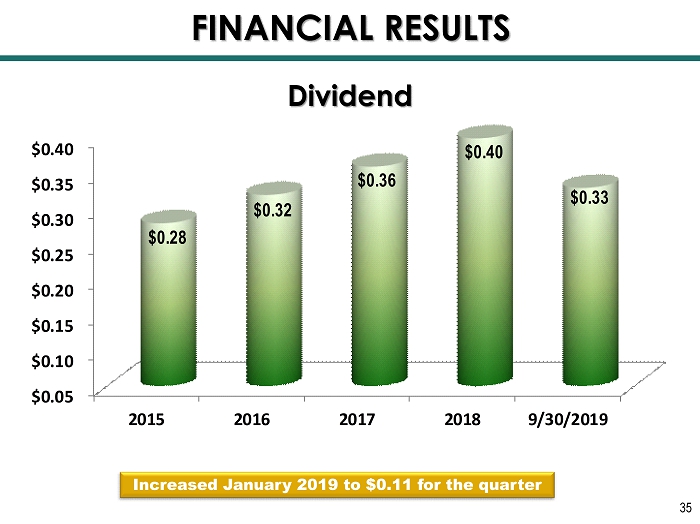
$0.05 $0.10 $0.15 $0.20 $0.25 $0.30 $0.35 $0.40 2015 2016 2017 2018 9/30/2019 $0.28 $0.32 $0.36 $0.40 $0.33 Increased January 2019 to $0.11 for the quarter Dividend FINANCIAL RESULTS 35

$9.00 $9.50 $10.00 $10.50 $11.00 $11.50 $12.00 $12.50 $13.00 $13.50 $14.00 12/31/15 12/31/16 12/31/17 12/31/18 9/30/19 $10.84 $11.28 $11.66 $12.56 $13.84 Tangible Book Value 1 FINANCIAL RESULTS 36 1 See Non - GAAP reconciliation on page 52.
SHAREHOLDER RETURN VS. BENCHMARK 37

2019 Total Shareholder Return vs. Index(es) SHAREHOLDER RETURN vs. BENCHMARK As of September 30, 2019 38
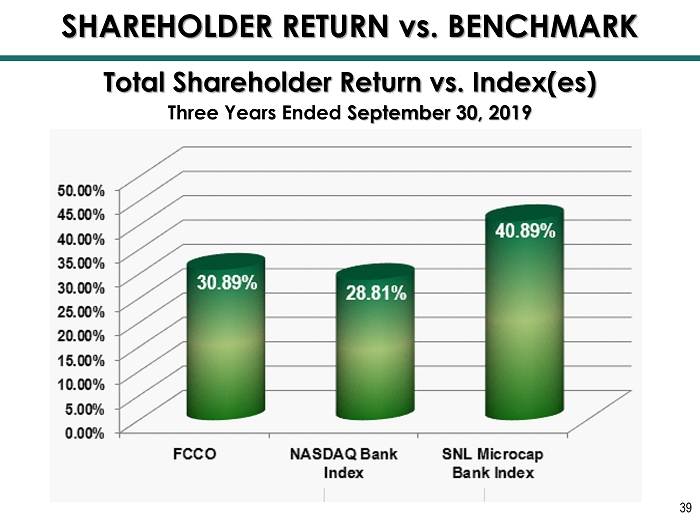
Total Shareholder Return vs. Index(es) Three Years Ended September 30, 2019 SHAREHOLDER RETURN vs. BENCHMARK 39

INVESTMENT IN THE FRANCHISE 40
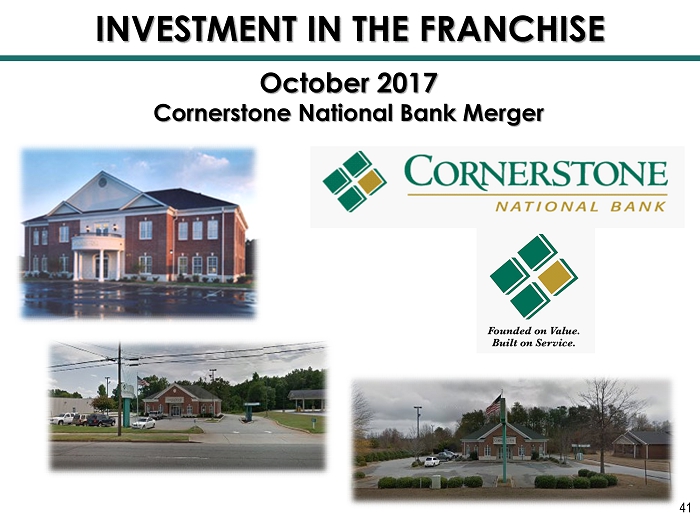
INVESTMENT IN THE FRANCHISE October 2017 Cornerstone National Bank Merger 41
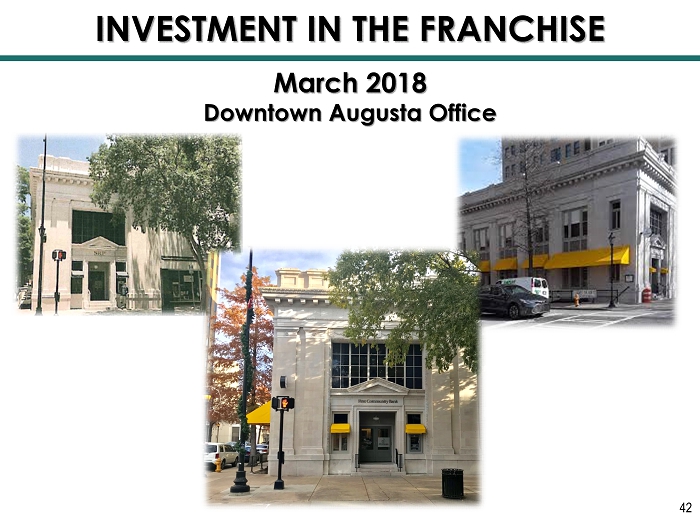
March 2018 Downtown Augusta Office INVESTMENT IN THE FRANCHISE 42
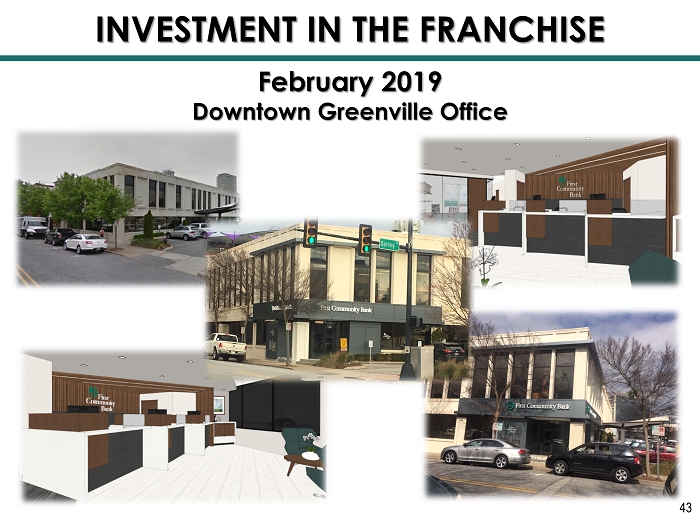
February 2019 Downtown Greenville Office INVESTMENT IN THE FRANCHISE 43
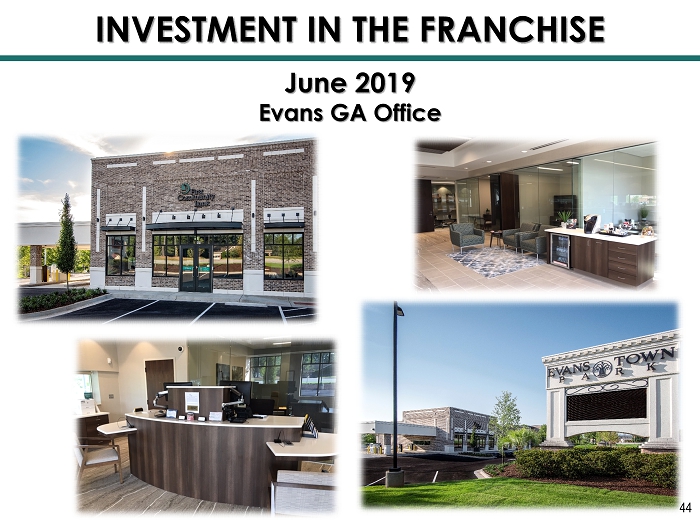
INVESTMENT IN THE FRANCHISE June 2019 Evans GA Office 44
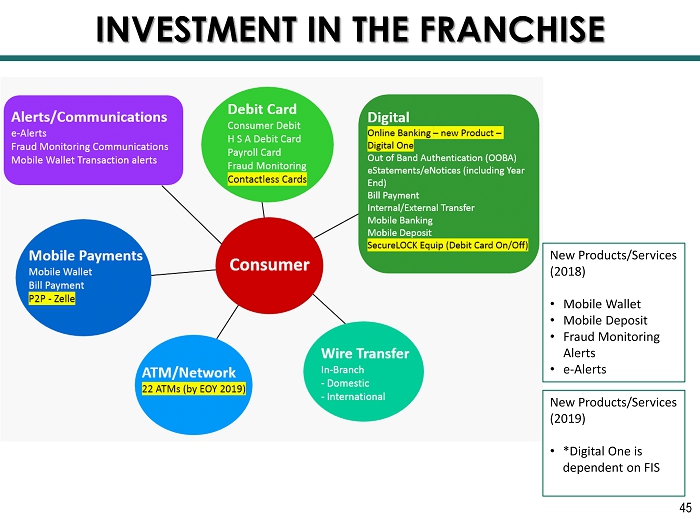
INVESTMENT IN THE FRANCHISE New Products/Services (2019) • *Digital One is dependent on FIS New Products/Services (2018) • Mobile Wallet • Mobile Deposit • Fraud Monitoring Alerts • e-Alerts 45
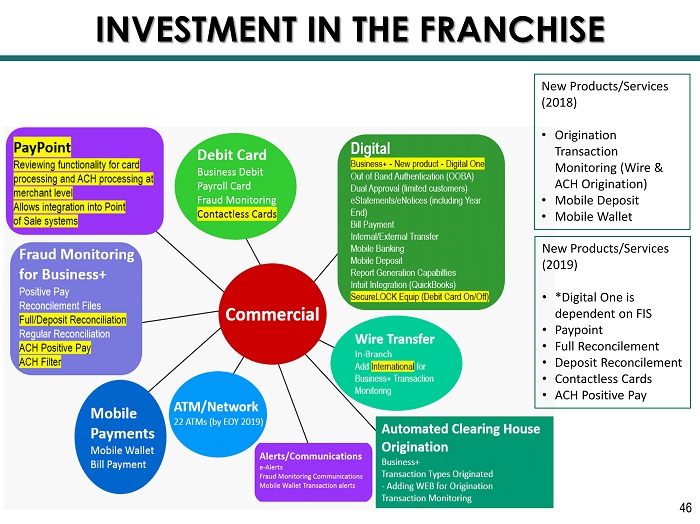
INVESTMENT IN THE FRANCHISE New Products/Services (2019) • *Digital One is dependent on FIS • Paypoint • Full Reconcilement • Deposit Reconcilement • Contactless Cards • ACH Positive Pay New Products/Services (2018) • Origination Transaction Monitoring (Wire & ACH Origination) • Mobile Deposit • Mobile Wallet 46

WHAT’S AHEAD 47
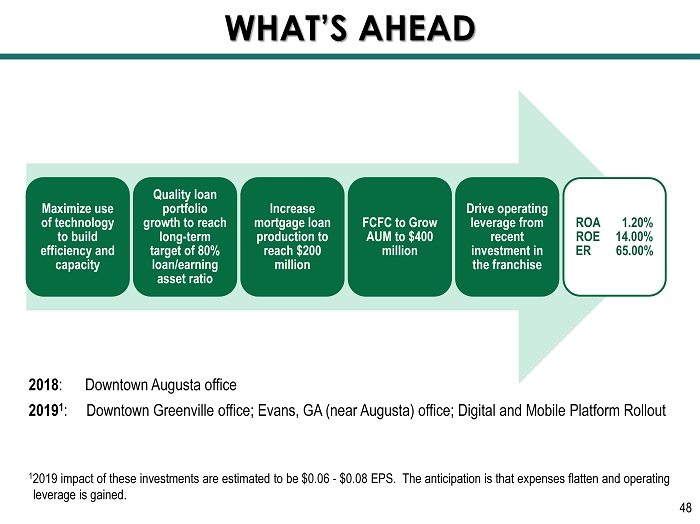
Maximize use of technology to build efficiency and capacity Quality loan portfolio growth to reach long - term target of 80% loan/earning asset ratio Increase mortgage loan production to reach $200 million FCFC to Grow AUM to $400 million Drive operating leverage from recent investment in the franchise ROA 1.20% ROE 14.00% ER 65.00% WHAT’S AHEAD 2018 : Downtown Augusta office 2019 1 : Downtown Greenville office; Evans, GA (near Augusta) office; Digital and Mobile Platform Rollout 1 2019 impact of these investments are estimated to be $0.06 - $0.08 EPS. The anticipation is that expenses flatten and operating leverage is gained. 48

SUMMARY 49
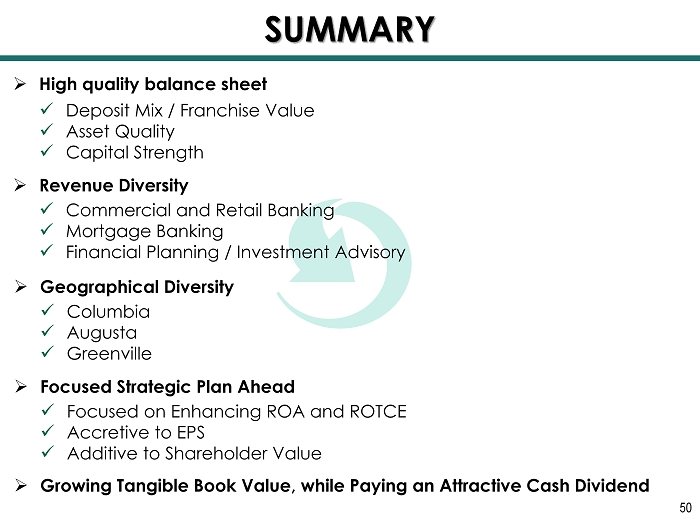
SUMMARY » High quality balance sheet » Revenue Diversity x Commercial and Retail Banking x Mortgage Banking x Financial Planning / Investment Advisory x Deposit Mix / Franchise Value x Asset Quality x Capital Strength » Geographical Diversity x Columbia x Augusta x Greenville » Focused Strategic Plan Ahead x Focused on Enhancing ROA and ROTCE x Accretive to EPS x Additive to Shareholder Value » Growing Tangible Book Value, while Paying an Attractive Cash Dividend 50

FORWARD - LOOKING STATEMENTS SAFE HARBOR STATEMENT – THIS PRESENTATION CONTAINS FORWARD - LOOKING STATEMENTS . ADDITIONAL WRITTEN OR ORAL FORWARD - LOOKING STATEMENTS MAY BE MADE BY THE COMPANY FROM TIME TO TIME IN FILINGS WITH THE SECURITIES AND EXCHANGE COMMISSION THE “SEC” OR OTHERWISE . THE WORDS "BELIEVE," "EXPECT," "SEEK,“ AND "INTEND" AND SIMILAR EXPRESSIONS IDENTIFY FORWARD - LOOKING STATEMENTS, WHICH SPEAK ONLY AS OF THE DATE THE STATEMENT IS MADE . SUCH FORWARD - LOOKING STATEMENTS ARE WITHIN THE MEANING OF THAT TERM IN SECTION 27 A OF THE SECURITIES ACT OF 1933 , AS AMENDED, & SECTION 21 E OF THE SECURITIES EXCHANGE ACT OF 1934 , AS AMENDED . SUCH STATEMENTS MAY INCLUDE, BUT ARE NOT LIMITED TO, PROJECTIONS OF INCOME OR LOSS, EXPENDITURES, ACQUISITIONS, PLANS FOR FUTURE OPERATIONS, FINANCING NEEDS OR PLANS RELATING TO SERVICES OF THE COMPANY, AS WELL AS ASSUMPTIONS RELATING TO THE FOREGOING . FORWARD - LOOKING STATEMENTS ARE INHERENTLY SUBJECT TO RISKS AND UNCERTAINTIES, SOME OF WHICH CANNOT BE PREDICTED OR QUANTIFIED . FUTURE EVENTS AND ACTUAL RESULTS COULD DIFFER MATERIALLY FROM THOSE SET FORTH IN, CONTEMPLATED BY OR UNDERLYING THE FORWARD - LOOKING STATEMENTS . A DISCUSSION OF FACTORS THAT COULD CAUSE ACTUAL RESULTS TO DIFFER MATERIALLY FROM THOSE EXPRESSED IN FORWARD - LOOKING STATEMENTS IS INCLUDED IN FILINGS WITH THE SEC . The Bank Behind Your Business NON - GAAP FINANCIAL MEASURES – THIS PRESENTATION CONTAINS CERTAIN NON - GAAP FINANCIAL MEASURES THAT ARE NOT IN ACCORDANCE WITH US GENERALLY ACCEPTED ACCOUNTING PRINCIPLES (“GAAP”) . FIRST COMMUNITY CORPORATION USES CERTAIN NON - GAAP FINANCIAL MEASURES TO PROVIDE MEANINGFUL, SUPPLEMENTAL INFORMATION REGARDING ITS OPERATIONAL RESULTS AND TO ENHANCE INVESTORS’ OVERALL UNDERSTANDING OF ITS FINANCIAL PERFORMANCE . THE LIMITATIONS ASSOCIATED WITH NON - GAAP FINANCIAL MEASURES INCLUDE THE RISK THAT PERSONS MIGHT DISAGREE AS TO THE APPROPRIATENESS OF ITEMS COMPRISING THESE MEASURES AND THAT DIFFERENT COMPANIES MIGHT CALCULATE THESE MEASURES DIFFERENTLY . THESE DISCLOSURES SHOULD NOT BE CONSIDERED AN ALTERNATIVE TO FIRST COMMUNITY CORPORATION’S GAAP RESULTS . SEE THE END OF THIS PRESENTATION FOR A RECONCILIATION OF THE NON - GAAP FINANCIAL MEASURES TO THE MOST DIRECTLY COMPARABLE GAAP FINANCIAL MEASURE . 51
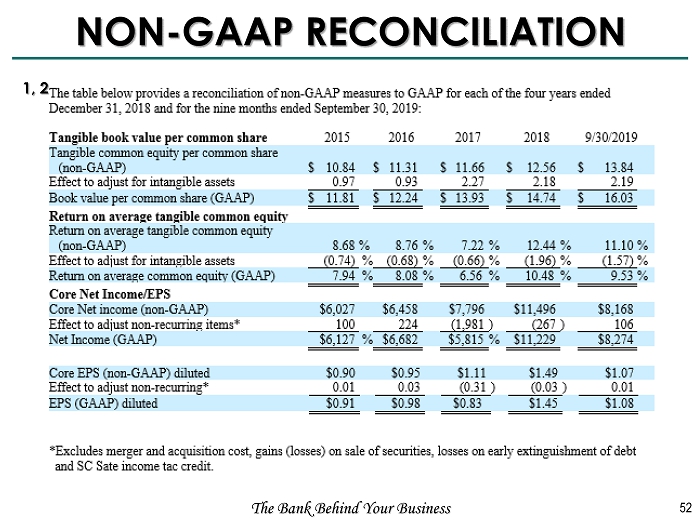
NON - GAAP RECONCILIATION The Bank Behind Your Business 52 1, 2