Exhibit 99.1

The Bank Behind Your Business September 2024

OUTLINE 2 I. Overview 3 II. 2Q24 Highlights / Topics of Interest 9 » Earning Assets 10 » Funding 15 » Net Interest Margin (NIM) 19 » Risk Management 24 » Capital 29 » Non - Interest Income Highlights 33 » Revenue 38 » Non - Interest Expense 41 » Net Income 44 Impacting Lives for Success and Significance

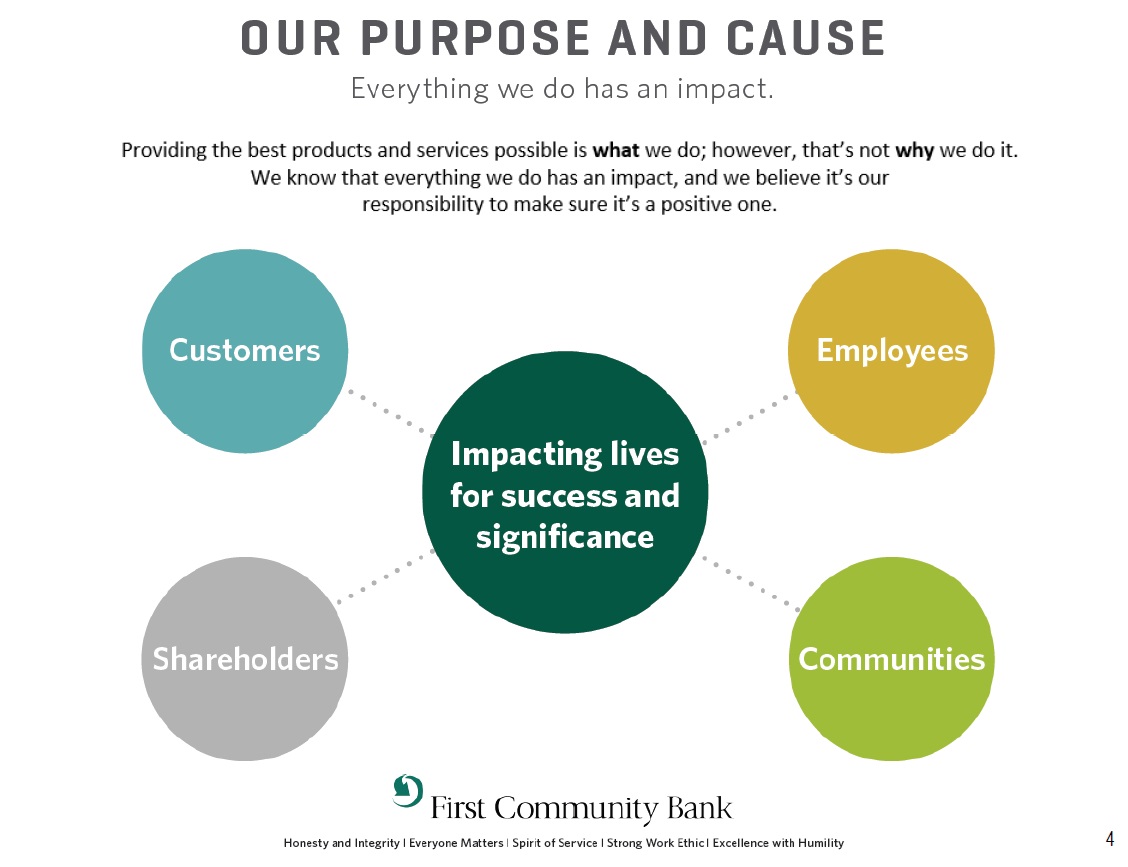
Impacting Lives for Success and Significance
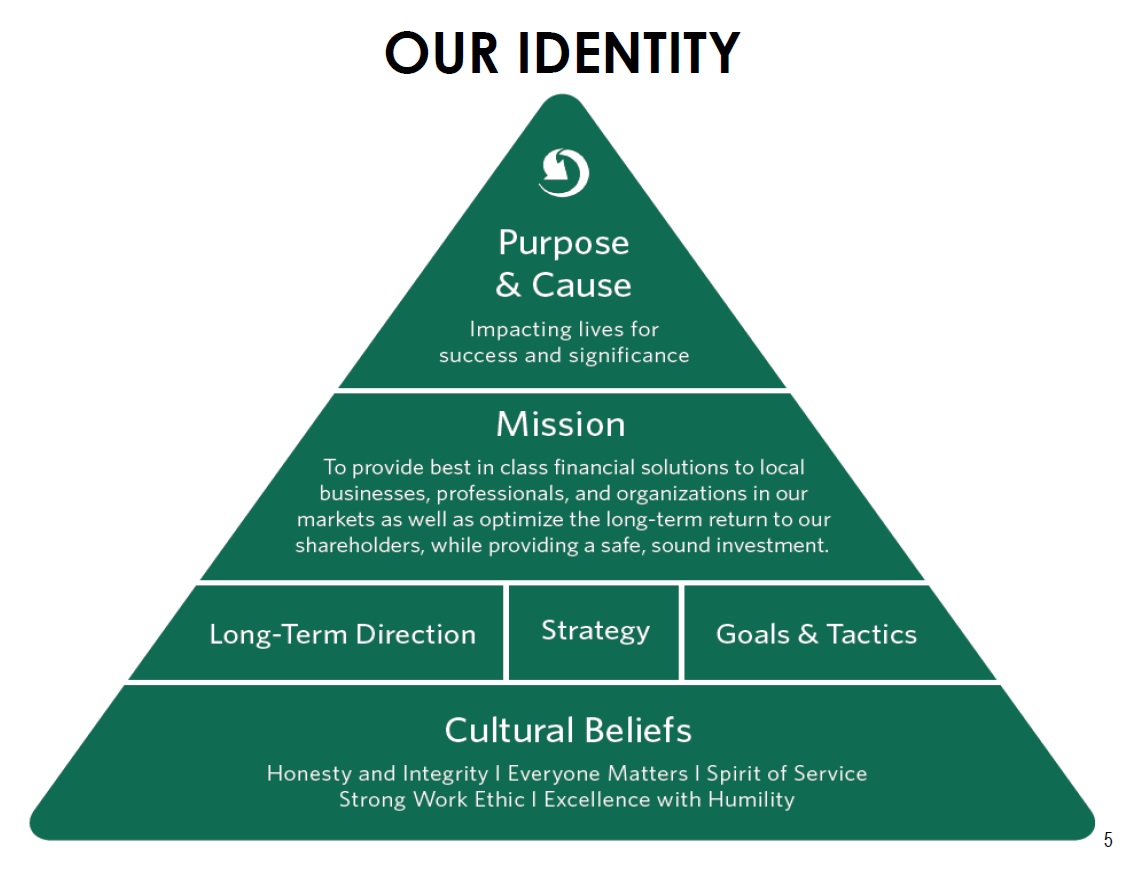
OUR IDENTITY
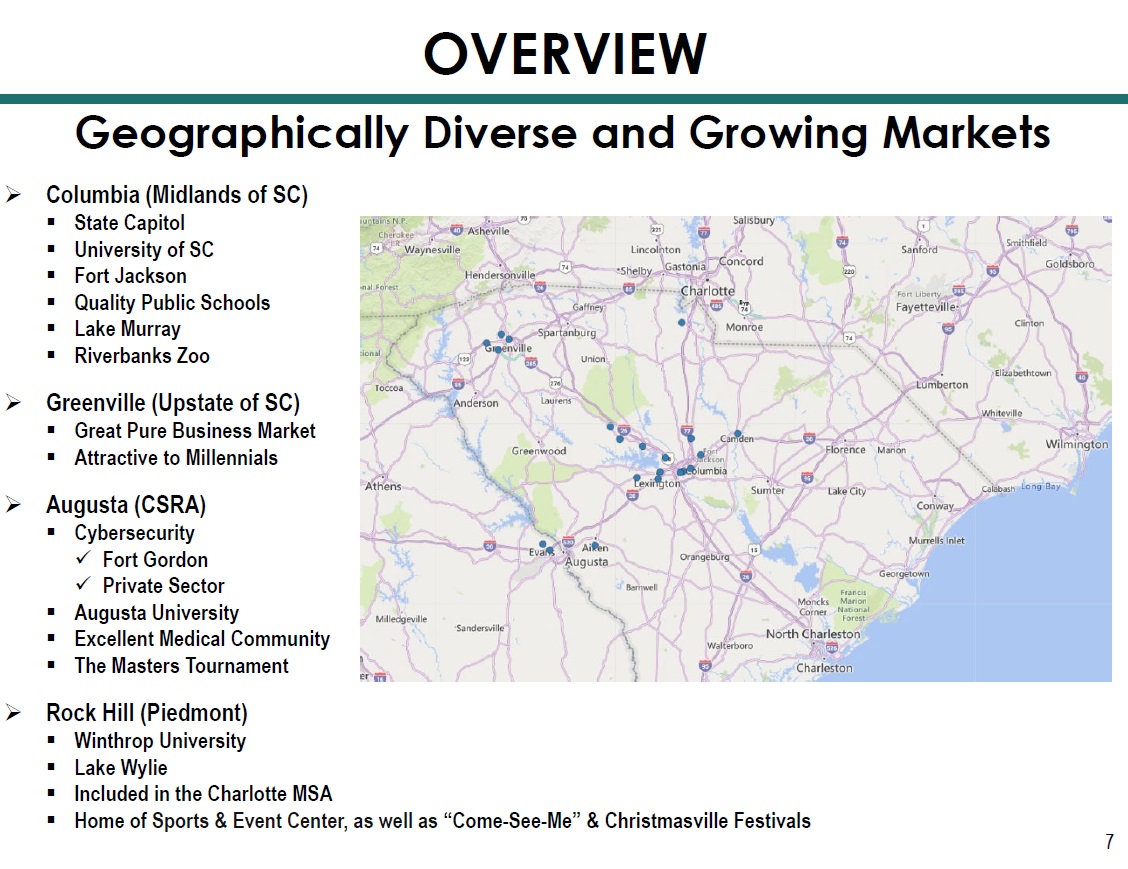
» Columbia (Midlands of SC) ▪ State Capitol ▪ University of SC ▪ Fort Jackson ▪ Quality Public Schools ▪ Lake Murray ▪ Riverbanks Zoo » Greenville (Upstate of SC) ▪ Great Pure Business Market ▪ Attractive to Millennials » Augusta (CSRA) ▪ Cybersecurity x Fort Gordon x Private Sector ▪ Augusta University ▪ Excellent Medical Community ▪ The Masters Tournament » Rock Hill (Piedmont) ▪ Winthrop University ▪ Lake Wylie ▪ Included in the Charlotte MSA ▪ Home of Sports & Event Center, as well as “Come - See - Me” & Christmasville Festivals Geographically Diverse and Growing Markets
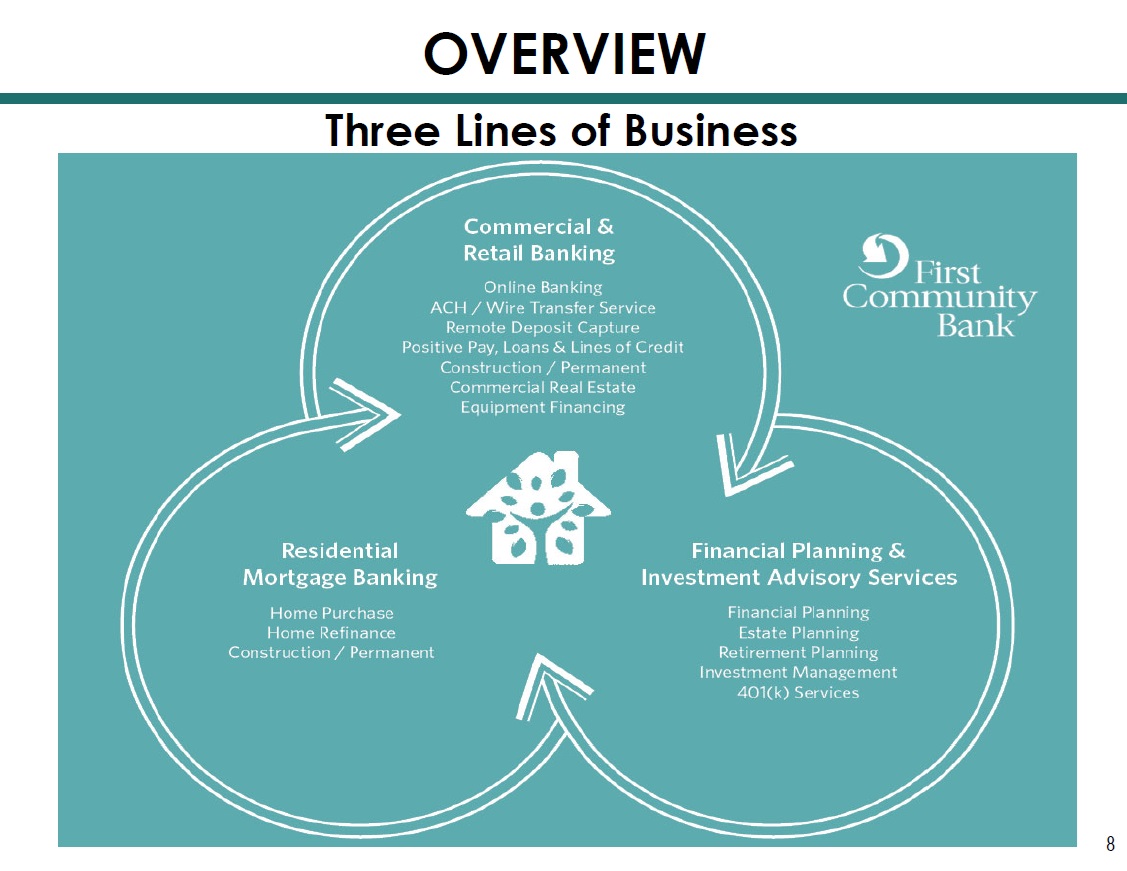
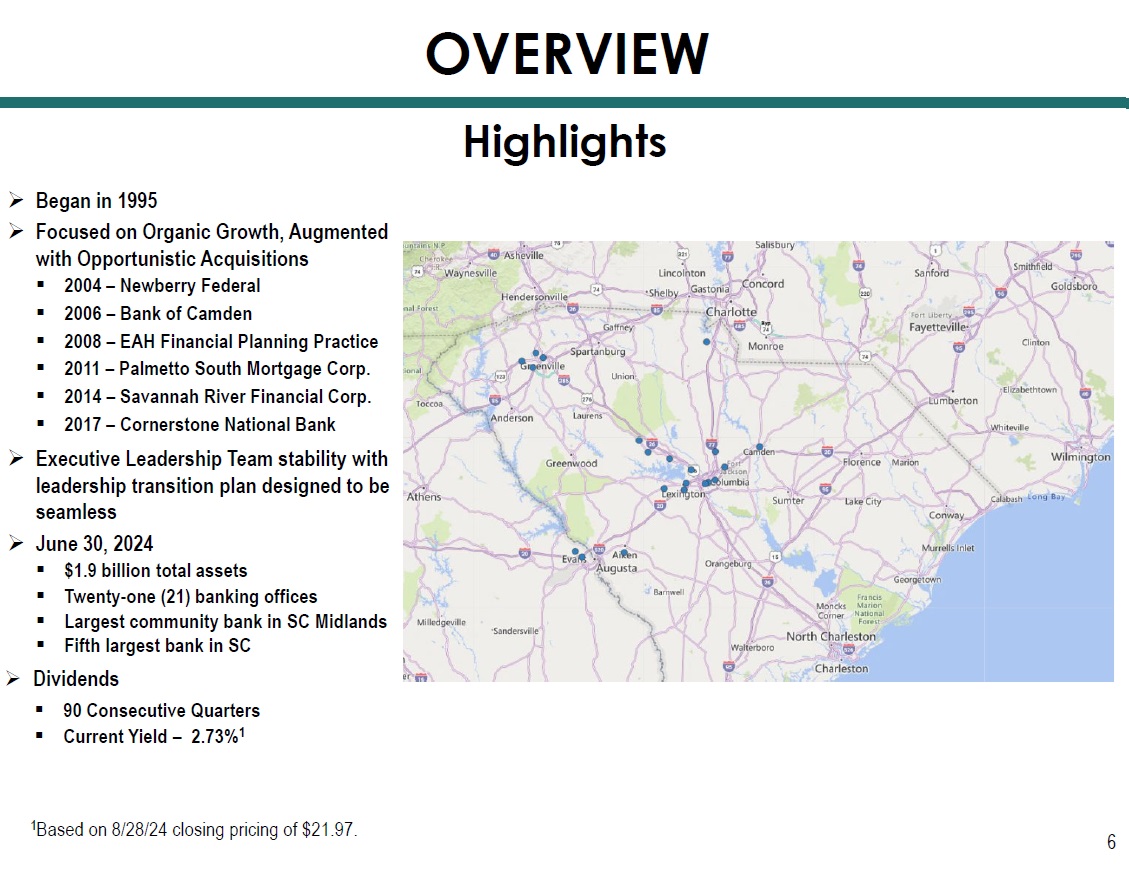
OVERVIEW

2Q24 HIGHLIGHTS / TOPICS OF INTEREST Impacting Lives for Success and Significance

Impacting Lives for Success and Significance

$863.7

Notes: 12 1 Excluding prepayments, 07/01/24 – 12.31/24 = $89.4 million and 2025 = $148.0 million. Loan Portfolio Growth EARNING ASSETS

Investment Portfolio Yield 1.98% 1.56% 2.78% 3.59% 3.66% AOCI/(AOCL) 1 $11.3 $3.3 ($32.4) ($28.2) ($27.3) (4 th Quarter for 2020 - 2023, and 2 nd Quarter for 2024) Average Life: 5.6 years Effective Duration: 3.8 Composition 6/30/24 $361.9 $564.8 $506.2 EARNING ASSETS Millions $488.6 13 $566.6 1 AOCI is accumulated other comprehensive income and (AOCL) is accumulated other comprehensive loss. $228.7
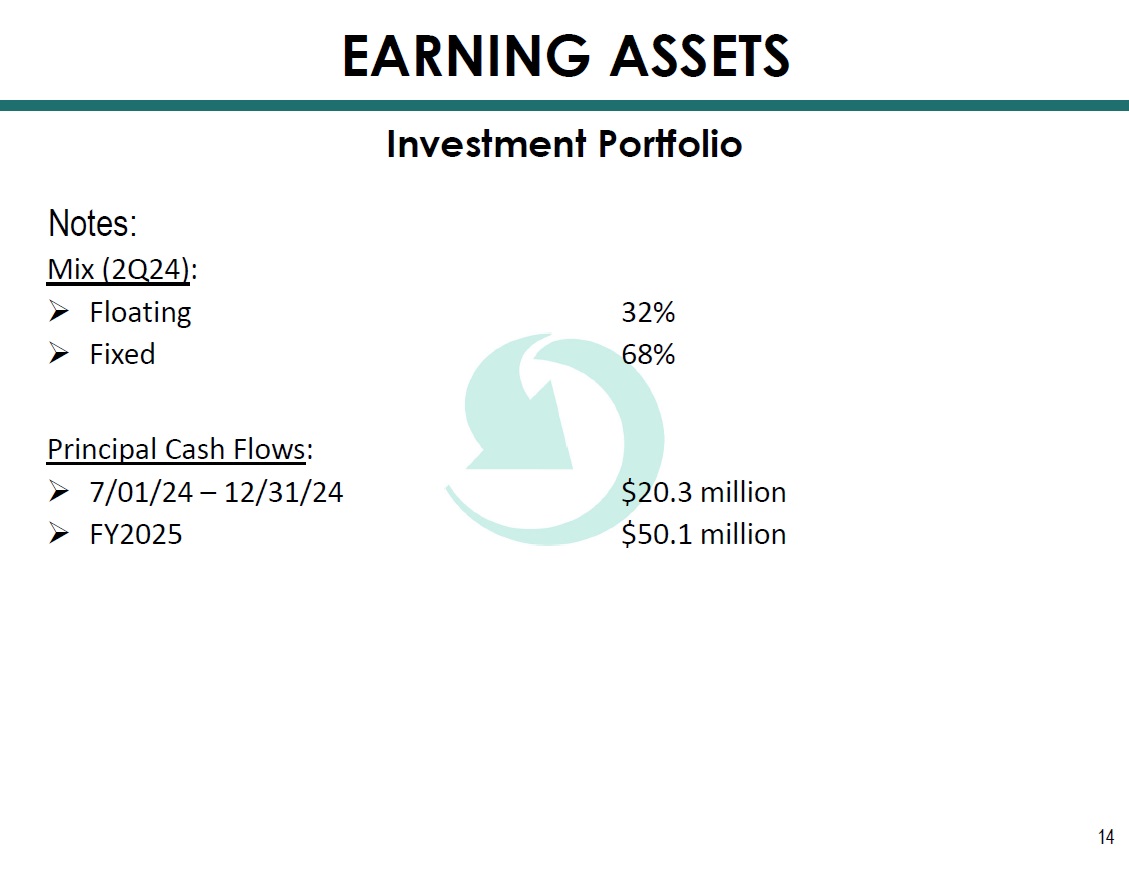
Notes: 14 Investment Portfolio EARNING ASSETS

Impacting Lives for Success and Significance

Total Deposit Cost 0.20% 0.11% 0.25% 1.69% 1.98% Non - Interest Bearing 32% 33% 33% 29% 29% Millions $1,230.3 $1,415.5 $1,454.1 $1,573.9 (4 th Quarter for 2020 - 2023 & 2 nd Quarter for 2024) 16 High Quality Deposit Franchise $1,663.8 FUNDING 12/31/2020 12/31/2021 12/31/2022 12/31/2023 06/30/2 024
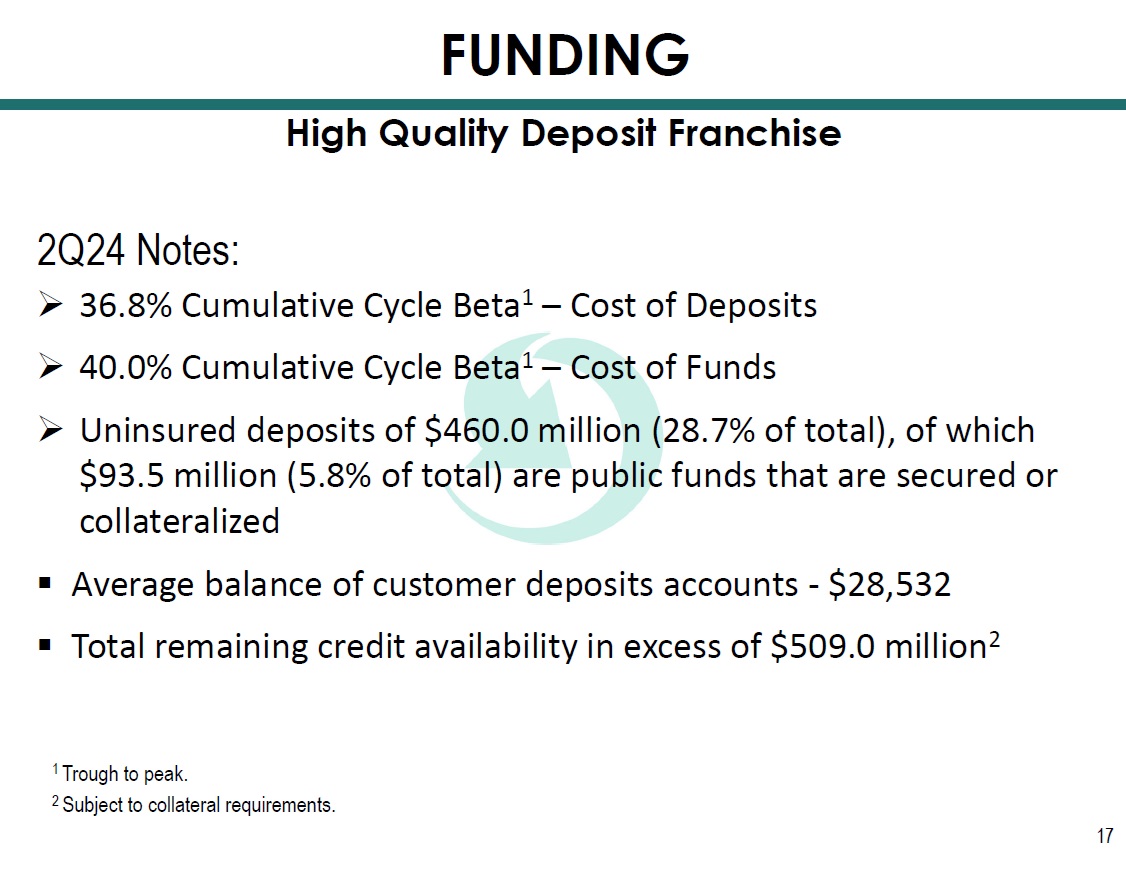
2Q24 Notes: 17 High Quality Deposit Franchise FUNDING 1 Trough to peak. 2 Subject to collateral requirements.
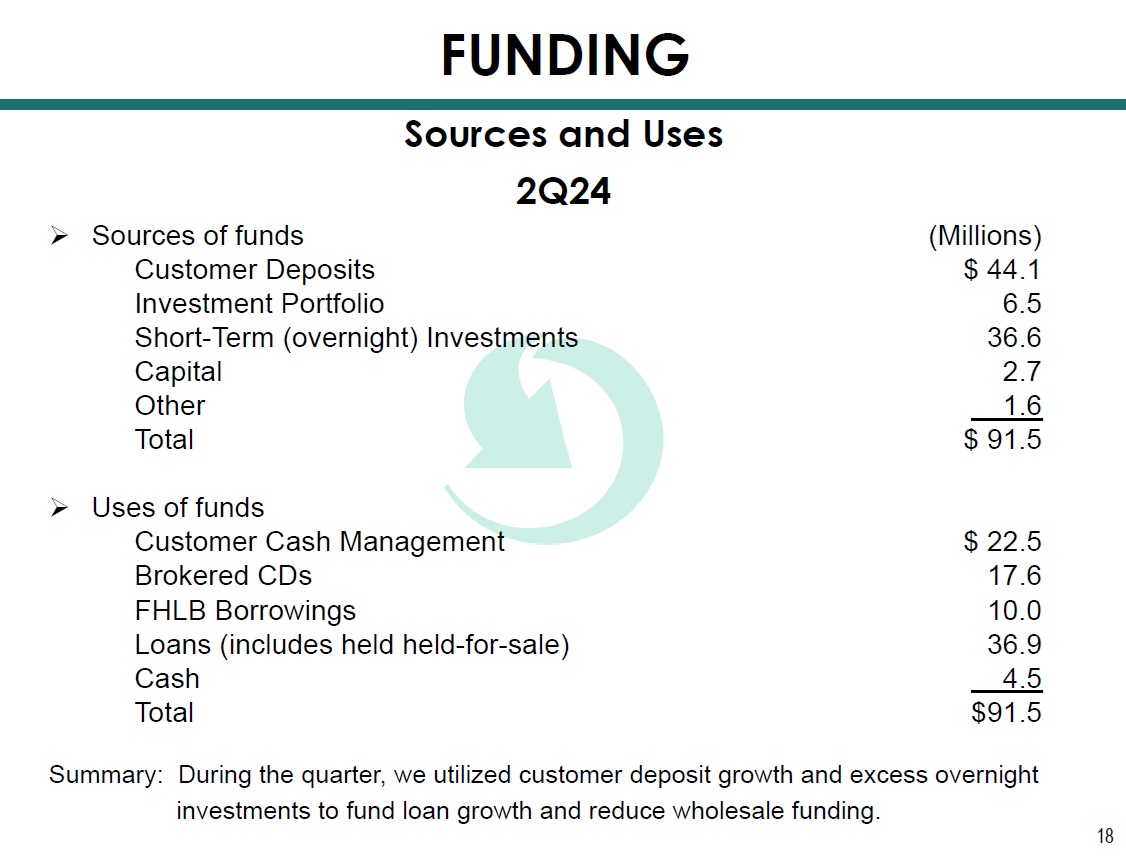
18 2Q24 » Sources of funds (Millions) Customer Deposits $ 44.1 Investment Portfolio 6.5 Short - Term (overnight) Investments 36.6 Capital 2.7 Other 1.6 Total $ 91.5 » Uses of funds Customer Cash Management $ 22.5 Brokered CDs 17.6 FHLB Borrowings 10.0 Loans (includes held held - for - sale) 36.9 Cash 4.5 Total $91.5 Summary: During the quarter, we utilized customer deposit growth and excess overnight investments to fund loan growth and reduce wholesale funding. Sources and Uses FUNDING
Impacting Lives for Success and Significance

20 NET INTEREST MARGIN (NIM)
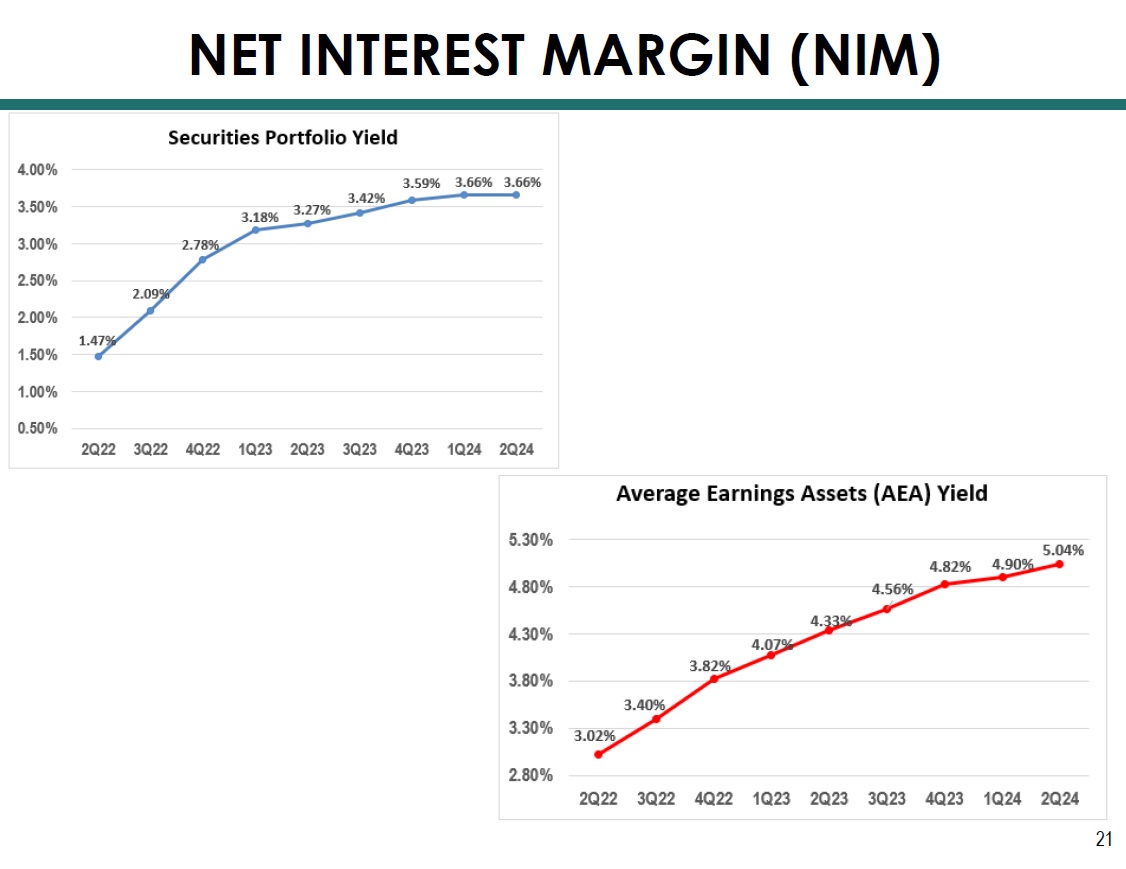
21 NET INTEREST MARGIN (NIM)
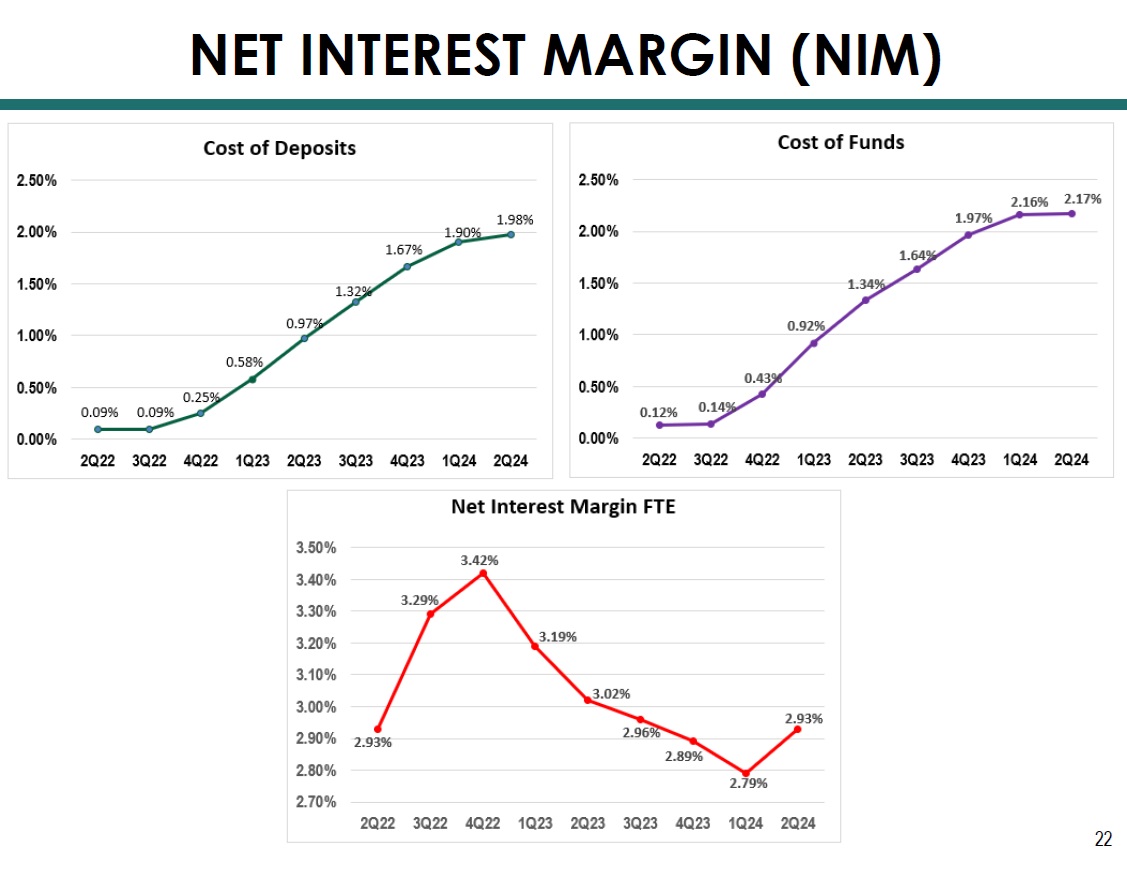
22 NET INTEREST MARGIN (NIM)
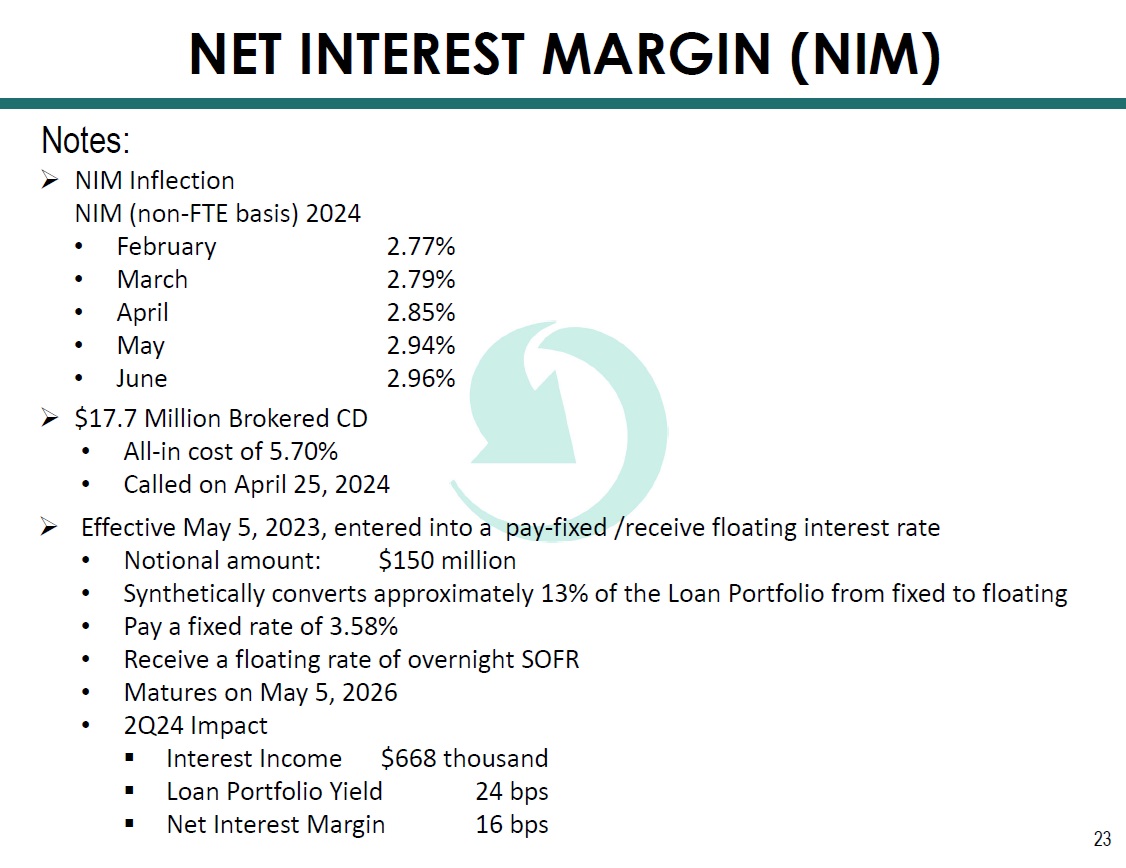
23 Notes: NET INTEREST MARGIN (NIM)
Impacting Lives for Success and Significance

25 Credit Quality RISK MANAGEMENT NPA / Assets Net Charge - Offs

26 Provision for (Release of) Credit Losses (000s omitted) Credit Quality RISK MANAGEMENT

2Q24 Notes: » Key Loan Portfolio Sectors 27 • There are only four loans secured by office buildings in excess of 50,000 square feet of rentable space. These four represent $10.6 million in loans outstanding and have a 34% weighted average loan - to - value. Credit Quality RISK MANAGEMENT
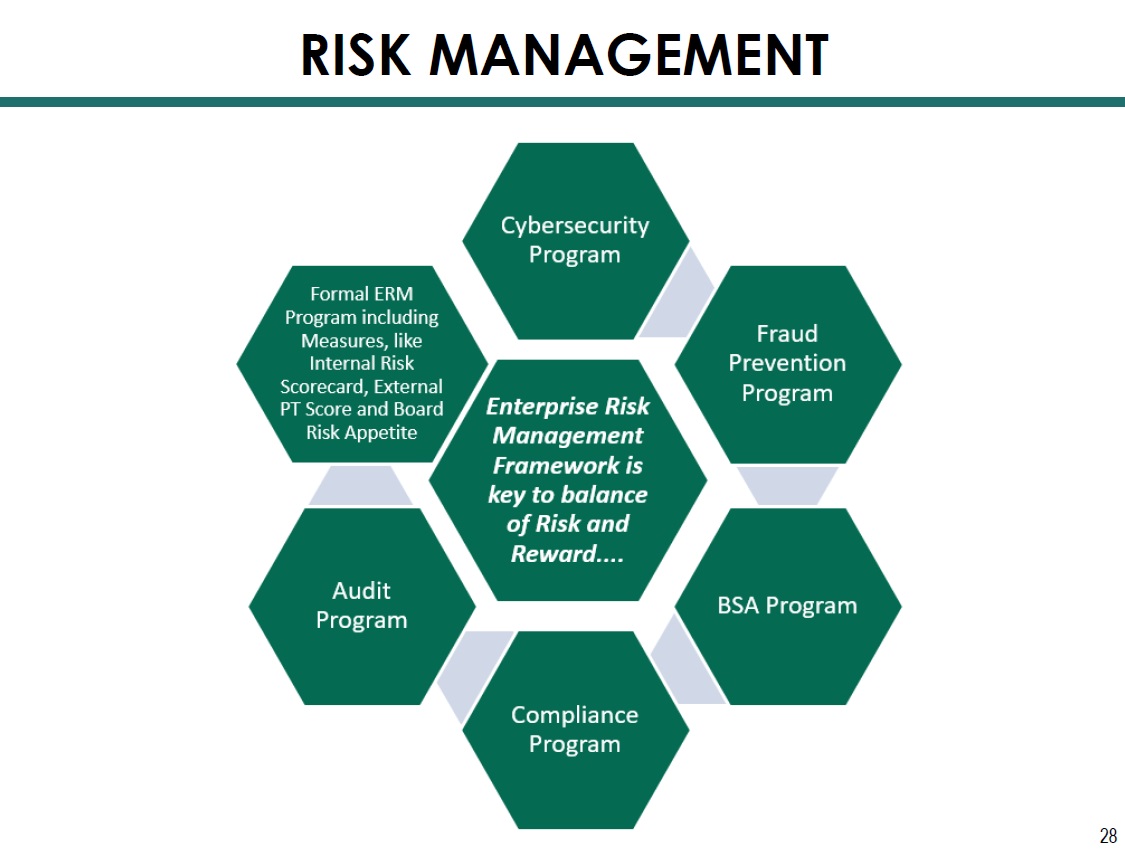
28 RISK MANAGEMENT
Impacting Lives for Success and Significance
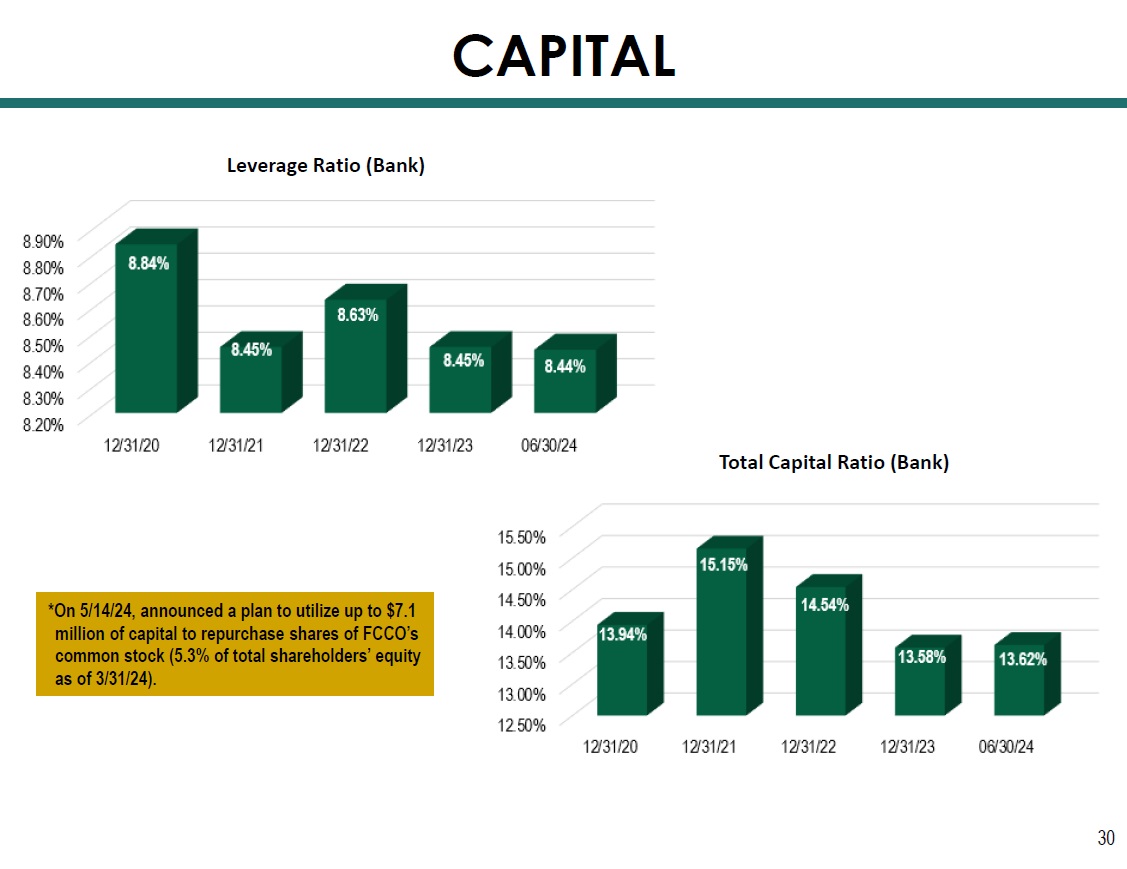
30 Leverage Ratio (Bank) Total Capital Ratio (Bank) CAPITAL *On 5/14/24, announced a plan to utilize up to $7.1 million of capital to repurchase shares of FCCO’s common stock (5.3% of total shareholders’ equity as of 3/31/24).

31 Tangible Common Equity Tangible Book Value CAPITAL

Dividend 32 CAPITAL On 7/17/24, a nnounced an increase in the cash dividend to $0.15 per common share payable 8/13/24 to shareholders of record as of 7/30/24.
Impacting Lives for Success and Significance
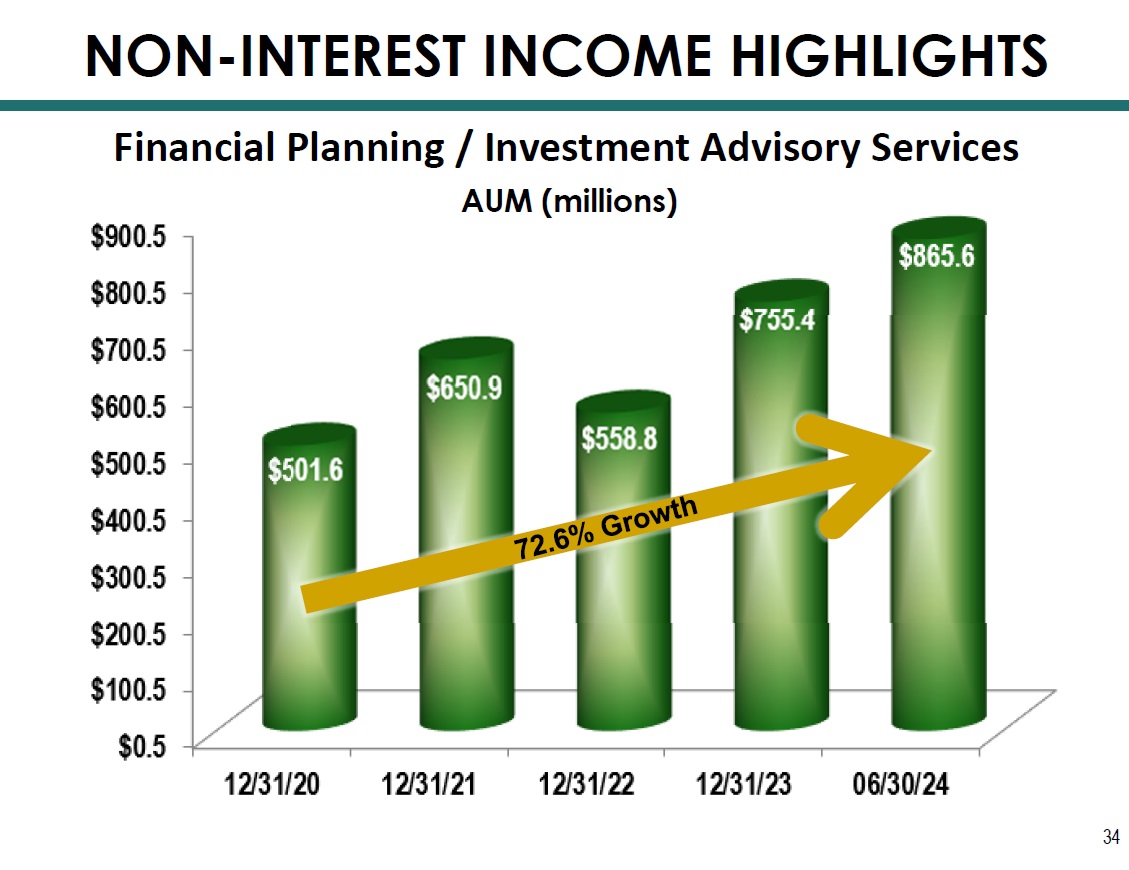
Financial Planning / Investment Advisory Services 34 NON - INTEREST INCOME HIGHLIGHTS
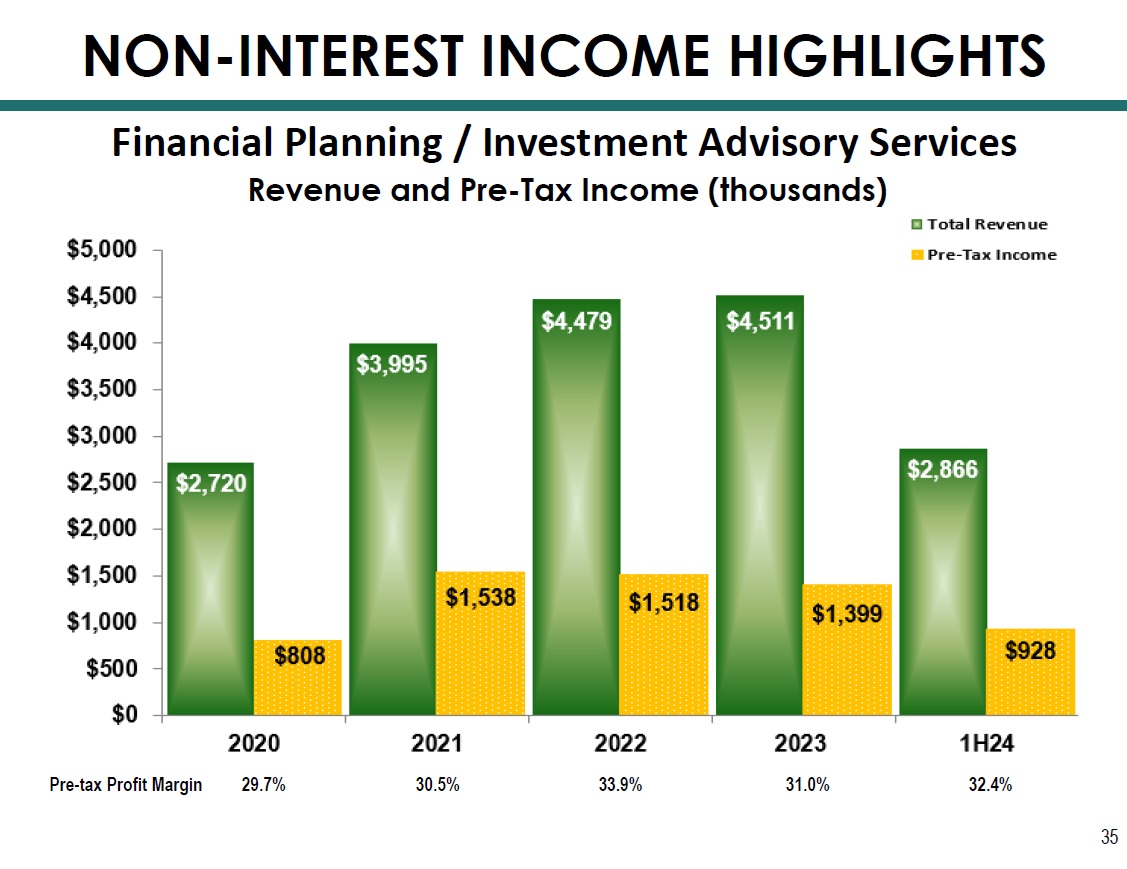
Financial Planning / Investment Advisory Services 35 Pre - tax Profit Margin 29.7% 30.5% 33.9% 31.0% 32.4% NON - INTEREST INCOME HIGHLIGHTS
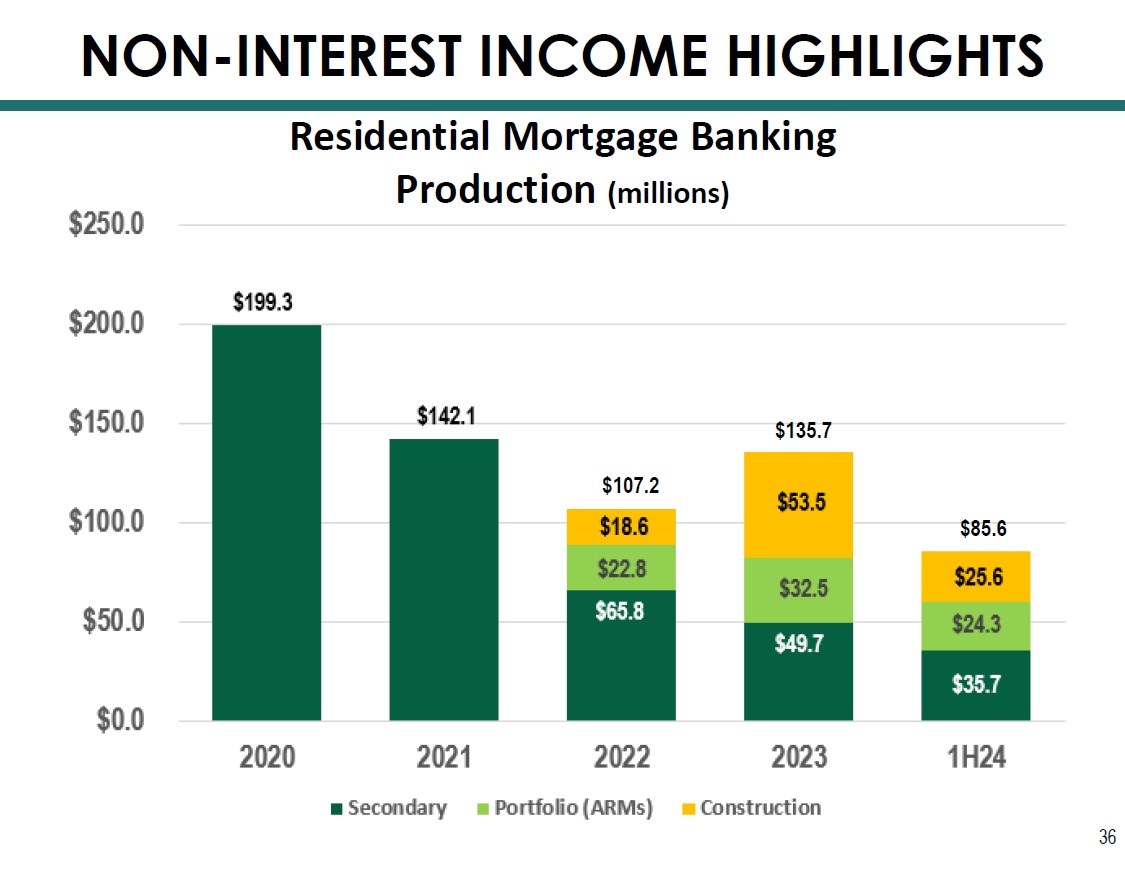
36 Residential Mortgage Banking Production (millions) NON - INTEREST INCOME HIGHLIGHTS $85.6 $107.2 $135.7
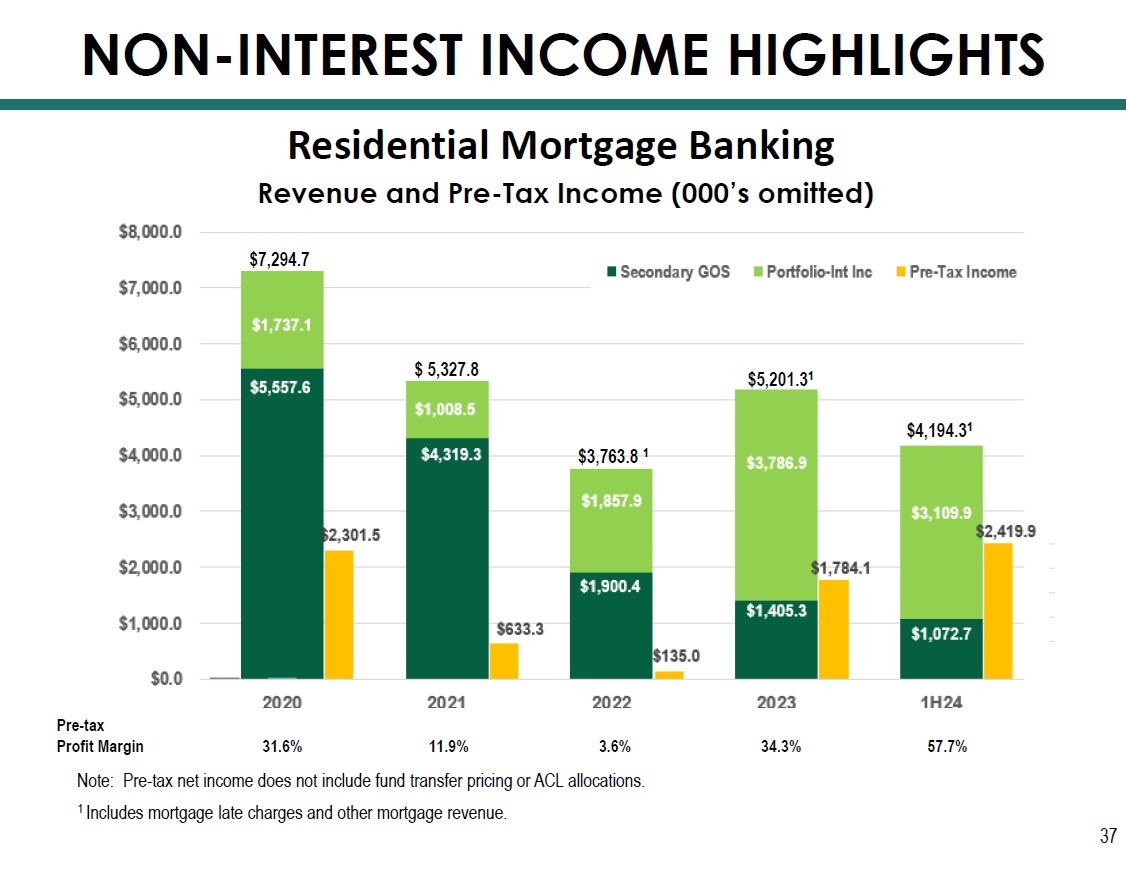
Pre - tax Profit Margin 31.6% 11.9% 3.6% 34.3% 57.7% 37 $7,294.7 $ 5,327.8 $4,194.3 1 $3,763.8 1 $5,201.3 1 Note: Pre - tax net income does not include fund transfer pricing or ACL allocations. 1 Includes mortgage late charges and other mortgage revenue. NON - INTEREST INCOME HIGHLIGHTS

Impacting Lives for Success and Significance
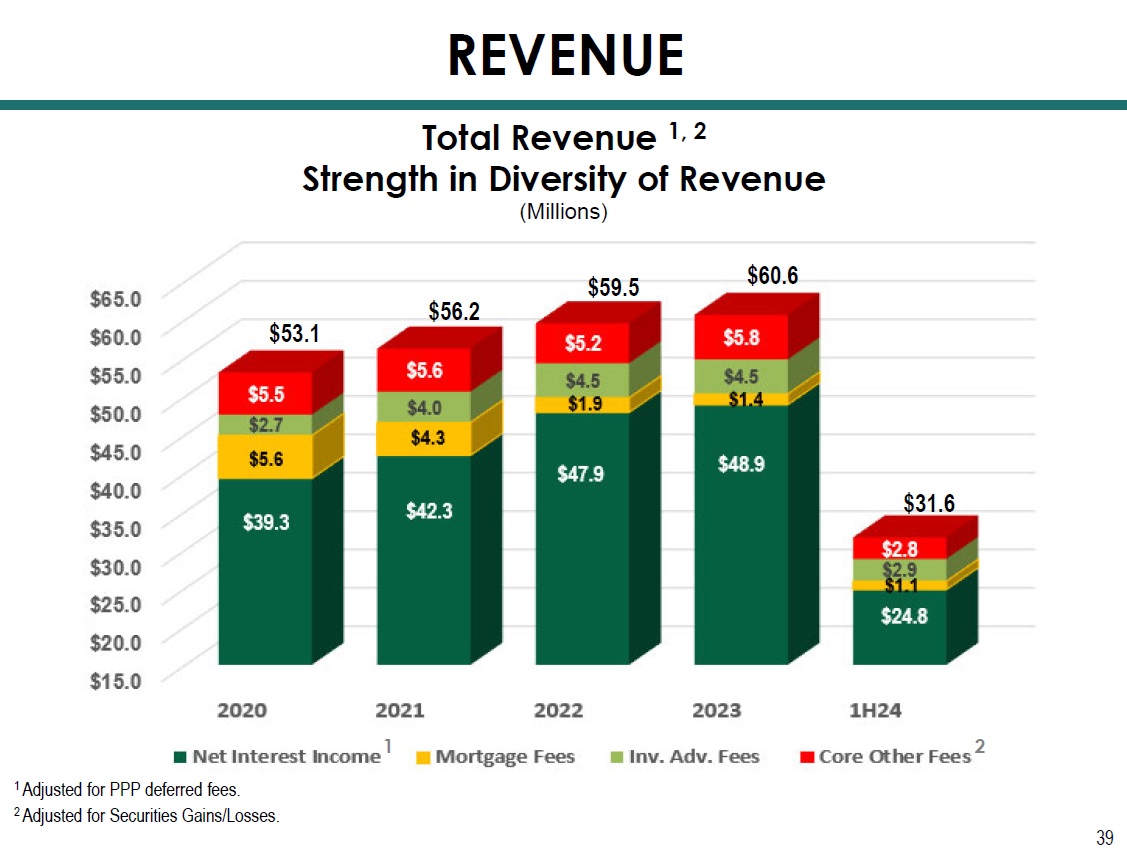
39 (Millions) $53.1 $56.2 $60.6 $59.5 Total Revenue 1, 2 Strength in Diversity of Revenue REVENUE 1 Adjusted for PPP deferred fees. 2 Adjusted for Securities Gains/Losses. 2 1 $31.6
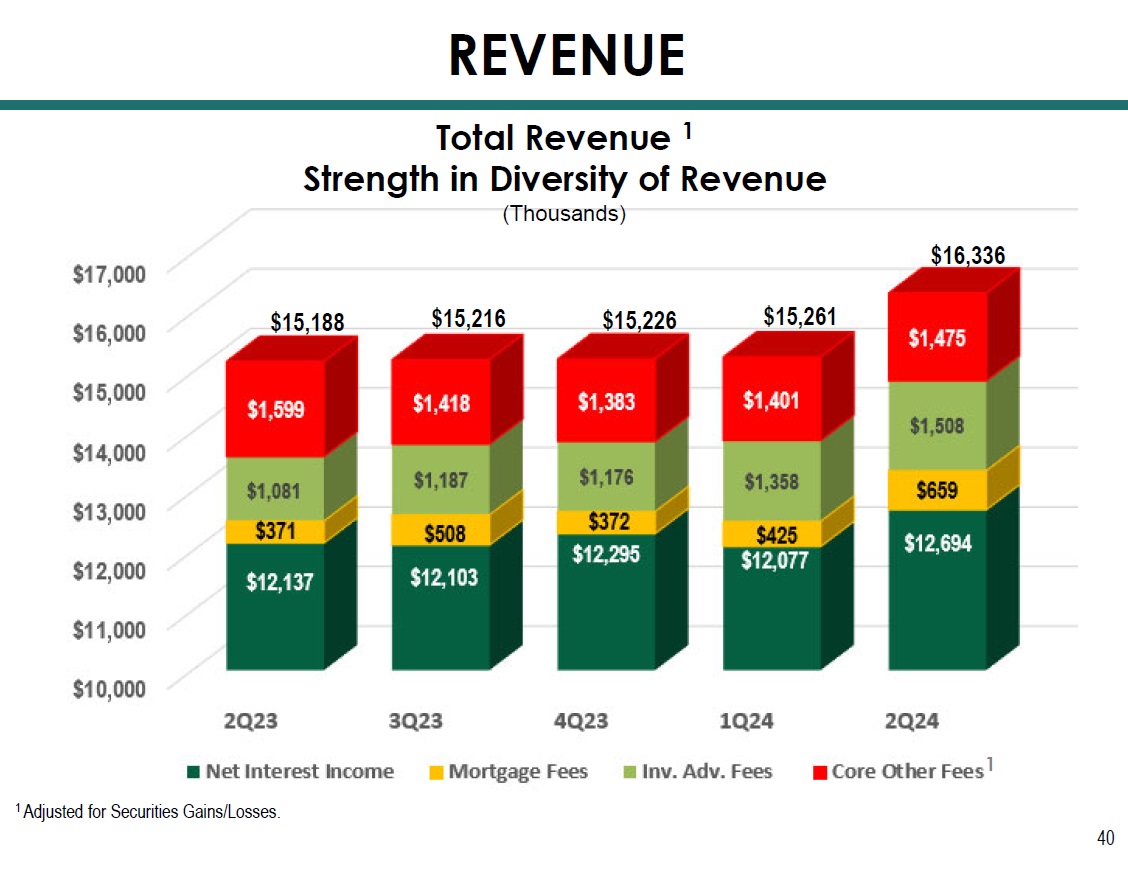
40 (Thousands) $15,188 $16,336 $15,226 Total Revenue 1 Strength in Diversity of Revenue 1 Adjusted for Securities Gains/Losses. 1 $15,216 REVENUE $15,261
Impacting Lives for Success and Significance

$43.1
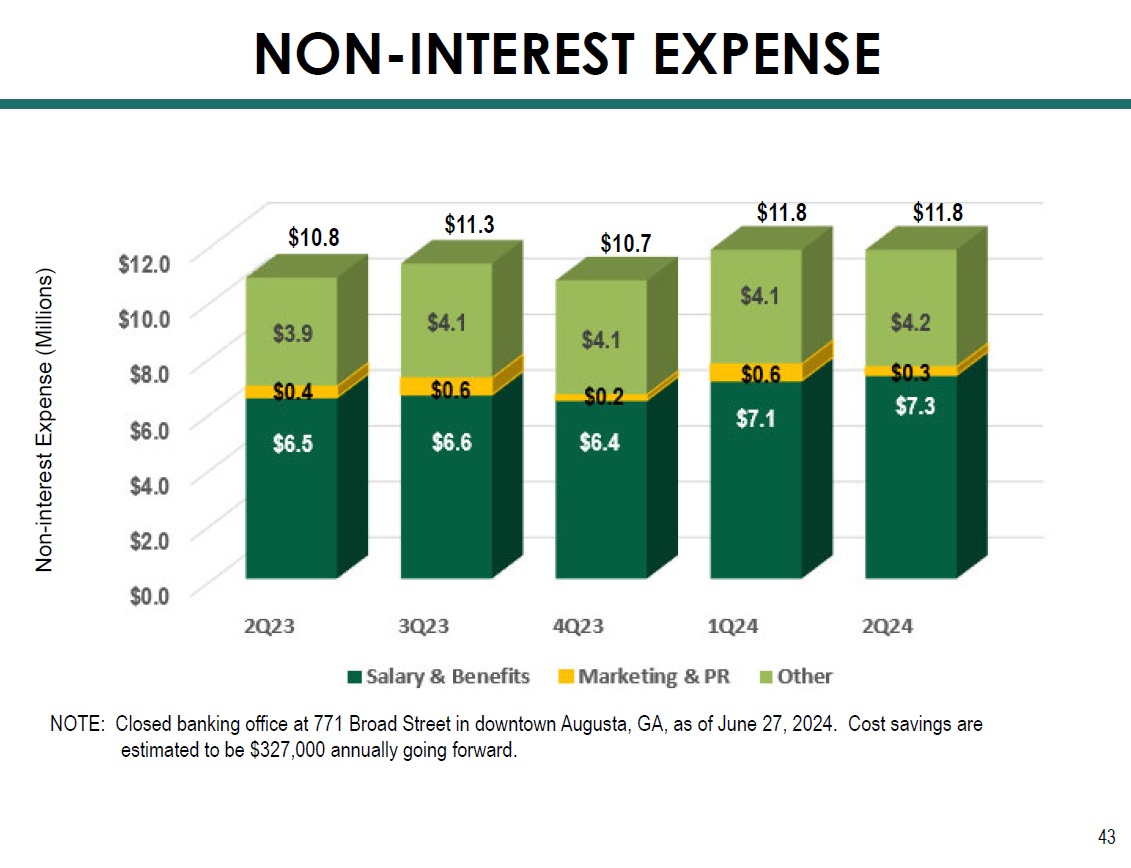
$10.7 $11.8

Impacting Lives for Success and Significance

1 Core net income and EPS exclude gains (losses) on sale of securities and bank premises, write - downs on bank premises held - for - sa le, non - recurring BOLI income, gains on insurance proceeds, and collection of summary judgements on two loans charged off at an FCCO acquired bank. S ee non - GAAP reconciliation on pages 48 and 49. 2 Includes $738 thousand in non - recurring PPP - related fee income. 3 Includes $2.955 million in non - recurring PPP - related fee income. 4 Includes $46 thousand in non - recurring PPP - related fee income. 5 This compares to 1H23 results of $6,695 thousand in Core Net Income and $0.88 in Core EPS. 6 This compares to 1H23 results of $8,929 thousand in pre - tax pre - provision earnings. Thousands Core Net Income 1 / Core EPS 1 / Pre - Tax Pre - Provision Earnings 45 NET INCOME 2 3 2 3 4 4 5 6

FORWARD - LOOKING STATEMENTS 46
NON - GAAP FINANCIAL MEASURES The Bank Behind Your Business 47 NON - GAAP FINANCIAL MEASURES – This presentation contains certain non - GAAP financial measures that are not in accordance with US generally accepted accounting principles (GAAP) . We use certain non - GAAP financial measures to provide meaningful, supplemental information regarding our operational results and to enhance investors’ overall understanding of our financial performance . The limitations associated with non - GAAP financial measures include the risk that persons might disagree as to the appropriateness of items comprising these measures and that different companies might calculate these measures differently . These disclosures should not be considered an alternative to our GAAP results . See the end of this presentation for a non - GAAP financial measures reconciliation to the most directly comparable GAAP financial measure .
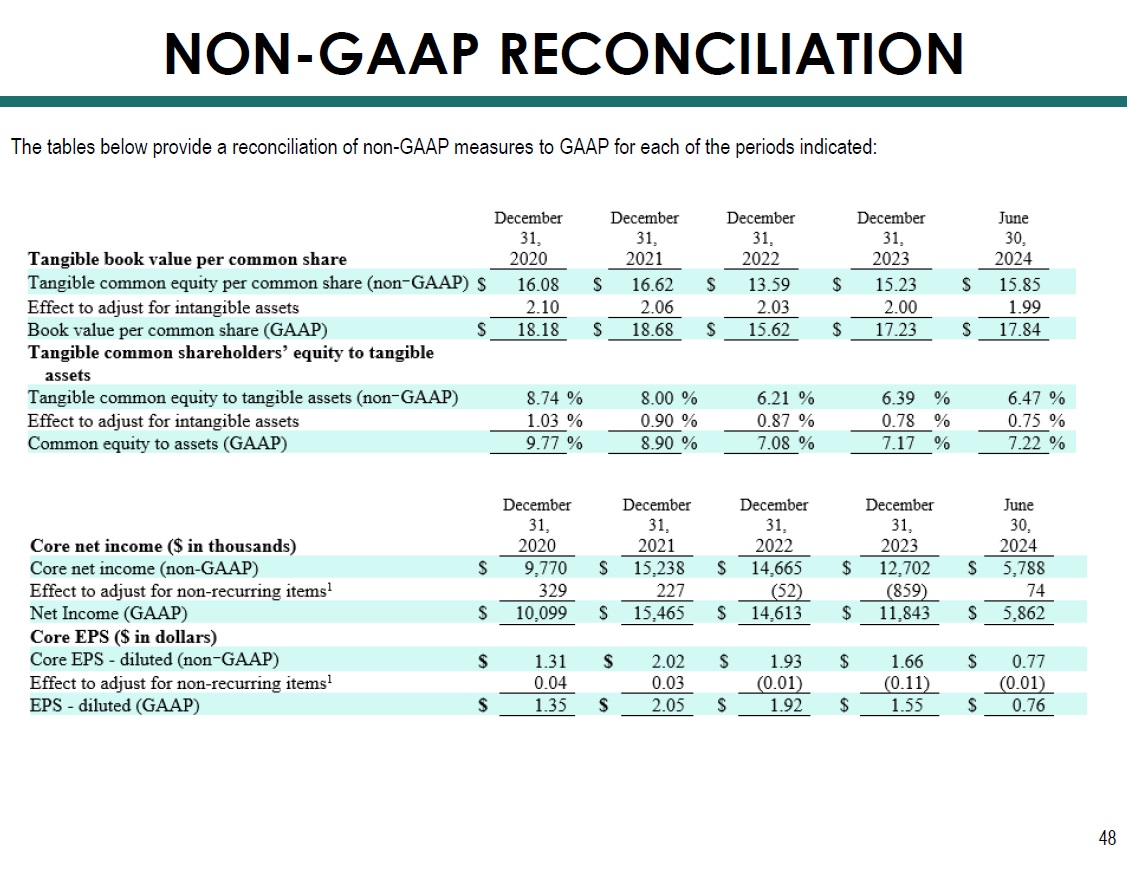
NON - GAAP RECONCILIATION 48 The tables below provide a reconciliation of non - GAAP measures to GAAP for each of the periods indicated:

NON - GAAP RECONCILIATION 49 1 Excludes gains (losses) on sale of securities and bank premises, write - downs on bank premises held - for - sale, non - recurring BOLI income, gains on insurance proceeds, and collection of summary judgements on two loans charged off at an FCCO acquired bank. The tables below provide a reconciliation of non - GAAP measures to GAAP for each of the periods indicated: