UNITED STATES
SECURITIES AND EXCHANGE COMMISSION
WASHINGTON, D.C. 20549
FORM20-F
| | ANNUAL REPORT PURSUANT TO SECTION 13 OR 15(d) OF THE SECURITIES EXCHANGE ACT OF 1934 |
for the fiscal year ended December 31, 2016
Commission File Number0-99
PETRÓLEOS MEXICANOS
(Exact name of registrant as specified in its charter)
| | |
| Mexican Petroleum | | United Mexican States |
| (Translation of registrant’s name into English) | | (Jurisdiction of incorporation or organization) |
Avenida Marina Nacional No. 329
Colonia Verónica Anzures
11300 Ciudad de México, México
(Address of principal executive offices)
Jaime José del Río Castillo
(5255) 1944 9700
ri@pemex.com
Avenida Marina Nacional No. 329
Torre Ejecutiva, Piso 38 Colonia Verónica Anzures
11300 Ciudad de México, México
(Name, telephone,e-mail and/or facsimile number
and address of company contact person)
Securities registered or to be registered pursuant to Section 12(b) of the Act.None
Securities registered or to be registered pursuant to Section 12(g) of the Act.None
Securities for which there is a reporting obligation pursuant to Section 15(d) of the Act.
Title of Each Class
|
| 3.500% Notes due 2018 |
| Floating Rate Notes due 2018 |
| 9 1⁄4% Guaranteed Bonds due 2018 |
| 8.00% Guaranteed Notes due 2019 |
| 3.500% Notes due 2020 |
| 6.375% Notes due 2021 |
| 4.875% Notes due 2022 |
| 3.500% Notes due 2023 |
| 4.625% Notes due 2023 |
| 4.250% Notes due 2025 |
| 4.500% Notes due 2026 |
| 9.50% Guaranteed Bonds due 2027 |
| 6.625% Guaranteed Bonds due 2038 |
| 5.50% Bonds due 2044 |
| 5.625% Bonds due 2046 |
| 9 1⁄4% Global Guaranteed Bonds due 2018 |
| 5.75% Guaranteed Notes due 2018 |
| 3.125% Notes due 2019 |
| 5.500% Notes due 2019 |
| 6.000% Notes due 2020 |
| 5.50% Notes due 2021 |
| 8.625% Bonds due 2022 |
| 8.625% Guaranteed Bonds due 2023 |
| 4.875% Notes due 2024 |
| 6.875% Notes due 2026 |
| 9.50% Global Guaranteed Bonds due 2027 |
| 6.625% Guaranteed Bonds due 2035 |
| 6.500% Bonds due 2041 |
| 6.375% Bonds due 2045 |
| 6.750% Bonds due 2047 |
Indicate by check mark if the registrant is awell-known seasoned issuer, as defined in Rule 405 of the Securities Act.
Yes ☐ No ☒
If this report is an annual or transition report, indicate by check mark if the registrant is not required to file reports pursuant to Section 13 or 15(d) of the Securities Exchange Act of 1934.
Yes ☐ No ☒
Indicate by check mark whether the registrant (1) has filed all reports required to be filed by Section 13 or 15(d) of the Securities Exchange Act of 1934 during the preceding 12 months (or for such shorter period that the registrant was required to file such reports), and (2) has been subject to such filing requirements for the past 90 days.
Yes ☒ No ☐
Indicate by check mark whether the registrant has submitted electronically and posted on its corporate Web site, if any, every Interactive Data File required to be submitted and posted pursuant to Rule 405 of RegulationS-T (§ 232.405 of this chapter) during the preceding 12 months (or for such shorter period that the registrant was required to submit and post such files).
N/A
Indicate by check mark whether the registrant is a large accelerated filer, an accelerated filer, anon-accelerated filer, or an emerging growth company. See the definitions of “large accelerated filer,” “accelerated filer,” and “emerging growth company” in Rule12b-2 of the Exchange Act.
| | | | | | | | | | |
| | Large accelerated filer | | ☐ | | Accelerated filer | | ☐ | | |
| | Non-accelerated filer | | ☒ | | Emerging growth company | | ☐ | | |
If an emerging growth company that prepares its financial statements in accordance with U.S. GAAP, indicate by check mark if the registrant has elected not to use the extended transition period for complying with any new or revised financial accounting standards† provided pursuant to Section 13(a) of the Exchange Act. ☐
| † | The term “new or revised financial accounting standard” refers to any update issued by the Financial Accounting Standards Board to its Accounting Standards Codification after April 5, 2012. |
Indicate by check mark which basis of accounting the registrant has used to prepare the financial statements included in this filing:
U.S. GAAP ☐ IFRS as issued by the IASB ☒ Other ☐
If “Other” has been checked in response to the previous question, indicate by check mark which financial statement item the registrant has elected to follow.
Item 17 ☐ Item 18 ☐
If this is an annual report, indicate by check mark whether the registrant is a shell company (as defined in Rule12b-2 of the Exchange Act).
Yes ☐ No ☒
TABLE OF CONTENTS
i
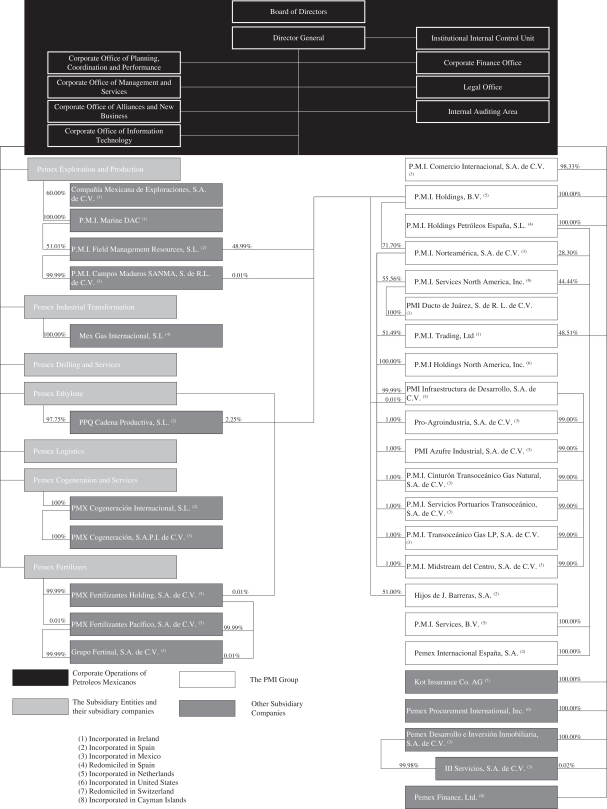
Petróleos Mexicanos and its seven subsidiary entities, which we refer to as the subsidiary entities,Pemex Exploración y Producción (Pemex Exploration and Production),Pemex Transformación Industrial (Pemex Industrial Transformation),Pemex Perforación y Servicios (Pemex Drilling and Services),Pemex Logística (Pemex Logistics),Pemex Cogeneración y Servicios (Pemex Cogeneration and Services),Pemex Fertilizantes (Pemex Fertilizers) andPemex Etileno (Pemex Ethylene), comprise the state oil and gas company of the United Mexican States, which we refer to as Mexico. Petróleos Mexicanos is a productivestate-owned company of the Federal Government of Mexico, which we refer to as the Mexican Government, and each of the subsidiary entities is a productivestate-owned subsidiary of Mexico. Each of Petróleos Mexicanos and the subsidiary entities is a legal entity empowered to own property and carry on business in its own name. In addition, a number of subsidiary companies that are defined in Note 1 and listed in Note 4 to our consolidated financial statements incorporated in Item 18, which we refer to as our subsidiary companies, are incorporated into the consolidated financial statements; these subsidiary companies are also identified with their corresponding ownership percentages in “—Consolidated Structure of PEMEX” on page 4. As further described under “Item 4—Information on the Company—History and Development—Corporate Reorganization,” the seven new subsidiary entities assumed, on or prior to, November 1, 2015, all of the rights and obligations of the prior subsidiary entities of Petróleos Mexicanos—Pemex-Exploración y Producción(Pemex-Exploration and Production),Pemex-Refinación(Pemex-Refining),Pemex-Gas y Petroquímica Básica(Pemex-Gas and Basic Petrochemicals) andPemex-Petroquímica(Pemex-Petrochemicals). References to the subsidiary entities prior to this corporate reorganization refer toPemex-Exploration and Production,Pemex-Refining,Pemex-Gas and Basic Petrochemicals andPemex-Petrochemicals. Petróleos Mexicanos, the subsidiary entities and the subsidiary companies are collectively referred to as “PEMEX” or “we.” See “Item 4—Information on the Company—History and Development—Energy Reform” for more details.
References herein to “U.S. $,” “$,” “U.S. dollars” or “dollars” are to United States dollars. References herein to “pesos” or “Ps.” are to the legal currency of Mexico. References herein to “euros” or “€” are to the legal currency of the European Economic and Monetary Union. References herein to “pounds” or “£” are to the legal currency of the United Kingdom. References herein to “Swiss francs” or “CHF” are to the legal currency of the Swiss Confederation. References herein to “Japanese yen” or “¥” are to the legal currency of Japan. References herein to “Australian dollars” or “AUD” are to the legal currency of Australia. The term “billion” as used herein means one thousand million.
Our consolidated financial statements included in this annual report were prepared in accordance with International Financial Reporting Standards as issued by the International Accounting Standards Board. We refer in this report to “International Financial Reporting Standards as issued by the International Accounting Standards Board” as IFRS. In addition, these financial statements were audited in accordance with the International Standards on Auditing, as required by theLey del Mercado de Valores (Securities Market Law) and theDisposiciones de carácter general aplicables a las emisoras de valores y a otros participantes del mercado de valores(General Provisions applicable to issuers of securities and other participants in the securities market) in each case, of Mexico, for purposes of filing with theComisiónNacional Bancaria y de Valores (National Banking and Securities Commission, or the CNBV) and theBolsa Mexicana de Valores, S.A.B. de C.V.(Mexican Stock Exchange, or the BMV), and in accordance with the standards of the Public Company Accounting Oversight Board (United States), or PCAOB, for purposes of filings with the U.S. Securities and Exchange Commission, or the SEC.
The regulations of the SEC do not require foreign private issuers that prepare their financial statements on the basis of IFRS to reconcile such financial statements to United States Generally Accepted Accounting Principles, which we refer to as U.S. GAAP. Accordingly, while we have in the past reconciled our consolidated financial statements prepared in accordance withNormas de Información Financiera Mexicanas(Mexican Financial Reporting Standards, or Mexican FRS) to U.S. GAAP, those reconciliations are no longer presented in our filings with the SEC. We do, however, continue to provide the disclosure required under the U.S. Financial Accounting Standards Board Accounting Standards Codification (ASC) Topic 932 “Extractive Activities—Oil and Gas” (which we refer to as ASC Topic 932), as this is required regardless of the basis of accounting on which we prepare our financial statements.
We maintain our consolidated financial statements and accounting records in pesos. Unless otherwise indicated, we have translated all peso amounts to U.S. dollars in this Form20-F, including all convenience translations of our consolidated financial statements included herein, at an exchange rate of Ps. 20.6640 = U.S. $1.00, which is the exchange rate that the Secretaría de Hacienda y Crédito Público (Ministry of Finance and Public Credit) instructed us to use on December 31, 2016. You should not construe these translations from pesos into dollars as actually representing such U.S. dollar amounts or meaning that you could convert such amounts into U.S. dollars at the rates indicated. Mexico has a free market for foreign exchange, and the Mexican Government allows the peso to float freely against the U.S. dollar. There can be no assurance that the Mexican Government will maintain its current policies with regard to the peso or that the peso will not depreciate or appreciate significantly in the future. Due to the volatility of the peso/U.S. dollar exchange rate, the exchange rate on any date subsequent to the date hereof could be materially different from the rate indicated above. See “Item 3—Key Information—Exchange Rates” for information regarding the rates of exchange between pesos and U.S. dollars.
PRESENTATION OF INFORMATION CONCERNING RESERVES
The proved hydrocarbon reserves included in this report for the year ended December 31, 2016 are those that we have the right to extract and sell based on assignments granted by the Mexican Government to us in August 2014 through the process commonly referred to as Round Zero. See “Item 4—Information on the Company—History and Development—Energy Reform” for a description of the Round Zero process.
The estimates of our proved reserves of crude oil and natural gas for the five years ended December 31, 2016 included in this report have been calculated according to the technical definitions required by the SEC. DeGolyer and MacNaughton, Netherland, Sewell International, S. de R.L. de C.V. (which we refer to as Netherland Sewell) and Ryder Scott Company, L.P. (which we refer to as Ryder Scott) conducted reserves audits of our estimates of our proved hydrocarbon reserves as of December 31, 2016 or January 1, 2017, as applicable. All reserves estimates involve some degree of uncertainty. For a description of the risks relating to reserves and reserves estimates, see “Item 3—Key Information—Risk Factors—Risk Factors Related to our Relationship with the Mexican Government—Information on Mexico’s hydrocarbon reserves is based on estimates, which are uncertain and subject to revisions,” “—We must make significant capital expenditures to maintain our current production levels, and to maintain, as well as increase, the proved hydrocarbon reserves assigned to us by the Mexican Government. Reductions in our income, adjustments to our capital expenditures budget and our inability to obtain financing may limit our ability to make capital investments” and “—The Mexican nation, not us, owns the hydrocarbon reserves located in the subsoil in Mexico and our right to continue to extract these reserves is subject to the approval of the Ministry of Energy.”
FORWARD-LOOKING STATEMENTS
This Form20-F contains words, such as “believe,” “expect,” “anticipate” and similar expressions that identifyforward-looking statements, which reflect our views about future events and financial performance. We have madeforward-looking statements that address, among other things, our:
| | • | | exploration and production activities, including drilling; |
| | • | | activities relating to import, export, refining, petrochemicals and transportation, storage and distribution of petroleum, natural gas and oil products; |
| | • | | activities relating to our lines of business, including the generation of electricity; |
| | • | | projected and targeted capital expenditures and other costs, commitments and revenues; |
| | • | | trends in international crude oil and natural gas prices; |
2
| | • | | liquidity and sources of funding, including our ability to continue operating as a going concern; |
| | • | | strategic alliances with other companies; and |
| | • | | the monetization of certain of our assets. |
Actual results could differ materially from those projected in suchforward-looking statements as a result of various factors that may be beyond our control. These factors include, but are not limited to:
| | • | | changes in international crude oil and natural gas prices; |
| | • | | effects on us from competition, including on our ability to hire and retain skilled personnel; |
| | • | | limitations on our access to sources of financing on competitive terms; |
| | • | | our ability to find, acquire or gain access to additional reserves and to develop, either on our own or with our strategic partners, the reserves that we obtain successfully; |
| | • | | uncertainties inherent in making estimates of oil and gas reserves, including recently discovered oil and gas reserves; |
| | • | | technical difficulties; |
| | • | | significant developments in the global economy; |
| | • | | significant economic or political developments in Mexico, including fluctuations in thepeso-U.S. dollar exchange rate or in the rate of inflation; |
| | • | | developments affecting the energy sector; and |
| | • | | changes in our legal regime or regulatory environment, including tax and environmental regulations. |
Accordingly, you should not place undue reliance on theseforward-looking statements. In any event, these statements speak only as of their dates, and we undertake no obligation to update or revise any of them, whether as a result of new information, future events or otherwise.
For a discussion of important factors that could cause actual results to differ materially from those contained in anyforward-looking statement, see “Item 3—Key Information—Risk Factors.”
3
4
PART I
| Item 1. | Identity of Directors, Senior Management and Advisers |
Not applicable.
| Item 2. | Offer Statistics and Expected Timetable |
Not applicable.
SELECTED FINANCIAL DATA
The selected statement of comprehensive income (loss), statement of financial position and cash flows data set forth below as of and for the five years ended December 31, 2016 have been derived from, and should be read in conjunction with, our consolidated financial statements as of December 31, 2015 and 2016 and for the years ended December 31, 2014, 2015 and 2016, which are included in Item 18 of this report. Our consolidated financial statements for the fiscal year ended December 31, 2012 were audited by KPMG Cárdenas Dosal, S.C., an independent registered public accounting firm. Our consolidated financial statements for each of the fiscal years ended December 31, 2013, 2014, 2015 and 2016 were audited by Castillo Miranda y Compañía, S.C. (which we refer to as BDO Mexico), an independent registered public accounting firm. Certain amounts in the consolidated financial statements for the years ended December 31, 2012, 2013, 2014 and 2015 have been reclassified to conform the presentation of the amounts in the consolidated financial statements for the year ended December 31, 2016. These reclassifications are not significant to the consolidated financial statements and had no impact on our consolidated net income (loss).
As detailed below, for the years ended December 31, 2016 and 2015, we recognized net losses of Ps. 191.1 billion and Ps. 712.6 billion, respectively. In addition, we had negative equity as of December 31, 2016 and 2015 of Ps. 1,233.0 billion and Ps. 1,331.7 billion, respectively, which resulted in a negative working capital of Ps. 70.8 billion and Ps. 176.2 billion, respectively, and negative cash flows from operating activities of Ps. 41.5 billion for the year ended December 31, 2016. This has led our independent auditors to state in their most recent audit report that there is important uncertainty and significant doubt about our ability to continue as a going concern. We have disclosed the circumstances that have caused these negative trends and the actions we are taking to face them and have concluded that we continue to operate as a going concern. Accordingly, we have prepared our consolidated financial statements on a going concern basis, which assumes that we can meet our payment obligations. For more information on the actions that we are taking to face these negative trends, see “Item 5—Operating and Financial Review and Prospects—Overview” and “Item 5—Operating and Financial Review and Prospects—Liquidity and Capital Resources.”
5
Selected Financial Data of PEMEX
| | | | | | | | | | | | | | | | | | | | | | | | |
| | | Year ended December 31, (1) | |
| | | 2012 | | | 2013 | | | 2014 | | | 2015 | | | 2016 | | | 2016(2) | |
| | | (in millions of pesos, except ratios) | | | (in millions of
U.S. dollars) | |
Statement of Comprehensive Income (Loss) Data | | | | | | | | | | | | | | | | | | | | | | | | |
Net sales | | | Ps. 1,646,912 | | | | Ps. 1,608,205 | | | | Ps. 1,586,728 | | | | Ps. 1,166,362 | | | | Ps. 1,079,546 | | | U.S.$ | 52,243 | |
Operating income | | | 905,339 | | | | 727,622 | | | | 615,480 | | | | (154,387 | ) | | | 424,350 | | | | 20,536 | |
Financing income | | | 2,532 | | | | 8,736 | | | | 3,014 | | | | 14,991 | | | | 13,749 | | | | 665 | |
Financing cost | | | (46,011 | ) | | | (39,586 | ) | | | (51,559 | ) | | | (67,774 | ) | | | (98,844 | ) | | | (4,783 | ) |
Derivative financial instruments (cost) income—Net | | | (6,258 | ) | | | 1,311 | | | | (9,439 | ) | | | (21,450 | ) | | | (14,000 | ) | | | (678 | ) |
Exchange (loss) gain—Net | | | 44,846 | | | | (3,951 | ) | | | (76,999 | ) | | | (154,766 | ) | | | (254,012 | ) | | | (12,292 | ) |
Net (loss) income for the period | | | 2,600 | | | | (170,058 | ) | | | (265,543 | ) | | | (712,567 | ) | | | (191,144 | ) | | | (9,250 | ) |
Statement of Financial Position Data (end of period) | | | | | | | | | | | | | | | | | | | | | | | | |
Cash and cash equivalents | | | 119,235 | | | | 80,746 | | | | 117,989 | | | | 109,369 | | | | 163,532 | | | | 7,914 | |
Total assets | | | 2,024,183 | | | | 2,047,390 | | | | 2,128,368 | | | | 1,775,654 | | | | 2,329,886 | | | | 112,751 | |
Long-term debt | | | 672,618 | | | | 750,563 | | | | 997,384 | | | | 1,300,873 | | | | 1,807,004 | | | | 87,447 | |
Totallong-term liabilities | | | 2,059,445 | | | | 1,973,446 | | | | 2,561,930 | | | | 2,663,922 | | | | 3,136,704 | | | | 151,793 | |
Total equity (deficit) | | | (271,066 | ) | | | (185,247 | ) | | | (767,721 | ) | | | (1,331,676 | ) | | | (1,233,008 | ) | | | (59,669 | ) |
Statement of Cash Flows | | | | | | | | | | | | | | | | | | | | | | | | |
Depreciation and amortization | | | 140,538 | | | | 148,492 | | | | 143,075 | | | | 167,951 | | | | 150,439 | | | | 7,280 | |
Acquisition of wells, pipelines, properties, plant and equipment(3) | | | 197,509 | | | | 245,628 | | | | 230,679 | | | | 253,514 | | | | 188,389 | | | | 9,117 | |
Other Financial Data | | | | | | | | | | | | | | | | | | | | | | | | |
Ratio of earnings to fixed charges(4)(5) | | | 1.01 | | | | — | | | | — | | | | — | | | | — | | | | — | |
| (1) | Includes Petróleos Mexicanos, the subsidiary entities and the subsidiary companies listed in Note 4 to our consolidated financial statements included herein. |
| (2) | Translations into U.S. dollars of amounts in pesos have been made at the exchange rate established by the Ministry of Finance and Public Credit for accounting purposes of Ps. 20.6640 = U.S. $1.00 at December 31, 2016. Such translations should not be construed as a representation that the peso amounts have been or could be converted into U.S. dollar amounts at the foregoing or any other rate. |
| (3) | Includes capitalized financing cost. See Note 12 to our consolidated financial statements included herein and “Item 5—Operating and Financial Review and Prospects—Liquidity and Capital Resources.” |
| (4) | Earnings, for this purpose, consist ofpre-tax income (loss) from continuing operations before income from equity investees, plus fixed charges, minus interest capitalized during the period, plus the amortization of capitalized interest during the period and plus dividends received on equity investments.Pre-tax income (loss) is calculated after the deduction of hydrocarbon duties, but before the deduction of the hydrocarbon income tax and other income taxes. Fixed charges for this purpose consist of the sum of interest expense plus interest capitalized during the period, plus amortization premiums related to indebtedness and plus the estimated interest within rental expense. Fixed charges do not take into account exchange gain or loss attributable to our indebtedness. |
| (5) | Earnings for the years ended December 31, 2013, 2014, 2015 and 2016 were insufficient to cover fixed charges. The amount by which fixed charges exceeded earnings was Ps. 165,217 million, Ps. 283,640, Ps. 765,161 million and Ps.236,800 million for the years ended December 31, 2013, 2014, 2015 and 2016 respectively. |
Source: PEMEX’s consolidated financial statements, prepared in accordance with IFRS, as it relates to the selected statements of comprehensive income, statement of financial position and statement of cash flows data; and Petróleos Mexicanos, as it relates to other financial data.
6
EXCHANGE RATES
The following table sets forth, for the periods indicated, the high, low, average andperiod-end exchange rates for the purchase of U.S. dollars, expressed in pesos per U.S. dollar. These rates have not been restated in constant currency units.
| | | | | | | | | | | | | | | | |
Period | | Exchange Rate | |
| | | High | | | Low | | | Average(1) | | | Period End | |
Year Ended December 31, | | | | | | | | | | | | | | | | |
2011 | | | 14.254 | | | | 11.505 | | | | 12.464 | | | | 13.951 | |
2012 | | | 14.365 | | | | 12.625 | | | | 13.140 | | | | 12.964 | |
2013 | | | 13.433 | | | | 11.976 | | | | 12.857 | | | | 13.098 | |
2014 | | | 14.794 | | | | 12.846 | | | | 13.370 | | | | 14.750 | |
2015 | | | 17.358 | | | | 14.564 | | | | 15.873 | | | | 17.195 | |
2016 | | | 20.842 | | | | 17.190 | | | | 18.667 | | | | 20.617 | |
November 2016 | | | 20.842 | | | | 18.435 | | | | 20.009 | | | | 20.457 | |
December 2016 | | | 20.738 | | | | 20.223 | | | | 20.499 | | | | 20.617 | |
2017 | | | | | | | | | | | | | | | | |
January 2017 | | | 21.891 | | | | 20.753 | | | | 21.391 | | | | 20.836 | |
February 2017 | | | 20.816 | | | | 19.735 | | | | 20.301 | | | | 19.998 | |
March 2017 | | | 19.927 | | | | 18.665 | | | | 19.280 | | | | 18.829 | |
April 2017(2) | | | 18.868 | | | | 18.478 | | | | 18.701 | | | | 18.843 | |
| | (1) | Average ofmonth-end rates, except for 2016 and 2017 monthly exchange rates. |
| | (2) | For the period from April 1, 2017 to April 21, 2017. |
Source: Noon buying rate for cable transfers in New York reported by the Federal Reserve.
The noon buying rate for cable transfers in New York reported by the Federal Reserve on April 21, 2017 was Ps. 18.8425 = U.S. $1.00.
7
RISK FACTORS
Risk Factors Related to Our Operations
Crude oil and natural gas prices are volatile and low crude oil and natural gas prices adversely affect our income and cash flows and the amount of hydrocarbon reserves that we have the right to extract and sell.
International crude oil and natural gas prices are subject to global supply and demand and fluctuate due to many factors beyond our control. These factors include competition within the oil and natural gas industry, the prices and availability of alternative sources of energy, international economic trends, exchange rate fluctuations, expectations of inflation, domestic and foreign laws and government regulations, political and other events in major oil and natural gas producing and consuming nations and actions taken by oil exporting countries, trading activity in oil and natural gas and transactions in derivative financial instruments (which we refer to as DFIs) related to oil and gas.
When international crude oil, petroleum product and/or natural gas prices are low, we generally earn less revenue and, therefore, generate lower cash flows and earn less income before taxes and duties because our costs remain roughly constant. Conversely, when crude oil, petroleum product and natural gas prices are high, we earn more revenue and our income before taxes and duties increases. Crude oil export prices, which had generally traded above U.S. $75.00 per barrel since October 2009 and traded above U.S. $100.00 per barrel as of July 30, 2014, began to fall in August 2014. After a gradual decline that resulted in per barrel prices falling to U.S. $91.16 at September 30, 2014, this decline sharply accelerated in October 2014 and prices fell to U.S. $53.27 per barrel at the end of 2014, with a weighted average price for the year of 2014 of U.S. $86.00 per barrel. During 2015, the weighted average Mexican crude oil export price was approximately U.S. $44.17 per barrel and fell to U.S. $26.54 per barrel by the end of December 2015. In 2016, the weighted average Mexican crude oil export price was approximately U.S. $35.63 per barrel, falling to U.S. $18.90 per barrel on January 20, 2016, the lowest in twelve years, before rebounding to U.S. $46.53 per barrel on December 28, 2016. This decline in crude oil prices had a direct effect on our results of operations and financial condition for the year ended December 31, 2016. During the first three months of 2017, the weighted average Mexican crude oil price was U.S. $44.11 per barrel, an increase of U.S. $8.48 per barrel as compared to the 2016 weighted average Mexican crude oil export price. As of April 27, 2017, the weighted average Mexican crude oil export price was U.S. $42.25 per barrel, a slight decrease from the first three months of 2017, but an increase of U.S. $6.62 per barrel as compared to the 2016 weighted average Mexican crude oil export price. Future declines in international crude oil and natural gas prices will have a similar negative impact on our results of operations and financial condition. These fluctuations may also affect estimates of the amount of Mexico’s hydrocarbon reserves that we have the right to extract and sell. See “—Risk Factors Related to our Relationship with the Mexican Government—Information on Mexico’s hydrocarbon reserves is based on estimates, which are uncertain and subject to revisions” below and “Item 11—Quantitative and Qualitative Disclosures About Market Risk—Changes in Exposure to Main Risks—Market Risk—Hydrocarbon Price Risk.”
We have a substantial amount of indebtedness and other liabilities and are exposed to liquidity constraints, which could make it difficult for us to obtain financing on favorable terms and could adversely affect our financial condition, results of operations and ability to repay our debt and, ultimately, our ability to operate as a going concern.
We have a substantial amount of debt, which we have incurred primarily to finance the capital expenditures needed to carry out our capital investment projects. Due to our heavy tax burden, our cash flow from operations in recent years has not been sufficient to fund our capital expenditures and other expenses and, accordingly, our debt has significantly increased and our working capital has decreased. The sharp decline in oil prices that began in late 2014 has had a negative impact on our ability to generate positive cash flows, which, together with our continued heavy tax burden and increased competition from the private sector, has further exacerbated our ability to fund our capital expenditures and other expenses from cash flow from operations. Therefore, in order to develop our hydrocarbon reserves and amortize scheduled debt maturities, we will need to raise significant amounts of financing from a broad range of funding sources.
8
As of December 31, 2016, our total indebtedness, including accrued interest, was approximately U.S. $96.0 billion (Ps. 1,983.1 billion), in nominal terms, which represents a 10.6% increase (a 32.8% increase in peso terms) compared to our total indebtedness, including accrued interest, of approximately U.S. $86.8 billion (Ps. 1,493.4 billion) as of December 31, 2015. 23.5% of our existing debt as of December 31, 2016, or U.S. $22.5 billion, is scheduled to mature in the next three years. As of December 31, 2016, we had negative working capital of U.S. $3.4 billion. Our level of debt may increase further in the short or medium term and may have an adverse effect on our financial condition, results of operations and liquidity position. To service our debt and to raise funds for our capital expenditures, we have relied and may continue to rely on a combination of cash flows provided by our operations, the divestment ofnon-strategic assets, drawdowns under our available credit facilities and the incurrence of additional indebtedness. See “Item 5—Operating and Financial Review and Prospects—Liquidity and Capital Resources—Overview—Changes to Our Business Plan.”
Certain rating agencies have expressed concerns regarding: (1) our heavy tax burden, (2) the total amount of our debt; (3) the significant increase in our indebtedness over the last several years; (4) our negative free cash flow during 2016, primarily resulting from our significant capital investment projects and the low price of oil; (5) the natural decline of certain of our oil fields and lower quality of crude oil; (6) our substantial unfunded reserve for retirement pensions and seniority premiums, which was equal to U.S. $59.1 billion as of December 31, 2016; and (7) the resilience of our operating expenses notwithstanding the sharp decline in oil prices that began in late 2014. On January 29, 2016, Standard & Poor’s (S&P) rating agency downgraded ourstand-alone credit profile from “BB+” to “BB,” and on August 23, 2016 downgraded our credit outlook from stable to negative. On December 23, 2016, S&P affirmed our global foreign currency rating of “BBB+.” On March 31, 2016, Moody’s Investors Service announced the revision of our global foreign currency and local currency credit ratings from “Baa1” to “Baa3” and changed the outlook for our credit ratings to negative. On December 9, 2016, Fitch Ratings affirmed our “BBB+” global credit rating, but revised the outlook for our credit ratings from stable to negative.
Any further lowering of our credit ratings may have adverse consequences on our ability to access the financial markets and/or our cost of financing. If we were unable to obtain financing on favorable terms, this could hamper our ability to obtain further financing, invest in projects financed through debt and meet our principal and interest payment obligations with our creditors. As a result, we may be exposed to liquidity constraints and may not be able to service our debt or make the capital expenditures required to maintain our current production levels and to maintain, and increase, the proved hydrocarbon reserves assigned to us by the Mexican Government, which may adversely affect our financial condition and results of operations. See “—Risk Factors Related to our Relationship with the Mexican Government—We must make significant capital expenditures to maintain our current production levels, and to maintain, as well as increase, the proved hydrocarbon reserves assigned to us by the Mexican Government. Reductions in our income, adjustments to our capital expenditures budget and our inability to obtain financing may limit our ability to make capital investments” below.
If such constraints occur at a time when our cash flow from operations is less than the resources necessary to fund our capital expenditures or to meet our debt service obligations, in order to provide additional liquidity to our operations, we could be forced to further reduce our planned capital expenditures, implement further austerity measures and/or sell additionalnon-strategic assets in order to raise funds. A reduction in our capital expenditure program could adversely affect our financial condition and results of operations. Additionally, such measures may not be sufficient to permit us to meet our obligations.
Our consolidated financial statements have been prepared under the assumption that we will continue as a going concern. However, our independent auditors have stated in their most recent report that there is important uncertainty and significant doubt concerning our ability to continue operating as a result of recurring net losses, negative working capital, negative equity and negative cash flows from operating activities for the year ended December 31, 2016. Our consolidated financial statements do not include any adjustments that might result from the outcome of that uncertainty. If the actions we are taking to improve our financial condition, which are described in detail under “Item 5—Operating and Financial Review and Prospects—Liquidity and Capital
9
Resources—Overview—Changes to Our Business Plan,” are not successful, we may not be able to continue operating as a going concern.
We are an integrated oil and gas company and are exposed to production, equipment and transportation risks, blockades to our facilities and criminal acts and deliberate acts of terror.
We are subject to several risks that are common among oil and gas companies. These risks include production risks (fluctuations in production due to operational hazards, natural disasters or weather, accidents, etc.), equipment risks (relating to the adequacy and condition of our facilities and equipment) and transportation risks (relating to the condition and vulnerability of pipelines and other modes of transportation). More specifically, our business is subject to the risks of explosions in pipelines, refineries, plants, drilling wells and other facilities, oil spills, hurricanes in the Gulf of Mexico and other natural or geological disasters and accidents, fires and mechanical failures. Criminal attempts to divert our crude oil, natural gas or refined products from our pipeline network and facilities for illegal sale have resulted in explosions, property and environmental damage, injuries and loss of life.
Our facilities are also subject to the risk of sabotage, terrorism, blockades and cyber-attacks. For example, widespread demonstrations, including blockades, as a result of the Mexican Government’s recent increase in fuel prices, have prevented us from accessing certain of our refined products supply terminals and caused critical gasoline shortages at retail service stations in at least three Mexican states. The occurrence of these incidents related to the production, processing and transportation of oil and gas products could result in personal injuries, loss of life, environmental damage from the subsequent containment,clean-up and repair expenses, equipment damage and damage to our facilities. Although we have established an information security program, which includes cybersecurity systems and procedures to protect our information technology, and have not yet suffered a cyber-attack, if the integrity of our information technology were ever compromised due to a cyber-attack, or due to the negligence or misconduct of our employees, our business operations could be disrupted and our proprietary information could be lost or stolen. As a result of these risks, we could face, among other things, regulatory action, legal liability, damage to our reputation, a significant reduction in revenues, an increase in costs, a shutdown of operations, or loss of our investments in affected areas.
We purchase comprehensive insurance policies covering most of these risks; however, these policies may not cover all liabilities, and insurance may not be available for some of the consequential risks. There can be no assurance that accidents, sabotage or acts of terror will not occur in the future, that insurance will adequately cover the entire scope or extent of our losses or that we may not be found directly liable in connection with claims arising from accidents or other similar events. See “Item 4—Information on the Company—Business Overview—PEMEX Corporate Matters—Insurance.”
Developments in the oil and gas industry and other factors may result in substantialwrite-downs of the carrying amount of certain of our assets, which could adversely affect our operating results and financial condition.
We evaluate on an annual basis, or more frequently where the circumstances require, the carrying amount of our assets for possible impairment. Our impairment tests are performed by a comparison of the carrying amount of an individual asset or acash-generating unit with its recoverable amount. Whenever the recoverable amount of an individual asset orcash-generating unit is less than its carrying amount, an impairment loss is recognized to reduce the carrying amount to the recoverable amount.
Changes in the economic, regulatory, business or political environment in Mexico or other markets where we operate, such as the gradual liberalization of fuel prices pursuant to energy reform and the significant decline in international crude oil and gas prices, among other factors, may result in the recognition of impairment charges in certain of our assets. Due to the decline in oil prices, we have performed impairment tests of ournon-financial assets (other than inventories and deferred taxes) at the end of each quarter. As of December 31, 2015, we recognized an impairment charge of Ps. 477,945 million. As of December 31, 2016, we recognized a net reversal of impairment in the amount of Ps. 331,314 million. See Note 12(d) to our consolidated financial
10
statements for further information about the impairment of certain of our assets. Future developments in the economic environment, in the oil and gas industry and other factors could result in further substantial impairment charges, adversely affecting our operating results and financial condition.
Increased competition in the energy sector due to the current legal framework in Mexico could adversely affect our business and financial performance.
The Political Constitution of the United Mexican States (the “Mexican Constitution”) and theLey de Hidrocarburos (Hydrocarbons Law) allows other oil and gas companies, in addition to us, to carry out certain activities related to the energy sector in Mexico, including exploration and extraction activities, and the import and sale of gasoline. As a result, we face competition for the right to explore and develop new oil and gas reserves in Mexico. We will also likely face competition in connection with certain refining, transportation and processing activities. In addition, increased competition could make it difficult for us to hire and retain skilled personnel. For more information, see “Item 4—Information on the Company—History and Development—Energy Reform.” If we are unable to compete successfully with other oil and gas companies in the energy sector in Mexico, our results of operations and financial condition may be adversely affected.
We are subject to Mexican and internationalanti-corruption,anti-bribery andanti-money laundering laws. Our failure to comply with these laws could result in penalties, which could harm our reputation, prevent us from obtaining governmental authorizations needed to carry out our operations and have an adverse effect on our business, results of operations and financial condition.
We are subject to Mexican and internationalanti-corruption,anti-bribery andanti-money laundering laws. See “Item 4—Information on the Company—General Regulatory Framework.” Although we maintain policies and processes intended to comply with these laws, including the review of our internal control over financial reporting, we are subject to the risk that our employees, contractors or any person doing business with us may engage in fraudulent activity, corruption or bribery, circumvent or override our internal controls and procedures or misappropriate or manipulate our assets for their personal or business advantage to our detriment. We have in place a number of systems for identifying, monitoring and mitigating these risks, but our systems may not be effective and we cannot ensure that these compliance policies and processes will prevent intentional, reckless or negligent acts committed by our officers or employees.
If we fail to comply with any applicableanti-corruption,anti-bribery oranti-money laundering laws, we and our officers and employees may be subject to criminal, administrative or civil penalties and other remedial measures, which could have material adverse effects on our business, financial condition and results of operations. Any investigation of potential violations ofanti-corruption,anti-bribery oranti-money laundering laws by governmental authorities in Mexico or other jurisdictions could result in an inability to prepare our consolidated financial statements in a timely manner. This could adversely impact our reputation, ability to access the financial markets and ability to obtain contracts, assignments, permits and other government authorizations necessary to participate in our industry, which, in turn, could have adverse effects on our business, results of operations and financial condition.
Our compliance with environmental regulations in Mexico could result in material adverse effects on our results of operations.
A wide range of general andindustry-specific Mexican federal and state environmental laws and regulations apply to our operations; these laws and regulations are often difficult and costly to comply with and carry substantial penalties fornon-compliance. This regulatory burden increases our costs because it requires us to make significant capital expenditures and limits our ability to extract hydrocarbons, resulting in lower revenues. For an estimate of our accrued environmental liabilities, see “Item 4—Information on the Company—Environmental Regulation—Environmental Liabilities.” Growing international concern over greenhouse gas emissions and climate change could result in new laws and regulations that could adversely affect our results of
11
operations and financial condition. International agreements, including the Paris Agreement approved by the Mexican Government, contemplate coordinated efforts to combat climate change. We may become subject to market changes, including carbon taxes, efficiency standards,cap-and-trade and emission allowances and credits. These measures could increase our operating and maintenance costs, increase the price of our hydrocarbon products and possibly shift consumer demand tolower-carbon sources. See “Item 4—Environmental Regulation—Climate Change” for more information on the Mexican Government’s current legal and regulatory framework for combatting climate change.
Risk Factors Related to Mexico
Economic conditions and government policies in Mexico and elsewhere may have a material impact on our operations.
A deterioration in Mexico’s economic condition, social instability, political unrest or other adverse social developments in Mexico could adversely affect our business and financial condition. Those events could also lead to increased volatility in the foreign exchange and financial markets, thereby affecting our ability to obtain new financing and service our debt. Additionally, the Mexican Government announced budget cuts in November 2015, February 2016, and September 2016 in response to declines in international crude oil prices, and it may cut spending in the future. See “—Risk Factors Related to our Relationship with the Mexican Government—The Mexican Government controls us and it could limit our ability to satisfy our external debt obligations or could reorganize or transfer us or our assets” below. These cuts could adversely affect the Mexican economy and, consequently, our business, financial condition, operating results and prospects.
In the past, Mexico has experienced several periods of slow or negative economic growth, high inflation, high interest rates, currency devaluation and other economic problems. These problems may worsen or reemerge, as applicable, in the future and could adversely affect our business and ability to service our debt. A worsening of international financial or economic conditions, such as a slowdown in growth or recessionary conditions in Mexico’s trading partners, including the United States, or the emergence of a new financial crisis, could have adverse effects on the Mexican economy, our financial condition and our ability to service our debt.
Changes in Mexico’s exchange control laws may hamper our ability to service our foreign currency debt.
The Mexican Government does not currently restrict the ability of Mexican companies or individuals to convert pesos into other currencies. However, we cannot provide assurances that the Mexican Government will maintain its current policies with regard to the peso. In the future, the Mexican Government could impose a restrictive exchange control policy, as it has done in the past. Mexican Government policies preventing us from exchanging pesos into U.S. dollars could hamper our ability to service our foreign currency obligations, including our debt, the majority of which is denominated in currencies other than pesos.
Political conditions in Mexico could materially and adversely affect Mexican economic policy and, in turn, our operations.
Political events in Mexico may significantly affect Mexican economic policy and, consequently, our operations. Enrique Peña Nieto, a member of thePartido Revolucionario Institucional(Institutional Revolutionary Party or PRI), was elected President of Mexico and took office on December 1, 2012. As of the date of this annual report, no political party holds a simple majority in either house of the Mexican Congress.
Presidential and federal congressional elections in Mexico will be held in July 2018. The Mexican presidential election will result in a change in administration, as presidential reelection is not permitted in Mexico. As a result, we cannot predict whether changes in Mexican governmental policy will result from the change in administration. Political events in Mexico could adversely affect economic conditions and/or the oil and gas industry and, by extension, our results of operations and financial position.
12
Mexico has experienced a period of increasing criminal activity, which could affect our operations.
In recent years, Mexico has experienced a period of increasing criminal activity, primarily due to the activities of drug cartels and related criminal organizations. In addition, the development of the illicit market in fuels in Mexico has led to increases in theft and illegal trade in the fuels that we produce. In response, the Mexican Government has implemented various security measures and has strengthened its military and police forces, and we have also established various strategic measures aimed at decreasing incidents of theft and other criminal activity directed at our facilities and products. See “Item 8—Financial Information—Legal Proceedings—Actions Against the Illicit Market in Fuels.” Despite these efforts, criminal activity continues to exist in Mexico, some of which may target our facilities and products. These activities, their possible escalation and the violence associated with them, in an extreme case, may have a negative impact on our financial condition and results of operations.
Economic and political developments in the United States may adversely affect PEMEX.
Changes in economic, political and regulatory conditions in the United States or in U.S. laws and policies governing foreign trade and foreign relations could create uncertainty in the international markets and could have a negative impact on the Mexican economy. Economic conditions in Mexico are highly correlated with economic conditions in the United States due to the high degree of economic activity between the two countries generally, including the trade facilitated by the North American Free Trade Agreement (“NAFTA”). In addition, political developments in the United States, including changes in the administration and governmental policies, can also have an impact on the exchange rate between the U.S. dollar and the Mexican peso, economic conditions in Mexico and the global capital markets.
Following the U.S. elections in November 2016 and the change in the U.S. administration, there is uncertainty regarding future U.S. policies with respect to matters of importance to Mexico and its economy. In particular, the U.S. administration has raised the possibility ofre-negotiating, or withdrawing from, NAFTA and taking actions related to trade, tariffs, immigration and taxation that could affect Mexico.
Since 2003, exports of petrochemical products from Mexico to the United States have enjoyed azero-tariff rate under NAFTA and, subject to limited exceptions, exports of crude oil and petroleum products have also been free or exempt from tariffs. During 2016, our export sales to the United States amounted to Ps. 138.2 billion, representing 12.8% of total sales and 35.0% of export sales for the year. Any increase of import tariffs could make it economically unsustainable for U.S. companies to import our petrochemical, crude oil and petroleum products if they are unable to transfer those additional costs onto consumers, which would increase our expenses and decrease our revenues, even if domestic and international prices for our products remain constant. Higher tariffs on products that we export to the United States could also require us to renegotiate our contracts or lose business resulting in a material adverse impact on our business and results of operations.
Because the Mexican economy is heavily influenced by the U.S. economy, there-negotiation, or even termination, of NAFTA and/or other U.S. government policies that may be adopted by the U.S. administration may adversely affect economic conditions in Mexico. These developments could in turn have an adverse effect on our financial condition, results of operations and ability to repay our debt.
Risk Factors Related to our Relationship with the Mexican Government
The Mexican Government controls us and it could limit our ability to satisfy our external debt obligations or could reorganize or transfer us or our assets.
We are controlled by the Mexican Government and our annual budget may be adjusted by the Mexican Government in certain respects. Pursuant to the Petróleos Mexicanos Law, Petróleos Mexicanos was transformed from a decentralized public entity to a productivestate-owned company on October 7, 2014. The Petróleos Mexicanos Law establishes a special regime governing, among other things, our budget, debt levels,
13
administrative liabilities, acquisitions, leases, services and public works. This special regime provides Petróleos Mexicanos with additional technical and managerial autonomy and, subject to certain restrictions, with additional autonomy with respect to our budget. Notwithstanding this increased autonomy, the Mexican Government still controls us and has the power to adjust our financial balance goal, which represents our targeted net cash flow for the fiscal year based on our projected revenues and expenses, and our annual wage and salary expenditures, subject to the approval of theCámara de Diputados (Chamber of Deputies).
The adjustments to our annual budget mentioned above may compromise our ability to develop the reserves assigned to us by the Mexican Government and to successfully compete with other oil and gas companies that enter the Mexican energy sector. See “Item 4—Information on the Company—History and Development—Capital Expenditures” for more information about our February 2016 budget adjustment and “—General Regulatory Framework” for more information about the Mexican Government’s authority with respect to our budget. In addition, the Mexican Government’s control over us could adversely affect our ability to make payments under any securities issued by Petróleos Mexicanos. Although Petróleos Mexicanos is wholly owned by the Mexican Government, our financing obligations do not constitute obligations of and are not guaranteed by the Mexican Government.
The Mexican Government’s agreements with international creditors may affect our external debt obligations. In certain past debt restructurings of the Mexican Government, Petróleos Mexicanos’ external indebtedness was treated on the same terms as the debt of the Mexican Government and other public sector entities, and it may be treated on similar terms in any future debt restructuring. In addition, Mexico has entered into agreements with official bilateral creditors to reschedule public sector external debt. Mexico has not requested restructuring of bonds or debt owed to multilateral agencies.
The Mexican Government has the power, if the Mexican Constitution and federal law were further amended, to further reorganize our corporate structure, including a transfer of all or a portion of our assets to an entity not controlled, directly or indirectly, by the Mexican Government. See “—Risk Factors Related to Mexico” above.
We pay significant taxes and duties to the Mexican Government, and, if certain conditions are met, to pay a state dividend, which may limit our capacity to expand our investment program or negatively impact our financial condition generally.
We are required to make significant payments to the Mexican Government, including in the form of taxes and duties, which may limit our ability to make capital investments. In 2016, approximately 32.0% of our sales revenues was used for payments to the Mexican Government in the form of taxes and duties, which constituted a substantial portion of the Mexican Government’s revenues.
The Secondary Legislation includes changes to the fiscal regime applicable to us, particularly with respect to the exploration and extraction activities that we carry out in Mexico. As of 2016, we have the obligation, subject to the conditions set forth in the Petróleos Mexicanos Law, to pay a state dividend to the Mexican Government. We were not required to pay a state dividend in 2016 and are not required to do so in 2017. See “Item 8—Financial Information—Dividends” for more information. Although the changes to the fiscal regime applicable to us are designed in part to reduce the Mexican Government’s reliance on payments made by us, we cannot provide assurances that we will not be required to continue to pay a large proportion of our sales revenue to the Mexican Government. See “Item 4—Information on the Company—Taxes, Duties and Other Payments to the Mexican Government—Fiscal Regime.” In addition, the Mexican Government may change the applicable rules in the future.
The Mexican Government has historically imposed price controls in the domestic market on our products.
The Mexican Government has from time to time imposed price controls on the sales of natural gas, liquefied petroleum gas, gasoline, diesel, gas oil intended for domestic use, fuel oil and other products. As a result of these
14
price controls, we have not been able to pass on all of the increases in the prices of our product purchases to our customers in the domestic market when the peso depreciates in relation to the U.S. dollar. A depreciation of the peso increases our cost of imported oil and petroleum products, without a corresponding increase in our revenues unless we are able to increase the price at which we sell products in Mexico. In accordance with theLey de Ingresos de la Federación para el Ejerecicio Fiscal de 2017 (2017 Federal Revenue Law), the Mexican Government will gradually remove price controls on gasoline and diesel over the course of 2017 and 2018 as part of the liberalization of fuel prices in Mexico. On December 27, 2016, the Ministry of Finance and Public Credit announced maximum gasoline and diesel prices to be applied in each of the regions of Mexico where prices are not determined based on market conditions. For more information, see “Item 4—Information on the Company—Business Overview—Industrial Transformation.”
We do not control the Mexican Government’s domestic policies and the Mexican Government could impose additional price controls on the domestic market in the future. The imposition of such price controls would adversely affect our results of operations. For more information, see “Item 4—Information on the Company—Business Overview—Refining—Pricing” and “Item 4—Information on the Company—Business Overview—Gas and Basic Petrochemicals—Pricing.”
The Mexican nation, not us, owns the hydrocarbon reserves located in the subsoil in Mexico and our right to continue to extract these reserves is subject to the approval of the Ministry of Energy.
The Mexican Constitution provides that the Mexican nation, not us, owns all petroleum and other hydrocarbon reserves located in the subsoil in Mexico.
Article 27 of the Mexican Constitution provides that the Mexican Government will carry out exploration and production activities through agreements with third parties and through assignments to and agreements with us. The Secondary Legislation allows us and other oil and gas companies to explore and extract the petroleum and other hydrocarbon reserves located in Mexico, subject to assignment of rights by the Ministry of Energy and entry into agreements pursuant to a competitive bidding process.
Access to crude oil and natural gas reserves is essential to an oil and gas company’s sustained production and generation of income, and our ability to generate income would be materially and adversely affected if the Mexican Government were to restrict or prevent us from exploring or extracting any of the crude oil and natural gas reserves that it has assigned to us or if we are unable to compete effectively with other oil and gas companies in future bidding rounds for additional exploration and production rights in Mexico. For more information, see “—We must make significant capital expenditures to maintain our current production levels, and to maintain, as well as increase, the proved hydrocarbon reserves assigned to us by the Mexican Government. Reductions in our income, adjustments to our capital expenditures budget and our inability to obtain financing may limit our ability to make capital investments” below.
Information on Mexico’s hydrocarbon reserves is based on estimates, which are uncertain and subject to revisions.
The information on oil, gas and other reserves set forth in this annual report is based on estimates. Reserves valuation is a subjective process of estimating underground accumulations of crude oil and natural gas that cannot be measured in an exact manner; the accuracy of any reserves estimate depends on the quality and reliability of available data, engineering and geological interpretation and subjective judgment. Additionally, estimates may be revised based on subsequent results of drilling, testing and production. These estimates are also subject to certain adjustments based on changes in variables, including crude oil prices. Therefore, proved reserves estimates may differ materially from the ultimately recoverable quantities of crude oil and natural gas. Downward revisions in our reserve estimates could lead to lower future production, which could have an adverse effect on our results of operations and financial condition. See “—Risk Factors Related to Our Operations—Crude oil and natural gas prices are volatile and low crude oil and natural gas prices adversely affect our income
15
and cash flows and the amount of hydrocarbon reserves that we have the right to extract and sell” above. We revise annually our estimates of hydrocarbon reserves that we are entitled to extract and sell, which may result in material revisions to these estimates. Our ability to maintain ourlong-term growth objectives for oil production depends on our ability to successfully develop our reserves, and failure to do so could prevent us from achieving ourlong-term goals for growth in production.
We must make significant capital expenditures to maintain our current production levels, and to maintain, as well as increase, the proved hydrocarbon reserves assigned to us by the Mexican Government. Reductions in our income, adjustments to our capital expenditures budget and our inability to obtain financing may limit our ability to make capital investments.
Because our ability to maintain, as well as increase, our oil production levels is highly dependent upon our ability to successfully develop existing hydrocarbon reserves and, in the long term, upon our ability to obtain the right to develop additional reserves, we continually invest capital to enhance our hydrocarbon recovery ratio and improve the reliability and productivity of our infrastructure. During 2016, our total proved reserves had a net increase of 40 million barrels of oil equivalent after accounting for discoveries, extensions, revisions, and delimitations. This amount, however, was less than production in 2016. Accordingly, our total proved reserves decreased by 11.1%, from 9,632 million barrels of crude oil equivalent as of December 31, 2015 to 8,562.8 million barrels of crude oil as of December 31, 2016. See “Item 4—Information on the Company—Business Overview—Exploration and Production—Reserves” for more information about the factors leading to this decline, including the results of Round Zero. Our crude oil production decreased by 1.0% from 2012 to 2013, by 3.7% from 2013 to 2014 and by 6.7% from 2014 to 2015 and by 5.0% from 2015 to 2016 primarily as a result of the decline of the Cantarell,Tsimín-Xux, Antonio J. Bermúdez, Chuc and Crudo Ligero projects.
Pursuant to energy reform in Mexico, the Mexican Government outlined a process, commonly referred to as Round Zero, for the determination of our initial allocation of rights to continue to carry out exploration and production activities in Mexico. On August 13, 2014, the Ministry of Energy granted us the right to continue to explore and develop areas that together contain 95.9% of Mexico’s estimated proved reserves of crude oil and natural gas. The development of the reserves that were assigned to us pursuant to Round Zero, particularly the reserves in the deep waters of the Gulf of Mexico and in shale oil and gas fields in the Burgos basin, will demand significant capital investments and will pose significant operational challenges. Our right to develop the reserves assigned to us through Round Zero is conditioned on our ability to develop such reserves in accordance with our development plans, which were based on our technical, financial and operational capabilities at the time. We cannot provide assurances that we will have or will be able to obtain, in the time frame that we expect, sufficient resources or the technical capacity necessary to explore and extract the reserves that the Mexican Government assigned to us as part of Round Zero, or that it may grant to us in the future. The decline in oil prices has forced us to make adjustments to our budget, including a significant reduction of our capital expenditures. Unless we are able to increase our capital expenditures, we may not be able to develop the reserves assigned to us in accordance with our development plans. We would lose the right to continue to extract these reserves if we fail to develop them in accordance with our development plans, which could adversely affect our operating results and financial condition. In addition, increased competition in the oil and gas sector in Mexico may increase the costs of obtaining additional acreage in bidding rounds for the rights to new reserves.
Our ability to make capital expenditures is limited by the substantial taxes and duties that we pay to the Mexican Government, the ability of the Mexican Government to adjust certain aspects of our annual budget, cyclical decreases in our revenues primarily related to lower oil prices and any constraints on our liquidity. The availability of financing may limit our ability to make capital investments that are necessary to maintain current production levels and increase the proved hydrocarbon reserves that we are entitled to extract. The energy reform has provided us with opportunities to enter into strategic alliances and partnerships, which may reduce our capital commitments and allow us to participate in projects for which we are more competitive. However, no assurance can be provided that these strategic alliances and partnerships will be successful or reduce our capital commitments. For more information, see “Item 4—Information on the Company—History and Development—
16
Capital Expenditures” and “—Energy Reform.” For more information on the liquidity constraints we are exposed to, see “—We have a substantial amount of indebtedness and other liabilities and are exposed to liquidity constraints, which could make it difficult for us to obtain financing on favorable terms and could adversely affect our financial condition, results of operations and ability to repay our debt and, ultimately, our ability to operate as a going concern” above.
We may claim some immunities under the Foreign Sovereign Immunities Act and Mexican law, and your ability to sue or recover may be limited.
We arepublic-sector entities of the Mexican Government. Accordingly, you may not be able to obtain a judgment in a U.S. court against us unless the U.S. court determines that we are not entitled to sovereign immunity with respect to that action. Under certain circumstances, Mexican law may limit your ability to enforce judgments against us in the courts of Mexico. We also do not know whether Mexican courts would enforce judgments of U.S. courts based on the civil liability provisions of the U.S. federal securities laws. Therefore, even if you were able to obtain a U.S. judgment against us, you might not be able to obtain a judgment in Mexico that is based on that U.S. judgment. Moreover, you may not be able to enforce a judgment against our property in the United States except under the limited circumstances specified in the Foreign Sovereign Immunities Act of 1976, as amended. Finally, if you were to bring an action in Mexico seeking to enforce our obligations under any securities issued by Petróleos Mexicanos, satisfaction of those obligations may be made in pesos, pursuant to the laws of Mexico.
Our directors and officers, as well as some of the experts named in this annual report, reside outside the United States. Substantially all of our assets and those of most of our directors, officers and experts are located outside the United States. As a result, investors may not be able to effect service of process on our directors or officers or those experts within the United States.
17
| Item 4. | Information on the Company |
HISTORY AND DEVELOPMENT
We are the largest company in Mexico according to the June 2016 special edition ofExpansiónmagazine, and according to the November 21, 2016 issue ofPetroleum Intelligence Weekly,we were the eighthlargest crude oil producer and the eighteenth largestoil and gas company in the world based on data from the year 2015.
Our executive offices are located at Avenida Marina Nacional No. 329, Colonia Verónica Anzures, Ciudad de México 11300, México. Our telephone number is(52-55) 1944-2500.
In March 1938, President Lázaro Cárdenas del Río nationalized the foreign-owned oil companies that were then operating in Mexico, and the Mexican Congress established Petróleos Mexicanos through theDecreto que crea la Institución Petróleos Mexicanos (Decree that creates the entity Petróleos Mexicanos), which was published in the Official Gazette of the Federation and took effect on July 20, 1938.
In July 1992, theLey Orgánica de Petróleos Mexicanos y Organismos Subsidiarios (Organic Law of Petróleos Mexicanos and Subsidiary Entities) took effect and, among other things, created Pemex-Exploration and Production, Pemex-Refining,Pemex-Gas and Basic Petrochemicals and Pemex-Petrochemicals as decentralized public entities of the Mexican Government with the legal authority to own property and conduct business in their own names. Each of the subsidiary entities had the characteristics of a subsidiary of Petróleos Mexicanos. The principal lines of business of those subsidiary entities were as follows:
| | • | | Pemex-Exploration and Production explored for, exploited, transported, stored and marketed crude oil and natural gas; |
| | • | | Pemex-Refining refined petroleum products and derivatives that may be used as basic industrial raw materials and stored, transported, distributed and marketed these products and derivatives; |
| | • | | Pemex-Gas and Basic Petrochemicals processed, produced, stored, transported, distributed and marketed natural gas, natural gas liquids, artificial gas and derivatives that may be used as basic industrial raw materials and produced, stored, transported, distributed and marketed petrochemicals that were classified as “basic” (ethane, propane, butane, pentanes, hexane, heptane, carbon black feedstocks, natural gasoline and methane, when used as raw materials and intended for use in petrochemical industrial processes) prior to the enactment of the Hydrocarbons Law in August 2014; and |
| | • | | Pemex-Petrochemicals engaged in industrial petrochemical processes and stored, distributed and marketed other petrochemicals. |
Energy Reform
Energy Reform Decree
On December 20, 2013, amendments to Articles 25, 27 and 28 of the Mexican Constitution were signed into law by President Enrique Peña Nieto and published in the Official Gazette of the Federation. We refer to this as the Energy Reform Decree. The Energy Reform Decree, which includes transitional articles setting forth the general framework and timeline for the related secondary legislation, took effect on December 21, 2013.
Secondary Legislation
On August 11, 2014, the secondary legislation was published pursuant to the Energy Reform Decree in the Official Gazette of the Federation. We refer in this annual report to this legislation as the Secondary Legislation. The Secondary Legislation includes nine new laws, of which the following are most relevant to our operations:
| | • | | The new Petróleos Mexicanos Law, which took effect, with the exception of certain provisions, on October 7, 2014 and repealed the previous Petróleos Mexicanos Law, which had been effective as of November 29, 2008; |
18
| | • | | Hydrocarbons Law, which took effect on August 12, 2014 and repealed theLey Reglamentaria del Artículo 27 Constitucional en el Ramo del Petróleo(Regulatory Law to Article 27 of the Mexican Constitution Concerning Petroleum Affairs, which we refer to as the Regulatory Law); and |
| | • | | Ley de Ingresos sobre Hidrocarburos (Hydrocarbons Revenue Law). |
Together, the Hydrocarbons Law and the Hydrocarbons Revenue Law establish the legal framework for the exploration and production of oil and gas through assignments and contracts, as well as the new fiscal regime through which the Mexican Government will collect revenues from participants in the Mexican oil and gas industry. The Hydrocarbons Law empowers the Ministry of Energy to determine the appropriate contract model for each area that is subject to a competitive bidding process, while the Ministry of Finance and Public Credit is responsible for determining the economic and fiscal terms of each contract. The following arrangements comprise the new contractual regime established by the Secondary Legislation for upstream activities:
| | • | | licenses, pursuant to which a license holder is entitled to the oil and gas that are extracted from the subsoil; |
| | • | | production-sharing contracts, pursuant to which a contractor is entitled to receive a percentage of production; |
| | • | | profit-sharing contracts, pursuant to which a contractor is entitled to receive a percentage of the profit from the sale of the extracted oil and gas; and |
| | • | | service contracts, pursuant to which a contractor would receive cash payments for services performed (service contracts, together with licenses, production-sharing contracts and profit-sharing contracts are known as the contracts for the exploration and extraction of oil and gas, collectively referred to as contracts for exploration and production). |
The fiscal terms of each contract for exploration and production are to be established in accordance with the Hydrocarbons Revenue Law. See “—Taxes, Duties and Other Payments to the Mexican Government—Fiscal Regime” below in this Item 4.
For midstream and downstream activities, including oil refining and natural gas processing, the Hydrocarbons Law establishes a permit regime that is granted by the Ministry of Energy and the Energy Regulatory Commission, as applicable. The Hydrocarbons Law also sets forth the process by which entities may apply for these permits. The Energy Regulatory Commission began issuing permits for the retail sale of gasoline and diesel fuel in 2016. During 2017 and 2018, the Energy Regulatory Commission, with the opinion of theComisión Federal de Competencia Económica (Federal Economic Antitrust Commission), will issue guidelines and schedules for different regions in Mexico relating to the processes to be used by the Ministry of Finance and Public Credit to determine prices of gasoline and diesel, which will take into account, among other things, transportation costs and volatility in international prices. Beginning in 2018, the prices of gasoline and diesel fuel will be freely determined by market conditions.
Legal Regime for Petróleos Mexicanos
As part of energy reform, Petróleos Mexicanos was transformed from a decentralized public entity into a productive state-owned company on October 7, 2014—the day on which the new Petróleos Mexicanos Law took effect, with the exception of certain provisions. As a productive state-owned company, Petróleos Mexicanos remains wholly owned by the Mexican Government and has the corporate purpose of generating economic value and increasing the income of the Mexican nation while adhering to principles of equity, as well as social and environmental responsibility.
On December 2, 2014, upon its determination that the new Board of Directors of Petróleos Mexicanos was performing its duties and the mechanisms for our oversight, transparency and accountability had been implemented, the Ministry of Energy formally announced in the Official Gazette of the Federation that the
19
special regime provided for in the Petróleos Mexicanos Law, which governs Petróleos Mexicanos’ activities relating to productive state-owned subsidiaries, affiliates, compensation, assets, administrative liabilities, budget, debt levels and the state dividend, had taken effect. On June 10, 2015, theDisposiciones Generales de Contratación para Petróleos Mexicanos y Sus Empresas Productivas Subsidiarias (General Provisions for Contracting for Petróleos Mexicanos and its Productive State-Owned Subsidiaries) were published in the Official Gazette of the Federation, and on June 11, 2015, the special regime for acquisitions, leases, services and public works became effective.
Corporate Reorganization
In accordance with the transitional articles of the Petróleos Mexicanos Law, on November 18, 2014, the Board of Directors of Petróleos Mexicanos approved the Director General’s proposal for our corporate reorganization. In our corporate reorganization, the four existing subsidiary entities of Petróleos Mexicanos were transformed into two new productive state-owned subsidiaries—Pemex Exploration and Production and Pemex Industrial Transformation—and five new productive state-owned subsidiaries—Pemex Drilling and Services, Pemex Logistics, Pemex Cogeneration and Services, Pemex Fertilizers and Pemex Ethylene—were created. Each of these productive state-owned subsidiaries is a legal entity empowered to own property and carry on business in its own name and has technical and operational autonomy, subject to the central coordination and strategic direction of Petróleos Mexicanos.
On March 27, 2015, the Board of Directors of Petróleos Mexicanos adoptedacuerdos de creación (creation resolutions) for each of the new productive state-owned subsidiaries, all of which were subsequently published in the Official Gazette of the Federation on April 28, 2015.
The principal lines of business of the new productive state-owned subsidiaries are as follows:
| | • | | Pemex Exploration and Production, formed on June 1, 2015 as a successor to Pemex-Exploration and Production, explores for, exploits, transports, stores and markets crude oil and natural gas; |
| | • | | Pemex Cogeneration and Services, formed on June 1, 2015, generates, supplies and trades electric and thermal energy; |
| | • | | Pemex Drilling and Services, formed on August 1, 2015, performs drilling and well repair services; |
| | • | | Pemex Fertilizers, formed on August 1, 2015, integrates the ammonia production chain up to the point of sale of fertilizers; |
| | • | | Pemex Ethylene, formed on August 1, 2015, separates the ethylene business from our petrochemicals segment in order to take advantage of the integration of the ethylene production chain and distributes and trades other gases, including methane and propylene; |
| | • | | Pemex Logistics, formed on October 1, 2015, provides land, maritime and pipeline transportation, storage and distribution to us and third parties; and |
| | • | | Pemex Industrial Transformation, formed on November 1, 2015 as a successor of Pemex-Refining,Pemex-Gas and Basic Petrochemicals and Pemex-Petrochemicals, refines petroleum products and derivatives; processes natural gas, natural gas liquids, artificial gas and derivatives and engages in industrial petrochemical processes. |
Capital Expenditures
The following table shows our capital expenditures, excludingnon-capitalizable maintenance, for each of the three years ended December 31, 2016, and the budget for these expenditures for 2017. Capital expenditure amounts are derived from our budgetary records, which are prepared on a cash basis. Accordingly, these capital expenditure amounts do not correspond to capital expenditure amounts included in our consolidated financial
20
statements prepared in accordance with IFRS. The following table presents our capital expenditures by subsidiary. For the year ended December 31, 2015, we have included capital expenditures made by the subsidiary entities prior to our recent corporate reorganization, and for the new productive state-owned subsidiaries, capital expenditures made after their creation. For the year ended December 31, 2016 and for the 2017 budget, we have included capital expenditures made by, or expected to be made by, the new productive state-owned subsidiaries.
Capital Expenditures and Budget by Subsidiary
| | | | | | | | | | | | | | | | |
| | | Year ended December 31, | | | Budget
2017(1) | |
| | | 2014 | | | 2015 | | | 2016 | | |
| | | (in millions of pesos)(2) | |
Pemex-Exploration and Production(3) | | Ps. | 222,069 | | | Ps. | 153,110 | | | Ps. | 137,242 | | | Ps. | 73,927 | |
Pemex Industrial Transformation(4) | | | — | | | | 4,952 | | | | 33,947 | | | | 21,369 | |
Pemex Logistics(5) | | | — | | | | 631 | | | | 7,015 | | | | 4,449 | |
Pemex Drilling and Services(6) | | | — | | | | — | | | | 2,688 | | | | 1,580 | |
Pemex Ethylene(7) | | | — | | | | 426 | | | | 746 | | | | 1,786 | |
Pemex Fertilizers(8) | | | — | | | | 205 | | | | 379 | | | | 444 | |
Pemex-Refining | | | 39,767 | | | | 34,152 | | | | n.a. | | | | — | |
Pemex-Gas and Basic Petrochemicals | | | 7,549 | | | | 5,070 | | | | n.a. | | | | — | |
Pemex-Petrochemicals | | | 4,765 | | | | 2,604 | | | | n.a. | | | | — | |
Pemex Cogeneration and Services | | | — | | | | — | | | | — | | | | — | |
Petróleos Mexicanos | | | 3,006 | | | | 2,157 | | | | 1,004 | | | | 5,422 | |
| | | | | | | | | | | | | | | | |
Total capital expenditures | | Ps. | 277,156 | | | Ps. | 203,307 | | | Ps. | 183,021 | | | Ps. | 108,977 | |
| | | | | | | | | | | | | | | | |
Note: Numbers may not total due to rounding.
| (1) | Budget authorized on December 14, 2016 and presented to the Board of Directors of Petróleos Mexicanos on April 7, 2017. |
| (2) | Figures for 2014, 2015 and 2016 are stated in nominal pesos. Figures for 2017 are stated in constant 2017 pesos. |
| (3) | For the year ended December 31, 2015, this includes capital expenditures made by Pemex-Exploration and Production and the new productive state-owned subsidiary Pemex Exploration and Production. |
| (4) | Figures for the year ended December 31, 2015 include capital expenditures after November 1, 2015, when Pemex Industrial Transformation was formed. |
| (5) | Figures for the year ended December 31, 2015 include capital expenditures after October 1, 2015, when Pemex Logistics was formed. |
| (6) | For the year ended December 31, 2015, capital expenditures for Pemex Drilling and Services were allocated under Pemex Exploration and Production. |
| (7) | Figures for the year ended December 31, 2015 include capital expenditures after October 1, 2015, when Pemex Ethylene was formed. |
| (8) | Figures for the year ended December 31, 2015 include capital expenditures after October 1, 2015, when Pemex Fertilizers was formed. |
Source: Petróleos Mexicanos.
21
The following table shows our capital expenditures, excludingnon-capitalizable maintenance, by segment for the years ended December 31, 2015 and 2016 and the budget for these expenditures in 2017.
Capital Expenditures by Segment
| | | | | | | | | | | | |
| | | Year ended December 31, | | | Budget
2017(1) | |
| | | 2015 | | | 2016 | | |
| | | (millions of pesos) | |
Exploration and Production(2) | | Ps. | 151,546 | | | Ps. | 137,242 | | | Ps. | 73,927 | |
Industrial Transformation | | | | | | | | | | | | |
Refining | | | 29,646 | | | | 30,501 | | | | 18,919 | |
Gas and Aromatics(3) | | | 5,654 | | | | 3,446 | | | | 2,450 | |
| | | | | | | | | | | | |
Total | | | 35,300 | | | | 33,947 | | | | 21,369 | |
Logistics(4) | | | 9,827 | | | | 7,015 | | | | 4,449 | |
Drilling and Services(5) | | | 1,564 | | | | 2,688 | | | | 1,580 | |
Ethylene(6) | | | 1,869 | | | | 746 | | | | 1,786 | |
Fertilizers(7) | | | 1,044 | | | | 379 | | | | 444 | |
Cogeneration and Services | | | — | | | | — | | | | — | |
Corporate and other Subsidiaries | | | 2,157 | | | | 1,004 | | | | 5,422 | |
| | | | | | | | | | | | |
Total Capital Expenditures | | Ps. | 203,307 | | | Ps. | 183,021 | | | Ps. | 108,977 | |
| | | | | | | | | | | | |
Note: Numbers may not total due to rounding.
| | (1) | Budget authorized on December 14, 2016 and presented to the Board of Directors of Petróleos Mexicanos on April 7, 2017. |
| | (2) | Figures for the exploration and production segment for the year ended December 31, 2015 include capital expenditures related to the drilling and services segment until the formation of Pemex Drilling and Services on August 1, 2015 and to the logistics segment until the formation of Pemex Logistics on October 1, 2015. |
| | (3) | Figures for the gas and aromatics activities for the year ended December 31, 2015 include the capital expenditures for the prior gas and basic petrochemicals and petrochemicals segments. |
| | (4) | Figures for the logistics segment for the year ended December 31, 2015 refer to logistics capital expenditures made by Pemex Refining and Pemex Gas and Basic Petrochemicals until September 30, 2015, and to capital expenditures made by Pemex Logistics after its formation on October 1, 2015. |
| | (5) | Figures for the drilling and services segment for the year ended December 31, 2015 refer to capital expenditures for drilling and services made by Pemex Exploration and Production. |
| | (6) | Figures for the ethylene segment for the year ended December 31, 2015 refer to capital expenditures made by Pemex Petrochemicals until September 30, 2015 and to capital expenditures made by Pemex Ethylene after its formation on October 1, 2015. |
| | (7) | Figures for the fertilizers segment for the year ended December 31, 2015 refer to capital expenditures made by Pemex Petrochemicals until September 30, 2015, and to capital expenditures made by Pemex Fertilizers after its formation on October 1, 2015. |
Source: Petróleos Mexicanos.
Capital expenditures and budget by project are described under each segment below in this Item 4.
Sincemid-2014, the international reference prices of crude oil have fluctuated significantly. During January 2016, the Mexican crude oil export price fell to U.S. $18.90 per barrel and the weighted average price for the year was U.S. $35.63 per barrel. Based on its estimate that the weighted average Mexican crude oil export price would be U.S. $42.00 per barrel, the Mexican Congress approved our Ps. 204.6 billion capital expenditures budget, including maintenance, for 2017.
In light of the oil and gas market and global economic conditions, on December 14, 2016 the Chamber of Deputies approved a 2017 budget of Ps. 391.9 billion, which included a financial balance goal (which we define as sales after deducting costs and expenses, investment expenses, taxes and duties, and financial debt service) of Ps. 93.8 billion. On December 14, 2016, the budget was presented to the Board of Directors of Petróleos Mexicanos along with detailed capital expenditure allocations by subsidiary entity. On April 7, 2017, the Board
22
of Directors of Petróleos Mexicanos was presented with an amended budget with capital expenditure allocations presented by subsidiary entity and by project. With this budget, our management expects that we will be able to maintain our medium- and long-term growth plans without the need to incur more indebtedness than the amount included in our approved financing program for 2017. The budget approved by the Board of Directors of Petróleos Mexicanos was based on the guiding principles of: maintaining the industrial safety and reliability of our facilities; taking advantage of the new contractual models provided by the energy reform in order to attract third-party investment; meeting our labor and financial obligations; and stabilizing our crude oil and gas production levels in the medium and long-term.
Our budget for 2017 includes a total of Ps. 109.0 billion for capital expenditures. We expect to direct Ps. 73.9 billion (or 67.8% of our total capital expenditures) to exploration and production programs in 2017. This investment in exploration and production activities reflects our focus on maximizing the potential of hydrocarbon reserves and our most productive projects, the promotion of ourfarm-out program, which we believe will allow us to sustain and increase our production levels while decreasing our corresponding capital expenditures, and our intention to take advantage of the opportunities provided by the energy reform. The energy reform provides us with opportunities to form new strategic partnerships in order to enhance our financial, technical and operational capabilities along our entire value chain. See “—Energy Reform” above in this Item 4. We continuously review our capital expenditures portfolio in accordance with our current and future business plans and upcoming opportunities. In the upcoming years, we expect to receive financial resources from third parties who may partner with us on certain projects, a collaboration made possible following the implementation of the Secondary Legislation. See “—Energy Reform” above in this Item 4 for more information about these new opportunities.
Our main objectives for upstream investment are to maximize our long-term economic value, and to increase and improve the quality of the oil and gas reserves assigned to us, enhance Pemex Exploration and Production’s reserves recovery ratio, improve the reliability of its production and transportation infrastructure for crude oil and natural gas operations and continue to emphasize industrial safety and compliance with environmental regulations. Our 2017 budget objectives include maintaining crude oil production at levels sufficient to satisfy domestic demand and have a surplus available for export and maintaining natural gas production levels in order to attempt to satisfy domestic demand.
Our downstream investment program seeks to improve the quality of our product selection and the reliability of our logistics and distribution services, to achieve a level of efficiency similar to that of our international competitors and to continue to emphasize industrial safety and environmental compliance.
23
BUSINESS OVERVIEW
Overview by Business Segment
Exploration and Production
Our exploration and production segment operates through the productive state-owned subsidiary Pemex Exploration and Production and explores for and produces crude oil and natural gas, primarily in the northeastern and southeastern regions of Mexico and offshore in the Gulf of Mexico. In nominal peso terms, our capital expenditures in exploration and production activities decreased by 9.4% in 2016. As a result of our investments in previous years, our total hydrocarbon production reached a level of approximately 1,115.7 million barrels of oil equivalent in 2016. Despite these investments, our crude oil production decreased by 5.0% from 2015 to 2016, averaging 2,153.5 thousand barrels per day in 2016, primarily as a result of the decline of the Cantarell, Crudo Ligero Marino, El Golpe-Puerto Ceiba, Bellota-Chinchorro, Antonio J. Bermúdez, Cactus-Sitio Grande, Ixtal-Manik, Chuc, Costero Terrestre, andTsimín-Xux projects, which was partially offset by development of the Integral Yaxché project’s Xanab field and by repairs, stimulations and diversification of artificial systems at our onshore fields that helped maintain production levels.
Our natural gas production (excluding natural gas liquids) decreased by 9.5% from 2015 to 2016, averaging 5,792.5 million cubic feet per day in 2016. This decrease in natural gas production resulted primarily from decreased volumes in the Burgos, Crudo Ligero Marino, Ixtal-Manik, Integral Veracruz Basin, Cactus-Sitio Grande, Integral Macuspana Basin and Ogarrio-Sánchez Magallanes projects. Exploration drilling activity decreased by 19.2% from 2015 to 2016, from 26 exploratory wells completed in 2015 to 21 exploratory wells completed in 2016. Development drilling activity decreased by 55.2% from 2015 to 2016, from 286 development wells completed in 2015 to 128 development wells completed in 2016. In 2016, we completed the drilling of 149 wells in total. Our drilling activity in 2016 was focused on increasing the production of crude oil and associated gas in the Ayatsil-Tekel, Chuc, Crudo Ligero Marino, El Golpe-Puerto Ceiba,Ku-Maloob-Zaap andTsimín-Xux, Aceite Terciario del Golfo andOgarrio-Sánchez Magallanes projects.
Our primary objectives in 2017 include: (i) generating economic value and profitability to ensure the sustainability of the company; (ii) improving our performance in industrial safety and environmental protection; and (iii) increasing productivity and efficiency. We aim to meet these objectives through the following: (1) exploration and extraction of oil and solid, liquid or gaseous hydrocarbons in Mexico, its exclusive economic zone and abroad, in a profitable and sustainable manner; (2) acceleration of the development of shale; (3) use of farm-outs to develop complex fields and leverage resources from third parties; (4) containment of production decline and increase of profitability of assignments migrated without third-party participation; (5) increase of the production of oil and gas to meet demands in the southeast of Mexico; (6) optimal allocation of resources for our projects and continuous performance evaluation; (7) increase of efficiency levels above international standards in our gas utilization and production costs; and (8) efficient use of our investments and logistics capacity and minimization of operating costs. Our production goals for 2017 include producing crude oil at a level of approximately 1,925.2 thousand barrels per day and maintaining natural gas production above 4,729.0 million cubic feet per day. We aim to meet these production goals through exploration and development activities, increasing inventory reserves through new discoveries and reclassifications, managing the decline in field production by applying primary, secondary and enhanced oil recovery processes and continuing to develop extra-heavy crude oil fields.
Industrial Transformation
Our industrial transformation segment is comprised of two principal activities: (i) refining and (ii) gas and aromatics:
Refining
Our refining business, which formerly operated as Pemex-Refining and operates through the productive state-owned subsidiary Pemex Industrial Transformation, converts crude oil into gasoline, jet fuel, diesel, fuel
24
oil, asphalts and lubricants. We also distribute and market most of these products throughout Mexico, where we experience significant demand for our refined products. At the end of 2016, atmospheric distillation refining capacity reached 1,602 thousand barrels per day. In 2016, we produced 977 thousand barrels per day of refined products as compared to 1,114 thousand barrels per day of refined products in 2015. This decrease in refined products production was mainly due to a decrease in crude oil processing and to operational issues inEl Sistema Nacional de Refinación (the National Refining System). As the result of operational problems, processing of crude oil by the National Refining System decreased 12.3%, from 1,064 million barrels per day in 2015 to 933 million barrels per day in 2016. Our primary goal for 2017 is to increase production of petroleum products, which we expect will result from an increase in distillate production and a decrease in fuel oil production.
Gas and Aromatics
Our gas and aromatics business processes wet natural gas to produce dry natural gas, liquefied petroleum gas (LPG) and other natural gas liquids, along with aromatic chain products such as styrene, toluene, benzene and xylene. In 2016, our total sour natural gas processing capacity remained at 2015 levels of 4,523 cubic feet per day. We processed 3,672 million cubic feet of wet natural gas per day in 2016, a 9.8% decrease from the 4,073 million cubic feet per day of wet natural gas processed in 2015. We produced 308 thousand barrels per day of natural gas liquids in 2016, a 5.8% decrease from the 364 thousand barrels per day of natural gas liquids production in 2015. We also produced 3,074 million cubic feet of dry gas (which is natural gas with a methane content of more than 90.0%) per day in 2015, 11.0% less than the 3,454 cubic feet of dry gas per day produced in 2015. We produced 940 thousand tons of aromatics and derivatives, an 8.0% decrease from 2015.
In 2017, we expect to have a lower supply of natural gas from our fields, which would require us to import higher volumes of natural gas to satisfy domestic demand.
Fertilizers
Our fertilizers segment operates through the productive state-owned subsidiary Pemex Fertilizers and integrates the ammonia production chain up to the point of sale of fertilizers.
Our strategies focus on: (1) increasing the economic value of our segment by generating diverse investment opportunities in the agricultural sector in Mexico and (2) ensuring a reliable supply of raw materials for our plants through a long-term contract that sustains operations at our four ammonia plants.
Ethylene
Our ethylene segment operates through the productive state-owned subsidiary Pemex Ethylene and takes advantage of the integration of the ethylene production chain. In 2016, we produced a total of 2,528.7 thousand tons of petrochemical products, a 14.8% decrease from the 2,969.7 thousand tons of petrochemical products produced in 2015.
We have two primary goals for our ethylene segment in 2017. The first is to better market our products and services to certain customers, mainly by (1) becoming a reliable supplier, adopting competitive business practices, focusing on profitable and abandoning unprofitable markets; and (2) evaluating strategic business relationships and partnerships to increase the profitability of our petrochemical processes. The second is to streamline our activities and operations in Pemex Ethylene’s value chain by following the best operational and maintenance practices.
Drilling and Services
Our drilling and services segment operates through the productive state-owned subsidiary Pemex Drilling and Services and provides drilling, completion, work-over and other services for wells in offshore and onshore fields. In 2016, this segment mainly provided drilling services to Pemex Exploration and Production, but also provided services to external clients such asComisión Nacional del Agua (CONAGUA) and the Armada Company.
25
Our well drilling activities during 2016 led to onshore discoveries. Our main discoveries were of crude oil reserves located in the Southeastern and Veracruz basins, specifically in the Northern and Southern regions. Exploration activity in the Northern region also led to the discovery of additionalnon-associated gas reserves in the Burgos basin. We are currently working on development plans for these new reserves.
Logistics
Our logistics segment operates through the productive state-owned subsidiary Pemex Logistics and provides land, maritime and pipeline transportation, storage and distribution services to us and other companies, including theComisión Federal de Electricidad (Federal Electricity Commission or CFE),Aeropuertos y Servicios Auxiliares, CENAGAS, local gas stations and distributors.
During 2016, we transported 58,016 millionton-kilometers of crude oil and petroleum products, an 11.3% decrease as compared to 2015, due to decreased production in our exploration and production segment, decreased processing of crude oil in our refineries and the illicit market in fuels which can lead to temporary pipeline closures.
During 2016, we transported approximately 5,440 million cubic feet per day of natural gas, a 5.8% increase as compared to the 5,142 million cubic feet per day transported in 2015, partially due to the transportation of an estimated 655 million cubic feet per day for the CFE as agreed among the Ministry of Energy, the Energy Regulatory Commission and Pemex Industrial Transformation. On January 1, 2016, we began providing operation, maintenance and information technology services to, among others, CENAGAS in connection with its natural gas transportation infrastructure.
During 2016, we also transported 140 thousand barrels per day of LPG and 2,589 thousand barrels per day of crude oil and petroleum products to be processed in our refining system and to satisfy domestic demand for petroleum products, as compared to 174 thousand barrels per day of LPG and 3,181 thousand barrels per day of crude oil and petroleum products transported in 2015. Of the total amount we transported in 2016, we carried 77% of the transported volumes in 2016 through pipelines, 12% by vessels and the remaining 11% by train tank cars and trucks.
Our logistics segment will continue to provide services to our other segments and to third parties throughout Mexico. It hopes to meet its customers’ needs by providing its services in an efficient manner.
Cogeneration and Services
Our cogeneration and services segment operates through the productive state-owned subsidiary Pemex Cogeneration and Services and uses thermal heat and steam from our industrial processes to produce the electricity required by us, as well as to generate surplus electricity to sell to third parties in Mexico. Our cogeneration and services segment designs construction, financing and development structures for cogeneration through alliances with third parties in close geographic proximity to our productive work centers.
International Trading
The international trading segment, which operates through P.M.I. Comercio Internacional, S.A. de C.V. (which we refer to as PMI), P.M.I. Trading, Ltd., P.M.I. Norteamérica, S.A. de C.V., (which, together with PMI, we collectively refer to as the “PMI Subsidiaries”) and Mex Gas International, Ltd., (which, together with the PMI Subsidiaries, we collectively refer to as the “Trading Companies”) provides us with international trading, distribution, risk management, insurance and transportation services. The Trading Companies sell, buy and transport crude oil, refined products and petrochemicals in world markets, and provide related risk management, insurance, transportation and storage services. The Trading Companies have offices in Mexico City, Houston, Amsterdam, Singapore and Madrid. Export sales are made through PMI to approximately 34 major customers in various foreign markets.
26
In 2016, our crude oil exports increased in volume by 1.9%, from 1,172.4 thousand barrels per day in 2015 to 1,194.4 thousand barrels per day in 2016. Natural gas imports increased by 36.6% in 2016, from 1,415.8 million cubic feet per day in 2015 to 1,933.9 million cubic feet per day in 2016. In 2016, exports of petrochemical products decreased 62.6%, from 333.8 thousand metric tons in 2015 to 124.7 thousand metric tons in 2016, while imports of petrochemical products increased 159.3%, from 107.3 thousand metric tons in 2015 to 278.2 thousand metric tons in 2016. In 2016, exports of petroleum products increased 1.6%, from 130.8 thousand barrels per day in 2015 to 132.9 thousand barrels per day in 2016, while imports of other petroleum products and liquefied petroleum gas increased 8.1%, from 739.8 thousand barrels per day in 2015 to 799.5 thousand barrels per day in 2016. As a major supplier of crude oil to the United States, our international trading segment’s crude oil exports to the U.S. totaled U.S. $7.5 billion in 2016, a decrease of U.S. $3.4 billion from 2015.
In addition to being our international trading arm, our trading segment is also active in the Mexican market. The PMI Subsidiaries are party to multiple long-term contracts that we expect will generate business during 2017, including a long-term contract with Petróleos Mexicanos for sulfur sales and a long-term agreement with Mex Gas, one of our affiliates, for naphtha sales.
Infrastructure of PEMEX
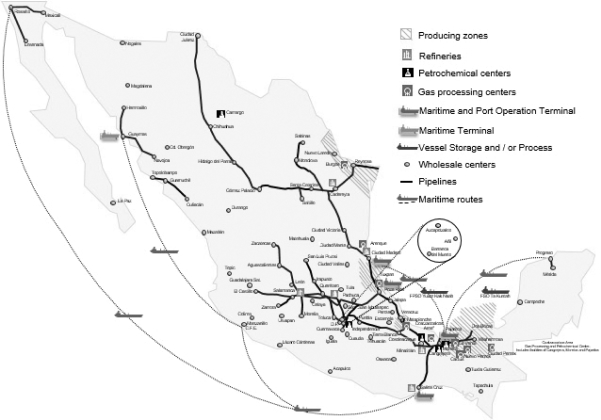
Exploration and Production
Following our 2015 corporate reorganization, certain business units and assets that were operated by our exploration and production segment were transferred to our drilling and services segment upon the formation of Pemex Drilling and Services on August 1, 2015. For the year ended December 31, 2015, we have not presented separately the operating results of our drilling and services segment in this Item 4 and, accordingly, the results of
27
our exploration and production segment include the results of that segment for this period. Operating results for both the exploration and production and drilling and services segments are presented separately for periods beginning January 1, 2016. For a detailed description of the financial results of each segment, see our consolidated financial statements included herein.
Exploration and Drilling
We seek to identify new oil reservoirs through our exploration program in order to increase the future replacement rate of proved reserves. From 1990 to 2016, we completed 13,186 exploration and development wells. During 2016, our average success rate for exploratory wells was 28.6% and our average success rate for development wells was 85.9%. From 2011 to 2016, we discovered 18 new crude oil fields and 14 new natural gas fields, bringing the total number of our crude oil and natural gas producing fields to 405 at the end of 2016.
Our 2016 exploration program was comprised of exploration in both onshore and offshore regions, including the deep waters of the Gulf of Mexico. These exploratory activities yielded 57 million barrels of oil equivalent of proved reserves resulting from the discovery of one oil producing field. We continued our main seismic data acquisition activities, in particular, those related to three-dimensional seismic data.
28
The following table summarizes our drilling activity for the five years ended December 31, 2016, all of which occurred in Mexican territory.
| | | | | | | | | | | | | | | | | | | | |
| | | Year ended December 31, | |
| | | 2012 | | | 2013 | | | 2014 | | | 2015 | | | 2016 | |
Wells initiated(1) | | | 1,290 | | | | 705 | | | | 474 | | | | 274 | | | | 93 | |
Exploratory wells initiated(1) | | | 36 | | | | 40 | | | | 20 | | | | 22 | | | | 23 | |
Development wells initiated(1) | | | 1,254 | | | | 665 | | | | 454 | | | | 252 | | | | 70 | |
Wells drilled(2) | | | 1,238 | | | | 817 | | | | 535 | | | | 312 | | | | 149 | |
Exploratory wells | | | 37 | | | | 38 | | | | 24 | | | | 26 | | | | 21 | |
Productive exploratory wells(3) | | | 21 | | | | 23 | | | | 8 | | | | 13 | | | | 6 | |
Dry exploratory wells | | | 16 | | | | 15 | | | | 16 | | | | 13 | | | | 15 | |
Success rate % | | | 57 | | | | 61 | | | | 33 | | | | 50 | | | | 29 | |
Development wells | | | 1,201 | | | | 779 | | | | 511 | | | | 286 | | | | 128 | |
Productive development wells | | | 1,159 | | | | 747 | | | | 484 | | | | 266 | | | | 110 | |
Dry development wells | | | 42 | | | | 32 | | | | 26 | | | | 20 | | | | 18 | |
Success rate %(4) | | | 97 | | | | 96 | | | | 95 | | | | 93 | | | | 86 | |
Producing wells (annual averages) | | | 9,439 | | | | 9,836 | | | | 9,558 | | | | 9,363 | | | | 8,750 | |
Marine region | | | 537 | | | | 559 | | | | 581 | | | | 544 | | | | 539 | |
Southern region | | | 1,230 | | | | 1,340 | | | | 1,420 | | | | 1,403 | | | | 1,244 | |
Northern region | | | 7,672 | | | | 7,937 | | | | 7,557 | | | | 7,416 | | | | 6,966 | |
Producing wells (at year end)(5) | | | 9,476 | | | | 9,379 | | | | 9,077 | | | | 8,826 | | | | 8,073 | |
Crude oil | | | 6,188 | | | | 6,164 | | | | 5,598 | | | | 5,374 | | | | 4,912 | |
Natural gas | | | 3,288 | | | | 3,215 | | | | 3,479 | | | | 3,452 | | | | 3,161 | |
Producing fields | | | 449 | | | | 454 | | | | 428 | | | | 434 | | | | 405 | |
Marine region | | | 38 | | | | 42 | | | | 45 | | | | 41 | | | | 43 | |
Southern region | | | 101 | | | | 102 | | | | 97 | | | | 97 | | | | 88 | |
Northern region | | | 310 | | | | 310 | | | | 286 | | | | 296 | | | | 274 | |
Drilling rigs | | | 136 | | | | 139 | | | | 136 | | | | 113 | | | | 110 | |
Kilometers drilled | | | 3,007 | | | | 1,627 | | | | 1,413 | | | | 815 | | | | 330 | |
Average depth by well (meters) | | | 2,429 | | | | 2,710 | | | | 2,738 | | | | 3,038 | | | | 3,655 | |
Discovered fields(6) | | | 9 | | | | 10 | | | | 2 | | | | 6 | | | | 1 | |
Crude oil | | | 2 | | | | 5 | | | | — | | | | 6 | | | | 1 | |
Natural gas | | | 7 | | | | 5 | | | | 2 | | | | — | | | | — | |
Crude oil and natural gas output by well (barrels of oil equivalent per day) | | | 392 | | | | 371 | | | | 370 | | | | 349 | | | | 348 | |
Total developed acreage (km2)(7) | | | 8,652 | | | | 8,706 | | | | 8,339 | | | | 8,654 | | | | 7,017 | (8) |
Total undeveloped acreage (km2)(7) | | | 1,040 | | | | 977 | | | | 1,278 | | | | 1,000 | | | | 712 | (8) |
Note: Numbers may not total due to rounding.
| (1) | “Wells initiated” refers to the number of wells the drilling of which commenced in a given year, regardless of when the well was or will be completed. |
| (2) | “Wells drilled” refers to the number of wells the drilling of which was completed in a given year, regardless of when the drilling of the well commenced. |
| (3) | Excludesnon-commercial productive wells. |
| (4) | Excludes injector wells. |
| (5) | All productive wells, and all other wells referred to in this table, are “net,” because we do not grant others any fractional working interests in any wells that we own; we also have not acquired any fractional working interest in wells owned by others. |
| (6) | Includes only fields with proved reserves. |
| (7) | All acreage is net because we neither grant others fractional interests nor enter into other types of production sharing arrangements. |
| (8) | These values relate only to our current assignments. |
Source: Pemex Exploration and Production.
29
Extensions and Discoveries
During 2016, our exploratory activity in the shallow waters of the Gulf of Mexico led to the incorporation of approximately 57 million barrels of oil equivalent in one field. We have also increased exploratory work in shallow waters to incorporate proved reserves.
Reserves
Under the Mexican Constitution, all oil and other hydrocarbon reserves located in the subsoil of Mexico are owned by the Mexican nation and not by us. As of December 31, 2014, Pemex-Exploration and Production was assigned rights through Round Zero corresponding to areas that together contained 95.2% of Mexico’s total proved reserves. Pemex Exploration and Production, as the successor to Pemex-Exploration and Production, has the right to extract, but not own, these reserves, and to sell the resulting production. As of the date of this report, the exploration and development activities of Petróleos Mexicanos and the subsidiary entities are limited to reserves located in Mexico.
Proved oil and natural gas reserves are those estimated quantities of crude oil, natural gas and natural gas liquids which geological and engineering data demonstrate with reasonable certainty to be economically producible from a given date forward, from known reservoirs and under existing economic conditions, operating methods and government regulations.
Proved reserves estimates as of December 31, 2016 were prepared by our exploration and production segment and were reviewed by the Independent Engineering Firms (as defined below), which audit its estimates of our oil and gas reserves. In addition, pursuant to theReglamento de la Ley de Hidrocarburos(Regulations to the Hydrocarbons Law), the NHC reviewed and approved the proved reserves reports estimates as of December 31, 2016 that we provided on March 31, 2017.
We estimate reserves based on generally accepted petroleum engineering and evaluation methods and procedures, which are based primarily on applicable SEC regulations and, as necessary, the Society of Petroleum Engineers’ (which we refer to as the SPE) publication entitledStandards Pertaining to the Estimating and Auditingof Oil and Gas Reserves Information, dated February 19, 2007 and other SPE publications, including the SPE’s publication entitledPetroleum Resources Management System, as well as other technical sources, includingEstimation and Classification of Reserves of Crude Oil, Natural Gas, and Condensate, by Chapman Cronquist, andDetermination of Oil and Gas Reserves, Petroleum Society Monograph Number 1, published by the Canadian Institute of Mining and Metallurgy & Petroleum. The choice of method or combination of methods employed in the analysis of each reservoir is determined by:
| | • | | experience in the area; |
| | • | | quality and completeness of basic data; and |
| | • | | production and pressure histories. |
Reserves data set forth herein represent only estimates. Reserves valuation is a subjective process of estimating underground accumulations of crude oil and natural gas that cannot be measured in an exact manner. The accuracy of any reserves estimate depends on the quality of available data, engineering and geological interpretation and professional judgment. As a result, estimates of different engineers may vary. In addition, the results of drilling, testing and producing subsequent to the date of an estimate may lead to the revision of an estimate.
During 2016, we did not record any material increase in our proved oil and gas reserves as a result of the use of new technologies.
30
In order to ensure the reliability of our reserves estimation efforts, we have undertaken the internal certification of our estimates of reserves since 1996. We have established certain internal controls in connection with the preparation of our proved reserves estimates. Initially, teams of geoscientists from our exploration and production business units (with each of these units covering several projects) prepare the reserves estimates, using distinct estimation processes for valuations relating to new discoveries and developed fields, respectively. Subsequently, the regional reserves offices collect these reserves estimates from the units and request that theGerencia de Recursos y Certificación de Reservas (Office of Resources and Certification of Reserves), the central hydrocarbon reserves management body of Pemex Exploration and Production, review and certify such valuations and the booking of the related reserves. This internal certification process is undertaken in accordance with internal guidelines for estimating and classifying proved reserves, which are based on the SEC’s rules and definitions. The Office of Resources and Certification of Reserves, which additionally oversees and conducts an internal audit of the process described above, consists entirely of professionals with geological, geophysical, petrophysical and reservoir engineering backgrounds. The engineers who participate in our reserves estimation process are experienced in: reservoir numerical simulation; well drilling and completion; pressure, volume and temperature (PVT) and analytical tools used in forecasting the performance of the various elements comprising the production system; and design strategies in petroleum field development. Furthermore, all of our personnel have been certified by theSecretaría de Educación Pública(Ministry of Public Education), most have earned master’s degrees in areas of study such as petroleum engineering, geology and geophysical engineering and they possess an average of over fifteen years of professional experience.
In addition to this internal review process, our exploration and production segment’s final reserves estimates are audited by independent engineering firms. Three independent engineering firms audited our estimates of proved reserves as of December 31, 2016: Netherland Sewell; DeGolyer and MacNaughton; and Ryder Scott (we refer to these firms together as the Independent Engineering Firms). The reserves estimates reviewed by the Independent Engineering Firms totaled 97.6% of our estimated proved reserves. The remaining 2.4% of our estimated proved reserves consisted of reserves located in certain areas in which third parties provide us with drilling services. Under such agreements, the corresponding third party is responsible for assessing the volume of reserves. Netherland Sewell audited the reserves in the Aceite Terciario de Golfo, Poza Rica-Altamira and the Litoral de Tabasco business units. DeGolyer and MacNaughton audited reserves in the Burgos and Veracruz business units and Ryder Scott audited the reserves in the Bellota-Jujo, Cinco Presidentes, Macuspana-Muspac, Samaria-Luna,Abkatún-Pol-Chuc, Cantarell andKu-Maloob-Zaap business units. The audits conducted by the Independent Engineering Firms consisted primarily of: (1) analysis of historical static and dynamic reservoir data that we have provided; (2) construction or updating of the Independent Engineering Firms’ own static and dynamic reservoir characterization models of some of our fields; (3) economic analysis of fields; and (4) review of our production forecasts and reserves estimates.
Since reserves estimates are, by definition, only estimates, they cannot be reviewed for the purpose of verifying exactness. Instead, the Independent Engineering Firms conducted a detailed review of our reserves estimates so that they could express an opinion as to whether, in the aggregate, the reserves estimates we furnished were reasonable and had been estimated and presented in conformity with generally accepted petroleum engineering and evaluation methods and procedures.
All questions, including any suggested modifications to proved reserves estimates, that arose during the Independent Engineering Firms’ review process were resolved by our exploration and production segment to the satisfaction of the Independent Engineering Firms. The Independent Engineering Firms have concluded that our estimated total proved oil and natural gas reserve volumes set forth in this report are, in the aggregate, reasonable and have been prepared in accordance with Rule4-10(a) of RegulationS-X of the SEC, as amended (which we refer to as Rule4-10(a)), are consistent with international reserves reporting practice and are in accordance with the revised oil and gas reserves disclosure provisions of ASC Topic 932.
Our total proved developed and undeveloped reserves of crude oil, condensates and liquefiable hydrocarbons recoverable from field processing plants decreased by 9.5% in 2016, from 7,977 million barrels at
31
December 31, 2015 to 7,219 million barrels at December 31, 2016. Our proved developed reserves of crude oil, condensates and liquefiable hydrocarbons recoverable from processing plants decreased by 14.7% in 2016, from 5,725 million barrels at December 31, 2015 to 4,886 million barrels at December 31, 2016.These decreases were principally due to a decrease in oil production in 2016, lower prices of hydrocarbons, a decrease in field development activities and field behavior. The amount of crude oil, condensate and liquefiable hydrocarbon reserves added in 2016 was insufficient to offset the level of production in 2016, which amounted to 891 million barrels of crude oil, condensates and liquefiable hydrocarbons.
Our total proved developed and undeveloped dry gas reserves decreased by 18.9% in 2016, from 8,610 billion cubic feet at December 31, 2015 to 6,984 billion cubic feet at December 31, 2016. Our proved developed dry gas reserves decreased by 24.9% in 2016, from 6,012 billion cubic feet at December 31, 2015 to 4,513 billion cubic feet at December 31, 2016. These decreases were principally due to a decrease in oil production in 2016, lower prices of oil and gas, a decrease in field development activities and field behavior. The amount of dry gas reserves added in 2016 was insufficient to offset the level of production in 2016, which amounted to 1,134 billion cubic feet of dry gas. Our proved undeveloped dry gas reserves decreased by 4.9% in 2016, from 2,598 billion cubic feet at December 31, 2015 to 2,471 billion cubic feet at December 31, 2016.
During 2016, proved reserves increased by 40 million barrels of oil equivalent due to reclassifications, development, revisions and discoveries.
During 2016, exploratory activity in shallow waters incorporated approximately 57 million barrels of oil equivalent in one new field located close to our existing facilities. We also maintained exploratory work in shallow waters in order to incorporate proved reserves that support future new production in the short term.
The following three tables of crude oil and dry gas reserves set forth our estimates of our proved reserves determined in accordance with Rule4-10(a).
Summary of Oil and Gas(1) Proved Reserves as of December 31, 2016 Based on Average Fiscal Year Prices
| | | | | | | | |
| | | Crude Oil and
Condensates(2) | | | Dry Gas(3) | |
| | | (in millions of
barrels) | | | (in billions of
cubic feet) | |
Proved developed and undeveloped reserves | | | | | | | | |
Proved developed reserves | | | 4,886 | | | | 4,513 | |
Proved undeveloped reserves | | | 2,233 | | | | 2,471 | |
| | | | | | | | |
Total proved reserves | | | 7,219 | | | | 6,984 | |
| | | | | | | | |
| | Note: | Numbers may not total due to rounding. |
| | (1) | We do not currently produce synthetic oil or synthetic gas, or other natural resources from which synthetic oil or synthetic gas can be produced. |
| | (2) | Crude oil and condensate reserves include the fraction of liquefiable hydrocarbons recoverable in natural gas processing plants located at fields. |
| | (3) | Reserve volumes reported in this table are volumes of dry gas, although natural gas production reported in other tables refers to sour wet gas. There is a shrinkage in volume when natural gas liquids and impurities are extracted to obtain dry gas. Therefore, reported natural gas volumes are greater than dry gas volumes. |
| | Source: | Pemex Exploration and Production. |
32
Crude Oil and Condensate Reserves
(including natural gas liquids)(1)
| | | | | | | | | | | | | | | | | | | | |
| | | 2012 | | | 2013 | | | 2014 | | | 2015 | | | 2016 | |
| Proved developed and undeveloped reserves | | (in millions of barrels) | |
At January 1 | | | 11,362 | | | | 11,424 | | | | 11,079 | | | | 10,292 | | | | 7,977 | |
Revisions(2) | | | 1,012 | | | | 630 | | | | 95 | | | | (1,491 | ) | | | 189 | |
Extensions and discoveries | | | 103 | | | | 62 | | | | 119 | | | | 111 | | | | (55 | ) |
Production | | | (1,053 | ) | | | (1,037 | ) | | | (1,001 | ) | | | (935 | ) | | | (891 | ) |
| | | | | | | | | | | | | | | | | | | | |
At December 31 | | | 11,424 | | | | 11,079 | | | | 10,292 | | | | 7,977 | | | | 7,219 | |
| | | | | | | | | | | | | | | | | | | | |
Proved developed reserves at December 31 | | | 7,790 | | | | 7,360 | | | | 7,141 | | | | 5,725 | | | | 4,886 | |
Proved undeveloped reserves at December 31 | | | 3,634 | | | | 3,719 | | | | 3,151 | | | | 2,252 | | | | 2,333 | |
Note: Numbers may not total due to rounding.
| (1) | Crude oil and condensate reserves include the fraction of liquefiable hydrocarbons recoverable in natural gas processing plants located at fields. |
| (2) | Revisions include positive and negative changes due to new data from well drilling, revisions made when actual reservoir performance differs from expected performance and the effect of changes in hydrocarbon prices. |
Source: Pemex Exploration and Production.
Dry Gas Reserves
| | | | | | | | | | | | | | | | | | | | |
| | | 2012 | | | 2013 | | | 2014 | | | 2015 | | | 2016 | |
| Proved developed and undeveloped reserves | | (in billions of cubic feet) | |
At January 1 | | | 12,734 | | | | 12,713 | | | | 12,273 | | | | 10,859 | | | | 8,610 | |
Revisions(1) | | | 1,377 | | | | 1,010 | | | | 4 | | | | (955 | ) | | | (183 | ) |
Extensions and discoveries | | | 162 | | | | 89 | | | | 93 | | | | 47 | | | | (308 | ) |
Production(2) | | | (1,560 | ) | | | (1,539 | ) | | | (1,511 | ) | | | (1,341 | ) | | | 1,134 | |
| | | | | | | | | | | | | | | | | | | | |
At December 31 | | | 12,713 | | | | 12,273 | | | | 10,859 | | | | 8,610 | | | | 6,984 | |
| | | | | | | | | | | | | | | | | | | | |
Proved developed reserves at December 31 | | | 7,951 | | | | 7,461 | | | | 6,740 | | | | 6,012 | | | | 4,513 | |
Proved undeveloped reserves at December 31 | | | 4,762 | | | | 4,811 | | | | 4,119 | | | | 2,598 | | | | 2,471 | |
Note: Numbers may not total due to rounding.
| (1) | Revisions include positive and negative changes due to new data from well drilling, revisions made when actual reservoir performance differs from expected performance and the effect of changes in hydrocarbon prices. |
| (2) | Production refers here to dry gas, although natural gas production reported in other tables refers to sour wet gas. There is a shrinkage in volume when natural gas liquids and impurities are extracted to obtain dry gas. Therefore, reported natural gas volumes are greater than dry gas volumes. |
Source: Pemex Exploration and Production.
33
The following table sets forth, as of December 31, 2016, the volumes of proved developed and undeveloped reserves, the number of producing wells and the number of proved undeveloped locations for the fields that contained 95.1% of our proved reserves.
| | | | | | | | | | | | | | | | | | | | |
| | | Reserves | | | | | | | |
Field | | Proved(1) | | | Developed(1) | | | Undeveloped(1) | | | Number of
Producing
Wells | | | Number of
Undeveloped
Locations(2) | |
| | | (in millions of barrels of oil equivalent) | | | | | | | |
Ku-Maloob-Zaap | | | 2,586.1 | | | | 2,166.4 | | | | 419.6 | | | | 173 | | | | 41 | |
Akal | | | 822.4 | | | | 822.4 | | | | — | | | | 98 | | | | — | |
Aceite Terciario del Golfo(3) | | | 730.5 | | | | 130.1 | | | | 600.4 | | | | 1,978 | | | | 4,202 | |
Ayatsil | | | 639.5 | | | | 147.1 | | | | 492.4 | | | | 6 | | | | 14 | |
Antonio J.Bermúdez(4) | | | 396.4 | | | | 262.3 | | | | 134 | | | | 221 | | | | 45 | |
Jujo-Tecominoacán | | | 223.7 | | | | 128.8 | | | | 94.9 | | | | 34 | | | | 17 | |
Xux | | | 140.9 | | | | 119.4 | | | | 21.5 | | | | 12 | | | | 3 | |
Xanab | | | 130.6 | | | | 75.8 | | | | 54.8 | | | | 10 | | | | 11 | |
Onel | | | 130.5 | | | | 89.3 | | | | 41.1 | | | | 6 | | | | 8 | |
Santuario | | | 108 | | | | 33.7 | | | | 74.3 | | | | 29 | | | | 32 | |
Ek | | | 92.8 | | | | 92.8 | | | | — | | | | 14 | | | | — | |
Balam | | | 87.8 | | | | 87.8 | | | | — | | | | 7 | | | | — | |
Homol | | | 79.7 | | | | 30.4 | | | | 49.3 | | | | 9 | | | | 5 | |
Tsimín | | | 72.2 | | | | 72.2 | | | | — | | | | 16 | | | | — | |
Ebano-Pánuco-Cacalilao | | | 64.6 | | | | 41.5 | | | | 23 | | | | 323 | | | | 310 | |
Lakach | | | 63.5 | | | | — | | | | 63.5 | | | | — | | | | 3 | |
Tamaulipas Constituciones | | | 63.3 | | | | 32.7 | | | | 30.6 | | | | 244 | | | | 133 | |
Tekel | | | 60.8 | | | | — | | | | 60.8 | | | | — | | | | 8 | |
Pokche | | | 57.1 | | | | — | | | | 57.1 | | | | — | | | | 4 | |
Xikin | | | 55.9 | | | | — | | | | 55.9 | | | | — | | | | 4 | |
Sihil | | | 51.9 | | | | 51.9 | | | | — | | | | 15 | | | | — | |
Arenque | | | 50.1 | | | | 15.9 | | | | 34.3 | | | | 14 | | | | 10 | |
Kambesah | | | 48 | | | | 48 | | | | — | | | | 5 | | | | — | |
Kab | | | 48 | | | | 14.3 | | | | 33.7 | | | | 4 | | | | 5 | |
Kuil | | | 45.8 | | | | 21.9 | | | | 23.9 | | | | 9 | | | | 2 | |
Puerto Ceiba | | | 45.1 | | | | 29.9 | | | | 15.2 | | | | 14 | | | | 10 | |
Eltreinta | | | 44 | | | | 21 | | | | 23 | | | | 8 | | | | 16 | |
Costero | | | 44 | | | | 44 | | | | — | | | | 12 | | | | — | |
Giraldas | | | 43.2 | | | | 34.7 | | | | 8.5 | | | | 9 | | | | 1 | |
Ixtal | | | 42 | | | | 36.8 | | | | 5.3 | | | | 10 | | | | — | |
Ayín | | | 38.8 | | | | — | | | | 38.8 | | | | — | | | | 4 | |
Tizón | | | 37 | | | | 37 | | | | — | | | | 11 | | | | — | |
Yaxché | | | 35.1 | | | | 13 | | | | 22.1 | | | | 8 | | | | 5 | |
Gasífero | | | 34.9 | | | | 23.5 | | | | 11.4 | | | | 22 | | | | 9 | |
Ogarrio | | | 34.7 | | | | 33.8 | | | | 0.9 | | | | 108 | | | | 2 | |
Cuervito | | | 34.6 | | | | 15.5 | | | | 19.2 | | | | 89 | | | | 59 | |
Utsil | | | 34.3 | | | | — | | | | 34.3 | | | | — | | | | 3 | |
Terra | | | 31.8 | | | | 15.6 | | | | 16.2 | | | | 11 | | | | 4 | |
Chuc | | | 29.9 | | | | 26.8 | | | | 3.1 | | | | 13 | | | | 1 | |
Poza Rica | | | 29.6 | | | | 25.1 | | | | 4.5 | | | | 93 | | | | 19 | |
Kax | | | 29.4 | | | | 29.4 | | | | — | | | | 2 | | | | — | |
May | | | 29.2 | | | | 29.2 | | | | — | | | | 12 | | | | — | |
Chinchorro | | | 29.1 | | | | 22.4 | | | | 6.7 | | | | 5 | | | | 2 | |
34
| | | | | | | | | | | | | | | | | | | | |
| | | Reserves | | | | | | | |
Field | | Proved(1) | | | Developed(1) | | | Undeveloped(1) | | | Number of
Producing
Wells | | | Number of
Undeveloped
Locations(2) | |
| | | (in millions of barrels of oil equivalent) | | | | | | | |
Rabasa | | | 27.2 | | | | 25.4 | | | | 1.8 | | | | 48 | | | | 1 | |
Teotleco | | | 25.3 | | | | 25.3 | | | | — | | | | 6 | | | | — | |
Bellota | | | 24.7 | | | | 18.7 | | | | 6 | | | | 5 | | | | 2 | |
Sen | | | 24.5 | | | | 18.9 | | | | 5.6 | | | | 12 | | | | 1 | |
Madrefil | | | 24.2 | | | | 21.4 | | | | 2.8 | | | | 5 | | | | 1 | |
Lum | | | 23.1 | | | | 17.6 | | | | 5.5 | | | | 3 | | | | 3 | |
Cárdenas | | | 22.9 | | | | 11.2 | | | | 11.7 | | | | 8 | | | | 4 | |
Etkal | | | 22.6 | | | | 10.5 | | | | 12.1 | | | | 1 | | | | 2 | |
Cuitláhuac | | | 22.3 | | | | 13 | | | | 9.3 | | | | 182 | | | | 54 | |
Tetl | | | 20.4 | | | | — | | | | 20.4 | | | | — | | | | 3 | |
Caparroso-Pijije-Escuintle | | | 20.1 | | | | 16.4 | | | | 3.8 | | | | 16 | | | | 1 | |
Cinco Presidentes | | | 19.8 | | | | 18.3 | | | | 1.5 | | | | 34 | | | | 3 | |
Tupilco | | | 19.8 | | | | 17.9 | | | | 1.9 | | | | 30 | | | | 1 | |
Nejo | | | 19.5 | | | | 14.6 | | | | 4.9 | | | | 198 | | | | 35 | |
Ixtoc | | | 19.1 | | | | 19.1 | | | | — | | | | 10 | | | | — | |
Edén-Jolote | | | 19.1 | | | | 14.1 | | | | 5 | | | | 7 | | | | 2 | |
Cauchy | | | 18.6 | | | | 18.6 | | | | — | | | | 23 | | | | — | |
Los Soldados | | | 17.6 | | | | 16 | | | | 1.6 | | | | 22 | | | | 1 | |
Jaatsul | | | 17.1 | | | | — | | | | 17.1 | | | | — | | | | 2 | |
Magallanes-Tucán-Pajonal | | | 15.3 | | | | 12.8 | | | | 2.4 | | | | 42 | | | | 5 | |
Paredón | | | 15 | | | | 15 | | | | — | | | | 2 | | | | — | |
San Ramón | | | 15 | | | | 13.9 | | | | 1 | | | | 50 | | | | 3 | |
Nohoch | | | 14.4 | | | | 14.4 | | | | — | | | | 7 | | | | — | |
Ayocote | | | 14.4 | | | | 10.1 | | | | 4.3 | | | | 15 | | | | 2 | |
Taratunich | | | 13.7 | | | | 13.7 | | | | — | | | | 7 | | | | — | |
Guaricho | | | 13.5 | | | | 13.1 | | | | 0.4 | | | | 14 | | | | 1 | |
Uech | | | 13.5 | | | | 13.5 | | | | — | | | | 2 | | | | — | |
Jacinto | | | 13.4 | | | | 13.4 | | | | — | | | | 3 | | | | — | |
Sinán | | | 13 | | | | 13 | | | | — | | | | 7 | | | | — | |
Mora | | | 12.8 | | | | 9.4 | | | | 3.4 | | | | 5 | | | | 2 | |
Bacab | | | 12.8 | | | | 12.8 | | | | — | | | | 6 | | | | — | |
Tintal | | | 12.4 | | | | 8.5 | | | | 3.9 | | | | 6 | | | | 8 | |
Takín | | | 12.3 | | | | 12.3 | | | | — | | | | 4 | | | | — | |
Sunuapa | | | 12.2 | | | | 10.2 | | | | 2.1 | | | | 10 | | | | 2 | |
Esah | | | 11.6 | | | | — | | | | 11.6 | | | | — | | | | 2 | |
Bedel | | | 11.3 | | | | 5.6 | | | | 5.6 | | | | 6 | | | | 8 | |
Sini | | | 11.1 | | | | 8.3 | | | | 2.8 | | | | 6 | | | | 1 | |
| | | | | | | | | | | | | | | | | | | | |
Total | | | 8,142.3 | | | | 5,419.7 | | | | 2,722.6 | | | | 4,456 | | | | 5,142 | |
| | | | | | | | | | | | | | | | | | | | |
Our proved reserves | | | 8,562.8 | | | | 5,753.4 | | | | 2,808.4 | | | | | | | | | |
Percentage | | | 95.1 | % | | | 94.2 | % | | | 96.9 | % | | | | | | | | |
Note: Numbers may not total due to rounding.
| (1) | Proved reserves, developed reserves and undeveloped reserves are expressed in millions of barrels of oil equivalent. To convert dry gas to barrels of oil equivalent, a factor of 5.201 thousand cubic feet of dry gas per barrel of oil equivalent is used. |
| (2) | Undeveloped Locations refers to the number of geographic sites or locations where a well will be drilled to produce undeveloped proved reserves. |
| (3) | Includes extraction assignments and temporary assignments. |
| (4) | Includes the Cunduacán, Iride, Oxiacaque, Platanal and Samaria fields. |
Source: Pemex Exploration and Production.
35
Our reserve-replacement ratio, or RRR, for a given period is calculated by dividing the sum of proved reserves additions due to discoveries, developments, delineations and revisions by that period’s total production. During 2016, we obtained 40 million barrels of oil equivalent of proved reserves, which represents a RRR of 4%. While low, our 2016 RRR is an improvement as compared to 2015, where there was no replacement of proved reserves. We expect continued improvements in our RRR in subsequent years.
Our reserves production ratio, which is presented in terms of years, is calculated by dividing the estimated remaining reserves at the end of the relevant year by the total production of hydrocarbons for that year. As of December 31, 2016, this ratio was equal to 7.7 years for proved reserves of crude oil equivalent, which represents a decrease of 4.9% as compared to the 2015 reserves production ratio of 8.1 years for proved reserves. For more information, see Note 29 to our consolidated financial statements included herein.
Sales Prices and Production Costs
The following table sets forth our average sales price per unit of oil and gas produced and our average production cost per unit of production, in the aggregate and for each field containing 10% or more of our proved reserves.
Unit Sales Prices and Production Costs(1)
| | | | | | | | | | | | | | | | |
| | | Ku-Maloob-
Zaap | | | Akal | | | Other Fields | | | All Fields | |
| | | (in U.S. dollars) | |
Year ended December 31, 2016 | | | | | | | | | | | | | | | | |
Average sales prices | | | | | | | | | | | | | | | | |
Crude oil, per barrel | | U.S. $ | 30.11 | | | U.S. $ | 36.67 | | | U.S. $ | 40.21 | | | U.S. $ | 36.55 | |
Natural gas, per thousand cubic feet | | U.S. $ | 3.40 | | | U.S. $ | 2.86 | | | U.S. $ | 3.16 | | | U.S. $ | 3.01 | |
Average production costs, per barrel of oil equivalent | | U.S. $ | 5.34 | | | U.S. $ | 16.53 | | | U.S. $ | 8.08 | | | U.S. $ | 7.78 | |
| |
Year ended December 31, 2015 | | | | |
Average sales prices | | | | | | | | | | | | | | | | |
Crude oil, per barrel | | U.S. $ | 41.21 | | | U.S. $ | 47.79 | | | U.S. $ | 51.51 | | | U.S. $ | 48.22 | |
Natural gas, per thousand cubic feet | | U.S. $ | 4.59 | | | U.S. $ | 3.59 | | | U.S. $ | 3.79 | | | U.S. $ | 3.78 | |
Average production costs, per barrel of oil equivalent | | U.S. $ | 6.93 | | | U.S. $ | 15.97 | | | U.S. $ | 9.69 | | | U.S. $ | 9.40 | |
| |
Year ended December 31, 2014 | | | | |
Average sales prices | | | | | | | | | | | | | | | | |
Crude oil, per barrel | | U.S. $ | 80.58 | | | U.S. $ | 90.67 | | | U.S. $ | 95.14 | | | U.S. $ | 90.37 | |
Natural gas, per thousand cubic feet | | U.S. $ | 6.96 | | | U.S. $ | 5.36 | | | U.S. $ | 5.74 | | | U.S. $ | 5.71 | |
Average production costs, per barrel of oil equivalent | | U.S.$ | 5.05 | | | U.S. $ | 10.79 | | | U.S. $ | 9.16 | | | U.S. $ | 8.22 | |
| (1) | Average of sales prices as of the last day of each month of the year. |
Source: Pemex Exploration and Production.
In 2016, our average production cost was U.S. $7.78 per barrel of oil equivalent, and represented a decrease of 17.2%, as compared to our average production cost of U.S. $9.40 per barrel in 2015. This decrease resulted primarily from a decrease in expenses in the maintenance of wells, equipment and production facilities and lowernon-income related taxes and duties.
We calculate and disclose our production costs pursuant to international practices, which are based on U.S. GAAP under ASC Topic 932. In accordance with ASC Topic 932, the production cost per barrel of oil equivalent is calculated by dividing total production expenses (in U.S. dollars) by total production of oil and gas (in barrels of oil equivalent) for the relevant period.
36
Our total production cost consists of all direct and indirect costs incurred to produce crude oil and gas, including costs associated with the operation and maintenance of wells and related equipment and facilities. In addition, it includes costs of labor to operate the wells and facilities, the costs of materials, supplies and fuel consumed, including gas used for gas lifting, nitrogen and other chemicals, repair andnon-capitalized maintenance costs, and other costs, such as fees for general services, a labor fund for active personnel, corporate services, indirect overhead and applicable taxes and duties. However, it excludesnon-cash expenses such as amortization of capitalized well expenses, the depreciation of fixed assets, expenses associated with the distribution and handling of oil and gas and other expenses that are related to exploration and drilling activities.
Crude Oil and Natural Gas Production
In 2016, we produced an average of 2,153.5 thousand barrels per day of crude oil, 5.0% less than our average production in 2015 of 2,266.8 thousand barrels per day of crude oil. The decrease in 2016 resulted primarily from the decrease of production in the Cantarell, Crudo Ligero Marino, El Golpe-Puerto Ceiba, Bellota-Chinchorro, Complejo Antonio J. Bermúdez, Cactus Sitio Grande, Ixtal-Manik, Chuc, Costero Terrestre, andTsimín-Xux projects. Accordingly, our average production of heavy crude oil decreased by 49.7 thousand barrels per day, or 4.3% less than the average daily production in 2015, primarily due to a decrease in our drilling activities, the natural decline in field production, an increase in fractional flow water production and an increase in the gas production cap of reservoirs, particularly for reservoirs past the saturation stage. In 2016, the average production of light crude oil decreased by 63.6 thousand barrels per day, or 5.7%, as compared to 2015. This decrease occurred mainly due to a natural decline in production in the Chuhuk, Caan, and Ixtal fields of theAbkatún-Pol-Chuc business unit; the Tsimín, Sinán, Bolontikú, and Yaxché fields of the Litoral de Tabasco business unit; the Costero, Sitio Grande, Teotleco fields of the Macuspana-Muspac business unit and the Samaria, ��ride, Cunduacán and Sini fields of the Samaria-Luna business unit.
Crude oil can be classified by its sulfur content. “Sour” or heavy crude oil contains 3.4% or greater sulfur content by weight and “sweet” or light crude oil contains less than 1.0% sulfur content by weight. Most of our production is classified as sour or heavy crude oil.
Our exploration and production segment primarily produces four types of crude oil:
| | • | | Altamira, a heavy crude oil; |
| | • | | Maya, a heavy crude oil; |
| | • | | Isthmus, a light crude oil; and |
| | • | | Olmeca, an extra-light crude oil. |
Most of our production consists of Isthmus and Maya crude oil. In 2016, 51.2% of our total production of crude oil consisted of heavy crude oil and 48.8% consisted of light and extra-light crude oil. The Marine regions yield mostly heavy crude oil (59.9% of these regions’ production in 2016), although significant volumes of light crude oil are also produced there (40.1% of these regions’ production in 2016). The Southern region yields mainly light and extra-light crude oil (together, 93.5% of this region’s production in 2016), and the Northern region yields both light and extra-light crude oil (42.8% of this region’s production in 2016) and heavy crude oil (57.2% of this region’s production in 2016).
The most productive crude oil and natural gas fields in the Gulf of Mexico are located in the Ku-Maloob-Zaap, Litoral de Tabasco,Abkatún-Pol-Chuc and Cantarell business units in the Marine regions and the Sarmaria Luna and Bellota-Jujo business units in the Southern region. In particular, theKu-Maloob-Zaap business unit was the most important crude oil producer in 2016, producing an average of 866.6 thousand barrels of crude oil per day in 2016, or 40.2% of our total crude oil production for the year, and 589.3 million cubic feet per day of natural gas, or 10.2% of our total natural gas production for the year. Our second most important crude oil producer was Litoral de Tabasco which produced an average of 359.9 thousand barrels of crude oil per day in
37
2016, or 16.7% of our total crude oil production for the year, and an average of 950.0 million cubic feet per day of natural gas, or 16.4% of our total natural gas production for the year.
The following table sets forth our annual crude oil production rates by type of oil for the five years ended December 31, 2016.
Crude Oil Production
| | | | | | | | | | | | | | | | | | | | | | | | |
| | | | | | 2016
vs. 2015 | |
| | | 2012 | | | 2013 | | | 2014 | | | 2015 | | | 2016 | | |
| | | (in thousands of barrels per day) | | | (%) | |
Marine regions | | | | | | | | | | | | | | | | | | | | | | | | |
Heavy crude oil | | | 1,280.2 | | | | 1,258.3 | | | | 1,160.1 | | | | 1,054.9 | | | | 1,018.3 | | | | (3.5 | ) |
Light crude oil(1) | | | 614.5 | | | | 638.1 | | | | 691.3 | | | | 705.4 | | | | 682.7 | | | | (3.2 | ) |
| | | | | | | | | | | | | | | | | | | | | | | | |
Total | | | 1,894.6 | | | | 1,896.4 | | | | 1,851.4 | | | | 1,760.3 | | | | 1,700.9 | | | | (3.4 | ) |
Southern region | | | | | | | | | | | | | | | | | | | | | | | | |
Heavy crude oil | | | 18.5 | | | | 26.5 | | | | 35.0 | | | | 31.7 | | | | 22.3 | | | | (29.7 | ) |
Light crude oil(1) | | | 489.6 | | | | 454.3 | | | | 417.4 | | | | 362.1 | | | | 321.8 | | | | (11.1 | ) |
| | | | | | | | | | | | | | | | | | | | | | | | |
Total | | | 508.2 | | | | 480.8 | | | | 452.4 | | | | 393.8 | | | | 344.1 | | | | (12.6 | ) |
Northern region | | | | | | | | | | | | | | | | | | | | | | | | |
Heavy crude oil | | | 86.3 | | | | 80.2 | | | | 70.4 | | | | 65.7 | | | | 62.0 | | | | (5.6 | ) |
Light crude oil(1) | | | 58.8 | | | | 64.7 | | | | 54.6 | | | | 47.0 | | | | 46.5 | | | | (1.1 | ) |
| | | | | | | | | | | | | | | | | | | | | | | | |
Total | | | 145.1 | | | | 144.9 | | | | 125.0 | | | | 112.7 | | | | 108.5 | | | | (3.7 | ) |
Total heavy crude oil | | | 1,385.0 | | | | 1,365.1 | | | | 1,265.5 | | | | 1,152.3 | | | | 1,102.6 | | | | (4.3 | ) |
Total light crude oil(1) | | | 1,162.9 | | | | 1,157.1 | | | | 1,163.3 | | | | 1,114.5 | | | | 1,050.9 | | | | (5.7 | ) |
| | | | | | | | | | | | | | | | | | | | | | | | |
Total crude oil | | | 2,547.9 | | | | 2,522.1 | | | | 2,428.8 | | | | 2,266.8 | | | | 2,153.5 | | | | (5.0 | ) |
| | | | | | | | | | | | | | | | | | | | | | | | |
Note: Numbers may not total due to rounding.
| (1) | Includes extra-light crude oil. |
Source: Pemex Exploration and Production.
38
The following table sets forth our annual crude oil production by region and business unit for the five years ended December 31, 2016.
Crude Oil Production
| | | | | | | | | | | | | | | | | | | | | | | | |
| | | | | | 2016
vs. 2015 | |
| | | 2012 | | | 2013 | | | 2014 | | | 2015 | | | 2016 | | |
| | | (in thousands of barrels per day) | | | (%) | |
Marine regions | | | | | | | | | | | | | | | | | | | | | | | | |
Ku-Maloob-Zaap | | | 855.1 | | | | 863.8 | | | | 856.7 | | | | 853.1 | | | | 866.6 | | | | 1.6 | |
Cantarell | | | 454.1 | | | | 439.8 | | | | 374.9 | | | | 273.4 | | | | 215.8 | | | | (21.1 | ) |
Litoral de Tabasco | | | 319.2 | | | | 299.2 | | | | 320.4 | | | | 347.2 | | | | 359.9 | | | | 3.7 | |
Abkatún-Pol-Chuc | | | 266.3 | | | | 293.6 | | | | 299.3 | | | | 286.7 | | | | 258.7 | | | | (9.8 | ) |
| | | | | | | | | | | | | | | | | | | | | | | | |
Total | | | 1,894.6 | | | | 1,896.4 | | | | 1,851.4 | | | | 1,760.3 | | | | 1,701.0 | | | | (3.4 | ) |
Southern region | | | | | | | | | | | | | | | | | | | | | | | | |
Samaria-Luna | | | 205.1 | | | | 172.5 | | | | 161.4 | | | | 145.4 | | | | 127.0 | | | | (12.7 | ) |
Bellota-Jujo | | | 130.3 | | | | 134.3 | | | | 124.8 | | | | 101.7 | | | | 90.3 | | | | (11.2 | ) |
Cinco Presidentes | | | 96.0 | | | | 93.1 | | | | 89.1 | | | | 87.6 | | | | 80.0 | | | | (8.7 | ) |
Macuspana-Muspac | | | 76.8 | | | | 80.9 | | | | 77.0 | | | | 59.0 | | | | 46.8 | | | | (20.7 | ) |
| | | | | | | | | | | | | | | | | | | | | | | | |
Total | | | 508.2 | | | | 480.8 | | | | 452.4 | | | | 393.8 | | | | 344.1 | | | | (12.6 | ) |
Northern region | | | | | | | | | | | | | | | | | | | | | | | | |
Aceite Terciario del Golfo | | | 68.6 | | | | 66.2 | | | | 48.8 | | | | 42.0 | | | | 39.8 | | | | (5.2 | ) |
Poza Rica-Altamira | | | 67.8 | | | | 61.5 | | | | 59.8 | | | | 58.7 | | | | 53.9 | | | | (8.0 | ) |
Burgos | | | 4.8 | | | | 8.0 | | | | 5.0 | | | | 0.0 | | | | — | | | | �� | |
Veracruz | | | 4.0 | | | | 9.3 | | | | 11.4 | | | | 12.1 | | | | 14.8 | | | | 22.3 | |
| | | | | | | | | | | | | | | | | | | | | | | | |
Total | | | 145.1 | | | | 144.9 | | | | 125.0 | | | | 112.7 | | | | 108.5 | | | | (3.7 | ) |
| | | | | | | | | | | | | | | | | | | | | | | | |
Total crude oil | | | 2,547.9 | | | | 2,522.1 | | | | 2,428.8 | | | | 2,266.8 | | | | 2,153.5 | | | | (5.0 | ) |
| | | | | | | | | | | | | | | | | | | | | | | | |
Note: Numbers may not total due to rounding.
Source: Pemex Exploration and Production.
The Marine regions, which are comprised of the Northeastern Marine region and the Southwestern Marine region, are located on the continental shelf and its slope in the Gulf of Mexico. They cover a surface area of approximately 550,000 square kilometers, located entirely within Mexican territorial waters, along the coast of the states of Tabasco, Campeche, Yucatán, Quintana Roo and the southern coast of the state of Veracruz. In 2016, the average crude oil production from the 43 fields located in these regions was 1,701.0 thousand barrels per day.
The Southern region covers an area of approximately 392,000 square kilometers, including the states of Guerrero, Oaxaca, Chiapas, Tabasco, Yucatán, Quintana Roo, Campeche and Veracruz. In 2016, the average crude oil production from the 88 fields located in this region was 344.1 thousand barrels per day.
The Northern region, including its offshore area, is located on the continental shelf in the Gulf of Mexico along the coast of the state of Tamaulipas and the northern coast of the state of Veracruz. It covers an area of approximately 1.8 million square kilometers. Our production area in the onshore portion of this region is located in, among others, the states of Veracruz, Tamaulipas, Nuevo León, Coahuila, San Luis Potosí and Puebla; we also produce offshore on the continental shelf in the Gulf of Mexico. In 2016, the average crude oil and natural gas production in the Northern region totaled 108.5 thousand barrels of crude oil per day and 1,427.8 million cubic feet of natural gas per day, respectively, from the 274 oil and gas fields in this region.
39
The following table sets forth our annual natural gas production by region and business unit for the five years ended December 31, 2016.
Natural Gas Production
| | | | | | | | | | | | | | | | | | | | | | | | |
| | | | | | 2016
vs. 2015 | |
| | | 2012 | | | 2013 | | | 2014 | | | 2015 | | | 2016 | | |
| | | (in millions of cubic feet per day) | | | (%) | |
Marine regions | | | | | | | | | | | | | | | | | | | | | | | | |
Cantarell | | | 1,004.2 | | | | 1,007.1 | | | | 1,120.9 | | | | 1,277.1 | | | | 1,184.9 | | | | (7.2 | ) |
Litoral de Tabasco | | | 735.6 | | | | 747.6 | | | | 842.6 | | | | 993.5 | | | | 950.0 | | | | (4.4 | ) |
Abkatún-Pol-Chuc | | | 523.6 | | | | 579.4 | | | | 553.4 | | | | 455.9 | | | | 390.5 | | | | (14.3 | ) |
Ku-Maloob-Zaap | | | 329.7 | | | | 405.1 | | | | 571.0 | | | | 556.5 | | | | 589.3 | | | | 5.9 | |
| | | | | | | | | | | | | | | | | | | | | | | | |
Total | | | 2,593.1 | | | | 2,739.2 | | | | 3,087.9 | | | | 3,283.0 | | | | 3,114.6 | | | | (5.1 | ) |
Southern region | | | | | | | | | | | | | | | | | | | | | | | | |
Samaria-Luna | | | 695.9 | | | | 606.3 | | | | 583.1 | | | | 500.3 | | | | 498.7 | | | | (0.3 | ) |
Macuspana-Muspac | | | 542.9 | | | | 515.1 | | | | 490.5 | | | | 455.3 | | | | 382.2 | | | | (16.1 | ) |
Bellota-Jujo | | | 297.4 | | | | 319.7 | | | | 288.9 | | | | 264.5 | | | | 231.5 | | | | (12.5 | ) |
Cinco Presidentes | | | 116.3 | | | | 129.4 | | | | 152.8 | | | | 160.1 | | | | 137.7 | | | | (14.0 | ) |
| | | | | | | | | | | | | | | | | | | | | | | | |
Total | | | 1,652.4 | | | | 1,570.5 | | | | 1,515.4 | | | | 1,380.1 | | | | 1,250.0 | | | | (9.4 | ) |
Northern region | | | | | | | | | | | | | | | | | | | | | | | | |
Burgos | | | 1,269.3 | | | | 1,286.6 | | | | 1,221.0 | | | | 1,099.0 | | | | 864.6 | | | | (21.3 | ) |
Veracruz | | | 601.2 | | | | 494.5 | | | | 455.3 | | | | 392.2 | | | | 322.8 | | | | (17.7 | ) |
Aceite Terciario del | | | | | | | | | | | | | | | | | | | | | | | | |
Golfo | | | 148.8 | | | | 167.0 | | | | 149.5 | | | | 145.2 | | | | 142.5 | | | | (1.9 | ) |
Poza Rica-Altamira | | | 120.0 | | | | 112.4 | | | | 102.8 | | | | 101.5 | | | | 97.9 | | | | (3.5 | ) |
| | | | | | | | | | | | | | | | | | | | | | | | |
Total | | | 2,139.3 | | | | 2,060.6 | | | | 1,928.6 | | | | 1,737.9 | | | | 1,427.8 | | | | (17.8 | ) |
| | | | | | | | | | | | | | | | | | | | | | | | |
Total natural gas | | | 6,384.9 | | | | 6,370.3 | | | | 6,531.9 | | | | 6,401.0 | | | | 5,792.5 | | | | (9.5 | ) |
| | | | | | | | | | | | | | | | | | | | | | | | |
Note: Numbers may not total due to rounding.
Source: Pemex Exploration and Production.
In 2016, the Marine regions produced 3,114.6 million cubic feet per day of natural gas, or 53.8% of our total natural gas production, a decrease of 5.1% as compared to the regions’ 2015 production of 3,283.0 million cubic feet per day. In 2016, the Southern region produced 1,250.0 million cubic feet per day of natural gas, or 21.6% of our total natural gas production, a decrease of 9.4% as compared to the region’s 2015 production of 1,380.1 million cubic feet per day. In 2016, the Northern region produced 1,427.8 million cubic feet per day of natural gas, or 24.6% of our total natural gas production, a decrease of 17.8% as compared to the region’s 2015 production of 1,737.9 million cubic feet per day.
Our average natural gas production decreased by 9.5% in 2016, from 6,401.0 million cubic feet per day in 2015 to 5,792.5 million cubic feet per day in 2016. Natural gas production associated with crude oil production accounted for 78.4% of total natural gas production in 2016, with the remainder of natural gas production consisting of extraction from fields holding natural gas reserves. As of December 31, 2016, 170 of our 405 gas producing fields, or 42.0%, producednon-associated gas. Thesenon-associated gas fields accounted for 21.6% of all natural gas production in 2016.
Investments in Exploration and Production
In nominal peso terms, our capital expenditures for exploration and production were Ps. 137,242 million in 2016, as compared to Ps. 151,546 million in 2015, representing a decrease of 9.4% in nominal terms. Of our total
40
capital expenditures, Ps. 25,468 million was directed to theKu-Maloob-Zaap fields, Ps. 13,802 million was directed to theTsimin-Xux project, Ps. 10,024 million was directed to the Chuc project, Ps. 8,179 million was directed to the Cantarell fields, Ps. 4,931 million was directed to the Crudo Ligero Marino project, Ps. 3,543 million was directed to theOgarrio-Sánchez Magallanes project, Ps. 2,859 million was directed to the Delta del Gijalva fields, Ps. 2,562 million was directed to the Antonio J. Bermúdez fields, Ps. 2,032 million was used for development of the Burgos natural gas fields (including Ps. 146 million of investments made through the Financed Public Works Contracts Program, see “—Business Overview—Exploration and Production—Integrated Exploration and Production Contracts and Financed Public Works Contracts” in this Item 4) and Ps. 1,487 million was directed to the ATG project. During 2016, expenditures for these ten projects amounted to 54.6% of all our capital expenditures for exploration and production. The remaining 45.4% amounted to Ps. 62,355 million in nominal terms, which was directed to the 16 remaining projects, as well as to other exploratory projects, other development projects and administrative and technical support.
2017 Exploration and Production Capital Expenditures Budget
For 2017, our total capital expenditures budget is Ps. 73,927 million, as compared to Ps. 137,242 million of capital expenditures made in 2016, representing a decrease of 46.1%, largely due to our strategic focus on our most profitable projects. The 2017 budget includes all of the 26 ongoing strategic exploration and production projects, Ps. 20,344 million in other exploratory projects and Ps. 103 million in administrative and technical support. Approximately Ps. 53,480 million, or 72% of our 2017 capital expenditures budget, is to be allocated to projects relating to field development and pipelines. Approximately Ps. 20,344 million, or 28% of the total budget, will be allocated to exploration activities.
The 2017 exploration and production budget includes Ps. 16,944 million for investments in theKu-Maloob-Zaap project, Ps. Ps. 7,804 million for the Integral Yaxché project, 6,730 million for the Chuc project, Ps. 4,744 million for theTsimin-Xux project, Ps. 2,031 million for the Cantarell project, Ps. 1,990 million for the Delta del Grijalva project, Ps. 1,455 million for the Crudo Ligero Marino project, Ps. 1,445 million for the Antonio J. Bermúdez project, Ps. 1,307 million for theOgarrio-Sánchez Magallanes project, Ps. 904 million for the Burgos project, Ps. 484 million for the Bellota Chinchorro project, and Ps. 28,089 million for the remaining projects, as well as for other exploratory and development projects and administrative and technical support.
Exploration and Production Investment Trends
In 2016, we invested Ps. 32,441 million in nominal terms, or 24% of the total capital expenditures of our exploration and production segment, in exploration activities, which represents a 4% increase from the Ps. 31,146 million invested in exploration activities in 2015. In 2016, we invested Ps. 104,801 million in nominal terms, or 76% of our total capital expenditures in development activities, which represents a 13% decrease from the Ps. 120,398 million invested in development activities in 2015.
In 2017, we have budgeted Ps. 20,885 million, or 28% of total capital expenditures, for exploration activities of our exploration and production segment, which represents a 37% decrease in nominal terms from the amount invested in exploration activities in 2016. For development activities in 2017, we have budgeted Ps. 53,045 million, or 72% of total capital expenditures, which represents a 49% decrease in nominal terms from the amount that we invested in development activities in 2016.
Our projected exploration and development capital expenditures correspond to the areas assigned to us through Round Zero, which represent the areas in which we are exploring, operating or have an interest in developing based on our operational capabilities. The Ministry of Energy granted us the right to explore and develop these areas with the aim of maintaining our production levels in the short term, while providing us with sufficient exploration opportunities to increase our production in the future. Given that a significant number of exploration areas were reserved by the Mexican Government for future competitive bidding rounds, we intend to carry out our strategy of increasing production and improving our RRR over time by entering into strategic joint
41
ventures with other oil and gas companies. Through these joint ventures, we hope to gain access to new technology and international best practices, while sharing the costs associated with security, occupational health and environmental protection and minimizing our operational risks. Over time, the allocation of our capital expenditures budget may change according to the results of subsequent bidding rounds in which we participate.
The capital expenditures of our exploration and production segment have constituted 74.5% or more of our total capital expenditures in each of the last five years. In 2017, the budgeted capital expenditures of our exploration and production segment constitute 67.8% of our total.
The following table sets forth our capital expenditures related to exploration and development during the three years ended December 31, 2016 and our estimated capital expenditures budget for exploration and development for 2017.
Exploration and Development Capital Expenditures
| | | | | | | | | | | | | | | | |
| | | Year ended December 31,(1) | | | Budget
2017(2) | |
| | | 2014 | | | 2015 | | | 2016 | | |
| | | (in millions of nominal pesos) | | | | |
Exploration | | Ps. | 35,082 | | | Ps. | 31,146 | | | Ps. | 32,441 | | | Ps. | 20,885 | |
Development | | | 186,986 | | | | 120,398 | | | | 104,801 | | | | 53,042 | |
| | | | | | | | | | | | | | | | |
Total | | Ps. | 222,069 | | | Ps. | 151,544 | | | Ps. | 137,242 | | | Ps. | 73,927 | |
| | | | | | | | | | | | | | | | |
Note: Numbers may not total due to rounding.
| (1) | Amounts based on cash basis method of accounting. |
| (2) | Budget authorized on December 14, 2016 and presented to the Board of Directors of Petróleos Mexicanos on April 7, 2017. |
Source: Pemex Exploration and Production.
42
Investments and Production by Project
We conduct exploration, production and development activities in fields throughout Mexico. Our main projects areKu-Maloob-Zaap,Tsimin-Xux, ATG, Cantarell, Crudo Ligero Marino, Burgos, Chuc, Antonio J. Bermúdez,Ogarrio-Sánchez Magallanes and Delta del Grijalva. These projects are described below.
Exploration and Production’s Capital Expenditures
| | | | | | | | | | | | | | | | |
| | | Year ended December 31,(1) | | | Budget
2017(2) | |
| | | 2014 | | | 2015 | | | 2016 | | |
| | | (in millions of pesos)(3) | | | | |
Exploration and Production | | | | | | | | | | | | |
Ku-Maloob-Zaap | | Ps. | 34,232 | | | Ps. | 23,507 | | | Ps. | 25,468 | | | Ps. | 16,944 | |
Tsimin-Xux | | | 19,638 | | | | 13,950 | | | | 13,802 | | | | 4,744 | |
Integral Yaxché | | | 4,695 | | | | 6,649 | | | | 10,116 | | | | 7,804 | |
Chuc | | | 10,618 | | | | 10,037 | | | | 10,024 | | | | 6,730 | |
Cantarell | | | 18,276 | | | | 11,217 | | | | 8,179 | | | | 2,031 | |
Lakach | | | 6,141 | | | | 3,079 | | | | 5,683 | | | | 1,635 | |
Crudo Ligero Marino | | | 12,829 | | | | 9,275 | | | | 4,931 | | | | 1,455 | |
Ogarrio-Sánchez Magallanes | | | 7,020 | | | | 4,626 | | | | 3,543 | | | | 1,307 | |
Delta del Grijalva | | | 5,348 | | | | 4,687 | | | | 2,859 | | | | 1,990 | |
Ek-Balam | | | 5,304 | | | | 2,722 | | | | 2,687 | | | | 433 | |
Antonio J. Bermúdez | | | 8,840 | | | | 5,352 | | | | 2,562 | | | | 1,445 | |
Burgos | | | 11,695 | | | | 5,855 | | | | 2,032 | | | | 904 | |
Bellota-Chinchorro | | | 3,739 | | | | 4,070 | | | | 1,978 | | | | 484 | |
Ixtal-Manik | | | 1,815 | | | | 1,439 | | | | 1,740 | | | | 265 | |
Cactus-Sitio Grande | | | 3,928 | | | | 2,671 | | | | 1,555 | | | | 739 | |
Aceite Terciario del Golfo | | | 18,943 | | | | 2,817 | | | | 1,487 | | | | 871 | |
El Golpe-Puerto Ceiba | | | 4,148 | | | | 2,605 | | | | 1,375 | | | | 277 | |
Jujo-Tecominoacán | | | 1,680 | | | | 847 | | | | 997 | | | | 938 | |
Veracruz Basin | | | 4,262 | | | | 1,538 | | | | 884 | | | | 1,517 | |
Integral Poza Rica | | | 1,695 | | | | 438 | | | | 521 | | | | 227 | |
Tamaulipas-Constituciones | | | 1,205 | | | | 459 | | | | 501 | | | | 149 | |
Ayín-Alux | | | 789 | | | | 1,161 | | | | 443 | | | | 1 | |
Costero Terrestre | | | 1,110 | | | | 321 | | | | 380 | | | | 76 | |
Cuenca de Macuspana | | | 874 | | | | 476 | | | | 368 | | | | 221 | |
Lankahuasa | | | 33 | | | | — | | | | 22 | | | | 4 | |
Arenque | | | 708 | | | | 26 | | | | 16 | | | | 6 | |
Other Exploratory Projects | | | 31,403 | | | | 31,146 | | | | 32,410 | | | | 20,344 | |
Other Development Projects | | | 21 | | | | 17 | | | | 172 | | | | 282 | |
Administrative and Technical Support | | | 1,078 | | | | 557 | | | | 507 | | | | 103 | |
| | | | | | | | | | | | | | | | |
Total | | | 222,069 | | | | 151,546 | | | | 137,242 | | | | 73,927 | |
| | | | | | | | | | | | | | | | |
Notes: Numbers may not total due to rounding.
| (1) | Amounts based on cash basis method of accounting. |
| (2) | Budget authorized on December 14, 2016 and presented to the Board of Directors of Petróleos Mexicanos on April 7, 2017. |
| (3) | Figures for 2014, 2015 and 2016 are stated in nominal pesos. Figures for 2017 are stated in constant 2017 pesos. |
Source: Petróleos Mexicanos.
Ku-Maloob-Zaap Project.TheKu-Maloob-Zaap project was our most important producer of heavy crude oil and plays an important part in the production of the Maya crude oil mix. It is the most important project in Mexico in terms of total proved hydrocarbon reserves and crude oil production. It is composed of the Ayatsil,
43
Bacab, Lum, Ku, Maloob, Tekel, Utsil and Zaap fields, and extends over an area of 305.7 square kilometers. As of December 31, 2016, there was a total of 253 wells completed, 189 of which were producing. The project produced an average of 866.6 thousand barrels of crude oil per day, 40.2% of our total production, and 589.3 million cubic feet of natural gas per day in 2016. As of December 31, 2016, cumulative production was 5.1 billion barrels of crude oil and 2.6 trillion cubic feet of natural gas. As of December 31, 2016, proved hydrocarbon reserves totaled 3.0 billion barrels of crude oil and 1.5 trillion cubic feet of natural gas. Total proved reserves were 3.4 billion barrels of oil equivalent, of which 2.3 billion barrels of oil equivalent were proved developed reserves.
In nominal peso terms, our exploration and production segment’s capital expenditures for this project were Ps. 34,232 million in 2014, Ps. 23,507 million in 2015 and Ps. 25,468 million in 2016. For 2017, we anticipate that our capital expenditures will be Ps. 16,944 million and that total accumulated capital expenditures for this project will reach approximately U.S. $359,951 million. In 2016, we paid approximately U.S. $80.8 million to acquire approximately 193.7 billion cubic feet of nitrogen for the pressure maintenance project in the fifth module of the Cantarell nitrogen cryogenic plant, which began operations in November 2006. In 2017, we expect to spend approximately U.S. $102.9 million to acquire approximately 255.4 billion cubic feet of nitrogen for injection into theKu-Maloob-Zaap fields.
Tsimin-Xux Project.This project consists of the Tsimin and Xux fields, which include volatile oil and gas condensate reservoirs in the shallow waters of the Gulf of Mexico. The Tsimin field is located 62 kilometers from the Dos Bocas Marine Terminal in Paraíso, Tabasco, while the Xux field is located on the continental shelf of the Gulf of Mexico, approximately ten kilometers off the coast of Tabasco. During 2016, one new well was completed at the Tsimin field and two new wells were completed at the Xux field. During 2016, average daily production at theTsimin-Xux project totaled 114.0 thousand barrels of crude oil and 552.5 million cubic feet of natural gas. During 2016, the sales prices of the light and extra-light crude oil produced at this field averaged approximately U.S. $44.87 per barrel, making this one of our most important projects in terms of revenue generation.
As of December 31, 2016, cumulative production totaled 0.1 billion barrels of crude oil and 0.6 trillion cubic feet of natural gas. Proved oil and gas reserves totaled 102.6 million barrels of crude oil and 0.6 trillion cubic feet of natural gas. Total proved reserves were 213.1 million barrels of oil equivalent, of which 191.6 million barrels of oil equivalent were proved developed reserves.
In nominal peso terms, our exploration and production segment’s capital expenditures for theTsimin-Xux project were Ps. 13,802 million in 2016. In 2017, we expect capital expenditures for this project to total Ps. 4,744 million.
Chuc Project.The Chuc project is the second largest producer of light crude oil in the Southwestern Marine region, and includes the operation and maintenance of thePol-A facility and water injection complexes. In 2013, the Ministry of Finance and Public Credit approved the integration of the Caan project into the Chuc project. This project covers an area of 213 square kilometers and has been exploited by our exploration and production segment since 1981. The fields of this project are located on the continental shelf of the Gulf of Mexico, off the coast of the states of Tabasco and Campeche, at a depth of between the20- and100-meter isobaths, approximately 132 kilometers from the Dos Bocas Marine Terminal in Paraíso, Tabasco, and 79 kilometers northeast of Ciudad del Carmen, Campeche. The fields in the project include Abkatún, Batab, Caan, Ché, Chuc, Chuhuk, Etkal, Homol, Kanaab, Kuil, Onel, Pol, Taratunich and Tumut. In January 2007, the Pol and Batab projects were merged into the Chuc project. As of December 31, 2016, 113 wells had been completed, of which 77 were producing. During 2016, average production totaled 220.4 thousand barrels per day of crude oil and 329.9 million cubic feet per day of natural gas. As of December 31, 2016, cumulative production totaled 5.7 billion barrels of crude oil and 6.6 trillion cubic feet of natural gas. As of December 31, 2016, proved hydrocarbon reserves totaled 297.1 million barrels of oil and 518.7 billion cubic feet of natural gas, or 377.8 million barrels of oil equivalent. As of December 31, 2016, total proved developed reserves were 240.2 million barrels of oil equivalent.
44
In nominal peso terms, our exploration and production segment’s capital expenditures for the Chuc project were Ps. 10,618 million in 2014, Ps. 10,037 million in 2015 and Ps. 10,024 million in 2016. In 2017, we expect our capital expenditures to be Ps. 6,730 million and anticipate that our total accumulated capital expenditures for this project will reach approximately U.S. $142,969 million.
Cantarell Project.The Cantarell project is located on the continental shelf of the Gulf of Mexico. It consists of the Akal, Chac, Ixtoc, Kambesah, Kutz, Nohoch, Sihil and Takin fields, which extend over an area of 294.4 square kilometers. As of December 31, 2016, there was a total of 561 wells drilled in the Cantarell project, 151 of which were producing. During 2016, the Cantarell business unit, of which the Cantarell project is part, was the fourth most important producer of crude oil in Mexico, averaging 215.8 thousand barrels per day of crude oil. This was 21.1% less than 2015 production, which was 273.4 thousand barrels per day, as a result of the decline of crude oil reserves remaining in these fields. Natural gas production from the Cantarell business unit during 2016 averaged 1,184.9 million cubic feet per day. This was 7.2% less than the 2015 average natural gas production, which was 1,277.1 million cubic feet per day, due to the natural decline of field production and an increase in the fractional water flow of wells in highly fractured deposits.
As of December 31, 2016, cumulative production of the Cantarell project was 14.2 billion barrels of crude oil and 9.3 trillion cubic feet of natural gas. As of December 31, 2016, proved oil and gas reserves of the Cantarell project totaled 769.8 billion barrels of crude oil and 959.3 trillion cubic feet of natural gas. As of December 31, 2016, total proved reserves were 977.9 million barrels of oil equivalent, all of which were proved developed reserves.
The Akal field, which is the most important field in the Cantarell project, averaged 69.5 thousand barrels per day of crude oil production during 2016. This was 30.0% less than the average production in 2015, which was 99.4 thousand barrels per day.
In nominal peso terms, our exploration and production segment’s capital expenditures for the Cantarell project totaled Ps. 18,276 million in 2014, Ps. 11,217 million in 2015 and Ps. 8,179 million in 2016. For 2017, we budgeted Ps. 2,031 million for capital expenditures for the Cantarell project. By the end of 2017, we expect our capital expenditures to total approximately U.S. $43,146 million for this project.
On October 10, 1997, we awarded abuild-own-operate contract for a nitrogen cryogenic plant at the Cantarell project to a consortium formed by BOC Holdings, Linde, Marubeni, West Coast Energy and ICA Fluor Daniel. Under this contract, the consortium is responsible for the financing, design, construction and operation of the plant. The plant began operations in 2000 and cost approximately Ps. 10,131 million. Pursuant to the terms of the agreement, Pemex Exploration and Production has the right to acquire the nitrogen plant in the case of a default by the consortium. Pemex Exploration and Production has the obligation to acquire the nitrogen plant if it defaults under the contract. Under the terms of the contract, Pemex Exploration and Production committed to purchasing 1.2 billion cubic feet per day of nitrogen from the consortium and to continue to supply service through June 2027.
During 2016, we paid approximately U.S. $108.5 million under this contract for an approximate total volume of 250.1 billion cubic feet of nitrogen, which was injected into the Cantarell fields. In 2017, our exploration and production segment expects to pay approximately U.S. $152.6 million under this contract for an approximate total volume of 438.0 billion cubic feet of nitrogen to be injected into the fields.
Crudo Ligero Marino Project.In 2013, the Ministry of Finance and Public Credit approved the designation of the Crudo Ligero Marino project as a stand-alone project, thereby separating it from the Strategic Gas Program of which it formed part from 2001 through 2012. In 2013, theOch-Uech-Kax project was integrated into this project. The main objectives for the Crudo Ligero Marino project during the years 2015 to 2037 are to continue constructing six marine structures, in addition to the marine structure completed during 2014, drill additional wells, implement secondary recovery, as well as intervention, optimization and maintenance techniques to its
45
facilities, particularly in the Sinan, Kab and May fields. As of December 31, 2016, a total of 99 wells had been completed at this project, of which 41 were producing. During 2016, average daily production totaled 86.4 thousand barrels of crude oil and 280.9 million cubic feet of natural gas. As of December 31, 2016, cumulative production was 885.9 million barrels of crude oil and 2,409.4 billion cubic feet of natural gas. Proved oil and gas reserves totaled 91.2 million barrels of crude oil and 268.3 billion cubic feet of natural gas. Total proved reserves were 147.9 million barrels of oil equivalent, of which 114.2 million barrels were proved developed reserves.
In nominal peso terms, our exploration and production segment’s capital expenditures for the Crudo Ligero Marino project totaled Ps. 4,931 million in 2016. For 2017, we anticipate our capital expenditures to total Ps. 1,455 million.
Ogarrio-Sánchez Magallanes Project.TheOgarrio-Sánchez Magallanes project is composed of 21 crude oil and natural gas producing fields and forms part of the Cinco Presidentes business unit. This project is located between the state borders of Veracruz and Tabasco and covers an area of 10,820 square kilometers. From a geological standpoint, this project pertains to the Isthmus Saline basin, specifically the southeastern basins at the Tertiary level. TheOgarrio-Sánchez Magallanes project is geographically bounded by the Gulf of Mexico to the north, the geological folds of the Sierra Madre of Chiapas to the south, the Tertiary basin of Veracruz to the west and the Comalcalco Tertiary basin to the east. The primary objective of this project is to increase production levels through the drilling of development wells and infill wells, which are drilled between producing wells to more efficiently recover oil and gas reserves, the execution of workovers of wells and the implementation of secondary and enhanced oil recovery processes. In addition, we aim to optimize the infrastructure of this project in order to counteract the decreases in production levels that result from the natural depletion of its reservoirs.
As of December 31, 2016, theOgarrio-Sánchez Magallanes project had 524 producing wells and 27 new wells had been completed during 2016. Average daily production totaled 80.0 thousand barrels of crude oil and 137.7 million cubic feet of natural gas during 2016. As of December 31, 2016, cumulative production was 1.3 billion barrels of crude oil and 1.9 trillion cubic feet of natural gas. Proved hydrocarbon reserves totaled 149.9 million barrels of crude oil and 268.1 billion cubic feet of natural gas. Total proved reserves were 196.8 million barrels of oil equivalent, of which 175.5 million barrels were proved developed reserves.
In nominal peso terms, our capital expenditures for theOgarrio-Sánchez Magallanes project were Ps. 3,543 million in 2016. For 2017, we anticipate that our capital expenditures will total Ps. 1,307 million.
Delta del Grijalva Project.The Delta del Grijalva project is the most important project in the Southern region in terms of both oil and gas production. The project covers an area of 1,343 square kilometers and has been exploited by our exploration and production segment since 1982. As of December 31, 2016, there was a total of 196 wells drilled, of which 60 were producing. During 2016, the project produced an average of 81.6 thousand barrels per day of crude oil and 325.4 million cubic feet per day of natural gas. The most important fields are Terra, Tizón, Sen and Caparroso-Pijije-Escuintle.
| | • | | Terra.This field covers an area of 13.7 square kilometers. As of December 31, 2016, a total of 13 wells had been completed, 11 of which were producing. During 2016, the field produced an average of 21.7 thousand barrels per day of crude oil and 65.2 million cubic feet per day of natural gas. As of December 31, 2016, cumulative production was 43.6 million barrels of crude oil and 137.5 billion cubic feet of natural gas. Proved hydrocarbon reserves totaled 18.4 million barrels of crude oil and 56.9 billion cubic feet of natural gas. As of December 31, 2016, total proved reserves were 31.8 million barrels of oil equivalent, 15.6 million of which were proved developed reserves. |
| | • | | Sen.This field covers an area of 45.1 square kilometers. As of December 31, 2016, a total of 49 wells had been completed, 13 of which were producing. During 2016, the field produced an average of 5.1 thousand barrels per day of crude oil and 20.7 million cubic feet per day of natural gas. As of December 31, 2016, cumulative production was 312.8 million barrels of crude oil and 858.0 billion |
46
| | cubic feet of natural gas. Proved hydrocarbon reserves totaled 13.3 million barrels of crude oil and 48.0 billion cubic feet of natural gas. As of December 31, 2016, total proved reserves were 24.5 million barrels of oil equivalent, 18.9 million of which were proved developed reserves. |
| | • | | Caparroso-Pijije-Escuintle.This field covers an area of 28.2 square kilometers. As of December 31, 2016, a total of 53 wells had been completed, 14 of which were producing. During 2016, the field produced an average of 12.8 thousand barrels per day of crude oil and 35.9 million cubic feet per day of natural gas. As of December 31, 2016, cumulative production was 231.3 million barrels of crude oil and 648.8 billion cubic feet of natural gas. Proved hydrocarbon reserves totaled 11.7 million barrels of crude oil and 35.9 billion cubic feet of natural gas. As of December 31, 2016, total proved reserves were 20.1 million barrels of oil equivalent, 16.4 million of which were proved developed reserves. |
| | • | | Tizón.This field covers an area of 17.8 square kilometers. As of December 31, 2016, a total of 17 wells had been completed, 11 of which were producing. During 2016, the field produced an average of 28.5 thousand barrels per day of crude oil and 162.5 million cubic feet per day of natural gas. As of December 31, 2016, cumulative production was 76.4 million barrels of crude oil and 437.7 billion cubic feet of natural gas. Proved hydrocarbon reserves totaled 16.3 million barrels of crude oil and 88.1 billion cubic feet of natural gas. As of December 31, 2016, total proved reserves were 37.0 million barrels of oil equivalent, 37.0 million of which were proved developed reserves. |
As of December 31, 2016, cumulative production in the Delta del Grijalva project was 0.8 billion barrels of crude oil and 2.9 trillion cubic feet of natural gas. Proved oil and gas reserves as of December 31, 2016 totaled 67.8 million barrels of crude oil and 259.0 billion cubic feet of natural gas. As of December 31, 2016, total proved reserves were 128.6 million barrels of oil equivalent, 100.3 million of which were proved developed reserves.
In nominal peso terms, our exploration and production segment’s capital expenditures for the Delta del Grijalva project were Ps. 5,348 million in 2014, Ps. 4,687 million in 2015 and Ps. 2,859 million in 2016. In 2017, we expect our capital expenditures to be Ps. 1,990 million, bringing our total capital expenditures for the project to approximately U.S. $42,275 billion.
Antonio J. Bermúdez Project.In 2002, we began investing in the Antonio J. Bermúdez project, the main investment project in the Southern region and the fifth largest in Mexico. This project is designed to accelerate reserves recovery, as well as increase the recovery factor by drilling additional wells and implementing a system of pressure maintenance through nitrogen injection. It consists of the Samaria, Cunduacán, Oxiacaque, Iride and Platanal fields, and covers an area of 163 square kilometers. As of December 31, 2016, a total of 845 wells had been completed, of which 239 were producing. During 2016, the project produced an average of 45.4 thousand barrels per day of crude oil and 173.3 million cubic feet per day of natural gas. As of December 31, 2016, cumulative production was 3.0 billion barrels of crude oil and 4.6 trillion cubic feet of natural gas. As of December 31, 2016, proved hydrocarbon reserves in this field totaled 256.2 million barrels of crude oil and 601 billion cubic feet of natural gas. As of December 31, 2016, total proved reserves were 396.4 million barrels of oil equivalent, of which 262.3 million were proved developed reserves.
In nominal peso terms, our exploration and production segment’s capital expenditures for the Antonio J. Bermúdez project were Ps. 8,840 million in 2014, Ps. 5,352 million in 2015 and Ps. 2,562 million in 2016. For 2017, we anticipate that our capital expenditures for this project will be Ps. 1,445 million and that our total accumulated investments in the project will reach approximately U.S. $30,697 billion. In March 2005, we entered into a contract with Praxair México, S. de R.L. de C.V. to build, own and operate a nitrogen cryogenic plant, which was completed in June 2008. After completing testing in July 2008, we began injecting 190 million cubic feet per day of nitrogen into the project. In 2016, we paid approximately Ps. 808.5 million to acquire nitrogen from this plant, which we used to inject approximately 131.7 million cubic feet per day during 2016 for pressure maintenance in connection with the project. Between 2016 and 2022, we plan to continue to inject the same volume of nitrogen.
47
Burgos Project.The Burgos project is the largest producer ofnon-associated gas in Mexico. In 1997, our exploration and production segment, through Pemex-Exploration and Production, initiated a development program for the Burgos natural gas fields. The purpose of the Burgos project is to enable us to meet increasing domestic demand for natural gas. The fields in Burgos accounted for 14.9% of our total natural gas production in 2016. The project is located in northeastern Mexico.
During 2016, the Burgos project produced an average of 864.6 billion cubic feet per day of natural gas. As of December 31, 2016, the drilling of 7,977 wells had been completed, 3,042 of which were producing. The most important fields are the Nejo, Arcabuz-Culebra, Cuitláhuac, Cuervito, Velero, Comitas and Santa Anita fields, which together produced 54.0% of the total production of the Burgos project in 2016.
Main Fields of the Burgos Project
(as of December 31, 2016)
| | | | | | | | | | | | | | | | | | | | | | | | | | | | |
| | | Nejo | | | Arcabuz-
Culebra | | | Cuitláhuac | | | Velero | | | Cuervito | | | Santa
Anita | | | Comitas | |
Wells completed | | | 407 | | | | 968 | | | | 443 | | | | 219 | | | | 135 | | | | 79 | | | | 137 | |
Producing wells | | | 261 | | | | 575 | | | | 196 | | | | 134 | | | | 92 | | | | 59 | | | | 92 | |
2016 production of natural gas (million cubic feet per day) | | | 176 | | | | 101 | | | | 64 | | | | 36 | | | | 29 | | | | 29 | | | | 32 | |
Cumulative production of natural gas (billion cubic feet) | | | 489.5 | | | | 2,043.0 | | | | 788.3 | | | | 337.5 | | | | 198.4 | | | | 254.4 | | | | 212.0 | |
Proved reserves of natural gas (billion cubic feet) | | | 82.5 | | | | 47.6 | | | | 107.8 | | | | 16 | | | | 140.4 | | | | 49.6 | | | | 34.6 | |
Proved developed reserves | | | 62.3 | | | | 45.9 | | | | 62.8 | | | | 16 | | | | 62.7 | | | | 31.4 | | | | 32.5 | |
Proved undeveloped reserves | | | 20.2 | | | | 1.7 | | | | 45 | | | | 0 | | | | 77.7 | | | | 18.2 | | | | 2.1 | |
Source: Pemex Exploration and Production.
During 2016, proved reserves decreased by 31.7 million barrels of oil equivalent, from 210.5 million barrels of oil equivalent in 2015 to 178.8 million barrels of oil equivalent in 2016, primarily due to reduced oil production in 2016, lower prices of hydrocarbons and a decrease in development activities.
In nominal peso terms, our exploration and production segment’s capital expenditures (including capital expenditures made pursuant to FPWCs) for the Burgos project were Ps. 11,695 million in 2014, Ps. 5,855 million in 2015 and Ps. 2,032 million in 2016. For 2017, we anticipate that our capital expenditures for this project will amount to Ps. 904 million and that our total accumulated capital expenditures will reach approximately U.S. $19,204 billion.
Aceite Terciario del Golfo Project (formerly Paleocanal de Chicontepec). The ATG project is located in the Northern region and covers an area of 4,243 square kilometers. This project comprises 29 fields, which are divided among eight sectors. As of December 31, 2016, there was a total of 4,544 wells completed, of which 2,224 were producing. The project produced an average of 39.8 thousand barrels of crude oil per day in 2016 as compared to 42.0 thousand barrels of crude oil per day in 2015, which represents a 5.3% decrease, and 142.5 million cubic feet of natural gas per day in 2016 as compared to 145.2 million cubic feet of natural gas per day in 2015, which represents a 1.9% decrease. The decrease in crude oil and natural gas production was primarily due to the decline in pressure in certain reservoirs. As of December 31, 2016, cumulative production was 301.8 million barrels of crude oil and 644.9 billion cubic feet of natural gas. As of December 31, 2016, proved reserves totaled 513.1 million barrels of crude oil and 1,063.8 billion cubic feet of natural gas. Total proved hydrocarbon reserves were 730.5 million barrels of oil equivalent, of which 130.1 million barrels of oil equivalent were proved developed reserves. During 2016, field development activities at the project included the drilling of 11 wells and the completion of 16 wells, all of which were classified as producing, reflecting a 100%
48
success rate. As of December 31, 2016, 75% of the total producing wells were operating with artificial systems such as mechanical, pneumatic, hydraulic and electric pumping, while the remaining 25% were “flowing wells” that are classified accordingly because they did not require any means of artificial lift.
In nominal peso terms, our exploration and production segment’s capital expenditures for the ATG project were Ps. 18,943 million in 2014, Ps. 2,817 million in 2015 and Ps. 1,487 million in 2016. For 2017, we anticipate that our capital expenditures for this project will be Ps. 871 million and that total accumulated investments in this project will be approximately U.S. $18.5 billion.
Crude Oil Sales
During 2016, domestic consumption of crude oil amounted to approximately 935 thousand barrels per day, which represented 43.4% of our total crude oil production. Through PMI’s activities, we sold the remainder of our crude oil production abroad. Maya crude oil accounted for 78.2% of exported crude oil volume sold by PMI in 2016. See “—Business Overview—International Trading” in this Item 4.
The following table sets forth crude oil distribution for the past five years.
Crude Oil Distribution
| | | | | | | | | | | | | | | | | | | | | | | | |
| | | At December 31, | | | 2016
vs. 2015 | |
| | | 2012 | | | 2013 | | | 2014 | | | 2015 | | | 2016 | | |
| | | (in thousands of barrels per day) | | | (%) | |
Production | | | 2,547.9 | | | | 2,522.1 | | | | 2,428.8 | | | | 2,266.8 | | | | 2,153.5 | | | | (5.0 | ) |
Distribution | | | | | | | | | | | | | | | | | | | | | | | | |
Refineries | | | 1,211.0 | | | | 1,229.1 | | | | 1,161.1 | | | | 1,064.0 | | | | 935.0 | | | | (12.1 | ) |
Export terminals | | | 1,268.3 | | | | 1,190.4 | | | | 1,148.6 | | | | 1,177.7 | | | | 1,198.7 | | | | 1.8 | |
| | | | | | | | | | | | | | | | | | | | | | | | |
Total | | | 2,479.3 | | | | 2,419.5 | | | | 2,309.7 | | | | 2,241.7 | | | | 2,133.7 | | | | (4.8 | ) |
| | | | | | | | | | | | | | | | | | | | | | | | |
Statistical differences in stock measurements(1) | | | 68.6 | | | | 102.6 | | | | 119.1 | | | | 25.2 | | | | 19.8 | | | | (21.4 | ) |
Note: Numbers may not total due to rounding.
| (1) | Includes measurement inconsistencies, shrinkage and leakage, naphthas and condensates added to crude oil. |
Source: Pemex Exploration and Production.
Differences between the volume of crude oil measured at the wellhead and the volume distributed reflect customary adjustments due to, among other things, shifting inventories, evaporation, shrinkage and product segregation. In August 2014, we identified increases in the difference between the volumes of crude oil production and distribution. Based on an analysis conducted in coordination with the NHC, we implemented various corrective measures to improve our measurement methodology and management system, including continuously monitoring our wells, calibrating our measurement equipment and installing additional crude oil dehydration systems. To this end, sediment tanks have also been installed at marine terminals in order to accelerate water evaporation and crude oil stabilization in accordance with industry standards. In addition, crude oil barrels undergo a stabilization process in preparation for export, which involves certification by us, the buyer and a third party to verify that the contents meet international standards and contain no more than 0.5% water.
Gas Flaring
The flaring of produced gas, which consists of the burning off of surplus combustible vapors from a well, usually occurs as a result of operational adjustments to carry out maintenance at production facilities, and in some cases is due to limitations in the ability to handle, process or transport natural gas. In addition, the flaring of
49
produced gas is also used as a safety measure to relieve well pressure. Gas flaring is considered to be one of the most significant sources of air emissions from offshore oil and gas installations. In 2016, gas flaring represented 8.8% of total natural gas production, as compared to 6.8% in 2015, primarily due to an explosion that occurred at theAbkatún-A platform in February 2016, management of oils with highgas-oil ratio and failures in gas compression equipment on offshore platforms. For more information on the explosion at theAbkatún-A platform, see “—Health, Safety and Environmental Performance” in this Item 4. We continue to implement programs to reduce gas flaring and improve gas extraction efficiency, including strategies to optimize the exploitation of wells with high associated gas content at the Cantarell project. In addition, in March 2017, we agreed to certain programs with the NHC, including five projects for U.S. $3.0 billion, which may allow us to improve our gas utilization rate to up to 98.0% at ourKu-Maloob-Zaap business unit by 2020.
Pipelines
The crude oil and natural gas pipeline network owned by our exploration and production segment connects crude oil and natural gas producing centers with refineries and petrochemical plants. At the end of 2016, this pipeline network consisted of approximately 42,260 kilometers of pipelines, of which 1,200 kilometers were located in the Northeast Marine region, 1,061 kilometers were located in the Southeast Marine region, 9,193 kilometers were located in the Southern region, 26,244 kilometers were located in the Northern region and 4,562 kilometers are distribution and commercial pipelines. For a description of products transported by the pipeline network, see “—Business Overview—Logistics” in this Item 4.
Integrated Exploration and Production Contracts and Financed Public Works Contracts
Our FPWC program, previously known as the Multiple Services Contracts program, was first announced in December 2001. The objective of the program was to provide a contractual framework that promotes efficient execution of public works in order to increase Mexico’s oil and gas production. The FPWC were public works contracts based on unit prices that aggregate a number of different services into a single contract. Under the FPWC framework, Pemex-Exploration and Production retained the rights and title to all oil and gas produced and works performed under each FPWC.
Our Integrated E&P Contracts program was established as part of reforms to the Mexican energy sector enacted in 2008. The objective of these Integrated E&P Contracts was to increase our execution and production capabilities. The oil and gas reserves located in and extracted from the areas to which we have a legal right, continue to be owned exclusively by the Mexican Government. Under this program, payments to the contractors were made on aper-barrel basis, plus recovery costs, provided that the payments did not exceed our cash flow from the particular block.
We may amend our Integrated E&P Contracts and FPWCs in order to align these contracts, which were entered into prior to the enactment of the Secondary Legislation, that are required to give effect to the Energy Reform Decree, with the new contractual framework established under the Hydrocarbons Law. Accordingly, an existing Integrated E&P Contract or FPWC may be migrated into a contract for exploration and production upon agreement by the contract parties to the technical guidelines established by the Ministry of Energy (after seeking our favorable opinion) and the financial terms determined by the Ministry of Finance and Public Credit. Upon approval by the contract parties, the existing Integrated E&P Contract or FPWC will be replaced by the new contract for exploration and production without the need for a bidding process. If the contract parties do not agree to the proposed technical guidelines and contractual and financial terms, the original Integrated E&P Contract or FPWC will remain in effect.
On December 19, 2014, we and the relevant counterparties requested that the Ministry of Energy migrate the Integrated E&P Contracts governing the Santuario, Magallanes, Altamira, Arenque, Ébano, Miquetla and Pánuco blocks, and the FPWC governing the Misión and Olmos blocks, into new contracts for exploration and production. Parties to the Integrated E&P contracts governing the Nejo and San Andrés blocks made similar
50
requests on November 24, 2015 and December 1, 2015. As part of the migration process, the Ministry of Energy, Ministry of Finance and Public Credit and the NHC requested further information on the proposed fiscal and technical terms of the new contracts, which Pemex Exploration and Production provided. On December 7, 2015, January 29, 2016 and May 11, 2016, the parties to the Altamira, San Andrés and Nejo blocks, respectively, withdrew their request for migration.
The migration of Integrated E&P Contracts and FPWCs into contracts for exploration and production has taken longer than expected. As of the date of this annual report, we have not yet migrated any of the Integrated E&P contracts or FPWCs. Nonetheless, we plan to migrate the Integrated E&P Contract corresponding to the Santuario block in the Southern region of Mexico and the FPWC corresponding to the Misión block of the Burgos business unit in the Northern region into contracts for exploration and production in the first six months of 2017.
Among the FPWC works during 2016, maintenance activities were carried out in the Burgos project under the FPWC program. The work carried out in 2016 represented an investment of approximately U.S. $189.3 million. By the end of 2016, natural gas production in the existing FPWC blocks reached 305.4 million cubic feet per day, which represents approximately 35.3% of all natural gas production from Burgos during 2016.
During 2016, contractors expended approximately U.S $323.3 million in connection with Integrated E&P Contracts. By the end of 2016, production in the existing Integrated E&P blocks reached 31.5 thousand barrels per day of crude oil and 22.3 million cubic feet per day of natural gas, for a total of 34.3 thousand barrels of oil equivalent per day.
New Exploration and Production Contracts and Farm-Outs
We have pursued farm-outs as part of the opportunities made available to us by energy reform. Through these agreements, we may enter into partnerships with third parties who, in exchange for an interest in the fields that have been granted to us, make financial contributions to the partnership and provide field services. On July 28, 2016, the NHC published the tender offer and bidding package to select a partner for Pemex Exploration and Production to carry out exploration and production activities in the Trión block field assignments located in the Perdido Fold Belt in the Gulf of Mexico. Since the Trión block has a depth greater than 2,500 meters, it requires a high level of technical expertise and financial investment to develop.
On December 5, 2016, the NHC announced that BHP Billiton Petróleo Operaciones de México, S. de R.L. de C.V., or BHP Billiton Mexico, an affiliate of BHP Billiton Limited and BHP Billiton Plc, had been selected as the partner for Pemex Exploration and Production for activities in the Trión block. Pursuant to the terms of its bid, BHP Billiton Mexico will make a U.S. $789.6 million contribution to the partnership in exchange for a 60% participating interest in the Trión Block, BHP Billiton Mexico will be the operator of the Trión block. BHP Billiton Mexico must invest U.S. $1.9 billion in the Trión Project before we are required to invest in the project, which, depending on the timeline set by the consortium, will likely be in four to five years. The corresponding exploration and production contract, joint operating agreement and other relevant agreements were executed on March 3, 2017.
On October 17, 2016, Petróleos Mexicanos’ Board of Directors approved the request to the Ministry of Energy for farm-outs related to the Ayín Batsil shallow water fields in the Campeche Basin. These fields are located at water depths of 160 meters. This shallow-waterfarm-out is to be included in the first bidding round of Round Two, which is expected to consist of 15 blocks to be awarded in June 2017. A secondfarm-out related to the Ogarrio and Cárdenas-Mora onshore fields located in the Southern Region is also scheduled for Round Two bidding in July 2017.
51
Competitive Bidding Rounds
On December 5, 2016, the NHC published the results of the bidding process referred to as Round 1.4, through which a consortium consisting of Pemex Exploration and Production, Chevron Energía de Mexico, S. de R.L. de C.V., or Chevron Energía, a subsidiary of Chevron Corporation and INPEX Corporation was awarded an exploration contract for a field located in the Perdido Fold Belt in the Gulf of Mexico. The field covers an area of approximately 1,686.9 square kilometers and is located approximately 117 kilometers off the coast of Mexico in water depths ranging between 500 meters and 1,700 meters. Chevron Energía will be the operator and holds 33.3334% interest in the consortium, while Pemex Exploration and Production and INPEX Corporation each holds 33.3333% interest. The corresponding exploration and production contract, joint operating agreement and other relevant agreements were executed on February 28, 2017.
Collaboration and Other Agreements
Pemex Exploration and Production, or its predecessor Pemex-Exploration and Production, have entered intonon-commercial scientific and technology agreements with the following parties, which remain in effect as of the date of this annual report:
| | • | | BP Exploration Operating Co. Ltd. during 2012; |
| | • | | Statoil Mexico A.S., ExxonMobil Ventures Mexico Ltd., Japan Oil, Gas and Metals National Corporation, Chevron Deepwater Mexico Inc., BG North America LLC during 2013; and |
| | • | | Itera Group LLC, during 2013. |
Pemex Exploration and Production did not enter into any collaboration agreements in 2016.
Through these agreements, we seek to increase our technical and scientific knowledge in areas including deepwater subsalt exploration and drilling; enhanced oil recovery processes, such as air injection; and reservoir characterization of complex structures. These broad agreements of technological and scientific collaboration are strictlynon-commercial,i.e., there is no transfer of resources and they do not establish a binding relationship among the parties.
Industrial Transformation
Our industrial transformation segment is comprised of two principal activities: (i) refining and (ii) gas and aromatics.
Refining
Refining Processes and Capacity
Our refining production processes include the following:
| | • | | Atmospheric distillation.This process heats crude oil in a tube furnace at atmospheric pressure to distill refined products. The primary products produced are gasoline, jet fuel, diesel, atmospheric gas oil and atmospheric residual crude oil. |
| | • | | Vacuum distillation.This process heats crude oil or other feedstock in a vacuum distillation column, which is operated at low pressures. The objective of this process is to maximize production of heavy vacuum gas oil, which is produced by boiling crude oil. |
| | • | | Cracking.This process uses either heat and pressure or a catalytic agent to increase gasoline yields from crude oil. |
| | • | | Visbreaking.This is a thermal cracking process, which uses a horizontal-tube heater fired to a high temperature. Visbreaking reduces flasher bottom viscosity and produces some heavy gas oil. |
52
| | • | | Reforming processes.These processes use heat and catalysts to transform smaller or unstable hydrocarbon molecules into larger, more useful refining or blending products. For example, we use reforming processes to convert low octane gasoline into higher octane stocks that are suitable for blending into finished gasoline and to convert naphthas into more volatile, higher octane products. |
| | • | | Hydrotreatment or residual hydrocracking.This process uses a catalyst and hydrogen at high temperature and pressure to remove sulfur, nitrogen and some aromatic compounds. Hydrotreatment also processes some lighter liquid productoff-take. |
| | • | | Alkylation and isomerization.This polymerization process unites olefins and isoparaffins. Butylenes and isobutanes are combined with sulfuric acid or hydrofluoric acid to rearrange straight-chain hydrocarbon molecules into branched-chain products. Pentanes and hexanes, which are difficult to reform, are isomerized through the use of aluminum chloride and other precious-metal catalysts. Normal butane may be isomerized to provide a portion of the isobutane feed needed for the alkylation process. The process produces a high octane, low sensitivity blending agent for gasoline. |
| | • | | Coking.This process is a severe method of thermal cracking used to upgrade heavy residuals into lighter products or distillates. Coking producesstraight-run gasoline (coker naphtha) and various middle-distillate fractions used as catalytic feedstock, thus generating a concentrated solid material. |
These production processes together constitute our production capacity as set forth in the table below.
Refining Capacity by Production Process
| | | | | | | | | | | | | | | | | | | | |
| | | At December 31, | |
| | | 2012 | | | 2013 | | | 2014 | | | 2015 | | | 2016 | |
| | | (in thousands of barrels per day) | |
Production Process | | | | | | | | | | | | | | | | | | | | |
Atmospheric distillation | | | 1,690.0 | | | | 1,690.0 | | | | 1,602.0 | | | | 1,640.0 | | | | 1,602.0 | |
Vacuum distillation | | | 832.0 | | | | 832.0 | | | | 767.5 | | | | 772.4 | | | | 767.5 | |
Cracking | | | 422.5 | | | | 422.5 | | | | 422.5 | | | | 422.5 | | | | 422.5 | |
Visbreaking | | | 91.0 | | | | 91.0 | | | | 91.0 | | | | 91.0 | | | | 91.0 | |
Reforming | | | 279.3 | | | | 279.3 | | | | 279.3 | | | | 279.3 | | | | 279.3 | |
Hydrotreatment | | | 1,067.5 | | | | 1,067.5 | | | | 1,067.5 | | | | 1,099.9 | | | | 1,230.0 | |
Alkylation and isomerization | | | 155.3 | | | | 155.3 | | | | 154.3 | | | | 154.8 | | | | 154.3 | |
Coking | | | 155.8 | | | | 155.8 | | | | 155.8 | | | | 155.8 | | | | 155.8 | |
Source: Base de Datos Institucional (Pemex Institutional Database, or Pemex BDI).
As of December 31, 2016, we owned and operated six refineries: Cadereyta, Madero, Minatitlán, Salamanca, Salina Cruz and Tula. Our refineries consist of atmospheric and vacuum distillation units, where the bulk of crude oil input is processed. Secondary processing facilities include desulfurization units and facilities for catalytic cracking, reforming and hydrotreating. During 2016, our refineries processed 933.1 thousand barrels per day of crude oil (122 thousand barrels per day at Cadereyta, 87.4 thousand barrels per day at Madero, 112.5 thousand barrels per day at Minatitlán, 170.9 thousand barrels per day at Salamanca, 238.7 thousand barrels per day at Salina Cruz and 201.6 thousand barrels per day at Tula), which in total consisted of 532.8 thousand barrels per day of Olmeca and Isthmus crude oil and 400.3 thousand barrels per day of Maya crude oil. In recent years, we have been affected by operational difficulties at our auxiliary services facilities. In order to increase the processing of crude oil at our refineries and the production of petroleum products, we have included certain actions in our 2017-2021 Business Plan to increase safety and reliability at our auxiliary services facilities.
Since 1993, through our subsidiary company, P.M.I. Norteamérica, S.A. de C.V., we have participated in a limited partnership with Shell Oil Company in a refinery located in Deer Park, Texas, which has the capacity to
53
process 340 thousand barrels per day of crude oil. Under the Deer Park Limited Partnership agreement, P.M.I. Norteamérica, S.A. de C.V. and Shell Oil Company each provide 50% of the refinery’s crude oil input and own 50% of the refinery’s output. This agreement is limited to the specific purpose of operating the Deer Park refinery.
Production
We produce a wide range of products derived from crude oil and natural gas, including LPG, gasoline, jet fuel, diesel, fuel oil, asphalts, lubricants and other refined products. In 2016, we produced 977.2 thousand barrels per day of refined products (including dry gasby-products of the refining process), as compared to 1,114.3 thousand barrels per day in 2015, representing a decrease of 12.3%. This decrease in refined products production was mainly due to an increase in corrective maintenance and auxiliary services failures and to low performance at our Tula, Madero, Minatitlán and Cadereyta refineries.
The following table sets forth, by category, our production of petroleum products from 2012 through 2016.
Refining Production
| | | | | | | | | | | | | | | | | | | | | | | | |
| | | Year ended December 31, | | | 2016
vs. 2015 | |
| | | 2012 | | | 2013 | | | 2014 | | | 2015 | | | 2016 | | |
| | | (in thousands of barrels per day) | | | (%) | |
Refinery Crude Oil Runs | | | 1,199.3 | | | | 1,224.1 | | | | 1,155.1 | | | | 1,064.5 | | | | 933.1 | | | | (12.3 | ) |
Refined Products | | | | | | | | | | | | | | | | |
Liquefied petroleum gas | | | 25.2 | | | | 25.2 | | | | 26.4 | | | | 21.4 | | | | 17.2 | | | | (19.6 | ) |
Gasoline | | | | | | | | | | | | | | | | |
Pemex Magna | | | 336.8 | | | | 360.5 | | | | 290.9 | | | | 272.5 | | | | 150.6 | | | | (44.7 | ) |
Ultra-Low Sulfur Magna | | | 61.5 | | | | 56.7 | | | | 99.1 | | | | 88.4 | | | | 165.5 | | | | 87.2 | |
Pemex Premium(1) | | | 19.7 | | | | 19.8 | | | | 30.8 | | | | 16.8 | | | | 7.7 | | | | (54.2 | ) |
Base | | | 0.0 | | | | 0.2 | | | | 0.8 | | | | 3.6 | | | | 1.6 | | | | (55.6 | ) |
| | | | | | | | | | | | | | | | | | | | | | | | |
Total | | | 418.1 | | | | 437.3 | | | | 421.6 | | | | 381.4 | | | | 325.3 | | | | (14.7 | ) |
Kerosene (Jet fuel) | | | 56.6 | | | | 60.8 | | | | 53.4 | | | | 47.8 | | | | 42.8 | | | | (10.5 | ) |
Diesel | | | | | | | | | | | | | | | | |
Pemex Diesel(2) | | | 225.9 | | | | 217.7 | | | | 186.9 | | | | 191.5 | | | | 130.1 | | | | (32.1 | ) |
Ultra-Low Sulfur Diesel | | | 72.6 | | | | 92.1 | | | | 97.8 | | | | 83.0 | | | | 85.1 | | | | 2.5 | |
Others | | | 1.0 | | | | 3.7 | | | | 1.9 | | | | 0.2 | | | | 1.0 | | | | 400 | |
| | | | | | | | | | | | | | | | | | | | | | | | |
Total | | | 299.6 | | | | 313.4 | | | | 286.6 | | | | 274.7 | | | | 216.2 | | | | (21.3 | ) |
Fuel oil(3) | | | 273.4 | | | | 268.8 | | | | 259.2 | | | | 237.4 | | | | 228.1 | | | | (3.9 | ) |
Other refined products | | | | | | | | | | | | | | | | |
Asphalts | | | 23.1 | | | | 18.7 | | | | 23.9 | | | | 17.7 | | | | 16.9 | | | | (4.5 | ) |
Lubricants | | | 3.9 | | | | 4.4 | | | | 3.7 | | | | 2.3 | | | | 3.0 | | | | 30.4 | |
Paraffins | | | 0.8 | | | | 0.7 | | | | 0.6 | | | | 0.5 | | | | 0.6 | | | | 20.0 | |
Still gas | | | 67.8 | | | | 70.7 | | | | 63.9 | | | | 62.2 | | | | 61.9 | | | | (0.5 | ) |
Other refined products(4) | | | 57.3 | | | | 75.7 | | | | 66.7 | | | | 68.9 | | | | 65.3 | | | | (5.2 | ) |
| | | | | | | | | | | | | | | | | | | | | | | | |
Total | | | 152.9 | | | | 170.2 | | | | 158.8 | | | | 151.6 | | | | 147.6 | | | | (2.6 | ) |
| | | | | | | | | | | | | | | | | | | | | | | | |
Total refined products | | | 1,225.9 | | | | 1,275.8 | | | | 1,206.1 | | | | 1,114.3 | | | | 977.2 | | | | (12.3 | ) |
| | | | | | | | | | | | | | | | | | | | | | | | |
Note: Numbers may not total due to rounding.
| (1) | Pemex Premium is anultra-low sulfur gasoline with 0.003% sulfur content. |
| (2) | Pemex Diesel is sold in the northern border market with 0.0015% sulfur content. |
| (3) | Includes heavy fuel oil and intermediate 15. |
| (4) | Includes mainly coke, along with other products such as aeroflex1-2, furfural extract, and light cyclic oil. |
Source: Pemex BDI.
54
Fuel oil, automotive gasoline and diesels represent the bulk of our production. In 2016, gasoline represented 33.3%, diesel fuel represented 22.1% and fuel oil represented 23.3% of total petroleum products production. Jet fuel represented 4.4% and LPG represented 1.8% of total production of petroleum products in 2016. The remainder, 15.1%, of our production consisted of a variety of other refined products.
As a result of our strategy of investing in technology to improve the quality of our fuels, all of our automotive gasoline production now consists of unleaded gasoline. In addition, we have introduced new environmentally sound products such asultra-low sulfur gasoline (or ULSG) andultra-low sulfur diesel (or ULSD).
In recent years, including 2016, our production has been affected by operational problems in our auxiliary services facilities. In order to improve production, our 2017-2021 Business Plan includes measures to ensure the supply of auxiliary services through partnerships with third parties. On February 23, 2017, we entered into a contract with Air Liquide for the supply of hydrogen to our Miguel Hidalgo refinery in Tula in order to decrease unscheduled stoppages and increase gasoline production.
Variable Refining Margin
During 2016, the National Refining System recorded a variable refining margin of U.S. $4.48 per barrel, an increase of U.S. $1.13 per barrel as compared to 2015. This is broadly the result of the recovery in prices for refined products in 2016. The following table sets forth the variable refining margin for the five years ended December 31, 2016.
Variable Refining Margin
| | | | | | | | | | | | | | | | | | | | | | | | |
| | | Year ended December 31, | | | 2016
vs. 2015 | |
| | | 2012 | | | 2013 | | | 2014 | | | 2015 | | | 2016 | | |
| | | (U.S dollars per barrel) | | | (%) | |
Variable margin | | | 0.01 | | | | (1.84 | ) | | | 1.76 | | | | 3.35 | | | | 4.48 | | | | 33.7 | |
Domestic Sales
We market a full range of refined products, including gasoline, jet fuel, diesel, fuel oil and petrochemicals. We are one of a few major producers of crude oil worldwide that experiences significant domestic demand for our refined products.
55
For the five years ended December 31, 2016, the value of our domestic sales of refined products and petrochemicals was as follows:
Value of Refining’s Domestic Sales(1)
| | | | | | | | | | | | | | | | | | | | | | | | |
| | | Year ended December 31, | | | 2016
vs. 2015 | |
| | | 2012 | | | 2013 | | | 2014 | | | 2015 | | | 2016 | | |
| | | (in millions of pesos)(2) | | | (%) | |
Refined Products | | | | | | | | | | | | | | | | | | | | | | | | |
Gasoline | | | | | | | | | | | | | | | | | | | | | | | | |
Pemex Magna | | Ps. | 326,187.2 | | | Ps. | 340,750.7 | | | Ps. | 347,952.4 | | | Ps. | 274,006.9 | | | Ps. | 248,595.2 | | | | (9.3 | ) |
Pemex Premium | | | 42,486.0 | | | | 63,723.1 | | | | 80,058.9 | | | | 81,813.5 | | | | 87,422.8 | | | | 6.9 | |
Aviation fuels | | | 396.2 | | | | 370.8 | | | | 358.1 | | | | 323.7 | | | | 328.0 | | | | 1.3 | |
Others | | | 95.6 | | | | 43.4 | | | | 29.5 | | | | 16.1 | | | | 14.5 | | | | (9.9 | ) |
| | | | | | | | | | | | | | | | | | | | | | | | |
Total | | | 369,165.1 | | | | 404,887.9 | | | | 428,398.8 | | | | 356,160.2 | | | | 336,360.4 | | | | (5.6 | ) |
Kerosene (Jet fuel) | | | 36,336.5 | | | | 35,417.9 | | | | 36,449.3 | | | | 27,077.2 | | | | 28,945.2 | | | | 6.9 | |
Diesel | | | | | | | | | | | | | | | | | | | | | | | | |
Pemex Diesel | | | 163,113.6 | | | | 178,929.4 | | | | 194,545.6 | | | | 139,796.2 | | | | 117,556.3 | | | | (15.9 | ) |
Others | | | 30,609.0 | | | | 32,542.0 | | | | 31,156.7 | | | | 22,930.4 | | | | 19,236.4 | | | | (16.1 | ) |
| | | | | | | | | | | | | | | | | | | | | | | | |
Total | | | 193,722.6 | | | | 211,471.4 | | | | 225,702.4 | | | | 162,726.7 | | | | 136,792.7 | | | | (15.9 | ) |
Fuel oil | | | | | | | | | | | | | | | | | | | | | | | | |
Total | | | 99,839.9 | | | | 78,001.8 | | | | 46,838.3 | | | | 25,906.0 | | | | 16,436.3 | | | | (36.6 | ) |
Other refined products | | | | | | | | | | | | | | | | | | | | | | | | |
Asphalts | | | 11,165.0 | | | | 7,865.4 | | | | 10,788.0 | | | | 7,575.5 | | | | 5,468.7 | | | | (27.8 | ) |
Lubricants | | | 3,097.7 | | | | 2,991.2 | | | | 2,618.9 | | | | 1,297.5 | | | | 1,473.0 | | | | 13.5 | |
Paraffins | | | 377.1 | | | | 339.4 | | | | 319.2 | | | | 257.9 | | | | 267.0 | | | | 3.5 | |
Coke | | | 346.3 | | | | 473.4 | | | | 763.3 | | | | 669.5 | | | | 501.9 | | | | (25.0 | ) |
Citroline | | | 6.4 | | | | 2.3 | | | | 0.4 | | | | 0.9 | | | | 4.6 | | | | 401.8 | |
Gas oil for domestic use | | | 217.6 | | | | 275.4 | | | | 432.5 | | | | 588.3 | | | | 428.8 | | | | (27.1 | ) |
Total | | Ps. | 15,210.0 | | | Ps. | 11,947.0 | | | Ps. | 14,922.3 | | | Ps. | 10,389.6 | | | Ps. | 8,143.9 | | | | (21.6 | ) |
| | | | | | | | | | | | | | | | | | | | | | | | |
Total Refined Products | | Ps. | 714,274.1 | | | Ps. | 741,726.1 | | | Ps. | 752,311.1 | | | Ps. | 582,259.8 | | | Ps. | 526,678.5 | | | | (9.5 | ) |
| | | | | | | | | | | | | | | | | | | | | | | | |
Petrochemicals(3) | | | Ps. 6,494.6 | | | Ps. | 6,882.8 | | | Ps. | 7,582.2 | | | Ps. | 3,930.9 | | | Ps. | 3,117.9 | | | | (20.7 | ) |
Note: Numbers may not total due to rounding.
| (1) | Excludes IEPS tax and value added tax. See “—Taxes, Duties and Other Payments to the Mexican Government” in this Item 4. |
| (2) | Figures are stated in nominal pesos. See “Item 3—Key Information—Selected Financial Data.” |
| (3) | Petrochemical products produced at refineries operated by our industrial transformation segment (carbon black feedstocks and propylene). |
Source: Pemex BDI.
In 2016, our domestic sales of refined products decreased by Ps. 55,581.3 million, or 9.5% in value, as compared to 2015 levels (excluding IEPS tax and value added tax). This was primarily due to a 10.8% decrease in the average prices for our refined products, a 15.9% decrease in the value of diesel sales, a 5.6% decrease in the value of gasoline sales and 36.6% decrease in the value of fuel oil sales.
56
The volume of our domestic sales of refined products for the five-year period ended December 31, 2016 was distributed as follows:
Volume of Refining’s Domestic Sales
| | | | | | | | | | | | | | | | | | | | | | | | |
| | | Year ended December 31, | | | 2016
vs. 2015 | |
| | | 2012 | | | 2013 | | | 2014 | | | 2015 | | | 2016 | | |
| | | (in thousands of barrels per day, except where
otherwise indicated) | | | (%) | |
Refined Products | | | | | | | | | | | | | | | | | | | | | | | | |
Gasoline | | | | | | | | | | | | | | | | | | | | | | | | |
Pemex Magna | | | 715.3 | | | | 667.6 | | | | 639.1 | | | | 638.0 | | | | 637.5 | | | | (0.1 | ) |
Pemex Premium | | | 87.7 | | | | 119.2 | | | | 137.1 | | | | 154.8 | | | | 185.1 | | | | 19.6 | |
Aviation fuels | | | 0.5 | | | | 0.5 | | | | 0.4 | | | | 0.5 | | | | 0.5 | | | | (1.0 | ) |
Others | | | 0.2 | | | | 0.1 | | | | — | | | | — | | | | — | | | | 1.2 | |
| | | | | | | | | | | | | | | | | | | | | | | | |
Total | | | 803.7 | | | | 787.3 | | | | 776.7 | | | | 793.3 | | | | 823.1 | | | | 3.8 | |
Kerosenes (jet fuel) | | | 59.3 | | | | 62.2 | | | | 66.5 | | | | 70.8 | | | | 76.2 | | | | 7.6 | |
Diesel | | | | | | | | | | | | | | | | | | | | | | | | |
Pemex Diesel | | | 339.4 | | | | 333.2 | | | | 336.4 | | | | 330.6 | | | | 335.5 | | | | 1.5 | |
Others | | | 61.1 | | | | 58.5 | | | | 53.0 | | | | 54.2 | | | | 51.8 | | | | (4.4 | ) |
| | | | | | | | | | | | | | | | | | | | | | | | |
Total | | | 400.5 | | | | 391.7 | | | | 389.4 | | | | 384.7 | | | | 387.2 | | | | 0.6 | |
Fuel oil | | | | | | | | | | | | | | | | | | | | | | | | |
Total | | | 214.4 | | | | 189.3 | | | | 121.7 | | | | 111.7 | | | | 102.6 | | | | (8.1 | ) |
Other refined products | | | | | | | | | | | | | | | | | | | | | | | | |
Asphalts | | | 22.3 | | | | 17.3 | | | | 21.7 | | | | 15.9 | | | | 15.9 | | | | — | |
Lubricants | | | 4.1 | | | | 4.7 | | | | 4.0 | | | | 2.6 | | | | 3.1 | | | | 19.2 | |
Paraffins | | | 0.8 | | | | 0.7 | | | | 0.6 | | | | 0.6 | | | | 0.6 | | | | — | |
Coke | | | 49.8 | | | | 47.8 | | | | 46.0 | | | | 45.9 | | | | 36.3 | | | | (20.9 | ) |
Citroline | | | 0.01 | | | | — | | | | — | | | | — | | | | 0.01 | | | | — | |
Gas oil for domestic use | | | 0.6 | | | | 0.7 | | | | 0.9 | | | | 1.2 | | | | 0.9 | | | | (25.0 | ) |
| | | | | | | | | | | | | | | | | | | | | | | | |
Total | | | 77.7 | | | | 71.2 | | | | 73.3 | | | | 66.2 | | | | 56.9 | | | | (14.0 | ) |
| | | | | | | | | | | | | | | | | | | | | | | | |
Total refined products | | | 1,555.5 | | | | 1,501.8 | | | | 1,427.6 | | | | 1,426.7 | | | | 1,446.0 | | | | 1.4 | |
| | | | | | | | | | | | | | | | | | | | | | | | |
Petrochemicals(1)(2) | | | 653.3 | | | | 738.8 | | | | 703.8 | | | | 620.9 | | | | 543.5 | | | | (12.5 | ) |
Note: Numbers may not total due to rounding.
| (1) | In thousands of metric tons. |
| (2) | Petrochemical products produced at refineries operated by our refining business (black carbon feedstocks and propylene). |
Source: Pemex BDI.
The volume of our domestic gasoline sales increased by 3.8% in 2016, from 793.3 thousand barrels per day in 2015 to 823.1 thousand barrels per day in 2016. The volume of our diesel sales increased by 0.6%, from 384.7 thousand barrels per day in 2015 to 387.2 thousand barrels per day in 2016. The increase in the volume of our domestic gasoline and diesel sales is mainly due to an increase in demand resulting from an increase in the number of vehicles operated in Mexico. The volume of our domestic sales of fuel oil decreased by 8.1%, from 111.7 thousand barrels per day in 2015 to 102.6 thousand barrels per day in 2016, primarily due to a decrease in CFE’s demand for fuel oil based on its substitution of fuel oil with natural gas.
Sales of Pemex Premium gasoline increased 19.6% in 2016, while those of Pemex Magna decreased slightly from the previous year. This change in consumption patterns is the result of a decrease in the price differential between the two kinds of gasolines.
We have also made concerted efforts to build and enhance our brands. As a result of energy reform, beginning in April 2016, the Mexican government has allowed private companies, including third-party
57
franchises, to participate as retailers in the Mexican gasoline market and purchase gasoline products from us or import these same products from abroad. Pursuant to this regulatory change, on June 5, 2016, we announced that a joint branding program had been established with various entities that own and operate retail service stations in Mexico. The joint branding program allows our franchisees to rename their retail service stations while continuing to sell our products under our brand. In addition, we will continue to provide technical and operational assistance to such franchisees. We believe that this program will strengthen our relationship with entities that own and operate retail service stations in Mexico as we continue to adapt to the new competitive pressures in the Mexican fuel market.
At the end of 2016, there were 11,578 retail service stations in Mexico, of which 11,531 were privately owned and operated as franchises, while the remaining 47 were owned by Pemex Industrial Transformation. This total number of retail service stations represents an increase of 3.3% from the 11,210 service stations as of December 31, 2015.
The largest consumers of fuel oils in Mexico are CFE and our productive state-owned subsidiaries. CFE consumed approximately 86.0% of our fuel oil production during 2016, pursuant to a fuel oil supply contract entered into in January 1, 2004. The minimum amount of fuel oil that we agreed to supply to CFE during 2015 was 58.1 thousand barrels per day, in accordance with our supply capacity and the requirements of CFE under its official program of substitution of fuel oil with natural gas. In 2016, we actually supplied 88 thousand barrels per day. The price per cubic meter of the fuel oil supplied to CFE is based on the three-month average spot price per cubic meter of Fuel Oil No. 6 sulfur at Houston, Texas, as quoted in Platt’s U.S. Marketscan and adjusted for quality and transportation cost differentials. In addition, the price of the fuel oil is then revised, either upwards or downwards, depending on whether the amount of fuel oil requested exceeds the minimum amount agreed to in the supply contract. The contract can be terminated by either party upon six months’ notice. The total amount paid to us by CFE under this contract in 2016 was Ps. 14,013 million, which represented 2.4% of our total revenues from domestic sales of refined products.
Pricing Decrees
The energy reform provides for fuel price liberalization, which began in January 2017. Our sales will continue to be regulated by the Energy Regulatory Commission until COFECE determines that there is effective competition in the wholesale market.
Historically, the Mexican Government has established periodic increases on the price of gasoline. On January 1, 2014, pursuant to theImpuesto a los Combustibles Fósiles(IEPS Tax on Fossil Fuels) approved under theLey del Impuesto Especial sobre Producción y Servicios(Special Tax on Production and Services Law, or the IEPS Law), unleaded gasoline became subject to aone-time price increase of ten Mexican cents per liter. See “—Information on the Company—Taxes, Duties and Other Payments to the Mexican Government” in this Item 4. For the period from January 1 to December 31, 2015, the Mexican Government eliminated these periodic price increases in favor of aone-time price increase of 26 Mexican cents per liter of magna gasoline and 27 Mexican cents per liter of premium gasoline. From January 1, 2016 to July 31, 2016, prices were 44 Mexican cents lower per liter as compared to 2015 and from August 1, 2016 to December 31, 2016, prices were 43 Mexican cents higher per liter as compared to 2015. The sale of gasoline began to be liberalized on January 1, 2017 and the Ministry of Finance and Public Credit established a flexible mechanism to reflect international market prices. As a result, in January 2017, magna gasoline prices were between Ps. 1.35 and Ps. 2.61 per liter higher than in December 2016. For more information, see “Item 5—Operating and Financial Review and Prospects—IEPS Tax, Hydrocarbon Duties and Other Taxes.”
The Mexican Government has also established periodic increases on the price of diesel. On January 1, 2014, pursuant to the IEPS Tax on Fossil Fuels, diesel became subject to aone-time price increase of thirteen Mexican
58
cents per liter. From January 1 to December 31, 2014, periodic increases continued at a rate of eleven Mexican cents per liter per month. For the period January 1 to December 31, 2015, the Mexican Government eliminated these periodic price increases in favor of aone-time price increase of 26 Mexican cents per liter. From January 1, 2016, the Mexican Government established a mechanism to determine prices that takes into account international market prices, subject to minimum and maximum prices, and adds a flat IEPS Tax. As a result, from January 1, 2016 to August 31, 2016 prices decreased by 43 Mexican cents per liter as compared to the same period in 2015 and from September 1, 2016 to December 31, 2016, this amounted to a 43 Mexican cent increase per liter as compared to the same period in 2015. The sale of diesel began to be liberalized on January 1, 2017 and the Ministry of Finance and Public Credit established a flexible mechanism to reflect international market prices. As a result, in January 2017, diesel prices were between Ps. 1.78 and Ps. 3.05 per liter higher than in December 2016.
Since the early 1980s, the Mexican Government has also established a discount of 30% on the price at which we sell gas oil intended for domestic use to the state of Chihuahua during the months of January, February and December of each year. On January 1, 2014, pursuant to the IEPS Tax on Fossil Fuels, such gas oil became subject to aone-time price increase of 10.857 Mexican cents per liter. Gas oil became subject to aone-time price increase of 11.307 Mexican cents per liter in 2015, 11.558 Mexican cents per liter as of January 1, 2016 and 11.94 Mexican cents per liter as of January 1, 2017. Notably, the discount on the price of gas oil in the state of Chihuahua was suspended in December 2016.
Since December 2008, the price at which we sell fuel oil to CFE has been linked to international market prices in accordance with a pricing methodology established by the Mexican Government. This methodology is based on the price of fuel oil in the U.S. Gulf of Mexico coastal region, and is then adjusted for quality as well as expenses related to distribution.
On January 1, 2015, the IEPS Tax on Fossil Fuels of 14.00 Mexican cents per liter of fuel oil became effective through the fiscal year ended December 31, 2015. As of January 1, 2016, fuel oil became subject to a premium of 14.31 Mexican cents per liter and as of January 1, 2017, the IEPS Tax on Fossil Fuels is 14.78 Mexican cents per liter.
The Mexican Government could modify these price controls or impose additional price controls in the future. See “Item 3—Key Information—Risk Factors—Risk Factors Related to our Relationship with the Mexican Government—The Mexican Government has historically imposed price controls in the domestic market on our products.”
We withhold IEPS Tax. While it is included in the price to our customers, it is not calculated as part of our revenue. For more information, see “Item 4—Taxes, Duties and Other Payments to the Mexican Government—Fiscal Regime for PEMEX.”
Investments
Over the past several years, we have focused our investment program on enhancing the quality of the gasoline and diesel we produce to meet Mexico’s new environmental standards. Our aim is to improve our ability to process heavy crude oil in order to optimize the crude oil blend in our refineries and to increase production of unleaded gasoline and diesel to supply growing demand at a lower cost, as opposed to increasing our overall crude oil processing capacity. This focus is primarily the result of the abundance of heavy crude oils in Mexico.
Our refining business invested Ps. 30,501 million in capital expenditures in 2016 and, due to budget cuts, has budgeted Ps. 18,919 million in capital expenditures for 2017. We hope to complement our capital expenditures in 2017 through strategic alliances.
The following table sets forth our refining business’ capital expenditures, excludingnon-capitalizable maintenance, for each of the three years ended December 31, 2016, and the budget for 2017. Capital expenditure
59
amounts are derived from our budgetary records, which are prepared on a cash basis. Accordingly, these capital expenditure amounts do not correspond to capital expenditure amounts included in our consolidated financial statements prepared in accordance with IFRS.
Refining’s Capital Expenditures
| | | | | | | | | | | | | | | | |
| | | Year ended December 31,(1) | | | Budget
2017(2) | |
| | | 2014 | | | 2015 | | | 2016 | | |
| | | (in millions of pesos)(3) | |
Refining | | | | | | | | | | | | | | | | |
Fuel Quality Investments(4) | | | Ps.7,814 | | | | Ps.9,045 | | | | Ps.10,702 | | | | Ps.4,990 | |
Reconfiguration of Miguel Hidalgo Refinery in Tula | | | 1,077 | | | | 4,674 | | | | 8,610 | | | | 1,821 | |
New Refinery in Tula(5) | | | 1,128 | | | | 561 | | | | 1,849 | | | | 0 | |
Minatitlán Refinery Energy Train | | | — | | | | — | | | | 1,100 | | | | 28 | |
Cadereyta Refinery Energy Train | | | — | | | | — | | | | 872 | | | | 7 | |
Residual Conversion from Salamanca Refinery | | | 1,310 | | | | 913 | | | | 749 | | | | 4,900 | |
Tuxpan Pipeline and Storage and Distribution Terminals | | | 275 | | | | 100 | | | | 15 | | | | 132 | |
Others | | | 28,163 | | | | 14,353 | | | | 6,604 | | | | 7,040 | |
| | | | | | | | | | | | | | | | |
Total | | | Ps.39,767 | | | | Ps.29,646 | | | | Ps.30,501 | | | | Ps.18,919 | |
| | | | | | | | | | | | | | | | |
Notes: Numbers may not total due to rounding.(1) Amounts based on cash basis method of accounting.
| (2) | Budget authorized on December 14, 2016 and presented to the Board of Directors of Petróleos Mexicanos on April 7, 2017. |
| (3) | Figures for 2014, 2015 and 2016 are stated in nominal pesos. Figures for 2017 are stated in constant 2017 pesos. |
| (4) | Includes clean fuels investments for gasoline and diesel in our six refineries. |
| (5) | Includespre-investments studies,on-site preparation and other expenses related to this project. |
Source: Petróleos Mexicanos.
In the medium term, we will continue to import unleaded gasoline to satisfy domestic demand. During 2016, we imported approximately 505 thousand barrels per day of unleaded gasoline, which represented approximately 61.4% of total domestic demand for unleaded gasoline in that year.
Our projects, which will involve some private sector investments, aim to reduce greenhouse gas emissions by promoting cleaner fuels and increasingcrude-oil processing capacity. Certain of these projects, including the Fuels Quality Project (formerly known as the Clean Fuels Project), the reconfiguration of the Miguel Hidalgo Refinery in Tula and the residual conversion of the Salamanca Refinery, are already part of ongoing projects developed by our industrial transformation segment. Our projects are described in further detail below.
Fuel Quality Project
Our Fuel Quality Project is being developed in our six refineries, with a first phase involving the installation of eight ULSG post-treatment units, the capacities of which are set forth below by refinery. The first phase of this project is being carried out at each of the following sets of our refineries: set 1, Tula and Salamanca (which are approximately 96.4% and 97.0% complete, respectively), with construction expected to be completed by the second quarter of 2016; set 2, Cadereyta and Madero (which are both 100% completed); and set 3, Minatitlán and Salina Cruz (which are 100% and approximately 96.4% complete, respectively), with the commencement of operations at Minatitlán in October 2015 interrupted due to lack of fuel, and the construction of Salina Cruz expected to be completed by the second quarter of 2016. We began production of ULSG at our Cadereyta refinery in February 2014 and at our Madero refinery in July 2015. In August 2016, we began producing ULSG at our Minatitlán, Tula, Salamanca and Salina Cruz refineries. In light of these projects, and as of the date of this annual report, all gasoline produced in Mexico meets international environmental standards. The consumption of cleaner fuels will allow us to reduce emissions of greenhouse compounds.
60
Plant Capacity
| | | | | | | | | | | | | | | | | | | | | | | | |
| | | Cadereyta | | | Madero | | | Minatitlán | | | Salamanca | | | Salina Cruz | | | Tula | |
ULSG units (tbpd) | | | 1 | (42) | | | 2 | (20) | | | 1 | (25) | | | 1 | (25) | | | 2 | (25) | | | 1 | (30) |
Note: tbpd = thousand barrels per day.
ULSG: Ultra Low Sulfur Gasoline.
Source: Pemex Industrial Transformation.
In addition to our ULSG post-treatment units, we have entered the following contracts for phase one of our fuel quality project:Sistema Integral de Mezcla en Línea Optimizado Automático(SIMLOA) at our Tula and Cadereyta refineries; laboratories at our Tula, Salamanca, Salina Cruz, Minatitlán and Madero refineries; rehabilitation tanks at our Tula, Salamanca and Salina Cruz refineries; parasitic gasoline at our Tula and Salamanca refineries; a steam condensation station at our Salamanca refinery; a turbogeneratorTG-204 at our Cadereyta refinery; and a turbogeneratorTG-8 at our Madero refinery. As of the date of this annual report, our overall progress on these contracts for each of the refineries is approximately: 79.9% at our Tula refinery, 94.1% at our Salamanca refinery, 100% at our Salina Cruz refinery, 100% at our Minatitlán refinery, 69.5% at our Cadereyta refinery and 75.1% at our Madero refinery. Both turbogenerator contracts have since been suspended due to budgetary constraints.
The second phase of the Fuel Quality Project involves the construction of five ULSD facilities and the reconfiguration of 17 existing units, as well as the installation of five hydrogen plants, four sulfur recovery units and five sour water treatment plants. This portion of the project will be carried out in three stages: (i) early production, (ii) Cadareyta diesel and (iii) a diesel stage for the five remaining refineries, as described below.
Early production.We initiated projects to increase efficiency at some of our processing plants and to produce ULSD through eight construction and services contracts totaling Ps. 130 billion. All of these projects are complete and the respective plants are in operation.
Cadereyta diesel phase.Construction began in March 2013 and, as of the date of this annual report, is approximately 68% complete. Construction is expected to be completed by the fourth quarter of 2017. Due to the 2016 Budget Adjustment Plan, however, two of the four relevant contracts have been suspended since April 2016. The two other contracts have been completed. We are currently investigating funding alternatives through alliances and/or strategic partnerships in order to resume work under these contracts.
Diesel phase for outstanding refineries.The Open Book Cost Estimation (OBCE) methodology is used in connection with the implementation of the diesel phase at the refineries other than Cadereyta and is divided into two stages: (i) the development of detailed engineering plans and the placement of purchase orders for equipment requiring significant delivery time, which was completed with the execution of the Final Works Agreement on December 17, 2015; and (ii) the execution of detailed engineering, procurement and construction, which commenced in January 2016. Due to the 2016 Budget Adjustment Plan, however, the project was suspended in October 2016 with only a small portion completed. Until construction is completed, we plan to importultra-low sulfur fuels in order to meet domestic demand. We are currently investigating funding alternatives through alliances and/or strategic partnerships in order to resume work under the contracts.
As of the date of this annual report, we also have 15 contracts for complementary facilities, which integrate the total scope of the Fuel Quality Project. Of those 15, five have been completed, eight are in development and two have been suspended as the result of budgetary constraints.
Reconfiguration of the Miguel Hidalgo Refinery in Tula
On August 12, 2009, we announced the construction of a new refinery in Tula on land that was donated by the state government of Hidalgo. Upon completion of ourpre-investment studies relating to the new refinery in
61
Tula, we determined that it would be more cost-effective to forgo construction of a new refinery and instead direct our investments to the reconfiguration of the existing Miguel Hidalgo refinery. Accordingly, on December 3, 2014, we announced the commencement of renovations to upgrade the refinery as part of theAprovechamiento de Residuales en la Refinería de Tula Hidalgo (Residue Use at the Tula Hidalgo Refinery, which we refer to as the Tula refinery reconfiguration project). The reconfigured refinery is intended to (i) generally modernize processing; (ii) increase the efficiency with which vacuum residue is converted into high value fuels; (iii) produce higher value products; (iv) increase refining margins; and (v) reduce fuel oil handling problems.
Pemex Industrial Transformation plans to implement the reconfiguration project in two phases: (i) phase one for the development of engineering plans and (ii) phase two for detailed engineering, procurement and construction. In September 2013, ICA Fluor Daniel, S. de R.L. de C.V. (ICA Fluor) was awarded a U.S. $94.8 million contract to carry out studies and to provide engineering services for phase one. Site conditioning work began in February 2014 and construction of the first processing unit began in October 2014.
At the end of 2016, the integral project was approximately 27.0% complete and basic and detailed engineering plans were 100% complete. The project is now advancing to phase two, however, due to budgetary restrictions, some tasks have been rescheduled and project completion has slowed. In light of continued budgetary constraints, we have developed a new strategy which engages a third party for technical and financial assistance. See “—Investments” below for more information regarding capital expenditures by project.
Residual Conversion of the Salamanca Refinery
The reconfiguration of the “Ingeniero Antonio M. Amor” refinery in Salamanca, Guanajuato focuses on the conversion of residuals into high-steam distillates (without a need for increased crude oil processing), as well as a new lubricants train to produce group II lubricants. As part of the reconfiguration, we will construct new plants and refurnish existing plants. This project also involves the construction of a perimeter wall surrounding the refinery with two security entrances, the relocation of CFE’s electric transmission lines, site improvements, as well as the construction of a delayed coker unit, a catalytic cracking unit, a hydrogen plant, a coker naphthas hydro-desulfurization plant, a gasoil hydro-desulfurization plant, a new lubricants train, a naphtha reforming plant, a sulfur recovery unit, an amine regeneration unit and a sour water treatment facility. In addition, this project involves the construction of storage tanks, effluent treatment plants (at which industrial wastewater is treated for reuse) and infrastructure (including roads and street lights) in the areas surrounding the refinery, as well as services, electric power supply, high burner areas, buildings and other service and support facilities. Other units, including certain distillation vacuum units, will undergo renovations designed to efficiently transport residuals to the coker plant for processing and to maximize the conversion of residuals into distillates. Finally, the project includes the integration of pipelines, pumping equipment and electrical substations from existing facilities.
In accordance with the OBCE methodology, Pemex Industrial Transformation plans to implement the project in two phases as part of a strategy to increase efficiency, mitigate technical and economic risks, define the project’s scope and reduce uncertainty. Phase one includes the development of engineering plans, while phase two includes engineering plans, together with procurement and construction. At the end of 2016, the project was approximately 12.7% complete and phase one was approximately 98% complete. The project, however, has been suspended due to budgetary constraints. See “—Investments” below for more information regarding capital expenditures by project.
Pemex Industrial Transformation, together with the Department of Corporate Alliances and New Business, is currently seeking partners to continue the project.
Tuxpan Maritime Terminal
The Tuxpan Maritime Terminal project is intended to help meet the increasing demand for refined products in the metropolitan area of the Mexico Valley. The total cost of the project is approximately Ps. 4,777 million,
62
which includes the construction of a pipeline measuring 18 inches in diameter and 109 kilometers in length from Cima de Togo to Venta de Carpio, five storage tanks located at the Tuxpan Maritime Terminal with a capacity of 100,000 barrels each, a research study to determine the best option for the discharge of refined products from tankers and pipelines to these storage tanks and auxiliary and integration services.
By the end of 2016, two of the three relevant phases of this project, thepre-investment studies and transportation on the Tuxpan-Mexico pipelines, were complete. The third phase, storage, is 91.3% complete. As of the date of this annual report, four of the project’s five tanks have been delivered to the Tuxpan Maritime Terminal and are in operation and one tank is 87% complete.
Hydrogen Supply for Refineries
Pursuant to energy reform and 2017-2021 Business Plan, we aim to partner with third parties for issues related to auxiliary services, such as the supply of hydrogen to refineries, which will permit us to specialize, maximize value, and focus on the processing of crude oil.
Gas and Aromatics
Natural Gas and Condensates
Our average natural gas production decreased by 11.0 % in 2016, from 3,454.4 million cubic feet per day in 2015 to 3,074.2 million cubic feet per day in 2016, while the average wet natural gas processed decreased by 9.8%, from 4,072.8 million cubic feet per day in 2015 to 3,671.5 million cubic feet per day in 2016.
All wet natural gas production is directed to our gas processing facilities. At the end of 2016, we owned nine facilities.
The following facilities are located in the Southern region:
| | • | | Nuevo Pemex. This facility contains 13 plants that together in 2016 produced 878.6 million cubic feet per day of dry gas, 25.0 thousand barrels per day of ethane, 31.4 thousand barrels per day of liquefied gas, 15.1 thousand barrels per day of naphtha and 66.3 thousand tons of sulfur. |
| | • | | Cactus. This facility contains 22 plants that together in 2016 produced 716 million cubic feet per day of dry gas, 22.9 thousand barrels per day of ethane, 29.2 thousand barrels per day of liquefied gas, 15.5 thousand barrels per day of naphtha and 271.3 thousand tons of sulfur. |
| | • | | Ciudad Pemex. This facility contains eight plants that together in 2016 produced 610.4 million cubic feet per day of dry gas and 126.1 thousand tons of sulfur. |
| | • | | La Venta. This facility contains one plant that in 2016 produced 128.2 million cubic feet of dry gas per day. |
| | • | | Matapionche.This facility contains five plants that together in 2016 produced 14.6 million cubic feet per day of dry gas, 0.7 thousand barrels per day of liquefied gas, 0.2 thousand barrels per day of naphtha and 3.5 thousand tons of sulfur. |
| | • | | The Morelos, Cangrejera and Pajaritos facilities form the Coatzacoalcos area gas processing complex (which we refer to as a GPC): |
| | • | | Morelos. This facility contains one plant that in 2016 produced 27.9 thousand barrels per day of ethane, 26.8 thousand barrels per day of liquefied gas and 8.3 thousand barrels per day of naphtha. |
| | • | | Cangrejera. This facility contains two plants that together in 2016 produced 26.8 thousand barrels per day of ethane, 28.7 thousand barrels per day of liquefied gas and 8.4 thousand barrels per day of naphtha. |
| | • | | Pajaritos. This facility contains one plant that produced 3.7 thousand barrels per day of ethane in 2016. |
63
The following facilities are located in the Northern region:
| | • | | Burgos.This facility contains nine plants that together in 2016 produced 534.4 million cubic feet per day of dry gas, 11.6 thousand barrels per day of liquefied gas and 13.1 thousand barrels per day of naphtha. |
| | • | | Poza Rica. This facility contains five plants that together in 2016 produced 134.5 million cubic feet per day of dry gas, 3.7 thousand barrels per day of liquefied gas, 1.2 thousand barrels per day of naphtha and 0.6 thousand tons of sulfur. |
| | • | | Arenque.This facility contains three plants that together in 2016 produced 30.2 million cubic feet per day of dry gas and 3.4 thousand tons of sulfur. |
The following tables set forth our processing capacity, as well as our total natural gas processing and production, for the five years ended December 31, 2016.
Gas and Aromatics’ Processing and Production Capacity(1)
| | | | | | | | | | | | | | | | | | | | |
| | | Year ended December 31, | |
| | | 2012 | | | 2013 | | | 2014 | | | 2015 | | | 2016 | |
| | | (in millions of cubic feet per day, except where otherwise indicated) | |
Sweetening plants | | | | | | | | | | | | | | | | | | | | |
Sour condensates(1) | | | 144 | | | | 144 | | | | 144 | | | | 144 | | | | 144 | |
Sour natural gas(2)(3) | | | 4,503 | | | | 4,503 | | | | 4,523 | | | | 4,523 | | | | 4,523 | |
Natural gas liquids recovery plants | | | | | | | | | | | | | | | | | | | | |
Cryogenics | | | 5,912 | | | | 5,912 | | | | 5,912 | | | | 5,912 | | | | 5,912 | |
Natural gas liquids fractionating(2)(4) | | | 569 | | | | 569 | | | | 569 | | | | 569 | | | | 591 | |
Processing of hydrosulfuric acid | | | 219 | | | | 219 | | | | 219 | | | | 219 | | | | 219 | |
Aromatic compounds and derivates(Cangrejera and Independencia)(5)(6) | | | — | | | | — | | | | — | | | | 1,694 | | | | 1,694 | |
| (1) | Production capacity refers to aromatic compounds and derivatives. |
| (2) | In thousands of barrels per day. |
| (3) | In 2014, following a review of the sour natural gas processing capacity of the Poza Rica Complex reflecting an increase in capacity from 230 to 250 million cubic feet per day, the total installed sour natural gas processing capacity of thePemex-Gas and Basic Petrochemicals increased from 4,503 to 4,523 million cubic feet per day. |
| (4) | The liquids fractionating plant at the Reynosa complex has been out of service since August 31, 2009. |
| (5) | Thousand tons per year. |
| (6) | Since November 2015, the operation of the Methanol I and II plants, the CPQ Independencia petrochemical specialties plant and the CPQ Cangrejera aromatic compounds plants have been assigned to Pemex Industrial Transformation. |
Source: Pemex BDI.
64
Natural Gas, Condensates and Aromatics’ Processing and Production(1)
| | | | | | | | | | | | | | | | | | | | | | | | |
| | | Year ended December 31, | | | 2016
vs. 2015 | |
| | | 2012 | | | 2013 | | | 2014 | | | 2015 | | | 2016 | | |
| | | (in millions of cubic feet per day,
except where otherwise indicated) | | | (%) | |
Processing | | | | | | | | | | | | | | | | | | | | | | | | |
Wet gas | | | 4,382 | | | | 4,404 | | | | 4,343 | | | | 4,073 | | | | 3,672 | | | | (9.8 | ) |
Sour gas | | | 3,395 | | | | 3,330 | | | | 3,356 | | | | 3,225 | | | | 2,997 | | | | (7.1 | ) |
Sweet gas(2) | | | 987 | | | | 1,074 | | | | 986 | | | | 847 | | | | 675 | | | | (20.3 | ) |
Condensates(3)(6) | | | 46 | | | | 46 | | | | 49 | | | | 45 | | | | 41 | | | | (8.9 | ) |
Gas to natural gas liquids extraction | | | 4,346 | | | | 4,381 | | | | 4,303 | | | | 3,904 | | | | 3,450 | | | | (11.6 | ) |
Wet gas | | | 4,206 | | | | 4,234 | | | | 4,172 | | | | 3,745 | | | | 3,394 | | | | (9.4 | ) |
Reprocessing streams(4) | | | 140 | | | | 147 | | | | 131 | | | | 159 | | | | 56 | | | | (64.8 | ) |
Production | | | | | | | | | | | | | | | | | | | | | | | | |
Dry gas(5) | | | 3,692 | | | | 3,755 | | | | 3,699 | | | | 3,454 | | | | 3,074 | | | | (11.0 | ) |
Natural gas liquids(6)(7) | | | 365 | | | | 362 | | | | 364 | | | | 327 | | | | 308 | | | | (5.8 | ) |
Liquefied petroleum gas(6)(8) | | | 204 | | | | 206 | | | | 205 | | | | 174 | | | | 159 | | | | (8.6 | ) |
Ethane(6) | | | 115 | | | | 109 | | | | 110 | | | | 107 | | | | 106 | | | | (0.9 | ) |
Naphtha(6) | | | 72 | | | | 73 | | | | 77 | | | | 69 | | | | 62 | | | | (10.1 | ) |
Sulfur(9)(11) | | | 1,011 | | | | 1,029 | | | | 962 | | | | 858 | | | | 673 | | | | (21.6 | ) |
Methanol(9) | | | 151 | | | | 157 | | | | 168 | | | | 161 | | | | 145 | | | | (9.9 | ) |
Aromatic compounds and derivatives(9)(10) | | | 166 | | | | 799 | | | | 1,017 | | | | 1,022 | | | | 940 | | | | (8.0 | ) |
Others(9)(12) | | | 31 | | | | 588 | | | | 899 | | | | 535 | | | | 507 | | | | (5.2 | ) |
Note: Numbers may not total due to rounding.
GPC = Gas Processing Complex
| (1) | Excludes operations of our exploration and production segment, which produced 5,792.5 million cubic feet per day in 2016. |
| (2) | Includes sweet vapor from condensates. |
| (3) | Includes internal streams. |
| (4) | Reprocessing of pipeline dry gas at the Pajaritos cryogenic plant. |
| (5) | Includes ethane reinjected into the natural gas stream. |
| (6) | In thousands of barrels per day. |
| (7) | Includes stabilized condensates, reprocessing streams from the Cangrejera petrochemical complex and other streams for fractionating. |
| (8) | Includes production from GPC, refineries and transfers from Pemex Exploration and Production. |
| (10) | Includes aromine 100, benzene, styrene, toluene, ethylbenzene, fluxoil, high octane hydrocarbon and xylenes. |
| (11) | Production of gas processing GPCs and refineries. |
| (12) | Includes butanes, petrochemical specialties, pentanes, hexane, hydrogen, BTX liquids, isopentanes and petroleum products, naphtha gas, petrol octane base and heavy naphtha. |
Source: Pemex BDI.
Domestic consumption of dry gas totaled 3,347.3 million cubic feet per day in 2016, a 3.1% increase from the 2015 domestic consumption of 3,246.8 million cubic feet per day.
We import dry gas to satisfy shortfalls in our production and to meet demand in areas of northern Mexico that, due to their distance from the fields, can be supplied more efficiently by importing natural gas from the United States. In August 2013, we announced a natural gas supply strategy developed in partnership with the Mexican Government to address the domestic natural gas shortages. Under this strategy, we will increase our liquefied natural gas imports in the short term. See “—Business Overview—Industrial Transformation—Gas and Aromatics—Natural Gas Supply Strategy” in this Item 4. In 2016, we imported 1,933.9 million cubic feet per day of natural gas, an increase of 36.6% from the 1,415.8 million cubic feet per day imported in 2015, due to lower availability of sour wet natural gas and dry gas from our exploration and production segment’s fields. The total amount of natural gas imported per day in 2016 included 103.2 million cubic feet of liquefied natural gas imported through Manzanillo.
We process sour and sweet condensates from our exploration and production segment in order to obtain stabilized natural gas liquids and also recover liquid hydrocarbons obtained from the processing of sweet natural
65
gas. In addition, we obtain natural gas liquids from internal streams and liquid hydrocarbons condensed in sour wet gas pipelines. Our production of natural gas liquids, including stabilized condensates, reprocessing and other fractionating streams, decreased by 5.8% from 327 thousand barrels per day in 2015 to 308 thousand barrels per day in 2016.
We process sour condensates, which have a higher sulfur content, to produce stabilized sweet condensates. The volume of sour condensates we processed from our exploration and production segment and internal streams of our gas and aromatic compoundsub-segment totaled 41 thousand barrels per day in 2016, an 8.8% decrease from the 45 thousand barrels per day processed in 2015. We also process sweet condensates at our Burgos facilities to produce light and heavy natural gasoline.
The production of aromatic compounds and derivatives decreased 8.0%, from 1,021.7 thousand tons in 2015 to 940.2 thousand tons in 2016 due to operational challenges in the continuous catalyst regeneration and styrene plants throughout the year.
Natural Gas Supply Strategy
On August 13, 2013, we and the Mexican Government presented a strategy to address domestic natural gas shortages in the short-, medium- and long-term. In the short-term, we have increased our liquefied natural gas imports, which increased by 36.3% in 2016, from 1,418.4 million cubic feet per day in 2015 to 1,933.9 million cubic feet per day in 2016, including imports of natural gas through Manzanillo. On January 1, 2016, as part of the opening of the natural gas market, we transferred certain of our transportation assets to CENAGAS in a step towards that goal.
Over the five years ended December 31, 2016, the value of our domestic sales was distributed as follows:
Value of Gas and Aromatics’ Domestic Sales(1)
| | | | | | | | | | | | | | | | | | | | | | | | |
| | | Year ended December 31, | | | 2016
vs. 2015 | |
| | | 2012 | | | 2013 | | | 2014 | | | 2015 | | | 2016 | | |
| | | (in millions of pesos)(2) | | | (%) | |
| | | | | | |
Natural gas | | | Ps.50,233.0 | | | | Ps.68,128.7 | | | | Ps.78,666.4 | | | | Ps.53,037.3 | | | | Ps.67,536.5 | | | | 27.3 | |
Liquefied petroleum gas | | | 64,966.5 | | | | 71,728.9 | | | | 78,258.9 | | | | 78,194.0 | | | | 50,179.8 | | | | (35.8 | ) |
Ethane(3) | | | — | | | | 32.3 | | | | 283.6 | | | | 310.7 | | | | 1,284.7 | | | | 313.5 | |
Heptane | | | 8.6 | | | | 62.7 | | | | 39.1 | | | | 1.0 | | | | — | | | | (100.0 | ) |
Propane | | | 69.6 | | | | 70.3 | | | | 92.4 | | | | 57.6 | | | | 73.8 | | | | 28.1 | |
Light naphtha | | | — | | | | — | | | | 2.8 | | | | 39.7 | | | | 84.5 | | | | 112.9 | |
Heavy naphtha | | | — | | | | 4.4 | | | | 15.7 | | | | 191.0 | | | | 404.8 | | | | 111.9 | |
Sulfur | | | 1,167.2 | | | | 659.6 | | | | 795.9 | | | | 926.1 | | | | 585.7 | | | | (36.8 | ) |
Methanol | | | 665.3 | | | | 733.9 | | | | 775.5 | | | | 748.4 | | | | 625.1 | | | | (16.5 | ) |
Aromatic compounds and derivatives(4) | | | 2,979.4 | | | | 3,641.4 | | | | 4,427.5 | | | | 3,479.4 | | | | 2,122.1 | | | | (39.0 | ) |
Others(5) | | | 192.4 | | | | 347.7 | | | | 658.9 | | | | 400.2 | | | | 261.5 | | | | (34.7 | ) |
| | | | | | | | | | | | | | | | | | | | | | | | |
Total | | | Ps.120,282.0 | | | | Ps.145,409.9 | | | | Ps.164,016.7 | | | | Ps.137,385.4 | | | | Ps.123,158.5 | | | | (10.4 | ) |
| | | | | | | | | | | | | | | | | | | | | | | | |
Note: Numbers may not total due to rounding.
| (1) | Excludes value added tax. |
| (2) | Figures are stated in nominal pesos. |
| (3) | Ethane sales to Petroquímica Mexicana de Vinilo S.A. de C.V. began in October 2013. In January 2016, we began the supply of ethane to Braskem IDESA. |
| (4) | Includes aromine 100, benzene, styrene, toluene, xylene. |
| (5) | Includes petrochemical specialties, hydrogen, isopropane, heptane, hexane, pentane and naphtha gas. |
Source: Pemex BDI.
66
The volume of our domestic sales of gas and aromatics for the five-year period ended December 31, 2016 was distributed as follows:
Volume of Gas and Aromatics’ Domestic Sales
| | | | | | | | | | | | | | | | | | | | | | | | |
| | | Year ended December 31, | | | 2016
vs. 2015 | |
| | | 2012 | | | 2013 | | | 2014 | | | 2015 | | | 2016 | | |
| | | (in thousands of barrels per day, except where otherwise indicated) | | | (%) | |
| | | | | | |
Natural gas(1) | | | 3,387.7 | | | | 3,463.5 | | | | 3,451.2 | | | | 3,246.8 | | | | 3,347.3 | | | | 3.1 | |
Liquefied petroleum gas(2) | | | 286.5 | | | | 284.3 | | | | 282.1 | | | | 278.8 | | | | 202.1 | | | | (27.5 | ) |
Ethane (3) | | | — | | | | 0.8 | | | | 5.8 | | | | 8.8 | | | | 30.5 | | | | 246.6 | |
Heptane | | | 0.5 | | | | 3.9 | | | | 3.0 | | | | 0.1 | | | | — | | | | (100.0 | ) |
Propane | | | 8.2 | | | | 9.3 | | | | 9.7 | | | | 10.1 | | | | 11.3 | | | | 11.9 | |
Heavy naphtha(4) | | | — | | | | 0.4 | | | | 1.5 | | | | 29.9 | | | | 64.3 | | | | 115.1 | |
Light naphtha(4) | | | — | | | | — | | | | 0.3 | | | | 6.2 | | | | 13.3 | | | | 114.5 | |
Sulfur(4) | | | 649.1 | | | | 520.7 | | | | 655.3 | | | | 572.7 | | | | 580.5 | | | | 1.4 | |
Methanol(4) | | | 107.7 | | | | 100.1 | | | | 110.9 | | | | 112.0 | | | | 111.3 | | | | (0.6 | ) |
Aromatic compounds and derivatives(4)(5) | | | 161.4 | | | | 197.4 | | | | 246.8 | | | | 240.0 | | | | 155.1 | | | | (35.4 | ) |
Others(4)(6) | | | 12.5 | | | | 25.9 | | | | 51.3 | | | | 40.6 | | | | 29.7 | | | | (26.8 | ) |
| | | | | | | | | | | | | | | | | | | | | | | | |
Total | | | 4,613.6 | | | | 4,606.3 | | | | 4,817.9 | | | | 4,546.0 | | | | 4,545.4 | | | | (0.01 | ) |
| | | | | | | | | | | | | | | | | | | | | | | | |
Note: Numbers may not total due to rounding.
| (1) | In millions of cubic feet per day. |
| (2) | In thousands of barrels per day. |
| (3) | Ethane sales to Petroquímica Mexicana de Vinilo S.A. de C.V. began in October 2013. |
| (4) | In thousands of tons per year. |
| (5) | Includes aromine 100, benzene, styrene, toluene and xylene. |
| (6) | Includes petrochemical specialties, hydrogen, isopropane, heptane, hexane, pentane and naphtha gas. |
Source:Pemex BDI.
In 2016, the value of our domestic sales decreased by 10.4%, as compared to 2015, to Ps. 123,158.4 million, primarily as a result of a decrease in domestic sales of LPG. Domestic sales of LPG decreased by 27.5%, as compared to 2015, to 202.1 thousand barrels per day due to price decreases driven by competition from private companies able to import LPG as of March 2016 pursuant to the energy reform. Domestic sales of natural gas increased by 3.1%, as compared to 2015, to 3,347.3 million cubic feet per day due to increasing domestic demand in the industrial sector, which accounts for 29.7% of total domestic sales. Demand in the electric sector decreased by 7.5%. Domestic sales of sulfur increased by 1.4%, as compared to 2015, to 580.5 thousand tons due to a greater than expected demand from private chemical companies. Domestic sales of aromatic compounds and derivatives decreased by 35.4%, as compared to 2015, to 155.1 thousand tons due to decreased production resulting from operational difficulties at the CRR and styrene plants.
Subsidiaries of Pemex Industrial Transformation
Pemex Industrial Transformation conducts certain management, real estate and distribution activities through its subsidiaries and through certain joint ventures. The following table lists its subsidiaries, their principal operating activities and Pemex Industrial Transformation’s ownership interest as of December 31, 2016.
67
Subsidiaries of Pemex Industrial Transformation(1)
| | | | | | |
Subsidiary | | Principal Activity | | Ownership
Interest (%) | |
Mex Gas Internacional, S.L.(2) | | Holding company | | | 100.00 | |
Pasco International, Ltd. | | Holding company | | | 100.00 | |
Terrenos para Industrias, S.A. | | Real estate holding company | | | 100.00 | |
| (1) | As of December 31, 2016. |
| (2) | Mex Gas Internacional, S.L. is the only subsidiary of Pemex Industrial Transformation that is a consolidated subsidiary company. See Note 4 to our consolidated financial statements included herein. |
Source: Pemex Industrial Transformation
The following table lists Pemex Industrial Transformation’s joint ventures, its principal operating activities and Pemex Industrial Transformation’s ownership interests as of December 31, 2016.
Joint Ventures of Pemex Industrial Transformation(1)
| | | | | | |
Subsidiary | | Principal Activity | | Ownership
Interest (%) | |
CH4 Energía, S.A. de C.V. | | Gas trading | | | 50.00 | |
Ductos y Energéticos del Norte, S. de R.L. de C.V. | | Holding company | | | 50.00 | |
| (1) | As of December 31, 2016. |
Source: Pemex Industrial Transformation
Divestitures
On July 31, 2015, we announced the divestiture of our 50% ownership interest in the Gasoductos de Chihuahua, S. de R.L. de C.V. (Gasoductos de Chihuahua) joint venture with Infraestructura Energética Nova, S.A.B. de C.V. (IEnova). IEnova shareholders approved the transaction in September 2015. On September 15, 2016, Mexico’sComisión Federal de Competencia Económica (Federal Economic Competition Commission or COFECE) approved the proposed direct sale to IEnova as it was structured, which included a competitive bidding process with respect to Gasoducto San Fernando and LPG Ducto TDF. The initial divestiture did not include Gasoductos de Chihuahua’s subsidiary company, Ductos y Energéticos del Norte, S. de R.L. de C.V., so Pemex Industrial Transformation retained a 50% share participation. On September 28, 2016, we announced the divestiture of our interest in Gasoductos de Chihuahua. IEnova’s interest in the company increased from 50% to 100%. The transaction was valued at US$ 1,143.8 million.
Los Ramones
The Los Ramones pipeline project, which is being implemented in two phases, is part of a strategy to supply central Mexico with natural gas imported from the United States. When complete, the Los Ramones pipeline is projected to have a transportation capacity of 3,530 million cubic feet per day and an approximate length of 859.4 km. Phase one of the pipeline project is complete and currently serves to address the natural gas deficit in the country with a maximum capacity of 2,100 million cubic feet per day. Phase two of this project, with a total capacity of 1,430 million cubic feet per day and consisting of the construction of a pipeline running from Los Ramones, Nuevo León to Apaseo el Alto, Guanajuato, is further subdivided into two stages: Ramones Norte totaling 452 km in length and Ramones Sur totaling 291 km in length. TAG Pipelines, S. de R.L. de C.V. (an indirect subsidiary of Pemex Industrial Transformation, which we refer to as TAG Pipelines) developed the project through partnerships for each of these stages. In 2016, commercial operations for this pipeline project commenced. On January 1, 2016, the transport service contract was transferred to CENAGAS, which is now responsible for monitoring the operations of the Los Ramones system and for payment of transportation services.
68
Pricing Decrees
The energy reform provides for fuel price liberalization, which began in January 2017. Our sales will continue to be regulated by the Energy Regulatory Commission until COFECE determines that there is effective competition in the wholesale market.
The Mexican Government currently determines natural gas prices for domestic sales, which are calculated in accordance with directives issued by the Energy Regulatory Commission on July 20, 2009 and the related Resolutions of December 20, 2010, March 3, 2011, December 20, 2012, January 17, 2013, March 21, 2013 and December 3, 2013, by which the Energy Regulatory Commission approved and issued a temporary methodology for determining the maximum prices of natural gas of first-hand sales. On February 15, 2016, the Energy Regulatory Commission issued a new methodology which, effective March 1, 2016, determines the maximum first-hand sales price of natural gas. These prices aim to reflect natural gas opportunity costs and competitive conditions in international markets and at the point of sale.
Since 2003, price control mechanisms for LPG have been implemented through governmental decrees. In January 2010, the Mexican Government issued a decree establishing the maximum weighted averageend-user price of LPG before taxes of Ps. 8.08 per kilogram. Subsequently, as of February 2010, the Mexican Government established monthly maximum price increases in cents per kilogram before taxes, as follows:
| | | | |
Period | | Mexican Cents per Kilogram | |
February 2010 to July 2011 | | | 5 | |
August to November 2011 | | | 7 | |
December 2011 | | | 8 | |
January 2012 to October 2013 | | | 7 | |
November to December 2013 | | | 9 | |
January to December 2014 | | | 9 | * |
January 2015 | | | 23 | * |
January 2016 | | | 34 | ** |
| | * | On January 1, 2014 and 2015, pursuant to the IEPS Tax on Fossil Fuels, a price increase of 12 and 13 Mexican cents per kilogram, respectively, went into effect in addition to the monthly price increase of nine Mexican cents per kilogram in 2014 and ten Mexican cents per kilogram in 2015; this resulted in a total increase of 23 Mexican cents per kilogram in 2015. The ten Mexican cent per kilogram increase in January 2015 was aone-time increase for the year, and no further monthly increases were established for the remainder of 2015. |
| | ** | The 34 Mexican cent per kilogram increase in January 2016 was aone-time increase for the year, and no further monthly increases were established for the remainder of 2016. |
Beginning in August 2014, the methodology for calculatingend-user price was modified from weighted average prices to simple average prices.
On January 1, 2016, the Mexican Government issued a decree establishing aone-time price increase of 34 Mexican cents per kilogram, which was effective until August 16, 2016. On August 17, 2016, the Mexican Government authorized an end user discount of 9.97%, which was effective until December 31, 2016. Since January 1, 2017, we have sold natural gas in accordance with the new methodology for determining first-hand sales, and all end user prices have been freely determined by the market.
The Mexican Government could modify these price controls or impose additional price controls in the future. See “Item 3—Key Information—Risk Factors—Risk Factors Related to our Relationship with the Mexican Government—The Mexican Government has historically imposed price controls in the domestic market on our products.”
69
Natural Gas Hedging Operations
We offer, as a value-added service, various hedging contracts to our domestic customers to protect them against fluctuations in the prices of natural gas. For information on hedging contracts offered to natural gas domestic customers, see “Item 11—Quantitative and Qualitative Disclosures about Market Risk.”
Gas and Aromatics Capital Expenditures
Our gas and aromatics business invested Ps. 3,446 million in capital expenditures in 2016 and has budgeted Ps. 2,450 million in capital expenditures for 2017.
The following table sets forth our gas and aromatics business’ capital expenditures, excludingnon-capitalizable maintenance, for each of the three years ended December 31, 2016, and the budget for 2017. Capital expenditure amounts are derived from our budgetary records, which are prepared on a cash basis. Accordingly, these capital expenditure amounts do not correspond to capital expenditure amounts included in our consolidated financial statements prepared in accordance with IFRS.
Gas and Aromatics’ Capital Expenditures
| | | | | | | | | | | | | | | | |
| | | Year ended December 31,(1) | | | Budget
2017(2) | |
| | | 2014 | | | 2015 | | | 2016 | | |
| | | (in millions of pesos)(3) | |
Gas and Aromatics | | | | |
Modernization of Transportation Areas of GPCs | | | Ps. 252 | | | | Ps. 534 | | | | Ps. 482 | | | | Ps. 296 | |
Modernization of Measuring, Control and Security Systems of GPCs | | | 187 | | | | 463 | | | | 481 | | | | — | |
Refurbishment and Modernization of Natural Gas Turbocompressors of the Cryogenic Plants at Nuevo Pemex GPC | | | 27 | | | | 143 | | | | 257 | | | | 47 | |
Modernization and Rehabilitation of Facilities of the Supply and Water Treatment System at Nuevo Pemex GPC | | | 117 | | | | 344 | | | | 255 | | | | 62 | |
Integral Project of Electric Reliability at GPCs | | | 240 | | | | 474 | | | | 177 | | | | 5 | |
Adaptation of Fractionation Plants and Conversion of the Liquids Sweetener at Nuevo Pemex GPC | | | 880 | | | | 320 | | | | 174 | | | | 36 | |
Refurbishment of Refrigerating and Ethane Turbocompressors of Fractionating Plants at Nuevo Pemex GPC | | | — | | | | 199 | | | | 119 | | | | — | |
Integral Maintenance of Gas Sweetening Plants 1, 2, 3 and 12 at Cactus GPC | | | 30 | | | | 109 | | | | 116 | | | | 117 | |
Conservation and Modernization of the Storage Area at Coatzacoalcos Area GPC | | | 286 | | | | 208 | | | | 88 | | | | 35 | |
Security Requirements for Improvement of Operational Reliability of the GPCs | | | 74 | | | | 211 | | | | 87 | | | | 24 | |
Conditioning of the Venting Systems at Cactus GPC | | | — | | | | 109 | | | | 75 | | | | 2 | |
Conservation of Processing Capacity at Nuevo Pemex GPC | | | 504 | | | | 180 | | | | 70 | | | | — | |
Conservation of Operational Reliability at Ciudad Pemex GPC | | | 352 | | | | 196 | | | | 31 | | | | 21 | |
Efficiency in Storage and Distribution I | | | 142 | | | | 102 | | | | 27 | | | | — | |
70
| | | | | | | | | | | | | | | | |
| | | Year ended December 31,(1) | | | Budget
2017(2) | |
| | | 2014 | | | 2015 | | | 2016 | | |
| | | (in millions of pesos)(3) | |
Conditioning of Facilities for Ethane Supply at Cactus GPC | | | 313 | | | | 234 | | | | 21 | | | | 2 | |
Integral Facilities Maintenance at Cactus GPC | | | 113 | | | | 137 | | | | 21 | | | | — | |
Others | | | 8,797 | | | | 1,691 | | | | 965 | | | | 1,803 | |
| | | | | | | | | | | | | | | | |
Total | | | Ps. 12,314 | | | | Ps. 5,654 | | | | Ps. 3,446 | | | | Ps. 2,450 | |
| | | | | | | | | | | | | | | | |
Notes: Numbers may not total due to rounding.
GPC = Gas Processing Complex.
PC = Petrochemical Complex.
| (1) | Amounts based on cash basis method of accounting. |
| (2) | Budget authorized on December 14, 2016 and presented to the Board of Directors of Petróleos Mexicanos on April 7, 2017. |
| (3) | Figures for 2014, 2015 and 2016 are stated in nominal pesos. Figures for 2017 are stated in constant 2017 pesos. |
Source: Petróleos Mexicanos.
Ethane Supply Contract
On February 19, 2010, we entered into a contract to supply 66,000 barrels per day of ethane to the Etileno XXI project, a petrochemical complex in Nanchital, Veracruz that will produce ethylene and polyethylene. The Etileno XXI project is being developed and will be owned and operated by Braskem-IDESA, a Brazilian-Mexican consortium. In order to meet the obligations of this contract, we made adjustments to the infrastructure of our gas processing plants in the Ciudad Pemex, Nuevo Pemex and Cactus. Additional ethane will be transported from the GPCs located in Tabasco, in southeastern Mexico, to Coatzacoalcos, Veracruz. This contract provides for “take or pay—delivery or pay” obligations for the parties, and thus, in case of breach of our supply obligation, we are subject to the payment of liquidated damages. In the event of termination as a consequence of our material default under the ethane supply contract, we may be obligated to pay to the other parties involved in the project an amount equal to the termination value of this project (the value of which is determined pursuant to the contract and takes into consideration, among other factors, the outstanding debt of the project and the amount invested in the project at such time). The Etileno XXI project commenced operations on March 18, 2016. By December 31, 2016, we had supplied 562.8 million cubic meters of ethane for a total of Ps. 1,426 million. Also as of December 31, 2016, construction of the pipeline to transport ethane from the gas processing plants located in Tabasco, in Southeastern Mexico, to Coatzacoalcos, Veracruz, was complete.
Fertilizers
Our fertilizers segment operates through the productive state-owned subsidiary Pemex Fertilizers, produces ammonia and carbon dioxide and integrates the ammonia production chain up to the point of sale of fertilizers.
Capacity
At the end of 2016, we owned four petrochemical plants, three of which are in operation, for the production of petrochemical products mainly those classified as“non-basic.” We had a total production capacity per unit of 480 thousand tons of petrochemicals per year in 2016. Three of these plants produce ammonia and have an installed capacity of 1,440 thousand tons per year in 2015 and 2016.
71
The total production capacity of our operating plants for the last two years was distributed among our facilities as set forth below:
Fertilizers’ Total Capacity
| | | | | | | | |
| | | Year ended December 31, | |
Petrochemical Complexes | | 2015 | | | 2016 | |
| | | (thousands of tons) | |
Cosoleacaque (ammonia) | | | 1,440 | | | | 1,440 | |
Source: Pemex Fertilizers.
Production
The following table summarizes the annual production of our fertilizers segment for the two years ended December 31, 2016.
Fertilizers’ Production
| | | | | | | | | | | | |
| | | Year ended December 31, | |
| | | 2015 | | | 2016 | | | 2016
vs. 2015 | |
| | | (thousands of tons) | | | (%) | |
Methane Derivatives | | | | | | | | | | | | |
Ammonia | | | 575 | | | | 533 | | | | (7.3 | ) |
Carbon dioxide | | | 830 | | | | 786 | | | | (5.3 | ) |
| | | | | | | | | | | | |
Total | | | 1,405 | | | | 1,319 | | | | (6.1 | ) |
| | | | | | | | | | | | |
Note: Numbers may not total due to rounding.
Source: Pemex BDI.
Total annual production of methane derivatives in 2016 decreased 6.1% from 1,405 thousand tons in 2015 to 1,319 thousand tons in 2016, mainly due to low gas supply and operations failures in our ammonia plants.
In 2016 we produced 533 thousand tons of ammonia, which represents a decrease of 7.3% as compared to 575 thousand tons produced in 2015. In 2016, we produced 786 thousand tons of carbon dioxide, aby-product of the production process, which represents a 5.3% decrease as compared to 2015.
Sales of Fertilizers
The following table sets forth the value of our domestic sales for the two years ended December 31, 2016:
Value of Fertilizers Segments’ Domestic Sales(1)
| | | | | | | | | | | | |
| | | Year ended December 31, | |
| | | 2015 | | | 2016 | | | 2016
vs. 2015 | |
| | | (in millions of pesos)(2) | | | (%) | |
Methane Derivatives | | | | | | | | | | | | |
Ammonia | | | Ps. 4,414.6 | | | | Ps. 4,593.1 | | | | 4.0 | |
Carbon dioxide | | | 69.9 | | | | 90.2 | | | | 29.0 | |
Urea (resale) | | | 46.5 | | | | 6.9 | | | | (85.2 | ) |
| | | | | | | | | | | | |
Total | | | Ps. 4,531.0 | | | | Ps. 4,690.2 | | | | 3.5 | |
| | | | | | | | | | | | |
72
| Note: | Numbers may not total due to rounding. |
| (1) | Excludes value added tax. |
| (2) | Figures are stated in nominal pesos. |
Source:Pemex BDI.
In 2016 the value of domestic sales in our fertilizers segment increased by 3.5%, from Ps. 4,531.0 million in 2015 to Ps. 4,690.2 million in 2016, primarily due to an increase in the volume of sales of ammonia, as presented in more detail below.
Volume of sales
The following table sets forth the value of our domestic sales for the two years ended December 31, 2016:
Volume of Fertilizers Segment’s Domestic Sales
| | | | | | | | | | | | |
| | | Year ended December 31, | |
| | | 2015 | | | 2016 | | | 2016
vs. 2015 | |
| | | (thousands of tons) | | | (%) | |
Methane Derivatives | | | | | | | | | | | | |
Ammonia | | | 643.4 | | | | 752.8 | | | | 17.0 | |
Carbon dioxide | | | 166.0 | | | | 179.7 | | | | 8.3 | |
Urea (resale) | | | 10.0 | | | | 1.7 | | | | (83.0 | ) |
| | | | | | | | | | | | |
Total | | | 819.4 | | | | 934.2 | | | | 14.0 | |
| | | | | | | | | | | | |
Note: Numbers may not total due to rounding.
Source:Pemex BDI.
Fertilizers Capital Expenditures
Our fertilizers segment invested Ps. 379 million in capital expenditures in 2016 and has budgeted Ps. 444 million in capital expenditures for 2017. The following table sets forth our fertilizers segment’s capital expenditures, excludingnon-capitalizable maintenance, for each of the two years ended December 1, 2016, and the budget for 2017. Capital expenditure amounts are derived from our budgetary records, which are prepared on a cash basis. Accordingly, these capital expenditure amounts do not correspond to capital expenditure amounts included in our consolidated financial statements prepared in accordance with IFRS.
73
Fertilizers Segments’ Capital Expenditures
| | | | | | | | | | | | |
| | | Year ended December 31,(1) | | | Budget
2017(2) | |
| | | 2015 | | | 2016 | | |
| | | (in millions of pesos)(3) | |
Fertilizers | | | | | | | | | | | | |
Rehabilitation of Ammonia Plant IV and Integration and Auxiliary Services for Cosoleacaque PC | | | Ps. 791 | | | | Ps. 295 | | | | Ps. 225 | |
Efficiency in Storage and Distribution of Pemex-Petrochemicals | | | — | | | | 45 | | | | 68 | |
Maintaining the Production Capacity of Ammonia Plant VII and its Auxiliary Services at Cosoleacaque PC | | | 101 | | | | 18 | | | | — | |
Maintaining the Production Capacity of Ammonia Plant VI at Cosoleacaque PC | | | 97 | | | | 16 | | | | — | |
Safety and Environmental Protection, Derived from Observations and Regulations II in Cosoleacaque PC | | | 43 | | | | 5 | | | | — | |
Rehabilitation of Primary Reformers and Auxiliary Ammonia Plant VI and VII of Cosoleacaque PC | | | — | | | | — | | | | 126 | |
Others | | | 12 | | | | — | | | | 24 | |
| | | | | | | | | | | | |
Total | | | Ps. 1,044 | | | | Ps. 379 | | | | Ps. 444 | |
| | | | | | | | | | | | |
Notes: Numbers may not total due to rounding.
PC = Petrochemical Complex.
| (1) | Amounts based on cash basis method of accounting. |
| (2) | Budget authorized on December 14, 2016 and presented to the Board of Directors of Petróleos Mexicanos on April 7, 2017. |
| (3) | Figures for 2015 and 2016 are stated in nominal pesos. Figures for 2017 are stated in constant 2017 pesos. |
Source: Petróleos Mexicanos.
In 2016, we invested Ps. 379 million in our fertilizers segment and expect to invest Ps. 444 million to our fertilizers segment in 2017.
Pajaritos Petrochemical Complex
On January 16, 2014, our subsidiary company P.M.I. Norteamérica, S.A. de C.V. signed an agreement through one of its subsidiaries to purchase the existing assets of Agro Nitrogenados, S.A. de C.V., a subsidiary of Minera del Norte, S.A. de C.V., including a closed fertilizer production facility located in Pajaritos, Veracruz, Mexico, for the purchase price of U.S. $275 million, which was subsequently lowered to U.S. $273 million. The renovation of the facility will involve restoring operations of our rotating, static and mechanical equipment, building a carbon dioxide compressor station, as well as other auxiliary projects. We expect to begin operations in the fourth quarter of 2017 and to have an annual production capacity of up to 990,000 tons of urea.
Acquisition of Fertinal
On January 28, 2016, PMX Fertilizantes Pacífico, S.A. de C.V., one of our subsidiaries, acquired 99.99% of the outstanding shares of Fertinal, for a total purchase price of Ps. 4,322.8 million. The net value of Fertinal’s assets is Ps. 315.8 million (consisting of total assets of Ps. 12,341.1 million and total liabilities of Ps. 12,025.3 million) and a goodwill of Ps. 4,007.0 million. As of December 31, 2016, a calculation of the impairment of goodwill resulted in the complete cancellation of that amount. See Note 22 to our consolidated financial statements contained herein.
74
Fertinal’s total production capacity for the last year is as set forth below:
Fertinal’s Total Capacity
| | | | |
| | | Year ended December 31, 2016 | |
| | | (thousands of tons) | |
Nitrate and phosphates | | | 1,299 | |
Source: Fertinal Group.
Fertinal’s total production for the last year is set forth below:
Fertinal’s Production
| | | | |
| | | Year ended December 31, 2016 | |
| | | (thousands of tons) | |
Phosphates | | | 184.3 | |
Nitrate | | | 136.4 | |
Others | | | 80.3 | |
| | | | |
Total | | | 401.0 | |
| | | | |
Source: Fertinal Group.
The following table sets forth the value of Fertinal’s domestic sales for the year ended December 31, 2016:
Value of Fertinal’s Domestic Sales(1)
| | | | |
| | | Year ended December 31, 2016 | |
| | | (in millions in pesos)(2) | |
Phosphates | | | Ps. 1,265.8 | |
Nitrogenated | | | 857.5 | |
Others | | | 522.9 | |
| | | | |
Total | | | Ps. 2,646.3 | |
| | | | |
Note: Numbers may not total due to rounding.
| (1) | Excludes value added tax. |
| (2) | Figures are stated in nominal pesos. |
Source: Fertinal Group.
We intend to incorporate Fertinal into the gas ammonia solid fertilizers value chain in order to offer a wide range of fertilizers and to cover approximately 50% of the domestic market. We are also assessing the possibility of selling this integrated business in the future.
Ethylene
Our ethylene segment operates through the productive state-owned subsidiary Pemex Ethylene and takes advantage of the integration of the ethylene production chain by manufacturing various petrochemical products. Our ethylene segment manufactures various petrochemical products, including:
| | • | | ethane derivatives, such as ethylene, polyethylene, low density polyethylene, ethylene oxide and glycols; |
75
| | • | | propylene and derivatives, such as acrylonitrile and propylene; and |
| | • | | others such as oxygen, nitrogen, hydrogen, butadiene and CPDI, among other products. |
Capacity
Total production capacity of our operating plants for the last two years was distributed among our facilities as set forth below:
Ethylene Segments’ Production Capacity
| | | | | | | | |
| | | Year ended December 31, | |
| | | 2015 | | | 2016 | |
| | | (in thousands of tons) | |
Petrochemical Facility | | | | |
Cangrejera(1) | | | 1,321 | | | | 1,321 | |
Morelos | | | 2,277 | | | | 2,277 | |
| | | | | | | | |
Total | | | 3,598 | | | | 3,598 | |
| | | | | | | | |
Notes: Numbers may not total due to rounding.
| (1) | Our ethylene segment’s capacity in Cangrejera does not include products from the aromatics and derivatives chain. These products belong to Pemex Industrial Transformation. |
Source: Pemex Ethylene.
Production
The following table sets forth our ethylene segment’s production for the two years ended December 31, 2016:
Ethylene Segment’s Production(1)
| | | | | | | | | | | | |
| | | Year ended December 31, | |
| | | 2015 | | | 2016 | | | 2016
vs. 2015 | |
| | | (in thousands of tons) | | | (%) | |
Ethane derivatives | | | 1,992.8 | | | | 1,690.7 | | | | (15.2 | ) |
Propylene and derivatives | | | 66.0 | | | | 42.8 | | | | (35.2 | ) |
Others | | | 910.9 | | | | 795.2 | | | | (12.7 | ) |
| | | | | | | | | | | | |
Total(1) | | | 2,969.7 | | | | 2,528.7 | | | | (14.8 | ) |
| | | | | | | | | | | | |
Note: Numbers may not total due to rounding.
| (1) | Figures include petrochemical products used as raw material to produce other petrochemicals. |
Source: Pemex BDI.
In 2016, our total production in the ethylene segment decreased 14.8%, from 2,969.7 thousand tons in 2015 to 2,528.7 thousand tons in 2016, primarily due to a decrease in the production of ethylene at the Cangrejera petrochemical complex and a reduced supply of ethane gas from our third-party supplier.
76
Domestic Sales
The following table sets forth our ethylene segment’s domestic sales for the two years ended December 31, 2016.
Value of Ethylene Segments’ Domestic Sales(1)
| | | | | | | | | | | | |
| | | Year ended December 31, | |
| | | 2015 | | | 2016 | | | 2016
vs. 2015 | |
| | | (in millions of pesos)(2) | | | (%) | |
Ethane derivatives | | | Ps.15,580.6 | | | | Ps. 14,539.4 | | | | (6.7 | ) |
Propylene and derivatives | | | 1,156.5 | | | | 788.3 | | | | (31.8 | ) |
Others | | | 104.0 | | | | 64.8 | | | | (37.7 | ) |
| | | | | | | | | | | | |
Total | | | Ps. 16,841.1 | | | | Ps. 15,392.5 | | | | (8.6 | ) |
| | | | | | | | | | | | |
Note: Numbers may not total due to rounding.
| (1) | Excludes value added tax. |
| (2) | Figures are stated in nominal pesos. |
Source: Pemex BDI.
In 2016, our domestic sales decreased by 8.6% in 2016, from Ps. 16,841.1 million in 2015 to Ps. 15,392.5 million in 2016. This decrease was primarily due to lower production of high density polyethylene, low density polyethylene and ethylene oxide, which was partially offset by an increase in the sales of low linear density polyethylene in 2016 as compared to 2015.
Sales to other Subsidiary Entities
The following table sets forth the intercompany sales of petrochemical products for the two years ended December 31, 2016.
Ethylene Segment’s Intercompany Sales(1)
| | | | | | | | | | | | |
| | | Year ended December 31, | |
| | | 2015 | | | 2016 | | | 2016
vs. 2015 | |
| | | (in millions of pesos)(2) | | | (%) | |
Ethane and derivatives | | | Ps. 84.7 | | | | Ps. 109.8 | | | | 29.6 | |
Others | | | 91.9 | | | | 373.7 | | | | 306.6 | |
| | | | | | | | | | | | |
Total | | | Ps. 176.6 | | | | Ps. 483.5 | | | | 173.8 | |
| | | | | | | | | | | | |
Note: Numbers may not total due to rounding.
| (1) | Excludes value added tax. |
| (2) | Figures are stated in nominal pesos. |
Source:Pemex Ethylene.
In 2016, our intercompany sales increased by 173.8%, from Ps. 176.6 million in 2015 to Ps. 483.5 million in 2016. This increase was primarily due to an increase in the sales of pyrolysis liquids and nitrogen.
Ethylene Capital Expenditures
Our ethylene segment invested Ps. 746 million in capital expenditures in 2016, and has budgeted Ps. 1,786 million for capital expenditures in 2017.
77
The following table sets forth our ethylene segment’s capital expenditures, excludingnon-capitalizable maintenance, for each of the two years ended December 31, 2016, and the budget for 2017. Capital expenditure amounts are derived from our budgetary records, which are prepared on a cash basis. Accordingly, these capital expenditure amounts do not correspond to capital expenditure amounts included in our consolidated financial statements prepared in accordance with IFRS.
Ethylene’s Capital Expenditures
| | | | | | | | | | | | |
| | | Year ended December 31,(1) | | | Budget
2017(2) | |
| | | 2015 | | | 2016 | | |
| | | (in millions of pesos)(3) | |
Ethylene | | | | | | | | | | | | |
Maintaining the Production Capacity of Ethylene Plant 2013-2015 at Morelos PC | | | Ps. 93 | | | | Ps. 122 | | | | Ps.— | |
Modernization and Optimization of Auxiliary Services Infrastructure I at Morelos PC | | | 5 | | | | 105 | | | | 213 | |
Modernization of Fire Protection Network at Cangrejera PC | | | 102 | | | | 71 | | | | 118 | |
Safety and Environmental Protection Based on Observations and Regulations IV at Morelos PC | | | 114 | | | | 43 | | | | 1 | |
Maintaining Production Capacity of the Low Density Polyethylene Plant | | | 112 | | | | 40 | | | | 156 | |
Maintaining the Production Capacity of Ethane Derivatives Chain II at Morelos PC | | | 87 | | | | 38 | | | | 0 | |
Maintaining the Production Capacity of Auxiliary Services II | | | 78 | | | | 27 | | | | 32 | |
Maintaining the production capacity of ethylene oxide plant 2015-2017 at Morelos PC | | | 1 | | | | 23 | | | | 97 | |
Maintaining the Production Capacity of Auxiliary Services III | | | 59 | | | | 17 | | | | 19 | |
Maintaining the Production Capacity of Auxiliary Services at Morelos PC | | | 48 | | | | 17 | | | | 42 | |
Maintaining the Production Capacity of the Ethane Derivatives Chain III at Morelos PC | | | 54 | | | | 8 | | | | 2 | |
Maintaining the Production Capacity of the Mitsui plant 2015-2017 at Morelos PC | | | 4 | | | | 8 | | | | 24 | |
Maintaining the Production Capacity of the Swing Plant 2015-2017 at Morelos PC | | | 7 | | | | 6 | | | | 150 | |
Modernization and Expansion of Production Capacity of Ethane Derivatives Chain I at Morelos PC | | | 402 | | | | 3 | | | | 6 | |
Modernization and Optimization of Infrastructure and Auxiliary Services I at Cangrejera PC | | | 277 | | | | — | | | | — | |
Others | | | 426 | | | | 219 | | | | 927 | |
| | | | | | | | | | | | |
Total | | | Ps. 1,869 | | | | Ps. 746 | | | | Ps. 1,786 | |
| | | | | �� | | | | | | | |
Notes: Numbers may not total due to rounding.
PC = Petrochemical Complex.
| (1) | Amounts based on cash basis method of accounting. |
| (2) | Budget authorized on December 14, 2016 and presented to the Board of Directors of Petróleos Mexicanos on April 7, 2017. |
| (3) | Figures for 2015 and 2016 are stated in nominal pesos. Figures for 2017 are stated in constant 2017 pesos. |
Source: Petróleos Mexicanos.
78
Joint Venture with Mexichem
We have a 44.1% interest in a joint venture with Mexichem S.A.B. de C.V., which we refer to as Mexichem, through an investment in Petroquímica Mexicana de Vinilo S.A. de C.V. (PMV), a Mexican entity incorporated by Mexichem in 2011. This joint venture allowed for the integration of the caustic soda-salt-chlorine-ethylene-vinyl chloride monomer production chain, which has streamlined operations and is expected to reduce manufacturing costs. Plants associated with this project began operating on September 12, 2013. The ethylene and vinyl chloride monomer plants are operated by employees of Pemex Ethylene. Vinyl chloride monomer plants and related infrastructure at the Pajaritos petrochemical complex were divested from Pemex-Petrochemicals and contributed to PMV. During 2016, our petrochemicals segment supplied 2.6 thousand barrels per day of ethane to PMV, a decrease of 71.1 % as compared to 8.8 thousand barrels per day in 2015.
As a result of an accident at vinyl chloride plant III on April 20, 2016, the vinyl chloride III and ethylene plants ceased operations and the soda plant began operating at reduced capacity, which led to a decline in sales of all products in 2016. The vinyl chloride plant was the only plant affected by the accident, and we are currently evaluating plants to resume operations. To date, the cause of the accident is unknown.
Drilling and Services
Our drilling and services segment operates through the productive state-owned subsidiary Pemex Drilling and Services and provides drilling, completion, work-over and other services for wells in offshore and onshore fields. During 2016, this segment mainly provided drilling services to Pemex Exploration and Production, but also began to provide services to third-party clients such as CONAGUA and the Armada Company.
As a result of our corporate reorganization, for the year ended December 31, 2015, we have presented operating results for our drilling and services segment together with results for our exploration and production segment. We have summarized some of these results below. For additional results for this segment, please see “—Exploration and Production—Exploration and Drilling” above in this Item 4. Operating results for these segments are presented separately for periods beginning January 1, 2016. When reviewing these results, please note that our exploration and production segment receives drilling services not only from our drilling and services segment but also from third parties. Accordingly, the amounts presented above under drilling activity do not relate only to services provided by our drilling and services segment. For a detailed description of the financial results of each segment, see our consolidated financial statements included herein.
During 2016, we drilled 93 wells, 41 onshore and 52 offshore; completed 92 wells, 41 onshore and 51 offshore; and made 617 workovers, 540 onshore and 77 offshore. Of the wells completed, two were for CONAGUA. Those services were performed with an average of 54 drilling and workover rigs, 24 terrestrial and 30 marine, including both owned and leased equipment. Moreover, we conducted 24,851 well services in 2016, of which 52.7% were wireline operations, 28.2% were cementing jobs, 16.0% were logging operations and perforations and 3.1% were coiled tubing operations.
Given the current state of the oil and gas industry and the decline in global oil prices, the demand for well drilling and services decreased in 2016 by approximately 12% as compared to 2015. In 2017, we expect well interventions to decrease by approximately 37.9% and we expect to operate an average of 35 rigs—16 land and 19 marine—including both owned and leased equipment, which represents a 35.2% decrease as compared to 2016. Of these, we expect that 13 land and 3 marine will be rigs we own, which is a 42.9% decrease as compared to 2016. By the end of 2017, we expect to be operating a total of 14 rigs—11 land and 3 marine rigs.
In 2016, we acquired two 3,000 hp land rigs for Ps. 1,442.3 million. Plans to acquire two marine rigs have been postponed due to delays in construction. In 2017, in accordance with our “Programa de modernización de la infraestructura de perforación” (Drilling Infrastructure Modernization Program), we expect to acquire two 200 hp land rigs for well repairs.
79
Drilling and Services Capital Expenditures
Our drilling and services segment invested Ps. 2,688 million on capital expenditures in 2016 and has budgeted Ps. 1,580 million for capital expenditures in 2017.
The following table sets forth our drilling and services segment’s capital expenditures, excludingnon-capitalizable maintenance, for each of the two years ended December 31, 2016, and the budget for 2017. Capital expenditure amounts are derived from our budgetary records, which are prepared on a cash basis. Accordingly, these capital expenditure amounts do not correspond to capital expenditure amounts included in our consolidated financial statements prepared in accordance with IFRS.
Drilling and Services’ Capital Expenditures
| | | | | | | | | | | | |
| | | Year ended
December 31, 2015(1) | | | Budget
2017(3) | |
| | | 2015(2) | | | 2016 | | |
| | | (in millions of pesos)(4) | |
Drilling and Services | | | | | | | | | | | | |
Acquisition of TwoJack-Up Platforms | | | Ps. 553 | | | | Ps. 772 | | | | Ps. 838 | |
Acquisition of Nine Land-Based Drilling Rigs | | | 288 | | | | 340 | | | | 386 | |
Drilling Rig Equipment and Well Service Equipment Maintenance Program | | | — | | | | 74 | | | | 287 | |
Acquisition of Two Modular Drilling Rigs | | | 723 | | | | — | | | | 65 | |
Others | | | — | | | | 1,501 | | | | 3 | |
| | | | | | | | | | | | |
Total | | | Ps. 1,564 | | | | Ps. 2,688 | | | | Ps. 1,580 | |
| | | | | | | | | | | | |
Notes: Numbers may not total due to rounding.
| (1) | Amounts based on cash basis method of accounting. |
| (2) | Figures for the drilling and services segment for the year ended December 31, 2015 refer to capital expenditures since August 1, 2015, when Pemex Drilling and Services was formed. |
| (3) | Budget authorized on December 14, 2016 and presented to the Board of Directors of Petróleos Mexicanos on April 7, 2017. |
| (4) | Figures for 2015 and 2016 are stated in nominal pesos. Figures for 2017 are stated in constant 2017 pesos. |
Source: Petróleos Mexicanos.
Logistics
Our logistics segment operates through the productive state-owned subsidiary Pemex Logistics and provides land, maritime and pipeline transportation, storage and distribution services to some of our other subsidiary entities and to other companies, including CFE,Aeropuertos y Servicios Auxiliares, CENAGAS, local gas stations and distributors.
Transportation of Crude Oil and Refined Products
During 2016, we transported 58,016 millionton-kilometers of crude oil and petroleum products, an 11.3% decrease as compared to 2015 due to decreased production in our exploration and production segment, decreased processing of crude oil in our refineries and the illicit market in fuels which can lead to temporary pipeline closures. During 2016, we transported approximately 4,688 million cubic feet per day of natural gas, through an operation and maintenance service contract provided to CENAGAS. During 2016, we also transported 140 thousand barrels per day of LPG and 2,475 thousand barrels per day of crude oil and petroleum products to be processed in our refining system and to satisfy domestic demand for petroleum products, as compared to 174 thousand barrels per day of LPG and 3,181 thousand barrels per day of crude oil and petroleum products transported in 2015. Of the total amount we transported in 2016, we carried 79.5% of the transported volumes in 2016 through pipelines, 7.8% by vessels and the remaining 12.7% by train tank cars and trucks.
80
During 2016, we transported approximately 5,440 million cubic feet per day of natural gas, an increase as compared to the 5,142 million cubic feet per day transported in 2015, partially due to the transportation of an estimated 655 million cubic feet per day for the CFE as agreed among the Ministry of Energy, the Energy Regulatory Commission and Pemex Industrial Transformation. On January 1, 2016, we began providing operation, maintenance and information technology services, among others, to CENAGAS in connection with its natural gas transportation infrastructure.
Our pipelines connect crude oil and natural gas producing centers with refineries and petrochemical plants, and our refineries and petrochemical plants with Mexico’s major cities. At the end of 2016, our pipeline network measured approximately 17,696 kilometers in length, of which 17,433 kilometers are operational and 263 kilometers are temporarily out of operation. These pipelines may be temporarily out of operation because of a decline in production in a field where the pipeline is located or because transportation service is irregular, making operation of the pipeline unprofitable. Once production is restored in that field, pipelines become operational again. We are currently analyzing the 263 kilometers of pipelines temporarily out of operation to determine if and how they may be used.
Approximately 5,259 kilometers of the pipelines currently in operation transport crude oil, 8,582 kilometers transport petroleum products and petrochemicals, 1,583 kilometers transport LPG, 1,982 kilometers transport basic and secondary petrochemicals and 290 kilometers transport other products, including fuel oil, jet fuel and water.
On January 1, 2016, the 9,168 kilometers of pipelines used to transport natural gas were transferred to CENAGAS. For more information, see Note 9 to our consolidated financial statements included herein.
We have been working to implement a pipeline integrity management plan, which is based on the guidelines of API Standard RP 1160, “Managing System Integrity for Hazardous Liquid Pipelines;” the American Society of Mechanical Engineers B31.8S, “Managing System Integrity of Gas Pipelines” andNOM-027.
The pipeline integrity management plan consists of the following stages:
| | • | | collection of detailed records and the development of a pipeline database; |
| | • | | categorization and identification of threats that could affect pipeline integrity, safety and operation; |
| | • | | identification of critical points in the pipeline; |
| | • | | risk assessment and evaluation of pipeline integrity; |
| | • | | maintenance and risk-mitigation planning; and |
| | • | | ongoing monitoring during all stages. |
We have made considerable progress towards satisfying the requirements ofNOM-027. Specifically, as of December 31, 2016, we have analyzed 96% of our overall logistics pipeline network. In addition, we have implemented several measures required by our pipeline integrity management plan, including our data collection requirements.
Despite having implemented strategies to improve the integrity and operation of our transportation pipeline network, we experienced 35 leaks and spills in 2016, which represents a 45.3% decrease as compared to 64 incidents in 2015. Of the 35 incidents we experienced in transportation pipelines in 2016, 14 were due to a failure in the mechanical integrity of the pipelines, two were due to third-party incidents and 19 were due to other factors.
The transportation of crude oil, natural gas and other products through a pipeline network is subject to various risks, including risks of leaks and spills, explosions and theft. In 2016, we incurred a total of Ps. 3,891.1 million in expenditures for the remediation and maintenance of our pipeline network and we have budgeted an additional Ps. 2,987.3 million for these expenditures in 2017. For more information on recent issues with our pipeline network, see “Item 3—Key Information—Risk Factors—Risk Factors Related to our
81
Operations—We are an integrated oil and gas company and are exposed to production, equipment and transportation risks, criminal acts and deliberate acts of terror” and “—Environmental Regulation—Environmental Liabilities” below.
Other Transportation Equipment and Storage Facilities
As of December 31, 2016, we owned 16 refined product tankers and leased one. We also own 17 tugs, 1,485 tank trucks and 511 train tank cars, as well as 74 major wholesale storage and distribution centers, 10 liquefied gas terminals, five maritime terminals and 10 dock operation and maintenance facilities. These facilities, together with our pipeline network, constitute our oil and gas transportation and distribution infrastructure.
Our current fleet includes 17 vessels, of which we own 16 and lease one. Altogether, we have a transportation capacity of 4,618 thousand barrels. 67.5% of our vessels are located on the Pacific Coast and 32.4% are in the Gulf of Mexico. Of the vessels on the Pacific Coast, 83.7% are used to transport distillates, and 16.3% to transport fuel oil and heavy diesel. Of the vessels in the Gulf of Mexico, 82.5% are used for distillates and 17.5% for fuel oil and heavy diesel. Our vessel, BT Burgos, is currently out of operation due to an accident which occurred on September 24, 2016.
The plan for renewal and modernization of our fleet was concluded in 2014; however, we may resume renewal and modernization efforts pursuant to future demand for petroleum products or the retirement of a vessel in accordance with current international regulation.
On July 25, 2013, as part of a plan to modernize the fleet, we signed an agreement with the Secretaría de Marina—Armada de México (Mexican Navy), valued at approximately Ps. 3,212.1 million (U.S. $250.0 million), for the construction of 22 marine vessels for Pemex-Refining, now Pemex Industrial Transformation. The agreement initially included construction of 16 tugs, three multipurpose vessels and three barges, but was modified in 2016 to remove the construction of the three barges and extend the final delivery date to December 31, 2018. This transaction is now valued at approximately Ps. 4,346.4 million.
Treatment and Primary Logistics
Treatment and primary logistics systems are the pipeline systems between our oil fields and our refineries and delivery terminals. During 2016, Pemex Exploration and Production began to transfer its treatment and logistics systems to Pemex Logistics, including the transfer of the Misión, Altamira and Santuario systems on May 1, 2016, the Dos Bocas Maritime Terminal system on September 1, 2016, and the oil and gas South Terrestrial system on November 1, 2016. Altogether these systems include 1,357 kilometers of natural gas pipelines, 1,124 kilometers of crude oil pipelines and 401 kilometers of gasoline pipelines, as well as one maritime export terminal for crude oil.
During 2016, these treatment and primary logistics systems transported an average of 2,133 thousand barrels per day of crude oil, of which 935 thousand barrels per day were delivered to the National Refining System and 1,198 thousand barrels per day were delivered to export terminals. For our gas distribution, an average of 4,195 million cubic feet per day was transported in 2016, of which 3,699 million cubic feet per day were delivered to process plants, 496 million cubic feet per day were delivered directly to pipelines, and 36 million cubic feet per day of condensate were delivered to process plants.
During 2016, we experienced six leaks and spills.
Open Season
As a result of energy reform, we may offer pipeline transportation and storage services for refined products to the wider energy market. During 2017, under the guidelines issued by the Energy Regulatory Commission, Pemex Logistics will participate in an “open season,” a transparent and competitive auction procedure where any participant can compete to offer its services.
82
Once the capacity reserve authorized by the CRE has been allocated to Pemex Industrial Transformation in a volume sufficient to ensure that national supply is not affected, the remaining services will be offered through an auction.
Pemex Logistics will offer its services in the north of Mexico, which includes the Rosarito area, and the Guaymas area. Once the auction process is complete, we anticipate that our logistics segment will gradually extend its transportation and storage services to the rest of Mexico, until reaching full coverage before the end of 2017.
During 2016, our logistics segment earned Ps. 71,130.8 million, primarily for services rendered to our other subsidiary entities.
Logistics Capital Expenditures
Our logistics segment invested Ps. 7,015 million in capital expenditures in 2016 and has budgeted Ps. 4,449 million in capital expenditures for 2017.
The following table sets forth our logistics segment’s capital expenditures, excludingnon-capitalizable maintenance, for each of the two years ended December 31, 2016, and the budget for 2017. Capital expenditure amounts are derived from our budgetary records, which are prepared on a cash basis. Accordingly, these capital expenditure amounts do not correspond to capital expenditure amounts included in our consolidated financial statements prepared in accordance with IFRS.
Logistics’ Capital Expenditures
| | | | | | | | | | | | |
| | | Year ended December 31,(1) | | | Budget
2017(2) | |
| | | 2015 | | | 2016 | | |
| | | (in millions of pesos)(3) | |
Logistics | | | | | | | | | | | | |
Larger Fleet Modernization | | | 458 | | | | 583 | | | | 487 | |
Renewal of Tugs, Chalanes and Multipurpose Vessels of the Smaller Fleet | | | 401 | | | | 495 | | | | 36 | |
Refurbishment, Modification and Modernization of Pumping and Compression Stations Nationwide | | | 221 | | | | 476 | | | | 97 | |
Maintenance of Safety, Measurement, Control and Automation Systems in Storage and Distribution Terminals | | | 460 | | | | 452 | | | | 332 | |
Acquisition of 5 Tankers Vessel by Cash and/or by Leasing | | | 363 | | | | 427 | | | | 309 | |
Evaluation and Rehabilitation of the Mechanical Integrity of the Pipeline’s Poza Rica-Salamanca and Nuevo Teapa- Tula-Salamanca | | | 461 | | | | 347 | | | | 388 | |
Replacement of Vessel Tanks Nuevo Pemex I, II, III and IV by Acquisition and/or Leasing | | | 278 | | | | 326 | | | | 240 | |
Implementation of the SCADA System in 47 Pipeline Transportation Systems | | | 520 | | | | 270 | | | | 106 | |
Evaluation and Rehabilitation of the Mechanical Integrity of the Pipelines in Northern and Pacific Zones | | | 271 | | | | 251 | | | | 450 | |
Evaluation and Rehabilitation of the Mechanical Integrity of the Pipelines Nuevo Teapa-Madero-Cadereyta | | | 574 | | | | 193 | | | | 41 | |
Integral Maintenance of Pipeline Systems for Natural Gas and LPG, Stage II | | | 293 | | | | 172 | | | | 176 | |
83
| | | | | | | | | | | | |
| | | Year ended December 31,(1) | | | Budget
2017(2) | |
| | | 2015 | | | 2016 | | |
| | | (in millions of pesos)(3) | |
Modernization of the Instrumented Security and Basic Control Systems of the Pumping Stations and Product Receipt Northern Zone | | | 278 | | | | 110 | | | | 2 | |
Evaluation and Rehabilitation of the Mechanical Integrity of the Turbosine, Diesel, Gasoline and Fuel Oil Pipelines and Gas Pipelines in the Central Zone | | | 464 | | | | 109 | | | | 62 | |
Natural Gas Transportation from Jáltipan to Salina Cruz Refinery | | | 403 | | | | 31 | | | | 7 | |
Maintenance of Marine Facilities | | | 316 | | | | 28 | | | | 65 | |
Others | | | 4,066 | | | | 2,745 | | | | 1,654 | |
| | | | | | | | | | | | |
Total | | | Ps. 9,827 | | | | Ps. 7,015 | | | | Ps. 4,449 | |
| | | | | | | | | | | | |
Notes: Numbers may not total due to rounding.
| (1) | Amounts based on cash basis method of accounting. |
| (2) | Budget authorized on December 14, 2016 and presented to the Board of Directors of Petróleos Mexicanos on April 7, 2017. |
| (3) | Figures for 2014, 2015 and 2016 are stated in nominal pesos. Figures for 2017 are stated in constant 2017 pesos. |
Source: Petróleos Mexicanos.
Private Sector Participation in Natural Gas Distribution
Prior to the enactment of the Hydrocarbons Law, the Regulatory Law provided that private and “social sector” companies could, with governmental authorization, store, distribute and transport natural gas and construct, own and operate natural gas pipelines, facilities and equipment.
Since 1997, the Regulatory Law has required us to provide the private sector with open access to our transportation system for distribution, ending our prior exclusive rights over the distribution lines. We continue to market natural gas and may develop natural gas storage systems.
In 1996, the Energy Regulatory Commission approved the Gradual Access Program for 1996 to 1997, which required that we open access to our natural gas distribution system to the private sector and prohibited vertical integration between transportation and distribution. As a result,Pemex-Gas and Basic Petrochemicals’ distribution assets located within the following official distribution zones were privatized: Chihuahua, Toluca, Saltillo, Nuevo Laredo, Río Pánuco, Northern Tamaulipas, Distrito Federal, Valle deCuautitlán-Texcoco-Hidalgo, Hermosillo, Monterrey, Mexicali, El Bajío, Cananea, Querétaro, La Laguna, Bajío Norte, Puebla, Tlaxcala, Guadalajara, Piedras Negras and Ciudad Juárez. Most recently,Pemex-Gas and Basic Petrochemicals’ distribution assets located within Altamira and Morelos were privatized in 2012 and the distribution assets located within Veracruz were privatized in 2013.
In addition, with respect to first-hand sales of natural gas,Pemex-Gas and Basic Petrochemicals, now Pemex Industrial Transformation, submitted to the Energy Regulatory Commission its proposal for a new payment system in 2013, which would provide customers with the option to reserve transportation capacity of natural gas and make payments based on the volume consumed. This new payment system is designed to allow customers to better estimate their consumption of natural gas, as well as enhance our ability to manage costs and capacity related to the transportation of natural gas. We continue to employ a temporary methodology for determining maximum prices of first-hand sales of natural gas. However, we are prepared to begin operating under the new system once the Energy Regulatory Commission approves it and issues final regulations to govern natural gas sales under the system. The Energy Regulatory Commission has stated that it plans to issue new regulations by July 1, 2017.
84
The Hydrocarbons Law, which repealed the Regulatory Law, provides for the participation of other companies in the entire natural gas value chain. The law additionally establishes a permit regime that governs all midstream and downstream activities in Mexico. In January 2015, the Energy Regulatory Commission granted Gasoducto de Aguaprieta S. de R.L. de C.V. a transportation permit corresponding to the northwestern region of Mexico, including Cajeme and Navojoa in the state of Sonora and another for Ahome, Choix, El Fuerte, Guasave and Salvador Alvarado in the state of Sinaloa.
Pursuant to the Hydrocarbons Law, on August 11, 2014, CENAGAS was created as a decentralized public entity of the Mexican Government to act as the independent administrator of the Integrated Natural Gas System. This system interconnects the infrastructure for the storage and transportation of natural gas across the nation, with the aim of expanding coverage, strengthening security measures and improving the continuity, quality and efficiency in transportation service. As an integrated system of transportation systems owned by CENAGAS or other participating companies, the Integrated Natural Gas System functions as a primary transportation service supplier in Mexico with standardized fares. Within this system, theSistema Nacional de Gasoductos (National Gas Pipelines System) acts as the commercial administrator for the total available capacity of the Integrated Natural Gas System. In order for a transportation system to become part of the Integrated Natural Gas System, its transport capacity must enhance the Integrated Natural Gas System’s flow capacity and improve the overall transportation service provided to users.
In accordance with the Energy Reform Decree, we signed a transfer agreement with CENAGAS on October 29, 2015 for the transfer to CENAGAS of assets associated with the Integrated Natural Gas System and the distribution contract for the Naco-Hermosillo pipeline system. The National Gas Pipeline System has 87 pipelines with a total length of almost 9,000 kilometers and a transport capacity over 5,000 million cubic feet per day, while the Naco-Hermosillo system is a 300 kilometers long pipeline with a transport capacity of 90 million cubic feet per day. The approximate aggregate book value of these assets, which were transferred to CENAGAS on January 1, 2016, was Ps. 35.3 billion as of December 31, 2016, as described in Note 9 to our consolidated financial statements included herein.
Cogeneration and Services
Our cogeneration and services segment operates through the productive state-owned subsidiary Pemex Cogeneration and Services and uses the thermal heat and steam from our industrial processes to produce the electricity required by us, as well as surplus electricity to sell to third parties in Mexico. Our cogeneration and services segment also provides technical and management services associated with supplying electricity.
Our cogeneration and services segment designs construction, financing and development structures for cogeneration through alliances with third parties in close geographic proximity to our productive work centers.
In 2013, we, throughPemex-Gas and Basic Petrochemicals, now Pemex Industrial Transformation, entered into a services agreement with the Cogeneration Plant of Nuevo Pemex, which we refer to as the Cogeneration Plant, owned by ACT Energy México, S. de R. L. de C. V., to convert demineralized/condensed water from liquid to steam and natural gas into electricity to supply the Nuevo Pemex gas processing complex and to transport natural gas to our other centers and productive state-owned subsidiaries. Through this services agreement, the Cogeneration Plant agrees to provide a minimum of between 550 and 800 tons per hour of steam and 277.2 megawatts of electricity to the Nuevo Pemex gas processing complex and our 191 other workplaces and productive state-owned subsidiaries throughout the country. On December 6, 2016, the services agreement with the Cogeneration Plant was amended to increase the supply of steam by 140 tons per hour beginning on December 1, 2017.
During 2016, the Cogeneration Plant generated an average of 561.3 tons per hour of steam for the Nuevo Pemex gas processing complex, a 4.5% decrease as compared to 2015, and 298 megawatts of electricity, a 2.6% decrease as compared to 2015. These decreases are primarily due to significant maintenance performed at the plant during February and March.
85
In November 2016, Pemex Industrial Transformation and CFE entered into a services agreement for the conversion of demineralized/condensed water from liquid to steam, pursuant to which CFE will supply 662 tons of steam per hour to the Salamanca refinery through the external cogeneration project developed by CFE. Operational and performance tests began in November 216 and will conclude in the second half of 2017. Our cogeneration and services segment will monitor and manage the services agreement between the parties.
Our cogeneration and services segment has two cogeneration projects to supply steam and electricity to Tula and Cadereyta refineries. During 2016, we carried out activities to define the scope of these projects and to develop the relevant user requirements, which we are working to formalize with the aim of commencing operations by the end of 2022. These projects will be developed through alliances with, and investment capital from, third parties. The projected total investment is U.S. $ 1,127 million, with an estimated capacity of 969 megawatts of electricity and 2,000 tons per hour of steam.
The following table sets forth a brief summary of the three projects discussed above.
Projects under Development
| | | | | | | | | | | | |
| | | Electricity (Megawatts) | | | Steam (tons/hour) | |
| | | Capacity | | | Our Demand | | | | |
Tula | | | 444 | | | | 267 | | | | 1,150 | |
Cadereyta | | | 525 | | | | 135 | | | | 850 | |
Source: Pemex Cogeneration and Services.
We did not have capital expenditures for our cogeneration and services segment for the year ended December 31, 2016, and do not have any capital expenditures budgeted for 2017.
International Trading
PMI and its subsidiaries conduct international commercial activities for our crude oil, refined and petrochemical products, with the exception of natural gas, which is marketed directly by our industrial transformation segment. The PMI subsidiaries’ main objectives are to assist in maximizing our profitability and optimizing our operations through the use of international trade, facilitating our link with the international markets and pursuing new business opportunities in marketing our products. PMI and its subsidiaries manage the international sales of our crude oil and petroleum products and acquire in the international markets those petroleum products that we import to satisfy domestic demand. Sales of crude oil are carried out through PMI. Sales and purchases of petroleum products in the international markets are carried out through P.M.I. Trading, Ltd., which also performs third-party trading, transportation and risk management activities.
Exports and Imports
PMI purchases crude oil from our exploration and production segment and then sells it to PMI’s customers. PMI sold an average of 1.2 million barrels of crude oil per day in 2016, which represented 55.5% of our total crude oil production.
86
The following tables set forth the composition and average prices of our crude oil exports for the periods indicated.
| | | | | | | | | | | | | | | | | | | | | | | | | | | | | | | | | | | | | | | | |
| | | Year ended December 31, | |
| | | 2012 | | | 2013 | | | 2014 | | | 2015 | | | 2016 | |
| | | (tbpd) | | | (%) | | | (tbpd) | | | (%) | | | (tbpd) | | | (%) | | | (tbpd) | | | (%) | | | (tbpd) | | | (%) | |
Crude Oil Exports (by Volume) | | | | | | | | | | | | | | | | | | | | | | | | | | | | | | | | | | | | | | | | |
Olmeca (API gravity of38°-39°) | | | 194 | | | | 15 | | | | 99 | | | | 8 | | | | 91 | | | | 8 | | | | 124 | | | | 11 | | | | 108 | | | | 9 | |
Isthmus (API gravity of32°-33°) | | | 99 | | | | 8 | | | | 103 | | | | 9 | | | | 134 | | | | 12 | | | | 194 | | | | 17 | | | | 153 | | | | 13 | |
Maya (API gravity of21°-22°) | | | 944 | | | | 75 | | | | 968 | | | | 81 | | | | 887 | | | | 78 | | | | 743 | | | | 63 | | | | 865 | | | | 72 | |
Altamira (API gravity of15.0°-16.5°) | | | 19 | | | | 2 | | | | 20 | | | | 2 | | | | 27 | | | | 2 | | | | 28 | | | | 2 | | | | 23 | | | | 2 | |
Talam (API gravity of-15.8º) | | | | | | | | | | | | | | | | | | | 3 | | | | 0.3 | | | | 83 | | | | 7 | | | | 45 | | | | 4 | |
| | | | | | | | | | | | | | | | | | | | | | | | | | | | | | | | | | | | | | | | |
Total | | | 1,256 | | | | 100 | % | | | 1,189 | | | | 100 | % | | | 1,142 | | | | 100 | % | | | 1,172 | | | | 100 | % | | | 1,194 | | | | 100 | |
| | | | | | | | | | | | | | | | | | | | | | | | | | | | | | | | | | | | | | | | |
| Notes: | Numbers may not total due to rounding. |
| | tbpd = thousand barrels per day. |
| | API gravity refers to the specific gravity or density of liquid petroleum products, measured in degrees on the American Petroleum Institute (API) scale. On the API scale, oil with the lowest specific gravity has the highest API gravity. In addition, holding all other factors constant, the higher the API gravity, the greater the value of the crude oil. |
Source: PMI operating statistics as of January 27, 2017.
| | | | | | | | | | | | | | | | | | | | |
| | | Year ended December 31, | |
| | | 2012 | | | 2013 | | | 2014 | | | 2015 | | | 2016 | |
| | | (U.S. dollars per barrel) | |
Crude Oil Prices | | | | | | | | | | | | | | | | | | | | |
Olmeca | | U.S.$ | 109.39 | | | U.S.$ | 107.92 | | | U.S.$ | 93.54 | | | U.S.$ | 51.46 | | | U.S.$ | 39.71 | |
Isthmus | | | 107.28 | | | | 104.69 | | | | 93.39 | | | | 49.28 | | | | 37.72 | |
Maya | | | 99.99 | | | | 96.89 | | | | 83.75 | | | | 41.12 | | | | 35.28 | |
Altamira | | | 96.40 | | | | 94.35 | | | | 81.30 | | | | 36.19 | | | | 30.35 | |
Talam | | | | | | | | | | | 36.74 | | | | 36.40 | | | | 28.26 | |
| | | | | | | | | | | | | | | | | | | | |
Weighted average realized price | | U.S. $ | 101.96 | | | U.S. $ | 98.44 | | | U.S. $ | 85.48 | | | U.S. $ | 43.12 | | | U.S. $ | 35.63 | |
| | | | | | | | | | | | | | | | | | | | |
Source: PMI operating statistics as of January 27, 2017.
Geographic Distribution of Export Sales
As of December 31, 2016, PMI had 34 customers in 18 countries. Among these countries, the largest proportion of our exports has consistently been to customers in the United States, Spain, India, Canada, South Korea and Japan. Since 2009, the percentage of our crude oil export sales to the United States compared to our total crude oil export sales has declined, while the proportion of crude oil export sales to countries in Europe and Asia, particularly Spain and India, has increased. In 2016, 47.8% of our crude oil exports were to customers located in the United States, which represents an 11% decrease as compared to 2015. The decrease in our crude oil exports to the United States can be attributed mainly to the steady increase of domestic production of light and extra-light crude oil in the United States, primarily as a result of shale discoveries and advances in technology that have made extraction of oil from shale rock commercially viable. In response to the increased availability of light crude oil in the U.S. Gulf of Mexico and other developing trends in international demand for imported crude oil, we have expanded the scope of its geographic distribution and renewed our strategy to diversify and strengthen the presence of Mexican crude oil in the international market. In January 2014, PMI began exporting Olmeca crude oil to European countries other than Spain. As part of our initiative to increase export sales of crude oil to East Asia, PMI also began exporting Isthmus and Maya crude oil to South Korea in January 2015 and continued to do so in 2016.
87
The following table sets forth our crude oil export sales by country for the five years ended December 31, 2016.
Crude Oil Exports byCountry
| | | | | | | | | | | | | | | | | | | | |
| | | Percentage of Exports | |
| | | 2012 | | | 2013 | | | 2014 | | | 2015 | | | 2016 | |
United States | | | 76.2 | % | | | 72.1 | % | | | 69.4 | % | | | 58.8 | % | | | 47.8 | % |
Spain | | | 13.2 | | | | 14.4 | | | | 14.2 | | | | 13.8 | | | | 14.9 | |
India | | | 6.0 | | | | 8.2 | | | | 7.0 | | | | 9.1 | | | | 10.4 | |
Canada | | | 1.8 | | | | 1.9 | | | | 1.8 | | | | 0.0 | | | | 0.0 | |
China | | | 0.8 | | | | 1.6 | | | | 1.2 | | | | 1.3 | | | | 1.7 | |
Others | | | 2.0 | | | | 1.8 | | | | 6.3 | | | | 16.9 | | | | 25.3 | |
| | | | | | | | | | | | | | | | | | | | |
Total | | | 100.0 | % | | | 100.0 | % | | | 100.0 | % | | | 100 | % | | | 100 | % |
| | | | | | | | | | | | | | | | | | | | |
Note: Numbers may not total due to rounding.
Source: PMI operating statistics as of January 27, 2017.
The following table sets forth the geographic distribution of PMI’s sales of crude oil exports for the five years ended December 31, 2016. The table also presents the distribution of exports among PMI’s crude oil types for those years.
Composition and Geographic Distribution of Crude Oil Export Sales
| | | | | | | | | | | | | | | | | | | | | | | | | | | | | | | | | | | | | | | | |
| | | Year ended December 31, | |
| | | 2012 | | | 2013 | | | 2014 | | | 2015 | | | 2016 | |
| | | (tbpd) | | | (%) | | | (tbpd) | | | (%) | | | (tbpd) | | | (%) | | | (tbpd) | | | (%) | | | (tbpd) | | | (%) | |
PMI Crude Oil Export Sales to: | | | | | | | | | | | | | | | | | | | | | | | | | | | | | | | | | | | | | | | | |
United States and Canada | | | 980 | | | | 78 | | | | 879 | | | | 74 | | | | 813 | | | | 71 | | | | 690 | | | | 59 | | | | 570 | | | | 48 | |
Europe | | | 176 | | | | 14 | | | | 179 | | | | 15 | | | | 215 | | | | 18 | | | | 248 | | | | 21 | | | | 272 | | | | 23 | |
Far East | | | 85 | | | | 7 | | | | 116 | | | | 10 | | | | 100 | | | | 9 | | | | 219 | | | | 19 | | | | 318 | | | | 26 | |
Central and South America | | | 14 | | | | 1 | | | | 15 | | | | 1 | | | | 15 | | | | 1 | | | | 15 | | | | 1 | | | | 34 | | | | 3 | |
| | | | | | | | | | | | | | | | | | | | | | | | | | | | | | | | | | | | | | | | |
Total | | | 1,256 | | | | 100 | | | | 1,189 | | | | 100 | | | | 1,142 | | | | 100 | | | | 1,172 | | | | 100 | | | | 1,194 | | | | 100 | |
| | | | | | | | | | | | | | | | | | | | | | | | | | | | | | | | | | | | | | | | |
| | | | | | | | | | |
Olmeca (API gravity of 38°-39°) | | | | | | | | | | | | | | | | | | | | | | | | | | | | | | | | | | | | | | | | |
United States and Canada | | | 184 | | | | 15 | | | | 90 | | | | 8 | | | | 35 | | | | 3 | | | | 40 | | | | 4 | | | | 4 | | | | 0.3 | |
Others | | | 9 | | | | 1 | | | | 8 | | | | 1 | | | | 56 | | | | 5 | | | | 84 | | | | 7 | | | | 104 | | | | 9 | |
| | | | | | | | | | | | | | | | | | | | | | | | | | | | | | | | | | | | | | | | |
Total | | | 194 | | | | 15 | | | | 99 | | | | 8 | | | | 91 | | | | 8 | | | | 124 | | | | 11 | | | | 108 | | | | 9 | |
| | | | | | | | | | | | | | | | | | | | | | | | | | | | | | | | | | | | | | | | |
| | | | | | | | | | |
Isthmus (API gravity of 32°-33°) | | | | | | | | | | | | | | | | | | | | | | | | | | | | | | | | | | | | | | | | |
United States and Canada | | | 58 | | | | 5 | | | | 62 | | | | 5 | | | | 89 | | | | 8 | | | | 78 | | | | 7 | | | | 3 | | | | 0.3 | |
Others | | | 41 | | | | 3 | | | | 41 | | | | 3 | | | | 45 | | | | 4 | | | | 116 | | | | 10 | | | | 150 | | | | 13 | |
| | | | | | | | | | | | | | | | | | | | | | | | | | | | | | | | | | | | | | | | |
Total | | | 99 | | | | 8 | | | | 103 | | | | 9 | | | | 134 | | | | 12 | | | | 194 | | | | 17 | | | | 153 | | | | 13 | |
| | | | | | | | | | | | | | | | | | | | | | | | | | | | | | | | | | | | | | | | |
| | | | | | | | | | |
Maya (API gravity of 21°-22°) | | | | | | | | | | | | | | | | | | | | | | | | | | | | | | | | | | | | | | | | |
United States and Canada | | | 719 | | | | 57 | | | | 707 | | | | 59 | | | | 662 | | | | 58 | | | | 513 | | | | 44 | | | | 540 | | | | 45 | |
Others | | | 224 | | | | 18 | | | | 260 | | | | 22 | | | | 225 | | | | 20 | | | | 230 | | | | 20 | | | | 325 | | | | 27 | |
| | | | | | | | | | | | | | | | | | | | | | | | | | | | | | | | | | | | | | | | |
Total | | | 944 | | | | 75 | | | | 968 | | | | 81 | | | | 887 | | | | 78 | | | | 743 | | | | 63 | | | | 865 | | | | 72 | |
| | | | | | | | | | | | | | | | | | | | | | | | | | | | | | | | | | | | | | | | |
88
| | | | | | | | | | | | | | | | | | | | | | | | | | | | | | | | | | | | | | | | |
| | | Year ended December 31, | |
| | | 2012 | | | 2013 | | | 2014 | | | 2015 | | | 2016 | |
| | | (tbpd) | | | (%) | | | (tbpd) | | | (%) | | | (tbpd) | | | (%) | | | (tbpd) | | | (%) | | | (tbpd) | | | (%) | |
Altamira (API gravity of15.0°-16.5°) | | | | | | | | | | | | | | | | | | | | | | | | | | | | | | | | | | | | | | | | |
United States and Canada | | | 18 | | | | 1 | | | | 20 | | | | 2 | | | | 27 | | | | 2 | | | | 28 | | | | 2 | | | | 22 | | | | 2 | |
Others | | | 1 | | | | 1 | | | | — | | | | — | | | | 0.4 | | | | 0.4 | | | | — | | | | — | | | | 2 | | | | 0.2 | |
| | | | | | | | | | | | | | | | | | | | | | | | | | | | | | | | | | | | | | | | |
Total | | | 19 | | | | 2 | | | | 20 | | | | 2 | | | | 27 | | | | 2 | | | | 28 | | | | 2 | | | | 24 | | | | 2 | |
| | | | | | | | | | | | | | | | | | | | | | | | | | | | | | | | | | | | | | | | |
| | | | | | | | | | |
Talam (API gravity of 15.8°) | | | | | | | | | | | | | | | | | | | | | | | | | | | | | | | | | | | | | | | | |
United States and Canada | | | — | | | | — | | | | — | | | | — | | | | — | | | | — | | | | 31 | | | | 3 | | | | 1 | | | | 0.1 | |
Others | | | — | | | | — | | | | — | | | | — | | | | 3 | | | | 0.3 | | | | 52 | | | | 4 | | | | 44 | | | | 4 | |
| | | | | | | | | | | | | | | | | | | | | | | | | | | | | | | | | | | | | | | | |
Total | | | — | | | | — | | | | — | | | | — | | | | 3 | | | | 0.3 | | | | 83 | | | | 7 | | | | 45 | | | | 4 | |
| | | | | | | | | | | | | | | | | | | | | | | | | | | | | | | | | | | | | | | | |
| Notes: | Numbers may not total due to rounding. |
tbpd = thousand barrels per day.
API gravity refers to the specific gravity or density of liquid petroleum products, measured in degrees on the API scale. On the API scale, oil with the lowest specific gravity has the highest API gravity. In addition, holding all other factors constant, the higher the API gravity, the greater the value of the crude oil.
Source: PMI operating statistics as of January 27, 2017.
PMI sells a significant percentage of its crude oil under evergreen contracts, which can be terminated by either party pursuant to a three-monthphase-out clause. In addition, PMI enters into agreements with various international customers, including those located in the United States, Europe, India, China and Japan. PMI’s crude oil exports are sold on aFree On Board (FOB) basis.
In total, we exported 1.2 million barrels of crude oil per day in 2016. In 2017, we expect to export approximately 869 thousand barrels of crude oil per day.
The following table sets forth the average volume of our exports and imports of crude oil, natural gas and petroleum products for the five years ended December 31, 2016.
Volume of Exports and Imports
| | | | | | | | | | | | | | | | | | | | | | | | |
| | | Year ended December 31, | | | 2016
vs. 2015 | |
| | | 2012 | | | 2013 | | | 2014 | | | 2015 | | | 2016 | | |
| | | (in thousands of barrels per day, except as noted) | | | (%) | |
Exports | | | | | | | | |
Crude Oil: | | | | | | | | | | | | | | | | | | | | | | | | |
Olmeca | | | 193.7 | | | | 98.6 | | | | 91.2 | | | | 124.2 | | | | 108.0 | | | | (13.0 | ) |
Isthmus | | | 99.4 | | | | 102.7 | | | | 133.7 | | | | 194.0 | | | | 152.7 | | | | (21.3 | ) |
Maya | | | 943.7 | | | | 967.6 | | | | 887.1 | | | | 743.4 | | | | 864.9 | | | | 16.3 | |
Altamira | | | 18.8 | | | | 19.9 | | | | 27.2 | | | | 27.8 | | | | 23.6 | | | | (15.1 | ) |
Talam | | | — | | | | — | | | | 3.0 | | | | 83.1 | | | | 45.2 | | | | (45.6 | ) |
| | | | | | | | | | | | | | | | | | | | | | | | |
Total crude oil | | | 1,255.5 | | | | 1,188.8 | | | | 1,142.2 | | | | 1,172.4 | | | | 1,194.4 | | | | 1.9 | |
Natural gas(1) | | | 0.9 | | | | 3.1 | | | | 4.1 | | | | 2.8 | | | | 2.2 | | | | (21.4 | ) |
Gasoline | | | 69.4 | | | | 66.8 | | | | 66.0 | | | | 62.9 | | | | 52.7 | | | | (16.2 | ) |
Other petroleum products | | | 83.5 | | | | 97.7 | | | | 135.3 | | | | 130.8 | | | | 132.8 | | | | 1.5 | |
Petrochemical products(2)(3) | | | 1,344.7 | | | | 1,336.9 | | | | 488.0 | | | | 333.8 | | | | 124.7 | | | | (62.6 | ) |
Imports | | | | | | | | | | | | | | | | | | | | | | | | |
Natural gas(1) | | | 1,089.3 | | | | 1,175.4 | | | | 1,250.4 | | | | 1,415.8 | | | | 1,933.9 | | | | 36.6 | |
Gasoline | | | 396.3 | | | | 375.2 | | | | 389.7 | | | | 440.1 | | | | 510.8 | | | | 16.1 | |
Other petroleum products and LPG(1)(4) | | | 260.2 | | | | 220.5 | | | | 243.4 | | | | 299.8 | | | | 288.7 | | | | (3.7 | ) |
Petrochemical products(2)(5) | | | 445.1 | | | | 287.8 | | | | 332.7 | | | | 107.3 | | | | 278.2 | | | | 159.3 | |
89
Note: Numbers subject to adjustment because crude oil exports may be adjusted to reflect the percentage of water in each shipment.
| (1) | Numbers expressed in millions of cubic feet per day. |
| (2) | Thousands of metric tons. |
| (4) | In 2013, we began importing liquefied natural gas through Manzanillo. |
| (5) | Includes isobutane, butane andN-butane. |
Source: PMI operating statistics as of January 27, 2017, and Pemex Industrial Transformation.
Crude oil exports increased by 1.9% in 2016, from 1,172.4 thousand barrels per day in 2015 to 1,194.4 thousand barrels per day in 2016, mainly due to a 16.3% increase of exports of Maya crude oil, which was partially offset by a 21.3% decrease in exports of Isthmus crude oil and a 13.0% decrease in Olmeca crude oil export during 2016.
Natural gas imports increased by 36.6% in 2016, from 1,415.8 million cubic feet per day in 2015 to 1,933.9 million cubic feet per day in 2016, which includes imports of liquefied natural gas through Manzanillo. The decreased availability of wet gas and natural gas from our exploration and production segment’s fields made it necessary to increase natural gas imports. We exported 2.2 million cubic feet of natural gas per day in 2016, a decrease of 21.4% as compared to natural gas exports in 2015 of 2.8 million cubic feet per day, primarily as a result of a decrease in the temporary surplus of natural gas that was originally designated for domestic consumption and subsequently used for export.
In 2016, exports of petroleum products decreased by 8.1%, from 193.8 thousand barrels per day in 2015 to 185.5 thousand barrels per day in 2016, mainly due to a 16.2% decrease in the volume of exports of gasoline and an 8.6% decrease in the volume of sales of fuel oil. Imports of petroleum products increased by 8.1% in 2016, from 739.8 thousand barrels per day in 2015 to 799.5 thousand barrels per day in 2016, primarily due to an 18.6% increase in domestic demand for gasoline and a 29.3% increase in domestic demand for diesel.
P.M.I. Trading, Ltd. sells refined and petrochemical products on anFOB,DeliveredEx-ship andCost and Freight basis and buys refined and petrochemical products on anFOB,Cost and Freight andDelivered Ex-ship orDelivery at Frontier basis.
The following table sets forth the value of exports and imports of crude oil, natural gas and petroleum products for the five years ended December 31, 2016.
Value of Exports and Imports(1)
| | | | | | | | | | | | | | | | | | | | | | | | |
| | | Year ended December 31, | | | 2016
vs. 2015 | |
| | | 2012 | | | 2013 | | | 2014 | | | 2015 | | | 2016 | | |
| | | (in millions of U.S. dollars) | | | (%) | |
Exports | | | | | | | | | | | | | | | | | | | | | | | | |
Olmeca | | U.S.$ | 7,753.7 | | | U.S.$ | 3,883.9 | | | U.S.$ | 3,114.7 | | | U.S.$ | 2,333.1 | | | U.S.$ | 1,569.4 | | | | (32.7 | ) |
Isthmus | | | 3,904.4 | | | | 3,925.7 | | | | 4,557.1 | | | | 3,489.0 | | | | 2,107.6 | | | | (39.6 | ) |
Altamira | | | 661.6 | | | | 683.7 | | | | 806.8 | | | | 366.8 | | | | 262.7 | | | | (28.4 | ) |
Maya | | | 34,532.7 | | | | 34,217.9 | | | | 27,119.4 | | | | 11,158.8 | | | | 11,168.3 | | | | 0.1 | |
Talam | | | — | | | | — | | | | 40.4 | | | | 1,103.6 | | | | 467.2 | | | | (57.7 | ) |
Total crude oil(2) | | U.S.$ | 46,852.3 | | | U.S.$ | 42,711.3 | | | U.S.$ | 35,638.4 | | | U.S.$ | 18,451.2 | | | U.S.$ | 15,575.2 | | | | (15.6 | ) |
Natural gas | | | 0.6 | | | | 2.8 | | | | 4.8 | | | | 1.6 | | | | 1.1 | | | | (31.3 | ) |
Gasoline | | | 2,257.4 | | | | 2,162.5 | | | | 1,985.9 | | | | 1,007.4 | | | | 733.2 | | | | (27.2 | ) |
Other petroleum products | | | 3,280.6 | | | | 3,654.7 | | | | 3,885.8 | | | | 1,984.8 | | | | 1,161.9 | | | | (41.4 | ) |
Petrochemical products | | | 362.9 | | | | 234.0 | | | | 166.9 | | | | 63.5 | | | | 20.5 | | | | (67.7 | ) |
| | | | | | | | | | | | | | | | | | | | | | | | |
Total natural gas, petroleum and petrochemical products | | U.S.$ | 5,901.5 | | | U.S.$ | 6,054.0 | | | U.S.$ | 6,040.3 | | | U.S.$ | 3,057.3 | | | U.S.$ | 1,916.7 | | | | (37.3 | ) |
| | | | | | | | | | | | | | | | | | | | | | | | |
Total exports | | U.S.$ | 52,753.8 | | | U.S.$ | 48,765.3 | | | U.S.$ | 41,681.8 | | | U.S.$ | 21,508.5 | | | U.S.$ | 17,491.9 | | | | (18.7 | ) |
| | | | | | | | | | | | | | | | | | | | | | | | |
90
| | | | | | | | | | | | | | | | | | | | | | | | |
| | | Year ended December 31, | | | 2016
vs. 2015 | |
| | | 2012 | | | 2013 | | | 2014 | | | 2015 | | | 2016 | | |
| | | (in millions of U.S. dollars) | | | (%) | |
Imports | | | | | | | | | | | | | | | | | | | | | | | | |
Natural gas | | U.S.$ | 1,216.2 | | | U.S.$ | 2,495.3 | | | U.S.$ | 2,819.3 | | | U.S.$ | 1,673.6 | | | U.S.$ | 2,097.9 | | | | 25.4 | |
Gasoline | | | 19,144.0 | | | | 17,485.9 | | | | 16,691.2 | | | | 12,805.2 | | | | 11,994.8 | | | | (6.3 | ) |
Other petroleum products and LPG | | | 10,486.9 | | | | 8,220.3 | | | | 8,775.8 | | | | 6,178.6 | | | | 5,689.5 | | | | (7.9 | ) |
Petrochemical products | | | 526.9 | | | | 322.3 | | | | 373.3 | | | | 196.3 | | | | 85.5 | | | | (56.4 | ) |
| | | | | | | | | | | | | | | | | | | | | | | | |
Total imports | | U.S.$ | 31,374.0 | | | U.S.$ | 28,523.8 | | | U.S.$ | 28,659.6 | | | U.S.$ | 20,853.7 | | | U.S.$ | 19,867.7 | | | | (4.7 | ) |
| | | | | | | | | | | | | | | | | | | | | | | | |
Net exports (imports) | | U.S.$ | 21,379.8 | | | U.S.$ | 20,241.5 | | | U.S.$ | 13,022.2 | | | U.S.$ | 654.8 | | | U.S.$ | (2,375.8 | ) | | | (2.6 | ) |
| | | | | | | | | | | | | | | | | | | | | | | | |
Note: Numbers may not total due to rounding.
| (1) | Does not include crude oil, refined products and petrochemicals purchased by P.M.I. Trading, Ltd. or P.M.I. Norteamérica, S.A. de C.V. from third parties outside of Mexico and resold in the international markets. The figures expressed in this table differ from the amounts contained under the line item “Net Sales” in our financial statements because of differences in methodology associated with the calculation of the exchange rates and other minor adjustments. |
| (2) | Crude oil exports are subject to adjustment to reflect the percentage of water in each shipment. |
Source: PMI operating statistics as of January 27, 2017, which are based on information in bills of lading, and Pemex Industrial Transformation.
Imports of natural gas increased in value by 25.4% during 2016, primarily as a result of an increase in domestic demand for natural gas and an increase in natural gas prices. Imports of gasoline decreased in value by 6.3%, despite a 16.1% increase in volume of domestic gasoline sales, due to a decrease in the average sales price of gasoline.
The following table describes the composition of our exports and imports of selected refined products in 2014, 2015 and 2016.
Exports and Imports of Selected Petroleum Products
| | | | | | | | | | | | | | | | | | | | | | | | |
| | | Year ended December 31, | |
| | | 2014 | | | 2015 | | | 2016 | |
| | | (tbpd) | | | (%) | | | (tbpd) | | | (%) | | | (tbpd) | | | (%) | |
Exports | | | | | | | | | | | | | | | | | | | | | | | | |
Liquefied petroleum gas(2) | | | 1.3 | | | | 0.7 | | | | — | | | | — | | | | 4.5 | | | | 2.4 | |
Fuel oil | | | 123.6 | | | | 63.9 | | | | 123.9 | | | | 64.0 | | | | 113.3 | | | | 61.1 | |
Gasoline | | | 66.0 | | | | 34.1 | | | | 62.9 | | | | 32.5 | | | | 52.7 | | | | 28.4 | |
Others | | | 3.2 | | | | 1.3 | | | | 6.9 | | | | 3.6 | | | | 15.0 | | | | 8.1 | |
| | | | | | | | | | | | | | | | | | | | | | | | |
Total | | | 193.5 | | | | 100.0 | % | | | 193.7 | | | | 100.0 | % | | | 185.5 | | | | 100.0 | % |
| | | | | | | | | | | | | | | | | | | | | | | | |
Imports | | | | | | | | | | | | | | | | | | | | | | | | |
Gasoline(3) | | | 389.7 | | | | 57.8 | | | | 440.1 | | | | 59.5 | | | | 510.8 | | | | 63.9 | |
Fuel oil | | | 13.0 | | | | 2.0 | | | | 17.0 | | | | 2.3 | | | | 10.7 | | | | 1.3 | |
Liquefied petroleum gas(2) | | | 84.6 | | | | 13.2 | | | | 105.2 | | | | 14.2 | | | | 50.6 | | | | 6.3 | |
Diesel | | | 132.9 | | | | 20.8 | | | | 145.3 | | | | 19.6 | | | | 187.8 | | | | 23.5 | |
Others | | | 39.7 | | | | 6.2 | | | | 32.4 | | | | 4.4 | | | | 39.6 | | | | 5.0 | |
| | | | | | | | | | | | | | | | | | | | | | | | |
Total | | | 633.1 | | | | 100.0 | % | | | 739.8 | | | | 100.0 | % | | | 799.5 | | | | 100.0 | % |
| | | | | | | | | | | | | | | | | | | | | | | | |
| Notes: | Numbers may not total due to rounding. |
| tbpd | = thousand barrels per day. |
| (1) | Includes gasoline and blendstock. |
| (3) | Includes aviation gasoline, vacuum as oil, isobutanes, naphthas and jet fuel. |
Source: Pemex BDI.
91
Exports of petroleum products decreased in value by 36.7% in 2016, primarily due to a 33.4% decrease in sales of fuel oil and decreases in the prices of petroleum products. In 2016, imports of petroleum products decreased in value, by 7.9%, despite an 8.1% increase in volume, primarily due to increased domestic demand for regular gasoline, which decreased the average price of gasoline as compared to prior years. Our net imports of petroleum products for 2016 totaled U.S. $3,794.4 million, which represents a 19.1% increase from our net imports of petroleum products of U.S. $3,186.4 million in 2015.
For the three years ended December 31, 2016, our exports and imports of selected petrochemicals were as follows:
Exports and Imports of Selected Petrochemicals
| | | | | | | | | | | | | | | | | | | | | | | | |
| | | Year ended December 31, | |
| | | 2014 | | | 2015 | | | 2016 | |
| | | (tmt) | | | (%) | | | (tmt) | | | (%) | | | (tmt) | | | (%) | |
Exports(1) | | | | | | | | | | | | | | | | | | | | | | | | |
Sulfur | | | 335.6 | | | | 68.8 | | | | 270.6 | | | | 81.1 | | | | 86.5 | | | | 69.4 | |
Butadien | | | 41.8 | | | | 8.6 | | | | 41.1 | | | | 12.3 | | | | 35.9 | | | | 28.8 | |
Ethylene | | | 15.6 | | | | 3.2 | | | | 1.5 | | | | 0.4 | | | | — | | | | — | |
Polyethylenes | | | 23.9 | | | | 4.9 | | | | 11.0 | | | | 3.3 | | | | 1.7 | | | | 1.3 | |
Others | | | 71.1 | | | | 14.6 | | | | 9.6 | | | | 2.9 | | | | 0.6 | | | | 1.3 | |
| | | | | | | | | | | | | | | | | | | | | | | | |
Total | | | 488.0 | | | | 100.0 | % | | | 333.8 | | | | 100.0 | % | | | 124.7 | | | | 100.0 | % |
| | | | | | | | | | | | | | | | | | | | | | | | |
Imports(2) | | | | | | | | | | | | | | | | | | | | | | | | |
Ammonia | | | — | | | | — | | | | 33.0 | | | | 30.7 | | | | 234.9 | | | | 84.4 | |
Methanol | | | 50.1 | | | | 15.1 | | | | 30.0 | | | | 23.3 | | | | 43.3 | | | | 15.6 | |
Isobutane-butane-hexane-1 | | | 228.7 | | | | 68.7 | | | | — | | | | — | | | | — | | | | — | |
Xylenes | | | 3.0 | | | | 0.9 | | | | 3.0 | | | | 2.8 | | | | — | | | | — | |
Toluene | | | 10.5 | | | | 3.2 | | | | 25.0 | | | | 23.3 | | | | — | | | | — | |
Others | | | 40.4 | | | | 12.1 | | | | 21.3 | | | | 19.8 | | | | — | | | | — | |
| | | | | | | | | | | | | | | | | | | | | | | | |
Total | | | 332.7 | | | | 100.0 | % | | | 107.3 | | | | 100. | % | | | 278.2 | | | | 100.0 | % |
| | | | | | | | | | | | | | | | | | | | | | | | |
| Notes: | Numbers may not total due to rounding. |
| tmt | = thousand metric tons. |
| (1) | Exports include propylene. |
| (2) | Imports include isobutane, butane andN-butane. |
Source: Pemex BDl.
In 2016, our exports of petrochemical products decreased by 209.9 thousand metric tons, from 333.8 thousand metric tons in 2015 to 124.7 thousand metric tons in 2016. Our imports of petrochemical products increased by 170.9 thousand metric tons, from 107.3 thousand metric tons in 2015 to 278.2 thousand metric tons in 2016. Petrochemical exports decreased in 2016, mainly due a 68.0% decrease in sales of sulfur and 9.4% decrease in sales of polyethylenes. Imports of petrochemical products increased in 2016, primarily due to higher demand for methanol.
Supply Commitments
We sell crude oil through a variety of contracts, some of which specify the delivery of a fixed and determinable quantity of crude oil. As of the date of this report, we are party to the following long-term crude oil supply agreements:
| | • | | An agreement executed on May 1, 1999, among Pecten Trading Company, which is a trading subsidiary of Shell Oil Company, and P.M.I. Norteamérica, S.A. de C.V., to supply the Deer Park refinery joint venture with a total of approximately 200 thousand barrels per day of Maya crude oil. |
92
| | Effective May 2008, this agreement was amended to reduce the supply to approximately 170 thousand barrels per day of Maya crude oil from May 2008 to March 2023 (when the agreement expires). In addition, PMI has agreed to supply additional volume depending on the availability of Maya crude oil. The additional volume is revised frequently, taking into account the refinery’s needs, as well as PMI’s available supply. In 2012 and 2013, PMI provided an additional 30 thousand barrels per day of Maya crude oil, increasing the total volume supplied during this period to 200 thousand barrels per day. For the period from January 2014 through December 31, 2017, the total volume to be supplied has been reduced to 170 thousand barrels per day. |
| | • | | An agreement executed on May 1, 2012, with Chevron Products Company, a division of Chevron U.S.A. Inc., to supply its refinery in Pascagoula, Mississippi with approximately 95 thousand barrels per day of Maya crude oil for a period of three years. On May 1, 2015, this agreement was extended for three additional years, however, our supply commitment was decreased to approximately 51 thousand barrels per day of Maya crude oil. |
| | • | | An agreement executed on January 1, 2014, with Valero Marketing and Supply Company Co., a subsidiary of Valero Energy Corp., to supply its refineries in the United States with approximately 80 thousand barrels per day of Maya crude oil for a period of four years, with an option to extend this agreement subject to the express agreement of both parties. Our supply commitment under this agreement increased in 2016 to 87 thousand barrels per day of Maya crude oil. |
| | • | | An agreement executed in January 2013 and extended on October 20, 2014 with Unipec America, Inc., acting on behalf of Unipec Asia Co., Ltd., a branch of China International United Petroleum & Chemicals Co. Ltd., which is a subsidiary of SINOPEC, to export crude oil to China. Under this agreement, we exported 500 thousand barrels of Maya crude oil each month until July 2016, for an aggregate amount of 22 million barrels of crude oil exports. In July 2016, this agreement was extended until June 2017. This agreement is limited to the specific purpose of establishing the terms for our crude oil exports to China. |
| | • | | Two agreements with Houston Refining LP, one executed on February 1, 2011 and amended on January 1, 2015, and the other executed on January 1, 2014 and amended on July 1, 2015. Under each agreement, PMI has agreed to export 36 thousand barrels per day of Maya crude oil over a period of two years. |
| | • | | The remainder of our supply agreements were entered into with four different customers and require that we deliver a total of 57 thousand barrels per day of crude oil during 2017. |
We expect to fulfill the majority of these supply commitments with both proved developed and proved undeveloped reserves.
In addition to these agreements, PMI has automatic renewal contracts and occasional contracts with many other customers around the world, including the United States, Europe, India, China, South Korea and Japan. In total, we exported 1,194 thousand barrels per day of crude oil in 2016. During 2017, we expect to export approximately 869 thousand barrels per day of crude oil.
The Secretary of Energy has entered into certain agreements to reduce or increase crude oil exports. See “Item 4—Information on the Company—Trade Regulation and Export Agreements” below in this Item 4.
Hedging Operations
P.M.I. Trading, Ltd. engages in hedging operations to cover its price exposure in the trading of petroleum products. The internal policies and procedures of P.M.I. Trading, Ltd. establish: (1) that DFIs are used exclusively to mitigate the volatility of oil and gas prices; (2) limits on the maximum amount of capital at risk and on the daily and accumulated annual losses for each business unit; and (3) the segregation of risk-taking and
93
risk measurement. Capital at risk is calculated on a daily basis in order to compare the actual figures with the aforementioned limit. P.M.I. Trading, Ltd. has a risk management subcommittee that reviews risk and hedging operations and meets on a quarterly basis. See “Item 11—Quantitative and Qualitative Disclosures about Market Risk—Changes in Exposure to Main Risks—Hydrocarbon Price Risk.”
Gas Stations in the United States
On December 3, 2015, we announced our initiative to open gas stations in the United States by opening five gas stations that will be owned and operated by franchisees in Houston, Texas. This is part of our strategy to expand our operations to the United States in order to fulfill the energy reform mandate to generate economic value in international markets. Further, it will allow us to measure the impact of our brand against others and identify business opportunities abroad. The gas stations’ fuel supply is derived from the United States wholesale market and selling prices are subject to local market conditions. As of the date of this report, all five of these gas stations have commenced operations.
PEMEX Corporate Matters
In addition to the operating activities that we undertake through the activities of our subsidiary entities and subsidiary companies, we have certain centralized corporate operations that coordinate general labor, safety, insurance and legal matters.
Industrial Safety and Environmental Protection
Our Corporate Office of Planning, Coordination and Performance is responsible for planning, conducting and coordinating programs to:
| | • | | foster a company culture of safety and environmental protection; |
| | • | | improve the safety of our workers and facilities; |
| | • | | reduce risks to residents of the areas surrounding our facilities; and |
| | • | | reduce greenhouse gas emissions and identify the risks associated with climate change in Mexico in order to develop strategies to minimize the impact of climate change on our operations. |
We intend to further develop industrial safety and environmental programs for each subsidiary entity. The environmental and safety division of each subsidiary entity coordinates closely with the Corporate Office of Planning, Coordination and Performance.
Insurance
We maintain a comprehensive property and general liability insurance program for onshore and offshore properties and liabilities. All onshore properties, such as refineries, processing plants, pipelines and storage facilities are covered, as are all of our offshore assets, such as drilling platforms, rigs, gas gathering systems, maritime terminals and production facilities. Our insurance covers risks of sudden and accidental physical damage to or destruction of our properties, as well as risk of sudden and accidental physical loss, including as a consequence of purposeful terrorist acts. This insurance also provides coverage for the contents of pipelines and storage facilities, and any of our liabilities arising from such acts. Our insurance also covers extraordinary costs related to the operation of offshore wells, such as control andre-drilling costs, evacuation expenses and liability costs associated with spills. We also maintain protection and indemnity insurance for our full marine fleet, in addition to life insurance, automobile and heavy equipment insurance, cargo and marine hull insurance, as well as insurance for deep water drilling activities and onshore and offshore construction risks.
In accordance with Mexican law, we have entered into all of our insurance contracts with Mexican insurance carriers. These policies have limits of U.S. $1.8 billion for onshore property, U.S. $1.3 billion for offshore property, U.S. $0.3 billion for extraordinary costs related to the operation of offshore wells, U.S.
94
$1.0 billion for marine-related liabilities, U.S. $1.1 billion for onshore and offshore liabilities, U.S. $0.5 billion for offshore terrorist acts and U.S. $0.5 billion for onshore terrorist acts. Limits of insurance policies purchased for each category of risk are determined using professional risk management assessment surveys conducted by international companies on an annual basis and the market capacity available per risk, and must be in compliance with local regulations enacted following the energy reform.
Since June 2003, we have not maintained business interruption insurance, which in the past compensated us for loss of revenues resulting from damages to our facilities. We have discontinued such insurance based on the following factors: (1) the existence of mitigating factors across all of our facilities, (2) the nature and operation of our facilities, such as the ability of any of our six refineries to compensate for the loss of one refinery and the physical separation of plants within the refineries, and (3) the excess processing capacity available across our different lines of business,vis-à-vis the restricted coverage available in the international reinsurance markets. These factors led us to conclude that the benefits of this type of coverage were outweighed by the costs. Instead, we purchasead-hoc business interruption mitigation insurance coverage, which compensates us for the additional expenses necessary to recover our production capabilities in the shortest time possible.
During 2016 we continued to engage in deep water exploratory and drilling activities that were covered by our existing insurance program. In August 2012, we purchased a policy to increase the coverage available for potential property damage, third-party liability and control of well risks related to these activities. Under this policy, we maintain coverage for each deep water well drilled, and the limits are determined based on the risk profile of the corresponding well. This policy has a limit of U.S. $3.3 billion, including U.S. $1.3 billion for control of well risks, U.S. $1.1 billion for casualty and U.S. $0.9 billion for property damage. This policy also contemplates additional coverage for environmental liabilities and remediation activities relating to deep water exploration and drilling.
All of our insurance policies are in turn reinsured through Kot Insurance Company, AG (which we refer to as Kot AG). Kot AG is a wholly owned subsidiary company that was originally formed in 1993 under the laws of Bermuda as Kot Insurance Company, Ltd. and was subsequently organized under the laws of Switzerland in 2004. Kot AG is used as a risk management tool to structure and distribute risks across the international reinsurance markets. The purpose of Kot AG is to reinsure policies held through our local insurance carriers and maintain control over the cost and quality of the insurance covering our risks. Kot AG reinsures over 95% of its reinsurance policies with unaffiliated third-party reinsurers. Kot AG carefully monitors the financial performance of its reinsurers and actively manages counterparty credit risk across its reinsurance portfolio to ensure its own financial stability and maintain its creditworthiness. Kot AG maintains solid capitalization and solvency margins consistent with guidelines provided by Swiss insurance authorities and regulations. As of December 31, 2016, Kot AG’s net risk retention is capped at U.S. $180 million, of which U.S. $150 million corresponds to property and liabilities, and is spread across different reinsurance coverage to mitigate potential aggregation factors.
Investment in Repsol
As of December 31, 2016, we owned a total of 22,221,893 shares of Repsol, S.A. (formerly known as Repsol YPF, S.A., and which we refer to as Repsol), which represents approximately 1.5% of Repsol’s total shares. We recorded the 22,221,893 Repsol shares that we hold as“available-for-sale-non-current asset” investments and valued them, as of December 31, 2016, at Ps. 6,463.1 million. As of December 31, 2015, our investment in 20,724,331 shares of Repsol, approximately 1.5% of Repsol’s total shares, was valued at Ps. 3,944.7 million. As described in Note 10 to our consolidated financial statements, we recorded the effect of the valuation of the investment at fair value as a loss of Ps. 3,206.3 million and a profit of Ps. 207,816 in the consolidated statements of changes in equity (deficit) for the years ended December 31, 2015 and 2016, respectively. See Note 10 to our consolidated financial statements included herein.
On August 4, 2015, P.M.I. Holdings, B.V. obtained a loan for U.S. $250.0 million, which bears interest at a rate of 1.79% and is collateralized by all of our Repsol shares. This loan is due to mature in 2018.
95
Ethics Committee
Our Ethics Committee consists of members from our management team, with the head of our Institutional Internal Control Unit serving as its chairman. Among other duties, the Ethics Committee is responsible for regulating and promoting the enforcement of our code of ethics and our code of conduct, as well as promoting corporate strategies that are designed to foster a culture of ethics and integrity. See “Item 16B—Code of Ethics” for more information regarding our code of ethics.
Our Ethics Committee is responsible for:
| | • | | promoting awareness and use of our code of ethics and code of conduct, including through online training available for our employees, in order to improve our culture of ethics; |
| | • | | establishing procedures that implement the principles found in our code of ethics in order to increase compliance and to detect behavior that adversely affects our activities; |
| | • | | working with the Liabilities Unit of Petróleos Mexicanos and our Internal Auditing Area to exchange information regarding violations of our code of ethics and our code of conduct. |
Collaboration and Other Agreements
On April 10, 2014, Petróleos Mexicanos signed a memorandum of understanding with TOTAL, a French company, to establish a framework for cooperation in the exchange of experience, knowledge and best practices related to upstream activities and scientific, administrative and technical matters, as well as the development of a sustainable energy sector.
On April 10, 2014, Petróleos Mexicanos signed a memorandum of understanding with GDF Suez, a French company, to establish terms for technical cooperation and the exchange of knowledge and experience related to energy efficiency, water treatment and natural gas projects, among others.
On September 25 and 26, 2014 at the World National Oil Companies Congress, Petróleos Mexicanos signed a memorandum of understanding with each of: (1) Petronas and YPF SA, (2) BHP Billiton and (3) Oil and Natural Gas Corporation Limited, through which the parties indicated their intent to analyze business opportunities in deep water, mature fields and heavy and extra-heavy crude oil, assess natural gas infrastructure and exchange best practices for sustainable development, environmental protection and exploration and production activities.
On October 2, 2014, Petróleos Mexicanos and Exxon Mobil signed a memorandum of understanding with the aim of identifying business opportunities in exploration, production and industrial transformation processes with a focus on sustainable development and environmental stewardship, as well as exchanging best practices for the development of human resources and industrial safety.
On October 17, 2014, Petróleos Mexicanos and Pacific Rubiales signed a memorandum of understanding to identify opportunities for collaboration in exploration and production activities, hydrocarbons transportation, electricity generation and the exchange of best practices for industrial safety training andhealth-at-work initiatives.
On October 26, 2014, Petróleos Mexicanos and Chevron signed a memorandum of understanding with the aim of establishing opportunities for cooperation in mutually beneficial projects related to deep water, heavy crude oil and the revitalization of mature fields, among other things. This memorandum of understanding also lays the foundation for collaboration in connection with natural gas production, refining and fuel distribution and carbon-dioxide emissions reduction.
On October 29, 2014, Petróleos Mexicanos, through PMI, and Kuwait Foreign Petroleum Exploration Company signed a memorandum of understanding to share technical and commercial information for the evaluation and development of joint business opportunities in oil and gas exploration and production, both in Mexico and abroad.
96
On October 30, 2014, Petróleos Mexicanos and Eni S.p.A., an Italian oil and gas company, signed a memorandum of understanding to identify opportunities for collaboration in exploration and refining activities, natural gas and petrochemical production, technological development, emissions reduction, as well as the exchange of best practices for the development of human capital.
On November 13, 2014, Petróleos Mexicanos and CNOOC, a Chinese state-owned oil and gas company, the China Development Bank and the Industrial and Commercial Bank of China signed memoranda of understanding which intend to, among other things, encourage cooperation among the parties with respect to technical, human resources and financial matters.
On December 4, 2014, Petróleos Mexicanos and Reliance Industries Limited, an Indian oil and gas company, signed a memorandum of understanding to collaborate in the development of new technologies and human resources. This memorandum of understanding also lays the foundation for collaboration and the possibility of joint business opportunities in exploration, production, refining and downstream activities.
On February 5, 2015, Petróleos Mexicanos and theInstituto Politécnico Nacional (National Polytechnic Institute) of Mexico entered into a collaboration agreement for the development of human resources, technology and research, with the aim of promoting and supporting joint research programs and the development of knowledge related to the hydrocarbons industry.
On February 18, 2015, Petróleos Mexicanos and the Organisation for EconomicCo-operation and Development (OECD) signed a memorandum of understanding with the aim of benefiting from the OECD’s knowledge of and experiences with international best practices relating to the procurement of goods and services.
On February 19, 2015, Petróleos Mexicanos signed a memorandum of understanding with the Infraestructura Energética Nova, S.A.B. de C.V. and Sempra LNG units of the U.S. energy company Sempra Energy for the potential joint development of a natural gas liquefaction project at the site of the Energía Costa Azul facility located in Ensenada, Mexico.
On April 7, 2015, Petróleos Mexicanos and First Reserve signed a memorandum of understanding and cooperation to explore new opportunities for joint energy projects, which would provide access to financing, as well as the exchange of technical and operational experience. This agreement contemplates up to U.S. $1.0 billion of investments in potential projects relating to infrastructure, maritime transport and power cogeneration, among others.
On May 12, 2015, Petróleos Mexicanos and Global Water Development Partners, a company founded by private equity funds operated by Blackstone, signed a memorandum of understanding with the aim of creating a partnership to invest in water and wastewater infrastructure for Petróleos Mexicanos’ upstream and downstream facilities. This partnership is intended to finance and carry out environmentally sustainable projects for water treatment in Petróleos Mexicanos’ operations.
On May 12, 2015, PMX Cogeneración, S.A.P.I. de C.V., an affiliate of Petróleos Mexicanos, signed a memorandum of understanding with the consortium formed by Enel S.p.A., an Italian renewable energy company, and Abengoa, S.A., a Spanish renewable energy company, to develop a cogeneration power plant to generate and supply clean energy to the Antonio Dovali Jaime refinery in Salina Cruz, as well as the Mexican national grid.
On June 1, 2015, Petróleos Mexicanos and the U.S. based global asset manager BlackRock Inc. signed a memorandum of understanding with the aim of accelerating the development and financing of energy-related infrastructure projects that are of strategic importance to Petróleos Mexicanos.
On July 20, 2015, Petróleos Mexicanos, through its Corporate Office of Procurement and Supply, signed an agreement with the OECD with the aim of adopting and promoting best practices in procurement and fostering
97
efficient management strategies and transparency in Petróleos Mexicanos’ processes. The agreement also contemplates the training of our personnel by the OECD on issues of transparency and ethics, the design of procurement procedures and mitigating risks of collusion.
On July 22, 2015, Petróleos Mexicanos and theSecretaría de Desarrollo Agrario, Territorial y Urbano (Ministry of Agriculture, Land and Urban Development) signed a collaboration agreement with the aim of establishing consulting and training mechanisms for the development of hydrocarbon exploration, extraction and distribution projects in strict observance of the applicable legal framework and with full respect for agricultural landowners.
On July 23, 2015, Petróleos Mexicanos and the Instituto Tecnológico y de Estudios Superiores de Monterrey, A.C. signed a collaboration agreement with the purpose of (1) fostering competitive development within the Mexican oil and gas industry; (2) carrying out specialized research and consulting services, including lectures, seminars, conferences and other events of common interest to the institutions; and (3) providing postgraduate studies for our employees and internships for college students at Petróleos Mexicanos.
On July 28, 2015, Petróleos Mexicanos and Banco Santander, S.A. (Santander) signed a collaboration agreement with the purpose of providing our franchisees with access to Santander banking services such as bank card sales, deposits ande-banking services, payroll management and the transportation of money.
On September 9, 2015, Petróleos Mexicanos and General Electric signed a memorandum of understanding with the aim of creating a partnership to invest in new technology and financing initiatives for gas compression, power generation and the production of hydrocarbons, both onshore and offshore, including in deepwater fields.
On October 7, 2015, Petróleos Mexicanos, through its subsidiary Pemex Cogeneration and Services, and Dominion Technologies signed a memorandum of understanding to form a company aimed at the joint implementation of cogeneration projects.
On October 10, 2015, Petróleos Mexicanos and the United Nations Development Programme in Mexico reaffirmed their commitment to use best practices in terms of inclusion, equality andnon-discrimination in the workplace.
On November 30, 2015, Petróleos Mexicanos and Global Water Development Partners agreed to create a joint venture intended to invest approximately U.S. $800 million in water and wastewater treatment infrastructure for upstream and downstream facilities in Mexico. This partnership aims to (1) provide access to advanced technology to meet the supply and treatment requirements of wastewater at our facilities, in both onshore and offshore production areas, as well as in refineries and petrochemical plants; and (2) in the future, to potentially implement and finance environmentally sustainable solutions for water management.
On January 19, 2016, Petróleos Mexicanos and Mubadala Petroleum signed a memorandum of understating agreeing to joint projects to explore the Mexican energy sector, including its upstream activities, primary midstream activities and infrastructure projects for a total investment of approximately U.S. $4.0 billion. Among these projects is a commercial logistic infrastructure system in the Salina Cruz, Oaxaca area, for an approximate investment in excess of U.S. $3.0 billion.
On January 19, 2016, Petróleos Mexicanos and the Abu Dhabi National Oil Company signed a memorandum of understanding with the aim to share each company’s best practices with respect to different upstream activities, including exploration, development and production in oil fields; improved recovery, handling and processing of liquefied natural gas; as well as human resources training, sustainability, internal controls, transparency, process development and cyber-security.
On January 19, 2016, Petróleos Mexicanos and Saudi Aramco signed a memorandum of understanding renewing and strengthening the relationship between both companies and establishing an exchange of ideas
98
surrounding operational excellence, sustainability and energy efficiency, and innovation and technological development.
These broad agreements of technological and scientific collaboration are strictlynon-commercial,i.e., there is no transfer of resources among the parties.
Property, Plants and Equipment
General
Substantially all of our property, consisting of refineries, storage, production, manufacturing and transportation facilities and certain retail outlets, is located in Mexico, including Mexican waters in the Gulf of Mexico. The location, character, utilization and productive capacity of our exploration, drilling, refining, petrochemical production, transportation and storage facilities are described above. See “—Exploration and Production,” “—Drilling and Services,” “Industrial Transformation,” “—Ethylene,” “—Fertilizers,” “—Logistics” and “—Cogeneration and Services.” The insurance program covering all of our properties is also described above. See “—Insurance.”
Reserves
Under Mexican law, all crude oil and other oil and gas reserves located in the subsoil of Mexico are owned by the Mexican nation and not by us. The Mexican Government has granted us the right to exploit the petroleum and other oil and gas reserves assigned to us in connection with Round Zero, as well as the right to explore for and exploit petroleum and other oil and gas reserves in areas that have been granted to us in Round 1.4. Productive state-owned companies and other companies participating in the Mexican oil and gas industry may report assignments or contracts and the corresponding expected benefits for accounting and financial purposes. See “Information on the Company—History and Development—Energy Reform” above in this Item 4. Our estimates of hydrocarbons reserves are described under “—Exploration and Production—Reserves” above.
99
GENERAL REGULATORY FRAMEWORK
Petróleos Mexicanos is regulated by the Mexican Constitution, the Petróleos Mexicanos Law and the Hydrocarbons Law, among other regulations. The purpose of the Petróleos Mexicanos Law is to regulate the organization, management, operation, monitoring, evaluation and accountability of Petróleos Mexicanos as a productive-state owned company of the Mexican Government. On October 31, 2014, the Regulations to the Petróleos Mexicanos Law were published in the Official Gazette of the Federation. These regulations were modified on February 9, 2015. The purpose of these regulations is to regulate, among other things, the appointment and removal of the members of the Board of Directors of Petróleos Mexicanos, potential conflicts of interest for Board members, and the evaluation of Petróleos Mexicanos.
The Mexican Government and its ministries regulate our operations in the oil and gas sector. The Ministry of Energy monitors our operations, and the Secretary of Energy acts as the chairperson of the Board of Directors of Petróleos Mexicanos. In addition, theLey de los Órganos Reguladores Coordinados en Materia Energética (Coordinated Energy Regulatory Bodies Law related to the Energy Matters Law, which was enacted as part of the Secondary Legislation and took effect on August 12, 2014) establishes mechanisms for the coordination of these entities with the Ministry of Energy and other ministries of the Mexican Government. The NHC has the authority to award and execute contracts for exploration and production in connection with competitive bidding rounds. The Energy Regulatory Commission has the authority to grant permits for the storage, transportation and distribution of oil, gas, petroleum products and petrochemicals in Mexico, and to regulate the first-hand sale of these products. The regulatory powers of the NHC and the Energy Regulatory Commission extend to all oil and gas companies operating in Mexico, including Petróleos Mexicanos and our subsidiary entities.
On December 2, 2014, the Ministry of Energy published in the Official Gazette of the Federation a statement declaring that the new Board of Directors of Petróleos Mexicanos was performing its duties and the mechanisms for our oversight, transparency and accountability had been implemented in accordance with the Petróleos Mexicanos Law. As a result, the special regime that governs Petróleos Mexicanos’ activities relating to productive state-owned subsidiaries, affiliates, compensation, assets, administrative liabilities, budget, debt levels and the state dividend took effect. On June 10, 2015 the General Provisions for Contracting with Petróleos Mexicanos and its Productive State-Owned Subsidiaries were published in the Official Gazette of the Federation, and on June 11, 2015, the special regime for acquisitions, leases, services and public became effective. In accordance with the Petróleos Mexicanos Law, each year the Ministry of Finance and Public Credit provides us with estimated macroeconomic indicators for the following fiscal year, which we are to use to prepare the consolidated annual budget for Petróleos Mexicanos and the subsidiary entities, including our financing program. Upon approval by the Board of Directors of Petróleos Mexicanos, our consolidated budget and financing program is then submitted to the Ministry of Finance and Public Credit, which has the authority to adjust our financial balance goal and the ceiling on our wage and salary expenditures for the fiscal year. The consolidated annual budget and financing program of Petróleos Mexicanos and the subsidiary entities, including any adjustments made by the Ministry of Finance and Public Credit, is then incorporated into the federal budget for approval by the Chamber of Deputies. The Mexican Government is not, however, liable for the financial obligations that we incur. In approving the federal budget, the Chamber of Deputies authorizes our financial balance goal and the ceiling on our wage and salary expenditures for the fiscal year, which it may subsequently adjust at any time by modifying the applicable law.
The Superior Audit Office of the Federation, or the ASF, reviews annually theCuenta Pública(Public Account) of Mexican Government entities, including Petróleos Mexicanos and our subsidiary entities. This review focuses mainly on the entities’ compliance with budgetary benchmarks and budget and accounting laws. The ASF prepares reports of its observations based on this review. The reports are subject to our analysis and, if necessary, our clarification and explanation of any issues raised during the audit. Discrepancies in amounts spent may subject our officials to legal sanctions. However, in most instances, the observed issues are explained and clarified.
100
As an issuer of debt securities that are registered under the Securities Act and in connection with certain representations and covenants included in our financing agreements, we must comply with the U.S. Foreign Corrupt Practices Act, or the FCPA. The FCPA generally prohibits companies and anyone acting on their behalf from offering or making improper payments or providing benefits to government officials for the purpose of obtaining or keeping business. In addition, we are subject to other international laws and regulations related to anti-corruption, anti-bribery and anti-money laundering, including the U.K. Bribery Act 2010, which prohibits the solicitation of, the agreement to receive and the acceptance of bribes.
We are also subject to various domestic and international laws and regulations related to anti-corruption, anti-bribery and anti-money laundering. TheCódigo Penal Federal (Federal Criminal Code) criminalizes certain corrupt practices, including bribery, embezzlement and abuse of authority. TheLey Federal Anticorrupción en Contrataciones Públicas (Federal Law of Anti-Corruption in Public Contracting) sanctions companies and individuals that violate this law while participating in federal government contracting in Mexico, as well as Mexican companies and individuals engaged in international commercial transactions. This law is analogous in many respects to the FCPA. In addition, the Federal Law of Administrative Responsibilities of Public Officials prohibits the bribery of federal public officials in Mexico, including members of the Mexican Congress and the federal judiciary.
We also employ internal control procedures and guidelines designed to monitor the activities of our employees, including senior management, and to ensure compliance with applicable anti-corruption, anti-bribery and anti-money laundering laws and regulations. TheLineamientos que regulan el sistema de control interno en Petróleos Mexicanos, sus empresas productivas subsidiarias y empresas filiales (Guidelines governing the internal control system of Petróleos Mexicanos, its productive subsidiary entities and affiliates) set forth the principles underlying our internal controls system and the procedures necessary for its implementation and monitoring. In addition, theLineamientos para la participación de testigos sociales durante actividades de procura y abastecimiento y procedimiento de contratación de Petróleos Mexicanos y sus empresas productivas subsidiarias (Guidelines for the participation of public witnesses in the procurement and supply activities and contracting procedures of Petróleos Mexicanos, its productive subsidiary entities and affiliates), delineates the ways in which public witnesses may act as third-party observers in connection with our procurement procedures. These internal controls and guidelines are applicable to Petróleos Mexicanos and the subsidiary entities. For a description of the risks relating to anti-corruption, anti-bribery and anti-money laundering laws and regulations, see “Item 3—Key Information—Risk Factors—Risk Factors Related to our Operations—We are subject to Mexican and international anti-corruption, anti-bribery and anti-money laundering laws. Our failure to comply with these laws could result in penalties, which could harm our reputation, prevent us from obtaining governmental authorizations needed to carry out our operations and have an adverse effect on our business, results of operations and financial condition.”
On May 27, 2015 theDecreto mediante el cual se reformaron, adicionaron y derogaron diversas disposiciones de la Constitución Política de los Estados Unidos Mexicanos, en materia de combate a la corrupción (Decree that reformed, added to and repealed various provisions of the Mexican Constitution, related to combating corruption matters) was published in the Official Gazette of the Federation. Pursuant to this decree, theLey General del Sistema Nacional Anticorrupción (General Law of the National Anti-corruption System); theLey de Fiscalización y Rendición de Cuentas de la Federación (Federal Audit and Accountability Law); and theLey General de Responsabilidades Administrativas (General Law of Administrative Liabilities), among others, which were published in the Official Gazette of the Federation on July 18, 2016. Among other things, these laws establish a national anti-corruption system to coordinate efforts among the Mexican Government, federal entities, states and municipalities to prevent, investigate and punish corrupt activities and oversee public resources, as well as determine administrative liabilities of public officials and the applicable penalties. The Mexican Senate is to appoint the head of the Special Anti-Corruption Prosecutor’s Office, which was created to investigate and prosecute actions considered crimes of corruption.
101
ENVIRONMENTAL REGULATION
Legal Framework
We are subject to the environmental laws and regulations issued by the local and state governments where our facilities are located, including those associated with atmospheric emissions, water usage and wastewater discharge, as well as the management of hazardous andnon-hazardous waste. In particular, we are subject to the provisions of theLey General del Equilibrio Ecológico y la Protección al Ambiente (General Law on Ecological Equilibrium and Environmental Protection, which we refer to as the Environmental Law) and related regulations, theLey General de Cambio Climático (General Law on Climate Change) and other technical environmental standards issued by the Secretaría del Medio Ambiente y Recursos Naturales (Secretariat of the Environment and Natural Resources or SEMARNAT). We are also subject to theLey General para la Prevención y Gestión Integral de los Residuos (General Law on Waste Prevention and Integral Management),Ley para el Aprovechamiento de Energías Renovables y el Financiamiento de la Transición Energética (Law of Use of Renewable Energy and Financing of the Energy Transition), as well as theLey para el Aprovechamiento Sustentable de la Energía (Sustainable Use of Energy Law).
Before we carry out any activity that may have an adverse impact on the environment, we are required to obtain certain authorizations from the Hydrocarbons Industrial Safety and Environmental Protection Agency, the SEMARNAT, the Ministry of Energy, the National Water Commission and the Mexican Navy, as applicable. In particular, specific environmental regulations apply to petrochemical, crude oil refining and extraction activities, as well as to the construction of crude oil and natural gas pipelines. Before authorizing a new project, the Hydrocarbons Industrial Safety and Environmental Protection Agency requires the submission of an environmental impact analysis and any other information that it may request.
The Hydrocarbons Industrial Safety and Environmental Protection Agency is an administrative body of the SEMARNAT that operates with technical and administrative autonomy and has the authority to regulate and supervise companies participating in the oil and gas sector through its issuance of rules establishing safety standards, limits on greenhouse gas emissions and guidelines for the dismantling and abandonment of facilities, among other things. The Hydrocarbons Industrial Safety and Environmental Protection Agency provides that until the general administrative provisions and Official Mexican Standards proposed by the Hydrocarbons Industrial Safety and Environmental Protection Agency are in effect, obligations will continue under the guidelines, technical and administrative arrangements, agreements and Official Mexican Standards promulgated by the SEMARNAT, CNH and CRE.
The environmental regulations specify, among other matters, the maximum permissible levels of emissions and water discharge. These regulations also establish procedures for measuring pollution levels.
In April 1997, the SEMARNAT issued regulations governing the procedures for obtaining an environmental license, under which new industrial facilities can comply with all applicable environmental requirements through a single administrative procedure. Each environmental license integrates all of the different permits, licenses and authorizations related to environmental matters for a particular facility. Since these regulations went into effect, we have been required to obtain an environmental license for any new facility. Our facilities that existed prior to the effectiveness of these regulations are not subject to this requirement.
We are also subject to theNOM-001-SEMARNAT-1996 issued by CONAGUA in conjunction with theProcuraduría Federal de Protección al Ambiente(PROFEPA), which sets forth the maximum permissible levels of pollutants in wastewater that can be discharged into national bodies of water.
Federal and state authorities are authorized to inspect any facility to determine its compliance with the Environmental Law, local environmental laws, regulations and technical environmental regulations. Violations ornon-compliance with environmental standards and regulations may result in substantial fines, temporary or
102
permanent shutdown of a facility, required capital expenditures to minimize the effect of our operations on the environment, cleanup of contaminated soil and water, cancellation of a concession or revocation of an authorization to carry out certain activities and, in certain cases, criminal proceedings. See “Item 3—Key Information—Risk Factors—Risk Factors Related to Our Operations—Our compliance with environmental regulations in Mexico could result in material adverse effects on our results of operations.”
Mexico generally reviews and updates its environmental regulatory framework every five years, and we work with the Mexican Government to develop new environmental regulations of activities related to the oil and gas industry.
In August 2016, theNOM-016-CRE-2016 was published in the Official Gazette of the Federation, which establishes the petroleum products quality requirements, including a maximum sulfur content for diesel fuel of 15 Mg/kg, to be applicable throughout Mexico by December 31, 2018.
In November 2016, theNOM-014-CRE-2016 was published in the Official Gazette of the Federation, which establishes the ethane and propane quality requirements for ethylene production, as well as the grade mixture for propellant butanes, whether domestically produced or imported.
During 2016, the CNH updated the technical provisions for the use of natural gas in exploration and extraction activities and issued regulations for drilling, exploration and development. Also in 2016, theAgencia de Seguridad Energía y Ambiente (National Agency for Industrial Safety and Environmental Protection of the Hydrocarbons Sector, better known as the Agency for Safety, Energy and Environment, or ASEA) required that CONAGUA monitor water tables before we began drilling shale gas exploratory wells in the northern part of Veracruz and the southern part of Tamaulipas.
Climate Change
On June 6, 2012, the General Law on Climate Change was published in the Official Gazette of the Federation, with the objectives of regulating greenhouse gas emissions and reducing the vulnerability of Mexico’s infrastructure, population and ecosystems to the adverse effects of climate change. The General Law on Climate Change establishes a series of financial, regulatory and technical rules and regulations, as well as tools for strategy formation, evaluation and monitoring that form the framework for a comprehensive public policy on climate change.
Our Special Climate Change Program 2014-2018 aims to reduce greenhouse gas emissions, improve energy and operational efficiency, reduce gas flaring and promote the efficient use of gas, among other things. Pursuant to this program, in 2016, we began upgrading the Ing. Antonio Dovalí Jaime Refinery in Salina Cruz, Oaxaca to operate on cleaner natural gas. We also began the test period for a cogeneration project to increase energy efficiency at the Antonio M. Amor Refinery in Salamanca, Guanajuato. In addition, we launched our PEMEX Environmental Strategy 2016-2020, which incorporates our formerPlan de Acción Climática(Climate Action Plan), to identify action items, projects and best practices to mitigate the impact of our operations on climate change. These actions include the construction of infrastructure for transportation and gas management.
We also work with several national and international entities to develop and promote initiatives that mitigate the effects of climate change. For instance, we participate in the Climate and Clean Air Coalition (CCAC), which aims to substantially reduce emissions of climate pollutants. In compliance with CCAC criteria, we carried out inspections in our Dos Bocas, Cactus and Atasta facilities, and are working to mitigate the emissions identified in those inspections.
In accordance with the actions carried out by the Mexican Government to mitigate global climate change, we are implementing carbon capture, use and storage (CCUS) techniques. In 2014, the “Technology Route Map of CCUS in Mexico” was developed in conjunction with SENER, SEMARNAT and CFE. This led to the
103
execution of integrated carbon capture projects at PEMEX and CFE facilities and enhanced oil recovery (EOR) initiatives. In 2016, several tools were developed to evaluate the firstCCUS-EOR project in Mexico. This project included a plan to inject carbon dioxide produced at our Cosoleacaque Petrochemical Complex into the Brillante producing field at the Cinco Presidentes business unit.
During 2016, we recorded greenhouse gas emissions of approximately 57.9 million tons of carbon dioxide equivalent, which represented an 11.1% increase compared to 2015, mainly due to an increase in the dispatch of bitter gas into our burners in Kumaza, AbkatúnPol-Chuc and Litoral Tabasco, increase in dispatch of acid gas into our burners for maintenance activities in the sulfur plants at the Poza Rica, Ciudad Pemex and Nuevo Pemex Complexes and an increase in the volume of gas into our burners for maintenance issues in the sulfur plants in the Minatitlán and Salina Cruz refineries. Our gas usage level was 91.2% during 2016, as compared to 93.2% in 2015, due to field performance, volume of waste gas used in artificial pumping systems and variations and adjustments to the allocated budget.
In 2016, we continued to develop several conservation and reforestation projects designed to increase carbon capture and preserve the ecosystems in which we operate. Our biodiversity conservation efforts and indirect mitigation measures have been carried out through the following projects:
| | • | | Proyecto de Conservación, Manejo y Restauración de los Ecosistemas Naturales de la Cuenca Media del Río Usumacinta (Conservation, Management and Restoration Project of the Natural Ecosystems of the Rio Usumacinta Basin) in Chiapas; |
| | • | | Operación y manejo del corredor ecológico JATUSA (Operation and Management of the JATUSA Ecological Corridor) in the Jaguaroundi and Tuzandépetl ecologic parks, and the Santa Alejandrina swamp; |
| | • | | Educación Ambiental y Operación de la Casa del Agua, en los Pantanos de Centla (Environmental Education and Operation of the Casa del Agua in Pantanos de Centla) in Tabasco; |
| | • | | Educación Ambiental y Restauración Forestal en Áreas Naturales Protegidas del Golfo de México, Subregión Planicie Costera (Environmental Education and Reforestation in Protected Natural Areas of the Gulf of MexicoSub-region Coastal Plain); |
| | • | | Sistematización e integración de datos de registros de aves de la Reserva de la Biosfera de Calakmul (Systematization and Integration of Data from the Biosphere Reserves of Calakmul Bird Registry) Campeche, México; |
| | • | | Producción de hortalizas para autoabastecimiento familiar, agroindustria, nutrición y manejo secundario al cultivo del banano (Produce Production for Self-Sufficiency, Agribusiness, Nutrition and Secondary Management of the Cultivation of the Banana Tree) in communities located in the region known as “La Isla”, in Tabasco; |
| | • | | Proyectos productivos sostenibles en los Municipios de Frontera, Paraíso y Cárdenas (Sustainable Productive Projects in the Municipalities of Frontera, Paraíso and Cárdenas) in Tabasco; and |
| | • | | Monitoreo Adaptativo: Mitigación y adaptación ante el Cambio Climático Calakmul (Adapted Monitoring: Mitigation and Adaptation before Calakmul’s Climat Change) in Campeche. |
We also began to develop the JATUSA Ecological Corridor project. This project is one of our most important conservation initiatives and its purpose is to merge natural or modified spaces, ecosystems and habitats to facilitate the conservation of biodiversity. It includes the implementation of a new scheme that allows third party participation to maximize profits and facilitate the preservation of the ecosystem.
Clean Development Mechanism Projects
In 2000, Mexico ratified the Kyoto Protocol to the United Nations Framework Convention on Climate Change as anon-Annex B country. Accordingly, Mexico is not subject to emission caps under the Kyoto
104
Protocol, but Mexican companies, such as PEMEX, are allowed to develop Clean Development Mechanism (CDM) projects. These CDM projects generate carbon dioxide emission reduction certificates or credits that can be traded in international markets. We have registered two CDM projects with the United Nations Framework Convention on Climate Change: Waste Energy Recovery at the Dos Bocas Marine Terminal and Tres Hermanos Oil Field Gas Recovery and Utilization Project. The execution of these projects is subject to market conditions, including an increase in the price of certified emission reductions. In addition, we began working on the Elimination of Nitrous Oxide in Lazaro Cardenas CDM project following our acquisition of Fertinal. As of the date of this annual report, that CDM project is in its final stages of development and will be registered with the United Nations once finalized.
105
HEALTH, SAFTEY AND ENVIRONMENTAL PERFORMANCE
We believe that we are in substantial compliance with all current federal and state environmental laws as those laws have been historically interpreted and enforced and that we maintain an organizational structure designed to identify and solve environmental risks. We engage external consultants to perform operational audits at our processing plants. In addition, our subsidiary entities have specialized departments that implement their own internal environmental programs, audits and facilities inspections. When these internal audits reveal problems or deficiencies, the subsidiary entities take the necessary measures to eliminate them.
In addition to our internal monitoring structure, Petróleos Mexicanos and its subsidiary entities’ environmental audit program is subject to review by ASEA, which is in charge of reviewing compliance with environmental regulations for the oil and gas sector and establishes environmental remediation standards.
Since 1993, we have participated in the National Environmental Audit Program (NEAP), a voluntary alternative to the traditional system of inspections and penalties, with PROFEPA and now with ASEA. This program was created by PROFEPA in 1992 as a regulatory incentive for companies to voluntarily correct any environmental irregularities in their operations.
In general terms, voluntary environmental auditing consists of three stages: (i) an audit and compliance diagnosis; (ii) development of an action plan to correct irregularities; and (iii) the implementation of the action plan. If a company satisfactorily completes these three stages, ASEA grants the audited company a clean industry certificate, which means that it complies with the applicable environmental legislation of their industry.
As of December 31, 2016, we were in the process of auditing 660 facilities with the objective of obtaining a “clean industry” certificate for each facility. In 2015, we certified 73 facilities, while the 2016 audits resulted in the certification of 445 facilities, of which 270 werere-certifications and 175 were certified for the first time. The audits of the remaining 215 facilities have begun, but are still under review. We will continue including new facilities under this program as we expand our activities in the areas of exploration, exploitation, refining and distribution of hydrocarbons.
During 2016, we did not experience any major incident that had significant environmental consequences. We did, however, experience the following material blasts or hazardous events at our facilities during 2016, none of which had significant environmental consequences:
| | • | | On January 23, 2016, a fire occurred during rig installation of theZaap-E platform, located in the Gulf of Mexico. The fire was caused by a lack of supervision and poor risk assessment. No personnel were injured. |
| | • | | On February 7, 2016, a fire and explosion occurred at theAbkatun-A-Compression processing platform in the Gulf of Mexico, which activated the safety systems, procedures and protocols and the platform was evacuated. As a result of this accident, three offshore workers (two PEMEX employees and one contractor) lost their lives. The explosion was caused when the welding of anFA-4210 cap failed. |
| | • | | On February 17, 2016, a fire and explosion occurred at well 864 at the Samaria oil field. As a result of this explosion, two contractors were injured. The accident occurred while personnel were cleaning an oil rig, a process that employs the use of hydrogen peroxide steam generators. The fire was caused by a failure to apply preventative industrial safety measures and environmental protections. |
| | • | | On May 13, 2016, an accident occurred during electrical maintenance at Cangrejera Petrochemical Complex, producing an electrical discharge that killed one worker. The accident was caused by the absence of personal safety equipment, inadequate risk assessment and poor supervision. |
| | • | | On June 24, 2016, a fire occurred during a poly pig launch at Pera 10, in the state of Tabasco. As a result of this fire, one worker was injured and another lost his life. The fire was caused when the tramp oil remover was opened without having previously been drained, due to by poor planning, failure to update operating procedures and a lack of personal safety equipment. |
106
| | • | | On September 5, 2016, a fire occurred during maintenance activities at the Madero Refinery when a plug valve was disassembled. As a result of this accident, three workers were injured. The accident was primarily caused by a lack of blanketing, pipe blinding and explosive gas detectors, as well as poor planning and supervision. |
| | • | | On September 10, 2016, during pipe gasket removal at Cactus GPC, a sour gas leak occurred, killing one worker and injuring three others. Maintenance staff were intoxicated by hydrogen sulfide acid. The leak and subsequent injuries and death were principally caused by a lack of pressure surveillance at the air station and inadequate education regarding operating safety limits of air supply equipment. |
| | • | | On September 24, 2016, a fire and explosion occurred at the oil tanker B/T Burgos, near the Port of Veracruz. As a result of this fire and explosion, the port tank 2 was completely destroyed and the vessel seriously damaged. The 31 workers aboard the vessel were safely evacuated without injury. The accident did not involve a gasoline spill or any impact to the marine environment. The oil tanker vessel was towed to Pajaritos Maritime Terminal for inspection. As of the date of this annual report, the cause of the fire and explosion is under assessment by Lloyd’s Register. |
In 2016, our lost time injury rate decreased 23.4% from 0.47 in 2015 to 0.36 in 2016. The segment that contributed most to this decrease was the industrial transformation segment. Our lost days indicator due to injuries decreased 25.8% from 31 to 23 lost days per million man hours worked with risk exposure from 2015 to 2016. Lost days are those missed as a result of incapacitating injuries suffered at work or those on which compensation is paid for partial, total or permanent incapacity or death. From 2015 to 2016, our contractors’ lost time injury rate decreased 40.9% from 0.44 to 0.26 injuries per million man hours worked with risk exposure.
In order to decrease our number of accidents, we have established the “Binomio” (Audit-Advisory Plan) project. This new program seeks to align our strategies, increases accountability and includes 12zero-tolerance EH&S guidelines. We have also run EH&S campaigns to decrease moderate and minor accidents. These campaigns focus on promoting a culture of safety and reducing accidents by better identifying risks, preventing slips and falls, providing additional lessons on how to handle objects and instructing on better planning and job scheduling. We have also used theBinomio program with our contractors to identify companies that have had fatal and/or serious accidents in the previous year to avoid entering into contracts with companies that perform poorly on the EH&S guidelines.
In 2016, our primary initiatives in industrial safety, health and environmental protection included the following:
| | • | | weekly visits to subsidiary facilities to supervise the implementation of the PEMEX-SSPA System; |
| | • | | SSPA campaigns launched to raise worker awareness of workplace risks and decrease accidents related to improper use of personal safety equipment; |
| | • | | a PEP campaign aimed at ensuring that all platform workers are in optimal health; |
| | • | | in a joint effort with ASEA, executing a strategy to comply with new requirements from ASEA applicable to the PEMEX-SSPA System; and |
| | • | | technical support to guide the implementation of the PEMEX-SSPA System in facilities belonging to our corporate administration and service areas. |
Environmental Liabilities
As of December 31, 2016, our estimated and accrued environmental liabilities totaled Ps. 8,230.5 million. Of this total, Ps. 1,014.9 million belong to Pemex Exploration and Production, Ps. 2,690.7 million to Pemex Industrial Transformation and Ps. 4,524.9 million to Pemex Logistics. The following tables detail our environmental liabilities by subsidiary entity and operating region at December 31, 2016.
107
Pemex Exploration and Production(1)
| | | | | | | | |
| | | Estimated Affected Area | | | Estimated Liability | |
| | | (in hectares) | | | (in millions of pesos) | |
Northern region | | | 131.39 | | | Ps. | 596.1 | |
Southern region | | | 89.89 | | | | 149.7 | |
| | | | | | | | |
Total(2) | | | 221.28 | | | Ps. | 745.9 | |
| | | | | | | | |
| | Note: | Numbers may not total due to rounding. |
| | (1) | Includes all liabilities of Pemex Exploration and Production that were assumed pursuant to our corporate reorganization. |
| | (2) | During 2016, environmental remediation was completed on 75.16 hectares. There were 107.68 hectares of additional affected areas in 2016, as a result of spills from pipelines mainly. |
| | | | | | | | |
| | | Holding Ponds Drainage | |
| | | Number of Holding Ponds
Reported as Liabilities(1) | | | Estimated Liability | |
| | | | | | (in millions of pesos) | |
Southern region | | | 11 | | | P | s.20.8 | |
Northern region | | | 69 | | | | 248.2 | |
| | | | | | | | |
Total | | | 80 | | | | 269.0 | |
| | | | | | | | |
Total estimated environmental liabilities of Pemex Exploration and Production | | | | | | Ps. | 1,014.9 | |
| | | | | | | | |
Note: Numbers may not total due to rounding.
| (1) | In 2016, no new ponds were added, while 6 holding ponds were restored. As a result, at December 31, 2016, 80 ponds remained to be reported. |
Source: Pemex Exploration and Production.
Pemex Industrial Transformation(1)
| | | | | | | | |
| | | Estimated Affected Area | | | Estimated Liability | |
| | | (in hectares) | | | (in millions of pesos) | |
Refineries | | | 273.43 | | | Ps. | 2,665.3 | |
Reynosa Gas complex processor | | | 11.52 | | | | 25.4 | |
Total estimated environmental liabilities of Pemex Industrial Transformation | | | 284.95 | | | Ps. | 2,690.7 | |
| | | | | | | | |
Note: Numbers may not total due to rounding.
| (1) | Includes liabilities of Pemex-Refining,Pemex-Gas and Basic Petrochemicals and Pemex-Petrochemicals, which were assumed by Pemex Industrial Transformation as part of our corporate reorganization. |
Source: Pemex Industrial Transformation.
Pemex Logistics
| | | | | | | | |
| | | Estimated Affected Area | | | Estimated Liability | |
| | | (in hectares) | | | (in millions of pesos) | |
Storage and Distribution Terminals | | | 69.58 | | | Ps. | 343.1 | |
Pipelines | | | 21.88 | | | | 4,181.8 | |
Total estimated environmental liabilities of Pemex Logistics | | | 91.46 | | | Ps. | 4,524.9 | |
| | | | | | | | |
Note: Numbers may not total due to rounding.
Source: Pemex Logistics.
108
Our estimates of environmental liabilities include cost estimates for site-specific evaluation studies, which draw upon aspects of previous evaluations for sites with comparable characteristics and the corresponding remediation. The remediation sites consist of facilities identified in the audit process described above, as well as those previously identified sites in more mature petroleum operating areas that were not cleaned up in the past. Our environmental liabilities also include the elimination of holding ponds created by abandoned petroleum wells. Additionally, our environmental liabilities include an accrual based on information received periodically from field managers regarding probable environmental liabilities identified in their respective areas of responsibility. We accrue environmental liabilities when sufficient basic knowledge is available to form a preliminary estimation as to remediation cost. Although the full potential scope of the remediation cost may not be known with certainty, these accruals are made when the liability is probable and the amount may be reasonably estimated, in accordance with IAS 37 “Provisions, Contingent Liabilities and Contingent Assets” for IFRS purposes. These estimated liabilities include assumptions resulting from an initial evaluation of damage, including land acreage to be remediated, depth and type of contamination. While the initial evaluation is extensive, there is a possibility that the actual scope of remediation could vary depending upon information gathered during the remediation process. For a further discussion of our environmental liabilities, see Note 3(l) to our consolidated financial statements included herein.
Unasserted or additional claims are not reflected in our identified liabilities. We are not aware of any such claims that would be of such magnitude as to materially affect our estimates of environmental liabilities. At the end of 2016, we were not aware of uncertainties with respect to joint and several liabilities that could affect our assessment of environmental contingencies or otherwise result in a major environmental liability. See “—History and Development—Energy Reform” above in this Item 4 for more information regarding the participation of other companies in the Mexican energy sector. As a result, we believe we are positioned to know immediately of any claims and are therefore directly accountable for any claims that may be brought against us.
Pemex Exploration and Production remains responsible for handling existing environmental liabilities—these responsibilities are not part of the Integrated E&P Contracts. Nevertheless, the Integrated E&P Contracts include environmental clauses related to contractors’ and Pemex Exploration and Production’s responsibility to ensure an adequate environmental performance, and also establish the terms for compensation and repair of any new environmental impacts.
The timing of remediation or cleanup of the sites to which these environmental liabilities relate is dependent upon the annual budget approved by the Mexican Congress.
Environmental Projects and Expenditures
In 2016, we spent approximately Ps. 11,424.4 million on environmental projects and related expenditures, as compared to Ps. 9,917.1 million in 2015. For 2017, we have budgeted Ps. 5,707.6 million for environmental projects and expenditures, including modernization of installations, implementation of systems and mechanisms to monitor and control atmospheric pollution, acquisition of equipment to address contingencies related to oil and gas spills, the expansion of water effluent systems, restoration and reforestation of affected areas, studies for environmental investigation and environmental audits. In addition, we continue to conduct research and development efforts to increase our capacity to produce gasoline, diesel and fuel oil with lower sulfur content at our refineries in Mexico.
We do not believe that the cost of complying with environmental laws or environmental requirements related to the North American Free Trade Agreement (NAFTA) among the governments of Mexico, the United States and Canada, the Vienna Convention for the Protection of the Ozone Layer, the Agreement on Environmental Cooperation between the Governments of Mexico and Canada or Mexico’s membership in the Organization for Economic Cooperation and Development, has caused or will cause a significant increase in our environmental expenditures.
109
Social Responsibility
We have implemented various corporate social responsibility initiatives, primarily with respect to the protection and preservation of the environment, relations with communities where we operate, ethical work practices, respect for labor rights and the general promotion of quality of life for communities and employees.
Our corporate and social responsibility goals are carried out through the following mechanisms:
| | • | | mutually beneficial public works and investment projects; |
| | • | | donations of fuels and asphalt; |
| | • | | environmental protection projects; |
| | • | | thePrograma de apoyo a la comunidad y medio ambiente (Program to support communities and the environment, which we refer to as PACMA), which supports and implements social programs, actions and public works designed to promote the economic and social development of the communities in which we operate and to protect their environment; and |
| | • | | other instruments that provide a positive impact our community, including our Integrated E&P contracts, FPWCs and the sustainable development annexes to our contracts in which we and our contractors commit to improving the quality of life in communities where we operate. |
In 2016, the total value of our donations and contributions amounted to Ps. 1,649.2 million. Our cash donations amounted to approximately Ps. 63.5 million, our asphalt and fuel donations amounted to approximately Ps. 1,218.4 million and our movable and immovable property donations amounted to approximately 28.3 million. Contributions made through provisions of our Integrated E&P Contracts, FPWCs, SD Annexes and RS KMZ sustainable development clause amounted to Ps. 129.0 million, and PACMA and mutual benefit project contributions amounted to Ps. 186.8 million and Ps. 23.2 million, respectively. Approximately 68.5% of our donations and contributions were assigned to states with greater activity in the oil and gas industry (Campeche, Tabasco, Tamaulipas and Veracruz); 22.0% to the states with medium activity in the oil and gas industry (Coahuila, Guanajuato, Hidalgo, Nuevo Leon, Oaxaca, Puebla and San Luis Potosí); and the remaining 9.5% to the remaining states. Most importantly, we took the following specific actions in 2016:
| | • | | contributed approximately Ps. 463.8 million to the construction, improvement or pavement of roads and highway infrastructure in 17 states; |
| | • | | contributed approximately Ps. 9.8 million for the installation of 8,072 roofs and 471 floors in community households in the states of Puebla, Tabasco and Veracruz; |
| | • | | contributed approximately Ps. 149.6 million toward education and sports programs in oil and gas communities in 11 states; |
| | • | | contributed approximately Ps. 56.9 million towards improving infrastructure for fishing communities in the states of Campeche, Oaxaca and Veracruz; |
| | • | | contributed approximately Ps. 34.6 million in equipment, training and development of renewable energy in communities in the states of Chiapas, Oaxaca, Tabasco, Tamaulipas and Veracruz; |
| | • | | contributed approximately Ps. 12.6 million for the construction of community kitchens in 11 municipalities in the states of Campeche, Tamaulipas and Veracruz; |
| | • | | contributed approximately Ps. 28.0 million for environmental education, restoration and conservation of protected natural areas through programs implemented in the states of Campeche, Chiapas, Tabasco and Veracruz; |
| | • | | contributed approximately Ps. 7.4 million in turbosine for the operation of state aircrafts in the states of Campeche, Chiapas, Hidalgo and Veracruz; |
110
| | • | | contributed approximately Ps. 758.8 million in fuel for the operation of vehicles and machinery for various state and municipal governments, principally to provide assistance for emergencies, civil protection programs, services and public safety; and |
| | • | | contributed approximately Ps. 28.6 million to various communities in the municipality of Carmen in the state of Campeche towards improving schools, health care centers and safety programs, as well as environmental and fishing projects. |
111
TRADE REGULATION AND EXPORT AGREEMENTS
Though Mexico is not a member of Organization of the Petroleum Exporting Countries (which we refer to as OPEC), it has periodically announced increases and decreases in our crude oil exports reflecting production revisions made by other oil producing countries, in order to contribute to crude oil prices stabilization. However, we have not changed our export goals because of announcements made by OPEC since 2004, and we believe that Mexico has no current plans to change our current level of crude oil exports.
NAFTA has not affected Mexico’s rights, through us or other companies, to explore and exploit crude oil and natural gas in Mexico, to refine and process crude oil and natural gas and to produce petrochemicals in Mexico. Since 2003, petrochemical products have enjoyed a zero tariff under NAFTA and, subject to limited exceptions, exports of crude oil and petroleum products from Mexico to the United States and Canada have been free or exempt from tariffs. Similarly, since 2003, Mexico’s imports of petroleum products from the United States and Canada have also been exempt from tariffs. In addition, in 2004, NAFTA approved lower tariffs on certain materials and equipment imported by Mexico. The zero tariff on Mexico’s imports of petrochemicals from the United States and Canada could have increased competition in the petrochemicals industry in Mexico. To the extent that domestic and international prices for our products remain constant, lower tariffs on products, materials and equipment that we import from and export to the United States and Canada, reduce our expenses and increase our revenue.
112
TAXES, DUTIES AND OTHER PAYMENTS TO THE MEXICAN GOVERNMENT
General
Taxes and duties applicable to us are a significant source of revenues to the Mexican Government. We contributed approximately 21% of the Mexican Government’s revenues in 2015 and 8.6% in 2016. In 2016, we paid a number of special oil and gas taxes and duties, in addition to the other taxes and duties paid by some of the subsidiary companies, as described below under “—Other Taxes.” The fiscal regime in effect for Petróleos Mexicanos and the subsidiary entities for 2016 (which we refer to as the 2016 fiscal regime) became effective in 2017 and can be subsequently modified from time to time. The Secondary Legislation published in August 2014 set forth a fiscal regime applicable to the new contractual arrangements that governs exploration and production activities conducted in Mexico beginning on January 1, 2015, as well as a new state dividend to be paid by Petróleos Mexicanos and the subsidiary entities beginning on January 1, 2016. See “—Fiscal Regime” and “—Other Payments to the Mexican Government” below.
Fiscal Regime for PEMEX
Fiscal Regime
The Hydrocarbons Revenue Law that was adopted as part of the Secondary Legislation sets forth, among other things, the following duties applicable to us in connection with our assignments granted by the Mexican Government:
| | • | | Derecho por la Utilidad Compartida(Profit-Sharing Duty): As of January 1, 2015, this duty is equivalent to 70% of the value of oil and gas produced in the relevant area, less certain permitted deductions. Pursuant to the Hydrocarbons Revenue Law, this duty is to decrease on an annual basis until January 1, 2019, at which point it will be set at 65%. During 2016, we paid Ps. 304,299 million in connection with this duty, a 19.2% decrease from Ps. 376,683 paid in 2015. On April 18, 2016, a decree was published in the Official Gazette of the Federation that increased the amount we can deduct for investments, costs, and expenses made pursuant to this duty, and resulted in a benefit of Ps. 40.2 billion. See “Item 5—Critical Accounting Policies—Exploration and Production Taxes and Duties” below. In addition, on November 16, 2016, we were granted an additional deduction of Ps. 28.4 billion in order to mitigate against the effects of continued low oil and gas prices. |
| | • | | Derecho de Extracción de Hidrocarburos(Hydrocarbons Extraction Duty):This duty is to be determined based on a rate linked to the type of hydrocarbons (e.g., crude oil, associated natural gas,non-associated natural gas or condensates), the volume of production and the relevant market price. During 2016, we paid Ps. 43.5 billion under this duty, a 10.9% decrease from Ps. 48,858 million in 2015. |
| | • | | Derecho de Exploración de Hidrocarburos(Exploration Hydrocarbons Duty): The Mexican Government is entitled to collect a monthly payment of Ps. 1,175 per square kilometer ofnon-producing areas. After 60 months, this duty increases to Ps. 2,811 per square kilometer for each additional month that the area is not producing. These amounts will be updated on an annual basis in accordance with the national consumer price index (NCPI). During 2016, we paid Ps.963 million under this duty, a 2.6% decrease from Ps. 989 million in 2015. |
| | • | | In 2016, Mexican companies paid a corporate income tax at a rate of 30% applied to revenues, less certain deductions. Beginning in 2015, Petróleos Mexicanos and the subsidiary entities became subject to theLey del Impuesto sobre la Renta, or Mexican Income Tax Law. During 2016, we paid Ps. 1,333 million under this tax, a 82.0% decrease from Ps. 7,426 million in 2015. |
113
Under the 2016 fiscal regime, some of our products are subject to the following IEPS Taxes, which we withhold from our customers and pay to the tax authorities. The IEPS tax is no longer included in our sales or expenses. of gasoline and diesel before the of eac
| | • | | IEPS sobre la venta de los combustibles automotrices (IEPS Tax on the Sale of Automotive Fuels): This tax is a fee on domestic sales of automotive fuels, gasoline and diesel, that Pemex Industrial Transformation collects on behalf of the Mexican Government. The applicable fees for this tax are Ps. 4.16 per liter of Magna gasoline; Ps. 3.52 per liter of Premium gasoline and Ps. 4.58 per liter of diesel. The amount of the fee will depend on the class of fuel, and is fixed monthly by the Ministry of Finance and Public Credit. |
| | • | | IEPSa beneficio de entidades federativas, municipios y demarcaciones territoriales (IEPS Tax in Favor of States, Municipalities and Territories): This tax is a fee on domestic sales of automotive fuels, gasoline and diesel, that Pemex Industrial Transformation collects on behalf of the Mexican Government. The applicable fees for this tax are 36.68 cents per liter of Magna gasoline, 44.75 cents per liter of Premium gasoline and 30.44 cents per liter of diesel. This fee changes yearly in accordance with inflation. Funds gathered by this fee are allocated to Mexican states and municipalities as provided for in theLey de Coordinación Fiscal (Tax Coordination Law). |
| | • | | IEPS Tax on Fossil Fuels: This tax is a fee on domestic sales of fossil fuels that Pemex Industrial Transformation collects on behalf of the Mexican Government. The applicable fees for this tax are 6.29 cents per liter for propane, 8.15 cents per liter for butane, 11.05 cents per liter for gasoline and aviation gasoline, 13.20 cents per liter for jet fuel and other kerosene, 13.40 cents per liter for diesel, 14.31 cents per liter for fuel oil and Ps. 16.60 per ton for petroleum coke. This fee changes yearly in accordance with inflation. |
The Hydrocarbons Revenue Law also establishes the fiscal terms to be applied to the contracts for exploration and production granted by the Mexican Government to us or to other companies in connection with future competitive bidding rounds. Specifically, these fiscal terms contemplate the following taxes, duties, royalties and other payments to the Mexican Government (in addition to any taxes owed pursuant to theLey de Ingresos de la Federación (Federal Revenue Law) for the applicable year and other applicable tax laws):
| | • | | Cuota Contractual para la Fase Exploratoria(Exploration Phase Contractual Fee): During the exploration phase of a project governed by a license, production-sharing contract or profit-sharing contract, the Mexican Government is entitled to collect a monthly payment of Ps. 1,150 per square kilometer ofnon-producing areas. After 60 months, this fee increases to Ps. 2,750 per square kilometer for each additional month that the area is not producing. The fee amount will be updated on an annual basis in accordance with the NCPI. |
| | • | | Regalías (Royalties): Royalty payments to the Mexican Government are determined based on the “contractual value” of the relevant hydrocarbons, which is based on a variety of factors, including the type of underlying hydrocarbons (e.g., crude oil, associated natural gas,non-associated natural gas or condensates), the volume of production and the market price. Royalties are payable in connection with licenses, production-sharing contracts and profit-sharing contracts. |
| | • | | Pago del Valor Contractual (Contractual Value Payment): Licenses require a payment calculated as a percentage of the “contractual value” of the hydrocarbons produced, as determined by the Ministry of Finance and Public Credit on acontract-by-contract basis. |
| | • | | Porcentaje a la Utilidad Operativa(Operating Profit Payment): Production-sharing contracts and profit-sharing contracts require a payment equivalent to a specified percentage of operating profits. In the case of production-sharing contracts, this payment is to be madein-kind through delivery of the hydrocarbons produced. In the case of profit-sharing contracts, this payment is to be made in cash. |
| | • | | Bono a la Firma(Signing Bonus): Upon execution of a license or migration of an assignment, a signing bonus is to be paid to the Mexican Government in an amount specified by the Ministry of Finance and Public Credit. |
114
| | • | | Impuesto por la actividad de Exploración y Extracción de Hidrocarburos (Hydrocarbons Exploration and Extraction Activities Tax): Contracts for exploration and extraction and assignments granted by the Mexican Government will include a specified tax on the exploration and extraction activities carried out in the relevant area. A monthly tax of Ps. 1,533 per square kilometer is payable during the exploration phase until the extraction phase begins. During the extraction phase of a project, a monthly tax of Ps. 6,133 per square kilometer is payable until the relevant contract for exploration and extraction or assignment is terminated. |
Under the Hydrocarbons Revenue Law, exploration and production activities associated with contracts for exploration and production are not subject to a value added tax.
Fluctuating crude oil price levels directly affect the level of certain taxes and duties that we pay. See “Item 3—Key Information—Risk Factors—Risk Factors Related to our Relationship with the Mexican Government—We pay significant taxes and duties to the Mexican Government, and, if certain conditions are met, to pay a state dividend, which may limit our capacity to expand our investment program or negatively impact our financial condition generally.”
Other Payments to the Mexican Government
Pursuant to the Petróleos Mexicanos Law, as of January 1, 2016, Petróleos Mexicanos and the subsidiary entities are required to pay a state dividend to the Mexican Government on an annual basis. In July of each year, Petróleos Mexicanos and the subsidiary entities are required to provide the Ministry of Finance and Public Credit a report disclosing their financial results for the previous fiscal year and their investment and financing plans for the following five years, together with an analysis of the profitability of these investments and the relevant projections of their financial positions. The Ministry of Finance and Public Credit will rely on this report and a favorable opinion issued by a technical committee of the Mexican Petroleum Fund for Stabilization and Development to determine the amount of the state dividend to be paid by Petróleos Mexicanos and each of the subsidiary entities. The Petróleos Mexicanos Law provides that the aggregate amount of the state dividend to be paid in 2016 is to be equal to, at minimum, 30% of the total revenues of Petróleos Mexicanos and the subsidiary entities, after taxes, from the previous fiscal year. It further provides that that percentage will decrease in subsequent years, until reaching 15% in 2021 and 0% in 2026. In accordance with the Federal Revenue Law for 2016 and the Federal Revenue Law for 2017, Petróleos Mexicanos was not required to pay a state dividend in 2016 and will not be required to pay a state dividend in 2017.
The following table sets forth the taxes and duties that we recorded for each of the past three years.
| | | | | | | | | | | | |
| | | Year ended December 31, | |
| | | 2014 | | | 2015 | | | 2016 | |
| | | (in millions of pesos)(1) | |
Hydrocarbon extraction duties and others | | Ps. | 760,912 | | | Ps. | 377,087 | | | Ps. | 304,813 | |
Hydrocarbons income tax | | | (18,735 | ) | | | — | | | | — | |
Income tax | | | 3,898 | | | | (45,587 | ) | | | (40,292 | ) |
| | | | | | | | | | | | |
Total | | Ps. | 746,075 | | | Ps. | 331,500 | | | Ps. | 264,521 | |
| | | | | | | | | | | | |
Note: For a description of these taxes and duties, see “Item 4—Information on the Company—Taxes, Duties and Other Payments to the Mexican Government.”Numbers may not total due to rounding.
| (1) | Figures are stated in nominal pesos. |
Source: PEMEX’s audited financial statements, prepared in accordance with IFRS.
Other Taxes
Since 1994, our interest payments on our external debt have been subject to Mexican Government withholding taxes. Nevertheless, withholding taxes do not represent a substantial portion of our total tax liability.
115
We are subject to municipal and state taxes, such as real property and payroll taxes. However, because most of our facilities are located on federal property, which is not subject to municipal taxation, real property taxes are not a significant part of our overall taxes. Similarly, payroll taxes do not represent a substantial portion of our total tax liability.
In addition, we have a number ofnon-Mexican subsidiary companies that may be subject to taxation in the jurisdiction of their incorporation or operations. The aggregate taxes paid by the subsidiary companies were Ps. 4,058.5 million in 2014, Ps. 6,833.4 millionin 2015 and Ps. 7,200.9 million in 2016.
No assurance can be given that our tax regime will not change in the future. See “Item 3—Key Information—Risk Factors—Risk Factors Related to our Relationship with the Mexican Government—We pay significant taxes and duties to the Mexican Government, and, if certain conditions are met, to pay a state dividend, which may limit our capacity to expand our investment program or negatively impact our financial condition generally.”
116
UNITED MEXICAN STATES
The information in this section with regard to Mexico has been derived from publicly available information published by, or on the websites of, the Comisión Nacional Bancaria y de Valores (National Banking and Securities Commission), Banco de México Banco (the Mexican central bank), the Ministry of Finance and Public Credit and the Instituto Nacional de Estadística y Geografía (INEGI).
Form of Government
The President is the chief of the executive branch of the Mexican Government. The President is elected by the popular vote of Mexican citizens who are 18 years of age or older. The Mexican Constitution limits the President to onesix-year term; the President is not allowed to run for reelection. In accordance with Mexico’s electoral law, on August 31, 2012, theTribunal Electoral del Poder Judicial de la Federación (Federal Electoral Court) officially validated the results of the presidential election held in Mexico on July 1, 2012, and declared Mr. Enrique Peña Nieto, a member of thePartido Revolucionario Institucional (Institutional Revolutionary Party, or PRI), President-elect. Mr. Enrique Peña Nieto took office on December 1, 2012 and his term will expire on November 30, 2018.
From 1929 to 1994, the PRI won all presidential elections, and, from 1929 until July 1997, the PRI held a majority of the seats in both chambers of the Mexican Congress. From 1929 until 1989, the PRI also won all of the state gubernatorial elections. In July 2000, the candidate from theAlianza por el Cambio (Alliance for Change), a coalition of thePartido Acción Nacional (National Action Party, or PAN), the oldest opposition party in the country, and thePartido Verde Ecologista de México (Ecological Green Party), won the presidential election.
Each of Mexico’s 31 states is headed by a state governor. Mexico’s Federal District, Mexico City, is headed by an elected mayor.
Legislative authority is vested in the Mexican Congress, which is composed of the Senate and the Chamber of Deputies. Members of the Mexican Congress are elected either directly or through a system of proportional representation by the popular vote of Mexican citizens who are 18 years of age or older. The Senate is composed of 128 members, 96 of whom are elected directly, while the other 32 are elected through a system of proportional representation. The Chamber of Deputies is composed of 500 members, 300 of whom are elected directly by national electoral districts, while the other 200 are elected through a system of proportional representation. Under this proportional representation system, seats are allocated to political party representatives based on the proportion of the votes cast for those parties that receive at least 3.0% of the national vote, among other requirements.
The Mexican Constitution provides that the President may veto bills and that the Mexican Congress may override such vetoes with atwo-thirds majority vote of each chamber.
Senators serve asix-year term and deputies serve a three-year term. Federal deputies are eligible for immediate reelection for up to four term periods and senators are eligible for immediate reelection for up to two term periods. Congressional elections for all 500 seats in the Chamber of Deputies were last held on June 7, 2015. The following table provides the distribution as of December 31, 2015 of Congressional seats, reflecting certainpost-election changes in the party affiliations of certain senators and deputies.
117
Party Representation in the Mexican Congress
| | | | | | | | | | | | | | | | |
| | | Senate | | | Chamber of Deputies | |
| | | Seats | | | % of Total | | | Seats | | | % of Total | |
| | | | |
Institutional Revolutionary Party | | | 55 | | | | 43.0 | % | | | 208 | | | | 41.6 | % |
National Action Party | | | 38 | | | | 29.7 | | | | 109 | | | | 21.8 | |
Democratic Revolution Party | | | 18 | | | | 14.1 | | | | 60 | | | | 12.0 | |
Ecological Green Party of Mexico | | | 7 | | | | 5.5 | | | | 42 | | | | 8.4 | |
Social Encounter Party | | | 0 | | | | 0 | | | | 9 | | | | 1.8 | |
Labor Party | | | 7 | | | | 5.5 | | | | 0 | | | | 0 | |
Citizen Movement Party | | | 0 | | | | 0.0 | | | | 24 | | | | 4.8 | |
New Alliance Party | | | 0 | | | | 0.0 | | | | 11 | | | | 2.2 | |
Unaffiliated National Regeneration Movement (New) | |
| 2
0 |
| |
| 1.6
0 |
| |
| 1
36 |
| |
| 0.2
7.2 |
|
| | | | | | | | | | | | | | | | |
Total | | | 127 | | | | 99.4 | % | | | 500 | | | | 100.0 | % |
| | | | | | | | | | | | | | | | |
| Note: | Numbers may not total due to rounding. According to official sources, there is one vacant seat in the Senate. |
| Source: | Senate and Chamber of Deputies. |
The Economy
General
According to World Bank data, the Mexican economy, as measured by 2015 gross domestic product (GDP) (at current prices in U.S. dollars), is the 15th largest in the world. The Mexican economy had a real GDP of Ps. 14,110.1 billion in 2015 and an increase in GDP of Ps. 1,335.9 billion between 2011 and 2015.
118
Gross Domestic Product
The following table sets forth the percentage change in Mexico’s real GDP by economic sector in percentage terms for the periods indicated.
Real GDP Growth by Sector
(% change against prior years)(1)
| | | | | | | | | | | | | | | | | | | | | | | | |
| | | 2011 | | | 2012 | | | 2013 | | | 2014 | | | 2015 | | | 2016(2) | |
GDP (constant 2008 prices) | | | 4.0 | % | | | 4.0 | % | | | 1.4 | % | | | 2.2 | % | | | 2.6 | % | | | 2.4 | % |
Primary activities: | | | | | | | | | | | | | | | | | | | | | | | | |
Agriculture, forestry, fishing, hunting and livestock(3) | | | (2.3 | ) | | | 7.4 | | | | 0.9 | | | | 4.2 | | | | 1.5 | | | | 4.1 | |
Secondary Activities: | | | | | | | | | | | | | | | | | | | | | | | | |
Mining | | | (0.4 | ) | | | 0.9 | | | | (0.1 | ) | | | (1.5 | ) | | | (4.6 | ) | | | (6.4 | ) |
Utilities | | | 6.9 | | | | 2.1 | | | | 0.5 | | | | 8.2 | | | | 2.3 | | | | 3.3 | |
Construction | | | 4.1 | | | | 2.5 | | | | (4.8 | ) | | | 2.0 | | | | 2.5 | | | | 1.8 | |
Manufacturing | | | 4.6 | | | | 4.1 | | | | 1.2 | | | | 4.1 | | | | 2.5 | | | | 1.3 | |
Tertiary Activities: | | | | | | | | | | | | | | | | | | | | | | | | |
Wholesale and retail trade | | | 9.7 | | | | 4.8 | | | | 2.2 | | | | 3.1 | | | | 4.7 | | | | 2.4 | |
Transportation and warehousing | | | 4.0 | | | | 4.1 | | | | 2.4 | | | | 3.2 | | | | 4.3 | | | | 2.8 | |
Information | | | 4.4 | | | | 16.3 | | | | 5.0 | | | | 0.2 | | | | 7.8 | | | | 10.1 | |
Finance and insurance | | | 7.1 | | | | 7.7 | | | | 10.4 | | | | (0.9 | ) | | | 4.3 | | | | 7.7 | |
Real estate, rental and leasing | | | 2.9 | | | | 2.5 | | | | 1.0 | | | | 2.0 | | | | 2.5 | | | | 1.9 | |
Professional, scientific and technical services | | | 5.1 | | | | 1.1 | | | | 1.2 | | | | 1.7 | | | | 4.2 | | | | 7.0 | |
Management of companies and enterprises | | | 3.6 | | | | 8.6 | | | | (1.8 | ) | | | 7.2 | | | | 3.5 | | | | 4.7 | |
Administrative support, waste management and remediation services | | | 6.0 | | | | 4.4 | | | | 4.3 | | | | (0.2 | ) | | | 1.2 | | | | 4.1 | |
Education services | | | 1.6 | | | | 2.2 | | | | 0.8 | | | | 0.1 | | | | 0.0 | | | | 1.0 | |
Health care and social assistance | | | 2.1 | | | | 2.2 | | | | 0.6 | | | | (0.6 | ) | | | (2.3 | ) | | | 1.3 | |
Arts, entertainment and recreation | | | (0.7 | ) | | | 2.9 | | | | 3.4 | | | | (1.5 | ) | | | 3.8 | | | | 5.7 | |
Accommodation and food services | | | 1.5 | | | | 5.4 | | | | 1.8 | | | | 2.9 | | | | 5.8 | | | | 3.8 | |
Other services (except public administration) | | | 1.9 | | | | 3.3 | | | | 2.1 | | | | 1.6 | | | | 2.7 | | | | 5.8 | |
Public administration | | | (1.4 | ) | | | 3.7 | | | | (0.5 | ) | | | 1.9 | | | | 2.7 | | | | 0.0 | |
| Note: | Numbers may not total due to rounding. |
| (1) | Based on GDP calculated in constant 2008 pesos. |
| (3) | GDP figures relating to agricultural production set forth in this table and elsewhere herein are based on figures for “agricultural years,” with the definition of the relevant “agricultural year” varying from crop to crop based on the season during which it is grown. Calendar year figures are used for the other components of GDP. |
According to preliminary figures, Mexico’s GDP increased by 2.4% in real terms during 2016 as compared to 2015. This increase was due to an increase of 4.1% in the primary activities sector as well as important increases in some tertiary activities such as 10.1% in information, 7.7% in finance and insurance, 7.0% in professional, scientific and technical services and 5.8% in other services (except public administration). Such increases compensated for the 6.4% decrease in the mining sector, the only sector that contracted in 2016.
Employment and Labor
According to preliminary Tasa de Desocupación Abierta (open unemployment rate) figures, Mexico’s unemployment rate was 3.5% as of December 31, 2016, a 0.7% decrease from the rate registered on December 31, 2015. As of December 31, 2016, the economically active population in Mexico 15 years of age or older consisted of 54.0 million individuals.
119
Principal Sectors of the Economy
Manufacturing
The following table sets forth the change in industrial manufacturing output by sector for the periods indicated.
Industrial Manufacturing Output Differential by Sector
(% change against prior years)(1)
| | | | | | | | | | | | | | | | | | | | | | | | |
| | | 2011 | | | 2012(2) | | | 2013 | | | 2014 | | | 2015(2) | | | 2016(2) | |
Food | | | 2.2 | % | | | 2.6 | % | | | 0.9 | % | | | 0.6 | % | | | 2.0 | % | | | 4.7 | % |
Beverage and tobacco products | | | 4.6 | | | | 2.6 | | | | (0.5 | ) | | | 3.1 | | | | 9.8 | | | | 4.1 | |
Textile mills | | | (4.4 | ) | | | 3.1 | | | | (2.7 | ) | | | (1.7 | ) | | | 3.0 | | | | (3.1 | ) |
Textile product mills | | | (2.9 | ) | | | (0.1 | ) | | | 3.5 | | | | 7.0 | | | | 2.3 | | | | 7.7 | |
Apparel | | | 0.2 | | | | (0.5 | ) | | | 3.3 | | | | (2.8 | ) | | | 19.2 | | | | (8.4 | ) |
Leather and allied products | | | (0.7 | ) | | | 3.5 | | | | (0.6 | ) | | | (1.7 | ) | | | 4.0 | | | | 0.5 | |
Wood products | | | 5.1 | | | | 13.0 | | | | (2.2 | ) | | | 1.0 | | | | 0.6 | | | | 0.1 | |
Paper | | | (0.8 | ) | | | 4.8 | | | | 2.1 | | | | 3.1 | | | | 3.3 | | | | 2.2 | |
Printing and related support activities | | | 4.2 | | | | (4.1 | ) | | | (6.9 | ) | | | (2.7 | ) | | | 6.2 | | | | (2.7 | ) |
Petroleum and coal products | | | (3.6 | ) | | | 1.1 | | | | 3.3 | | | | (4.5 | ) | | | 1.7 | | | | (25.6 | ) |
Chemicals | | | (0.1 | ) | | | (0.3 | ) | | | 0.8 | | | | (1.3 | ) | | | (1.7 | ) | | | (5.8 | ) |
Plastics and rubber products | | | 6.7 | | | | 9.0 | | | | (1.9 | ) | | | 6.5 | | | | 4.5 | | | | 1.6 | |
Nonmetallic mineral products | | | 3.7 | | | | 2.3 | | | | (3.1 | ) | | | 2.7 | | | | 3.3 | | | | 4.9 | |
Primary metals | | | 4.3 | | | | 3.8 | | | | 2.3 | | | | 8.4 | | | | (7.6 | ) | | | 7.8 | |
Fabricated metal products | | | 7.0 | | | | 3.9 | | | | (3.3 | ) | | | 7.8 | | | | 2.7 | | | | 8.6 | |
Machinery | | | 13.3 | | | | 5.5 | | | | 0.2 | | | | 1.6 | | | | (2.0 | ) | | | 9.4 | |
Computers and electronic products | | | 6.7 | | | | 0.5 | | | | 3.6 | | | | 11.1 | | | | 9.8 | | | | 5.8 | |
Electrical equipment, appliances and components | | | (1.1 | ) | | | 1.7 | | | | (2.0 | ) | | | 8.8 | | | | 7.1 | | | | 4.7 | |
Transportation equipment | | | 16.6 | | | | 13.9 | | | | 5.8 | | | | 12.4 | | | | 8.9 | | | | 3.6 | |
Furniture and related products | | | 1.2 | | | | 2.8 | | | | (5.8 | ) | | | (1.8 | ) | | | (20.6 | ) | | | (9.4 | ) |
Miscellaneous | | | 5.1 | | | | 0.4 | | | | 0.0 | | | | 6.4 | | | | 6.0 | | | | (9.4 | ) |
Total expansion/contraction | | | 4.6 | | | | 4.1 | | | | 1.2 | | | | 4.1 | | | | 3.1 | | | | 1.8 | |
| (1) | Percent change reflects differential in constant 2008 pesos. |
120
Financial System
Monetary Policy, Inflation and Interest Rates
The M1 money supply of Mexico is the sum of bills and coins held by the public, plus checking accounts denominated in local currency and foreign currency, plus interest-bearing deposits denominated in pesos and operated by debit cards, plus savings and loan deposits. The following table shows Mexico’s M1 and M4 money supply aggregates at each of the dates indicated.
Money Supply
| | | | | | | | | | | | | | | | | | | | |
| | | December 31, | |
| | | 2012 | | | 2013 | | | 2014 | | | 2015 | | | 2016(1) | |
| | | (in millions of nominal pesos) | |
M1: | | | | | | | | | | | | | | | | | | | | |
Bills and coins | | | Ps.734,034 | | | | Ps.792,928 | | | | Ps.928,777 | | | | Ps.1,088,016 | | | | Ps.1,263,001 | |
Checking deposits | | | | | | | | | | | | | | | | | | | | |
In domestic currency | | | 979,413 | | | | 1,082,702 | | | | 1,170,381 | | | | 1,301,904 | | | | 1,475,985 | |
In foreign currency | | | 163,611 | | | | 189,020 | | | | 232,467 | | | | 333,094 | | | | 469,185 | |
Interest-bearing peso deposits | | | 393,231 | | | | 438,012 | | | | 534,973 | | | | 614,312 | | | | 648,032 | |
Savings and loan deposits | | | 9,760 | | | | 11,097 | | | | 12,598 | | | | 14,560 | | | | 16,614 | |
| | | | | | | | | | | | | | | | | | | | |
Total M1 | | | Ps.2,280,049 | | | | Ps.2,513,758 | | | | Ps.2,879,196 | | | | Ps.3,351,975 | | | | Ps. 3,872,817 | |
| | | | | | | | | | | | | | | | | | | | |
M4 | | | Ps.10,684,898 | | | | Ps.11,658,729 | | | | Ps.13,107,550 | | | | Ps.13,858,271 | | | | Ps.14,969,884 | |
| Note: | Numbers may not total due to rounding. |
During 2016, consumer inflation was 3.4%, which was above the 3.0% target inflation for the year and 1.3 percentage points higher than the 2.1% consumer inflation for 2015. According toBanco de México, inflation was in the higher range of the expected deviation(+/-1.0%) from the 3.0% target due mostly to a depreciation in the Mexican peso given the complicated external environment after the presidential election in the United States and inflation associated with the price increases in some agricultural products as well as in certain energy products, as was the case with gasoline in the northern border.
The following table shows, in percentage terms, the changes in price indices and annual increases in the minimum wage for the periods indicated.
Changes in Price Indices
| | | | | | | | | | | | |
| | | National Producer
Price Index(1)(2) | | | National Consumer
Price Index(1) | | | Increase in
Minimum Wage | |
2011 | | | 6.9 | | | | 3.8 | | | | 4.1 | |
2012 | | | 1.8 | | | | 3.6 | | | | 4.6 | |
2013 | | | 1.6 | | | | 4.0 | | | | 3.9 | |
2014 | | | 3.3 | | | | 4.1 | | | | 3.9 | |
2015 | | | 2.8 | | | | 2.1 | | | | 6.9 | |
2016 | | | 8.5 | | | | 3.4 | | | | 4.2 | |
During 2016, interest rates on28-dayCetes averaged 4.2%, as compared to 3.0% during 2015. Interest rates on91-dayCetes averaged 4.4%, as compared to 3.1% during 2015.
121
On March 9, 2017, the28-dayCetes rate was 6.3% and the91-dayCetes rate was 6.5%.
Exchange Controls and Foreign Exchange Rates
On March 15, 2017, the peso/dollar exchange rate closed at Ps. 19.5803 = U.S. $1.00, a 5.2% appreciation in dollar terms as compared to the rate on December 31, 2016. The peso/U.S. dollar exchange rate announced by Banco de México on March 14, 2017 (which took effect on the second business day thereafter) was Ps. 19.6880 = U.S. $1.00.
Securities Markets
The BMV is the only authorized stock exchange involved in the listing and trading of equity and debt securities in Mexico. Upon the consummation of the initial public offering of its shares on June 18, 2008, the BMV was transformed from asociedad anónima de capital variable (private company) to asociedad anónima bursátil de capital variable (public company). In connection with the initial public offering of shares, certain of the former stockholders of the BMV (banks and brokerage houses) created a control trust into which they deposited more than 50% of the issued and outstanding shares of the BMV, for purposes of voting such shares in the future as a single block. Both debt and equity securities are listed and traded on the BMV, including stocks and bonds of private sector corporations, equity certificates or shares issued by banks, commercial paper, bankers’ acceptances, certificates of deposit, Mexican Government debt and special hedging instruments linked to the dollar. Currently, institutional investors are the most active participants in the BMV, although retail investors also play a role in the market. The Mexican equity market is one of Latin America’s largest in terms of market capitalization, but it remains relatively small and illiquid compared to major world markets.
The BMV publishes theÍndice de Precios y Cotizaciones (Stock Market Index, or IPC) based on a group of the thirty-five most actively traded shares.
At March 14, 2017, the IPC stood at 47,088.0 points, representing a 3.2% increase from the level at December 30, 2016.
122
Foreign Trade and Balance of Payments
Foreign Trade
The following table provides information about the value of Mexico’s merchandise exports and imports (excluding tourism) for the periods indicated.
Exports and Imports
| | | | | | | | | | | | | | | | | | | | |
| | | 2012 | | | 2013 | | | 2014 | | | 2015 | | | 2016(1) | |
| | | (in millions of dollars, except average price of the
Mexican crude oil mix) | |
Merchandise exports (f.o.b.) | | | | | | | | | | | | | | | | | | | | |
Oil and oil products | | $ | 52,956 | | | $ | 49,482 | | | $ | 42,586 | | | $ | 23,173 | | | $ | 18,743 | |
Crude oil | | | 46,852 | | | | 42,712 | | | | 35,855 | | | | 18,524 | | | | 15,500 | |
Other | | | 6,103 | | | | 6,770 | | | | 6,731 | | | | 4,648 | | | | 3,243 | |
Non-oil products | | | 317,814 | | | | 330,534 | | | | 354,542 | | | | 357,450 | | | | 355,187 | |
Agricultural | | | 10,914 | | | | 11,246 | | | | 12,181 | | | | 12,971 | | | | 14,743 | |
Mining | | | 4,906 | | | | 4,714 | | | | 5,064 | | | | 4,505 | | | | 4,368 | |
Manufactured goods(2) | | | 301,993 | | | | 314,573 | | | | 337,297 | | | | 339,975 | | | | 336,076 | |
| | | | | | | | | | | | | | | | | | | | |
Total merchandise exports | | | 370,770 | | | | 380,015 | | | | 397,129 | | | | 380,623 | | | | 373,930 | |
Merchandise imports (f.o.b.) | | | | | | | | | | | | | | | | | | | | |
Consumer goods | | | 54,272 | | | | 57,329 | | | | 58,299 | | | | 56,279 | | | | 51,950 | |
Intermediate goods(2) | | | 277,911 | | | | 284,823 | | | | 302,031 | | | | 297,253 | | | | 294,994 | |
Capital goods | | | 38,568 | | | | 39,057 | | | | 39,647 | | | | 41,700 | | | | 40,120 | |
| | | | | | | | | | | | | | | | | | | | |
Total merchandise imports | | | 370,752 | | | | 381,210 | | | | 399,977 | | | | 395,232 | | | | 387,065 | |
| | | | | | | | | | | | | | | | | | | | |
Trade balance | | $ | 18 | | | $ | (1,195 | ) | | $ | (2,849 | ) | | $ | (14,609 | ) | | $ | (13,135 | ) |
| | | | | | | | | | | | | | | | | | | | |
Average price of Mexican oil mix(3) | | $ | 102.0 | | | $ | 98.4 | | | $ | 86.0 | | | $ | 43.1 | | | $ | 35.6 | |
| Note: | Numbers may not total due to rounding. |
| (2) | Includes thein-bond industry. |
| (3) | In U.S. dollars per barrel. |
| Source: | Banco de México / PEMEX. |
During 2016, total merchandise exports decreased by 1.8% as compared to 2015 while total merchandise imports decreased by 2.1%. The trade balance for 2016 registered a deficit of U.S. $13.1 billion as compared to the U.S. $14.6 billion deficit registered in 2015. This deficit was a result of the combination of a decrease in both merchandise exports (especially oil and oil products, which decreased by 19.1% in nominal terms) and merchandise imports (especially consumer goods, which decreased by 7.7% in nominal terms).
Balance of Payments and International Payments
During 2016, Mexico’s current account registered a deficit of U.S. $27.9 billion, as compared to a deficit of U.S. $33.3 billion in 2015, which was the result of a combination of a deficit in the balance of goods and services and a surplus in the balance of transfers. The capital account registered a surplus of U.S. $35.3 billion in 2016, as compared to a surplus of U.S. $36.8 billion in 2015. Foreign direct investment in Mexico totaled U.S. $26.7 billion in 2016, as compared to U.S. $33.2 billion in 2015. This decrease was mainly due to loans and debt reduction between subsidiaries and their parent companies.
The Mexican Government has announced that it will gradually remove price controls on gasoline and diesel over the course of 2017 and 2018 as part of the liberalization of fuel prices in Mexico. On December 27, 2016, the Ministry of Finance and Public Credit announced an increase, effective January 1, 2017, in the maximum
123
gasoline and diesel prices to be applied in certain regions of Mexico, which caused an increase of gasoline prices of up to 20% in those areas. The removal of price controls and the resulting price increases have led to widespread protests across Mexico. Mexico cannot predict the effect of changes in gasoline and diesel prices, and any related political and social unrest, on the Mexican economy or whether the Mexican Government may alter its strategy for price liberalization in the future.
The following table sets forthBanco de México’s international reserves and net international assets at the end of each period indicated.
International Reserves and Net International Assets(3)
| | | | | | | | |
Year | | End-of-Period
International Reserves(1)(2) | | | End-of-Period
Net International Assets | |
| | | (in millions of dollars) | |
2012 | | $ | 163,515 | | | $ | 167,082 | |
2013 | | | 176,522 | | | | 180,232 | |
2014 | | | 193,239 | | | | 195,714 | |
2015 | | | 176,735 | | | | 177,629 | |
2015 | | | 176,735 | | | | 177,629 | |
2016(4) | | | 176,542 | | | | 178,057 | |
| (1) | Includes gold, Special Drawing Rights (international reserve assets created by the IMF) and foreign exchange holdings. |
| (2) | “International reserves” are equivalent to: (a) gross international reserves, minus (b) international liabilities ofBanco de México with maturities of less than six months. |
| (3) | “Net international assets” are defined as: (a) gross international reserves, plus (b) assets with maturities greater than six months derived from credit agreements with central banks, less (x) liabilities outstanding to the IMF and (y) liabilities with maturities of less than six months derived from credit agreements with central banks. |
Public Finance
Fiscal Policy
ThePrograma Nacional de Financiamiento del Desarrollo 2013-2018 (National Program to Finance Development 2013-2018, or PRONAFIDE), which was announced on December 16, 2013, establishes the Mexican Government’s fiscal policy goals. These goals include securing sufficient fiscal resources to strengthen social infrastructure and productivity. To this end, PRONAFIDE has outlined several specific objectives, including the promotion of economic development and macroeconomic stability on a federal and state level, as well as the improvement of the financial system to generate additional resources and to transform it into a simpler, more progressive and transparent system through spending efficiency and the facilitation of access to financial services.
2016 UMS Budget and Fiscal Results
On September 8, 2015, the President of Mexico submitted the proposed 2016 Revenue Law and the proposed 2016 Expenditure Budget to Congress for its approval. The 2016 Revenue Law and the 2016 Expenditure Budget were approved on October 29, 2015 and November 13, 2015, and were published in the Official Gazette of the Federation on November 18, 2015 and November 27, 2015, respectively. We refer to these two bills together as Mexico’s 2016 budget (the 2016 UMS Budget).
124
The following table illustrates the composition of public sector budgetary revenues for the fiscal years 2015 and 2016 in constant 2008 pesos.
2016 Public Sector Budgetary Revenues
| | | | | | | | | | | | |
| | | First six months
of 2015(1) | | | First six months
of 2016(1) | | | 2016
Budget(2) | |
| | | (in billions of constant pesos)(3) | |
Budgetary revenues | | | 2,046.3 | | | | 2,339.2 | | | | 4,154.6 | |
Federal government | | | 1,582.5 | | | | 1,868.5 | | | | 3,102.4 | |
Taxes | | | 1,225.7 | | | | 1,393.2 | | | | 2,407.7 | |
Income tax | | | 659.2 | | | | 763.5 | | | | 1,244.2 | |
Value-added tax | | | 346.3 | | | | 373.8 | | | | 742.0 | |
Excise taxes | | | 180.5 | | | | 211.8 | | | | 348.9 | |
Import duties | | | 19.7 | | | | 23.5 | | | | 36.3 | |
Export duties | | | 0.0 | | | | 0.0 | | | | 0.0 | |
Luxury goods and services | | | 0.0 | | | | 0.0 | | | | 0.0 | |
Other | | | 18.3 | | | | 18.3 | | | | 36.3 | |
Non-tax revenue | | | 356.9 | | | | 475.3 | | | | 694.7 | |
Fees and tolls | | | 246.8 | | | | 176.5 | | | | 47.4 | |
Transfers from the Mexican Petroleum Fund for Stabilization and Development | | | 0.0 | | | | 0.0 | | | | 485.5 | |
Rents, interest and proceeds of assets sales | | | 0.0 | | | | 0.0 | | | | 0.0 | |
Fines and surcharges | | | 107.3 | | | | 294.2 | | | | 161.7 | |
Other | | | 2.8 | | | | 4.6 | | | | 0.0 | |
Public enterprises and agencies | | | 463.7 | | | | 470.7 | | | | 1,052.2 | |
PEMEX | | | 165.4 | | | | 172.8 | | | | 398.4 | |
Others | | | 298.4 | | | | 297.9 | | | | 653.8 | |
Note: Numbers may not total due to rounding.
| (2) | Budgetary estimates as of December 2015. Budgetary estimates for 2016 were converted into constant pesos using the GDP deflator for 2016, estimated as of December 2015. |
| (3) | Constant pesos with purchasing power as of December 31, 2008. |
Source: Ministry of Finance and Public Credit.
2017 UMS Budget
On September 8, 2016, the President of Mexico submitted the proposedLey de Ingresos de la Federación para el Ejercicio Fiscal de 2017 (Federal Revenue Law for 2017, or the 2017 Revenue Law) and the proposedPresupuesto de Egresos de la Federación para el Ejercicio Fiscal de 2017 (Federal Expenditure Budget for 2017, or the 2017 Expenditure Budget) to the Mexican Congress for its approval. The 2017 Revenue Law was approved by the Senate on October 26, 2016, and the 2017 Expenditure Budget was approved by the Chamber of Deputies on November 11, 2016. They were published in the Official Gazette of the Federation on November 15, 2016, and November 30, 2016, respectively. We refer to these two bills together as Mexico’s 2017 budget (the 2017 UMS Budget).
The 2017 UMS Budget provides for a public sector budget surplus excluding investment in projects of high economic and social impact of 0.1% of GDP. The 2017 UMS Budget provides for a public sector budget deficit of 2.4% of GDP, including investment in projects of high economic and social impact, specifically investments by public entities and other Mexican Government projects. The 2017 UMS Budget contemplates public sector budgetary revenues totaling Ps. 4,309.5 billion, a 0.4% increase in real terms as compared to public sector
125
budgetary revenues estimated for the 2016 UMS Budget. The 2017 UMS Budget estimates are based on an estimated volume of oil exports of 775,000 barrels per day. Oil revenues are estimated at Ps. 769.9 billion in nominal pesos, a 15.7% decrease in real terms as compared to the estimated amount for the 2016 UMS Budget. In addition, approvednon-oil revenues are Ps. 3,539.6 billion, a 4.8% increase as compared to the estimated amount for the 2016 UMS Budget. Finally, projectednon-oil tax revenues also increased by 9.7% in real terms as compared to the amount approved for the 2016 UMS Budget.
The 2017 Expenditure Budget provides for a total of Ps. 3,105.8 billion in expenditures (excluding estimated physical investment expenditures by PEMEX totaling Ps. 391.9 billion), a 3.9% decrease in real terms as compared to the amount approved in the 2016 Expenditure Budget.
The 2017 UMS Budget authorizes the Mexican Government to incur net domestic debt in the amount of Ps. 495 billion in nominal pesos, or 2.4% of GDP. The 2017 UMS Budget also authorizes the Mexican Government to incur an additional U.S. $6.0 billion in external indebtedness, which includes financing from international financial organizations.
Public Debt
External Public Debt
Mexico’s external public debt goals are intended to provide the Mexican Government with flexibility to finance its stated needs, while also accounting for market volatility and unforeseen developments. The policy also seeks to maintain costs and risks at stable levels. Mexico primarily seeks debt financing through local markets, supplemented by external financing from the U.S., Europe and Japan. Mexico’s principal objectives in connection with its external financing include improving the terms and conditions of Mexico’s external liabilities, as well as strengthening and diversifying Mexico’s investor base, with specific consideration to Mexico’s continued presence in the most influential international markets. Objectives also include strengthening Mexico’s benchmark bonds and maintaining a constant relationship with international investors in order to ensure transparency and to promote investment in Mexico.
Internal Public Debt
The Mexican Government’s “net internal debt” includes only the internal portion of indebtedness incurred directly by the Mexican Government and the assets of theFondo del Sistema de Ahorro Para el Retiro(Retirement Savings System Fund). In addition, “net internal debt” is comprised ofCetesand other securities sold to the public in auctions for new issuances (primary auctions) but does not include any debt allocated toBanco de Méxicofor its use inRegulación Monetaria (regulating the money supply). It also does not include debt by theInstituto para la Protección al Ahorro Bancario (Bank Savings Protection Institute, or IPAB) or the debt of budget-controlled or administratively-controlled agencies. At December 31, 2015, all of the Mexican Government’s internal debt was denominated in pesos or UDIs and was payable in pesos.
Over the last two decades, the Mexican Government has actively sought to increase its average debt maturity date. Accordingly, the Mexican Government has issued new debt instruments bearing longer maturities than those previously issued. In doing so, the Mexican Government hopes to mitigate any risk associated with the refinancing of its internal public debt. This has had the effect of establishing a long-dated benchmark yield curve (the line that plots interest rates across different contract lengths for bonds having equal credit quality). These issuances have also encouraged long-term investments in the following areas: (1) fixed-rate contracts; (2) peso-denominated securities by Mexican companies; (3) Mexican financial hedging products; and (4) the use of long-term savings in financing long-term investment projects.
As a result of this policy, the average maturity of the Government’s internal debt increased from 7.2 years at December 31, 2010 to 8 years at December 31, 2015.
126
The following table summarizes the gross and net internal debt of the Mexican Government at each of the dates indicated.
Gross and Net Internal Debt of the Mexican Government(1)
| | | | | | | | | | | | | | | | | | | | | | | | | | | | | | | | | | | | | | | | | | | | | | | | |
| | | At December 31, | |
| | | 2011 | | | 2012 | | | 2013 | | | 2014 | | | 2014 | | | 2016(2) | |
| | | (in billions of pesos, except percentages) | |
Gross Debt | | | | | | | | | | | | | | | | | | | | | | | | | | | | | | | | | | | | | | | | | | | | | | | | |
Government Securities | | Ps. | 2,882.8 | | | | 90.2 | % | | Ps. | 3,257.8 | | | | 91.1 | % | | Ps. | 3,734.1 | | | | 91.9 | % | | Ps. | 4,223.3 | | | | 92.9 | % | | Ps. | 4,701.2 | | | | 92.7 | % | | Ps. | 4,915.3 | | | | 87.5 | % |
Cetes | | | 456.6 | | | | 14.3 | | | | 531.3 | | | | 14.9 | | | | 635.6 | | | | 15.6 | | | | 678.7 | | | | 14.9 | | | | 655.8 | | | | 12.9 | | | | 634.7 | | | | 11.3 | |
Floating Rate Bonds | | | 202.5 | | | | 6.3 | | | | 200.4 | | | | 5.6 | | | | 216.6 | | | | 5.3 | | | | 232.6 | | | | 5.1 | | | | 296.5 | | | | 5.8 | | | | 397.9 | | | | 7.1 | |
Inflation-Linked Bonds | | | 642.1 | | | | 20.1 | | | | 747.2 | | | | 20.9 | | | | 888.7 | | | | 21.9 | | | | 1,011.1 | | | | 22.2 | | | | 1,196.6 | | | | 23.6 | | | | 1,223.5 | | | | 21.8 | |
Fixed Rate Bonds | | | 1,581.6 | | | | 49.5 | | | | 1,777.9 | | | | 49.7 | | | | 1,989.6 | | | | 49.0 | | | | 2,295.8 | | | | 50.5 | | | | 2,546.2 | | | | 50.2 | | | | 2,652.1 | | | | 47.2 | |
STRIPS of Udibonos | | | — | | | | — | | | | 1.0 | | | | 0.0 | | | | 3.6 | | | | 0.1 | | | | 5.1 | | | | 0.1 | | | | 6.1 | | | | 0.1 | | | | 7.2 | | | | 0.1 | |
Other(3) | | | 314.9 | | | | 9.8 | | | | 317.6 | | | | 8.9 | | | | 329.1 | | | | 8.1 | | | | 323.3 | | | | 7.1 | | | | 372.8 | | | | 7.1 | | | | 705.0 | | | | 12.5 | |
| | | | | | | | | | | | | | | | | | | | | | | | | | | | | | | | | | | | | | | | | | | | | | | | |
Total Gross Debt | | Ps. | 3,197.7 | | | | 100.0 | % | | Ps. | 3,575.3 | | | | 100.0 | % | | Ps. | 4,063.2 | | | | 100.0 | % | | Ps. | 4,546.6 | | | | 100.0 | % | | Ps. | 5,074.0 | | | | 100.0 | % | | Ps. | 5,620.3 | | | | 100.0 | % |
| | | | | | | | | | | | | | | | | | | | | | | | | | | | | | | | | | | | | | | | | | | | | | | | |
Net Debt | | | | | | | | | | | | | | | | | | | | | | | | | | | | | | | | | | | | | | | | | | | | | | | | |
Financial Assets(4) | | | (85.6 | ) | | | | | | | (74.2 | ) | | | | | | | (169.3 | ) | | | | | | | (222.5 | ) | | | | | | | (259.9 | ) | | | | | | | (224.0 | ) | | | | |
| | | | | | | | | | | | | | | | | | | | | | | | | | | | | | | | | | | | | | | | | | | | | | | | |
Total Net Debt | | Ps. | 3,112.1 | | | | | | | Ps. | 3,501.1 | | | | | | | Ps. | 3,893.9 | | | | | | | Ps. | 4,324.1 | | | | | | | Ps. | 4,814.1 | | | | | | | Ps. | 5,396.3.1 | | | | | |
| | | | | | | | | | | | | | | | | | | | | | | | | | | | | | | | | | | | | | | | | | | | | | | | |
| | | | | | | | | | | | |
Gross Internal Debt/GDP | | | 20.5 | % | | | | | | | 22.1 | % | | | | | | | 24.2 | % | | | | | | | 25.4 | % | | | | | | | 26.6 | % | | | | | | | 27.8 | % | | | | |
Net Internal Debt/GDP | | | 19.9 | % | | | | | | | 21.6 | % | | | | | | | 23.2 | % | | | | | | | 24.1 | % | | | | | | | 25.2 | % | | | | | | | 26.7 | % | | | | |
| Note: | Numbers may not total due to rounding. |
| (1) | Internal debt figures do not include securities sold byBanco de México in open-market operations to manage liquidity levels pursuant toRegulación Monetaria. This is because the securities do not increase the Mexican Government’s overall level of internal debt.Banco de México must reimburse the Mexican Government for any allocated debt thatBanco de México sells into the secondary market and that is presented to the Mexican Government for payment. IfBanco de México undertakes extensive sales of allocated debt in the secondary market, however, this can result in an elevated level of outstanding internal debt as compared to the Mexican Government’s figure for net internal debt. |
| (3) | Includes Ps. 171.9 billion for 2011, Ps. 169.0 billion for 2012, Ps. 165.5 billion for 2013, Ps. 161.5 billion for 2014, Ps. 153.8 billion for 2015 and Ps. 147.5 billion at December 31, 2016 in liabilities associated with social security under the ISSSTE Law.. |
| (4) | Includes the net balance (denominated in pesos) of the Federal Treasury’s General Account inBanco de México. |
| Source: | Ministry of Finance and Public Credit |
External Public Debt
“External public sector debt” consists of the external portion of the long-term indebtedness incurred directly by the Mexican Government, the external long-term indebtedness incurred by budget-controlled agencies, the external long-term indebtedness incurred directly by productive state-owned companies, the external long-term indebtedness incurred directly or guaranteed by administratively-controlled agencies (including but not limited to national development banks) and the short-term external debt of the public sector. Private sector debt guaranteed by the Mexican Government is not included, unless and until the Mexican Government is called upon to make payment under the applicable guaranty. “External public debt” does not include, among other things, repurchase obligations ofBanco de México with the IMF.
According to preliminary figures, at December 31, 2016, outstanding gross public sector external debt totaled U.S. $181.0 billion, an approximate U.S. $18.8 billion increase from the U.S. $162.2 billion outstanding at December 31, 2015. Of this amount, U.S. $177.9 billion represented long-term debt and U.S. $3.1 billion represented short-term debt. Net external indebtedness also increased by U.S. $16.1 billion during 2016, mainly due to an increase in Mexican Government and State Productive Enterprise external debt. Overall, at December 31, 2016, total public debt (gross external debt plus net internal public sector debt) represented approximately 48.2% of nominal GDP, an increase of 5.4 percentage points from December 31, 2015.
127
The following tables set forth a summary of Mexico’s external public debt, including a breakdown of such debt by currency, net external public sector debt, the Mexican Government’s gross external debt, the Mexican Government’s net external debt and the Mexican Government’s net debt.
Summary of External Public Debt(1)
By Type
| | | | | | | | | | | | | | | | | | | | | | | | |
| | | Long-Term
Direct Debt
of the Mexican
Government | | | Long-Term
Debt of Budget-
Controlled
Agencies | | | Other
Long-Term
Public
Debt(2) | | | Total Long-
Term Debt | | | Total Short-
Term Debt | | | Total Long-
and Short-
Term Debt | |
| | | (in millions of U.S. dollars) | |
At December 31, | | | | | | | | | | | | | | | | | | | | | | | | |
2011 | | U.S.$ | 60,590 | | | U.S.$ | 47,436 | | | U.S.$ | 5,625 | | | U.S.$ | 113,651 | | | U.S.$ | 2,769 | | | U.S.$ | 116,420 | |
2012 | | | 66,912 | | | | 50,063 | | | | 5,626 | | | | 122,601 | | | | 3,125 | | | | 125,726 | |
2013 | | | 71,817 | | | | 53,358 | | | | 5,734 | | | | 130,909 | | | | 3,527 | | | | 134,436 | |
2014 | | | 78,379 | | | | 58,863 | | | | 5,627 | | | | 142,869 | | | | 4,797 | | | | 147,666 | |
2015 | | | 82,493 | | | | 69,621 | | | | 6,943 | | | | 159,057 | | | | 3,152 | | | | 162,209 | |
2016(3) | | | 88,083 | | | | 82,688 | | | | 7,122 | | | | 177,893 | | | | 3,093 | | | | 180,986 | |
By Currency(4)
| | | | | | | | | | | | | | | | | | | | | | | | | | | | | | | | | | | | | | | | | | | | | | | | |
| | | At December 31, | |
| | | 2011 | | | 2012 | | | 2013 | | | 2014 | | | 2015 | | | 2016(3) | |
| | | (in millions of U.S. dollars, except for percentages) | |
U.S. Dollars | | U.S.$ | 97,048 | | | | 83.4 | % | | U.S.$ | 105,836 | | | | 84.2 | % | | U.S.$ | 111,647 | | | | 83.0 | % | | U.S.$ | 121,927 | | | | 82.6 | % | | U.S.$ | 131,702 | | | | 81.2 | % | | U.S.$ | 144,185 | | | | 79.7 | % |
Japanese Yen | | | 6,793 | | | | 5.8 | | | | 6,847 | | | | 5.4 | | | | 5,519 | | | | 4.1 | | | | 5,058 | | | | 3.4 | | | | 4,857 | | | | 3.0 | | | | 6,410 | | | | 3.5 | |
Swiss Francs | | | 910 | | | | 0.8 | | | | 961 | | | | 0.8 | | | | 969 | | | | 0.7 | | | | 401 | | | | 0.3 | | | | 1,011 | | | | 0.6 | | | | 1,331 | | | | 0.7 | |
Pounds Sterling | | | 1,906 | | | | 1.6 | | | | 1,993 | | | | 1.6 | | | | 1,369 | | | | 1.0 | | | | 2,848 | | | | 1.9 | | | | 2,694 | | | | 1.7 | | | | 2,257 | | | | 1.3 | |
Euro | | | 9,377 | | | | 8.1 | | | | 9,530 | | | | 7.6 | | | | 11,489 | | | | 8.5 | | | | 13,986 | | | | 9.5 | | | | 18,834 | | | | 11.6 | | | | 24,409 | | | | 13.5 | |
Others | | | 385 | | | | 0.3 | | | | 558 | | | | 0.4 | | | | 3,443 | | | | 2.6 | | | | 3,445 | | | | 2.3 | | | | 3,113 | | | | 1.9 | | | | 2,393 | | | | 1.3 | |
| | | | | | | | | | | | | | | | | | | | | | | | | | | | | | | | | | | | | | | | | | | | | | | | |
Total | | U.S.$ | 116,420 | | | | 100.0 | % | | U.S.$ | 125,726 | | | | 100.0 | % | | U.S.$ | 134,436 | | | | 100.0 | % | | U.S.$ | 147,666 | | | | 100.0 | % | | U.S.$ | 162,209 | | | | 100.0 | % | | U.S.$ | 180,986 | | | | 100.0 | % |
| | | | | | | | | | | | | | | | | | | | | | | | | | | | | | | | | | | | | | | | | | | | | | | | |
Net External Debt of the Public Sector
| | | | | | | | | | | | | | | | | | | | | | | | |
| | | At December 31, | |
| | | 2011 | | | 2012 | | | 2013 | | | 2014 | | | 2015 | | | 2016(3) | |
| | | (in millions of U.S. dollars, except for percentages) | |
| | | | | | |
Total Net Debt | | U.S.$ | 113,631.6 | | | U.S.$ | 121,659.0 | | | U.S.$ | 130,949.7 | | | U.S.$ | 145,617.4 | | | U.S.$ | 161,609.5 | | | U.S.$ | 177,693 | |
Gross External Debt/GDP | | | 10.4 | % | | | 10.1 | % | | | 10.5 | % | | | 12.1 | % | | | 14.8 | % | | | 18.5 | % |
Net External Debt/GDP | | | 10.12 | % | | | 9.8 | % | | | 10.2 | % | | | 12.0 | % | | | 14.7 | % | | | 18.2 | % |
128
Gross External Debt of the Mexican Government
| | | | | | | | | | | | | | | | | | | | | | | | | | | | | | | | | | | | | | | | | | | | | | | | |
| | | At December 31, | |
| | | 2011 | | | 2012 | | | 2013 | | | 2014 | | | 2015 | | | 2016(3) | |
| | | (in millions of U.S. dollars, except for percentages) | |
U.S. dollars | | U.S.$ | 51,704 | | | | 84.3 | % | | U.S.$ | 57,465 | | | | 85.2 | % | | U.S. $ | 62,285 | | | | 86.3 | % | | U.S. $ | 65,127 | | | | 82.9 | % | | U.S.$ | 66,298 | | | | 80.3 | % | | U.S.$ | 67,533 | | | | 76.6 | % |
Japanese yen | | | 3,933 | | | | 6.4 | | | | 4,433 | | | | 6.6 | | | | 3,643 | | | | 5.0 | | | | 3,686 | | | | 4.7 | | | | 3,672 | | | | 4.4 | | | | 4,525 | | | | 5.1 | |
Swiss francs | | | 267 | | | | 0.4 | | | | — | | | | — | | | | — | | | | — | | | | — | | | | — | | | | — | | | | — | | | | — | | | | — | |
Pounds sterling | | | 741 | | | | 1.2 | | | | 774 | | | | 1.1 | | | | 789 | | | | 1.1 | | | | 2,302 | | | | 2.9 | | | | 2,177 | | | | 2.6 | | | | 1,825 | | | | 2.1 | |
Euros | | | 4,694 | | | | 7.7 | | | | 4,771 | | | | 7.1 | | | | 5,447 | | | | 7.6 | | | | 7,437 | | | | 9.5 | | | | 10,422 | | | | 12.6 | | | | 14,256 | | | | 16.2 | |
Others | | | 14 | | | | 0.0 | | | | 18 | | | | 0.0 | | | | 16 | | | | 0.0 | | | | 20 | | | | 0.0 | | | | 19 | | | | 0.0 | | | | 18 | | | | 0.0 | |
| | | | | | | | | | | | | | | | | | | | | | | | | | | | | | | | | | | | | | | | | | | | | | | | |
Total | | U.S.$ | 61,352 | | | | 100.0 | % | | U.S.$ | 67,461 | | | | 100.0 | % | | U.S. $ | 72,180 | | | | 100.0 | % | | U.S. $ | 78,573 | | | | 100.0 | % | | U.S.$ | 82,588 | | | | 100.0 | % | | U.S. $ | 88,157 | | | | 100.0 | % |
| | | | | | | | | | | | | | | | | | | | | | | | | | | | | | | | | | | | | | | | | | | | | | | | |
Net External Debt of the Mexican Government
| | | | | | | | | | | | | | | | | | | | | | | | |
| | | At December 31, | |
| | | 2011 | | | 2012 | | | 2013 | | | 2014 | | | 2015 | | | 2016(3) | |
| | | (in millions of U.S. dollars, except for percentages) | |
| | | | | | |
Total Net Debt | | U.S.$ | 59,642.5 | | | U.S.$ | 66,016.5 | | | U.S.$ | 69,910.4 | | | U.S.$ | 77,352.4 | | | U.S.$ | 82,320.3 | | | U.S. $ | 86,666 | |
Gross External Debt/GDP | | | 5.5 | % | | | 5.4 | % | | | 5.6 | % | | | 6.4 | % | | | 7.5 | % | | | 9.0 | % |
Net External Debt/GDP | | | 5.4 | % | | | 5.3 | % | | | 5.5 | % | | | 6.3 | % | | | 7.5 | % | | | 8.9 | % |
Net Debt of the Mexican Government
| | | | | | | | | | | | | | | | | | | | | | | | |
| | | At December 31, | |
| | | 2010 | | | 2011 | | | 2012 | | | 2013 | | | 2014 | | | 2015(3) | |
External Debt | | | 21.1 | % | | | 19.7 | % | | | 19.0 | % | | | 20.8 | % | | | 22.7 | % | | | 25.0 | % |
Internal Debt | | | 78.9 | % | | | 80.3 | % | | | 81.0 | % | | | 79.2 | % | | | 77.3 | % | | | 75.0 | % |
| Note: | Numbers may not total due to rounding. |
| (1) | External debt denominated in foreign currencies other than U.S. dollars has been translated into dollars at exchange rates as of each of the dates indicated. External public debt does not include (a) repurchase obligations ofBanco de México with the IMF (none of which were outstanding as of December 31, 2016) or (b) loans from the Commodity Credit Corporation to public sector Mexican banks. External debt is presented herein on a “gross” basis, and includes external obligations of the public sector at their full outstanding face or principal amount. For certain informational and statistical purposes, Mexico sometimes reports its external public sector debt on a “net” basis, which is calculated as the gross debt net of certain financial assets held abroad. These financial assets include Mexican public sector external debt that is held by public sector entities but that has not been cancelled.Banco de México’s reserves are not subtracted from gross debt. |
| (2) | Includes development banks’ debt and the debt of other administratively-controlled agencies whose finances are consolidated with those of the Mexican Government. |
| (4) | Adjusted to reflect the effect of currency swaps. |
| Source: | Ministry of Finance and Public Credit. |
Recent Securities Offerings
Mexico offers additional debt securities from time to time, and in order to manage the composition of its outstanding liabilities, Mexico engages from time to time in a variety of transactions including tender offers, open market purchases and early redemptions.
On January 21, 2016, Mexico issued U.S. $2.25 billion of its 4.125% Global Notes due 2026. The notes were issued under Mexico’s U.S. $110 billion Global Medium-Term Notes Program.
On February 23, 2016, Mexico issued € 1.5 billion of its 1.875% Global Notes due 2022 and € 1.0 billion of its 3.375% Global Notes due 2031.
129
On June 16, 2016, Mexico issued ¥45.9 billion of notes due 2019, ¥50.9 billion of notes due 2021, ¥16.3 billion of notes due 2026 and ¥21.9 billion of notes due 2036. These notes were placed in the Japanese public market and bear interest at 0.40%, 0.70%, 1.09% and 2.40%, respectively.
On August 11, 2016, Mexico issued U.S. $0.76 billion of its 4.125% Global Notes due 2026 and U.S. $2.0 billion of its 4.350% Global Notes due 2047.
On November 1, 2016, Mexico issued U.S. € 1.2 billion of its 1.375% Global Notes due 2025 and € 0.7 billion of its 3.375% Global Notes due 2031. Mexico used a portion of the proceeds from this offering to redeem its outstanding 4.250% Global Notes due 2017.
On March 28, 2017, Mexico issued U.S. $3.2 billion of its 4.150% Global Notes due 2027. Mexico used a portion of the proceeds from this offering to redeem its outstanding 5.950% Global Notes due 2019.
In 2017, Mexico has repurchased approximately $500 million in aggregate principal amount of outstanding debt securities in open market transactions.
Legal and Political Reforms
Anti-Corruption
On July 18, 2016, theSistema Nacional Anticorrupción (National Anti-Corruption System or NAS) went into force. The NAS is an institutional framework that seeks to combat corruption and bribery in public administration and governmental accounting.
Access to Information and Government Transparency
On May 9, 2016 theLey Federal de Transparencia y Acceso a la Información Pública (Federal Law for Transparency and Access to Public Information) was published in the Official Gazette of the Federation, abrogating the former law of the same name. This law continues to ensure the right to access to information held by governmental entities and, additionally, was expanded to include transparency obligations for the armed forces, theAgencia Nacional de Seguridad Industrial y de Protección al Medio Ambiente del Sector Hidrocarburos (National Agency for Industrial Safety and Environmental Protection on Hydrocarbons Sector), the NHC, the Energy Regulatory Commission, theFondo Mexicano del Petróleo para la Estabilización y el Desarrollo (Mexican Petroleum Fund for Stabilization and Development) and the productive state-owned companies. The new law sets forth the authority of theInstituto Nacional de Transparencia, Acceso a la Información y Protección de Datos Personales(National Institute of Transparency, Information Access and Protection of Private Data or INAI) to impose sanctions.
Criminal Justice
In June 2008, theConstitución Política de los Estados Unidos Mexicanos (the Political Constitution of Mexico, or the Constitution) was amended to reform the criminal justice system. The reforms were implemented over a period of eight years and went into force on June 18, 2016. Under the reforms, Mexico transitioned to an accusatory system of criminal justice, in which defendants are presumed innocent until proven guilty. Closed-door proceedings, previously conducted almost exclusively through written briefs, will be replaced with oral trials open to the public. A specific judge will be named to each criminal proceeding and will follow that proceeding through the sentencing phase and will be required to be present at every hearing. The victims of criminal activity are more directly involved in criminal proceedings and benefit from increased protection of their personal data, as well as access to legal, medical and psychological assistance.
Local Government Finance
On April 27, 2016, theLey de Disciplina Financiera de las Entidades Federativas y los Municipios(Law for the Financial Discipline of the States and the Municipalities) was published in the Official Gazette of the
130
Federation. Pursuant to the law, states and municipalities will need the authorization of the local congress to incur additional indebtedness if their outstanding indebtedness is higher than six percent of the revenues approved by the Legislative branch for the applicable fiscal year. The law also imposes a new set of requirements that must be met prior to having the Mexican Government guarantee debt issued by states and municipalities. This legislation follows a May 2015 decree amending various provisions of the Constitution, creating a new legal framework to control the borrowing practices of the states and municipalities.
Economic Development
On June 1, 2016, theLey de Zonas Económicas Especiales(Law of Special Economic Zones) was published in the Official Gazette of the Federation. This law is part of the National Development Plan and its purpose is to regulate the establishment and operation of the Special Economic Zones and promote sustainable economic growth in the undeveloped regions of the country, particularly the southern region of Mexico. The Special Economic Zones are designated geographic areas subject to special incentives to promote business, attract new investment and generate employment opportunities through infrastructure development projects.
Consistent with the National Development Plan, on January 9, 2017, the Mexican Government announced that it signed theAcuerdo para el Fortalecimiento Económico y la Protección de la Economía Familiar(Agreement for Economic Strengthening and Protection of the Economy of the Family). This agreement aims to strengthen the domestic market in Mexico with a focus on protecting the economic well-being of Mexican families, increasing investment and maintaining job creation, economic growth and competitiveness.
131
| Item 4A. | Unresolved Staff Comments |
Not applicable.
| Item 5. | Operating and Financial Review and Prospects |
General
We earn income from:
| | • | | export sales, which consist of sales of crude oil and condensates, petroleum products and petrochemical products; |
| | • | | domestic sales, which consist of sales of natural gas, petroleum products (such as gasoline, diesel fuel and LPG) and petrochemical products; and |
| | • | | other sources, including financial and investment income and insurance revenue. |
Our operating expenses include:
| | • | | cost of sales, including the cost of purchases of imported petroleum and other products, depreciation and amortization, salaries, wages and benefits, a portion of the net cost of employee benefits for the period, the variation of inventories, maintenance, and exploration and unsuccessful drilling expenses; |
| | • | | transportation and distribution expenses (including a portion of the net cost of employee benefits for the period); and |
| | • | | administrative expenses (including a portion of the net cost of employee benefits for the period). |
Our income is affected by a number of factors, including:
| | • | | changes in international prices of crude oil, petroleum products and petrochemical products, which are denominated in U.S. dollars, and domestic prices of petroleum products, which are denominated in pesos; |
| | • | | the type and volume of crude oil produced and exported; |
| | • | | the type and volume of natural gas produced, processed and sold domestically and internationally; |
| | • | | the results of development and exploration activities; |
| | • | | the amount of taxes, duties and other payments that we are required to make to the Mexican Government; |
| | • | | fluctuations in thepeso-U.S. dollar exchange rate; and |
| | • | | Mexican and global economic conditions, including the levels of international interest rates. |
Overview
In 2016 we focused on recovering financial stability, taking concrete steps towards implementing the opportunities presented to us by the energy reform and strengthening the relationship with our stakeholders. These actions took place against a macroeconomic landscape that continues to be challenging for us. Crude oil prices continued the decline that commenced in late 2014, albeit less sharply than before. In 2016, the weighted average price of the Mexican crude oil export price decreased from U.S. $43.12 per barrel in 2015 to U.S. $35.63 per barrel. In addition, the continued depreciation of the peso against the U.S. dollar in 2016 also had a significant negative impact on our income statement due to the conversion of our financial debt, which is primarily denominated in U.S. dollars, to pesos.
132
Going Concern
Our consolidated financial statements as of December 31, 2016 and 2015 have been prepared on a going concern basis, which assumes that we can meet our payment obligations. As we describe in Note 2 to our consolidated financial statements, we have experienced certain conditions that have generated important uncertainty and significant doubts concerning our ability to continue operating, including recurring net losses, negative working capital, negative equity and negative cash flows from operating activities. We discuss below, and in Note 2 to our consolidated financial statements, the circumstances that have caused these negative trends and the concrete actions we are taking to improve our results, strengthen our ability to continue operating, and achieve revenue maximization and efficiencies in an economic environment which is showing recovery and some stability. We continue operating as a going concern, and our consolidated financial statements do not include any adjustments that might result from the outcome of this uncertainty.
Redefinition of Petróleos Mexicanos as a State-Owned Productive Company
We are continuing to implement a business strategy that redefines us as a state-owned productive company, enables us to operate competitively and efficiently and takes advantage of the opportunities made available to us by the energy reform. As a productive state-owned company, our business model contemplates maximizing value for Mexico and, accordingly, we intend to focus on high-yield projects with growth potential. Every action taken under our business plan will be directed towards the efficient allocation of resources, developing profitable businesses and considering the development of new businesses with third parties. These opportunities include expanding the scope of activities in which we participate, enhancing our ability to acquire technology and knowledge along the entire hydrocarbons value chain through strategic alliances and continuing the migration of certain assignments into exploration and production contracts.
We began taking certain of these actions in 2016 and will continue in 2017 as further described below:
| | • | | 2016 Budget Adjustment Plan: For 2017, we continue to develop actions from thePlan de Ajuste Presupuestal 2016 (2016 Budget Adjustment Plan), which were also included in our 2017-2021 Business Plan, as this plan contributed to increasing our efficiency to enable us to be more competitive in the hydrocarbons sector in Mexico; focused investments on the most profitable projects; established partnerships with the private sector for strategic projects and promoted further development in sectors where private investment may provide economic growth in Mexico. |
| | • | | Pension Reform:As of January 1, 2016, new employees received a defined contribution plan, pursuant to which both we and our employees contribute to each employee’s individual account, in contrast to the existing defined benefit pension plan, pursuant to which only we contribute. We expect that the defined contribution plan will limit increases in our pension liabilities because, among other things, employees will now also contribute to such plan. In addition, we will provide employees the option to transfer from their existing defined benefit pension plan to a defined contribution plan. |
| | • | | Assets Sales:We will continue to evaluate the sale ofnon-essential assets to obtain working capital, such as the sale of Gasoductos de Chihuahua in 2016. |
| | • | | 2017-2021 Business Plan:On November 3, 2016, we announced our business plan for the five-year period from 2017 through 2021 (which we refer to as the 2017-2021 Business Plan), which is designed to improve cash flows, reduce net indebtedness, strengthen our financial balance (which we define as sales after deducting costs and expenses, investment expenses, taxes and duties, and financial debt service), reduce financial losses in our National Refining System and plans for continued cost-cutting and administrative discipline, as well as the establishment of additional alliances, including an intensivefarm-out program. The business plan was formulated with what management believes are realistic and conservative assumptions, which does not include additional income from any disposal of assets. |
133
| | • | | 2017 Plans:Our 2017 plans also sets out certain objectives we expect to achieve with respect to our subsidiary entities as follows: |
| | • | | Pemex Exploration and Production’s investments will focus on the most profitable assignments, as well as farm-outs and other partnerships aimed at increasing hydrocarbon production. For 2017, Pemex Exploration and Production is planning to develop farm-outs and other partnerships, including the partnership entered with Chevron and Inpex Corporation in bidding round 1.4 for the rights to block 3 which is north of the Plegado Perdido Belt in the Gulf of Mexico and the migration of an assignment through the strategic alliance with BHP Billiton for the Trion project. |
| | • | | With respect to Pemex Industrial Transformation, we are seeking partnerships for auxiliary services and the reconfiguration of certain refineries for projects for 2017, such as the auxiliary services contract with the French company Air Liquide México. S.A. de R.L. de C.V. for the hydrogen supply in the Miguel Hidalgo Refinery in Tula. |
| | • | | Pemex Logistics is being transformed from a company designed to ensure that Petróleos Mexicanos and its subsidiaries are properly supplied to one intended to provide profitable and competitive services to multiple customers. For 2017, Pemex Logistics will hold an open season for parties to contract for transportation and storage of products. |
| | • | | The business plan also describes our goal to increase the profitability of Pemex Fertilizers, Pemex Ethylene, Pemex Cogeneration and Services and Pemex Drilling and Services through services contracts and partnerships for the modernization of their facilities. |
| | • | | Decreased Debt Financing:We intend to decrease our debt financing during 2017 from the Ps. 240.4 billion of net indebtedness approved for 2016 to the net indebtedness approved for 2017 of Ps. 150 billion. In addition, we will assess opportunities for liability management, such as the transaction completed on October 3, 2016 that exchangednear-to-maturity securities for longer-term maturity securities with better terms, in accordance with market conditions. |
| | • | | New Budget:On July 8, 2016, Petróleos Mexicanos’ Board of Directors approved a proposal for the consolidated annual budget of Petróleos Mexicanos and the subsidiary entities for 2017, which was subsequently approved by the Mexican Congress on November 10, 2016 and published in the Official Gazette of the Federation on November 30, 2016. The consolidated annual budget of Petróleos Mexicanos and the subsidiary entities for 2017 approved by the Mexican Chamber of Deputies is approximately Ps. 391.9 billion, as compared to the Ps. 378.0 billion consolidated annual budget for 2016 adjusted as of March 31, 2016. |
In addition, we foresee a more stable scenario for the hydrocarbons market, which may enable an improvement in our revenues. For example, a stabilization of prices in the hydrocarbons market contributed to the net reversal of impairment experienced in 2016, which resulted in an improvement in our financial position of Ps. 331.3 billion, as compared to the impairment of Ps.477.9 billion in 2015.
Results of operations and financial condition in 2016
For the year ended December 31, 2016, we reduced our net loss by 73.2%, from a net loss of Ps. 712.6 billion (U.S. $34.5 billion) in 2015 to a net loss of Ps. 191.1 billion (U.S. $9.3 billion) in 2016. This decrease in net loss was primarily due to:
| | • | | a Ps. 809.2 billion decrease in the impairment of fixed assets; |
| | • | | a Ps. 67.0 billion decrease in taxes and other duties, mainly due to the decrease in the weighted average price of the Mexican crude oil export price; and |
| | • | | a Ps. 21.4 billion increase in other revenues, net. |
134
This decrease was partially offset by:
| | • | | a Ps. 172.3 billion increase in the net periodic cost of employee benefits, mainly due to theone-time Ps. 196.0 billion decrease in pension liabilities recorded in 2015 as a result of modifications made to our pension regime; |
| | • | | a Ps. 99.2 billion increase in exchange loss, net; |
| | • | | a Ps. 86.8 billion decrease in total sales, mainly due to the decrease in average sales prices of our petroleum products and the decrease in volume of sales of liquefied natural gas in Mexico; and |
| | • | | a Ps. 24.9 billion increase in financing costs, net. |
For more information on our results of operations, see “— Results of Operations of Petróleos Mexicanos, the Subsidiary Entities and the Subsidiary Companies—For the Year Ended December 31, 2016 Compared to the Year Ended December 31, 2015” below.
In 2016, our (deficit) equity increased by Ps. 98.7 billion from negative Ps. 1,331.7 billion as of December 31, 2015 to negative Ps. 1,233.0 billion as of December 31, 2016. For more information on our (deficit) equity increase, see “—Liquidity and Capital Resources—Equity Structure and Mexican Government Contributions” below. This increase was mainly due to (1) the equity contributions in the total amount of Ps. 161.9 billion made by the Mexican Government to Petróleos Mexicanos in 2016 in the form of Certificates of Contribution “A”; (2) a Ps. 108.2 billion increase in actuarial gains on employee benefits, resulting from the increase in the discount rate used in the actuarial computation method from 7.4% in 2015 to 8.2% in 2016 and an increase in the expected returns for fixed assets; and (3) Ps. 21.4 billion in accumulated gains from the foreign currency translation effect. This increase was partially offset by our net loss for the year of Ps. 191.1 billion.
While we continue to depend heavily on net cash flows from financing activities, in 2016 we were able to strengthen our liquidity. During 2016, our cash and cash equivalents increased by Ps. 54.2 billion, or 49.5%, from Ps. 109.4 billion as of December 31, 2015 to Ps. 163.5 billion as of December 31, 2016, mainly due to an increase in net cash flows from financing activities. Our accounts receivable, net, increased 68.2%, in 2016, from Ps. 79.2 billion as of December 31, 2015 to Ps. 133.2 billion as of December 31, 2016, mainly due to the following:
| | • | | an increase in accounts receivable from sales to our international customers; |
| | • | | customer services reimbursements; |
| | • | | the current portion of the promissory notes issued by the Mexican Government in relation to our pension liabilities; |
| | • | | higher accounts receivable from gasoline distributors; and |
| | • | | an increase in tax credits associated with hydrocarbon extraction duties. |
In addition to increasing our assets, during 2016 we sought to address one of the most critical problems we faced in 2015—our accounts payable to suppliers. As of December 31, 2016, we owed our suppliers approximately Ps. 151.6 billion as compared to Ps. 167.3 billion as of December 31, 2015. As of December 31, 2016, we have paid the total outstanding balance due to suppliers and contractors as of December 31, 2015 as part of our effort to repay such balances.
Operating Challenges
Notwithstanding our exploration and development efforts in shallow and deep waters that we carried out in 2016 and the new techniques and strategies we applied to improve the timeline for the completion and drilling of new wells, during 2016 our crude oil production totaled 2,153.5 thousand barrels per day, a decrease of 113 thousand barrels per day, or 5.0%, as compared to 2015. This decline was primarily a result of the natural decline of some of our fields, particularly production at the fields located in the Litoral de Tabasco, AbkatúnPol-Chuc and Cantarell business units. We describe the reasons for this decline under “Item 4—Information on
135
the Company—Business Overview—Exploration and Production—Crude Oil and Natural Gas Production.” Our exploration and production segment is working to successfully stabilize production and replace our reserves.
In 2016, the total crude oil we processed decreased by 12.3% to 933 thousand barrels per day. Although we had a decrease in crude oil processing and our petroleum products output, our variable refining margin increased by 33.7% due to an increase in the unit contribution margin of U.S. $1.10 per barrel, primarily as a result of the increase in average sales prices for refined products. We are working to reverse our economic and operating losses and to increase processing of crude oil.
Critical Accounting Policies
Some of our accounting policies require the application of estimates, judgments and assumptions by management which affect the reported amounts of assets and liabilities as of the date of our financial statements, as well as the reported amounts of revenues and expenses during the periods presented in this report. By their nature, these estimates, judgments and assumptions are subject to a degree of uncertainty and are based on: our historical experience; terms of existing contracts; management’s view of trends in the oil and gas industry, both internationally and within Mexico; economic factors in Mexico; and information from outside sources. We believe that the following critical accounting policies, among others, affect management’s judgments and estimates used in the preparation of our consolidated financial statements according to IFRS, and could potentially impact our financial results and future financial performance. There can be no assurance that actual results do not differ from these estimates. These policies are more fully described in Note 3 to our consolidated financial statements included herein.
Successful Efforts Method of Oil and Gas Accounting
We apply the successful efforts method for the exploration and production of crude oil and gas activities, considering the criteria mentioned in IFRS 6, “Exploration for and Evaluation of Mineral Resources,” in relation to the recognition of exploration and drilling assets. Costs of development wells and related plant, property and equipment involved in the exploitation of oil and gas are recorded as part of the cost of assets. The costs of exploratory wells in areas that have not yet been designated as containing proved reserves are recorded as intangible assets until it is determined whether such reserves are commercially viable. Otherwise, the costs of drilling an exploratory well are charged to exploration expense. Other expenditures on exploration are charged to exploration expense, as incurred.
Depreciation and amortization of capitalized costs associated with wells are based on the estimated commercial life of the field to which the well corresponds, taking into account the relationship between the field’s production levels for the period and proved developed reserves, as of the beginning of the year and as updated on a quarterly basis for new development investments.
Reserves estimates are determined in accordance with earth science and petroleum engineering principles and practices pursuant to Rule4-10(a) and, where necessary, in accordance with the Standards Pertaining to the Estimating and Auditing of Oil and Gas Reserves Information promulgated by the SPE as of February 19, 2007. These procedures are consistent with international reserves reporting practices. The estimation of these reserves depends on assumptions made and the interpretation of the data available, and can vary as a result of changes in such factors as forecasted oil and gas prices, reservoir performance and developments in oil field technology. The results of drilling activities, test wells and production after the date of estimation are utilized in future revisions of reserves estimates.
Downward revision of reserves estimates can result in: higher depreciation and depletion expense per barrel in future periods; an immediate write-down of an asset’s book value in accordance with accounting rules for the impairment of properties; or changes in our accrual of the asset retirement obligation. An impairment of oil and gas producing fixed assets will result if the downward revisions are so significant that the estimated future cash flows from the remaining reserves in the field are insufficient to recover the unamortized capitalized costs. Conversely, if the oil and gas reserves quantities are revised upward, our per barrel depreciation and depletion expense will be lower.
136
The application of successful efforts accounting can also cause material fluctuations between periods in exploration expenses if drilling results are different than expected or if we change our exploration and development plans. The determination that exploratory drilling was unsuccessful in finding economically producible reserves requires the immediate expensing of previously capitalized drilling costs. We make periodic assessments of the amounts included within intangible assets to determine whether capitalization is initially appropriate and should continue. Exploration wells capitalized beyond 12 months are subject to additional evaluation as to whether the facts and circumstances have changed, and therefore whether the conditions described below no longer apply. Exploration wells more than 12 months old are expensed unless: they are in an area requiring major capital expenditures before production can begin, commercially productive quantities of reserves have been found, and they are subject to further exploration or appraisal activity, in that either drilling of additional exploratory wells is underway or firmly planned for the near future; or proved reserves are identified within 12 months following the completion of exploratory drilling.
Environmental Remediation and Asset Retirement Obligations
We are required to make judgments and estimates in recording liabilities for environmental cleanup and asset retirement obligations. In accordance with applicable legal requirements and accounting practices, we recognize an environmental liability when the cash outflows are probable and the amount is reasonably estimable. We account for disbursements related to the conservation of the environment that are linked to revenue from current or future operations as costs or assets, depending on the circumstances of each disbursement. Moreover, we account for disbursements related to past operations, which no longer contribute to current or future revenues, as current period costs. We accrue a liability for a future disbursement when an obligation related to environmental remediation is identified and the amount thereof can be reasonably estimated.
Estimated liabilities for environmental remediation and asset retirement obligations are subject to change as a result of: changes in laws, regulations and their interpretation; the review of additional information on the extent and nature of site contamination; the determination of additional works that need to be undertaken; improvements in technology; the nature and timing of expenditure; foreign currency exchange rates to the extent that some of these costs are incurred in U.S. dollars; and changes in discount rates.
We do not recognize the obligations related to the costs of future retirement of assets associated with the principal refining processes for gas and petrochemicals. These assets are considered to have an indefinite useful life due to the potential for maintenance and repairs, and, accordingly, we lack sufficient information to reasonably determine the date on which they will be decommissioned.
Financial Instruments
We face market risk caused by the volatility of hydrocarbon prices, exchange rates and interest rates. In order to monitor and manage this risk, Petróleos Mexicanos and the subsidiary entities have developed policies and guidelines that promote an integrated scheme for market risk management, regulate the use of DFIs, guide the development of hedging strategies and provide strategies for the formulation of risk limits.
We enter into derivatives transactions with the sole purpose of hedging financial risks related to our operations. Nonetheless, some of these transactions do not qualify for hedge accounting treatment because they do not meet the strict requirements of IAS 39, “Financial Instruments Recognition and Measurement” for designation as hedges. They are therefore recorded in the financial statements asnon-hedge instruments or as instruments entered into for trading purposes, despite the fact that their cash flows are offset by the cash flows of the positions to which they relate. As a result, the changes in their fair value are recognized in the financing cost. See Note 16 to our consolidated financial statements included herein.
Impairment ofNon-Financial Assets
At each reporting date, we evaluate whether there is objective evidence thatnon-financial assets, other than inventory or deferred taxes, are impaired. Significant judgment is required to appropriately assess the recoverable
137
amount, represented by the higher of the value in use and the fair value, less costs to sell or otherwise dispose of our reporting units. Our future net cash flow projections are based on the best available estimates of the cash-generating unit income and expenses using forecasts, prior results and the outlook for the business’s performance and the market’s development. Our annual budget and business plan set macroeconomic forecasts for each of the cash-generating units, which are calculated based on different assumptions regarding projected commodity sales prices, volume of production and overhead costs, foreign currency exchange rates and inflation, among other items, that are used to quantify income and expense estimates. Any change in the assumptions upon which the forecasts for each cash-generating unit are based can materially affect the anticipated cash flows to be generated bynon-financial assets.
These estimated future net cash flows are discounted at present value using cash-generating unit specific discount rates determined as a function of the currency in which their respective cash flows are denominated and the risks associated with these cash flows. The discount rates are intended to reflect current market assessments of the time value of money and the risks specific to the asset. Accordingly, the various discount rates used take into consideration country risk. To ensure that the calculations are consistent and avoid double counting, the cash flow projections do not factor in risks that have already been built into the discount rates used. The discount rates used reflect current market conditions and specific risks related to those fixed assets. See Note 3(j) to our consolidated financial statements included herein.
As of December 31, 2016, we have carried out an impairment test to assess the carrying amount ofnon-financial assets, other than inventories and deferred taxes. The impairment test has resulted in a net reversal of impairment of Ps. 331.3 billion, primarily resulting from (1) a Ps. 350.7 billion reversal mainly due to the reallocation of resources to the most highly profitable fields, particularly fields with lower production costs, (2) the 20.1% appreciation of the U.S. dollar relative to the peso, (3) the change in the period used to estimate the long-term recoverable value of fixed assets from 20 to 25 years, (4) reclassification of proved reserves and (5) a decrease in the discount rate. This net reversal was partially offset by an impairment of fixed assets of Ps. 19.4 billion, mainly due to the fact that cash flows were insufficient to match the recovery value of our exploration and production segment’s Lakach project and a decrease in production at the Cangrejera and Independencia petrochemical centers.
Income Taxes
As described under “Item 4—Information on the Company—Taxes, Duties and Other Payments to the Mexican Government” above and in Note 20 to our consolidated financial statements included herein, the fiscal regime applicable to Petróleos Mexicanos and the subsidiary entities and certain subsidiary companies as of December 31, 2016 became effective on January 1, 2015. Effective as of this date, the Hydrocarbons Revenue Law and the Federal Revenue Law of the applicable year comprise the fiscal regime applicable to us.
As of December 31, 2016, Petróleos Mexicanos and the subsidiary entities are required to estimate taxable income according to IAS 12, “Income Taxes.” This process involves an estimation of our actual current tax and an assessment of temporary differences resulting from differing treatment of items for tax and accounting purposes. These differences result in deferred assets and liabilities, which are included within our consolidated balance sheet. We must then assess the likelihood that our deferred assets will be recovered from future taxable income.
Management judgment is required in determining our provision for income taxes. In the event that actual results differ from our estimates, any adjustments recorded will affect our net income during the corresponding period.
138
Exploration and Production Taxes and Duties
The fiscal regime applicable to the exploration and production assignments granted to us by the Mexican Government includes the following taxes and duties:
| | • | | Profit-Sharing Duty.The Profit-Sharing Duty is calculated based on the value of hydrocarbons produced in the relevant area minus certain permitted deductions. As of January 1, 2016, the applicable rate of this duty was 68.75%. Pursuant to the Hydrocarbons Revenue Law, the Profit-Sharing Duty decreases on an annual basis and as of January 1, 2019, it is expected to be set at 65%. |
| | • | | Hydrocarbons Extraction Duty.The Hydrocarbons Extraction Duty is calculated based on a rate that varies according to (i) the type of hydrocarbon (e.g., crude oil, associated natural gas,non-associated natural gas or condensates), (ii) the volume of production and (iii) the relevant market price. |
| | • | | Exploration Hydrocarbons Duty.The Exploration Hydrocarbons Duty is calculated by applying a quote per square kilometer for each assigned phase of production and extraction phase. Pemex Exploration and Production must make monthly payments of this duty. The Mexican Government is entitled to collect a monthly payment of Ps. 1,150 per square kilometer ofnon-producing areas. After 60 months, this tax increases to Ps. 2,750 per square kilometer for each additional month that the area is not producing. These amounts will be updated on an annual basis in accordance with the national price index. |
Contingencies
In the ordinary course of business, we are named in a number of lawsuits of various types. We evaluate the merit of each claim and assess the likely outcome. Liabilities for loss contingencies are recorded when it is probable that a liability has been incurred and the amount thereof can be reasonably estimated. We do not recognize contingent revenues, earnings or assets until their realization is assured. We have not recorded provisions related to ongoing legal proceedings whenever we do not expect an unfavorable resolution in such proceedings, except as disclosed in “Item 8—Financial Information—Legal Proceedings—Civil Actions” and Notes 6 and 25 to our consolidated financial statements included herein.
Employee Benefits
As described under “Item 6—Directors, Senior Management and Employees—Employees” below and in Note 2(m) to our consolidated financial statements included herein, as of January 1, 2016, we are operating both a defined contribution plan and defined benefit pension plan. Until December 31, 2015, we only operated a defined benefit pension plan.
Contribution Plan
Under the defined contribution plan, both we and our employees contribute to each employee’s individual account, in contrast to the existing defined benefit plan, pursuant to which only we contribute. We account for our contributions as costs, expenses or assets. Contributions to the defined contribution plan that are not expected to be fully settled within 12 months after the end of the annual reporting period in which the employee rendered related services will be discounted using the defined benefits plan discount rate.
Benefit Pension Plan
Under the defined benefit pension plan, we are the only contributor to a trust, which is managed separately. We recognize the cost for the defined benefit pension plan based on independent actuarial computations applying the projected unit credit method. Actuarial gains and losses are recognized within other comprehensive results for the period in which they occur. The costs of prior services are recognized within profit or loss for the period in which they are incurred.
139
Our net obligation with respect to the defined benefit pension plan equals the present value of the defined benefit obligation less the fair value of plan assets for which obligations have yet to be settled. The value of any asset is limited to the present value of the economic benefit represented by the plan reimbursements and reductions in future contributions to the plan.
In addition, other long-term employee benefits include seniority premiums payable for disability, death and survivors’ benefits, medical services, gas and basic food baskets for beneficiaries. Termination benefits are recognized in profit or loss for the year in which they are incurred.
Benefits to employees were approximately 34.3% and 41.2% of our total liabilities as of December 31, 2016 and 2015, respectively, and any adjustments recorded will affect our net income and/or comprehensive net income during the corresponding period.
Recently Issued Accounting Standards
Note 3(u) to our consolidated financial statements discusses new accounting interpretations and revisions under IFRS that apply to annual periods beginning on or after January 1, 2016. There are no additional standards, amendments or interpretations that, even though not yet effective, could have a material impact on our consolidated financial statements included herein.
Sales Volumes and Prices
The profitability of our operations in any particular accounting period is directly related to the sales volume of, and average realized prices for, the crude oil and natural gas that we sell. These average realized prices for crude oil and natural gas fluctuate from one period to another due to world market conditions and other factors.
Export Volumes and Prices
Pemex Exploration and Production sells crude oil to PMI, which then sells it to international clients. The volume of crude oil that we export is the volume delivered to international clients as adjusted for water content according to the bill of lading and standard market practice. PMI bases crude oil export price formulas on a basket of international reference prices and a constant set according to specific market conditions. We determine export prices of refined products, petrochemicals and natural gas by reference to market conditions and direct negotiations with our clients.
Significant changes in international crude oil prices directly affect our financial results. The impact of changes in crude oil prices on our refining activities and petrochemicals business depends on:
| | • | | the magnitude of the change in crude oil prices; |
| | • | | how quickly petroleum and petrochemical product prices in international markets adjust to reflect changes in crude oil prices; and |
| | • | | the extent to which prices in Mexico, where we sell most of our petroleum products and petrochemicals, reflect international prices for those products. |
The following table sets forth the weighted average market price per barrel of crude oil that PMI received from exports and the average price of its benchmark, West Texas Intermediate (or WTI) crude oil, for the years indicated. Between 2012 and 2013, the average prices of crude oil that we exported were higher than the average prices of WTI crude oil. As of December 31, 2014, 2015 and 2016 however, the average price of crude oil that we exported fell below the average price of WTI crude oil, primarily due to the strengthening of the WTI crude oil against the prices of certain benchmark crudes, such as West Texas Sour, Light Louisiana Sweet and Brent
140
Dated, and against the price of high sulfur fuel oil, upon which the pricing formulas for our crude oil are based. See “Item 4—Information on the Company—Business Overview—International Trading.”
| | | | | | | | | | | | | | | | | | | | |
| | | Year ended December 31, | |
| | | 2012 | | | 2013 | | | 2014 | | | 2015 | | | 2016 | |
| | | (in dollars per barrel) | |
West Texas Intermediate crude oil average price | | U.S. $ | 94.13 | | | U.S. $ | 97.90 | | | U.S. $ | 93.28 | | | U.S. $ | 48.71 | | | U.S. $ | 43.34 | |
PEMEX crude oil weighted average export price | | | 101.82 | | | | 98.46 | | | | 86.00 | | | | 43.39 | | | | 35.63 | |
| Note: | The numbers in this table are daily average prices for the full year, which differ from spot prices at year end. On April 26, 2017, the spot price for West Texas Intermediate crude oil was U.S. $49.62 per barrel and the spot price for the PEMEX crude oil basket was an estimated U.S. $42.86 per barrel. |
Sources: PMI operating statistics and Platt’s U.S. Marketscan (McGraw-Hill Company).
Domestic Prices
Until December 31, 2016, the formulas used to determine prices for petroleum products and petrochemical products sold in the Mexican market were determined by the Ministry of Finance and Public Credit and the Energy Regulatory Commission, in accordance with the Federal Public Administration Organic Law, as amended, theLey de Planeación(Planning Law), theReglamento Interior (Internal Regulations) of the Ministry of Finance and Public Credit and theLey de la Comisión Reguladora de Energía (Energy Regulatory Commission Law). The Ministry of Finance and Public Credit and the Energy Regulatory Commission received input from us and other governmental ministries through committees composed of officers of Petróleos Mexicanos, the subsidiary entities, some of the subsidiary companies, and representatives of various government ministries, including, among others, the Ministry of Finance and Public Credit, the Ministry of Energy, theSecretaría de la Función Pública (Ministry of Public Function, or the SFP) and theSecretaría de Economía (Ministry of Economy). The Ministry of Finance and Public Credit and the Energy Regulatory Commission determined wholesale and first-hand sale prices based on opportunity cost, which considers international prices, and makes adjustments to reflect transportation expenses and differences in the quality of our products relative to international benchmarks. The retail price was determined based on the wholesale price plus the value added tax, the retailer’s margin and freight costs. The Ministry of Finance and Public Credit adjusted prices for petroleum and petrochemical products sold in the Mexican market, so that they are consistent with the Mexican Government’s macroeconomic targets.
As a part of the energy reform, domestic fuel prices are to be liberalized and to be determined according to market forces by 2018. During 2017 and 2018, domestic fuel prices may vary within a specific range determined by the Mexican Government based on the references points set in 2016 and taking into account international benchmarks. For further information on domestic prices see “Item 4—Business Overview—Industrial Transformation—Refining—Pricing Decrees” and “Item 4—Business Overview—Industrial Transformation—Gas and Aromatics—Pricing Decrees” above.
141
The following table compares the average prices in nominal terms of petroleum products in Mexico and in the United States for the years indicated:
| | | | | | | | | | | | | | | | | | | | | | | | | | | | | | | | | | | | | | | | |
| | | 2012 | | | 2013 | | | 2014 | | | 2015 | | | 2016 | |
| | | Mexico | | | U.S. | | | Mexico | | | U.S. | | | Mexico | | | U.S. | | | Mexico | | | U.S. | | | Mexico | | | U.S. | |
Petroleum Products | | | | | | | | | | | | | | | | | | | | | | | | | | | | | | | | | | | | | | | | |
Unleaded regular gasoline(1) | | U.S. $ | 131.36 | | | U.S. $ | 145.42 | | | U.S. $ | 143.36 | | | U.S. $ | 139.70 | | | U.S. $ | 153.16 | | | U.S. $ | 132.21 | | | U.S. $ | 135.94 | | | U.S. $ | 91.18 | | | U.S. $ | 115.11 | | | U.S. $ | 77.28 | |
Premium gasoline(1) | | | 139.82 | | | | 159.03 | | | | 150.46 | | | | 156.82 | | | | 161.52 | | | | 152.23 | | | | 144.15 | | | | 114.42 | | | | 122.21 | | | | 102.51 | |
Diesel(1) | | | 135.95 | | | | 159.89 | | | | 147.85 | | | | 158.62 | | | | 159.37 | | | | 152.72 | | | | 144.25 | | | | 114.11 | | | | 119.69 | | | | 89.16 | |
Jet fuel(2) | | | 137.29 | | | | 129.08 | | | | 124.55 | | | | 123.11 | | | | 115.54 | | | | 113.94 | | | | 70.08 | | | | 64.67 | | | | 56.19 | | | | 53.19 | |
Kerosene(3) | | | 135.96 | | | | 128.37 | | | | 147.85 | | | | 122.78 | | | | 159.37 | | | | 113.25 | | | | 142.25 | | | | 64.07 | | | | 119.69 | | | | 52.47 | |
Natural Gas(4) | | | | | | | | | | | | | | | | | | | | | | | | | | | | | | | | | | | | | | | | |
Industrial | | | 3.65 | | | | 3.88 | | | | 5.27 | | | | 4.64 | | | | 5.70 | | | | 5.62 | | | | 3.38 | | | | 3.91 | | | | 3.56 | | | | 3.51 | |
Residential | | | 12.73 | | | | 10.65 | | | | 15.22 | | | | 10.32 | | | | 15.71 | | | | 10.97 | | | | 12.14 | | | | 10.38 | | | | 11.18 | | | | 10.06 | |
Selected Petrochemicals | | | | | | | | | | | | | | | | | | | | | | | | | | | | | | | | | | | | | | | | |
Ammonia(5) | | | 530.77 | | | | 562.83 | | | | 453.92 | | | | 505.16 | | | | 451.93 | | | | 494.33 | | | | 397.69 | | | | 361.48 | | | | 297.29 | | | | 244.81 | |
Polyethylene L.D.(6) | | | 1,667.72 | | | | 1,447.47 | | | | 1,701.00 | | | | 1,493.94 | | | | 1,928.41 | | | | 1,632.48 | | | | 1,531.95 | | | | 1,235.44 | | | | 1,509.55 | | | | 1,203.71 | |
Polyethylene H.D.(7) | | | 1,576.48 | | | | 1,359.29 | | | | 1,660.18 | | | | 1,438.83 | | | | 1,855.88 | | | | 1,570.89 | | | | 1,485.01 | | | | 1,189.62 | | | | 1,314.45 | | | | 1,071.58 | |
Styrene(8) | | | 1,825.91 | | | | 1,559.16 | | | | 1,991.57 | | | | 1,706.27 | | | | 1,839.24 | | | | 1,678.04 | | | | 1,170.08 | | | | 1,144.37 | | | | 1,117.09 | | | | 1,089.60 | |
| 1) | In U.S. dollars per barrel. Prices to final consumers including taxes. U.S. prices in Houston, Texas. |
| | Sources for data accompanying note (1): Ministry of Finance and Lundberg Retail Price Survey (Lundberg Survey Inc.). As of January 1, 2016, prices for two new designations established by the Mexican Government are included in the calculation of unleaded regular gasoline prices: (i) lower than 92 octane gasoline (previously designated as Pemex Magna) and (ii) greater than or equal to 92 octane gasoline (previously designated as Pemex Premium). |
| (2) | In U.S. dollars per barrel. Mexican prices at the gate of the refineries. U.S. spot prices in Houston, Texas (Jet Fuel Gulf Coast Waterborne). |
| | Sources for data accompanying note (2): Retail Prices Management of Pemex Industrial Transformation and Platt’s U.S. Marketscan (McGraw-Hill Company). |
| (3) | In U.S. dollars per barrel. In both countries, prices to final consumers. Mexico prices include taxes, while U.S. prices exclude taxes. |
| | Sources for data accompanying note (3): Retail Prices Management of Pemex Industrial Transformation and Petroleum Marketing Monthly, published by the Energy Information Administration (Kerosene Type Jet Fuel, end users). |
| (4) | In U.S. dollars per thousand cubic feet. Including taxes. Industrial natural gas prices for Mexico are estimated national average first-hand sales prices for the industrial sector. Industrial natural gas prices for the United States are national average prices for industrial users. Residential natural gas prices for Mexico are estimated national average prices forend-users. Residential natural gas prices for the United States are national average prices forend-users. |
| | Sources for data accompanying note (4): Retail Prices Management of Pemex Industrial Transformation, Energy Regulatory Commission and Natural Gas Navigator, published by the Energy Information Administration. |
| (5) | In U.S. dollars per ton. Prices exclude taxes. Mexican basis prices at Cosoleacaque until 2015. As of January 1, 2016 wholesale customer prices at Petrochemical Plant. Spot prices for the Caribbean. |
| | Sources for data accompanying note (5): Pemex Industrial Transformation, Fertecon Ammonia Report and Argus FMB Ammonia. |
| (6) | In U.S. dollars per ton. PX 20020 P quality. Prices exclude taxes. Mexico prices to end consumers. U.S. prices are for exports. |
| | Sources for data accompanying note (6): Retail Prices Management of Pemex Industrial Transformation and ICIS-Pricing. |
| (7) | In U.S. dollars per ton. PADMEX 65050 quality. Prices exclude taxes. Mexico prices to end consumers. U.S. prices are for exports. |
| | Sources for data accompanying note (7): Retail Prices Management of Pemex Industrial Transformation and ICIS-Pricing. |
| (8) | In U.S. dollars per ton. Prices exclude taxes. Mexico prices to end consumers. U.S. reference prices are an average of contract and spot prices. |
| | Sources for data accompanying note (8): Retail Prices Management of Pemex Industrial Transformation and ICIS-Pricing. |
IEPS Tax, Hydrocarbon Duties and Other Taxes
The following table sets forth the taxes and duties that we recorded for each of the past three years.
| | | | | | | | | | | | |
| | | Year ended December 31, | |
| | | 2014 | | | 2015 | | | 2016 | |
| | | (in millions of pesos)(1) | |
Hydrocarbon extraction duties and others | | | Ps. 760,912 | | | | Ps. 377,087 | | | | Ps. 304,813 | |
Hydrocarbons income tax | | | (18,735 | ) | | | — | | | | — | |
Income tax | | | 3,898 | | | | (45,587 | ) | | | (12,640 | ) |
IEPS tax(2) | | | — | | | | — | | | | — | |
| | | | | | | | | | | | |
Total | | | Ps. 746,075 | | | | Ps. 331,500 | | | | Ps. 292,173 | |
| | | | | | | | | | | | |
| | Note: | For a description of these taxes and duties, see “Item 4—Information on the Company—Taxes, Duties and Other Payments to the Mexican Government.”Numbers may not total due to rounding. | |
| | (1) | Figures are stated in nominal pesos. |
| | (2) | During 2014, 2015 and 2016 no IEPS tax was generated. |
Source: PEMEX’s audited financial statements, prepared in accordance with IFRS.
Relation to the Mexican Government
Petróleos Mexicanos and the subsidiary entities are public entities of the Mexican Government, rather than Mexican corporations. Therefore, we do not have the power to issue shares of equity securities evidencing
142
ownership interests and are not required, unlike Mexican corporations, to have multiple shareholders. However, our financing obligations do not constitute obligations of and are not guaranteed by the Mexican Government. The President of Mexico appoints five of the ten members of the Board of Directors of Petróleos Mexicanos as representatives of the Mexican Government, including the Secretary of Energy, who serves as the Chairperson of the Board of Directors of Petróleos Mexicanos, and the Secretary of Finance and Public Credit. The President of Mexico also appoints five independent members to the Board of Directors of Petróleos Mexicanos, whose appointments are ratified by the Senate.
Pursuant to the Petróleos Mexicanos Law, the consolidated annual budget of Petróleos Mexicanos and the subsidiary entities, including our financing program, must be submitted to the Ministry of Finance and Public Credit, which has the authority to adjust our financial balance goal and the ceiling on our wage and salary expenditures for the fiscal year. The Mexican Government incorporates our consolidated annual budget and financing program into its budget, which the Chamber of Deputies must approve each year. The Mexican Congress has the authority to adjust our annual financial balance goal at any time by amending the applicable law. In addition, any adjustment proposed by the Board of Directors of Petróleos Mexicanos to change our annual financial balance goal or increase the limit on our wage and salary expenditures or our financing program must be approved by the Chamber of Deputies.
Inflation
Mexico experienced high inflation during the 1980s. The annual rate of inflation (as measured by the change in the NCPI) decreased from a high of 159.2% in 1987 to 11.9% in 1992, 8.0% in 1993 and 7.1% in 1994. However, the economic events that followed the devaluation of the peso against the U.S. dollar in late 1994 and 1995, along with turbulence in international financial markets, caused inflation to increase to 52.0% in 1995. After 1995, inflation decreased to 27.7% in 1996 and 15.7% in 1997. The annual inflation rate was 3.6% in 2012, 4.0% in 2013, 4.1% in 2014, 2.1% in 2015 and 3.4% in 2016.
We do not use inflation accounting, unless the economic environment in which we operate qualifies as “hyperinflationary,” as defined by IFRS. In accordance with IFRS, the threshold for considering an economy hyperinflationary, and consequently, adjusting certain line items in the financial statements for inflation, is reached when the cumulative three-year inflation rate is 100% or more. Because the economic environment in the three-year periods ended December 31, 2014, 2015 and 2016 did not qualify as hyperinflationary, we did not use inflation accounting to prepare our consolidated financial statements as of December 31, 2014, 2015 and 2016 included herein.
Consolidation
Our financial statements consolidate the results of Petróleos Mexicanos, the subsidiary entities and the subsidiary companies. For further information about the basis for our consolidation see Note 3(a). For a list of our consolidated subsidiary companies, see Note 4 to our consolidated financial statements included herein.
Export Agreements
Though Mexico is not a member of OPEC, it has periodically announced increases and decreases in our crude oil exports, reflecting production revisions made by other oil producing countries in order to contribute to crude oil prices stabilization. However, we have not changed our export goals because of announcements made by OPEC since 2004, and we believe that Mexico has no plans to change our current level of crude oil exports.
143
Results of Operations of Petróleos Mexicanos, the Subsidiary Entities and the Subsidiary Companies—For the Year Ended December 31, 2016 Compared to the Year Ended December 31, 2015
Total Sales
Total sales decreased by 7.4%, or Ps. 86.9 billion, in 2016, from Ps. 1,166.4 billion in 2015 to Ps. 1,079.5 billion in 2015, primarily due to a decrease in our domestic sales following the decrease in average sales prices of our petroleum products and the decrease in volume of sales of liquefied natural gas in Mexico, in each case, for the reasons explained in further detail below. This decrease in total sales was partially offset by a 12.7% increase in services income.
Domestic Sales
Domestic sales decreased by 10.2% in 2016, from Ps. 746.2 billion in 2015 to Ps. 670.0 billion in 2016, primarily due to a decrease in the average prices of fuel oil, diesel, gasoline and liquefied natural gas. Domestic sales of petroleum products decreased by 9.5% in 2016, from Ps. 585.0 billion in 2015 to Ps. 529.3 billion in 2016, primarily due to a 5.5% decrease in the average price of gasoline, a 15.9% decrease in the average price of diesel, and a 36.5% decrease in the average price of fuel oil as a result of decreased demand from the CFE. These price decreases were partially offset by a 4.3% increase in the volume of sales of gasoline due to an increase in demand from retail service stations and an 8.1% increase in the volume of sales of jet fuel. Domestic sales of natural gas increased by 9.2% in 2016, from Ps. 54.5 billion in 2015 to Ps. 59.5 billion in 2016, primarily due to a 6.4% increase in the volume of sales of natural gas and a 2.9% increase in the average sales price of natural gas. Domestic sales of liquefied natural gas decreased by 34.9% in 2016, from Ps. 78.2 billion in 2015 to Ps. 50.9 billion in 2016, primarily as a result of a 27.1% decrease in the volume of sales of liquefied natural gas due to the market share loss that resulted from increased competition due to the liberalization of imports in 2016 and a 10.8% decrease in the average sales price of liquefied natural gas. Domestic petrochemical sales (including sales of certainby-products of the petrochemical production process) increased by 6.0%, from Ps. 28.5 billion in 2015 to Ps. 30.2 billion, primarily as a result of Ps. 2.6 billion in petrochemical sales by Grupo Fertinal.
Export Sales
Export sales decreased by 3.0%in peso terms in 2016 (with U.S. dollar-denominated export revenues translated to pesos at the exchange rate on the date of the corresponding export sale), from Ps. 407.2 billion in 2015 to Ps. 395.1 billion in 2016. This decrease was primarily due to a 7.4% decrease in the volume of petroleum product exports, a 17.4% decrease in the weighted average Mexican crude oil export price, an 18.5% decrease in the export sales of fuel oil, mainly due to a decrease in the average sales price and volume of sales of fuel oil, and a 13.7% decrease in the export sales of naphthas. This decrease in export sales was partially offset by a 2.1% increase in the volume of sales of crude oil and a Ps. 2,920.7 million increase in the volume of sales of petrochemical products.
Excluding the trading activities of the Trading Companies (in order to show only the amount of export sales related to the subsidiary entities), export sales by the subsidiary entities to the Trading Companies and third parties decreased by 0.5%in peso terms, from Ps. 329.6 billion in 2015 to Ps. 327.8 billion in 2016. In U.S. dollar terms, excluding the trading activities of the Trading Companies, total export sales (which are U.S. dollar-denominated) decreased by 16.2% in 2016, from U.S. $20.9 billion in 2015 to U.S. $17.5 billion in 2016. This was primarily due to the 17.4% decrease in the weighted average Mexican crude oil export price and a 2.1% increase in the volume of crude oil exports. The trading and export activities of the Trading Companies generated additional marginal revenues of Ps. 67.4 billion in 2016, 13.2% lower in peso terms than the Ps. 77.5 billion of additional revenues generated in 2015, mainly due to a decrease in the average prices of diesel and gasoline. The weighted average price per barrel of crude oil that PMI sold to third parties in 2016 was U.S. $35.63, or 17.4%, lower than the weighted average price of U.S. $43.12 in 2015.
144
Crude oil and condensate export sales to PMI accounted for 88.1% of total export sales (excluding the trading activities of the Trading Companies) in 2016, as compared to 87.4% in 2015. These crude oil and condensate sales increased in peso terms by 0.2% in 2016, from Ps. 288.2 billion in 2015 to Ps. 288.6 billion in 2016, and decreased in U.S. dollar terms by 14.9% in 2016, from U.S. $18.2 billion in 2015 to U.S. $15.5 billion in 2016. The weighted average price per barrel of crude oil that Pemex Exploration and Production sold to PMI for export in 2016 was U.S. $35.17, 17.6% lower than the weighted average price of U.S. $42.70 in 2015.
Export sales of petroleum products, including natural gas and natural gas liquids, by our industrial transformation segment to the Trading Companies and third parties decreased from 12.4% of total export sales (excluding the trading activities of the Trading Companies) in 2015 to 10.9% of those export sales in 2016. Export sales of petroleum products, including products derived from natural gas and natural gas liquids, decreased by 13.0%, from Ps. 40.9 billion in 2015 to Ps. 35.6 billion in 2016, primarily due to a 5.5% decrease in the volume of exports of fuel oil and a 16.8% decrease in the volume of exports of naphtha, as well as a decrease in the average sales price for both products. In U.S. dollar terms, export sales of petroleum products, including products derived from natural gas and natural gas liquids, decreased by 26.1%, from U.S. $2.6 billion in 2015 to U.S. $1.9 billion in 2016. Export sales of natural gas decreased by 23.1%, from Ps. 27.3 million in 2015 to Ps. 21.0 million in 2016. This was primarily due to a decrease in the production ofnatural gas.
Petrochemical products accounted for the remainder of export sales in 2015 and 2016. Export sales of petrochemical products (including certainby-products of the petrochemical process) increased by Ps. 2,920.7 million in 2016, from Ps. 616.8 million in 2015 to Ps. 3,537.5 million in 2016, primarily due to inclusion of export sales of Grupo Fertinal during 2016. In U.S. dollar terms, export sales of petrochemical products (including certainby-products of the petrochemical process) increased by Ps. 6,208.8 million in 2016, from Ps. 39.2 million in 2015 to Ps. 6,248.0 million in 2016.
Services Income
Services income increased by 11.7% in 2016, from Ps. 12.9 billion in 2015 to Ps. 14.4 billion in 2016, primarily as a result of an increase in transportation services supplied by Pemex Logistics to CENAGAS and an increase in freight services provided by Pemex Industrial Transformation to third parties.
Cost of Sales
Cost of sales decreased by 3.1%, from Ps. 895.1 billion in 2015 to Ps. 867.6 billion in 2016. This decrease was mainly due to: (1) a Ps. 23.4 billion decrease in operating expenses, primarily due to cost saving measures; (2) a Ps. 25.0 billion decrease in cost of employee benefits, mainly due to the ongoing benefits resulting from the modifications made to our pension regime in 2015; (3) a Ps. 16.9 billion decrease in the amortization of wells as a result of the net effect of the impairment recorded in 2015 of new investments made in 2016; and (4) a Ps. 5.5 billion decrease in hydrocarbon extraction and exploration duties and taxes due to decreased production and lower average sales prices in 2016 as compared to 2015. This decrease was partially offset by (1) a Ps. 46.9 billion increase in the purchases of imports, primarily gasoline and diesel, due to an increase in the price of imports owing to the 20.1% appreciation of the U.S. dollar relative to the peso in 2016 and a 9.3% increase in the volume of imports; and (2) a Ps. 5.9 billion increase in the cost of unsuccessful wells.
Impairment of Wells, Pipelines, Properties, Plant and Equipment
Impairment of wells, pipelines, properties, plant and equipment decreased by Ps. 809.3 billion in 2016, from an impairment of Ps. 477.9 billion in 2015 to a net reversal of Ps. 331.3 billion in 2016, mainly due to the change in the period used to estimate long-term prices of proved reserves and the recoverable amount of fixed assets from 20 to 25 years in accordance with changes to official guidelines; the appreciation of the U.S. dollar relative to the peso; the reallocation of resources to the most highly profitable fields, particularly fields with lower production costs; and an increase in the average price of crude oil.
145
Net Periodic Cost of Employee Benefits
During 2015, we had a Ps. 196.1 billion increase in employee benefits in connection with the negotiation of our pension regime in 2015 as described in “Item 6—Directors, Senior Management and Employees—Employees.” Ps. 92.2 billion of this benefit was recognized under net periodic cost of employee benefits, and Ps. 103.9 billion was recognized under general expenses. We do not have a similar benefit to record under net periodic cost of employee benefits for 2016.
General Expenses
General expenses increased by Ps. 100.4 billion, from Ps. 37.5 billion in 2015 to Ps. 137.9 billion in 2016. This increase was primarily due to aone-time Ps. 103.9 billion benefit recognized in our cost of employee benefits in connection with the negotiation of our pension regime in 2015 as described in “Item 6—Directors, Senior Management and Employees—Employees.” Excluding thisone-time benefit to cost of employee benefits, general expenses decreased by Ps. 3.5 billion, from Ps. 141.4 billion in 2015 to Ps. 137.9 billion in 2016, primarily due to the effects of our 2016 Budget Adjustment Plan.
Other Revenues/Expenses, Net
Other revenues, net, increased by Ps. 21.4 billion in 2016, from other expenses, net, of Ps. 2.4 billion in 2015 to other revenues, net, of Ps. 19.0 billion in 2016. This increase was primarily due to a Ps. 28.4 billion fiscal support from the Ministry of Finance and Public Credit in connection with the Profit-Sharing Duty, due to the decrease in average prices and production of crude oil, and a Ps. 15.2 billion profit from the sale of our 50% interest in Gasoductos de Chihuahua. This increase in other revenues, net was partially offset by an expense of Ps. 27.7 billion that was recognized following our transfer of pipelines and other assets to CENAGAS, due to the difference between the book value of these assets and the amount paid by CENAGAS for these assets.
Financing Income
Financing income decreased by Ps. 1.2 billion in 2016, from Ps. 15.0 billion in 2015 to Ps. 13.8 billion in 2016, primarily due to a decrease in the amount we were able to invest during the year, which was partially offset by yield derived from the promissory notes issued by the Mexican Government in connection with our pension liabilities.
Financing Cost
Financing cost increased by 45.7% in 2016, from Ps. 67.8 billion in 2015 to Ps. 98.8 billion in 2016, primarily due to an increase in interest expense in 2016 following higher levels of indebtedness and a 20.1% depreciation of the peso against the U.S. dollar in 2016 as compared to 2015.
Derivative Financial Instruments Income (Cost)
Derivative financial instruments income (cost), net, decreased by Ps. 7.4 billion, from a net cost of Ps. 21.4 billion in 2015 to a net cost of Ps. 14.0 billion in 2016, primarily due to a decrease in the appreciation of the U.S. dollar relative to other foreign currencies we hedge, the restructuring of certain of our derivative financial instruments and favorable changes in market variables involved in our calculation of fair value of these instruments, including exchange rates, foreign currency interest rates and our counterparties’ credit spread.
Exchange Loss, Net
A substantial portion of our indebtedness, 83.2% as of December 31, 2016, is denominated in foreign currencies. Our exchange loss increased by Ps. 99.2 billion, from an exchange loss of Ps. 154.8 billion in 2015 to
146
an exchange loss of Ps. 254.0 billion in 2016, primarily as a result of the 5.3% increase in our indebtedness that is denominated in other currencies and the higher rate of depreciation of the peso against the U.S. dollar, which depreciated by 20.1% in 2016 as compared to 16.9% in 2015. However, due to the fact that over 95.7% of our revenues from exports and domestic sales are referenced to prices denominated in U.S. dollars, and only 71.0 % of our expenses, including financing costs, are linked to U.S. dollar prices, the depreciation of the peso relative to the U.S. dollar did have a significant effect on our ability to meet U.S. dollar-denominated financial obligations and improved our ability to meet peso-denominated financial obligations in 2016. The value of the peso in U.S. dollar terms depreciated by 20.1% in 2016, from Ps. 17.2065 = U.S. $1.00 on December 31, 2015 to Ps. 20.6640 = U.S. $1.00 on December 31, 2016, as compared to a 16.9% depreciation of the peso in U.S. dollar terms in 2015.
Taxes, Duties and Other
Hydrocarbon extraction duties and other duties and taxes paid decreased by 20.2% in 2015, from Ps. 331.5 billion in 2015 to Ps. 264.5 billion in 2016, primarily due to the 17.4% decrease in the weighted average price of the Mexican crude oil export price, from U.S. $43.12 per barrel in 2015 to U.S. $35.63 per barrel in 2016. Income related duties and taxes represented 24.9% of total sales in 2016, as compared to 24.9% of total sales in 2015.
Net Income/Loss
In 2016, we had a net loss of Ps. 191.1 billion from Ps. 1,079.5 billion in total sales revenues, as compared to a net loss of Ps. 712.6 billion from Ps. 1,166.4 billion in total sales revenues in 2015. This decrease in net loss was primarily explained by:
| | • | | a Ps. 809.2 billion decrease in the impairment of fixed assets; |
| | • | | a Ps. 67.0 billion decrease in taxes and other duties, mainly due to the decrease in the weighted average price of the Mexican crude oil export price; and |
| | • | | a Ps. 21.4 billion increase in other revenues, net. |
This decrease was partially offset by
| | • | | a Ps. 172.3 billion increase in the net periodic cost of employee benefits, mainly due to theone-time Ps. 196.0 billion decrease in pension liabilities recorded in 2015 as a result of modifications made to our pension regime; |
| | • | | a Ps. 99.2 billion increase in exchange loss, net; |
| | • | | a Ps. 86.8 billion decrease in total sales, mainly due to the decrease in average sales prices of our petroleum products and the decrease in volume of sales of liquefied natural gas in Mexico; and |
| | • | | a Ps. 24.9 billion increase in financing costs, net. |
Other Comprehensive Results
In 2016, we had a net gain of Ps. 127.9 billion in other comprehensive results, as compared to a net gain of Ps. 88.6 billion in 2015, primarily due to a decrease in the reserve for employee benefits that resulted from the increase in the discount rate and expected rate of return on plan assets used in the actuarial computation method from 7.4% in 2015 to 8.2% in 2016 and Ps. 21.4 in accumulated gains from the foreign currency translation effect.
147
Results of Operations of Petróleos Mexicanos, the Subsidiary Entities and the Subsidiary Companies—For the Year Ended December 31, 2015 Compared to the Year Ended December 31, 2014
Total Sales
Total sales decreased by 26.5%, or Ps. 420.3 billion, in 2015, from Ps. 1,586.7 billion in 2014 to Ps. 1,166.4 billion in 2015, primarily due to the decrease in average sales prices of Mexican crude oil, petroleum products and natural gas in the international markets. During 2015, the weighted average Mexican crude oil export price decreased by 50.3%, from U.S. $86.00 per barrel in 2014 to U.S. $42.70 per barrel in 2015. Crude oil export volumes increased by 2.3% in 2015 as compared to 2014. The impact of price decreases on both domestic and export sales is explained in further detail below.
Domestic Sales
Domestic sales decreased by 21.0% in 2015, from Ps. 945.0 billion in 2014 to Ps. 746.2 billion in 2015, primarily due to a decrease in the average prices of gasoline, diesel, fuel oil and jet fuel. Domestic sales of petroleum products decreased by 20.3% in 2015, from Ps. 830.5 billion in 2014 to Ps. 662.3 billion in 2015, primarily due to decreases in the average prices of gasoline, diesel, turbosine and fuel oil. Domestic sales of natural gas and liquefied natural gas decreased by 30.0% in 2015, from Ps. 77.8 billion in 2014 to Ps. 54.5 billion in 2015, primarily as a result of lower prices for these products. Domestic petrochemical sales (including sales of certainby-products of the petrochemical production process) decreased by 19.4%, from Ps. 36.6 billion in 2014 to Ps. 29.5 billion in 2015, primarily as a result of lower prices for these products.
Export Sales
Export sales decreased by 35.4% in peso terms in 2015 (with U.S. dollar-denominated export revenues translated to pesos at the exchange rate on the date of the corresponding export sale), from Ps. 630.3 billion in 2014 to Ps. 407.2 billion in 2015. This decrease was primarily due to a 50.3% decrease in the weighted average Mexican crude oil export price. The decrease in export sales was partially offset by a 2.3% increase in the volume of crude oil exports in 2015.
Excluding the trading activities of the Trading Companies (in order to show only the amount of export sales related to the subsidiary entities), export sales by the subsidiary entities to the Trading Companies and third parties decreased by 39.8% in peso terms, from Ps. 546.6 billion in 2014 to Ps. 329.0 billion in 2015. In U.S. dollar terms, excluding the trading activities of the Trading Companies, total export sales (which are U.S. dollar-denominated) decreased by 49.4% in 2015, from U.S. $41.2 billion in 2014 to U.S. $20.9 billion in 2015. This was primarily due to the 50.5% decrease in the weighted average Mexican crude oil export price and a 2.3% increase in the volume of crude oil exports. The trading and export activities of the Trading Companies generated additional marginal revenues of Ps. 78.2 billion in 2015, 6.8% higher in peso terms than the Ps. 83.9 billion of additional revenues generated in 2014, mainly due to higher international prices of gasoline traded by the Trading Companies. The weighted average price per barrel of crude oil that the Trading Companies sold to third parties in 2015 was U.S. $43.29, or 49.6%, lower than the weighted average price of U.S. $86.00 in 2014.
Crude oil export sales to PMI accounted for 87.6% of total export sales (excluding the trading activities of the Trading Companies) in 2015, as compared to 87.0% in 2014. These crude oil sales decreased in peso terms by 39.3% in 2015, from Ps. 475.1 billion in 2014 to Ps. 288.2 billion in 2015, and decreased in U.S. dollar terms by 48.9% in 2015, from U.S. $35.8 billion in 2014 to U.S. $18.3 billion in 2015. The weighted average price per barrel of crude oil that Pemex Exploration and Production sold to PMI for export in 2015 was U.S. $42.70, 50.3% lower than the weighted average price of U.S. $86.0 in 2014.
Export sales of petroleum products, including natural gas and natural gas liquids, by our refining and gas and petrochemicals segments to the Trading Companies and third parties decreased from 12.7% of total export
148
sales (excluding the trading activities of the Trading Companies) in 2014 to 12.1% of those export sales in 2015. Export sales of petroleum products, including products derived from natural gas and natural gas liquids, decreased by 42.6%, from Ps. 69.5 billion in 2014 to Ps. 39.9 billion in 2015, primarily due to a decrease in prices and in the volume of fuel oil sold. In U.S. dollar terms, export sales of petroleum products, including products derived from natural gas and natural gas liquids, decreased by 52.8%, from U.S. $5.3 billion in 2014 to U.S. $2.5 billion in 2015. Export sales of natural gas decreased by 50.0%, from Ps. 0.06 billion in 2014 to Ps. 0.03 billion in 2015. This was primarily due to a decrease in the price and volume of sales of natural gas sold as a result of lower demand in the international market.
Petrochemical products accounted for the remainder of export sales in 2014 and 2015. Export sales of petrochemical products (including certainby-products of the petrochemical process) decreased by 47.0% in 2015, from Ps. 1.7 billion in 2014 to Ps. 0.9 billion in 2015, primarily as a result of decreases in the prices and volumes of sales of styrene, sulfur and ethylene. In U.S. dollar terms, export sales of petrochemical products (including certainby-products of the petrochemical process) decreased by 57.5% in 2015, from U.S. $131.2 million in 2014 to U.S. $55.8 million in 2015.
Services Income
Services income increased by 13.2% in 2015, from Ps. 11.4 billion in 2014 to Ps. 12.9 billion in 2015, primarily as a result of a Ps. 1.0 billion increase in services provided by Pemex Logistics to third parties, a Ps. 0.7 billion increase in revenues from freight and managerial services provided by Pemex Industrial Transformation and a Ps. 0.2 billion increase in insurance revenues from Kot Insurance Company, AG.
Cost of Sales, Impairment of Wells, Pipelines, Properties, Plant and Equipment, Cost of Employee Benefits and General Expenses
Cost of sales increased by 6.2%, from Ps. 842.6 billion in 2014 to Ps. 895.1 billion in 2015. This increase was mainly due to: (1) the recognition of Ps. 53.9 billion in new hydrocarbon extraction and exploration duties and taxes in connection with the new fiscal regime that took effect on January 1, 2015; (2) a Ps. 20.4 billion increase in the amortization of wells; and (3) an increase of Ps. 11.1 billion in the cost of unsuccessful wells. This increase was partially offset by a Ps. 54.5 billion decrease in the purchases of imports, primarily gasoline and diesel.
Impairment of wells, pipelines, properties, plant and equipment increased by Ps. 455.3 billion, from Ps. 22.6 billion in 2014 to Ps. 477.9 billion in 2015, mainly due to the decrease in future cash flows as a result of lower hydrocarbon prices, adjustments in the discount rates and changes in the criteria for identifying the cash-generating units of the refineries.
During 2015 we had a Ps. 103.9 billion decrease in net periodic cost of employee benefits recognized as a separate line item due to modifications to our pension regime.
General expenses decreased by 1.5%, from Ps. 143.5 billion in 2014 to Ps. 141.4 billion in 2015. This decrease was primarily due to a Ps. 2.5 billion decrease in the net periodic cost of employee benefits recognized under general expenses due to modifications to our pension regime.
Other Revenues/Expenses, Net
Other revenues, net, decreased by 106.4% in 2015, from other revenues, net, of Ps. 37.6 billion in 2014 to other expenses, net, of Ps. 2.4 billion in 2015. This decrease was primarily due to a Ps. 40.0 billion decrease in the credit attributable to the negative IEPS tax rate in 2015 as compared to 2014. The credit attributable to the negative IEPS tax rate is generated when the prices at which we sell gasoline and diesel in the domestic market are lower than the international market prices for such products. We recognized revenues from IEPS tax credits of Ps. 2.5 billion in 2015, as compared to Ps. 43.1 billion in 2014.
149
Financing Income
Financing income increased by Ps. 12.0 billion in 2015, from Ps. 3.0 billion in 2014 to Ps. 15.0 billion in 2015, primarily due to the effect of changes to the discount rate used in the computation of the provision for the plugging of wells.
Financing Cost
Financing cost increased by 31.4% in 2015, from Ps. 51.6 billion in 2014 to Ps. 67.8 billion in 2015, primarily due to an increase in interest expense in 2015 following higher levels of indebtedness and the depreciation of the peso against the U.S. dollar in 2015 as compared to 2014.
Derivative Financial Instruments Income (Cost)
Derivative financial instruments income (cost), net, increased by Ps. 12.0 billion, from a net cost of Ps. 9.4 billion in 2014 to a net cost of Ps. 21.4 billion in 2015, primarily due to an increase in costs associated with certain derivative financial instruments as a result of the appreciation of the U.S. dollar relative to other foreign currencies that we hedge.
Exchange Loss, Net
A substantial portion of our indebtedness, 77.9% as of December 31, 2015, is denominated in foreign currencies. Our exchange loss increased by Ps. 77.8 billion, from an exchange loss of Ps. 77.0 billion in 2014 to an exchange loss of Ps. 154.8 billion in 2015, primarily as a result of the higher rate of depreciation of the peso against the U.S. dollar, which depreciated by 16.9% in 2015 as compared to 12.6% in 2014. However, due to the fact that over 93.7% of our revenues from exports and domestic sales are referenced to prices denominated in U.S. dollars, and only 68.2 % of our expenses, including financing costs, are linked to U.S. dollar prices, the depreciation of the peso relative to the U.S. dollar did have a significant effect on our ability to meet U.S. dollar-denominated financial obligations and improved our ability to meet peso-denominated financial obligations in 2015. The value of the peso in U.S. dollar terms depreciated by 16.9% in 2015, from Ps. 14.7180 = U.S. $1.00 on December 31, 2014 to Ps. 17.2065 = U.S. $1.00 on December 31, 2015, as compared to a 12.6% depreciation of the peso in U.S. dollar terms in 2014.
Taxes, Duties and Other
Hydrocarbon extraction duties and other duties and taxes paid decreased by 55.6% in 2015, from Ps. 746.1 billion in 2014 to Ps. 331.5 billion in 2015, primarily due to the 50.3% decrease in the weighted average price of the Mexican crude oil basket, from U.S. $86.00 per barrel in 2014 to U.S. $42.70 per barrel in 2015. Income related duties and taxes represented 28.4% of total sales in 2015, as compared to 47.0% of total sales in 2014, partly because certain hydrocarbon extraction and exploration duties and taxes under the new tax regime are recognized under cost of sales, as described above. Prior to January 1, 2015, all of our duties and taxes were income-based taxes and were therefore recognized under the “taxes, duties and other” line item.
Net Income/Loss
In 2015, we had a net loss of Ps. 712.6 billion (U.S. $41.4 billion) from Ps. 1,166.4 billion in total sales revenues, as compared to a net loss of Ps. 265.5 billion (U.S. $15.4 billion) from Ps. 1,586.7 billion in total sales revenues in 2014. This increase in net loss was primarily explained by: (1) a Ps. 455.3 billion increase in impairment of fixed assets, which was mainly due to the decrease in future cash flows as a result of lower hydrocarbon prices; (2) a Ps. 420.4 billion decrease in sales mainly due to a decrease in the Mexican crude oil export price and decrease in our crude oil production and domestic sales prices; (3) a Ps. 77.8 billion increase in foreign exchange loss; (4) a Ps. 39.9 billion decrease in other revenues, net; and (5) a Ps. 16.2 billion increase in
150
financing costs, net. This increase was partially offset by a Ps. 414.6 billion decrease in taxes and duties and a Ps. 184.3 billion decrease in the net periodic cost of employee benefits following modifications to our pension regime.
Other Comprehensive Results
In 2015, we had a net gain of Ps. 88.6 billion in other comprehensive results, as compared to a net loss of Ps. 265.3 billion in 2014, primarily due to a decrease in the reserve for employee benefits that resulted from the increase in the discount rate and expected rate of return on plan assets used in the actuarial computation method from 6.98% in 2014 to 7.41% in 2015.
Changes in Statement of Financial Position of Petróleos Mexicanos, the Subsidiary Entities and the Subsidiary Companies—from December 31, 2015 to December 31, 2016
Assets
Cash and cash equivalents increased by Ps. 54.2 billion, or 49.5%, in 2016, from Ps. 109.4 billion as of December 31, 2015 to Ps. 163.5 billion as of December 31, 2016. This increase was mainly due to an increase in net cash flows from financing activities, and was partially offset by tax and debt payments and operating and investment commitments.
Accounts receivable, net, increased by Ps. 54.0 billion, or 68.1%, in 2016, from Ps. 79.2 billion as of December 31, 2015 to Ps. 133.2 billion as of December 31, 2016, primarily explained by: (1) a Ps. 18.7 billion increase in accounts receivable from tax credits associated with hydrocarbon extraction duties; (2) a Ps. 17.7 billion increase in accounts receivable from sales to our international customers, mainly due to the 20.1% appreciation of the U.S. dollar relative to the peso during 2016 and the 56.1% increase in the weighted average market price per barrel of crude oil during 2016, from U.S. $28.69 per barrel in December 2015 to U.S. $44.79 per barrel in December 2016; (3) a Ps. 12.6 billion increase in accounts receivable from sales to domestic customers, mainly due to higher accounts receivable from gasoline distributors; and (4) a Ps. 7.9 billion increase in accounts receivable from sundry debtors, mainly due to Ps. 6.6 billion in customer services reimbursements and Ps. 3.7 billion as the current portion of the promissory notes issued by the Mexican Government in relation to our pension liabilities.
Held-for-salenon-financial assets decreased by Ps. 25.8 billion, or 77.5%, in 2016, from Ps. 33.2 billion as of December 31, 2015 to Ps. 7.5 billion as of December 31, 2016. This decrease was mainly due to the transfer of assets to CENAGAS for Ps. 33.2 billion and was partially offset by the reclassification of Ps. 7.5 billion from fixed assets toheld-for-sale currentnon-financial assets in connection with the delivery to third parties of 22 blocks of titles that were temporarily assigned to us in Round Zero pursuant to Round 1.3 on May 10, 2016. On June 29, 2016, we submitted an application for compensation for the fixed assets located in these blocks to the Ministry of Energy. For more information, see Note 9 to our consolidated financial statements included herein.
Derivative financial instruments increased by Ps. 3.3 billion in 2016, from Ps. 1.6 billion as of December 31, 2015 to Ps. 4.9 billion as of December 31, 2016. This increase was mainly due to the restructuring of certain derivative financial instruments and changes in market variables involved in the calculation of the fair value of derivative financial instruments, such as exchange rates, foreign currency interest rates and our counterparties’ credit spread.
Wells, pipelines, properties, plant and equipment increased by Ps. 323.3 billion in 2016, primarily due to a net reversal of impairment in the amount of Ps. 331.3 billion. See “—Results of Operations of Petróleos Mexicanos, the Subsidiary Entities and the Subsidiary Companies—For the Year Ended December 31, 2016 Compared to the Year Ended December 31, 2015—Impairment of Wells, Pipelines, Properties, Plant and Equipment” above in this Item 5 for more information.
151
Long-term notes receivable increased by Ps. 98.6 billion, or 197.2%, in 2016, from Ps. 50.0 billion as of December 31, 2015 to Ps. 148.6 billion as of December 31, 2016, mainly due to the Ps. 184.2 billion in promissory notes issued by the Mexican Government, which replaced the Ps. 50.0 billion promissory note issued to us in 2015 in connection with our pension liabilities.
Intangible assets decreased by Ps. 5.7 billion, or 39.6%, in 2016, from Ps. 14.3 billion as of December 31, 2015 to Ps. 8.6 billion as of December 31, 2016, mainly due to a decrease in wells under construction but not allocated to a reserve.
Liabilities
Total debt, including accrued interest, increased by Ps. 489.8 billion, or 32.8%, in 2016, from Ps. 1,493.4 billion as of December 31, 2015 to Ps. 1,983.2 billion as of December 31, 2016, mainly due to higher levels of indebtedness and a 20.1% depreciation of the peso against the U.S. dollar in 2016 as compared to 2015.
Line items related to suppliers and contractors decreased by Ps. 15.7 billion, or 9.4%, in 2016, from Ps. 167.3 billion as of December 31, 2015 to Ps. 151.6 billion as of December 31, 2016, primarily due to the payment programs established during 2016 to address the total outstanding balance of payments due to suppliers and contractors at year end.
Taxes and duties payable increased by Ps. 5.8 billion, or 13.5%, in 2016, from Ps. 43.0 billion as of December 31, 2015 to Ps. 48.8 billion as of December 31, 2016, primarily due to (1) a Ps. 8.9 billion increase in the value added tax payable and the Profit-Sharing Duty and (2) a Ps. 2.0 billion decrease in the provision for income tax.
Derivative financial instruments liabilities increased by Ps. 3.6 billion, or 13.1%, in 2016, from Ps. 27.3 billion as of December 31, 2015 to Ps. 30.9 billion as of December 31, 2016. This increase was mainly due to the negotiation of new derivative financial instruments in 2016, the restructuring of certain existing derivative financial instruments and changes in market variables involved in the calculation of the fair value of derivative financial instruments, such as exchange rates, foreign currency interest rates and our counterparties’ credit spread.
Employee benefits liabilities decreased by Ps. 59.0 billion, or 4.6%, in 2016, from Ps. 1,279.4 billion as of December 31, 2015 to Ps. 1,220.4 billion as of December 31, 2016. This decrease was primarily due to (1) the effect of changes to the discount rate and expected rate of return on plan assets used in the actuarial computation method from 7.4% in 2015 to 8.2% in 2016; (2) contributions made to theFondo Laboral Pemex(Pemex Labor Fund) trust; and (3) payments made for medical and hospital services and post-mortem benefits provided to retired employees and certain of their beneficiaries. This decrease was partially offset by the recognition of net cost of the period of employee benefits.
Equity (Deficit), Net
Equity (deficit), net, increased by Ps. 104.1 billion, or 7.8 %, in 2016, from negative Ps. 1,331.7 billion as of December 31, 2015 to negative Ps. 1,233.0 billion as of December 31, 2016. This increase was mainly due to (1) the equity contributions made by the Mexican Government to Petróleos Mexicanos in 2016 in the form of Certificates of Contribution “A” in the total amount of Ps. 161.9 billion; (2) a Ps. 108.2 billion increase in actuarial gains on employee benefits, resulting from the increase in the discount rate used in the actuarial computation method from 7.4% in 2015 to 8.2% in 2016 and an increase in the expected returns for fixed assets; and (3) Ps. 21.4 billion in accumulated gains from the foreign currency translation effect. This increase was partially offset by our net loss for the year of Ps. 191.1 billion.
152
Liquidity and Capital Resources
Overview
During 2016, we were able to strengthen our liquidity position despite a 7.5% decrease in total sales, from Ps. 1,166.4 billion in 2015 to Ps. 1,079.5 billion in 2016, and a Ps. 100 billion budget reduction, by increasing our cash and cash equivalents and accounts receivable, decreasing our accounts payable to suppliers and increasing our borrowing base under lines of credit.
Our principal uses of funds in 2016 were primarily the repayment of debt, strengthening our cash flow through the actions listed below, and, to a lesser extent, the acquisition of wells, pipelines, properties, plant and equipment, sale ofnon-essential assets and business acquisitions, which collectively amounted to Ps. 134.5 billion. We met this requirement primarily with cash provided by cash flows from borrowings, which amounted to Ps. 842.0 billion. During 2016, our net cash flow from operating activities was less than the resources needed to fund our capital expenditures and other expenses. See “—Overview—Redefinition of Petróleos Mexicanos as a State-Owned Productive Company” above for more information and a discussion of actions being taken in response to this imbalance of resources.
For 2016, our capital expenditures decreased by approximately 22.9% from 2015, primarily due to the expected price levels of our products in 2016 and our expected borrowing capacity. Additionally, one of the most critical problems we faced and sought to address in 2016 was our accounts payable to suppliers. As of December 31, 2016, we owed our suppliers approximately Ps. 151.6 billion as compared to Ps. 167.3 billion as of December 31, 2015. As of December 31, 2016, we have paid the total outstanding balance due to suppliers and contractors as of December 31, 2015 as part of our effort to repay such balances. The average number of days outstanding of our accounts payable decreased from 90 days as of December 31, 2015 to 81 days as of December 31, 2016. Despite these obligations, we believe net cash flows from our operating and financing activities will be sufficient to meet our working capital, debt service and capital expenditure requirements in 2017 because, since early 2015, we and the Mexican Government have adjusted investment, taxation and financing plans to address declining oil prices and maintain our financial strength and flexibility as described above under “Redefinition of Petróleos Mexicanos as a State-Owned Productive Company” and as further described below:
| | • | | Changes to Our Business Plan.We have implemented certain measures intended to improve our financial situation, including the reduction of our budget in February 2015 and in February 2016, the implementation of a plan to reduce costs and the establishment of lines of credit with Mexican development banks. |
| | • | | Modifying Our Funding Strategy.We have adjusted our financing strategy to diversify our sources of funding. Specifically, we have undertaken the following transactions, based on this strategy, as of the date of this annual report: |
| | • | | On June 17, 2016, Pemex Exploration and Production obtained approximately U.S. $1.1 billion from the sale and leaseback of certain infrastructure assets used for oil and gas activities. On July 8, 2016, Pemex Industrial Transformation obtained approximately U.S. $600.0 million in connection with the sale and leaseback of a plant located in the Madero Refinery. See Notes 12(f) and 15(l) and 15(m) to our consolidated financial statements included herein for more information. |
| | • | | On October 3, 2016, Petróleos Mexicanos completed a liability management transaction wherein we used part of the proceeds from U.S. $4.0 billion in debt securities issued on September 21, 2016 to finance the purchase of U.S. $1.3 billion in outstanding securities. We subsequently exchanged U.S. $1.7 billion in securities for U.S. $1.6 billion in new securities. See “—Financing Activities” below for more details regarding this transaction. |
| | • | | Changes to Employee Benefits Plans.For more information, see “—Critical Accounting Policies—Employee Benefits” above. |
153
| | • | | Asset Sales.We have sold certain of ournon-essential assets to obtain working capital, including the sale of our stake in Gasoductos de Chihuahua. |
| | • | | Reduction in Taxes.As described below, we expect that the Mexican Government’s modification to the fiscal regime applicable to us enabled us to deduct more of our exploration and production costs. |
| | • | | Reduction in Outstanding Accounts Payable.As described above, as of December 31, 2016, we have paid the total outstanding balance due to suppliers and contractors as of December 31, 2015 as part of our effort to repay such balances. |
| | • | | No Payment of Dividend.The Mexican Government announced that Petróleos Mexicanos was not required to pay a state dividend in 2016 and will not be required to pay one in 2017. See “Item 4—Taxes, Duties and Other Payments to the Mexican Government—Fiscal Regime for PEMEX—Other Payments to the Mexican Government” above for more information. |
Moreover, on April 21, 2016, we received a capital contribution of Ps. 26.5 billion from the Ministry of Finance and Public Credit and, on August 3, 2016, the Ministry of Finance and Public Credit informed us that the Mexican Government will assume Ps. 184.2 billion in payment liabilities related to our pensions and retirement plans, following the review performed by an independent expert. See “—Equity Structure and Mexican Government Contributions” below.
Furthermore, the Mexican Government modified the fiscal regime applicable to us to enable us to deduct more of our exploration and production costs. Under the current low oil price environment, the amount of the hydrocarbon extraction duty we paid for the year ended December 31, 2016 was reduced by approximately Ps. 40.2 billion, as compared to the amount we would have had to pay for this duty if this change in the fiscal regime had not been implemented.
As noted above, successful completion of financings is an integral part of our plan to satisfy our working capital, capital expenditure, debt maturities and other requirements for the foreseeable future. Our financing program for 2017, included in theLey de Ingresos de la Federación para el Ejercicio Fiscal 2017 (Federal Revenues Law for the Fiscal Year 2017), provides for the incurrence of up to U.S. $15.7 billion in net indebtedness (i.e., U.S. $21.0 billion of new financings minus U.S. $5.3 billion of debt payments) through a combination of domestic and international capital markets offerings and borrowings from domestic and international financial institutions.
We have a substantial amount of debt, which we have incurred primarily to finance the capital expenditures needed to carry out our capital investment projects. Due to our heavy tax burden, our cash flow from operations in recent years has not been sufficient to fund our capital expenditures and other expenses and, accordingly, our debt has significantly increased. The sharp decline in oil prices that began in late 2014 has had a negative impact on our ability to generate positive cash flows, which, together with our continued heavy tax burden, has further exacerbated our ability to fund our capital expenditures and other expenses from cash flow from operations. Therefore, in order to develop our hydrocarbon reserves and amortize scheduled debt maturities, we will need to raise significant amounts of financing from a broad range of funding sources, in addition to the efficiency and cost-cutting initiatives described in this annual report.
As of December 31, 2016, our total indebtedness, including accrued interest, was approximately Ps. 1,983.2 billion (U.S. $96.0 billion), in nominal terms, which represents a 32.8% increase compared to our total indebtedness, including accrued interest, of approximately Ps. 1,493.4 billion (U.S. $86.8 billion) as of December 31, 2015. Approximately 23.5% of our existing debt as of December 31, 2016, or Ps. 465.7 billion (U.S. $22.5 billion), is scheduled to mature in the next three years. Our working capital increased from a negative working capital of Ps. 176.2 billion (U.S. $10.2 billion) as of December 31, 2015 to a negative working capital of Ps. 70.8 million (U.S. $3.4 million) as of December 31, 2016. Our level of debt may increase further in the short or medium term, as a result of new financing activities or future depreciation of the peso as compared to the U.S.
154
dollar, and may have an adverse effect on our financial condition, results of operations and liquidity position. To service our debt, we have relied and may continue to rely on a combination of cash flow from operations, drawdowns under our available credit facilities and the incurrence of additional indebtedness (including refinancings of existing indebtedness). In addition, we are taking actions to improve our financial position, such as those discussed above, particularly through our 2017-2021 Business Plan.
Certain rating agencies have expressed concerns regarding: (1) the total amount of our debt; (2) the significant increase in our indebtedness over the last several years; (3) our negative free cash flow during 2015, primarily resulting from our significant capital investment projects and the declining price of oil; (4) our substantial unfunded reserve for retirement pensions and seniority premiums, which was equal to Ps. 1,220.4 billion (U.S. $59.1 billion) as of December 31, 2016, and (5) the resilience of our operating expenses notwithstanding the sharp decline in oil prices that began in late 2014. On January 29, 2016, Standard & Poor’s announced the downgrade of ourstand-alone credit profile from “BB+” to “BB,” and affirmed its global foreign currency rating of “BBB+.” On March 31, 2016, Moody’s Investors Service announced the revision of our global foreign currency and local currency credit ratings from “Baa1” to “Baa3” and changed the outlook for its credit ratings to negative. On July 26, 2016, Fitch Ratings announced the downgrade of our global local currency credit ratings from“A-“ to “BBB+”, citing its recent downgrade of Mexico’s sovereign global local currency rating as its key factor. On August 23, 2016, Standard & Poor’s announced that it had revised the outlook of our corporate credit rating for our foreign currency and for our local currency from stable to negative.
Any further lowering of our credit ratings may have adverse consequences on our ability to access the financial markets and/or our cost of financing. If we were unable to obtain financing on favorable terms or at all, this could hamper our ability to obtain further financing on favorable terms as well as investment in projects financed through debt and impair our ability to meet our principal and interest payment obligations with our creditors. As a result, we may be exposed to liquidity constraints and may not be able to service our debt or make the capital expenditures needed to maintain our current production levels and to maintain, and increase, our proved hydrocarbon reserves, which may adversely affect our financial condition and results of operations.
If such constraints occur at a time when our cash flow from operations is less than the resources needed to fund our capital expenditures or to meet our debt service obligations, in order to provide additional liquidity to our operations, we could be forced to further reduce our planned capital expenditures, implement further austerity measures and/or sell additionalnon-strategic assets in order to raise funds. A reduction in our capital expenditure program could adversely affect our financial condition and results of operations. Such measures may not be sufficient to permit us to meet our obligations.
Going Concern
Our consolidated financial statements have been prepared under the assumption that we will continue as a going concern. As we describe in Note 2 to our consolidated financial statements, we have experienced certain conditions that have generated important uncertainty and significant doubts concerning our ability to continue operating, including recurring net losses, negative working capital, negative equity and negative cash flows from operating activities. We discuss the circumstances that have caused these negative trends, as well our plans in regard to these matters in “Operating and Financial Review and Prospects—Overview” above in this Item 5 and Note 2 to our consolidated financial statements included herein. We continue operating as a going concern, and our consolidated financial statements do not include any adjustments that might result from the outcome of this uncertainty.
Equity Structure and Mexican Government Contributions
Our total equity as of December 31, 2016 was negative Ps. 1,233.0 billion, and our total capitalization (long-term debt plus equity) totaled Ps. 574.0 billion. During 2016, our total equity increased by Ps. 98.7 billion from negative Ps. 1,331.7 billion as of December 31, 2015, primarily due to (1) the equity contributions in the total
155
amount of Ps. 161.9 billion made by the Mexican Government to Petróleos Mexicanos in 2016 in the form of Certificates of Contribution “A” described in greater detail above; (2) a Ps. 108.2 billion increase in actuarial gains on employee benefits, resulting from the increase in the discount rate and expected rate of return on plan assets used in the actuarial computation method from 7.4% in 2015 to 8.2% in 2016 and an increase in the expected returns for fixed assets; and (3) Ps. 21.4 billion in accumulated gains from the foreign currency translation effect. This increase was partially offset by our net loss for the year of Ps. 191.1 billion. Under theLey deConcursos Mercantiles (Commercial Bankruptcy Law of Mexico), Petróleos Mexicanos and the subsidiary entities cannot be subject to a bankruptcy proceeding. In addition, our current financing agreements do not include financial covenants or events of default that would be triggered as a result of our having negative equity.
On April 21, 2016, we received a capital contribution of Ps. 26.5 billion from the Ministry of Finance and Public Credit and, on August 3, 2016, the Ministry of Finance and Public Credit informed us that the Mexican Government would assume Ps. 184.2 billion in payment liabilities related to our pensions and retirement plans, following the review performed by an independent expert. In accordance with theDisposiciones de carácter general relativas a la asunción por parte del Gobierno Federal de obligaciones de pago de pensiones y jubilaciones a cargo de Petróleos Mexicanos y sus empresas productivas subsidiarias (General provisions regarding the assumption by the Federal Government of the payment obligations related to pensions and retirement plans of Petróleos Mexicanos and its productive state-owned subsidiaries) published in the Official Gazette of the Federation on December 24, 2015, we received Ps. 184.2 billion in promissory notes issued by the Mexican Government, which replaced the Ps. 50.0 billion promissory note issued to us on December 24, 2015 and was recognized as an increase in equity in the amount of Ps. 135.4 billion in the form of Certificates of Contribution “A.” The Ps. 135.4 billion increase in equity was the result of the Ps. 184.2 billion value of the promissory notes as of June 29, 2016, minus the Ps. 50.0 billion promissory note we received on December 24, 2015, plus a Ps. 1.2 billion increase in the value of the promissory notes from June 29, 2016 to August 15, 2016, which is the date on which we received the promissory notes. On August 15, 2016, we exchanged Ps. 47.0 billion of these promissory notes for short-term floating rate Mexican Government debt securities known asBonos de Desarrollo del Gobierno Federal (Development Bonds of the Federal Government, or BONDES D). We then sold the BONDES D to Mexican development banks for the same price at which we received them from the Mexican Government.
On January 19, 2015, the Mexican Government made an equity contribution of Ps. 10.0 billion to Petróleos Mexicanos in accordance with the Federal Law of Budget and Fiscal Accountability, as amended. This payment was recognized as a Ps. 10.0 billion increase in Mexican Government contributions to Petróleos Mexicanos.
As of December 31, 2015 and 2016, the balance of Mexican Government contributions to Petróleos Mexicanos was Ps. 140.6 billion. As of December 31, 2015 and 2016, the total amount of contributions in the form of Certificates of Contribution “A” was Ps. 194.6 billion and Ps. 356.5 billion, respectively.
Cash Flows from Operating, Financing and Investing Activities
During 2016, net funds provided by operating activities totaled negative Ps. 41.5 billion, as compared to Ps. 102.3 billion in 2015. Net loss was Ps. 191.1 billion in 2016, as compared to net loss of Ps. 712.6 billion in 2015. Our net cash flows from financing activities totaled Ps. 213.4 billion in 2016, as compared to Ps. 134.9 billion in 2015. During 2016, we applied net cash flows of Ps. 134.5 billion for net investments at cost in fixed assets, including exploration expenses, as compared to our application of cash flows of Ps. 254.8 billion in 2015 for net investments at cost in fixed assets, including exploration expenses.
At December 31, 2016, our cash and cash equivalents totaled Ps. 163.5 billion, as compared to Ps. 109.4 billion at December 31, 2015.
156
Liquidity Position
We define liquidity as funds available under our lines of credit as well as cash and cash equivalents. The following table summarizes our liquidity position as of December 31, 2015 and 2016.
| | | | | | | | |
| | | As of December 31, | |
| | | 2016 | | | 2015 | |
| | | (millions of pesos) | |
Borrowing base under lines of credit | | | Ps. 99,174 | | | | Ps 11,337 | |
Cash and cash equivalents | | | 163,533 | | | | 109,369 | |
| | | | | | | | |
Liquidity | | | Ps. 262,707 | | | | Ps 120,706 | |
| | | | | | | | |
The following table summarizes our sources and uses of cash for the years ended December 31, 2015 and 2016:
| | | | | | | | |
| | | For the years ended
December 31, | |
| | | 2016 | | | 2015 | |
| | | (millions of pesos) | |
Net cash flows (used in) from operating activities | | | Ps. (41,485) | | | | Ps. 102,337 | |
Net cash flows used in investing activities | | | (134,536) | | | | (254,832) | |
Net cash flows from financing activities | | | 213,360 | | | | 134,915 | |
Effect of change in cash value | | | 16,804 | | | | 8,960 | |
| | | | | | | | |
Net increase (decrease) in cash and cash equivalents | | | Ps. 54,143 | | | | Ps. (8,620) | |
| | | | | | | | |
Note: Numbers may not total due to rounding.
Investment Policies
Our Finance and Treasury Department maintains financial resources sufficient to meet our payment commitments and those of the subsidiary entities, as well as a comprehensive, consolidated cash position and related projections in anticipation of such commitments.
Our investment policies attempt to take advantage of favorable market conditions by accessing the most favorable terms offered to us by financial institutions. Investments of financial resources by our Finance and Treasury Department are made in accordance with the following policies:
Investments of Mexican Pesos
In connection with investments in Mexican pesos, we are obligated, during the structuring and development phase of our financial transactions, to observe and comply with the investment guidelines for resources in pesos that were approved by our Financial Resources Committee on December 21, 2006, as modified from time to time. We may only invest in the following:
| | • | | securities issued or guaranteed by the Mexican Government; |
| | • | | repurchase agreements that use securities issued or guaranteed by the Mexican Government; |
| | • | | time deposits with major financial institutions, the balance of which may not exceed 30% of our cash and cash equivalents; and |
| | • | | shares of mutual funds whose investments are limited to securities issued or guaranteed by the Mexican Government. |
157
In addition to the above limits, time deposits must be traded with financial institutions that maintain, at a minimum, the following credit ratings as issued by the applicable rating agency:
| | | | | | |
Domestic scale | | Fitch Ratings | | S&P | | Moody’s |
Long term | | AA(mex) | | mxAA | | Aa2.mx |
Investments of Financial Resources in Dollars
Investments of financial resources in dollars must meet our operational and strategic requirements and must be previously approved byBanco de México on acase-by-case basis. Currently, our investments in dollars are limited to operational accounts, short-term money market funds and time deposits. Our dollar investments are managed byBanco de México.
Operational Currencies
The main currencies for investing cash and cash equivalents are pesos and dollars. Similarly, we generate revenues from the domestic and international sales of our products in those two currencies and our expenses, including those relating to our debt service, are payable in these two currencies.
Commitments for Capital Expenditures and Sources of Funding
Our current aggregate commitments for capital expenditures for 2017 total approximately Ps. 109.0 billion. For a general description of our current commitments for capital expenditures, see “Item 4—Information on the Company—History and Development—Capital Expenditures.” The amount of our aggregate capital expenditures commitments for 2017 remains subject to adjustment by the Mexican Government. See “Item 3—Key Information—Risk Factors—Risk Factors Related to our Relationship with the Mexican Government—The Mexican Government controls us and it could limit our ability to satisfy our external debt obligations or could reorganize or transfer us or our assets.”
The following table sets forth our total capital expenditures by segment for the year ended December 31, 2016, and the budget for these expenditures for 2017. For more information see “Item 4—History and Development—Capital Expenditures.”
| | | | | | | | |
| | | Year ended
December 31,
2016 | | | Budget
2017(1) | |
| | | |
| | | (millions of pesos) | |
Exploration and Production | | | Ps. 137,242 | | | | Ps. 73,927 | |
Industrial Transformation(2) | | | 33,947 | | | | 21,369 | |
Drilling and Services | | | 2,688 | | | | 1,580 | |
Logistics | | | 7,015 | | | | 4,449 | |
Fertilizers | | | 379 | | | | 444 | |
Ethylene | | | 746 | | | | 1,786 | |
Cogeneration and Services | | | — | | | | — | |
Corporate and other Subsidiaries | | | 1,004 | | | | 5,422 | |
| | | | | | | | |
Total | | | Ps. 183,021 | | | | Ps. 108,977 | |
| | | | | | | | |
Note: Numbers may not total due to rounding.
| | (1) | Budget authorized on December 14, 2016 and presented to the Board of Directors of Petróleos Mexicanos on April 7, 2017. |
| | (2) | Figures for the refining, gas and basic petrochemicals and petrochemicals segments for the year ended December 31, 2016 are allocated to the capital expenditures for the industrial transformation segment. |
158
Our current commitments for capital expenditures have fluctuated in recent years as compared to previous years. Based on past experience, we expect to generate sufficient funds for our working capital, capital expenditures and investments through:
| | • | | cash flow generated by operations; |
| | • | | the issuance ofcertificados bursátiles (peso-denominated publicly traded notes) in the Mexican market; |
| | • | | the issuance of debt securities in the international capital markets; |
| | • | | the renewal of existing lines of credit and the entering into of new lines of credit from international and local commercial banks; and |
| | • | | other financing activities. |
The securities that we issue may vary in tenor, amount, currency and type of interest rate. We may issue debt securities in U.S. dollars, Japanese yen, euros, pounds, pesos or Swiss francs, among others; these securities may be issued with fixed or floating rates and with maturities of one or more years, including perpetual debt securities, depending on market conditions and funding requirements. We may issue securities in the international capital markets or in the Mexican domestic market, or in both markets. Commercial bank syndicated loans may be established with single or multiple tranches with varying maturities. Bilateral loans may vary in tenor and range, which may be of one year or more. See also “—Financing Activities” below.
In order to be able to carry out our planned capital expenditures program, we will need to seek financing from a variety of sources, and we cannot guarantee that we will be able to obtain financing on terms that would be acceptable to us. Our inability to obtain additional financing could have an adverse effect on our planned capital expenditures program and result in our being required to limit or defer this program.
Financing Activities
2017 Financing Activity.During the period from January 1 to April 25, 2017, we participated in the following activity:
| | • | | On February 4, 2017, Petróleos Mexicanos issued € 4,250,000,000 of debt securities under its U.S. $72,000,000,000 Medium-Term Notes Program, Series C, in three tranches: (1) € 1,750,000,000 of its 2.5% Notes due 2021; (2) € 1,250,000,000 of its 3.75% Notes due 2024; and (3) € 1,250,000,000 of its 4.875 % Notes due 2028. All debt securities issued under this program are guaranteed by Pemex Exploration and Production, Pemex Industrial Transformation, Pemex Drilling and Services, Pemex Logistics and Pemex Cogeneration and Services as of the date of this annual report. |
2016 Financing Activities.During 2016 we participated in the following activities:
| | • | | On January 25, 2016, Petróleos Mexicanos increased its Medium-Term Notes Program from U.S. $52,000,000,000 to U.S. $62,000,000,000 pursuant to an authorization by the Board of Directors of Petróleos Mexicanos on August 18, 2015. |
| | • | | On January 28, 2016, subsidiaries of Pemex Fertilizers obtained loans for an aggregate amount of U.S. $635,000,000 in connection with the acquisition of Grupo Fertinal, S.A. |
| | • | | On February 4, 2016, Petróleos Mexicanos issued U.S. $5,000,000,000 of debt securities under its U.S. $62,000,000,000 Medium-Term Notes Program, Series C, in three tranches: (1) U.S. $750,000,000 of its 5.500% Notes due 2019; (2) U.S. $1,250,000,000 of its 6.375% Notes due 2021; and (3) U.S. $3,000,000,000 of its 6.875% Notes due 2026. All debt securities issued under this program are guaranteed by Pemex Exploration and Production, Pemex Industrial Transformation, Pemex Drilling and Services, Pemex Logistics and Pemex Cogeneration and Services as of the date of this annual report. |
| | • | | On February 5, 2016, Petróleos Mexicanos obtained a loan from a line of credit for Ps. 7,000,000,000 bearing interest at a floating rate linked to the TIIE, plus 0.55%, which was repaid in full on January 27, 2017. |
159
| | • | | On March 15, 2016, Petróleos Mexicanos issued € 2,250,000,000 of debt securities under its U.S. $62,000,000,000 Medium-Term Notes Program, Series C in two tranches: (1) € 1,350,000,000 of its 3.750% Notes due 2019 and (2) € 900,000,000 of its 5.125% Notes due 2023. All debt securities issued under this program are guaranteed by Pemex Exploration and Production, Pemex Industrial Transformation, Pemex Drilling and Services, Pemex Logistics and Pemex Cogeneration and Services. |
| | • | | On March 17, 2016, Petróleos Mexicanos received a disbursement of Ps. 2,000,000,000 from its revolving credit lines at a floating rate linked to the TIIE, which was repaid in full on March 17, 2017. |
| | • | | On March 17, 2016, Petróleos Mexicanos received a disbursement of Ps. 3,300,000,000 from its revolving credit lines at a floating rate linked to the TIIE, which was repaid in full on March 17, 2017. |
| | • | | On March 23, 2016, Petróleos Mexicanos issued in the Mexican market Ps. 5,000,000,000 ofCertificados Bursátiles under its Ps. 200,000,000,000Unidades de Inversión(or UDI) equivalentCertificados Bursátiles Program, at a floating rate linked to the TIIE due 2019. All debt securities issued under this program are guaranteed by Pemex Exploration and Production, Pemex Industrial Transformation, Pemex Drilling and Services, Pemex Logistics and Pemex Cogeneration and Services as of the date of this annual report. |
| | • | | On March 28, 2016, Petróleos Mexicanos borrowed Ps. 9,700,000,000 from a credit line at a floating rate linked to the TIIE, which was repaid in full on March 28, 2017. |
| | • | | On April 19, 2016, Petróleos Mexicanos borrowed € 500,000,000 from a credit line at a fixed rate of 5.11%, which matures on March 15, 2023. |
| | • | | On May 31, 2016, Petróleos Mexicanos borrowed U.S. $300,000,000 from a bilateral credit line which bears interest at a floating rate linked to the LIBOR, which matures on May 31, 2021. |
| | • | | On June 14, 2016, Petróleos Mexicanos issued CFH 375,000,000 aggregate principal amount of Notes under its U.S. $62,000,000,000 Medium-Term Notes Program, Series C, in two tranches: (1) CFH 225,000,000 of its 1.500% Notes due 2018 and (2) CFH 150,000,000 of its 2.375% Notes due 2021. All debt securities issued under this program are guaranteed by Pemex Exploration and Production, Pemex Industrial Transformation, Pemex Drilling and Services, Pemex Logistics and Pemex Cogeneration and Services as of the date of this annual report. |
| | • | | On June 17, 2016, Pemex Exploration and Production obtained approximately U.S. $1.1 billion in connection with the sale and leaseback of certain infrastructure assets used for oil and gas activities. As part of this transaction, Pemex Exploration and Production entered into a15-year financial lease agreement pursuant to which Pemex Exploration and Production will retain the operation of these assets and the title and ownership of such assets will revert to Pemex Exploration and Production at the end of this period following payment of an agreed price. |
| | • | | On July 8, 2016, Pemex Industrial Transformation obtained approximately U.S. $600,000,000 in connection with the sale and leaseback of a plant located in the Madero Refinery. As part of this transaction, Pemex Industrial Transformation entered into a20-year financial lease agreement pursuant to which Pemex Industrial Transformation will retain the operation of this plant and the title and ownership will revert to Pemex Industrial Transformation at the end of this period following payment of an agreed price. This transaction was recognized as a financing activity due to the fact that we retained all of the risks and benefits associated with ownership of the asset and substantially all of the operating rights of the asset. |
| | • | | On July 26, 2016, Petróleos Mexicanos issued ¥80,000,000,000 of its 0.54% Bonds due 2026. The Bonds are guaranteed by the Japan Bank for International Cooperation. |
| | • | | On September 21, 2016, Petróleos Mexicanos issued U.S. $4,000,000,000 of its debt securities under its U.S. $62,000,000,000 Medium-Term Notes Program, Series C, in two tranches: (i) U.S. $2,000,000,000 of its 4.625% Notes due 2023 and (ii) U.S. $2,000,000,000 of its 6.750% |
160
| | Bonds due 2047. All debt securities issued under this program are guaranteed by Pemex Exploration and Production, Pemex Industrial Transformation, Pemex Drilling and Services, Pemex Logistics and Pemex Cogeneration and Services as of the date of this annual report. |
| | • | | On October 3, 2016, Petróleos Mexicanos consummated a tender and exchange offer pursuant to which it (i) purchased U.S. $687,725,000 aggregate principal amount of its outstanding 8.000% Notes due 2019 and U.S. $657,050,000 aggregate principal amount of its outstanding 5.750% Notes due 2018 and (ii) exchanged (a) U.S. $73,288,000 aggregate principal amount of its outstanding 5.750% Notes due 2018 for U.S. $69,302,000 aggregate principal amount of its 4.625% Notes due 2023 and U.S. $8,059,000 aggregate principal amount of its 6.750% Bonds due 2047 and (b) U.S. $1,591,961,000 aggregate principal amount of its outstanding 5.500% Bonds due 2044 for U.S. $1,491,941,000 aggregate principal amount of its 6.750% Bonds due 2047. The 4.625% Notes due 2023 and 6.750% Bonds due 2047 are guaranteed by Pemex Exploration and Production, Pemex Industrial Transformation, Pemex Drilling and Services, Pemex Logistics and Pemex Cogeneration and Services and represent reopenings of the 4.625% Notes due 2023 and 6.750% Bonds due 2047, respectively, originally issued on September 21, 2016. |
| | • | | On December 6, 2016, Petróleos Mexicanos increased its Medium-Term Notes Program, Series C, from U.S. $62,000,000,000 to U.S. $72,000,000,000. |
| | • | | On December 13, 2016, Petróleos Mexicanos issued U.S. $5,500,000,000 of its debt securities under its U.S. $72,000,000,000 Medium-Term Notes Program, Series C in three tranches: (1) U.S. $3,000,000,000 at a fixed rate of 6.50% due 2027, (2) U.S. $1,500,000,000 at a fixed rate of 5.375% due 2022, and (3) U.S. $1,000,000,000 at a floating rate linked to LIBOR plus 365 basis points, due 2022. All debt securities issued under this program are guaranteed by Pemex Exploration and Production, Pemex Industrial Transformation, Pemex Drilling and Services, Pemex Logistics and Pemex Cogeneration and Services as of the date of this annual report. |
| | • | | On December 14, 2016, Petróleos Mexicanos entered into a term loan credit facility in the amount of U.S. $300,000,000 at a floating rate linked to LIBOR plus 165 basis points, which matures on December 6, 2019. |
| | • | | Between January 1 and December 31, 2016, P.M.I. Holdings B.V. obtained U.S. $11,369,800 in financing from its revolving credit lines, which was repaid in full. As of December 31, 2016, there was no outstanding amount under this revolving credit line. |
As of December 31, 2016, Petróleos Mexicanos had U.S. $4,750,000,000 and Ps. 23,500,000,000 in available revolving credit lines in order to ensure liquidity, with U.S. $4,630,000,000 and Ps. 3,500,000,000 remaining available.
2015 Financing Activities.During 2015 we participated in the following activities:
| | • | | On January 16, 2015, Petróleos Mexicanos obtained a direct loan for Ps. 7,000,000,000 bearing interest at a floating rate linked to the TIIE, which matured on January 16, 2016. |
| | • | | On January 22, 2015, Petróleos Mexicanos increased its Medium-Term Notes Program from U.S. $42,000,000,000 to U.S. $52,000,000,000 pursuant to an authorization by the Board of Directors of Petróleos Mexicanos on December 19, 2014. |
| | • | | On January 23, 2015, Petróleos Mexicanos issued U.S. $6,000,000,000 of its debt securities under its U.S. $52,000,000,000 Medium-Term Notes Program, Series C in three tranches: (1) U.S. $1,500,000,000 of its 3.500% Notes due 2020; (2) U.S. $1,500,000,000 of its 4.500% Notes due 2026; and (3) U.S. $3,000,000,000 of its 5.625% Bonds due 2046. All debt securities issued under this program are guaranteed by Pemex Exploration and Production, Pemex Industrial Transformation, Pemex Drilling and Services, Pemex Logistics and Pemex Cogeneration and Services as of the date of this annual report. |
161
| | • | | On January 30, 2015, Petróleos Mexicanos amended the terms of its revolving credit facility in order to increase the amount available thereunder from U.S. $1,250,000,000 to U.S. $3,250,000,000 and to extend the maturity date to February 5, 2020. On February 5, 2015, Petróleos Mexicanos borrowed U.S. $1,950,000,000 under this facility to prepay in full its U.S. $700,000,000 credit facility dated as of December 17, 2014. |
| | • | | On February 11, 2015, Petróleos Mexicanos issued Ps. 24,287,901,544 aggregate principal amount ofCertificados Bursátiles in three tranches. The first tranche was issued at a fixed rate of 7.47% due 2026 in an aggregate principal amount of Ps. 17,000,000,000, consisting of (1) an international offering outside of Mexico of Ps. 9,000,000,000 of “EuroclearableCertificados Bursátiles,” which are eligible for clearance through Euroclear Clearance System plc and Indeval, and (2) a concurrent offering to the public in Mexico of Ps. 8,000,000,000. This issuance was a reopening of the same series ofCertificados Bursátiles due 2026 that was originally issued on November 27, 2014. The second tranche was issued at a floating rate due 2020 in an aggregate principal amount of Ps. 4,300,000,000. This issuance was a reopening of the same series ofCertificados Bursátiles due 2020 that was originally issued on November 27, 2014. The third tranche was issued at a fixed rate of 3.94% due 2026 in an aggregate principal amount of 565,886,800 UDI, equivalent to Ps. 2,987,901,544. This issuance represented the fourth reopening of the same series originally issued on January 30, 2014 and subsequently reopened on July 2, 2014, September 11, 2014 and November 27, 2014. Thesecertificados bursátiles were issued under Petróleos Mexicanos’ Ps. 200,000,000,000 or UDI equivalentCertificados Bursátiles Program. All debt securities issued under this program are guaranteed by Pemex Exploration and Production, Pemex Industrial Transformation, Pemex Drilling and Services, Pemex Logistics and Pemex Cogeneration and Services as of the date of this annual report. |
| | • | | On February 11, 2015, Petróleos Mexicanos entered into a term loan credit facility in the amount of U.S. $2,000,000,000. On February 17, 2015, Petróleos Mexicanos borrowed U.S. $2,000,000,000 under this facility to prepay in full its credit agreement dated as of November 18, 2010. |
| | • | | On March 24, 2015, the CNBV authorized Petróleos Mexicanos’ Short-TermCertificados Bursátiles Program for an aggregate revolving amount of Ps. 100,000,000,000. As of the date of this annual report, there are no outstanding amounts under this program. All debt securities issued under this program are guaranteed by Pemex Exploration and Production, Pemex Industrial Transformation, Pemex Drilling and Services, Pemex Logistics and Pemex Cogeneration and Services as of the date of this annual report. |
| | • | | On April 21, 2015, Petróleos Mexicanos issued € 2,250,000,000 of its debt securities under its U.S. $52,000,000,000 Medium-Term Notes Program, Series C in two tranches: (1) € 1,000,000,000 of its 1.875% Notes due 2022 and (2) € 1,250,000,000 of its 2.750% Notes due 2027. All debt securities issued under this program are guaranteed by Pemex Exploration and Production, Pemex Industrial Transformation, Pemex Drilling and Services, Pemex Logistics and Pemex Cogeneration and Services as of the date of this annual report. |
| | • | | On June 26, 2015, Petróleos Mexicanos received a disbursement of U.S. $500,000,000 from its revolving credit lines entered into with international financial institutions. |
| | • | | On July 7, 2015, Petróleos Mexicanos obtained a loan for Ps. 18,000,000,000 bearing interest at a floating rate linked to the TIIE plus 0.95%, which matures on July 7, 2025. |
| | • | | On July 16, 2015, Petróleos Mexicanos issued in the Mexican market Ps. 7,721,582,153 aggregate principal amount ofCertificados Bursátiles under its Ps. 200,000,000,000 or UDI equivalentCertificados Bursátiles Program, in three tranches: (1) aggregate principal amount of Ps. 650,000,000 at a floating rate linked to the TIIE plus 0.15% due 2020, this issuance was the second reopening of the same series ofCertificados Bursátiles originally issued on November 27, 2014 and reopened on February 11, 2015; (2) aggregate principal amount of Ps. 6,100,000,000 at a fixed rate of 7.47% due 2026, this issuance was the second reopening of the same series of |
162
| | Certificados Bursátiles originally issued on November 27, 2014 and reopened on February 11, 2015; and (3) aggregate principal amount of 183,941,400 UDIs, equivalent to approximately Ps. 971,582,153, at a fixed rate of 3.94% due 2026, this issuance was the fifth reopening of the same series ofCertificados Bursátiles originally issued on January 30, 2014 and reopened on July 2, 2014, September 11, 2014, November 27, 2014 and February 11, 2015. As of the date of this annual report, all debt securities issued under the aforementioned program are guaranteed by Pemex Exploration and Production, Pemex Industrial Transformation, Pemex Drilling and Services, Pemex Logistics and Pemex Cogeneration and Services as of the date of this annual report. |
| | • | | On July 31, 2015, Petróleos Mexicanos issued U.S. $525,000,000 of notes due 2025, which bear interest at a fixed rate of 2.46%. The notes are guaranteed by the Export-Import Bank of the United States. |
| | • | | On August 4, 2015, P.M.I. Holdings, B.V. obtained a loan for U.S. $250,000,000, which bears interest at a rate of 1.79% and is due in 2018. The loan is collateralized by 20,724,331 Repsol shares. |
| | • | | On August 28, 2015, Petróleos Mexicanos borrowed U.S. $120,000,000 from a U.S. $3,250,000,000 revolving credit line, which bears interest at a floating rate linked to the LIBOR and was repaid in full in February 2016. |
| | • | | On September 15, 2015, Petróleos Mexicanos borrowed U.S. $800,000,000 from its revolving credit lines entered into with international financial institutions. |
| | • | | On September 30, 2015, Petróleos Mexicanos entered into a credit facility in the amount of Ps. 5,000,000,000, which bears interest at a floating rate linked to the TIIE and matures in September 2023. This credit facility was fully disbursed on October 7, 2015. |
| | • | | On September 30, 2015, Petróleos Mexicanos borrowed U.S. $500,000,000 from its revolving credit line, which bears interest at a rate linked to LIBOR and matures in December 2025. The credit facility is guaranteed by the Export-Import Bank of the United States. |
| | • | | On September 30, 2015, Petróleos Mexicanos borrowed U.S. $475,000,000 from a revolving credit facility guaranteed by the Export-Import Bank of the United States, which bears interest at a rate linked to LIBOR and matures in December 2025. |
| | • | | On September 30, 2015, Petróleos Mexicanos issued in the Mexican market Ps. 7,400,493,076 aggregate principal amount ofCertificados Bursátiles under its Ps. 200,000,000,000 or UDI equivalentCertificados Bursátiles Program, in two tranches: (1) aggregate principal amount of Ps. 1,357,736,800 at a floating rate linked to the TIIE plus 0.35 basis points due 2018; and (2) aggregate principal amount of 1,138,056,400 UDIs, equivalent to approximately Ps. 6,042,756,276, at a fixed rate of 5.23% due 2035. As of the date of this annual report, all debt securities issued under this program are guaranteed by Pemex Exploration and Production, Pemex Industrial Transformation, Pemex Drilling and Services, Pemex Logistics and Pemex Cogeneration and Services as of the date of this annual report. |
| | • | | On October 7, 2015, Petróleos Mexicanos obtained a loan from a line of credit for Ps. 5,000,000,000 bearing interest at a floating rate linked to the TIIE, which matures on September 30, 2023. |
| | • | | On October 22, 2015, Petróleos Mexicanos obtained a loan from a line of credit for Ps. 5,000,000,000 bearing interest at a floating rate linked to the TIIE, which matures on October 16, 2022. |
| | • | | On November 6, 2015, Petróleos Mexicanos issued € 100,000,000 of notes due 2030, which bear interest at a fixed rate of 4.625%. The notes are guaranteed by Pemex Exploration and Production, |
163
| | Pemex Industrial Transformation, Pemex Drilling and Services, Pemex Logistics and Pemex Cogeneration and Services. |
| | • | | On December 8, 2015, Petróleos Mexicanos issued CHF 600,000,000 of its 1.5% Notes due 2020 under its U.S. $52,000,000,000 Medium-Term Notes Program, Series C. The notes are guaranteed by Pemex Exploration and Production, Pemex Industrial Transformation, Pemex Drilling and Services, Pemex Logistics and Pemex Cogeneration and Services. |
| | • | | On December 15, 2015, Petróleos Mexicanos received a disbursement for Ps. 10,000,000,000 from a revolving credit line bearing interest at a floating rate linked to the TIIE, and was paid in full on March 15, 2016. |
| | • | | On December 29, 2015, Petróleos Mexicanos received a disbursement for Ps. 4,400,000,000 bearing interest at a floating rate linked to the TIIE, and was paid in full on March 29, 2016. |
| | • | | From January 1, 2015 to December 31, 2015, Petróleos Mexicanos issued and repaid a total of Ps. 40,000,000,000 ofshort-term Certificados Bursátiles at fixed and floating rates under its Short-Term Certificados Bursátiles Program. |
| | • | | From January 1, 2015 to December 31, 2015, P.M.I. Holdings B.V. obtained U.S. $1,540,000,000 in financing from its revolving credit lines and repaid U.S. $2,040,000,000. |
Indebtedness
During 2016, our total debt increased by 32.8%, from Ps. 1,493.4 billion at December 31, 2015 to Ps. 1,983.2 billion at December 31, 2016, primarily due to the financing activities undertaken during this period, as described in Note 15 to our consolidated financial statements included herein and to the 20.1% appreciation of the U.S. dollar relative to the peso in 2016.
As of December 31, 2016 and as of the date of this annual report, we were not in default on any of our financing agreements.
The following table sets forth the analysis of our total indebtedness (not including accrued interest) as of December 31, 2016 based on short- and long-term debt and fixed or floating rates:
| | | | |
| | | In millions of
U.S. dollars | |
Short-term debt | | | | |
Short-term bonds with floating interest rates | | U.S. $ | 1,260 | |
Lines of credit with variable interest rates established under committed credit facilities with various international commercial banks | | | 3,765 | |
Lines of credit with fixed interest rates | | | 2,154 | |
| | | | |
Total short-term debt(1) | | U.S. $ | 7,179 | |
| | | | |
Long-term debt | | | | |
Fixed rate instruments | | | | |
Instruments with fixed annual interest rates ranging from 1.5% to 9.5% and maturities ranging from 2018 to 2047 and perpetual bonds with no maturity date | | U.S. $ | 74,959 | |
Variable rate instruments | | | | |
Drawings under lines of credit based on LIBOR and other variable rates with maturities ranging from 2018 to 2030 | | | 8,109 | |
Floating rate notes with maturities ranging from 2018 to 2025 | | | 4,379 | |
| | | | |
Total variable rate instruments | | | 12,488 | |
| | | | |
Total long-term debt | | | 87,447 | |
| | | | |
Total indebtedness(1) | | U.S. $ | 94,626 | |
| | | | |
Note: Numbers may not total due to rounding.
| (1) | Excludes U.S. $1,346.1 million of accrued interest and includes notes payable to contractors. |
164
The table below sets forth our total indebtedness as of December 31 for each of the three years from 2014 to 2016.
Total Indebtedness of PEMEX
| | | | | | | | | | | | |
| | | As of December 31,(1) | |
| | | 2014 | | | 2015 | | | 2016 | |
| | | (in millions of U.S. dollars)(2) | |
Domestic debt in various currencies | | U.S. $ | 19,856 | | | U.S. $ | 19,415 | | | U.S. $ | 16,651 | |
External debt in various currencies(3) | | | | | | | | | | | | |
Bonds(4) | | | 44,445 | | | | 52,981 | | | | 67,523 | |
Direct loans | | | 6,473 | | | | 7,486 | | | | 3,808 | |
Project financing(5) | | | 4,916 | | | | 4,816 | | | | 4,125 | |
Financial leases | | | 263 | | | | 536 | | | | 2,181 | |
Notes payable to contractors | | | 795 | | | | 483 | | | | 338 | |
| | | | | | | | | | | | |
Total external debt | | U.S. $ | 56,892 | | | U.S. $ | 66,302 | | | U.S. $ | 77,975 | |
| | | | | | | | | | | | |
Total indebtedness | | U.S. $ | 76,748 | | | U.S. $ | 85,717 | | | U.S. $ | 94,626 | |
| | | | | | | | | | | | |
Note: Numbers may not total due to rounding.
| (1) | Figures do not include accrued interest. Accrued interest was U.S. $928.9 million, U.S. $1,074.5 million and U.S. $1,346.1 million at December 31, 2014, 2015 and 2016, respectively. |
| (2) | Indebtedness payable in currencies other than U.S. dollars was first converted into pesos for accounting purposes at the exchange rates set byBanco de México and then converted from pesos to U.S. dollars at the following exchange rates: Ps. 14.7180 = U.S. $1.00 for 2014, Ps. 17.2065 = U.S. $1.00 for 2015 and Ps.20.664 = U.S. $1.00 for 2016. See Notes 3 and 15 to our consolidated financial statements included herein. |
| (3) | Indebtedness payable other than in pesos and owed to persons or institutions having their head offices or chief places of business outside of Mexico and payable outside the territory of Mexico. |
| (4) | Includes, as of December 31, 2014, 2015 and 2016, U.S. $0.39 billion, U.S. $0.275 billion and U.S. $0.16 billion, respectively, of bonds issued by Pemex Finance, Ltd. See “—Financing Activities of Pemex Finance, Ltd.” below. |
| (5) | All credits included in this line are insured or guaranteed by export credit agencies. |
Source: PEMEX’s consolidated financial statements, prepared in accordance with IFRS.
Financing Activities of Pemex Finance, Ltd.
Commencing on December 1, 1998, Petróleos Mexicanos, Pemex-Exploration and Production, PMI and P.M.I. Services, B.V. have entered into several agreements with Pemex Finance, Ltd. Under these contracts, Pemex Finance, Ltd. purchases certain existing PMI accounts receivable for crude oil as well as certain accounts receivable to be generated in the future by PMI related to crude oil. The receivables sold are those generated by the sale of Maya and Altamira crude oil to designated customers in the United States, Canada and Aruba. The net proceeds obtained by Pemex Exploration and Production, which assumed all of the rights and obligations ofPemex-Exploration and Production under these agreements, from the sale of such receivables under the agreements are utilized for capital expenditures. Pemex Finance, Ltd. obtains resources for the acquisition of such accounts receivable through the placement of debt instruments in the international markets.
On July 1, 2005, we entered into an option agreement with BNP Paribas Private Bank and Trust Cayman Limited giving us an option to acquire 100% of the shares of Pemex Finance, Ltd. As a result, the financial results of Pemex Finance, Ltd. under IFRS are consolidated into our financial statements, and PMI’s sales of accounts receivable to Pemex Finance, Ltd. have been reclassified as debt. Our option to purchase the shares of Pemex Finance, Ltd. can only be exercised once its remaining debt, approximately U.S. $162.5 million in aggregate principal amount as of December 31, 2016, has been redeemed.
As of December 31, 2016, the outstanding debt of Pemex Finance, Ltd. was composed of U.S. $162.5 million aggregate principal amount of fixed rate notes with maturities ranging from 2017 to 2018 and interest rates between 9.15% and 10.61% and accrued interest of U.S. $0.7 million.
2017 Financing Activities.During the first four months of 2017, Pemex Finance, Ltd. made payments of U.S. $28.1 million in principal of its notes. Pemex Finance, Ltd. did not incur any additional indebtedness during the first four months of 2017.
165
2016 Financing Activities.During 2016, Pemex Finance, Ltd. made payments of U.S. $28.1 million in principal of its notes. Pemex Finance, Ltd. did not incur any additional indebtedness during 2016.
2015 Financing Activities.During 2015, Pemex Finance, Ltd. made payments of U.S. $112.5 million in principal of its notes. Pemex Finance, Ltd. did not incur any additional indebtedness during 2015.
Contractual Obligations andOff-Balance Sheet Arrangements
Information about our long-term contractual obligations andoff-balance sheet arrangements outstanding as of December 31, 2016 is set forth below. This information is important in understanding our financial position. In considering the economic viability of investment opportunities we view any source of financing, for example, operating leases or sales of future accounts receivable, as being economically equivalent to consolidated debt.
Contractual Obligations as of December 31, 2016(1)
| | | | | | | | | | | | | | | | | | | | |
| | | | | | Payments due by period | |
| | | Total | | | Less than
1 year | | | 1-3 years | | | 4-5 years | | | After
5 years | |
| | | (in millions of U.S. dollars) | |
Contractual obligations recognized in balance sheet: | | | | |
Debt(2) | | U.S.$ | 93,453 | | | U.S.$ | 8,174 | | | U.S.$ | 13,666 | | | U.S.$ | 16,485 | | | U.S.$ | 55,128 | |
Notes payable to contractors(3) | | | 338 | | | | 202 | | | | 68 | | | | 51 | | | | 17 | |
Capital lease obligations(4) | | | 2,181 | | | | 149 | | | | 279 | | | | 273 | | | | 1,480 | |
Other long-term liabilities: | | | | | | | | | | | | | | | | | | | | |
Dismantlement and abandonment costs obligations(5) | | | 3,144 | | | | 13 | | | | 478 | | | | 543 | | | | 2,110 | |
Employee benefits plan(6) | | | 59,060 | | | | 2,945 | | | | 6,061 | | | | 6,776 | | | | 43,278 | |
| | | | | | | | | | | | | | | | | | | | |
Total contractual obligations recognized in balance sheet | | | 158,226 | | | | 11,483 | | | | 20,552 | | | | 24,128 | | | | 102,013 | |
| | | | | | | | | | | | | | | | | | | | |
Other contractual obligations not recognized in liabilities: | | | | | | | | | | | | | | | | | | | | |
Infrastructure works contracts(7) | | | 39,585 | | | | 16,822 | | | | 13,626 | | | | 3,365 | | | | 5,572 | |
Financed Public Works Contracts (FPWC)(8) | | | 799 | | | | 356 | | | | 122 | | | | 120 | | | | 201 | |
Nitrogen supply contracts(9) | | | 419 | | | | 39 | | | | 79 | | | | 80 | | | | 221 | |
| | | | | | | | | | | | | | | | | | | | |
Total contractual obligations not recognized in liabilities(10) | | | 40,803 | | | | 17,217 | | | | 13,827 | | | | 3,565 | | | | 5,994 | |
| | | | | | | | | | | | | | | | | | | | |
Total contractual obligations | | U.S. $ | 199,029 | | | U.S. $ | 28,700 | | | U.S. $ | 34,379 | | | U.S. $ | 27,693 | | | U.S. $ | 108,007 | |
| | | | | | | | | | | | | | | | | | | | |
Note: Numbers may not total due to rounding.
| (1) | All amounts calculated in accordance with IFRS. |
| (2) | See Note 15to our consolidated financial statements included herein. Figures in this line item do not include notes payable to contractors and capital lease obligations, which are presented in separate line items, but do include accrued interest as of December 31, 2016. |
| (3) | See Note 15 to our consolidated financial statements included herein. |
| (4) | See Note 15 to our consolidated financial statements included herein. |
| (5) | See Notes 3(l) and 12(c) to our consolidated financial statements included herein. |
| (6) | See Note 17 to our consolidated financial statements included herein. |
| (7) | See Note 24(e) to our consolidated financial statements included herein. |
| (8) | The amounts presented for Financed Public Works Contracts in this table correspond to works the performance and delivery of which by the relevant contractors are pending. For more information on the FPWC program, see “Item 4—Information on the Company—Business Overview—Pemex Exploration and Production—Integrated Exploration and Production Contracts and Financed Public Works Contracts” and Note 24(c) to our consolidated financial statements included herein. |
| (9) | See Notes 24(b) to our consolidated financial statements included herein. |
| (10) | No amounts have been included for Integrated E&P Contracts in this table, since payments for these contracts will be made on aper-barrel basis and performance and delivery by the relevant contractors is pending. For more information on the Integrated E&P Contracts program, see “Item 4—Information on the Company—Business Overview—Pemex Exploration and Production—Integrated Exploration and Production Contracts and Financed Public Works Contracts” and Note 24(d) to our consolidated financial statements included herein. |
Source: PEMEX’s consolidated financial statements, prepared in accordance with IFRS.
166
As of December 31, 2016, we did not have anyoff-balance sheet arrangements of the type that we are required to disclose under Item 5.E of Form20-F.
See “Item 11—Quantitative and Qualitative Disclosures about Market Risk.”
Results of Operations by Business Segment
This section presents the results of our operations by business segment, including our central corporate operations and the operations of the consolidated subsidiary companies.
As further described under “Item 4—Information on the Company—History and Development—Energy Reform—Corporate Reorganization” and in Note 1 and Note 5 to our consolidated financial statements included herein, as a result of the energy reform, we have undergone a corporate reorganization that created new business segments and redistributed the operation of certain business units to different business segments. Accordingly, the results for the business segments presented as of and for the years ended December 31, 2016 reflect different business segments from those presented as of and for the year ended December 31, 2015 and 2014. Further, as of 2016, the results for refining, gas and basic petrochemicals and petrochemicals, which were previously presented separately, are presented as part of the industrial transformation segment. For comparison purposes, we have consolidated 2015 results for these prior segments under “Total industrial transformation.”
Revenue by Business Segment
The following table sets forth our trade and intersegment net sales revenues by business segment for the fiscal years ended December 31, 2014, 2015 and 2016 as well as the percentage change in sales revenues for those years.
| | | | | | | | | | | | | | | | | | | | |
| | | Year Ended December 31, | | | 2015 | | | 2016 | |
| | | 2014 | | | 2015 | | | 2016 | | | vs. 2014 | | | vs. 2015 | |
| | | (in millions of pesos)(1) | | | (%) | | | (%) | |
Exploration and Production(4) | | | | | | | | | | | | | | | | | | | | |
Trade sales(2) | | | — | | | | — | | | | — | | | | — | | | | — | |
Intersegment sales | | | Ps.1,134,520 | | | | Ps.690,642 | | | | Ps.616,381 | | | | (39.1 | ) | | | (10.8 | ) |
| | | | | | | | | | | | | | | | | | | | |
Total net sales | | | 1,134,520 | | | | 690,642 | | | | 616,381 | | | | (39.1 | ) | | | (10.8 | ) |
Industrial Transformation(5) | | | | | | | | | | | | | | | | | | | | |
Refining(6) | | | | | | | | | | | | | | | | | | | | |
Trade sales(2)(3) | | | 763,005 | | | | 589,548 | | | | n.a. | | | | (22.7 | ) | | | n.a. | |
Intersegment sales | | | 78,453 | | | | 54,876 | | | | n.a. | | | | (30.0 | ) | | | n.a. | |
| | | | | | | | | | | | | | | | | | | | |
Total net sales | | | 841,458 | | | | 644,424 | | | | n.a. | | | | (23.4 | ) | | | n.a. | |
Gas and Basic Petrochemicals(7) | | | | | | | | | | | | | | | | | | | | |
Trade sales(2)(3) | | | 159,754 | | | | 137,456 | | | | n.a. | | | | (14.0 | ) | | | n.a. | |
Intersegment sales | | | 84,198 | | | | 55,594 | | | | n.a. | | | | (34.0 | ) | | | n.a. | |
| | | | | | | | | | | | | | | | | | | | |
Total net sales | | | 243,952 | | | | 193,050 | | | | n.a. | | | | (20.9 | ) | | | n.a. | |
Petrochemicals(8) | | | | | | | | | | | | | | | | | | | | |
Trade sales(2) | | | 29,074 | | | | 20,735 | | | | n.a. | | | | (28.7 | ) | | | n.a. | |
Intersegment sales | | | 15,182 | | | | 15,824 | | | | n.a. | | | | 4.2 | | | | n.a. | |
| | | | | | | | | | | | | | | | | | | | |
Total net sales | | | 44,256 | | | | 36,559 | | | | n.a. | | | | (17.4 | ) | | | n.a. | |
Total Industrial Transformation | | | | | | | | | | | | | | | | | | | | |
Total trade sales | | | n.a. | | | | 747,739 | | | | 653,654 | | | | n.a. | | | | (12.6 | ) |
Total intersegment sales | | | n.a. | | | | 126,264 | | | | 117,096 | | | | n.a. | | | | (7.3 | ) |
| | | | | | | | | | | | | | | | | | | | |
Total net sales | | | n.a. | | | | 874,033 | | | | 770,750 | | | | n.a. | | | | (11.8 | ) |
167
| | | | | | | | | | | | | | | | | | | | |
| | | Year Ended December 31, | | | 2015 | | | 2016 | |
| | | 2014 | | | 2015 | | | 2016 | | | vs. 2014 | | | vs. 2015 | |
| | | (in millions of pesos)(1) | | | (%) | | | (%) | |
Drilling and Services(9) | | | | | | | | | | | | | | | | | | | | |
Trade sales(2) | | | n.a | | | | n.a | | | | 70 | | | | n.a | | | | 100.0 | |
Intersegment sales | | | n.a | | | | 1,512 | | | | 1,982 | | | | 100.0 | | | | 31.1 | |
| | | | | | | | | | | | | | | | | | | | |
Total net sales | | | | | | | 1,512 | | | | 2,052 | | | | 100.0 | | | | 35.7 | |
Logistics(10) | | | | | | | | | | | | | | | | | | | | |
Trade sales(2) | | | n.a | | | | 10,356 | | | | 2,814 | | | | 100.0 | | | | (72.8 | ) |
Intersegment sales | | | n.a | | | | 599 | | | | 68,317 | | | | 100.0 | | | | 11,305.2 | |
| | | | | | | | | | | | | | | | | | | | |
Total net sales | | | | | | | 10,955 | | | | 71,131 | | | | 100.0 | | | | 549.3 | |
Cogeneration and Services(11) | | | | | | | | | | | | | | | | | | | | |
Trade sales(2) | | | n.a | | | | 0 | | | | 133 | | | | n.a | | | | 100.0 | |
Intersegment sales | | | n.a | | | | 0 | | | | 52 | | | | n.a | | | | 100.0 | |
| | | | | | | | | | | | | | | | | | | | |
Total net sales | | | | | | | 0 | | | | 184 | | | | n.a | | | | 100.0 | |
Fertilizers(12) | | | | | | | | | | | | | | | | | | | | |
Trade sales(2) | | | n.a | | | | 1,496 | | | | 3,875 | | | | 100.0 | | | | 159.0 | |
Intersegment sales | | | n.a | | | | 209 | | | | 900 | | | | 100.0 | | | | 330.8 | |
| | | | | | | | | | | | | | | | | | | | |
Total net sales | | | | | | | 1,705 | | | | 4,776 | | | | 100.0 | | | | 180.1 | |
Ethylene(13) | | | | | | | | | | | | | | | | | | | | |
Trade sales(2) | | | n.a | | | | 4,569 | | | | 15,453 | | | | 100.0 | | | | 238.2 | |
Intersegment sales | | | n.a | | | | 474 | | | | 1,764 | | | | 100.0 | | | | 272.2 | |
| | | | | | | | | | | | | | | | | | | | |
Total net sales | | | | | | | 5,043 | | | | 17,217 | | | | 100.0 | | | | 241.4 | |
Trading Companies | | | | | | | | | | | | | | | | | | | | |
Trade sales(2)(3) | | | 631,069 | | | | 407,876 | | | | 395,354 | | | | (35.4 | ) | | | (3.1 | ) |
Intersegment sales | | | 433,732 | | | | 353,137 | | | | 405,293 | | | | (18.6 | ) | | | 14.8 | |
| | | | | | | | | | | | | | | | | | | | |
Total net sales | | | 1,064,801 | | | | 761,013 | | | | 800,648 | | | | (28.5 | ) | | | 5.2 | |
Corporate and other subsidiary companies | | | | | | | | | | | | | | | | | | | | |
Trade sales(2)(3) | | | 3,826 | | | | (5,673 | ) | | | 8,193 | | | | (248.3 | ) | | | (244.4 | ) |
Intersegment sales and eliminations | | | (1,746,085 | ) | | | (1,172,868 | ) | | | (1,211,786 | ) | | | (32.8 | ) | | | 3.3 | |
| | | | | | | | | | | | | | | | | | | | |
Total net sales | | | (1,742,259 | ) | | | (1,178,541 | ) | | | (1,203,593 | ) | | | (32.4 | ) | | | 2.1 | |
| | | | | | | | | | | | | | | | | | | | |
Total net sales | | | Ps. 1,586,728 | | | | Ps. 1,166,362 | | | | Ps.1,079,546 | | | | (26.5 | ) | | | (7.4 | ) |
| | | | | | | | | | | | | | | | | | | | |
Note: Numbers may not total due to rounding.
| (1) | Figures for 2014, 2015 and 2016 are stated in nominal pesos. |
| (2) | Trade sales represent sales to external customers. See “Item 3—Key Information—Selected Financial Data.” |
| (3) | Includes services income. |
| (4) | Figures for the exploration and production segment for the year ended December 31, 2015 include net sales revenue related to the drilling and services segment until the formation of Pemex Drilling and Services on August 1, 2015 and to the logistics segment until the formation of Pemex Logistics on October 1, 2015. |
| (5) | Figures for the industrial transformation segment for the year ended December 31, 2015 include net sales revenue related to refining, gas and basic petrochemicals and petrochemicals. |
| (6) | Net sales revenue for refining for the year ended December 31, 2016 has been included under the industrial transformation segment. |
| (7) | Net sales revenue for gas and basic petrochemicals for the year ended December 31, 2016 has been included under the industrial transformation segment. |
| (8) | Figures for petrochemicals for the year ended December 31, 2015 include net sales revenue related to the ethylene segment until the formation of Pemex Ethylene on October 1, 2015 and to the fertilizers segment until the formation of Pemex Fertilizers on October 1, 2015. Net sales revenue for petrochemicals for the year ended December 31, 2016 has been included under the industrial transformation segment. |
| (9) | Figures for the drilling and services segment for the year ended December 31, 2015 refer to net sales revenue since August 1, 2015 when Pemex Drilling and Services was formed. |
168
| (10) | Figures for the logistics segment for the year ended December 31, 2015 refer to net sales revenue since October 1, 2015 when Pemex Logistics was formed. |
| (11) | Figures for the cogeneration and services segment year ended December 31, 2015 refer to net sales revenue since June 1, 2015 when Pemex Cogeneration and Services was formed. |
| (12) | Figures for the fertilizers segment for the year ended December 31, 2015 refer to net sales revenue since October 1, 2015 when Pemex Fertilizers was formed. |
| (13) | Figures for the ethylene segment for the year ended December 31, 2015 refer to net sales revenue since October 1, 2015 when Pemex Ethylene was formed. |
Source: PEMEX’s consolidated financial statements, prepared in accordance with IFRS.
Income by Business Segment
The following table sets forth our net income (loss) by business segment for each year in the three-year period ended December 31, 2016, as well as the percentage change in income for the years 2014 to 2016.
| | | | | | | | | | | | | | | | | | | | |
| | | Year Ended December 31, | | | 2015
vs. 2014 | | | 2016
vs. 2015 | |
| | | 2014 | | | 2015 | | | 2016 | | | (%) | | | (%) | |
| | | (in millions of pesos)(1) | | | | | | | |
Business Segment | | | | | | | | | | | | | | | | | | | | |
Exploration and Production(2) | | | Ps. (153,377 | ) | | | Ps. (667,394 | ) | | | Ps. (45,879 | ) | | | (335.1 | ) | | | (93.1 | ) |
Industrial Transformation(3) | | | | | | | | | | | | | | | | | | | | |
Refining(4) | | | (113,826 | ) | | | (113,147 | ) | | | n.a | | | | (0.6 | ) | | | n.a. | |
Gas and Basic Petrochemicals(5) | | | 15,584 | | | | 18,126 | | | | n.a. | | | | 16.3 | | | | n.a. | |
Petrochemicals(6) | | | (18,895 | ) | | | 7,812 | | | | n.a. | | | | 141.3 | | | | n.a. | |
| | | | | | | | | | | | | | | | | | | | |
Total Industrial Transformation | | | n.a. | | | | (87,209 | ) | | | (69,865 | ) | | | n.a. | | | | (19.9 | ) |
Drilling and Services(7) | | | n.a | | | | 455 | | | | (142 | ) | | | 100 | | | | (131.3 | ) |
Logistics(8) | | | n.a | | | | (3,685 | ) | | | (10,018 | ) | | | 100 | | | | 171.9 | |
Cogeneration and Services(9) | | | n.a | | | | (57 | ) | | | (35 | ) | | | 100 | | | | (39.1 | ) |
Fertilizers(10) | | | n.a | | | | (145 | ) | | | (1,659 | ) | | | 100 | | | | 1,044.5 | |
Ethylene(11) | | | n.a | | | | (1,755 | ) | | | 2,097 | | | | 100 | | | | (219.5 | ) |
Trading Companies | | | 4,085 | | | | 8,697 | | | | 11,167 | | | | 112.9 | | | | 28.4 | |
Corporate and other subsidiary companies(12) | | | 886 | | | | 38,526 | | | | (76,809 | ) | | | 4,245.3 | | | | (299.4 | ) |
| | | | | | | | | | | | | | | | | | | | |
Total net income (loss) | | | Ps. (265,543 | ) | | | Ps. (712,567 | ) | | | Ps. (191,144 | ) | | | (168.3 | ) | | | (73.2 | ) |
| | | | | | | | | | | | | | | | | | | | |
Note: Numbers may not total due to rounding.
| (1) | Figures are stated in nominal pesos. See “Item 3—Key Information—Selected Financial Data.” |
| (2) | Figures for the exploration and production segment for the year ended December 31, 2015 include net income (loss) related to the drilling and services segment until the formation of Pemex Drilling and Services on August 1, 2015 and to the logistics segment until the formation of Pemex Logistics on October 1, 2015. |
| (3) | Figures for the industrial transformation segment for the year ended December 31, 2015 include net income (loss) related to refining, gas and basic petrochemicals and petrochemicals. |
| (4) | Net income (loss) for refining for the year ended December 31, 2016 has been included under the industrial transformation segment. |
| (5) | Net income (loss) for gas and basic petrochemicals for the year ended December 31, 2016 has been included under the industrial transformation segment. |
| (6) | Figures for petrochemicals for the year ended December 31, 2015 include net income (loss) related to the ethylene segment until the formation of Pemex Ethylene on October 1, 2015 and to the fertilizers segment until the formation of Pemex Fertilizers on October 1, 2015. Net income (loss) for petrochemicals for the year ended December 31, 2016 has been included under the industrial transformation segment. |
| (7) | Figures for the drilling and services segment for the year ended December 31, 2015 refer to net income (loss) since August 1, 2015 when Pemex Drilling and Services was formed. |
| (8) | Figures for the logistics segment for the year ended December 31, 2015 refer to net income (loss) since October 1, 2015 when Pemex Logistics was formed. |
| (9) | Figures for the cogeneration and services segment year ended December 31, 2015 refer to net income (loss) since June 1, 2015 when Pemex Cogeneration and Services was formed. |
| (10) | Figures for the fertilizers segment for the year ended December 31, 2015 refer to net income (loss) since October 1, 2015 when Pemex Fertilizers was formed. |
169
| (11) | Figures for the ethylene segment for the year ended December 31, 2015 refer to net income (loss) since October 1, 2015 when Pemex Ethylene was formed. |
| (12) | Includes intersegment eliminations. |
Source: PEMEX’s consolidated financial statements, prepared in accordance with IFRS.
2016 Compared to 2015
Certain business units and assets that were operated by the refining, gas and basic petrochemicals and petrochemicals segments were transferred to our industrial transformation segment as a part of Pemex Industrial Transformation, on November 1, 2015. In order to provide investors with comparative information, we have consolidated 2015 results for these prior segments. Accordingly, in the case of our industrial transformation segment below, we present consolidated results for 2015 for the refining, gas and basic petrochemicals and petrochemicals segments under the heading “Industrial Transformation.” For more information on our corporate restructuring and our operating segments, see “Item 4—Information on the Company—History and Development—Energy Reform—Corporate Reorganization” and Note 1 to our consolidated financial statements included herein. For a detailed description of the financial results of each segment, see Note 5 to our consolidated financial statements included herein.
Exploration and Production
In 2016, total intersegment sales, which include sales to our industrial transformation segment and the Trading Companies, decreased by 10.8%, primarily due to the decrease in crude oil export prices. As compared to 2015, our exploration and production segment’s sales of crude oil to the Trading Companies in 2016 decreased by 0.5% in peso terms and decreased by 16.2% in U.S. dollar terms, primarily due to a decrease in crude oil export prices. The weighted average price of crude oil sold by our exploration and production segment to the Trading Companies for export was U.S. $35.17 in 2016, as compared to U.S. $42.70 in 2015. Net loss related to exploration and production activities decreased by 91.3%, or Ps. 621,515 million, from a Ps. 667,394 million loss in 2015 to a Ps. 45,879 million loss in 2016, primarily due to a net reversal of impairment of our fixed assets in this segment.
Industrial Transformation
In 2016, trade sales related to industrial transformation activities decreased by 12.6%, from Ps. 747,739 million in 2015 to Ps. 653,654 million in 2016, primarily due to a decrease in the average sales prices of petroleum products. Intersegment sales decreased by 7.3%, from Ps. 126,264 million in 2015 to Ps. 117,096 million in 2016, primarily due to a decrease in the prices of petroleum products sold. In 2016, our net loss related to industrial transformation activities was Ps. 69,865 million, 19.9% lower than the loss of Ps. 87,209 million in 2015. The decrease in loss was primarily due to a net reversal of impairment of our fixed assets in this segment and a decrease in cost and operating expenses, which was partially offset by an increase in crude oil purchases and an increase in material acquisitions.
Drilling and Services
In 2016, total sales related to the drilling and services segment increased by 35.7%, from Ps. 1,512 million in 2015 to Ps. 2,052 million in 2016. This increase was primarily due to an increase in services provided to Pemex Exploration and Production. Net loss related to drilling and services increased by Ps. 597 million, from an income of Ps. 455 million in 2015 to a net loss of Ps. 142 million in 2016, primarily due to an increase in the expenses related to our intersegment services, an increase in the depreciation and maintenance required for our fixed assets, and a foreign exchange loss.
Logistics
In 2016, total sales related to the logistics segment increased by Ps. 60,176 million, from Ps. 10,955 million in 2015 to Ps. 71,131 million in 2016, primarily due to an increase in the services provided to Pemex Industrial
170
Transformation. In 2016, our net loss related to logistics activities was Ps. 10,018 million, 171.9% higher than the loss of Ps. 3,685 million in 2015. The increase in net loss was primarily due to the transfer of certain of our assets to CENAGAS, higher operating expenses, an increase in financing cost, and a foreign exchange loss.
Fertilizers
In 2016, total sales related to the fertilizers segment increased by Ps. 3,071 million, from Ps. 1,705 million in 2015 to Ps. 4,776 million in 2016. This increase was primarily due to an increase in the trade sales of ammonia. In 2016, our net loss related to our fertilizers activities increased by Ps. 1,514 million, from a net loss of Ps. 145 million in 2015 to a net loss of Ps. 1,659 million in 2016, primarily due to costs related to the acquisition of Fertinal and an increase in the cost of services received from Pemex Logistics and from maritime freights.
Ethylene
In 2016, total sales related to our ethylene segment increased by Ps. 12,174 million, from Ps. 5,043 million in 2015 to Ps. 17,217 million in 2016, primarily due to an increase in the sales of polyethylene, ethylene oxides and monoethylenglecol products. In 2016, our net income related to our ethylene activities increased by Ps. 3,852 million, from a net loss of Ps. 1,755 million in 2015 to a net income of Ps. 2,097 million in 2016. This increase in income was primarily due to a net reversal of impairment of our plants and an increase in sales..
Trading Companies
In 2016, total sales relating to the Trading Companies’ exports of crude oil and petroleum products to third parties (including services income) decreased in peso terms, from Ps. 407,876 million in 2015 to Ps. 395,354 million in 2016, primarily as a result of a decrease in the prices of crude oil exports. In 2016, net income related to the Trading Companies increased by 28.4%, from Ps. 8,697 million in 2015 to Ps. 11,167 million, primarily due to an increase in the permanent investment in associates that was recognized at fair value.
Corporate and Other Subsidiary Companies
In 2016, the total sales relating to corporate and other subsidiary companies after inter-company eliminations increased from Ps. 1,178,541 million in 2015 to Ps. 1,203,593 million in 2016, primarily due to an increase in total intercompany sales as a result of an increase in the import of products. Net loss related to corporate and other subsidiary companies after inter-company eliminations increased by Ps. 115,335 million, from a net income of Ps. 38,526 million in 2015 to a net loss of Ps. 76,809 million in 2016, primarily due to unfavorable results from subsidiary companies, an increase in foreign exchange loss and an increase in financing costs.
2015 Compared to 2014
Certain business units and assets that were operated by our exploration and production segment were transferred to our drilling and services segment upon the formation of Pemex Drilling and Services on August 1, 2015, and certain business units and assets that were operated by our exploration and production, refining and gas and basic petrochemicals segments were transferred to our logistics segment upon the formation of Pemex Logistics on October 1, 2015. Similarly, certain business units and assets that were operated by our petrochemicals segment were transferred to our ethylene and fertilizers segments upon the formation of Pemex Ethylene and Pemex Fertilizers on August 1, 2015 and certain business units and assets that were operated by the gas and basic petrochemicals segment were transferred to the cogeneration and services segment upon the formation of Pemex Cogeneration and Services on June 1, 2015. As detailed in the table above, we have started reporting financial information for these new segments from and after their formation in 2015.
171
However, in order to provide investors with comparative information, we have consolidated these new segments into the segments that previously included the business units and assets of these new segments here and in Note 5 to our consolidated financial statements included herein. Accordingly, in the case of our exploration and production segment below, we present consolidated results for 2015 of the exploration and production segment, the drilling and services segment and the logistics segment under the heading “Exploration and Production”; in the case of our refining segment, we present consolidated results for 2015 of the refining segment and part of the logistics segment under the heading “Refining”; in the case of our petrochemicals segment below, we present consolidated results for 2015 of the petrochemicals segment, the ethylene segment and the fertilizers segment under the heading “Petrochemicals”; and in the case of our gas and basic petrochemicals segment below, we present consolidated results for 2015 of the gas and basic petrochemicals segment, part of the logistics segment and the cogeneration and services segment under the heading “Gas and Basic Petrochemicals.” For more information on our corporate restructuring and our new operating segments, see “Item 4—Information on the Company—History and Development—Energy Reform—Corporate Reorganization” and Note 1 to our consolidated financial statements included herein. For a detailed description of the financial results of each segment, see Note 5 to our consolidated financial statements included herein. The following sections compare results of operations for our main segments prior to our recent corporate reorganization for 2015 as compared to 2014.
Exploration and Production
As compared to 2014, our exploration and production segment’s sales of crude oil to the Trading Companies in 2015 decreased by 39.1% in peso terms and decreased by 49.4% in U.S. dollar terms, primarily due to a decrease in crude oil export prices. The weighted average price of crude oil sold by our exploration and production segment to the Trading Companies for export was U.S. $42.70 in 2015, as compared to U.S. $86.00 in 2014. Total intersegment sales, which include sales to our refining segment, our gas and basic petrochemicals segment and the Trading Companies, decreased by 39.1%, primarily due to the decrease in crude oil export prices. Net loss related to exploration and production activities increased by 335.1%, or Ps. 514,017 million, from a Ps. 153,377 million loss in 2014 to a Ps. 667,394 million loss in 2015, primarily due to a decrease in the average price of crude oil.
Refining
In 2015, trade sales related to refining activities (including services income) decreased by 22.7%, from Ps. 763,005 million in 2014 to Ps. 589,548 million in 2015, primarily due to a decrease in the average sales prices of petroleum products. Intersegment sales decreased by Ps. 23,577 million, or 30.0%, from Ps. 78,453 million in 2014 to Ps. 54,876 million in 2015, primarily due to a decrease in the prices of petroleum products sold. In 2015, our total loss related to refining activities was Ps. 113,148 million, 0.6% lower than the loss of Ps. 113,826 million in 2014. The decrease in loss was primarily due to higher prices of petroleum products during 2015, which was partially offset by a decrease in other income due to the negative IEPS tax.
Gas and Basic Petrochemicals
In 2015, trade sales related to the natural gas and basic petrochemical segment (including services income) decreased by 14.0%, from Ps. 159,754 million in 2014 to Ps. 137,456 million in 2015. LPG sales increased by 0.1%, from Ps. 78,084 million in 2014 to Ps. 78,194 million in 2015, primarily due to an increase in LPG prices. Natural gas sales decreased by 30.0%, from Ps. 77,813 million in 2014 to Ps. 54,498 million in 2015, primarily due to a decrease in the volume and prices of natural gas. Net income related to natural gas and basic petrochemicals increased by 16.3%, from Ps. 15,584 million in 2014 to Ps. 18,126 million in 2015, primarily due to a decrease in purchases of imported LPG and cost of employee benefits.
Petrochemicals
In 2015, trade sales related to the petrochemicals segment decreased by 28.7%, from Ps. 29,074 million in 2014 to Ps. 20,735 million in 2015. Prices for petrochemicals sold domestically decreased for a majority of our
172
petrochemical products. In 2015, the volume of petrochemical exports decreased by 40.4%, from 527.1 thousand tons in 2014 to 313.9 thousand tons in 2015. Losses related to petrochemical activities decreased by 141.3%, from Ps. 18,895 million in 2014 to profit Ps. 7,812 million in 2015, primarily due to: (1) a 24.9% decrease in the cost of sales in 2015; (2) a decrease in the prices of raw materials; and (3) a decrease in the cost of employee benefits.
Trading Companies
In 2015, trade sales relating to the Trading Companies’ exports of crude oil and petroleum products to third parties (including services income) decreased in peso terms, from Ps. 631,069 million in 2014 to Ps. 407,876 million in 2015, primarily as a result of a decrease in the prices of crude oil exports. In 2015, net income related to the Trading Companies increased by 112.9%, from Ps. 4,085 million in 2014 to Ps. 8,697 million, primarily due to lower taxes and sale.
Corporate and Other Subsidiary Companies
In 2015, the trade sales relating to corporate and other subsidiary companies after inter-company eliminations decreased, from Ps. 1,742,259 million in 2014 to Ps. 1,178,541 million in 2015, primarily due to lower revenues from services. Net income related to corporate and other subsidiary companies after inter-company eliminations increased, from Ps. 886 million in 2014 to Ps. 38,526 million in 2015, primarily due to favorable results from subsidiary companies.
| Item 6. | Directors, Senior Management and Employees |
Under the Petróleos Mexicanos Law, Petróleos Mexicanos is governed by aten-member Board of Directors composed as follows:
| | • | | the Secretary of Energy, who serves as the Chairperson and has the right to cast atie-breaking vote; |
| | • | | the Secretary of Finance and Public Credit; |
| | • | | three Mexican Government representatives, who are appointed by the President of Mexico; and |
| | • | | five independent members, who are appointed by the President of Mexico, subject to ratification by the Senate. Independent members perform their duties on a part-time basis, are not public officials (i.e., individuals holding federal, state or municipal government positions in Mexico) and have not been employed by Petróleos Mexicanos or any of the subsidiary entities during the two years prior to their appointment. |
The Petróleos Mexicanos Law authorizes only the Secretary of Energy and the Secretary of Finance and Public Credit to designate an alternate to serve in his or her place, provided that the alternate is a public official at the undersecretary level, at minimum. This alternate may attend meetings of the Board of Directors of Petróleos Mexicanos and otherwise assume the duties of the director, except that the Chairperson’s designated alternate may not cast atie-breaking vote. In addition, any ministry-level secretary serving as a member of the Board of Directors of Petróleos Mexicanos may designate an alternate to attend meetings on his or her behalf, provided that such alternate is a public official at the undersecretary level, at minimum.
Under the Petróleos Mexicanos Law, all public officials serving as members of the Board of Directors of Petróleos Mexicanos are required to act impartially and for the benefit and in the best interests of Petróleos Mexicanos, separating at all times the interests of the ministry or governmental entity for which they work from their duties as members of the Board of Directors.
173
Except in the case of the independent members first appointed under the Petróleos Mexicanos Law, the five independent members will be appointed to staggered five-year terms, and may be appointed for an additional term of the same length. The remaining members of the Board of Directors of Petróleos Mexicanos are not appointed for a specific term.
In 2014, the following individuals were appointed to serve as independent members of the Board of Directors of Petróleos Mexicanos for the initial terms set forth below:
| | • | | Mr. Alberto Tiburcio Celorio, for two years; |
| | • | | Mr. Octavio Francisco Pastrana Pastrana, for three years; |
| | • | | Mr. Jorge José Borja Navarrete, for four years; |
| | • | | Mr. Jaime Lomelín Guillén, for five years; and |
| | • | | Mr. Carlos Elizondo Mayer-Serra, for six years. |
On February 17, 2015, Mr. Jaime Lomelín Guillén resigned from his position as independent member of the Board of Directors of Petróleos Mexicanos. On April 29, 2016, the Senate ratified the appointment of Mr. Felipe Duarte Olvera as an independent member to serve for the remainder of Mr. Lomelín Guillén’s term. Following the expiration of Mr. Alberto Tiburcio Celorio’s initial term as an independent director, Ms. María Teresa Fernández Labardini was appointed to an additional five-year term.
Under the Petróleos Mexicanos Law, each of the boards of directors of the subsidiary entities will consist of not less than five and no more than seven members. The majority of the members of each of the board of directors shall be appointed by and represent the Board of Directors of Petróleos Mexicanos. The Ministry of Energy and the Ministry of Finance and Public Credit may also appoint members to each board of directors of the subsidiary entities, subject to approval by the Board of Directors of Petróleos Mexicanos.
TheEstatuto Orgánico(Organic Statute) of Petróleos Mexicanos was published in the Official Gazette of the Federation on April 28, 2015. This Organic Statute establishes the structure, organizational basis and functions of the administrative units of Petróleos Mexicanos and also delineates the duties and internal regulations of its Board of Directors. During 2016 and through the first quarter of 2017, the Board of Directors of Petróleos Mexicanos approved several amendments to our organic structure. The management of Petróleos Mexicanos will task applicable areas with carrying out all of the necessary actions to implement these changes until a new Organic Statute is authorized and becomes effective.
174
The following tables set forth certain information with respect to directors and executive officers of Petróleos Mexicanos and each of the subsidiary entities as of April 3, 2017.
Petróleos Mexicanos—Directors and Executive Officers
| | | | |
Name | | Position with Petróleos Mexicanos | | Year
Appointed |
| | |
Mr. Pedro Joaquín Coldwell | | Chairman of the Board of Directors of Petróleos Mexicanos and Secretary of Energy Born: 1950 Business experience: Chairman of the National Executive Committee of the PRI; Senator of the LXth and LXIst Legislatures; and Chairman of the National Executive Commission of Internal Procedures of the PRI. Other board memberships: Chairman of CFE;Chairman of the Centro Nacional de Control de Energía; Chairman of CENAGAS; Banco Nacional de Comercio Exterior, S.N.C., Institución de Banca de Desarrollo; Nacional Financiera, S.N.C., Institución de Banca de Desarrollo; Comisión Nacional de Vivienda; Instituto Nacional de Ecología y Cambio Climático. | | 2012 |
| | |
Mr. Ildefonso Guajardo Villarreal | | Board member of Petróleos Mexicanos and Secretary of Economy Born: 1957 Business experience: Deputy Coordinator of Political Economy for the President Elect’s Transition Team; Transition Coordinator to the PRI Candidate’s Presidential Campaign; Federal Deputy of the LXIst Legislature. Other board memberships: Aeropuertos y Servicios Auxiliares; Banco del Ahorro Nacional y Servicios Financieros, S.N.C., Institución de Banca de Desarrollo; Banco Nacional de Comercio Exterior, S.N.C.; Caminos y Puentes Federales de Ingresos y Servicios Conexos; Centro de Investigación y Docencia Económicas, A.C.; Centro Nacional de Metrología; Centro Nacional de Gas Natural; Comisión Coordinadora para la Negociación de Precios de Medicamentos y otros Insumos para la Salud; CFE; Chairman of the Comisión Federal de Mejora Regulatoria; Comisión Intersecretarial de Bioseguridad de los Organismos Genéticamente Modificados; Comisión Intersecretarial de Cambio Climático; Chairman of the Comisión Intersecretarial de Compras y Obras de la Administración Pública Federal a la Micro, Pequeña y Mediana Empresa; | | 2013 |
175
Petróleos Mexicanos—Directors and Executive Officers
| | | | |
Name | | Position with Petróleos Mexicanos | | Year
Appointed |
| | Comisión Intersecretarial de Desarrollo Social; Comisión Intersecretarial de Gasto Público Financiamiento y Desincorporación; Comisión Intersecretarial de Precios y Tarifas de los Bienes y Servicios de la Administración Pública Federal; Comisión Intersecretarial de Vivienda; Comisión Intersecretarial para Asuntos de la Frontera Norte; Comisión Intersecretarial para el Desarrollo de los Bioenergéticos; Comisión Intersecretarial para el Desarrollo del Gobierno Electrónico; Comisión Intersecretarial para el Desarrollo Rural Sustentable; Comisión Intersecretarial para el Manejo Sustentable de Mares y Costas; Comisión Intersecretarial para la Coordinación Operativa en los Puntos de Internación al Territorio Nacional; Comisión Intersecretarial para la Atención de Sequias e Inundaciones; Comisión Intersecretarial para la Instrumentación de la Cruzada contra el Hambre; Comisión Intersecretarial para la Prevención y Combate a la Economía Ilegal; Comisión Intersecretarial para la Prevención y Erradicación del Trabajo Infantil y la Protección de Adolescentes Trabajadores en Edad Permitida en México; Comisión Intersecretarial para la Transición Digital; Comisión Intersecretarial para la Prevención Social de la Violencia y la Delincuencia; Comisión Intersecretarial de Zonas Económicas Especiales; Chairman of the Comisión Nacional de Inversiones Extranjeras; Comisión Nacional de Vivienda; CONAGUA; Comisión Nacional Forestal; Comisión Nacional para el Conocimiento y Uso de la Biodiversidad; Comisión Nacional para el Desarrollo de los Pueblos Indígenas; Chairman of the Comité de Control y Desempeño Institucional; Chairman of the Comité Intersectorial para la Innovación; Comité Nacional de Productividad; Comité Nacional para el Desarrollo Sustentable de la Caña de Azúcar; Consejo Consultivo Empresarial para el Crecimiento Económico de México; Chairman of the Consejo Consultivo para el Fomento a la Industria Eléctrica Nacional; Consejo Consultivo de Turismo; Comisión Intersecretarial para el Sector Turístico; Consejo Nacional de Normalización y Certificación de Competencias Laborales; Consejo Mexicano para el Desarrollo Rural Sustentable; Consejo Nacional contra las Adicciones; Consejo | | |
176
Petróleos Mexicanos—Directors and Executive Officers
| | | | |
Name | | Position with Petróleos Mexicanos | | Year
Appointed |
| | Nacional de Ciencia y Tecnología; Consejo General de Investigación Científica, Desarrollo Tecnológico e Innovación; Consejo Nacional de Fomento Educativo; Consejo Nacional de Infraestructura; Consejo Nacional de Protección Civil; Consejo de Salubridad General; Consejo Nacional de Vivienda; Chairman of the Consejo Nacional para la Competitividad de la Micro, Pequeña y Mediana Empresa; Consejo Nacional para la Prevención y Control de las Enfermedades Crónicas no Transmisibles; Coordinación Nacional de Prospera, Programa de Inclusión Social; Consejo Nacional para las Comunidades Mexicanas en el Exterior; El Colegio de la Frontera Norte, A.C.; Chairman of the Fideicomiso de Fomento Minero; Fideicomiso del Fondo Institucional para el Fomento de la Ciencia, el Fomento de la Tecnología y el Fomento, Desarrollo y Consolidación de Científicos y Tecnólogos; Fideicomisoe-México; Chairman of the Fideicomiso para Promover el Acceso al Financiamiento de MIPYMES y Emprendedores (México Emprende); Chairman of the Fondo de Innovación TecnológicaSE-CONACYT; Gabinete Especializado de México Próspero; Gabinete Especializado de México con Responsabilidad Global; Gabinete Especializado Incluyente; Instituto del Fondo Nacional de la Vivienda de los Trabajadores; Instituto del Fondo Nacional para el Consumo de los Trabajadores; Instituto Mexicano de la Juventud; Chairman of the Instituto Mexicano de la Propiedad Industrial; Instituto Nacional de la Infraestructura Física Educativa; Instituto Nacional de las Mujeres; Chairman of the Instituto Nacional del Emprendedor; Nacional Financiera, S.N.C.; Chairman of the Fideicomiso Público ProMéxico; Chairman of the Servicio Geológico Mexicano; Servicio Nacional de Capacitación y Asistencia Técnica Rural; Servicio Postal Mexicano; Sistema de Investigación Alfonso Reyes; Sistema de Investigación Benito Juárez; Sistema de Investigación Francisco Villa; Sistema de Investigación Golfo de México; Sistema de Investigación Ignacio Zaragoza; Sistema de Investigación José María Morelos; Sistema de Investigación Justo Sierra; Sistema de Investigación Mar de Cortés; Sistema de Investigación Miguel Hidalgo; and Telecomunicaciones de México. | | |
177
Petróleos Mexicanos—Directors and Executive Officers
| | | | |
Name | | Position with Petróleos Mexicanos | | Year
Appointed |
| | |
Mr. Aldo Ricardo Flores Quiroga | | Board Member of Petróleos Mexicanos and Undersecretary of Hydrocarbons of the Ministry of Energy Born: 1967 Business experience: Secretary-General of the International Energy Forum; Director General of International Affairs of the Ministry of Energy; and Director General of Bilateral Economic Relations of the Ministry of Foreign Affairs. Other board memberships: Centro Nacional de Control del Gas Natural; Consejo de Coordinación del Sector Energético; Fondo Mexicano del Petróleo para la Estabilización y el Desarrollo (Alternate) | | 2016 |
| | |
Mr. José Antonio Meade Kuribreña | | Board Member of Petróleos Mexicanos and Secretary of Finance and Public Credit Born: 1969 Business experience: Secretary of Social Development; Secretary of Foreign Affairs; and Secretary of Energy. Other board memberships: Aeropuertos y Servicios Auxiliares; Chairman of Casa de Moneda de México; Centro Nacional de Control de Energía; Centro Nacional de Control de Gas; Agencia de Noticias del Estado Mexicano; Agencia Espacial Mexicana; Caminos y Puentes Federales de Ingresos y Servicios Conexos; Chairman of Financiera Nacional de Desarrollo Agropecuario, Rural, Forestal y Pesquero; Fondo de Cultura Económica; Instituto del Fondo Nacional de la Vivienda para los Trabajadores; Instituto del Fondo Nacional para el Consumo de los Trabajadores; Instituto Mexicano de la Radio; Chairman of the Instituto para la Protección al Ahorro Bancario; Chairman of Lotería Nacional para la Asistencia Pública; Chairman of Pronósticos para la Asistencia Pública; Servicio Postal Mexicano; Talleres Gráficos de México; Telecomunicaciones de México; Chairman of Servicio de Administración y Enajenación de Bienes; Aeropuerto Internacional de la Ciudad de México, S.A. de C.V.; Chairman of Agroasemex, S.A., Institución Nacional de Seguros; Chairman of Banco del Ahorro Nacional y Servicios Financieros, S.N.C., Institución de Banca de Desarrollo; Chairman of Banco Nacional de | | 2016 |
178
Petróleos Mexicanos—Directors and Executive Officers
| | | | |
Name | | Position with Petróleos Mexicanos | | Year
Appointed |
| | Comercio Exterior, S.N.C., Institución de Banca de Desarrollo; Chairman of Banco Nacional de Obras y Servicios Públicos, S.N.C., Institución de Banca de Desarrollo; Chairman of Banco Nacional del Ejército, Fuerza Aérea y Armada, S.N.C., Institución de Banca de Desarrollo; Exportadora de la Sal, S.A. de C.V.; Ferrocarril del Istmo de Tehuantepec, S.A. de C.V.; Impresora y Encuadernadora Progreso, S.A. de C.V.; FONATUR Constructora, S.A. de C.V.; FONATUR Operadora Portuaria, S.A. de C.V.; FONATUR Mantenimiento Turístico, S.A. de C.V.; FONATUR Prestadora de Servicios, S.A. de C.V.; Grupo Aeroportuario de la Ciudad de México, S.A. de C.V.; Chairman of Nacional Financiera, S.N.C., Institución de Banca de Desarrollo; Chairman of Seguros de Crédito a la Vivienda SHF, S.A. de C.V.; Chairman of Sociedad Hipotecaria Federal, S.N.C., Institución de Banca de Desarrollo; Servicios Aeroportuarios de la Ciudad de México, S.A. de C.V.; CFE; Chairman of the Fondo de Capitalización e Inversión del Sector Rural; Fondo Nacional de Fomento al Turismo; Fideicomiso de Fomento Minero; Fondo de Operación y Financiamiento Bancario a la Vivienda; CNBV; Comisión Nacional de Seguros y Fianzas; Chairman of the Comisión de Cambios; Comisión Nacional de Inversiones Extranjeras; Banco Interamericano de Desarrollo y Corporación Interamericana de Inversiones; Banco Internacional de Reconstrucción y Fomento del Banco Mundial; Organismo Multilateral de Garantía de Inversiones del Banco Mundial; and Banco de Desarrollo del Caribe. | | |
| | |
Mr. Rafael Pacchiano Alamán | | Board Member of Petróleos Mexicanos and Secretary of the Environmental and Natural Resources Born: 1975 Business experience: Undersecretary of Environmental Protection Management of the Ministry of Environment and Natural Resources; Youth Program Coordinator of the Transition Team for the President-Elect of Mexico; and Federal Deputy in the LXI Legislature. Other board memberships: CFE. | | 2015 |
179
Petróleos Mexicanos—Directors and Executive Officers
| | | | |
Name | | Position with Petróleos Mexicanos | | Year
Appointed |
| | |
Mr. Carlos Elizondo Mayer-Serra | | Independent Board Member of Petróleos Mexicanos
Born: 1962
Business experience: Professor at the Instituto Tecnológico y de Estudios Superiores de Monterrey, A.C.; Professor and Researcher at the Centro de Investigación y Docencia Económicas, A.C.; and Ambassador of Mexico to the Organización para la Cooperación y Desarrollo Económicos. Other board memberships: Corporación Interamericana de Entretenimiento, S.A.B. de C.V. (Independent) and Consejo Nacional de Ciencia y Tecnología. | | 2014 |
| | |
Mr. Octavio Francisco Pastrana Pastrana | | Independent Board Member of Petróleos Mexicanos Born: 1952 Business experience: Partner of Administradora Ictineo Infraestructura, S.A.P.I. de C.V.; President and Chief Executive Officer of Isolux Mexico of Isolux Corsán, S.A.; and Director of Strategy and Business Development of ARB Arendal. Other board memberships: COREMAR Empresa de Servicios Portuarios, S.A. and Grupo Aeroportuario de la Ciudad de México, S.A. de C.V. (Independent). | | 2014 |
| | |
Mr. Jorge José Borja Navarrete | | Independent Board Member of Petróleos Mexicanos Born: 1943 Business experience: Professional Member of the Board of Directors of Petróleos Mexicanos; Member of the Directive Board of the Universidad Nacional Autónoma de México; and Advisor of Grupo Xignux. Other board memberships: Chairman of the Club Universidad Nacional, A.C. | | 2014 |
| | |
Ms. María Teresa Fernández Labardini | | Independent Board Member of Petróleos Mexicanos Born: 1967
Business experience: Partner of White & Case, S.C.; Executive Secretary-General Director of the Instituto para la Protección al Ahorro Bancario; General Technical Director of the CNBV; and Vice President of Regulation of the CNBV. | | 2017 |
180
Petróleos Mexicanos—Directors and Executive Officers
| | | | |
Name | | Position with Petróleos Mexicanos | | Year
Appointed |
| | |
Mr. Felipe Duarte Olvera | | Independent Board Member of Petróleos Mexicanos Born: 1974 Business experience: Assistant Director General of Infrastructure and Energy of Grupo Financiero Banorte, S.A.B. de C.V.; Assistant Director General of Client Experience of Grupo Financiero Banorte, S.A.B. de C.V.; and Undersecretary of Transportation of the Ministry of Communications and Transportation. Other board memberships: Grupo Aeroportuario del Centro Norte, S.A.B. de C.V. | | 2016 |
| | |
Mr. José Antonio González Anaya | | Chief Executive Officer/Director General Born: 1967 Business experience: Chief Executive Officer of the Instituto Mexicano del Seguro Social; Undersecretary of Income of the Ministry of Finance and Public Credit; and Chief of Staff of the Secretary of Finance and Public Credit. | | 2016 |
| | |
Mr. Juan Pablo Newman Aguilar | | Chief Financial Officer / Corporate Director of Finance
Born: 1979
Business experience: Chief Financial Officer of Nacional Financiera, S.N.C., Institución de Banca de Desarrollo; Deputy Director General of Debt Issuance of the Ministry of Finance and Public Credit; and Director of Risk Management of the Ministry of Finance and Public Credit. | | 2016 |
| | |
Mr. Luis Ignacio Rayón Llerandi | | Deputy Director of Budget Born: 1963 Business experience: Executive Director of Products and Market Relations of Grupo Financiero Interacciones, S.A. de C.V.; Deputy Treasurer of Operation of the Tesorería de la Federación; and Advisor of the Tax Affairs Department of the Fondo Monetario Internacional. | | 2016 |
| | |
Mr. Roberto Cejudo Pascual | | Deputy Director of Treasury
Born: 1969
Business experience: Corporate Director of Treasury of Grupo Bimbo, S.A.B. de C.V.; Private Consultant for Pharo Capital S.C.; and Chief of Financial Staff of Grupo Financiero Serfin, S.A. de C.V. | | 2016 |
181
Petróleos Mexicanos—Directors and Executive Officers
| | | | |
Name | | Position with Petróleos Mexicanos | | Year
Appointed |
| | |
Mr. Manuel Salvador Cruz Flores | | Deputy Director of Accounting and Tax Born: 1950 Business experience: Central Administrator of the General Administration for Large Taxpayers of the Servicio de Administracion Tributaria; Vice President of Taxes, Customs and Legal and Government Relations of Robert Bosch Mexico; and International Tax Director of KPMG Peat Marwick, Cárdenas Dosal, S.C. | | 2016 |
| | |
Ms. Alma Rosa Moreno Razo | | Deputy Director of Economic-Financial Performance (before Deputy Director of Economic Performance) Born: 1952
Business experience: Advisor to the Director General of Petróleos Mexicanos; Partner of ITG Consultants; and General Director of Management of Grupo Financiero Banorte, S.A.B. de C.V. | | 2013 |
| | |
Mr. David Ruelas Rodríguez | | Deputy Director of Risk Management and Insurance Born: 1977
Business experience: Associate Managing Director of Corporate Financial Management of Petróleos Mexicanos; Coordinator of Governmental Programs of Petróleos Mexicanos; and Advisor to the Corporate Director of Management of Petróleos Mexicanos. | | 2011 |
| | |
Mr. Carlos Alberto Treviño Medina | | Corporate Director of Management and Services Born: 1970 Business experience: Chief Financial Officer of the Instituto Mexicano del Seguro Social; Chief Executive Officer of Financiera Rural; and Undersecretary of Expenses of the Ministry of Finance and Public Credit. | | 2016 |
| | |
Mr. Miguel Ángel Servín Diago | | Operative Director of Procurement and Supply Born: 1969 Business experience: Head of the Administrative Unit of the Instituto Mexicano del Seguro Social; Director General of Material Resources of the Ministry of Communications and Transportation and Advisor of the Secretary of Communications and Transportation. | | 2016 |
182
Petróleos Mexicanos—Directors and Executive Officers
| | | | |
Name | | Position with Petróleos Mexicanos | | Year
Appointed |
| | |
Mr. Marco Antonio Murillo
Soberanis | | Deputy Director of Labor Relations and Services for Personnel Born: 1959
Business experience: Acting Corporate Director of Management of Petróleos Mexicanos; Deputy Director of Human Resources of Petróleos Mexicanos; and Associate Corporate Managing Director of Human Resources of Petróleos Mexicanos. | | 2005 |
| | |
Mr. Antonio Eduardo Carrillo Liceaga | | Deputy Director of Corporate Services Born: 1965
Business experience: Executive Coordinator of Corporate Direction of Management of Petróleos Mexicanos; Advisor of the Corporate Director of Operations of Petróleos Mexicanos; and Associate Managing Director of Public Works Agreements Standardization of Petróleos Mexicanos. | | 2013 |
| | |
Mr. Marco Antonio Navarrete Prida | | Deputy Director of Health Services
Born: 1967
Business experience: National Coordinator of Medical Subrogation Services; National Coordinator of Assigned Medical Services of Petróleos Mexicanos; Medical Coordinator (Guadalajara Area) of Petróleos Mexicanos; and Medical Supervisor of Petróleos Mexicanos for the Aguascalientes Sector. | | 2014 |
| | |
Mr. José Antonio Negroe Ortega | | Deputy Director of Equity Administration Born: 1957
Business experience: Associate Managing Director of Equity Administration and Services of Pemex-Refining; Legal Representative of the Museo Tecnológico de la CFE; and General Comptroller of Consorcio Aviacsa, S.A. de C.V. | | 2015 |
| | |
Mr. Eduardo León Trauwitz | | Deputy Director of Strategic Safeguarding Born: 1966
Business experience: Associate Managing Director of Physical Security Services of Petróleos Mexicanos; Coordinator of Security for Mr. Enrique Peña Nieto; and Coordinator of Assistantships for the Governor of the Estado de México. | | 2014 |
| | |
Mr. Alejandro Dieck Assad | | Deputy Director of Human Resources Born: 1958 Business experience: Founder and Chief Executive Officer of Consultores Asociados en Asesoría Integral S.A.; Director of Residual Division and Institutional Liaisons and Projects of Promotora Ambiental, S.A.B. de C.V.; and Undersecretary of Planning and Technological Development of the Ministry of Energy. | | 2016 |
183
Petróleos Mexicanos—Directors and Executive Officers
| | | | |
Name | | Position with Petróleos Mexicanos | | Year
Appointed |
| | |
Mr. Rodulfo Figueroa Alonso | | Corporate Director of Planning, Coordination and Performance Born: 1964
Business experience: Deputy Director of Planning ofPemex-Gas and Basic Petrochemicals; Associate Managing Director of Planning ofPemex-Gas and Basic Petrochemicals; and Associate Managing Director of Assessment and Information ofPemex-Gas and Basic Petrochemicals. | | 2015 |
| | |
Ms. Guadalupe Merino Bañuelos | | Deputy Director of Strategic Planning and Regulatory Analysis Born: 1971 Business experience: Associate Managing Director of Strategic Planning of Petróleos Mexicanos; Deputy Director of Programming and Budgeting of Petróleos Mexicanos; and Deputy Director of Corporate Services of Petroóleos Mexicanos. | | 2016 |
| | |
Mr. Sergio Escoto Cortés | | Deputy Director of Programming and Coordination Execution Born: 1967 Business experience: Acting Deputy Director of Operation and Strategy Execution of Petróleos Mexicanos; Associate Managing Director of Evaluation and Monitoring of Petróleos Mexicanos; and Associate Managing Director of Operations Analysis and Programming of Petróleos Mexicanos. Other board memberships: Frío Espacio Control, S.A.P.I. de C.V. (Alternate). | | 2014 |
| | |
Mr. Luis Fernando Betancourt
Sánchez | | Deputy Director of Sustainable Development and Safety, Health and Environmental Protection Born: 1967
Business experience: Associate Managing Director of Operative Discipline and Execution of the SSPA System of Petróleos Mexicanos; Associate Managing Director of Environmental Protection of Pemex-Refining; and Associate Managing Director of Implementation of SSPA System of Petróleos Mexicanos. | | 2010 |
| | |
Mr. Franklin Ulin Jiménez | | Deputy Director of Reliability Born: 1957 Business experience: Acting Deputy Director of Operation and Strategy Execution of Petróleos Mexicanos; Associate Managing Director of Evaluation and Monitoring of Petróleos Mexicanos; and Acting Deputy Director of Maintenance Coordination of Petróleos Mexicanos. | | 2015 |
184
Petróleos Mexicanos—Directors and Executive Officers
| | | | |
Name | | Position with Petróleos Mexicanos | | Year
Appointed |
| | |
Mr. Jorge Collard de la Rocha | | Deputy Director of Business Performance Born: 1951
Business experience: Deputy Director of Management and Finance of Pemex-Petrochemicals; Deputy Director of Management and Finance of Pemex-Exploration and Production; and Acting Deputy Director of Supplies of Petróleos Mexicanos. | | 2015 |
| | |
Mr. Rodrigo Becerra Mizuno | | Chief Information Officer/ Corporate Director of Information Technology (before Corporate Officer of Business Processes and Information Technology) Born: 1975
Business experience: Director General of Public Sector (Asia Region) of Microsoft Corporation; Executive Director of Global Government of Microsoft Corporation; and Global Manager of Public Sector of Marketing Microsoft Corporation. | | 2016 |
| | |
Ms. Eugenia Berenice Torres Romero | | Acting Deputy Director of Information Technology Services Born: 1964 Business experience: Director of Programming and Innovation of the Ministry of Labor and Social Foresight; Deputy Director of Human Resources, Materials and General Services of the Ministry of Labor and Social Foresight and Director of Development of the Instituto Latinoamericano de Cultura Digital, A.C. | | 2016 |
| | |
Mr. Juan Gerardo Dávila Vales | | Deputy Director of Technology Alignment Born: 1974 Business experience: Founding Partner of Ecosoluciones Citienergy, S.A.P.I. de C.V.; Chief Executive Officer of Grupo Bienestar; and Vice President of Global Financial Services LLP. | | 2017 |
| | |
Mr. Rogelio Ventura Miranda | | Deputy Director of Business Solutions Born: 1969 Business experience: Acting Deputy Director of Solutions and Business Services of Petróleos Mexicanos; Associate Managing Director of Design and Business Solutions Integration of Petróleos Mexicanos; and Deputy Manager of Development of Petróleos Mexicanos. | | 2017 |
| | |
Mr. José Manuel Carrera Panizzo | | Corporate Director of Alliances and New Businesses Born: 1969 Business experience: Chief Executive Officer of PMI; Chief Financial Officer of PMI; and Deputy Director of Risk Management of Petróleos Mexicanos. | | 2015 |
185
Petróleos Mexicanos—Directors and Executive Officers
| | | | |
Name | | Position with Petróleos Mexicanos | | Year
Appointed |
| | |
Mr. Miguel Ángel Maciel Torres | | Deputy Director of Businesses Development of Exploration and Production Born: 1960
Business experience: Coordinator of Migration of COPF-CIEP of Pemex Exploration and Production; Deputy Director of Field Development of Pemex-Exploration and Production; and Associate Managing Director of Field Development of the Lakach Project of Pemex-Exploration and Production. | | 2015 |
| | |
Mr. Armando García Espinosa | | Deputy Director of Businesses Development of Industrial Transformation Born: 1967
Business experience: Deputy Director of Management and Finance of Pemex-Refining; Associate Managing Director of Budgets of Pemex-Refining; and Associate Managing Director of Financial Procedure Liaisons of Petróleos Mexicanos. | | 2015 |
| | |
Mr. Luis Fernández Tovar | | Deputy Director of International Analysis Born: 1968 Business experience: Head of the Internal Control Unit of PMI; Local Manager of Tax Auditing of the Servicio de Administración Tributaria; and Central Manager of Tax Coordination of the Federal Entities of the Servicio de Administración Tributaria. | | 2015 |
| | |
Mr. Jorge Eduardo Kim Villatoro | | Legal Director
Born: 1979
Business experience: Legal Director of the Instituto Mexicano del Seguro Social; Head of the Legislative Tax Unit of the Ministry of Finance and Public Credit; and Director General of Protection against Administrative Acts of the Procuraduría Fiscal de la Federación. | | 2016 |
| | |
Mr. Fermín Fernández Guerra Espinal | | Deputy Legal Director of Regional Operations Born: 1976
Business experience: Deputy Legal Director of Direction of Processes and Project Contro; Executive Coordinator of the General Counsel’s Office of Petróleos Mexicanos; and Associate Managing Director of Equity Regulation of Petróleos Mexicanos. | | 2012 |
| | |
Mr. Alfonso Guati Rojo Sánchez | | Deputy Legal Director of Litigious Affairs and Portfolio Management Born: 1966 | | 2015 |
186
Petróleos Mexicanos—Directors and Executive Officers
| | | | |
Name | | Position with Petróleos Mexicanos | | Year
Appointed |
| | Business experience: Founding Partner of Guati Rojo Abogados, S.C., Professor of Universidad Iberoamericana, A.C.; and Professor of Universidad Panamericana, A.C. | | |
| | |
Ms. Silvia María Cristina Oropeza Querejeta | | Deputy Director of Legal Consultancy Born: 1953 Business experience: Legal Associate Managing Director of Amendments and Agreements of Petróleos Mexicanos; Deputy Manager of Acquisitions, Leases and Service Agreements of Petróleos Mexicanos; and Chief of the Amendments, Agreements and Joint Groups Consulting Unit of Petróleos Mexicanos. | | 2012 |
| | |
Mr. César Fernández Gómez | | Deputy Legal Director of Projects and Businesses Born: 1977 Business experience: Legal Director and Compliance Officer of Petrofac; Legal Director for Latin America and Compliance Officer of Commercial Relations in Mexico and Brazil of Moksha8 Pharmaceuticals; and Senior Associate of Barrera, Siqueiros y Torres Landa, S.C. Other board memberships: Alimentos Funcionales Nonoencaosulados S.A. de C.V. (Secretary) and Chairman of Destilados RE, S.A.P.I. de C.V. | | 2015 |
| | |
Mr. Gustavo Adolfo Aguilar Espinosa de los Monteros | | Head of the Institutional Internal Control Unit
Born: 1967 Business experience: Head of the Liabilities Area of Petróleos Mexicanos; Head of Auditing, Complaints and Liabilities of the Instituto Mexicano del Seguro Social; and Director of Notification and Tax Execution of the Ministry of Planning, Management and Finance of the Government of Jalisco. | | 2017 |
| | |
Mr. Efraín Ceballos Medina | | Executive Coordinator of the Internal Control Unit Born: 1973 Business experience: Deputy Director of Promotion and Internal Control Development of Petróleos Mexicanos; Operative Associate Managing Director of Development and Management Improvement of Petróleos Mexicanos; and Head of Auditing of Petróleos Mexicanos. | | 2015 |
| | |
Mr. Luis Bartolini Esparza | | Head of Internal Auditing Born: 1970 Business experience: Head of the Internal Control | | 2017 |
187
Petróleos Mexicanos—Directors and Executive Officers
| | | | |
Name | | Position with Petróleos Mexicanos | | Year
Appointed |
| | Unit of Nacional Financiera, S.N.C., Institución de Banca de Desarrollo; Director General of Career Services of Procuraduría General de la República; and Executive Director of Movable Assets of the Servicio de Administración y Enajenación de Bienes. | | |
| | |
Mr. Carlos Nicolás Juárez Ávila | | Deputy Director of Internal Audit Born: 1948 Business experience: Head of Internal Control Body of Pemex-Exploration and Production; Coordinator of Portfolio Audits of the Internal Control Body of the Servicio de Administración y Enajenación de Bienes of the Ministry of Finance and Public Credit; and Director of Delegations Audit of the Internal Control Body of the Attorney General Office. | | 2013 |
| | |
Mr. Juan Carlos Pérez Tejada López | | Deputy Director of Performance and Control Auditing Born: 1958 Business experience: Associate Managing Director of Liaisons with Supervising Areas of Petróleos Mexicanos; Deputy Manager of Programming and Operative Auditing of Petróleos Mexicanos; and Superintendent of Bidding and Contract Quality of Petróleos Mexicanos. | | 2015 |
| | |
Mr. Carlos Joel Hernández Rodríguez | | Deputy Director of Subsidiary Auditing, Information Technology and Legality Born: 1956 Business experience: Head of Internal Audit for the Internal Control Office ofPemex-Gas and Basic Petrochemicals; General Deputy Director of Casas de la Cultura Jurídica of the Suprema Corte de Justicia de la Nación; and Advisor to the Executive Management Secretariat of the Suprema Corte de Justicia de la Nación. | | 2015 |
| | |
Mr. Miguel Ángel Hernández Castañeda | | Delegate of Internal Auditing in Exploration and Production Born: 1967 Business experience: Head of Audit for Development and Improvement of Public Management of Petróleos Mexicanos; Head of Audit for Development and Improvement of Public Management of Pemex-Exploration and Production; and Head of the Auditing Unit (Central Zone) ofPemex-Gas and Basic Petrochemicals. | | 2015 |
188
Petróleos Mexicanos—Directors and Executive Officers
| | | | |
Name | | Position with Petróleos Mexicanos | | Year
Appointed |
| | |
Mr. Luis Alberto Ramos Padilla | | Delegate of Internal Auditing in Industrial Transformation Born: 1956
Business experience: Head of the Internal Control Body of Pemex-Refining; Area Director of the Auditoría Superior de la Federación; and Visiting General Supervisor of the CNBV. | | 2015 |
Pemex Exploration and Production—Directors and Executive Officers
| | | | |
Name | | Position with Pemex Exploration and Production | | Year
Appointed |
| | |
Mr. José Antonio González Anaya | | Chairman of the Board of Pemex Exploration and Production (refer to Petróleos Mexicanos) | | 2016 |
| | |
Ms. Rosanety Barrios Beltrán | | Board Member of Pemex Exploration and Production and Head of the Industrial Transformation Policies of the Ministry of Energy Born: 1963 Business experience: Deputy Director General of Natural Gas Transmission of the Energy Regulatory Commission; Associate Consultant of Sociedad Mexicana de Análisis Financiero; and Assistant Director of Fundamental Analysis of Casa de Bolsa Bancomer, S.A. de C.V., Grupo Financiero BBVA Bancomer. Other board memberships: CENAGAS (Alternate) and Fideicomiso de Administración y Pago CENAGAS-BANCOMEXT. | | 2015 |
| | |
Mr. Miguel Messmacher Linartas | | Board Member of Pemex Exploration and Production and Undersecretary of Income of the Ministry of Finance and Public Credit Born: 1972 Business experience: Head of the Economic Planning Unit of Public Finance of the Ministry of Finance and Public Credit; Economist of the IMF; and Economic Researcher of Banco de México. Other board memberships: CFE (Alternate); Lotería Nacional para la Asistencia Pública (Alternate); Pronósticos para la Asistencia Pública (Alternate); Servicio de Administración y Enajenación de Bienes (Alternate); Servicio de Administración Tributaria (Alternate); Comisión de Fomento de las Actividades de las Organizaciones de la Sociedad Civil; Comisión Intersecretarial para la Coordinación Operativa en los Puntos de | | 2013 |
189
Petróleos Mexicanos—Directors and Executive Officers
| | | | |
Name | | Position with Pemex Exploration and Production | | Year
Appointed |
| | Internación en Territorio Nacional (Alternate); Comisión Intersecretarial para el Desarrollo de los Bioenergéticos (Alternate); Comisión Intersecretarial de la Industria Automotriz; Comisión de Cambios; CENAGAS; Centro Nacional de Control de Energía; Mexican Petroleum Fund for Stabilization and Development (Alternate); Instituto Nacional para el Federalismo y el Desarrollo Municipal; Comisión de Comercio Exterior; Comisión Tripartita encargada de la Evaluación y Seguimiento de las Disposiciones establecidas en la Ley de Ayuda Alimentaria para los Trabajadores; Comisión Tripartita a que se refiere el artículo 15 de la Ley de Ayuda Alimentaria para los Trabajadores; Comité Interinstitucional para la Aplicación del Estímulo Fiscal a Proyectos de Inversión en la Producción Teatral Nacional; Comité Nacional de Productividad (Alternate); Comité Interinstitucional para la Aplicación del Estímulo Fiscal a Proyectos de Inversión en la Producción Cinematográfica Nacional; and Consejo Nacional de Armonización Contable (Alternate). | | |
| | |
Mr. Juan Pablo Newman Aguilar | | Board Member of Pemex Exploration and Production (refer to Petróleos Mexicanos) | | 2016 |
| | |
Mr. Carlos Rafael Murrieta Cummings | | Board Member of Pemex Exploration and Production and Director General of Pemex Industrial Transformation Born: 1965 Business experience: Independent Business Consultant of Sendero; Corporate Director of Operations of Petroleos Mexicanos and Consultant/Director of McKinsey & Co. | | 2016 |
| | |
Mr. Miguel Ángel Servín Diago | | Board Member of Pemex Exploration and Production (refer to Petróleos Mexicanos) | | 2016 |
| | |
Mr. J. Javier Hinojosa Puebla | | Board Member of Pemex Exploration and Production Born: 1958 Business experience: Executive Director of Pemex Exploration and Production; Director of Development and Production of Pemex Exploration and Production; and Chief of Staff of the Director General of Pemex-Exploration and Production. | | 2015 |
190
Pemex Industrial Transformation—Directors and Executive Officers
| | | | |
Name | | Position with Pemex Industrial Transformation | | Year
Appointed |
| Mr. José Antonio González Anaya | | Chairman of the Board of Pemex Industrial Transformation (refer to Petróleos Mexicanos) | | 2016 |
| | |
| Mr. Carlos Alberto Treviño Medina | | Board Member of Pemex Industrial Transformation (refer to Petróleos Mexicanos) | | 2016 |
| | |
| Mr. Claudio César de la Cerda Negrete | | Board Member of Pemex Industrial Transformation and Director General of Hydrocarbons Exploration and Extraction of the Ministry of Energy Born: 1974 Business experience: Director of Operations of Jaguar Exploración y Producción de Hidrocarburos, S.A.P.I. de C.V.; Director of Technology of Dowell Schlumberger de México, S.A. de C.V.; and Director of Geoscience of Dowell Schlumberger de México, S.A. de C.V. | | 2017 |
| | |
| Mr. Miguel Messmacher Linartas | | Board Member of Pemex Industrial Transformation (refer to Pemex Exploration and Production) | | 2015 |
| | |
| Mr. Juan Pablo Newman Aguilar | | Board Member of Pemex Industrial Transformation (refer to Petróleos Mexicanos) | | 2016 |
| | |
| Mr. J. Javier Hinojosa Puebla | | Board Member of Pemex Industrial Transformation (refer to Pemex Exploration and Production) | | 2015 |
| | |
| Mr. Carlos Rafael Murrieta Cummings | | Board Member of Pemex Industrial Transformation and Director General of Pemex Industrial Transformation (refer to Pemex Exploration and Production) | | 2016 |
191
Pemex Cogeneration and Services—Directors and Executive Officers
| | | | |
Name | | Position with Cogeneration and Services | | Year
Appointed |
| Mr. José Antonio González Anaya | | Chairman of the Board of Pemex Cogeneration and Services (refer to Petróleos Mexicanos) | | 2016 |
| | |
| Mr. Rodulfo Figueroa Alonso | | Board Member of Pemex Cogeneration and Services (refer to Petróleos Mexicanos) | | 2015 |
| | |
| Mr. Leonardo Cornejo Serrano | | Board Member of Pemex Cogeneration and Services and Director of Industrial Projects of Pemex Industrial Transformation Born: 1969 Business experience: Director of Projects of Pemex Industrial Transformation; Deputy Director of Projects of Pemex-Refining; and Coordinator of Modernization and Capacity Expansion Projects of Pemex-Refining. | | 2016 |
| | |
| Mr. Juan Pablo Newman Aguilar | | Board Member of Pemex Cogeneration and Services (refer to Petróleos Mexicanos) | | 2016 |
| | |
| Mr. Gustavo Adolfo Aguilar Espinosa de los Monteros | | Board Member of Pemex Cogeneration and Services (refer to Pemex Exploration and Production) | | 2015 |
| | |
| Mr. Gustavo Adolfo Aguilar Espinosa de los Monteros | | Board Member of Pemex Cogeneration and Services (refer to Petróleos Mexicanos) | | 2017 |
| | |
| Ms. Raquel Buenrostro Sánchez . | | Acting Director General of Pemex Cogeneration and Services and Associate Managing Director of Planning of Pemex Cogeneration and Services Born: 1970 Business experience: Associate Managing Director of Planning of Grupo Adya Select, S. de R.L. de C.V.; Advisor to the Director of Management and Finance of PMI; and Advisor to the General Services Coordinator of the Ministry of the Interior. | | 2017 |
192
Pemex Drilling and Services—Directors and Executive Officers
| | | | |
Name | | Position with Pemex Drilling and Services | | Year
Appointed |
| Mr. José Antonio González Anaya | | Chairman of the Board of Pemex Drilling and Services (refer to Petróleos Mexicanos) | | 2016 |
| | |
| Mr. Rodulfo Figueroa Alonso | | Board Member of Pemex Drilling and Services (refer to Petróleos Mexicanos) | | 2016 |
| | |
| Mr. Carlos Alberto Treviño Medina | | Board Member of Pemex Drilling and Services (refer to Petróleos Mexicanos) | | 2016 |
| | |
| Mr. Rodrigo Becerra Mizuno | | Board Member of Pemex Drilling and Services (refer to Petróleos Mexicanos) | | 2016 |
| | |
| Mr. J. Javier Hinojosa Puebla | | Board Member of Pemex Drilling and Services (refer to Pemex Exploration and Production) | | 2015 |
| | |
| Mr. Miguel Ángel Maciel Torres | | Board Member of Pemex Drilling and Services (refer to Petróleos Mexicanos) | | 2015 |
| | |
| Mr. Miguel Ángel Lugo Valdez | | Board Member of Pemex Drilling and Services and Coordinator of Procurement and Supply for Exploration and Production of Petróleos Mexicanos Born: 1967 Business experience: Acting Deputy Director of Strategy Management and Business Model Support of Petróleos Mexicanos; Acting Associate Managing Director of Contract Planning, Evaluation and Consolidation of Petróleos Mexicanos; Acting Associate Managing Director of Exploration and Production Contracts of Petróleos Mexicanos. | | 2016 |
| | |
| Mr. Pedro Virgilio Sánchez Soto | | Acting Director General of Pemex Drilling and Services and Deputy Director of Well Engineering and Business Development of Pemex Drilling and Services Born: 1960 Business experience: Associate Managing Director of Integration and Technical Coordination of Pemex-Exploration and Production; Associate Managing Director of Programming and Evaluation (Southwestern Marine Region) of Pemex-Exploration and Production; and Manager of the Litoral de Tabasco Business Unit of Pemex-Exploration and Production. | | 2017 |
193
Pemex Logistics—Directors and Executive Officers
| | | | |
Name | | Position with Pemex Logistics | | Year
Appointed |
| Mr. José Antonio González Anaya | | Chairman of the Board of Pemex Logistics (refer to Petróleos Mexicanos) | | 2016 |
| | |
| Mr. Carlos Alberto Treviño Medina | | Board Member of Pemex Logistics (refer to Petróleos Mexicanos) | | 2016 |
| | |
| Mr. Rodrigo Becerra Mizuno | | Board Member of Pemex Logistics (refer to Petróleos Mexicanos) | | 2016 |
| | |
| Ms. Guadalupe Merino Bañuelos | | Board Member of Pemex Logistics (refer to Petróleos Mexicanos) | | 2016 |
| | |
| Mr. Luis Ignacio Rayón Llerandi | | Board Member of Pemex Logistics (refer to Petróleos Mexicanos) | | 2016 |
| | |
| Mr. José Luis Antonio Gómez Góngora | | Board Member of Pemex Logistics and Coordinator of Procurement and Supply for Industrial Transformation of Petroleos Mexicanos Born: 1957 Business experience: Deputy Director of Procurement and Supply for Industrial Transformation of Petróleos Mexicanos; Associate Managing Director of Contracts for Gas and Basic Petrochemicals of Petróleos Mexicanos; and Associate Managing Director of Material Resources ofPemex-Gas and Basic Petrochemicals | | 2015 |
| | |
| Mr. David Ruelas Rodriguez | | Board Member of Pemex Logistics (refer to Petróleos Mexicanos) | | 2016 |
| | |
| Mr. José Ignacio Aguilar Álvarez Greaves | | Director General Born: 1970 Business experience: Vice President of Administration of Petróleos Ebano; Deputy Director of Hartree Consultores, S. de R.L. de C.V.; and Deputy Director of Hydrocarbons and Derivatives Logistics of Petróleos Mexicanos. | | 2017 |
194
Pemex Fertilizers—Directors and Executive Officers
| | | | |
Name | | Position with Pemex Fertilizers | | Year
Appointed |
| Mr. José Antonio González Anaya | | Chairman of the Board of Pemex Fertilizers (refer to Petróleos Mexicanos) | | 2016 |
| | |
| Mr. Luis Rodolfo Capitanachi Dagdug | | Board Member of Pemex Fertilizers, Associate Managing Director of Industrial Process Financials and Logistics and Associate Managing Director of Finance, Industrial Processes and Logistics of Petróóleos Mexicanos Born: 1971 Business experience: Associate Managing Director of Accounting for Productive State-Owned Subsidiaries and Other Businesses of Petróóleos Mexicanos; Acting Deputy Director of Management and Finance of Pemex-Petrochemicals; and Associate Managing Director of Financial Resources of Pemex-Petrochemicals. | | 2015 |
| | |
| Ms. Alma Rosa Moreno Razo | | Board Member of Pemex Fertilizers (refer to Petróleos Mexicanos) | | 2015 |
| | |
| Mr. Carlos Alberto Treviño Medina | | Board Member of Pemex Fertilizers (refer to Petróleos Mexicanos) | | 2016 |
| | |
| Mr. José Ignacio Aguilar Álvarez Greaves | | Board Member of Pemex Fertilizers (refer to Pemex Logistics) | | 2017 |
| | |
| Mr. Jorge Collard de la Rocha | | Board Member of Pemex Fertilizers (refer to Petróleos Mexicanos) | | 2015 |
| | |
| Mr. Juan Alfredo Lozano Tovar | | Director General of Pemex Fertilizers Born: 1968 Business experience: Director of Economic and Social Benefits of the Instituto Mexicano del Seguro Social; General Secretary of the Conferencia Interamericana de Seguridad Social; and Head of the Liaisons of the Instituto Mexicano del Seguro Social. | | 2016 |
195
Pemex Ethylene—Directors and Executive Officers
| | | | |
Name | | Position with Pemex Ethylene | | Year
Appointed |
| Mr. José Antonio González Anaya | | Chairman of the Board of Pemex Ethylene (refer to Petróleos Mexicanos) | | 2016 |
| | |
| Mr. Luis Ignacio Rayón Llerandi | | Board Member of Pemex Ethylene (refer to Petróleos Mexicanos) | | 2016 |
| | |
| Mr. Jorge Valadez Montoya | | Board Member of Pemex Ethylene and Associate Managing Director of Alliances and New Businesses for Conventional Resources of Petróleos Mexicanos Born: 1973 Business experience: Deputy Director of Project Analysis of PMI; Project Leader of Petróleos Mexicanos; and Director of Planning and Management of Gasoductos de Chihuahua, S. de. R.L. de C.V. Other board memberships: Mex Gas Enterprises, S.L.; and MGI Asistencia Integral, S. de R.L. de C.V. | | 2015 |
| | |
| Mr. Jorge Collard de la Rocha | | Board Member of Pemex Ethylene (refer to Petróleos Mexicanos) | | 2015 |
| | |
| Mr. José Luis Antonio Gómez Góngora | | Board Member of Pemex Ethylene (refer to Pemex Logistics) | | 2015 |
| | |
| Mr. Juan Lozano Tovar | | Board Member of Pemex Ethylene (refer to Pemex Fertilizers) | | 2016 |
| | |
| Mr. Jose Manuel Alvarado Doria | | Board Member of Pemex Ethylene and Deputy Director of Pemex Industrial Information Born: 1957 Business experience: Deputy Director of Production of Pemex-Gas and Basic Petrochemicals; Acting Associate Managing Director of Evaluation and Improvement ofPemex-Gas and Basic Petrochemicals; and Associate Managing Director of Operative Control, Optimization and Safety ofPemex-Gas and Basic Petrochemicals. Other board memberships: MGC México, S.A. de C.V.; Mex Gas Trading, S.L.; Mex Gas Enterprises, S.L. and Mex Gas Supply, S.L. | | 2016 |
| | |
| Mr. Luis Rafael Montanaro Sánchez | | Director General Born: 1969 Business experience: Deputy Director of Planning of Pemex Petrochemicals, | | 2016 |
196
| | | | |
Name | | Position with Pemex Ethylene | | Year
Appointed |
| | Associate Managing Director of Morelos PC of Pemex-Petrochemicals; and Associate Managing Director of Strategic Planning and Business Development of Pemex-Petrochemicals. Other board memberships: Petroquímica Mexicana de Vinilo, S.A. de C.V.; PMV Minera, S.A. de C.V.; and PMV Servicios Administrativas, S.A. de C.V. | | |
Compensation of Directors and Officers
For the year ended December 31, 2016, the aggregate compensation of executive officers of Petróleos Mexicanos and the existing subsidiary entities (49 people) paid or accrued in that year for services in all capacities was approximately Ps. 111.5 million. Except in the case of the independent members, with respect to the previous Board of Directors of Petróleos Mexicanos and the boards of directors of the existing subsidiary entities, and the independent members, with respect to the new Board of Directors of Petróleos Mexicanos, the members of our boards of directors do not receive compensation for their services. The compensation paid or accrued during 2016 to the professional members of the previous Board of Directors of Petróleos Mexicanos and boards of directors of the existing subsidiary entities was approximately Ps. 7.7 million. See “Item 7—Major Shareholders and Related Party Transactions—Related Party Transactions” for information about the salary advances that we offer to our executive officers as an employee benefit.
Board Practices
Except in the case of the independent members with respect to the Board of Directors of Petróleos Mexicanos, neither the members of the boards of directors nor the executive officers of Petróleos Mexicanos or the productive state-owned subsidiaries are appointed for a specific term. The length of the terms of the Secretary of Energy and the Secretary of Finance and Public Credit is, however, limited by the length of their respective positions in the Mexican Government. Except in the case of the independent members first appointed under the Petróleos Mexicanos Law, the five independent members of the Board of Directors of Petróleos Mexicanos will be appointed for five-year terms, and may be appointed for an additional term of the same length.
The Mexican Government representatives that serve as members of the boards of directors of Petróleos Mexicanos and each of the existing subsidiary entities may be removed at the discretion of the President of Mexico. The independent members of the Board of Directors of Petróleos Mexicanos may be removed for cause, including failure to carry out the duties and obligations set forth in the Petróleos Mexicanos Law, by the President of Mexico upon Senate approval.
On October 14, 2014, the Board of Directors of Petróleos Mexicanos appointed members to and convened the four committees established by the new Petróleos Mexicanos Law to support its work. Unless otherwise specified in the new Petróleos Mexicanos Law, the memberships of these committees must consist of at least three, but no more than five, members of the Board of Directors of Petróleos Mexicanos. Each of these committees must include two independent members of the Board of Directors of Petróleos Mexicanos, with the exception of the Audit Committee, which must include three independent members. Each of the Secretary of Energy, the Secretary of Finance and Public Credit and any ministry-level secretary serving as a member of the Board of Directors of Petróleos Mexicanos may designate one or more alternates to take his or her place at committee meetings, provided that these alternates are public officials whose positions are not more than two levels below such secretary’s position in the Mexican Government.
197
The committees may authorize a representative of the Director General to attend their meetings as a guest with the right to participate, but not vote, when deemed advisable for the performance of their duties.
Audit Committee
The Audit Committee of the Board of Directors of Petróleos Mexicanos is required to, among other duties, oversee our management, evaluate our financial and operational performance, monitor the status of our internal control systems, as well as nominate our external auditors, whose appointments are approved by the Board of Directors of Petróleos Mexicanos. See “Item 16C—Principal Accountant Fees and Services.”
Each of the three members of the Audit Committee is “independent” of Petróleos Mexicanos within the meaning of Rule10A-3 under the Securities Exchange Act of 1934, as amended (the Exchange Act). In accordance with the Petróleos Mexicanos Law, the Audit Committee consists of three independent members of the Board of Directors of Petróleos Mexicanos, each of whom will serve as the chair of the committee on a rotating, annual basis, as determined by the Board of Directors of Petróleos Mexicanos.
The Audit Committee consists of the following members:
| | • | | Mr. Jorge José Borja Navarrete, independent member of the Board of Directors of Petróleos Mexicanos and Chairperson of the Audit Committee; |
| | • | | Mr. Octavio Francisco Pastrana Pastrana, independent member of the Board of Directors of Petróleos Mexicanos; and |
| | • | | Mr. Felipe Duarte Olvera, independent member of the Board of Directors of Petróleos Mexicanos. |
A representative of the Director General, the Head of the Internal Auditing Area, the Legal Director or any other person may attend the Audit Committee’s meetings as a guest with the right to participate, but not vote, when deemed advisable and appropriate given the subject matter to be discussed.
Human Resources and Compensation Committee
The Human Resources and Compensation Committee is chaired by an independent member of the Board of Directors of Petróleos Mexicanos and includes the Secretary of Finance and Public Credit as a permanent member. The duties of the Human Resources and Compensation Committee include, among others, proposing the compensation of the Director General and other members of senior management of Petróleos Mexicanos within three levels of the Director General, as well as proposing hiring policies, performance management guidelines and the compensation of all other employees of Petróleos Mexicanos.
The Human Resources and Compensation Committee of Petróleos Mexicanos consists of the following members:
| | • | | Mr. Carlos Elizondo Mayer-Serra, independent member of the Board of Directors of Petróleos Mexicanos and Chairperson of the Human Resources and Compensation Committee; |
| | • | | Mr. Octavio Francisco Pastrana Pastrana, independent member of the Board of Directors of Petróleos Mexicanos; |
| | • | | Mr. José Antonio Meade Kuribreña, member of the Board of Directors of Petróleos Mexicanos; |
| | • | | Mr. Ildefonso Guajardo Villarreal, member of the Board of Directors of Petróleos Mexicanos; and |
| | • | | Mr. Rafael Pacchiano Alamán, member of the Board of Directors of Petróleos Mexicanos. |
Strategy and Investment Committee
The Strategy and Investment Committee is chaired by an independent member of the Board of Directors of Petróleos Mexicanos on a rotating annual basis and is required to, among other duties, analyze our business plan
198
and assist the Board of Directors of Petróleos Mexicanos in the approval of guidelines, priorities and general policies related to investments made by Petróleos Mexicanos.
The Strategy and Investment Committee of Petróleos Mexicanos consists of the following members:
| | • | | Mr. Octavio Francisco Pastrana Pastrana, independent member of the Board of Directors of Petróleos Mexicanos and Chairperson of the Strategy and Investment Committee; |
| | • | | Mr. Carlos Elizondo Mayer-Serra, independent member of the Board of Directors of Petróleos Mexicanos; |
| | • | | Mr. Pedro Joaquín Coldwell, member of the Board of Directors of Petróleos Mexicanos; |
| | • | | Mr. José Antonio Meade Kuribreña, member of the Board of Directors of Petróleos Mexicanos; and |
| | • | | Mr. Ildefonso Guajardo Villarreal, member of the Board of Directors of Petróleos Mexicanos. |
Acquisitions, Leasing, Public Works and Services Committee
The Acquisitions, Leasing, Public Works and Services Committee is chaired by an independent member of the Board of Directors of Petróleos Mexicanos on a rotating annual basis and, among other duties, reviews, evaluates, monitors and develops recommendations regarding the annual programs of Petróleos Mexicanos for acquisition, construction and services contracts, and determines whether an exception to the public bidding process is applicable in specific cases.
The Acquisitions, Leasing, Public Works and Services Committee of Petróleos Mexicanos consists of the following members:
| | • | | Mr. Felipe Duarte Olvera, independent member of the Board of Directors of Petróleos Mexicanos and Chairperson of the Acquisitions, Leasing, Public Works and Services Committee; |
| | • | | Mr. Jorge José Borja Navarrete, independent member of the Board of Directors of Petróleos Mexicanos; |
| | • | | Mr. Pedro Joaquín Coldwell, member of the Board of Directors of Petróleos Mexicanos; |
| | • | | Mr. José Antonio Meade Kuribreña, member of the Board of Directors of Petróleos Mexicanos; and |
| | • | | Mr. Rafael Pacchiano Alamán, member of the Board of Directors of Petróleos Mexicanos. |
Employees
Excluding employees employed by us on a temporary basis, at December 31, 2016, Petróleos Mexicanos, its subsidiary entities and subsidiary companies had 130,333 employees, as compared to 139,183 at December 31, 2015. During 2016, Petróleos Mexicanos and the productive state-owned subsidiaries employed an average of 9,289 temporary employees.
The following table sets forth our employee numbers for the five years ended December 31, 2016:
| | | | | | | | | | | | |
Year | | Petróleos Mexicanos and
Subsidiary Entities | | | Subsidiary
Companies | | | Total | |
2012 | | | 150,697 | | | | 416 | | | | 151,113 | |
2013 | | | 154,474 | | | | 764 | | | | 155,538 | |
2014 | | | 153,085 | | | | 804 | | | | 153,889 | |
2015 | | | 138,397 | | | | 786 | | | | 139,183 | |
2016 | | | 126,940 | | | | 3,393 | | | | 130,333 | |
Source: Petróleos Mexicanos and the subsidiary companies.
199
As of December 31, 2016, the Petroleum Workers’ Union represented approximately 79% of the work force of Petróleos Mexicanos and the productive state-owned subsidiaries. The members of the Petroleum Workers’ Union are PEMEX employees and they elect their own leadership from among their ranks. Our relationship with our employees is regulated by theLey Federal de Trabajo(which we refer to as the Federal Labor Law), a collective bargaining agreement between Petróleos Mexicanos and the Petroleum Workers’ Union and the Employment Regulation for White Collar Employees of PEMEX and Subsidiary Entities. The collective bargaining agreement is subject to renegotiation every two years, although salaries are reviewed annually. Since the Petroleum Workers’ Union’s was officially established in 1938, we have not experienced labor strikes; we have experienced work stoppages for short periods of time, but none of these stoppages had a material adverse effect on our operations.
On September 10, 2015, Petróleos Mexicanos and the Petroleum Workers’ Union executed a new collective bargaining agreement that will regulate their labor relations until July 31, 2017. The new collective bargaining agreement provided for a 3.99% increase in wages and a 1.75% increase in benefits. On July 20, 2016, Petróleos Mexicanos and the Petroleum Workers’ Union revised their collective bargaining agreement, which revision became effective on August 1, 2016. The revised agreement provides for a 3.17% increase in wages.
On November 11, 2015, Petróleos Mexicanos announced that it had signed an agreement with the Petroleum Workers’ Union to modify the pension regime applicable to current and new employees. Pursuant to the agreement, the retirement age for employees with less than 15 years of service has been increased from 55 to 60. Employees are still required to serve for at least 30 years in order to be eligible to receive full retirement benefits. In addition, new employees will receive individual defined contributions retirement plans, which will benefit from direct contributions from Petróleos Mexicanos, portability and tax benefits applicable to retirement savings. Current employees will also be permitted to opt into the new defined contributions retirement plans.
On December 18, 2015, the Director General of Petróleos Mexicanos informed the Ministry of Finance and Public Credit that our pension liabilities were expected to decrease by Ps. 186.5 billion as a result of the modifications to our pension regime described above. As of December 31, 2015, our pension liabilities had decreased by Ps. 196.0 billion.
On December 24, 2015, the Ministry of Finance and Public Credit published in the Official Gazette of the Federation theDisposiciones de carácter general relativas a la asunción por parte del Gobierno Federal de obligaciones de pago de pensiones y jubilaciones a cargo de Petróleos Mexicanos y sus empresas productivas subsidiarias (General provisions regarding the assumption by the Mexican Government of the payment obligations related to pensions and retirement plans of Petróleos Mexicanos and its productive state-owned subsidiaries). On August 3, 2016, the Ministry of Finance and Public Credit informed us that the Mexican Government would assume Ps. 184.2 billion in payment liabilities related to our pensions and retirement plans, and accordingly replaced the Ps. 50 billion promissory note issued to us on December 24, 2015 with Ps. 184.2 billion in promissory notes.
In accordance with the Federal Labor Law and collective bargaining agreement in effect as of December 31, 2015, Petróleos Mexicanos and the productive state-owned subsidiaries are under an obligation to pay seniority premiums to retiring employees and pensions to retired employees, as well as death benefits and pensions to certain survivors of retired employees. Retirees are entitled to receive increases in their pensions, of at least the increase in NCPI, whenever salary increases are granted to current employees. We also provide health and medical benefits to employees, retired employees and their beneficiaries and, subject to our overall budgetary constraints, we provide an interest-rate subsidy on employees’ mortgage loans.
On November 5, 1997, the Ministry of Finance and Public Credit and the Board of Directors of Petróleos Mexicanos authorized the formation of a trust called the Pemex Labor Fund. This fund is a vehicle to fund labor liabilities, current pension payments and seniority premiums. We have designed a contribution plan to increase the funds held in this trust and to continue to make payments on outstanding labor and pension liabilities. Our
200
contributions to the plan assets for our retirement benefits totaled Ps. 49,190 million in 2015 and Ps. 55,693 million in 2016. As of December 31, 2015 and 2016, the balance of the Pemex Labor Fund was Ps. 5,229 million and Ps. 9,490 million, respectively.
| Item 7. | Major Shareholders and Related Party Transactions |
Major Shareholders
Petróleos Mexicanos and the subsidiary entities have no shareholders because they are public entities of the Mexican Government. The Mexican Government controls us and incorporates the consolidated annual budget and financing program of Petróleos Mexicanos and the subsidiary entities into its budget, which must be approved by the Chamber of Deputies each year. Any adjustment proposed by the Board of Directors of Petróleos Mexicanos to change our annual financial balance goal or increase the limit on our wage and salary expenditures budget or our financing program must be approved by the Chamber of Deputies. See “Item 4—Information on the Company—General Regulatory Framework” for more information about the Mexican Government’s authority with respect to our budget. Our operations in the oil and gas sector are also regulated by the Mexican Government and its ministries.
Mexican Government officials hold five of the ten seats on the Board of Directors of Petróleos Mexicanos, and the Secretary of Energy is the Chairperson of the Board of Directors of Petróleos Mexicanos with the power to cast atie-breaking vote. An additional five seats on the Board of Directors are held by independent members appointed by the President of Mexico and ratified by the Senate. The Director General of Petróleos Mexicanos is a member of the President of Mexico’s cabinet. See also “Item 3—Key Information—Risk Factors—Risk Factors Related to our Relationship with the Mexican Government.”
Related Party Transactions
Article 8, Section XI of theLey Federal de Responsabilidades Administrativas de los Servidores Públicos (Federal Law of Administrative Responsibilities of Public Officials), requires all public officials to “recuse themselves from intervening in any way in the attention to, processing or resolution of matters in which they might have personal, family or business interest, including those where some benefit can result for themselves, their spouse, blood or affinity relatives up to the fourth degree, or civil relatives, or for third parties with which they have professional, labor or business relations, or for partners or partnerships where the public officials or the persons referred above are or have been members thereof.”
The Board of Directors of Petróleos Mexicanos, including the independent members who are not public officials, are subject to the duties of loyalty and diligence. In accordance with the Petróleos Mexicanos Law, an independent member of the Board of Directors of Petróleos Mexicanos may be removed from his or her position for, among other causes: (1) utilizing for personal benefit or for the benefit of any third party the information made available to him or her in connection with the exercise of his or her duties as a board member; (2) disclosing such information in violation of applicable law; or (3) not recusing him or herself from discussion of and voting on matters in respect of which he or she has a conflict of interest. A member of the Board of Directors of Petróleos Mexicanos or of the board of directors of an existing subsidiary entity who acts in contravention of the Petróleos Mexicanos Law may be held liable for any damages that he or she caused to Petróleos Mexicanos or an existing subsidiary entity.
As an employee benefit, we offer salary advances to all of our eligible Petroleum Workers’ Union andnon-union workers, including our executive officers, pursuant to the programs set forth in the collective bargaining agreement and in the Employment Regulation of White Collar Employees of Petróleos Mexicanos and Subsidiary Entities, respectively. The salary advances, which arenon-interest bearing, are offered to each eligible employee in an amount up to a maximum of four months’ salary and are repaid through salary deductions in equal installments over a period of either one or two years, as elected by the employee. Most of our
201
employees take advantage of this benefit. The largest amount of salary advances outstanding to executive officers at any one time during 2016 was Ps. 8.9 million. As of April 15, 2017, the aggregate amount of salary advances outstanding to our executive officers was Ps. 8.1 million.
Prior to his appointment as Secretary of Energy, Mr. Pedro Joaquín Coldwell, Chairman of the Board of Directors of Petróleos Mexicanos since December 2012, as well as certain members of his family, held ownership interests in companies that have entered into agreements with Pemex-Refining, now held by Pemex Industrial Transformation, for the sale and purchase of gasoline and other products by certain retail service stations and a wholesale distributor, as well as the performance of other related activities. As of the date of this report, their ownership interests are as follows:
| | | | |
Company | | Name | | Ownership
Share |
Servicio Cozumel, S.A. de C.V. (which operates a retail service station) | | Mr. Pedro Joaquín Coldwell Mr. Pedro Oscar Joaquín Delbouis (son of Mr. Joaquín Coldwell) Mr. Nassim Joaquín Delbouis (son of Mr. Joaquín Coldwell) | | 60%
20% 20% |
| | |
Planta de Combustible Cozumel, S.A. de C.V. (which operates as a wholesale distributor) | | Testamentary Trust(1) Mr. Pedro Joaquín Coldwell | | 57%
40% |
| | |
Gasolinera y Servicios Juárez, S.A. de C.V. (which operates a retail service station) | | Mr. Pedro Joaquín Coldwell Mr. Ignacio Nassim Ruiz Joaquín (nephew of Mr. Joaquín Coldwell) Testamentary Trust(2) | | 40%
20% 40% |
| | |
Combustibles Caleta, S.A. de C.V. (which operates a retail service station) | | Mr. Pedro Joaquín Coldwell Mr. Pedro Oscar Joaquín Delbouis Mr. Nassim Joaquín Delbouis Mr. Ignacio Nassim Ruiz Joaquín Testamentary Trust(3) | | 20%
20% 20% 20% 20% |
| | |
Combustibles San Miguel, S.A. de C.V. (which operates a retail service station) | | Mr. Pedro Joaquín Coldwell Mr. Pedro Oscar Joaquín Delbouis Mr. Nassim Joaquín Delbouis Mr. Ignacio Nassim Ruiz Joaquín | | 25%
25% 25% 25% |
| (1) | 60% of these shares were owned by Fausto Nassim Joaquín Ibarra (father of Pedro Joaquín Coldwell), until his death in June of 2016, after which 57% of these shares became property of an investment, management and testamentary revocable trust, which we refer to as the Testamentary Trust. 50% of the voting rights of these shares are currently exercised by Mr. Pedro Oscar Joaquín Delbouis, and 50% are exercised by Mr. Nassim Joaquín Delbouis. |
| (2) | 40% of these shares were owned by Fausto Nassim Joaquín Ibarra until his death in June of 2016, after which these shares became property of the Testamentary Trust. 100% of the voting rights of these shares are currently exercised by Mr. Pedro Joaquín Coldwell. |
| (3) | 20% of these shares were owned by Fausto Nassim Joaquín Ibarra until his death in June of 2016, after which these shares became property of the Testamentary Trust. 50% of the voting rights of these shares are currently exercised by Mr. Pedro Oscar Joaquín Delbouis, and 50% are exercised by Mr. Nassim Joaquín Delbouis. |
The rights of these companies to operate retail service stations and distribute gasoline and other products on a wholesale basis in Mexico are dependent on these agreements, the expiration ornon-renewal of which may adversely affect their business. These agreements are based on our standard forms of agreements and contain the standard terms and conditions applicable to all of Pemex Industrial Transformation retail service stations and wholesale distributors.
202
| Item 8. | Financial Information |
Legal Proceedings
Labor-Related Proceedings
We are a party to various legal actions involving labor claims of former and present employees. These labor disputes relate to severance payments, life insurance benefits, extensions of labor contracts, level of wages, improper termination and employee housing. We do not expect these lawsuits to have a material adverse effect on our financial condition or future results of operations.
For information on our negotiations with the Petroleum Workers’ Union and collective bargaining agreements, see “Item 6—Directors, Senior Management and Employees—Employees.”
Ethics Committee and Liabilities Unit
Certain rules have been enacted in order to promote a culture of ethics and prevent corruption in our daily operations. On November 26, 2016, the Board of Directors of Petróleos Mexicanos issued theCódigo de Ética para Petróleos Mexicanos, sus empresas productivas subsidiarias y empresas filiales (Code of Ethics for Petróleos Mexicanos, its productive subsidiary entities and affiliates, or the Code of Ethics), which applies to the members of the boards of directors of Petróleos Mexicanos and each of the subsidiary entities and all of our employees, including the Director General (chief executive officer) of Petróleos Mexicanos, the Chief Financial Officer of Petróleos Mexicanos, the chief accounting officer of Petróleos Mexicanos and all other employees performing similar functions. This new code of ethics replaced the code of ethics that had been in place since 2014. On December 7, 2016, our Ethics Committee was formed to monitor the implementation and enforcement of the Code of Ethics. See “Item 4—Information on the Company—Business Overview—PEMEX Corporate Matters—Ethics Committee” for more information. See “Item 16B—Code of Ethics” for more information.
In addition, on December 9, 2016, the Ethic Committee reviewed the newCódigo de Conducta de Petróleos Mexicanos, sus empresas productivas subsidiarias y, en su caso, empresas filiales(Code of Conduct of Petróleos Mexicanos, its productive subsidiary entities and, where applicable, affiliated companies, or the Code of Conduct), which is scheduled to be approved and issued in 2017, replacing the code issued in 2015. This Code of Conduct delineates the code of conduct expected from all of our employees in the daily performance of their duties and is designed to promote transparency and prevent abuses.
On February 4, 2016, we launched an ethics and corporate integrity program, which incorporates high industry standards and practices related to ethics, integrity, conduct, anti-corruption strategies and institutional values. Several measures have been taken to ensure the successful implementation of the program, including the distribution of our Code of Ethics and Code of Conduct among personnel, the administration of trainings on risk management, internal control and integrity and the development of mechanisms to identify and combat corrupt practices. Additionally, we are developing tools to assess compliance with our internal ethics and integrity guidelines, and intend to launch an ethics support line and an anti-corruption webpage in the first half of 2017 to inform our partners, contractors and others about the policies and procedures to be applied to our business dealings.
Our Liabilities Unit, which is part of the SFP, is responsible for investigating violations of the Federal Law of Administrative Responsibilities of Public Officials, as well as imposing administrative penalties in accordance with the law.
Mexican Government Audits and Other Investigations
In March and April 2010, the SFP filed seven criminal complaints against officers and employees ofPemex-Refining, in connection with a pipeline rupture in Nanchital, Veracruz. The SFP imposed administrative penalties against these officers and employees, as well as against contractors. As of the date of this report, 28 appeals have been filed by these public sector employees, 27 of which have concluded with the following results: 16 penalties were confirmed, nine penalties were declared null and void and new resolutions were ordered with respect to two penalties, imposing new sanctions that are now final. As of the date of this report, a final resolution of the final outstanding appeal against the administrative penalties is still pending.
203
In May 2010, the SFP filed two criminal complaints and initiated two administrative proceedings against María Karen Miyazaki Hara, who served as PMI’s Deputy Director of Trading of Intermediate Distillates, for allegedly committing acts of corruption pursuant to which PMI lost revenues of approximately U.S. $13 million. The alleged acts involved the unauthorized sale of ULSD for the economic benefit of foreign companies, including Blue Oil Trading Ltd. During November 2010, the first administrative proceedings concluded, resulting in Ms. Miyazaki Hara being fined Ps. 164.2 million and banned from holding public sector positions for 20 years. Ms. Miyazaki Hara filed a motion before theSéptima Sala Regional Metropolitana(Seventh Regional Metropolitan Court) of the Federal Court of Fiscal and Administrative Justice seeking that this resolution be declared null and void. On July 2, 2015, theSegunda Sección de la Sala Superior(Second Section of the Superior Court) of the Tax and Administrative Federal Court declared the resolution null and void. The SFP filed a motion to review this judgment, which was granted on February 27, 2017 (file No.77/2017-II). As of the date of this report, a final resolution is still pending. In addition, on June 25, 2013, the second administrative proceeding concluded, and the SFP fined Ms. Miyazaki Hara for Ps. 59.3 million and banned her from holding public sector positions for 20 years. On September 23, 2013, Ms. Miyazaki Hara filed a motion against this resolution before theOctava Sala Regional Metropolitana (Eighth Regional Metropolitan Court) of the Federal Court of Fiscal and Administrative Justice seeking that this additional resolution also be declared null and void, which was granted on February 20, 2017 (file No.66/2017-V). As of the date of this report, a final resolution is still pending the Superior Court’s resolution.
In December 2010, the SFP fined 15 public sector employees for irregularities in a bidding process related to the leasing of four vessels. These employees were barred from holding public sector positions for ten years and several monetary penalties were ordered. The public sector employees filed motions against these penalties. As of the date of this report, 13 of the motions were confirmed. The resolutions in ten motions were declared null and void, in four motions were declared valid and one motion is still pending. Mr. Zermeño Díaz filed anamparo against the judgment declaring the resolution valid before theDécimo Tercer Tribunal Colegiado en Materia Administrativa del Primer Circuito (Thirteenth Joint Administrative Court of the First Circuit), which, as of the date of this report, is still pending resolution.
On October 11, 2011, the SFP announced that it had fined three former officers of PMI an aggregate amount of Ps. 267.8 million, for allegedly improper contracting practices in the purchase and/or sale of petroleum products, which allegedly benefited certain of PMI’s commercial counterparties. The implicated former officers of PMI were also barred from public sector employment for a period of ten years. These former officers appealed the penalties. Two motions were granted and the resolutions declared null and void. On February 8, 2017, a judgment was issued by theSala Superior (Higher Court) of theTribunal Federal de Justicia Administrativa (Federal Court of Administrative Justice) declaring the third resolution null and void. On April 3, 2017, the SFP filed a motion to review this resolution and the former officer filed anamparo (file No. 198/2017) before theQuinto Tribunal Colegiado en Materia Administrativa del Primer Circuito (Fifth Joint Administrative Court of the First Circuit). As of the date of this report, a final resolution is still pending.
In July 2011, a criminal complaint was filed against Mario Blenda Ahumada, former Deputy Director of Trade and Refined Products of PMI, after a Ps. 11.0 million increase in his personal assets was detected. The Federal Attorney General’s Office concluded its investigation without filing a criminal complaint. The SFP filed a motion against this resolution, which was granted. As of the date of this report, this resolution is still being implemented.
On April 24, 2014, the SFP issued a resolution imposing penalties against several public sector employees in connection with operations executed with Oceanografía, S.A. de C.V. Four employees of Pemex-Exploration and Production were barred from public sector employment for six months to one year. The employees filed motions (filesNo. 14/8891-19-01-02-08-OT;10781/14-17-10-5;16172/14-17-04-7; and15972/14-17-11-4) before the Regional Court of Chiapas-Tabasco and theDécima Sala Regional Metropolitana (Tenth Regional Metropolitan Court), theCuarta Sala Regional Metropolitana (Fourth Regional Metropolitan Court) and theDécima Primera Sala Regional Metropolitana (Eleventh Regional Metropolitan Court) of the Federal Court of
204
Fiscal and Administrative Justice, respectively, requesting that the penalties be declared null and void. The following sets forth the status of these proceedings:
| | • | | On April 4, 2015, a judgment was issued (fileNo. 14/8891-19-01-02-08-OT) declaring the resolution null and void and requesting that a new judgment be issued. On September 29, 2016, a new resolution was issued and the employee filed a new administrative claim (fileNo. 518/16-26-01-2) before theSala Regional de Tabasco del Tribunal de Justicia Administrativa (Regional Court of Tabasco of the Administrative Justice Court). As of the date of this report, a final resolution is still pending. |
| | • | | On May 9, 2015, a judgment was issued (fileNo. 10781/14-17-10-5) declaring the resolution valid. On December 14, 2016, the employee filed anamparo requesting that a new judgment be issued, which was granted. As of the date of this report, a new judgment is still pending. |
| | • | | On February 15, 2015, a judgment was issued (fileNo. 16172/14-17-04-7) declaring the resolution null and void. On August 11, 2016, theTribunal Colegiado de Circuito (Circuit Court) dismissed the judgment and remanded for issuance of a new resolution. As of the date of this report, a final resolution is still pending. |
| | • | | On March 19, 2015, a judgment was issued (fileNo. 15972/14-17-11-4) declaring the resolution null and void, which was sustained by the Circuit Court on October 16, 2015. |
Key Energy Services
On August 11, 2016, the SEC announced that Key Energy Services, Inc. agreed to pay U.S. $5 million to settle SEC charges that it violated the internal controls andbooks-and-records provisions of the Foreign Corrupt Practices Act. These violations arose from payments allegedly made by its subsidiary, Key Mexico, to one of our employees to induce him to provide advice, assistance and inside information that was used by Key Energy and Key Mexico in negotiating contracts with us. Our Liabilities Unit is currently investigating these allegations.
Odebrecht
On December 21, 2016, the U.S. Department of Justice publicly disclosed that Odebrecht S.A. (Odebrecht), a global construction conglomerate based in Brazil, pled guilty to charges of bribery and corruption in connection with, among other things, bribes paid for more than 100 projects in twelve countries. The report further disclosed that, between 2010 and 2014, Odebrecht had bribed officials of the Mexican government for an amount equal to U.S. $10.5 million, including the payment to a high-level official of a Mexican state-owned and state-controlled company of a bribe of U.S. $6 million.
On December 22, 2016, our Liabilities Unit commenced an investigation into instances of bribery or corruption related to these allegations. On January 25, 2017, we filed a criminal complaint with the Federal Attorney General’s Office against any party for acts that may have been committed against PEMEX. We are collaborating with the Liabilities Unit, the SFP and the Federal Attorney General’s Office in order to hold those responsible for these acts accountable and ensure that we recover any damages to which we are entitled.
Actions Against the Illicit Market in Fuels
In order to counteract the illicit fuel market, we have implemented a security strategy throughout our facilities that seeks to:
| | • | | implement a strategic safeguard system, allowing us to respond in a timely manner to risks of illegal activity; |
| | • | | strengthen coordination and collaboration between Petróleos Mexicanos and our subsidiary entities, as well as with authorities in the three orders of government, including the Federal Attorney General’s Office, Federal Consumer’s Office, Tax Administration System, federal, state and municipal police, theSecretaría de la Defensa Nacional (Ministry of National Defense) and the Mexican navy; |
205
| | • | | optimize our human capital and modernize our technology; |
| | • | | modernize our information systems to improve our strategic decision making; and |
| | • | | revise our security strategy to incorporate innovations from the fields of industrial safety, civil protection, and environmental preservation. |
Our initiatives aim to develop a sustainable operating model to safeguard the areas in which we operate, which comprise approximately 2.0 million square kilometers of onshore fields and 3.2 million square kilometers of Mexican territorial waters.
These initiatives are intended to strengthen our ability to combat the illicit market in fuels, and include our increased investments in surveillance technology for our facilities and pipelines, as well as the reinforcement of equipment and resources available to protect our personnel, facilities, the general population and the environment. In particular, during 2016, we continued the following strategic measures in order to decrease incidents of criminal activity at our facilities:
| | • | | Increased vigilance by 2.1% compared to 2015 in order to mobilize these forces in patrolling areas with a higher crime rate on hydrocarbons. |
| | • | | Worked with the judicial and ministerial authorities to identify 2,695 vehicles involved in the illicit market in fuels, as compared to 4,907 vehicles in 2015, which represents a 45.1% decrease, as a result of a decrease in the amount of hydrocarbons stolen along our pipeline systems. The number of individuals brought before judicial authorities in connection with the illicit market in fuels decreased to 583, as compared to 1,154 individuals brought before judicial authorities in 2015, which represents a 49.5% decrease, mainly due to implementation of theSistema de Justicia Penal Acusatorio (Adversarial System in Criminal Justice), which requires that law enforcement, not our personnel, act as first responders to any suspected participation in hydrocarbon related crime, irrespective of whether we, or any other group initially discovered the illegal activity. |
| | • | | Inspected the rights of way and facilities through a total of 10,472,808 kilometers patrolled in 2016, at an average of 28,693 kilometers per day by vehicle and 305 kilometers per day by foot, as compared to 29,317 kilometers per day by vehicles and 306 kilometers per day by foot during 2015. These surveillance activities were carried out in coordination with the Ministry of National Defense, the Mexican Navy and other governmental authorities. During 2016 we were able to patrol at levels similar to 2015, despite using only half of the number of vehicles as a result to budget cuts following the 2016 Budget Adjustment Plan. |
| | • | | Strengthened our collaborations with governmental entities, the Federal Attorney General’s Office, the federal police and the Ministry of the Interior, among others, to share information and provide support to investigative teams focused on theft and illegal trade in fuels. We have also provided training for authorities responsible for the prevention, detection and prosecution of criminal activities in the illicit market in fuels, particularly in the inspection of automobile tanks and the documentation needed to be able to transport fuel, in an effort to support intragovernmental coordination. |
| | • | | Created territorial divisions to best use monitoring technologies along with our ground patrol, which has allowed us to detect a higher number of illegal drillings and to prevent the illegal extraction of fuels. |
These measures led to the recovery of 13.1 million liters of hydrocarbon product in 2016.
These efforts also led to the identification and sealing of 6,873 illegal pipeline taps in 2016, as compared to the identification and sealing of 6,260 illegal pipeline taps during 2015, which represents a 9.8% increase. This increase resulted from both increased surveillance and an increase in the number of criminal attempts to divert our products. Our renewed focus on the detection of illegal pipeline taps in 2015 enabled us to collect more
206
information and develop more effective strategies to combat fuel theft, which in turn improved our ability to deploy ground patrol for the immediate identification and sealing of pipeline taps and prevent additional extraction of our hydrocarbon products.
On January 12, 2016, theLey Federal para Prevenir y Sancionar los Delitos Cometidos en Materia de Hidrocarburos (Federal Law to Prevent and Punish Crimes related to Hydrocarbons Matters) was published in the Official Gazette of the Federation, along with several reforms to related laws, including theCódigo Federal de Procedimientos Penales (Criminal Procedures Federal Code), theCódigo Penal Federal (Federal Criminal Code) and theLey Federal contra la Delincuencia Organizada (Federal Law of Organized Crime). This law and the related reforms establish additional civil and criminal penalties for the illegal tapping of pipelines, the theft of hydrocarbons and the alteration of hydrocarbons measurements systems, among other infractions.
Civil Actions
In the ordinary course of our business, we are a party to a number of lawsuits of various types. We evaluate the merit of each claim and assess the likely outcome, accruing a contingent liability when an unfavorable decision is probable and the amount is reasonably estimable. At December 31, 2015 and 2016, we had accrued a reserve of Ps. 12.8 billion and Ps. 15.1 billion, respectively, for our contingent liabilities in connection with these lawsuits. Our material legal proceedings are described in Note 25 and Note 27 to our consolidated financial statements included in this report, and those descriptions are incorporated by reference under this Item.
Dividends
Pursuant to the Petróleos Mexicanos Law, as of January 1, 2016, Petróleos Mexicanos and its subsidiary entities are subject to a new dividend policy that will require them to pay a state dividend to the Mexican Government on an annual basis. In accordance with the Federal Revenue Law of 2016 and the Federal Revenue Law of 2017, Petróleos Mexicanos was not required to pay a state dividend in 2016 and will not be required to pay a state dividend in 2017. For more information, see “Item 4—Taxes, Duties and Other Payments to the Mexican Government—Fiscal Regime for PEMEX—Other Payments to the Mexican Government.”
| Item 9. | The Offer and Listing |
Trading in the debt securities issued by Petróleos Mexicanos takes place primarily in theover-the-counter market. All the debt securities issued by Petróleos Mexicanos that are registered pursuant to the U.S. Securities Act of 1933 (which we refer to as the Securities Act) are also listed on the Luxembourg Stock Exchange and traded on the Euro MTF market of the Luxembourg Stock Exchange.
| Item 10. | Additional Information |
Memorandum and Articles of Association
The Mexican Congress established Petróleos Mexicanos by a decree dated June 7, 1938, effective July 20, 1938. None of Petróleos Mexicanos or the subsidiary entities has bylaws or articles of association. Petróleos Mexicanos and the subsidiary entities, are public entities of the Mexican Government and each is a legal entity empowered to own property and carry on business in its own name.
The activities of Petróleos Mexicanos and the subsidiary entities are regulated by the Mexican Constitution, the Petróleos Mexicanos Law, Regulations to the Petróleos Mexicanos Law, the Hydrocarbons Law and other federal laws and regulations. See “Item 4—Information on the Company—History and Development.” Under the Petróleos Mexicanos Law, the Board of Directors of Petróleos Mexicanos has the following committees: the Audit Committee, the Human Resources and Compensation Committee, the Strategy and Investment Committee and the Acquisitions, Leasing, Public Works and Services Committee. See “Item 6—Directors, Senior Management and Employees.”
207
Under the Petróleos Mexicanos Law and the Regulations to the Petróleos Mexicanos Law, our directors are obligated to abstain from voting on a proposal, arrangement or contract in which they have a personal, family or business interest. Our directors do not have the power to vote compensation to themselves or any other member of the board. Except in the case of the independent board members, our directors do not receive compensation for their services as members of the boards of directors of Petróleos Mexicanos and the subsidiary entities. Under the Petróleos Mexicanos Law, our directors must perform their duties without obtaining or attempting to obtain any benefits greater than those granted by law. Therefore, our directors do not have borrowing powers exercisable by themselves. There is no requirement for early retirement for our directors.
Material Contracts
As of December 31, 2015 and 2016, we have entered into contracts with various contractors for approximate amounts of Ps. 987,674 million and Ps. 817,994 million, respectively. These contracts are for the development of investment projects. See Note 24(e) to our consolidated financial statements included herein.
On January 27, 2009, Petróleos Mexicanos entered into an indenture with Deutsche Bank Trust Company Americas, as Trustee. This agreement provides for the issuance by Petróleos Mexicanos from time to time of unsecured debt securities. On the same date, Petróleos Mexicanos entered into a distribution agreement with Calyon Securities (USA) Inc. (now known as Credit Agricole Securities (USA) Inc.), Citigroup Global Markets Inc., Citigroup Global Markets Limited, HSBC Securities (USA) Inc. and Santander Investment Securities Inc. pursuant to which Petróleos Mexicanos established a U.S. $7.0 billion medium-term note, Series C, program. Pursuant to the 1996 guaranty agreement referred to above, Petróleos Mexicanos’ obligations under all notes issued under this program are jointly and severally guaranteed by Pemex-Exploration and Production, Pemex-Refining andPemex-Gas and Basic Petrochemicals. In December 2010, Petróleos Mexicanos appointed Credit Suisse Securities (USA) LLC as an agent under the 2009 distribution agreement referred to above. In each of December 2010 and January 2010, Petróleos Mexicanos increased the size of this program to U.S. $12.0 billion and U.S. $22.0 billion, respectively. Petróleos Mexicanos issued U.S. $3.5 billion of notes and bonds under this program in 2011. In 2012, Petróleos Mexicanos issued U.S. $5.3 billion of notes and bonds under this program. In 2013, Petróleos Mexicanos increased the size of this program to U.S. $32.0 billion and issued U.S. $6.9 billion of notes and bonds under it. In 2014, Petróleos Mexicanos increased the size of this program to U.S. $42.0 billion and issued U.S. $7.9 billion of notes and bonds under it. During the first three months of 2017, Petróleos Mexicanos increased the size of this program to U.S. $72.0 billion and issued € 4.3 billion of notes and bonds under it. See “Item 5—Operating and Financial Review and Prospects—Liquidity and Capital Resources—Financing Activities.”
Exchange Controls
Mexico has had a free market for foreign exchange since 1991, and the Mexican Government has allowed the peso to float freely against the U.S. dollar since December 1994. We have no control over or influence on this exchange rate policy. The Mexican Government has announced that it does not intend to change its floating exchange rate policy, but there is no guarantee that the Mexican Government will not change this policy. See “Item 3—Key Information—Exchange Rates.”
Taxation
The 1997 Securities, the 1998 Securities, the 1999 Securities, the 2003 Securities, the 2004 Securities, the 2006 Securities, the 2008 Securities, the 2009 Securities, the 2010 Securities, the 2011 Securities, the 2012 Securities, the 2013 Securities, the 2014 Securities, 2016 and the 2017 Securities.
Pursuant to a registration statement on FormF-4 (FileNo. 333-7796), which was declared effective by the SEC on October 17, 1997, Petróleos Mexicanos, Pemex-Exploration and Production, Pemex-Refining andPemex-Gas and Basic Petrochemicals registered pursuant to the Securities Act up to U.S. $400,000,000 of 9.50%
208
Global Guaranteed Bonds due 2027, which we refer to as the 1997 Securities. In December 2004 and February 2006, an aggregate amount of U.S. $376,250,000 of the 1997 Securities were exchanged for bonds issued by the Pemex Project Funding Master Trust (which we refer to as the Master Trust).
Pursuant to a registration statement on FormF-4 (FileNo. 333-9310), which was declared effective by the SEC on August 24, 1998, Petróleos Mexicanos, Pemex-Exploration and Production, Pemex-Refining andPemex-Gas and Basic Petrochemicals registered pursuant to the Securities Act up to U.S. $350,000,000 of 9 1⁄4% Global Guaranteed Bonds due 2018, which we refer to as the 1998 Securities. In December 2004 and February 2006, an aggregate amount of U.S. $340,427,000 of the 1998 Securities were exchanged for bonds issued by the Master Trust.
Pursuant to a registration statement on FormF-4 (FileNo. 333-10706), which was declared effective by the SEC on October 1, 1999, Petróleos Mexicanos, Pemex-Exploration and Production, Pemex-Refining andPemex-Gas and Basic Petrochemicals registered pursuant to the Securities Act up to U.S. $500,000,000 of 9.50% Puttable or Mandatorily Exchangeable Securities (POMESSM) due 2027, which we refer to as the 1999 Securities. In December 2004 and February 2006, an aggregate amount of U.S. $421,522,000 of the 1999 Securities were exchanged for POMESSM issued by the Master Trust. All outstanding 1999 Securities of Petróleos Mexicanos were, on March 16, 2006, mandatorily exchanged for 9.50% Global Guaranteed Bonds due 2027 issued by Petróleos Mexicanos, thereby increasing the outstanding amount of the 1997 Securities.
Pursuant to a registration statement on FormF-4 (FileNo. 333-103197), which was declared effective by the SEC on February 24, 2003, the Master Trust, Petróleos Mexicanos, Pemex-Exploration and Production, Pemex-Refining andPemex-Gas and Basic Petrochemicals registered pursuant to the Securities Act up to U.S. $500,000,000 of 8.625% Bonds due 2022. Pursuant to a registration statement on FormF-4 (FileNo. 333-107905), which was declared effective by the SEC on August 21, 2003, the Master Trust, Petróleos Mexicanos, Pemex-Exploration and Production, Pemex-Refining andPemex-Gas and Basic Petrochemicals registered pursuant to the Securities Act up to U.S. $510,154,000 of 8.625% Bonds due 2022. We refer to the securities registered in 2003 under these registration statements as the 2003 Securities.
Pursuant to a registration statement on FormF-4 (FileNo. 333-118373), which was declared effective by the SEC on August 31, 2004, the Master Trust, Petróleos Mexicanos, Pemex-Exploration and Production, Pemex-Refining andPemex-Gas and Basic Petrochemicals registered pursuant to the Securities Act up to U.S. $47,085,000 of 8.625% Bonds due 2022. We refer to the securities registered in 2004 as the 2004 Securities.
Pursuant to a registration statement on FormF-4 (FileNo. 333-126941), which was declared effective by the SEC on January 13, 2006, the Master Trust, Petróleos Mexicanos, Pemex-Exploration and Production, Pemex-Refining andPemex-Gas and Basic Petrochemicals registered pursuant to the Securities Act up to U.S. $324,220,000 of 9 1⁄4% Bonds due 2018, U.S. $228,735,000 of 8.625% Bonds due 2023, U.S. $354,477,000 of 9.50% Bonds due 2027, U.S. $403,746,000 of POMESSM due 2027 and U.S. $500,000,000 of 6.625% Guaranteed Bonds due 2035. Pursuant to a registration statement on FormF-4 (FileNo. 333-126948), which was declared effective by the SEC on January 13, 2006, the Master Trust, Petróleos Mexicanos, Pemex-Exploration and Production, Pemex-Refining andPemex-Gas and Basic Petrochemicals registered pursuant to the Securities Act up to U.S. $25,780,000 of 9 1⁄4% Bonds due 2018, U.S. $21,265,000 of 8.625% Bonds due 2023, U.S. $45,523,000 of 9.50% Bonds due 2027 and U.S. $96,254,000 of POMESSM due 2027. All outstanding POMES registered under these registration statements were, on March 15, 2006, mandatorily exchanged for 9.50% Bonds due 2027. Pursuant to a registration statement on FormF-4 (FileNo. 333-136674), which was declared effective by the SEC on November 3, 2006, the Master Trust, Petróleos Mexicanos, Pemex-Exploration and Production, Pemex-Refining andPemex-Gas and Basic Petrochemicals registered pursuant to the Securities Act up to U.S. $751,995,000 of 6.625% Guaranteed Bonds due 2035. We refer to the securities registered in 2006 under these registration statements as the 2006 Securities.
Pursuant to a registration statement on FormF-4 (FileNo. 333-152486), which was declared effective by the SEC on December 18, 2008, the Master Trust, Petróleos Mexicanos, Pemex-Exploration and Production,
209
Pemex-Refining andPemex-Gas and Basic Petrochemicals registered pursuant to the Securities Act up to U.S. $2,500,000,000 of 5.75% Guaranteed Notes due 2018, up to U.S. $501,000,000 of 6.625% Guaranteed Bonds due 2035 and up to U.S. $500,000,000 of 6.625% Guaranteed Bonds due 2038. We refer to the securities registered in 2008 as the 2008 Securities.
Pursuant to a registration statement on FormF-4 (FileNo. 333-160799), which was declared effective by the SEC on August 25, 2009, Petróleos Mexicanos, Pemex-Exploration and Production, Pemex-Refining andPemex-Gas and Basic Petrochemicals registered pursuant to the Securities Act up to U.S. $2,000,000,000 of 8.00% Notes due 2019. We refer to the securities registered in 2009 as the 2009 Securities.
Effective as of September 30, 2009, Petróleos Mexicanos assumed, as primary obligor, all of the Master Trust’s obligations as issuer of the 2001 Securities, the 2003 Securities, the 2004 Securities, the 2006 Securities and the 2008 Securities. As a result, effective as of September 30, 2009, Petróleos Mexicanos is the issuer of all Registered Securities (as defined below).
Pursuant to a registration statement on FormF-4 (FileNo. 333-168326), which was declared effective by the SEC on August 31, 2010, Petróleos Mexicanos, Pemex-Exploration and Production, Pemex-Refining andPemex-Gas and Basic Petrochemicals registered pursuant to the Securities Act up to U.S. $63,314,000 of 8.00% Notes due 2019, up to U.S. $1,000,000,000 of 6.000% Notes due 2020, up to U.S. $2,000,000,000 of 5.50% Notes due 2021 and up to U.S. $1,000,000,000 of 6.625% Bonds due 2035. We refer to the securities registered in 2010 as the 2010 Securities.
Pursuant to a registration statement on FormF-4 (FileNo. 333-175821), which was declared effective by the SEC on August 31, 2011, Petróleos Mexicanos, Pemex-Exploration and Production, Pemex-Refining andPemex-Gas and Basic Petrochemicals registered pursuant to the Securities Act up to U.S. $1,000,000,000 of 5.50% Notes due 2021 and up to U.S. $1,250,000,000 of 6.500% Bonds due 2041. We refer to the securities registered in 2011 as the 2011 Securities.
Pursuant to a registration statement on FormF-4 (FileNo. 333-182553), which was declared effective by the SEC on July 23, 2012, Petróleos Mexicanos,Pemex-Exploration and Production,Pemex-Refining andPemex-Gas and Basic Petrochemicals registered pursuant to the Securities Act up to U.S. $2,100,000,000 of 4.875% Notes due 2022 and up to U.S. $1,750,000,000 of 5.500% Bonds due 2044. We refer to the securities registered in 2012 as the 2012 Securities.
Pursuant to a registration statement on FormF-4/A (FileNo. 333-189852), which was declared effective by the SEC on July 25, 2013, Petróleos Mexicanos,Pemex-Exploration and Production,Pemex-Refining andPemex-Gas and Basic Petrochemicals registered pursuant to the Securities Act up to U.S. $1,000,000,000 of 3.500% Notes due 2018, up to U.S. $500,000,000 of Floating Rate Notes due 2018, up to U.S. $2,100,000,000 of 3.500% Notes due 2023, up to U.S. $1,000,000,000 of 4.875% Notes due 2024, up to U.S. $500,000,000 of 6.500% Bonds due 2041 and up to U.S. $1,000,000,000 of 5.50% Bonds due 2044. We refer to the securities registered in 2013 as the 2013 Securities.
Pursuant to a registration statement on FormF-4 (FileNo. 333-198588), which was declared effective by the SEC on September 22, 2014, Petróleos Mexicanos,Pemex-Exploration and Production,Pemex-Refining andPemex-Gas and Basic Petrochemicals registered pursuant to the Securities Act up to U.S. $500,000,000 of 3.125% Notes due 2019, up to U.S. $500,000,000 of 4.875% Notes due 2024 and up to U.S. $3,000,000,000 of 6.375% Bonds due 2045. We refer to the securities registered in 2014 as the 2014 Securities.
Pursuant to a registration statement on FormF-4 (FileNo. 333-205763), which was declared effective by the SEC on February 22, 2016, Petróleos Mexicanos,Pemex-Exploration and Production, Pemex Industrial Transformation, Permex Drilling and Services, Pemex Logistics and Pemex Cogeneration and Services registered pursuant to the Securities Act up to U.S. $1,500,000,000 of 3.500% Notes due 2020, up to U.S. $1,000,000,000
210
of 4.250% Notes due 2025, $1,500,000,000 of 4.500% Notes due 2026, up to U.S. $1,500,000,000 of 5.50% Bonds due 2044 and up to U.S. $3,000,000,000 of 5.625% Bonds due 2046. We refer to the securities registered in 2016 as the 2016 Securities, and together with the 1997 Securities, the 1998 Securities, the 2003 Securities, the 2004 Securities, the 2006 Securities, the 2008 Securities, the 2009 Securities, the 2010 Securities, the 2011 Securities, the 2012 Securities, the 2013 Securities and the 2014 Securities as the Registered Securities.
Pursuant to a registration statement on FormF-4 (FileNo. 333-205763), which was declared effective by the SEC on February 22, 2016, Petróleos Mexicanos,Pemex-Exploration and Production, Pemex Industrial Transformation, Pemex Drilling and Services, Pemex Logistics and Pemex Cogeneration and Services registered pursuant to the Securities Act up to U.S. $1,500,000,000 of 3.500% Notes due 2020, up to U.S. $1,000,000,000 of 4.250% Notes due 2025, $1,500,000,000 of 4.500% Notes due 2026, up to U.S. $1,500,000,000 of 5.50% Bonds due 2044 and up to U.S. $3,000,000,000 of 5.625% Bonds due 2046. Pursuant to a registration statement on FormF-4 (FileNo. 333-213351), which was declared effective by the SEC on November 11, 2016, Petróleos Mexicanos, Pemex Exploration and Production, Pemex Industrial Transformation, Pemex Drilling and Services, Pemex Logistics and Pemex Cogeneration and Services registered pursuant to the Securities Act up to U.S. $750,000,000 of 5.500% Notes due 2019, up to U.S. $1,250,000,000 of 6.375% Notes due 2021, up to U.S. $2,069,302,000 of 4.625% Notes due 2023, up to U.S $3,000,000,000 of 6.875% Notes due 2026, and up to U.S.$3,500,000,000 of 6.750% Notes due 2047. We refer to the securities registered in 2016 as the 2016 Securities, and together with the 1997 Securities, the 1998 Securities, the 2003 Securities, the 2004 Securities, the 2006 Securities, the 2008 Securities, the 2009 Securities, the 2010 Securities, the 2011 Securities, the 2012 Securities, the 2013 Securities and the 2014 Securities as the Registered Securities.
Taxation Generally
The following summary contains a description of the principal Mexican and U.S. federal income tax consequences of the ownership and disposition of the Registered Securities, but it does not purport to be a comprehensive description of all of the tax considerations that may be relevant to a decision to invest in, or dispose of, the Registered Securities.
This summary is based on the federal tax laws of Mexico and the United States in force on the date of thisForm 20-F, including the provisions of the income tax treaty between the United States and Mexico together with related protocols (which are subject to change), and does not describe any tax consequences arising under the laws of any state or municipality in Mexico, the United States or any other jurisdiction, or the laws of any taxing jurisdiction other than the federal laws of Mexico and the United States.
Mexico has also entered into, or is negotiating, tax treaties with various countries that may have effects on holders of Registered Securities. This report does not discuss the consequences (if any) of such treaties.
Each holder or beneficial owner of Registered Securities should consult its tax advisor as to the Mexican, United States or other tax consequences of the ownership and disposition of those securities, including the effect of any foreign, state or municipal tax laws, and the consequences of the application of any tax treaty to which Mexico is a party.
Mexican Taxation
This summary of certain Mexican federal tax considerations refers only to holders of Registered Securities that are not residents of Mexico for Mexican tax purposes and that will not hold the Registered Securities or a beneficial interest therein through a permanent establishment for tax purposes (we refer to any suchnon-resident holder as a Foreign Holder). For purposes of Mexican taxation, an individual is a resident of Mexico if he/she has established his/her domicile in Mexico. When an individual also has a place of residence in another country, that individual will be considered a resident of Mexico for tax purposes, if such individual has his/her center of vital interest in Mexico. An individual would be deemed to have his/her center of vital interest in Mexico if, among
211
other things: (a) more than 50% of his/her total income for the year were derived from Mexican sources, or (b) his/her principal center of professional activities were located in Mexico.
A legal entity is a resident of Mexico if:
| | • | | it maintains the principal administration of its business in Mexico; or |
| | • | | it has established its effective management in Mexico. |
A Mexican national is presumed to be a resident of Mexico unless such person can demonstrate the contrary. If a legal entity or individual has a permanent establishment in Mexico, such permanent establishment shall be required to pay taxes in Mexico on income attributable to such permanent establishment in accordance with Mexican federal tax law.
Taxation of Interest.Under the Mexican Income Tax Law and rules issued by the Ministry of Finance and Public Credit applicable to PEMEX, payments of interest (which are deemed to include any amounts paid in excess of the original issue price of the relevant securities), made by a Mexican issuer (including Petróleos Mexicanos) in respect of notes or bonds and other debt securities to a Foreign Holder will generally be subject to a Mexican withholding tax assessed at a rate of 4.9%, if the following requirements are met:
| | • | | notice relating to the offering of such notes or bonds is given to the CNBV as required under the Securities Market Law and evidence of such notice is timely filed with the Ministry of Finance and Public Credit; |
| | • | | such notes or bonds are placed outside of Mexico through banks or brokerage houses in a country that is party to a treaty to avoid double taxation with Mexico; and |
| | • | | the issuer duly complies with the information requirements established in the general rules issued by the Ministry of Finance and Public Credit for such purposes. |
If the effective beneficiaries, directly or indirectly, individually or jointly with related parties, receive more than 5% of the interest paid on such notes or bonds and are holders, directly or indirectly, individually or jointly, with related parties of more than 10% of the voting stock of the issuer or entities 20% or more of whose stock is owned directly or indirectly, individually or jointly, by parties related to the issuer, the withholding tax rate applicable to payment of interest on such notes or bonds may be significantly higher.
Payments of interest made by Petróleos Mexicanos or the subsidiary entities, except for Pemex Fertilizers and Pemex Ethylene, in respect of the Registered Securities tonon-Mexican pension or retirement funds will be exempt from Mexican withholding taxes, provided that:
| | • | | such fund is duly organized pursuant to the laws of its country of origin and is the effective beneficiary of the interest payment; |
| | • | | the income from such interest payment is exempt from income tax in its country of residence; and |
| | • | | such fund delivers certain information as per rules issued by the Ministry of Finance and Public Credit. |
Additional Amounts.Petróleos Mexicanos and the subsidiary entities, except for Pemex Fertilizers and Pemex Ethylene, have agreed, subject to specified exceptions and limitations, to:
| | • | | pay Additional Amounts (as defined in the indenture dated as of September 18, 1997, as supplemented, between Petróleos Mexicanos and Deutsche Bank) to the holders of the 1997 Securities in respect of the Mexican withholding taxes mentioned above; |
| | • | | pay Additional Amounts (as defined in the indenture dated as of August 7, 1998, as supplemented, between Petróleos Mexicanos and Deutsche Bank) to the holders of the 1998 Securities in respect of the Mexican withholding taxes mentioned above; |
212
| | • | | pay Additional Amounts (as defined in the indenture dated as of July 31, 2000, as supplemented, between Petróleos Mexicanos and Deutsche Bank) to the holders of the 2003 Securities and the 2004 Securities in respect of the Mexican withholding taxes described above; |
| | • | | pay Additional Amounts (as defined in the indenture dated as of December 30, 2004, as supplemented, between Petróleos Mexicanos and Deutsche Bank) to the holders of the 2006 Securities and the 2008 Securities in respect of the Mexican withholding taxes described above; and |
| | • | | pay Additional Amounts (as defined in the indenture dated as of January 27, 2009, as supplemented, between Petróleos Mexicanos and Deutsche Bank) to the holders of the 2009 Securities, the 2010 Securities, the 2011 Securities, the 2012 Securities, the 2013 Securities, the 2014 Securities and the 2016 Securities in respect of the Mexican withholding taxes described above. |
If Petróleos Mexicanos pays Additional Amounts in respect of such Mexican withholding taxes, any refunds received with respect to such Additional Amounts will be for the account of Petróleos Mexicanos.
Holders or beneficial owners of the Registered Securities may be required to provide certain information or documentation necessary to enable Petróleos Mexicanos and the subsidiary entities to apply the appropriate Mexican withholding tax rate applicable to holders or beneficial owners of the Registered Securities. In the event that the specified information or documentation concerning such holder or beneficial owner, if requested, is not provided on a timely basis, the obligation of Petróleos Mexicanos and the subsidiary entities to pay Additional Amounts may be limited.
Taxation of Dispositions.Capital gains resulting from the sale or other disposition of the Registered Securities by a Foreign Holder will not be subject to Mexican income or withholding taxes.
Other Mexican Tax Considerations.Under the Income Tax Law, any discount received by anon-resident upon purchase of the notes or bonds from a Mexican resident or anon-resident with a permanent establishment in Mexico is deemed interest income, and therefore, subject to taxes in Mexico. Such interest income results from the difference between the face value (plus accrued interest not subject to withholding) and the purchase price of such notes or bonds.
Transfer and Other Taxes.There are no Mexican stamp, registration or similar taxes payable by a Foreign Holder in connection with the purchase, ownership or disposition of the Registered Securities. A Foreign Holder of the Registered Securities will not be liable for Mexican estate, succession, gift, inheritance or similar tax with respect to such securities.
United States Taxation
This summary of certain U.S. federal income tax considerations deals principally with persons that hold the Registered Securities as capital assets and whose functional currency is the U.S. dollar. As used in this section “Taxation,” the term “United States Holder” means a beneficial owner of a Registered Security that is an individual who is a citizen or resident of the United States, a U.S. domestic corporation or any other person that is subject to U.S. federal income taxation on a net income basis in respect of its investment in the Registered Securities.
This summary does not purport to be a comprehensive description of all the tax considerations that may be relevant to any particular investor, including tax considerations that arise from rules of general application or that are assumed to be known to investors. This summary generally does not address the tax treatment of holders that may be subject to special tax rules, such as banks, insurance companies,tax-exempt organizations, dealers in securities or currencies, certain short-term holders of Registered Securities, traders in securities electing tomark-to-market, or persons that hedge their exposure in the Registered Securities or hold the Registered Securities as a position in a “straddle” for tax purposes or as part of a “synthetic security” or a “hedging” or “conversion” transaction or other integrated investment comprised of such Registered Securities and one or more
213
other investments, nonresident aliens present in the United States for more than 182 days in a taxable year, U.S. expatriates, entities taxed as partnerships or the partners therein, persons that have a “functional currency” other than the U.S. dollar, nor does it address the tax treatment of holders that did not acquire the Registered Securities at their issue price as part of the initial distribution. Investors who purchased the Registered Securities at a price other than the issue price should consult their tax advisor as to the possible applicability to them of the amortizable bond premium or market discount rules.
In addition, this summary does not discuss the application of the Medicare contribution tax on net investment income or the alternative minimum tax. United States Holders should consult their own tax advisers concerning the U.S. federal, state, local, and other tax consequences of purchasing, owning, and disposing of a Registered Security in their particular circumstances.
Taxation of Interest and Additional Amounts.A United States Holder will treat the gross amount of interest and Additional Amounts (i.e., without reduction for Mexican withholding taxes) as ordinary interest income in respect of the Registered Securities. Mexican withholding taxes paid at the appropriate rate applicable to the United States Holder will be treated as foreign income taxes eligible, subject to generally applicable limitations and conditions, for credit against such United States Holder’s U.S. federal income tax liability, at the election of such United States Holder, or for deduction in computing such United States Holder’s taxable income, provided that the United States Holder does not elect to claim a foreign tax credit for any foreign income taxes paid or accrued for the relevant taxable year. Interest and Additional Amounts will constitute income from sources without the United States and generally will be treated separately along with other items of “passive” income for purposes of determining the credit for foreign income taxes allowed under the Internal Revenue Code of 1986, as amended.
The calculation and availability of foreign tax credits or deductions involves the application of rules that depend on a United States Holder’s particular circumstances. United States Holders should consult their own tax advisors regarding the availability of foreign tax credits and the treatment of Additional Amounts.
Taxation of Dispositions.Upon the sale, exchange or retirement of a Registered Security, a United States Holder will generally recognize a gain or loss equal to the difference between the amount realized (less any amounts attributable to accrued and unpaid interest not previously includible in gross income, which will be taxable as ordinary income) and the holder’s tax basis in such security, which is generally equal to the cost of the Registered Security to the United States Holder. Gain or loss recognized by a United States Holder on the sale, redemption or other disposition of the Registered Securities generally will be long-term capital gain or loss if, at the time of disposition, the securities have been held for more than one year. Long-term capital gain realized by an individual United States Holder is generally taxed at lower rates than short-term capital gains or ordinary income.
Non-United States Holders.Subject to the discussion below under “Backup Withholding and Information Reporting,” holders of the Registered Securities that are not United States Holders (which we refer to asNon-United States Holders) generally will not be subject to U.S. federal income or withholding tax on interest income in respect of the Registered Securities or on any gain realized on the disposition of the Registered Securities.
Backup Withholding and Information Reporting.Information returns may be filed with the Internal Revenue Service with respect to payments made to certain United States Holders of the Registered Securities. In addition, certain United States Holders may be subject to a backup withholding tax in respect of such payments, unless they (1) provide their accurate taxpayer identification numbers to the principal paying agent and certify that they are not subject to backup withholding or (2) otherwise establish an exemption from the backup withholding tax. Backup withholding is not an additional tax.Non-United States Holders may be required to comply with applicable certification procedures to establish that they are not United States Holders in order to avoid the application of such information reporting requirements and backup withholding tax.
214
Specified Foreign Financial Assets.Certain United States Holders that own “specified foreign financial assets” with an aggregate value in excess of U.S. $50,000 are generally required to file an information statement along with their tax returns, currently on Form 8938, with respect to such assets. “Specified foreign financial assets” include any financial accounts held at anon-U.S. financial institution, as well as securities issued by anon-U.S. issuer (which would include the Registered Securities) that are not held in accounts maintained by financial institutions. Higher reporting thresholds apply to certain individuals living abroad and to certain married individuals. Regulations extend this reporting requirement to certain entities that are treated as formed or availed of to hold direct or indirect interests in specified foreign financial assets based on certain objective criteria. United States Holders who fail to report the required information could be subject to substantial penalties. In addition, the statute of limitations for assessment of tax would be suspended, in whole or part. Prospective investors should consult their own tax advisors concerning the application of these rules to their investment in the Registered Securities, including the application of the rules to their particular circumstances.
Documents on Display
We are subject to the information requirements of the Exchange Act. In accordance with these requirements, we file reports, including annual reports on Form20-F, and other information with the SEC. These materials, including this report, and the exhibits thereto, may be inspected and copied at the SEC’s public reference room at 100 F Street, N.E., Washington, D.C. 20549. Please call the SEC at1-800-SEC-0330 for further information on the public reference rooms. In addition, any filings we make electronically with the SEC will be available to the public over the Internet at the SEC’s web site at http://www.sec.gov.
215
| Item 11. | Quantitative and Qualitative Disclosures About Market Risk |
QUALITATIVE DISCLOSURE
Policies for Risk Management and the Use of Derivative Financial Instruments
We face market risk caused by the volatility of hydrocarbon prices, exchange rates and interest rates, credit risk associated with investments and financial derivatives, as well as liquidity risk. In order to monitor and manage these risks, we have approved general provisions relating to financial risk management, which are comprised of policies and guidelines that promote an integrated framework for risk management, regulate the use of Derivative Financial Instruments (“DFIs”), and guide the development of risk mitigation strategies.
This regulatory framework establishes that DFIs should be used only for the purpose of mitigating financial risk. The use of DFIs for any other purpose must be approved in accordance with our current internal regulation. We have a Financial Risk Committee, which is a joint body for consultation, opinion and decisions on financial risk exposure, financial risk mitigation schemes and negotiation of DFIs.
In addition, certain of the PMI subsidiaries have implemented a regulatory framework for risk management with respect to its activities, which consists of policies, guidelines and procedures to manage the market risk associated with its commodity trading activities in accordance with industry best practices, such as: the use of DFIs for financial risk mitigation purposes; the segregation of duties; valuation and monitoring mechanisms, such as the generation of a daily portfolio risk report, value at risk (VaR) computation; and VaR limits, both at a global and business unit level and the implementation of stop loss mechanisms. In addition, PMI Trading also has its own risk management subcommittee that supervises the trading of DFIs.
Approved DFIs are mainly traded on the OTC (Over the Counter) market; however, exchange traded instruments may also be used. In the case of PMI Trading, DFIs are traded onCME-Clearport.
The different types of DFIs that we trade are described below in the subsections corresponding to each type of risk and applicable trading markets. See Note 16 to our consolidated financial statements included herein.
One of our policies is to contribute to minimizing the impact that unfavorable changes in financial risk factors have on our financial results by promoting an adequate balance between expected incoming cash flows from operations and outgoing cash flows related to our liabilities.
As part of the regulatory framework for financial risk management, we have established in our internal guidelines the counterparties that are eligible to trade DFIs and other financial instruments.
Given that outstanding DFIs of Petróleos Mexicanos have been entered into for risk mitigation purposes, particularly with economic hedging purposes, there is no need to establish and monitor market risk limits.
For those portfolios with an open market risk exposure, our financial risk management regulatory framework establishes the implementation and monitoring of market risk limits such as VaR and capital at risk (an aggregation ofmark-to-market (“MtM”) and profit and loss, or CaR).
We have also established credit guidelines for DFIs that Pemex Industrial Transformation offers to its domestic customers, which include the use of guarantees and credit lines. For exchange traded DFIs, we trade under the margin requirements of the corresponding exchange market, and therefore do not have internal policies for these DFIs.
DFIs held with financial counterparties do not require collateral exchange clauses. Notwithstanding, our regulatory framework promotes credit risk mitigation strategies such as collateral exchange
216
We do not have an independent third party to verify the compliance with these internal standards; however, we have internal control procedures that certify our compliance with existing policies and guidelines.
Description about Valuation Techniques
Fair Value of DFIs
We monitor the fair value of our DFI portfolio on a periodic basis. The fair value represents the price at which one party would assume the rights and obligations of the other, and is calculated for DFIs through models commonly used in the international financial markets, based on inputs obtained from major market information systems and price providers.
Our DFI portfolio is composed primarily of swaps, the prices of which are estimated by discounting flows using the appropriate factors, and contains no exotic instruments that require numerical approximations for their valuation.
We value our DFIs under standard methodologies commonly applied in the financial markets, thereby we do not have an independent third party to value our DFIs. Nonetheless, we calculate the fair value of our DFIs through the tools developed by our market information providers such as Bloomberg, and through valuation models implemented in software packages used to integrate all of our business areas and accounting, such as System Applicable Products (SAP). We have no policies to designate a calculation or valuation agent.
Because our hedges are cash flow hedges, their effectiveness is preserved regardless of the variations in the underlying assets or reference variables, thus asset flows are fully offset by liabilities flows. Therefore, it is not necessary to measure or monitor the hedges’ effectiveness.
Fair value hierarchy
Our fair-value assumptions fall under Level 1 and 2 of the fair value hierarchy for market participant assumptions, as described below.
The fair values determined by Level 1 inputs utilize quoted prices in financial markets for identical assets or liabilities. Fair values determined by Level 2 inputs are based on quoted prices for similar assets or liabilities in financial markets, and inputs other than quoted prices that are observed for assets or liabilities. Level 3 inputs are unobservable inputs for the assets or liabilities, and include situations where there is little, if any, market activity for the assets or liabilities. Management uses appropriate valuation techniques based on the available inputs to measure the fair values of our applicable assets and liabilities.
When available, we measure fair value using Level 1 inputs, because they generally provide the most reliable evidence of fair value.
Liquidity Sources
Liquidity Risk
Our main internal source of liquidity comes from our operations. Additionally, through our debt planning and the purchase and sale of U.S. dollars, we currently preserve a cash balance at a level of liquidity in domestic currency and U.S. dollars that is considered adequate to cover our investment and operating expenses, as well as other payment obligations, such as those related to DFI’s.
In addition, we have acquired committed revolving credit lines in order to mitigate liquidity risk, two of which provide access to Ps. 3,500 million and Ps. 20,000 million with expiration dates in June and November 2019, respectively, and two others that provide access to U.S. $1,500 million and U.S. $3,250 million with expiration dates in December 2019 and January 2020, respectively.
217
Finally, the investment strategies of our portfolios are structured by selecting time horizons that consider each currency’s cash flow requirements in order to preserve liquidity.
Certain of the PMI subsidiaries mitigate their liquidity risk through several mechanisms, the most important of which is the centralized treasury or“in-house bank,” which provides access to a syndicated credit line for up to U.S. $700 million and cash surplus capacity in the custody of the centralized structure. In addition, certain of the PMI subsidiaries have access to bilateral credit lines from financial institutions for up to U.S. $1,450 million.
These companies monitor their cash flow on a daily basis and protect their creditworthiness in the financial markets. Liquidity risk is mitigated by monitoring the maximum/minimum permissible financial ratios as set forth in the policies approved by each company’s board of directors.
Changes in Exposure to Main Risks
Market Risk
We are exposed to fluctuations in floating interest rate liabilities. We are exposed to U.S. dollar LIBOR and to Mexican peso TIIE. As of December 31, 2016, approximately 18.2% of our total net debt outstanding consisted of floating rate debt.
Moreover, we invest in pesos and U.S. dollars in compliance with applicable internal regulations, through portfolios that have different purposes that seek an adequate return subject to risk parameters that reduce the probability of capital losses. The objective of the investments made through these portfolios is to meet our obligations payable in pesos and U.S. dollars.
The investments made through our portfolios are exposed to domestic and international interest rate risk and credit spread risk derived from government and corporate securities, and inflation risk arising from the relationship between UDIs and pesos. However, these risks are mitigated by established limits on exposure to market risk.
Interest Rate Swaps
Occasionally, for strategic reasons or in order to offset the expected inflows and outflows, we have entered into interest rate swaps. Under our interest rate swap agreements, we acquire the obligation to make payments based on a fixed interest rate and are entitled to receive floating interest rate payments based on LIBOR, TIIE or a rate referenced to or calculated from TIIE.
As of December 31, 2016, we were a party to four interest rate swap agreements denominated in U.S. dollars for an aggregate notional amount of U.S. $1,846.3 million at a weighted average fixed interest rate of 2.35% and a weighted average term of 8.3 years.
Similarly, in order to eliminate the volatility associated with variable interest rates of long-term financing operations, PMI NASA has executed interest rate swap agreements denominated in U.S. dollars for an outstanding aggregate notional amount of U.S. $86.6 million, at a weighted average fixed interest rate of 4.17% and a weighted average term of 5.4 years.
A significant amount of our revenues is derived from exports of crude oil and petroleum products, which are priced and payable in U.S. dollars. Moreover, our revenues from domestic sales of gasoline and diesel net of IEPS Tax, tax duties, incentives, and other related taxes, petrochemicals and natural gas and our byproducts are
218
related to international U.S. dollar-denominated prices, except for domestic sales of LPG, which were priced in pesos and represented less than 5% of our revenues. Nevertheless, as of 2017, these sales are referenced to international U.S. dollar-denominated prices.
Our expenses related to hydrocarbon duties are calculated based on international U.S. dollar-denominated prices and the cost of hydrocarbon imports that we acquire for resale in Mexico or use in our facilities are indexed to international U.S. dollar-denominated prices. By contrast, our capital expenditure and operating expenses are established in pesos.
As a result of this cash flow structure, the depreciation of the peso against the U.S. dollar increases our financial balance. The appreciation of the peso relative to the U.S. dollar has the opposite effect. We manage this risk without the need for hedging instruments, because the impact on our revenues of fluctuations in the exchange rate between the U.S. dollar and the peso is offset in whole or in part by its impact on our obligations.
Cross-Currency Swaps
In order to favor the cash flow structure described above, most of our debt is issued in U.S. dollars or hedged through DFIs, either with swaps to convert the debt into U.S. dollars or through other DFIs to mitigate our exchange rate risk exposure. The rest of the debt is denominated in pesos or in UDIs, for which most of the debt denominated in UDIs has been converted into pesos through DFIs in order to eliminate the inflationary risk exposure.
As a consequence of the above, our debt issued in international currencies other than U.S. dollars has exchange rate risk mitigation strategies. Through these strategies, we have further sought to reduce our cost of funding by leaving, in some cases, part of this exchange rate exposure unhedged when assessed appropriate to reduce our cost of funding.
The underlying currencies of our DFIs are the euro, Swiss franc, Japanese yen, Pound sterling and Australian dollar, which are each swapped against the U.S. dollar and UDIs which are swapped against the peso.
In 2016, we entered into various cross-currency swaps to hedge currency risk arising from debt obligations denominated in euros and Swiss francs for an aggregate notional amount of U.S. $3,459.2 million and the inflation risk arising from debt denominated in UDIs, for an aggregate notional amount of Ps. 1,077.1 million. During 2015, we entered into the same kind of instruments to hedge currency risk arising from debt obligations denominated in euros and Swiss francs, for an aggregate notional amount of U.S. $3,109.3 million and the inflation risk arising from debt denominated in UDIs, for an aggregate notional amount of Ps. 9,706.9 million.
Most of our cross-currency swaps are plain vanilla except for one swap entered into in 2004 to hedge our exposure to euros, which expired in 2016. This swap was referred to as an “extinguishing swap” and was obtained in order to hedge long-term obligations. The main characteristic of extinguishing swaps is that these DFIs terminate upon the occurrence of any of the credit default events specified in the DFI contract confirmation, without any payment obligation by either party. This swap had a notional amount of U.S. $1,146.4 million.
Moreover, in 2016 we entered into, without cost, an options structure called the “Seagull Option” in order to cover the notional risk of a debt issued in Japanese yens for ¥80,000,000, keeping the coupons in the original currency (0.5% annual coupon rate). This structure protects our short exposure to the Japanese yen against an appreciation of the Japanese yen relative to the U.S. dollar from JPY 83.70 = U.S. $1.00 and up to JPY 75.00 = U.S. $1.00, with the benefit of its depreciation to an average of 117.39 Japanese Yen/U.S. Dollar.
We recorded a total net foreign exchange loss of Ps. 254,012.7 million in 2016, as compared to a total net foreign exchange loss of Ps. 154,765.6 million in 2015 and to a total net foreign exchange loss of Ps. 76,999.2 million in 2014, which includes the unrealized foreign exchange loss associated with debt of Ps.
219
243,182.8 million, Ps. 152,554.5 million, and Ps. 78,884.7 million for the years ended December 31, 2016, 2015 and 2014, respectively. The depreciation of the peso caused a total net foreign exchange loss in 2016 because a significant portion of our debt (83.0% as of December 31, 2016) is denominated in foreign currency. Unrealized foreign exchange losses and gains do not impact our cash flows. Due to the cash flow structure described above, the depreciation of the peso relative to the U.S. dollar does not affect our ability to meet U.S. dollar-denominated financial obligations and it improves our ability to meet peso-denominated financial obligations. On the other hand, the appreciation of the peso relative to the U.S. dollar may increase our peso-denominated debt service costs on a U.S. dollar basis. Our foreign exchange loss in 2016 was due to the depreciation of the peso, from Ps. 17.2065 = U.S. $1.00 on December 31, 2015 to Ps. 20.6640 = U.S. $1.00 on December 31, 2016. Our foreign exchange loss in 2015 was due to the depreciation of the peso, from Ps. 14.7180 = U.S. $1.00 on December 31, 2014 to Ps. 17.20650 = U.S. $1.00 on December 31, 2015. Our foreign exchange loss in 2014 was due to the depreciation of the peso, from Ps. 13.0765 = U.S. $1.00 on December 31, 2013 to Ps. 14.7180 = U.S. $1.00 on December 31, 2014.
Certain of the PMI subsidiaries face market risks generated by fluctuations in foreign exchange rates. In order to mitigate these risks, the boards of directors of several of these companies have authorized a policy which stipulates that no more than 5% of a company’s total financial assets may be denominated in a currency other than its functional currency, unless the company owes a duty or expected payment in a currency other than its functional one. Accordingly, certain of the PMI subsidiaries will, from time to time, enter into DFIs in order to mitigate the risk associated with financing operations denominated in currencies other than a company’s functional currency.
Finally, a significant amount of PMI Trading’s income and expenses, including the cost of sales and related sales costs, is derived from the trade of refined products, petrochemicals and gas liquids to our subsidiaries and third parties, whose prices are determined and are payable in U.S. dollars. PMI Trading’s exposure to foreign currency risk results primarily from the need to fund tax payments denominated in domestic currency and secondarily from the need to purchase products in domestic currency for sale in U.S. dollars in the international market, as well as certain related sales costs denominated in domestic currency.
PMI Trading believes it can adequately manage the risk created by the payment of taxes in domestic currency without the need to enter into hedging instruments because the exposure to this risk is marginal relative to the total flows of U.S. dollar. In addition, in the event that a potential foreign exchange risk arises in connection with a commercial transaction, PMI Trading may implement risk mitigation measures by entering into DFIs.
| (iii) | Hydrocarbon Price Risk |
We periodically assess our revenues and expenditures structure in order to identify the main market risk factors that our cash flows are exposed to in connection with international hydrocarbon prices. Based on this assessment, we monitor our exposure to the most significant risk factors and quantify their impact on our financial balance.
Our exports and domestic sales are directly or indirectly related to international hydrocarbon prices. Therefore, we are exposed to fluctuations in these prices. In terms of crude oil and natural gas, part of this risk is transferred to the Mexican Government under our current fiscal regime.
We continuously evaluate the implementation of risk mitigation strategies, including those involving the use of DFIs, while taking into account operational and economic constraints.
Our exposure to crude oil prices is partly mitigated by natural hedges between our inflows and outflows. During 2016, as a result of the changes in our fiscal regime, our sensitivity to crude oil prices decreased. Nonetheless, we have been working on a hedging strategy for the coming years in order to reduce our exposure to drops in crude oil price.
220
Commodity Derivatives
In April 2017, we entered into a crude oil hedge to partially protect our cash flows from a decrease in the Mexican crude oil basket price established in the Federal Revenue Law. Through this instrument, we hedged 409 thousand barrels per day from May to December 2017 for U.S. $133.5 million dollars. This hedging strategy provides PEMEX with protection when the monthly average price of the Mexican crude oil basket price is between U.S. $42 and U.S. $37 dollars per barrel, which is the likely price range for an adverse scenario.
In 2015, we entered into various swaps in order to hedge the risk arising from the variations in the propane import price. These DFIs were held over a percentage of the total imports volume, with maturity dates in 2015. Although we entered into these contracts with economic hedging purposes, for accounting purposes, these DFIs do not qualify as hedges and were recorded as trading instruments in the financial statements. During 2016 we did not enter in any propane import price swap.
In addition to supplying natural gas, Pemex Industrial Transformation offers DFIs to its domestic customers in order to provide them with support to mitigate the risk associated with the volatility of natural gas prices. Pemex Industrial Transformation enters into DFIs with Mex Gas Supply, S.L. under the opposite position to those DFIs offered to its customers in order to mitigate the market risk it bears under such offered DFIs. Mex Gas Supply, S.L. then transfers the related price risk derived from the DFI position held with Pemex Industrial Transformation to international financial counterparties by entering into these opposite position DFIs with such parties. Through the above mechanism, Pemex Industrial Transformation maintains a negligible or even null exposure to market risk. These portfolios have VaR and CaR limits in order to limit market risk exposure.
PMI Trading faces market risk generated by the terms of the purchase and sale of refined products and natural gas liquids, as well as the volatility of oil prices. Accordingly, it frequently enters into DFIs in order to mitigate this risk, thereby reducing the volatility of its financial results.
In accordance with the risk management regulatory framework that PMI Trading has implemented, VaR and the change in profit and loss by portfolio are calculated daily and compared to the maximum applicable limits in order to implement risk mitigation mechanisms as necessary.
| (iv) | Risks Related to the Portfolio of Third-Party Shares |
As of December 31, 2016, Petróleos Mexicanos does not hold any third-party shares of companies that do not report on the financial markets and, therefore, does not hold any related DFIs. On May 2014, we held a synthetic long position on 67,969,767 shares of Repsol, with the objective of maintaining corporate and economic rights over these shares. We accomplished this by using a total return swap under which we paid variable amounts and received a total return on the Repsol shares. Under these DFIs, we were entitled to any capital gains associated with the Repsol shares and agreed to cover our counterparties for any capital losses relating to those shares in reference to an exercise price, as well as to make payments at a floating interest rate. On June 3, 2014, we made an early termination of this DFI. Following this termination, Petróleos Mexicanos no longer directly participates in Repsol.
As of December 31, 2016, PMI HBV owned 22,221,893 Repsol shares and P.M.I. Holdings Petróleos España, S.L. holds one for a total of 22,221,894 shares. These shares have no related DFIs.
Counterparty or Credit Risk
When the fair value of a DFI is favorable to us, we face the risk that the counterparty will not be able to meet its obligations. We monitor our counterparties’ creditworthiness and calculate the credit risk exposure for our DFIs. As a risk mitigation strategy, we only enter into DFIs with major financial institutions with a minimum credit rating ofBBB-. These ratings are issued and revised periodically by risk rating agencies. Furthermore, we seek to maintain a diversified portfolio of counterparties.
221
In order to estimate our credit risk exposure to each financial counterparty, the potential future exposure is calculated by projecting the risk factors used in the valuation of each DFI in order to estimate the MtM value for different periods, taking into account any credit risk mitigation provisions.
Moreover, we have entered into various long-term cross-currency swaps agreements with “recouponing” provisions (pursuant to which the payments on the swaps are adjusted when the MtM exceeds the relevant threshold specified in the swap), thereby limiting our exposure with our counterparties to a specific threshold amount. The specified thresholds were reached in five cross-currency swaps from the first to the fourth quarter of 2016, which were used to hedge the exchange rate exposure to the euro and to the Pound sterling, and in nine cross-currency swaps during 2015, which were used to hedge the exchange rate exposure to the euro and the Australian dollar. This resulted in the cash settlement of such swaps and the resetting of swap terms to return theirmark-to-market value to zero. During 2016, we did not enter into any cross-currency swap with these characteristics.
In addition, during 2016 we entered into long-term DFIs with mandatory early termination clauses (pursuant to which, at a given date, and irrespective of the then current MtM, the DFI will terminate and settle at the corresponding MtM, and we can either enter into a new DFI with the same counterparty or a new counterparty) which reduces the credit risk generated by the term of the DFI by bounding it to a specific date. As of December 31, 2016, we have entered into three euro swaps and two Japanese yen Seagull Option structures, with termination clauses in 2018 and 2021, respectively.
According to IFRS 13 “Fair Value Measurement,” the fair value or MtM value of DFIs must reflect the creditworthiness of the parties. Consequently, the fair value of a DFI takes into account the risk that either party may default on its obligation. In accordance with market best practices, we apply the credit value adjustment (“CVA”) method to calculate the fair value of our DFIs.
For each DFI, the CVA is calculated by determining the difference between the MtM and the estimated MtM adjusted for credit risk. In determining the credit risk, the CVA method takes into account the current market perception about the credit risk of both counterparties, using the following inputs: (a) the MtM projection for each payment date based on forward yield curves; (b) the implied default probability obtained from both us and the counterparty’s credit default swaps, at each payment date; and (c) the default recovery rates of each counterparty.
Furthermore, by means of its credit guidelines for DFI operations, Pemex Industrial Transformation has significantly reduced its credit risk exposure related to the DFIs offered to its customers to assist them in mitigating the risk associated with the price volatility of natural gas.
In order to qualify for these DFIs, Pemex Industrial Transformation’s customers must be party to a current natural gas supply contract and sign a domestic master derivative agreement.
Additionally, beginning on October 2, 2009, DFIs with these customers must be initially secured by cash deposits, letters of credit or other collateral provisions, as required. In accordance with these guidelines, in the event that a client does not meet its payment obligations, DFIs related to this client are terminated, rights to collateral are exercised and, if the collateral is insufficient to cover the fair value, natural gas supply is suspended until the payment is made.
On August 20, 2014, certain amendments to the credit guidelines were enacted which allowedPemex-Gas and Petrochemicals, and now Pemex Industrial Transformation, to offer to its clients with an adequate credit rating, based on an internal financial and credit assessment, DFIs with an exemption from collateral requirements up to certain amount through a credit line approved by the credit committee. Moreover, if the credit line is insufficient to cover each client’s exposure, the client is obligated to deposit collateral. If a client suffers an event of default, DFIs related to this client are terminated early and natural gas supply is suspended until the payment is made.
222
PMI Trading’s credit risk associated with DFI transactions is minimized through the use of futures and standardized instruments that are cleared throughCME-Clearport.
Accounting Standards Applied and the Impact on Results
We enter into derivatives transactions with the sole purpose of hedging financial risks related to our operations, firm commitments, planned transactions and assets and liabilities recorded on our statement of financial position. Nonetheless, some of these transactions do not qualify for hedge accounting treatment because they do not meet the requirements of the accounting standards for being designated as hedges. They are therefore recorded in the financial statements asnon-hedge instruments or as instruments entered into for trading purposes, despite the fact that their cash flows are offset by the cash flows of the positions (assets or liabilities) to which they are related. As a result, the changes in their fair value are recognized in the “Derivative financial instruments (cost) income—net” line item in the consolidated statement of comprehensive income.
As of December 31, 2016 and 2015, the net fair value of our DFIs, including both DFIs that have not reached maturity and those that have reached maturity but have not been settled, recognized in our consolidated statement of financial position, was Ps. (26,010.5) million and Ps. (25,699.6) million, respectively. As of December 31, 2016 and 2015, we did not have any DFIs designated as hedges. See Note 16 to our consolidated financial statements included herein.
For the years ended December 31, 2016, 2015 and 2014, we recognized a net loss of Ps. 14,001.0, Ps. 21,449.9 million and Ps. 9,438.6 million, respectively, in the “Derivative financial instruments (cost) income, net” line item with respect to DFIs treated as instruments entered into for trading purposes.
According to established accounting policies, we have analyzed the different contracts that we have entered into and have determined that according to the terms thereof none of these agreements meet the criteria to be classified as embedded derivatives. Accordingly, as of December 31, 2016 and 2015, we did not recognize any embedded derivatives (foreign currency or index).
QUANTITATIVE DISCLOSURE
Fair Value
The following tables show our cash flow maturities as well as the fair value of our debt and DFI portfolios as of December 31, 2016. It should be noted that:
| | • | | For debt obligations, these tables present principal cash flow and the weighted average interest rates for fixed rate debt. |
| | • | | For interest rate swaps, cross-currency swaps, and currency options, these tables present notional amounts and weighted average interest rates by expected (contractual) maturity dates. |
| | • | | Weighted average variable rates are based on implied forward rates obtained from the interbank market yield curve at the reporting date. |
| | • | | For natural gas DFIs, volumes are presented in millions of British thermal units (MMBtu), and fixed average and strike prices are presented in U.S. dollars per MMBtu. |
| | • | | ADFI’s fair value includes CVA and is calculated based on market quotes obtained from market sources such as Reuters and Bloomberg. Forward curves for natural gas are supplied by the Kiodex Risk Workbench platform. |
| | • | | For PMI Trading, the prices used in commercial transactions and DFIs are published by reputable sources that are widely used in international markets, such asCME-NYMEX, Platts and Argus, among others. |
223
| | • | | Fair value is calculated internally, either by discounting cash flows with the correspondingzero-coupon yield curve in the original currency, or through other standard methodologies commonly used in financial markets for specific instruments. |
| | • | | For all instruments, the tables are based on the contract terms in order to determine the future cash flows that are categorized by expected maturity dates. |
This information is presented in thousands of pesos (except as noted).
224
*Quantitative Disclosure of Debt Cash Flow’s Maturities as of December 31, 2016(1)
| | | | | | | | | | | | | | | | | | | | | | | | | | | | | | | | |
| | | Year of expected maturity date | | | 2022
Thereafter | | | Total carrying
value | | | Fair value | |
| | | 2017 | | | 2018 | | | 2019 | | | 2020 | | | 2021 | | | | |
Liabilities | | | | | | | | | | | | | | | | | | | | | | | | | | | | | | | | |
Outstanding debt | | | | | | | | | | | | | | | | | | | | | | | | | | | | | | | | |
Fixed rate (U.S. dollars) | | | Ps. 15,759,027 | | | | Ps. 86,161,096 | | | | Ps. 65,642,616 | | | | Ps. 62,440,943 | | | | Ps. 98,858,992 | | | | Ps. 826,093,574 | | | | Ps.1,154,956,248 | | | | Ps.1,137,936,275 | |
Average interest rate (%) | | | | | | | | | | | | | | | | | | | | | | | | | | | 5.6541 | % | | | | |
| | | | | | | | |
Fixed rate (Japanese yen) | | | 517,286 | | | | — | | | | — | | | | — | | | | — | | | | 19,459,306 | | | | 19,976,592 | | | | 17,336,203 | |
Average interest rate (%) | | | | | | | | | | | | | | | | | | | | | | | | | | | 1.3665 | % | | | | |
| | | | | | | | |
Fixed rate (Pounds) | | | — | | | | — | | | | — | | | | — | | | | — | | | | 8,825,434 | | | | 8,825,434 | | | | 11,373,345 | |
Average interest rate (%) | | | | | | | | | | | | | | | | | | | | | | | | | | | 8.2500 | % | | | | |
| | | | | | | | |
Fixed rate (pesos) | | | — | | | | — | | | | — | | | | 10,048,950 | | | | 20,457,671 | | | | 90,393,507 | | | | 120,900,128 | | | | 160,930,040 | |
Average interest rate (%) | | | | | | | | | | | | | | | | | | | | | | | | | | | 7.4878 | % | | | | |
| | | | | | | | |
Fixed rate (UDIs) | | | — | | | | — | | | | 17,319,897 | | | | 4,464,787 | | | | 3,630,557 | | | | 28,288,180 | | | | 53,703,421 | | | | 50,809,979 | |
Average interest rate (%) | | | | | | | | | | | | | | | | | | | | | | | | | | | 4.0559 | % | | | | |
| | | | | | | | |
Fixed rate (euros) | | | 26,006,880 | | | | — | | | | 29,198,138 | | | | 28,061,554 | | | | — | | | | 123,886,644 | | | | 207,153,216 | | | | 216,100,006 | |
Average interest rate (%) | | | | | | | | | | | | | | | | | | | | | | | | | | | 3.9581 | % | | | | |
| | | | | | | | |
Fixed rate (Swiss Francs) | | | — | | | | 4,539,022 | | | | 6,056,338 | | | | 12,102,748 | | | | 3,031,480 | | | | — | | | | 25,729,588 | | | | 26,469,543 | |
Average interest rate (%) | | | | | | | | | | | | | | | | | | | | | | | | | | | 1.8385 | % | | | | |
| | | | | | | | |
Fixed rate (Australian dollars) | | | 2,232,195 | | | | — | | | | — | | | | — | | | | — | | | | — | | | | 2,232,195 | | | | 2,346,390 | |
Average interest rate (%) | | | — | | | | — | | | | — | | | | — | | | | — | | | | — | | | | 6.1250 | % | | | — | |
| | | | | | | | | | | | | | | | | | | | | | | | | | | | | | | | |
Total fixed rate debt | | | 44,515,388 | | | | 90,700,118 | | | | 118,216,989 | | | | 117,118,982 | | | | 125,978,700 | | | | 1,096,946,645 | | | | 1,593,476,822 | | | | 1,623,301,781 | |
| | | | | | | | | | | | | | | | | | | | | | | | | | | | | | | | |
| | | | | | | | |
Variable rate (U.S. dollars) | | | 38,811,320 | | | | 27,907,661 | | | | 15,984,547 | | | | 52,726,647 | | | | 13,366,336 | | | | 45,385,885 | | | | 194,182,396 | | | | 195,838,382 | |
Variable rate (Japanese yen) | | | — | | | | — | | | | — | | | | 11,341,440 | | | | — | | | | — | | | | 11,341,440 | | | | 11,025,531 | |
Variable rate (euros) | | | — | | | | — | | | | — | | | | — | | | | — | | | | — | | | | — | | | | — | |
Variable rate (pesos) | | | 65,024,075 | | | | 8,742,191 | | | | 28,007,709 | | | | 18,347,822 | | | | 8,468,176 | | | | 27,764,693 | | | | 156,354,666 | | | | 158,109,920 | |
| | | | | | | | | | | | | | | | | | | | | | | | | | | | | | | | |
Total variable rate debt | | | 103,835,395 | | | | 36,649,852 | | | | 43,992,256 | | | | 82,415,909 | | | | 21,834,512 | | | | 73,150,578 | | | | 361,878,502 | | | | 364,973,833 | |
| | | | | | | | | | | | | | | | | | | | | | | | | | | | | | | | |
Total debt | | | Ps. 148,350,783 | | | | Ps.127,349,970 | | | | Ps.162,209,245 | | | | Ps.199,534,891 | | | | Ps.147,813,212 | | | | Ps.1,170,097,223 | | | | Ps.1,955,355,324 | | | | Ps.1,988,275,614 | |
| | | | | | | | | | | | | | | | | | | | | | | | | | | | | | | | |
| Note: | Numbers may not total due to rounding. |
| (1) | The information in this table has been calculated using exchange rates at December 31, 2016 of: Ps. 20.664 = U.S. $1.00; Ps. 0.17721 = 1.00 Japanese yen; Ps. 25.30513 = 1.00 Pound sterling; Ps. $ 5.562883 = 1.00 UDI; Ps. 21.6724 = 1.00 euro; Ps. 20.19744= 1.00 Swiss Franc; and Ps. 14.88428 = 1.00 Australian dollar. |
Source: PEMEX.
225
Quantitative Disclosure of Cash Flow’s Maturities from Derivative Financial Instruments Held or Issued for Purposes other than Trading as of December 31, 2016(1)(2)
| | | | | | | | | | | | | | | | | | | | | | | | | | | | | | | | |
| | | Year of expected maturity date | | | Total
notional
amount | | | Fair
value(4) | |
| | | 2017 | | | 2018 | | | 2019 | | | 2020 | | | 2021 | | | 2022
Thereafter | | | |
Hedging instruments(2)(4) | | | | | | | | | | | | | | | | | | | | | | | | | | | | | | | | |
Interest rate DFIs | | | | | | | | | | | | | | | | | | | | | | | | | | | | | | | | |
Interest rate swaps (U.S. dollars) | | | | | | | | | | | | | | | | | | | | | | | | | | | | | | | | |
Variable to fixed | | | Ps.4,899,645 | | | | Ps.4,912,743 | | | | Ps.4,926,477 | | | | Ps.4,940,613 | | | | Ps. 4,894,180 | | | | Ps. 15,365,634 | | | | Ps.39,939,292 | | | | Ps.164,716 | |
Average pay rate | | | 2.76 | % | | | 2.66 | % | | | 3.35 | % | | | 3.83 | % | | | 4.04 | % | | | 4.57 | % | | | N.A. | | | | N.A. | |
Average receive rate | | | 2.95 | % | | | 2.99 | % | | | 3.03 | % | | | 3.06 | % | | | 3.11 | % | | | 3.33 | % | | | N.A. | | | | N.A. | |
Interest rate swaps (pesos) | | | | | | | | | | | | | | | | | | | | | | | | | | | | | | | | |
Variable to fixed | | | — | | | | — | | | | — | | | | — | | | | — | | | | — | | | | — | | | | — | |
Average pay rate | | | N.A. | | | | N.A. | | | | N.A. | | | | N.A. | | | | N.A. | | | | N.A. | | | | N.A. | | | | N.A. | |
Average receive rate | | | N.A. | | | | N.A. | | | | N.A. | | | | N.A. | | | | N.A. | | | | N.A. | | | | N.A. | | | | N.A. | |
Currency DFIs | | | | | | | | | | | | | | | | | | | | | | | | | | | | | | | | |
Cross-currency swaps | | | | | | | | | | | | | | | | | | | | | | | | | | | | | | | | |
Receive euros/Pay U.S. dollars | | | 34,775,198 | | | | — | | | | 31,223,821 | | | | 29,992,556 | | | | — | | | | 133,024,913 | | | | 229,016,488 | | | | (16,484,533 | ) |
Receive Japanese yen/ Pay U.S. dollars | | | 532,711 | | | | — | | | | — | | | | 17,697,534 | | | | — | | | | 4,987,289 | | | | 23,217,534 | | | | (6,132,633 | ) |
Receive Pounds sterling/ Pay U.S. dollars | | | — | | | | — | | | | — | | | | — | | | | — | | | | 10,767,349 | | | | 10,767,349 | | | | (211,207 | ) |
Receive UDI/ Pay pesos | | | — | | | | — | | | | 23,740,341 | | | | 3,540,220 | | | | 3,000,000 | | | | 14,313,198 | | | | 44,593,759 | | | | (2,132,236 | ) |
Receive Swiss francs/ Pay U.S. dollars | | | — | | | | 4,736,567 | | | | 6,789,326 | | | | 12,060,700 | | | | 3,127,139 | | | | — | | | | 26,713,732 | | | | (789,449 | ) |
Receive Australian dollars/ Pay U.S. dollars | | | 2,459,429 | | | | — | | | | — | | | | — | | | | — | | | | — | | | | 2,459,429 | | | | (126,796 | ) |
Currency Options | | | | | | | | | | | | | | | | | | | | | | | | | | | | | | | | |
Buy Put, Sell Put and sell Call on yen | | | — | | | | — | | | | — | | | | — | | | | — | | | | 14,133,580 | | | | 14,133,580 | | | | (301,131 | ) |
| Notes: | Numbers may not total due to rounding. |
N.A. = not applicable.
| (1) | The information in this table has been calculated using the exchange rate at December 31, 2016 of: Ps. 20.664 = U.S. $1.00 and Ps. 21.6724 = 1.00 euro. |
| (2) | Our management uses these DFIs to hedge market risk; however, these DFIs do not qualify for accounting purposes as hedges and are recorded in the financial statements as entered into for trading purposes. |
| (3) | Positive numbers represent a favorable fair value to us. |
| (4) | PMI’s risk management policies and procedures establish that DFIs should be used only for hedging purposes; however, DFIs are not recorded as hedges for accounting purposes. |
Source: PEMEX.
226
Quantitative Disclosure of Cash Flow’s Maturities from Derivative Financial Instruments (Natural Gas) Held or Issued for Purposes other than Trading as of December 31, 2016(1)(2)
| | | | | | | | | | | | | | | | | | | | | | | | | | | | | | | | |
| | | 2017 | | | 2018 | | | 2019 | | | 2020 | | | 2021 | | | 2022
Thereafter | | | Total
Volume | | | Fair
Value(2) | |
| | | (in MMBtu, except that average fixed and strike prices are in U.S. $ per MMBtu) | | | (in thousands
of nominal
pesos) | |
Derivatives entered into with Customers of Pemex Industrial Transformation | |
Short | | | | | | | | | | | | | | | | | | | | | | | | | | | | | | | | |
European Call Option | | | (789,475 | ) | | | (270,200 | ) | | | (13,750 | ) | | | — | | | | — | | | | — | | | | (1,073,425 | ) | | | (11,488 | ) |
Average strike price | | | 3.32 | | | | 3.29 | | | | 3.81 | | | | — | | | | — | | | | — | | | | 3.32 | | | | n.a. | |
Variable to Fixed Swap(3) | | | (1,899,650 | ) | | | (738,488 | ) | | | (62,364 | ) | | | — | | | | — | | | | — | | | | (2,700,502 | ) | | | (25,145 | ) |
Average fixed price | | | 2.89 | | | | 2.80 | | | | 2.96 | | | | — | | | | — | | | | — | | | | 2.87 | | | | n.a. | |
Long | | | | | | | | | | | | | | | | | | | | | | | | | | | | | | | | |
European Call Option | | | — | | | | — | | | | — | | | | — | | | | — | | | | — | | | | — | | | | — | |
Average strike price | | | — | | | | — | | | | — | | | | — | | | | — | | | | — | | | | — | | | | — | |
|
Derivatives entered into with Third Parties to Offset Transactions entered into with Customers | |
Short | | | | | | | | | | | | | | | | | | | | | | | | | | | | | | | | |
European Call Option | | | — | | | | — | | | | — | | | | — | | | | — | | | | — | | | | — | | | | — | |
Average strike price | | | — | | | | — | | | | — | | | | — | | | | — | | | | — | | | | — | | | | n.a. | |
Long | | | | | | | | | | | | | | | | | | | | | | | | | | | | | | | | |
European Call Option | | | 789,475 | | | | 270,200 | | | | 13,750 | | | | — | | | | — | | | | — | | | | 1,073,425 | | | | 11,548 | |
Average strike price | | | 3.32 | | | | 3.29 | | | | 3.81 | | | | — | | | | — | | | | — | | | | 3.32 | | | | n.a. | |
Variable to Fixed Swap(4) | | | 1,899,650 | | | | 738,488 | | | | 62,364 | | | | — | | | | — | | | | — | | | | 2,700,502 | | | | 27,869 | |
Average fixed price | | | 2.85 | | | | 2.75 | | | | 2.93 | | | | — | | | | — | | | | — | | | | 2.82 | | | | n.a. | |
| Notes: | Numbers may not total due to rounding. |
N.A. = not applicable.
| (1) | The information in this table has been calculated using the exchange rate at December 31, 2016 of: Ps. 20.664 = U.S. $1.00. |
| (2) | Positive numbers represent a favorable fair value to us. |
| (3) | Under short variable to fixed swaps entered into with customers of Pemex Industrial Transformation, we will pay a variable price and receive the fixed price specified in the contract. |
| (4) | Under long variable to fixed swaps entered into with customers of Pemex Industrial Transformation, we will pay the fixed price specified in the contract and receive a variable price. |
Source: Pemex Industrial Transformation
227
Quantitative Disclosure of Cash Flows’ Maturities from Derivative Financial Instruments (Petroleum Products) Held or Issued for Purposes other than Trading as of December 31, 2016(1)
| | | | | | | | | | | | | | | | | | | | | | | | | | | | | | | | |
| | | 2017 | | | 2018 | | | 2019 | | | 2020 | | | 2021 | | | 2022
Thereafter | | | Total
Volume | | | Fair
Value(2) | |
| | | | | | (in thousands of barrels) | | | (in thousands of nominal pesos) | |
Hedging Instruments | | | | | | | | | | | | | | | | | | | | | | | | | | | | | | | | |
Exchange-traded futures(3) (5) | | | — | | | | — | | | | — | | | | — | | | | — | | | | — | | | | — | | | | — | |
Exchange-traded swaps(4) (5) | | | 4.1 | | | | — | | | | — | | | | — | | | | — | | | | — | | | | 4.1 | | | | (688,016 | ) |
Note: Numbers may not total due to rounding.
| (1) | The information in this table has been calculated using the exchange rate at December 31, 2016 of: Ps. 20.664 = U.S. $1.00. |
| (2) | Positive numbers represent a favorable fair value to PMI Trading. |
| (4) | Swaps registered in CME Clearport are included in these figures. |
| (5) | The balance of these financial instruments is recognized as cash and cash equivalents. PMI Trading considered these financial assets to be fully liquid. |
Source: P.M.I. Trading, Ltd.
Sensitivity Analysis
We have entered into DFIs with the purpose to completely mitigate the market risk for specific flows or predetermined volumes associated with our operations. Our DFIs have the same characteristics (e.g. underlying assets, payment dates, amounts, or volumes) as the hedged position, but with the opposite exposure to the market risk factors. As a result of these mitigation strategies, we have a negligible sensitivity to the hedged market risk factors. See Note 16 from our consolidated financial statements included herein.
As discussed above, because our hedges are cash flow hedges, their effectiveness is maintained regardless of variations in the underlying assets or reference variables. Accordingly, over time, asset flows are fully offset by liabilities flows. Therefore, it is not necessary to measure or monitor the hedge effectiveness.
Natural gas DFIs that Pemex Industrial Transformation offers to its domestic customers are reported as transactions with trading purposes. However, such operations are fully compensated by the operations entered into with their financial counterparts through Mex Gas Supply, S.L. Through this mechanism(back-to-back), Pemex Industrial Transformation maintains a negligible or even null market risk exposure, so we do not consider it necessary to conduct either a sensitivity analysis or to measure or monitor the hedge effectiveness.
Other DFIs seek to fix hydrocarbons prices, such that the DFIs’ underlying assets are the same as those involved in the commercialization, so we do not consider it necessary to conduct either a sensitivity analysis or to measure or monitor the hedge effectiveness. Notably, the price fixing DFIs of PMI Trading (crude and oil), are classified under cash and cash equivalents for accounting purposes due to their liquidity.
| Item 12. | Description of Securities Other than Equity Securities |
Not applicable.
228
PART II
| Item 13. | Defaults, Dividend Arrearages and Delinquencies |
None.
| Item 14. | Material Modifications to the Rights of Security Holders and Use of Proceeds |
None.
| Item 15. | Controls and Procedures |
| (a) | Disclosure Controls and Procedures |
We carried out an evaluation under the supervision and with the participation of our management, including our Director General (chief executive officer) and our Chief Financial Officer, of the effectiveness of the design and operation of our disclosure controls and procedures as of December 31, 2016. There are inherent limitations to the effectiveness of any system of disclosure controls and procedures, including the possibility of human error and the circumvention or overriding of the controls and procedures. Accordingly, effective disclosure controls and procedures can provide only reasonable assurance of achieving their control objectives.
Based upon our evaluation, and because of the material weakness in internal control over financial reporting described below, our Director General and our Chief Financial Officer concluded that our disclosure controls and procedures as of December 31, 2016 were not effective to provide reasonable assurance that information required to be disclosed in the reports we filed and submit under the Exchange Act is recorded, processed, summarized and reported within the time periods specified in the SEC’s rules and forms, and that such information is accumulated and communicated to our management, including Director General and our Chief Financial Officer, as appropriate, to allow timely decisions regarding required disclosures.
| (b) | Management’s Annual Report on Internal Control over Financial Reporting |
Management is responsible for establishing and maintaining adequate internal control over financial reporting. Our internal control over financial reporting is a process designed to provide reasonable assurance regarding the reliability of financial reporting and the preparation of financial statements for external purposes in accordance with IFRS. Our internal control over financial reporting includes those policies and procedures that:
| | (1) | pertain to the maintenance of records that, in reasonable detail, accurately and fairly reflect the transactions and dispositions of our assets; |
| | (2) | provide reasonable assurance that transactions are recorded as necessary to permit preparation of financial statements in accordance with IFRS in accordance with Item 18 of Form 20-F, and that our receipts and expenditures are being made only in accordance with authorizations of management and directors of the relevant entity; and |
| | (3) | provide reasonable assurance regarding prevention or timely detection of unauthorized acquisition, use or disposition of our assets that could have a material effect on our financial statements. |
Because of its inherent limitations, internal control over financial reporting may not prevent or detect misstatements. Also, projections of any evaluation of effectiveness to future periods are subject to the risk that controls may become inadequate because of changes in conditions, or that the degree of compliance with the policies or procedures may deteriorate.
We conducted an assessment of the effectiveness of our internal controls over financial reporting as of December 31, 2016. In making this assessment, management used the criteria set for in the “Internal Control—Integrated Framework” published by the Committee of Sponsoring Organizations of the Treadway Commission
229
in 2013, supplemented for information technologies with the guidelines suggested byIT Control Objectives for Sarbanes-Oxley (3rd Edition), published by the Information Systems Audit and Control Association, which were in effect as of December 31, 2015. Management relied on Auditing Standards No. 2 and 5 of the PCAOB in order to create an appropriate framework to evaluate the effectiveness of the design and operation of our internal control over financial reporting.
Management concluded that our internal control over financial reporting was not effective as of December 31, 2016. Based on our assessment and criteria, management concluded that a material weakness existed in our internal control over financial reporting as of December 31, 2016, because, when we calculated the impairment effect at the time of our unaudited financial statements, we incorrectly assumed, for purposes of the impairment analysis of our exploration and production cash generating units, the economic landscape related to the two-year life-of-field for those fields assigned to Petróleos Mexicanos on temporary basis pursuant to Round Zero rather than 25-year life-of-field allowed by the CNH. As a result, our unaudited consolidated financial statements as of and for the year ended December 31, 2016 only reflected a net reversal of impairment in the amount of Ps. 246.3 billion. In connection with the preparation of our audited consolidated financial statements as of and for the year ended December 31, 2016, we applied the 25-year life-of-field assumption allowed by the CNH which, combined with the certified reserves data, resulted in a net reversal of impairment in the amount of Ps. 331.3 billion. Although the effect is favorable, the difference between the net reversal of impairment that we disclosed in our unaudited and audited financial statements as of and for the year ended December 31, 2016 – an amount equal to Ps. 85.0 billion—is material and reflects a failure of our internal controls to include a mechanism to ensure that the period allowed by the authorities is properly applied and that the disclosure of our unaudited results in respect of our impairment assessment is consistent with the disclosure of our audited results.
In response to the material weakness described above, we executed a remediation plan, with oversight from our audit committee which includes the following actions:
1. We are strengthening controls focused on generating adequate and timely policies related to updated regulatory criteria that may affect our financial reporting.
2. We are strengthening our procedures relating to compliance with general policies. We are designing procedures to ensure that regulatory criteria, legal aspects, business rules are disseminated in a timely manner and implemented.
3. Moreover, and in order to assist us in addressing the material weakness related to long-lived impairment calculations, we are improving our internal procedures to appropriately prepare documentation that keeps track of the process for such calculations.
We did report a material weakness in internal control over financial reporting in our Annual Report on Form 20-F for the year ended December 31, 2015, as we had not, at the relevant time, established an effective design of processes and procedures to effectively respond to the nature and magnitude of the changes in the economic landscape at such time. In particular, the sharp decline in the price of crude oil in the fourth quarter of 2015 triggered the need to test carrying amounts of our wells, pipelines, properties, plant and equipment for impairment. In performing the tests, the discount rates used were lower than those required by IFRS and those used by peers in the sector and categorized our entire refinery system as a single cash generating unit instead of viewing each refinery as an independent cash-generating unit in order to determine impairment charges with respect to our wells, pipelines, properties, plant and equipment, as required by IFRS. That resulted in an estimation of recoverable amounts of assets that did not accurately reflect operating and economic conditions as of the date of our consolidated financial statements. For the reasons set forth above, those unaudited financial statements reflected only a Ps. 229.1 billion impairment of wells, pipelines, properties, plant and equipment in 2015, Ps. 248.8 billion less than the actual impairment of Ps. 477.9 billion. In addition, at that time, our internal controls did not provide a mechanism that enabled us to ensure that our disclosure regarding our impairment evaluation and our liquidity condition complied with IFRS. In our unaudited financial statements as of and for the fiscal year ended December 31, 2015, we did not appropriately disclose the assumptions for the computation
230
of the impairment, the uncertainties about the estimates used to calculate impairment and the relevant assets impacted by the impairment and issues related to significant doubt about our ability to continue operating as a going concern in accordance with IFRS.
In response to the material weakness described above, we executed a remediation plan, with oversight from our audit committee that took the following actions:
1. We re-designed our controls, including the execution of a walkthrough of the long-lived impairment calculation process, identifying new controls in their determination. In addition we implemented new controls relating to (1) the long-lived impairment analysis, including the enhancement of the evaluation of the components of future cash flows, particularly the assumptions utilized and the comparison to the requirements of IFRS in order to allows us timely identify events that may impact the assumptions and criteria for the computation, and (2) the assessment of our ability to continue operating as a going concern and our process for making the appropriate corresponding disclosure in accordance with IFRS.
2. We have updated our internal control assessment methodology in order to enhance the design and documentation of management review controls by including new internal control elements to oversee and monitor and are verifying the appropriate design and effectiveness of the internal controls over (1) our asset impairment tests to determine the recoverable amounts of our wells, pipelines, properties, plant and equipment, review of criteria and variables for the homologation and determination of the discount rate and (2) the assessment of uncertainties regarding our ability to continue operating as a going concern and other liquidity issues.
3. We updated our oversight and monitoring program for 2016 in order to perform timely tests of the effectiveness of the internal controls in connection with our (1) asset impairment tests to determine the recoverable amounts of our wells, pipelines, properties, plant and equipment and (2) assessment of our ability to continue operating as a going concern and other liquidity issues. We completed our remediation plan and have fully established enhanced controls designed to address the material weakness for each of the quarters reported during 2016.
4. We have strengthened our internal controls to establish the process for determining impairment charges. During 2016, this resulted in an estimation of recoverable amounts that accurately reflected operating and economic conditions as of the date of our consolidated financial statements, and we have reviewed the assumptions we use to calculate impairment in order to ensure that the criteria and variables used in that calculation accurately reflect the operating and economic conditions as of the date of our calculations and will include the appropriate disclosure in accordance with IFRS.
5. We have strengthened our internal controls to properly assess each of the relevant factors that could create uncertainty as to our ability to continue operating as a going concern, our liquidity condition and corresponding disclosure.
6. Moreover, and in order to assist us in addressing the material weakness related to long-lived impairment calculation, we are preparing documentation that memorializes the process for such calculations.
| (c) | Attestation Report of the Independent Registered Public Accounting Firm |
Not applicable.
| (d) | Changes in Internal Control over Financial Reporting |
As discussed above, during 2016, we completed the design, update and strengthening of controls, procedures and assessment methodology in order to effectively respond to the nature and magnitude of the changes in the economic landscape. We have updated the internal control processes and procedures that have been affected by these activities.
231
Except for these changes, there has been no change in our internal control over financial reporting during 2016 that has materially affected, or is reasonably likely to materially affect, our internal control over financial reporting.
Item 16A. Audit Committee Financial Expert
The Board of Directors of Petróleos Mexicanos has determined that it does not have an “audit committee financial expert” within the meaning of this Item 16A serving on its Audit Committee. We believe that the combined knowledge, skills and experience of the members of the Audit Committee enable them, as a group, to act effectively in the fulfillment of their tasks and responsibilities.
In accordance with the Petróleos Mexicanos Law, we adopted a new code of ethics, as defined in Item 16B of Form20-F under the Exchange Act, which took effect on November 26, 2016 and replaced the code of ethics that had been in place since 2014. Our code of ethics applies to the members of the Boards Directors of Petróleos Mexicanos and the subsidiary entities and all of our employees, including our Director General (chief executive officer), our Chief Financial Officer, our chief accounting officer and all other employees performing similar functions, as well as other individuals and companies whose actions may affect our reputation. Our code of ethics is available on our website at http://www.pemex.com. If we amend the provisions of our Code of Ethics or if we grant any waiver of such provisions, we will disclose such amendment or waiver on our website at the same address.
| Item 16C. | Principal Accountant Fees and Services |
In its meeting held on October 24, 2016,the Board of Directors of Petróleos Mexicanos appointed BDO Mexico as external auditor of Petróleos Mexicanos, its productive state-owned subsidiaries and subsidiary companies for the fiscal year 2016 based on the proposal of the Audit Committee. See “Item 6—Directors, Senior Management and Employees—Audit Committee.”
Audit andNon-Audit Fees
The following table sets forth the aggregate fees billed to us for the fiscal years 2015 and 2016 by BDO Mexico, our independent registered public accounting firm for the years ended December 31, 2016 and 2015.
| | | | | | | | |
| | | Year ended December 31, | |
| | 2015 | | | 2016 | |
| | | (in thousands of nominal pesos) | |
Audit fees | | | Ps. 33,704 | | | | Ps. 46,587 | |
Audit-related fees | | | — | | | | — | |
Tax Fees | | | — | | | | — | |
All other fees | | | — | | | | — | |
| | | | | | | | |
Total fees | | | Ps. 33,704 | | | | Ps. 46,587 | |
| | | | | | | | |
Audit fees in the table above are the aggregate fees billed by BDO Mexico for services provided in connection with the audits of our annual financial statements in each year, statutory filings and statutory audits, filings with financial regulators, regulatory filings, limited review of interim financial information, review of public filings of financial information and reviews of documents related to offerings of securities, as well as comfort and consent letters, and services provided in accordance with the instructions of the Audit Committee.
232
Audit Committee Approval Policies and Procedures
In accordance with the Petróleos Mexicanos Law, the Audit Committee nominates the external auditor for approval by the Board of Directors of Petróleos Mexicanos and issues an opinion regarding the external auditor’s report on our financial statements. See “Item 6—Directors, Senior Management and Employees—Audit Committee.”
On December 8, 2009, the former Audit and Performance Evaluation Committee issued criteria, which have not been reviewed by the new Audit Committee, for the performance of services by the external auditor. In accordance with these criteria, the external auditor may audit the financial statements of Petróleos Mexicanos and its subsidiary entities and subsidiary companies for no more than four consecutive fiscal years as of the date these criteria were issued, except in special circumstances. An auditing firm that has performed such services may again be considered in the selection process for our external auditor after a period of at least two years since concluding such services.
Item 16D. Exemptions from the Listing Standards for Audit Committees
Not applicable.
Item 16E. Purchases of Equity Securities by the Issuer and Affiliated Purchasers
Not applicable.
Item 16F. Change in Registrant’s Certifying Accountant
Not applicable.
Item 16G. Corporate Governance
Not applicable.
Item 16H. Mine Safety Disclosure
Not applicable.
233
PART III
| Item 17. | Financial Statements |
Not applicable.
| Item 18. | Financial Statements |
See pagesF-1 throughF-146, incorporated herein by reference.
| Item 19. | Exhibits. Documents filed as exhibits to this Form20-F: |
| | |
| 1.1 | | Ley de Petróleos Mexicanos (Petróleos Mexicanos Law), effective October 7, 2014 (English translation) (previously filed as Exhibit 1.1 to Petróleos Mexicanos’ annual report on Form20-F (FileNo. 0-99) on April 30, 2015 and incorporated by reference herein). |
| |
| 1.2 | | Reglamento de la Ley de Petróleos Mexicanos(Regulations to the Petróleos Mexicanos Law), effective November 1, 2014 and as amended as of February 9, 2015 (English translation) (previously filed as Exhibit 1.2 to Petróleos Mexicanos’ annual report on Form20-F (FileNo. 0-99) on April 30, 2015 and incorporated by reference herein). |
| |
| 1.3 | | Acuerdo de Creación de la Empresa Productiva del Estado Subsidiaria de Petróleos Mexicanos, denominada Pemex Exploración y Producción(Creation Resolution of the Productive State-Owned Subsidiary of Petróleos Mexicanos, denominated Pemex Exploration and Production), effective June 1, 2015 (English translation) (previously filed as Exhibit 3.4 to the Petróleos Mexicanos Registration Statement on FormF-4 (FileNo. 333-205763) on July 21, 2015 and incorporated by reference herein). |
| |
| 1.4 | | Acuerdo de Creación de la Empresa Productiva del Estado Subsidiaria de Petróleos Mexicanos, denominada Pemex Cogeneración y Servicios(Creation Resolution of the Productive State-Owned Subsidiary of Petróleos Mexicanos, denominated Pemex Cogeneration and Services), effective June 1, 2015 (English translation) (previously filed as Exhibit 3.5 to the Petróleos Mexicanos Registration Statement on FormF-4 (FileNo. 333-205763) on July 21, 2015 and incorporated by reference herein). |
| |
| 1.5 | | Acuerdo de Creación de la Empresa Productiva del Estado Subsidiaria de Petróleos Mexicanos, denominada Pemex Perforación y Servicios(Creation Resolution of the Productive State-Owned Subsidiary of Petróleos Mexicanos, denominated Pemex Drilling and Services), effective August 1, 2015 (English translation) (previously filed as Exhibit 3.5 to Amendment No. 1 to the Petróleos Mexicanos Registration Statement on FormF-4 (FileNo. 333-205763) on February 8, 2016 and incorporated by reference herein). |
| |
| 1.6 | | Acuerdo de Creación de la Empresa Productiva del Estado Subsidiaria de Petróleos Mexicanos, denominada Pemex Logística(Creation Resolution of the Productive State-Owned Subsidiary of Petróleos Mexicanos, denominated Pemex Logistics), effective October 1, 2015 (English translation) (previously filed as Exhibit 3.6 to Amendment No. 1 to the Petróleos Mexicanos Registration Statement on FormF-4 (FileNo. 333-205763) on February 8, 2016 and incorporated by reference herein). |
| |
| 1.7 | | Acuerdo de Creación de la Empresa Productiva del Estado Subsidiaria de Petróleos Mexicanos, denominada Pemex Transformación Industrial(Creation Resolution of the Productive State-Owned Subsidiary of Petróleos Mexicanos, denominated Pemex Industrial Transformation), effective November 1, 2015 (English translation) (previously filed as Exhibit 3.7 to Amendment No. 1 to the Petróleos Mexicanos Registration Statement on FormF-4 (FileNo. 333-205763) on February 8, 2016 and incorporated by reference herein). |
234
| | |
| |
| 1.8 | | Amendment to the Creation Resolution of the Productive State-Owned Subsidiary of Petróleos Mexicanos, denominated Pemex Exploration and Production, effective April 28, 2015 (English translation) (previously filed on FormF-4 (FileNo. 333-213351) on November 30, 2016 and incorporated by reference herein). |
| |
| 2.1 | | Indenture, dated as of September 18, 1997, between Petróleos Mexicanos and Deutsche Bank Trust Company Americas (formerly known as Bankers Trust Company) (previously filed as Exhibit 4.1 to the Petróleos Mexicanos Registration Statement on FormF-4 (FileNo. 333-7796) on October 17, 1997 and incorporated by reference herein). |
| |
| 2.2 | | Indenture, dated as of August 7, 1998, between Petróleos Mexicanos and Deutsche Bank Trust Company Americas (formerly known as Bankers Trust Company) (previously filed as Exhibit 4.1 to the Petróleos Mexicanos Registration Statement on FormF-4 (FileNo. 333-9310) on August 24, 1998 and incorporated by reference herein). |
| |
| 2.3 | | Indenture, dated as of July 31, 2000, among the Pemex Project Funding Master Trust, Petróleos Mexicanos and Deutsche Bank Trust Company Americas (formerly known as Bankers Trust Company) (previously filed as Exhibit 2.5 to the Petróleos Mexicanos Annual Report on Form20-F (FileNo. 0-99) on June 28, 2001 and incorporated by reference herein). |
| |
| 2.4 | | First supplemental indenture dated as of September 30, 2009, between Petróleos Mexicanos and Deutsche Bank Trust Company Americas, to the indenture dated as of July 31, 2000 (previously filed as Exhibit 2.4 to the Petróleos Mexicanos Annual Report on Form20-F (FileNo. 0-99) on June 29, 2010 and incorporated by reference herein). |
| |
| 2.5 | | Indenture, dated as of December 30, 2004, among the Pemex Project Funding Master Trust, Petróleos Mexicanos and Deutsche Bank Trust Company Americas (previously filed as Exhibit 2.7 to Petróleos Mexicanos’ Annual Report on Form20-F (FileNo. 0-99) on June 30, 2005 and incorporated by reference herein). |
| |
| 2.6 | | First supplemental indenture dated as of September 30, 2009, between Petróleos Mexicanos and Deutsche Bank Trust Company Americas, to the indenture dated as of December 30, 2004 (previously filed as Exhibit 2.6 to the Petróleos Mexicanos Annual Report on Form20-F (FileNo. 0-99) on June 29, 2010 and incorporated by reference herein). |
| |
| 2.7 | | Indenture, dated as of January 27, 2009, between Petróleos Mexicanos and Deutsche Bank Trust Company Americas (previously filed as Exhibit 2.5 to the Petróleos Mexicanos Annual Report onForm 20-F (FileNo. 0-99) on June 30, 2009 and incorporated by reference herein). |
| |
| 2.8 | | Fiscal Agency Agreement between Petróleos Mexicanos and Deutsche Bank Trust Company Americas (formerly known as Bankers Trust Company), dated as of June 16, 1993, and amended and restated as of February 26, 1998 (previously filed as Exhibit 3.1 to the Petróleos Mexicanos Annual Report on Form20-F (FileNo. 0-99) on June 29, 2000 and incorporated by reference herein). |
| |
| 2.9 | | Trust Agreement, dated as of November 10, 1998, among The Bank of New York, The Bank of New York (Delaware) and Petróleos Mexicanos (previously filed as Exhibit 3.1 to the Petróleos Mexicanos Annual Report on Form20-F (FileNo. 0-99) on June 30, 1999 and incorporated by reference herein). |
| |
| 2.10 | | Amendment No. 1, dated as of November 17, 2004, to the Trust Agreement among The Bank of New York, The Bank of New York (Delaware) and Petróleos Mexicanos dated as of November 10, 1998 (previously filed as Exhibit 2.10 to the Petróleos Mexicanos Annual Report on Form20-F (FileNo. 0-99) on June 30, 2005 and incorporated by reference herein). |
235
| | |
| 2.11 | | Amendment No. 2, dated as of December 22, 2004, to the Trust Agreement among The Bank of New York, The Bank of New York (Delaware) and Petróleos Mexicanos dated as of November 10, 1998 (previously filed as Exhibit 2.11 to the Petróleos Mexicanos Annual Report on Form20-F (FileNo. 0-99) on June 30, 2005 and incorporated by reference herein). |
| |
| 2.12 | | Amendment No. 3, dated as of August 17, 2006, to the Trust Agreement among The Bank of New York, The Bank of New York (Delaware) and Petróleos Mexicanos dated as of November 10, 1998 (previously filed as Exhibit 3.4 to the Petróleos Mexicanos Registration Statement on FormF-4/A (FileNo. 333-136674) on October 27, 2006 and incorporated by reference herein). |
| |
| 2.13 | | Assignment and Indemnity Agreement, dated as of November 10, 1998, among Petróleos Mexicanos, Pemex-Exploración y Producción, Pemex-Refinación,Pemex-Gas y Petroquímica Básica and the Pemex Project Funding Master Trust (previously filed as Exhibit 3.2 to the Petróleos Mexicanos Annual Report on Form20-F (FileNo. 0-99) on June 30, 1999 and incorporated by reference herein). |
| |
| 2.14 | | Amendment No. 1, dated as of August 17, 2006, to the Assignment and Indemnity Agreement among Petróleos Mexicanos, Pemex-Exploración y Producción, Pemex-Refinación,Pemex-Gas y Petroquímica Básica, Pemex-Petroquímica, and the Pemex Project Funding Master Trust dated as of November 10, 1998 (previously filed as Exhibit 4.7 to the Petróleos Mexicanos Registration Statement on FormF-4/A (FileNo. 333-136674-04) on October 27, 2006 and incorporated by reference herein). |
| |
| 2.15 | | Guaranty Agreement, dated July 29, 1996, among Petróleos Mexicanos, Pemex-Exploración y Producción, Pemex-Refinación andPemex-Gas y Petroquímica Básica (previously filed as Exhibit 4.4 to the Petróleos Mexicanos Registration Statement on FormF-4 (FileNo. 333-7796) on October 17, 1997 and incorporated by reference herein). |
| |
| 2.16 | | Amendment Agreement dated as of June 24, 2014, between Petróleos Mexicanos and Deutsche Bank Trust Company Americas, amending the terms and conditions of the Petróleos Mexicanos 8.625% Bonds due 2023 issued pursuant to the Fiscal Agency Agreement between Petróleos Mexicanos and Deutsche Bank Trust Company (as amended and restated) (previously filed as Exhibit 4.9 to the Petróleos Mexicanos Registration Statement on FormF-4 (FileNo. 333-198588) on September 5, 2014 and incorporated by reference herein). |
| |
| 2.17 | | First supplemental indenture dated as of June 24, 2014, between Petróleos Mexicanos and Deutsche Bank Trust Company Americas, to the indenture dated as of September 18, 1997 (previously filed as Exhibit 4.10 to the Petróleos Mexicanos Registration Statement on FormF-4 (FileNo. 333-198588) on September 5, 2014 and incorporated by reference herein). |
| |
| 2.18 | | First supplemental indenture dated as of June 24, 2014, between Petróleos Mexicanos and Deutsche Bank Trust Company Americas, to the indenture dated as of August 7, 1998 (previously filed as Exhibit 4.11 to the Petróleos Mexicanos Registration Statement on FormF-4 (FileNo. 333-198588) on September 5, 2014 and incorporated by reference herein). |
| |
| 2.19 | | Second supplemental indenture dated as of June 24, 2014, between Petróleos Mexicanos and Deutsche Bank Trust Company Americas, to the indenture dated as of July 31, 2000 (previously filed as Exhibit 4.12 to the Petróleos Mexicanos Registration Statement on FormF-4 (FileNo. 333-198588) on September 5, 2014 and incorporated by reference herein). |
| |
| 2.20 | | Second supplemental indenture dated as of June 24, 2014, between Petróleos Mexicanos and Deutsche Bank Trust Company Americas, to the indenture dated as of December 30, 2004 (previously filed as Exhibit 4.13 to the Petróleos Mexicanos Registration Statement on FormF-4 (FileNo. 333-198588) on September 5, 2014 and incorporated by reference herein). |
| |
| 2.21 | | Fourth supplemental indenture dated as of June 24, 2014, between Petróleos Mexicanos and Deutsche Bank Trust Company Americas, to the indenture dated as of January 27, 2009 (previously filed as Exhibit 4.14 to the Petróleos Mexicanos Registration Statement on FormF-4 (FileNo. 333-198588) on September 5, 2014 and incorporated by reference herein). |
236
| | |
| 2.22 | | Third supplemental indenture dated as of September 10, 2014, between Petróleos Mexicanos and Deutsche Bank Trust Company Americas, to the indenture dated as of July 31, 2000 (previously filed as Exhibit 2.22 to Petróleos Mexicanos’ annual report on Form20-F (FileNo. 0-99) on April 30, 2015 and incorporated by reference herein). |
| |
| 2.23 | | Fifth supplemental indenture dated as of October 15, 2014, between Petróleos Mexicanos and Deutsche Bank Trust Company Americas, to the indenture dated as of January 27, 2009 previously filed as Exhibit 2.23 to Petróleos Mexicanos’ annual report on Form20-F (FileNo. 0-99) on April 30, 2015 and incorporated by reference herein). |
| |
| 2.24 | | Sixth supplemental indenture dated as of December 8, 2015 between Petróleos Mexicanos and Deutsche Bank Trust Company Americas, to the indenture dated as of January 27, 2009 (previously filed as Exhibit 4.17 to Amendment No. 1 to the Petróleos Mexicanos Registration Statement on FormF-4 (FileNo. 333-205763) on February 8, 2016 and incorporated by reference herein). |
| |
| 2.25 | | Seventh supplemental indenture dated as of June 14, 2016 between Petróleos Mexicanos and Deutsche Bank Trust Company Americas, to the indenture dated as of January 27, 2009 (previously filed as Exhibit 4.18 to Amendment No. 1 to the Petróleos Mexicanos Registration Statement on FormF-4 (FileNo. 333-213351) on August 26, 2016 and incorporated by reference herein). |
The registrant agrees to furnish to the U.S. Securities and Exchange Commission, upon request, copies of any instruments that define the rights of holders of long-term debt of the registrant that are not filed as exhibits to this report.
| | |
| 4.1 | | Receivables Purchase Agreement, dated as of December 1, 1998, by and among Pemex Finance, Ltd., P.M.I. Comercio Internacional, S.A. de C.V., P.M.I. Services, B.V. and Pemex-Exploración y Producción. (previously filed as Exhibit 3.3 to the Petróleos Mexicanos Annual Report on Form20-F (FileNo. 0-99) on June 30, 1999 and incorporated by reference herein). |
| |
| 7.1 | | Computation of Ratio of Earnings to Fixed Charges. |
| |
| 8.1 | | For a list of subsidiaries, their jurisdiction of incorporation and the names under which they do business, see “Consolidated Structure of PEMEX” on page 4. |
| |
| 10.1 | | Consent letters of Ryder Scott Company, L.P. |
| |
| 10.2 | | Reports on Reserves Data by Ryder Scott Company, L.P., Independent Qualified Reserves Evaluator or Auditor, as of December 31, 2016. |
| |
| 10.3 | | Consent letters of Netherland, Sewell International, S. de R.L. de C.V. |
| |
| 10.4 | | Reports on Reserves Data by Netherland, Sewell International, S. de R.L. de C.V., Independent Qualified Reserves Evaluator or Auditor, as of January 1, 2017. |
| |
| 10.5 | | Consent letters of DeGolyer and MacNaughton. |
| |
| 10.6 | | Reports on Reserves Data by DeGolyer and MacNaughton, Independent Qualified Reserves Evaluator or Auditor, as of January 1, 2017. |
| |
| 12.1 | | CEO Certification pursuant toRule 13a-14(a)/15d-14(a). |
| |
| 12.2 | | CFO Certification pursuant toRule 13a-14(a)/15d-14(a). |
| |
| 13.1 | | Certification pursuant toRule 13a-14(b)/15d-14(b) and 18 U.S.C. §1350. |
237
SIGNATURE
Pursuant to the requirements of Section 12 of the Securities Exchange Act of 1934, as amended, the registrant hereby certifies that it meets all of the requirements for filing on Form 20-F and has duly caused and authorized the undersigned to sign this annual report on its behalf.
| | |
| PETRÓLEOS MEXICANOS |
| |
| By: | | /S/ JUAN PABLO NEWMAN AGUILAR |
| | Name: Juan Pablo Newman Aguilar Title: Chief Financial Officer |
Date: April 28, 2017
PETRÓLEOS MEXICANOS, PRODUCTIVE STATE-OWNED SUBSIDIARIES
AND SUBSIDIARY COMPANIES
CONSOLIDATED FINANCIAL STATEMENTS
DECEMBER 31, 2016, 2015 AND 2014 AND REPORT OF INDEPENDENT REGISTERED PUBLIC
ACCOUNTING FIRM
PETRÓLEOS MEXICANOS, PRODUCTIVE STATE-OWNED SUBSIDIARIES
AND SUBSIDIARY COMPANIES
CONSOLIDATED FINANCIAL STATEMENTS
DECEMBER 31, 2016, 2015 AND 2014
Index
REPORT OF INDEPENDENT REGISTERED PUBLIC ACCOUNTING FIRM
To the Board of Directors of
Petróleos Mexicanos:
We have audited the accompanying consolidated statements of financial position of Petróleos Mexicanos, Productive State-Owned Subsidiaries and Subsidiary Companies (“PEMEX”) as of December 31, 2016 and 2015, and the related consolidated statements of comprehensive income, changes in equity (deficit), and cash flows for each of the three years in the period ended December 31, 2016. These consolidated financial statements are the responsibility of PEMEX’s management. Our responsibility is to express an opinion on these consolidated financial statements based on our audits.
We conducted our audits in accordance with the standards of the Public Company Accounting Oversight Board (United States). Those standards require that we plan and perform the audit to obtain reasonable assurance about whether the financial statements are free of material misstatement. PEMEX is not required to have, nor were we engaged to perform, an audit of its internal control over financial reporting. Our audits included consideration of internal control over financial reporting as a basis for designing audit procedures that are appropriate in the circumstances, but not for the purpose of expressing an opinion on the effectiveness of PEMEX’s internal control over financial reporting. Accordingly, we express no such opinion. An audit also includes examining, on a test basis, evidence supporting the amounts and disclosures in the consolidated financial statements, assessing the accounting principles used and significant estimates made by management, as well as evaluating the overall presentation of the consolidated financial statements. We believe that our audits provide a reasonable basis for our opinion.
In our opinion, the consolidated financial statements referred to above present fairly, in all material respects, the financial position of Petróleos Mexicanos, Productive State-Owned Subsidiaries and Subsidiary Companies as of December 31, 2016 and 2015, and the consolidated results of their operations and their cash flows for each of the three years in the period ended December 31, 2016, in conformity with International Financial Reporting Standards as issued by the International Accounting Standards Board.
The accompanying consolidated financial statements have been prepared assuming that PEMEX will continue as a going concern. As described in Note 2-b to the consolidated financial statements, PEMEX has suffered recurring losses from operations, has a negative cash flows from operating activities and has a working capital deficiency and a net equity deficit. As stated in Note 2-b, these events or conditions, along with other matters as set forth in such Note, indicate that a material uncertainty exists that may cast significant doubt on the PEMEX’s ability to continue as a going concern. Management’s plans in regard to these matters are also described in Note 2-b. The consolidated financial statements do not include any adjustments that might result from the outcome of this uncertainty.
|
| CASTILLO MIRANDA Y COMPAÑÍA, S. C. |
|
| /s/ BERNARDO SOTO PEÑAFIEL |
| C.P.C. Bernardo Soto Peñafiel |
Mexico City,
April 28, 2017
F-2
PETRÓLEOS MEXICANOS, PRODUCTIVE STATE-OWNED SUBSIDIARIES
AND SUBSIDIARY COMPANIES
CONSOLIDATED STATEMENTS OF FINANCIAL POSITION
AS OF DECEMBER 31, 2016 AND 2015
(FIGURES STATED IN THOUSANDS, EXCEPT AS NOTED)
| | | | | | | | | | | | | | | | |
| | | Note | | | December 31,
2016 | | | December 31,
2016 | | | December 31,
2015 | |
| | | | | | (Unaudited;
U.S. dollars) | | | | | | | |
ASSETS | | | | | | | | | | | | | | | | |
Current assets: | | | | | | | | | | | | | | | | |
Cash and cash equivalents | | | 6 | | | U.S. $ | 7,913,885 | | | Ps. | 163,532,513 | | | Ps. | 109,368,880 | |
Accounts receivable, net | | | 7 | | | | 6,446,986 | | | | 133,220,527 | | | | 79,245,821 | |
Inventories, net | | | 8 | | | | 2,220,870 | | | | 45,892,060 | | | | 43,770,928 | |
Held-for-sale current non-financial assets | | | 9 | | | | 361,047 | | | | 7,460,674 | | | | 33,213,762 | |
Available-for-sale financial assets | | | 10 | | | | 21,078 | | | | 435,556 | | | | — | |
Derivative financial instruments | | | 16 | | | | 235,069 | | | | 4,857,470 | | | | 1,601,106 | |
| | | | | | | | | | | | | | | | |
Total current assets | | | | | | | 17,198,935 | | | | 355,398,800 | | | | 267,200,497 | |
| | | | | | | | | | | | | | | | |
Non-current assets: | | | | | | | | | | | | | | | | |
Available-for-sale financial assets | | | 10 | | | | 291,693 | | | | 6,027,540 | | | | 3,944,696 | |
Permanent investments in associates and other | | | 11 | | | | 1,120,530 | | | | 23,154,632 | | | | 24,165,599 | |
Wells, pipelines, properties, plant and equipment, net | | | 12 | | | | 80,707,619 | | | | 1,667,742,248 | | | | 1,344,483,631 | |
Long-term notes receivable | | | 14 | | | | 7,191,618 | | | | 148,607,602 | | | | 50,000,000 | |
Deferred taxes | | | 20 | | | | 4,855,047 | | | | 100,324,689 | | | | 54,900,384 | |
Restricted cash | | | 6 | | | | 507,096 | | | | 10,478,626 | | | | 9,246,772 | |
Intangible assets | | | 13 | | | | 418,082 | | | | 8,639,242 | | | | 14,304,961 | |
Other assets | | | 14 | | | | 460,349 | | | | 9,512,645 | | | | 7,407,660 | |
| | | | | | | | | | | | | | | | |
Totalnon-current assets | | | | | | | 95,552,034 | | | | 1,974,487,224 | | | | 1,508,453,703 | |
| | | | | | | | | | | | | | | | |
Total assets | | | | | | U.S. $ | 112,750,969 | | | | Ps. 2,329,886,024 | | | | Ps. 1,775,654,200 | |
| | | | | | | | | | | | | | | | |
LIABILITIES | | | | | | | | | | | | | | | | |
Current liabilities: | | | | | | | | | | | | | | | | |
Short-term debt and current portion of long-term debt | | | 15 | | | U.S. $ | 8,525,270 | | | | Ps. 176,166,188 | | | | Ps. 192,508,668 | |
Suppliers | | | | | | | 7,338,828 | | | | 151,649,540 | | | | 167,314,243 | |
Taxes and duties payable | | | 20 | | | | 2,363,511 | | | | 48,839,595 | | | | 43,046,716 | |
Accounts and accrued expenses payable | | | | | | | 903,339 | | | | 18,666,607 | | | | 13,237,407 | |
Derivative financial instruments | | | 16 | | | | 1,493,804 | | | | 30,867,956 | | | | 27,300,687 | |
| | | | | | | | | | | | | | | | |
Total current liabilities | | | | | | | 20,624,752 | | | | 426,189,886 | | | | 443,407,721 | |
| | | | | | | | | | | | | | | | |
Long-term liabilities: | | | | | | | | | | | | | | | | |
Long-term debt | | | 15 | | | | 87,446,987 | | | | 1,807,004,542 | | | | 1,300,873,167 | |
Employee benefits | | | 17 | | | | 59,059,690 | | | | 1,220,409,436 | | | | 1,279,385,441 | |
Provisions for sundry creditors | | | 18 | | | | 4,273,997 | | | | 88,317,878 | | | | 73,191,796 | |
Other liabilities | | | | | | | 814,844 | | | | 16,837,893 | | | | 8,288,139 | |
Deferred taxes | | | 20 | | | | 200,084 | | | | 4,134,536 | | | | 2,183,834 | |
| | | | | | | | | | | | | | | | |
Total long-term liabilities | | | | | | | 151,795,602 | | | | 3,136,704,285 | | | | 2,663,922,377 | |
| | | | | | | | | | | | | | | | |
Total liabilities | | | | | | U.S. $ | 172,420,354 | | | | Ps. 3,562,894,171 | | | | Ps. 3,107,330,098 | |
| | | | | | | | | | | | | | | | |
EQUITY (DEFICIT), NET | | | 21 | | | | | | | | | | | | | |
Controlling interest: | | | | | | | | | | | | | | | | |
Certificates of Contribution “A” | | | | | | | 17,254,377 | | | | 356,544,447 | | | | 194,604,835 | |
Mexican Government contributions | | | | | | | 2,116,269 | | | | 43,730,591 | | | | 43,730,591 | |
Legal reserve | | | | | | | 48,496 | | | | 1,002,130 | | | | 1,002,130 | |
Accumulated other comprehensive result | | | | | | | (7,907,445 | ) | | | (163,399,441 | ) | | | (306,022,973 | ) |
Accumulated deficit: | | | | | | | | | | | | | | | | |
From prior years | | | | | | | (61,953,977 | ) | | | (1,280,216,973 | ) | | | (552,808,762 | ) |
Net loss for the year | | | | | | | (9,274,371 | ) | | | (191,645,606 | ) | | | (712,434,997 | ) |
| | | | | | | | | | | | | | | | |
Total controlling interest | | | | | | | (59,716,651 | ) | | | (1,233,984,852 | ) | | | (1,331,929,176 | ) |
Totalnon-controlling interest | | | | | | | 47,266 | | | | 976,705 | | | | 253,278 | |
| | | | | | | | | | | | | | | | |
Total equity (deficit), net | | | | | | U.S. $ | (59,669,385 | ) | | | (1,233,008,147 | ) | | | (1,331,675,898 | ) |
| | | | | | | | | | | | | | | | |
Total liabilities and equity (deficit), net | | | | | | U.S. $ | 112,750,969 | | | | Ps. 2,329,886,024 | | | | Ps. 1,775,654,200 | |
| | | | | | | | | | | | | | | | |
The accompanying notes are an integral part of these consolidated financial statements.
F-3
PETRÓLEOS MEXICANOS, PRODUCTIVE STATE-OWNED SUBSIDIARIES
AND SUBSIDIARY COMPANIES
CONSOLIDATED STATEMENTS OF COMPREHENSIVE INCOME
FOR THE YEARS ENDED DECEMBER 31, 2016, 2015 AND 2014
(Figures stated in thousands, except as noted)
| | | | | | | | | | | | | | | | | | | | |
| | | Note | | | 2016 | | | 2016 | | | 2015 | | | 2014 | |
| | | | | | (Unaudited; U.S.
dollars) | | | | | | | | | | |
Net sales: | | | | | | | | | | | | | | | | | | | | |
Domestic | | | 5 | | | U.S. $ | 32,423,561 | | | Ps. | 670,000,473 | | | Ps. | 746,235,912 | | | Ps. | 944,997,979 | |
Export | | | 5 | | | | 19,121,086 | | | | 395,118,117 | | | | 407,214,445 | | | | 630,291,313 | |
Services income | | | 5 | | | | 698,175 | | | | 14,427,081 | | | | 12,912,112 | | | | 11,438,582 | |
| | | | | | | | | | | | | | | | | | | | |
Total of sales | | | | | | | 52,242,822 | | | | 1,079,545,671 | | | | 1,166,362,469 | | | | 1,586,727,874 | |
(Reversal) Impairment of wells, pipelines, properties, plant and equipment | | | 12-d | | | | (16,033,408 | ) | | | ( 331,314,343 | ) | | | 477,944,690 | | | | 22,645,696 | |
Benefit from change in pension plan | | | 17 | | | | — | | | | — | | | | (92,177,089 | ) | | | — | |
Cost of sales | | | | | | | 41,985,126 | | | | 867,580,634 | | | | 895,068,904 | | | | 842,634,784 | |
| | | | | | | | | | | | | | | | | | | | |
Gross income (loss) | | | | | | | 26,291,104 | | | | 543,279,380 | | | | (114,474,036 | ) | | | 721,447,394 | |
Other revenues (expenses), net | | | 22 | | | | 917,324 | | | | 18,955,580 | | | | (2,373,266 | ) | | | 37,552,397 | |
General expenses: | | | | | | | | | | | | | | | | | | | | |
Distribution, transportation and sale expenses | | | | | | | 1,221,024 | | | | 25,231,240 | | | | 28,928,639 | | | | 32,182,666 | |
Administrative expenses | | | | | | | 5,451,681 | | | | 112,653,533 | | | | 112,472,095 | | | | 111,337,114 | |
Benefit from change in pension plan | | | 17 | | | | | | | | — | | | | (103,860,955 | ) | | | — | |
| | | | | | | | | | | | | | | | | | | | |
Operating income (loss) | | | | | | | 20,535,723 | | | | 424,350,187 | | | | (154,387,081 | ) | | | 615,480,011 | |
| | | | | | | | | | | | | | | | | | | | |
Financing income1 | | | | | | | 665,372 | | | | 13,749,255 | | | | 14,990,859 | | | | 3,014,187 | |
Financing cost2 | | | | | | | (4,783,414 | ) | | | (98,844,464 | ) | | | (67,773,593 | ) | | | (51,559,060 | ) |
Derivative financial instruments cost, net | | | 16 | | | | (677,555 | ) | | | (14,000,987 | ) | | | (21,449,877 | ) | | | (9,438,570 | ) |
Foreign exchange loss, net | | | 16 | | | | (12,292,525 | ) | | | (254,012,743 | ) | | | (154,765,574 | ) | | | (76,999,161 | ) |
| | | | | | | | | | | | | | | | | | | | |
| | | | | | | (17,088,122 | ) | | | (353,108,939 | ) | | | (228,998,185 | ) | | | (134,982,604 | ) |
Profit sharing in associates and other, net | | | 11 | | | | 103,361 | | | | 2,135,845 | | | | 2,318,115 | | | | 34,368 | |
| | | | | | | | | | | | | | | | | | | | |
Income(loss) before duties, taxes and other | | | | | | | 3,550,962 | | | | 73,377,093 | | | | (381,067,151 | ) | | | 480,531,775 | |
| | | | | | | | | | | | | | | | | | | | |
Hydrocarbon extraction duties and others | | | 20 | | | | 14,750,938 | | | | 304,813,375 | | | | 377,087,514 | | | | 760,912,095 | |
Income tax | | | 20 | | | | (1,949,862 | ) | | | (40,291,940 | ) | | | (45,587,267 | ) | | | (14,837,331 | ) |
| | | | | | | | | | | | | | | | | | | | |
Total duties, taxes and other | | | | | | | 12,801,076 | | | | 264,521,435 | | | | 331,500,247 | | | | 746,074,764 | |
| | | | | | | | | | | | | | | | | | | | |
Net loss | | | | | | | (9,250,114 | ) | | | (191,144,342 | ) | | | (712,567,398 | ) | | | (265,542,989 | ) |
| | | | | | | | | | | | | | | | | | | | |
Other comprehensive results: | | | | | | | | | | | | | | | | | | | | |
Items that will be reclassified subsequently to profit or loss: | | | | | | | | | | | | | | | | | | | | |
Available-for-sale financial assets | | | 10 | | | | 10,057 | | | | 207,817 | | | | (3,206,316 | ) | | | (765,412 | ) |
Currency translation effect | | | 19 | | | | 1,034,984 | | | | 21,386,903 | | | | 13,262,101 | | | | 11,379,657 | |
Items that will not be reclassified subsequently to profit or loss: | | | | | | | | | | | | | | | | | | | | |
Actuarial gains (losses) — employee benefits | | | 17 | | | | 5,143,136 | | | | 106,277,761 | | | | 78,556,569 | | | | (275,962,370 | ) |
| | | | | | | | | | | | | | | | | | | | |
Total other comprehensive results | | | | | | | 6,188,177 | | | | 127,872,481 | | | | 88,612,354 | | | | (265,348,125 | ) |
| | | | | | | | | | | | | | | | | | | | |
Total comprehensive loss | | | | | | U.S. $ | (3,061,937 | ) | | Ps. | (63,271,861 | ) | | Ps. | (623,955,044 | ) | | Ps. | (530,891,114 | ) |
| | | | | | | | | | | | | | | | | | | | |
Net loss attributable to: | | | | | | | | | | | | | | | | | | | | |
Controlling interest | | | | | | U.S. $ | (9,274,371 | ) | | Ps. | (191,645,606 | ) | | Ps. | (712,434,997 | ) | | Ps. | (265,203,213 | ) |
Non-controlling interest | | | | | | | 24,258 | | | | 501,264 | | | | (132,401 | ) | | | (339,776 | ) |
| | | | | | | | | | | | | | | | | | | | |
Net loss | | | | | | U.S. $ | (9,250,113 | ) | | Ps. | (191,144,342 | ) | | Ps. | (712,567,398 | ) | | Ps. | (265,542,989 | ) |
| | | | | | | | | | | | | | | | | | | | |
Other comprehensive results attributable to: | | | | | | | | | | | | | | | | | | | | |
Controlling interest | | | | | | U.S. $ | 6,177,425 | | | Ps. | 127,650,318 | | | Ps. | 88,571,493 | | | Ps. | (265,528,837 | ) |
Non-controlling interest | | | | | | | 10,751 | | | | 222,163 | | | | 40,861 | | | | 180,712 | |
| | | | | | | | | | | | | | | | | | | | |
Total other comprehensive results | | | | | | U.S. $ | 6,188,176 | | | Ps. | 127,872,481 | | | Ps. | 88,612,354 | | | Ps. | (265,348,125 | ) |
| | | | | | | | | | | | | | | | | | | | |
Comprehensive (loss) income: | | | | | | | | | | | | | | | | | | | | |
Controlling interest | | | | | | U.S. $ | (3,096,946 | ) | | Ps. | (63,995,288 | ) | | Ps. | (623,863,504 | ) | | Ps. | (530,732,050 | ) |
Non-controlling interest | | | | | | | 35,009 | | | | 723,427 | | | | (91,540 | ) | | | (159,064 | ) |
| | | | | | | | | | | | | | | | | | | | |
Total comprehensive loss | | | | | | U.S. $ | (3,061,937 | ) | | Ps. | (63,271,861 | ) | | Ps. | (623,955,044 | ) | | Ps. | (530,891,114 | ) |
| | | | | | | | | | | | | | | | | | | | |
The accompanying notes are an integral part of these consolidated financial statements.
| 1 | Includes financing income from investments and gain on discount rate of plugging of wells in 2016, 2015 and 2014. |
| 2 | Mainly interest on debt. |
F-4
PETRÓLEOS MEXICANOS, PRODUCTIVE STATE-OWNED SUBSIDIARIES
AND SUBSIDIARY COMPANIES
CONSOLIDATED STATEMENTS OF CHANGES IN EQUITY (DEFICIT), NET
FOR THE YEARS ENDED DECEMBER 31, 2016, 2015 AND 2014
(Figures stated in thousands, except as noted)
(See Note 21)
| | | | | | | | | | | | | | | | | | | | | | | | | | | | | | | | | | | | | | | | | | | | |
| | | Controlling interest | | | | | | | |
| | | | | | | | | | | | Accumulated other comprehensive income (loss) | | | Accumulated deficit | | | Total | | | Non
controlling
interest | | | Total Equity
(deficit), net | |
| | | Certificates
of
Contribution “A” | | | Mexican
Government
contributions | | | Legal reserve | | | Available-
for sale
financial
assets | | | Cumulative
currency
translation
effect | | | Actuarial
(losses) gains
on employee
benefits effect | | | For the
year | | | From prior
years | | | | |
Balances as of January 1, 2014 | | Ps. | 114,604,835 | | | Ps. | 115,313,691 | | | Ps. | 1,002,130 | | | Ps. | (1,800,219 | ) | | Ps. | 5,127,480 | | | Ps. | (132,392,890 | ) | | Ps. | — | | | Ps. | (287,605,549 | ) | | Ps. | (185,750,522 | ) | | Ps. | 503,882 | | | | (185,246,640 | ) |
Increase in Certificates of Contribution “A” | | | 20,000,000 | | | | — | | | | — | | | | — | | | | — | | | | — | | | | — | | | | — | | | | 20,000,000 | | | | — | | | | 20,000,000 | |
Increase in Mexican Government Contributions | | | — | | | | 2,000,000 | | | | — | | | | — | | | | — | | | | — | | | | — | | | | — | | | | 2,000,000 | | | | — | | | | 2,000,000 | |
Decrease in Mexican Government Contributions | | | — | | | | (73,583,100 | ) | | | — | | | | — | | | | — | | | | — | | | | — | | | | — | | | | (73,583,100 | ) | | | — | | | | (73,583,100 | ) |
Total comprehensive income (loss) | | | — | | | | — | | | | — | | | | (765,412 | ) | | | 11,192,953 | | | | (275,956,378 | ) | | | (265,203,213 | ) | | | — | | | | (530,732,050 | ) | | | (159,064 | ) | | | (530,891,114 | ) |
| | | | | | | | | | | | | | | | | | | | | | | | | | | | | | | | | | | | | | | | | | | | |
Balances as of December 31, 2014 | | Ps. | 134,604,835 | | | Ps. | 43,730,591 | | | Ps. | 1,002,130 | | | Ps. | (2,565,631 | ) | | Ps. | 16,320,433 | | | Ps. | (408,349,268 | ) | | Ps. | (265,203,213 | ) | | Ps. | (287,605,549 | ) | | Ps. | (768,065,672 | ) | | Ps. | 344,818 | | | | (767,720,854 | ) |
Transfer to accumulated deficit | | | — | | | | — | | | | — | | | | — | | | | — | | | | — | | | | 265,203,213 | | | | (265,203,213 | ) | | | — | | | | — | | | | — | |
Increase in Certificates of Contribution “A” | | | 60,000,000 | | | | — | | | | — | | | | — | | | | — | | | | — | | | | — | | | | — | | | | 60,000,000 | | | | — | | | | 60,000,000 | |
Total comprehensive income (loss) | | | — | | | | — | | | | — | | | | (3,206,316 | ) | | | 13,229,927 | | | | 78,547,882 | | | | (712,434,997 | ) | | | — | | | | (623,863,504 | ) | | | (91,540 | ) | | | (623,955,044 | ) |
| | | | | | | | | | | | | | | | | | | | | | | | | | | | | | | | | | | | | | | | | | | | |
Balances as of December 31, 2015 | | Ps. | 194,604,835 | | | Ps. | 43,730,591 | | | Ps. | 1,002,130 | | | Ps. | (5,771,947 | ) | | Ps. | 29,550,360 | | | Ps. | (329,801,386 | ) | | Ps. | (712,434,997 | ) | | Ps. | (552,808,762 | ) | | Ps. | (1,331,929,176 | ) | | Ps. | 253,278 | | | Ps. | (1,331,675,898 | ) |
Transfer to accumulated deficit | | | — | | | | — | | | | — | | | | — | | | | — | | | | — | | | | 712,434,997 | | | | (712,434,997 | ) | | | — | | | | — | | | | — | |
Increase in Certificates of Contribution “A” | | | 161,939,612 | | | | — | | | | — | | | | — | | | | — | | | | — | | | | — | | | | — | | | | 161,939,612 | | | | — | | | | 161,939,612 | |
Reclassification of other comprehensive income | | | — | | | | — | | | | — | | | | — | | | | — | | | | 14,973,214 | | | | — | | | | (14,973,214 | ) | | | — | | | | — | | | | | |
Total comprehensive income (loss) | | | — | | | | — | | | | — | | | | 207,817 | | | | 21,169,662 | | | | 106,272,839 | | | | ( 191,645,606 | ) | | | — | | | | ( 63,995,288 | ) | | | 723,427 | | | | ( 63,271,861 | ) |
| | | | | | | | | | | | | | | | | | | | | | | | | | | | | | | | | | | | | | | | | | | | |
Balances as of December 31, 2016 | | Ps. | 356,544,447 | | | Ps. | 43,730,591 | | | Ps. | 1,002,130 | | | Ps. | (5,564,130 | ) | | Ps. | 50,720,022 | | | Ps. | (208,555,333 | ) | | Ps. | (191,645,606 | ) | | Ps. | (1,280,216,973 | ) | | Ps. | ( 1,233,984,852 | ) | | Ps. | 976,705 | | | Ps. | (1,233,008,147 | ) |
| | | | | | | | | | | | | | | | | | | | | | | | | | | | | | | | | | | | | | | | | | | | |
Balances as of December 31, 2016 (Unaudited U.S. dollars) | | U.S.$ | 17,254,377 | | | U.S.$ | 2,116,269 | | | U.S.$ | 48,496 | | | U.S.$ | (269,267) | | | U.S.$ | 2,454,512 | | | U.S.$ | (10,092,690) | | | U.S.$ | (9,274,371 | ) | | U.S.$ | (61,953,977 | ) | | U.S.$ | (59,716,651 | ) | | U.S.$ | 47,266 | | | U.S.$ | (59,669,385) | |
| | | | | | | | | | | | | | | | | | | | | | | | | | | | | | | | | | | | | | | | | | | | |
The accompanying notes are an integral part of these consolidated financial statements.
F-5
PETRÓLEOS MEXICANOS, PRODUCTIVE STATE-OWNED SUBSIDIARIES
AND SUBSIDIARY COMPANIES
CONSOLIDATED STATEMENTS OF CASH FLOWS
FOR THE YEARS ENDED DECEMBER 31, 2016, 2015 AND 2014
(Figures stated in thousands, except as noted)
| | | | | | | | | | | | | | | | |
| | | 2016 | | | 2016 | | | 2015 | | | 2014 | |
| | | (Unaudited; U.S. dollars) | | | | | | | | | | |
Operating activities | | | | | | | | | | | | | | | | |
Net (loss) income | | U.S. $ | (9,250,114 | ) | | | Ps. 191,144,342 | ) | | | Ps. (712,567,398 | ) | | | Ps. (265,542,989 | ) |
Depreciation and amortization | | | 7,280,270 | | | | 150,439,491 | | | | 167,951,250 | | | | 143,074,787 | |
(Reversal) impairment of wells, pipelines, properties, plant and equipment | | | (16,033,408 | ) | | | (331,314,343 | ) | | | 477,944,690 | | | | 22,645,696 | |
Unsuccessful wells | | | 1,408,541 | | | | 29,106,084 | | | | 23,213,519 | | | | 12,148,028 | |
Disposal of wells, pipelines, properties, plant and equipment | | | 182,505 | | | | 3,771,287 | | | | 24,638,537 | | | | 6,370,937 | |
Loss in sale of fixed assets | | | 193,913 | | | | 27,882,480 | | | | — | | | | — | |
Gain on sale of share in associates and other | | | 1,349,326 | | | | (15,211,039 | ) | | | — | | | | — | |
Profit (loss) share in associates | | | (103,361 | ) | | | (2,135,845 | ) | | | (2,318,115 | ) | | | (34,368 | ) |
Impairment of goodwill | | | (736,113 | ) | | | 4,007,018 | | | | (680,630 | ) | | | — | |
Dividends | | | (14,198 | ) | | | (293,397 | ) | | | (359,941 | ) | | | (736,302 | ) |
Effects of net present value of reserve for well abandonment | | | 579,218 | | | | 11,968,966 | | | | (608,160 | ) | | | 9,169,327 | |
Net loss onavailable-for-sale financial assets | | | — | | | | — | | | | — | | | | 215,119 | |
Amortization expenses related to debt issuance | | | (77,922 | ) | | | (1,610,183 | ) | | | (2,299,657 | ) | | | 312,296 | |
Unrealized foreign exchange loss | | | 11,768,426 | | | | 243,182,764 | | | | 152,676,256 | | | | 78,884,717 | |
Interest expense | | | 4,783,414 | | | | 98,844,464 | | | | 67,773,593 | | | | 50,909,624 | |
| | | | | | | | | | | | | | | | |
| | | 1,330,497 | | | | 27,493,405 | | | | 195,363,944 | | | | 57,416,872 | |
Derivative financial instruments | | | 15,046 | | | | 310,905 | | | | 9,802,397 | | | | 16,354,342 | |
Accounts receivable | | | (2,666,688 | ) | | | (55,104,439 | ) | | | 33,003,083 | | | | 9,261,025 | |
Inventories | | | (65,761 | ) | | | (1,358,879 | ) | | | 6,167,728 | | | | 6,975,844 | |
Long-term receivables | | | (158,620 | ) | | | (3,277,724 | ) | | | — | | | | — | |
Intangible assets | | | (955,566 | ) | | | (19,745,821 | ) | | | — | | | | — | |
Other assets | | | (101,867 | ) | | | (2,104,985 | ) | | | (16,602,365 | ) | | | (18,984,877 | ) |
Accounts payable and accrued expenses | | | 149,906 | | | | 3,097,660 | | | | 1,002,403 | | | | (1,959,714 | ) |
Taxes paid | | | 280,337 | | | | 5,792,879 | | | | 626,626 | | | | 1,130,595 | |
Suppliers | | | (758,067 | ) | | | (15,664,703 | ) | | | 51,135,948 | | | | 9,433,102 | |
Provisions for sundry creditors | | | 754,228 | | | | 15,585,374 | | | | (9,126,733 | ) | | | 356,582 | |
Employee benefits | | | 2,288,670 | | | | 47,293,069 | | | | (116,022,232 | ) | | | 78,970,008 | |
Deferred taxes | | | (2,119,734 | ) | | | (43,802,181 | ) | | | (53,014,159 | ) | | | (24,597,648 | ) |
| | | | | | | | | | | | | | | | |
Net cash flows (used in) from operating activities | | | (2,007,619 | ) | | | (41,485,440 | ) | | | 102,336,640 | | | | 134,356,131 | |
| | | | | | | | | | | | | | | | |
Investing activities | | | | | | | | | | | | | | | | |
Acquisition of wells, pipelines, properties, plant and equipment | | | (7,327,162 | ) | | | (151,408,480 | ) | | | (253,514,001 | ) | | | (230,678,870 | ) |
Exploration costs | | | (97,891 | ) | | | (2,022,826 | ) | | | (5,698,511 | ) | | | (1,593,706 | ) |
Received dividends | | | — | | | | — | | | | — | | | | 336,095 | |
Resources from the sale on share in associates | | | 1,097,790 | | | | 22,684,736 | | | | 4,417,138 | | | | — | |
Proceeds from the sale of fixed assets | | | 27,132 | | | | 560,665 | | | | — | | | | — | |
Investments in associates | | | — | | | | — | | | | (36,214 | ) | | | (3,466,447 | ) |
Business acquisition | | | (209,532 | ) | | | (4,329,769 | ) | | | — | | | | | |
Available-for-sale financial assets | | | — | | | | — | | | | — | | | | 12,735,337 | |
| | | | | | | | | | | | | | | | |
Net cash flows used in investing activities | | | (6,509,663 | ) | | | (134,515,674 | ) | | | (254,831,588 | ) | | | (222,667,591 | ) |
| | | | | | | | | | | | | | | | |
Financing activities | | | | | | | | | | | | | | | | |
Increase in equity due to Certificates of Contributions “A” | | | 3,556,911 | | | | 73,500,000 | | | | 10,000,000 | | | | 22,000,000 | |
Decrease in equity Mexican Government contributions | | | — | | | | — | | | | — | | | | (73,583,100 | ) |
Loans obtained from financial institutions | | | 40,746,795 | | | | 841,991,767 | | | | 378,971,078 | | | | 423,399,475 | |
Debt payments, principal only | | | (29,683,369 | ) | | | (613,377,146 | ) | | | (191,318,841 | ) | | | (207,455,492 | ) |
Interest paid | | | (4,295,109 | ) | | | (88,754,141 | ) | | | (62,737,150 | ) | | | (47,248,478 | ) |
| | | | | | | | | | | | | | | | |
Net cash flows from financing activities | | | 10,325,228 | | | | 213,360,480 | | | | 134,915,087 | | | | 117,112,405 | |
| | | | | | | | | | | | | | | | |
Net increase (decrease) in cash and cash equivalents | | | 1,807,946 | | | | 37,359,366 | | | | (17,579,861 | ) | | | 28,800,945 | |
Effects of change in cash value | | | 813,213 | | | | 16,804,267 | | | | 8,960,213 | | | | 8,441,864 | |
Cash and cash equivalents at the beginning of the year | | | 5,292,726 | | | | 109,368,880 | | | | 117,988,528 | | | | 80,745,719 | |
| | | | | | | | | | | | | | | | |
Cash and cash equivalents at the end of the year (Note 6) | | U.S. $ | 7,913,885 | | | | Ps. 163,532,513 | | | | Ps. 109,368,880 | | | | Ps.117,988,528 | |
| | | | | | | | | | | | | | | | |
The accompanying notes are an integral part of these consolidated financial statements.
F-6
PETRÓLEOS MEXICANOS, PRODUCTIVE STATE-OWNED SUBSIDIARIES
AND SUBSIDIARY COMPANIES
NOTES TO THE CONSOLIDATED FINANCIAL STATEMENTS
FOR THE YEARS ENDED DECEMBER 31, 2016, 2015 AND 2014
(FIGURES STATED IN THOUSANDS, EXCEPT AS NOTED)
NOTE 1. STRUCTURE AND BUSINESS OPERATIONS OF PETRÓLEOS MEXICANOS, SUBSIDIARY ENTITIES AND SUBSIDIARY COMPANIES
Petróleos Mexicanos was created by a decree issued by the Mexican Congress on June 7, 1938. The decree was published in theDiario Oficial de la Federación (Official Gazette of the Federation) on July 20, 1938 and came into effect on that date.
On December 20, 2013, theDecreto por el que se reforman y adicionan diversas disposiciones de la Constitución Política de los Estados Unidos Mexicanos, en Materia de Energía (Decree that amends and supplements various provisions of the Mexican Constitution relating to energy matters), was published in the Official Gazette of the Federation and came into effect on December 21, 2013 (the “Energy Reform Decree”). In accordance with the Energy Reform Decree, the Mexican Government will carry out the exploration and extraction of hydrocarbons in the United Mexican States (“Mexico”) through assignments to productive state-owned companies, as well as through agreements with productive state-owned companies and with other companies.
As part of the secondary legislation enacted in accordance with the Energy Reform Decree, on August 11, 2014, theLey de Petróleos Mexicanos (the Petróleos Mexicanos Law) was published in the Official Gazette of the Federation. The Petróleos Mexicanos Law became effective on October 7, 2014, except for certain provisions. On December 2, 2014, the Secretaría de Energía (Ministry of Energy) published in the Official Gazette of the Federation the declaration pursuant to which the special regime governing Petróleos Mexicanos’ activities relating to productive state-owned subsidiaries, affiliates, compensation, assets, administrative liabilities, state dividend, budget and debt levels came into effect. On June 10, 2015 theDisposiciones Generales de Contratación para Petróleos Mexicanos y sus Empresas Productivas Subsidiarias (General Contracting Provisions for Petróleos Mexicanos and its productive state-owned subsidiaries) was published in the Official Gazette of the Federation and the special regime for acquisitions, leases, services and public works matters came into effect the day after.
Once the Petróleos Mexicanos Law came into effect, Petróleos Mexicanos was transformed from a decentralized public entity to a productive state-owned company. Petróleos Mexicanos is a legal entity empowered to own property and carry on business in its own name with the purpose of carrying out exploration and extraction of crude oil and other hydrocarbons in Mexico. In addition, Petróleos Mexicanos is entitled to perform activities related to refining, gas processing and engineering and research projects to create economic value and profitability for the Mexican Government, as its owner, while adhering to principles of equity and social and environmental responsibility.
The Subsidiary Entities,Pemex Exploración y Producción (Pemex Exploration and Production),Pemex Transformación Industrial (Pemex Industrial Transformation),Pemex Perforación y Servicios (Pemex Drilling and Services),Pemex Logística (Pemex Logistics),Pemex Cogeneración y Servicios (Pemex Cogeneration and Services),Pemex Fertilizantes (Pemex Fertilizers) andPemex Etileno (Pemex Ethylene), are productive state-owned subsidiaries empowered to own property and carry on business in their own name, subject to the direction and coordination of Petróleos Mexicanos (the “Subsidiary Entities”).
The Subsidiary Entities of Petróleos Mexicanos prior to the Corporate Reorganization werePemex-Exploración y Producción, Pemex-Refinación (Pemex-Refining),Pemex-Gas and Petroquímica Básica(Pemex-Gas and Basic Petrochemicals) andPemex-Petroquímica (Pemex-Petrochemicals), which were
F-7
PETRÓLEOS MEXICANOS, PRODUCTIVE STATE-OWNED SUBSIDIARIES
AND SUBSIDIARY COMPANIES
NOTES TO THE CONSOLIDATED FINANCIAL STATEMENTS
FOR THE YEARS ENDED DECEMBER 31, 2016, 2015 AND 2014
(FIGURES STATED IN THOUSANDS, EXCEPT AS NOTED)
decentralized public entities with a technical, industrial and commercial nature with their own corporate identity and equity, with the legal authority to own property and conduct business in their own names, and were 100% owned by Petróleos Mexicanos and controlled by the Mexican Government; they had been consolidated into and had the characteristics of subsidiaries of Petróleos Mexicanos.
The Board of Directors of Petróleos Mexicanos, in its meeting held on November 18, 2014, approved the Corporate Reorganization proposed by the Chief Executive Officer of Petróleos Mexicanos.
Pursuant to the recent corporate reorganization (the “Corporate Reorganization”), the existing four Subsidiary Entities were transformed into two new productive state-owned subsidiaries, which will have assumed all of the rights and obligations of the existing Subsidiary Entities (the “Corporate Reorganization”). Pemex-Exploration and Production was transformed into Pemex Exploration and Production, a productive state-owned subsidiary, and Pemex-Refining,Pemex-Gas and Basic Petrochemicals and Pemex-Petrochemicals were transformed into the productive state-owned subsidiary Pemex Industrial Transformation.
The Board of Directors of Petróleos Mexicanos also approved the creation of the following new Subsidiary Entities: Pemex Drilling and Services, Pemex Logistics, Pemex Cogeneration and Services, Pemex Fertilizers and Pemex Ethylene. Each of these productive state-owned subsidiaries may be transformed into an affiliate of Petróleos Mexicanos if certain conditions set forth in the Petróleos Mexicanos Law are met.
On March 27, 2015, the Board of Directors of Petróleos Mexicanos approved the acuerdos de creación (creation resolutions) of each productive state-owned subsidiary. The Subsidiary Entities mainly perform the following activities:
| | • | | Pemex Exploration and Production: This entity is in charge of exploration and extraction of crude oil and solid, liquid or gaseous hydrocarbons in Mexico, in the exclusive economic zone of Mexico and abroad. |
| | • | | Pemex Industrial Transformation: This entity performs activities related to refining, processing, import, export, trading and sale of hydrocarbons. |
| | • | | Pemex Drilling and Services: This entity performs drilling services and repair and services of wells. |
| | • | | Pemex Logistics: This entity provides transportation, storage and related services for crude oil, petroleum products and petrochemicals to Petróleos Mexicanos, Subsidiary Entities, subsidiary companies and other companies, through pipelines and maritime and terrestrial means, and provides guard and management services. |
| | • | | Pemex Cogeneration and Services: This entity generates, supplies and trades electric and thermal energy, including but not limited to the energy and thermal power produced in power plants and cogeneration plants, as well as performing technical and management services related to these activities to Petróleos Mexicanos, Subsidiary Entities, subsidiary companies and other companies, by itself or through companies in which it participates directly or indirectly. |
| | • | | Pemex Fertilizers: This entity produces, distributes and commercializes ammonia, fertilizers and its derivatives, as well as provides related services. |
| | • | | Pemex Ethylene: This entity commercializes, distributes and trades methane, ethane and propylene, directly or through others. |
F-8
PETRÓLEOS MEXICANOS, PRODUCTIVE STATE-OWNED SUBSIDIARIES
AND SUBSIDIARY COMPANIES
NOTES TO THE CONSOLIDATED FINANCIAL STATEMENTS
FOR THE YEARS ENDED DECEMBER 31, 2016, 2015 AND 2014
(FIGURES STATED IN THOUSANDS, EXCEPT AS NOTED)
On April 28, 2015 the creation resolutions of the seven productive state-owned subsidiaries were published in the Official Gazette of the Federation.
On May 29, 2015 the statements related to the creation resolution of the productive state-owned subsidiary Pemex Exploration and Production and the productive state-owned subsidiary Pemex Cogeneration and Services issued by the Board of Directors of Petróleos Mexicanos were published in the Official Gazette of the Federation and, accordingly, these creation resolutions came into effect on June 1, 2015. On May 12, 2016, a modification to the creation resolution of the productive state-owned subsidiary Pemex Exploration and Production was published in the Official Gazette of the Federation and became effective that same date.
On July 31, 2015, the statements related to the creation resolution of the productive state-owned subsidiary Pemex Drilling and Services, the productive state-owned subsidiary Pemex Fertilizers and the productive state-owned subsidiary Pemex Ethylene issued by the Board of Directors of Petróleos Mexicanos were published in the Official Gazette of the Federation and, accordingly, these creation resolutions came into effect on August 1, 2015.
On October 1, 2015, the statement related to the creation resolution of the productive state-owned subsidiary Pemex Logistics issued by the Board of Directors of Petróleos Mexicanos was published in the Official Gazette of the Federation and, accordingly, these creation resolutions came into effect on October 1, 2015.
On October 6, 2015, the statement related to the creation resolution of the productive state-owned subsidiary Pemex Industrial Transformation issued by the Board of Directors of Petróleos Mexicanos was published in the Official Gazette of the Federation and, accordingly, these creation resolutions came into effect on November 1, 2015.
The terms in capital letters not defined in these financial statements shall be understood as established in the Petróleos Mexicanos Law.
The principal distinction between the Subsidiary Entities and the Subsidiary Companies (as defined below) is that the Subsidiary Entities are productive state-owned entities, whereas the Subsidiary Companies are affiliates companies that were formed in accordance with the applicable laws of each of the respective jurisdictions in which they were incorporated. The “Subsidiary Companies” are defined as those companies which are controlled, directly or indirectly, by Petróleos Mexicanos (see Note3-a).
“Associates,” as used herein, means those companies in which Petróleos Mexicanos does not have effective control (see Note 3 a).
Petróleos Mexicanos, the Subsidiary Entities and the Subsidiary Companies are referred to collectively herein as “PEMEX.”
PEMEX’s address and its principal place of business is: Av. Marina Nacional No. 329, Col. Verónica Anzures, Delegación Miguel Hidalgo, 11300 Ciudad de México, México.
F-9
PETRÓLEOS MEXICANOS, PRODUCTIVE STATE-OWNED SUBSIDIARIES
AND SUBSIDIARY COMPANIES
NOTES TO THE CONSOLIDATED FINANCIAL STATEMENTS
FOR THE YEARS ENDED DECEMBER 31, 2016, 2015 AND 2014
(FIGURES STATED IN THOUSANDS, EXCEPT AS NOTED)
NOTE 2. BASIS OF PREPARATION
| a. | Statement of compliance |
PEMEX prepared its consolidated financial statements as of December 31, 2016 and 2015, and for the years ended December 31, 2016, 2015 and 2014, in accordance with International Financial Reporting Standards (“IFRS”) as issued by the International Accounting Standards Board (“IASB”).
On April 20, 2017, these consolidated financial statements under IFRS and the notes hereto were authorized for issuance by the following officers: Mr. José Antonio González Anaya, Chief Executive Officer, Mr. Juan Pablo Newman Aguilar, Chief Financial Officer, Mr. Manuel Salvador Cruz Flores, Deputy Director of Accounting and Tax Matters, and Mr. Francisco J. Torres Suárez, Associate Managing Director of Accounting.
These consolidated financial statements and the notes hereto as of December 31, 2016 were approved by the Board of Petróleos Mexicanos on April 27, 2017 with prior approval from the Audit Committee of the report of the Independent Registered Public Accountant, pursuant to the terms of Article 13 Fraction VI of the Petróleos Mexicanos Law, Article 104 Fraction III, paragraph a, of theLey del Mercado de Valores (Securities Market Law), and of Article 33 Fraction I, paragraph a, section 3 and Article 78 of theDisposiciones de carácter general aplicables a las emisoras de valores y a otros participantes del mercado de valores (General provisions applicable to securities´ issuers and other participants of the securities market).
These consolidated financial statements have been prepared using the historical cost basis method, except where it is indicated that certain items have been measured using the fair value model, amortized cost, present value or value in use. The principal items measured at fair value are derivative financial instruments (“DFIs”); the principal item measured at amortized cost is debt, the principal item measured at present value is the provision for employee benefits and some components of wells, pipelines, properties, plant and equipment are measured at value in use.
Going concern
The consolidated financial statements have been prepared on a going concern basis, which assumes that PEMEX can meet its payment obligations.
For the years ended December 31, 2016 and 2015, PEMEX recognized net losses of Ps. 191,144,342 and Ps.712,567,398, respectively, caused mainly by the decrease in international oil prices that commenced in August 2014, the high tax burden applicable to the industry and the depreciation of the peso relative to the U.S. dollar. Additionally, as of December 31, 2016 and December 31, 2015, PEMEX had a negative equity of Ps. 1,233,008,147 and Ps. 1,331,675,898, respectively, and a negative working capital of Ps. 70,791,086 and Ps. 176,207,224, respectively; and net cash flows used in operating activities for Ps.41,485,440 for the year ended December 31, 2016.
PEMEX believes net cash flows from its operating and financing activities for 2017, including the use of lines of credit with certain banks, will be sufficient to meet its working capital needs, debt service and capital expenditure requirements and maintain its financial strength and flexibility in the twelve months following from the date of issuance of these consolidated financial statements.
F-10
PETRÓLEOS MEXICANOS, PRODUCTIVE STATE-OWNED SUBSIDIARIES
AND SUBSIDIARY COMPANIES
NOTES TO THE CONSOLIDATED FINANCIAL STATEMENTS
FOR THE YEARS ENDED DECEMBER 31, 2016, 2015 AND 2014
(FIGURES STATED IN THOUSANDS, EXCEPT AS NOTED)
PEMEX is continuing to implement a business strategy that redefines it as a state-owned productive company and that enables it to operate competitively and efficiently and take advantage of benefits of the Energy Reform. PEMEX began taking certain of these actions in 2016 and will continue in 2017 as further described below:
| | • | | 2017-2021 Business Plan: On November 3, 2016, PEMEX announced its business plan for the five-year period from 2017 through 2021, which is designed to improve cash flows, reduce net indebtedness, strengthen its financial balance, reduce financial losses in its national refining system and plan for continued cost-cutting and administrative discipline, as well as the establishment of additional alliances, including an intensivefarm-out program. |
The business plan was prepared with realistic and conservative premises, which does not include additional income from the disposal of assets.
| | • | | Plan for 2017: The 2017 actions under the business plan also sets out certain objectives Petróleos Mexicanos expects to achieve with respect to its Subsidiary Entities as follows: |
| | • | | Pemex Exploration and Production’s investments will focus on the most profitable projects, as well as on farm-outs and other partnerships aimed at increasing hydrocarbon production. For 2017 Pemex Exploration and Production is planning to develop farm-outs and other partnerships, including the partnership celebrated with Chevron and Inpex Corporation in the bidding round 1.4, for the rights to block 3 North of the Plegado Perdido Belt in the Gulf of Mexico and its migration of assignment through the strategic alliance with the FrenchBHP-Billiton for the Trion project. |
| | • | | With respect to Pemex Industrial Transformation, PEMEX is seeking partnerships for auxiliary services and the reconfiguration of certain refineries for approximately projects for 2017, such as the auxiliary services contract with Air Liquide México. S.A. de R.L. de C.V. for the hydrogen supply in the Miguel Hidalgo Refinery in Tula, Hidalgo. |
| | • | | Pemex Logistics is being transformed from a company designed to ensure that Petróleos Mexicanos and its subsidiaries are properly supplied to provide profitable and competitive services to multiple customers. For 2017, Pemex Logistics is working on the open season to provide services for transportation and storage of products. |
| | • | | PEMEX’s business plan also describes its goal to increase the profitability of Pemex Fertilizers, Pemex Ethylene, Pemex Cogeneration and Services and Pemex Drilling and Services through services contracts and partnerships for the modernization of their facilities. |
| | • | | 2016 Budget Adjustment. For 2017, PEMEX continues to develop actions from its “Plan de Ajuste Presupuestal 2016” (2016 Budget Adjustment Plan) which were included in its 2017-2021 business plan, as this plan contributed to increase its efficiency to enable it to be more competitive in the hydrocarbons sector in Mexico; focus investments on the most profitable projects; established partnerships with the private sector for strategic projects and promoted further development in sectors where private investment may provide economic growth in Mexico; and identified opportunities for joint arrangements that can generate additional revenues, as well as savings in investment costs. |
| | • | | Pension Reform. As of January 1, 2016, new employees receive a defined contribution pension plan, pursuant to which both PEMEX and its employees contribute to each employee’s individual account, in contrast to the existing defined benefit pension plan, pursuant to which only PEMEX contributes. Additionally, PEMEX will provide existing employees with the option to migrate from a defined |
F-11
PETRÓLEOS MEXICANOS, PRODUCTIVE STATE-OWNED SUBSIDIARIES
AND SUBSIDIARY COMPANIES
NOTES TO THE CONSOLIDATED FINANCIAL STATEMENTS
FOR THE YEARS ENDED DECEMBER 31, 2016, 2015 AND 2014
(FIGURES STATED IN THOUSANDS, EXCEPT AS NOTED)
| | benefit plan to a defined contribution plan, which will allow PEMEX to decrease its employee benefits service cost and the growing of its employee benefits liability. |
| | • | | Asset Sales. PEMEX will continue to evaluate the divestiture ofnon-essential assets to obtain working capital, such as the sale of Gasoductos de Chihuahua, S. de R.L. de C.V. in 2016 (see Note 11). |
| | • | | Decreased Debt Financing: PEMEX will decrease its financing during the year in 2017 from Ps. 240,400,000 net indebtedness approved for 2016 to a net indebtedness approved of Ps. 150,000,000 in 2017. In addition, PEMEX will assess opportunities for liability management in accordance with market conditions, such as the liability management transaction completed on October 3, 2016, which allowed the exchange of near to maturity securities for longer term maturity securities with better conditions. |
| | • | | New Budget: On July 8, 2016, the Board of Directors of Petróleos Mexicanos approved a proposal for the consolidated annual budget of Petróleos Mexicanos and its Subsidiaries Entities for 2017, which was subsequently approved by the Chamber of Deputies on November 10, 2016. The consolidated annual budget of Petróleos Mexicanos and its Subsidiary entities for 2017 is approximately Ps. 391,946,173 as compared to the Ps. 378,282,000 consolidated annual adjusted budget for 2016. |
| | • | | The structural changes arising from the Energy Reform, and the actions taken by management are aimed at ensuring the continuity of PEMEX’s operations, reducing costs, generating more revenue and operating more efficiently. |
In addition, PEMEX foresees a more stable scenario for the hydrocarbons market, which may allow for an improvement in its revenues. A result of this stability was the effect of the reversal of the impairment experienced in 2016, which resulted in an improvement in the financial position of PEMEX by Ps. 331.3 billion, compared to the impairment of Ps.477.9 billion in 2015.
Petróleos Mexicanos and its Subsidiaries Entities are not subject to theLey de Concursos Mercantiles (the Bankruptcy Law) and none of PEMEX’S existing financing agreements include any clause that could lead to the demand for immediate payment of the respective debt due to having negative equity.
PEMEX prepared its consolidated financial statements as of December 31, 2016 and 2015 on a going concern basis. There are certain conditions that have generated important uncertainty and significant doubts concerning the entity’s ability to continue operating, including recurring net losses, negative working capital, negative equity and negative cash flows from operating activities in 2016. PEMEX has disclosed the existence of these uncertainties, the circumstances that have caused these negative trends and the concrete actions it is taking to face them, improve its results and strengthen the feasibility to continue operating, achieving maximization and efficiencies in an economic environment which is showing recovery and some stability. These financial statements do not contain any adjustments that would be required if they were not prepared on a going concern basis.
| c. | Functional and reporting currency and translation of foreign currency operations |
These consolidated financial statements are presented in Mexican pesos,which is both PEMEX’s functional and reporting currency, due to the following:
| | i. | the economic environment in which PEMEX operates is Mexico, where the legal currency is the Mexican peso; |
F-12
PETRÓLEOS MEXICANOS, PRODUCTIVE STATE-OWNED SUBSIDIARIES
AND SUBSIDIARY COMPANIES
NOTES TO THE CONSOLIDATED FINANCIAL STATEMENTS
FOR THE YEARS ENDED DECEMBER 31, 2016, 2015 AND 2014
(FIGURES STATED IN THOUSANDS, EXCEPT AS NOTED)
| | ii. | Petróleos Mexicanos and its Subsidiary Entities have budgetary autonomy, subject only to maintaining the financial balance (the difference between income and total net spending, including the financial cost of the public debt of the Mexican Government and the entities directly controlled by the Mexican Government) and the spending cap of personnel services proposed by SHCP and approved by the Mexican Congress, in Mexican pesos. |
| | iii. | Employee benefits provision was approximately 34% and 41% of PEMEX’s total liabilities as of December 31, 2016 and 2015, respectively. This provision is computed, denominated and payable in Mexican pesos; and |
| | iv. | cash flows for payment of general expenses, taxes and duties are realized in Mexican pesos. |
Although the sales prices of several products are based on international U.S. dollar-indices, final domestic selling prices are governed by the economic and financial policies established by the Mexican Government. Accordingly, cash flows from domestic sales are generated and received in Mexican pesos.
Mexico’s monetary policy regulator, the Banco de México, requires that Mexican Government entities other than financial entities sell their foreign currency to the Banco de México in accordance with its terms, receiving Mexican pesos in exchange, which is the currency of legal tender in Mexico.
Translation of financial statements of foreign operations
The financial statements of foreign subsidiaries and associates are translated into the reporting currency by first identifying if the functional currency is different from the currency for recording the foreign operations, and, if so, the recording currency is translated into the functional currency and then into the reporting currency using theyear-end exchange rate of each period for assets and liabilities reported in the consolidated statements of financial position; the historical exchange rate at the date of the transaction for equity items; and the weighted average exchange rate of the period for income and expenses reported in the statement of comprehensive income.
References in these consolidated financial statements and the related notes to “pesos” or “Ps.” refers to Mexican pesos, “U.S. dollars” or “US$” refers to dollars of the United States of America, “yen” or “¥” refers to Japanese yen, “euro” or “€ ” refers to the legal currency of the European Economic and Monetary Union, “Pounds sterling” or “£” refers to the legal currency of the United Kingdom, “Swiss francs” or “CHF” refers to the legal currency of the Swiss Confederation, “Canadian dollars” or “CAD” refers to the legal currency of Canada and “Australian dollars” or “AUD” refers to the legal currency of Australia. Figures in all currencies are presented in thousands of the relevant currency unit, except exchange rates and product and share prices.
| e. | Convenience translations |
These consolidated financial statements are presented in Mexican pesos (reporting currency), which is the same as the recording currency and the functional currency of PEMEX. The U.S. dollar amounts shown in the consolidated statements of financial position, the consolidated statements of comprehensive income, the consolidated statements of changes in equity (deficit) and the consolidated statements of cash flows have been included solely for the convenience of the reader and are unaudited. Such amounts have been translated from amounts in pesos, as a matter of arithmetic computation only, at the exchange rate for the settlement of
F-13
PETRÓLEOS MEXICANOS, PRODUCTIVE STATE-OWNED SUBSIDIARIES
AND SUBSIDIARY COMPANIES
NOTES TO THE CONSOLIDATED FINANCIAL STATEMENTS
FOR THE YEARS ENDED DECEMBER 31, 2016, 2015 AND 2014
(FIGURES STATED IN THOUSANDS, EXCEPT AS NOTED)
obligations in foreign currencies provided by Banco de México and SHCP at December 31, 2016 of Ps. 20.6640 per U.S. dollar. Translations herein should not be construed as a representation that the peso amounts have been or could be converted into U.S. dollars at the foregoing or any other rate.
NOTE 3. Significant accounting policies
The preparation of the consolidated financial statements in accordance with IFRS requires the use of estimates and assumptions made by PEMEX’s management that affect the recorded amounts of assets and liabilities and the disclosures of contingent assets and liabilities as of the date of these consolidated financial statements, as well as the recorded amounts of income, costs and expenses during the year.
Significant estimates and underlying assumptions are reviewed, and the effects of such revisions are recognized in the period in which any estimates are revised and in any future periods affected by such revision.
Information about estimates, assumptions and critical accounting policies that have the most significant effects on the amounts recognized in the consolidated financial statements are described in the following notes:
| | • | | Note 3(e) Financial instruments |
| | • | | Note 3(h) Wells, pipelines, properties, plant and equipment; Successful efforts method |
| | • | | Note 3(j) Impairment ofnon-financial assets |
| | • | | Note 3(m) Employee benefits |
| | • | | Note 3(n) Income taxes and duties; |
| | • | | Note 3(p) Contingencies |
Actual results could differ from those estimates and assumptions.
Below is a summary of the principal accounting policies, which have been consistently applied to each of the years presented and followed by PEMEX in the preparation of its consolidated financial statements:
The consolidated financial statements include those of Petróleos Mexicanos, the Subsidiary Entities and the Subsidiary Companies. All intercompany balances and transactions of the consolidated companies; income and expenses, as well as unrealized profits and losses resulting from operations between them have been eliminated in the preparation of the consolidated financial statements pursuant to IFRS 10, “Consolidated Financial Statements” (“IFRS 10”).
Unrealized gains arising from transactions with entities whose investment is accounted for using the equity method are eliminated against the investment to the extent of PEMEX’s participation in such entities. Unrealized losses are eliminated in the same way as unrealized gains but only to the extent that there is no evidence of impairment.
F-14
PETRÓLEOS MEXICANOS, PRODUCTIVE STATE-OWNED SUBSIDIARIES
AND SUBSIDIARY COMPANIES
NOTES TO THE CONSOLIDATED FINANCIAL STATEMENTS
FOR THE YEARS ENDED DECEMBER 31, 2016, 2015 AND 2014
(FIGURES STATED IN THOUSANDS, EXCEPT AS NOTED)
Investment in subsidiaries
The Subsidiary Entities and Subsidiary Companies are consolidated from the date that control commences until the date that control ceases.
Petróleos Mexicanos controls a subsidiary when it is exposed to or has rights to variable returns from the company and has the ability to affect those returns through its power over the company.
The financial statements of the Subsidiary Entities and Subsidiary Companies have been prepared based on the same period of Petróleos Mexicanos’ consolidated financial statements applying the same accounting policies.
For more information about Subsidiary Companies, see Note 4.
Permanent investments in associates and joint arrangements
Associates are those entities in which PEMEX has significant influence but not the power to control financial and operational decisions. It is presumed that there is significant influence when PEMEX owns directly or indirectly between 20% and 50% of voting rights in another entity.
Joint arrangements are those arrangements whereby two or more parties have joint control of an arrangement. A joint arrangement is either a joint venture, where both of the parties have rights to the net assets of the arrangements, or a joint operation, where the parties have both rights to the assets, and obligations for the liabilities relating to the arrangements.
Investments in associates and joint ventures are recognized based on the equity method and recorded initially at cost, including any goodwill identified on acquisition. With respect to joint operations, the assets, liabilities, income and expenses are recognized in relation to the share of each party and in accordance with the applicable IFRS for each of those items. The investment cost includes transaction costs.
These consolidated financial statements include the proportion of gains, losses and other comprehensive income corresponding to PEMEX’s share in each investee, once these items are adjusted to align with the accounting policies of PEMEX, from the date that significant influence and joint control begins to the date that such influence or joint control ceases.
When the value of the share of losses exceeds the value of PEMEX’s investment in an associate or joint venture, the carrying value of the investment, including any long-term investment, is reduced to zero and PEMEX ceases to recognize additional losses, except in cases where PEMEX is jointly liable for obligations incurred by those associates and joint ventures.
For more information about associates and joint arrangements, see Note 11.
Non-controlling interests
The interests of third parties who do not have a controlling interest in the equity or comprehensive result of subsidiaries of PEMEX are presented in the consolidated statements of financial position, the consolidated
F-15
PETRÓLEOS MEXICANOS, PRODUCTIVE STATE-OWNED SUBSIDIARIES
AND SUBSIDIARY COMPANIES
NOTES TO THE CONSOLIDATED FINANCIAL STATEMENTS
FOR THE YEARS ENDED DECEMBER 31, 2016, 2015 AND 2014
(FIGURES STATED IN THOUSANDS, EXCEPT AS NOTED)
statements of changes in equity (deficit) as“non-controlling interests” and as “net income and comprehensive income for the period, attributable tonon-controlling interests,” in the consolidated statements of comprehensive income.
Dividends in cash and assets other than cash
A liability for distributions of dividends in cash andnon-cash assets to third parties is recognized when the distribution is authorized by the Board of Directors. The corresponding amount is recognized directly in equity.
Distributions of dividends innon-cash assets are measured at the fair value of the assets to be distributed. Changes relating to these measurements of the fair value, between the date on which the distribution is declared and the date when the assets are transferred, are recognized directly in equity.
When distributingnon-cash assets, any difference between the carrying amount of the liability for distribution of dividends and the carrying amount of the assets distributed is recognized in the consolidated statements of comprehensive income.
| b. | Business combinations and goodwill |
Business combinations are accounted for using the acquisition method. The cost of an acquisition is measured as the aggregate of the consideration transferred, measured as the acquisition date fair value, and the amount of anynon-controlling interest in the acquiree.
When PEMEX acquires a business, it assesses the acquired assets and liabilities in order to appropriately classify and designate each, taking into account the contractual terms, economic circumstances and other pertinent conditions as of the date of the acquisition. This includes the separation of embedded derivatives in host contractors by the acquiree. Acquired petroleum reserves and resources that can be reliably measured are recognized separately in the assessment of fair values on acquisition. Other potential reserves and rights, for which fair values cannot be reliably measured, are not recognized separately, but instead are subsumed in goodwill.
For business combinations achieved in stages, any previously held equity interest is measured at its acquisition date fair value, and any resulting gain or loss is recognized in income or loss or other comprehensive income.
Any contingent consideration to be transferred by the acquirer will be recognized at fair value on the acquisition date. Contingent consideration classified as an asset or liability that is a financial instrument and within the scope of IAS 39 “Financial instruments: Recognition and Measurement” is measured at fair value, with changes in fair value recognized in income or loss or other comprehensive income. If contingent consideration is not with the scope of IAS 39, it is measured in accordance with the appropriate IFRS requirement. Contingent consideration that is classified as equity is not remeasured, and subsequent settlement is accounted for within equity.
Goodwill, which is initially measured at cost, is the excess of the aggregate of the consideration transferred and the amount recognized fornon-controlling interest over the fair value of the identifiable net assets acquired and liabilities assumed. If the fair value of the net asset acquired is greater than the aggregate consideration
F-16
PETRÓLEOS MEXICANOS, PRODUCTIVE STATE-OWNED SUBSIDIARIES
AND SUBSIDIARY COMPANIES
NOTES TO THE CONSOLIDATED FINANCIAL STATEMENTS
FOR THE YEARS ENDED DECEMBER 31, 2016, 2015 AND 2014
(FIGURES STATED IN THOUSANDS, EXCEPT AS NOTED)
transferred (bargain purchase), before recognizing a gain, PEMEX reassesses whether it has correctly identified all of the assets acquired and all of the liabilities assumed and reviews the procedures used to measure the amounts to be recognized at the acquisition date. If the assessment still results in an excess of the fair value of net assets acquired over the aggregate consideration transferred, then the gain is recognized in the statement of comprehensive income.
After initial recognition, goodwill is measured at cost less any accumulated impairment losses. For the purpose of impairment testing, goodwill acquired in a business combination is, from the acquisition date, allocated to each cash generating unit that is expected to benefit from the combination, irrespective of whether other assets or liabilities of the acquiree are assigned to those units.
When goodwill is allocated to a cash generating unit and certain of the operations in that unit are disposed of, the goodwill associated with the disposed operation is included in the carrying amount of the operation when determining the gain or loss on disposal. Goodwill disposed in these circumstances is measured based on the relative values of the disposed operation and the portion of the cash generating unit retained.
| c. | Transactions in foreign currency |
In accordance with IAS 21 “The Effects of Changes in Foreign Exchange Rates” (“IAS 21”), transactions in foreign currencies are translated and recorded at exchange rates at the dates of the transactions and/or of the presentation of financial information.
Exchange differences arising from the settlement of monetary items or from the translation of monetary items into rates different from those at which they were translated on their initial recognition, are recognized in the results of operations in the reporting period in which they arise. When a gain or loss from anon-monetary item is recognized in other comprehensive results, any exchange difference included in that gain or loss is recognized in other comprehensive results. Conversely, when a gain or loss from anon-monetary item is recognized in the results of operations, any exchange difference included in that gain or loss is recognized in the results of operations for the period.
PEMEX measures certain financial instruments such as DFIs at fair value as of the closing date of the relevant reporting period.
Fair value is the price that would be received to sell an asset or paid to transfer a liability in an orderly transaction between market participants at the measurement date. A measurement at fair value assumes that the sale of the asset or transfer of a liability occurs:
| | i. | in the principal market for the asset or liability; or |
| | ii. | in the absence of a principal market, in the most advantageous market for the asset or liability. |
The principal market or the most advantageous market must be accessible for PEMEX.
The fair value of an asset or liability is measured by using the same assumptions that market participants would make when pricing the asset or liability under the premise that market participants take into account highest and best use of the asset or liability.
F-17
PETRÓLEOS MEXICANOS, PRODUCTIVE STATE-OWNED SUBSIDIARIES
AND SUBSIDIARY COMPANIES
NOTES TO THE CONSOLIDATED FINANCIAL STATEMENTS
FOR THE YEARS ENDED DECEMBER 31, 2016, 2015 AND 2014
(FIGURES STATED IN THOUSANDS, EXCEPT AS NOTED)
Financial instruments are classified as: (i) financial instruments measured at fair value through profit or loss; (ii) financial instruments held to maturity;(iii) available-for-sale financial assets; (iv) investments in equity instruments; (v) loans and receivables; and (vi) DFIs. PEMEX determines the classification of its financial instruments at the time of initial recognition.
PEMEX’s financial instruments include cash and short-term deposits,available-for-sale financial assets, accounts receivable, other receivables, loans, accounts payable to suppliers, other accounts payable, borrowings and debts, as well as DFIs.
Below are descriptions of the financial instruments policies employed by PEMEX:
Financial instruments measured at fair value through profit or loss
A financial instrument is measured at fair value through profit or loss if it is classified as held for trading or designated as such upon initial recognition. Financial assets are designated at fair value through profit or loss if PEMEX manages such investments and makes purchase and sale decisions based on their fair value in accordance with PEMEX’s documented risk management or investment strategy. In addition, directly attributable transaction costs are recognized in the consolidated statements of comprehensive income for the year. These financial instruments are recognized at fair value and corresponding changes relating to dividend income are recognized in the consolidated statements of comprehensive income.
Available-for-sale financial assets
Available-for-sale financial assets arenon-DFIs that are designated asavailable-for-sale or are not classified in any of the previous categories. PEMEX’s investments in certain equity securities and debt securities are classified asavailable-for-sale financial assets.Available-for-sale financial assets are recognized initially at fair value plus any directly attributable transaction costs.
Subsequent to initial recognition,available-for-sale financial assets are measured at fair value. In addition, any gains or losses associated with such instruments, as well as foreign exchange differences are recognized in other comprehensive result and presented in the fair value reserve in equity. When an investment is derecognized, any gains or losses accumulated in the equity are reclassified to profit or loss.
Sales and purchases of financial assets that require the delivery of such assets within a period of time established by market practice are recognized as of the negotiation date (the date on which PEMEX commits to purchase or sell the asset).
Loans and receivables
Loans and receivables are initially recognized at fair value. After initial recognition, loans and debt securities that bear interest are measured at amortized cost using the effective interest rate (“EIR”) method, less impairment losses.
The amortized cost is calculated based on any discount or premium on acquisition and fees and costs that are an integral part of the EIR method. Amortization of costs is included under the heading of financing cost in the statement of comprehensive income.
F-18
PETRÓLEOS MEXICANOS, PRODUCTIVE STATE-OWNED SUBSIDIARIES
AND SUBSIDIARY COMPANIES
NOTES TO THE CONSOLIDATED FINANCIAL STATEMENTS
FOR THE YEARS ENDED DECEMBER 31, 2016, 2015 AND 2014
(FIGURES STATED IN THOUSANDS, EXCEPT AS NOTED)
Derivative financial instruments
DFIs presented in the consolidated statement of financial position are carried at fair value. In the case of DFIs held for trading, changes in fair value are recorded in profit or loss; in the case of DFIs formally designated as and that qualify for hedging, changes in fair value are recorded in the statement of comprehensive income using cash flow or fair value hedge accounting, with gains or losses classified in accordance with the earnings treatment of the hedge transaction.
Embedded derivatives
PEMEX evaluates the potential existence of embedded derivatives, which may be found in the terms of its contracts, or combined with other host contracts, which could be structured financial instruments (debt or equity instruments with embedded derivatives). Embedded derivatives have terms that implicitly or explicitly meet the characteristics of a DFI. In some instances, these embedded derivatives must be segregated from the underlying contracts and measured, recognized, presented and disclosed as DFIs, such as when the economic risks and terms of the embedded derivative are not clearly and closely related to the underlying contract.
Impairment of financial assets
At each reporting date, PEMEX evaluates whether there is objective evidence that a financial asset or group of financial assets is impaired, in which case the value of the recoverable amount of the asset is calculated. A financial asset is impaired if objective evidence indicates that a loss event has occurred after the initial recognition of the asset, and that the loss event had a negative effect on the estimated future cash flows of the financial asset.
Objective evidence that a financial asset or group of assets is impaired includes significant financial difficulty of the issuer or obligor, a breach of contract, such as a default or delinquency in interest or principal payments; the lender, for economic or legal reasons relating to the borrower’s financial difficulty, granting to the borrower a concession that the lender would not otherwise consider; it becoming probable that the borrower will enter bankruptcy or other financial reorganization; the disappearance of an active market for that financial asset because of financial difficulties; or observable data indicating that there is a measurable decrease in the estimated future cash flows. Impairments by asset are:
Impairment of financial assets carried at amortized cost
The impairment of financial assets carried at amortized cost is measured as the difference between the assets carrying amount and the present value of estimated future cash flows (excluding future credit losses that have not been incurred) discounted at the financial asset´s original effective interest rate. The amount of the loss shall be recognized in profit or loss.
If, in a subsequent period, the amount of the impairment loss decreases and the decrease can be related objectively to an event occurring after the impairment was recognized, the impairment loss previously recognized shall be reversed in profit or loss.
Impairment in available-for-sale financial assets
Additionally to the above mentioned, a significant or prolonged decline in the fair value of an available- for- sale financial asset is also objective evidence of impairment.
F-19
PETRÓLEOS MEXICANOS, PRODUCTIVE STATE-OWNED SUBSIDIARIES
AND SUBSIDIARY COMPANIES
NOTES TO THE CONSOLIDATED FINANCIAL STATEMENTS
FOR THE YEARS ENDED DECEMBER 31, 2016, 2015 AND 2014
(FIGURES STATED IN THOUSANDS, EXCEPT AS NOTED)
When there is objective evidence of the impairment of an asset, the accumulated loss recognized in other comprehensive income shall be reclassified from equity to profit or loss even though the financial asset has not been derecognized.
If, in a subsequent period, the impairment loss decreases and the reduction could be objectively related to an event occurring after the impairment recognition, this impairment loss previously recognized shall be reversed in profit or loss.
| f. | Cash and cash equivalents |
Cash and cash equivalents are comprised of cash balances on hand, net of overdrafts, deposits in bank accounts, foreign currency reserves and instruments with maturities of three months or less from the acquisition date that are subject to an insignificant risk of changes in their fair value, which are used in the management of PEMEX’s short-term commitments.
Cash subject to restrictions or that cannot be exchanged or used to settle a liability within 12 months is presented asnon-current assets.
| g. | Inventories and cost of sales |
Inventories are valued at the lower of cost or net realizable value. Cost is determined based on the cost of production or acquisition of inventory and other costs incurred in transporting such inventory to its present location and in its present condition, using the average cost formula. Net realizable value is the estimated selling price in the ordinary course of business less the estimated costs of completion and the estimated selling costs. The estimate takes into consideration, among other things, the decrease in the value of inventories due to obsolescence.
Cost of sales represents the cost of production or acquisition of inventories at the time of sale, increased, where appropriate, by declines in net realizable value of inventories during the year.
Advance payment to suppliers for inventory purchases are recognized as part of inventory when the risks and benefits of the ownership of the inventory have been transferred to PEMEX.
| h. | Wells, pipelines, properties, plant and equipment |
Wells, pipelines, properties, plant and equipment are recorded at acquisition or construction cost less accumulated depreciation and accumulated impairment losses.
PEMEX uses the successful efforts method for the exploration and production of crude oil and gas activities, considering the criteria mentioned in IFRS 6, “Exploration for and Evaluation of Mineral Resources” in relation to the recognition of exploration and drilling assets. Costs of development wells and related plant, property and equipment involved in the exploitation of oil and gas are recorded as part of the cost of assets. The costs of exploratory wells in areas that have not yet been designated as containing proved reserves are recorded as intangible assets until it is determined whether they are commercially viable to capitalize as fixed assets, otherwise they are recognized as exploration expenses. Other expenditures on exploration are recognized as exploration expenses as they are incurred.
F-20
PETRÓLEOS MEXICANOS, PRODUCTIVE STATE-OWNED SUBSIDIARIES
AND SUBSIDIARY COMPANIES
NOTES TO THE CONSOLIDATED FINANCIAL STATEMENTS
FOR THE YEARS ENDED DECEMBER 31, 2016, 2015 AND 2014
(FIGURES STATED IN THOUSANDS, EXCEPT AS NOTED)
In accordance with IAS 16, “Property, Plant and Equipment” (“IAS 16”), initial costs of wells, pipelines, properties, plant and equipment are initially recorded at cost, which includes their original purchase price or construction cost, any costs attributable to bringing the assets to a working condition for their intended use and the costs of dismantling and removing the items and restoring the site on which they are located, including the estimated cost of plugging and abandoning wells. The cost of financing projects that require large investments and financing incurred for projects, net of interest revenues from the temporary investment of these funds, is recognized as part of wells, pipelines, properties, plant and equipment when the cost is directly attributable to the construction or acquisition of a qualifying asset. The capitalization of these costs is suspended during periods in which the development of construction is interrupted, and its capitalization ends when the activities necessary for the use of the qualifying asset are substantially completed. All other financing costs are recognized in the consolidated statements of comprehensive income in the period in which they are incurred.
The cost of self-constructed assets includes the cost of materials and direct labor, interest on financing and any other costs directly attributable to start up. In some cases the cost also includes the cost of plugging of wells and removal.
Expenditures related to the construction of wells, pipelines, properties, plant and equipment during the stage prior to commissioning are stated at cost as intangible assets or construction in progress, in accordance with the characteristics of the asset. Once the assets are ready for use, they are transferred to the respective component of wells, pipelines, properties, plant and equipment and depreciation or amortization begins.
The costs of major maintenance or replacement of a significant component of an item of wells, pipelines, properties, plant and equipment are recognized in the carrying amount of the item if it is probable that the future economic benefits embodied within the component will flow to PEMEX and its cost can be measured reliably. The costs of recurring maintenance, repairs and renovations of wells, pipelines, properties, plant and equipment carried out to maintain the facilities in normal operation conditions are recognized in profit or loss as incurred.
Depreciation and amortization of capitalized costs in wells are determined based on the estimated economic life of the field to which the wells belong, considering the relationship between the production of barrels of oil equivalent for the period and proved developed reserves of the field, as of the beginning of the year, with quarterly updates for new development investments.
Depreciation of other elements of pipelines, properties, plant and equipment is recognized in profit or loss on a straight-line basis over the estimated useful life of the asset, beginning as of the date that the asset is available for use, or in the case of construction, from the date that the asset is completed and ready for use.
When parts of an item of wells, pipelines, properties and equipment are significant relative to the total cost of the item, the part is depreciated separately.
Estimated useful lives of items of properties, plant and equipment are reviewed if expectations differ from previous estimates.
Pipelines, properties, and equipment received from customers are initially recognized at fair value as revenue from ordinary operating activities if PEMEX has no future obligations to the customer who transferred the item. In contrast, if PEMEX does have future obligations to such a customer, the initial recognition is recorded as a deferred liability based on the period in which the assets will provide services to the customers.
F-21
PETRÓLEOS MEXICANOS, PRODUCTIVE STATE-OWNED SUBSIDIARIES
AND SUBSIDIARY COMPANIES
NOTES TO THE CONSOLIDATED FINANCIAL STATEMENTS
FOR THE YEARS ENDED DECEMBER 31, 2016, 2015 AND 2014
(FIGURES STATED IN THOUSANDS, EXCEPT AS NOTED)
The capitalized value of finance leases is also included in the line item of wells, pipelines, properties, plant and equipment. Properties, plant and equipment acquired through financial leases are depreciated over the shorter of the lease term or the useful life of the asset.
Advance payments for the acquisition of pipelines, properties, plant and equipment are also recognized in the line item of wells, pipelines, properties, plant and equipment when the risks and benefits of the ownership have been transferred to PEMEX.
| i. | Crude oil and natural gas reserves |
Under Mexican law, all crude oil and other hydrocarbon reserves located in the subsoil of Mexico are owned by the Mexican nation and not by PEMEX. In accordance with the aforementioned and based on the applicable regulation as of the date of these consolidated financial statements, the reserves assigned to PEMEX by the Mexican Government are not registered for accounting purposes because they are not PEMEX’s property. PEMEX estimates total proved oil and natural gas reserve volumes in accordance with the definitions, methods and procedures established in Rule4-10(a) of RegulationS-X (“Rule4-10(a)”) of the U.S. Securities and Exchange Commission (“SEC”) as amended, and where necessary, in accordance with the Standards Pertaining to the Estimating and Auditing of Oil and Gas Reserves Information promulgated by the Society of Petroleum Engineers (the “SPE”) as of February 19, 2007. These procedures are consistent with international reserves reporting practice. The estimation of these reserves depends on assumptions made and the interpretation of the data available, and may vary among analysts. The results of drilling activities, test wells and production after the date of estimation are utilized in future revisions of reserves estimates.
Although PEMEX does not own the oil and other hydrocarbon reserves within Mexico, these procedures allow PEMEX to record the effects that such oil and other hydrocarbon reserves have on its consolidated financial statements, including, for example, in the depreciation and amortization line item.
| j. | Impairment ofnon-financial assets |
The carrying amounts of PEMEX’snon-financial assets, other than inventories and deferred taxes, are assessed for indicators of impairment at the end of each reporting period. If the net carrying value of the asset or its cash-generating unit exceeds the recoverable amount, PEMEX records an impairment charge in its consolidated statement of comprehensive income.
A cash-generating unit is the smallest identifiable group of assets which can generate cash flows independently from other assets or groups of assets.
The recoverable amount of an asset or a cash-generating unit is defined as the higher of its fair value minus the costs of disposal and its value in use. The value in use is the discounted present value, of the net future cash flows expected to arise from the continuing use of an asset, and from its disposal at the end of its useful life. In measuring value in use, the discount rate applied is thepre-tax rate that reflects current market assessments of the time value of money and the risks specific to the asset. Fair value is calculated using discounted cash flows determined by the assumptions that market participants would apply in order to estimate the price of an asset or cash generating unit, assuming that such participants were acting in their best economic interest.
F-22
PETRÓLEOS MEXICANOS, PRODUCTIVE STATE-OWNED SUBSIDIARIES
AND SUBSIDIARY COMPANIES
NOTES TO THE CONSOLIDATED FINANCIAL STATEMENTS
FOR THE YEARS ENDED DECEMBER 31, 2016, 2015 AND 2014
(FIGURES STATED IN THOUSANDS, EXCEPT AS NOTED)
In the case of cash-generating assets or items dedicated to the exploration and evaluation of hydrocarbons reserves, the recoverable amount is determined using the value in use based on the proved reserves and probable reserves in some cases, for the risk factor associated with such reserves.
Both impairment losses and reversals are recognized in the costs and expenses in which the depreciation and amortization are recognized. Impairment losses may not be presented as part of the costs that have been capitalized in the value of any asset. Impairment losses related to inventories are recognized as part of cost of sales. Impairment losses on investments in associates, joint ventures and other permanent investments are recognized as profit (loss) sharing in associates.
An impairment loss shall be reversed if there has been a change in the estimates used since the date when the impairment loss was recognized. These reversals will not exceed the carrying value of the asset as though no impairment had been recognized. Impairment losses and reversals are presented in a separate line item in the statement of comprehensive income.
The determination of whether an agreement is or contains a lease is based on the economic substance of the agreement at the date of execution. An agreement contains a lease if performance under the agreement depends upon the use of a specific asset or assets, or if the agreement grants the right to use the asset.
Finance leases, which transfer to PEMEX substantially all the inherent benefits and risks of the leased property, are capitalized at the date the lease commences, and the value is recorded as the lower of the fair value of the leased property and the present value of the minimum lease payments. Payments on the lease are divided between the financial costs and the amortization of the remaining debt principal in order to achieve a constant effective interest rate for the outstanding liability. The financing costs are recognized in the statement of comprehensive income.
Operating lease payments are recognized as expenses in the statement of comprehensive income on a straight line basis over the term of the lease and variable rent payments are recognized in the operating results on an accrued basis.
PEMEX recognizes provisions when, as a result of a past event, PEMEX has incurred a legal or assumed present obligation for which a future disbursement is probable and the value of such disbursement is reasonably estimable. In certain cases, such amounts are recorded at their present value.
Environmental liabilities
In accordance with applicable legal requirements and accounting practices, an environmental liability is recognized when the cash outflows are probable and the amount is reasonably estimable. Disbursements related to the conservation of the environment that are linked to revenue from current or future operations are accounted as expenses or assets, depending on the circumstances of each disbursement. Disbursements related to past operations, which no longer contribute to current or future revenues, are accounted for as current period expenses.
F-23
PETRÓLEOS MEXICANOS, PRODUCTIVE STATE-OWNED SUBSIDIARIES
AND SUBSIDIARY COMPANIES
NOTES TO THE CONSOLIDATED FINANCIAL STATEMENTS
FOR THE YEARS ENDED DECEMBER 31, 2016, 2015 AND 2014
(FIGURES STATED IN THOUSANDS, EXCEPT AS NOTED)
The accrual of a liability for a future disbursement occurs when an obligation related to environmental remediation, for which PEMEX has the information necessary to determine a reasonable estimated cost, is identified.
Retirement of assets
The obligations associated with the future retirement of assets, including those related to the retirement of wells, pipelines, properties, plant and equipment and their components are recognized at the date that the retirement obligation is incurred, based on the discounted cash flow method. The determination of the fair value is based on existing technology and regulations. If a reliable estimation of fair value cannot be made at the time the obligation is incurred, the accrual will be recognized when there is sufficient information to estimate the fair value.
The obligations related to the costs of future retirement of assets associated with the principal refining processes for gas and petrochemicals are not recognized. These assets are considered to have an indefinite useful life due to the potential for maintenance and repairs.
The abandonment costs related to wells currently in production and wells temporarily closed are recorded in the statement of comprehensive income based on the units of production method. Total cost of abandonment and plugging fornon-producing wells is recognized in the statement of comprehensive income at the end of each period. All estimations are based on the useful lives of the wells, considering their discounted present value. Salvage values are not considered, as these values commonly have not traditionally existed.
Beginning January 1, 2016, Petróleos Mexicanos and the Subsidiary Entities operates both a defined contribution plan and a defined benefit pension plan. Until December 31, 2015, PEMEX only operated a defined benefit pension plan.
Defined contribution pension plan
In this plan, both Petróleos Mexicanos and the Subsidiary Entities and its employees contribute to the worker’s individual account. PEMEX’s contributions are recognized on an accrual basis as cost, expense or asset, and are credited to liability.
Contributions to the defined contribution plan that are not expected to be fully settled within 12 months after the end of the annual reporting period in which the employee rendered related services; they will be discounted using the defined benefit plan discount rate.
Defined benefit plan
Under the defined benefit plan, Petróleos Mexicanos and the Subsidiary Entities are the only parties that contribute to a trust which is managed separately. Petróleos Mexicanos and the Subsidiary Entities recognize the cost for defined benefit plans based on independent actuarial computations applying the projected unit credit method. Actuarial gains and losses are recognized within other comprehensive results for the period in which they are determined.
F-24
PETRÓLEOS MEXICANOS, PRODUCTIVE STATE-OWNED SUBSIDIARIES
AND SUBSIDIARY COMPANIES
NOTES TO THE CONSOLIDATED FINANCIAL STATEMENTS
FOR THE YEARS ENDED DECEMBER 31, 2016, 2015 AND 2014
(FIGURES STATED IN THOUSANDS, EXCEPT AS NOTED)
The costs of prior services are recognized within profit or loss for the period in which they are determined.
The asset or liability in the defined benefit plan comprises the present value of the defined benefit obligation less the fair value of plan assets for which obligations have to be settled. The value of any asset is limited to the present value of any economic benefit represented by the plan reimbursements or reductions of the future contributions to the plan.
In addition, other long term employee benefits include the seniority premiums payable for disability, death and survivors benefits, medical services, gas and basic food basket for beneficiaries.
Termination benefits are recognized in profit or loss for the year in which they are incurred.
| n. | Income taxes and duties |
Current income tax
Current income tax assets or liabilities for the current and prior years are measured as the amount expected to be paid or to be recovered from the tax authorities, using either the tax rates in force or tax rates which are in the process of being approved and are substantially completed by the end of the year.
Current income taxes related with items that are recognized as equity shall be presented in the other comprehensive income of the year. Periodically, PEMEX evaluates the positions taken in its tax returns for those regulations that are subject to interpretation and books corresponding provisions, if it is deemed necessary.
Deferred income taxes
Deferred taxes are recorded based on the assets and liabilities method, which consists on the recognition of deferred taxes by applying tax rates applicable to the income tax to the temporary differences between the carrying value and tax values of assets and liabilities at the date of these consolidated financial statements.
Deferred tax liabilities are recognized for all taxable temporary differences, except to the extent that the deferred tax liability arises from:
| | • | | The initial recognition of goodwill or the initial recognition of an asset or liability in a transaction which is not a business combination and at the time of the transaction, affects neither accounting profit nor taxable profit or tax loss; and |
| | • | | taxable temporary differences associated with investments in subsidiaries, branches and associates, and interest in joint arrangements, when the parent, investor, joint venture or joint operator is able to control the timing of reversal of the temporary difference and it is probable that the temporary difference will not reverse in the foreseeable future. |
Deferred tax assets are recognized for all deductible temporary differences, carry forward of both unused tax credits and unused tax losses to the extent that it is probable that taxable profit will be available against deductible temporary differences, and that the carry forward of both unused tax credits and unused tax losses can be utilized, unless:
| | • | | The deferred tax asset relating to deductible temporary difference arises from the initial recognition of asset or liability derived from a transaction that is not a business combination and, at the time of the transaction, affects neither accounting profit nor taxable profit or tax loss; and |
F-25
PETRÓLEOS MEXICANOS, PRODUCTIVE STATE-OWNED SUBSIDIARIES
AND SUBSIDIARY COMPANIES
NOTES TO THE CONSOLIDATED FINANCIAL STATEMENTS
FOR THE YEARS ENDED DECEMBER 31, 2016, 2015 AND 2014
(FIGURES STATED IN THOUSANDS, EXCEPT AS NOTED)
| | • | | In respect of deductible temporary differences associated with investments in subsidiaries, associates and interests in joint ventures, deferred tax assets are recognized only to the extent that it is probable that the temporary differences will reverse in the foreseeable future and taxable profit will be available, against which the temporary differences can be utilized. |
The carrying amount of a deferred tax asset is reviewed at the end of each reporting period. PEMEX reduces the carrying amount of a deferred tax asset to the extent that it is no longer probable that a sufficient taxable profit will be available to allow the benefit of that deferred tax asset to be utilized in whole or in part. Unrecognized deferred tax assets are revalued at each reporting date and will be recognized to the extent that it is probable that future taxable income will be sufficient to allow for the recovery of the deferred tax asset.
Deferred tax assets and liabilities are measured at the tax rates that are expected to apply to the period when the asset is realized or the liability is settled, based on tax rates (and tax laws) that have been enacted or substantively enacted by the end of the reporting period.
Deferred tax assets and deferred tax liabilities related with items that are recognized in equity shall be presented directly in other comprehensive income.
Deferred tax assets and deferred tax liabilities are offset, if PEMEX has a legal right to set off current tax assets against current tax liabilities and are levied by the same taxation authority or the same taxable entity.
Income taxes and duties
PEMEX is subject to taxes and special duties, which are based on the value of hydrocarbons extracted, with certain deductions.
These taxes and duties are recognized in accordance with IAS 12, “Income Taxes” (IAS 12), when they have the characteristics of income tax, which occurs when such taxes are set by a government authority and are determined on a formula that considers the balance of income (or extraction valued at a selling price) less expenses. Taxes and duties that meet this criteria should be recognized for current and deferred income tax based on the above paragraphs. Taxes and duties that do not meet this criteria are recognized as liabilities, affecting the costs and expenses relating to the transactions that gave rise to them.
| o. | Impuesto Especial sobre Producción y Servicios |
(Special Tax on Production and Services, or “IEPS Tax”)
The IEPS Tax charged to customers is a witholding on domestic sales of gasoline, diesel and fossil fuels. The applicable quotas depend on, among other factors, the product, producer’s price, freight costs, commissions and the region in which the respective product is sold.
Contingency losses are recorded when it is probable that a liability has been incurred and the amount thereof can be reasonably estimated. When a reasonable estimation cannot be made, qualitative disclosure is provided in the notes to the consolidated financial statements. Contingent revenues, earnings or assets are not recognized until realization is assured.
F-26
PETRÓLEOS MEXICANOS, PRODUCTIVE STATE-OWNED SUBSIDIARIES
AND SUBSIDIARY COMPANIES
NOTES TO THE CONSOLIDATED FINANCIAL STATEMENTS
FOR THE YEARS ENDED DECEMBER 31, 2016, 2015 AND 2014
(FIGURES STATED IN THOUSANDS, EXCEPT AS NOTED)
Sales revenue is recognized at the moment when the risks and benefits of ownership of crude oil, refined or gas products, and derivative and petrochemical products are transferred to the customers who acquire them, which occurs as follows:
| | • | | in accordance with contractual terms; |
| | • | | the moment at which the customer picks up product at PEMEX’s facilities; or |
| | • | | the moment at which PEMEX delivers the product to the delivery point. |
Services rendered are recognized as services income when the customers accept the receipt of the services.
| r. | Presentation of consolidated statements of comprehensive income |
The costs and expenses shown in PEMEX’s consolidated statements of comprehensive income are presented based on their function, which allows for a better understanding of the components of PEMEX’s operating income. This classification allows for a comparison to the industry to which PEMEX belongs.
Revenues
Represents revenues from sale or products or services.
Cost of sales
Cost of sales represents the acquisition and production costs of inventories at the time of sale. Cost of sales mainly includes depreciation, amortization, salaries, wages and benefits, a portion of the cost of the reserve for employee benefits and operating expenses related to the production process.
Other revenues (expenses), net
Other revenues (expenses), net consist primarily of income an expenses concepts that are not related directly to the operation of PEMEX.
Transportation, distribution and sale expenses
Transportation, distribution and sale expenses are costs in connection to the storage, sale and delivery of products, such as depreciation and operating expenses associated with these activities.
Administrative expenses
Administrative expenses are costs related to PEMEX’s areas that provide administrative support.
Financing income
Financing income is comprised of interest income, financial income and other income from financial operations between PEMEX and third parties.
F-27
PETRÓLEOS MEXICANOS, PRODUCTIVE STATE-OWNED SUBSIDIARIES
AND SUBSIDIARY COMPANIES
NOTES TO THE CONSOLIDATED FINANCIAL STATEMENTS
FOR THE YEARS ENDED DECEMBER 31, 2016, 2015 AND 2014
(FIGURES STATED IN THOUSANDS, EXCEPT AS NOTED)
Financing cost
Financing cost is comprised of interest expenses, commissions and other expenses related to financing operations minus any portion of the financing cost that is capitalized.
Derivative financial instruments (cost) income, net
Derivative financial instruments (cost) income represents the net effect of the profit or loss for the year associated with DFIs.
Foreign exchange loss, net
Exchange rate variations relating to assets or liabilities governed by contracts denominated in foreign currencies are recorded in income (loss) for the year.
Operating segments are identifiable components of PEMEX that pursue business activities from which PEMEX earns revenues and incurs expenses, including those revenues and expenses from transactions with other segments of PEMEX, and for which information is available to management on a segmented basis and is assessed by the Board of Directors in order to allocate resources and assess the profitability of the segments.
| t. | Non-current assets held for sale,non-current assets held for distribution to owners and discontinued operations |
Non-current asset held for sale
PEMEX classifies anon-current asset, or disposal group of assets, as held for sale if (a) its carrying amount will be recovered principally through a sale transaction rather than through continuing use; (b) the asset or group of assets is available in its present condition for immediate sale and (c) the sale is expected to be completed within one year from the date of classification, or more, with certain exceptions.
Non-current assets classified as held for sale are measured at the lower of its carrying amount, and fair value minus cost of sales and presented in a separate line item in the consolidated statements of financial position.Non-current assets classified as held for sale are not subject to depreciation or amortization after the classification as held for sale.
The liabilities of a disposal group classified as held for sale are presented separately from other liabilities in the statement of financial position. Those assets and liabilities are not offset and presented as a single amount.
Non-current asset held for distribution to owners
When PEMEX agrees to distribute anon-current asset, or disposal group of assets, to owners, this asset or disposal group of assets, is classified as held for distribution to owners if: a)non-current asset or disposal group of assets, is available for immediate distribution in their present conditions and b) the distribution must be highly expected to be completed within one year from the date of classification, with certain exceptions.
F-28
PETRÓLEOS MEXICANOS, PRODUCTIVE STATE-OWNED SUBSIDIARIES
AND SUBSIDIARY COMPANIES
NOTES TO THE CONSOLIDATED FINANCIAL STATEMENTS
FOR THE YEARS ENDED DECEMBER 31, 2016, 2015 AND 2014
(FIGURES STATED IN THOUSANDS, EXCEPT AS NOTED)
Non-current assets classified as held for distribution are measured at the lower of its carrying amount and fair value less cost of distribution and it is presented in a separate line item in the consolidated financial statements.Non-current assets classified as held for distribution are not subject to depreciation or amortization after the classification as held for distribution.
The liabilities of a disposal group classified as held for distribution to owners are presented separately from other liabilities in the statement of financial position. Those assets and liabilities shall not be offset and shall be presented as a single amount.
Discontinued operations
A discontinued operation is a component of an entity that either has been disposed of or is classified as held for sale, and either:
| | • | | represents a separate major line of business or geographical area of operations; |
| | • | | is part or a single coordinated plan to dispose of a separated major line of business or geographical area of operations; or |
| | • | | is a subsidiary acquired exclusively with a view to resale. |
The revenues or expenses from discontinued operations, including profits or losses from previous years, are presented in a specific line item in the consolidated financial statement of comprehensive income.
| u. | New accounting policies not yet adopted |
The IASB issued the new IFRS mentioned below, which are applicable to PEMEX and are effective for annual periods beginning January 1, 2016:
a) Amendments to IAS 16 and IAS 38 “Intangible Assets” (“IAS 38”), to clarify acceptable methods of depreciation and amortization.
| | • | | The amended IAS 16 prohibits entities from using revenue-based depreciation methods for items in property, plant and equipment. |
| | • | | The amended IAS 38 introduces a rebuttable presumption that revenue is not an appropriate basis for amortization of an intangible asset. This presumption can only be rebutted in two limited circumstances: a) the intangible asset is expressed as a measure of revenue; or b) ordinary revenue and the life of the assets are highly associated. |
| | • | | The expected future reductions in selling prices could be indicative of a reduction of the future economic benefits embodied in an asset. |
The amendments had no impact on these consolidated financial statements.
b) Amendments to IFRS 11, “Joint Arrangements” (“IFRS 11”), to address accounting for interest acquisition in joint operations.
| | • | | The amendments to IFRS 11 address how a joint operator should account for the acquisition of an interest in a joint operation that constitutes a business. IFRS 11 now requires that such transactions be |
F-29
PETRÓLEOS MEXICANOS, PRODUCTIVE STATE-OWNED SUBSIDIARIES
AND SUBSIDIARY COMPANIES
NOTES TO THE CONSOLIDATED FINANCIAL STATEMENTS
FOR THE YEARS ENDED DECEMBER 31, 2016, 2015 AND 2014
(FIGURES STATED IN THOUSANDS, EXCEPT AS NOTED)
| | accounted for using the related principles to business combination accounting established in IFRS 3, “Business Combinations” (“IFRS 3”), and additionally requires certain related disclosures. |
| | • | | The amendments also require disclosure of significant information required by IFRS 3. |
| | • | | The most significant impact of the amendments to IFRS 11 will be the recognition of goodwill (when there is an excess of the transferred consideration over the identifiable net asset) and the recognition of deferred tax assets and liabilities. |
| | • | | These amendments are not only applicable in an interest acquisition for a joint operation, but also apply when a business is contributed to the joint operation upon its creation. |
The amendments had no impact on these consolidated financial statements.
c) Amendments to IFRS 5,“Non-Current AssetsHeld-for-Sale and Discontinued Operations” (“IFRS 5”). Change in distribution methods.
The amendments to IFRS 5 introduce specific guidance for the reclassification of an asset fromheld-for-sale toheld-for-distribution-to-owners (or vice versa) or the discontinuation ofheld-for-distribution accounting.
The amendments state that:
| | • | | Such reclassifications should not be considered changes to a plan of sale or a plan of distribution to owners and that the classification, presentation and measurement requirements applicable to the new method of disposal should be applied; and |
| | • | | Assets that no longer meet the criteria forheld-for-distribution-to-owners (and do not meet the criteria forheld-for-sale) should be treated in the same manner as assets that cease to be classified asheld-for-sale. |
The amendments had no impact on these consolidated financial statements.
d) Amendments to IFRS 7, “Financial Instruments: Disclosures” (“IFRS 7”)
The amendments to IFRS 7 provide additional guidance to clarify whether a servicing contract constitutes continuing involvement in a transferred asset for purposes of the required disclosure relating to transferred assets.
The amendments apply retrospectively; however, to avoid the risk of hindsight affecting the determination of the required fair value disclosure, an entity is not required to apply the amendments to any period beginning prior to the annual period during which the amendments are first applied. The amendments also include an amendment to IFRS 1, “First Time Adoption of International Financial Reporting Standards (IFRS 1).”
The amendments apply retrospectively in accordance with IAS 8, “Accounting Policies, Changes in Accounting Estimates and Errors” (“IAS 8”).
The amendments had no impact on these consolidated financial statements.
F-30
PETRÓLEOS MEXICANOS, PRODUCTIVE STATE-OWNED SUBSIDIARIES
AND SUBSIDIARY COMPANIES
NOTES TO THE CONSOLIDATED FINANCIAL STATEMENTS
FOR THE YEARS ENDED DECEMBER 31, 2016, 2015 AND 2014
(FIGURES STATED IN THOUSANDS, EXCEPT AS NOTED)
e) Amendments to IAS 19, “Employee Benefits” (“IAS 19”) Discount rate: issuing in a regional market.
The amendments to IAS 19 clarify that investment-grade corporate bonds used to estimate the discount rate for post-employment benefits should be issued in the same currency as the benefits to be paid. These amendments also provide for the assessment of the depth of the market for investment-grade corporate bonds at the relevant currency level.
The amendments apply retrospectively in accordance with IAS 8.
The amendments had no impact on these consolidated financial statements.
| v. | New IFRS not yet adopted |
The IASB issued amendments and new IFRS that are not effective as of the issuance date of these consolidated financial statements but could have effect in subsequent PEMEX’s financial information.
Amendments that will be applicable in 2017:
a) IAS 12 “Income Taxes: Recognition of Deferred Tax Assets for Unrealized Losses” (“IAS 12”)
The IASB issues amendments to IAS 12 to clarify the diversity of practices in the recognition of deferred tax assets for unrealized losses related to debt instruments measured at fair value. The amendments to IAS 12 include some explanatory paragraphs and an illustrative example.
The amendments clarify the following aspects of IAS 12:
| | • | | Unrealized losses on debt instruments measured at fair value for accounting purposes and measured at cost for tax purposes give rise to deductible temporary differences regardless of whether the debt instrument’s holder expects to recover the carrying amount of the debt instrument by sale or by use. |
| | • | | The carrying amount of an asset does not limit the estimation of probable future taxable profits. |
| | • | | Estimates of future taxable profits exclude tax deductions resulting from the reversal of deductible temporary differences. |
| | • | | An entity assesses a deferred tax asset in combination with other deferred tax assets. Where tax law restricts the utilization of tax losses, an entity would assess a deferred tax asset in combination with other deferred tax assets of the same type. |
The amendments are to be applied retrospectively and are effective for annual periods beginning on or after January 1, 2017. Earlier application is permitted.
PEMEX is in the process of evaluating the impact that these standards will have on its consolidated financial statements.
b) Amendments to IAS 7 “Statement of Cash Flows” (“IAS 7”)
The IASB issued amendments to IAS 7. The amendments are intended to clarify disclosure provided to the user of financial statements about an entity’s financing activities.
F-31
PETRÓLEOS MEXICANOS, PRODUCTIVE STATE-OWNED SUBSIDIARIES
AND SUBSIDIARY COMPANIES
NOTES TO THE CONSOLIDATED FINANCIAL STATEMENTS
FOR THE YEARS ENDED DECEMBER 31, 2016, 2015 AND 2014
(FIGURES STATED IN THOUSANDS, EXCEPT AS NOTED)
Changes
The amendments in IAS 7 come with the objective that entities shall provide disclosures that enable users of financial statements to evaluate changes in liabilities arising from financing activities.
To achieve this objective, the IASB requires that the following changes in liabilities arising from financing activities are disclosed: (i) changes from financing cash flows; (ii) changes arising from obtaining or losing control of subsidiaries or other businesses; (iii) the effects of changes in foreign exchange rate; (iv) changes in fair values; and (v) other changes.
The IASB defines liabilities arising from financing activities as liabilities “for which cash flows were, or future cash flows will be, classified in the statements of cash flows as cash flows from financing activities.” It also stresses that the new disclosure requirements also relate to changes in financial assets if they meet the same definition.
The amendments state that one way to fulfill the new disclosure requirements is to provide reconciliation between the opening and closing balances in the statement of financial position for liabilities arising from financing activities.
Finally, the amendments state that changes in liabilities arising from financing activities must be disclosed separately from changes in other assets and liabilities.
The amendments are effective for annual periods beginning on or after January 1, 2017. Earlier application is permitted. Entities need not provide comparative information when they first apply the amendments.
PEMEX is in the process of evaluating the impact that these standards will have on its financial statements.
c) IFRS 12 “Disclosure of Interest in Other Entities” (“IFRS 12”) – Annual Improvements to IFRS 2014 – 2016 Cycle.
As of December 2016, the IASB published Annual Improvements to IFRS 2014 – 2016 Cycle, which clarified the scope of IFRS 12, by specifying that the disclosure requirements apply to all subsidiaries, joint arrangements, associates and unconsolidated structured entities classified as held for sale, held for distribution or as discontinued operations in accordance with IFRS 5, with certain exceptions.
The amendments are going to be applied restrospectively and are effective for annual periods beginning on or after January 1, 2017.
PEMEX is in the process of evaluating the impact that these standards will have on its financial statements.
Amendments effective for periods beginning in 2018:
a) IFRS 15, “Revenue from Contracts with Customers” (“IFRS 15”)
The IASB issued the amendment to IFRS 15 to provide a single comprehensive model for the accounting of revenue from contracts with customers and replaces the current guidelines on revenue recognition.
The core principle of the new IFRS 15 is that an entity should recognize revenue as the promised transfer of goods or services to the customer, valued at the amount that the entity expects to be entitled in exchanged for those goods or services.
F-32
PETRÓLEOS MEXICANOS, PRODUCTIVE STATE-OWNED SUBSIDIARIES
AND SUBSIDIARY COMPANIES
NOTES TO THE CONSOLIDATED FINANCIAL STATEMENTS
FOR THE YEARS ENDED DECEMBER 31, 2016, 2015 AND 2014
(FIGURES STATED IN THOUSANDS, EXCEPT AS NOTED)
Pursuant to IFRS 15, an entity should:
| | • | | identify customer contracts that fall within the scope of the new standard; |
| | • | | identify the separate performance obligations in the contract based on the following criteria: i) sales of goods or services, separately, ii) sales that are dependent or interrelated with other products or services; and iii) homogeneous and consistent sales pattern; |
| | • | | determine the price of the transaction by applying the following considerations: i) variable consideration and constraining estimates of variable consideration; ii) the existence of a significant financing component in the contract; iii) anynon-cash consideration; and iv) the consideration payable to the customer; |
| | • | | allocate the transaction price to each separate performance obligation; and |
| | • | | recognize revenue when (or as) each performance obligation is satisfied either over time or at a point in time. |
The new IFRS 15 enhances disclosures of revenue. This standard must be applied for periods beginning on or after January 1, 2018, and early application is permitted. During the year of application, entities may apply the rule retrospectively or use a modified approach.
PEMEX is in the process of evaluating the impact that these standards will have on its financial statements.
b) IFRS 9, “Financial Instruments” (“IFRS 9”(2014))
The IASB issued IFRS 9 (2009) and IFRS 9 (2010), which introduced new classification and measurement requirements. In 2013, the IASB released a new model for hedge accounting. The final version of IFRS 9, which was issued in July 2014 (“IFRS 9 (2014)”), replaces the previous versions of IFRS 9 and completes the IASB’s project to replace IAS 39, “Financial Instruments.”
The package of improvements introduced by IFRS 9 (2014) includes a logical model for classification and measurement, a single, forward-looking “expected loss” impairment model and a substantially reformed approach to hedge accounting.
Classification and Measurement
Classification under IFRS 9 (2014) determines how financial assets and liabilities are recognized in financial statements and, in particular, how they are measured on an ongoing basis. IFRS 9 (2014) introduces a logical approach to the classification of financial assets, which is based on the cash flow characteristics of the financial asset and the entity’s business model for managing the financial assets. This principle-based approach replaces the existing classification and measurement requirements.
Impairment
As part of IFRS 9 (2014), the IASB introduced a new, single impairment model that is applicable to all financial instruments and eliminates the complexity associated with multiple impairment models. The new
F-33
PETRÓLEOS MEXICANOS, PRODUCTIVE STATE-OWNED SUBSIDIARIES
AND SUBSIDIARY COMPANIES
NOTES TO THE CONSOLIDATED FINANCIAL STATEMENTS
FOR THE YEARS ENDED DECEMBER 31, 2016, 2015 AND 2014
(FIGURES STATED IN THOUSANDS, EXCEPT AS NOTED)
impairment model requires an entity to recognize expected credit losses on a timelier basis and to update the amount of expected losses throughout the useful life of a financial instrument. Additional disclosure is required to describe the basis for recognizing expected credit losses and any changes in the estimated amount of expected credit losses.
Hedge Accounting
IFRS 9 (2014) includes significant changes to hedge accounting, such as new disclosure requirements that require a description of an entity’s risk management activities. The new model represents a comprehensive review of hedge accounting and aligns the accounting with risk management in order to better reflect risk management activities in the financial statements. These changes are intended to provide better disclosure about the risks that an entity faces and the impact of risk management activities on its financial information.
Credit Risk
IFRS 9 (2014) also aims to eliminate the volatility in financial results caused by changes in the credit risk of liabilities that are measured at fair value. Under IFRS 9 (2014), earnings from the impairment credit risk of liabilities are recognized in other comprehensive income rather than directly in profit or net loss.
IFRS 9 (2014) is effective for annual periods beginning on or after January 1, 2018. Earlier application is permitted. Additionally, the new standards relating to credit risk may be applied early and in isolation, without adopting other modifications to the recognition of financial instruments.
PEMEX is in the process of evaluating the impact that these standards will have on its financial statements.
c) IAS 28 “Investments in Associates and Joint Ventures” (“IAS 28”) – Annual Improvements to IFRS 2014 – 2016 Cycle.
As of December 2016, the IASB published Annual Improvements to IFRS Cycle 2014 – 2016, which clarified that a venture capital organization or a mutual fund, unit trust and similar entities may elect, at initial recognition, to measure investment in an associate or joint venture at fair value through recognizing the changes in profits.
The amendments are effective for periods beginning on or after January 1, 2018.
PEMEX is in the process of evaluating the impact that these standards will have on its financial statements.
d) Amendments to IAS 40 “Investment Property” (“IAS 40”) – Transfers of Investment Property
These amendments were made to state that an entity transfer a property to, or from, investment property occurs when, and only when, there is evidence of a change of use. A change of use occurs if property meets, or ceases to meet, the definition of investment property. A change in management’s intentions for the use of a property by itself does not constitute evidence of a change in use.
Additionally, examples of evidence of a change in use were included.
The amendments are effective for periods beginning on or after January 1, 2018.
F-34
PETRÓLEOS MEXICANOS, PRODUCTIVE STATE-OWNED SUBSIDIARIES
AND SUBSIDIARY COMPANIES
NOTES TO THE CONSOLIDATED FINANCIAL STATEMENTS
FOR THE YEARS ENDED DECEMBER 31, 2016, 2015 AND 2014
(FIGURES STATED IN THOUSANDS, EXCEPT AS NOTED)
PEMEX is in the process of evaluating the impact that these standards will have on its financial statements.
e) Interpretation of IFRIC 22 “Foreign Currency Transactions and Advance Considerations” (IFRIC 22)
As of December 2016, IASB published an interpretation of IFRIC 22 developed by the International Financial Reporting Standards Interpretations Committee (the Interpretations Committee). The interpretation clarified when to recognize payments and collections of foreign currency transactions paid in advance due the fact that it observed some diversity in practice regarding these transactions.
The interpretations recognized foreign currency transactions when:
| | • | | there is consideration that is denominated or priced in a foreign currency; |
| | • | | the entity recognizes a prepayment asset or a deferred income liability in respect of that consideration, in advance of the recognition of the related asset, expense or income; and |
| | • | | the prepayment asset or deferred income liability isnon-monetary. |
The Interpretations Committee concluded that:
| | • | | The date of the transaction, for the purpose of determining the exchange rate, is the date of initial recognition of thenon- monetary prepayment asset or deferred income liability. |
| | • | | If there are multiple payments or receipts in advance, a date of transaction is established for each payment or receipt. |
IFRIC 22 is effective for annual reporting periods beginning on or after January 1, 2018. Entities may apply the rule retrospectively, or prospectively, in accordance with IAS 8 with certain exemptions.
PEMEX is in the process of evaluating the impact that these standards will have on its financial statements.
Standards effective for periods beginning in 2019
IFRS 16, “Leases” (“IFRS 16”)
In January 2016, the IASB published a new accounting standard IFRS 16, which replaces IAS 17, “Leases and Guide interpretations.”
The main changes from the previous standard are:
| | • | | IFRS 16 provides a comprehensive model for the identification of the lease arrangements and their treatment in the financial statements of both lessees and lessors; |
| | • | | the new standard applies a control model to the identification of leases, distinguishing between leases and service contracts on the basis of whether there is an identified asset controlled by the customer; |
| | • | | the distinction between financial and operating leasing is removed, therefore, the assets and liabilities are recognized in respect of all leases, with some exceptions for short-term leases and leases oflow-value assets; and |
F-35
PETRÓLEOS MEXICANOS, PRODUCTIVE STATE-OWNED SUBSIDIARIES
AND SUBSIDIARY COMPANIES
NOTES TO THE CONSOLIDATED FINANCIAL STATEMENTS
FOR THE YEARS ENDED DECEMBER 31, 2016, 2015 AND 2014
(FIGURES STATED IN THOUSANDS, EXCEPT AS NOTED)
| | • | | the standard does not include significant changes to the requirements for accounting by lessors. The standard is effective for annual periods beginning on or after January 1, 2019, with earlier application permitted for entities that have also adopted IFRS 15, “Revenue from Contracts with Customers.” |
PEMEX is in the process of assessing the impact this new standard will have on its financial statements.
For comparison purposes, the following amounts in the consolidated financial statements as of December 31, 2015 were reclassified to add long-term notes receivable as a separate line item from other assets in the consolidated financial statements as of December 31, 2016.
| | | | | | | | | | | | |
Line item | | December 31, 2015
(as previously reported) | | | Reclassification | | | December 31, 2015
(following reclasification) | |
Other assets | | Ps. | 57,407,660 | | | Ps. | (50,000,000 | ) | | Ps. | 7,407,660 | |
Long-term notes receivable | | Ps. | — | | | Ps. | 50,000,000 | | | Ps. | 50,000,000 | |
These reclassifications had no impact on PEMEX’s total assets or liabilities.
NOTE 4. SUBSIDIARY ENTITIES AND SUBSIDIARY COMPANIES
As of December 31, 2016, the Subsidiary Entities consolidated in these financial statements include Pemex Exploration and Production, Pemex Industrial Transformation, Pemex Cogeneration and Services, Pemex Drilling and Services, Pemex Logistics, Pemex Fertilizers and Pemex Ethylene.
The consolidated Subsidiary Companies are as follows:
| | • | | P.M.I. Marine, Ltd. (PMI Mar) (i) |
| | • | | P.M.I. Services, B.V. (PMI SHO) (i) |
| | • | | P.M.I. Holdings, B.V. (PMI HBV) (i) |
| | • | | P.M.I. Trading, Ltd. (PMI Trading) (i) |
| | • | | PEMEX Internacional España, S. A. (PMI SES) (i) |
| | • | | P.M.I. Holdings Petróleos España, S.L. (HPE) (i) |
| | • | | P.M.I. Services North América, Inc. (PMI SUS) (i) |
| | • | | P.M.I. Holdings North América, Inc. (PMI HNA) (i) |
| | • | | P.M.I. Norteamérica, S. A. de C. V. (PMI NASA) (i) |
| | • | | P.M.I. Comercio Internacional, S. A. de C. V. (PMI CIM) (i)(ii) |
| | • | | PMI Field Management Resources, S.L. (FMR) (i) |
| | • | | PMI Campos Maduros SANMA, S. de R. L. de C. V. (SANMA) (i) |
| | • | | Pro-Agroindustria, S. A. de C. V. (AGRO) (i)(iii) |
| | • | | PMI Azufre Industrial, S. A. de C. V. (PMI AZIND) (i)(iii) |
F-36
PETRÓLEOS MEXICANOS, PRODUCTIVE STATE-OWNED SUBSIDIARIES
AND SUBSIDIARY COMPANIES
NOTES TO THE CONSOLIDATED FINANCIAL STATEMENTS
FOR THE YEARS ENDED DECEMBER 31, 2016, 2015 AND 2014
(FIGURES STATED IN THOUSANDS, EXCEPT AS NOTED)
| | • | | PMI Infraestructura de Desarrollo, S. A. de C. V. (PMI ID) (i)(iii) |
| | • | | PMI Cinturón Transoceánico Gas Natural, S.A. de C.V. (PMI CT) (i)(iv) |
| | • | | PMI Transoceánico Gas LP, S.A. de C.V. (PMI TG) (i)(iv) |
| | • | | PMI Servicios Portuarios Transoceánicos, S.A. de C.V. (PMI SP) (i)(iv) |
| | • | | PMI Midstream del Centro, S.A. de C.V. (PMI MC) (i)(iv) |
| | • | | Pemex Procurement International, Inc. (PPI) |
| | • | | Hijos de J. Barreras, S. A. (HJ BARRERAS) (ii) |
| | • | | Pemex Finance, Ltd. (FIN) (ii) |
| | • | | Mex Gas Internacional, S.L. (MGAS) (v) |
| | • | | Pemex Desarrollo e Inversión Inmobiliaria, S.A. de C.V. (III)(vi) |
| | • | | Kot Insurance Company, AG. (KOT) |
| | • | | PPQ Cadena Productiva, S.L. (PPQCP) |
| | • | | III Servicios, S. A. de C. V. (III Servicios) |
| | • | | PMI Ducto de Juárez, S. de R.L. de C.V. (PMI DJ) (i)(vii) |
| | • | | PMX Cogeneración Internacional, S.L. (MG COG) (viii)(x) |
| | • | | PMX Cogeneración S.A.P.I. de C.V. (PMX COG) (viii) |
| | • | | PMX Fertilizantes Holding, S.A de C.V. (PMX FH) (viii) |
| | • | | PMX Fertilizantes Pacífico, S.A. de C.V. (PMX FP) (viii) |
| | • | | Grupo Fertinal (GP FER) (viii) |
| | • | | Compañía Mexicana de Exploraciones, S.A. de C.V. (COMESA) (ix) |
| | i. | Member Company of the “PMI Subsidiaries”. |
| | ii. | Non-controlling Interest Company. |
| | iii. | As of August 2014, these companies were included in the consolidated financial statements of PEMEX. |
| | iv. | As of February 2015, these companies were included in the consolidated financial statements of PEMEX. |
| | v. | Until May 2014, formerly Mex Gas International, Ltd. |
| | vi. | Until September 2015, formerly Instalaciones Inmobiliarias para Industrias, S.A. de C.V. |
| | vii. | As of January 2016, this company started operations and was included in the consolidated financial statements of PEMEX. |
| | viii. | As of June 2016, this company started operations and was included in the consolidated financial statements of PEMEX. |
| | ix. | As of July 2016 this company was included in the consolidated financial statements of PEMEX. |
| | x. | Until October 2016, formerly Mex Gas Cogeneración S.L. |
NOTE 5. Segment financial information
PEMEX’s primary business is the exploration and production of crude oil and natural gas, as well as the production, processing, marketing and distribution of petroleum and petrochemical products. After the Corporate Reorganization, PEMEX’s operations are now conducted through nine business segments: exploration and production, industrial transformation, cogeneration and services, drilling and services, logistics, ethylene,
F-37
PETRÓLEOS MEXICANOS, PRODUCTIVE STATE-OWNED SUBSIDIARIES
AND SUBSIDIARY COMPANIES
NOTES TO THE CONSOLIDATED FINANCIAL STATEMENTS
FOR THE YEARS ENDED DECEMBER 31, 2016, 2015 AND 2014
(FIGURES STATED IN THOUSANDS, EXCEPT AS NOTED)
fertilizers, the Trading Companies and Corporate and Other Operating Subsidiary Companies. The results for refining, gas and basic petrochemicals and petrochemicals reported in a separate segment during 2015, are now reported under the industrial transformation segment. In addition, information for 2015 relating to the segments of the Subsidiary Entities includes the results of the operation as of its creation date (see Note 1). For comparison purposes, results for the year ended December 31, 2015 are also presented using Industrial Transformation, and do not separate out the results for refining, gas and basic petrochemicals and petrochemicals. Due to PEMEX’s structure, there are significant quantities of inter-segment sales among the reporting segments, which are made at internal transfer prices established by PEMEX reflecting international market prices.
The primary sources of revenue for PEMEX’s business segments following the Corporate Reorganization are as described below:
| | • | | The exploration and production segment earns revenues from sales of domestic crude oil and natural gas, and from exporting crude oil through certain of the Trading Companies. Export sales are made through PMI CIM to approximately 34 major customers in various foreign markets. Approximately half of PEMEX’s crude oil is sold to Pemex Industrial Transformation. |
| | • | | The industrial transformation segment earns revenues from sales of refined petroleum products and derivatives, mainly to third parties within the domestic market. This segment also sells a significant portion of the fuel oil produced to the Comisión Federal de Electricidad (Federal Electricity Commission, or “CFE”) and a significant portion of jet fuel produced to Aeropuertos y Servicios Auxiliares (the Airports and Auxiliary Services Agency). The refining segment’s most important products are different types of gasoline and diesel. |
| | • | | Industrial transformation also earns revenues from domestic sources generated by sales of natural gas, liquefied petroleum gas, naphtha, butane and ethane and certain other petrochemicals such as methane derivatives, ethane derivatives, aromatics and derivatives. |
| | • | | The cogeneration segment receives income from the cogeneration, supply and sale of electricity and thermal energy; it also provides technical and management activities associated with these services. |
| | • | | The drilling segment receives income from drilling services, and wells repair and services. |
| | • | | The logistics segment earns income from transportation, storage and related services of crude oil, petroleum products and petrochemicals, through strategies such as pipelines and maritime and terrestrial resources, and from the provision of services related to the maintenance and handling of the products and guard and management services. |
| | • | | The ethylene segment earns revenues from the distribution and trade of methane, ethane and propylene in the domestic market. |
| | • | | The fertilizers segment earns revenues from trading ammonia, fertilizers and its derivatives, mostly in the domestic market. |
| | • | | The trading companies segment, which consist of PMI CIM, PMI NASA, PMI Trading and MGAS (the “Trading Companies”), earn revenues from trading crude oil, natural gas and petroleum and petrochemical products within international markets. |
| | • | | The segment related to corporate and other operating Subsidiary Companies provides administrative, financing, consulting and logistical services, as well as economic, tax and legal advice to PEMEX’s entities and companies. |
F-38
PETRÓLEOS MEXICANOS, PRODUCTIVE STATE-OWNED SUBSIDIARIES
AND SUBSIDIARY COMPANIES
NOTES TO THE CONSOLIDATED FINANCIAL STATEMENTS
FOR THE YEARS ENDED DECEMBER 31, 2016, 2015 AND 2014
(FIGURES STATED IN THOUSANDS, EXCEPT AS NOTED)
The following tables present the condensed financial information of these segments, after elimination of unrealized intersegment gain (loss), and include only select line items. As a result, the line items presented below may not total. These reporting segments are those which PEMEX’s management evaluates in its analysis of PEMEX and makes decisions.
| | | | | | | | | | | | | | | | | | | | | | | | | | | | | | | | | | | | | | | | | | | | |
As of/for the year ended December 31, 2016 | | Exploration
and
Production | | | Industrial
Transformation | | | Cogeneration
and Services | | | Drilling and
Services | | | Logistics | | | Fertilizers | | | Ethylene | | | Trading
Companies | | | Corporate and
Other Operating
Subsidiary
Companies | | | Intersegment
eliminations | | | Total | |
Sales: | | | | | | | | | | | | | | | | | | | | | | | | | | | | | | | | | | | | | | | | | | | | |
Trade | | Ps. | — | | | Ps. | 648,088,013 | | | Ps. | — | | | Ps. | — | | | Ps. | — | | | Ps. | 3,873,403 | | | Ps. | 15,392,552 | | | Ps. | 395,118,117 | | | Ps. | 2,646,505 | | | Ps. | — | | | Ps. | 1,065,118,590 | |
Intersegment | | | 616,380,615 | | | | 117,096,378 | | | | 51,913 | | | | 1,981,754 | | | | 68,316,958 | | | | 900,464 | | | | 1,764,438 | | | | 405,293,283 | | | | 50,683,175 | | | | (1,262,468,978 | ) | | | — | |
Services income | | | — | | | | 5,565,604 | | | | 132,521 | | | | 70,112 | | | | 2,813,887 | | | | 1,908 | | | | 60,141 | | | | 236,230 | | | | 5,925,854 | | | | (379,176 | ) | | | 14,427,081 | |
(Reversal) Impairment of wells pipe-lines, properties, plant and equipment | | | (271,709,433 | ) | | | (52,498,881 | ) | | | — | | | | — | | | | (5,829,520 | ) | | | — | | | | (1,276,509 | ) | | | — | | | | | | | | — | | | | (331,314,343 | ) |
Cost of sales | | | 359,064,884 | | | | 823,763,927 | | | | 166,721 | | | | 143,956 | | | | 61,248,584 | | | | 5,506,198 | | | | 13,936,213 | | | | 783,691,245 | | | | 9,018,456 | | | | (1,188,959,550 | ) | | | 867,580,634 | |
| | | | | | | | | | | | | | | | | | | | | | | | | | | | | | | | | | | | | | | | | | | | |
Gross income (loss) | | | 529,025,164 | | | | (515,051 | ) | | | 17,713 | | | | 1,907,910 | | | | 15,711,781 | | | | (730,423 | ) | | | 4,557,427 | | | | 16,956,385 | | | | 50,237,078 | | | | (73,888,604 | ) | | | 543,279,380 | |
Other revenues (expenses), net | | | 27,346,794 | | | | 19,964,654 | | | | — | | | | 591,704 | | | | (27,189,969 | ) | | | 32,710 | | | | 63,989 | | | | 3,412,711 | | | | (4,600,209 | ) | | | (666,804 | ) | | | 18,955,580 | |
Distribution, transportation and sales expenses | | | — | | | | 50,792,317 | | | | 8,232 | | | | 6 | | | | 148,215 | | | | 185,168 | | | | 481,727 | | | | 229,432 | | | | 49,162 | | | | (26,663,019 | ) | | | 25,231,240 | |
Administrative expenses | | | 54,509,047 | | | | 34,183,846 | | | | 32,126 | | | | 983,560 | | | | 7,175,451 | | | | 731,479 | | | | 2,101,834 | | | | 1,157,182 | | | | 60,497,232 | | | | (48,718,224 | ) | | | 112,653,533 | |
| | | | | | | | | | | | | | | | | | | | | | | | | | | | | | | | | | | | | | | | | | | | |
Operating income (loss) | | | 501,862,911 | | | | (65,526,560 | ) | | | (22,645 | ) | | | 1,516,048 | | | | (18,801,854 | ) | | | (1,614,360 | ) | | | 2,037,855 | | | | 18,982,482 | | | | (14,909,525 | ) | | | 825,835 | | | | 424,350,187 | |
Financing income | | | 56,040,129 | | | | 11,056,345 | | | | — | | | | 72,995 | | | | 373,301 | | | | 4,358 | | | | 64,582 | | | | 1,098,079 | | | | 125,964,466 | | | | (180,925,000 | ) | | | 13,749,255 | |
Financing cost | | | (109,946,363 | ) | | | (3,188,892 | ) | | | (12,055 | ) | | | (642,711 | ) | | | (481,741 | ) | | | (20,217 | ) | | | (2,980 | ) | | | (1,342,351 | ) | | | (163,400,779 | ) | | | 180,193,625 | | | | (98,844,464 | ) |
Derivative financial instruments (cost) income, net | | | — | | | | 3,172 | | | | — | | | | — | | | | — | | | | — | | | | — | | | | (1,951,959 | ) | | | (12,052,200 | ) | | | — | | | | (14,000,987 | ) |
Foreign exchange (loss) income, net | | | (217,166,718 | ) | | | (12,858,875 | ) | | | — | | | | (1,570,317 | ) | | | (1,118,537 | ) | | | (29,263 | ) | | | (2,843 | ) | | | 174,866 | | | | (21,441,056 | ) | | | — | | | | (254,012,743 | ) |
(Loss) profit sharing in associates | | | (21,164 | ) | | | 649,520 | | | | — | | | | — | | | | — | | | | — | | | | — | | | | 1,586,503 | | | | (117,426,818 | ) | | | 117,347,804 | | | | 2,135,845 | |
Taxes, duties and other | | | 276,647,448 | | | | — | | | | — | | | | (481,581 | ) | | | (10,010,686 | ) | | | — | | | | — | | | | 7,380,870 | | | | (9,014,616 | ) | | | — | | | | 264,521,435 | |
| | | | | | | | | | | | | | | | | | | | | | | | | | | | | | | | | | | | | | | | | | | | |
Net (loss) income | | | (45,878,653 | ) | | | (69,865,290 | ) | | | (34,700 | ) | | | (142,404 | ) | | | (10,018,145 | ) | | | (1,659,482 | ) | | | 2,096,614 | | | | 11,166,750 | | | | (194,251,296 | ) | | | 117,442,264 | | | | (191,144,342 | ) |
| | | | | | | | | | | | | | | | | | | | | | | | | | | | | | | | | | | | | | | | | | | | |
Total current assets | | | 983,260,710 | | | | 795,237,287 | | | | 388,422 | | | | 6,032,213 | | | | 22,087,801 | | | | 1,724,967 | | | | 5,817,262 | | | | 125,081,531 | | | | 611,464,455 | | | | (2,195,695,848 | ) | | | 355,398,800 | |
Permanent investments in associates and other | | | 139,523 | | | | 257,159 | | | | — | | | | — | | | | — | | | | — | | | | — | | | | 17,568,893 | | | | (244,932,588 | ) | | | 250,121,645 | | | | 23,154,632 | |
Wells, pipelines, properties, plant and equipment, net | | | 1,176,504,263 | | | | 311,432,174 | | | | — | | | | 21,023,629 | | | | 86,695,514 | | | | 7,771,634 | | | | 20,086,650 | | | | 6,691,813 | | | | 37,536,571 | | | | — | | | | 1,667,742,248 | |
Total assets | | | 2,206,418,541 | | | | 1,107,094,580 | | | | 388,423 | | | | 27,673,598 | | | | 130,824,921 | | | | 9,556,469 | | | | 26,007,319 | | | | 155,376,864 | | | | 2,359,024,145 | | | | (3,692,478,836 | ) | | | 2,329,886,024 | |
Total current liabilities | | | 340,011,451 | | | | 666,467,674 | | | | 472,236 | | | | 3,894,121 | | | | 19,824,792 | | | | 2,995,088 | | | | 3,879,828 | | | | 78,894,485 | | | | 1,497,612,971 | | | | (2,187,862,760 | ) | | | 426,189,886 | |
Long-term debt | | | 1,737,109,328 | | | | 31,495,027 | | | | — | | | | 12,489,423 | | | | 4,382,109 | | | | — | | | | — | | | | 3,597,938 | | | | 1,757,315,685 | | | | (1,739,384,968 | ) | | | 1,807,004,542 | |
Employee benefits | | | 362,312,386 | | | | 575,277,374 | | | | 191,876 | | | | 441,127 | | | | 571,702 | | | | 20,362 | | | | 21,893 | | | | (749,034 | ) | | | 282,321,750 | | | | — | | | | 1,220,409,436 | |
Total liabilities | | | 2,533,221,665 | | | | 1,278,138,290 | | | | 664,829 | | | | 16,853,202 | | | | 29,336,417 | | | | 3,015,450 | | | | 3,901,722 | | | | 86,885,889 | | | | 3,553,477,189 | | | | (3,942,600,482 | ) | | | 3,562,894,171 | |
Equity (deficit), net | | | (326,803,124 | ) | | | (171,043,710 | ) | | | (276,406 | ) | | | 10,820,396 | | | | 101,488,504 | | | | 6,541,019 | | | | 22,105,597 | | | | 68,490,975 | | | | (1,194,453,044 | ) | | | 250,121,646 | | | | (1,233,008,147 | ) |
Depreciation and amortization | | | 124,329,921 | | | | 17,425,472 | | | | — | | | | 2,559,357 | | | | 2,230,557 | | | | 481,241 | | | | 1,395,232 | | | | 86,707 | | | | 1,931,004 | | | | — | | | | 150,439,491 | |
Net periodic cost of employee benefits | | | 32,617,215 | | | | 52,886,397 | | | | 5,860 | | | | 31,491 | | | | 30,340 | | | | (1,178 | ) | | | 1,424 | | | | (552,735 | ) | | | 24,719,602 | | | | — | | | | 109,738,416 | |
Acquisition of wells, pipelines, properties, plant and equipment | | | 70,418,370 | | | | 32,254,531 | | | | — | | | | 2,053,139 | | | | 26,344,495 | | | | 889,420 | | | | 1,724,690 | | | | 1,019,484 | | | | 21,031,214 | | | | — | | | | 155,735,343 | |
F-39
PETRÓLEOS MEXICANOS, PRODUCTIVE STATE-OWNED SUBSIDIARIES
AND SUBSIDIARY COMPANIES
NOTES TO THE CONSOLIDATED FINANCIAL STATEMENTS
FOR THE YEARS ENDED DECEMBER 31, 2016, 2015 AND 2014
(FIGURES STATED IN THOUSANDS, EXCEPT AS NOTED)
| | | | | | | | | | | | | | | | | | | | | | | | | | | | | | | | | | | | | | | | | | | | |
As of/for the year ended December 31, 2015 | | Exploration
and
Production | | | Industrial
Transformation | | | Cogeneration
and Services | | | Drilling and
Services | | | Logistics | | | Fertilizers | | | Ethylene | | | Trading
Companies | | | Corporate and
Other Operating
Subsidiary
Companies | | | Intersegment
eliminations | | | Total | |
Sales: | | | | | | | | | | | | | | | | | | | | | | | | | | | | | | | | | | | | | | | | | | | | |
Trade | | Ps. | — | | | Ps. | 740,190,020 | | | Ps. | — | | | Ps. | — | | | Ps. | — | | | Ps. | 1,494,478 | | | Ps. | 4,551,413 | | | Ps. | 407,214,446 | | | Ps. | — | | | Ps. | — | | | Ps. | 1,153,450,357 | |
Intersegment | | | 690,642,133 | | | | 126,294,195 | | | | — | | | | 1,511,970 | | | | 598,853 | | | | 209,970 | | | | 473,990 | | | | 353,137,149 | | | | 18,296,515 | | | | (1,191,164,775 | ) | | | — | |
Services income | | | — | | | | 7,549,061 | | | | — | | | | — | | | | 10,355,988 | | | | 236 | | | | 17,893 | | | | 661,683 | | | | 5,107,109 | | | | (10,779,858 | ) | | | 12,912,112 | |
Impairment of wells, pipelines, properties, plant and equipment | | | 394,396,580 | | | | 76,442,079 | | | | — | | | | — | | | | 5,829,519 | | | | — | | | | 1,276,512 | | | | — | | | | — | | | | — | | | | 477,944,690 | |
Benefit from change in pension plan | | | (46,368,308 | ) | | | (45,808,781 | ) | | | — | | | | — | | | | — | | | | — | | | | — | | | | — | | | | — | | | | — | | | | (92,177,089 | ) |
Cost of sales | | | 427,158,621 | | | | 876,531,944 | | | | 2,793 | | | | 706,896 | | | | 10,727,462 | | | | 1,707,548 | | | | 4,965,414 | | | | 749,655,199 | | | | 5,895,648 | | | | (1,182,282,621 | ) | | | 895,068,904 | |
| | | | | | | | | | | | | | | | | | | | | | | | | | | | | | | | | | | | | | | | | | | | |
Gross (loss) income | | | (84,544,760 | ) | | | (33,131,966 | ) | | | (2,793 | ) | | | 805,074 | | | | (5,602,140 | ) | | | (2,864 | ) | | | (1,198,630 | ) | | | 11,358,079 | | | | 17,507,976 | | | | (19,662,012 | ) | | | (114,474,036 | ) |
Other (expenses) revenues, net | | | (7,957,202 | ) | | | 1,243,040 | | | | — | | | | 38 | | | | 26,941 | | | | 14,680 | | | | 19,909 | | | | 1,666,783 | | | | 721,759 | | | | 1,890,786 | | | | (2,373,266 | ) |
Distribution, transportation and sales expenses | | | — | | | | 35,292,527 | | | | 1,448 | | | | — | | | | 3,009 | | | | 4,416 | | | | 62,071 | | | | 428,613 | | | | 254 | | | | (6,863,699 | ) | | | 28,928,639 | |
Administrative expenses | | | 18,454,281 | | | | 40,529,587 | | | | 47,670 | | | | 8,553 | | | | 104,794 | | | | 152,404 | | | | 519,351 | | | | 1,967,581 | | | | 61,609,813 | | | | (10,921,939 | ) | | | 112,472,095 | |
Benefit from change in pension plan | | | (17,853,725 | ) | | | (39,975,450 | ) | | | — | | | | — | | | | — | | | | — | | | | — | | | | — | | | | (46,031,780 | ) | | | — | | | | (103,860,955 | ) |
| | | | | | | | | | | | | | | | | | | | | | | | | | | | | | | | | | | | | | | | | | | | |
Operating (loss) income | | | (93,102,518 | ) | | | (67,735,590 | ) | | | (51,911 | ) | | | 796,559 | | | | (5,683,002 | ) | | | (145,004 | ) | | | (1,760,143 | ) | | | 10,628,668 | | | | 2,651,448 | | | | 14,412 | | | | (154,387,081 | ) |
Financing income | | | 25,852,078 | | | | 2,789,535 | | | | — | | | | 43,690 | | | | 37 | | | | 3,503 | | | | 7,728 | | | | 1,147,870 | | | | 110,816,691 | | | | (125,670,273 | ) | | | 14,990,859 | |
Financing cost | | | (90,822,360 | ) | | | (13,738,104 | ) | | | 2,110 | | | | (95,280 | ) | | | (61,153 | ) | | | — | | | | — | | | | (1,299,580 | ) | | | (87,289,616 | ) | | | 125,530,390 | | | | (67,773,593 | ) |
Derivative financial instruments (cost) income, net | | | — | | | | 6,463 | | | | — | | | | — | | | | — | | | | — | | | | — | | | | 1,347,323 | | | | (22,803,663 | ) | | | — | | | | (21,449,877 | ) |
Foreign exchange loss, net | | | (132,165,427 | ) | | | (7,364,486 | ) | | | (7,509 | ) | | | (92,046 | ) | | | (11,090 | ) | | | (3,600 | ) | | | (2,802 | ) | | | (49,190 | ) | | | (15,069,424 | ) | | | — | | | | (154,765,574 | ) |
(Loss) profit sharing in associates and other | | | (473,082 | ) | | | 671,868 | | | | — | | | | — | | | | — | | | | — | | | | — | | | | 2,056,259 | | | | (749,900,890 | ) | | | 749,963,960 | | | | 2,318,115 | |
Taxes, duties and other | | | 376,682,705 | | | | 1,839,021 | | | | — | | | | 197,491 | | | | (2,069,848 | ) | | | — | | | | — | | | | 5,134,176 | | | | (50,283,298 | ) | | | — | | | | 331,500,247 | |
| | | | | | | | | | | | | | | | | | | | | | | | | | | | | | | | | | | | | | | | | | | | |
Net (loss) income | | | (667,394,014 | ) | | | (87,209,335 | ) | | | (57,310 | ) | | | 455,432 | | | | (3,685,360 | ) | | | (145,101 | ) | | | (1,755,217 | ) | | | 8,697,174 | | | | (711,312,156 | ) | | | 749,838,489 | | | | (712,567,398 | ) |
| | | | | | | | | | | | | | | | | | | | | | | | | | | | | | | | | | | | | | | | | | | | |
Total current assets | | | 709,252,019 | | | | 313,801,630 | | | | 655,239 | | | | 2,171,717 | | | | 49,162,929 | | | | 1,594,643 | | | | 4,988,511 | | | | 73,116,155 | | | | 275,582,816 | | | | (1,163,125,162 | ) | | | 267,200,497 | |
Permanent investments in associates and other | | | 919,654 | | | | 6,687,977 | | | | — | | | | — | | | | — | | | | 8,500 | | | | — | | | | 11,845,489 | | | | (242,233,405 | ) | | | 246,937,384 | | | | 24,165,599 | |
Wells, pipelines, properties, plant and equipment, net | | | 966,144,619 | | | | 246,463,069 | | | | — | | | | 22,647,454 | | | | 58,078,603 | | | | 7,405,969 | | | | 18,480,684 | | | | 3,045,704 | | | | 22,217,529 | | | | — | | | | 1,344,483,631 | |
Total assets | | | 1,698,909,240 | | | | 567,486,579 | | | | 655,240 | | | | 24,917,981 | | | | 111,307,038 | | | | 9,034,376 | | | | 23,705,118 | | | | 93,266,620 | | | | 1,443,189,885 | | | | (2,196,817,877 | ) | | | 1,775,654,200 | |
Total current liabilities | | | 278,507,394 | | | | 104,569,842 | | | | 469,524 | | | | 1,981,652 | | | | 14,698,159 | | | | 1,486,468 | | | | 4,534,980 | | | | 34,749,438 | | | | 1,157,183,570 | | | | (1,154,773,306 | ) | | | 443,407,721 | |
Long-term debt | | | 1,252,239,594 | | | | 16,707,005 | | | | — | | | | 12,031,849 | | | | 4,850,905 | | | | — | | | | — | | | | 3,607,840 | | | | 1,285,676,066 | | | | (1,274,240,092 | ) | | | 1,300,873,167 | |
Employee benefits | | | 379,150,943 | | | | 609,492,623 | | | | 61,171 | | | | 417,817 | | | | 368,036 | | | | 12,533 | | | | 3,611 | | | | (59,581 | ) | | | 289,938,288 | | | | — | | | | 1,279,385,441 | |
Total liabilities | | | 1,985,557,185 | | | | 735,280,560 | | | | 530,696 | | | | 14,431,318 | | | | 19,917,100 | | | | 1,499,001 | | | | 4,538,591 | | | | 41,420,792 | | | | 2,747,910,113 | | | | (2,443,755,258 | ) | | | 3,107,330,098 | |
Equity (deficit), net | | | (286,647,945 | ) | | | (167,793,981 | ) | | | 124,544 | | | | 10,486,663 | | | | 91,389,938 | | | | 7,535,375 | | | | 19,166,527 | | | | 51,845,828 | | | | (1,304,720,228 | ) | | | 246,937,381 | | | | (1,331,675,898 | ) |
Depreciation and amortization | | | 144,567,149 | | | | 20,916,796 | | | | — | | | | 612,741 | | | | 337,364 | | | | 158,505 | | | | 442,504 | | | | 84,493 | | | | 831,698 | | | | — | | | | 167,951,250 | |
Net periodic cost of employee benefits | | | 23,608,485 | | | | 21,392,600 | | | | (298 | ) | | | — | | | | (310 | ) | | | — | | | | — | | | | (119,819 | ) | | | 17,668,484 | | | | — | | | | 62,549,142 | |
Acquisition of wells, pipelines, properties, plant and equipment | | | 184,786,051 | | | | 68,935,841 | | | | — | | | | — | | | | 1,544,224 | | | | 320,762 | | | | 1,882,108 | | | | 677,314 | | | | 6,711,511 | | | | — | | | | 264,857,811 | |
F-40
PETRÓLEOS MEXICANOS, PRODUCTIVE STATE-OWNED SUBSIDIARIES
AND SUBSIDIARY COMPANIES
NOTES TO THE CONSOLIDATED FINANCIAL STATEMENTS
FOR THE YEARS ENDED DECEMBER 31, 2016, 2015 AND 2014
(FIGURES STATED IN THOUSANDS, EXCEPT AS NOTED)
| | | | | | | | | | | | | | | | | | | | | | | | | | | | | | | | |
As of / for the year ended December 31, 2014 | | Exploration
and
Production | | | Refining | | | Gas and Basic
Petrochemicals | | | Petrochemicals | | | Trading
Companies | | | Corporate and
Other Operating
Subsidiary
Companies | | | Intersegment
eliminations | | | Total | |
Sales: | | | | | | | | | | | | | | | | | | | | | | | | | | | | | | | | |
Trade | | Ps. | — | | | Ps. | 758,988,560 | | | Ps. | 157,715,607 | | | Ps. | 28,293,812 | | | Ps. | 630,291,313 | | | Ps. | — | | | Ps. | — | | | Ps. | 1,575,289,292 | |
Intersegment | | | 1,134,519,972 | | | | 78,453,236 | | | | 84,198,317 | | | | 15,181,899 | | | | 433,732,307 | | | | 65,377,209 | | | | (1,811,462,940 | ) | | | — | |
Services income | | | — | | | | 4,016,699 | | | | 2,038,629 | | | | 779,978 | | | | 777,160 | | | | 4,743,987 | | | | (917,871 | ) | | | 11,438,582 | |
Impairment of wells, pipelines, properties, plant and equipment | | | 21,199,705 | | | | — | | | | — | | | | 1,445,991 | | | | — | | | | — | | | | — | | | | 22,645,696 | |
Cost of sales | | | 336,376,922 | | | | 916,867,969 | | | | 238,920,142 | | | | 46,215,742 | | | | 1,059,616,060 | | | | 3,730,490 | | | | (1,759,092,541 | ) | | | 842,634,784 | |
| | | | | | | | | | | | | | | | | | | | | | | | | | | | | | | | |
Gross income (loss) | | | 776,943,345 | | | | (75,409,474 | ) | | | 5,032,411 | | | | (3,406,044 | ) | | | 5,184,720 | | | | 66,390,706 | | | | (53,288,270 | ) | | | 721,447,394 | |
Other (expenses) revenues, net | | | (3,190,604 | ) | | | 39,332,749 | | | | 376,111 | | | | (361,504 | ) | | | 643,043 | | | | 1,011,199 | | | | (258,597 | ) | | | 37,552,397 | |
Distribution, transportation and sales expenses | | | — | | | | 31,071,231 | | | | 3,024,325 | | | | 1,061,157 | | | | 493,651 | | | | 468 | | | | (3,468,166 | ) | | | 32,182,666 | |
Administrative expenses | | | 43,131,979 | | | | 31,941,961 | | | | 11,038,955 | | | | 14,107,044 | | | | 1,806,000 | | | | 59,442,914 | | | | (50,131,739 | ) | | | 111,337,114 | |
| | | | | | | | | | | | | | | | | | | | | | | | | | | | | | | | |
Operating income (loss) | | | 730,620,762 | | | | (99,089,917 | ) | | | (8,654,758 | ) | | | (18,935,749 | ) | | | 3,528,112 | | | | 7,958,523 | | | | 53,038 | | | | 615,480,011 | |
Financing income | | | 14,784,998 | | | | 258,069 | | | | 2,653,747 | | | | 142,115 | | | | 1,157,820 | | | | 87,371,829 | | | | (103,354,391 | ) | | | 3,014,187 | |
Financing cost | | | (74,492,786 | ) | | | (9,917,204 | ) | | | (346,660 | ) | | | (72,354 | ) | | | (1,068,869 | ) | | | (69,026,534 | ) | | | 103,365,347 | | | | (51,559,060 | ) |
Derivative financial instruments income (cost), net | | | — | | | | — | | | | 8,116 | | | | — | | | | 4,652,123 | | | | (14,098,809 | ) | | | — | | | | (9,438,570 | ) |
Foreign exchange loss, net | | | (63,865,750 | ) | | | (5,077,441 | ) | | | (132,849 | ) | | | (29,136 | ) | | | (96,785 | ) | | | (7,797,200 | ) | | | — | | | | (76,999,161 | ) |
Profit (loss) sharing in associates | | | 203,285 | | | | — | | | | 284,080 | | | | — | | | | (247,303 | ) | | | (263,425,082 | ) | | | 263,219,388 | | | | 34,368 | |
Taxes, duties and other | | | 760,627,534 | | | | — | | | | (21,772,116 | ) | | | — | | | | 3,839,908 | | | | 3,379,438 | | | | — | | | | 746,074,764 | |
| | | | | | | | | | | | | | | | | | | | | | | | | | | | | | | | |
Net (loss) income | | | (153,377,025 | ) | | | (113,826,493 | ) | | | 15,583,792 | | | | (18,895,124 | ) | | | 4,085,190 | | | | (262,396,711 | ) | | | 263,283,382 | | | | (265,542,989 | ) |
| | | | | | | | | | | | | | | | | | | | | | | | | | | | | | | | |
Depreciation and amortization | | | 121,034,025 | | | | 11,435,739 | | | | 7,039,030 | | | | 2,685,896 | | | | 80,990 | | | | 799,107 | | | | — | | | | 143,074,787 | |
Net periodic cost of employee benefits | | | 37,582,742 | | | | 38,198,504 | | | | 9,338,059 | | | | 11,512,589 | | | | 177,003 | | | | 24,914,431 | | | | — | | | | 121,723,328 | |
Acquisition of wells, pipelines, properties, plant and equipment | | | 174,019,012 | | | | 39,087,896 | | | | 5,632,770 | | | | 4,709,838 | | | | 2,545,075 | | | | 8,007,600 | | | | — | | | | 234,002,191 | |
F-41
PETRÓLEOS MEXICANOS, PRODUCTIVE STATE-OWNED SUBSIDIARIES
AND SUBSIDIARY COMPANIES
NOTES TO THE CONSOLIDATED FINANCIAL STATEMENTS
FOR THE YEARS ENDED DECEMBER 31, 2016, 2015 AND 2014
(FIGURES STATED IN THOUSANDS, EXCEPT AS NOTED)
PEMEX’s management measures the performance of the segments based on operating income and net segment income before elimination of unrealized intersegment gain (loss), as well as by analyzing the impact of the results of each segment in the consolidated financial statements. For certain of the items in these consolidated financial statements to agree with the individual financial statements of the operating segments, they must be reconciled. The tables below present the financial information of PEMEX’s operating segments, before intersegment eliminations:
The following tables present accounting conciliations between individual and consolidated information.
| | | | | | | | | | | | | | | | | | | | | | | | | | | | | | | | | | | | |
As of/for the year ended December 31, 2016 | | Exploration and
Production | | | Industrial
Transformation | | | Cogeneration
and Services | | | Drilling and
Services | | | Logistics | | | Fertilizers | | | Ethylene | | | Trading
Companies | | | Corporate and
Other
Operating
Subsidiary
Companies | |
Sales: | | | | | | | | | | | | | | | | | | | | | | | | | | | | | | | | | | | | |
By segment | | Ps. | 616,380,615 | | | | 771,597,427 | | | | 184,434 | | | | 6,263,093 | | | | 71,130,845 | | | | 4,775,775 | | | | 17,217,131 | | | | 800,979,076 | | | | 59,255,534 | |
Less unrealized intersegment sales | | | — | | | | (847,432 | ) | | | — | | | | (4,211,227 | ) | | | — | | | | — | | | | — | | | | (331,446 | ) | | | — | |
| | | | | | | | | | | | | | | | | | | | | | | | | | | | | | | | | | | | |
Total consolidated sales | | Ps. | 616,380,615 | | | | 770,749,995 | | | | 184,434 | | | | 2,051,866 | | | | 71,130,845 | | | | 4,775,775 | | | | 17,217,131 | | | | 800,647,630 | | | | 59,255,534 | |
| | | | | | | | | | | | | | | | | | | | | | | | | | | | | | | | | | | | |
Operating income (loss): | | | | | | | | | | | | | | | | | | | | | | | | | | | | | | | | | | | | |
By segment | | Ps. | 503,679,153 | | | | (60,347,367 | ) | | | (22,645 | ) | | | 1,271,202 | | | | (25,701,065 | ) | | | (2,877,725 | ) | | | (3,504,812 | ) | | | 19,526,997 | | | | ( 14,909,526 | ) |
Less unrealized intersegment sales | | | — | | | | (847,432 | ) | | | — | | | | (4,211,227 | ) | | | — | | | | — | | | | — | | | | (331,446 | ) | | | — | |
Less unrealized gain due to production cost valuation of inventory | | | (273,237 | ) | | | 3,572,498 | | | | — | | | | 3,815,371 | | | | — | | | | 905,910 | | | | (2,163 | ) | | | (213,069 | ) | | | — | |
Less capitalized refined products | | | (1,661,986 | ) | | | (7,904,259 | ) | | | — | | | | — | | | | — | | | | — | | | | — | | | | — | | | | — | |
Less amortization of capitalized interest | | | 118,981 | | | | — | | | | — | | | | — | | | | — | | | | — | | | | — | | | | — | | | | — | |
Less depreciation of revaluated assets | | | — | | | | — | | | | — | | | | 640,702 | | | | 6,899,211 | | | | 357,455 | | | | 5,544,830 | | | | — | | | | — | |
| | | | | | | | | | | | | | | | | | | | | | | | | | | | | | | | | | | | |
Total consolidated operating income (loss) | | Ps. | 501,862,911 | | | | (65,526,560 | ) | | | (22,645 | ) | | | 1,516,048 | | | | (18,801,854 | ) | | | (1,614,360 | ) | | | 2,037,855 | | | | 18,982,482 | | | | ( 14,909,526 | ) |
| | | | | | | | | | | | | | | | | | | | | | | | | | | | | | | | | | | | |
Net income (loss): | | | | | | | | | | | | | | | | | | | | | | | | | | | | | | | | | | | | |
By segment | | Ps. | (44,069,001 | ) | | | (61,639,067 | ) | | | (381,214 | ) | | | (387,250 | ) | | | (16,917,356 | ) | | | (7,820,835 | ) | | | (3,780,706 | ) | | | 11,711,265 | | | | (194,251,297 | ) |
Less unrealized intersegment sales | | | — | | | | (847,432 | ) | | | — | | | | (4,211,227 | ) | | | — | | | | — | | | | — | | | | (331,446 | ) | | | — | |
Less unrealized gain due to production cost valuation of inventory | | | (273,237 | ) | | | 3,572,498 | | | | — | | | | 3,815,371 | | | | — | | | | 905,910 | | | | (2,163 | ) | | | (213,069 | ) | | | — | |
Less capitalized refined products | | | (1,661,986 | ) | | | (7,904,259 | ) | | | — | | | | — | | | | — | | | | — | | | | — | | | | — | | | | — | |
Less equity method elimination | | | 6,590 | | | | (3,047,030 | ) | | | 346,514 | | | | — | | | | — | | | | 4,897,988 | | | | 334,653 | | | | — | | | | — | |
Less amortization of capitalized interest | | | 118,981 | | | | — | | | | — | | | | — | | | | — | | | | — | | | | — | | | | — | | | | — | |
Less depreciation of revaluated assets | | | — | | | | — | | | | — | | | | 640,702 | | | | 6,899,211 | | | | 357,455 | | | | 5,544,830 | | | | — | | | | — | |
| | | | | | | | | | | | | | | | | | | | | | | | | | | | | | | | | | | | |
Total consolidated net (loss) income | | Ps. | (45,878,653 | ) | | | (69,865,290 | ) | | | (34,700 | ) | | | (142,404 | ) | | | (10,018,145 | ) | | | (1,659,482 | ) | | | 2,096,614 | | | | 11,166,750 | | | | (194,251,297 | ) |
| | | | | | | | | | | | | | | | | | | | | | | | | | | | | | | | �� | | | | |
F-42
PETRÓLEOS MEXICANOS, PRODUCTIVE STATE-OWNED SUBSIDIARIES
AND SUBSIDIARY COMPANIES
NOTES TO THE CONSOLIDATED FINANCIAL STATEMENTS
FOR THE YEARS ENDED DECEMBER 31, 2016, 2015 AND 2014
(FIGURES STATED IN THOUSANDS, EXCEPT AS NOTED)
| | | | | | | | | | | | | | | | | | | | | | | | | | | | | | | | | | | | |
As of/for the year ended December 31, 2016 | | Exploration and
Production | | | Industrial
Transformation | | | Cogeneration
and Services | | | Drilling and
Services | | | Logistics | | | Fertilizers | | | Ethylene | | | Trading
Companies | | | Corporate and
Other
Operating
Subsidiary
Companies | |
Assets: | | | | | | | | | | | | | | | | | | | | | | | | | | | | | | | | | | | | |
By segment | | Ps. | 2,232,052,453 | | | | 1,151,907,566 | | | | 425,141 | | | | 30,990,147 | | | | 254,615,026 | | | | 10,421,225 | | | | 43,067,636 | | | | 170,782,928 | | | | 2,359,024,145 | |
Less unrealized intersegment sales | | | 483,230 | | | | (4,158,101 | ) | | | — | | | | — | | | | — | | | | — | | | | (5,304 | ) | | | (332,529 | ) | | | — | |
Less unrealized gain due to production cost valuation of inventory | | | (3,246,782 | ) | | | (33,361,438 | ) | | | — | | | | — | | | | — | | | | — | | | | — | | | | (5,688,341 | ) | | | — | |
Less capitalized refined products | | | (1,661,986 | ) | | | — | | | | — | | | | — | | | | — | | | | — | | | | — | | | | — | | | | — | |
Less depreciation of revalued assets | | | (20,585,300 | ) | | | — | | | | — | | | | (3,316,549 | ) | | | (123,790,105 | ) | | | (5,300,044 | ) | | | (12,746,136 | ) | | | (652 | ) | | | — | |
Less equity method for unrealized profits | | | (742,055 | ) | | | ( 7,293,447 | ) | | | (36,718 | ) | | | — | | | | — | | | | 4,435,288 | | | | (4,308,877 | ) | | | (8,960,344 | ) | | | — | |
Less amortization of capitalized interest | | | 118,981 | | | | — | | | | — | | | | — | | | | — | | | | — | | | | — | | | | (424,198 | ) | | | — | |
| | | | | | | | | | | | | | | | | | | | | | | | | | | | | | | | | | | | |
Total consolidated assets | | Ps. | 2,206,418,541 | | | | 1,107,094,580 | | | | 388,423 | | | | 27,673,598 | | | | 130,824,921 | | | | 9,556,469 | | | | 26,007,319 | | | | 155,376,864 | | | | 2,359,024,145 | |
| | | | | | | | | | | | | | | | | | | | | | | | | | | | | | | | | | | | |
Liabilities: | | | | | | | | | | | | | | | | | | | | | | | | | | | | | | | | | | | | |
By segment | | Ps. | 2,533,221,665 | | | | 1,282,558,220 | | | | 664,829 | | | | 16,457,347 | | | | 29,336,417 | | | | 3,015,450 | | | | 3,901,722 | | | | 85,392,123 | | | | 3,553,477,189 | |
Less unrealized intersegment sales | | | — | | | | (4,419,930 | ) | | | — | | | | 395,855 | | | | — | | | | — | | | | — | | | | 1,493,766 | | | | — | |
| | | | | | | | | | | | | | | | | | | | | | | | | | | | | | | | | | | | |
Total consolidated liabilities | | Ps. | 2,533,221,665 | | | | 1,278,138,290 | | | | 664,829 | | | | 16,853,202 | | | | 29,336,417 | | | | 3,015,450 | | | | 3,901,722 | | | | 86,885,889 | | | | 3,553,477,189 | |
| | | | | | | | | | | | | | | | | | | | | | | | | | | | | | | | | | | | |
F-43
PETRÓLEOS MEXICANOS, PRODUCTIVE STATE-OWNED SUBSIDIARIES
AND SUBSIDIARY COMPANIES
NOTES TO THE CONSOLIDATED FINANCIAL STATEMENTS
FOR THE YEARS ENDED DECEMBER 31, 2016, 2015 AND 2014
(FIGURES STATED IN THOUSANDS, EXCEPT AS NOTED)
| | | | | | | | | | | | | | | | | | | | | | | | | | | | | | | | | | | | |
As of/for the year ended
December 31, 2015 | | Exploration and
Production | | | Industrial
Transformation | | | Cogeneration and
Services | | | Drilling and
Services | | | Logistics | | | Fertilizers | | | Ethylene | | | Trading
Companies | | | Corporate and
Other Operating
Subsidiary
Companies | |
Sales: | | | | | | | | | | | | | | | | | | | | | | | | | | | | | | | | | | | | |
By segment | | Ps. | 690,642,133 | | | Ps. | 874,630,488 | | | Ps. | — | | | Ps. | 1,511,970 | | | Ps. | 10,954,841 | | | Ps. | 1,704,684 | | | Ps. | 5,048,600 | | | Ps. | 761,213,475 | | | Ps. | 23,403,624 | |
Less unrealized intersegment sales | | | — | | | | (597,212 | ) | | | — | | | | — | | | | — | | | | — | | | | (5,304 | ) | | | (200,197 | ) | | | — | |
| | | | | | | | | | | | | | | | | | | | | | | | | | | | | | | | | | | | |
Total consolidated sales | | Ps. | 690,642,133 | | | Ps. | 874,033,276 | | | Ps. | — | | | Ps. | 1,511,970 | | | Ps. | 10,954,841 | | | Ps. | 1,704,684 | | | Ps. | 5,043,296 | | | Ps. | 761,013,278 | | | Ps. | 23,403,624 | |
| | | | | | | | | | | | | | | | | | | | | | | | | | | | | | | | | | | | |
Operating income (loss): | | | | | | | | | | | | | | | | | | | | | | | | | | | | | | | | | | | | |
By segment | | Ps. | (89,473,302 | ) | | Ps. | (88,819,558 | ) | | Ps. | (51,911) | | | Ps. | 700,748 | | | Ps. | (6,875,252 | ) | | Ps. | (262,145 | ) | | Ps. | (2,288,747 | ) | | Ps. | 10,334,138 | | | Ps. | 2,651,448 | |
Less unrealized intersegment sales | | | — | | | | (597,212 | ) | | | — | | | | — | | | | — | | | | — | | | | (5,304 | ) | | | (200,197 | ) | | | — | |
Less unrealized gain due to production cost valuation of inventory | | | (251,995 | ) | | | 21,681,180 | | | | — | | | | — | | | | — | | | | — | | | | 2,163 | | | | 494,727 | | | | — | |
Less capitalized refined products | | | (3,496,201 | ) | | | — | | | | — | | | | — | | | | — | | | | — | | | | — | | | | — | | | | — | |
Less amortization of capitalized interest | | | 118,980 | | | | — | | | | — | | | | — | | | | — | | | | — | | | | — | | | | — | | | | — | |
Less depreciation of revaluated assets | | | — | | | | — | | | | — | | | | 95,811 | | | | 1,192,250 | | | | 117,141 | | | | 531,745 | | | | — | | | | — | |
| | | | | | | | | | | | | | | | | | | | | | | | | | | | | | | | | | | | |
Total consolidated operating (loss) income | | Ps. | (93,102,518 | ) | | Ps. | (67,735,590 | ) | | Ps. | (51,911 | ) | | Ps. | 796,559 | | | Ps. | (5,683,002 | ) | | Ps. | (145,004 | ) | | Ps. | (1,760,143 | ) | | Ps. | 10,628,668 | | | Ps. | 2,651,448 | |
| | | | | | | | | | | | | | | | | | | | | | | | | | | | | | | | | | | | |
Net income (loss): | | | | | | | | | | | | | | | | | | | | | | | | | | | | | | | | | | | | |
By segment | | Ps. | (663,719,119 | ) | | Ps. | (107,164,261 | ) | | Ps. | (57,310 | ) | | Ps. | 359,621 | | | Ps. | (4,877,610 | ) | | Ps. | (262,242 | ) | | Ps. | (2,314,774 | ) | | Ps. | 8,402,644 | | | Ps. | (711,312,156 | ) |
Less unrealized intersegment sales | | | — | | | | (597,212 | ) | | | — | | | | — | | | | — | | | | — | | | | (5,304 | ) | | | (200,197 | ) | | | — | |
Less unrealized gain due to production cost valuation of inventory | | | (251,995 | ) | | | 21,681,180 | | | | — | | | | — | | | | — | | | | — | | | | 2,163 | | | | 494,727 | | | | — | |
Less capitalized refined products | | | (3,496,201 | ) | | | — | | | | — | | | | — | | | | — | | | | — | | | | — | | | | — | | | | | |
Less equity method elimination | | | (45,679 | ) | | | (1,129,042 | ) | | | — | | | | — | | | | — | | | | — | | | | 30,953 | | | | — | | | | — | |
Less amortization of capitalized interest | | | 118,980 | | | | — | | | | — | | | | — | | | | — | | | | — | | | | — | | | | — | | | | — | |
Less depreciation of revaluated assets | | | — | | | | — | | | | — | | | | 95,811 | | | | 1,192,250 | | | | 117,141 | | | | 531,745 | | | | — | | | | — | |
| | | | | | | | | | | | | | | | | | | | | | | | | | | | | | | | | | | | |
Total consolidated net (loss) income | | Ps. | (667,394,014 | ) | | Ps. | (87,209,335 | ) | | Ps. | (57,310 | ) | | Ps. | 455,432 | | | Ps. | (3,685,360 | ) | | Ps. | (145,101 | ) | | Ps. | (1,755,217 | ) | | Ps. | 8,697,174 | | | Ps. | (711,312,156 | ) |
| | | | | | | | | | | | | | | | | | | | | | | | | | | | | | | | | | | | |
F-44
PETRÓLEOS MEXICANOS, PRODUCTIVE STATE-OWNED SUBSIDIARIES
AND SUBSIDIARY COMPANIES
NOTES TO THE CONSOLIDATED FINANCIAL STATEMENTS
FOR THE YEARS ENDED DECEMBER 31, 2016, 2015 AND 2014
(FIGURES STATED IN THOUSANDS, EXCEPT AS NOTED)
| | | | | | | | | | | | | | | | | | | | | | | | | | | | | | | | | | | | |
As of/for the year ended
December 31, 2015 | | Exploration and
Production | | | Industrial
Transformation | | | Cogeneration and
Services | | | Drilling and
Services | | | Logistics | | | Fertilizers | | | Ethylene | | | Trading
Companies | | | Corporate and
Other Operating
Subsidiary
Companies | |
Assets: | | | | | | | | | | | | | | | | | | | | | | | | | | | | | | | | | | | | |
By segment | | | Ps.1,722,396,075 | | | | Ps. 599,848,048 | | | | Ps.655,240 | | | | Ps.28,875,231 | | | | Ps.247,480,983 | | | | Ps.15,166,563 | | | | Ps.45,951,979 | | | | Ps. 98,305,071 | | | | Ps.1,443,189,885 | |
Less unrealized intersegment sales | | | 1,132 | | | | (3,502,902 | ) | | | — | | | | — | | | | — | | | | — | | | | (5,304 | ) | | | (293,536 | ) | | | — | |
Less unrealized gain due to production cost valuation of inventory | | | (19,699,526 | ) | | | (25,264,947 | ) | | | — | | | | — | | | | — | | | | — | | | | 2,163 | | | | (4,744,915 | ) | | | — | |
Less capitalized refined products | | | (3,496,201 | ) | | | — | | | | — | | | | — | | | | — | | | | — | | | | — | | | | — | | | | | |
Less equity method for unrealized profits | | | (411,221 | ) | | | (3,593,620 | ) | | | — | | | | — | | | | — | | | | — | | | | (3,952,754 | ) | | | — | | | | — | |
Less amortization of capitalized interest | | | 118,981 | | | | — | | | | — | | | | — | | | | — | | | | — | | | | — | | | | — | | | | — | |
Less market value of fixed assets elimination | | | — | | | | — | | | | — | | | | (3,957,250 | ) | | | (136,173,945 | ) | | | (6,132,187 | ) | | | (18,290,966 | ) | | | — | | | | — | |
| | | | | | | | | | | | | | | | | | | | | | | | | | | | | | | | | | | | |
Total consolidated assets | | | Ps.1,698,909,240 | | | | Ps.567,486,579 | | | | Ps.655,240 | | | | Ps.24,917,981 | | | | Ps.111,307,038 | | | | Ps.9,034,376 | | | | Ps.23,705,118 | | | | Ps. 93,266,620 | | | | Ps.1,443,189,885 | |
| | | | | | | | | | | | | | | | | | | | | | | | | | | | | | | | | | | | |
Liabilities: | | | | | | | | | | | | | | | | | | | | | | | | | | | | | | | | | | | | |
By segment | | | Ps.1,985,557,185 | | | | Ps.735,280,560 | | | | Ps.530,696 | | | | Ps.14,431,318 | | | | Ps.19,917,100 | | | | Ps. 1,499,001 | | | | Ps. 4,538,591 | | | | Ps.39,895,655 | | | | Ps.2,747,910,113 | |
Less unrealized intersegment sales | | | — | | | | — | | | | — | | | | — | | | | — | | | | — | | | | — | | | | 1,525,137 | | | | — | |
| | | | | | | | | | | | | | | | | | | | | | | | | | | | | | | | | | | | |
Total consolidated liabilities | | | Ps.1,985,557,185 | | | | Ps. 735,280,560 | | | | Ps.530,696 | | | | Ps.14,431,318 | | | | Ps. 19,917,100 | | | | Ps. 1,499,001 | | | | Ps. 4,538,591 | | | | Ps. 41,420,792 | | | | Ps.2,747,910,113 | |
| | | | | | | | | | | | | | | | | | | | | | | | | | | | | | | | | | | | |
F-45
PETRÓLEOS MEXICANOS, PRODUCTIVE STATE-OWNED SUBSIDIARIES
AND SUBSIDIARY COMPANIES
NOTES TO THE CONSOLIDATED FINANCIAL STATEMENTS
FOR THE YEARS ENDED DECEMBER 31, 2016, 2015 AND 2014
(FIGURES STATED IN THOUSANDS, EXCEPT AS NOTED)
| | | | | | | | | | | | | | | | | | | | | | | | |
For the year ended December 31, 2014 | | Exploration
and Production | | | Refining | | | Gas and Basic
Petrochemicals | | | Petrochemicals | | | Trading
Companies | | | Corporate and Other
Subsidiary Companies | |
Sales: | | | | | | | | | | | | | | | | | | | | | | | | |
By segment | | Ps. | 1,134,519,972 | | | Ps. | 844,558,586 | | | Ps. | 243,972,757 | | | Ps. | 44,258,725 | | | Ps. | 1,064,903,042 | | | Ps. | 70,121,196 | |
Less unrealized intersegment sales | | | — | | | | (3,100,091 | ) | | | (20,204 | ) | | | (3,036 | ) | | | (102,262 | ) | | | — | |
| | | | | | | | | | | | | | | | | | | | | | | | |
Total consolidated sales | | Ps. | 1,134,519,972 | | | Ps. | 841,458,495 | | | Ps. | 243,952,553 | | | Ps. | 44,255,689 | | | Ps. | 1,064,800,780 | | | Ps. | 70,121,196 | |
| | | | | | | | | | | | | | | | | | | | | | | | |
Operating income (loss): | | | | | | | | | | | | | | | | | | | | | | | | |
By segment | | Ps. | 730,817,884 | | | Ps. | (101,970,712 | ) | | Ps. | (9,527,142 | ) | | Ps. | (19,066,287 | ) | | Ps. | 5,844,320 | | | Ps. | 7,958,523 | |
Less unrealized intersegment sales | | | — | | | | (3,100,091 | ) | | | (20,204 | ) | | | (3,036 | ) | | | (102,262 | ) | | | — | |
Less unrealized gain due to productioncost valuation of inventory | | | 3,473,742 | | | | 5,980,886 | | | | 892,588 | | | | 133,574 | | | | (2,213,946 | ) | | | — | |
Less capitalized refined products | | | (3,789,845 | ) | | | — | | | | — | | | | — | | | | — | | | | — | |
Less amortization of capitalized interest | | | 118,981 | | | | — | | | | — | | | | — | | | | — | | | | — | |
| | | | | | | | | | | | | | | | | | | | | | | | |
Total consolidated operating income (loss) | | Ps. | 730,620,762 | | | Ps. | (99,089,917 | ) | | Ps. | (8,654,758 | ) | | Ps. | (18,935,749 | ) | | Ps. | 3,528,112 | | | Ps. | 7,958,523 | |
| | | | | | | | | | | | | | | | | | | | | | | | |
Net income (loss): | | | | | | | | | | | | | | | | | | | | | | | | |
By segment | | Ps. | (153,150,787 | ) | | Ps. | (116,707,288 | ) | | Ps. | 16,255,028 | | | Ps. | (19,129,147 | ) | | Ps. | 6,401,398 | | | Ps. | (262,297,846 | ) |
Less unrealized intersegment sales | | | — | | | | (3,100,091 | ) | | | (20,204 | ) | | | (3,036 | ) | | | (102,262 | ) | | | — | |
Less unrealized gain due to productioncost valuation of inventory | | | 3,473,742 | | | | 5,980,886 | | | | 892,588 | | | | 133,574 | | | | (2,213,946 | ) | | | — | |
Less capitalized refined products | | | (3,789,845 | ) | | | — | | | | — | | | | — | | | | — | | | | — | |
Less equity method for unrealized profits | | | (29,116 | ) | | | — | | | | (1,543,620 | ) | | | 103,485 | | | | — | | | | (98,865 | ) |
Less amortization of capitalized interest | | | 118,981 | | | | — | | | | — | | | | — | | | | — | | | | — | |
| | | | | | | | | | | | | | | | | | | | | | | | |
Total consolidated net (loss) income | | Ps. | (153,377,025 | ) | | Ps. | (113,826,493 | ) | | Ps. | 15,583,792 | | | Ps. | (18,895,124 | ) | | Ps. | 4,085,190 | | | Ps. | (262,396,711 | ) |
| | | | | | | | | | | | | | | | | | | | | | | | |
F-46
PETRÓLEOS MEXICANOS, PRODUCTIVE STATE-OWNED SUBSIDIARIES
AND SUBSIDIARY COMPANIES
NOTES TO THE CONSOLIDATED FINANCIAL STATEMENTS
FOR THE YEARS ENDED DECEMBER 31, 2016, 2015 AND 2014
(FIGURES STATED IN THOUSANDS, EXCEPT AS NOTED)
Supplemental geographic information:
| | | | | | | | | | | | |
| | | For the years ended December 31, | |
| | | 2016 | | | 2015 | | | 2014 | |
Domestic sales | | Ps. | 670,000,473 | | | Ps. | 746,235,912 | | | Ps. | 944,997,979 | |
| | | | | | | | | | | | |
Export sales: | | | | | | | | | | | | |
United States | | | 221,954,461 | | | | 266,826,499 | | | | 481,364,906 | |
Canada, Central and South America | | | 14,058,897 | | | | 11,027,813 | | | | 17,575,078 | |
Europe | | | 64,348,997 | | | | 58,707,787 | | | | 54,214,041 | |
Other | | | 94,755,762 | | | | 70,652,346 | | | | 77,137,288 | |
| | | | | | | | | | | | |
Total export sales | | | 395,118,117 | | | | 407,214,445 | | | | 630,291,313 | |
| | | | | | | | | | | | |
Services income | | | 14,427,081 | | | | 12,912,112 | | | | 11,438,582 | |
| | | | | | | | | | | | |
Total sales | | Ps. | 1,079,545,671 | | | Ps. | 1,166,362,469 | | | Ps. | 1,586,727,874 | |
| | | | | | | | | | | | |
PEMEX does not have significant long-lived assets outside of Mexico.
The following table shows income by product:
| | | | | | | | | | | | |
| | | For the years ended December 31, | |
| | | 2016 | | | 2015 | | | 2014 | |
Domestic sales | | | | | | | | | | | | |
Refined petroleum products and derivatives (primarily gasolines) | | | Ps. 578,718,674 | | | | Ps. 660,573,780 | | | | Ps. 830,545,046 | |
Gas | | | 59,648,576 | | | | 54,497,824 | | | | 77,813,359 | |
Petrochemical products | | | 31,633,223 | | | | 31,164,308 | | | | 36,639,574 | |
| | | | | | | | | | | | |
Total domestic sales | | | Ps. 670,000,473 | | | | Ps. 746,235,912 | | | | Ps. 944,997,979 | |
| | | | | | | | | | | | |
Export sales | | | | | | | | | | | | |
Crude oil | | | Ps. 288,625,794 | | | | Ps. 288,170,451 | | | | Ps. 475,056,981 | |
Refined petroleum products and derivatives (primarily gasolines) | | | 92,705,248 | | | | 118,129,615 | | | | 153,436,847 | |
Gas | | | 20,995 | | | | 27,283 | | | | 64,397 | |
Petrochemical products | | | 13,766,080 | | | | 887,096 | | | | 1,733,088 | |
| | | | | | | | | | | | |
Total export sales | | | Ps. 395,118,117 | | | | Ps. 407,214,445 | | | | Ps. 630,291,313 | |
| | | | | | | | | | | | |
F-47
PETRÓLEOS MEXICANOS, PRODUCTIVE STATE-OWNED SUBSIDIARIES
AND SUBSIDIARY COMPANIES
NOTES TO THE CONSOLIDATED FINANCIAL STATEMENTS
FOR THE YEARS ENDED DECEMBER 31, 2016, 2015 AND 2014
(FIGURES STATED IN THOUSANDS, EXCEPT AS NOTED)
NOTE 6. CASH, CASH EQUIVALENTS AND RESTRICTED CASH
a. As of December 31, 2016 and 2015, cash and cash equivalents were as follows:
| | | | | | | | |
| | | 2016 | | | 2015 | |
Cash on hand and in banks(i) | | Ps. | 71,430,427 | | | Ps. | 52,509,683 | |
Marketable securities | | | 92,102,086 | | | | 56,859,197 | |
| | | | | | | | |
| | Ps. | 163,532,513 | | | Ps. | 109,368,880 | |
| | | | | | | | |
| | (i) | Cash on hand and in banks is primarily composed of cash in banks. |
b. At December 31, 2016, and 2015, restricted cash was as follows:
| | | | | | | | |
| | | 2016 | | | 2015 | |
Restricted cash | | | Ps. 10,478,626 | | | | Ps. 9,246,772 | |
| | | | | | | | |
Restricted cash as of December 31, 2016 and 2015 is primarily composed of the deposit made by Pemex-Exploration and Production in the amount of U.S. $465,060 as a result of an arbitration claim before the International Court of Arbitration of the International Chamber of Commerce (the “ICA”). At December 31, 2016 and 2015, this deposit, including income interest, amounted to Ps. 9,624,804 and Ps. 8,010,298, respectively (see Note 25). On December 31, 2016 and 2015, PMI HBV made deposits of U.S. $ 41,319 and U.S. $ 71,861, respectively, in an account in Banco Santander, S.A. as additional collateral for a credit agreement in accordance with the terms of the agreement. The credit agreement requires that PMI HBV maintain aloan-to-value ratio based on the ratio between the principal amount of debt and the market value in U.S. dollars of the Repsol S. A. (“Repsol”) shares owned by PMI HBV. Accordingly, PMI HBV deposited this amount in order to maintain theloan-to-value ratio required under the credit agreement. As of December 31, 2016 and 2015, this deposit, including income interest, amounted to Ps. 853,822 and Ps.1,236,474, respectively (see Note 10).
NOTE 7. ACCOUNTS RECEIVABLE, NET
As of December 31, 2016 and 2015, accounts receivable and other receivables were as follows:
| | | | | | | | |
| | | 2016 | | | 2015 | |
Domestic customers, net | | Ps. | 41,884,579 | | | Ps. | 29,328,750 | |
Export customers, net | | | 34,859,341 | | | | 17,131,455 | |
Sundry debtors | | | 18,736,922 | | | | 10,837,297 | |
Prepaid taxes | | | 29,361,303 | | | | 10,710,521 | |
Employees and officers | | | 6,054,251 | | | | 5,523,740 | |
Advances to suppliers | | | 2,246,437 | | | | 5,634,114 | |
Insurance claims | | | 38,497 | | | | 43,490 | |
Other accounts receivable | | | 39,197 | | | | 36,454 | |
| | | | | | | | |
| | Ps. | 133,220,527 | | | Ps. | 79,245,821 | |
| | | | | | | | |
F-48
PETRÓLEOS MEXICANOS, PRODUCTIVE STATE-OWNED SUBSIDIARIES
AND SUBSIDIARY COMPANIES
NOTES TO THE CONSOLIDATED FINANCIAL STATEMENTS
FOR THE YEARS ENDED DECEMBER 31, 2016, 2015 AND 2014
(FIGURES STATED IN THOUSANDS, EXCEPT AS NOTED)
The following table shows a breakdown of accounts receivable based on their credit history at December 31, 2016 and 2015:
| | | | | | | | |
| | | Domestic customers | |
| | | 2016 | | | 2015 | |
1 to 30 days | | Ps. | 1,767,718 | | | Ps. | 620,034 | |
31 to 60 days | | | 658,456 | | | | 28,278 | |
61 to 90 days | | | 263,447 | | | | (32,411 | ) |
More than 90 days | | | 1,016,553 | | | | 692,040 | |
| | | | | | | | |
Past due | | | 3,706,174 | | | | 1,307,941 | |
Impaired (reserved) | | | (458,428 | ) | | | (667,883 | ) |
| | | | | | | | |
Unimpaired | | | 3,247,746 | | | | 640,058 | |
Current | | | 38,636,833 | | | | 28,688,692 | |
| | | | | | | | |
Total | | Ps. | 41,884,579 | | | Ps. | 29,328,750 | |
| | | | | | | | |
| | | | | | | | |
| | | Export customers | |
| | | 2016 | | | 2015 | |
1 to 30 days | | Ps. | 341,184 | | | Ps. | 323 | |
31 to 60 days | | | 6,824 | | | | 425 | |
61 to 90 days | | | 35,372 | | | | 37,239 | |
More than 90 days | | | 624,157 | | | | 413,603 | |
| | | | | | | | |
Past due | | | 1,007,537 | | | | 451,590 | |
Impaired (reserved) | | | (374,699 | ) | | | (312,004 | ) |
| | | | | | | | |
Unimpaired | | | 632,838 | | | | 139,586 | |
Current | | | 34,226,503 | | | | 16,991,869 | |
| | | | | | | | |
Total | | Ps. | 34,859,341 | | | Ps. | 17,131,455 | |
| | | | | | | | |
Additionally, the reconciliation for impaired accounts receivable is as follows:
| | | | | | | | |
| | | Domestic customers | |
| | |
| | | 2016 | | | 2015 | |
Balance at the beginning of the year | | | Ps. (667,883 | ) | | | Ps. (598,624 | ) |
Additions against income | | | (218,836 | ) | | | (196,856 | ) |
Application against estimation | | | 428,291 | | | | 127,597 | |
| | | | | | | | |
Balance at the end of the year | | | Ps. (458,428 | ) | | | Ps. (667,883 | ) |
| | | | | | | | |
F-49
PETRÓLEOS MEXICANOS, PRODUCTIVE STATE-OWNED SUBSIDIARIES
AND SUBSIDIARY COMPANIES
NOTES TO THE CONSOLIDATED FINANCIAL STATEMENTS
FOR THE YEARS ENDED DECEMBER 31, 2016, 2015 AND 2014
(FIGURES STATED IN THOUSANDS, EXCEPT AS NOTED)
| | | | | | | | |
| | | Export customers | |
| | | 2016 | | | 2015 | |
Balance at the beginning of the year | | Ps. | (312,004 | ) | | Ps. | (309,252 | ) |
Additions against income | | | (25,931 | ) | | | (119,819 | ) |
Aplication against estimation | | | — | | | | 145,811 | |
Translation effects | | | (36,764 | ) | | | (28,744 | ) |
| | | | | | | | |
Balance at the end of the year | | | Ps. (374,699) | | | | Ps. (312,004) | |
| | | | | | | | |
NOTE 8. INVENTORIES, NET
As of December 31, 2016 and 2015, inventories were as follows:
| | | | | | | | |
| | | 2016 | | | 2015 | |
Refined and petrochemicals products | | | Ps. 21,534,846 | | | | Ps. 23,673,427 | |
Crude oil | | | 11,391,310 | | | | 11,461,185 | |
Products in transit | | | 7,735,163 | | | | 3,262,252 | |
Materials and products in stock | | | 4,721,834 | | | | 5,145,874 | |
Materials in transit | | | 419,547 | | | | 120,750 | |
Gas and condesate products | | | 89,360 | | | | 107,440 | |
| | | | | | | | |
| | | Ps. 45,892,060 | | | | Ps. 43,770,928 | |
| | | | | | | | |
NOTE 9. HELD—FOR—SALENON-FINANCIAL ASSETS
| | a. | Petróleos Mexicanos and theCentro Nacional de Control de Gas Natural (National Center of Natural Gas Control, or CENAGAS) signed a framework agreement on October 29, 2015 for the transfer to CENAGAS of assets associated with theSistema Nacional de Gasoductos (National Gas Pipeline System) valued at approximately Ps. 33,213,762 as of December 31, 2015. As a result of further review of the assets, during 2016 this value was increased to Ps.35,333,411. As of December 31, 2016, CENAGAS and Pemex Logistics have jointly agreed (pursuant to terms set by theComisiónReguladora de Energía (Energy Regulatory Commission) on the valuation of these assets, leading to a final value of the transferred assets of Ps. 7,450,931, plus Value Added Tax (“VAT”), which triggered a loss of Ps. 27,882,480. On December 30, 2016, Pemex Logistics received Ps. 560,665 as a first payment and the outstanding adjustment amount was recorded as a long-term account receivable. |
The remaining amount to be paid by CENAGAS, Ps. 8,027,628 (including VAT), will be received in the form of a consideration payment which will take into account depreciation inflation accumulated in each payment period and a rate of cost of capital determined by the Energy Regulatory Commission. These factors are subject to a determination of variables over the time (see Note14-a).
| | b. | Additionally, pursuant to Round Zero, PEMEX was provisionally assigned titles to escrow. The ownership of the fixed assets located in those blocks will be transferred when the blocks are awarded to third parties in subsequent rounds. |
F-50
PETRÓLEOS MEXICANOS, PRODUCTIVE STATE-OWNED SUBSIDIARIES
AND SUBSIDIARY COMPANIES
NOTES TO THE CONSOLIDATED FINANCIAL STATEMENTS
FOR THE YEARS ENDED DECEMBER 31, 2016, 2015 AND 2014
(FIGURES STATED IN THOUSANDS, EXCEPT AS NOTED)
As a result of the Energy Reform Decree, the secondary legislation and the corresponding initial adjudication of rights for the exploration and extraction of oil and solid hydrocarbons mentioned in transitory article 6 of the Energy Reform Decree, certain assignments that Pemex Exploration and Production received from the Mexican Government were affected. These investments will be compensated at their fair value pursuant to the terms determined by Ministry of Energy.
In 2016, pursuant to Round 1.3, the Ministry of Energy awarded certain contractual areas for the exploration and extraction of oil and solid hydrocarbons to third parties and their respective fixed assets will be transferred from PEMEX to such third parties. During 2016, PEMEX submitted the application for compensation from the Ministry of Energy for the fixed assets located in those areas, and, on December 31, 2016, these fixed assets were reclassified asheld-for-salenon-financial assets at book value of Ps. 7,460,674, as follows:
| | | | | | |
| | | Fields | | As of December 31,
2016 | |
| 22 | | Not-requested but temporarily assigned fields | | | Ps. 2,736,358 | |
| 3 | | Not-requested and unassigned fields | | | 71,974 | |
| | | | | | |
| | | | | 2,808,332 | |
| 317 | | Fields permanently unassigned | | | 4,652,342 | |
| | | | | | |
| | Total | | | Ps. 7,460,674 | |
| | | | | | |
NOTE 10. AVAILABLE—FOR—SALENON-CURRENT FINANCIAL ASSETS
On January 1, 2015, PEMEX had a total of 19,557,003 shares of Repsol valued at Ps. 3,944,696, which represented approximately 1.48% of Repsol’s share capital.
On January 16, 2015, PMI HBV received 575,205 new Repsol shares, valued at Ps. 163,834, as anin-kind dividend resulting from a flexible dividend declared by Repsol in December 2014.
On June 15, 2015, Repsol declared flexible dividends to its shareholders, of which PMI HBV received 592,123 new Repsol shares in July 2015, valued at Ps. 171,451.
On August 4, 2015, PMI HBV obtained a loan for U.S. $250,000, which bears interest at a rate of 1.79% and is due in 2018. The loan is collateralized by 20,724,331 Repsol shares which are presented asnon-current assets.
On December 16, 2015, Repsol declared flexible dividends to its shareholders, from which PMI HBV received 942,015 new Repsol shares as anin-kind dividend in January 2015. This amount was recognized as an account receivable of Ps.188,490 as of December 31, 2015.
On June 13, 2016, Repsol declared flexible dividends to its shareholders, of which PMI HBV received 555,547 new Repsol shares as anin-kind dividend on July 18, 2016, valued at Ps. 128,051.
Since the 1,497,562 new Repsol shares were received as anin-kind dividend during 2016 are not included in the loan agreement obtained by PMI HBV in August 2015, these shares are presented as short termavailable-for-sale current financial assets amounting to Ps. 435,556. These shares were sold in January 2017.
F-51
PETRÓLEOS MEXICANOS, PRODUCTIVE STATE-OWNED SUBSIDIARIES
AND SUBSIDIARY COMPANIES
NOTES TO THE CONSOLIDATED FINANCIAL STATEMENTS
FOR THE YEARS ENDED DECEMBER 31, 2016, 2015 AND 2014
(FIGURES STATED IN THOUSANDS, EXCEPT AS NOTED)
On December 14, 2016, Repsol declared flexible dividends to its shareholders, of which PMI HBV received 584,786 new Repsol shares as anin-kind dividend in January 23, 2017. This amount was recognized as an account receivable of Ps.165,346 as of December 31, 2016.
As of December 31, 2016 and December 31, 2015, the investments in 20,724,331 shares of Repsol held by PMI HBV were valued at Ps. 6,027,540 and Ps. 3,944,696, respectively. These shares are presented undernon-current assets. The effect of the valuation on the investment at fair value was recorded in other comprehensive result in the statement of changes in equity (deficit) as a profit of Ps. 207,817 at December 31, 2016, and a loss of Ps. 3,206,316 at December 31, 2015.
As of December 31, 2016 and 2015, PEMEX’s direct holdings of Repsol shares amounted to approximately 1.52% and 1.48% respectively, of Repsol’s total shares.
NOTE 11. PERMANENT INVESTMENTS IN ASSOCIATES AND OTHER
The permanent investments in associates and other as of December 31, 2016 and 2015, were as follows:
| | | | | | | | | | | | | | |
| | | | | Percentage of
investment | | | 2016 | | | 2015 | |
Deer Park Refining Limited | | | | | 49.99% | | | Ps. | 14,039,384 | | | Ps. | 10,600,545 | |
Petroquímica Mexicana de Vinilo, S. A. de C. V. | | (i) | | | 44.09% | | | | 4,309,050 | | | | 3,954,251 | |
TAG Norte Holding, S. de R. L. de C. V. | | (ii)(iii) | | | 5.00% | | | | 1,909,527 | | | | 283,524 | |
Sierrita Gas Pipeline LLC | | | | | 35.00% | | | | 1,112,338 | | | | 983,059 | |
TAG Pipelines Sur, S. de R. L. de C. V. | | (ii)(iii) | | | 5.00% | | | | 507,596 | | | | 61,747 | |
Frontera Brownsville, LLC. | | | | | 50.00% | | | | 478,414 | | | | 404,129 | |
Texas Frontera, LLC. | | | | | 50.00% | | | | 260,828 | | | | 224,834 | |
CH4 Energía, S. A. | | | | | 50.00% | | | | 194,868 | | | | 183,474 | |
Administración Portuaria Integral de Dos Bocas, S.A. de C.V. | | | | | 40.00% | | | | 139,523 | | | | 160,687 | |
PMV Minera, S.A. de C.V. | | | | | 44.09% | | | | 61,779 | | | | 51,270 | |
Gasoductos de Chihuahua, S. de R. L. de C. V. | | (iv) | | | 50.00% | | | | — | | | | 6,454,806 | |
Compañía Mexicana de Exploraciones, S. A. de C. V. | | (v) | | | 60.00% | | | | — | | | | 758,967 | |
Other-net | | | | | Various | | | | 141,325 | | | | 44,306 | |
| | | | | | | | | | | | | | |
| | | | | | | | Ps. | 23,154,632 | | | Ps. | 24,165,599 | |
| | | | | | | | | | | | | | |
| i. | On April 20, 2016, an explosion occurred in the “Planta de Clorados 3” (Chlorinated Plant 3) of the Petroquímica Mexicana de Vinilo, resulting in approximately Ps.461,000 in damages. Chorinated Plant 3 incurred the greatest amount of damaged, including the loss of certain assets and the closure of the plant for an undefined amount of time. The Chlorine-Soda plants and the ethylene plants did not register any damage. |
| ii. | On December 15, 2015, PEMEX completed the divestiture of PMI HBV’s ownership interest in the TAG Norte Holding, S. de R.L. de C.V., and TAG Pipelines Sur, S. de R.L. de C.V., joint ventures with TETL México Sur, S. de R.L. de C.V., at a price of Ps. 3,590,963, or 45% of the ownership interest, with a profit of Ps. 342,954. The figures presented representMex-Gas International’s 5% ownership interest in such companies. |
| iii. | As of December 31, 2016, due to the loss of significant influence in TAG Norte Holding, S. de R.L. de C.V. and y TAG Pipelines Sur, S. de R.L. de C.V. companies, PEMEX valued these investments at fair value. The difference between the fair value at the end of the period and the book value amounted to Ps.1,763,759. As of December 31, 2016, the fair value was higher than the book value. |
F-52
PETRÓLEOS MEXICANOS, PRODUCTIVE STATE-OWNED SUBSIDIARIES
AND SUBSIDIARY COMPANIES
NOTES TO THE CONSOLIDATED FINANCIAL STATEMENTS
FOR THE YEARS ENDED DECEMBER 31, 2016, 2015 AND 2014
(FIGURES STATED IN THOUSANDS, EXCEPT AS NOTED)
| iv. | On September 28, 2016, PEMEX completed the divestiture of its 50% ownership interest in the Gasoductos de Chihuahua S. de R.L. de C.V. joint venture with Infraestructura Energética Nova, S.A.B. de C.V. The stock was sold for Ps. 22,684,736, yielding a profit of Ps. 15,211,039. |
| v. | Beginning July 1, 2016 this company was included in the consolidated financial statements of PEMEX. Until June 30, 2016 this Company was accounted for as a permanent investment in an associate under the equity method (see Note3-a). |
Profit (loss) sharing in associates and others:
| | | | | | | | | | | | |
| | | 2016 | | | 2015 | | | 2014 | |
Deer Park Refining Limited | | Ps. | 1,437,850 | | | Ps. | 1,913,835 | | | Ps. | (232,960 | ) |
Gasoductos de Chihuahua, S. de R. L. de C. V. | | | 638,126 | | | | 666,779 | | | | 244,958 | |
Sierrita Gas Pipeline LLC | | | 105,825 | | | | 152,445 | | | | 6,478 | |
TAG Norte Holding, S. de R. L. de C. V. | | | — | | | | 34,602 | | | | (108,126 | ) |
TAG Pipelines Sur, S. de R. L. de C. V. | | | — | | | | (6,543 | ) | | | (57,330 | ) |
Petroquímica Mexicana de Vinilo, S. A. de C. V. | | | (190,468 | ) | | | (61,952 | ) | | | (89,280 | ) |
Compañía Mexicana de Exploraciones, S. A. de C. V. | | | — | | | | (496,774 | ) | | | 114,677 | |
Other, net | | | 144,512 | | | | 115,723 | | | | 155,951 | |
| | | | | | | | | | | | |
Profit sharing in associates and other, net | | Ps. | 2,135,845 | | | Ps. | 2,318,115 | | | Ps. | 34,368 | |
| | | | | | | | | | | | |
The following tables show condensed financial information of major investments recognized under the equity method during 2016 and 2015:
Condensed statements of financial position
| | | | | | | | | | | | | | | | |
| | | Deer Park Refining Limited | | | Gasoductos de Chihuahua,
S. de R. L. de C. V. | |
| | | 2016 | | | 2015 | | | 2016 | | | 2015 | |
Total assets | | Ps. | 42,428,275 | | | Ps. | 33,249,652 | | | Ps. | — | | | Ps. | 26,573,119 | |
| | | | |
Total liabilities | | Ps. | 14,346,643 | | | Ps. | 12,046,441 | | | Ps. | — | | | Ps. | 13,663,507 | |
Total equity | | | 28,081,632 | | | | 21,203,211 | | | | | | | | 12,909,612 | |
| | | | | | | | | | | | | | | | |
Total liabilities and equity | | Ps. | 42,428,275 | | | Ps. | 33,249,652 | | | Ps. | — | | | Ps. | 26,573,119 | |
| | | | | | | | | | | | | | | | |
Condensed statements of comprehensive income
| | | | | | | | | | | | | | | | | | | | | | | | |
| | | Deer Park Refining Limited | | | Gasoductos de Chihuahua,
S. de R. L. de C. V. | |
| | | December 31, | | | August 31 | | | December 31, | |
| | | 2016 | | | 2015 | | | 2014 | | | 2016 | | | 2015 | | | 2014 | |
Sales and other income | | Ps. | 16,750,155 | | | Ps. | 16,658,705 | | | Ps. | 11,996,951 | | | Ps. | 3,798,666 | | | Ps. | 4,617,982 | | | Ps. | 2,406,375 | |
Costs and expenses | | | 13,874,172 | | | | 12,830,653 | | | | 12,462,917 | | | | 2,522,415 | | | | 3,284,424 | | | | 1,916,459 | |
| | | | | | | | | | | | | | | | | | | | | | | | |
Net result | | Ps. | 2,875,983 | | | Ps. | 3,828,052 | | | Ps. | (465,966 | ) | | Ps. | 1,276,251 | | | Ps. | 1,333,558 | | | Ps. | 489,916 | |
| | | | | | | | | | | | | | | | | | | | | | | | |
F-53
PETRÓLEOS MEXICANOS, PRODUCTIVE STATE-OWNED SUBSIDIARIES
AND SUBSIDIARY COMPANIES
NOTES TO THE CONSOLIDATED FINANCIAL STATEMENTS
FOR THE YEARS ENDED DECEMBER 31, 2016, 2015 AND 2014
(FIGURES STATED IN THOUSANDS, EXCEPT AS NOTED)
Additional information about the significant permanent investments in associates and other is presented below:
| | • | | Deer Park Refining Limited. On March 31, 1993, PMI NASA acquired 50% of the Deer Park Refinery. In its capacity as General Partner of Deer Park Refining Limited Partnership, Shell is responsible for the operation and management of the Refinery, the purpose of which is to provide oil refinery services to PMI NASA and Shell for a processing fee. Shell is responsible for determining the crude oil and production materials requirements and both partners are required to provide in equal amounts. Deer Park returns to PMI NASA and Shell products in the same equal amounts. Shell is responsible for purchasing the total amount of finished products in stock at market prices. This joint venture is recorded under the equity method. |
| | • | | Petroquímica Mexicana de Vinilo, S.A. de C.V.On September 13, 2013, Pemex-Petrochemicals (now Pemex Industrial Transformation), through its subsidiary PPQ Cadena Productiva, S.L. and Mexichem founded Petroquímica Mexicana de Vinilo, S.A. de C.V. (Mexicana de Vinilo). The principal activity ofPetroquímica Mexicana de Vinilo, S.A. de C.V.is the production and sale of chemicals. Mexicana de Vinilo’s main products are: chlorine, caustic soda, ethylene and monomers of vinyl chloride. Mexichem is responsible for operational and financial decisions for Mexicana de Vinilo. This investment is recorded under the equity method. |
| | • | | TAG Norte Holding, S. de R. L. de C. V.This company was created on June 6, 2014, and is the holding company of other enterprises aimed at developing infrastructure projects related to hydrocarbon transport. This investment is accounted at fair value as described in footnote (iii) to the table above. |
| | • | | Sierrita Gas Pipeline LLC.This company was created on June 24, 2013. Its main activity is the developing of projects related to the transport infrastructure of gas in the United States. This investment is recorded under the equity method. |
| | • | | TAG Pipelines Sur, S. de R. L. de C. V.This company was created on November 27, 2013. The principal activity is the operation and maintenance of the southern portion of the Ramones II project. The investment is accounted at fair value as described in footnote (iii) to the table above. |
| | • | | Frontera Brownsville, LLC. Effective April 1, 2011, PMI SUS entered into a joint venture with TransMontaigne Operating Company L.P (TransMontaigne) to create Frontera Brownsville, LLC. Frontera Brownsville, LLC was incorporated in Delaware, U. S., and has the corporate power to own and operate certain facilities for the storage and treatment of clean petroleum products. This investment is recorded under the equity method. |
| | • | | Texas Frontera, LLC. This company was constituted on July 27, 2010, and its principal activity is the lease of tanks for the storage of refined product. PMI SUS, which owns thr 50% of interest in Texas Frontera, entered into a joint venture with Magellan OLP, L.P. (Magellan) and together are responsible for the results in proportion of this investment. As of December 31, 2016, the company has seven tanks of 120,000 barrels of capacity, each of them. This joint venture is recorded under the equity method. |
| | • | | CH4 Energía, S.A.This company was constituted on December 21, 2000. CH4 Energía engages in the purchase and sale of natural gas and in all activities related to the trading of the natural gas, such as transport and distribution in Valle de Toluca, México. This joint venture is recorded under the equity method. |
F-54
PETRÓLEOS MEXICANOS, PRODUCTIVE STATE-OWNED SUBSIDIARIES
AND SUBSIDIARY COMPANIES
NOTES TO THE CONSOLIDATED FINANCIAL STATEMENTS
FOR THE YEARS ENDED DECEMBER 31, 2016, 2015 AND 2014
(FIGURES STATED IN THOUSANDS, EXCEPT AS NOTED)
| | • | | Administración Portuaria Integral de Dos Bocas, S.A. de C.V.This company was constituted on August 12, 1999. Its primarily activity is the use of water and land in port areas in Mexico’s public domain; operates the use and development of building sites. It also provides related port services. This investment is recorded under the equity method. |
| | • | | PMV Minera, S.A. de C.V. This company was constituted on October 1, 2014 and the principal activity is the extraction and sale of salmuera (mixture of salt and water). This investment is recorded under the equity method. |
| | • | | Gasoductos de Chihuahua, S. de R.L. de C.V. On February 6, 1997, Pemex Industrial Transformation (before Pemex-Refining) entered into a joint venture with IEnova Gasoductos Holding, S. de R.L de C.V. to own and operate companies related to gas transportation and distribution, called Gasoductos de Chihuahua, S. de R.L. de C.V. Decision-making requires the consent of both partners during a meeting. The participation of each of the partners was 50% of the share capital. This investment was recorded under the equity method until August 2016, when PEMEX completed the divestiture of this company as described in footnote (iv) to the table above. |
| | • | | Compañía Mexicana de Exploraciones S.A. de C.V., (“COMESA”). COMESA was founded on November 12, 1968 to support PEMEX’s exploration programs. The operations of COMESA are focused on designing integral solutions for the energy sector, along the value chain for Exploration and Production, Refining, Petrochemicals, Geothermal energy and other energy areas all over the energy sector in Mexico, South America and the United States of America. COMESA’s principal activities are: gravimetric, magnetometric and microseismic studies, land seismic data acquisition (2D,3D, 3C), marine Seismic data acquisition, seismic data processing, seismic data interpretation and integration, vertical Seismic Profile (VSP) 2D and 3D, reservoir characterization and visualization, conceptualization and definition for exploration process. Until June 30, 2016 this company was accounted under the equity method. Beginning July 1, 2016 this company was included in the consolidation. |
F-55
PETRÓLEOS MEXICANOS, PRODUCTIVE STATE-OWNED SUBSIDIARIES
AND SUBSIDIARY COMPANIES
NOTES TO THE CONSOLIDATED FINANCIAL STATEMENTS
FOR THE YEARS ENDED DECEMBER 31, 2016, 2015 AND 2014
(FIGURES STATED IN THOUSANDS, EXCEPT AS NOTED)
NOTE 12. WELLS, PIPELINES, PROPERTIES, PLANT AND EQUIPMENT, NET
| | | | | | | | | | | | | | | | | | | | | | | | | | | | | | | | | | | | | | | | | | | | | | | | | | | | |
| | | Plants | | | Drilling
equipment | | | Pipelines | | | Wells | | | Buildings | | | Offshore
platforms | | | Furniture and
equipment | | | Transportation
equipment | | | Construction
in progress | | | Land | | | Unproductive
fixed assets | | | Other
fixed
assets | | | Total
fixed assets | |
Investment | | | | | | | | | | | | | | | | | | | | | | | | | | | | | | | | | | | | | | | | | | | | | | | | | | | | |
Balances as of January 1, 2015 | | Ps. | 758,965,433 | | | | 46,129,352 | | | | 571,099,029 | | | | 1,191,385,012 | | | | 64,403,269 | | | | 337,246,010 | | | | 54,819,706 | | | | 24,002,014 | | | | 195,817,249 | | | | 42,813,007 | | | | 10,825,706 | | | | 583,753 | | | | 3,298,089,540 | |
Acquisitions | | Ps. | 21,066,695 | | | | 6,117,156 | | | | 5,331,416 | | | | 49,027,740 | | | | 2,624,138 | | | | 6,874,162 | | | | 1,531,683 | | | | 236,284 | | | | 155,841,872 | | | | 12,077,308 | | | | 114,062 | | | | 4,015,295 | | | | 264,857,811 | |
Reclassifications | | Ps. | 1,871,739 | | | | (313,503 | ) | | | 2,816,080 | | | | — | | | | 937,482 | | | | 774 | | | | (607,369 | ) | | | 387,331 | | | | 1,809,152 | | | | 23,804 | | | | (6,448,543 | ) | | | (3,275,979 | ) | | | (2,799,032 | ) |
Capitalization | | Ps. | 33,362,415 | | | | — | | | | 17,144,630 | | | | 76,065,532 | | | | 1,301,395 | | | | 13,670,992 | | | | 35,933 | | | | 590,435 | | | | (141,792,676 | ) | | | 209,655 | | | | — | | | | (588,311 | ) | | | — | |
Impairment | | Ps. | (97,981,310 | ) | | | — | | | | (34,543,415 | ) | | | (249,962,633 | ) | | | — | | | | (95,457,330 | ) | | | — | | | | — | | | | — | | | | — | | | | — | | | | — | | | | (477,944,688 | ) |
Disposals | | Ps. | (68,872,958 | ) | | | (30,252,662 | ) | | | (141,868,232 | ) | | | — | | | | (2,981,818 | ) | | | (2,006,512 | ) | | | (2,813,759 | ) | | | (9,886,969 | ) | | | — | | | | (11,775,972 | ) | | | (4,491,225 | ) | | | (103,880 | ) | | | (275,053,987 | ) |
| | | | | | | | | | | | | | | | | | | | | | | | | | | | | | | | | | | | | | | | | | | | | | | | | | | | |
Balances as of December 31, 2015 | | Ps. | 648,412,014 | | | | 21,680,343 | | | | 419,979,508 | | | | 1,066,515,651 | | | | 66,284,466 | | | | 260,328,096 | | | | 52,966,194 | | | | 15,329,095 | | | | 211,675,597 | | | | 43,347,802 | | | | — | | | | 630,878 | | | | 2,807,149,644 | |
Acquisitions | | Ps. | 20,406,464 | | | | 1,629,710 | | | | 1,265,011 | | | | 8,239,480 | | | | 2,541,802 | | | | 9,866,984 | | | | 545,271 | | | | 2,063,519 | | | | 107,682,868 | | | | 1,487,434 | | | | 6,800 | | | | — | | | | 155,735,343 | |
Reclassifications | | Ps. | 150,817 | | | | — | | | | (1,268,887 | ) | | | 8,649,686 | | | | (6,610,184 | ) | | | — | | | | (561,569 | ) | | | (325,778 | ) | | | (282,044 | ) | | | 50,709 | | | | 2,039 | | | | (137,246 | ) | | | (332,457 | ) |
Capitalization | | Ps. | 15,943,630 | | | | — | | | | 11,851,378 | | | | 40,825,973 | | | | 1,085,323 | | | | 17,318,279 | | | | 2,769 | | | | 2,918,621 | | | | (89,945,973 | ) | | | — | | | | — | | | | — | | | | — | |
Impairment | | Ps. | 81,135,967 | | | | — | | | | 31,967,407 | | | | 198,974,994 | | | | — | | | | 35,640,491 | | | | 438,979 | | | | 8,743 | | | | (16,852,238 | ) | | | — | | | | — | | | | — | | | | 331,314,343 | |
Disposals | | Ps. | (7,602,782 | ) | | | (40,937 | ) | | | ( 3,648,989 | ) | | | (4,382,867 | ) | | | (558,374 | ) | | | (449,645 | ) | | | (2,644,957 | ) | | | (551,355 | ) | | | (4,864,062 | ) | | | (314,327 | ) | | | (8,839 | ) | | | (2,126 | ) | | | (25,069,260 | ) |
| | | | | | | | | | | | | | | | | | | | | | | | | | | | | | | | | | | | | | | | | | | | | | | | | | | | |
Balances as of December 31, 2016 | | Ps. | 758,446,110 | | | | 23,269,116 | | | | 460,145,428 | | | | 1,318,822,917 | | | | 62,743,033 | | | | 322,704,205 | | | | 50,746,687 | | | | 19,442,845 | | | | 207,414,148 | | | | 44,571,618 | | | | — | | | | 491,506 | | | | 3,268,797,613 | |
| | | | | | | | | | | | | | | | | | | | | | | | | | | | | | | | | | | | | | | | | | | | | | | | | | | | |
Accumulated depreciation and amortization | | | | | | | | | | | | | | | | | | | | | | | | | | | | | | | | | | | | | | | | | | | | | | | | | | | | |
Balances as of January 1, 2015 | | Ps. | (339,292,292 | ) | | | (27,771,648 | ) | | | (232,658,051) | | | | (695,718,382 | ) | | | (37,144,310 | ) | | | (124,922,867 | ) | | | (37,051,446 | ) | | | (12,811,151 | ) | | | — | | | | — | | | | (7,345,255 | ) | | | — | | | | (1,514,715,402 | ) |
Depreciation and amortization | | Ps. | (41,107,609 | ) | | | (3,041,899 | ) | | | (16,777,673 | ) | | | (84,823,893 | ) | | | (1,608,620 | ) | | | (15,986,093 | ) | | | (3,533,648 | ) | | | (1,071,815 | ) | | | — | | | | — | | | | — | | | | — | | | | (167,951,250 | ) |
Reclassifications | | Ps. | (1,148,744 | ) | | | 283,636 | | | | (310,859 | ) | | | — | | | | (113,573 | ) | | | — | | | | 1,259,561 | | | | (402,648 | ) | | | — | | | | — | | | | 3,231,659 | | | | — | | | | 2,799,032 | |
Disposals | | Ps. | 60,264,739 | | | | 29,951,896 | | | | 110,415,176 | | | | 98,636 | | | | 1,154,416 | | | | — | | | | 2,812,054 | | | | 8,391,094 | | | | — | | | | — | | | | 4,113,596 | | | | — | | | | 217,201,607 | |
| | | | | | | | | | | | | | | | | | | | | | | | | | | | | | | | | | | | | | | | | | | | | | | | | | | | |
Balances as of December 31, 2015 | | Ps. | (321,283,906 | ) | | | (578,015 | ) | | | (139,331,407 | ) | | | (780,443,639 | ) | | | (37,712,087 | ) | | | (140,908,960 | ) | | | (36,513,479) | | | | (5,894,520 | ) | | | — | | | | — | | | | — | | | | — | | | | (1,462,666,013) | |
| | | | | | | | | | | | | | | | | | | | | | | | | | | | | | | | | | | | | | | | | | | | | | | | | | | | |
Depreciation and amortization | | Ps. | (44,549,443 | ) | | | (2,364,560 | ) | | | (15,153,879 | ) | | | (70,090,038 | ) | | | (1,796,383 | ) | | | (12,252,810 | ) | | | (3,205,089 | ) | | | (1,027,289 | ) | | | — | | | | — | | | | — | | | | — | | | | (150,439,491 | ) |
Reclassifications | | Ps. | (10,521 | ) | | | — | | | | (166,632 | ) | | | (3,077 | ) | | | (108,718 | ) | | | — | | | | 166,914 | | | | 454,492 | | | | — | | | | — | | | | — | | | | — | | | | 332,458 | |
Disposals | | Ps. | 5,826,891 | | | | — | | | | 2,286,691 | | | | — | | | | 492,557 | | | | — | | | | 2,560,988 | | | | 550,554 | | | | — | | | | — | | | | — | | | | — | | | | 11,717,681 | |
| | | | | | | | | | | | | | | | | | | | | | | | | | | | | | | | | | | | | | | | | | | | | | | | | | | | |
Balances as of December 31, 2016 | | Ps. | (360,016,979 | ) | | | (2,942,575 | ) | | | (152,365,227 | ) | | | (850,536,754 | ) | | | (39,124,631 | ) | | | (153,161,770 | ) | | | (36,990,666 | ) | | | (5,916,763 | ) | | | — | | | | — | | | | — | | | | — | | | | (1,601,055,365 | ) |
| | | | | | | | | | | | | | | | | | | | | | | | | | | | | | | | | | | | | | | | | | | | | | | | | | | | |
Wells, pipelines, properties, plant and equipment—net as of December 31,2015 | | Ps. | 327,128,108 | | | | 21,102,328 | | | | 280,648,101 | | | | 286,072,012 | | | | 28,572,379 | | | | 119,419,136 | | | | 16,452,715 | | | | 9,434,575 | | | | 211,675,597 | | | | 43,347,802 | | | | — | | | | 630,878 | | | | 1,344,483,631 | |
| | | | | | | | | | | | | | | | | | | | | | | | | | | | | | | | | | | | | | | | | | | | | | | | | | | | |
Wells, pipelines, properties, plant and equipment—net as of December 31,2016 | | Ps. | 398,429,131 | | | | 20,326,541 | | | | 307,780,201 | | | | 468,286,163 | | | | 23,618,402 | | | | 169,542,435 | | | | 13,756,021 | | | | 13,526,082 | | | | 207,414,148 | | | | 44,571,618 | | | | — | | | | 491,506 | | | | 1,667,742,248 | |
| | | | | | | | | | | | | | | | | | | | | | | | | | | | | | | | | | | | | | | | | | | | | | | | | | | | |
Depreciation rates | | | 3 a 5 | % | | | 5 | % | | | 2 a 7 | % | | | — | | | | 3 a 7 | % | | | 4 | % | | | 3 a 10 | % | | | 4 a 20 | % | | | — | | | | — | | | | — | | | | — | | | | — | |
Estimated useful lives | | | 20 a 35 | | | | 20 | | | | 15 a 45 | | | | — | | | | 33 a 35 | | | | 25 | | | | 3 a 10 | | | | 5 a 25 | | | | — | | | | — | | | | — | | | | — | | | | — | |
| a. | As of December 31, 2016, 2015 and 2014, the financing cost identified with fixed assets in the construction or installation stage, capitalized as part of the value of such fixed assets, was Ps. 3,667,752, Ps. 5,258,854 and Ps. 3,997,121, respectively. |
| b. | The combined depreciation of fixed assets and amortization of wells for the fiscal years ended December 31, 2016, 2015 and 2014, recognized in operating costs and expenses, was Ps. 150,439,491, 167,951,250 and Ps. 143,074,787, respectively, which includes costs related to plugging and abandonment of wells for the years ended December 31, 2016, 2015 and 2014 of Ps. 1,698,312, Ps.1,401,870, and Ps. 2,011,027, respectively. |
| c. | As of December 31, 2016 and 2015, provisions relating to future plugging of wells costs amounted to Ps. 64,967,710 and Ps. 56,894,695, respectively, and are presented in the “Provisions for plugging of wells” (see Note 18). |
F-56
PETRÓLEOS MEXICANOS, PRODUCTIVE STATE-OWNED SUBSIDIARIES
AND SUBSIDIARY COMPANIES
NOTES TO THE CONSOLIDATED FINANCIAL STATEMENTS
FOR THE YEARS ENDED DECEMBER 31, 2016, 2015 AND 2014
(FIGURES STATED IN THOUSANDS, EXCEPT AS NOTED)
| d. | As of December 31, 2016 PEMEX recognized a net reversal of impairment of Ps. (331,314,343) and a net impairment of Ps.477,944,688 as of December 31, 2015. These amounts are explained as follows: |
| | i. | As of December 31, 2016, PEMEX recognized a net reversal of impairment in the amount of Ps. (331,314,343) arising from (1) a reversal of Ps. (350,686,687) mainly due to the reallocation of resources towards oil fields with highest profitability and net cash flows arising from relatively greater efficiency in oil extraction and lower production costs; the appreciation of the U.S. dollar against the Mexican peso, the change in the period used to estimate long-term prices of proved reserves and the recoverable amount of fixed assets as well as an improvement in the forecasts of prices in refineries and the decrease in the discount rate; and (2) an impairment of fixed assets of Ps. 19,372,344, mainly due to the fact that cash flows were not sufficient to cover the recovery value of an exploration and production project as a result of the increase in investments in this strategic gas project and the decrease in the production in a petrochemical center. Net reversal of impairment as well as the impairment for the years ended December 31, 2016 and 2015 are presented in a separate line item in the consolidated statement of comprehensive income. |
Cash Generating Unit of Pemex Exploration and Production
Pemex Exploration and Production recognized a net reversal of impairment in the amount of Ps. (271,709,432) as of December 31, 2016, arising from (1) a reversal of Ps. (288,581,670) mainly due to the reallocation of resources towards oil fields with highest profitability and net cash flows arising from relatively greater efficiency in oil extraction and lower production costs, which fields are located primarily in the Aceite Terciario del Golfo, Crudo Ligero Marino, Burgos, Cantarell and Antonio J. Bermudez crude oil projects, (ii) the appreciation of the U.S. dollar against the Mexican peso by 20.1%, from a peso–U.S. dollar exchange rate of Ps. 17.2065 to U.S. $1.00 as of December 31, 2015 to a peso–U.S. dollar exchange rate of Ps. 20.6640 to U.S. $1.00 as of December 31, 2016, given that cash inflows are denominated in U.S. dollars and then translated to the reporting currency using the exchange rate at the end of the period, (iii) the change in the period used to estimate long-term prices of proved reserves and the recoverable amount of fixed assets from 20 years to 25 years in accordance with the amendment to theLineamientos que regulan el procedimiento de cuantificación y certificación de reservas de la nación y el informe de los recursos contingentes relacionados (Guidelines regulating the quantification and certification procedures of the nation’s reserves and the related contingent resources report), (iv) by the authorization that the assignments to safeguard for two years be considered in an undetermined time until they are bidded and assigned to a contract and (v) the decrease in the discount rate; (2) an impairment of fixed assets of Ps. 16,872,238, mainly due to the fact that cash flows were not sufficient to cover the recovery value of the Lakach project as a result of the increase in investments in this strategic gas project.
The cash generating units of Pemex Exploration and Production are investment projects in productive fields with hydrocarbon reserves associated with proved reserves (1P). These productive hydrocarbon fields contain varying degrees of heating power consisting of a set of wells and are supported by fixed assets associated directly with the production, such as pipelines, production facilities, offshore platforms, specialized equipment and machinery.
Each project represents the smallest unit which can concentrate the core revenues, with clear costs and expenses that enable future cash flows (value in use) to be determined.
To determine the value in use of long-lived assets associated to hydrocarbon extraction, the net present value of reserves is determined based on the following assumptions:
| | |
| Average crude oil price | | 60.24 U.S. dollars/bl |
| Average gas price | | 4.69 U.S. dollars/mpc |
| Average condensates price | | 40.22 U.S. dollars/bl |
| Discount rate | | 14.36% annually |
F-57
PETRÓLEOS MEXICANOS, PRODUCTIVE STATE-OWNED SUBSIDIARIES
AND SUBSIDIARY COMPANIES
NOTES TO THE CONSOLIDATED FINANCIAL STATEMENTS
FOR THE YEARS ENDED DECEMBER 31, 2016, 2015 AND 2014
(FIGURES STATED IN THOUSANDS, EXCEPT AS NOTED)
The total forecast production, calculated with a horizon of 25 years is 7,092 million bpce.
Pemex Exploration and Production determines the recoverable amount of fixed assets based on the long-term estimated prices for Pemex Exploration and Production’s proved reserves (1P). The recoverable amount on each asset is the value in use.
Cash Generating Units which conform Industrial Transformation
As of December 31, 2016, Industrial Transformation recognized a net reversal of impairment of Ps. (52,498,881) mainly due to (1) a reversal of Ps. (54,998,987) corresponding to Madero and Minatitlán refineries due to higher prices than were forecasted in 2015 during the market decline, the reduction of the discount rate in the National Refinery System from 13.72% to 12.06%, and the appreciation of the U.S. dollar against the Mexican peso by 20.1%, from a peso–U.S. dollar exchange rate of Ps. 17.2065 to U.S. $1.00 as of December 31, 2015 to a peso–U.S. dollar exchange rate of Ps. 20.6640 to U.S. $1.00 as of December 31, 2016; (2) the cash generating units of the Arenque gas processor complex also recognized a reversal of impairment of Ps. (268,161) due to the improvement in prices of generated products and the appreciation of the U.S. dollar against the Mexican peso, improved efficiency in operating expenses and (3) three cash generating units presented impairment, including Ps. 65,105 in the gas Matapionche Processor Center, Ps. 2,590,870 in the Cangrejera Petrochemical Center and Ps. 112,292 for the Independencia Petrochemical Center, due to a decrease in the methanol price produced in these petrochemical centers.
Cash-generating units in Pemex Industrial Transformation are processing centers grouped according to their types of processes as refineries, gas complex processors, and petrochemical centers. These centers produce various finished products for direct sale to or intermediate products that can be processed in another of its cash generating units or by a third party.
Each processing center of Industrial Transformation represents the smallest unit which can concentrate the core revenues, with clear costs and expenses that enable future cash flows (value in use) to be determined.
Cash flows determination is made based on PEMEX’s business plans, operating financial programs, forecasts of future prices of products related to the processes of the cash generating units, budget programs and different statistic models that consider historical information of processes and the capacity of different processing centers.
Cash generating unit of refining
To determine the value in use of long-lived assets associated with refineries of the National Refinery System, the net present value of reserves were determined based on the following assumptions:
| | |
| Average crude oil price | | 52.30 U.S. dollars per processed barrel (2016-2029) |
| Processed volume | | 1,100 mbd (2016-2033 average) |
| Rate of U.S. dollar | | $20.6640 mxp/usd |
| Useful lives of the cash generating units | | Average of 14 years |
| Discount rate | | 12.06% annually |
F-58
PETRÓLEOS MEXICANOS, PRODUCTIVE STATE-OWNED SUBSIDIARIES
AND SUBSIDIARY COMPANIES
NOTES TO THE CONSOLIDATED FINANCIAL STATEMENTS
FOR THE YEARS ENDED DECEMBER 31, 2016, 2015 AND 2014
(FIGURES STATED IN THOUSANDS, EXCEPT AS NOTED)
The recoverable amount of the assets is value in use. To determine of cash flows the volume of volumes product produced and sold are taken into consideration. As of December 31, 2016, the value in use for the Minatitlán and Madero Refineries was Ps. 79,113,512. As of December 31, 2016, the projection of cash flows was based on a period of 14 years for each refinery.
Cash generating unit of gas
To determine the value in use of long-lived assets associated with gas processing centers, the net present value of reserves is determined based on the following assumptions:
| | |
| Processed volume | | Variable because the load inputs are diverse |
| Rate of U.S. dollar | | $20.6640 mxp/usd |
| Useful lives of the cash generating units | | Average of 10 years |
| Discount rate | | 10.72% annually |
The recoverable amount of assets based on each asset’s value in use. The value in use for each asset is calculated based on cash flows, taking into consideration volumes produced and sold. As of December 31, 2016, the value in use amounted to Ps.572,909 in the Matapionche gas processing center. Until December 31, 2016, the projection of cash flows was calculated based on a period of 10 years according to the useful life of each gas processing center.
Cash generating unit of petrochemicals
To determine the value in use of long-lived assets associated with petrochemicals centers, the net present value of reserves is determined based on the following assumptions:
| | |
| Processed volume | | Variable because the load inputs are diverse |
| Rate of U.S. dollar | | $20.6640 mxp/usd |
| Useful lives of the cash generating units | | Average of 4 years |
| Discount rate | | 10.29% annually |
The recoverable amount of assets is based on each asset’s value in use. The value in use for each asset is calculated based on cash flows, taking into consideration volumes produced and sold. As of December 31, 2016, the value in use of impairment fixed assets amounted to Ps. 4,148,373 in the petrochemicals centers Cangrejera and Independencia. Until December 31, 2016, the projection of cash flows was calculated based on a period of 4 years according to the useful life of each petrochemical center.
Cash generating unit of logistics
The cash generating units of PEMEX’s logistics segments are pipelines, tankers, storage terminals and transportation equipment used for service, transport and storage of oil, oil products and petrochemicals.
Pemex Logistics calculates the recoverable amount of assets based on the value in use. The value in use for each asset is calculated based on cash flows, taking into consideration services income. As of December 31,
F-59
PETRÓLEOS MEXICANOS, PRODUCTIVE STATE-OWNED SUBSIDIARIES
AND SUBSIDIARY COMPANIES
NOTES TO THE CONSOLIDATED FINANCIAL STATEMENTS
FOR THE YEARS ENDED DECEMBER 31, 2016, 2015 AND 2014
(FIGURES STATED IN THOUSANDS, EXCEPT AS NOTED)
2016, the value in use amounted to Ps. 139,436,715. Until December 31, 2016, the projection of cash flows was calculated based on a period of 5 years. During 2016 the discount rate used was 12.63%.
As of December 31, 2016, reversal of impairment amounted Ps. (5,829,520), mainly due to improvements in operating costs.
Cash generating unit of ethylene
Pemex Ethylene calculates the recoverable amount of assets based on the value in use. The value in use for each asset is calculated based on cash flows, taking into consideration services income. As of December 31, 2016 the value in use of impairment fixed assets amounted to Ps. (1,276,510). During 2016 the discount rate used was 10.29%.
| | ii. | As of December 31, 2015, PEMEX recognized an impairment of fixed assets in the amount of Ps. 477,944,688, mainly due to the decrease in cash flows as a result of the steep decline in crude oil prices, a higher discount rate, and a decrease in the period used to calculate future cash flows, which affected certain projects. |
Cash generating unit of exploration and production
The cash generating units of Pemex Exploration and Production are investment projects grouped from productive fields with hydrocarbon reserves associated with proved reserves (1P). These productive hydrocarbon fields contain varying degrees of heating power consisting of a set of wells and are supported by fixed assets associated directly with production, such as pipelines, production facilities, offshore platforms, specialized equipment and machinery.
Each project represents the smallest unit which can concentrate the core revenues, with clear costs and expenses that enable future cash flows (value in use) to be determined.
To determine the value in use of long-lived assets associated with hydrocarbon extraction, the net present value of reserves is determined based on the following assumptions:
| | |
| Crude oil average price | | 57.57 U.S. dollars/bl (2016-2034) |
| Gas average price | | 3.39 U.S. dollars/mpc (2016-2034) |
| Condensated average price | | 41.63 U.S. dollars/bl (2016-2034) |
| Total production | | 8,694 mm bpce |
| Average rate of U.S. dollar | | $17.40 mxp/usd (2016-2034) |
| Production horizon | | 19 years |
| Discount rate | | 15.48% annually |
Pemex Exploration and Production determines the recoverable amount of fixed assets based on the long-term estimated prices for Pemex Exploration and Production’s proved reserves (1P). The recoverable amount on each asset is the value in use. As of December 31, 2015 the value in use of impairment fixed assets amounted to Ps. 266,214,532. Until December 31, 2014, Pemex Exploration and Production based its estimates of long-term prices for proved reserves on a 25 year period for the projection of cash flows; however, due to changes in the applicable regulatory provisions as a result of the Energy Reform, as of January 1, 2015, the period used to
F-60
PETRÓLEOS MEXICANOS, PRODUCTIVE STATE-OWNED SUBSIDIARIES
AND SUBSIDIARY COMPANIES
NOTES TO THE CONSOLIDATED FINANCIAL STATEMENTS
FOR THE YEARS ENDED DECEMBER 31, 2016, 2015 AND 2014
(FIGURES STATED IN THOUSANDS, EXCEPT AS NOTED)
estimate long-term prices was reduced to 20 years as a contractual limit. The discount rate used in 2015 was 15.48%, which included an assessment of factors of market risk, country risk, capital cost and cost of debt. Cash flows projections were determined based on the assumptions described above, presenting a declining rate of growth of Ps. 394,396,580. The main projects that were affected by this declining rate of growth were Cantarell, Aceite Terciario del Golfo, Crudo Ligero Marino, Antonio J. Bermudez and Burgos.
Cash Generating Units of industrial transformation
As of December 31, 2015, industrial transformation cash generating units recognized Ps. 76,442,079 of impairment of long-lived assets, mainly due to: an impairment of Ps. 75,724,859 in the cash generating unit of refining, an impairment of Ps. 325,200 in the cash generating unit of gas and an impairment of Ps.392,020 in the cash generating unit of petrochemicals.
Cash generating unit of refining
As a result of the Corporate Reorganization, the cash generating units of PEMEX’s refining activities were redefined to those refineries located in the following strategic points of Mexico: Cadereyta, Minatitlán, Salamanca, Salina Cruz, Madero and Tula. The National Refinery System was previously a cash generating unit.
To determine the value in use of long-lived assets associated with refineries of the National Refinery System, the net present value of reserves was determined based on the following assumptions:
| | |
| Crude oil average price | | 56.02 U.S. dollars per processed barrel (2016-2029) |
| Processed volume | | 204.4 mbd (2016-2029 average) |
| Average rate of U.S. dollar | | $17.40 mxp/usd (2016-2029) |
| Useful lives of the cash generating units | | Average of 14 years |
| Discount rate | | 13.72% annually |
The recoverable amount of the refineries’ assets is based on each asset’s value in use. The value in use for each asset is calculated based on cash flows, taking into consideration volumes produced and sold. As of December 31, 2015 the value in use of impairment fixed assets amounted to Ps. 1,801,000. Until December 31, 2015, the projection of cash flows was based on a period of 14 years. During 2015 the discount rate used was 13.72%.
As of December 31, 2015, the total impairment charge on long-lived assets was Ps. 75,724,859, including impairment charges of Ps. 53,890,967 recorded by the Minatitlán cash generating unit and Ps. 21,833,892 recorded by the Madero cash generating unit.
Cash generating unit of gas
The cash generating units of PEMEX’s gas and petrochemicals activities are gas processing centers located in the following strategic points of Mexico: Ciudad Pemex, Cactus, Nuevo Pemex, La Venta, Coatzacoalcos, Matapionche, Poza Rica, Burgos and Arenque.
F-61
PETRÓLEOS MEXICANOS, PRODUCTIVE STATE-OWNED SUBSIDIARIES
AND SUBSIDIARY COMPANIES
NOTES TO THE CONSOLIDATED FINANCIAL STATEMENTS
FOR THE YEARS ENDED DECEMBER 31, 2016, 2015 AND 2014
(FIGURES STATED IN THOUSANDS, EXCEPT AS NOTED)
To determine the value in use of long-lived assets associated with gas processing centers, the net present value of reserves is determined based on the following assumptions:
| | |
| Crude oil average price | | $ 50.61 mxp per mdpc (2016-2029) |
| Processed volume | | 2,021 mmpcd of sour gas (2016-2029) |
| | 805 mmpcd ofwet-sweet gas (2016-2029) |
| Average rate of U.S. dollar | | $17.40 mxp/usd (2016-2029) |
| Useful lives of the cash generating units | | Average of 11 years |
| Discount rate | | 9.52% annually |
The recoverable amount of assets based on each asset’s value in use. The value in use for each asset is calculated based on cash flows, taking into consideration volumes produced and sold. As of December 31, 2015 the value in use of impairment fixed assets amounted to Ps. 235,000. Until December 31, 2015, the projection of cash flows was calculated based on a period of 13 years. During 2015 the discount rate used was 9.52%.
As of December 31, 2015, impairment of wells, pipelines, properties, plant and equipment includes an impairment charge on long-lived assets of Ps. 325,200 recorded by the Arenque cash generating unit.
Cash generating unit of petrochemicals
The cash generating units of PEMEX’s petrochemicals segment are petrochemicals centers located in the following strategic points of Mexico: Independencia and Cangrejera.
The recoverable amount of assets based on each asset’s value in use. The value in use for each asset is calculated based on cash flows, taking into consideration volumes produced and sold. As of December 31, 2015 there was no value in use for these cash generating units. Until December 31, 2015, the projection of cash flows was calculated based on a period of 14 years. During 2015 the discount rate used was 8.84%.
As of December 31, 2015, impairment of wells, pipelines, properties, plant and equipment includes an impairment charge on long-lived assets of Ps. 392,020 recorded by the Cangrejera cash generating unit.
Cash generating unit of logistics
The cash generating units of PEMEX’s logistics segments are pipelines, tankers, storage terminals and transportation equipment used for service, transport and storage of oil, oil products and petrochemicals. Cash generating units were redefined as a result of the Corporate Reorganization in 2015, prior to which they were part of cash generating units from The National Refinery System and imported products.
Pemex Logistics calculates the recoverable amount of assets based on the value in use. The value in use for each asset is calculated based on cash flows, taking into consideration services income. As of December 31, 2015 the value in use of impairment fixed assets amounted to Ps. 93,873,919. Until December 31, 2015, the projection of cash flows was calculated based on a period from 5 to 21 years. During 2015 the discount rate used was 8.42%.
As of December 31, 2015, impairment of wells, pipelines, properties, plant and equipment includes an impairment charge on long-lived assets of Ps. 5,829,519 recorded by the cash generating units mentioned above.
F-62
PETRÓLEOS MEXICANOS, PRODUCTIVE STATE-OWNED SUBSIDIARIES
AND SUBSIDIARY COMPANIES
NOTES TO THE CONSOLIDATED FINANCIAL STATEMENTS
FOR THE YEARS ENDED DECEMBER 31, 2016, 2015 AND 2014
(FIGURES STATED IN THOUSANDS, EXCEPT AS NOTED)
Cash generating unit of ethylene
Pemex Ethylene calculates the recoverable amount of assets based on each asset’s value in use. The value in use for each asset is calculated based on cash flows, taking into consideration sales and services income. As of December 31, 2015 the value in use of impairment fixed assets amounted to Ps. 129,843. During 2015 the discount rate used was 7.28%.
As of December 31, 2015, impairment of wells, pipelines, properties, plant and equipment includes an impairment charge on long-lived assets of Ps. 1,276,510 recorded by the cash generating units mentioned above.
PEMEX’snet-future cash flow projections are based on the best available estimations of revenues and expenses of the cash-generating units, using forecasts, past performances and market developement. PEMEX’s annual budget and business plan set macroeconomic variables for each of the cash-generating units using real basis and including some variables, such as production volume, market prices, exchange rates, among other variables, which are used to quantify estimated income and expenses. Forecasts are prepared based on internal values and are updated based on changes to certain relevant information from external sources (mainly price predictions made by consultants and specialized entities).
The key value assumptions, which are the more sensitive variables used to calcultate net cash flows, and the general principles used to generate these assumptions are as follows:
| | i. | Sales prices for oil and gas. The resulting prices are consistent with those used by PEMEX to make investing decisions and are based on observable prices in the international market from the date of the statement of financial position. |
| | ii. | Reserves and production programs. Proved reserves of oil and gas are estimated on the basis of oil and gas reserves as of December 31, 2016 adjusted to comply with applicable rules, with the framework established by the SEC and with the framework established by the Sociedad de Ingenieros Petroleros, taking into account the development plan. Productions programs are estimated on the basis of reserves, production levels in actual wells and development plans established for each productive field. |
| | iii. | Operating expenses and investments. Operating expenses and investments are calculated in the first year based on PEMEX’s annual budget for the first year and subsequently updated in accordance with asset development programs. PEMEX does not include expenses related to enhancement of assets in order to carry out tests using value in accordance with IAS 36, “Impairment of Assets.” |
These future net cash flows estimates are discounted to their present value using discount rates for specific cash-generating units based on the currency in which they are denominated, their cash flows and risks associated with these cash flows. Discount rates are intended to reflect current market assessments of the time value of money and the specific risks of each asset. Accordingly, various discount rates used take into account the country risk. To ensure calculations are consistent and avoid double counting, the cash flow projections do not take into account the risks that have already been incorporated in the discount rates used. The discount rates reflect current market conditions and the specific risks associated with these assets.
| e. | As a result of the Energy Reform Decree, the secondary legislation and the corresponding initial adjudication of rights for the exploration and extraction of oil and solid hydrocarbons mentioned in transitory article 6 of the Energy Reform Decree, certain assignments that Pemex Exploration and |
F-63
PETRÓLEOS MEXICANOS, PRODUCTIVE STATE-OWNED SUBSIDIARIES
AND SUBSIDIARY COMPANIES
NOTES TO THE CONSOLIDATED FINANCIAL STATEMENTS
FOR THE YEARS ENDED DECEMBER 31, 2016, 2015 AND 2014
(FIGURES STATED IN THOUSANDS, EXCEPT AS NOTED)
| | Production received from the Mexican Government were affected. These investments are expected to be compensated at their economic fair value. As of December 31, 2016, the carrying amount of the investments affected is as follows: |
| | | | | | | | |
| | | Fields | | | Amount | |
Temporarily assigned fields | | | 6 | | | Ps. | 2,107,126 | |
Unassigned requested fields | | | 44 | | | | 12,077,947 | |
Exploratory areas not assigned | | | 14 | | | | 843,960 | |
| | | | | | | | |
Total | | | | | | Ps. | 15,029,033 | |
| | | | | | | | |
| f. | PEMEX entered into certain capital lease arrangements for tankers. These leases expire on various dates until 2018. |
As of December 31, 2013, PEMEX had entered into nine capital lease arrangements for drilling equipment. These leases expire on various dates over the next 10 years.
As of December 31, 2015, PEMEX had entered into certain capital lease arrangements for two offshore platforms. These leases expire on various dates over the next 10 years.
As of December 31, 2016 and 2015, assets acquired through these capital leases were as follows:
| | | | | | | | |
| | | 2016 | | | 2015 | |
Investment in tankers and drilling equipment | | Ps. | 11,142,197 | | | Ps. | 11,142,197 | |
Less accumulated depreciation | | | (1,274,314 | ) | | | (1,176,208 | ) |
| | | | | | | | |
| | Ps. | 9,867,883 | | | Ps. | 9,965,989 | |
| | | | | | | | |
The liabilities relating to the assets listed above are payable in the years following December 31, 2016 as presented below:
| | | | | | | | |
Year | | Pesos | | | U.S. dollars | |
2017 | | | Ps. 2,037,107 | | | U.S.$ | 98,583 | |
2018 | | | 1,941,756 | | | | 93,968 | |
2019 | | | 1,245,341 | | | | 60,266 | |
2020 | | | 1,245,341 | | | | 60,266 | |
2021 | | | 1,245,341 | | | | 60,266 | |
2022 and thereafter | | | 3,499,546 | | | | 169,355 | |
| | | | | | | | |
| | | 11,214,432 | | | | 542,704 | |
Less: short-term unaccrued interest | | | 436,619 | | | | 21,129 | |
Less: long-term unaccrued interest | | | 1,218,753 | | | | 58,980 | |
| | | | | | | | |
Total capital leases | | | 9,559,060 | | | | 462,595 | |
Less: current portion of leases (excluding interest) | | | 1,600,488 | | | | 77,753 | |
| | | | | | | | |
Total long-term capital leases | | | Ps. 7,958,572 | | | U.S. $ | 384,842 | |
| | | | | | | | |
F-64
PETRÓLEOS MEXICANOS, PRODUCTIVE STATE-OWNED SUBSIDIARIES
AND SUBSIDIARY COMPANIES
NOTES TO THE CONSOLIDATED FINANCIAL STATEMENTS
FOR THE YEARS ENDED DECEMBER 31, 2016, 2015 AND 2014
(FIGURES STATED IN THOUSANDS, EXCEPT AS NOTED)
The capitalized interest expense from financial leases for the years ended December 31, 2016, 2015 and 2014 was Ps.500,654, Ps. 450,760 and Ps. 242,436, respectively.
The discount rates applied to the calculation of capitalized leases were as follows:
| | i. | 7.96 % rate in nominal terms (4.45% in real terms) as of December 31, 2016. |
| | ii. | 7.96 % rate in nominal terms (5.71% in real terms) as of December 31, 2015. |
| | iii. | 7.96% rate in nominal terms (3.73% in real terms) as of December 31, 2014. |
| g. | Certain infrastructure assets used for oil and gas activities are guaratees for the U.S. $1,100,000 and U.S. $600,000 sale and lease back agreements dated as of June 17, 2016 and July 8, 2016 (see Note 15). |
| h. | As of December 31, 2016, certain fixed assets were reclassified asheld-for-salenon-financial assets in the amout of Ps. 7,460,674 (see Note9-b). |
NOTE 13. INTANGIBLE ASSETS
At December 31, 2016 and 2015, intangible assets are wells unassigned to a reserve, which amounted Ps. 8,639,242 and Ps. 14,304,961, respectively as follows:
| | | | | | | | |
| | | 2016 | | | 2015 | |
Wells unassigned to a reserve: | | | | | | | | |
Balance at the beginning of period | | | Ps. 14,304,961 | | | | Ps. 14,970,904 | |
Additions to construction in progress | | | 20,526,300 | | | | 28,725,376 | |
Transfers against expenses | | | (9,798,246 | ) | | | (13,081,780 | ) |
Transfers against fixed assets | | | (16,393,773 | ) | | | (16,309,539 | ) |
| | | | | | | | |
Balance at the end of period | | | Ps. 8,639,242 | | | | Ps. 14,304,961 | |
| | | | | | | | |
In addition, as of December 31, 2016 and 2015, PEMEX recognized expenses related to unsuccessful wells of Ps. 19,307,838 and Ps. 10,131,739, respectively, directly in its statement of comprehensive income.
NOTE 14. LONG-TERM NOTES RECEIVABLE AND OTHER ASSETS
| a. | Long-term notes receivable |
As of December 31, 2016 and 2015, the balance of long-term notes receivable was as follows:
| | | | | | | | |
| | | 2016 | | | 2015 | |
Promissory notes issued by the Mexican Government | | | Ps. 140,578,871 | | | | Ps. 50,000,000 | |
Other long-term notes receivable(i) | | | 8,028,731 | | | | — | |
| | | | | | | | |
Total long-term notes receivable | | | Ps. 148,607,602 | | | | Ps. 50,000,000 | |
| | | | | | | | |
| | (i) | Primarily CENAGAS, see Note9-a. |
F-65
PETRÓLEOS MEXICANOS, PRODUCTIVE STATE-OWNED SUBSIDIARIES
AND SUBSIDIARY COMPANIES
NOTES TO THE CONSOLIDATED FINANCIAL STATEMENTS
FOR THE YEARS ENDED DECEMBER 31, 2016, 2015 AND 2014
(FIGURES STATED IN THOUSANDS, EXCEPT AS NOTED)
Promissory notes issued by the Mexican Government
| | | | | | | | |
| | | 2016 | | | 2015 | |
Total promissory notes | | | Ps. 142,124,620 | | | | Ps.50,000,000 | |
Less: current portion of notes receivable(2) | | | 1,545,749 | | | | — | |
| | | | | | | | |
Long-term promissory notes | | | Ps. 140,578,871 | | | | Ps.50,000,000 | |
| | | | | | | | |
| | (2) | The current portion of the promissory notes and the total yield payments due are allocated under sundry debtors in accounts receivable, net (see Note 7). |
On December 24, 2015, the SHCP published in the Official Gazette of the Federation theDisposiciones de carácter general relativas a la asunción por parte del Gobierno Federal de obligaciones de pago de pensiones y jubilaciones a cargo de Petróleos Mexicanos y sus empresas productivas subsidiarias (General provisions regarding the assumption by the Mexican Government of the payment obligations related to pensions and retirement plans of Petróleos Mexicanos and its productive state-owned subsidiaries). These regulations stated the terms, conditions, financing mechanisms and payment arrangements pursuant to which the SHCP would assume a portion of the payment obligations related to PEMEX’s pensions and retirement plans. An independent expert reviewed the calculation, the methodology used, the maturity profile and all of the information provided by PEMEX.
In accordance with these provisions and prior to the completion of the independent expert’s review described above, on December 24, 2015, the Mexican Government issued in advance payment, through the SHCP, a Ps. 50,000,000non-negotiable promissory note due December 31, 2050 payable to Petróleos Mexicanos. The promissory note, which accrued interest at a rate of 6.93% per year, was recognized as a long-term note receivable innon-current assets once the independent expert named by SHCP concluded its review.
On August 5, 2016, Petróleos Mexicanos received promissory notes issued by the Mexican Government at a discount value of Ps. 184,230,586 as of June 29, 2016, as part of the Mexican Government’s assumption of a portion of the payment liabilities related to Petróleos Mexicanos and Subsidiary Entities’ pensions and retirement plans, which notes were delivered in exchange for the Ps. 50,000,000 promissory notes issued to Petróleos Mexicanos on December 24, 2015. On August 15, 2016 Petróleos Mexicanos exchanged Ps. 47,000,000 of these promissory notes for short-term floating rate Mexican Government debt securities, known as Bonos de Desarrollo del Gobierno Federal (Development Bonds of the Federal Government or “BONDES D”). Petróleos Mexicanos then sold the BONDES D to Mexican development banks at market prices.
Petróleos Mexicanos recognized a Ps. 135,439,612 increase in equity as a result of the Ps. 184, 230,586 discount value of the promissory notes as of June 29, 2016, minus the Ps. 50,000,000 promissory note received by Petróleos Mexicanos on December 24, 2015, plus a Ps. 1,209,026 increase in the value of the promissory notes from June 29, 2016 to August 15, 2016, the date on which PEMEX received the promisorry notes.(see Note 21).
F-66
PETRÓLEOS MEXICANOS, PRODUCTIVE STATE-OWNED SUBSIDIARIES
AND SUBSIDIARY COMPANIES
NOTES TO THE CONSOLIDATED FINANCIAL STATEMENTS
FOR THE YEARS ENDED DECEMBER 31, 2016, 2015 AND 2014
(FIGURES STATED IN THOUSANDS, EXCEPT AS NOTED)
As of December 31, 2016, these promissory notes at discount valued amounted to Ps. 142,124,620. PEMEX intends is to hold them to maturity. These promissory notes will be converted into cash with annual maturity dates ranging from 2017 to 2042 and annual rates ranging from 4.35% to 7.04% as follows:
| | | | | | | | |
Number of Promissory Notes | | Maturity | | Yield Rate Range | | Principal
Amount
(discount
value) | |
1 | | 2017 | | 4.35% | | Ps. | 1,545,749 | |
1 | | 2018 | | 4.65% | | | 2,408,634 | |
1 | | 2019 | | 5.14% | | | 3,402,849 | |
1 | | 2020 | | 5.39% | | | 4,192,132 | |
1 | | 2021 | | 5.57% | | | 4,957,840 | |
5 | | 2022 to 2026 | | 4.74% a 6.11% | | | 30,986,252 | |
5 | | 2027 to 2031 | | 6.32% a 6.77% | | | 33,280,216 | |
5 | | 2032 to 2036 | | 6.81% a 7.00% | | | 31,370,504 | |
6 | | 2037 to 2042 | | 6.94% a 7.04% | | | 29,980,444 | |
| | | | | | | | |
| | Total promissory notes | | Ps. | 142,124,620 | |
| | Less: current portion | | | 1,545,749 | |
| | | | | | |
| | Long-term notes receivable | | Ps. | 140,578,871 | |
| | | | | | |
From August 2016 to December 2016, PEMEX received Ps. 3,597,654 in accrued yields from these promissory notes, which was recognized as financing income in the consolidated statement of comprehensive income.
The promissory notes have fixed yield rates. Accordingly they are not exposed to market risk. In addition, PEMEX believes the promissory notes do not have anon-compliance risk because they are issued by the Mexican Government in Mexican pesos.
At December 31, 2016 and 2015, the balance of other assets was as follows:
| | | | | | | | |
| | | 2016 | | | 2015 | |
Payments in advance | | Ps. | 2,558,767 | | | Ps. | 1,980,260 | |
Other | | | 6,953,878 | | | | 5,427,400 | |
| | | | | | | | |
Total other assets | | Ps. | 9,512,645 | | | Ps. | 7,407,660 | |
| | | | | | | | |
NOTE 15. DEBT
The Federal Income Law applicable to PEMEX as of January 1, 2016, published in the Official Journal of the Federation on November 18, 2015, authorized Petróleos Mexicanos and its Subsidiaries Entities to incur an internal net debt up to Ps. 110,500,000 and an external net debt up to U.S. $8,500,000. PEMEX can incur additional internal or external debt, as long as the total amount of net debt (Ps.240,550,000 equivalent to U.S. $15,722,000) does not exceed the ceiling established by the Federal Income Law.
F-67
PETRÓLEOS MEXICANOS, PRODUCTIVE STATE-OWNED SUBSIDIARIES
AND SUBSIDIARY COMPANIES
NOTES TO THE CONSOLIDATED FINANCIAL STATEMENTS
FOR THE YEARS ENDED DECEMBER 31, 2016, 2015 AND 2014
(FIGURES STATED IN THOUSANDS, EXCEPT AS NOTED)
On November 18, 2014, the Board of Directors of Petróleos Mexicanos approved policies and general requirements for obligations that constitute public debt of Petróleos Mexicanos and Subsidiary Entities, in accordance with the Article 107 of the Petroleos Mexicanos Law.
Subsequently, the Board of Directors of PEMEX, approved the debt program for fiscal year 2016 in accordance with Article 13 section XXVI of the Petróleos Mexicanos Law.
During 2016, PEMEX participated in the following financing activities:
| | a. | On January 25, 2016, Petróleos Mexicanos increased its Medium-Term Notes Program from U.S. $52,000,000 to U.S. $62,000,000. |
| | b. | On February 4, 2016, Petróleos Mexicanos issued U.S. $5,000,000 of debt securities under its Medium-Term Notes Program, Series C, in three tranches: (i) U.S. $750,000 of its 5.500% Notes due February 2019; (ii) U.S. $1,250,000 of its 6.375% Notes due February 2021; and (iii) U.S. $3,000,000 of its 6.875% Notes due August 2026. All debt securities issued under this program are guaranteed by Pemex Exploration and Production, Pemex Industrial Transformation, Pemex Drilling and Services, Pemex Logistics and Pemex Cogeneration and Services. |
| | c. | On February 5, 2016, Petróleos Mexicanos obtained a loan from a line of credit for Ps. 7,000,000,000 bearing interest at a floating rate linked to the TIIE, plus 0.55%, and matured on January 2017. |
| | d. | On March 15, 2016, Petróleos Mexicanos issued €2,250,000 of debt securities U.S. $62,000,000 Medium-Term Notes Program, Series C in two tranches: (i) €1,350,000 of its 3.750% Notes due to March 2019 and (ii) €900,000 of its 5.125% Notes due to March 2023. All debt securities issued under this program are guaranteed by Pemex Exploration and Production, Pemex Industrial Transformation, Pemex Drilling and Services, Pemex Logistics and Pemex Cogeneration and Services. |
| | e. | On March 17, 2016, Petróleos Mexicanos borrowed Ps. 2,000,000 from a credit line at a floating rate linked to TIIE and matured on March 2017. |
| | f. | On March 17, 2016, Petróleos Mexicanos borrowed Ps. 3,300,000 from a credit line at a floating rate linked to TIIE and matured on March 2017. |
| | g. | On March 23, 2016, Petróleos Mexicanos issued Ps. 5,000,000 of Certificados Bursátiles due to October 2019 at a floating rate linked to TIIE. As of December 31, 2016, all debt securities issued under this program are guaranteed by Pemex Exploration and Production, Pemex Industrial Transformation, Pemex Drilling and Services, Pemex Logistics and Pemex Cogeneration and Services. |
| | h. | On March 28, 2016, Petróleos Mexicanos borrowed Ps. 9,700,000 from a credit line at a floating rate linked to TIIE, and matured on March 2017. |
| | i. | On April 19, 2016, Petróleos Mexicanos borrowed €500,000 from a credit line at fixed rate of 5.11%, which matures on March 2023. |
| | j. | On May 31, 2016, Petróleos Mexicanos obtained a U.S. $300,000 bilateral credit line from Export Development Canada (EDC), due on May 2021, which bears interest at a floating rate linked to the London Interbank Offered Rate (“LIBOR”). |
| | k. | On June 14, 2016, Petróleos Mexicanos issued CHF 375,000 of debt securities under its Medium-Term Notes Program, Series C, in two tranches: (1) CHF 225,000 of its 1.50% Notes due to June 2018 and |
F-68
PETRÓLEOS MEXICANOS, PRODUCTIVE STATE-OWNED SUBSIDIARIES
AND SUBSIDIARY COMPANIES
NOTES TO THE CONSOLIDATED FINANCIAL STATEMENTS
FOR THE YEARS ENDED DECEMBER 31, 2016, 2015 AND 2014
(FIGURES STATED IN THOUSANDS, EXCEPT AS NOTED)
| | (2) CHF 150,000 of its 2.35% Notes due to December 2021. The Notes are guaranteed by Pemex Exploration and Production, Pemex Industrial Transformation, Pemex Drilling and Services, Pemex Logistics and Pemex Cogeneration and Services. |
| | l. | On June 17, 2016, Pemex Exploration and Production obtained approximately U.S. $1,100,000 in connection with the sale and leaseback of certain infrastructure assets used for oil and gas activities. As part of this transaction, Pemex Exploration and Production entered into a15-year financial lease agreement, which will last for the greater part of the economic life of the asset, at a fixed rate of 8.38%, pursuant to which Pemex Exploration and Production will retain the operation of these assets and the title and ownership of such assets will revert to Pemex Exploration and Production at the end of this period following payment of an agreed price. This transaction was recognized as a financing activity due to the fact that PEMEX retained all of the risks and benefits associated with ownership of the asset and substantially all of the operating rights of the asset. |
| | m. | On July 8, 2016, Pemex Industrial Transformation obtained approximately U.S. $600,000 in connection with the sale and leaseback of a plant located in the Madero Refinery. As part of this transaction, Pemex Industrial Transformation entered into a20-year financial lease agreement pursuant to which Pemex Industrial Transformation will retain the operation of the plant and title and ownership will revert to Pemex Industrial Transformation at the end of this period following payment of an agreed price. This transaction was recognized as a financing activity due to the fact that Pemex Industrial Transformation retained all of the risks and benefits associated with ownership of the asset and substantially all of the operating rights of the asset. |
| | n. | On July 26, 2016, Petróleos Mexicanos issued ¥80,000,000 Bonds at 0.54% due July 2026. The Bonds are guaranteed by the Japan Bank for International Cooperation. |
| | o. | On September 21, 2016, Petróleos Mexicanos issued U.S. $4,000,000 aggregate principal amount of debt securities under its U.S. $62,000,000 Medium-Term Notes Program, Series C, in two tranches: (i) U.S. $2,000,000 of its 4.625% Notes due to September 2023 and (ii) U.S. $2,000,000 of its 6.750% Bonds due to September 2047. The debt securities are guaranteed by Pemex Exploration and Production, Pemex Industrial Transformation, Pemex Drilling and Services, Pemex Logistics and Pemex Cogeneration and Services. |
| | p. | On October 3, 2016, Petróleos Mexicanos consummated a tender and exchange offer pursuant to which it (i) purchased U.S. $687,725 aggregate principal amount of its outstanding 8.000% Notes due 2019 and U.S. $657,050 aggregate principal amount of its outstanding 5.750% Notes due 2018 and (ii) exchanged (a) U.S. $73,288 aggregate principal amount of its outstanding 5.750% Notes due 2018 for U.S. $69,302 aggregate principal amount of its 4.625% Notes due 2023 and U.S. $8,059 aggregate principal amount of its 6.750% Bonds due 2047 and (b) U.S. $1,591,961 aggregate principal amount of its outstanding 5.500% Bonds due 2044 for U.S. $1,491,941 aggregate principal amount of its 6.750% Bonds due 2047. The 4.625% Notes due 2023 and 6.750% Bonds due 2047 are guaranteed by Pemex Exploration and Production, Pemex Industrial Transformation, Pemex Drilling and Services, Pemex Logistics and Pemex Cogeneration and Services and represent reopenings of the 4.625% Notes due 2023 and 6.750% Bonds due 2047, respectively, originally issued on September 21, 2016 |
| | q. | On December 6, 2016, Petróleos Mexicanos increased its Medium-Term Notes Program, Series C, from U.S. $ 62,000,000 to U.S. $72,000,000. |
F-69
PETRÓLEOS MEXICANOS, PRODUCTIVE STATE-OWNED SUBSIDIARIES
AND SUBSIDIARY COMPANIES
NOTES TO THE CONSOLIDATED FINANCIAL STATEMENTS
FOR THE YEARS ENDED DECEMBER 31, 2016, 2015 AND 2014
(FIGURES STATED IN THOUSANDS, EXCEPT AS NOTED)
| | r. | On December 13, 2016, Petróleos Mexicanos issued U.S. $5,500,000 of its debt securities under its Medium-Term Notes Program, Series C in three tranches: (1) U.S. $3,000,000 at fixed rate of 6.50% due March 2027, (2) U.S. $1,500,000 a fixed rate of 5.375% due March 2022, and (3) U.S. $1,000,000 at a floating rate linked to LIBOR, due March 2022. As of December 31, 2016, all debt securities issued under this program are guaranteed by Pemex Exploration and Production, Pemex Industrial Transformation, Pemex Drilling and Services, Pemex Logistics and Pemex Cogeneration and Services. |
| | s. | On December 14, 2016, Petróleos Mexicanos entered into a term loan credit facility in the amout of U.S. $300,000 at floating rate linked to LIBOR, matures on December 2019. |
Between January 1 and December 31, 2016, PMI HBV obtained and paid U.S. $11,369,800 in revolving credit lines. As of December 31, 2016 there was no outstanding amount.
As of December 31, 2016, Petróleos Mexicanos had U.S. $4,750,000 and Ps. 23,500,000 in available credit lines in order to ensure liquidity. The available amounts are U.S. $4,630,000 and Ps. 3,500,000, respectively.
The Federal Income Law applicable to PEMEX as of January 1, 2015, published in the Official Journal of the Federation on November 13, 2014, authorized Petróleos Mexicanos and its Subsidiaries Entities to incur an internal net debt up to Ps. 110,500,000 and an external net debt up to U.S. $6,500,000. PEMEX can incur additional internal or external debt, as long as the total amount of net debt (Ps.195,000,000 equivalent to U.S. $15,000,000) does not exceed the ceiling established by the Federal Income Law.
On November 18, 2014, the Board of Directors of Petróleos Mexicanos approved policies and general requirements for obligations that constitute public debt of Petróleos Mexicanos and Subsidiary Entities, in accordance with the Article 107 of the Petroleos Mexicanos Law.
Subsequently, the Board of Directors of PEMEX, approved the debt program for fiscal year 2015 in accordance with Article 13 section XXVI of the Petróleos Mexicanos Law.
During 2015, the significant financing activities of PEMEX were as follows:
| | a. | On January 16, 2015, Petróleos Mexicanos obtained a direct loan for Ps. 7,000,000 bearing interest at a floating rate linked to the Tasa de Interés Interbancaria de Equilibrio (Interbank Equilibrium Interest Rate, or “TIIE”) 28 days plus 35 base points, and matured on January 16, 2016. |
| | b. | On January 22, 2015, Petróleos Mexicanos increased its Medium-Term Notes Program from U.S. $42,000,000 to U.S. $52,000,000. As of December 31, 2015, all debt securities issued under this program are guaranteed by Pemex Exploration and Production, Pemex Industrial Transformation, Pemex Drilling and Services, Pemex Logistics and Pemex Cogeneration and Services. |
| | c. | On January 23, 2015, Petróleos Mexicanos issued U.S. $6,000,000 of its debt securities under its U.S. $52,000,000 Medium-Term Notes Program, Series C in three tranches: (1) U.S. $1,500,000 of its 3.500% Notes due 2020; (2) U.S. $1,500,000 of its 4.500% Notes due 2026; and (3) U.S. $3,000,000 of its 5.625% Bonds due 2046. |
| | d. | On January 30, 2015, Petróleos Mexicanos amended the terms of its revolving credit facility in order to increase the amount available thereunder from U.S. $1,250,000 to U.S. $3,250,000 and to extend the maturity date to February 5, 2020. On February 5, 2015, Petróleos Mexicanos borrowed U.S. $1,950,000 under this facility to prepay in full its U.S. $700,000 credit facility dated as of December 17, 2014. |
F-70
PETRÓLEOS MEXICANOS, PRODUCTIVE STATE-OWNED SUBSIDIARIES
AND SUBSIDIARY COMPANIES
NOTES TO THE CONSOLIDATED FINANCIAL STATEMENTS
FOR THE YEARS ENDED DECEMBER 31, 2016, 2015 AND 2014
(FIGURES STATED IN THOUSANDS, EXCEPT AS NOTED)
| | e. | On February 11, 2015, Petróleos Mexicanos issued Ps. 24,287,902 aggregate principal amount of Certificados Bursátiles in three tranches. The first tranche was issued at a fixed rate of 7.47% due 2026 in an aggregate principal amount of Ps. 17,000,000, consisting of (1) an international offering outside of Mexico of Ps. 9,000,000 of “Euroclearable Certificados Bursátiles,” which are eligible for clearance through Euroclear Clearance System plc and Indeval, and (2) a concurrent offering to the public in Mexico of Ps. 8,000,000. This issuance was a reopening of the same series of Certificados Bursátiles due 2026 that was originally issued on November 27, 2014. The second tranche was issued at a floating rate due 2020 in an aggregate principal amount of Ps. 4,300,000. This issuance was a reopening of the same series of Certificados Bursátiles due 2020 that was originally issued on November 27, 2014. The third tranche was issued at a fixed rate of 3.94% due 2026 in an aggregate principal amount of 565,886,800 Unidades de Inversión (“UDIs”), equivalent to Ps. 2,987,902. This issuance represented the fourth reopening of the same series originally issued on January 30, 2014 and subsequently reopened on July 2, 2014, September 11, 2014 and November 27, 2014. These certificados bursátiles were issued under Petróleos Mexicanos’ Ps. 200,000,000 or UDI equivalent Certificados Bursátiles Program. |
| | f. | On February 11, 2015, Petróleos Mexicanos entered into a term loan credit facility in the amount of U.S. $ 2,000,000. On February 17, 2015, Petróleos Mexicanos borrowed U.S. $2,000,000 under this facility to prepay in full its credit agreement dated as of November 18, 2010. |
| | g. | On March 24, 2015, the CNBV authorized Petróleos Mexicanos’ Short-Term Certificados Bursátiles Program for an aggregate revolving amount of Ps. 100,000,000. As of September 30, 2015, all debt securities issued under this program are guaranteed by Pemex Exploration and Production, Pemex Industrial Transformation, Pemex Drilling and Services, Pemex Logistics and Pemex Cogeneration and Services. |
| | h. | On April 21, 2015, Petróleos Mexicanos issued €2,250,000 of its debt securities under its U.S. $52,000,000 Medium-Term Notes Program, Series C in two tranches: (1) €1,250,000 of its 2.750% Notes due 2027; and (2) €1,000,000 of its 1.875% Notes due 2022. As of December 31, 2015, all debt securities issued under this program are guaranteed by Pemex Exploration and Production, Pemex Industrial Transformation, Pemex Drilling and Services, Pemex Logistics and Pemex Cogeneration and Services. |
| | i. | On May 6, 2015, AGRO withdrew U.S. $50,000 from its credit line, withdrawals from which bear interest at a floating rate linked to LIBOR, which matures on December 18, 2017. |
| | j. | On June 26, 2015, Petróleos Mexicanos received a disbursement of U.S. $500,000 from its revolving credit lines. |
| | k. | On July 7, 2015, Petróleos Mexicanos obtained a loan for Ps. 18,000,000 bearing interest at a floating rate linked to TIIE plus 0.95%, which matures on July 7, 2025. |
| | l. | On July 16, 2015, Petróleos Mexicanos issued in the Mexican market Ps. 7,721,582 aggregate principal amount of Certificados Bursátiles under its Ps. 200,000,000 or UDI equivalent Certificados Bursátiles Program, in three tranches: (1) an aggregate principal amount of Ps. 650,000 at a floating rate linked to the TIIE plus 0.15% due 2020; (2) an aggregate principal amount of Ps. 6,100,000 at a fixed rate of 7.47% due 2026; and (3) an aggregate principal amount of 183,941 UDIs, equivalent to approximately Ps. 971,582, at a fixed rate of 3.94% due 2026. As of December 31, 2015, all debt securities issued under this program are guaranteed by Pemex Exploration and Production, Pemex Industrial Transformation, Pemex Drilling and Services, Pemex Logistics and Pemex Cogeneration and Services. |
F-71
PETRÓLEOS MEXICANOS, PRODUCTIVE STATE-OWNED SUBSIDIARIES
AND SUBSIDIARY COMPANIES
NOTES TO THE CONSOLIDATED FINANCIAL STATEMENTS
FOR THE YEARS ENDED DECEMBER 31, 2016, 2015 AND 2014
(FIGURES STATED IN THOUSANDS, EXCEPT AS NOTED)
| | m. | On July 31, 2015, Petróleos Mexicanos issued U.S. $525,000 of notes due 2025, which bear interest at a fixed rate of 2.46%. The notes are guaranteed by the Export-Import Bank of the United States. |
| | n. | On August 4, 2015, PMI HBV obtained a loan for U.S. $250,000, which bears interest at a rate of 1.79% and is due in 2018. The loan is collateralized by 20,724,331 Repsol shares. |
| | o. | On August 14, 2015, Petróleos Mexicanos borrowed U.S. $500,000 in two tranches, each of them of U.S $250,000 of its revolving credit lines and dollars, and matured in August 2015. |
| | p. | On August 28, 2015, Petróleos Mexicanos borrowed U.S. $120,000 from a certain U.S. $3,250,000 revolving credit line, which bears interest at a floating rate linked to the LIBOR that is due in February 2016. |
| | q. | On September 2015, Petróleos Mexicanos borrowed U.S. $800,000 from its revolving credit lines entered into with international financial institutions. |
| | r. | On September 30, 2015, Petróleos Mexicanos entered into a credit facility in the amount of Ps. 5,000,000, which bears interest at a floating rate linked to the TIIE and matures in September 2023. This credit facility was fully disbursed on October 7, 2015. |
| | s. | On September 30, 2015, Petróleos Mexicanos borrowed U.S. $500,000 from its revolving credit line, which bears interest at a rate linked to LIBOR and matures in December 2025. The credit facility is guaranteed by the Export-Import Bank of the United States. |
| | t. | On September 30, 2015, Petróleos Mexicanos borrowed U.S. $475,000 from its revolving credit line, which bears interest at a rate linked to LIBOR and matures in December 2025. The credit facility is guaranteed by the Export-Import Bank of the United States. |
| | u. | On September 30, 2015, Petróleos Mexicanos issued in the Mexican market Ps. 7,400,493, aggregate principal amount of Certificados Bursátiles under its Ps. 200,000,000, or UDI equivalent Certificados Bursátiles Program, in two tranches: (1) an aggregate principal amount of Ps. 1,357,737 at a fixed rate of 3.68% due 2018; and (2) an aggregate principal amount of 1,138,056 UDIs, equivalent to approximately Ps. 6,042,756, at a fixed rate of 5.23% due 2035. As of December 31, 2015, all debt securities issued under this program are guaranteed by Pemex Exploration and Production, Pemex Industrial Transformation, Pemex Drilling and Services, Pemex Logistics and Pemex Cogeneration and Services. |
| | v. | On October 7, 2015, Petróleos Mexicanos obtained a loan from a line of credit for Ps. 5,000,000, bearing interest at a floating rate linked to the TIIE, which matures on September 30, 2023. |
| | w. | On October 16, 2015, Petróleos Mexicanos obtained a loan from a line of credit for Ps. 5,000,000, bearing interest at a floating rate linked to the TIIE, which matures on October 16, 2022. |
| | x. | On November 6, 2015, Petróleos Mexicanos issued € 100,000 of notes due 2030, which bear interest at a fixed rate of 4.625%. The notes are guaranteed by Pemex Exploration and Production, Pemex Industrial Transformation, Pemex Drilling and Services, Pemex Logistics and Pemex Cogeneration and Services. |
| | y. | On December 8, 2015, Petróleos Mexicanos issued CHF 600,000 of its 1.5% Notes due 2020 under its U.S. $52,000,000 Medium-Term Notes Program, Series C. The notes are guaranteed by Pemex Exploration and Production, Pemex Industrial Transformation, Pemex Drilling and Services, Pemex Logistics and Pemex Cogeneration and Services. |
| | z. | On December 15, 2015, Petróleos Mexicanos obtained a loan for Ps. 10,000,000, bearing interest at a floating rate linked to the TIIE, which matures on March 15, 2016. |
F-72
PETRÓLEOS MEXICANOS, PRODUCTIVE STATE-OWNED SUBSIDIARIES
AND SUBSIDIARY COMPANIES
NOTES TO THE CONSOLIDATED FINANCIAL STATEMENTS
FOR THE YEARS ENDED DECEMBER 31, 2016, 2015 AND 2014
(FIGURES STATED IN THOUSANDS, EXCEPT AS NOTED)
| | aa. | On December 21, 2015, Petróleos Mexicanos entered into a new bilateral revolving credit facility in the amount of Ps. 3,500,000; the facility bears interest at a floating rate linked to the TTIE of 28 days, plus 60 base points and matures on December 21, 2018. This facility will replace the revolving credit facility that expired on December 23, 2015. |
| | bb. | On December 29, 2015, Petróleos Mexicanos obtained a loan for Ps. 4,400,000, bearing interest at a floating rate linked to the TIIE, which matures on March 29, 2016. |
| | cc. | In addition, during the period from January 1, 2015 to December 21, 2015, Petróleos Mexicanos made another disbursement totaling U.S. $132,700. |
| | dd. | From January 1, 2015 to December 31, 2015, P.M.I. Holdings B.V. obtained U.S. $1,540,000 in financing from its revolving credit line and repaid U.S. $2,040,000. As of December 31, 2014, the outstanding amount under this revolving credit line was US$500,000. As of December 31, 2015 there were not pending payments. |
As of December 31, 2015, Petróleos Mexicanos had U.S. $4,500,000 and Ps. 23,500,000 in lines of credit in order to ensure liquidity, of which U.S. $130,000 and Ps. 9,100,000, respectively, remain available.
Various financial transactions (including credit facilities and bond issuances) require compliance with various covenants that, among other things, place restrictions on the following types of transactions by PEMEX, subject to certain exceptions:
| | • | | The sale of substantial assets essential for the continued operations of its business. |
| | • | | The incurrence of liens against its assets. |
| | • | | Transfers, sales or assignments of rights to payment not yet earned under contracts for the sale of crude oil or natural gas, accounts receivable or other negotiable instruments. |
As of December 31, 2016 and as of the date of the issuance of these consolidated financial statements, PEMEX was in compliance with the covenants described above.
F-73
PETRÓLEOS MEXICANOS, PRODUCTIVE STATE-OWNED SUBSIDIARIES
AND SUBSIDIARY COMPANIES
NOTES TO THE CONSOLIDATED FINANCIAL STATEMENTS
FOR THE YEARS ENDED DECEMBER 31, 2016, 2015 AND 2014
(FIGURES STATED IN THOUSANDS, EXCEPT AS NOTED)
As of December 31, 2016, long-term debt was as follows:
| | | | | | | | | | | | | | |
| | | | | | | | Pesos | | | Foreign currency | |
| | | Rate of interest(1) | | Maturity | | | (thousands) | | | (thousands) | |
U.S. dollars | | | | | | | | | | | | | | |
Bonds | | Fixed from 3.125% to 9.5% and LIBOR plus 0.35% to 2.02% | | | Various to 2046 | | | Ps. | 1,131,389,914 | | | U.S. $ | 54,751,738 | |
Purchasing loans | | LIBOR plus 0.8% to 0.85% | | | Various to 2016 | | | | 2,479,680 | | | | 120,000 | |
Project financing | | Fixed from 2.35% to 5.45% and LIBOR plus 0.01% to 1.71% | | | Various to 2021 | | | | 84,711,684 | | | | 4,099,481 | |
Direct loans | | Fixed at 5.44% and LIBOR plus 1.0% | | | Various to 2018 | | | | 33,100,587 | | | | 1,601,848 | |
Syndicated loans | | LIBOR plus 0.85% | | | Various to 2020 | | | | 41,056,571 | | | | 1,986,865 | |
Bank loans | | Fixed from 3.5% to 5.28% | | | Various to 2023 | | | | 4,339,826 | | | | 210,019 | |
Financial leases | | Fixed from 0.38% to 1.99% | | | Various to 2025 | | | | 9,559,060 | | | | 462,595 | |
Lease-back (See Financing activities for 2016(l)and m))(4) | | Fixed from 0.45% to 0.7% | | | Various to 2036 | | | | 35,513,114 | | | | 1,718,598 | |
| | | | | | | | | | | | | | |
Total financing in U.S. dollars | | | | | | | | | 1,342,150,436 | | | U.S. $ | 64,951,144 | |
| | | | | | | | | | | | | | |
Euros | | | | | | | | | | | | | | |
Bonds | | Fixed from 3.125% to 6.375% | | | Various to 2030 | | | | 196,317,016 | | | € | 9,058,388 | |
Project financing | | Fixed at 2% | | | Various to 2016 | | | | 10,836,200 | | | | 500,000 | |
| | | | | | | | | | | | | | |
Total financing in Euros | | | | | | | | | 207,153,216 | | | € | 9,558,388 | |
| | | | | | | | | | | | | | |
Japanese yen: | | | | | | | | | | | | | | |
Bonds | | Fixed at 3.5% and LIBOR yen plus 0.75% | | | Various to 2023 | | | | 30,800,746 | | | ¥ | 173,809,300 | |
Project financing | | Fixed at 1.56% and Prime Rate yen plus 2.56% | | | Various to 2017 | | | | 517,286 | | | | 2,919,056 | |
| | | | | | | | | | | | | | |
Total financing in yen | | | | | | | | | 31,318,032 | | | ¥ | 176,728,356 | |
| | | | | | | | | | | | | | |
Pesos | | | | | | | | | | | | | | |
Certificados bursátiles | | Mexican Government Treasury Certificates (“Cetes”) , TIIE(1)less 0.06% to 0.35%, and fixed at 7.19% to 9.15% | | | Various to 2026 | | | Ps. | 173,151,985 | | | | | |
Direct loans | | Fixed at 6.55% and TIIE plus 0.55% to 1.25% | | | Various to 2025 | | | | 45,563,848 | | | | | |
Syndicated loans | | TIIE plus 0.95 | | | Various to 2025 | | | | 38,538,961 | | | | | |
Revolved loans | | TIIE plus 0.55 | | | To 2016 | | | | 20,000,000 | | | | | |
| | | | | | | | | | | | | | |
Total financing in pesos | | | | | | | | Ps. | 277,254,794 | | | | | |
| | | | | | | | | | | | | | |
Unidades de Inversión Certificados bursátiles | | | | | | | | | | | | | | |
Certificados bursátiles | | Zero rate and Fixed at 3.02% to 5.23% | | | Various to 2035 | | | | 53,703,421 | | | | | |
| | | | | | | | | | | | | | |
F-74
PETRÓLEOS MEXICANOS, PRODUCTIVE STATE-OWNED SUBSIDIARIES
AND SUBSIDIARY COMPANIES
NOTES TO THE CONSOLIDATED FINANCIAL STATEMENTS
FOR THE YEARS ENDED DECEMBER 31, 2016, 2015 AND 2014
(FIGURES STATED IN THOUSANDS, EXCEPT AS NOTED)
| | | | | | | | | | | | | | |
| | | | | | | | Pesos | | | Foreign currency | |
| | | Rate of interest(1) | | Maturity | | | (thousands) | | | (thousands) | |
Other currencies: | | | | | | | | | | | | | | |
Bonds | | Fixed from 2.5% to 8.25% | | | Various to 2022 | | | | 36,786,665 | | | | | |
| | | | | | | | | | | | | | |
Total principal in pesos(2) | | | | | | | | | 1,948,366,564 | | | | | |
Plus: accrued interest | | | | | | | | | 27,815,467 | | | | | |
Notes payable to contractors(3) | | | | | | | | | 6,988,699 | | | | | |
| | | | | | | | | | | | | | |
Total principal and interest | | | | | | | | | 1,983,170,730 | | | | | |
Less: short-term maturities | | | | | | | | | 144,169,619 | | | | | |
Current portion of notes payable to contractors(3) | | | | | | | | | 4,181,102 | | | | | |
Accrued interest | | | | | | | | | 27,815,467 | | | | | |
| | | | | | | | | | | | | | |
Total short-term debt and current portion of long-term debt | | | | | | | | | 176,166,188 | | | | | |
| | | | | | | | | | | | | | |
Long-term debt (Note 16(c)) | | | | | | | | | Ps. 1,807,004,542 | | | | | |
| | | | | | | | | | | | | | |
| | | | |
| | | Rate of interest(1) | | Maturity | | | Peso
(thousands) | | | Foreign currency
(thousands) | |
U.S. dollars | | | | | | | | | | | | | | |
Bonds | | Fixed from 3.125 % to 9.5% and LIBOR plus 0.35% to 2.02% | | | Various to 2046 | | | | Ps. 727,841,896 | | | U.S. $ | 42,300,404 | |
Purchasing loans | | LIBOR plus 0.8% to 0.85% | | | Various to 2016 | | | | 75,192,405 | | | | 4,370,000 | |
Project financing | | Fixed from 2.35% to 5.45% and LIBOR plus .01% to 1.71% | | | Various to 2021 | | | | 81,621,345 | | | | 4,743,634 | |
Direct loans | | Fixed at 5.44% and LIBOR plus 1.0% | | | Various to 2018 | | | | 15,255,958 | | | | 886,639 | |
Syndicated loans | | LIBOR plus 0.85% | | | Various to 2020 | | | | 34,158,029 | | | | 1,985,182 | |
Bank loans | | Fixed from 3.5% to 5.28% | | | Various to 2023 | | | | 4,200,888 | | | | 244,145 | |
Financial leases | | Fixed from 0.38% to 5.28% | | | Various to 2023 | | | | 9,214,921 | | | | 535,549 | |
| | | | | | | | | | | | | | |
Total financing in U.S. dollars | | | | | | | | | 947,485,442 | | | U.S. $ | 55,065,553 | |
| | | | | | | | | | | | | | |
Euros | | | | | | | | | | | | | | |
Bonds | | Fixed from 3.125% to 6.375% | | | Various to 2030 | | | | 143,993,293 | | | € | 7,653,433 | |
Project financing | | Fixed at 2% | | | Various to 2016 | | | | 24 | | | | 1 | |
| | | | | | | | | | | | | | |
Total financing in Euros | | | | | | | | | 143,993,317 | | | € | 7,653,434 | |
| | | | | | | | | | | | | | |
Japanese yen: | | | | | | | | | | | | | | |
Bonds | | Fixed at 3.5% and LIBOR yen plus 0.75% | | | Various to 2023 | | | | 13,432,600 | | | ¥ | 94,000,000 | |
Project financing | | Fixed at 1.56% and Prime Rate yen plus 2.56% | | | Various to 2017 | | | | | | | | | |
| | | | | | | | | 1,251,426 | | | | 8,757,358 | |
| | | | | | | | | | | | | | |
Total financing in yen | | | | | | | | | 14,684,026 | | | ¥ | 102,757,358 | |
| | | | | | | | | | | | | | |
F-75
PETRÓLEOS MEXICANOS, PRODUCTIVE STATE-OWNED SUBSIDIARIES
AND SUBSIDIARY COMPANIES
NOTES TO THE CONSOLIDATED FINANCIAL STATEMENTS
FOR THE YEARS ENDED DECEMBER 31, 2016, 2015 AND 2014
(FIGURES STATED IN THOUSANDS, EXCEPT AS NOTED)
| | | | | | | | | | | | |
| | | | |
| | | Rate of interest(1) | | Maturity | | Pesos
(thousands) | | | Foreign
currency
(thousands) | |
Pesos | | | | | | | | | | | | |
Certificados bursátiles | | Mexican Federal Treasury Certificates (“Cetes”) , TIIE(1) less 0.06% to 0.35%, and fixed at 7.19% to 9.15% | | Various to 2026 | | | Ps. 185,777,844 | | | | | |
Direct loans | | Fixed at 6.55% and TIIE plus 0.55% to 1.25% | | Various to 2025 | | | 38,485,205 | | | | | |
Syndicated loans | | TIIE plus 0.95 | | Various to 2025 | | | 43,437,901 | | | | | |
Revolved loans | | TIIE plus 0.55 | | To 2016 | | | 14,400,000 | | | | | |
| | | | | | | | | | | | |
Total financing in pesos | | | | | | | Ps. 282,100,950 | | | | | |
Unidades de Inversión Certificados bursátiles | | | | | | | | | | | | |
Certificados bursátiles | | Zero rate and Fixed at 3.02% to 5.23% | | Various to 2035 | | | 51,964,883 | | | | | |
| | | | | | | | | | | | |
Other currencies: | | | | | | | | | | | | |
Bonds | | Fixed from 2.5% to 8.25% | | Various to 2022 | | | 26,357,327 | | | | | |
| | | | | | | | | | | | |
Total principal in pesos(2) | | | | | | | 1,466,585,945 | | | | | |
Plus: accrued interest | | | | | | | 18,488,522 | | | | | |
Notes payable to contractors(3) | | | | | | | 8,307,368 | | | | | |
| | | | | | | | | | | | |
Total principal and interest | | | | | | | 1,493,381,835 | | | | | |
Less: short-term maturities | | | | | | | 169,342,715 | | | | | |
Current portion of notes payable to contractors(3) | | | | | | | 4,677,431 | | | | | |
Accrued interest | | | | | | | 18,488,522 | | | | | |
| | | | | | | | | | | | |
Total short-term debt and current portion of long-term debt | | | | | | | 192,508,668 | | | | | |
| | | | | | | | | | | | |
Long-term debt (Note 16(c)) | | | | | | | Ps. 1,300,873,167 | | | | | |
| | | | | | | | | | | | |
| | | | | | | | | | | | | | | | | | | | | | | | | | | | |
| | | 2017 | | | 2018 | | | 2019 | | | 2020 | | | 2021 | | | 2022 and
thereafter | | | Total | |
Maturity of the total principal outstanding and accrued interest as of December 31, 2016, for each of the years ending December 31. | | | Ps.176,166,188 | | | | Ps.127,349,970 | | | | Ps.162,209,245 | | | | Ps.199,534,891 | | | | Ps.147,813,212 | | | | Ps.1,170,097,224 | | | | Ps.1,983,170,730 | |
F-76
PETRÓLEOS MEXICANOS, PRODUCTIVE STATE-OWNED SUBSIDIARIES
AND SUBSIDIARY COMPANIES
NOTES TO THE CONSOLIDATED FINANCIAL STATEMENTS
FOR THE YEARS ENDED DECEMBER 31, 2016, 2015 AND 2014
(FIGURES STATED IN THOUSANDS, EXCEPT AS NOTED)
| | | | | | | | |
| | | 2016(i) | | | 2015(i) | |
Changes in total debt: | | | | | | | | |
At the beginning of the year | | | Ps.1,493,381,835 | | | | Ps.1,143,250,503 | |
Loans obtained—financing institutions | | | 829,579,084 | | | | 378,971,078 | |
Loans obtained—financing lease | | | 21,924,053 | | | | 7,066,052 | |
Debt payments | | | (613,377,146 | ) | | | (191,318,841 | ) |
Accrued interest | | | 98,847,751 | | | | 67,773,593 | |
Interest paid | | | (88,757,428 | ) | | | (62,737,150 | ) |
Foreign exchange | | | 243,182,764 | | | | 152,676,257 | |
Expenses related to debt issuance | | | (1,610,183 | ) | | | (2,299,657 | ) |
| | | | | | | | |
At the end of the year | | | Ps.1,983,170,730 | | | | Ps.1,493,381,835 | |
| | | | | | | | |
| | (i) | These amounts include accounts payable by Financed Public Works Contracts (“FPWC”) (formerly known as Multiple Services Contracts), which do not generate cash flows. |
| | (1) | As of December 31, 2016 and 2015, interest rates were as follows: 3 month LIBOR of 0.99789% and 0.6127%, respectively; 6 month LIBOR of 1.31767% and 0.8461%, respectively; TIIE rate of 6.1066% and 3.55%, respectively, for 28 days; TIIE rate of 6.1875% and 3.58%, respectively, for 91 days; Cetes rate of 5.69% and 3.05%, respectively, for 28 days; Cetes rate of 5.96% and 3.29%, respectively, for 91 days; Cetes rate of 6.09% and 3.58%, respectively, for 182 days. |
| | (2) | Includes financing from foreign banks of Ps. 1,600,968,832 and Ps. 1,123,936,915, as of December 31, 2016 and 2015, respectively. |
| | (3) | The total amounts of notes payable to contractors as of December 31, 2016 and 2015, current and long-term, are as follows: |
| | | | | | | | |
| | | 2016 | | | 2015 | |
Total notes payable to contractors(a)(b) | | | Ps.6,988,699 | | | | Ps.8,307,368 | |
Less: current portion of notes payable to contractors | | | 4,181,102 | | | | 4,677,431 | |
| | | | | | | | |
Notes payable to contractors (long-term) | | | Ps.2,807,597 | | | | Ps.3,629,937 | |
| | | | | | | | |
| | (a) | PEMEX has entered into FPWCs pursuant to which the hydrocarbons and construction in progress are property of Pemex Exploration and Production. Pursuant to the FPWC, the contractors manage the work in progress, classified as development, infrastructure and maintenance. As of December 31, 2016 and 2015, PEMEX had an outstanding amount payable of Ps. 3,986,565 and Ps. 5,372,799, respectively. |
F-77
PETRÓLEOS MEXICANOS, PRODUCTIVE STATE-OWNED SUBSIDIARIES
AND SUBSIDIARY COMPANIES
NOTES TO THE CONSOLIDATED FINANCIAL STATEMENTS
FOR THE YEARS ENDED DECEMBER 31, 2016, 2015 AND 2014
(FIGURES STATED IN THOUSANDS, EXCEPT AS NOTED)
| | (b) | During 2007, Pemex-Exploration and Production contracted for the purchase of a Floating Production Storage and Offloading (“FPSO”) vessel. The investment in the vessel totaled U.S. $723,575. As of December 31, 2016 and 2015, the outstanding balances owing to the contractor were Ps. 3,002,134 (U.S. $145,283) and Ps. 2,934,569 (U.S. $170,550), respectively. In accordance with the contract, the estimated future payments are as follows: |
| | | | |
Year | | Amount | |
2017 | | U.S. $ | 25,267 | |
2018 | | | 25,267 | |
2019 | | | 25,267 | |
2020 | | | 25,267 | |
2021 | | | 25,267 | |
2022 and thereafter | | | 18,948 | |
| | | | |
Total | | U.S $ | 145,283 | |
| | | | |
| | (4) | PEMEX obtained financing through the sale and leaseback of certain infrastructure assets and a plant, which will require periodic payments through 2036. |
This transaction was recognized as a financing activity due to the fact that PEMEX retained all of the risks and benefits associated with ownership of the asset and substantially all of the operating rights to the assets.
The outstanding liability for this transaction is payable as follows:
| | | | | | | | |
Years | | Pesos | | | U.S. dollars | |
2017 | | Ps. | 4,058,336 | | | U.S. $ | 196,396 | |
2018 | | | 4,058,336 | | | | 196,396 | |
2019 | | | 4,058,336 | | | | 196,396 | |
2020 | | | 4,058,336 | | | | 196,396 | |
2021 | | | 4,058,336 | | | | 196,396 | |
2022 and thereafter | | | 45,241,719 | | | | 2,189,399 | |
| | | | | | | | |
| | | 65,533,399 | | | | 3,171,379 | |
Less: short-term unaccrued interest | | | 2,580,807 | | | | 124,893 | |
Less: long-term unaccrued interest | | | 27,439,478 | | | | 1,327,888 | |
| | | | | | | | |
Total financing | | | 35,513,114 | | | | 1,718,598 | |
Less: short-term portion of financing | | | 1,477,529 | | | | 71,503 | |
| | | | | | | | |
| | |
Total long term financing | | | Ps. 34,035,585 | | | | U.S. $ 1,647,095 | |
| | | | | | | | |
| | (5) | As of December 31, 2016 and 2015, PEMEX used the following exchange rates to translate the outstanding balances in foreign currencies to pesos in the statement of financial position: |
| | | | | | | | |
| | | 2016 | | | 2015 | |
U.S. dollar | | | Ps. 20.6640 | | | | Ps. 17.2065 | |
Japanese yen | | | 0.1772 | | | | 0.14290 | |
Pounds sterling | | | 25.3051 | | | | 25.4983 | |
Euro | | | 21.6724 | | | | 18.8084 | |
Swiss francs | | | 20.1974 | | | | 17.3487 | |
Canadian dollar | | | 15.2896 | | | | 12.4477 | |
Australian dollar | | | 14.8842 | | | | 12.5538 | |
F-78
PETRÓLEOS MEXICANOS, PRODUCTIVE STATE-OWNED SUBSIDIARIES
AND SUBSIDIARY COMPANIES
NOTES TO THE CONSOLIDATED FINANCIAL STATEMENTS
FOR THE YEARS ENDED DECEMBER 31, 2016, 2015 AND 2014
(FIGURES STATED IN THOUSANDS, EXCEPT AS NOTED)
NOTE 16. DERIVATIVE FINANCIAL INSTRUMENTS
PEMEX faces market risk caused by the volatility of hydrocarbon prices, exchange rates and interest rates, credit risk associated with investments and financial derivatives, as well as liquidity risk. In order to monitor and manage these risks, PEMEX has approved general provisions relating to financial risk management, which are comprised of policies and guidelines that promote an integrated framework for risk management, regulate the use of derivative financial instruments (“DFIs”), and guide the development of risk mitigation strategies.
This regulatory framework establishes that DFIs should be used only for the purpose of mitigating financial risk. The use of DFIs for any other purpose must be approved in accordance with PEMEX’s current internal regulation.
One of PEMEX’s policies is to contribute minimizing the impact that unfavorable changes in financial risk factors have on its financial results by promoting an adequate balance between expected incoming cash flows from operations and outgoing cash flows related to its liabilities.
In addition, certain PMI subsidiaries have implemented a regulatory framework for risk management with respect to its activities, which consists of policies, guidelines and procedures to manage the market risk associated with its commodity trading activities in accordance with industry best practices, such as: the use of DFIs for financial risk mitigation purposes; the segregation of duties; valuation and monitoring mechanisms, such as the generation of a daily portfolio risk report, value at risk (VaR) computation; and VaR limits, both at a global and business unit level and the implementation of stop loss mechanisms. In addition, PMI Trading also has its own risk management subcommittee which supervises the trading of DFIs.
i. Interest rate risk
PEMEX is exposed to fluctuations in floating interest rate liabilities. PEMEX is exposed to U.S. dollar LIBOR and to Mexican peso TIIE. As of December 31, 2016, approximately 18.2% of PEMEX’s total net debt outstanding consisted of floating rate debt.
Occasionally, for strategic reasons or in order to offset the expected inflows and outflows, PEMEX has entered into interest rate swaps. Under its interest rate swap agreements, PEMEX acquires the obligation to make payments based on a fixed interest rate and is entitled to receive floating interest rate payments based on LIBOR, TIIE or a rate referenced to or calculated from TIIE.
As of December 31, 2016, PEMEX was a party to four interest rate swap agreements denominated in U.S. dollars for an aggregate notional amount of U.S. $1,846,250 at a weighted average fixed interest rate of 2.35% and a weighted average term of 8.27 years.
Similarly, in order to eliminate the volatility associated with variable interest rates of long-term financing operations, PMI NASA has executed interest rate swap agreements denominated in U.S. dollars for an aggregate notional amount of U.S. $86,545, at a weighted average fixed interest rate of 4.17% and a weighted average term of 5.41 years.
F-79
PETRÓLEOS MEXICANOS, PRODUCTIVE STATE-OWNED SUBSIDIARIES
AND SUBSIDIARY COMPANIES
NOTES TO THE CONSOLIDATED FINANCIAL STATEMENTS
FOR THE YEARS ENDED DECEMBER 31, 2016, 2015 AND 2014
(FIGURES STATED IN THOUSANDS, EXCEPT AS NOTED)
Moreover, PEMEX invests in pesos and U.S. dollars in compliance with applicable internal regulations through portfolios that have different purposes that seek an adequate return subject to risk parameters that reduce the probability of capital losses. The objective of the investments made through these portfolios is to meet PEMEX’s obligations payable in pesos and U.S. dollars.
The investments made through PEMEX’s portfolios are exposed to domestic and international interest rate risk and credit spread risk derived from government and corporate securities, and inflation risk arising from the relationship between UDIs and pesos. However, these risks are mitigated by established limits on exposure to market risk.
ii. Exchange rate risk
A significant amount of PEMEX’s revenue is derived from exports of crude oil and petroleum products, which are priced and payable in U.S. dollars. Moreover, PEMEX’s revenues from domestic sales of gasoline and diesel net of IEPS Tax, tax duties, incentives, and other related taxes, petrochemicals and natural gas and its byproducts are related to international U.S. dollar-denominated prices, except for domestic sales of liquefied petroleum gas (LPG), which are priced in pesos and represent less than 5% of PEMEX’s revenues.
PEMEX’s expenses related to hydrocarbon duties are calculated based on international U.S. dollar-denominated prices and the cost of hydrocarbon imports that PEMEX acquires for resale in Mexico or use in its facilities are indexed to international U.S. dollar-denominated prices. By contrast, PEMEX’s capital expenditure and operating expenses are established in pesos.
As a result of this cash flow structure, the depreciation of the peso against the U.S. dollar increases PEMEX’s financial balance. The appreciation of the peso relative to the U.S. dollar has the opposite effect. PEMEX manages this risk without the need for hedging instruments, because the impact on PEMEX’s revenues of fluctuations in the exchange rate between the U.S. dollar and the peso is offset in whole or in part by its impact on its obligations.
In order to favor the cash flow structure described above, most of PEMEX’s debt is issued in U.S. dollars or hedged through DFIs, either with swaps to convert the debt into U.S. dollars or through other DFIs, in order to mitigate the exchange rate risk exposure. The rest of the debt is denominated in pesos or in UDIs, where most of the debt denominated in UDIs has been converted into pesos through DFIs in order to eliminate the inflationary risk exposure.
As a consequence of the above, PEMEX debt issued in international currencies other than the U.S. dollar has exchange rate risk mitigation strategies. Through these strategies, PEMEX has further sought to reduce its cost of funding by leaving, in some cases, part of this exchange rate exposure unhedged when assessed appropriate.
The underlying currencies of PEMEX’s DFIs are the Euro, Swiss franc, Japanese yen, Pound Sterling and Australian dollar versus the U.S. dollar, and UDIs, versus the Mexican peso.
In 2016, PEMEX entered into various cross-currency swaps to hedge currency risk arising from debt obligations denominated in euros and Swiss francs for an aggregate notional amount of U.S. $3,459,236 and the inflation risk arising from debt denominated in UDIs, for an aggregate notional amount of Ps. 1,077,101. During
F-80
PETRÓLEOS MEXICANOS, PRODUCTIVE STATE-OWNED SUBSIDIARIES
AND SUBSIDIARY COMPANIES
NOTES TO THE CONSOLIDATED FINANCIAL STATEMENTS
FOR THE YEARS ENDED DECEMBER 31, 2016, 2015 AND 2014
(FIGURES STATED IN THOUSANDS, EXCEPT AS NOTED)
2015, PEMEX entered into the same kind of instruments to hedge currency risk arising from debt obligations denominated in euros and Swiss francs, for an aggregate notional amount of U.S. $3,109,298 and the inflation risk arising from debt denominated in UDIs, for an aggregate notional amount of Ps. 9,706,932.
Most of PEMEX’s cross-currency swaps are plain vanilla except for one swap entered into in 2004 to hedge its exposure to euro, which expired in 2016. This swap was referred to as an “extinguishing swap” and was obtained in order to hedge long-term obligations. The main characteristic of extinguishing swaps was that these DFIs terminate upon the occurrence of any of the credit default events specified in the DFI contract confirmation, without any payment obligation by either party. This swap had a notional amount of U.S. $1,146,410.
Moreover, in 2016, PEMEX entered into, without cost, an options structure called the “Seagull Option” in order to cover the notional risk of a debt issue in Japanese yen for ¥80,000,000, keeping the coupons in the original currency (0.5% annual coupon rate). This structure protects the short exposure in Japanese yen against an appreciation of the Japanese yen versus the U.S. dollar from JPY 83.70 and up to JPY 75.00, and recognizes a benefit if the Japanese yen depreciates to an average of 117.39 JPY / USD.
PEMEX recorded a total net foreign exchange loss of Ps. 254,012,743 in 2016, as compared to a total net foreign exchange loss of Ps. 154,765,574 in 2015 and to a total net foreign exchange loss of Ps. 76,999,161 in 2014, which includes the unrealized foreign exchange loss associated with debt of Ps. 243,182,764, Ps. 152,554,454 and Ps. 78,884,717 for the years ended December 31, 2016, 2015 and 2014, respectively. The depreciation of the peso caused a total net foreign exchange loss because a significant part of PEMEX’s debt (83.0% as of December 31, 2016) is denominated in foreign currency. Unrealized foreign exchange losses and gains do not impact PEMEX’s cash flows. Due to the cash flow structure described above, the depreciation of the peso relative to the U.S. dollar does not affect PEMEX’s ability to meet U.S. dollar-denominated financial obligations and improves PEMEX’s ability to meetpeso-denominated financial obligations. On the other hand, the appreciation of the peso relative to the U.S. dollar may increase PEMEX’s peso debt service costs on a U.S. dollar basis. PEMEX’s foreign exchange loss in 2016 was due to the depreciation of the peso, from Ps. 17.2065 = U.S. $1.00 on December 31, 2015 to Ps.20.6640 = U.S. $1.00 on December 31, 2016. PEMEX’s foreign exchange loss in 2015 was due to the depreciation of the peso, from Ps. 14.7180 = U.S. $1.00 on December 31, 2014 to Ps.17.2065 = U.S. $1.00 on December 31, 2015. PEMEX’s foreign exchange loss in 2014 was due to the depreciation of the peso, from Ps. 13.0765 = U.S. $1.00 on December 31, 2013 to Ps. 14.7180 = U.S. $1.00 on December 31, 2014.
Certain PMI subsidiaries face market risks generated by fluctuations in foreign exchange rates. In order to mitigate these risks, the boards of directors of several of these companies have authorized a policy which stipulates that no more than 5% of a company’s total financial assets may be denominated in a currency other than its functional currency, unless the company owes a duty or expected payment in a currency other than its functional one. Accordingly, certain PMI subsidiaries will, from time to time, enter into DFIs in order to mitigate the risk associated with financing operations denominated in currencies other than a company’s functional currency.
Finally, a significant amount of PMI Trading’s income and expenses, including the cost of sales and related sales costs, is derived from the trade of refined products, petrochemicals and gas liquids to PEMEX subsidiaries and third parties, whose prices are determined and are payable in U.S. dollars. PMI Trading’s exposure to foreign currency risk results primarily from the need to fund tax payments denominated in domestic currency and secondarily from the need to purchase products in domestic currency for sale in U.S. dollars in the international market, as well as certain related sales costs denominated in domestic currency.
F-81
PETRÓLEOS MEXICANOS, PRODUCTIVE STATE-OWNED SUBSIDIARIES
AND SUBSIDIARY COMPANIES
NOTES TO THE CONSOLIDATED FINANCIAL STATEMENTS
FOR THE YEARS ENDED DECEMBER 31, 2016, 2015 AND 2014
(FIGURES STATED IN THOUSANDS, EXCEPT AS NOTED)
PMI Trading believes it can adequately manage the risk created by the payment of taxes in domestic currency without the need to enter into hedging instruments because the exposure to this risk is marginal relative to the total flows of U.S. dollar. In addition, in the event that a potential foreign exchange risk arises in connection with a commercial transaction, PMI Trading may implement risk mitigation measures by entering into DFIs.
iii. Hydrocarbon Price Risk
PEMEX periodically assesses its revenues and expenditures structure in order to identify the main market risk factors that PEMEX’s cash flows are exposed to in connection with international hydrocarbon prices. Based on this assessment, PEMEX monitors its exposure to the most significant risk factors and quantifies their impact on PEMEX’s financial balance.
PEMEX’s exports and domestic sales are directly or indirectly related to international hydrocarbon prices. Therefore, PEMEX is exposed to fluctuations in these prices. In terms of crude oil and natural gas, part of this risk is transferred to the Mexican Government under PEMEX’s current fiscal regime.
PEMEX continuously evaluates the implementation of risk mitigation strategies, including those involving the use of DFIs, while taking into account operational and economic constraints.
PEMEX’s exposure to crude oil prices is partly mitigated by natural hedges between its inflows and outflows. During 2016, as a result of the changes in the PEMEX’s fiscal regime, its sensitivity to crude oil prices decreased. Nonetheless, PEMEX has been working on a hedging strategy for the coming years in order to reduce its exposure to drops in crude oil price.
In 2015, PEMEX entered into various swaps in order to hedge the risk arising from the variations of the propane price of its imports. These DFIs were held over a percentage of the total imports volume with maturity dates in 2015. Although PEMEX entered into these contracts with economic hedging purposes, for accounting purposes, these DFIs do not qualify as hedges and were recorded as trading instruments in the financial statements. During 2016, PEMEX did not enter into any propane import price swaps.
In addition to supplying natural gas, Pemex Industrial Transformation offers DFIs to its domestic customers in order to provide them with support to mitigate the risk associated with the volatility of natural gas prices. Pemex Industrial Transformation enters into DFIs with Mex Gas Supply, S.L. under the opposite position to those DFIs offered to its customers in order to mitigate the market risk it bears under such offered DFIs. Mex Gas Supply, S.L. then transfers the related price risk derived from the DFI position held with Pemex Industrial Transformation to international financial counterparties by entering into these opposite position DFIs with such parties. Through the above mechanism, Pemex Industrial Transformation maintains a negligible or even null exposure to market risk. These portfolios have VaR and Capital at Risk (“CaR”—An aggregation of Mark to Market “MtM” and Profit and Loss “P&L”) limits in order to limit market risk exposure.
PMI Trading faces market risk generated by the terms of the purchase and sale of refined products and natural gas liquids, as well as the volatility of oil prices. Accordingly, it frequently enters into DFIs in order to mitigate this risk, thereby reducing the volatility of its financial results.
F-82
PETRÓLEOS MEXICANOS, PRODUCTIVE STATE-OWNED SUBSIDIARIES
AND SUBSIDIARY COMPANIES
NOTES TO THE CONSOLIDATED FINANCIAL STATEMENTS
FOR THE YEARS ENDED DECEMBER 31, 2016, 2015 AND 2014
(FIGURES STATED IN THOUSANDS, EXCEPT AS NOTED)
iv. Risks relating to the portfolio of third-party shares
As of December 31, 2016 Petróleos Mexicanos does not hold any third party shares of companies that do not participate in financial markets and, therefore, does not hold any related DFIs. On May 2014, PEMEX held a synthetic long position on 67,969,767 shares of Repsol, with the objective of maintaining corporate and economic rights over these shares. PEMEX accomplished this by using a total return swap under which PEMEX paid variable amounts and received a total return on the Repsol shares. Under these DFIs, PEMEX was entitled to any capital gains associated with the Repsol shares and agreed to cover its counterparties for any capital losses relating to those shares in reference to an exercise price, as well as to make payments at a floating interest rate. On June 3, 2014, PEMEX made an early termination of its DFI. Following this termination, Petróleos Mexicanos no longer directly participates in Repsol.
Between July and September 2011, PEMEX acquired 57,204,240 shares of Repsol through its subsidiary PMI HBV. In order to protect this investment, PMI HBV entered into a structured product consisting of long put, short call and long call options with maturities in 2012, 2013 and 2014. The exposure to the exchange rate associated with the shares financing was covered by euro exchange rate forwards maturing in 2012, 2013 and 2014. All corresponding DFIs expired in 2012, 2013 and 2014, so there were no DFIs in place at the close of 2014. Although these DFIs were entered into with the purpose of hedging the exposure to the share price of Repsol, for accounting purposes, these DFIs do not qualify as hedges and were recorded as trading instruments in the financial statements.
As of December 31, 2016, PMI HBV owned 22,221,893 Repsol shares and HPE holds one for a total of 22,221,894 shares. These shares have no related DFIs.
v. Market risk quantification
The quantification of market risk exposure in PEMEX’s financial instruments is presented below, in accordance with the applicable international risk management practices.
Interest rate risk quantification
The quantification of interest rate risk of investment portfolios is carried out by using theone-day horizon historical VaR, with a confidence level of 95%, over a period of one year. The VaR incorporates interest rate and spread risks. In addition, for portfolios in domestic currency, the VaR includes the inflation risk embedded in securities denominated in UDI. For portfolio management purposes, interest rate risk is mitigated by VaR limits.
As of December 31, 2016, the VaR of PEMEX’s investment portfolios was Ps. (461.6) for the Peso Treasury Portfolio, Ps. (38.6) for the Fondo Laboral Pemex Portfolio (“FOLAPE”), Ps. (15.5) for the Fideicomiso de Cobertura Laboral y de Vivienda Portfolio (“FICOLAVI”), and U.S. $0 for the U.S. Dollar Treasury Portfolio.
In addition to the exposure to interest rate fluctuations of the DFIs in which PEMEX is obligated to pay floating rates, PEMEX’s DFIs are exposed to MtM volatility as a result of changes in the interest rate curves used in their valuation.
Interest rate risk quantification was calculated for DFIs in conjunction with the interest rate risk quantification for the debt portfolio. The following table shows the sensitivity of PEMEX’s DFIs and debt
F-83
PETRÓLEOS MEXICANOS, PRODUCTIVE STATE-OWNED SUBSIDIARIES
AND SUBSIDIARY COMPANIES
NOTES TO THE CONSOLIDATED FINANCIAL STATEMENTS
FOR THE YEARS ENDED DECEMBER 31, 2016, 2015 AND 2014
(FIGURES STATED IN THOUSANDS, EXCEPT AS NOTED)
portfolio to a parallel shift of 10 basis points (bp) over the zero coupon rate curves. The 10bp parallel shift may be used to estimate in a simple manner the impact for proportional values to this shift and was selected in accordance with market practices for financial risk management.
For the debt portfolio, interest rate risk sensitivity was calculated taking into account both the DFI interbank market yield curves and the PEMEX curves (which were also used to estimate the debt portfolios’ fair value). These metrics were calculated solely for informational purposes and are not used for portfolio management purposes because PEMEX does not intend to prepay its debt or terminate its DFIs early. Therefore, there is no interest rate risk arising from fixed rate obligations.
INTEREST RATE and CURRENCY DFIs
| | | | | | | | | | | | | | | | |
Interest rate sensitivity to + 10 bp | |
| | | Interbank Yield Curves | | | | | | | |
Currency | | Sensitivity
debt | | | Sensitivity
DFIs | | | Sensitivity
net | | | PEMEX Curves
Sensitivity
debt | |
AUD | | | 36,676 | | | | (36,676 | ) | | | 0 | | | | 36,319 | |
CHF | | | 4,446,080 | | | | (4,446,080 | ) | | | 0 | | | | 4,032,264 | |
Euro | | | 67,026,628 | | | | (67,026,628 | ) | | | 0 | | | | 49,162,441 | |
Pound Sterling | | | 2,869,215 | | | | (2,869,215 | ) | | | 0 | | | | 2,462,337 | |
Yen | | | 9,642,639 | | | | (4,653,708 | ) | | | 4,988,931 | | | | 6,741,888 | |
Peso | | | 47,171,321 | | | | 3,096,961 | | | | 50,268,282 | | | | 40,695,583 | |
UDI | | | 17,737,545 | | | | (10,382,347 | ) | | | 7,355,198 | | | | 14,291,786 | |
U.S. dollar | | | 729,563,673 | | | | 75,281,102 | | | | 804,844,774 | | | | 352,524,570 | |
| | | | | | | | | | | Amounts in U.S. dollars | |
In addition, PEMEX performed a retrospective sensitivity analysis of the impact on its financial statements for the years ended December 31, 2016, 2015 and 2014, in which PEMEX assumed either an increase or decrease of 25 basis points in the floating interest rates of its debt and corresponding hedges.
At December 31, 2016, 2015 and 2014, had market interest rates been 25 basis points higher, with all other variables remaining constant, net income for the year would have been Ps. 841,024, Ps. 922,268 and Ps. 7,297,773 lower for December 31, 2016, 2015 and 2014, respectively, primarily as a result of an increase in interest expense. Conversely, had market interest rates been 25 basis points lower, net income for the year would have been Ps. 841,024, Ps. 922,268 and Ps. 7,297,773 greater at December 31, 2016, 2015 and 2014, respectively, primarily as a result of a decrease in interest expense.
Exchange rate risk quantification
The investments of PEMEX’s portfolios do not face foreign exchange rate risk because the funds of such portfolios are used to meet obligations in pesos and U.S. dollars.
Currency DFIs are entered into in order to hedge exchange rate risk arising from debt flows in currencies other than pesos and U.S. dollars or inflation risk arising from debt flows in UDIs. However, due to the accounting treatment, net income is exposed tomark-to-market volatility as a result of changes in the exchange rates used in their valuation.
F-84
PETRÓLEOS MEXICANOS, PRODUCTIVE STATE-OWNED SUBSIDIARIES
AND SUBSIDIARY COMPANIES
NOTES TO THE CONSOLIDATED FINANCIAL STATEMENTS
FOR THE YEARS ENDED DECEMBER 31, 2016, 2015 AND 2014
(FIGURES STATED IN THOUSANDS, EXCEPT AS NOTED)
Exchange rate risk quantification was calculated for DFIs in conjunction with the exchange rate risk quantification for the debt portfolio. The following table shows the sensitivity of PEMEX’s DFIs and debt portfolio to an increase of 1% to the exchange rates of currencies against the U.S. dollar. The 1% may be used to estimate in a simple manner the impact for proportional values to this increase and was selected in accordance with market practices for financial risk management.
For the debt portfolio, exchange rate risk sensitivity was calculated taking into account both, interbank market yield curves and the PEMEX curves. In addition, the table shows theone-day horizon historical VaR of the remaining open position, with a confidence level of 95%, over a period of one year. These metrics were calculated solely for informational purposes. Nevertheless, in order to carry out management activities related to its debt portfolio, PEMEX periodically conducts quantitative analyses in order to estimate the exchange rate risk exposure generated by its debt issuances. Based on these analyses, PEMEX has elected to enter into DFIs as an exchange rate risk mitigation strategy.
INTEREST RATE and CURRENCY DFIs
| | | | | | | | | | | | | | | | | | | | |
| | | Interbank Yield Curves | | | | | | PEMEX Curves
1%
Debt | |
Currency | | 1%
Debt | | | 1%
DFIs | | | 1%
Net | | | VaR 95%
Net | | |
AUD | | | (1,139,617 | ) | | | 1,139,617 | | | | 0 | | | | 0 | | | | (1,135,496 | ) |
CHF | | | (13,757,737 | ) | | | 13,757,737 | | | | 0 | | | | 0 | | | | (12,809,496 | ) |
Euro | | | (126,172,455 | ) | | | 126,172,455 | | | | 0 | | | | 0 | | | | (104,578,013 | ) |
Pound Sterling | | | (6,219,613 | ) | | | 6,219,613 | | | | 0 | | | | 0 | | | | (5,503,942 | ) |
Yen | | | (17,156,740 | ) | | | 11,818,964 | | | | (5,337,775 | ) | | | (6,091,892 | ) | | | (13,725,191 | ) |
Peso | | | (161,626,313 | ) | | | (21,079,370 | ) | | | (182,705,683 | ) | | | (234,335,192 | ) | | | (153,507,202 | ) |
UDI | | | (27,466,689 | ) | | | 20,246,729 | | | | (7,219,960 | ) | | | (9,526,703 | ) | | | (24,588,646 | ) |
Amounts in U.S. dollars
As shown in the table above, exchange rate risk derived from debt denominated in currencies other than pesos and U.S. dollars is almost fully hedged by DFIs.
The exchange rate risk exposure to the Japanese yen is a result of the fact that, underyear-end market levels (116.6 JPY / USD), the Seagull Option structure described above (which protects the short exposure in Japanese yen against an appreciation of the Japanese yen against the US dollar from 83.70 JPY / USD and up to 75.00 JPY / USD) allowed PEMEX to profit from the depreciation of the Japanese yen relative to the U.S. Dollar.
In addition, PEMEX performed a retrospective sensitivity analysis of the impact on its financial statements of the years ended December 31, 2016, 2015 and 2014, in which PEMEX assumed either an increase or decrease of 10% in the exchange rate between the U.S. dollar and peso in order to determine the impact on net income and equity as a result of applying these new rates to the monthly balances of assets and liabilities denominated in U.S. dollars.
At December 31, 2016, 2015 and 2014, had the peso depreciated against the U.S. dollar by 10% with other variables remaining constant, net income would have been Ps.124,512,400, Ps.105,915,340 and Ps. 70,280,300 lower, respectively, primarily as a result of an increase in the exchange rate losses. However, had the peso appreciated against the U.S. dollar by 10%, net income for the period would have increased by Ps.124,512,400, Ps.105,915,340 and Ps. 70,280,300, respectively, primarily as a result of the decrease in exchange rate losses.
F-85
PETRÓLEOS MEXICANOS, PRODUCTIVE STATE-OWNED SUBSIDIARIES
AND SUBSIDIARY COMPANIES
NOTES TO THE CONSOLIDATED FINANCIAL STATEMENTS
FOR THE YEARS ENDED DECEMBER 31, 2016, 2015 AND 2014
(FIGURES STATED IN THOUSANDS, EXCEPT AS NOTED)
Quantification of risks related to third-party shares
Shares are exposed to price risk and euro/U.S. dollar exchange rate risk. The quantification of these risks was carried out using theone-day horizon historical VaR, with a confidence level of 95%, over 500 observations, of Repsol’s share price in euros converted to U.S. dollars. In addition, the sensitivity to an increase of 1% in the euro/U.S. dollar exchange rate is provided for informational purposes.
| | | | | | | | | | | | | | | | |
| Equity DFIs | | | | | | | | | | | | |
Currency | | Shares | | | Equity risk
Shares value | | | VaR EQ | | | FX risk
1% | |
Euro | | | 22,221,894 | | | | 313,635,679 | | | | (11,539,301 | ) | | | 3,136,357 | |
| | | | | | | | | | | Amounts in U.S. dollars | |
Hydrocarbon price risk quantification
Pemex Industrial Transformation occasionally faces market risk due to open positions arising from the mismatch between the DFI portfolio offered to domestic customers and hedges with international counterparties. As of December 31, 2016, Pemex Industrial Transformation’s natural gas DFI portfolio had no market risk exposure.
Market risk exposure is measured using the20-day Delta-Gamma VaR methodology, with a confidence level of 95%, based on 500 daily observations; VaR and CaR are monitored and mitigated bypre-established limits.
It should be noted that sensitivity analyses were not carried out for other financial instruments, such as accounts receivable and payable (as defined in the financial reporting standards). Such accounts are cleared in short-term, and therefore market risk is considered to be nonexistent. Most of these accounts are related to hydrocarbon prices.
In accordance with the risk management regulatory framework that PMI Trading has implemented, VaR and the change in profit and loss by portfolio are calculated daily and compared to the maximum applicable limits in order to implement risk mitigation mechanisms as necessary.
PMI Trading’s global VaR associated with commodities market risk was U.S. $(23,198) as of December 31, 2016. This VaR was calculated using the historical method with a 99% confidence level,two-year history and aone-day horizon. The minimum VaR recorded on the year was U.S. $(4,145) (registered on February 16, 2016) and the maximum VaR recorded on the year was U.S. $(23,198) (registered on December 30, 2016). As of December 31, 2015, the global VaR was US $(12,789).
When the fair value of a DFI is favorable to PEMEX, PEMEX faces the risk that the counterparty will not be able to meet its obligations. PEMEX monitors its counterparties’ creditworthiness and calculates the credit risk exposure for its DFIs. As a risk mitigation strategy, PEMEX only enters into DFIs with major financial institutions with a minimum credit rating ofBBB-. These ratings are issued and revised periodically by risk rating agencies. Furthermore, PEMEX seeks to maintain a diversified portfolio of counterparties.
F-86
PETRÓLEOS MEXICANOS, PRODUCTIVE STATE-OWNED SUBSIDIARIES
AND SUBSIDIARY COMPANIES
NOTES TO THE CONSOLIDATED FINANCIAL STATEMENTS
FOR THE YEARS ENDED DECEMBER 31, 2016, 2015 AND 2014
(FIGURES STATED IN THOUSANDS, EXCEPT AS NOTED)
In order to estimate PEMEX’s credit risk exposure to each financial counterparty, the potential future exposure is calculated by projecting the risk factors used in the valuation of each DFI in order to estimate the MtM value for different periods, taking into account any credit risk mitigation provisions.
Moreover, PEMEX has entered into various long-term cross-currency swaps agreements with “recouponing” provisions (pursuant to which the payments on the swaps are adjusted when the MtM exceeds the relevant threshold specified in the swap), thereby limiting the exposure with its counterparties to a specific threshold amount. The specified thresholds were reached in five cross-currency swaps from the first to the fourth quarter of 2016, which were used to hedge the exchange rate exposure to the euro and to the Pound Sterling, and in nine cross-currency swaps during 2015, which were used to hedge the exchange rate exposure to the euro and the Australian dollar. This resulted in the cash settlement of such swaps and the resetting of swap terms to return theirmark-to-market value to zero. During 2016, PEMEX did not enter into any cross-currency swap with these characteristics.
In addition, during 2016 PEMEX entered into long-term DFIs with mandatory early termination clauses (pursuant to which, at a given date, regardless of the MtM of the transaction, the DFI has an early termination with the settlement of the corresponding MtM, requiring that PEMEX enter into a new DFI with the same counterparty or with a new one), which reduces the credit risk generated by the term of the DFI by limiting it to a specific date. As of December 31, 2016, PEMEX has entered into three euro swaps and two Japanese yen Seagull Option structures, with termination clauses in 2018 and 2021, respectively.
According to IFRS 13 “Fair Value Measurement,” the fair value or MtM value of DFIs must reflect the creditworthiness of the parties. Consequently, the fair value of a DFI takes into account the risk that either party may default on its obligation. In accordance with market best practices, PEMEX applies the credit value adjustment (“CVA”) method to calculate the fair value of its DFIs.
For each DFI, the CVA is calculated by determining the difference between the MtM and the estimated MtM adjusted for credit risk. In determining the credit risk, the CVA method takes into account the current market perception about the credit risk of both counterparties, using the following inputs: a) the MtM projection for each payment date based on forward yield curves; b) the implied default probability obtained from both, PEMEX and the counterparty credit default swaps’, at each payment date; and c) the default recovery rates of each counterparty.
The current and potential exposures, aggregated by credit rating, are as follows:
| | | | | | | | | | | | | | | | | | | | | | | | | | | | |
| Maximum Credit Exposure by term in Petróleos Mexicanos | |
| | | | | | | |
Rating | | Current | | | Less than 1 year | | | 1-3 years | | | 3-5 years | | | 5-7 years | | | 7-10 years | | | More than 10 years | |
A+ | | | 0 | | | | 0 | | | | 0 | | | | 0 | | | | 0 | | | | 0 | | | | 0 | |
A | | | 0 | | | | 339 | | | | 578 | | | | 671 | | | | 269 | | | | 124 | | | | 0 | |
A- | | | 0 | | | | 192 | | | | 273 | | | | 237 | | | | 216 | | | | 224 | | | | 0 | |
BBB+ | | | 0 | | | | 561 | | | | 1193 | | | | 1362 | | | | 1034 | | | | 898 | | | | 259 | |
BBB | | | 0 | | | | 110 | | | | 160 | | | | 189 | | | | 206 | | | | 139 | | | | 0 | |
In millions of U.S. dollars | |
F-87
PETRÓLEOS MEXICANOS, PRODUCTIVE STATE-OWNED SUBSIDIARIES
AND SUBSIDIARY COMPANIES
NOTES TO THE CONSOLIDATED FINANCIAL STATEMENTS
FOR THE YEARS ENDED DECEMBER 31, 2016, 2015 AND 2014
(FIGURES STATED IN THOUSANDS, EXCEPT AS NOTED)
PEMEX also faces credit risk derived from its investments. As of December 31, 2016, the notional amounts of investments in domestic currency, organized by the credit ratings of the issuances, were as follows:
| | | | |
Credit rating of issuances* | | Notional amount
(In millions of pesos) | |
mxAAA | | | Ps. 21,774.77 | |
mxAA | | | 250.35 | |
mxA | | | 70.01 | |
* Minimum S&P, Moody’s and Fitch credit rating. | |
National Credit Rating Scale. | |
Does not include investments in Mexican Government bonds. | |
The table above does not include domestic currency Mexican Government bonds because these issuances are considered not to carry default risk in this currency.
PEMEX held an investment in a note linked to United Mexican States’ credit risk that was issued by a U.S. financial institution with a BBB+ credit rating. This note matured in June 2016 and had a face value of U.S. $108,000. As of December 31, 2016, PEMEX does not hold an investment in structured notes.
Furthermore, by means of its credit guidelines for DFI operations, Pemex Industrial Transformation has significantly reduced its credit risk exposure related to the DFIs offered to its customers to assist them in mitigating the risk associated with the volatility of natural gas.
In order to qualify for these DFIs, Pemex Industrial Transformation’s customers must be party to a current natural gas supply contract and sign a domestic master derivative agreement.
Additionally, beginning on October 2, 2009, DFIs with these customers must be initially secured by cash deposits, letters of credit or other collateral provisions, as required. In accordance with these guidelines, in the event that a client does not meet its payment obligations, DFIs related to this client are terminated, rights to collateral are exercised and, if the collateral is insufficient to cover the fair value, natural gas supply is suspended until the payment is made.
On August 20, 2014, certain amendments to the credit guidelines were enacted, which allowedPemex-Gas and Petrochemicals, and now Pemex Industrial Transformation, to offer to its clients with an adequate credit rating, based on an internal financial and credit assessment, DFIs with an exemption from collateral requirements up to certain amount through a credit line approved by the credit committee. Moreover, if the credit line is insufficient to cover each client’s exposure, the client is obligated to deposit collateral. If a client suffers an event of default, DFIs related to this client are terminated early and natural gas supply is suspended until the payment is made.
As of December 31, 2016, Pemex Industrial Transformation’s DFIs had a fair value of U.S. $0 (deferred premiums included) for clients with exempted credit lines and U.S. $514,126 for clients with guaranteed credit lines. The total amount of exempt credit lines rose to U.S. $1,025,852,430, representing 0% usage of available exempt credit lines, while the total amount of guaranteed credit lines rose to U.S. $57,884,274, representing a 1% usage of available guaranteed credit lines.
As of December 31, 2016, the overdue accounts of natural gas customers in the industrial and distribution sectors accounted for less than 1.00% of the total sales of Pemex Industrial Transformation.
F-88
PETRÓLEOS MEXICANOS, PRODUCTIVE STATE-OWNED SUBSIDIARIES
AND SUBSIDIARY COMPANIES
NOTES TO THE CONSOLIDATED FINANCIAL STATEMENTS
FOR THE YEARS ENDED DECEMBER 31, 2016, 2015 AND 2014
(FIGURES STATED IN THOUSANDS, EXCEPT AS NOTED)
As of December 31, 2016, Pemex Industrial Transformation had open DFIs with 11 customers, of which 10 are industrial customers (91%) and one is both an industrial customer and distributor (9%). Of the total volume (in millions of British thermal units or MMBtu) of DFIs, industrial customers represented 77%, and customers who are both industrial and distributor customers represented 23%.
As of December 31, 2016 and 2015, Pemex Industrial Transformation had not provided any collateral for DFIs entered into to hedge its DFIs with customers. This was due to the following: (i) natural gas prices maintained levels below the strike price, which has kept the credit limits within the set limits; and (ii) when certain DFIs matured,Pemex-Gas and Basic Petrochemicals, and now Pemex Industrial Transformation, had used domestic customers’ payments to meet its international obligations.
The potential future exposure of Mex Gas Supply, S.L.’s DFI portfolio was calculated in an analogous manner to the analysis of Petróleos Mexicanos’ DFI positions. The current and potential exposure, aggregated by credit rating, is as follows:
| | | | | | | | | | | | | | | | | | | | | | | | | | | | |
| Maximum Credit Exposure by term in Pemex Industrial Transformation | |
| | | | | | | |
Rating | | Current | | | Less than 1 year | | | 1-3 years | | | 3-5 years | | | 5-7 years | | | 7-10 years | | | More than 10 years | |
| A | | | 0.68 | | | | 0.68 | | | | 0.27 | | | | — | | | | — | | | | — | | | | — | |
| A- | | | 2.95 | | | | 2.95 | | | | 2.47 | | | | — | | | | — | | | | — | | | | — | |
| BBB+ | | | 1.16 | | | | 1.16 | | | | 0.34 | | | | — | | | | — | | | | — | | | | — | |
In millions of U.S. dollars | |
PMI Trading’s credit risk associated with DFI transactions is mitigated through the use of futures and standardized instruments that are cleared throughCME-Clearport.
Through its debt planning and the purchase and sale of U.S. dollars, PEMEX currently preserves cash balance at a level of liquidity in domestic currency and U.S. dollars that is considered adequate to cover its investment and operating expenses, as well as other payment obligations.
In addition, PEMEX has acquired committed revolving credit lines in order to mitigate liquidity risk, two of which provide access to Ps. 3,500,000 and Ps. 20,000,000 with expiration dates in June and November 2019, respectively; and two others that each provides access to U.S. $1,500,000 and U.S. $3,250,000 with expiration dates in December 2019 and January 2020, respectively.
Finally, the investment strategies of PEMEX’s portfolios are structured by selecting time horizons that consider each currency’s cash flow requirements in order to preserve liquidity.
Certain PMI subsidiaries mitigate their liquidity risk through several mechanisms, the most important of which is the centralized treasury or“in-house bank,” which provides access to a syndicated credit line for up to U.S. $700,000 and cash surplus capacity in the custody of the centralized structure. In addition, certain PMI subsidiaries have access to bilateral credit lines from financial institutions for up to U.S. $1,450,000.
F-89
PETRÓLEOS MEXICANOS, PRODUCTIVE STATE-OWNED SUBSIDIARIES
AND SUBSIDIARY COMPANIES
NOTES TO THE CONSOLIDATED FINANCIAL STATEMENTS
FOR THE YEARS ENDED DECEMBER 31, 2016, 2015 AND 2014
(FIGURES STATED IN THOUSANDS, EXCEPT AS NOTED)
These companies monitor their cash flow on a daily basis and protect their creditworthiness in the financial markets. Liquidity risk is mitigated by monitoring the maximum/minimum permissible financial ratios as set forth in the policies approved by each company’s board of directors.
The following tables show the cash flow maturities as well as the fair value of PEMEX’s debt and DFI portfolios as of December 31, 2016 and 2015. It should be noted that:
| | • | | For debt obligations, these tables present principal cash flow and the weighted average interest rates for fixed rate debt. |
| | • | | For interest rate swaps, cross currency swaps, and currency options, these tables present notional amounts and weighted average interest rates by expected (contractual) maturity dates. |
| | • | | Weighted average variable rates are based on implied forward rates obtained from the interbank market yield curve at the reporting date. |
| | • | | For natural gas DFIs, volumes are presented in millions of British thermal unit (MMBtu), and fixed average and strike prices are presented in U.S. dollars per MMBtu. |
| | • | | A DFI’s fair value includes CVA and is calculated based on market quotes obtained from market sources such as Reuters and Bloomberg. Forward curves for natural gas are supplied by the Kiodex Risk Workbench platform. |
| | • | | For PMI Trading, the prices used in commercial transactions and DFIs are published by reputable sources that are widely used in international markets, such asCME-NYMEX, Platts and Argus, among others. |
| | • | | Fair value is calculated internally, either by discounting cash flows with the correspondingzero-coupon yield curve in the original currency, or through other standard methodologies commonly applied in financial markets for specific instruments. |
| | • | | For all instruments, tables are based on the contract terms in order to determine the future cash flows that are categorized by expected maturity dates. |
| | • | | This information is presented in thousands of pesos, except as noted. |
F-90
PETRÓLEOS MEXICANOS, PRODUCTIVE STATE-OWNED SUBSIDIARIES
AND SUBSIDIARY COMPANIES
NOTES TO THE CONSOLIDATED FINANCIAL STATEMENTS
FOR THE YEARS ENDED DECEMBER 31, 2016, 2015 AND 2014
(FIGURES STATED IN THOUSANDS, EXCEPT AS NOTED)
Quantitative Disclosure of Debt Cash Flow’s Maturities as of December 31, 2016(1)
| | | | | | | | | | | | | | | | | | | | | | | | | | | | | | | | |
| | | Year of expected maturity date | |
| | | 2017 | | | 2018 | | | 2019 | | | 2020 | | | 2021 | | | 2022
thereafter | | | Total
carrying
value | | | Fair value | |
Liabilities | | | | | | | | | | | | | | | | | | | | | | | | | | | | | | | | |
Outstanding debt | | | | | | | | | | | | | | | | | | | | | | | | | | | | | | | | |
Fixed rate (U.S. dollars) | | | Ps 15,759,027 | | | Ps | 86,161,096 | | | Ps | 65,642,616 | | | Ps | 62,440,943 | | | Ps | 98,858,992 | | | Ps | 826,093,574 | | | Ps | 1,154,956,248 | | | Ps | 1,137,936,275 | |
Average interest rate (%) | | | | | | | | | | | | | | | | | | | | | | | | | | | 5.6541 | % | | | | |
Fixed rate (Japanese yen) | | | 517,286 | | | | — | | | | — | | | | — | | | | — | | | | 19,459,306 | | | | 19,976,592 | | | | 17,336,203 | |
Average interest rate (%) | | | | | | | | | | | | | | | | | | | | | | | | | | | 1.3665 | % | | | | |
Fixed rate (Pounds) | | | — | | | | — | | | | — | | | | — | | | | — | | | | 8,825,434 | | | | 8,825,434 | | | | 11,373,345 | |
Average interest rate (%) | | | | | | | | | | | | | | | | | | | | | | | | | | | 8.2500 | % | | | | |
Fixed rate (pesos) | | | — | | | | — | | | | — | | | | 10,048,950 | | | | 20,457,671 | | | | 90,393,507 | | | | 120,900,128 | | | | 160,930,040 | |
Average interest rate (%) | | | | | | | | | | | | | | | | | | | | | | | | | | | 7.4878 | % | | | | |
Fixed rate (UDIs) | | | — | | | | — | | | | 17,319,897 | | | | 4,464,787 | | | | 3,630,557 | | | | 28,288,180 | | | | 53,703,421 | | | | 50,809,979 | |
Average interest rate (%) | | | | | | | | | | | | | | | | | | | | | | | | | | | 4.0559 | % | | | | |
Fixed rate (euros) | | | 26,006,880 | | | | — | | | | 29,198,138 | | | | 28,061,554 | | | | — | | | | 123,886,644 | | | | 207,153,216 | | | | 216,100,006 | |
Average interest rate (%) | | | | | | | | | | | | | | | | | | | | | | | | | | | 3.9581 | % | | | | |
Fixed rate (Swiss Francs) | | | — | | | | 4,539,022 | | | | 6,056,338 | | | | 12,102,748 | | | | 3,031,480 | | | | — | | | | 25,729,588 | | | | 26,469,543 | |
Average interest rate (%) | | | | | | | | | | | | | | | | | | | | | | | | | | | 1.8385 | % | | | | |
Fixed rate (Australian dollars) | | | 2,232,195 | | | | — | | | | — | | | | — | | | | — | | | | — | | | | 2,232,195 | | | | 2,346,390 | |
Average interest rate (%) | | | — | | | | — | | | | — | | | | — | | | | — | | | | — | | | | 6.1250 | % | | | — | |
| | | | | | | | | | | | | | | | | | | | | | | | | | | | | | | | |
Total fixed rate debt | | | 44,515,388 | | | | 90,700,118 | | | | 118,216,989 | | | | 117,118,982 | | | | 125,978,700 | | | | 1,096,946,645 | | | | 1,593,476,822 | | | | 1,623,301,781 | |
| | | | | | | | | | | | | | | | | | | | | | | | | | | | | | | | |
Variable rate (U.S. dollars) | | | 38,811,320 | | | | 27,907,661 | | | | 15,984,547 | | | | 52,726,647 | | | | 13,366,336 | | | | 45,385,885 | | | | 194,182,396 | | | | 195,838,382 | |
Variable rate (Japanese yen) | | | — | | | | — | | | | — | | | | 11,341,440 | | | | — | | | | — | | | | 11,341,440 | | | | 11,025,531 | |
Variable rate (euros) | | | — | | | | — | | | | — | | | | — | | | | — | | | | — | | | | — | | | | — | |
Variable rate (pesos) | | | 65,024,075 | | | | 8,742,191 | | | | 28,007,709 | | | | 18,347,822 | | | | 8,468,176 | | | | 27,764,693 | | | | 156,354,666 | | | | 158,109,920 | |
| | | | | | | | | | | | | | | | | | | | | | | | | | | | | | | | |
Total variable rate debt | | | 103,835,395 | | | | 36,649,852 | | | | 43,992,256 | | | | 82,415,909 | | | | 21,834,512 | | | | 73,150,578 | | | | 361,878,502 | | | | 364,973,833 | |
| | | | | | | | | | | | | | | | | | | | | | | | | | | | | | | | |
Total debt | | | 148,350,783 | | | | 127,349,970 | | | | 162,209,245 | | | | 199,534,891 | | | | 147,813,212 | | | | 1,170,097,223 | | | | 1,955,355,324 | | | | 1,988,275,614 | |
| | | | | | | | | | | | | | | | | | | | | | | | | | | | | | | | |
| Note: | Numbers may not total due to rounding. |
| (1) | The information in this table has been calculated using exchange rates at December 31, 2016 of: Ps. 20.664 = U.S. $1.00; Ps. 0.17721 = 1.00 Japanese yen; Ps. 25.30513 = 1.00 Pound sterling; Ps. $ 5.562883 = 1.00 UDI; Ps. 21.6724 = 1.00 euro; Ps. 20.19744= 1.00 Swiss Franc; and Ps. 14.88428 = 1.00 Australian dollar. |
Source: PEMEX
F-91
PETRÓLEOS MEXICANOS, PRODUCTIVE STATE-OWNED SUBSIDIARIES
AND SUBSIDIARY COMPANIES
NOTES TO THE CONSOLIDATED FINANCIAL STATEMENTS
FOR THE YEARS ENDED DECEMBER 31, 2016, 2015 AND 2014
(FIGURES STATED IN THOUSANDS, EXCEPT AS NOTED)
Quantitative Disclosure of Debt Cash Flow’s Maturities as of December 31, 2015(1)
| | | | | | | | | | | | | | | | | | | | | | | | | | | | | | | | |
| | | Year of expected maturity date | |
| | | 2016 | | | 2017 | | | 2018 | | | 2019 | | | 2020 | | | 2021
thereafter | | | Total
carrying
value | | | Fair value | |
Liabilities | | | | | | | | | | | | | | | | | | | | | | | | | | | | | | | | |
Outstanding debt | | | | | | | | | | | | | | | | | | | | | | | | | | | | | | | | |
Fixed rate (U.S. dollars) | | Ps | 12,829,312 | | | Ps | 11,855,937 | | | Ps | 82,984,743 | | | Ps | 52,181,092 | | | Ps | 50,502,077 | | | Ps | 528,285,394 | | | Ps | 738,638,555 | | | Ps | 693,943,114 | |
Average interest rate (%) | | | | | | | | | | | | | | | | | | | | | | | | | | | 5.3598 | % | | | | |
Fixed rate (Japanese yen) | | | 834,293 | | | | 417,133 | | | | — | | | | — | | | | — | | | | 4,287,000 | | | | 5,538,426 | | | | 5,606,358 | |
Average interest rate (%) | | | | | | | | | | | | | | | | | | | | | | | | | | | 3.1698 | % | | | | |
Fixed rate (Pounds) | | | — | | | | — | | | | — | | | | — | | | | — | | | | 8,885,952 | | | | 8,885,952 | | | | 10,767,887 | |
Average interest rate (%) | | | | | | | | | | | | | | | | | | | | | | | | | | | 8.2500 | % | | | | |
Fixed rate (pesos) | | | 7,500,000 | | | | — | | | | — | | | | — | | | | 10,064,778 | | | | 110,946,135 | | | | 128,510,913 | | | | 176,496,022 | |
Average interest rate (%) | | | | | | | | | | | | | | | | | | | | | | | | | | | 7.5851 | % | | | | |
Fixed rate (UDIs) | | | — | | | | — | | | | — | | | | 16,754,153 | | | | 4,318,678 | | | | 30,892,053 | | | | 51,964,884 | | | | 44,959,784 | |
Average interest rate (%) | | | | | | | | | | | | | | | | | | | | | | | | | | | 5.3275 | % | | | | |
Fixed rate (euros) | | | 15,987,190 | | | | 22,513,392 | | | | — | | | | — | | | | 24,308,184 | | | | 81,184,552 | | | | 143,993,318 | | | | 136,416,000 | |
Average interest rate (%) | | | | | | | | | | | | | | | | | | | | | | | | | | | 4.0517 | % | | | | |
Fixed rate (Swiss Francs) | | | — | | | | — | | | | — | | | | 5,200,092 | | | | 10,391,550 | | | | — | | | | 15,591,642 | | | | 15,342,323 | |
Average interest rate (%) | | | | | | | | | | | | | | | | | | | | | | | | | | | 1.8335 | % | | | | |
Fixed rate (Australian dollars) | | | — | | | | 1,879,733 | | | | — | | | | — | | | | — | | | | — | | | | 1,879,733 | | | | 1,998,003 | |
Average interest rate (%) | | | — | | | | — | | | | — | | | | — | | | | — | | | | — | | | | 6.1250 | % | | | — | |
| | | | | | | | | | | | | | | | | | | | | | | | | | | | | | | | |
Total fixed rate debt | | | 37,150,795 | | | | 36,666,195 | | | | 82,984,743 | | | | 74,135,337 | | | | 99,585,267 | | | | 764,481,086 | | | | 1,095,003,423 | | | | 1,085,529,491 | |
| | | | | | | | | | | | | | | | | | | | | | | | | | | | | | | | |
Variable rate (U.S. dollars) | | | 98,054,813 | | | | 26,444,912 | | | | 21,175,683 | | | | 10,682,902 | | | | 42,961,127 | | | | 17,834,819 | | | | 217,154,256 | | | | 211,799,779 | |
Variable rate (Japanese yen) | | | — | | | | — | | | | — | | | | — | | | | 9,145,600 | | | | — | | | | 9,145,600 | | | | 8,446,427 | |
Variable rate (euros) | | | — | | | | — | | | | — | | | | — | | | | — | | | | — | | | | — | | | | — | |
Variable rate (pesos) | | | 38,814,538 | | | | 29,895,944 | | | | 8,619,552 | | | | 22,902,913 | | | | 18,211,267 | | | | 35,145,822 | | | | 153,590,036 | | | | 152,252,128 | |
| | | | | | | | | | | | | | | | | | | | | | | | | | | | | | | | |
Total variable rate debt | | | 136,869,351 | | | | 56,340,856 | | | | 29,795,235 | | | | 33,585,815 | | | | 70,317,994 | | | | 52,980,641 | | | | 379,889,892 | | | | 372,498,334 | |
| | | | | | | | | | | | | | | | | | | | | | | | | | | | | | | | |
Total debt | | | 174,020,146 | | | | 93,007,051 | | | | 112,779,978 | | | | 107,721,152 | | | | 169,903,261 | | | | 817,461,727 | | | | 1,474,893,315 | | | | 1,458,027,825 | |
| | | | | | | | | | | | | | | | | | | | | | | | | | | | | | | | |
| Note: | Numbers may not total due to rounding. |
| (1) | The information in this table has been calculated using exchange rates at December 31, 2015 of: Ps. 17.2065 = U.S. $1.00; Ps. 0.1429 = 1.00 Japanese yen; Ps. 25.49831 = 1.00 Pound sterling; Ps. 5.381175 = 1.00 UDI; Ps. 18.80843 = 1.00 euro; Ps. 17.34876 = 1.00 Swiss Franc; and Ps. 12.55386 = 1.00 Australian dollar. |
Source: PEMEX
F-92
PETRÓLEOS MEXICANOS, PRODUCTIVE STATE-OWNED SUBSIDIARIES
AND SUBSIDIARY COMPANIES
NOTES TO THE CONSOLIDATED FINANCIAL STATEMENTS
FOR THE YEARS ENDED DECEMBER 31, 2016, 2015 AND 2014
(FIGURES STATED IN THOUSANDS, EXCEPT AS NOTED)
Quantitative Disclosure of Cash Flow’s Maturities from Derivative Financial Instruments
Held or Issued for Purposes Other than Trading as of December 31, 2016(1)(2)
| | | | | | | | | | | | | | | | | | | | | | | | | | | | | | | | |
| | | Year of expected maturity date | | | Total
Notional
Amount | | | Fair
Value | |
| | | 2017 | | | 2018 | | | 2019 | | | 2020 | | | 2021 | | | 2022
Thereafter | | | |
Hedging instruments(2)(4) | | | | | | | | | | | | | | | | | | | | | | | | | | | | | | | | |
Interest rate DFIs | | | | | | | | | | | | | | | | | | | | | | | | | | | | | | | | |
Interest rate swaps (U.S. dollars) | | | | | | | | | | | | | | | | | | | | | | | | | | | | | | | | |
Variable to fixed | | | Ps. 4,899,645 | | | | Ps. 4,912,743 | | | | Ps. 4,926,477 | | | | Ps. 4,940,613 | | | | Ps 4,894,180 | | | | Ps 15,365,634 | | | | Ps. 39,939,292 | | | | Ps. 164,716 | |
Average pay rate | | | 2.76 | % | | | 2.66 | % | | | 3.35 | % | | | 3.83 | % | | | 4.04 | % | | | 4.57 | % | | | N.A. | | | | N.A. | |
Average receive rate | | | 2.95 | % | | | 2.99 | % | | | 3.03 | % | | | 3.06 | % | | | 3.11 | % | | | 3.33 | % | | | N.A. | | | | N.A. | |
Interest rate swaps (pesos) | | | | | | | | | | | | | | | | | | | | | | | | | | | | | | | | |
Variable to fixed | | | — | | | | — | | | | — | | | | — | | | | — | | | | — | | | | — | | | | — | |
Average pay rate | | | N.A. | | | | N.A. | | | | N.A. | | | | N.A. | | | | N.A. | | | | N.A. | | | | N.A. | | | | N.A. | |
Average receive rate | | | N.A. | | | | N.A. | | | | N.A. | | | | N.A. | | | | N.A. | | | | N.A. | | | | N.A. | | | | N.A. | |
Currency DFIs | | | | | | | | | | | | | | | | | | | | | | | | | | | | | | | | |
Cross-currency swaps | | | | | | | | | | | | | | | | | | | | | | | | | | | | | | | | |
Receive euros/Pay U.S. dollars | | | 34,775,198 | | | | — | | | | 31,223,821 | | | | 29,992,556 | | | | — | | | | 133,024,913 | | | | 229,016,488 | | | | (16,484,533 | ) |
Receive Japanese yen/ Pay U.S. dollars | | | 532,711 | | | | — | | | | — | | | | 17,697,534 | | | | — | | | | 4,987,289 | | | | 23,217,534 | | | | (6,132,633 | ) |
Receive Pounds sterling/ Pay U.S. dollars | | | — | | | | — | | | | — | | | | — | | | | — | | | | 10,767,349 | | | | 10,767,349 | | | | (211,207 | ) |
Receive UDI/ Pay pesos | | | — | | | | — | | | | 23,740,341 | | | | 3,540,220 | | | | 3,000,000 | | | | 14,313,198 | | | | 44,593,759 | | | | (2,132,236 | ) |
Receive Swiss francs/ Pay U.S. dollars | | | — | | | | 4,736,567 | | | | 6,789,326 | | | | 12,060,700 | | | | 3,127,139 | | | | — | | | | 26,713,732 | | | | (789,449 | ) |
Receive Australian dollars/ Pay U.S. dollars | | | 2,459,429 | | | | — | | | | — | | | | — | | | | — | | | | — | | | | 2,459,429 | | | | (126,796 | ) |
Currency Options | | | | | | | | | | | | | | | | | | | | | | | | | | | | | | | | |
Buy Put, Sell Put and sell Call on yen | | | — | | | | — | | | | — | | | | — | | | | — | | | | 14,133,580 | | | | 14,133,580 | | | | (301,131 | ) |
N.A. = not applicable.
Numbers may not total due to rounding.
| (1) | The information in this table has been calculated using exchange rates at December 31, 2016 of: Ps. 20.664 = U.S. $1.00 and Ps. 21.6724 = 1.00 euro. |
| (2) | PEMEX’s management uses these DFIs to hedge market risk; however, these DFIs do not qualify for accounting purposes as hedges and are recorded in the financial statements as entered into for trading purposes. |
| (3) | Positive numbers represent a favorable fair value to PEMEX. |
| (4) | PMI’s risk management policies and procedures establish that DFIs should be used only for hedging purposes; however DFIs are not recorded as hedges for accounting purposes. |
Source: PEMEX
F-93
PETRÓLEOS MEXICANOS, PRODUCTIVE STATE-OWNED SUBSIDIARIES
AND SUBSIDIARY COMPANIES
NOTES TO THE CONSOLIDATED FINANCIAL STATEMENTS
FOR THE YEARS ENDED DECEMBER 31, 2016, 2015 AND 2014
(FIGURES STATED IN THOUSANDS, EXCEPT AS NOTED)
Quantitative Disclosure of Cash Flow’s Maturities from Derivative Financial Instruments
Held or Issued for Purposes Other than Trading as of December 31, 2015(1)(2)
| | | | | | | | | | | | | | | | | | | | | | | | | | | | | | | | |
| | | Year of expected maturity date | | | Total
notional
amount | | | Fair
value(3) | |
| | | 2016 | | | 2017 | | | 2018 | | | 2019 | | | 2020 | | | 2021
Thereafter | | | |
Hedging instruments(2)(4) | | | | | | | | | | | | | | | | | | | | | | | | | | | | | | | | |
Interest rate DFIs | | | | | | | | | | | | | | | | | | | | | | | | | | | | | | | | |
Interest rate swaps (U.S. dollars) | | | | | | | | | | | | | | | | | | | | | | | | | | | | | | | | |
Variable to fixed | | Ps. | 4,069,129 | | | Ps. | 4,079,836 | | | Ps | 4,090,743 | | | Ps. | 4,102,179 | | | Ps | 4,113,949 | | | Ps | 16,869,943 | | | Ps. | 37,325,779 | | | Ps. | (192,666) | |
Average pay rate | | | 2.09 | % | | | 2.40 | % | | | 3.05 | % | | | 3.47 | % | | | 3.82 | % | | | 4.25 | % | | | N.A. | | | | N.A. | |
Average receive rate | | | 2.93 | % | | | 2.97 | % | | | 3.00 | % | | | 3.02 | % | | | 3.06 | % | | | 3.24 | % | | | N.A. | | | | N.A. | |
Interest rate swaps (pesos) | | | | | | | | | | | | | | | | | | | | | | | | | | | | | | | | |
Variable to fixed | | | — | | | | — | | | | — | | | | — | | | | — | | | | — | | | | — | | | | — | |
Average pay rate | | | N.A. | | | | N.A. | | | | N.A. | | | | N.A. | | | | N.A. | | | | N.A. | | | | N.A. | | | | N.A. | |
Average receive rate | | | N.A. | | | | N.A. | | | | N.A. | | | | N.A. | | | | N.A. | | | | N.A. | | | | N.A. | | | | N.A. | |
Currency DFIs | | | | | | | | | | | | | | | | | | | | | | | | | | | | | | | | |
Cross-currency swaps | | | | | | | | | | | | | | | | | | | | | | | | | | | | | | | | |
Receive euros/Pay U.S. dollars | | | 19,725,704 | | | | 28,956,612 | | | | — | | | | — | | | | 30,263,050 | | | | 83,793,246 | | | | 162,738,612 | | | | (19,088,133 | ) |
Receive Japanese yen/ Pay U.S. dollars | | | 887,184 | | | | 443,581 | | | | — | | | | — | | | | 14,736,383 | | | | 4,152,816 | | | | 20,219,964 | | | | (5,419,164 | ) |
Receive Pounds sterling/ Pay U.S. dollars | | | — | | | | — | | | | — | | | | — | | | | — | | | | 10,951,197 | | | | 10,951,197 | | | | (693,597 | ) |
Receive UDI/ Pay pesos | | | — | | | | — | | | | — | | | | 16,105,371 | | | | 3,540,220 | | | | 16,236,097 | | | | 35,881,688 | | | | 294,255 | |
Receive Swiss francs/ Pay U.S. dollars | | | — | | | | — | | | | — | | | | 5,653,336 | | | | 10,042,704 | | | | — | | | | 15,696,040 | | | | (281,999 | ) |
Receive Australian dollars/ Pay U.S. dollars | | | — | | | | 2,047,918 | | | | — | | | | — | | | | — | | | | — | | | | 2,047,918 | | | | (46,526 | ) |
Exchange rate forward | | | | | | | | | | | | | | | | | | | | | | | | | | | | | | | | |
Receive euros/Pay U.S. dollars | | | — | | | | — | | | | — | | | | — | | | | — | | | | — | | | | — | | | | — | |
N.A. = not applicable.
Numbers may not total due to rounding.
| (1) | The information in this table has been calculated using the exchange rate at December 31, 2015 of: Ps. 17.20650 = U.S. $1.00 and Ps. 18.80843 = 1.00 euro. |
| (2) | PEMEX’s management uses these DFIs to hedge market risk; however, these DFIs do not qualify for accounting purposes as hedges and are recorded in the financial statements as entered into for trading purposes. |
| (3) | Positive numbers represent a favorable fair value to PEMEX. |
| (4) | PMI’s risk management policies and procedures establish that DFIs should be used only for hedging purposes; however DFIs are not recorded as hedges for accounting purposes. |
Source: PEMEX
F-94
PETRÓLEOS MEXICANOS, PRODUCTIVE STATE-OWNED SUBSIDIARIES
AND SUBSIDIARY COMPANIES
NOTES TO THE CONSOLIDATED FINANCIAL STATEMENTS
FOR THE YEARS ENDED DECEMBER 31, 2016, 2015 AND 2014
(FIGURES STATED IN THOUSANDS, EXCEPT AS NOTED)
| B. | Fair value of derivative financial instruments |
PEMEX periodically evaluates its exposure to international hydrocarbon prices, interest rates and foreign currencies and uses derivative instruments as a mitigation mechanism when potential sources of market risk are identified.
PEMEX monitors the fair value of its DFI portfolio on a periodic basis. The fair value represents the price at which one party would assume the rights and obligations of the other, and is calculated for DFIs through models commonly used in the international financial markets, based on inputs obtained from major market information systems and price providers.
PEMEX’s DFIs portfolio is composed primarily of swaps, the prices of which are estimated by discounting flows using the appropriate factors, and contains no exotic instruments that require numerical approximations for their valuation.
Embedded derivatives
In accordance with established policies, PEMEX has analyzed the different contracts it has entered into and has determined that according to the terms thereof, none meet the criteria necessary to be classified as embedded derivatives. Accordingly, as of December 31, 2016 and 2015, PEMEX did not recognize any embedded derivatives (foreign currency or index).
Accounting treatment
PEMEX enters into derivatives transactions with the sole purpose of hedging financial risks related to its operations, firm commitments, planned transactions and assets and liabilities recorded on its statement of financial position. Nonetheless, some of these transactions do not qualify for hedge accounting treatment because they do not meet the requirements of the accounting standards for designation as hedges. They are therefore recorded in the financial statements asnon-hedge instruments or as instruments entered into for trading purposes, despite the fact that their cash flows are offset by the cash flows of the positions (assets or liabilities) to which they relate. As a result, the changes in their fair value are recognized in the “Derivative financial instruments (cost) income, net” line item in the consolidated statement of comprehensive income.
As of December 31, 2016 and 2015, the net fair value of PEMEX’s DFIs (including both DFIs that have not reached maturity and those that have reached maturity but have not been settled), recognized in the consolidated statement of financial position, was Ps. (26,010,486) and Ps. (25,699,581), respectively. As of December 31, 2016 and 2015, PEMEX did not have any DFIs designated as hedges.
The following table shows the fair values and notional amounts of PEMEX’sover-the-counter (“OTC”) DFIs that were designated asnon-hedges for accounting purposes and entered into for trading purposes as of December 31, 2016 and 2015. It should be noted that:
| | • | | DFI’s fair value includes the CVA and is calculated based on market quotes obtained from market sources such as Reuters and Bloomberg. Forward curves for natural gas are supplied by the Kiodex Risk Workbench platform. |
| | • | | Fair value is calculated internally, either by discounting cash flows with the correspondingzero-coupon yield curve, in the original currency, or through other standard methodologies commonly applied in the financial markets for certain specific instruments. |
| | • | | The information is presented in thousands of pesos (except as noted). |
F-95
PETRÓLEOS MEXICANOS, PRODUCTIVE STATE-OWNED SUBSIDIARIES
AND SUBSIDIARY COMPANIES
NOTES TO THE CONSOLIDATED FINANCIAL STATEMENTS
FOR THE YEARS ENDED DECEMBER 31, 2016, 2015 AND 2014
(FIGURES STATED IN THOUSANDS, EXCEPT AS NOTED)
| | | | | | | | | | | | | | | | | | |
| | | | | December 31, 2016 | | | December 31, 2015 | |
DFI | | Position | | Notional
amount | | | Fair
Value | | | Notional
Amount | | | Fair
value | |
Interest rate swaps | | PEMEX pays fixed in U.S. dollar and receives floating in3-month U.S. dollar LIBOR + spread. | | | 20,018,250 | | | | (90,451 | ) | | | 18,819,609 | | | | (245,232 | ) |
Interest rate swaps | | PEMEX pays fixed in U.S. dollar and receives floating in6-month U.S. dollar LIBOR + spread. | | | 18,132,660 | | | | 312,210 | | | | 16,776,338 | | | | 127,586 | |
Cross-currency swaps | | PEMEX pays fixed in pesos and receives notional in UDI. | | | 23,740,341 | | | | (4,815,373 | ) | | | 16,105,371 | | | | (207,713 | ) |
Cross-currency swaps | | PEMEX pays the28-day TIIE + spread in pesos and receives fixed in UDI. | | | 20,853,418 | | | | 2,683,138 | | | | 19,776,317 | | | | 501,968 | |
Cross-currency swaps | | PEMEX pays fixed in U.S. dollar and receives fixed in Japanese yen. | | | 5,520,000 | | | | (116,507 | ) | | | 5,483,580 | | | | (475,356 | ) |
Cross-currency swaps | | PEMEX pays floating in6-month U.S. dollar LIBOR + spread and receives floating in6-month yen LIBOR + spread. | | | 17,697,534 | | | | (6,016,126 | ) | | | 14,736,383 | | | | (4,943,807 | ) |
Cross-currency swaps | | PEMEX pays fixed in U.S. dollar and receives fixed in euro. | | | 229,016,488 | | | | (16,484,533 | ) | | | 162,738,612 | | | | (19,088,133 | ) |
Cross-currency swaps | | PEMEX pays floating in6-month U.S. dollar LIBOR + spread and receives fixed in Pound sterling. | | | 10,767,349 | | | | (211,207 | ) | | | 10,951,197 | | | | (693,597 | ) |
Cross-currency swaps | | PEMEX pays fixed in U.S. dollar and receives fixed in CHF. | | | 26,713,732 | | | | (789,449 | ) | | | 15,696,040 | | | | (281,999 | ) |
Cross-currency swaps | | PEMEX pays fixed in U.S. dollar and receives fixed in AUD. | | | 2,459,429 | | | | (126,796 | ) | | | 2,047,918 | | | | (46,526 | ) |
Currency Options | | PEMEX buys put, sells put and sells call | | | 14,133,580 | | | | (301,131 | ) | | | — | | | | — | |
Propane gas swaps | | PEMEX receives floating. | | | — | | | | — | | | | 1,702,618 | | | | (276,553 | ) |
Natural gas swaps | | PEMEX receives fixed. | | | (160,214 | ) | | | (25,145 | ) | | | (240,934 | ) | | | 37,675 | |
Natural gas swaps | | PEMEX receives floating. | | | 157,545 | | | | 27,869 | | | | 236,960 | | | | (32,990 | ) |
Natural gas options | | PEMEX Long Call. | | | 73,653 | | | | 11,548 | | | | 269,091 | | | | 5,426 | |
Natural gas options | | PEMEX Short Call. | | | (73,653 | ) | | | (11,488 | ) | | | (269,091 | ) | | | (5,310 | ) |
Interest rate swaps | | PEMEX pays fixed in U.S. dollar and receives floating in U.S. dollar LIBOR 1M. | | | 1,788,382 | | | | (57,043 | ) | | | 1,729,833 | | | | (75,019 | ) |
| | | | | | | | | | | | | | | | | | |
Subtotal | | | | | | | | $ | (26,010,486 | ) | | | | | | | Ps.(25,699,581 | ) |
F-96
PETRÓLEOS MEXICANOS, PRODUCTIVE STATE-OWNED SUBSIDIARIES
AND SUBSIDIARY COMPANIES
NOTES TO THE CONSOLIDATED FINANCIAL STATEMENTS
FOR THE YEARS ENDED DECEMBER 31, 2016, 2015 AND 2014
(FIGURES STATED IN THOUSANDS, EXCEPT AS NOTED)
| | | | | | | | | | | | | | | | | | | | |
| | | | December 31, 2016 | | | December 31, 2015 | |
DFI | | Market | | | Volume
(MMb) | | | Fair
value | | | Volume
(MMb) | | | Fair
value | |
Futures | | | Exchange traded | | | | — | | | $ | — | | | | 0.4 | | | $ | (7,994 | ) |
Petroleum Products Swaps | | | Exchange traded | | | | 4.1 | | | $ | (688,016 | ) | | | 11.6 | | | $ | 550,952 | |
Notes: Numbers may not total due to rounding.
| (1) | The fair value of the Futures and the Petroleum Products Swaps, was recognized as “Cash and cash equivalents” in the statement of financial position because PEMEX considered these financial assets to be fully liquid. |
The exchange rate for U.S. dollars as of December 31, 2016 and 2015 was Ps. 20.664 and Ps. 17.2065 per U.S. dollar, respectively. The exchange rate for euros as of December 31, 2016 and 2015 was Ps. 21.6724 and Ps. 18.80843 per euro, respectively.
For the years ended December 31, 2016, 2015 and 2014, PEMEX recognized a net loss of Ps. 14,000,987, Ps. 21,449,877 and Ps. 9,438,570, respectively, in the “Derivative financial instruments (cost) income, net” line item with respect to DFIs treated as instruments entered into for trading purposes.
The following table presents the location on the consolidated statement of financial position and the fair value of PEMEX’s DFIs (including both DFIs that have not reached maturity and those that have reached maturity but have not been settled), as of December 31, 2016 and 2015:
| | | | | | | | | | |
| | | Derivatives assets | |
Derivatives not designated as
hedging instruments | | Location in statement of
financial position | | Fair value | |
| | |
| | | 2016 | | | 2015 | |
Embedded derivatives | | Derivative financial instruments | | Ps. | — | | | Ps. | — | |
Forwards | | Derivative financial instruments | | | — | | | | — | |
Futures | | Derivative financial instruments | | | — | | | | — | |
Stock options | | Derivative financial instruments | | | — | | | | — | |
Currency options | | Derivative financial instruments | | | — | | | | — | |
Natural gas options | | Derivative financial instruments | | | 11,548 | | | | 5,432 | |
Equity swaps | | Derivative financial instruments | | | — | | | | — | |
Cross-currency swaps | | Derivative financial instruments | | | 4,503,550 | | | | 1,426,626 | |
Natural gas swaps | | Derivative financial instruments | | | 30,162 | | | | 41,462 | |
Petroleum product swaps | | Derivative financial instruments | | | — | | | | — | |
Propane swaps | | Derivative financial instruments | | | — | | | | 127,586 | |
Interest rate swaps | | Derivative financial instruments | | | 312,210 | | | | — | |
Others | | Derivative financial instruments | | | — | | | | — | |
| | | | | | | | | | |
Total derivatives not designated as hedging instruments | | | 4,857,470 | | | | 1,601,106 | |
| | | | | | | | | | |
Total assets | | Ps. | 4,857,470 | | | Ps. | 1,601,106 | |
| | | | | | | | | | |
F-97
PETRÓLEOS MEXICANOS, PRODUCTIVE STATE-OWNED SUBSIDIARIES
AND SUBSIDIARY COMPANIES
NOTES TO THE CONSOLIDATED FINANCIAL STATEMENTS
FOR THE YEARS ENDED DECEMBER 31, 2016, 2015 AND 2014
(FIGURES STATED IN THOUSANDS, EXCEPT AS NOTED)
| | | | | | | | | | |
| | | Derivatives liabilities | |
Derivatives not designated as hedging instruments | | Location in statement of financial position | | Fair value | |
| | |
| | | 2016 | | | 2015 | |
Embedded derivatives | | Derivative financial instruments | | Ps. | — | | | Ps. | — | |
Forwards | | Derivative financial instruments | | | — | | | | — | |
Futures | | Derivative financial instruments | | | — | | | | — | |
Stock options | | Derivative financial instruments | | | — | | | | — | |
Currency options | | Derivative financial instruments | | | (301,131 | ) | | | — | |
Natural gas options | | Derivative financial instruments | | | (11,488 | ) | | | (5,316 | ) |
Equity swaps | | Derivative financial instruments | | | — | | | | — | |
Cross-currency swaps | | Derivative financial instruments | | | (30,380,405 | ) | | | (26,661,789 | ) |
Natural gas swaps | | Derivative financial instruments | | | (27,438 | ) | | | (36,777 | ) |
Petroleum product swaps | | Derivative financial instruments | | | — | | | | — | |
Propane swaps | | Derivative financial instruments | | | — | | | | (276,553 | ) |
Interest rate swaps | | Derivative financial instruments | | | (147,494 | ) | | | (320,252 | ) |
Others | | Derivative financial instruments | | | — | | | | — | |
| | | | | | | | | | |
Total derivatives not designated as hedging instruments | | | (30,867,956 | ) | | | (27,300,687 | ) |
| | | | | | | | | | |
Total liabilities | | Ps. | (30,867,956 | ) | | Ps. | (27,300,687 | ) |
| | | | | | | | | | |
Net total | | Ps. | (26,010,486 | ) | | Ps. | (25,699,581 | ) |
| | | | | | | | | | |
The following tables presents the net gain (loss) recognized in income on PEMEX’s DFIs for the years ended December 31, 2016, 2015 and 2014, and the line location in the consolidated statement of comprehensive income of such gains and losses.
| | | | | | | | | | |
Derivatives not designated as
hedging instruments | | Location of gain (loss)
recognized in statement of
operations on derivatives | | Amount of gain (loss) recognized in
statement of operations on derivatives | |
| | | | | 2016 | | | 2015 | |
Embedded derivatives | | Derivative financial instruments (cost) income, net | | Ps. | — | | | Ps. | — | |
Forwards | | Derivative financial instruments (cost) income, net | | | — | | | | — | |
Futures | | Derivative financial instruments (cost) income, net | | | (1,925,969 | ) | | | 1,387,177 | |
Stock options | | Derivative financial instruments (cost) income, net | | | — | | | | — | |
Currency options | | Derivative financial instruments (cost) income, net | | | (298,789 | ) | | | — | |
Natural gas options | | Derivative financial instruments (cost) income, net | | | (671 | ) | | | 4,786 | |
Equity swaps | | Derivative financial instruments (cost) income, net | | | — | | | | — | |
Cross-currency swaps | | Derivative financial instruments (cost) income, net | | | (11,633,605 | ) | | | (21,358,898 | ) |
F-98
PETRÓLEOS MEXICANOS, PRODUCTIVE STATE-OWNED SUBSIDIARIES
AND SUBSIDIARY COMPANIES
NOTES TO THE CONSOLIDATED FINANCIAL STATEMENTS
FOR THE YEARS ENDED DECEMBER 31, 2016, 2015 AND 2014
(FIGURES STATED IN THOUSANDS, EXCEPT AS NOTED)
| | | | | | | | | | |
Derivatives not designated as
hedging instruments | | Location of gain (loss)
recognized in statement of
operations on derivatives | | Amount of gain (loss) recognized in
statement of operations on derivatives | |
| | | | | 2016 | | | 2015 | |
Natural gas swaps | | Derivative financial instruments (cost) income, net | | | 831 | | | | 4,355 | |
Petroleum product swaps | | Derivative financial instruments (cost) income, net | | | — | | | | — | |
Propane swaps | | Derivative financial instruments (cost) income, net | | | (3,805 | ) | | | (1,136,188 | ) |
Interest rate swaps | | Derivative financial instruments (cost) income, net | | | (138,979 | ) | | | (351,109 | ) |
Others | | Derivative financial instruments (cost) income, net | | | — | | | | — | |
| | | | | | | | | | |
Total | | Ps. | (14,000,987 | ) | | Ps. | (21,449,877 | ) |
| | | | | | | | | | |
| | | |
| | | | | | | | 2014 | |
Embedded derivatives | | Derivative financial instruments (cost) income, net | | | | | | Ps | . — | |
Forwards | | Derivative financial instruments (cost) income, net | | | | | | | (146,415 | ) |
Futures | | Derivative financial instruments (cost) income, net | | | | | | | 4,696,862 | |
Stock options | | Derivative financial instruments (cost) income, net | | | | | | | (93,715 | ) |
Currency options | | Derivative financial instruments (cost) income, net | | | | | | | — | |
Natural gas options | | Derivative financial instruments (cost) income, net | | | | | | | 4,535 | |
Equity swaps | | Derivative financial instruments (cost) income, net | | | | | | | 2,402,992 | |
Cross-currency swaps | | Derivative financial instruments (cost) income, net | | | | | | | (15,815,498 | ) |
Natural gas swaps | | Derivative financial instruments (cost) income, net | | | | | | | 4,977 | |
Petroleum product swaps | | Derivative financial instruments (cost) income, net | | | | | | | — | |
Propane swaps | | Derivative financial instruments (cost) income, net | | | | | | | — | |
Interest rate swaps | | Derivative financial instruments (cost) income, net | | | | | | | (492,308 | ) |
Others | | Derivative financial instruments (cost) income, net | | | | | | | — | |
| | | | | | | | | | |
Total | | | Ps. | (9,438,570 | ) |
| | | | | | | | | | |
F-99
PETRÓLEOS MEXICANOS, PRODUCTIVE STATE-OWNED SUBSIDIARIES
AND SUBSIDIARY COMPANIES
NOTES TO THE CONSOLIDATED FINANCIAL STATEMENTS
FOR THE YEARS ENDED DECEMBER 31, 2016, 2015 AND 2014
(FIGURES STATED IN THOUSANDS, EXCEPT AS NOTED)
PEMEX values its DFIs under standard methodologies commonly applied in the financial markets. PEMEX’s related assumptions therefore fall under Level 2 of the fair value hierarchy for market participant assumptions, as described below.
The fair values determined by Level 1 inputs utilize quoted prices in financial markets for identical assets or liabilities. Fair values determined by Level 2 inputs are based on quoted prices for similar assets or liabilities in financial markets, and inputs other than quoted prices that are observed for the assets or liabilities. Level 3 inputs are unobservable inputs for the assets or liabilities, and include situations where there is little, if any, market activity for the assets or liabilities.
Management uses appropriate valuation techniques based on the available inputs to measure the fair values of PEMEX’s applicable assets and liabilities.
When available, PEMEX measures fair value using Level 1 inputs, because they generally provide the most reliable evidence of fair value.
The following tables present information about PEMEX’s financial assets and liabilities measured at fair value, and indicate the fair value hierarchy of the inputs utilized to determine the fair values as of December 31, 2016 and 2015.
| | | | | | | | | | | | | | | | |
| | | Fair value hierarchy | | | Total as of
2016 | |
| | | Level 1 | | | Level 2 | | | Level 3 | | |
Assets: | | | | | | | | | | | | | | | | |
Derivative financial instruments | | Ps. | — | | | Ps. | 4,857,470 | | | Ps. | — | | | Ps. | 4,857,470 | |
Available-for-sale financial assets | | | 6,463,096 | | | | — | | | | — | | | | 6,463,096 | |
Permanent investments in associates and other | | | | | | | | | | | 23,154,632 | | | | 23,154,632 | |
| | | | |
Liabilities: | | | | | | | | | | | | | | | | |
Derivative financial instruments | | | — | | | | (30,867,956 | ) | | | — | | | | (30,867,956) | |
| | | | |
| | | | | | | | | | | | Total as of
2015 | |
Assets: | | | | | | | | | | | | | | | | |
Derivative financial instruments | | Ps. | — | | | Ps. | 1,601,106 | | | Ps. | — | | | Ps. | 1,601,106 | |
Available-for-sale financial assets | | | 3,944,696 | | | | — | | | | — | | | | 3,944,696 | |
Permanent investments in associates and other | | | | | | | | | | | 24,165,599 | | | | 24,165,599 | |
| | | | |
Liabilities: | | | | | | | | | | | | | | | | |
Derivative financial instruments | | | — | | | | (27,300,687 | ) | | | — | | | | (27,300,687) | |
When market quotes are not available to measure the fair value of PEMEX’s DFIs, PEMEX uses Level 2 inputs to calculate the fair value based on quotes from major market sources. These market quotes are then adjusted internally using standard market pricing models for interest rate, currency, equity and commodities derivatives.
F-100
PETRÓLEOS MEXICANOS, PRODUCTIVE STATE-OWNED SUBSIDIARIES
AND SUBSIDIARY COMPANIES
NOTES TO THE CONSOLIDATED FINANCIAL STATEMENTS
FOR THE YEARS ENDED DECEMBER 31, 2016, 2015 AND 2014
(FIGURES STATED IN THOUSANDS, EXCEPT AS NOTED)
The following table shows the carrying value and the estimated fair value of the remaining financial assets and liabilities, which are not valued at fair value, as of December 31, 2016 and 2015:
| | | | | | | | | | | | | | | | |
| | | Carrying value | | | Fair value | | | Carrying value | | | Fair value | |
Assets: | | | | | | | | | | | | | | | | |
Cash and cash equivalents | | Ps. | 163,532,513 | | | Ps. | 163,532,513 | | | Ps. | 109,368,880 | | | Ps. | 109,368,880 | |
Accounts receivable, net | | | 133,220,527 | | | | 133,220,527 | | | | 79,245,821 | | | | 79,245,821 | |
Long-term notes receivable | | | 148,607,602 | | | | 148,607,602 | | | | 50,000,000 | | | | 50,000,000 | |
| | | | |
Liabilities: | | | | | | | | | | | | | | | | |
Suppliers | | | 151,649,540 | | | | 151,649,540 | | | | 167,314,243 | | | | 167,314,243 | |
Accounts and accrued expenses payable | | | 18,666,607 | | | | 18,666,607 | | | | 13,237,407 | | | | 13,237,407 | |
Short-term debt and current portion of long-term debt | | | 176,166,188 | | | | 176,166,188 | | | | 192,508,668 | | | | 192,508,668 | |
Long-term debt | | | 1,807,004,542 | | | | 1,812,109,426 | | | | 1,300,873,167 | | | | 1,265,519,157 | |
The fair values of the financial current assets and current liabilities presented in the table above are included for informational purposes.
The fair values of current financial assets and short-term liabilities are equal to their nominal values because, due to their short-term maturities, their nominal values are very close to their corresponding fair values.
The fair value of long-term debt is estimated using quotes from major market sources which are then adjusted internally using standard market pricing models. As a result of relevant assumptions, estimated fair values do not necessarily represent the actual terms at which existing transactions could be liquidated or unwound.
The information related to “Cash and cash equivalents”, “Accounts receivable, net”,“Available-for-sale financial assets”, “Permanent investments in associates”, “Long-term notes receivable” and “Debt” is described in the following notes, respectively:
| | • | | Note 6, Cash, Cash Equivalents and Restricted Cash; |
| | • | | Note 7, Accounts Receivable, Net; |
| | • | | Note 10,Available-for-Sale Financial Assets; |
| | • | | Note 11, Permanent Investments in Associates; |
| | • | | Note 14, Long-term Notes Receivable and other; and |
NOTE 17. EMPLOYEE BENEFITS
Until December 31, 2015, Petróleos Mexicanos and Subsidiary Entities only had defined benefit pension plans for the retirement of its employees, to which only Petróleos Mexicanos and Subsidiary Entities contributes. As of January 1, 2016, Petróleos Mexicanos and Subsidiary Entities also has a defined contribution pension plan, in which both Petróleos Mexicanos and Subsidiary Entities and the employee contribute to an employee’s individual account.
F-101
PETRÓLEOS MEXICANOS, PRODUCTIVE STATE-OWNED SUBSIDIARIES
AND SUBSIDIARY COMPANIES
NOTES TO THE CONSOLIDATED FINANCIAL STATEMENTS
FOR THE YEARS ENDED DECEMBER 31, 2016, 2015 AND 2014
(FIGURES STATED IN THOUSANDS, EXCEPT AS NOTED)
Benefits under the defined benefit plan are mainly based off of years of service completed by the employee, and their remuneration at the date of retirement. The obligations and costs of these plans are recognized based on an actuarial valuation prepared by independent experts. Within the regulatory framework of plan assets, there are no minimum funding requirements. Petróleos Mexicanos and the Subsidiary Entities have established additional plans to cover post-employment benefits, which are based on actuarial studies prepared by independent experts and which include disability, post-mortem pension and the death of retired employees.
As of December 31, 2016, Petróleos Mexicanos and Subsidiary Entities funded its employees benefits through Mexican trusts, the resources of which come from the retirement line item of PEMEX’s annual budget (an operating expense), or any other line item that substitutes or relates to this line item, or that is associated to the same line item and the interests, dividends or capital gains obtained from the investments of the trusts.
The following table show the amounts associated with PEMEX’s labor obligations:
| | | | | | | | |
| | | December 31, | |
| | | 2016 | | | 2015 | |
Defined Benefits Liabilities | | | | | | | | |
Liability for defined benefits at retirement and post-employment at the end of the year | | Ps. | 1,202,624,665 | | | Ps. | 1,258,480,019 | |
Liability for other long-term benefits | | | 17,784,771 | | | | 20,905,422 | |
| | | | | | | | |
Total liability for defined benefits recognized in the consolidated statement of financial position at the end of the year | | Ps. | 1,220,409,436 | | | Ps. | 1,279,385,441 | |
| | | | | | | | |
The following tables contain detailed information regarding PEMEX’s retirement and post-employment benefits:
| | | | | | | | |
| | | December 31, | |
| | | 2016 | | | 2015 | |
Changes in the liability for defined benefits | | | | | | | | |
Liability for defined benefits at the beginning of the year | | Ps. | 1,258,480,019 | | | Ps. | 1,455,240,835 | |
Recognition of the modifications in plan pensions | | | (571,713 | ) | | | (198,951,179 | ) |
Current Service cost | | | 23,111,918 | | | | 34,680,772 | |
Net interest | | | 90,527,624 | | | | 99,671,447 | |
Past service costs | | | (33,244 | ) | | | | |
Defined benefits paid by the fund | | | (4,892,767 | ) | | | (4,291,090 | ) |
Actuarial (gains) losses in other comprehensive results due to: | | | | | | | | |
Change in financial assumptions | | | (149,533,263 | ) | | | (54,415,586 | ) |
Change in demographic assumptions | | | 4,842,109 | | | | (46,507,299 | ) |
For experience during the year | | | 36,103,857 | | | | 21,875,522 | |
In plan assets during the year | | | 285,123 | | | | 366,511 | |
Effect of Adoption in subsidiary | | | (1,742 | ) | | | | |
Contributions paid to the fund | | | (55,693,256 | ) | | | (49,189,914 | ) |
| | | | | | | | |
Defined benefit liabilities at end of year | | Ps. | 1,202,624,665 | | | Ps. | 1,258,480,019 | |
| | | | | | | | |
F-102
PETRÓLEOS MEXICANOS, PRODUCTIVE STATE-OWNED SUBSIDIARIES
AND SUBSIDIARY COMPANIES
NOTES TO THE CONSOLIDATED FINANCIAL STATEMENTS
FOR THE YEARS ENDED DECEMBER 31, 2016, 2015 AND 2014
(FIGURES STATED IN THOUSANDS, EXCEPT AS NOTED)
In 2016 and 2015, the net actuarial gains recognized in other comprehensive income net of income deferred tax of Ps. (106,387,640) and Ps.(78,680,852), respectively, related to retirement and post-employment benefits, not including the normalyear-to-year increase in obligations based on changes in population, age, seniority, wages, pensions and benefits, mainly due to the increase in the discount and expected return on plan assets rates, from 7.41% in 2015 to 8.17% in 2016.
| | | | | | | | |
| | | December 31, | |
| | | 2016 | | | 2015 | |
Changes in pension plan assets | | | | | | | | |
Plan assets at the beginning of year | | Ps. | 5,228,909 | | | Ps. | 2,993,244 | |
Expected return on plan assets | | | 742,477 | | | | 340,335 | |
Payments by the pension fund | | | (51,889,821 | ) | | | (46,843,824 | ) |
Company contributions to the fund | | | 55,693,256 | | | | 49,189,912 | |
Actuarial (gains) losses in plan assets | | | (285,155 | ) | | | (450,758 | ) |
| | | | | | | | |
Pension plan assets at the end of year | | Ps. | 9,489,666 | | | Ps. | 5,228,909 | |
| | | | | | | | |
PEMEX’s plan assets are held in two trusts, the FOLAPE and the FICOLAVI, which are managed by BBVA Bancomer, S. A. and a technical committee for each trust that is comprised of personnel from Petróleos Mexicanos and the trusts.
The expected contribution to the fund for 2017 amounts to Ps. 53,387,230 and the expected payments for 2017 is Ps. 60,851,407.
As of December 31, 2016 and 2015, the amounts and types of plan assets are as follows:
| | | | | | | | |
Plan Assets | | 2016 | | | 2015 | |
Cash and cash equivalents | | Ps. | 5,906,660 | | | Ps. | 343,488 | |
Available-for-sale financial assets | | | 2,694,291 | | | | 4,061,655 | |
Debt instruments | | | 888,715 | | | | 823,766 | |
| | | | | | | | |
Total plan assets | | Ps. | 9,489,666 | | | Ps. | 5,228,909 | |
| | | | | | | | |
F-103
PETRÓLEOS MEXICANOS, PRODUCTIVE STATE-OWNED SUBSIDIARIES
AND SUBSIDIARY COMPANIES
NOTES TO THE CONSOLIDATED FINANCIAL STATEMENTS
FOR THE YEARS ENDED DECEMBER 31, 2016, 2015 AND 2014
(FIGURES STATED IN THOUSANDS, EXCEPT AS NOTED)
| | | | | | | | |
| | | 2016 | | | 2015 | |
Changes in Defined Benefit Obligations (DBO) | | | | | | | | |
Defined benefit obligations at the beginning of the year | | Ps. | 1,263,708,928 | | | Ps. | 1,458,234,079 | |
Service costs | | | 23,107,851 | | | | 34,693,923 | |
Financing costs | | | 91,270,383 | | | | 100,049,689 | |
Past service costs | | | (33,244 | ) | | | (66,160 | ) |
Payments by the fund | | | (56,778,359 | ) | | | (51,134,915 | ) |
Amount of (gains) and losses recognized through other comprehensive income: | | | (108,589,515 | ) | | | (79,116,509 | ) |
Modifications to the pension plan | | | (571,713 | ) | | | (198,951,179 | ) |
| | | | | | | | |
Defined benefit obligations at the end of year | | Ps. | 1,212,114,331 | | | Ps. | 1,263,708,928 | |
| | | | | | | | |
The asset ceiling test was not applied because there was a deficit of labor liabilities at the beginning and end of the year.
The effect of an increase or decrease of one percentage point in the assumed variation rate is a-12.27% increase or a 15.53% decrease in defined benefit obligations.
The effect of an increase or decrease of one percentage point in the assumed variation rate with respect to the cost and obligations related to medical services point is a 22.75% increase or a-17.38% decrease in defined benefit obligations.
Assumptions regarding future mortality are based on EMSSA2009 to Unique Circular of theComisión Nacional de Seguros y Fianzas (National Commission of Insurance and Bonds) and include changes to the mortality rate established in 2016.
The following tables present additional fair value disclosure about plan assets and indicate their rank, in accordance with IFRS 13, as of December 31, 2016 and 2015:
| | | | | | | | | | | | | | | | |
| | | Fair value measurements | |
Plan Assets | | Quoted prices
in active
markets for
identical
assets (level 1) | | | Significant
observable
inputs
(level 2) | | | Significant
unobservable
inputs (level 3) | | | Total | |
Cash and cash equivalents | | Ps. | 5,906,660 | | | Ps. | — | | | Ps. | — | | | Ps. | 5,906,660 | |
Available—for—sale financial assets | | | 2,694,291 | | | | — | | | | — | | | | 2,694,291 | |
Debt instruments | | | 888,715 | | | | — | | | | — | | | | 888,715 | |
| | | | | | | | | | | | | | | | |
Total | | Ps. | 9,489,666 | | | Ps. | — | | | Ps. | — | | | Ps. | 9,489,666 | |
| | | | | | | | | | | | | | | | |
F-104
PETRÓLEOS MEXICANOS, PRODUCTIVE STATE-OWNED SUBSIDIARIES
AND SUBSIDIARY COMPANIES
NOTES TO THE CONSOLIDATED FINANCIAL STATEMENTS
FOR THE YEARS ENDED DECEMBER 31, 2016, 2015 AND 2014
(FIGURES STATED IN THOUSANDS, EXCEPT AS NOTED)
| | | | | | | | | | | | | | | | |
| | | Fair value measurements | |
Plan Assets | | Quoted prices
in active
markets for
identical
assets (level 1) | | | Significant
observable
inputs
(level 2) | | | Significant
unobservable
inputs (level 3) | | | Total | |
Cash and cash equivalents | | Ps. | 343,488 | | | Ps. | — | | | Ps. | — | | | Ps. | 343,488 | |
Available—for—sale financial assets | | | 4,061,655 | | | | — | | | | — | | | | 4,061,655 | |
Debt instruments | | | 823,766 | | | | — | | | | — | | | | 823,766 | |
| | | | | | | | | | | | | | | | |
Total | | Ps. | 5,228,909 | | | Ps. | — | | | Ps. | — | | | Ps. | 5,228,909 | |
| | | | | | | | | | | | | | | | |
As of December 31, 2016 and 2015, the principal actuarial assumptions used in determining the defined benefit obligation for the plans are as follows:
| | | | | | | | |
| | | 2016 | | | 2015 | |
Rate of increase in salaries | | | 4.77 | % | | | 5.00 | % |
Rate of increase in pensions | | | 3.75 | % | | | 3.75 | % |
Rate of increase in medical services | | | 7.65 | % | | | 7.65 | % |
Inflation assumption | | | 3.75 | % | | | 3.75 | % |
Discount and expected return on plan assets rate | | | 8.17 | % | | | 7.41 | % |
Average length of obligation (years) | | | 17.67 | | | | 19.31 | |
In accordance with IAS 19, the discount rate used is determined by considering the government zero coupon curve generated from the Bonds M and Cetes, as well as the flow of payments expected to cover contingent liabilities.
Other long-term benefits
Petróleos Mexicanos and Subsidiary Entities has established other long-term benefit plans for its employees, to which employees do not contribute, which correspond to the seniority premiums payable for disability, death and survivors benefits (payable to the widow and beneficiaries of worker), medical service, gas and basic basket for beneficiaries. Benefits under these plans are based on an employee’s salary and years of service completed at separation date. Obligations and costs of such plans are recorded in accordance with actuarial valuations performed by independent actuaries.
The amounts recognized for long-term obligations for the years ended December 31, 2016 and 2015 are as follows:
| | | | | | | | |
| | | 2016 | | | 2015 | |
Change in the liability for defined benefits | | | | | | | | |
Liabilities defined benefit at the beginning of year | | | Ps.20,905,422 | | | | Ps.18,847,693 | |
Charge to income for the year | | | 3,420,158 | | | | 5,818,221 | |
Actuarial (gains) losses recognized in income due to: | | | | | | | | |
Change in financial assumptions | | | (3,028,211 | ) | | | (1,746,245 | ) |
Change in demographic assumptions | | | (119,982 | ) | | | (40,831 | ) |
For experience during the year | | | (3,390,396 | ) | | | (1,973,416 | ) |
Benefits paid | | | (2,220 | ) | | | — | |
| | | | | | | | |
Liabilities defined benefit at the end of year | | | Ps.17,784,771 | | | | Ps.20,905,422 | |
| | | | | | | | |
F-105
PETRÓLEOS MEXICANOS, PRODUCTIVE STATE-OWNED SUBSIDIARIES
AND SUBSIDIARY COMPANIES
NOTES TO THE CONSOLIDATED FINANCIAL STATEMENTS
FOR THE YEARS ENDED DECEMBER 31, 2016, 2015 AND 2014
(FIGURES STATED IN THOUSANDS, EXCEPT AS NOTED)
The principal actuarial assumptions used in determining the defined benefit obligation for the plans are as follows:
| | | | | | | | |
| | | 2016 | | | 2015 | |
Rate of increase in salaries | | | 4.77 | % | | | 5.00 | % |
Inflation assumption | | | 3.75 | % | | | 3.75 | % |
Discount and expected return on plan assets rate | | | 8.17 | % | | | 7.41 | % |
Average length of obligation (years) | | | 17.67 | | | | 19.31 | |
In accordance with IAS 19, the discount rate used is determined by considering the government zero coupon curve generated from the fixed rate bonds Mexican Government (“Bonds M”) and Cetes, as well as the flow of payments expected to cover contingent liabilities.
NOTE 18. PROVISIONS FOR SUNDRY CREDITORS
At December 31, 2016 and 2015, the provisions for sundry creditors and others is as follows:
| | | | | | | | |
| | | 2016 | | | 2015 | |
Provision for plugging of wells (Note 12) | | | Ps.64,967,710 | | | | Ps.56,894,695 | |
Provision for trails in process (Note 25) | | | 15,119,692 | | | | 12,775,263 | |
Provision for environmental costs | | | 8,230,476 | | | | 3,521,838 | |
| | | | | | | | |
| | | Ps.88,317,878 | | | | Ps.73,191,796 | |
| | | | | | | | |
The following tables show the allowance account for plugging of wells, trials in progress and environmental costs:
| | | | | | | | |
| | | Plugging of wells | |
| | | 2016 | | | 2015 | |
Balance at the beginning of the year | | | Ps.56,894,695 | | | | Ps.52,460,749 | |
Additions capitalized in fixed assets | | | (3,878,503 | ) | | | 5,067,782 | |
Discount rate against income | | | 11,968,966 | | | | (608,160 | ) |
Deductions | | | (17,448 | ) | | | (25,676 | ) |
| | | | | | | | |
Balance at the end of the year | | | Ps.64,967,710 | | | | Ps.56,894,695 | |
| | | | | | | | |
| | | | | | | | |
| | | Trials in progress | |
| | | 2016 | | | 2015 | |
Balance at the beginning of the year | | | Ps.12,775,263 | | | | Ps.19,787,440 | |
Additions against income | | | 3,049,202 | | | | 2,013,242 | |
Discount rate against income | | | (632,806 | ) | | | (2,608,494 | ) |
Deductions(1) | | | (71,967 | ) | | | (6,416,925 | ) |
| | | | | | | | |
Balance at the end of the year | | | Ps.15,119,692 | | | | Ps.12,775,263 | |
| | | | | | | | |
F-106
PETRÓLEOS MEXICANOS, PRODUCTIVE STATE-OWNED SUBSIDIARIES
AND SUBSIDIARY COMPANIES
NOTES TO THE CONSOLIDATED FINANCIAL STATEMENTS
FOR THE YEARS ENDED DECEMBER 31, 2016, 2015 AND 2014
(FIGURES STATED IN THOUSANDS, EXCEPT AS NOTED)
| | | | | | | | |
| | | Environmental costs | |
| | | 2016 | | | 2015 | |
Balance at the beginning of the year | | | Ps. 3,521,838 | | | | Ps. 6,174,754 | |
Additions against income | | | 6,118,454 | | | | 1,087,867 | |
Discount rate against income | | | (1,347,285 | ) | | | (3,622,807 | ) |
Deductions | | | (62,531 | ) | | | (117,976 | ) |
| | | | | | | | |
Balance at the end of the year(2) | | | Ps. 8,230,476 | | | | Ps. 3,521,838 | |
| | | | | | | | |
| | (1) | Deductions made during 2015 are the result of the agreement between PEMEX and Conproca achieved during the third quarter of 2015. |
| | (2) | PEMEX is subject to the provisions of theLey General del Equilibrio Ecológico y la Protección al Ambiente (General Law on Ecological Equilibrium and Environmental Protection). To comply with this law, environmental audits of PEMEX’s larger operating, storage and transportation facilities have been or are being conducted. Following the completion of such audits, PEMEX has signed various agreements with theProcuraduría Federal de Protección al Ambiente (Federal Attorney of Environmental Protection) to implement environmental remediation and improve environmental plans. Such plans contemplate remediation for environmental damages, as well as related investments for the improvement of equipment, maintenance, labor and materials. |
Provision for plugging of wells
PEMEX records a provision at present value for the future plugging cost of an oil production facility or pipeline at the time that it is built.
The plugging provision represents the present value of plugging costs related to oil and gas properties. These provisions have been created based on internal estimates of PEMEX. PEMEX has made certain assumptions based on the current economic environment that PEMEX believes provide a reasonable basis on which to estimate the future liability. These estimates are reviewed regularly to take into account any material changes in the assumptions. However, actual plugging costs in the long run will depend on future market prices for the necessary plugging work, which reflect market conditions at the time the work is being performed.
Moreover, the time of plugging depends on when the fields cease to have economically viable production rates, which, in turn, depends on the inherently uncertain future prices of oil and gas.
NOTE 19. DISCLOSURES OF CASH FLOW
The following items representnon-cash transactions and are presented for disclosure purposes:
| | | | | | | | | | | | |
| | | For the years ended December 31, | |
| | | 2016 | | | 2015 | | | 2014 | |
Investing activities | | | | | | | | | | | | |
Available-for-sale financial assets | | Ps. | 207,816 | | | Ps. | (3,206,316 | ) | | Ps. | (765,412 | ) |
Financing activities | | | | | | | | | | | | |
Employee benefits equity effect(i) | | | 106,277,761 | | | | 78,556,569 | | | | (275,962,370 | ) |
Net (benefits) cost of the year for employee benefits(i) | | | 109,738,416 | | | | (62,549,142 | ) | | | 121,723,328 | |
Financed Public Works Contracts | | | 146,217,292 | | | | 2,001,093 | | | | 3,207,947 | |
Currency translation effect | | | 21,386,902 | | | | 13,262,101 | | | | 11,379,657 | |
Accrued interest | | | 9,326,945 | | | | 4,816,784 | | | | 3,856,736 | |
| | (i) | Items that do not impact cash flows but that reflect the actuarial valuation at the end of the year. |
F-107
PETRÓLEOS MEXICANOS, PRODUCTIVE STATE-OWNED SUBSIDIARIES
AND SUBSIDIARY COMPANIES
NOTES TO THE CONSOLIDATED FINANCIAL STATEMENTS
FOR THE YEARS ENDED DECEMBER 31, 2016, 2015 AND 2014
(FIGURES STATED IN THOUSANDS, EXCEPT AS NOTED)
NOTE 20. INCOME TAXES AND FEDERAL DUTIES
The Hydrocarbons Revenue law and the Federal Revenue Law were published in the Official Gazette of the Federation on August 11, 2014 and November 13, 2014, respectively, and came into effect, in each case, on January 1, 2015. TheLey de Ingresos sobre Hidrocarburos (Hydrocarbons Revenue Law) and the Federal Revenue Law for fiscal year 2015 comprise the fiscal regime applicable to PEMEX for fiscal year 2015. The new fiscal regime applicable to Petróleos Mexicanos applicable to the assignments and the contracts were established on such date.
Tax regime applicable to Assignments
The fiscal regime applicable to the exploration and production for the assignments granted to PEMEX by the Mexican Government contemplates the following taxes and duties:
| a. | Derecho por la Utilidad Compartida “DUC” (Profit-sharing Duty). |
As of January 1, 2015, Pemex Exploration and Production is obligated to pay a Profit-sharing Duty.
As of January 1, 2016 and 2015, the applicable rate of this duty was 68.75% and 70% respectively. The computation of this duty is based on the excess of the value of hydrocarbons produced during the fiscal year (including self-consumption, shrinkage and burning), minus certain permitted deductions by the Hydrocarbons Revenue Law, including part of the investments and some costs, expenses and duties. Pursuant to the Hydrocarbons Revenue Law, this duty decreases on an annual basis. As of January 1, 2019, this duty will be set at 65%.
During 2016, this duty totaled Ps. 304,299,019 from annual payments presented on April 3, 2017 paid as follows: Ps. 301,050,325, in monthly installment payments and a payable balance amounting to Ps. 3,248,694.
During 2015 this duty totaled Ps. 375,990,409, paid as follows: Ps. 266,136,000 in monthly advance payments, Ps. 85,234,004 in monthly installment payments and a payable balance amounting to Ps. 24,620,405 as of December 31, 2015.
The accounting result differs from the tax result mainly due to differences in depreciation,non-deductible expenses and others. Such differences generate a defered DUC.
F-108
PETRÓLEOS MEXICANOS, PRODUCTIVE STATE-OWNED SUBSIDIARIES
AND SUBSIDIARY COMPANIES
NOTES TO THE CONSOLIDATED FINANCIAL STATEMENTS
FOR THE YEARS ENDED DECEMBER 31, 2016, 2015 AND 2014
(FIGURES STATED IN THOUSANDS, EXCEPT AS NOTED)
The principal factors generating the deferred DUC are the following:
| | | | | | | | |
| | | 2016 | | | 2015 | |
Deferred DUC asset: | | | | | | | | |
Provisions | | Ps. | 570,544,863 | | | Ps. | 34,632,301 | |
| | | | | | | | |
Total deferred DUC asset | | | 570,544,863 | | | | 34,632,301 | |
| | | | | | | | |
Deferred Profit-sharing duty liability: | | | | | | | | |
Wells, pipelines, properties, plant and equipment | | | (473,406,721 | ) | | | (29,231,976 | ) |
| | | | | | | | |
Deferred DUC liability | | | (473,406,721 | ) | | | (29,231,976 | ) |
| | | | | | | | |
Deferret asset net | | | 97,138,142 | | | | 5,400,325 | |
Valuation reserve(1) | | | (69,486,571 | ) | | | (5,400,325 | ) |
| | | | | | | | |
Net, deferred DUC asset | | Ps. | 27,651,571 | | | Ps. | — | |
| | | | | | | | |
| | (1) | PEMEX added to its valuation reserve since it estimates that some allowed deductions will not materialize in future years. |
The expected benefit for DUC is different from that which would result from applying the 65% rate to the tax base, as a result of the items mentioned below:
| | | | | | | | |
| | | 2016 | | | 2015 | |
Expected expense: | | Ps. | 159,897,683 | | | Ps. | 200,925,491 | |
Increase (decrease) resulting from: | | | | | | | | |
Non-cumulative profit | | | (423,761,673 | ) | | | 483,449,494 | |
Non-deductible expenses | | | 263,863,990 | | | | (684,374,984 | ) |
Production value | | | 441,655,000 | | | | 483,916,169 | |
Deductible duties | | | (29,918,201 | ) | | | (34,200,348 | ) |
Deductions cap | | | (107,437,780 | ) | | | (73,033,117 | ) |
| | | | | | | | |
DUC-Profit-sharing duty expense | | Ps. | 304,299,019 | | | Ps. | 376,682,705 | |
| | | | | | | | |
On April 18, 2016, a decree granting a fiscal benefit to Pemex Exploration and Production (assignee) was published in the Official Gazette of the Federation and increases the limit on the amount Pemex Exploration and Production can deduct for costs, expenses and investments in the calculation of its DUC, for terrestrial areas or in maritime areas with water depths lower than 500 meters. The benefit was granted to further the Mexican Government’s strategic hydrocarbon exploration and extraction activities through assignments, in light of historically low international hydrocarbons prices in late 2015 and early 2016 combined with a historically low oil production platform in Mexico, thereby, together with other actions avoiding that the worldwide economic conditions had affected the national economy. The benefit obtained was Ps. 40,213,913. Additionally, the Mexican Government granted PEMEX a fiscal support on November 16, by Ps. 28,439,379. This benefit consisted in a tax credit against the DUC as a measure to mitigate the impact generated in the financial environment of the Mexican hydrocarbons exploration and extraction companies (assignees), as international energy prices continued to be depressed, generating effects on the economies of several countries, including Mexico.
F-109
PETRÓLEOS MEXICANOS, PRODUCTIVE STATE-OWNED SUBSIDIARIES
AND SUBSIDIARY COMPANIES
NOTES TO THE CONSOLIDATED FINANCIAL STATEMENTS
FOR THE YEARS ENDED DECEMBER 31, 2016, 2015 AND 2014
(FIGURES STATED IN THOUSANDS, EXCEPT AS NOTED)
| b. | Derecho de Extracción de Hidrocarburos (Hydrocarbons Extraction Duty). |
This duty is to be calculated based on a rate based on a formula applicable to each type of hydrocarbon, the volume of production and utilizing the relevant market price for hydrocarbons in U.S. Dollars.
During 2016 Pemex Exploration and Production made payments of Ps.43,517,383.
| c. | Derecho de Exploración de Hidrocarburos (Exploration Hydrocarbons Duty). |
The Mexican Government is entitled to collect a monthly payment of Ps. 1,175.42 per square kilometer ofnon-producing areas. After 60 months, this tax increases to Ps. 2,810.78 per square kilometer for each additional month that the area is not producing. These amounts will be updated on an annual basis in accordance with the national consumer price index.
During 2016, Pemex Exploration and Production made payments under this duty, totaling Ps. 962,740.
| d. | Impuesto por la actividad de Exploración y Extracción de Hidrocarburos (Exploration and Extraction Hydrocarbons Duty). |
The assignments granted by the Mexican Government create a tax on the exploration and extraction activities carried out in the corresponding area. The monthly tax paid during the exploration phase and until the extraction phase begins is 1,533.15 pesos per square kilometer. During the extraction phase, the monthly tax from the start of the extraction phase and until the assignment ends is 6,132.60 pesos per square kilometer. During 2016 payments for this tax amounted Ps. 3,944,738.
Tax Regime applicable to contracts:
As of January 1, 2015, the tax regime applicable to Pemex Exploration and Production for contracts is set forth in the Hydrocarbons Revenue law which regulates, among other things, the fiscal terms applicable to the exploration and extraction contracts (license, profit sharing contracts, production sharing and services) and sets duties and other taxes paid to the Mexican Government.
The Hydrocarbons Revenue Law also establishes the following duties applicable to PEMEX in connection with assignments granted to it by the Mexican Government:
| | • | | Cuota Contractual para la Fase Exploratoria (Exploration Phase Contractual Fee) |
During the exploration phase of an exploration and extraction contract, the Mexican Government is entitled to collect a monthly payment of 1,175.42 pesos per square kilometer ofnon-producing areas. After 60 months, this fee increases to 2,810.78 pesos per square kilometer for each additional month that the area is not producing. The fee amount will be updated on an annual basis in accordance with the national consumer price index. PEMEX did not trigger this fee in 2016.
Royalty payments to the Mexican Government are determined based on the “contractual value” of the relevant hydrocarbons, which is based on a variety of factors, including the type of underlying hydrocarbons (e.g., crude oil, associated natural gas,non-associated natural gas or condensates), the
F-110
PETRÓLEOS MEXICANOS, PRODUCTIVE STATE-OWNED SUBSIDIARIES
AND SUBSIDIARY COMPANIES
NOTES TO THE CONSOLIDATED FINANCIAL STATEMENTS
FOR THE YEARS ENDED DECEMBER 31, 2016, 2015 AND 2014
(FIGURES STATED IN THOUSANDS, EXCEPT AS NOTED)
volume of production and the market price. Royalties are payable in connection with licensing contracts, production-sharing contracts and profit-sharing contracts. PEMEX did not trigger this royalty payment in 2016.
| | • | | Pago del Valor Contractual (Contractual Value Payment) |
Licensing contracts require a payment to the Mexican Governement calculated as a percentage of the “contractual value” of the hydrocarbons produced, as determined by the SHCP on acontract-by-contract basis. PEMEX did not trigger this contractual value payment in 2016.
| | • | | Porcentaje a la Utilidad Operativa (Operating Profit Payment) |
Production-sharing contracts and profit-sharing contracts require a payment equivalent to a specified percentage of operating profits. In the case of production-sharing contracts, this payment shall be madein-kind through delivery of the hydrocarbons produced. In the case of profit-sharing contracts, this payment shall be made in cash. PEMEX did not trigger this type of payment in 2016.
| | • | | Bono a la Firma (Signing Bonus) |
Upon execution of a licensing contract, a signing bonus is to be paid to the Mexican Government in an amount specified by the SHCP in the relevant bidding terms and conditions or in the contracts resulting from a migration. PEMEX did not trigger this signing bonus in 2016.
| | • | | Impuesto por la actividad de Exploración y Extracción de Hidrocarburos (Hydrocarbons Exploration and Extraction Activities Tax) |
Contracts for exploration and extraction granted by the Mexican Government will include a specified tax on the exploration and extraction activities carried out in the relevant area. A monthly tax of 1,533.15 pesos per square kilometer is payable during the exploration phase until the extraction phase begins. During the extraction phase of a project, a monthly tax of 6,132.6 pesos per square kilometer is payable from the starting date until the relevant contract for exploration and extraction is terminated.
Other applicable taxes
Beginning with the creation of the Subsidiary Entities during 2015, they became subject to the Income Tax Law and the Value Added Tax Law. Pemex Industrial Transformation is also subject to the Special Tax on Production and Services (IEPS Tax).
2016 indirect taxes are below mentioned:
IEPS Tax on the sale of automotive fuels: This is a tax imposed on domestic sales of automotive fuels, including gasoline and diesel, which Pemex Industrial Transformation collects on behalf of the Mexican Government. The applicable quotas for 2016 were: 4.16 pesos per liter of Magna gasoline; 3.52 pesos per liter of Premium gasoline and 4.58 pesos per liter of diesel. This fee is updated annually according to inflation and adjusted monthly by the tax authorities.
IEPS Tax to benefit Mexican states and municipalities: This tax is a quota on domestic sales of automotive fuels, including gasoline and diesel, which Pemex Industrial Transformation collects on behalf of the Mexican
F-111
PETRÓLEOS MEXICANOS, PRODUCTIVE STATE-OWNED SUBSIDIARIES
AND SUBSIDIARY COMPANIES
NOTES TO THE CONSOLIDATED FINANCIAL STATEMENTS
FOR THE YEARS ENDED DECEMBER 31, 2016, 2015 AND 2014
(FIGURES STATED IN THOUSANDS, EXCEPT AS NOTED)
Government. The applicable quotas for 2016 were 36.68 cents per liter of Magna gasoline, 44.75 cents per liter of premium gasoline and 30.44 cents per liter of diesel. This rate is updated annually with inflation. The funds raised by this quota are allocated to the states and municipalities as provided in the Tax Coordination Law.
IEPS Tax on Fossil Fuels: This tax is a quota on the internal sales of fossil fuels, which Pemex Industrial Transformation collects on behalf of the Mexican Government. The applicable quotas for 2016 were 6.29 cents per liter for propane, 8.15 cents per liter for butane, 11.05 cents per liter for jet and other fuel, 13.20 cents per liter for turbosine and other kerosene, 13.40 cents per liter for diesel, 14.31 cents per liter for fuel oil and Ps. 16.60 per ton for petroleum coke. This share increases annually according to inflation.
For VAT purposes, final monthly payments are determined based on PEMEX’s cash flow, in accordance with the provisions of the Value Added Tax Law, applicable to payers of this tax.
The VAT is caused by the sales of goods, rendering of services, granting of the temporary use of goods in the national territory and by the importation of goods and services to the national territory. VAT taxpayers transfer VAT to their customers and are entitled to credit the VAT paid to their suppliers and on their imports. The net balance between VAT transferred to customers and paid to suppliers and on imports results each month in the VAT to be paid to the tax authorities or in an amount in favor of the taxpayer. The taxpayer has the right to credit VAT in favor against VAT payable in future months, to request a refund or to offset it against other payable federal taxes.
Taxes on Income are described below:
As of January 1, 2015, Petróleos Mexicanos, Subsidiary Entities and the subsidiary companies residing in Mexico for tax purposes are subject to the Income Tax Law.
This tax is calculated by applying a rate of 30% to the tax result. Tax result is the excess of total revenues over the allowed deductions and tax losses from previous years.
Accounting income differs from taxable income primarily due to the effects of inflation and differences between depreciation and othernon-deductible expenses.
For the years ended December 31, 2016, 2015 and 2014, Petroleos Mexicanos and its Subsidiary Companies incurred the following income tax expense (benefit):
| | | | | | | | | | | | |
| | | 2016 | | | 2015 | | | 2014 | |
Current income tax | | Ps. | 6,201,842 | | | Ps. | 7,426,892 | | | Ps. | 4,673,476 | |
Deferred income tax | | | (18,842,211 | ) | | | (53,014,159 | ) | | | (775,506 | ) |
| | | | | | | | | | | | |
Total(1) | | Ps. | (12,640,369 | ) | | Ps. | (45,587,267 | ) | | Ps. | 3,897,970 | |
| | | | | | | | | | | | |
| | (1) | As a result of the repeal of the IRP, Petróleos Mexicanos recognized these amounts in the statement of comprehensive income for the year ended December 31, 2014. |
F-112
PETRÓLEOS MEXICANOS, PRODUCTIVE STATE-OWNED SUBSIDIARIES
AND SUBSIDIARY COMPANIES
NOTES TO THE CONSOLIDATED FINANCIAL STATEMENTS
FOR THE YEARS ENDED DECEMBER 31, 2016, 2015 AND 2014
(FIGURES STATED IN THOUSANDS, EXCEPT AS NOTED)
The principal factors generating the deferred income tax are the following:
| | | | | | | | |
| | | December 31, | |
| | | 2016 | | | 2015 | |
Deferred income tax asset: | | | | | | | | |
Provisions | | Ps. | 5,906,581 | | | Ps. | 25,414,822 | |
Employee benefits provision | | | 125,973,332 | | | | 247,834,882 | |
Advance payments from clients | | | 1,046,010 | | | | 1,015,357 | |
Accrued liabilities | | | 2,269,561 | | | | 1,514 | |
Non-recoverable accounts receivable | | | 778,179 | | | | 104,346 | |
Derivative financial instruments | | | 223,518 | | | | 22,506 | |
Wells, pipelines, properties and equipment | | | 458,273,897 | | | | 446,970,333 | |
Tax loss carryforwards(1) | | | 43,327,737 | | | | 14,894,231 | |
| | | | | | | | |
Total deferred income tax asset | | | 637,798,815 | | | | 736,257,991 | |
Valuation reserve(2) | | | (565,125,697 | ) | | | (681,357,607 | ) |
| | | | | | | | |
Net deferred income tax asset | | | 72,673,118 | | | | 54,900,384 | |
| | | | | | | | |
Deferred income tax liability: | | | | | | | | |
Wells, pipelines, properties plant and equipment | | | (3,632,294 | ) | | | (1,909,529 | ) |
Other | | | (502,242 | ) | | | (274,305 | ) |
| | | | | | | | |
Total deferred income tax liability | | | (4,134,536 | ) | | | (2,183,834 | ) |
| | | | | | | | |
Net long-term deferred income tax liability | | Ps. | 68,538,582 | | | Ps. | 52,716,550 | |
| | | | | | | | |
|
|
(1) Tax loss carryforwards expires in 2026. |
(2) Due to PEMEX’s estimate that not enough taxable income will be generated in future periods, a valuation reserve was recognized to account for the deferred income tax asset. |
Expense attributable to the profit (loss) from continuing operations before income taxes was different from that which would result from applying the 30% rate to profit, as a result of the items listed below:
| | | | | | | | | | | | |
| | | For the years ended December 31, | |
| | | 2016 | | | 2015 | | | 2014 | |
Expected income tax expense | | Ps. | (14,901,324 | ) | | Ps. | (3,089,241 | ) | | Ps. | 272,457 | |
Increase (decrease) resulting from: | | | | | | | | | | | | |
Tax effect ofinflation-net | | | 8,098,213 | | | | (1,618,327 | ) | | | 4,020,358 | |
Difference between accounting and tax depreciation | | | (1,765,183 | ) | | | (107,231 | ) | | | 1,116,630 | |
Non-deductible expenses | | | 1,558,120 | | | | (1,921,515 | ) | | | 2,437,778 | |
Others-net(1) | | | (5,630,195 | ) | | | (38,850,953 | ) | | | (3,949,253 | ) |
| | | | | | | | | | | | |
Income tax expense | | Ps. | (12,640,369 | ) | | Ps. | (45,587,267 | ) | | Ps. | 3,897,970 | |
| | | | | | | | | | | | |
| | (1) | As of December 31, 2016, the deferred tax effect of gains and losses from Petróleos Mexicanos and PMI CIM’s performance are presented in (loss) profit comprehensive income in the amounts of Ps. (1,914,534) and Ps. (109,879), respectively. As of December 31, 2015 and 2014, the deferred tax effect of PMI CIM’s performance was Ps. (124,285) and Ps. (51,720), respectively. |
F-113
PETRÓLEOS MEXICANOS, PRODUCTIVE STATE-OWNED SUBSIDIARIES
AND SUBSIDIARY COMPANIES
NOTES TO THE CONSOLIDATED FINANCIAL STATEMENTS
FOR THE YEARS ENDED DECEMBER 31, 2016, 2015 AND 2014
(FIGURES STATED IN THOUSANDS, EXCEPT AS NOTED)
| d. | Impuestos a los Rendimientos Petroletos (IRP) |
Until December 31, 2014, theImpuesto a los Rendimientos Petroleros (Hydrocarbons Income Tax or “IRP”) was applicable to Petróleos Mexicanos and its Subsidiary Entities other than Pemex-Exploration and Production, and was calculated by applying a 30% rate to the excess of total revenues minus authorized deductions, in accordance with the IRP Federal Income Tax Law.
For the years ended on December 31, 2014, PEMEX generated an IRP was as follows:
| | | | |
| | | 2014 | |
Current IRP | | Ps. | 5,086,841 | |
Deferred IRP(1) | | | (23,822,142 | ) |
| | | | |
Total IRP | | Ps. | (18,735,301 | ) |
| | | | |
| | (1) | As a result of the repeal of the IRP in 2015, Petróleos Mexicanos and its Productive Subsidiary and Companies wrote down in 2015 the Ps. 23,822,142 effect of the deferred IRP for 2014 and recognized deferred income taxes for Ps. 124,002 in the related statement of comprehensive income for the year ended December 31, 2014. |
The expense (benefit) attributable to the profit (loss) from continuing operations before IRP was different from that which would result from applying the 30% rate to profit, as can be seen below:
| | | | |
| | | December 31,
2014 | |
Expected IRP expense (benefit) | | Ps. | (5,065,075 | ) |
Increase (decrease) resulting from: | | | | |
Tax effect ofinflation-net | | | 4,182,641 | |
Deferred tax write down | | | (23,822,142 | ) |
Difference between accounting and tax depreciation | | | 1,116,630 | |
Non-taxable loss from Equity Participation | | | (3,129,801 | ) |
Non-deductible expenses | | | 5,367,726 | |
Other-net | | | 2,614,720 | |
| | | | |
IRP expense | | Ps. | (18,735,301 | ) |
| | | | |
NOTE 21. EQUITY (DEFICIT), NET
| a. | Certificates of Contribution “A” |
On January 19, 2015, the Mexican Government made an equity contribution of Ps. 10,000,000 to Petróleos Mexicanos in accordance with theLey Federal del Presupuesto y Responsabilidad Hacendaria (Federal Law of Budget and Fiscal Accountability).
On December 24, 2015, the Mexican Government, through the SHCP, issued anon-negotiable promissory note of Ps. 50,000,000 due December 31, 2050 for the assumption by the Mexican Government of the payment obligations related to pensions and retirement plans of Petróleos Mexicanos and its Subsidiary Entities (see Note 14).
F-114
PETRÓLEOS MEXICANOS, PRODUCTIVE STATE-OWNED SUBSIDIARIES
AND SUBSIDIARY COMPANIES
NOTES TO THE CONSOLIDATED FINANCIAL STATEMENTS
FOR THE YEARS ENDED DECEMBER 31, 2016, 2015 AND 2014
(FIGURES STATED IN THOUSANDS, EXCEPT AS NOTED)
On April 21, 2016, the Mexican Government made an equity contribution to Petróleos Mexicanos in the amount of Ps. 26,500,000 following the guidelines established in the Federal Budget and Fiscal Responsibility. This contribution was recognized as an increase in Certificates of Contribution “A.”
On August 3, 2016, the Mexican Government issued Ps. 184,230,586 in exchange for the Ps. 50,000,000non-negotiable promissory note issued to Petróleos Mexicanos on December 24, 2015, which was recognized as a Ps. 135,439,612 increase in equity. The Ps. 135,439,612 increase in equity was the result of the Ps. 184,230,586 value of the promissory notes as of June 29, 2016, minus the Ps. 50,000,000 promissory note received by Petróleos Mexicanos on December 24, 2015, plus a Ps. 1,209,026 increase in the discount value of the promissory notes from June 29, 2016 to August 15, 2016, the date on which Petróleos Mexicanos received the promissory notes.
The capitalization agreement between Petróleos Mexicanos and the Mexican Government states that the Certificates of Contribution “A” constitute permanent capital.
PEMEX’s permanent equity is as follows:
| | | | |
| | | Amount | |
Certificates of Contribution “A” as of December 31, 2014 | | | Ps. 134,604,835 | |
Increase in Certificates of Contribution “A” during 2015 | | | 60,000,000 | |
| | | | |
Certificates of Contribution “A” as of December 31, 2015 | | | 194,604,835 | |
Increase in Certificates of Contribution “A” during 2016 | | | 161,939,612 | |
| | | | |
Certificates of Contribution “A” as of December 31, 2016 | | | Ps. 356,544,447 | |
| | | | |
| b. | Mexican Government contributions |
As of December 31, 2016 and 2015 there were not operations in Mexican Government contibutions.
Under Mexican law, each of the Subsidiary Companies is required to allocate a certain percentage of its net income to a legal reserve fund until the fund reaches an amount equal to a certain percentage of each Subsidiary Company’s capital stock.
As of December 31, 2016 and 2015, there were no changes to the legal reserve.
| d. | Accumulated deficit from prior years |
PEMEX has recorded negative earnings in the past several years. However, theLey de Concursos Mercantiles (Commercial Bankruptcy Law of Mexico) is not applicable to Petróleos Mexicanos and the Subsidiary Entities. Furthermore, the financing agreements to which PEMEX is a party do not provide for financial covenants that would be breached or events of default that would be triggered as a consequence of negative equity (see Note2-a). The Mexican Government has focused its recent efforts on consolidating PEMEX’s institutional strategy, including the approval of amendments to the Mexican Constitution published as the Energy Reform Decree on December 20, 2013, which permit it greater autonomy in decision-making and enhanced operational viability (see Note 1).
F-115
PETRÓLEOS MEXICANOS, PRODUCTIVE STATE-OWNED SUBSIDIARIES
AND SUBSIDIARY COMPANIES
NOTES TO THE CONSOLIDATED FINANCIAL STATEMENTS
FOR THE YEARS ENDED DECEMBER 31, 2016, 2015 AND 2014
(FIGURES STATED IN THOUSANDS, EXCEPT AS NOTED)
| e. | Non-controlling interest |
Effective July 1, 2005, PEMEX entered into an option agreement with BNP Private Bank & Trust Cayman Limited; the option was not excercised and was terminated on July 20, 2015. On July 1, 2015, PEMEX also entered into a new option agreement with SML Trustees Limited to acquire 100% of the shares of Pemex Finance, Ltd, which allows PEMEX to have control over Pemex Finance Ltd. because of the potential voting rights. As of the date of these consolidated financial statements the option agreement has not been exercised. As a result, the financial results of Pemex Finance, Ltd. are included in these consolidated financial statements of PEMEX. Under IFRS, variations in income and equity from Pemex Finance, Ltd. are presented in the consolidated statements of changes in equity (deficit), net as“non-controlling interest,” and as net income and comprehensive income for the year, attributable tonon-controlling interest, in the consolidated statements of comprehensive income, due to the fact that PEMEX does not currently own any of the shares of Pemex Finance, Ltd.
Similarly, because PEMEX does not currently own all of the shares of PMI CIM, HJ BARRERAS and COMESA, variations in income and equity from these entities are also presented in the consolidated statements of changes in equity (deficit) as“non-controlling interest.”
As of December 31, 2016 and 2015,non-controlling interest represented gains of Ps. 976,705 and Ps. 253,278, respectively, in PEMEX’s equity (deficit).
F-116
PETRÓLEOS MEXICANOS, PRODUCTIVE STATE-OWNED SUBSIDIARIES
AND SUBSIDIARY COMPANIES
NOTES TO THE CONSOLIDATED FINANCIAL STATEMENTS
FOR THE YEARS ENDED DECEMBER 31, 2016, 2015 AND 2014
(FIGURES STATED IN THOUSANDS, EXCEPT AS NOTED)
NOTE 22. OTHER REVENUES ANDEXPENSES-NET
Other revenues and expenses—net for each of the years ended December 31, 2016, 2015 and 2014, was as follows:
| | | | | | | | | | | | |
| | | 2016 | | | 2015 | | | 2014 | |
Revenues: | | | | | | | | | | | | |
Fiscal support (Profit-sharing duty) (see Note 20 a.) | | Ps. | 28,439,379 | | | Ps. | — | | | Ps. | — | |
Price of sale share (see Note11-iv) | | | 22,684,736 | | | | — | | | | — | |
Assets value transferred to CENAGAS (see Note9-a) | | | 7,450,931 | | | | — | | | | — | |
Other income for services | | | 4,266,854 | | | | 3,953,888 | | | | 1,607,273 | |
Gain on sale of fixed assets | | | 2,687,652 | | | | | | | | | |
Provisions | | | 1,240,222 | | | | 3,657,465 | | | | 969,850 | |
Other | | | 12,988,579 | | | | 3,335,489 | | | | 4,364,756 | |
Negative IEPS | | | — | | | | 2,519,126 | | | | 43,108,707 | |
Claims recovery | | | 3,695,217 | | | | 1,975,281 | | | | 780,509 | |
Bidding terms, sanctions, penalties and other | | | 3,223,437 | | | | 1,262,458 | | | | 3,031,159 | |
Franchise fees | | | 1,059,333 | | | | 1,148,528 | | | | 1,055,753 | |
| | | | | | | | | | | | |
Total other revenues | | | 87,736,340 | | | | 17,852,235 | | | | 54,918,007 | |
| | | | | | | | | | | | |
Expenses: | | | | | | | | | | | | |
Loss in the Assets value transferred to CENAGAS (see Note9-a) | | | (35,333,411 | ) | | | — | | | | — | |
Transportation and distribution of natural gas | | | (8,830,967 | ) | | | (369,317 | ) | | | — | |
Loss in the sale of associates (see Note11-iv) | | | (7,473,698 | ) | | | — | | | | — | |
Claims | | | (4,757,116 | ) | | | (12,527,548 | ) | | | (5,885,828 | ) |
Impairment of goodwill | | | (4,007,018 | ) | | | | | | | | |
Disposal of assets | | | (2,140,943 | ) | | | (3,364,063 | ) | | | (1,778,641 | ) |
Services provided | | | (2,656,571 | ) | | | (3,237,984 | ) | | | (2,281,174 | ) |
Other | | | (779,496 | ) | | | (552,955 | ) | | | (3,054,848 | ) |
Other provisons | | | (2,801,540 | ) | | | (173,634 | ) | | | (4,365,119 | ) |
| | | | | | | | | | | | |
Total other expenses | | | (68,780,760 | ) | | | (20,225,501 | ) | | | (17,365,610 | ) |
| | | | | | | | | | | | |
Other revenues andexpenses-net | | Ps. | 18,955,580 | | | Ps. | (2,373,266 | ) | | Ps. | 37,552,397 | |
| | | | | | | | | | | | |
NOTE 23. RELATED PARTIES
Balances and transactions with related parties are mainly due to: (i) sale and purchase of products, (ii) administrative services rendered and (iii) financial loans among related parties. The terms and conditions of transactions with related parties were no more favorable than those available to other parties on an arm’s length basis.
Under theLey Federal de Responsabilidades Administrativas de los Servidores Públicos (Federal Law of Administrative Responsibilities of Public Officials), which applies to PEMEX’s directors and employees, PEMEX’s directors and employees are obligated to “recuse themselves from intervening in any way in the attention to, processing or resolution of matters in which they might have personal, family or business interest, including those where some benefit can result for themselves, their spouse, blood or affinity relatives up to the fourth degree, or
F-117
PETRÓLEOS MEXICANOS, PRODUCTIVE STATE-OWNED SUBSIDIARIES
AND SUBSIDIARY COMPANIES
NOTES TO THE CONSOLIDATED FINANCIAL STATEMENTS
FOR THE YEARS ENDED DECEMBER 31, 2016, 2015 AND 2014
(FIGURES STATED IN THOUSANDS, EXCEPT AS NOTED)
civil relatives, or for third parties with which they have professional, labor or business relations, or for partners or partnerships where the public officials or the persons referred above are or have been members thereof.”
Related parties include individuals and companies that do not form part of PEMEX, but that could take advantage of being in a privileged position as a result of their relation with PEMEX. Also included are situations in which PEMEX could take advantage of a special relationship in order to benefit its financial position or results of operations.
Prior to his appointment as Secretary of Energy, Mr. Pedro Joaquín Coldwell, Chairman of the Board of Directors of Petróleos Mexicanos since December 2012, as well as certain members of his family, held ownership interests in companies that have entered into agreements with Pemex-Refining, which are now obligations of Pemex Industrial Transformation, for the sale and purchase of gasoline and other products by certain retail service stations and a wholesale distributor, as well as the performance of other related activities. As of the date of these consolidated financial statements, Mr. Pedro Joaquín Coldwell as well as certain members of his family had the following ownership interests:
| | | | | | |
Company | | Name | | Ownership
share | |
Servicio Cozumel, S. A. de C. V. (which operates a retail service station) | | Mr. Pedro Joaquín Coldwell | | | 60 | % |
| | Mr. Pedro Oscar Joaquín Delbouis
(son of Mr. Joaquín Coldwell) | | | 20 | % |
| | Mr. Nassim Joaquín Delbouis
(son of Mr. Joaquín Coldwell) | | | 20 | % |
Planta de Combustible Cozumel, S. A. de C. V. (which operates as a wholesale distributor) | | Fideicomiso Testamentario¹ | | | 57 | % |
| | Mr. Pedro Joaquín Coldwell | | | 40 | % |
Gasolinera y Servicios Juárez, S. A. de C. V. (which operates a retail service station) | | Mr. Pedro Joaquín Coldwell | | | 40 | % |
| | Fideicomiso Testamentario² | | | 40 | % |
| | Mr. Ignacio Nassim Ruiz Joaquín
(nephew of Mr. Joaquín Coldwell) | | | 20 | % |
Combustibles Caleta, S. A. de C. V. (which operates a retail service station) | | Mr. Pedro Joaquín Coldwell | | | 20 | % |
| | Mr. Pedro Oscar Joaquín Delbouis | | | 20 | % |
| | Mr. Nassim Joaquín Delbouis | | | 20 | % |
| | Fideicomiso Testamentario³ | | | 20 | % |
| | Mr. Ignacio Nassim Ruiz Joaquín | | | 20 | % |
Combustibles San Miguel, S. A. de C. V. (which operates a retail service station) | | Mr. Pedro Joaquín Coldwell | | | 25 | % |
| | Mr. Pedro Oscar Joaquín Delbouis | | | 25 | % |
| | Mr. Nassim Joaquín Delbouis | | | 25 | % |
| | Mr. Ignacio Nassim Ruiz Joaquín | | | 25 | % |
| 1 | 60% of these shares were owned by Fausto Nassim Joaquín Ibarra (father of Pedro Joaquín Coldwell), until his death in June of 2016, after which 57% of these shares became property of an investment, management and testamentary revocable trust, which is referred to as the Testamentary Trust. 50% of the voting rights of these shares are currently exercised by Mr. Pedro Oscar Joaquín Delbouis, and 50%are exercised by Mr. Nassim Joaquín Delbouis. |
F-118
PETRÓLEOS MEXICANOS, PRODUCTIVE STATE-OWNED SUBSIDIARIES
AND SUBSIDIARY COMPANIES
NOTES TO THE CONSOLIDATED FINANCIAL STATEMENTS
FOR THE YEARS ENDED DECEMBER 31, 2016, 2015 AND 2014
(FIGURES STATED IN THOUSANDS, EXCEPT AS NOTED)
| 2 | 40% of these shares were owned by Fausto Nassim Joaquín Ibarra until his death in June of 2016, after which these shares became property of the Testamentary Trust. 100% of the voting rights of these shares are currently exercised by Mr. Pedro Joaquín Coldwell. |
| 3 | 20% of these shares were owned by Fausto Nassim Joaquín Ibarra until his death in June of 2016, after which these shares became property of the Testamentary Trust. 50% of the voting rights of these shares are currently exercised by Mr. Pedro Oscar Joaquín Delbouis, and 50% are exercised by Mr. Nassim Joaquín Delbouis. |
The rights of these companies to operate retail service stations and distribute gasoline and other products on a wholesale basis in Mexico are dependent on these agreements, the expiration ornon-renewal of which may adversely affect their business. These agreements are based on PEMEX’s standard forms of agreements and contain the standard terms and conditions applicable to all of Pemex Industrial Transformation’s retail service stations and wholesale distributors.
| a. | Compensation of Directors and Officers |
For the years ended December 31, 2016, 2015 and 2014, the aggregate compensation of executive officers of Petróleos Mexicanos and the Subsidiary Entities paid or accrued in that year for services in all capacities was approximately Ps. 111,541, Ps. 116,930 and Ps. 79,831, respectively. Retirement and former employee benefits are granted as described in Note 17. Except in the case of the professional members, with respect to the previous Board of Directors of Petróleos Mexicanos and the boards of directors of the existing Subsidiary Entities, and the independent members, with respect to the new Board of Directors of Petróleos Mexicanos, members of the Boards of Directors of Petróleos Mexicanos and the Subsidiary Entities do not receive compensation for their services.
The compensation paid or accrued during 2016, 2015 and 2014 to the professional members of the previous Board of Directors of Petróleos Mexicanos and boards of directors of the existing Subsidiary Entities was approximately Ps. 7,693, Ps. 17,899, and Ps. 12,599, respectively.
As an employee benefit, PEMEX offers salary advances to all of its eligible Petroleum Workers’ Union andnon-union workers, including executive officers, pursuant to the programs set forth in the collective bargaining agreement and in theReglamento de Trabajo del Personal de Confianza de Petróleos Mexicanos y Organismos Subsidiarios (Employment Regulation of White Collar Employees of Petróleos Mexicanos and Subsidiary Entities), respectively. The salary advances, which arenon-interest bearing, are offered to each eligible employee in an amount up to a maximum of four months’ salary and are repaid through salary deductions in equal installments over a period of either one or two years, as elected by the employee. Most employees take advantage of this benefit. The amount of salary advances outstanding to executive officers at December 31, 2016 was Ps. 7,436 and at December 31, 2015 was Ps. 5,765. The amount of salary advances outstanding to executive officers at April 15, 2017 was Ps. 8,147.
NOTE 24. COMMITMENTS
| a. | PMI CIM has entered into several contracts for the sale of crude oil on the international market to foreign companies. The terms and conditions of these contracts are specific to each client, and their durations may be indefinite (evergreen contracts) or they may contain a minimum obligatory period (long-term contracts). |
F-119
PETRÓLEOS MEXICANOS, PRODUCTIVE STATE-OWNED SUBSIDIARIES
AND SUBSIDIARY COMPANIES
NOTES TO THE CONSOLIDATED FINANCIAL STATEMENTS
FOR THE YEARS ENDED DECEMBER 31, 2016, 2015 AND 2014
(FIGURES STATED IN THOUSANDS, EXCEPT AS NOTED)
| b. | PEMEX has entered into a nitrogen supply contract for the pressure maintenance program at the Cantarell complex. During 2007, an additional contract was entered into with the purpose of supplying nitrogen to theKu-Maloob-Zap complex and extending the original contract until 2027. At December 31, 2016 and 2015, the value of the nitrogen to be supplied during the term of the contract was approximately Ps. 8,646,726 and Ps. 8,920,228, respectively. In the event of the annulment of the contract and depending on the circumstances, PEMEX has the right or the obligation to acquire the vendor’s nitrogen plant under the terms of the contract. |
Estimated future payments under this contract for upcoming fiscal years are as follows:
| | | | |
2017 | | Ps. | 807,280 | |
2018 | | | 807,321 | |
2019 | | | 817,922 | |
2020 | | | 820,505 | |
2021 | | | 821,187 | |
2022 and thereafter | | | 4,572,511 | |
| | | | |
Total | | Ps. | 8,646,726 | |
| | | | |
| c. | As of December 31, 2016, PEMEX had entered into FPWCs by means of which the contractor manages and is responsible for financing performance of the work to be undertaken. |
As of December 31, 2016 and 2015, the estimated value of these contracts was as follows:
| | | | | | | | |
Maturity | | 2016 | | | 2015 | |
Up to 1 year | | Ps. | 7,366,247 | | | | Ps. 3,484,630 | |
1 to 3 years | | | 2,518,207 | | | | 1,191,247 | |
4 to 5 years | | | 2,470,878 | | | | 1,168,858 | |
More than 5 years | | | 4,157,843 | | | | 1,966,882 | |
| | | | | | | | |
Total | | Ps. | 16,513,175 | | | | Ps. 7,811,617 | |
| | | | | | | | |
| d. | In 2016 and 2015, Pemex-Exploration and Production, entered into integrated exploration and production contracts (“Integrated E&P Contracts”) for the development of mature fields in the Altamira, Ébano, Nejo, Pánuco and San Andrés blocks in the Northern region of Mexico and Magallanes, Santuario and Carrizo blocks in the Southern region of Mexico, respectively. Each contract has a term of up to 25 years. Payments to the contractors pursuant to the Integrated E&P Contracts will be made on aper-barrel basis, plus recovery of certain costs, provided that the payments to the contractor may not exceed PEMEX’s cash flow from the particular block subject to each contract. During 2016, PEMEX made payments pursuant to the Integrated E&P Contracts in the Northern region of Ps. 7,026,822 and in the Southern region of Ps. 524,475. During 2015, PEMEX made payments pursuant to the Integrated E&P Contracts in the Northern region of Ps. 12,908,720 and in the Southern region of Ps. 1,359,802. As of December 31, 2016 there is no outstanding liability due to the fact that the available cash flow has an annual maturity and has not yet matured, additionally, these contracts are in process to migrate to a new exploration and production integral contract. |
F-120
PETRÓLEOS MEXICANOS, PRODUCTIVE STATE-OWNED SUBSIDIARIES
AND SUBSIDIARY COMPANIES
NOTES TO THE CONSOLIDATED FINANCIAL STATEMENTS
FOR THE YEARS ENDED DECEMBER 31, 2016, 2015 AND 2014
(FIGURES STATED IN THOUSANDS, EXCEPT AS NOTED)
| e. | As of December 31, 2016 and 2015, the estimated value of the contracts that PEMEX has entered into with several contractors for the development of various infrastructure and services works was as follows: |
| | | | | | | | |
Maturity | | 2016 | | | 2015 | |
Up to 1 year | | | Ps. 347,606,848 | | | | Ps. 388,047,435 | |
1 to 3 years | | | 281,563,607 | | | | 294,020,900 | |
4 to 5 years | | | 69,541,826 | | | | 127,885,086 | |
More than 5 years | | | 119,281,849 | | | | 177,720,692 | |
| | | | | | | | |
Total | | | Ps. 817,994,130 | | | | Ps. 987,674,113 | |
| | | | | | | | |
NOTE 25. CONTINGENCIES
In the ordinary course of business, PEMEX is named in a number of lawsuits of various types. PEMEX evaluates the merit of each claim and assesses the likely outcome. PEMEX has not recorded provisions related to ongoing legal proceedings due to the fact that an unfavorable resolution is not expected in such proceedings, with the exception of the proceeding described in further detail in this Note.
PEMEX is involved in various civil, tax, criminal, administrative, labor and commercial lawsuits and arbitration proceedings. The results of these proceedings are uncertain as of the date of these consolidated financial statements. As of December 31, 2016 and 2015, PEMEX had accrued a reserve of Ps. 15,119,692 and Ps. 12,775,263, respectively, for these contingent liabilities. As of December 31, 2016, the current status of the principal lawsuits in which PEMEX is involved is as follows:
| | • | | In December 2004, Corporación Mexicana de Mantenimiento Integral, S. de R. L. de C. V. (“COMMISA”) filed an arbitration claim (No. 13613/CCO/JRF) before the International Court of Arbitration of the International Chamber of Commerce against Pemex-Exploration and Production for, among other things, the breach of a construction agreement in connection with two platforms in the Cantarell project (Project No. IPC01). On December 16, 2009, the International Court of Arbitration issued an arbitration award requiring Pemex-Exploration and Production to pay U.S. $293,646 and Ps. 34,459, plus interest. COMMISA requested that the U.S. District Court for the Southern District of New York recognize and execute the arbitration award. Pemex-Exploration and Production requested that the award be declared null and void by the Mexican courts, which was granted. On September 25, 2013, the U.S. District Court for the Southern District of New York issued a final judgment confirming the arbitration award. Pemex-Exploration and Production was ordered to pay COMMISA U.S. $465,060, which included Pemex-Exploration and Production’s U.S. $106,828 guarantee. Each party is to pay its value added taxes, and interest relating to the award is to be paid in accordance with applicable law. In November 2013, Pemex-Exploration and Production deposited this amount in a bank account in New York as a condition to filing its appeal with the U.S. Second Circuit Court of Appeals, which it did on January 28, 2014. On August 2, 2016, the U.S. Second Circuit Court of Appeals denied the appeal and confirmed the arbitration award in favor of COMMISA. On September 14, 2016, Pemex Exploration and Production appealed the decision, which was denied on November 3, 2016. Pemex Exploration and Production is evaluating different alternatives in connection with this claim. |
On January 22, 2013 COMMISA requested from the authorities in Luxembourg an execution of the arbitration award and an attachment of assets of Pemex-Exploration and Production and Petróleos Mexicanos located in several financial institutions. On November 15, 2013, Pemex-Exploration and
F-121
PETRÓLEOS MEXICANOS, PRODUCTIVE STATE-OWNED SUBSIDIARIES
AND SUBSIDIARY COMPANIES
NOTES TO THE CONSOLIDATED FINANCIAL STATEMENTS
FOR THE YEARS ENDED DECEMBER 31, 2016, 2015 AND 2014
(FIGURES STATED IN THOUSANDS, EXCEPT AS NOTED)
Production filed a motion against the execution of the arbitration award before the Supreme Court of Justice of Luxembourg. On January 15, 2014 COMMISA also filed a motion before this Supreme Court. On March 25, 2014, Pemex-Exploration and Production filed its pleadings. In connection with the attachment of assets, COMMISA filed a motion before the Court of Appeals of Luxembourg seeking that the Court recognizes the arbitration award without considering that it was declared null and void by the Mexican courts. On June 25, 2016, the Court of Appeals of Luxembourg issued a new procedural timeline. A final judgment is still pending.
| | • | | In February 2010, the Servicio de Administración Tributaria (the Tax Management Service) notified Pemex-Exploration and Production of the results of its review of Pemex-Exploration and Production’s financial statements for the fiscal year ended December 31, 2006 with respect to federal taxes, the value added tax and the Ordinary Duty on Hydrocarbons payable by it. On September 20, 2010, the Tax Management Service determined that Pemex-Exploration and Production owed additional taxes totaling Ps. 4,575,208 (of which Pemex-Exploration and Production was notified on September 22, 2010). On November 30, 2010, Pemex-Exploration and Production filed an administrative claim before the Tercera Sala Regional Metropolitana (Third Regional Metropolitan Court) of the Tribunal Federal de Justicia Fiscal y Administrativa (Tax and Administrative Federal Court) challenging the assessment (fileNo. 28733/10-17-03-7). |
On March 31, 2016, a judgment was issued by the First Section of the Superior Court confirming the resolution issued by the Tax Management Service. Pemex-Exploration and Production filed anamparo against this resolution (file No. 402/2016) before the Segundo Tribunal Colegiado en Materia Administrativa del Primer Circuito (Second Administrative Joint Court of the First Circuit), which was admitted on June 1, 2016. On December 1, 2016, anamparo was granted in favor of Pemex Exploration and Production ordering a new resolution to be issued by the Tax Management Service.
| | • | | In February 2011, EMS Energy Services de México, S. de R.L. de C.V. and Energy Maintenance Services Group I. LLC filed a civil claim against Pemex-Exploration and Production before the Juzgado Tercero de Distrito (Third District Court) in Villahermosa, Tabasco (No. 227/2010). The plaintiffs are seeking, among other things, damages totaling U.S. $193,713 related to the termination of a public works contract and nonpayment by Pemex-Exploration and Production under the contract. On December 31, 2014, a final judgment was issued in favor of Pemex-Exploration and Production. The plaintiff subsequently filed an appeal, which was denied on May 11, 2015. On June 3, 2015, the plaintiff filed an amparo (02/2015) against this resolution, which was denied. The plaintiff filed a motion to review this resolution before the Suprema Corte de Justicia de la Nación (the Mexican Supreme Court of Justice), which was denied. Therefore this claim has concluded. |
On April 4, 2011, Pemex-Exploration and Production was summoned before theSéptima Sala Regional Metropolitana (Seventh Regional Metropolitan Court) of the Tax and Administrative Federal Court in connection with an administrative claim (No. 4957/1117071) filed by the plaintiffs seeking that Pemex-Exploration and Production’s termination of the public works contract be declared null and void. In a concurrent proceeding, the plaintiffs also filed an administrative claim (No.13620/15-17-06) against Pemex Exploration and Production before theSexta Sala Regional Metropolitana (Sixth Regional Metropolitan Court) of the Tax and Administrative Federal Court in Mexico City seeking damages totaling U.S. $193,713 related to the above mentioned contract. Pemex-Exploration and Production filed a response requesting the two administrative claims be joined in a single proceeding, which was granted on May 10, 2016 by the Seventh Regional Metropolitan Court. A final resolution is still pending.
F-122
PETRÓLEOS MEXICANOS, PRODUCTIVE STATE-OWNED SUBSIDIARIES
AND SUBSIDIARY COMPANIES
NOTES TO THE CONSOLIDATED FINANCIAL STATEMENTS
FOR THE YEARS ENDED DECEMBER 31, 2016, 2015 AND 2014
(FIGURES STATED IN THOUSANDS, EXCEPT AS NOTED)
| | • | | In June 2016, Pemex Exploration and Production was summoned before the Juzgado Octavo de Distrito en materia Civil (Eighth Civil District Court) in Mexico City, in connection with a claim filed by Drake Mesa, S. de R.L. (file No.200/2016-II), seeking approximately U.S. $120,856 related to expenses and damages, in connection with, among other things, a public work agreement executed between them. The trial is in the evidentiary stage. |
| | • | | On July 10, 2015, the Local Treasury of Minatitlán, Veracruz determined that Pemex-Refining owed Ps. 2,531,040 for property taxes from 2010 to 2015 related to the “General Lázaro Cárdenas” refinery. Pemex-Refining filed an amparo against this determination (no.863/2015-V) before the Juzgado Décimo de Distrito (Tenth District Court) in Veracruz, which was granted. On April 26, 2016, a dismissal of this action was filed due to the suspension granted under the administrative claim mentioned below. Pemex-Refining also filed an administrative claim against this determination, which was admitted by the Court on August 6, 2015, and the trial was suspended. On September 2, 2016, a resolution dated August 31, 2016 was notified, declaring the property tax resolution null and void. On September 13, 2016, both parties filed motions to appeal this resolution. A final resolution is still pending. |
| | • | | On June 11, 2015, theSegunda Sala Regional del Noreste (Second Regional Northeast Court) notified Pemex-Refining of an administrative claim (file no.2383/15-06-02-4) filed by Severo Granados Mendoza, Luciano Machorro Olvera and Hilario Martínez Cerda, as President, Secretary and Treasurer of the Ejido Tepehuaje, seeking Ps. 2,094,232 in damages due to a hydrocarbons spill on their land. Pemex-Refining filed a response to this claim and the plaintiffs were given time to amend their claim. The defendant filed a motion against this resolution. A final judgment is still pending. |
| | • | | In February 2010, the Tax Management Service notified Pemex-Refining of the results of its review of Pemex-Refining’s financial statements for the fiscal year ended December 31, 2006 with respect to federal contributions, the value added tax and the Hydrocarbons Income Tax. On September 20, 2010, the Tax Management Service notified Pemex-Refining that it owed approximately Ps. 1,553,372 (including penalties and interest). On November 30, 2010, Pemex-Refining filed an administrative claim before the Third Regional Metropolitan Court of the Tax and Administrative Federal Court challenging the assessment. On November 20, 2013, theSala Superior (Superior Court) of the Tax and Administrative Federal Court attracted the documentation related to this trial (file No. 28733/1017037/1838/13S10504). The First Section of the Superior Court ordered the file to be sent back to the Third Regional Metropolitan Court to correct any procedural errors in order to issue a final judgment, which was sent back to the First Section of the Superior Court when the procedural errors were corrected. On March 31, 2016, a judgment was issued confirming the resolution issued by the Tax Management Service. Pemex Industrial Transformation filed anamparo against the decision with the Second Administrative Joint Court of the First Circuit which was admitted on June 1, 2016. On December 1, 2016, anamparo was granted in favor of Pemex Industrial Transformation ordering a new resolution to be issued by the Tax Management Service. |
| | • | | On July 8, 2011, Pemex-Exploration and Production was summoned in connection with an administrative claim (No. 4334/1111026) filed by Compañía Petrolera La Norma, S.A., against the Director General of Petróleos Mexicanos and the Director General of Pemex-Exploration and Production before the Segunda Sala RegionalHidalgo-México (Hidalgo-Mexico Second Regional Court) of the Tax and Administrative Federal Court in Tlalnepantla, State of Mexico. The plaintiff is seeking compensation in connection with the cancellation of its alleged petroleum rights concessions and damages for up to Ps. 1,552,730. On August 20, 2014, the proceeding was sent to the Segunda |
F-123
PETRÓLEOS MEXICANOS, PRODUCTIVE STATE-OWNED SUBSIDIARIES
AND SUBSIDIARY COMPANIES
NOTES TO THE CONSOLIDATED FINANCIAL STATEMENTS
FOR THE YEARS ENDED DECEMBER 31, 2016, 2015 AND 2014
(FIGURES STATED IN THOUSANDS, EXCEPT AS NOTED)
| | Sección de la Sala Superior (Second Section of the Superior Court) of the Tax and Administrative Federal Court(4334/11-11-02-6/1337/14-S2-07-04), which will issue a final judgment. On October 29, 2014, the proceeding was returned to the Second Regional Court to correct a procedural error. On May 31, 2016, the parties were convened for the final judgment. A final resolution is still pending. |
The results of these proceedings are uncertain until their final resolutions are issued by the appropriate authorities. PEMEX has recorded liabilities for loss contingencies when it is probable that a liability has been incurred and the amount thereof can be reasonably estimated. When a reasonable estimation could not be made, qualitative disclosure was provided in the notes to these consolidated financial statements.
PEMEX does not disclose amounts accrued for each individual claim because such disclosure could adversely affect PEMEX’s legal strategy, as well as the outcome of the related litigation.
NOTE 26. BUSINESS COMBINATION
On January 28, 2016, PMX Fertilizantes Pacífico, S.A. de C.V., a PEMEX subsidiary company, acquired 99.99% of the outstanding shares of Fertinal, for a total purchase price of Ps. 4,322,826. This amount was paid through credit lines under a simple credit agreement. Additionally, within the same credit line, PMX Fertilizantes obtained U.S. $425,800 for the liquidation of Fertinal’s debt. These loans will mature in 16 years.
The net fair value of Fertinal’s assets and liabilities as of the date of acquisition is:
| | | | |
| | | Fair value | |
Cash and cash equivalents | | | Ps. (6,943 | ) |
Accounts receivable | | | 102,121 | |
Inventories | | | 762,254 | |
Properties, plant and equipment | | | 9,811,928 | |
Other assets | | | 1,671,718 | |
| | | | |
Total assets | | | 12,341,078 | |
| |
Accounts payable | | | Ps. 2,331,540 | |
Debt | | | 9,365,152 | |
Deferred taxes | | | 328,578 | |
| | | | |
Total liabilities | | | 12,025,270 | |
| | | | |
Total assets, net | | | Ps. 315,808 | |
| | | | |
Transaction value | | | Ps. 4,322,826 | |
Goodwill | | | Ps. 4,007,018 | |
PMX FP, carried out the purchase price allocation (PPA) of the Fertinal acquisition in accordance with International Financial Reporting Standard 3 “Business Combination”. It was determined that net assets acquired amounted to Ps. 315,808 and a goodwill of Ps. 4,007,018. As of December 31, 2016, a calculation of the impairment of goodwill resulted in the complete cancellation of that amount. The impairment of goodwill is recognized in the consolidated statement of comprehensive income in other income (expenses), net. See Note 22.
F-124
PETRÓLEOS MEXICANOS, PRODUCTIVE STATE-OWNED SUBSIDIARIES
AND SUBSIDIARY COMPANIES
NOTES TO THE CONSOLIDATED FINANCIAL STATEMENTS
FOR THE YEARS ENDED DECEMBER 31, 2016, 2015 AND 2014
(FIGURES STATED IN THOUSANDS, EXCEPT AS NOTED)
PEMEX intends to incorporate Fertinal into thegas-ammonia solid fertilizers value chain in order to strengthen its ability to offer a wide range of fertilizers and to cover approximately 50% of the domestic market, and is also assessing the possibility of selling the integrated business in the future.
NOTE 27. SUBSEQUENT EVENTS
During the period from January 1 to April 27, 2017, PEMEX participated in the following financing activities:
| | • | | On February 14, 2017, Petróleos Mexicanos issued, under its Medium-Term Notes program, Series C, € 4,250,000 in the international capital markets through three benchmark bonds at 4.5, 7 and 11 years: |
| | i. | € 1,750,000 of its 2.50% Notes due in August 2021, bearing interest rate at 2.51%; |
| | ii. | € 1,250,000 of its 3.75% Notes due in February 2024, bearing interest rate at 3.84%; and |
| | iii. | € 1,250,000 of its 4.875% Notes due in February 2028, bearing interest rate at 4.98%. |
All debt securities issued under this program are guaranteed by Pemex Exploration and Production, Pemex Industrial Transformation, Pemex Drilling and Services, Pemex Logistics and Pemex Cogeneration and Services
Between January 1 to April 27, 2017, PMI HBV obtained and repaid U.S. $2,201,659 in financing from its revolving credit lines.
As of December 31, 2016, PEMEX has valued and recorded 22,221,893 Repsol shares acquired through PMI HBV, of which 1,497,562 are presented as available for sale current financial assets and 20,724,331 as available for salenon-current financial assets. As of April 27, 2017, PEMEX has valued and recorded the 22,221,893 Repsol shares. The market value of Repsol shares has increased approximately 8.49%, from € 13.42 per share as of December 31, 2016 to € 14.56 per share as of April 27, 2017.
As of April 27, 2017, the Mexicanpeso-U.S. dollar exchange rate was Ps. 18.9225 per U.S. dollar, which represents a 8.43% appreciation of the value of the peso in U.S. dollar terms as compared to the exchange rate as of December 31, 2016, which was Ps. 20.6640 per U.S. dollar.
As of April 27, 2017, the weighted average price of the crude oil exported by PEMEX was U.S. $42.25 per barrel. This represents a price decrease of approximately 8.75% as compared to the average price as of December 31, 2016, which was U.S. $46.30 per barrel.
On March 8, 2017, PEMEX obtained U.S.$ 693,000 to settle the claim of the fire at the Abkatun Permanente Platform occurred last April 2015, as a result of negotiations and other actions taken by Kot Insurance Company AG in the international reinsurance markets.
In connection with the arbitration proceeding filed by COMMISA in December 2004 before the International Court of Arbitration of the International Chamber of Commerce against Pemex-Exploration and Production (13613/CCO/JRF), prior authorization from the Director General of Pemex Exploration and Production and the Delegate of the Liabilities Unit in that Subsidiary Entity, exhausting the authorization and feasibility procedure established in the applicable regulations, on April 6, 2017, Pemex Exploration and Production and Petróleos Mexicanos executed a settlement agreement with COMMISA and agreed to pay to
F-125
PETRÓLEOS MEXICANOS, PRODUCTIVE STATE-OWNED SUBSIDIARIES
AND SUBSIDIARY COMPANIES
NOTES TO THE CONSOLIDATED FINANCIAL STATEMENTS
FOR THE YEARS ENDED DECEMBER 31, 2016, 2015 AND 2014
(FIGURES STATED IN THOUSANDS, EXCEPT AS NOTED)
COMMISA U.S.$ 435,000 plus the applicable value added tax, with the funds deposited by Pemex Exploration and Production in a bank account as a guarantee before the U.S. District Court for the Southern District of New York. The remaining U.S.$.30,800 in this account will be refunded to Pemex Exploration and Production, once the corresponding value added tax is paid to COMMISA according to the criteria determined by the Tax Management Service.
As of the date of these consolidated annual financial statements, the activities needed for the due compliance of the settlement agreement are being implemented in order to resolve all disputes arising from the construction agreementPEP-0-129/97, including this arbitration proceeding and other related proceedings. (See Note 25).
In April 2017, PEMEX entered into a crude oil hedge to partially protect its cash flows from decreases in the Mexican crude oil basket price below the price established in the Federal Revenue Law. Through this hedge, PEMEX hedged 409 thousand barrels per day from May to December 2017 for U.S.$133.5 million. This hedging strategy provides PEMEX with full protection when the monthly average price of the Mexican crude oil basket is between U.S.$42 and U.S.$37 per barrel, which is the price range with a higher probability among adverse scenarios, and partial protection when the price is below U.S.$37 per barrel.
NOTE 28. SUBSIDIARY GUARANTOR INFORMATION
The following consolidating information presents: (i) condensed consolidated statements of financial position at December 31, 2016 and 2015 and condensed consolidated statements of comprehensive income and cash flows for the years ended December 31, 2016, 2015 and 2014 of Petróleos Mexicanos, the Subsidiary Guarantors and theNon-Guarantor Subsidiaries (as defined below).
These condensed consolidated statements were prepared in conformity with IFRS, with one exception: for the purposes of the presentation of the subsidiary guarantor information, the Subsidiary Entities and Subsidiary Companies have been accounted for as investments under the equity method by Petróleos Mexicanos. Earnings of subsidiaries are therefore reflected in Petróleos Mexicanos’ investment account and earnings. The principal elimination entries eliminate Petróleos Mexicanos’ investment in subsidiaries and inter-company balances and transactions. Pemex Exploration and Production, Pemex Industrial Transformation, Pemex Drilling and Services, Pemex Logistics and Pemex Cogeneration and Services (collectively, the “Subsidiary Guarantors”) and Pemex Ethylene and Pemex Fertilizers are 100%-owned subsidiaries of Mexican Government. The guaranties by the Subsidiary Guarantors of Petróleos Mexicanos’ payment obligations under this indebtedness are full, unconditional, joint and several. Pemex Ethylene, Pemex Fertilizers, Pemex Finance, Ltd. and the Subsidiary Companies collectively comprise thenon-guarantor subsidiaries (the“Non-Guarantor Subsidiaries”).
The Pemex Project Funding Master Trust (the “Master Trust”), which was a trust formed for the purpose of financing PEMEX’s projects, was dissolved effective December 20, 2011 and is no longer consolidated in the financial statements of PEMEX as of December 31, 2011 and thereafter.
F-126
PETRÓLEOS MEXICANOS, PRODUCTIVE STATE-OWNED SUBSIDIARIES
AND SUBSIDIARY COMPANIES
NOTES TO THE CONSOLIDATED FINANCIAL STATEMENTS
FOR THE YEARS ENDED DECEMBER 31, 2016, 2015 AND 2014
(FIGURES STATED IN THOUSANDS, EXCEPT AS NOTED)
The following table sets forth, as of December 31, 2016, the principal amount outstanding of the registered debt securities originally issued by the Master Trust. As noted above, Petróleos Mexicanos has assumed, as primary obligor, all of the obligations of the Master Trust under these debt securities. The obligations of Petróleos Mexicanos are guaranteed by the Subsidiary Guarantors:
Table 1: Registered Debt Securities originally issued by the Master Trust and Assumed by Petróleos Mexicanos
| | | | | | | | |
Security | | Primary
obligor | | Guarantors | | Principal
amount
outstanding
(U.S. $) | |
5.75% Guaranteed Notes due 2018 | | Petróleos
Mexicanos | | Pemex Exploration and Production, Pemex Industrial Transformation, Pemex Drilling and Services, Pemex Logistics and Pemex Cogeneration and Services | | | 1,775,616 | |
| | | |
6.625% Guaranteed Bonds due 2035 | | Petróleos
Mexicanos | | Pemex Exploration and Production, Pemex Industrial Transformation, Pemex Drilling and Services, Pemex Logistics and Pemex Cogeneration and Services | | | 1,750,000 | |
| | | |
6.625% Guaranteed Bonds due 2038 | | Petróleos
Mexicanos | | Pemex Exploration and Production, Pemex Industrial Transformation, Pemex Drilling and Services, Pemex Logistics and Pemex Cogeneration and Services | | | 491,175 | |
| | | |
8.625% Bonds due 2022 | | Petróleos
Mexicanos | | Pemex Exploration and Production, Pemex Industrial Transformation, Pemex Drilling and Services, Pemex Logistics and Pemex Cogeneration and Services | | | 160,245 | |
| | | |
8.625% Guaranteed Bonds due 2023 | | Petróleos
Mexicanos | | Pemex Exploration and Production, Pemex Industrial Transformation, Pemex Drilling and Services, Pemex Logistics and Pemex Cogeneration and Services | | | 106,507 | |
| | | |
9 1⁄4% Guaranteed Bonds due 2018 | | Petróleos
Mexicanos | | Pemex Exploration and Production, Pemex Industrial Transformation, Pemex Drilling and Services, Pemex Logistics and Pemex Cogeneration and Services | | | 107,109 | |
| | | |
9.50% Guaranteed Bonds due 2027 | | Petróleos
Mexicanos | | Pemex Exploration and Production, Pemex Industrial Transformation, Pemex Drilling and Services, Pemex Logistics and Pemex Cogeneration and Services | | | 219,217 | |
F-127
PETRÓLEOS MEXICANOS, PRODUCTIVE STATE-OWNED SUBSIDIARIES
AND SUBSIDIARY COMPANIES
NOTES TO THE CONSOLIDATED FINANCIAL STATEMENTS
FOR THE YEARS ENDED DECEMBER 31, 2016, 2015 AND 2014
(FIGURES STATED IN THOUSANDS, EXCEPT AS NOTED)
The following table sets forth, as of December 31, 2016, the principal amount outstanding of the registered debt securities issued by Petróleos Mexicanos, and guaranteed by Pemex Exploration and Production, Pemex Industrial Transformation, Pemex Drilling and Services, Pemex Logistics and Pemex Cogeneration and Services.
Table 2: Registered Debt Securities originally issued by Petróleos Mexicanos
| | | | | | | | |
Security | | Issuer | | Guarantors | | Principal amount
outstanding
(U.S. $) | |
8.00% Notes due 2019 | | Petróleos
Mexicanos | | Pemex Exploration and Production, Pemex Industrial Transformation, Pemex Drilling and Services, Pemex Logistics and Pemex Cogeneration and Services | | | 1,312,015 | |
| | | |
9 1⁄4% Global Guaranteed Bonds due 2018 | | Petróleos
Mexicanos | | Pemex Exploration and Production, Pemex Industrial Transformation, Pemex Drilling and Services, Pemex Logistics and Pemex Cogeneration and Services | | | 9,296 | |
| | | |
9.50% Global Guaranteed Bonds due 2027 | | Petróleos
Mexicanos | | Pemex Exploration and Production, Pemex Industrial Transformation, Pemex Drilling and Services, Pemex Logistics and Pemex Cogeneration and Services | | | 102,149 | |
| | | |
3.500% Notes due 2018 | | Petróleos
Mexicanos | | Pemex Exploration and Production, Pemex Industrial Transformation, Pemex Drilling and Services, Pemex Logistics and Pemex Cogeneration and Services | | | 999,590 | |
| | | |
Floating Rate Notes due 2018 | | Petróleos
Mexicanos | | Pemex Exploration and Production, Pemex Industrial Transformation, Pemex Drilling and Services, Pemex Logistics and Pemex Cogeneration and Services | | | 498,570 | |
| | | |
6.000% Notes due 2020 | | Petróleos
Mexicanos | | Pemex Exploration and Production, Pemex Industrial Transformation, Pemex Drilling and Services, Pemex Logistics and Pemex Cogeneration and Services | | | 995,364 | |
F-128
PETRÓLEOS MEXICANOS, PRODUCTIVE STATE-OWNED SUBSIDIARIES
AND SUBSIDIARY COMPANIES
NOTES TO THE CONSOLIDATED FINANCIAL STATEMENTS
FOR THE YEARS ENDED DECEMBER 31, 2016, 2015 AND 2014
(FIGURES STATED IN THOUSANDS, EXCEPT AS NOTED)
| | | | | | | | |
Security | | Issuer | | Guarantors | | Principal amount
outstanding
(U.S. $) | |
5.50% Notes due 2021 | | Petróleos
Mexicanos | | Pemex Exploration and Production, Pemex Industrial Transformation, Pemex Drilling and Services, Pemex Logistics and Pemex Cogeneration and Services | | | 2,961,947 | |
| | | |
3.500% Notes due 2023 | | Petróleos
Mexicanos | | Pemex Exploration and Production, Pemex Industrial Transformation, Pemex Drilling and Services, Pemex Logistics and Pemex Cogeneration and Services | | | 2,099,730 | |
| | | |
4.875% Notes due 2024 | | Petróleos
Mexicanos | | Pemex Exploration and Production, Pemex Industrial Transformation, Pemex Drilling and Services, Pemex Logistics and Pemex Cogeneration and Services | | | 1,499,136 | |
| | | |
6.625% Notes due 2035 | | Petróleos
Mexicanos | | Pemex Exploration and Production, Pemex Industrial Transformation, Pemex Drilling and Services, Pemex Logistics and Pemex Cogeneration and Services | | | 2,748,500 | |
| | | |
6.500% Bonds due 2041 | | Petróleos
Mexicanos | | Pemex Exploration and Production, Pemex Industrial Transformation, Pemex Drilling and Services, Pemex Logistics and Pemex Cogeneration and Services | | | 3,000,000 | |
| | | |
4.875% Bonds 2022 | | Petróleos
Mexicanos | | Pemex Exploration and Production, Pemex Industrial Transformation, Pemex Drilling and Services, Pemex Logistics and Pemex Cogeneration and Services | | | 2,097,055 | |
| | | |
3.125% Notes due 2019 | | Petróleos
Mexicanos | | Pemex Exploration and Production, Pemex Industrial Transformation, Pemex Drilling and Services, Pemex Logistics and Pemex Cogeneration and Services | | | 497,278 | |
| | | |
3.500% Notes due 2020 | | Petróleos
Mexicanos | | Pemex Exploration and Production, Pemex Industrial Transformation, Pemex Drilling and Services, Pemex Logistics and Pemex Cogeneration and Services | | | 1,454,967 | |
F-129
PETRÓLEOS MEXICANOS, PRODUCTIVE STATE-OWNED SUBSIDIARIES
AND SUBSIDIARY COMPANIES
NOTES TO THE CONSOLIDATED FINANCIAL STATEMENTS
FOR THE YEARS ENDED DECEMBER 31, 2016, 2015 AND 2014
(FIGURES STATED IN THOUSANDS, EXCEPT AS NOTED)
| | | | | | | | |
Security | | Issuer | | Guarantors | | Principal amount
outstanding
(U.S. $) | |
5.50% Bonds due 2044 | | Petróleos
Mexicanos | | Pemex Exploration and Production, Pemex Industrial Transformation, Pemex Drilling and Services, Pemex Logistics and Pemex Cogeneration and Services | | | 2,657,962 | |
| | | |
6.375% Bonds due en 2045 | | Petróleos
Mexicanos | | Pemex Exploration and Production, Pemex Industrial Transformation, Pemex Drilling and Services, Pemex Logistics and Pemex Cogeneration and Services | | | 2,999,980 | |
| | | |
5.625% Bonds due 2046 | | Petróleos
Mexicanos | | Pemex Exploration and Production, Pemex Industrial Transformation, Pemex Drilling and Services, Pemex Logistics and Pemex Cogeneration and Services | | | 2,992,876 | |
| | | |
4.500% Notes due 2026 | | Petróleos
Mexicanos | | Pemex Exploration and Production, Pemex Industrial Transformation, Pemex Drilling and Services, Pemex Logistics and Pemex Cogeneration and Services | | | 1,486,725 | |
| | | |
4.250% Notes due 2025 | | Petróleos
Mexicanos | | Pemex Exploration and Production, Pemex Industrial Transformation, Pemex Drilling and Services, Pemex Logistics and Pemex Cogeneration and Services | | | 998,153 | |
Petróleos Mexicanos is the only PEMEX entity that had debt securities registered with the SEC outstanding as of December 31, 2016 and as of the date of these consolidated financial statements, and all guaranteed debt is issued by Petróleos Mexicanos. The guaranties of the Subsidiary Guarantors are full and unconditional and joint and several. PEMEX’s management has not presented separate financial statements for the Subsidiary Guarantors, because it has determined that such information is not material to investors.
F-130
PETRÓLEOS MEXICANOS, PRODUCTIVE STATE-OWNED SUBSIDIARIES
AND SUBSIDIARY COMPANIES
NOTES TO THE CONSOLIDATED FINANCIAL STATEMENTS
FOR THE YEARS ENDED DECEMBER 31, 2016, 2015 AND 2014
(FIGURES STATED IN THOUSANDS, EXCEPT AS NOTED)
SUPPLEMENTAL CONDENSED CONSOLIDATING FINANCIAL INFORMATION
STATEMENT OF FINANCIAL POSITION
As of December 31, 2016
| | | | | | | | | | | | | | | | | | | | |
| | | Petróleos
Mexicanos | | | Subsidiary
guarantors | | | Non-guarantor
subsidiaries | | | Eliminations | | | PEMEX
consolidated | |
Assets | | | | | | | | | | | | | | | | | | | | |
Current assets | | | | | | | | | | | | | | | | | | | | |
Cash and cash equivalents | | Ps. | 92,503,607 | | | Ps. | 9,732,503 | | | Ps. | 61,296,403 | | | Ps. | — | | | Ps. | 163,532,513 | |
Accounts receivable and other, net, and derivative financial instruments | | | 6,604,595 | | | | 75,760,079 | | | | 55,713,323 | | | | — | | | | 138,077,997 | |
Accounts receivable—inter-company | | | 440,645,367 | | | | 1,684,782,235 | | | | 70,268,246 | | | | (2,195,695,848 | ) | | | — | |
Inventories | | | 446,954 | | | | 29,270,943 | | | | 16,174,163 | | | | — | | | | 45,892,060 | |
Available-for-sale financial assets | | | — | | | | — | | | | 435,556 | | | | — | | | | 435,556 | |
Held-for-salenon-financial assets | | | — | | | | 7,460,674 | | | | — | | | | — | | | | 7,460,674 | |
| | | | | | | | | | | | | | | | | | | | |
Total current assets | | | 540,200,523 | | | | 1,807,006,434 | | | | 203,887,691 | | | | (2,195,695,848 | ) | | | 355,398,800 | |
Available-for-sale financial assets | | | — | | | | — | | | | 6,027,540 | | | | — | | | | 6,027,540 | |
Long-term receivables—intercompany | | | 1,740,519,399 | | | | 289 | | | | 6,384,944 | | | | (1,746,904,632 | ) | | | — | |
Permanent investments in associates and other | | | (250,108,630 | ) | | | 396,681 | | | | 22,744,936 | | | | 250,121,645 | | | | 23,154,632 | |
Wells, pipelines, properties, plant andequipment-net | | | 12,596,722 | | | | 1,595,655,580 | | | | 59,489,946 | | | | — | | | | 1,667,742,248 | |
Long-term notes receivables | | | 140,579,974 | | | | 8,027,628 | | | | — | | | | — | | | | 148,607,602 | |
Deferred taxes | | | 59,162,878 | | | | 40,341,615 | | | | 820,196 | | | | — | | | | 100,324,689 | |
Restricted cash | | | — | | | | 9,624,804 | | | | 853,822 | | | | — | | | | 10,478,626 | |
Intangible assets | | | — | | | | 8,639,242 | | | | — | | | | — | | | | 8,639,242 | |
Other assets | | | 1,824,104 | | | | 2,707,788 | | | | 4,980,753 | | | | — | | | | 9,512,645 | |
| | | | | | | | | | | | | | | | | | | | |
Total assets | | Ps. | 2,244,774,970 | | | Ps. | 3,472,400,061 | | | $ | 305,189,828 | | | $ | (3,692,478,835 | ) | | $ | 2,329,886,024 | |
| | | | | | | | | | | | | | | | | | | | |
Liabilities | | | | | | | | | | | | | | | | | | | | |
Current liabilities | | | | | | | | | | | | | | | | | | | | |
Current portion of long-term debt | | | 157,937,631 | | | | 7,381,095 | | | | 10,847,462 | | | | — | | | | 176,166,188 | |
Accounts payable—inter-company | | | 1,265,244,986 | | | | 854,106,939 | | | | 68,510,835 | | | | (2,187,862,760 | ) | | | — | |
Other current liabilities | | | 34,913,773 | | | | 169,182,239 | | | | 45,927,686 | | | | — | | | | 250,023,698 | |
| | | | | | | | | | | | | | | | | | | | |
Total current liabilities | | | 1,458,096,390 | | | | 1,030,670,273 | | | | 125,285,983 | | | | (2,187,862,760 | ) | | | 426,189,886 | |
Long-term debt | | | 1,737,332,174 | | | | 46,090,919 | | | | 23,581,449 | | | | — | | | | 1,807,004,542 | |
Long-term payables—inter-company | | | — | | | | 1,746,433,870 | | | | 8,303,850 | | | | (1,754,737,720 | ) | | | — | |
Employee benefits, provisions for sundry creditors, other liabilities and deferred taxes | | | 282,902,667 | | | | 1,035,019,339 | | | | 11,777,737 | | | | — | | | | 1,329,699,743 | |
| | | | | | | | | | | | | | | | | | | | |
Total liabilities | | | 3,478,331,231 | | | | 3,858,214,401 | | | | 168,949,019 | | | | (3,942,600,480 | ) | | | 3,562,894,171 | |
Equity (deficit), net | | | (1,233,556,261 | ) | | | (385,814,340 | ) | | | 136,240,809 | | | | 250,121,645 | | | | (1,233,008,147 | ) |
| | | | | | | | | | | | | | | | | | | | |
Total liabilities and equity | | Ps. | 2,244,774,970 | | | Ps. | 3,472,400,061 | | | Ps. | 305,189,828 | | | Ps. | (3,692,478,835 | ) | | Ps. | 2,329,886,024 | |
| | | | | | | | | | | | | | | | | | | | |
F-131
PETRÓLEOS MEXICANOS, PRODUCTIVE STATE-OWNED SUBSIDIARIES
AND SUBSIDIARY COMPANIES
NOTES TO THE CONSOLIDATED FINANCIAL STATEMENTS
FOR THE YEARS ENDED DECEMBER 31, 2016, 2015 AND 2014
(FIGURES STATED IN THOUSANDS, EXCEPT AS NOTED)
SUPPLEMENTAL CONDENSED CONSOLIDATING FINANCIAL INFORMATION
STATEMENT OF FINANCIAL POSITION
As of December 31, 2015
| | | | | | | | | | | | | | | | | | | | |
| | | Petróleos
Mexicanos | | | Subsidiary
guarantors | | | Non-guarantor
subsidiaries | | | Eliminations | | | PEMEX
consolidated | |
Assets | | | | | | | | | | | | | | | | | | | | |
Current assets | | | | | | | | | | | | | | | | | | | | |
Cash and cash equivalents | | Ps. | 58,461,012 | | | Ps. | 6,630,670 | | | Ps. | 44,277,198 | | | Ps. | — | | | Ps. | 109,368,880 | |
Accounts receivable and other, net, and derivative financial instruments | | | 37,238,854 | | | | (34,341,755 | ) | | | 77,949,828 | | | | — | | | | 80,846,927 | |
Accounts receivable—inter-company | | | 125,742,649 | | | | 900,153,311 | | | | 137,229,202 | | | | (1,163,125,162 | ) | | | — | |
Inventories | | | 530,271 | | | | 31,959,005 | | | | 11,281,652 | | | | — | | | | 43,770,928 | |
Held-for-salenon-financial assets | | | — | | | | 33,213,762 | | | | — | | | | — | | | | 33,213,762 | |
| | | | | | | | | | | | | | | | | | | | |
Total current assets | | | 221,972,786 | | | | 937,614,993 | | | | 270,737,880 | | | | (1,163,125,162 | ) | | | 267,200,497 | |
Available-for-sale financial assets | | | — | | | | — | | | | 3,944,696 | | | | — | | | | 3,944,696 | |
Long-term receivables—intercompany | | | 1,274,568,094 | | | | 313 | | | | 6,061,687 | | | | (1,280,630,094 | ) | | | — | |
Permanent investments in associates and other | | | (246,924,369 | ) | | | 7,607,632 | | | | 16,544,953 | | | | 246,937,383 | | | | 24,165,599 | |
Wells, pipelines, properties, plant andequipment-net | | | 11,810,768 | | | | 1,280,347,602 | | | | 52,325,261 | | | | — | | | | 1,344,483,631 | |
Long-term notes receivable | | | 50,000,000 | | | | — | | | | — | | | | — | | | | 50,000,000 | |
Deferred taxes | | | 52,242,786 | | | | 2,168,657 | | | | 488,941 | | | | — | | | | 54,900,384 | |
Restricted cash | | | — | | | | 8,010,298 | | | | 1,236,474 | | | | — | | | | 9,246,772 | |
Intangible assets | | | — | | | | 14,304,961 | | | | — | | | | — | | | | 14,304,961 | |
Other assets | | | 1,559,055 | | | | 2,528,699 | | | | 3,319,906 | | | | — | | | | 7,407,660 | |
| | | | | | | | | | | | | | | | | | | | |
Total assets | | PS. | 1,365,229,120 | | | Ps. | 2,252,583,155 | | | Ps. | 354,659,798 | | | Ps. | (2,196,817,873 | ) | | Ps. | 1,775,654,200 | |
| | | | | | | | | | | | | | | | | | | | |
Liabilities | | | | | | | | | | | | | | | | | | | | |
Current liabilities | | | | | | | | | | | | | | | | | | | | |
Current portion of long-term debt | | Ps. | 183,985,562 | | | Ps. | 5,933,027 | | | Ps. | 2,590,079 | | | Ps. | — | | | Ps. | 192,508,668 | |
Accounts payable—inter-company | | | 915,533,239 | | | | 162,455,837 | | | | 76,784,232 | | | | (1,154,773,308 | ) | | | — | |
Other current liabilities | | | 35,189,773 | | | | 195,646,938 | | | | 20,062,342 | | | | — | | | | 250,899,053 | |
| | | | | | | | | | | | | | | | | | | | |
Total current liabilities | | | 1,134,708,574 | | | | 364,035,802 | | | | 99,436,653 | | | | (1,154,773,308 | ) | | | 443,407,721 | |
Long-term debt | | | 1,271,921,360 | | | | 11,589,261 | | | | 17,362,546 | | | | — | | | | 1,300,873,167 | |
Long-term payables—inter-company | | | — | | | | 1,281,683,849 | | | | 7,298,100 | | | | (1,288,981,949 | ) | | | — | |
Employee benefits, provisions for sundrycreditors, other liabilities and deferred taxes | | | 290,528,362 | | | | 944,461,253 | | | | 128,059,595 | | | | — | | | | 1,363,049,210 | |
| | | | | | | | | | | | | | | | | | | | |
Total liabilities | | | 2,697,158,296 | | | | 2,601,770,165 | | | | 252,156,894 | | | | (2,443,755,257 | ) | | | 3,107,330,098 | |
Equity (deficit), net | | | (1,331,929,176 | ) | | | (349,187,010 | ) | | | 102,502,904 | | | | 246,937,384 | | | | (1,331,675,898 | ) |
| | | | | | | | | | | | | | | | | | | | |
Total liabilities and equity | | Ps. | 1,365,229,120 | | | Ps. | 2,252,583,155 | | | Ps. | 354,659,798 | | | Ps. | (2,196,817,873 | ) | | Ps. | 1,775,654,200 | |
| | | | | | | | | | | | | | | | | | | | |
F-132
PETRÓLEOS MEXICANOS, PRODUCTIVE STATE-OWNED SUBSIDIARIES
AND SUBSIDIARY COMPANIES
NOTES TO THE CONSOLIDATED FINANCIAL STATEMENTS
FOR THE YEARS ENDED DECEMBER 31, 2016, 2015 AND 2014
(FIGURES STATED IN THOUSANDS, EXCEPT AS NOTED)
SUPPLEMENTAL CONDENSED CONSOLIDATING FINANCIAL INFORMATION
STATEMENT OF COMPREHENSIVE INCOME
For the year ended December 31, 2016
| | | | | | | | | | | | | | | | | | | | |
| | | Petróleos
Mexicanos | | | Subsidiary
guarantors | | | Non-guarantor
subsidiaries | | | Eliminations | | | PEMEX
consolidated | |
Net sales | | Ps. | — | | | Ps. | 1,361,538,624 | | | Ps. | 828,143,332 | | | Ps. | (1,124,563,366 | ) | | Ps. | 1,065,118,590 | |
Services income | | | 46,330,245 | | | | 98,959,131 | | | | 7,422,494 | | | | (138,284,789 | ) | | | 14,427,081 | |
| | | | | | | | | | | | | | | | | | | | |
Total sales revenues | | | 46,330,245 | | | | 1,460,497,755 | | | | 835,565,826 | | | | (1,262,848,155 | ) | | | 1,079,545,671 | |
Impairment of wells, pipelines, properties, plant and equipment | | | — | | | | (330,037,834 | ) | | | (1,276,509 | ) | | | — | | | | (331,314,343 | ) |
Cost of sales | | | 1,236,921 | | | | 1,244,388,072 | | | | 810,915,191 | | | | (1,188,959,550 | ) | | | 867,580,634 | |
| | | | | | | | | | | | | | | | | | | | |
Gross income | | | 45,093,324 | | | | 546,147,517 | | | | 25,927,144 | | | | (73,888,605 | ) | | | 543,279,380 | |
Other (expenses) revenues, net | | | (312,611 | ) | | | 20,713,184 | | | | (778,189 | ) | | | (666,804 | ) | | | 18,955,580 | |
| | | | | | | | | | | | | | | | | | | | |
General expenses: | | | | | | | | | | | | | | | | | | | | |
Transportation, distribution and sale expenses | | | — | | | | 50,948,771 | | | | 945,489 | | | | (26,663,020 | ) | | | 25,231,240 | |
Administrative expenses | | | 57,437,455 | | | | 96,884,031 | | | | 7,050,271 | | | | (48,718,224 | ) | | | 112,653,533 | |
| | | | | | | | | | | | | | | | | | | | |
Total general expenses | | | 57,437,455 | | | | 147,832,802 | | | | 7,995,760 | | | | (75,381,244 | ) | | | 137,884,773 | |
| | | | | | | | | | | | | | | | | | | | |
Operating income | | | (12,656,742 | ) | | | 419,027,899 | | | | 17,153,195 | | | | 825,835 | | | | 424,350,187 | |
Financing income | | | 123,266,281 | | | | 67,542,768 | | | | 3,526,378 | | | | (180,586,172 | ) | | | 13,749,255 | |
Financing cost | | | (160,824,632 | ) | | | (114,271,762 | ) | | | (3,602,868 | ) | | | 179,854,798 | | | | (98,844,464 | ) |
Derivative financial instruments (cost) income, net | | | (12,052,200 | ) | | | 3,172 | | | | (1,951,959 | ) | | | — | | | | (14,000,987 | ) |
Foreign exchange loss, net | | | (20,531,005 | ) | | | (232,714,446 | ) | | | (767,292 | ) | | | — | | | | (254,012,743 | ) |
Profit (loss) sharing in associates and other | | | (117,347,803 | ) | | | 628,357 | | | | 1,507,488 | | | | 117,347,803 | | | | 2,135,845 | |
| | | | | | | | | | | | | | | | | | | | |
Income (loss) before taxes, duties and other | | | (200,146,101 | ) | | | 140,215,988 | | | | 15,864,942 | | | | 117,442,264 | | | | 73,377,093 | |
Total taxes, duties and other | | | (8,834,626 | ) | | | 266,155,181 | | | | 7,200,880 | | | | — | | | | 264,521,435 | |
| | | | | | | | | | | | | | | | | | | | |
Net (loss) income for the year | | | (191,311,475 | ) | | | (125,939,193 | ) | | | 8,664,062 | | | | 117,442,264 | | | | (191,144,342 | ) |
Total other comprehensive result | | | 10,126,560 | | | | 96,032,433 | | | | 21,713,488 | | | | — | | | | 127,872,481 | |
| | | | | | | | | | | | | | | | | | | | |
Total comprehensive result for the year | | Ps. | (181,184,915 | ) | | Ps. | (29,906,760 | ) | | Ps. | 30,377,550 | | | Ps. | 117,442,264 | | | Ps. | (63,271,861 | ) |
| | | | | | | | | | | | | | | | | | | | |
F-133
PETRÓLEOS MEXICANOS, PRODUCTIVE STATE-OWNED SUBSIDIARIES
AND SUBSIDIARY COMPANIES
NOTES TO THE CONSOLIDATED FINANCIAL STATEMENTS
FOR THE YEARS ENDED DECEMBER 31, 2016, 2015 AND 2014
(FIGURES STATED IN THOUSANDS, EXCEPT AS NOTED)
SUPPLEMENTAL CONDENSED CONSOLIDATING FINANCIAL INFORMATION
STATEMENT OF COMPREHENSIVE INCOME
For the year ended December 31, 2015
| | | | | | | | | | | | | | | | | | | | |
| | | Petróleos
Mexicanos | | | Subsidiary
guarantors | | | Non-guarantor
subsidiaries | | | Eliminations | | | PEMEX
consolidated | |
Net sales | | Ps. | 15,556 | | | Ps. | 1,523,767,800 | | | Ps. | 803,623,324 | | | Ps. | (1,173,956,323 | ) | | Ps. | 1,153,450,357 | |
Services income | | | 16,897,139 | | | | 16,815,589 | | | | 7,187,694 | | | | (27,988,310 | ) | | | 12,912,112 | |
| | | | | | | | | | | | | | | | | | | | |
Total sales revenues | | | 16,912,695 | | | | 1,540,583,389 | | | | 810,811,018 | | | | (1,201,944,633 | ) | | | 1,166,362,469 | |
Impairment of wells, pipelines, properties, plant and equipment | | | — | | | | 476,276,159 | | | | 1,668,531 | | | | — | | | | 477,944,690 | |
Benefit from change in pension plan | | | | | | | (83,657,496 | ) | | | (8,519,593 | ) | | | — | | | | (92,177,089 | ) |
Cost of sales | | | 2,695,423.00 | | | | 1,280,404,059 | | | | 794,252,043 | | | | (1,182,282,621 | ) | | | 895,068,904 | |
| | | | | | | | | | | | | | | | | | | | |
Gross income | | | 14,217,272 | | | | (132,439,333 | ) | | | 23,410,037 | | | | (19,662,012 | ) | | | (114,474,036 | ) |
Other (expenses) revenues, net | | | (19,805 | ) | | | (6,073,003 | ) | | | 1,828,642 | | | | 1,890,900 | | | | (2,373,266 | ) |
| | | | | | | | | | | | | | | | | | | | |
General expenses: | | | | | | | | | | | | | | | | | | | | |
Transportation, distribution and sale expenses | | | — | | | | 32,870,908 | | | | 2,921,430 | | | | (6,863,699 | ) | | | 28,928,639 | |
Administrative expenses | | | 59,923,878 | | | | 52,832,029 | | | | 10,638,127 | | | | (10,921,939 | ) | | | 112,472,095 | |
Benefit from change in pension plan | | | (46,031,780 | ) | | | (50,394,477 | ) | | | (7,434,698 | ) | | | — | | | | (103,860,955 | ) |
Total general expenses | | | 13,892,098 | | | | 35,308,460 | | | | 6,124,859 | | | | (17,785,638 | ) | | | 37,539,779 | |
| | | | | | | | | | | | | | | | | | | | |
Operating income | | | 305,369 | | | | (173,820,796 | ) | | | 19,113,820 | | | | 14,526 | | | | (154,387,081 | ) |
Financing income | | | 108,543,665 | | | | 28,639,034 | | | | 3,478,434 | | | | (125,670,274 | ) | | | 14,990,859 | |
Financing cost | | | (85,544,060 | ) | | | (104,453,148 | ) | | | (3,306,776 | ) | | | 125,530,391 | | | | (67,773,593 | ) |
Derivative financial instruments (cost) income, net | | | (22,803,663 | ) | | | 6,463 | | | | 1,347,323 | | | | — | | | | (21,449,877 | ) |
Foreign exchange loss, net | | | (14,829,436 | ) | | | (139,623,910 | ) | | | (312,228 | ) | | | — | | | | (154,765,574 | ) |
(Loss) profit sharing in associates and other | | | (749,963,960 | ) | | | 198,786 | | | | 2,119,329 | | | | 749,963,960 | | | | 2,318,115 | |
| | | | | | | | | | | | | | | | | | | | |
(Loss) income before taxes, duties and other | | | (764,292,085 | ) | | | (389,053,571 | ) | | | 22,439,902 | | | | 749,838,603 | | | | (381,067,151 | ) |
Total taxes, duties and other | | | (51,982,560 | ) | | | 376,649,369 | | | | 6,833,438 | | | | — | | | | 331,500,247 | |
| | | | | | | | | | | | | | | | | | | | |
Net (loss) income for the year | | | (712,309,525 | ) | | | (765,702,940 | ) | | | 15,606,464 | | | | 749,838,603 | | | | (712,567,398 | ) |
Total other comprehensive result | | | 10,980,787 | | | | 56,585,790 | | | | 21,045,777 | | | | — | | | | 88,612,354 | |
| | | | | | | | | | | | | | | | | | | | |
Total comprehensive result for the year | | Ps. | (701,328,738 | ) | | Ps. | (709,117,150 | ) | | Ps. | 36,652,241 | | | Ps. | 749,838,603 | | | Ps. | (623,955,044 | ) |
| | | | | | | | | | | | | | | | | | | | |
F-134
PETRÓLEOS MEXICANOS, PRODUCTIVE STATE-OWNED SUBSIDIARIES
AND SUBSIDIARY COMPANIES
NOTES TO THE CONSOLIDATED FINANCIAL STATEMENTS
FOR THE YEARS ENDED DECEMBER 31, 2016, 2015 AND 2014
(FIGURES STATED IN THOUSANDS, EXCEPT AS NOTED)
SUPPLEMENTAL CONDENSED CONSOLIDATING FINANCIAL INFORMATION
STATEMENT OF COMPREHENSIVE INCOME
For the year ended December 31, 2014
| | | | | | | | | | | | | | | | | | | | |
| | | Petróleos
Mexicanos | | | Subsidiary
guarantors | | | Non-guarantor
subsidiaries | | | Eliminations | | | PEMEX
consolidated | |
Net sales | | Ps. | 18,998 | | | | Ps. 2,213,875,692 | | | Ps. | 1,108,487,220 | | | Ps. | (1,747,092,618 | ) | | Ps. | 1,575,289,292 | |
Services income | | | 64,245,159 | | | | 6,055,328 | | | | 6,426,288 | | | | (65,288,193 | ) | | | 11,438,582 | |
| | | | | | | | | | | | | | | | | | | | |
Total sales revenues | | | 64,264,157 | | | | 2,219,931,020 | | | | 1,114,913,508 | | | | (1,812,380,811 | ) | | | 1,586,727,874 | |
Impairment of wells, pipelines, properties, plant and equipment | | | — | | | | 21,199,704 | | | | 1,445,992 | | | | — | | | | 22,645,696 | |
Cost of sales | | | 2,663,293 | | | | 1,492,165,034 | | | | 1,106,898,998 | | | | (1,759,092,541 | ) | | | 842,634,784 | |
Gross income | | | 61,600,864 | | | | 706,566,282 | | | | 6,568,518 | | | | (53,288,270 | ) | | | 721,447,394 | |
| | | | | | | | | | | | | | | | | | | | |
Other (expenses) revenues, net | | | 514,056 | | | | 36,518,256 | | | | 778,682 | | | | (258,597 | ) | | | 37,552,397 | |
| | | | | | | | | | | | | | | | | | | | |
General expenses: | | | | | | | | | | | | | | | | | | | | |
Transportation, distribution and sale expenses | | | — | | | | 34,095,556 | | | | 1,555,276 | | | | (3,468,166 | ) | | | 32,182,666 | |
Administrative expenses | | | 57,654,464 | | | | 86,112,895 | | | | 17,701,494 | | | | (50,131,739 | ) | | | 111,337,114 | |
| | | | | | | | | | | | | | | | | | | | |
Total general expenses | | | 57,654,464 | | | | 120,208,451 | | | | 19,256,770 | | | | (53,599,905 | ) | | | 143,519,780 | |
| | | | | | | | | | | | | | | | | | | | |
Operating income | | | 4,460,456 | | | | 622,876,087 | | | | (11,909,570 | ) | | | 53,038 | | | | 615,480,011 | |
Financing income | | | 85,565,363 | | | | 17,696,814 | | | | 3,106,401 | | | | (103,354,391 | ) | | | 3,014,187 | |
Financing cost | | | (67,194,647 | ) | | | (84,756,651 | ) | | | (2,973,111 | ) | | | 103,365,349 | | | | (51,559,060 | ) |
Derivative financial instruments (cost) income, net | | | (13,858,680 | ) | | | 8,116 | | | | 4,411,994 | | | | — | | | | (9,438,570 | ) |
Foreign exchange loss, net | | | (7,859,495 | ) | | | (69,076,040 | ) | | | (63,626 | ) | | | — | | | | (76,999,161 | ) |
(Loss) profit sharing in associates and other | | | (263,219,388 | ) | | | 487,365 | | | | (452,997 | ) | | | 263,219,388 | | | | 34,368 | |
| | | | | | | | | | | | | | | | | | | | |
(Loss) income before taxes, duties and other | | | (262,106,391 | ) | | | 487,235,691 | | | | (7,880,909 | ) | | | 263,283,384 | | | | 480,531,775 | |
Total taxes, duties and other | | | 3,160,818 | | | | 738,855,418 | | | | 4,058,528 | | | | — | | | | 746,074,764 | |
| | | | | | | | | | | | | | | | | | | | |
Net (loss) income for the year | | | (265,267,209 | ) | | | (251,619,727 | ) | | | (11,939,437 | ) | | | 263,283,384 | | | | (265,542,989 | ) |
Total other comprehensive result | | | (62,426,587 | ) | | | (189,804,290 | ) | | | (13,117,248 | ) | | | — | | | | (265,348,125 | ) |
| | | | | | | | | | | | | | | | | | | | |
Total comprehensive result for the year | | Ps. | (327,693,796 | ) | | Ps. | (441,424,017 | ) | | Ps. | (25,056,685 | ) | | Ps. | 263,283,384 | | | Ps. | (530,891,114 | ) |
| | | | | | | | | | | | | | | | | | | | |
F-135
PETRÓLEOS MEXICANOS, PRODUCTIVE STATE-OWNED SUBSIDIARIES
AND SUBSIDIARY COMPANIES
NOTES TO THE CONSOLIDATED FINANCIAL STATEMENTS
FOR THE YEARS ENDED DECEMBER 31, 2016, 2015 AND 2014
(FIGURES STATED IN THOUSANDS, EXCEPT AS NOTED)
SUPPLEMENTAL CONDENSED CONSOLIDATING FINANCIAL INFORMATION
STATEMENT OF CASH FLOWS
For the year ended December 31, 2016
| | | | | | | | | | | | | | | | | | | | |
| | | Petróleos
Mexicanos | | | Subsidiary
guarantors | | | Non-guarantor
subsidiaries | | | Eliminations | | | PEMEX
consolidated | |
Operating activities: | | | | | | | | | | | | | | | | | | | | |
Net (loss) income for the year | | Ps. | (191,311,476 | ) | | Ps. | (139,410,398 | ) | | | Ps. 22,160,755 | | | Ps. | 117,416,777 | | | Ps. | (191,144,342) | |
Adjustments to reconcile net loss to cash provided by operating activities: | | | | | | | | | | | | | | | | | | | | |
Depreciation and amortization | | | 1,066,033 | | | | 146,545,307 | | | | 2,828,151 | | | | — | | | | 150,439,491 | |
Impairment of wells, pipelines, properties, plant and equipment | | | — | | | | (330,037,834 | ) | | | (1,276,509 | ) | | | — | | | | (331,314,343 | ) |
Unsuccessful wells | | | — | | | | 29,106,084 | | | | — | | | | — | | | | 29,106,084 | |
Disposal of wells, pipelines, properties, plant and equipment | | | 320,599 | | | | 2,658,625 | | | | 792,063 | | | | — | | | | 3,771,287 | |
Loss in sale of fixed assets | | | — | | | | 27,882,480 | | | | — | | | | — | | | | 27,882,480 | |
Gain on sale of share in associates and other | | | — | | | | (15,211,039 | ) | | | — | | | | — | | | | (15,211,039 | ) |
Profit (loss) sharing in associates and other | | | 117,249,643 | | | | (628,356 | ) | | | (1,507,489 | ) | | | (117,249,643 | ) | | | (2,135,845 | ) |
Impairment of goodwill | | | — | | | | — | | | | 4,007,018 | | | | — | | | | 4,007,018 | |
Dividends | | | — | | | | — | | | | (293,397 | ) | | | — | | | | (293,397 | ) |
Effects of net present value of reserve for well abandonment | | | — | | | | 11,968,966 | | | | — | | | | — | | | | 11,968,966 | |
Amortization expenses related to debt issuance | | | (1,610,183 | ) | | | — | | | | — | | | | — | | | | (1,610,183 | ) |
Unrealized foreign exchange loss (gain) | | | 231,191,646 | | | | 6,754,046 | | | | 5,237,072 | | | | — | | | | 243,182,764 | |
Interest expense | | | 91,044,541 | | | | 5,687,502 | | | | 2,112,421 | | | | — | | | | 98,844,464 | |
Funds (used in) from operating activities: | | | | | | | | | | | | | | | | | | | | |
Accounts receivable, accounts payable and derivative financial instruments | | | 23,636,331 | | | | (158,449,370 | ) | | | 45,028,534 | | | | — | | | | (89,784,505 | ) |
Inventories | | | 83,317 | | | | 3,508,494 | | | | (4,950,690 | ) | | | — | | | | (1,358,879 | ) |
Other assets | | | (2,405,412 | ) | | | (22,600,504 | ) | | | (122,614 | ) | | | — | | | | (25,128,530 | ) |
Employee benefits | | | 2,591,000 | | | | 136,354,337 | | | | (91,652,268 | ) | | | — | | | | 47,293,069 | |
Inter-company charges and deductions | | | (393,835,932 | ) | | | (83,049,125 | ) | | | 48,435,633 | | | | 428,449,424 | | | | — | |
| | | | | | | | | | | | | | | | | | | | |
Cash flows (used in) from operating activities | | | (121,979,893 | ) | | | (378,920,785 | ) | | | 30,798,680 | | | | 428,616,558 | | | | (41,485,440 | ) |
Investing activities: | | | | | | | | | | | | | | | | | | | | |
Acquisition of wells, pipelines, properties, plant and equipment | | | (2,172,586 | ) | | | (147,786,686 | ) | | | (1,449,208 | ) | | | — | | | | (151,408,480 | ) |
Exploration costs | | | — | | | | (2,022,826 | ) | | | — | | | | — | | | | (2,022,826 | ) |
Resources from sale on share in associates | | | — | | | | 23,050,344 | | | | (365,608 | ) | | | — | | | | 22,684,736 | |
Proceeds from the sale of fixed assets | | | — | | | | — | | | | (4,329,769 | ) | | | — | | | | (4,329,769 | ) |
(Increase) decrease due to Inter-company investing | | | (39,612,699 | ) | | | — | | | | — | | | | 39,612,699 | | | | — | |
| | | | | | | | | | | | | | | | | | | | |
Cash flows used in investing activities | | | (41,785,285 | ) | | | (126,198,503 | ) | | | (6,144,585 | ) | | | 39,612,699 | | | | (134,515,674 | ) |
Financing activities: | | | | | | | | | | | | | | | | | | | | |
Increase in equity due to Certificates of Contributions “A” | | | 73,500,000 | | | | — | | | | — | | | | — | | | | 73,500,000 | |
Loans obtained from financial institutions | | | 571,944,209 | | | | 34,483,348 | | | | 235,564,210 | | | | — | | | | 841,991,767 | |
Debt payments, principal only | | | (371,198,983 | ) | | | (6,414,441 | ) | | | (235,763,722 | ) | | | — | | | | (613,377,146 | ) |
Interest paid | | | (82,008,347 | ) | | | (4,706,946 | ) | | | (2,038,848 | ) | | | — | | | | (88,754,141 | ) |
Inter-company increase (decrease) financing | | | — | | | | 464,488,030 | | | | 3,741227 | | | | (468,229,257 | ) | | | — | |
| | | | | | | | | | | | | | | | | | | | |
Cash flows provided by financing activities: | | | 192,236,879 | | | | 487,849,991 | | | | 1,502,867 | | | | (468,229,257 | ) | | | 213,360,480 | |
| | | | | | | | | | | | | | | | | | | | |
Net (decrease) increase in cash and cash equivalents | | | 28,471,701 | | | | (17,269,297 | ) | | | 26,156,962 | | | | — | | | | 37,359,366 | |
Effects of change in cash value | | | 5,570,892 | | | | 20,371,126 | | | | (9,137,751 | ) | | | — | | | | 16,804,267 | |
Cash and cash equivalents at the beginning of the year | | | 58,461,014 | | | | 6,630,674 | | | | 44,277,192 | | | | — | | | | 109,368,880 | |
| | | | | | | | | | | | | | | | | | | | |
Cash and cash equivalents at the end of the year | | Ps. | 92,503,607 | | | Ps. | 9,732,503 | | | | Ps. 61,296,403 | | | Ps. | — | | | Ps. | 163,532,513 | |
| | | | | | | | | | | | | | | | | | | | |
F-136
PETRÓLEOS MEXICANOS, PRODUCTIVE STATE-OWNED SUBSIDIARIES
AND SUBSIDIARY COMPANIES
NOTES TO THE CONSOLIDATED FINANCIAL STATEMENTS
FOR THE YEARS ENDED DECEMBER 31, 2016, 2015 AND 2014
(FIGURES STATED IN THOUSANDS, EXCEPT AS NOTED)
SUPPLEMENTAL CONDENSED CONSOLIDATING FINANCIAL INFORMATION
STATEMENT OF CASH FLOWS
For the year ended December 31, 2015
| | | | | | | | | | | | | | | | | | | | |
| | | Petróleos
Mexicanos | | | Subsidiary
guarantors | | | Non-guarantor
subsidiaries | | | Eliminations | | | PEMEX
consolidated | |
Operating activities: | | | | | | | | | | | | | | | | | | | | |
Net (loss) income for the year | | Ps. | (712,177,124 | ) | | Ps. | (765,702,826 | ) | | Ps. | 15,738,868 | | | Ps. | 749,573,684 | | | Ps. | (712,567,398 | ) |
Adjustments to reconcile net loss to cash provided by operating activities: | | | | | | | | | | | | | | | | | | | | |
Depreciation and amortization | | | 789,657 | | | | 164,221,429 | | | | 2,940,164 | | | | — | | | | 167,951,250 | |
Impairment of wells, pipelines, properties, plant and equipment | | | — | | | | 476,276,159 | | | | 1,668,531 | | | | — | | | | 477,944,690 | |
Unsuccessful wells | | | — | | | | 23,213,519 | | | | — | | | | — | | | | 23,213,519 | |
Disposal of wells, pipelines, properties, plant and equipment | | | 180,992 | | | | 21,945,266 | | | | 2,512,279 | | | | — | | | | 24,638,537 | |
Profit (loss) sharing in associates and other | | | 749,963,958 | | | | (198,786 | ) | | | (2,119,329 | ) | | | (749,963,958 | ) | | | (2,318,115 | ) |
Net profit (loss) onavailable-for-sale financial assets | | | — | | | | (337,675 | ) | | | (342,955 | ) | | | — | | | | (680,630 | ) |
Dividends | | | — | | | | — | | | | (359,941 | ) | | | — | | | | (359,941 | ) |
Effects of net present value of reserve for well abandonment | | | — | | | | (608,160 | ) | | | — | | | | — | | | | (608,160 | ) |
Amortization expenses related to debt issuance | | | (2,299,657 | ) | | | — | | | | — | | | | — | | | | (2,299,657 | ) |
Unrealized foreign exchange loss (gain) | | | 145,971,158 | | | | 2,996,219 | | | | 3,708,879 | | | | — | | | | 152,676,256 | |
Interest expense | | | 63,460,443 | | | | 3,414,430 | | | | 898,720 | | | | — | | | | 67,773,593 | |
Funds provided by (used in) operating activities: | | | | | | | | | | | | | | | | | | | | |
Accounts receivable, accounts payable and derivative financial instruments | | | (58,554,144 | ) | | | 119,761,648 | | | | (27,777,939 | ) | | | — | | | | 33,429,565 | |
Inventories | | | 108,568 | | | | 4,547,843 | | | | 1,511,317 | | | | — | | | | 6,167,728 | |
Other assets | | | (149,819 | ) | | | (16,578,827 | ) | | | 126,281 | | | | — | | | | (16,602,365 | ) |
Employee benefits | | | (10,037,444 | ) | | | (94,183,192 | ) | | | (11,801,596 | ) | | | — | | | | (116,022,232 | ) |
Inter-company charges and deductions | | | (310,384,820 | ) | | | 30,044,041 | | | | 31,975,215 | | | | 248,365,564 | | | | — | |
| | | | | | | | | | | | | | | | | | | | |
Cash flows provided by operating activities | | | (133,128,232 | ) | | | (31,188,912 | ) | | | 18,678,494 | | | | 247,975,290 | | | | 102,336,640 | |
Investing activities: | | | | | | | | | | | | | | | | | | | | |
Acquisition of wells, pipelines, properties, plant and equipment | | | (1,496,277 | ) | | | (239,315,507 | ) | | | (12,702,217 | ) | | | — | | | | (253,514,001 | ) |
Available-for-sale financial assets | | | | | | | | | | | | | | | | | | | | |
Investments in associates | | | — | | | | — | | | | (36,214 | ) | | | — | | | | (36,214 | ) |
Exploration costs | | | — | | | | (5,698,511 | ) | | | — | | | | — | | | | (5,698,511 | ) |
Received dividends | | | — | | | | (130,323 | ) | | | 4,547,461 | | | | — | | | | 4,417,138 | |
(Increase) decrease due to Inter-company investing | | | (39,108,879 | ) | | | — | | | | — | | | | 39,108,879 | | | | — | |
| | | | | | | | | | | | | | | | | | | | |
Cash flows used in investing activities | | | (40,605,156 | ) | | | (245,144,341 | ) | | | (8,190,970 | ) | | | 39,108,879 | | | | (254,831,588 | ) |
Financing activities: | | | | | | | | | | | | | | | | | | | | |
Increase in equity due to Certificates of Contributions “A” | | | 10,000,000 | | | | (1,915,922 | ) | | | 1,844,394 | | | | 71,528 | | | | 10,000,000 | |
Loans obtained from financial institutions | | | 345,383,990 | | | | — | | | | 33,587,088 | | | | — | | | | 378,971,078 | |
Debt payments, principal only | | | (145,628,200 | ) | | | (8,081,177 | ) | | | (37,609,464 | ) | | | — | | | | (191,318,841 | ) |
Interest paid | | | (58,123,368 | ) | | | (3,443,923 | ) | | | (1,169,859 | ) | | | — | | | | (62,737,150 | ) |
Inter-company increase (decrease) financing | | | (3,626,448 | ) | | | 289,859,193 | | | | 922,972 | | | | (287,155,717 | ) | | | — | |
| | | | | | | | | | | | | | | | | | | | |
Cash flows provided by financing activities: | | | 148,005,974 | | | | 276,418,151 | | | | (2,424,869 | ) | | | (287,084,169 | ) | | | 134,915,087 | |
| | | | | | | | | | | | | | | | | | | | |
Net (decrease) increase in cash and cash equivalents | | | (25,727,414 | ) | | | 84,898 | | | | 8,062,655.00 | | | | — | | | | (17,579,861 | ) |
Effects of change in cash value | | | 11,185,788 | | | | 1,138,356 | | | | (3,363,931 | ) | | | — | | | | 8,960,213 | |
Cash and cash equivalents at the beginning of the year | | | 73,002,640 | | | | 5,407,420 | | | | 39,578,468 | | | | — | | | | 117,988,528 | |
| | | | | | | | | | | | | | | | | | | | |
Cash and cash equivalents at the end of the year | | Ps. | 58,461,014 | | | Ps. | 6,630,674 | | | Ps. | 44,277,192 | | | Ps. | — | | | Ps. | 109,368,880 | |
| | | | | | | | | | | | | | | | | | | | |
F-137
PETRÓLEOS MEXICANOS, PRODUCTIVE STATE-OWNED SUBSIDIARIES
AND SUBSIDIARY COMPANIES
NOTES TO THE CONSOLIDATED FINANCIAL STATEMENTS
FOR THE YEARS ENDED DECEMBER 31, 2016, 2015 AND 2014
(FIGURES STATED IN THOUSANDS, EXCEPT AS NOTED)
SUPPLEMENTAL CONDENSED CONSOLIDATING FINANCIAL INFORMATION
STATEMENT OF CASH FLOWS
For the year ended December 31, 2014
| | | | | | | | | | | | | | | | | | | | |
| | | Petróleos
Mexicanos | | | Subsidiary
guarantors | | | Non-guarantor
subsidiaries | | | Eliminations | | | PEMEX
consolidated | |
Operating activities: | | | | | | | | | | | | | | | | | | | | |
Net (loss) income for the year | | Ps. | (265,267,209 | ) | | Ps. | (251,619,727 | ) | | Ps. | (11,939,437 | ) | | Ps. | 263,283,384 | | | Ps. | (265,542,989 | ) |
Adjustments to reconcile net loss to cash provided by operating activities: | | | | | | | | | | | | | | | | | | | | |
Depreciation and amortization | | | 744,081 | | | | 139,522,310 | | | | 2,808,396 | | | | — | | | | 143,074,787 | |
Impairment of wells, pipelines, properties, plant and equipment | | | — | | | | 21,199,704 | | | | 1,445,992 | | | | — | | | | 22,645,696 | |
Unsuccessful wells | | | — | | | | 12,148,028 | | | | — | | | | — | | | | 12,148,028 | |
Disposal of wells, pipelines, properties, plant and equipment | | | 211,414 | | | | 3,499,602 | | | | 2,659,921 | | | | — | | | | 6,370,937 | |
Net loss (profit) onavailable-for-sale financial assets | | | — | | | | — | | | | 215,119 | | | | — | | | | 215,119 | |
Profit (loss) sharing in associates and other | | | 263,559,164 | | | | (487,365 | ) | | | 452,997 | | | | (263,559,164 | ) | | | (34,368 | ) |
Dividends | | | — | | | | — | | | | (736,302 | ) | | | — | | | | (736,302 | ) |
Effects of net present value of reserve for well abandonment | | | — | | | | 9,169,327 | | | | — | | | | — | | | | 9,169,327 | |
Amortization expenses related to debt issuance | | | 312,296 | | | | — | | | | — | | | | — | | | | 312,296 | |
Unrealized foreign exchange loss (gain) | | | 75,053,801 | | | | 1,903,282 | | | | 1,927,634 | | | | — | | | | 78,884,717 | |
Interest expense | | | 44,969,920 | | | | 5,084,856 | | | | 854,848 | | | | — | | | | 50,909,624 | |
Funds provided by (used in) operating activities: | | | | | | | | | | | | | | | | | | | | |
Accounts receivable, accounts payable and derivative financial instruments | | | 14,951,048 | | | | (19,048,441 | ) | | | 14,075,687 | | | | — | | | | 9,978,294 | |
Inventories | | | 20,413 | | | | (5,046,019 | ) | | | 12,001,450 | | | | — | | | | 6,975,844 | |
Other assets | | | (227,438 | ) | | | (17,819,505 | ) | | | (937,934 | ) | | | — | | | | (18,984,877 | ) |
Employee benefits | | | 17,913,078 | | | | 52,988,257 | | | | 8,068,673 | | | | — | | | | 78,970,008 | |
Inter-company charges and deductions | | | (274,747,392 | ) | | | 37,103,048 | | | | (13,393,984 | ) | | | 251,038,328 | | | | — | |
| | | | | | | | | | | | | | | | | | | | |
Cash flows provided by operating activities | | | (122,506,824 | ) | | | (11,402,643 | ) | | | 17,503,050 | | | | 250,762,548 | | | | 134,356,131 | |
| | | | | | | | | | | | | | | | | | | | |
Investing activities: | | | | | | | | | | | | | | | | | | | | |
Acquisition of wells, pipelines, properties, plant and equipment | | | (2,574,431 | ) | | | (215,531,732 | ) | | | (12,572,707 | ) | | | — | | | | (230,678,870 | ) |
Available-for-sale financial assets | | | — | | | | — | | | | 12,735,337 | | | | — | | | | 12,735,337 | |
(Increase) decrease due to Inter-company investing | | | — | | | | — | | | | (3,466,447 | ) | | | — | | | | (3,466,447 | ) |
Exploration costs | | | — | | | | (1,593,706 | ) | | | — | | | | — | | | | (1,593,706 | ) |
Received dividends | | | — | | | | — | | | | 336,095 | | | | — | | | | 336,095 | |
Investments in associates | | | 7,942,930 | | | | — | | | | — | | | | (7,942,930 | ) | | | — | |
| | | | | | | | | | | | | | | | | | | | |
Cash flows used in investing activities | | | 5,368,499 | | | | (217,125,438 | ) | | | (2,967,722 | ) | | | (7,942,930 | ) | | | (222,667,591 | ) |
Financing activities: | | | | | | | | | | | | | | | | | | | | |
Increase in equity due to Certificates of Contributions “A” | | | 22,000,000 | | | | — | | | | — | | | | — | | | | 22,000,000 | |
Withdrawal of Mexican Government contributions | | | (73,583,100 | ) | | | — | | | | — | | | | — | | | | (73,583,100 | ) |
Loans obtained from financial institutions | | | 320,893,270 | | | | — | | | | 102,506,205 | | | | — | | | | 423,399,475 | |
Debt payments, principal only | | | (93,488,805 | ) | | | (7,748,079 | ) | | | (106,218,608 | ) | | | — | | | | (207,455,492 | ) |
Interest paid | | | (41,091,971 | ) | | | (5,105,446 | ) | | | (1,051,061 | ) | | | — | | | | (47,248,478 | ) |
Inter-company increase (decrease) financing | | | 687,961 | | | | 240,568,067 | | | | 1,563,590 | | | | (242,819,618 | ) | | | — | |
| | | | | | | | | | | | | | | | | | | | |
Cash flows provided by financing activities: | | | 135,417,355 | | | | 227,714,542 | | | | (3,199,874 | ) | | | (242,819,618 | ) | | | 117,112,405 | |
| | | | | | | | | | | | | | | | | | | | |
Net (decrease) increase in cash and cash equivalents | | | 18,279,030 | | | | (813,539 | ) | | | 11,335,454 | | | | — | | | | 28,800,945 | |
Effects of change in cash value | | | 4,592,205 | | | | 889,057 | | | | 2,960,602 | | | | — | | | | 8,441,864 | |
Cash and cash equivalents at the beginning of the year | | | 50,131,405 | | | | 5,331,902 | | | | 25,282,412 | | | | — | | | | 80,745,719 | |
| | | | | | | | | | | | | | | | | | | | |
Cash and cash equivalents at the end of the year | | Ps. | 73,002,640 | | | Ps. | 5,407,420 | | | Ps. | 39,578,468 | | | Ps. | — | | | Ps. | 117,988,528 | |
| | | | | | | | | | | | | | | | | | | | |
F-138
PETRÓLEOS MEXICANOS, PRODUCTIVE STATE-OWNED SUBSIDIARIES
AND SUBSIDIARY COMPANIES
NOTES TO THE CONSOLIDATED FINANCIAL STATEMENTS
FOR THE YEARS ENDED DECEMBER 31, 2016, 2015 AND 2014
(FIGURES STATED IN THOUSANDS, EXCEPT AS NOTED)
NOTE 29. SUPPLEMENTARY INFORMATION ON OIL AND GAS EXPLORATION AND PRODUCTION ACTIVITIES (UNAUDITED)
Under the Mexican Constitution, all crude oil and other hydrocarbon reserves located in the subsoil of Mexico are owned by the Mexican nation and not by PEMEX. In August 2014, through the Round Zero process, the Mexican Government granted PEMEX the right to extract, but not own, certain petroleum and other hydrocarbon reserves in Mexico through assignment deeds.
This note provides supplementary information on the oil and gas exploration, development and production activities of Pemex Exploration and Production in compliance with the U.S. Financial Accounting Standards Board (FASB) Accounting Standards Codification (ASC) Topic 93210-5 “Extractive Activities—Oil and Gas” (“ASC Topic 932”) and Accounting Standards Update2010-03 (see Note 3(i)).
As of the date of these consolidated financial statements, all exploration and production activities of Pemex Exploration and Production are conducted in Mexico. The supplemental data presented herein reflect information for all of Pemex Exploration and Production’s oil and gas producing activities.
| a. | Capitalized costs for oil and gas producing activities (unaudited): |
| | | | | | | | | | | | |
| | | As of December 31, | |
| | | 2016 | | | 2015 | | | 2014 | |
Proved reserves | | Ps. | 2,476,535,503 | | | Ps. | 2,102,971,025 | | | Ps. | 2,381,670,263 | |
Construction in progress | | | 60,720,261 | | | | 88,706,330 | | | | 111,812,137 | |
Accumulated depreciation and amortization | | | (1,355,402,150 | ) | | | (1,224,690,867 | ) | | | (1,122,444,895 | ) |
| | | | | | | | | | | | |
Net capitalized costs | | Ps. | 1,181,853,614 | | | Ps. | 966,986,487 | | | Ps. | 1,371,037,505 | |
| | | | | | | | | | | | |
| b. | Costs incurred for oil and gas property exploration and development activities (unaudited): |
| | | | | | | | |
| | | As of December 31, | |
| | | 2016 | | | 2015 | |
Exploration | | Ps. | 41,661,666 | | | Ps. | 44,165,179 | |
Development | | | 113,895,246 | | | | 161,433,414 | |
| | | | | | | | |
Total costs incurred | | Ps. | 155,556,912 | | | Ps. | 205,598,593 | |
| | | | | | | | |
There are no property acquisition costs because PEMEX exploits oil reserves owned by the Mexican nation.
Exploration costs include costs for geological and geophysical studies of fields amounting to Ps. 6,804,341 and Ps. 8,119,241 for 2016 and 2015, respectively, that, in accordance with the successful efforts method of accounting, are accounted for as geological and geophysical exploration expenses.
Development costs include costs incurred in obtaining access to proved reserves and providing facilities for extracting, treating, gathering and storing oil and gas.
F-139
PETRÓLEOS MEXICANOS, PRODUCTIVE STATE-OWNED SUBSIDIARIES
AND SUBSIDIARY COMPANIES
NOTES TO THE CONSOLIDATED FINANCIAL STATEMENTS
FOR THE YEARS ENDED DECEMBER 31, 2016, 2015 AND 2014
(FIGURES STATED IN THOUSANDS, EXCEPT AS NOTED)
| c. | Results of operations for oil and gas producing activities (unaudited): |
| | | | | | | | | | | | |
| | | 2016 | | | 2015 | | | 2014 | |
Revenues from sale of oil and gas | | Ps. | 616,380,608 | | | Ps. | 690,591,455 | | | Ps. | 1,134,448,708 | |
| | | | | | | | | | | | |
Hydrocarbon duties | | | 304,299,019 | | | | 376,682,705 | | | | 760,627,534 | |
Production costs (excluding taxes) | | | 171,194,337 | | | | 177,774,082 | | | | 156,134,037 | |
Other costs and expenses | | | 61,359,271 | | | | 20,360,540 | | | | 35,978,232 | |
Exploration expenses | | | 39,693,273 | | | | 31,244,564 | | | | 22,291,247 | |
Depreciation, depletion, amortization and accretion | | | (150,891,739 | ) | | | 527,014,056 | | | | 144,384,138 | |
| | | | | | | | | | | | |
| | | 425,654,161 | | | | 1,133,075,947 | | | | 1,119,415,188 | |
| | | | | | | | | | | | |
Results of operations for oil and gas producing activities | | Ps. | 190,726,447 | | | Ps. | (442,484,491 | ) | | Ps. | 15,033,520 | |
| | | | | | | | | | | | |
Note: Numbers may not total due to rounding.
| d. | Sales prices (unaudited) |
The following table summarizes average sales prices in U.S. dollars for each of the years ended December 31 (excluding production taxes):
| | | | | | | | | | | | |
| | | 2016 | | | 2015 | | | 2014 | |
Weighted average sales price per barrel of oil equivalent (boe)(1) | | US$ | 29.18 | | | US$ | 37.17 | | | US$ | 71.44 | |
Crude oil, per barrel | | | 36.55 | | | | 48.22 | | | | 90.37 | |
Natural gas, per thousand cubic feet | | | 3.01 | | | | 3.78 | | | | 5.71 | |
| (1) | To convert dry gas to barrels of oil equivalent, a factor of 5.201 thousand cubic feet of dry gas per barrel of oil equivalent is used. |
| e. | Crude oil and natural gas reserves (unaudited) |
Under the Mexican Constitution, all oil and other hydrocarbon reserves located in the subsoil of Mexico are owned by the Mexican nation and not by PEMEX. Under the Petróleos Mexicanos Law, Pemex Exploration and Production has the right to extract, but not own, these reserves, and to sell the resulting production. The exploration and development activities of Petróleos Mexicanos and the Subsidiary Entities are limited to reserves located in Mexico.
Proved oil and natural gas reserves are those estimated quantities of crude oil, natural gas and natural gas liquids which geological and engineering data demonstrate with reasonable certainty to be economically producible from a given date forward, from known reservoirs and under existing economic conditions, operating methods and government regulations.
Proved reserves estimates as of December 31, 2016 were prepared by the exploration and production segment and were reviewed by the Independent Engineering Firms (as defined below), which audit its estimates of its hydrocarbon reserves. In addition, pursuant to the Reglamento de la Ley de Hidrocarburos (Regulations to the Hydrocarbons Law), on March 31, 2017 theComisión Nacional de Hidrocarburos reviewed and approved the proved reserves estimates as of December 31, 2016.
F-140
PETRÓLEOS MEXICANOS, PRODUCTIVE STATE-OWNED SUBSIDIARIES
AND SUBSIDIARY COMPANIES
NOTES TO THE CONSOLIDATED FINANCIAL STATEMENTS
FOR THE YEARS ENDED DECEMBER 31, 2016, 2015 AND 2014
(FIGURES STATED IN THOUSANDS, EXCEPT AS NOTED)
Pemex-Exploration and Production estimated reserves based on generally accepted petroleum engineering and evaluation methods and procedures, which are based primarily on applicable SEC regulations and, as necessary, the SPE’s publication entitled Standards Pertaining to the Estimating and Auditing of Oil and Gas Reserves Information, dated February 19, 2007 and other SPE publications, including the SPE’s publication entitled Petroleum Resources Management System, as well as other technical sources, including Estimation and Classification of Reserves of Crude Oil, Natural Gas, and Condensate, by Chapman Cronquist, and Determination of Oil and Gas Reserves, Petroleum Society Monograph Number 1, published by the Canadian Institute of Mining and Metallurgy & Petroleum. The choice of method or combination of methods employed in the analysis of each reservoir is determined by:
| | • | | Experience in the area. |
| | • | | Quality and completeness of basic data. |
| | • | | Production and pressure histories. |
Reserves data set forth herein represents only estimates. Reserves valuation is a subjective process of estimating underground accumulations of crude oil and natural gas that cannot be measured in an exact manner. The accuracy of any reserves estimate depends on the quality of available data, engineering and geological interpretation and professional judgment. As a result, estimates of different engineers may vary. In addition, the results of drilling, testing and producing subsequent to the date of an estimate may lead to the revision of an estimate.
During 2016, PEMEX did not record any material increase in PEMEX’s hydrocarbons reserves as a result of the use of new technologies.
In order to ensure the reliability of PEMEX’s reserves estimation efforts, it has undertaken the internal certification of its estimates of reserves since 1996. PEMEX has established certain internal controls in connection with the preparation of its proved reserves estimates. Initially, teams of geoscientists fromPemex-Exploration and Production’s exploration and exploitation business units (with each of these units covering several projects) prepare the reserves estimates, using distinct estimation processes for valuations relating to new discoveries and developed fields, respectively. Subsequently, the regional reserves offices collect these reserves estimates from the units and request that theGerencia de Recursos y Certificación de Reservas (Office of Resources and Reserves Certification), the central hydrocarbon reserves management body of Pemex-Exploration and Production, review and certify such valuations and the booking of the related reserves. This internal certification process is undertaken in accordance with internal guidelines for estimating and classifying hydrocarbon reserves, which are based on the SEC’s rules and definitions. The Office of Resources and Reserves Certification, which additionally oversees and conducts an internal audit of the above process, consists entirely of professionals with geological, geophysical, petrophysical and reservoir engineering backgrounds. The engineers who participate in PEMEX’s reserves estimation process are experienced in: reservoir numerical simulation; well drilling and completion; pressure, volume and temperature (PVT) analysis; analytical tools used in forecasting the performance of the various elements comprising the production system; and design strategies in petroleum field development. Furthermore, all of PEMEX’s personnel have been certified by theSecretaría de Educación Pública (Ministry of Public Education), most have earned master’s degrees in areas of study such as petroleum engineering, geology and geophysical engineering and they possess an average of over fifteen years of professional experience.
F-141
PETRÓLEOS MEXICANOS, PRODUCTIVE STATE-OWNED SUBSIDIARIES
AND SUBSIDIARY COMPANIES
NOTES TO THE CONSOLIDATED FINANCIAL STATEMENTS
FOR THE YEARS ENDED DECEMBER 31, 2016, 2015 AND 2014
(FIGURES STATED IN THOUSANDS, EXCEPT AS NOTED)
In addition to this internal review process, Pemex Exploration and Production’s final reserves estimates are audited by independent engineering firms. Three independent engineering firms audited Pemex Exploration and Production’s estimates of proved reserves as of December 31, 2016: Netherland Sewell International, S. de R. L. de C. V. (“Netherland Sewell”); DeGolyer and MacNaughton (“DeGolyer”); and Ryder Scott Company, L.P. (“Ryder Scott,”) and, together with Netherland Sewell and DeGolyer and MacNaughton, the “Independent Engineering Firms”). The reserves estimates reviewed by the Independent Engineering Firms totaled 97.6% of PEMEX’s estimated proved reserves. The remaining 2.4% of PEMEX’s estimated proved reserves consisted of reserves located in certain areas in which third parties provide drilling services to Pemex Exploration and Production. Under such agreements, the corresponding third party is responsible for assessing the volume of reserves. Netherland Sewell audited the reserves in the Poza Rica-Altamira, Aceite Terciario del Golfo and Litoral de Tabasco Assets, DeGolyer in Burgos and Veracruz Assets and Ryder Scott audited the reserves in the Bellota-Jujo, Cinco Presidentes, Macuspana-Muspac, Samaria-Luna,Abkatún-Pol-Chuc, Cantarell andKu-Maloob-Zaap Assets. The audits conducted by the Independent Engineering Firms consisted primarily of: (1) analysis of historical static and dynamic reservoir data provided by Pemex-Exploration and Production; (2) construction or updating of the Independent Engineering Firms’ own static and dynamic reservoir characterization models of some of the fields; (3) economic analysis of the fields; and (4) review of Pemex Exploration and Production’s production forecasts and reserves estimates.
Since reserves estimates are, by definition, only estimates, they cannot be reviewed for the purpose of verifying exactness. Instead, the Independent Engineering Firms conducted a detailed review of Pemex Exploration and Production’s reserves estimates so that they could express an opinion as to whether, in the aggregate, the reserves estimates that Pemex Exploration and Production furnished were reasonable and had been estimated and presented in conformity with generally accepted petroleum engineering and evaluation methods and procedures.
All questions, including any suggested modifications to proved reserves estimates, that arose during the Independent Engineering Firms’ review process were resolved by Pemex Exploration and Production to the satisfaction of the Independent Engineering Firms. The Independent Engineering Firms have concluded that PEMEX’s estimated total proved oil and natural gas reserve volumes set forth in this report are, in the aggregate, reasonable and have been prepared in accordance with Rule4-10(a) are consistent with international reserves reporting practice and are in accordance with the revised oil and gas reserves disclosure provisions of ASC Topic 932.
PEMEX’s total proved developed and undeveloped reserves of crude oil, condensates and liquefiable hydrocarbons recoverable from field processing plants decreased by 9.5% in 2016, from 7,977 million barrels at December 31, 2015 to 7,219 million barrels at December 31, 2016. Its proved developed reserves of crude oil, condensates and liquefiable hydrocarbons recoverable from processing plants decreased by 14.7% in 2016, from 5,724 million barrels at December 31, 2015 to Ps. 4,886 million barrels at December 31, 2016. These decreases were principally due to the production of oil in 2016, lower prices of hydrocarbons, as well as a decrease in field development and field behavior. The amount of crude oil, condensate and liquefiable hydrocarbon reserves added in 2016 was insufficient to offset the level of production in 2016, which amounted to 891 million barrels of crude oil, condensates and liquefiable hydrocarbons.
PEMEX’s total proved developed and undeveloped dry gas reserves decreased by 18.9 % in 2016, from 8,610 billion cubic feet at December 31, 2015 to 6,984 billion cubic feet at December 31, 2016. Its proved developed dry gas reserves decreased by 24.9% in 2016, from 6,012 billion cubic feet at December 31, 2015 to
F-142
PETRÓLEOS MEXICANOS, PRODUCTIVE STATE-OWNED SUBSIDIARIES
AND SUBSIDIARY COMPANIES
NOTES TO THE CONSOLIDATED FINANCIAL STATEMENTS
FOR THE YEARS ENDED DECEMBER 31, 2016, 2015 AND 2014
(FIGURES STATED IN THOUSANDS, EXCEPT AS NOTED)
4,513 billion cubic feet at December 31, 2016. These decreases were principally due to the production of gas in 2016, low prices of hydrocarbons, as well as a decrease in field development and field behavior. The amount of dry gas reserves added in 2016 was insufficient to offset the level of production in 2016, which amounted to 1,134 billion cubic feet of dry gas. Its proved undeveloped dry gas reserves decreased by 4.9 % in 2016, from 2,598 billion cubic feet at December 31, 2015 to 2,471 billion cubic feet at December 31, 2016.
During 2016, the exploratory activity in shallow waters incorporated 57 million barrels of oil equivalent coming from one new field located close to existing facilities of exploitation through exploration assignments. Pemex Exploration and Production keep the exploratory jobs in shallow waters in order to incorporate proved reserves which support the future fresh production in short term.
The following three tables of crude oil and dry gas reserves set forth PEMEX’s estimates of its proved reserves determined in accordance with Rule4-10(a).
Summary of oil and gas(1) proved reserves as of December 31, 2016
based on average fiscal year prices
| | | | | | | | |
| | | Crude oil and Condensates(2) | | | Dry Gas(3) | |
| | | (in millions of barrels) | | | (in billions of cubic feet) | |
Proved developed and undeveloped reserves: | | | | | | | | |
Proved developed reserves | | | 4,886 | | | | 4,513 | |
Proved undeveloped reserves | | | 2,333 | | | | 2,471 | |
| | | | | | | | |
Total proved reserves | | | 7,219 | | | | 6,984 | |
| | | | | | | | |
Note: Numbers may not total due to rounding.
| | (1) | PEMEX does not currently produce synthetic oil or synthetic gas, or other natural resources from which synthetic oil or synthetic gas can be produced. |
| | (2) | Crude oil and condensate reserves include the fraction of liquefiable hydrocarbons recoverable in natural gas processing plants located at fields. |
| | (3) | Reserve volumes reported in this table are volumes of dry gas, although natural gas production reported in other tables refers to sour wet gas. There is a shrinkage in volume when natural gas liquids and impurities are extracted to obtain dry gas. Therefore, reported natural gas volumes are greater than dry gas volumes. |
Source: Pemex Exploration and Production.
F-143
PETRÓLEOS MEXICANOS, PRODUCTIVE STATE-OWNED SUBSIDIARIES
AND SUBSIDIARY COMPANIES
NOTES TO THE CONSOLIDATED FINANCIAL STATEMENTS
FOR THE YEARS ENDED DECEMBER 31, 2016, 2015 AND 2014
(FIGURES STATED IN THOUSANDS, EXCEPT AS NOTED)
Crude oil and condensate reserves
(including natural gas liquids)(1)
| | | | | | | | | | | | |
| | | 2016 | | | 2015 | | | 2014 | |
| | | (in millions of barrels) | |
Proved developed and undeveloped reserves: | | | | |
At January 1 | | | 7,977 | | | | 10,292 | | | | 11,079 | |
Revisions (2) | | | 189 | | | | (1,491 | ) | | | 95 | |
Extensions and discoveries | | | (55 | ) | | | 111 | | | | 119 | |
Production | | | (891 | ) | | | (935 | ) | | | (1001 | ) |
| | | | | | | | | | | | |
At December 31 | | | 7,219 | | | | 7,977 | | | | 10,292 | |
| | | | | | | | | | | | |
Proved developed reserves at December 31 | | | 4,886 | | | | 5,725 | | | | 7,141 | |
Proved undeveloped reserves at December 31 | | | 2,333 | | | | 2,252 | | | | 3,719 | |
Note: Numbers may not total due to rounding.
| (1) | Crude oil and condensate reserves include the fraction of liquefiable hydrocarbons recoverable in natural gas processing plants located at fields. |
| (2) | Revisions include positive and negative changes due to new data from well drilling, revisions made when actual reservoir performance differs from expected performance and changes by hydrocarbon prices. |
Source: Pemex Exploration and Production.
Dry gas reserves
| | | | | | | | | | | | |
| | | 2016 | | | 2015 | | | 2014 | |
| | | (in billions of cubic feet) | |
Proved developed and undeveloped reserves: | | | | |
At January 1 | | | 8,610 | | | | 10,859 | | | | 12,273 | |
Revisions(1) | | | (183 | ) | | | (955 | ) | | | 4 | |
Extensions and discoveries | | | (308 | ) | | | 47 | | | | 93 | |
Production(2) | | | (1,134 | ) | | | 1,341 | ) | | | (1,511 | ) |
| | | | | | | | | | | | |
At December 31 | | | 6,984 | | | | 8,610 | | | | 10,859 | |
| | | | | | | | | | | | |
Proved developed reserves at December 31 | | | 4,513 | | | | 6,012 | | | | 6,740 | |
Proved undeveloped reserves at December 31 | | | 2,471 | | | | 2,598 | | | | 4,119 | |
Note: Numbers may not total due to rounding.
| | (1) | Revisions include positive and negative changes due to new data from well drilling, revisions made when actual reservoir performance differs from expected performance and changes by hydrocarbon prices. |
| | (2) | Production refers here to dry gas, although natural gas production reported in other tables refers to sour wet gas. There is a shrinkage in volume when natural gas liquids and impurities are extracted to obtain dry gas. Therefore, reported natural gas volumes are greater than dry gas volumes. |
Source: Pemex Exploration and Production.
Pemex Exploration and Production’s reserve-replacement ratio, or RRR, for a given period is calculated by dividing the sum of proved reserves additions due to discoveries, developments, delineations and revisions by that period’s total production. During 2016, PEMEX obtained an increase of 40 million barrels of oil equivalent of proved reserves as aggregated from discoveries, revisions, delimitations, development and production in 2016, that represents a RRR of 4 %. While low, 2016 RRR is an improvement as compared to 2015, where there was
F-144
PETRÓLEOS MEXICANOS, PRODUCTIVE STATE-OWNED SUBSIDIARIES
AND SUBSIDIARY COMPANIES
NOTES TO THE CONSOLIDATED FINANCIAL STATEMENTS
FOR THE YEARS ENDED DECEMBER 31, 2016, 2015 AND 2014
(FIGURES STATED IN THOUSANDS, EXCEPT AS NOTED)
no replacement of proved reserves. PEMEX believes there will be continued improvements in its RRR in subsequent years.
PEMEX’s reserves production ratio, which is presented in terms of years, is calculated by dividing the estimated remaining reserves at the end of the relevant year by the total production of hydrocarbons for that year. As of December 31, 2016, this ratio was equal to 7.7 years for proved reserves in oil equivalent, which represents a decrease of 4.9 % as compared to the 2015 reserves production ratio of 8.1 years for proved reserves
| f. | Standardized measure of discounted future net cash flowsrelated to proved oil and gas reserves (unaudited) |
The standardized measure tables presented below relate to proved oil and gas reserves excluding proved reserves scheduled to be produced after the year 2042. This measure is presented in accordance with ASC Topic 932. The computation includes production profiles and maintenance and operating expenses of assignments received by Pemex Exploration and Production on escrow on a temporary basis.
Estimated future cash inflows from production are computed by applying average prices of oil and gas on the first day of each month of 2016. Future development and production costs are those estimated future expenditures needed to develop and produce theyear-end estimated proved reserves after a net cash flows discount factor of 10%, assuming constantyear-end economic conditions.
Future tax expenses are computed by applying the appropriateyear-end statutory tax rates with consideration of the tax rates of the new fiscal regime for Pemex Exploration and Production already legislated for 2016 to the futurepre-tax net cash flows related to proved oil and gas reserves.
The estimated future payment of taxes was calculated based on fiscal regime applicable by decree to Pemex Exploration and Production effective January 1, 2015 and by the tax benefits published in the Official Gazette of the Federation on April 18, 2016.
The standardized measure provided below represents a comparative benchmark value rather than an estimate of expected future cash flows or fair market value of PEMEX’s production rights. There are numerous uncertainties inherent in estimating quantities of proved reserves and in projecting future rates of production and timing of development expenditures, including many factors beyond the control of the producer. Accordingly, reserve estimates may be materially different from the quantities of crude oil and natural gas that are ultimately recovered.
F-145
PETRÓLEOS MEXICANOS, PRODUCTIVE STATE-OWNED SUBSIDIARIES
AND SUBSIDIARY COMPANIES
NOTES TO THE CONSOLIDATED FINANCIAL STATEMENTS
FOR THE YEARS ENDED DECEMBER 31, 2016, 2015 AND 2014
(FIGURES STATED IN THOUSANDS, EXCEPT AS NOTED)
Standardized measure of discounted future net cash flows as of December 31
| | | | | | | | | | | | |
| | | 2016 | | | 2015 | | | 2014 | |
| | | (in millions of dollars) | |
Future cash inflows | | US$ | 228,196 | | | US$ | 325,052 | | | US$ | 757,794 | |
Future production costs (excluding profit taxes) | | | (87,942 | ) | | | (99,948 | ) | | | (112,421 | ) |
Future development costs | | | (25,515 | ) | | | (32,560 | ) | | | (37,019 | ) |
| | | | | | | | | | | | |
Future cash flows before tax | | | 114,738 | | | | 192,544 | | | | 608,353 | |
Future production and excess gains taxes | | | (108,960 | ) | | | (167,056 | ) | | | (543,743 | ) |
| | | | | | | | | | | | |
Future net cash flows | | | 5,779 | | | | 25,488 | | | | 64,610 | |
Effect of discounting net cash flows by 10% | | | (937 | ) | | | (9,946 | ) | | | (19,949 | ) |
| | | | | | | | | | | | |
Standardized measure of discounted future net cash flows | | US$ | 4,841 | | | US$ | 15,541 | | | US$ | 44,661 | |
| | | | | | | | | | | | |
Note: Table amounts may not total due to rounding.
To comply with ASC Topic 932, the following table presents the aggregate standardized measure changes for each of the last three years and significant sources of variance:
Changes in standardized measure of discounted future net cash flows:
| | | | | | | | | | | | |
| | | 2016 | | | 2015 | | | 2014 | |
Sales of oil and gas produced, net of production costs | | | US$(19,411) | | | US$ | (28,371 | ) | | US$ | (69,582 | ) |
Net changes in prices and production costs | | | (53,278 | ) | | | (327,865 | ) | | | (79,617 | ) |
Extensions and discoveries | | | 1,105 | | | | 3,086 | | | | 3,022 | |
Development cost incurred during the year | | | 4,124 | | | | 10,172 | | | | 14,215 | |
Changes in estimated development costs | | | 1,763 | | | | (2,171 | ) | | | (7,086 | ) |
Reserves revisions and timing changes | | | 6,366 | | | | (22,801 | ) | | | (13,432 | ) |
Accretion of discount ofpre-tax net cash flows | | | 11,094 | | | | 43,394 | | | | 51,504 | |
Net changes in production and excess gains taxes | | | 37,537 | | | | 295,437 | | | | 64,678 | |
| | | | | | | | | | | | |
Aggregate change in standardized measure of discounted future net cash flows | | | US$(10,700) | | | US$ | (29,119 | ) | | US$ | (36,296 | ) |
| | | | | | | | | | | | |
Standardized measure: | | | | | | | | | | | | |
As of January 1 | | US$ | 15,541 | | | US$ | 44,661 | | | US$ | 80,957 | |
As of December 31 | | | 4,841 | | | | 15,541 | | | | 44,661 | |
| | | | | | | | | | | | |
Change | | US$ | (10,700 | ) | | US$ | (29,119 | ) | | US$ | (36,296 | ) |
| | | | | | | | | | | | |
Note: Table amounts may not total due to rounding.
In computing the amounts under each factor of change, the effects of variances in prices and costs are computed before the effects of changes in quantities. Consequently, changes in reserves are calculated at December 31 prices and costs. The change in computed taxes includes taxes effectively incurred during the year and the change in future tax expense.
F-146