UNITED STATES
SECURITIES AND EXCHANGE COMMISSION
Washington, D.C. 20549
FORM6-K
REPORT OF FOREIGN PRIVATE ISSUER
PURSUANT TO RULE13a-16 OR15d-16 UNDER
THE SECURITIES EXCHANGE ACT OF 1934
For the month of May, 2018
Commission File Number0-99
PETRÓLEOS MEXICANOS
(Exact name of registrant as specified in its charter)
MEXICAN PETROLEUM
(Translation of registrant’s name into English)
United Mexican States
(Jurisdiction of incorporation or organization)
Avenida Marina Nacional No. 329
Colonia Petróleos Mexicanos
México, D.F. 11311
México
(Address of principal executive offices)
Indicate by check mark whether the registrant files or will file annual reports under cover of Form20-F or Form40-F.
Form20-F ☑ Form40-F ☐
Indicate by check mark if the registrant is submitting the Form6-K in paper as permitted by RegulationS-T Rule 101(b)(1).
Yes ☐ No ☑
Indicate by check mark if the registrant is submitting the Form6-K in paper as permitted by RegulationS-T Rule 101(b)(7).
Yes ☐ No ☑
Indicate by check mark whether the registrant by furnishing the information contained in this form is also thereby furnishing the information to the Commission pursuant to Rule12g3-2(b) under the Securities Exchange Act of 1934.
Yes ☐ No ☑

Mexico City, April 27, 2018
 |
Investor Relations ri@pemex.com Tel (52 55) 1944 9700 www.pemex.com/en/investors |

Key Highlights
The first quarter of 2018 provided a stable start for the Company, with improved performance indicators and the materialization of different strategic alliances and associations:
✓ Natural gas use improved from 94.6% to 96.8% ✓ PEMEX was awarded 11 blocks in CNH’s rounds 2.4 and 3.1 ✓ Strategic alliance with Linde for hydrogen supply at the Madero refinery ✓ MXN 19.0 billion asset impairment reversal ✓ MXN 113.3 billion net profit
Selected financial information (MXN million)
|
|  Crude Oil Production 1,890 Mbd
Natural gas production 4,782 MMcfd
Crude Oil Processing 598 Mbd
EBITDA MXN 141.5 billion
Long Term Credit Rating in Foreign Currency | ||||||||||||
| First Quarter | ||||||||||||||
| 2017 | 2018 | Var% | ||||||||||||
Total sales | 347,431 | 397,396 | 14 | % | ||||||||||
Domestic sales | 217,740 | 237,789 | 9 | % | ||||||||||
Exports | 127,319 | 157,573 | 24 | % | ||||||||||
Cost of sales | 257,692 | 257,734 | 0 | % | ||||||||||
Total expenses | 33,172 | 36,496 | 10 | % | ||||||||||
Operating income (loss) | 72,741 | 107,411 | 48 | % | ||||||||||
Net income (loss) | 87,935 | 113,312 | 29 | % | ||||||||||
EBITDA | 149,865 | 141,510 | -6 | % | ||||||||||


Agency | Rating | Outlook | ||
S&P | BBB+ | Stable | ||
Fitch | BBB+ | Stable | ||
Moody’s | Baa3 | Stable |
| 1 | PEMEX refers to Petróleos Mexicanos, its Productive Subsidiary Companies, Affiliates, Subsidiary Entities and Subsidiary Companies |
| www.pemex.com | 1 / 34 |

| 1Q182 |  |
Carlos Alberto Treviño Medina Chief Executive Officer
“The Company started the year on the right track, carrying forward efforts to improve its operating and financial performance indicators, while prioritizing profitability, our Business Plan’s guiding principle. Petróleos Mexicanos continues making great strides towards formalizing associations and joint ventures along the entire value chain, within the current legal framework”. |

| 2 | From January 1 to March 31, 2018. PEMEX encourages the reader to analyze this document together with the information provided in the annexes to this document, in addition to the transcript of its conference call announcing its quarterly results, to take place on April 27, 2018. Annexes, transcripts and relevant documents related to this call can be found at www.pemex.com/en/investors. |
| www.pemex.com | 2 / 34 |

Earnings
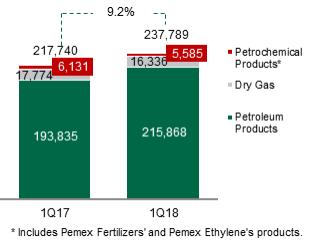
During the first quarter of 2018, total sales increased by 14.4%, as compared to the same period of 2017, mainly as a result of a 23.8% increase in exports due to the recovery in international crude oil prices, and a 9.2% increase in domestic sales mainly originated by gasolines and diesel price liberalization.
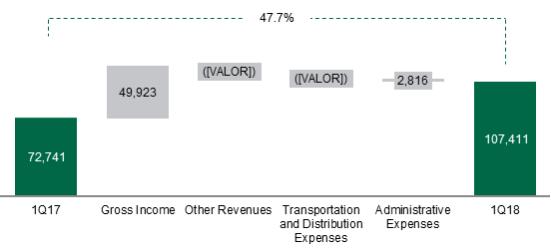
Gross & Operating Income
Cost of sales increased by 17.6% as compared to 1Q17, isolating the asset impairment effect. Including the asset impairment, cost of goods sold remained stable.
Gross income recorded MXN 139.7 billion.
Total operating expenses (transportation and distribution expenses and administrative expenses) remained stable, and operating income recorded MXN 107.4 billion.
Taxes and Duties
During the first quarter of 2018, total taxes and duties remained stable as compared to 1Q17, mainly as a result of crude oil prices’ recovery. Profit Sharing Duty increased by 5.0% as compared to the same period of 2017.
Net Income
During 1Q18 a net income of MXN 113.3 billion was recorded.
Financial Debt
Total financial debt decreased by 4.3% as compared to the same period of 2017, mainly due to the appreciation of the Mexican peso against the U.S. dollar.
As of March 31, 2018, the exchange rate registered MXN 18.3445 per U.S. dollar, resulting in a MXN 1,949.9 billion or USD 106.3 billion total financial debt.
Liquidity Management
As of March 31, 2018, Petróleos Mexicanos held five syndicated revolving credit lines for liquidity management in the amounts of USD 6.7 billion and MXN 23.5 billion.
New method to calculate EBITDA
In order to reveal a better approach to the operating cash flow capacity, as of 4Q17 the EBITDA formula was modified. Net cost for the period of employee benefits (excluding pension payments, seniority premium and health service since they are cash items), depreciation, amortization and impairment of wells, pipelines, property, plant and equipment are added to the operating income.
Investment Activities
As of March 31, 2018, PEMEX spent MXN 52.5 billion (USD 2.8 billion) on investment activities, which represents 25.7% of the total investment budget of MXN 204.6 billion that was programmed for the year.
| www.pemex.com | 3 / 34 |

Hydrocarbons production
During the first quarter of 2018, crude oil production averaged 1,890 thousand barrels per day (Mbd), which represents a 128 Mbd decrease as compared to the same period of 2017. This decrease was mainly a result of high inventories at storage facilities, due to adverse weather conditions that precluded some deliveries for safety reasons, therefore, crude oil production decreased at certain fields. On the other hand, this result can also be explained by natural decline in production and the increase of fractional water flow of wells at certain fields.
Heavy crude oil production remained stable, mainly due toKu-Maloob-Zaap’s production, that averaged 876 Mbd during the quarter.
Natural gas production (with nitrogen) amounted to 4,782 million cubic feet per day (MMcfd) during the first quarter of 2018; a 10.4% decrease as compared to the first quarter of 2017.
Crude oil processing
During the period, total crude oil processing averaged 598 Mbd, a 36.8% decrease as compared to the first quarter of 2017. This is explained by Salina Cruz refinery’s operation with only one train due to shortages in electricity supply, and bystart-up and stabilization processed at the Madero and Minatitlán refineries, after overall maintenance works.
Consequently, primary distillation capacity averaged 70% at Salina Cruz, Tula, Cadereyta and Salamanca. Variable refining margin amounted to USD 1.85 per barrel, a USD 2.95 per barrel decrease as compared to 1Q17, as a result of a better performance of the Mexican Crude oil Mix prices.
Natural gas processing decreased by 11.2% due to decreased supply of sour wet gas from the Mesozoic and sweet wet gas from Burgos basin.
| 1Q18 | Change | |||||||
Industrial Safety and Environmental Protection | ||||||||
Frequency Index | 0.08 | -85.7% | ||||||
Severity Index | 5 | -78.2% | ||||||
Natural Gas Flaring (MMcfd) | 152 | -47.2% | ||||||
Upstream | ||||||||
Total Production (Mboed) | 2,635 | -5.9% | ||||||
Liquid Hydrocarbons (Mbd) | 1,918 | -6.5% | ||||||
Crude Oil (Mbd) | 1,890 | -6.3% | ||||||
Condensates (Mbd) | 28 | -17.3% | ||||||
Natural Gas (MMcfd) | 4,782 | -10.4% | ||||||
Downstream | ||||||||
Dry Gas from Plants (MMcfd) | 2,462 | -11.5% | ||||||
Natural Gas Liquids (Mbd) | 253 | -17.1% | ||||||
Petroleum Products (Mbd) | 6.3 | -37.1% | ||||||
Petrochemical Products (Mt) | 590 | -33.9% | ||||||
Variable Refining Margin (USD /b) | 1.85 | -2.95 | ||||||
| www.pemex.com | 4 / 34 |

PEMEX and SMB signed a contract for the exploration and extraction of hydrocarbons
On March 2, 2018, PEMEX and SMB (the consortium formed by Tecpetrol and Grupo R), signed a contract for the exploration and extraction of hydrocarbons at Misión, located in the states of Tamaulipas and Nuevo León, to increase the field’s productivity.
PEMEX signedfarm-out contracts with Cheiron and with Deutsche Erdoel
On March 6, 2018, PEMEX signed contracts for the extraction of hydrocarbons at Cárdenas-Mora and Ogarrio, located in Tabasco and Veracruz, with the companies Petrolera Cárdenas Mora (Cheiron Holdings Limited) and Deutsche Erdoel México (DEA), respectively. Onshore farm-outs Cárdenas-Mora and Ogarrio represented approximately USD 540 million in revenues for PEMEX, and they are estimated to attract investments for over USD 1.5 billion. These projects complement 15 associations which PEMEX has formed in CNH’s bidding rounds, farm-outs and the migration of assignments.
PEMEX signed a contract with Lewis Energy
On March 26, 2018, PEMEX and Lewis Energy México signed the first incentivized services contract (that evolved from an Integrated Exploration and Production Contract, CIEP, to an Exploration and Production Integral Services Contract, CSIEE) for Olmos field, in the state of Coahuila, to evaluate and exploitnon-conventional reservoir Eagle Ford in Mexico. Expected investment totals USD 617 million, while estimated production amounts to 117 MMcfd of gas in 2021.
PEMEX was awarded 7 blocks in Round 3.1
On March 27, 2018, the National Hydrocarbons Commission carried out Round 3.1, and awarded 16 contracts for the exploration and extraction of hydrocarbons in shallow waters of the Gulf of Mexico. Out of 14 companies, grouped in 12 bidders, PEMEX was awarded 7 contracts; 6 in associations and one by itself. With this, the company maintains its portfolio diversification and strengthening strategy.
PEMEX signed a contract with Olstor Services
On March 28, 2018, Petróleos Mexicanos and Olstor Services signed a contract with the objective of increasing storage capacity of petroleum products. This is the first contract of its type between PEMEX (Pemex Industrial Transformation) and the private sector, and will provide more flexibility and reliability in the supply of gasoline and other petroleum products to satisfy demand in the Bajío area.
Moody’s improved PEMEX’s Outlook
On April 12, 2018, Moody’s Investors Service changed Petróleos Mexicanos’ credit rating Outlook from negative to stable and affirmed its long-term local and global credit ratings, Aa3.mx/Baa3, respectively, in line with the agency’s change of Mexico’s sovereign credit rating outlook to stable (A3). Moody’s acknowledged PEMEX’s stable finances and that the current legal framework has enabled the company to be awarded tenders, carry out farm-outs, and form strategic associations that will gradually materialize into significant results.
| www.pemex.com | 5 / 34 |

|
David Ruelas Rodríguez – Chief Financial Officer:
“PEMEX maintains stable finances. Expenditure discipline and austerity measures implemented since 2016 have allowed the Company to stabilize expenses and improve financial indicators. Ahead, Petróleos Mexicanos will continue making great strides toward optimizing its operations and strengthening its results” |

Uses and Sources of Funds as of March 31, 2018
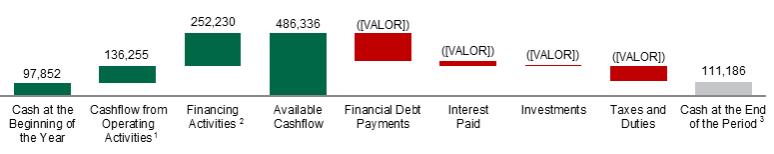
| a) | Before taxes and duties. Calculated by adding accrued taxes and duties to revenues from operations from the statement of changes in financial position. |
| b) | Excludes E&P Financed Public Works Contract Program. |
| c) | Includes change of cash effect of MXN (7,180) million. |
Consolidated Income Statement from January 1 to March 31, 2017
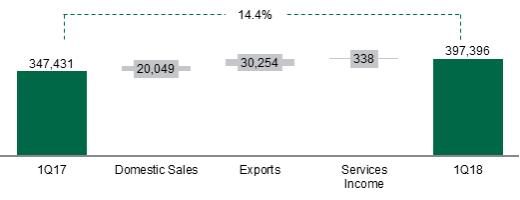
Total Sales
During the first quarter of 2018, total sales increased by 14.4%, as compared to the same period of 2017, mainly as a result of:
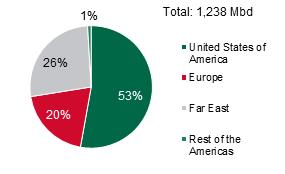
| • | a 23.8% increase in export sales, mainly due to the recovery in international crude oil prices from USD 44.15 per barrel in 1Q17 to USD 56.42 per barrel in 1Q18. The volume of crude oil exports increased by 12.8% and the volume of exported petroleum products decreased by 19.9%; and |
| • | a 9.2% increase in domestic sales, mainly gasolines and diesel, as a consequence of the recovery in international prices. Domestic sales’ volume of gasolines increased marginally by 1.3% while diesel decreased by 11.6%. |
The increase in domestic sales also presents an important effect due to the new pricing scheme, implemented in 2017. This scheme modifies the calculation formula of maximum prices of gasolines and diesel and recognizes logistics and distribution costs, in addition to the effect of the Mexican peso - U.S. dollar exchange rate. In addition, as of December 1, 2017, sale prices of gasoline and diesel are fully liberalized throughout the country.
| www.pemex.com | 6 / 34 |
Sales Evolution
(MXN million)
Exports (MXN million) | Crude Exports by Region |
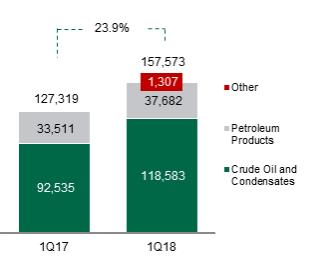
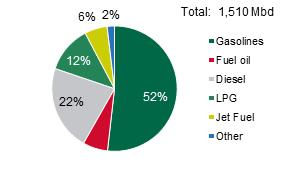
Domestic Sales (MXN million) | Domestic Sales of Petroleum Products |
| www.pemex.com | 7 / 34 |
Gross & Operating Income
Cost of goods sold remained stable as compared to 1Q17, primarily as a result of:
| • | a MXN 19.0 billion reversal of asset impairment, as compared to a MXN 22.3 billion asset impairment in 1Q17.This item is considered virtual, and mostly does not imply cash flows; and |
| • | a 15.0% or MXN 18.8 billion increase in purchases for resale, primarily of gasolines and diesel, to satisfy local demand of petroleum products. The price-effect of this increase was 19%, and the volume-effect was 81%. |
If fixed-assets impairment is isolated, cost of goods sold increased by 17.6% as a result of the previously described purchases for resale increase.
Consequently, gross income totaled MXN 139.7 billion.
Transportation and distribution expenses increased by 10.0%, mainly due to the recognition of the cost associated to recent retirements.
Thus, operating income amounted to MXN 107.4 billion.
Operating Income Evolution
(MXN million)
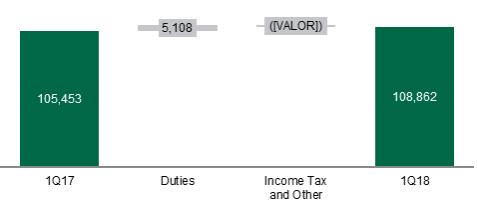
Taxes and Duties
During the first quarter of 2018, total taxes and duties amounted to MXN 108.9 billion, a 3.2% increase as compared to the same period of 2017. Profit Sharing duty-the most important duty for the company- increased by 5.0% mainly due to the recovery in crude oil prices.
| www.pemex.com | 8 / 34 |
Evolution of Taxes and Duties
(MXN million)
Evolution of Net Income
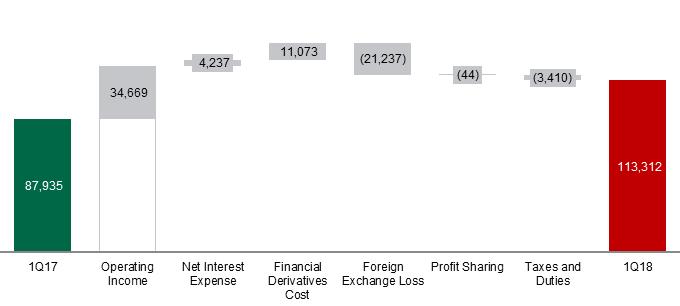
During the first quarter of 2018, PEMEX recorded a MXN 113.3 billion net income, as compared to a MXN 87.9 billion net income in 1Q17. This result was mainly due to the following:
| • | a MXN 120.9 billion foreign exchange profit due to the appreciation of the Mexican peso against the U.S. dollar in the period. As of December 31, 2017, the exchange rate was MXN 19.7867 per dollar, compared to MXN 18.3445 at the end of this quarter. This variation is considered “virtual” and mostly did not represent cash disbursements; and |
| • | an MXN 11.1 billion increase in financial derivatives, mainly as a result of the movement in different market variables involved in financial derivative instruments, such as the U.S. dollar’s depreciation against other currencies in which PEMEX holds debt, and is hedged by several instruments different than the US dollar. |
Evolution of Net Income (Loss)
(MXN million)
| www.pemex.com | 9 / 34 |
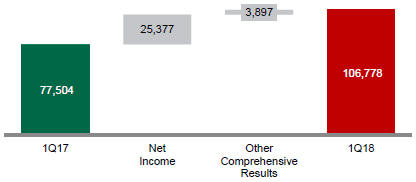
Comprehensive Income
A MXN 106.8 billion comprehensive income was recorded, mainly as a result of a MXN 5.4 billion decrease in the conversion effect resulting from the conversion of all the accounts denominated in other currencies to Mexican pesos, currency used by PEMEX to report its financial statements.
Evolution of Comprehensive Income
(MXN million)
Consolidated Balance Sheet as of March 31, 2017
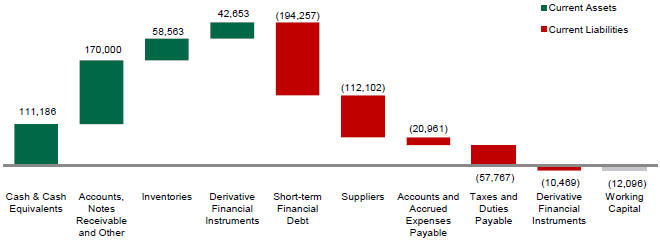
Working Capital
As of March 31, 2018, the company’s negative working capital amounted to MXN 12.1 billion, as compared to a negative working capital of MXN 25.6 billion at the end of 2017. This result was mainly caused by:
| • | a 13.6% increase in cash and cash equivalents, mainly due to the net effect between receivables and funds from financing activities, and was partially offset by taxes and debt payments related to financing transactions, as well as capital and operational expenditures; |
| • | a MXN 12.5 billion increase in profit due to financial derivatives, as a result of the increase in cross-currency swaps due to the U.S. dollar depreciation against other currencies in which PEMEX holds debt and hedges, as well as the increase in income due to oil and currency hedging; |
| • | a MXN 27.9 billion decrease in suppliers’ liabilities resulting from the partial payment of existing obligations; and |
| • | a 41.0% decrease in liabilities due to derivative financial instruments, mainly due to the maturity and expiration of some cross-currency swaps and the implementation of crude oil hedging contracts. |
| www.pemex.com | 10 / 34 |
Working Capital
(MXN million)
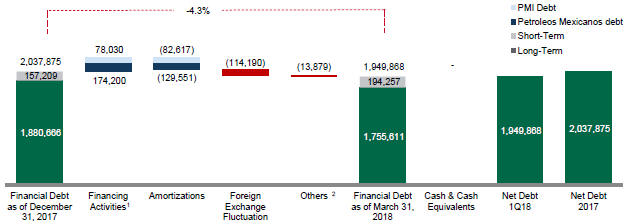
Financial Debt
Total financial debt decreased by 4.3% as compared to 1Q17, mainly due to the appreciation of the Mexican peso against the U.S. dollar during the period.
As of March 31, 2018, the Mexican peso – U.S. dollar exchange rate was MXN 18.3445 per U.S. dollar, resulting in a total financial debt of MXN 1,949.9 billion, or USD 106.3 billion.
Approximately, 86% of Petróleos Mexicanos’ financial debt is denominated in currencies different to the Mexican peso, mainly in U.S. dollars, and for registration purposes is converted into pesos at the exchange rate at the end of the period.
As of March 31, 2018, Petróleos Mexicanos and PMI carried out financing activities for MXN 252.2 billion, or USD 13.7 billion. Total debt payments amounted to MXN 212.2 billion, or USD 11.6 billion.
PEMEX’s financing strategy is intended to take advantage of financial markets with increased liquidity, maximize efficiencies with respect to reference curves, seize opportunities in select markets and maintain a diversified debt maturity profile.
| www.pemex.com | 11 / 34 |
Financial Debt
(MXN billion)
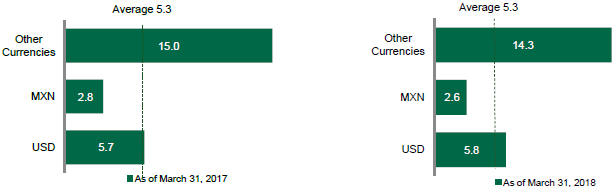
Financial Debt Exposure as of March 31, 2018

Average Duration of Financial Debt Exposure
(Years)
| www.pemex.com | 12 / 34 |
Investment Activities
2018 Activity
As of March 31, 2018, PEMEX spent MXN 52.5 billion (USD 2.8 billion2) on investment activities, which represents 25.7% of the total investment budget of MXN 204.6 billion (USD 11.1 billion3) that was programmed for the year.
PEMEX continuously reviews its expenditures portfolio in accordance with its current and future business plans and upcoming opportunities, and adjusts capital and operational needs throughout the year. For the first quarter of 2018, these investments were allocated as follows:
| Authorized Investment (MXN billion) | Investment Expenditures As of March 31, 2018 (MXN billion) | |||||||
Exploration and Production4 | 168.4 | 44.5 | ||||||
Industrial Transformation | 21.4 | 6.3 | ||||||
Logistics | 4.4 | 1.0 | ||||||
Drilling and Services | 2.7 | 0.5 | ||||||
Corporate | 5.4 | 0.1 | ||||||
Ethylene | 1.8 | 0.1 | ||||||
Fertilizers | 0.4 | 0.004 | ||||||
Financing Activities
Financing Activities 2018
Capital Markets and Liability Management
On February 12, 2018, PEMEX issued USD 4.0 billion in two tranches:
| • | USD 2.5 billion at 5.35% due in 2028; and |
| • | USD 1.5 billion at 6.35% due in 2048. |
Part of the proceeds from this transaction were used for a liability management operation to improve the amortization profile and increase the average debt maturity:
| (i) | exchange of bonds due 2044 and 2046 for the new bond due in 30 years, totaling USD 1,828.7 million; |
| (ii) | repurchase of bonds totaling USD 1,789.4 million due in 2019 and 2020. |
Bank Loans
On March 27, 2018, PEMEX subscribed a credit contract for USD 181.1 million, at LIBOR (6 months) plus 0.70%, due in February 2025.
Syndicated Revolving Credit Lines
As of March 31, 2018, PEMEX holds five syndicated revolving credit lines for liquidity management in the amounts of USD 6.7 billion and MXN 23.5 billion, of which USD 2.9 billion were disbursed.
| 2 | Convenience translation has been made at the established exchange average rate during the first quarter of 2018, of MXN 18.7590 = USD 1.00 |
| 3 | Convenience translation has been made at the average exchange rate established in the Economic Package Fiscal Year 2018 of MXN 18.40 = USD 1.00. |
| 4 | MXN 13.2 billion were allocated to exploration activities. Includesnon-capitalizable maintenance expenditures. |
| www.pemex.com | 13 / 34 |
Other Relevant Information
Appointments
On April 17, 2018, PEMEX’s Board of Directors appointed Ulises Hernández Romano as new Director of Resources, Reserves and Associations at Pemex Exploration and Production.
R&I Affirms PEMEX’s Rating
On April 25, 2018, Rating and Investment Information (R&I) affirmed Petróleos Mexicanos’ issuer rating in BBB+ with a stable rating outlook.
| www.pemex.com | 14 / 34 |

Main Statistics of Production
| First quarter (Jan.-Mar.) | ||||||||||||||||
| 2017 | 2018 | Change | ||||||||||||||
Upstream | ||||||||||||||||
Total hydrocarbons (Mboed) | 2,800 | 2,635 | -5.9 | % | (165 | ) | ||||||||||
Liquid hydrocarbons (Mbd) | 2,051 | 1,918 | -6.5 | % | (133 | ) | ||||||||||
Crude oil (Mbd) | 2,018 | 1,890 | -6.3 | % | (128 | ) | ||||||||||
Condensates (Mbd) | 33 | 28 | -17.3 | % | (6 | ) | ||||||||||
Natural gas (MMcfd)(1) | 5,337 | 4,782 | -10.4 | % | (555 | ) | ||||||||||
Downstream | ||||||||||||||||
Dry gas from plants (MMcfd)(2) | 2,783 | 2,462 | -11.5 | % | (320 | ) | ||||||||||
Natural gas liquids (Mbd) | 306 | 253 | -17.1 | % | (52 | ) | ||||||||||
Petroleum products (Mbd)(3) | 959 | 603 | -37.1 | % | (356 | ) | ||||||||||
Petrochemical products (Mt) | 893 | 590 | -33.9 | % | (303 | ) | ||||||||||
| (1) | Includes nitrogen. |
| (2) | Does not include dry gas used as fuel. |
| (3) | Includes LPG |
| www.pemex.com | 15 / 34 |

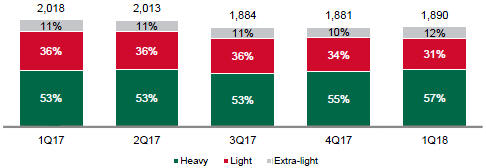
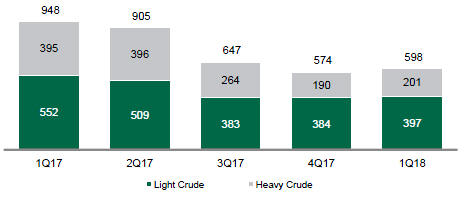
Crude Oil Production
During the first quarter of 2018, crude oil production averaged 1,890 Mbd, a 128 Mbd decrease as compared to the same period of 2017.
The quarterly variation by crude oil type is partly explained as a result of high inventories at storage facilities, due to adverse weather conditions that precluded some deliveries for safety reasons, therefore, crude oil production decreased at certain fields.
On the other hand, the reduction in the production focused in light crude oil focused, this means a 17.8% or 129 Mbd decrease, primarily due to a natural decline in production at the Chuc, Kuil, Chuhuk and Ixtal fields of theAbkatún-Pol-Chuc business unit, as well as Artesa, Guaricho, Puerto Ceiba, Ayacote, Shishito and Rabasa of the South Blocks Production Assets.
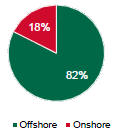
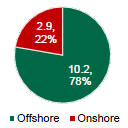
Notice that heavy crude oil production marginally increased reaching 1,074 Mbd, due toKu-Maloob-Zaap’s production platform. On the other hand, extra light crude oil production remained the same as of the first quarter of 2017, a 224 Mbd average.
Crude Oil Production by Type (Mbd) | Crude Oil Production by Region | |
 |  |
Crude Oil Production by Fiel
(Mbd)
| www.pemex.com | 16 / 34 |
Crude Oil Production by Asset
(Mbd)
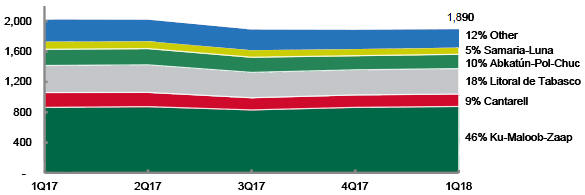
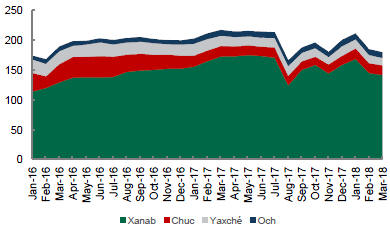
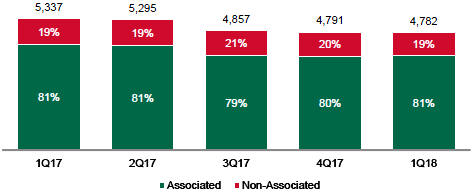
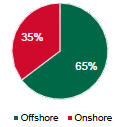
Natural Gas Production5
Natural gas production averaged 4,782 million cubic feet per day (MMcfd), a 10.4% decrease as compared to the first quarter of 2017, mainly explained by:
| • | a 10.2% decrease in associated gas production, primarily due to the natural decline of fields and an increase in the fractional water flow of wells at theAbkatún-Pol-Chuc, Litoral de Tabasco, Bellota-Jujo, Samaria-Luna, and Macuspana-Muspac business units; and |
| • | a 11.2% decrease innon-associated gas production, mainly due to a natural decline in production at the Veracruz and Burgos business units of the Northern region. |
Natural Gas Production (MMcfd) | Natural Gas Production by Type of Field | |
 |  | |
| 5 | Includes nitrogen |
| www.pemex.com | 17 / 34 |
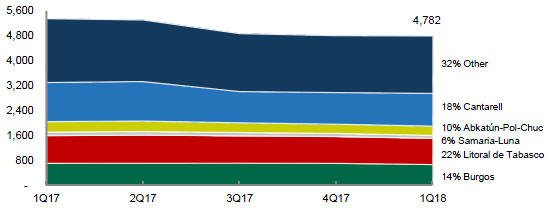
Natural Gas by Asset
(MMcfd)
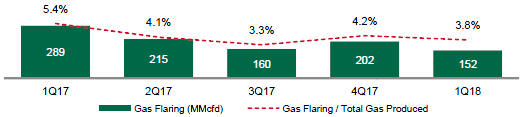
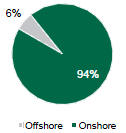
Natural Gas Use and Gas Flaring
During the first quarter of 2018, natural gas use amounted to 96.8%.
Likewise, gas flaring decreased by 47.2%, mainly explained by works carried out at marine regions to increase gas use.
Gas Flaring
| Infrastructure | ||
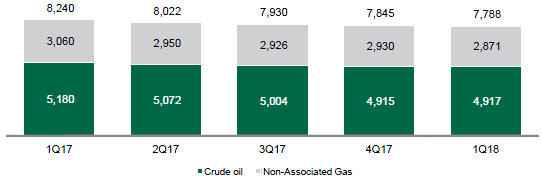
During the quarter, the average number of operating wells totaled 7,788, a 5.5% decrease as compared to the same period of 2017. This was a result of lower activity due to the strategy aimed at increasing economic value, and due to the natural decline of some fields.
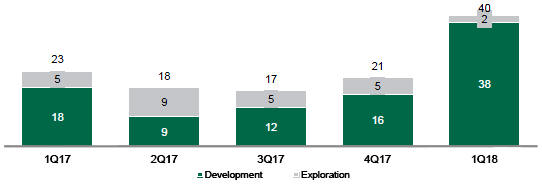
Completion of wells increased by 17, mainly due to the implementation of a strategy aimed at advancing 2018’s drilling program in the first quarter of the year. This positive variation is mainly explained by completion of development wells, with 20 additional wells as compared to the same period of 2017. In contrast, only 2 exploration wells were completed during the first quarter of 2018, three less than in the same period of 2017. With these tools, the company carried out exploration activities in one shallow waters well, and another in deep waters. | Average Operating Wells by Type of Field
| |
| www.pemex.com | 18 / 34 |
Average Number of Operating Wells
Completed Wells
Average Number of Operating Drilling Rigs
| www.pemex.com | 19 / 34 |
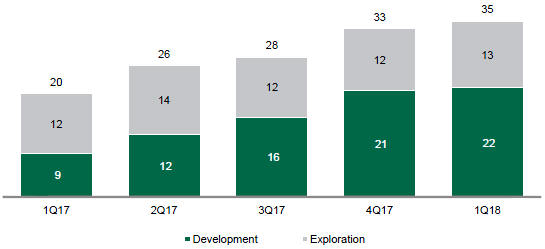
| Average Drilling Rigs by Type | ||
Development
| Exploration
| |
Discoveries
As a result of exploratory activities carried out during the first quarter of 2018,Doctus-1 DEL, located at Perdido, revealed positive results in the production of crude oil, condensates and gas.
It is worth mentioning that after a discovery is made, the estimated resources need to be certified through a process that considers:
| • | Internal record of discovered hydrocarbon resources; |
| • | Evaluation of the fields’ potential (through external firms); and |
| • | Request for an audit conducted by the National Hydrocarbons Commission. |
Discoveries 1Q18
Asset | Well | Geologic Era | Recoverable Volume | Water Depth | Type of Hydrocarbon | |||||||||||||||
| MMboe | Meters | |||||||||||||||||||
Perdido Area | Doctus-1_DEL | Eocene Inferior Wilcox | 150 - 200 | 1,646 | Crude oil | |||||||||||||||
Additional Information Related to Upstream
Round 3.1 Results
On March 27, 2018, CNH carried out Round 3.1 in shallow waters of the Gulf of Mexico. Petróleos Mexicanos was awarded seven blocks; six in association with other companies and one by itself. From these blocks, four are located at the Southeastern Basins: two in association with Total, one with Shell, and one by itself. Furthermore, PEMEX was awarded three blocks at Tampico-Misantla-Veracruz: two in association with Deutsche Erdoel (DEM) and Compañía Española de Petróleos (CEP) and one with (CEP).
These blocks are located close to PEMEX’s assignments in the Gulf of Mexico, which will create synergies in exploration activities and eventually in their development, in areas with existing infrastructure.
On January 31, 2018, Petróleos Mexicanos successfully participated in Round 2.4, and was awarded four blocks in deep waters, two in association with other companies and two by itself.
| www.pemex.com | 20 / 34 |
PEMEX and SMB signed contract for the exploration and extraction of hydrocarbons
| Block | ||||||
| 16. Tampico - Misantla - Veracruz | 17. Tampico - Misantla - Veracruz | 18. Tampico -Misantla - Veracruz | ||||
| Bidder | Pemex Exploration and Production, Deutsche Erdoel México, and Compañía Española de Petróleos | Pemex Exploration and Production, Deutsche Erdoel México, and Compañía Española de Petróleos | Pemex Exploration and Production and Compañía Española de Petróleos | |||
State’s Stake | 24.2% | 35.5% | 40.5% | |||
Committed Investment(USD Million) | 2.2 | 2.4 | 2.3 | |||
Total Expected Investment (USD Million) | 568.7 | 568.7 | 568.7 | |||
Total State’s Participation in Profits | 60.5% | 66.8% | 69.7% | |||
Type of Hydrocarbon | Light Crude Oil and Dry Gas | Light Crude Oil | Light Crude Oil | |||
Area (km²) | 785 | 842 | 813 | |||
Maximum Expected Production (Mboe) | 14.6 | 14.6 | 14.6 | |||
| www.pemex.com | 21 / 34 |
| Block | ||||||||
| 29.Southeastern Basins | 32. Southeastern Basins | 33. Southeastern Basins | 35. Southeastern Basins | |||||
| Bidder | Pemex Exploration Production | Total E&P México Pemex Exploration Production | Total E&P México and Production | Shell Exploración y Extracción de México Production | ||||
State’s Stake | 65.0% | 40.5% | 50.5% | 34.9% | ||||
Additional Investment Factor1/ | 2 | 0 | 1 | 0 | ||||
Cash (USD Million) | 13.1 | 0 | 0 | 0 | ||||
Committed Investment (USD Million) | 92.6 | 2.9 | 47.3 | 2.3 | ||||
Total Expected Investment (USD Million) | 540.6 | 473.7 | 540.6 | 540.6 | ||||
Total State Participation in Profits | 81.5% | 67.1% | 72.7% | 63.9% | ||||
Type of Hydrocarbon | Light Crude Oil | Heavy Crude Oil and Dry Gas | Extra-light Crude Oil | Extra-heavy Crude Oil | ||||
Área (km²) | 471 | 1,027 | 581 | 798 | ||||
Maximum Estimated Production (Mboe) | 22.2 | 20.3 | 22.2 | 22.2 | ||||
On March 2, 2018, PEMEX and SMB (the consortium integrated by TecPetrol and Grupo R) signed a contract for hydrocarbons exploration and extraction at the Misión field, located in the states of Tamaulipas and Nuevo León, to increase the company’s reliability. SMB had a Public Works Contract for Misión since 2004. This field holds total 3P reserves for 345 billion cubic feet of gas. This new contract considers investments in the amount of USD 637 million and an expected production of 103 MMcfd by 2020.
PEMEX signed contract with Lewis Energy
On March 26, 2018, PEMEX and Lewis Energy México signed the first incentivized services contract (that evolved from an Integrated Exploration and Production Contract, CIEP, to an Exploration and Production Integral Services Contract, CSIEE) for Olmos field, in the state of Coahuila, to evaluate and exploitnon-conventional reservoir Eagle Ford in Mexico. Expected investment totals USD 617 million, while estimated production amounts to 117 MMcfd of gas in 2021.
| www.pemex.com | 22 / 34 |
Lewis Energy is a private operator ofnon-conventional reservoirs in the South of Texas. It has drilled over 500 wells at Eagle Ford, focusing on natural gas. In 2017, the company produced more natural gas in the region than any other operator, and was the third largest producer in Texas. For the last 14 years, Lewis has executed a Public Works Contract at Olmos, that corresponds to Eagle Ford on the Mexican side, and which holds an estimated volume of 800 billion cubic feet of gas.
| www.pemex.com | 23 / 34 |

Crude oil processing
During the fourth quarter of 2018, total crude oil processing averaged 598.4 thousand barrels per day (Mbd), a 36.8% decrease as compared to the same period of 2017. The observed reduction in the National Refining System (Sistema Nacional de Refinación, SNR by its Spanish acronym) was mainly as a result of the following factors:
| • | thestart-up and stabilization process of the plants at the Madero and Minatitlán refineries, after the conclusion of the comprehensive maintenance programs implemented in 2017; |
| • | electricity shortages at the Salina Cruz refinery that affected the utilization of one train during this quarter. |
The outlook for the second quarter is to increase crude oil processing. On March 31, 2018, total crude oil processing at the Salina Cruz refinery averaged 244 Mbd, this is equivalent to a 73.8% primary distillation capacity. This increase is due to the operation of the second railcar. Furthermore, total crude oil processing in the SNR during the first week of April reached 800 Mbd.
At the end of the quarter, primary distillation capacity at Salina Cruz, Tula, Cadereyta and Salamanca refineries reached 70%.
Crude Oil Processing
(Mbd)
Production of Petroleum Products
Petroleum products production decreased as a consequence of the reduction of crude oil processing. Therefore, during the first quarter of 2018 petroleum products output averaged 603 Mbd, which represents a 356 Mbd decrease as compared to the volume produced during the same period of 2017.
As detailed above, this decrease is mainly as a result ofnon-scheduled shutdowns at the Salina Cruz refinery due to problems with one train, and due to comprehensive maintenance works at the Madero and Minatitlán refineries. To this date, both refineries are in the process of stabilizing its production to optimal levels.
| www.pemex.com | 24 / 34 |
Petroleum Products Production
(Mbd)
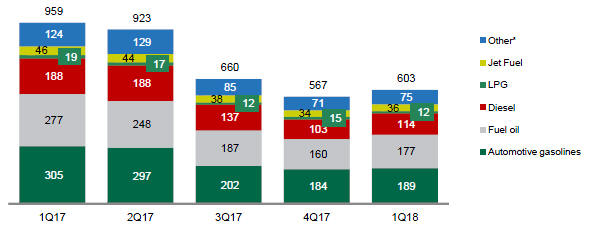
| * | Includes paraffins, furfural extract, aeroflex, asphalt, lubricants, coke, cyclical light oil and other gasolines. |
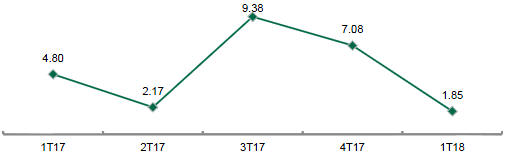
Variable Refining Margin
During the first quarter of 2018, the variable refining margin amounted to USD 1.85 per barrel, a USD 2.95 per barrel decrease, as compared to the same quarter of 2017. The observed reduction is due to the recovery in the performance of the Mexican crude oil Mix price, that increased by USD 12.28 per barrel, from USD 44.15 per barrel in the first quarter of 2017 to USD 56.42 per barrel during the first quarter of 2018.
Variable Refining Margin
(USD /b)
PEMEX Gas Stations
As of March 31, 2018, Pemex Franchise gas service stations totaled 11,632, this is a 4.5% reduction as compared to the first quarter of 2017. Out of 2018’s figure, 11,068 are privately owned and are operated as a franchise; whereas the remaining 46 belong to Pemex Industrial Transformation. On the other hand, 803 gas stations use different trademarks. Notwithstanding, gasolines and diesel are supplied by Pemex TRI.
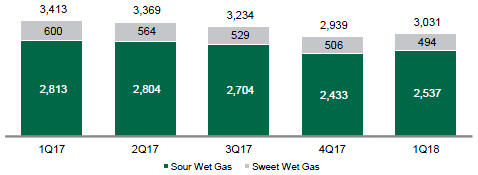
Natural Gas Processing and Production
During the first quarter of 2018, natural gas processing averaged 3,031 million cubic feet per day (MMcfd), an 11.2% decrease as compared to the same period of 2017. This is primarily due to the decreased availability of sour wet gas from marine regions and the South Region, as well as a reduction in the supply of sweet wet gas from the Burgos basin.
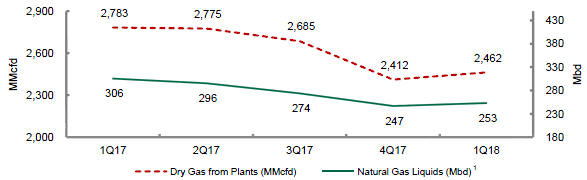
| www.pemex.com | 25 / 34 |
As a result, dry gas production in plants totaled 2,462 MMcfd, a 320 MMcfd decrease as compared to the same period of 2017. Natural gas liquids production decreased by 17.1%, to 253 Mbd.
Condensates processing averaged 32 Mbd, this is a 15.3% decrease as compared to the same period of 2017, mainly as a result of the decline in the supply of sour condensates from the Mesozoic and sweet condensates from Burgos.
Natural Gas Processing
(MMcfd)
Dry Gas and Natural Gas Liquids Production
| (1) | Includes condensates process. |
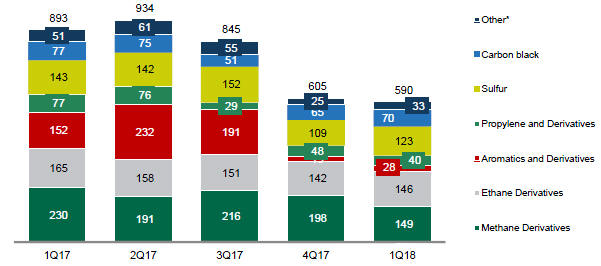
Petrochemicals Production
During the first quarter of 2018, petrochemical products output totaled 590 thousand tons (Mt), this is a 303 Mt decrease, as compared to the same period of 2017, primarily due to the following factors:
| • | a 123.5 Mt decrease in the aromatics and derivatives chain due to scheduled maintenance of the aromatics train at the Cangrejera Petrochemical Complex from October 2017 until January 2018. Additionally, the continuous catalytic regeneration (CCR) plant of that complex underwent anon-scheduled shutdown, from late February until early March 2018, afterwards production was stabilized; |
| • | an 80.5 Mt decrease in ammonia production due to anon-scheduled shutdown at the Cosoleacaque’s Petrochemical Complex, and gas availability; |
| • | a 20.4 Mt reduction in sulfur production, mainly explained by crude oil processing at the Salina Cruz, Madero and Minatitlán refineries; and |
| • | a 36.2 Mt decrease in propylene mainly due to lower crude oil processing at the Salina Cruz and Madero refineries. |
| www.pemex.com | 26 / 34 |
Petrochemical Production
(Mt)
| * | Includes muriatic acid, butadiene, polyethylene wax, petrochemical specialities, BTX liquids, hydrogen, isohexane, pyrolysis liquids, oxygen, CPDI, isopropyl alcohol, amorphous gasoline, octane basis gasoline and heavy naphtha. |
Additional Information Related to Downstream and Midstream Activities
Ministry of Public Service Suspends Eight Public Officials, under Suspicion of Participation in Fuel Theft
On March 5, 2018, the Ministry of Public Service (Secretaría de la Función Pública, SFP) suspended eight PEMEX’s employees from their duties, who allegedly participated in fuel theft. PEMEX’s Responsibilities Unit carried out an investigation that detected alleged participation of several Pemex Logistics’ workers appointed to the Minatitlán Pipeline Sector. Federal authorities continue the investigation in order to assess each participant’s responsibilities. The suspension is a cautionary measure that does not exclude public officials involved in this criminal activity from administrative responsibility.
PEMEX Calls for Tender for a Rehabilitation Project at the Tula Refinery
On March 23, 2018, PEMEX announced an international call for bids for the rehabilitation of itsH-Oil plant at the Tula refinery, in order to improve its safety, performance and profitability. The process will be carried out through PEMEX’s Electronic Contracting System (Sistema de Contrataciones Electrónicas).
Currently, theH-Oil plant processes virgin gasoil and produces hydro-desulfurized gasoil withlow-sulfur content, which are sent in bulk to the catalytic plants, as well as obtaining other products, like diesel, sour gas, dry gas and acid. Close to 84% of PEMEX’s purchases are done through open calls for bids, which leads to a healthy competition between suppliers and generates operational savings and increased budgetary efficiency.
PEMEX Increases its Storage Capacity
To increase petroleum products’ storage capacity, PEMEX signed a contract with Olstor Services. With this, Pemex Industrial Transformation will increase its flexibility and reliability to satisfy the demand for gasoline and other petroleum products at the Bajío area. Current legal framework aims to develop new storage infrastructure in order to guarantee timely supply of fuels and contribute to increase Mexico’s energy security.
PEMEX Signed Trade Contracts with PetroMax and Hidrosina
On April 12, 2018, Petróleos Mexicanos established a commercial relationship with its gasoline and diesel fuel client, PetroMax, which operates over 200 service stations in Mexico under the brandPetro-7. PetroMax is a strategic partner to maintain PEMEX’s competitive advantages in the now competitive fuels retail market.
| www.pemex.com | 27 / 34 |
On April 25, 2018, PEMEX signed a medium-term contract with Grupo Hidrosina. This company has 200 service stations in Mexico, with more presence in the central region. The alliance includes the commitment to sell PEMEX-branded fuels.
Linde Will Supply Hydrogen for Madero Refinery
On April 17, 2018, PEMEX announced a joint venture with German company Linde for the supply of hydrogen to the Madero refinery. This is part of the strategy to reducenon-scheduled shutdowns, increase operational reliability and profitability at the refinery.
Linde is a pioneer in hydrogen production technology, operating more than 120 plants in the world. Linde will invest around USD 40 million for the joint operation of the hydrogen plant, with 42 million cubic feet per day production capacity. Whereas PEMEX will provide the entire operating structure and highly skilled personnel with extensive experience in refining.
Actions against Fuel Theft
On April 17, 2018, the Mexican Senate approved a comprehensive fiscal and criminal reform that will strengthen combat against fuel theft. This reform will allow Mexico’s Internal Revenue Service (Sistema de Administración Tributaria, SAT) and the Energy Regulatory Commission (Comisión Reguladora de Energía, CRE) to control the product, its origin, the volumes that the service stations receive and their sales to the public. These changes complement earlier reforms on April 5, when it was approved to raise penalties to up to 30 years in prison.
| www.pemex.com | 28 / 34 |

Industrial Safety
Frequency Index
As of March 31, 2018, frequency index recorded 0.08 injuries per millionman-hours worked (MMhh), an 85% decrease as compared to the same period of 2017.
Severity Index
During this quarter, severity index totaled 5 days lost per MMhh, a 76% decrease as compared to the same period of 2017.
During this quarter Safety, Health and Environment Protection (SSPA by its Spanish acronym) applied several policies that explain the improved performance in both indexes, for instance:
| • | Weekly technical support for the PEMEX SSPA system’s implementation and adherence to the New Terms of Reference |
| • | Awareness campaign “Capas de Protección” at work centers |
| • | Effective implementation of PEMEX’s SSPA System with the Union |
| • | Critical procedures work cycle execution: opening lines, electric security and special protection for personal equipment |
| • | Task force in triple A facilities to reduce causes for severe accidents |
| • | Weekly visits to work centers for compliance monitoring of SSPA New Terms of Reference and Zero Tolerance guidelines |
| • | SSPA training in its four functions: audit, regulate, training and technical support |
| • | Compliancefollow-up of an ASEA resolution |
Environmental Protection
Sulfur Oxide Emissions
During the first quarter of 2018, sulfur oxide emissions decreased by 31.4% as compared to the same quarter of 2017, primarily due to less gas flaring at Salina Cruz, Madero and Minatitlán refineries. Also, due to the increase in operating sulfur-recovery plants at Cactus and Poza Rica Gas Processing Centers, and due to associated gas usage infrastructure to reduce gas flaring at business units in shallow waters.
Water Reuse
During the first quarter of 2018, water reuse decreased by 16.9% as compared to the same period of 2017, mainly due to the decrease in water treatment (0.35 MMm3/month) at the Madero refinery and a decrease in Residual Water Treatment Plants’ usage at the other refineries.
| www.pemex.com | 29 / 34 |

Consolidated Income Statement
| First quarter (Jan.-Mar.) | ||||||||||||||||||||
| 2017 | 2018 | Change | 2018 | |||||||||||||||||
| (MXN million) | (USD million) | |||||||||||||||||||
Total sales | 347,431 | 397,396 | 14.4 | % | 49,965 | 21,663 | ||||||||||||||
Domestic sales | 217,740 | 237,789 | 9.2 | % | 20,049 | 12,962 | ||||||||||||||
Exports | 127,319 | 157,573 | 23.8 | % | 30,254 | 8,590 | ||||||||||||||
Services income | 2,372 | 2,034 | -14.3 | % | (338 | ) | 111 | |||||||||||||
Cost of sales | 257,692 | 257,734 | 0.0 | % | 42 | 14,050 | ||||||||||||||
Gross income | 89,739 | 139,662 | 55.6 | % | 49,923 | 7,613 | ||||||||||||||
Other revenues (expenses) | 16,174 | 4,245 | -73.8 | % | (11,929 | ) | 231 | |||||||||||||
Transportation and distribution expenses | 5,014 | 5,523 | 10.1 | % | 509 | 301 | ||||||||||||||
Administrative expenses | 28,157 | 30,973 | 10.0 | % | 2,816 | 1,688 | ||||||||||||||
Operating income (loss) | 72,741 | 107,411 | 47.7 | % | 34,669 | 5,855 | ||||||||||||||
Financial Cost | (25,894 | ) | (27,169 | ) | -4.9 | % | (1,275 | ) | (1,481 | ) | ||||||||||
Financial Income | 3,609 | 9,120 | 152.7 | % | 5,512 | 497 | ||||||||||||||
Income (cost) due to financial derivatives | 601 | 11,674 | -1843.6 | % | 11,073 | 636 | ||||||||||||||
Foreign exchange profit (loss) | 142,090 | 120,853 | 14.9 | % | (21,237 | ) | 6,588 | |||||||||||||
Profit sharing innon-consolidated subsidiaries and affiliates | 242 | 285 | 18.1 | % | 44 | 16 | ||||||||||||||
Income before taxes and duties | 193,388 | 222,174 | -14.9 | % | 28,786 | 12,111 | ||||||||||||||
Taxes and duties | 105,453 | 108,862 | 3.2 | % | 3,410 | 5,934 | ||||||||||||||
Profit Sharing Duties | 102,967 | 108,075 | 5.0 | % | 5,108 | 5,891 | ||||||||||||||
Income tax and other | 2,486 | 788 | -68.3 | % | (1,698 | ) | 43 | |||||||||||||
Net income (loss) | 87,935 | 113,312 | 28.9 | % | 25,377 | 6,177 | ||||||||||||||
Other comprehensive results | (10,431 | ) | (6,534 | ) | 37.4 | % | 3,897 | (356 | ) | |||||||||||
Investment in equity securities | 1,545 | 0 | (1,545 | ) | 0 | |||||||||||||||
Conversion effect | (11,976 | ) | (6,534 | ) | 45.4 | % | 5,442 | (356 | ) | |||||||||||
Comprehensive income (loss) | 77,504 | 106,778 | 37.8 | % | 29,274 | 5,821 | ||||||||||||||
| www.pemex.com | 30 / 34 |
Consolidated Balance Sheet
| As of December 31, | As of March 31, | |||||||||||||||||||
| 2017 | 2018 | Change | 2018 | |||||||||||||||||
| (MXN million) | (USD million) | |||||||||||||||||||
Total assets | 2,136,209 | 2,136,228 | 0.0 | % | 19 | 116,451 | ||||||||||||||
Current assets | 363,527 | 383,459 | 5.5 | % | 19,932 | 20,903 | ||||||||||||||
Cash and cash equivalents | 97,852 | 111,186 | 13.6 | % | 13,335 | 6,061 | ||||||||||||||
Accounts, notes receivable and other | 170,646 | 170,000 | -0.4 | % | (646 | ) | 9,267 | |||||||||||||
Inventories | 63,859 | 58,563 | -8.3 | % | (5,296 | ) | 3,192 | |||||||||||||
Available for sale financial assets | 1,057 | 1,057 | 0.0 | % | — | — | ||||||||||||||
Derivative financial instruments | 30,113 | 42,653 | 41.6 | % | 12,539 | 2,325 | ||||||||||||||
Permanent investment in shares of associates | 16,707 | 15,550 | -6.9 | % | (1,157 | ) | 848 | |||||||||||||
Property, plant and equipment | 1,440,716 | 1,423,079 | -1.2 | % | (17,637 | ) | 77,575 | |||||||||||||
Deferred taxes | 146,192 | 146,178 | 0.0 | % | (14 | ) | 7,969 | |||||||||||||
Other assets | 169,067 | 167,961 | -0.7 | % | (1,105 | ) | 9,156 | |||||||||||||
Total liabilities | 3,634,355 | 3,531,802 | -2.8 | % | (102,553 | ) | 192,526 | |||||||||||||
Current liabilities | 389,128 | 395,555 | 1.7 | % | 6,428 | 21,563 | ||||||||||||||
Short-term financial debt | 157,209 | 194,257 | 23.6 | % | 37,047 | 10,589 | ||||||||||||||
Suppliers | 139,955 | 112,102 | -19.9 | % | (27,853 | ) | 6,111 | |||||||||||||
Accounts and accrued expenses payable | 23,212 | 20,961 | -9.7 | % | (2,251 | ) | 1,143 | |||||||||||||
Derivative financial instruments | 17,746 | 10,469 | -41.0 | % | (7,277 | ) | 571 | |||||||||||||
Taxes and duties payable | 51,005 | 57,767 | 13.3 | % | 6,762 | 3,149 | ||||||||||||||
Long-term liabilities | 3,245,227 | 3,136,247 | -3.4 | % | (108,981 | ) | 170,964 | |||||||||||||
Long-term financial debt | 1,880,666 | 1,755,611 | -6.6 | % | (125,054 | ) | 95,702 | |||||||||||||
Reserve for employee benefits | 1,258,436 | 1,275,872 | 1.4 | % | 17,436 | 69,551 | ||||||||||||||
Reserve for diverse credits | 87,677 | 86,931 | -0.9 | % | (747 | ) | 4,739 | |||||||||||||
Other liabilities | 14,194 | 13,757 | -3.1 | % | (438 | ) | 750 | |||||||||||||
Deferred taxes | 4,254 | 4,076 | -4.2 | % | (178 | ) | 222 | |||||||||||||
Total equity | (1,498,146 | ) | (1,395,574 | ) | 6.8 | % | 102,572 | (76,076 | ) | |||||||||||
Holding | (1,499,111 | ) | (1,396,518 | ) | 6.8 | % | 102,593 | (76,127 | ) | |||||||||||
Certificates of contribution “A” | 356,544 | 356,544 | 0.0 | % | — | 19,436 | ||||||||||||||
Federal Government Contributions | 43,731 | 43,731 | 0.0 | % | — | 2,384 | ||||||||||||||
Legal Reserve | 1,002 | 1,002 | 0.0 | % | — | 55 | ||||||||||||||
Comprehensive accumulated results | (151,887 | ) | (158,388 | ) | 4.3 | % | (6,501 | ) | (8,634 | ) | ||||||||||
Retained earnings (accumulated losses) | (1,748,501 | ) | (1,639,407 | ) | 6.2 | % | 109,094 | (89,368 | ) | |||||||||||
From prior years | (1,471,863 | ) | (1,752,707 | ) | -19.1 | % | (280,845 | ) | (95,544 | ) | ||||||||||
For the year | (276,638 | ) | 113,301 | 141.0 | % | 389,939 | 6,176 | |||||||||||||
Participation ofnon-holding entities | 965 | 944 | -2.2 | % | (21 | ) | 51 | |||||||||||||
Total liabilities and equity | 2,136,209 | 2,136,228 | 0.0 | % | 19 | 116,451 | ||||||||||||||
| www.pemex.com | 31 / 34 |
Consolidated Statements of Cash Flows
| As of March 31, | ||||||||||||||||||||
| 2017 | 2018 | Change | 2018 | |||||||||||||||||
| (MXN million) | (USD million) | |||||||||||||||||||
Operating activities | ||||||||||||||||||||
Net income (loss) | 87,935 | 113,312 | 28.9 | % | 25,377 | 6,177 | ||||||||||||||
Items related to investing activities | 58,895 | 28,626 | -51.4 | % | (30,269 | ) | 1,560 | |||||||||||||
Depreciation and amortization | 35,714 | 34,471 | -3.5 | % | (1,243 | ) | 1,879 | |||||||||||||
Impairment of properties, plant and equipment | 22,329 | (19,038 | ) | -185.3 | % | (41,368 | ) | (1,038 | ) | |||||||||||
Unsuccessful wells | 1,519 | 4,250 | 179.9 | % | 2,732 | 232 | ||||||||||||||
Retirement of property, plant and equipment | (3,044 | ) | (98 | ) | 96.8 | % | 2,946 | (5 | ) | |||||||||||
Profit (loss) from sale of financial assets available for sale | 2,144 | 9,325 | 334.9 | % | 7,181 | 508 | ||||||||||||||
Profit in the sale of associates | 475 | — | (475 | ) | — | |||||||||||||||
Dividend revenue | (242 | ) | (285 | ) | -18.1 | % | (44 | ) | (16 | ) | ||||||||||
Activities related to financing activities | — | (5,049 | ) | (5,049 | ) | (275 | ) | |||||||||||||
Interest expense (income) | 25,894 | 27,169 | 4.9 | % | 1,275 | 1,481 | ||||||||||||||
Unrealized loss (gain) from foreign exchange fluctuations | (142,490 | ) | (114,190 | ) | 19.9 | % | 28,300 | (6,225 | ) | |||||||||||
Subtotal | 30,235 | 49,867 | 64.9 | % | 19,632 | 2,718 | ||||||||||||||
Funds provided by (used in) operating activities | (56,491 | ) | (22,475 | ) | 60.2 | % | 34,016 | (1,225 | ) | |||||||||||
Financial instruments for negotiation | (12,010 | ) | (19,816 | ) | -65.0 | % | (7,806 | ) | (1,080 | ) | ||||||||||
Accounts and notes receivable | (23,893 | ) | 645 | 102.7 | % | 24,538 | 35 | |||||||||||||
Inventories | 2,013 | 5,296 | 163.1 | % | 3,283 | 289 | ||||||||||||||
Long term accounts and notes receivable | 325 | 1,169 | 259.2 | % | 843 | 64 | ||||||||||||||
Intangible assets | 56 | (4,147 | ) | -7566.3 | % | (4,202 | ) | (226 | ) | |||||||||||
Other assets | (148 | ) | (69 | ) | 53.1 | % | 79 | (4 | ) | |||||||||||
Accounts payable and accrued expenses | 19,950 | (2,251 | ) | -111.3 | % | (22,201 | ) | (123 | ) | |||||||||||
Taxes payable | (102,030 | ) | (99,254 | ) | 2.7 | % | 2,776 | (5,411 | ) | |||||||||||
Taxes paid | 105,007 | 106,016 | 1.0 | % | 1,010 | 5,779 | ||||||||||||||
Suppliers | (66,649 | ) | (27,853 | ) | 58.2 | % | 38,796 | (1,518 | ) | |||||||||||
Reserve for diverse credits | (207 | ) | 518 | -350.0 | % | 725 | 28 | |||||||||||||
Reserve for employees benefits | 19,598 | 17,436 | -11.0 | % | (2,161 | ) | 950 | |||||||||||||
Deferred taxes | 1,498 | (164 | ) | -111.0 | % | (1,663 | ) | (9 | ) | |||||||||||
Net cash flow from operating activities | (26,257 | ) | 27,392 | 204.3 | % | 53,649 | 1,493 | |||||||||||||
Investing activities | ||||||||||||||||||||
Acquisition of property, plant and equipment | (8,921 | ) | (5,892 | ) | 33.9 | % | 3,028 | (321 | ) | |||||||||||
Resources from divestment of financial assets | 684 | — | (684 | ) | — | |||||||||||||||
Net cash flow from investing activities | (8,236 | ) | (5,892 | ) | 28.5 | % | 2,344 | (321 | ) | |||||||||||
Cash needs related to financing activities | (34,493 | ) | 21,500 | 162.3 | % | 55,993 | 1,172 | |||||||||||||
Financing activities | ||||||||||||||||||||
Loans obtained from financial institutions | 177,833 | 252,230 | 41.8 | % | 74,397 | 13,750 | ||||||||||||||
Amortization of loans | (154,148 | ) | (214,766 | ) | -39.3 | % | (60,618 | ) | (11,707 | ) | ||||||||||
Interest paid | (34,892 | ) | (38,450 | ) | -10.2 | % | (3,558 | ) | (2,096 | ) | ||||||||||
Net cash flow from financing activities | (11,207 | ) | (985 | ) | 91.2 | % | 10,221 | (54 | ) | |||||||||||
Net Increase (decrease) in cash and cash equivalents | (45,700 | ) | 20,515 | 144.9 | % | 66,214 | 1,118 | |||||||||||||
Effect of change in cash value | (12,336 | ) | (7,180 | ) | 41.8 | % | 5,156 | (391 | ) | |||||||||||
Cash and cash equiv. at the beginning of the period | 163,533 | 97,852 | -40.2 | % | (65,681 | ) | 5,334 | |||||||||||||
Cash and cash equivalents at the end of the period | 105,497 | 111,186 | 5.4 | % | 5,690 | 6,061 | ||||||||||||||
| www.pemex.com | 32 / 34 |

David Ruelas Chief Financial Officer
Ulises Hernández Director of Resources, Reserves & Associations
Josefa Casas Deputy Director of Strategic Analysis at Pemex Industrial Transformation
will present the financial and operating results of PEMEX as of March 31, 2018
Friday, April 27, 2017
A question and answer session will follow the presentation.
To connect through telephone, dial +1 (847) 585 4405.
To connect through Internet, access webcast.
The teleconference and webcast replay will be available on April 27, 2017 at 1:00 p.m. (EDT) and until July 27, 2018 through this link. As of May 3, 2018, the conference call replay will be available at Unaudited Financial Results 2017.
Additionally, the Spanish version of the conference call will take place at 11:00 a.m. (CST) / 12:00 p.m. (EST), please follow this link to find the instructions to connect:Información Financiera / Calendario financiero / Reporte de Resultados al 31 de marzo de 2018.
Investor Relations ri@pemex.com Twitter: @PemexGlobal |
Online Institutional Database Access PEMEX’s official operating information database interactively.
SEC Filings Review the latest20-F,F-4 and6-K forms filed by PEMEX with the SEC
| |


| www.pemex.com | 33 / 34 |

If you would like to be included in our distribution list, please email the Investor Relations team atri@pemex.com or register onhttp://www.pemex.com/en/investors/Paginas/list-distribution-signup.aspx
If you would like to contact us, please call us at (52 55) 1944 9700, (52 55) 1944 9702, (52 55) 1944 8015 or send an email tori@pemex.com.
Follow us on: @Pemex
| Jaime del Rio Castillo | Lucero Medina González | Mariana López Martínez | ||
| jaime.delrio@pemex.com | lucero.angelica.medina@pemex.com | mariana.lopezm@pemex.com | ||
| José González Echevarría | Guillermo Bitar Siman | Alejandro López Mendoza | ||
| jose.manuel.gonzaleze@pemex.com | guillermo.karim.bitar@pemex.com | alejandro.lopezm@pemex.com | ||
Variations
Cumulative and quarterly variations are calculated comparing the period with the same one of the previous year; unless specified otherwise.
Rounding
Numbers may not total due to rounding.
Financial Information
Excluding budgetary and volumetric information, the financial information included in this report and the annexes hereto is based on unaudited consolidated financial statements prepared in accordance with International Financial Reporting Standards as issued by the International Accounting Standards Board (“IFRS”), which PEMEX has adopted effective January 1, 2012. For more information regarding the transition to IFRS, see Note 23 to the consolidated financial statements included in Petróleos Mexicanos’ 2012 Form20-F filed with the Securities and Exchange Commission (SEC) and its Annual Report filed with the Comisión Nacional Bancaria y de Valores (CNBV).
EBITDA is anon-IFRS measure. We show a reconciliation of EBITDA to net income in Table 33 of the annexes to this report. Budgetary information is based on standards from Mexican governmental accounting; therefore, it does not include information from the subsidiary companies or affiliates of Petróleos Mexicanos. It is important to mention, that our current financing agreements do not include financial covenants or events of default that would be triggered as a result of our having negative equity.
Methodology
We might change the methodology of the information disclosed in order to enhance its quality and usefulness, and/or to comply with international standards and best practices.
Foreign Exchange Conversions
Convenience translations into U.S. dollars of amounts in Mexican pesos have been made at the exchange rate at close for the corresponding period, unless otherwise noted. Due to market volatility, the difference between the average exchange rate, the exchange rate at close and the spot exchange rate, or any other exchange rate used could be material. Such translations should not be construed as a representation that the Mexican peso amounts have been or could be converted into U.S. dollars at the foregoing or any other rate. It is important to note that we maintain our consolidated financial statements and accounting records in pesos. As of March 31, 2018, the exchange rate of MXN 18.3445 = USD 1.00 is used.
Fiscal Regime
Starting January 1, 2016, Petróleos Mexicanos’ fiscal regime is ruled by the Ley de Ingresos sobre Hidrocarburos (Hydrocarbons Income Law). Since January 1, 2006 and until December 31, 2015, PEP was subject to a fiscal regime governed by the Federal Duties Law, while the tax regimes of the other Subsidiary Entities were governed by the Federal Revenue Law.
The Special Tax on Production and Services (IEPS) applicable to automotive gasoline and diesel is established in the Production and Services Special Tax Law “Ley del Impuesto Especial sobre Producción y Servicios”. As an intermediary between the Ministry of Finance and Public Credit (SHCP) and the final consumer, PEMEX retains the amount of the IEPS and transfers it to the Mexican Government. The IEPS rate is calculated as the difference between the retail or “final price,” and the “producer price” of products. If the “final price” is higher than the “producer price,” the IEPS is paid by the final consumer. If the opposite occurs, the “negative IEPS” amount can be credited against certain of PEMEX’s tax liabilities and included in “Other income (expenses)” in its Income Statement.
PEMEX’s “producer price” is calculated in reference to that of an efficient refinery operating in the Gulf of Mexico. Until December 31, 2017, the Mexican Government may continue issuing pricing decrees to regulate the maximum prices for the retail sale of gasoline and diesel fuel, taking into account transportation costs between regions, inflation and the volatility of international fuel prices, among other factors. Beginning in 2018, the prices of gasoline and diesel fuel will be freely determined by market conditions. However, the Federal Commission for Economic Competition, based on the existence of effective competitive conditions, can declare that prices of gasoline and diesel fuel are to be freely determined by market conditions before 2018.
Hydrocarbon Reserves
In accordance with the Hydrocarbons Law, published in the Official Gazette of the Federation on August 11, 2015, the National Hydrocarbons Commission (CNH) will establish and will manage the National Hydrocarbons Information Center, comprised by a system to obtain, safeguard, manage, use, analyze, keep updated and publish information and statistics related; which includes estimations, valuation studies and certifications.
As of January 1, 2010, the Securities and Exchange Commission (SEC) changed its rules to permit oil and gas companies, in their filings with the SEC, to disclose not only proved reserves, but also probable reserves and possible reserves. Nevertheless, any description of probable or possible reserves included herein may not meet the recoverability thresholds established by the SEC in its definitions. Investors are urged to consider closely the disclosure in our Form20-F and our Annual Report to the CNBV and SEC, available at http://www.pemex.com/.
Forward-looking Statements
This report contains forward-looking statements. We may also make written or oral forward-looking statements in our periodic reports to the CNBV and the SEC, in our annual reports, in our offering circulars and prospectuses, in press releases and other written materials and in oral statements made by our officers, directors or employees to third parties. We may include forward-looking statements that address, among other things, our:
| • | exploration and production activities, including drilling; |
| • | activities relating to import, export, refining, petrochemicals and transportation of petroleum, natural gas and oil products; |
| • | activities relating to the generation of electrical energy; |
| • | projected and targeted capital expenditures and other costs, commitments and revenues, and |
| • | liquidity and sources of funding. |
Actual results could differ materially from those projected in such forward-looking statements as a result of various factors that may be beyond our control. These factors include, but are not limited to:
| • | changes in international crude oil and natural gas prices; |
| • | effects on us from competition, including on our ability to hire and retain skilled personnel; |
| • | limitations on our access to sources of financing on competitive terms; |
| • | our ability to find, acquire or have the right to access additional hydrocarbons reserves and to develop the reserves that we obtain successfully; |
| • | uncertainties inherent in making estimates of oil and gas reserves, including recently discovered oil and gas reserves; |
| • | technical difficulties; |
| • | significant developments in the global economy; |
| • | significant economic or political developments in Mexico, including developments relating to the implementation of the laws that implement the new legal framework contemplated by the Energy Reform Decree (as described in our most recent Annual Report and Form20-F); |
| • | developments affecting the energy sector; and |
| • | changes in our legal regime or regulatory environment, including tax and environmental regulations. |
Accordingly, you should not place undue reliance on these forward-looking statements. In any event, these statements speak only as of their dates, and we undertake no obligation to update or revise any of them, whether as a result of new information, future events or otherwise. These risks and uncertainties are more fully detailed in our most recent Annual Report filed with the CNBV and available through the Mexican Stock Exchange (http://www.bmv.com.mx/) and our most recent Form20-F filing filed with the SEC (http://www.sec.gov/). These factors could cause actual results to differ materially from those contained in any forward-looking statement.
| www.pemex.com | 34 / 34 |
SIGNATURES
Pursuant to the requirements of the Securities Exchange Act of 1934, the registrant has duly caused this report to be signed on its behalf by the undersigned, thereunto duly authorized.
| Petróleos Mexicanos | ||
| By: | /s/ CARLOS CARAVEO SÁNCHEZ | |
| Carlos Caraveo Sánchez | ||
| Associate Managing Director of Finance | ||
Date: May 3, 2018
FORWARD-LOOKING STATEMENTS
This report contains words, such as “believe,” “expect,” “anticipate” and similar expressions that identify forward-looking statements, which reflect our views about future events and financial performance. We have made forward-looking statements that address, among other things, our:
| • | exploration and production activities, including drilling; |
| • | activities relating to import, export, refining, petrochemicals and transportation, storage and distribution of petroleum, natural gas and oil products; |
| • | activities relating to our lines of business, including the generation of electricity; |
| • | projected and targeted capital expenditures and other costs, commitments and revenues; |
| • | trends in international crude oil and natural gas prices; |
| • | liquidity and sources of funding, including our ability to continue operating as a going concern; |
| • | farm-outs, joint ventures and strategic alliances with other companies; and |
| • | the monetization of certain of our assets. |
Actual results could differ materially from those projected in suchforward-looking statements as a result of various factors that may be beyond our control. These factors include, but are not limited to:
| • | changes in international crude oil and natural gas prices; |
| • | effects on us from competition, including on our ability to hire and retain skilled personnel; |
| • | limitations on our access to sources of financing on competitive terms; |
| • | our ability to find, acquire or gain access to additional reserves and to develop, either on our own or with our strategic partners, the reserves that we obtain successfully; |
| • | our ability to successfully identify partners and enter into farm-outs, joint ventures and strategic alliances; |
| • | liberalization of hydrocarbon prices in Mexico; |
| • | uncertainties inherent in making estimates of oil and gas reserves, including recently discovered oil and gas reserves; |
| • | technical difficulties; |
| • | significant developments in the global economy; |
| • | significant economic or political developments in Mexico and the United States; |
| • | developments affecting the energy sector; and |
| • | changes in our legal regime or regulatory environment, including tax and environmental regulations. |
Accordingly, you should not place undue reliance on theseforward-looking statements. In any event, these statements speak only as of their dates, and we undertake no obligation to update or revise any of them, whether as a result of new information, future events or otherwise.