Exhibit 13


LETTER TO THE SHAREHOLDERS
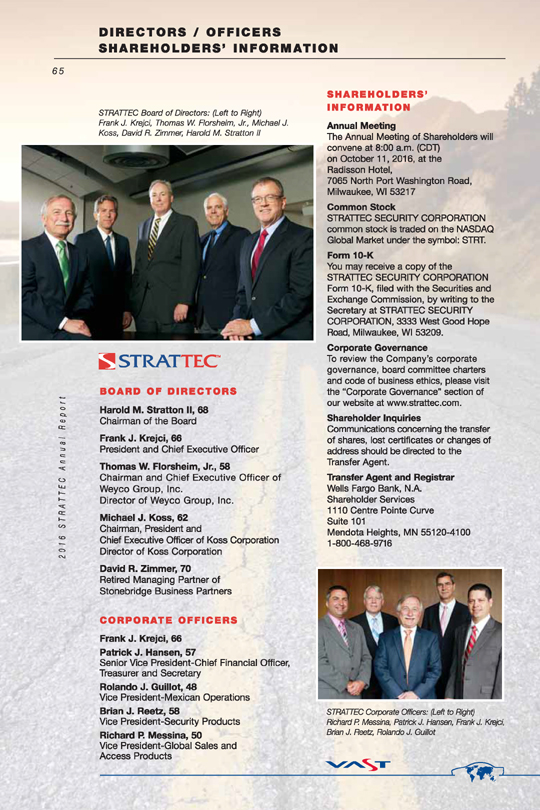
Dear STRATTEC Shareholders,
Fiscal 2016 was a year in which we saw a return to a more normal sales pattern after fiscal 2015’s exceptional growth in revenue and profits. In addition to increased sales of parts for vehicle production, much of that 2015 growth was due to a spike in service parts business to support a customer recall. Fiscal 2016 had a more limited amount of service part sales, resulting in lower overall sales, a less favorable product mix, and lower asset utilization, making comparisons with the prior year challenging. Despite the lower total sales year-over-year, we did increase sales of production parts to our customers, reflecting the continued robust demand for new vehicles, some increased vehicle product content on parts we supply as well as new product placements.
I am pleased to report that during the year we were able to put some strategic initiatives in motion which should have very positive long term benefits for our company. With hard work by our teams and the respect that we have gained from our customers, this was the best year in winning new business that we have had in many, many years. As most of you know, in the automotive industry that does not turn into immediate sales. During fiscal 2017, we will therefore be busy refining designs, building prototypes and performing extensive testing to achieve the high quality standards expected by our customers and our customers’ customers. As usual, timelines will be aggressive, so in advance, I thank our associates for their efforts to satisfy our customers’ expectations. Some of the new business is in new market niches which hold promise for significant growth. Winning this business gives us great optimism for the foreseeable future.
OPERATIONS
In our manufacturing operations, we added equipment to enhance capacity and efficiency. More is on order and will be delivered throughout this coming fiscal year. We restructured our organization to ensure that our design and manufacturing processes meet stricter quality standards. With our products shipped globally, even a minor issue can prove to be very expensive to contain and correct, which unfortunately we experienced in fiscal 2016. One of the main pillars of our strategic plan for 2017 is to avoid those unnecessary costs through a comprehensive Quality Improvement Plan focused on adding resources, refining checks and balances and increased commitment to more training which is a need which will never go away.
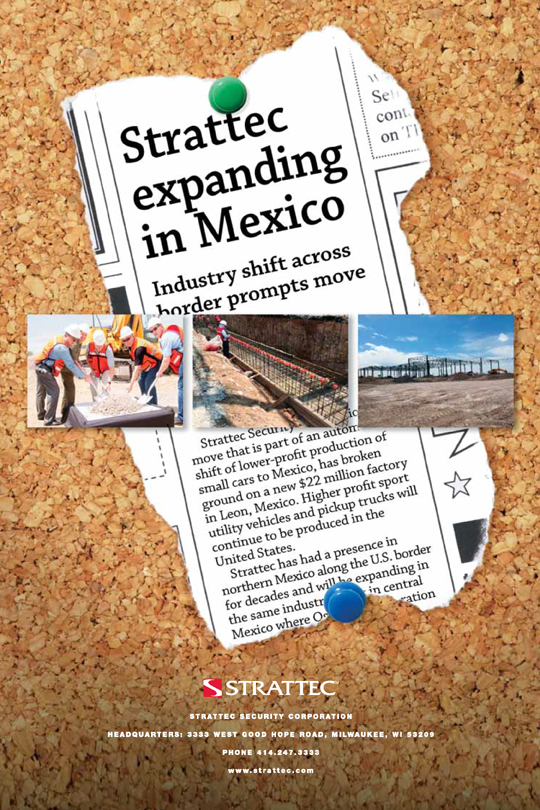
There has been a significant migration of automotive assembly to the central part of Mexico. Through our joint venture with ADAC Automotive, we broke ground in April on a new facility in Leon, Mexico to manufacture painted door handles for both existing and future customers currently in, or moving to, that region. This significant incremental business will have a positive impact on STRATTEC earnings in Fiscal 2018 and beyond. For fiscal 2017, we will be concentrating on facility construction and refining the manufacturing processes.
FINANCIAL
In addition to product mix having a large negative impact on earnings in fiscal 2016, we faced additional costs associated with winning new business, some product containment / replacement costs, and continued losses associated with our diversification efforts which we still believe will create long term value. We also recognized an impairment charge related to our investment in India, as explained in the next section.
| 2016 STRATTEC Annual Report | 2 |
LETTER TO THE SHAREHOLDERS
VAST
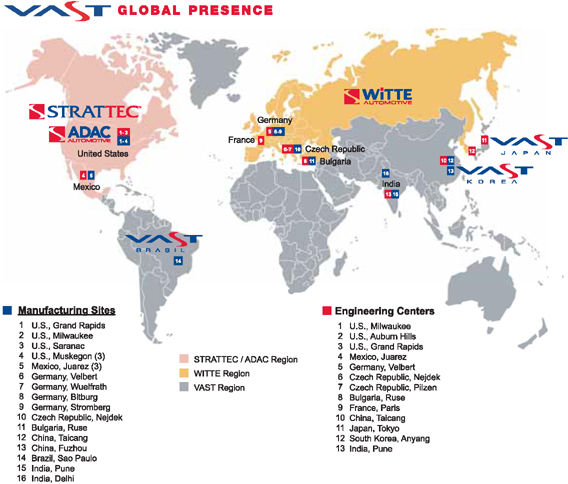
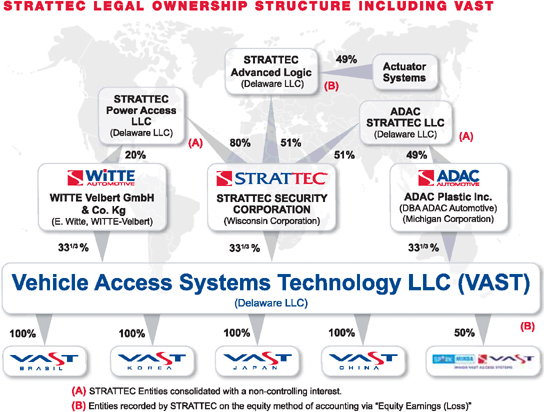
VAST (Vehicle Access System Technology) is a unique partnership between STRATTEC and two privately owned companies, WITTE Automotive of Velbert Germany and ADAC Automotive of Grand Rapids, Michigan. With our partners, we have made investments in China and India. We are pleased with the progress made by our organizations in leveraging our collective strengths, technologies, locations and global footprint.
In April 2015, VAST made an investment in India, now called Minda-VAST Access Systems (MVAS), owning 50% of this joint venture. We are very pleased to have Spark Minda, a publicly traded company in India with over one-half billion in sales, as a strong partner to participate in the anticipated growth in that market. While gaining a share of sales in India over the long term is of benefit, the greater benefit comes from gaining a stronger competitive position to win global programs.
The price of VAST LLC’s share of MVAS was based in part on an estimated level of sales revenue generation that MVAS would be able to reach. MVAS did not reach the level anticipated for 2016, and VAST now believes the estimates for subsequent years may not be reached. The accounting rules require an impairment study to value the investment based on a formula related to India alone, without consideration for the positive leverage it will have on the rest of our global business. As a result, STRATTEC recognized a $2 million impairment charge for our share of the write down of the book value of this investment, which reduced our Earnings per Share by $.35 and our Stockholders Equity value, but was not an additional cash expense. We remain very bullish on the long term positive impact MVAS will have on our global strategy and global success.
Lastly, to strengthen our Asian operations, VAST recently added a Vice-President to its organization, who is located in China. We believe his efforts to coordinate VAST China operations with the rest of the world will be beneficial in many ways.
SUMMARY
As a company, we are driven and rewarded by a return on asset metric known as Economic Value Added (EVA). It forces us to act like owners and spend our money accordingly. I am deeply appreciative of the efforts of nearly 4,000 STRATTEC Associates in acting like owners and taking steps to create a bright future for all of us. For our long term shareholders, despite the drop in share price this year, we have returned approximately a 15% annual compounded rate of return over the last five years. We appreciate your support and long term commitment to the company.
Sincerely,

Frank J. Krejci
President & Chief Executive Officer
| 2016 STRATTEC Annual Report | 3 |
FINANCIAL HIGHLIGHTS
(IN MILLIONS)
| 2016 | 2015 | 2014 | ||||||||||
Net Sales | $ | 401.4 | $ | 411.5 | $ | 348.4 | ||||||
Gross Profit | 64.8 | 72.7 | 65.8 | |||||||||
Income from Operations | 20.9 | 31.1 | 26.5 | |||||||||
Net Income Attributable to STRATTEC | 9.1 | 20.7 | 16.4 | |||||||||
Total Assets | 242.2 | 230.8 | 207.9 | |||||||||
Total Debt | 20.0 | 10.0 | 2.5 | |||||||||
STRATTEC Shareholders’ Equity | 139.3 | 140.3 | 125.5 | |||||||||
ECONOMIC VALUE ADDED (EVA®)
We believe that EVA® represents an accurate measure of STRATTEC’s overall performance and shareholder value. All U.S. associates and many of our Mexico-based salaried associates participate in incentive plans that are based upon our ability to add economic value to the enterprise. The EVA® performance for 2016 was a positive $2.1 million which represents a $4.4 million reduction from 2015. (For further explanation of our EVA® Plan, see our 2016 definitive Proxy Statement.)
Net Operating Profit After Cash-Basis Taxes | $ | 14.9 | ||||||
Average Monthly Net Capital Employed | $ | 127.7 | ||||||
Cost of Capital | 10 | % | ||||||
|
| |||||||
Capital Charge | 12.8 | |||||||
|
| |||||||
Economic Value Added | $ | 2.1 | ||||||
|
|
EVA® is not a traditional financial measurement under U.S. GAAP and may not be similar to EVA® calculations used by other companies. However, STRATTEC believes the reporting of EVA® provides investors with greater visibility of economic profit. The following is a reconciliation of the relevant GAAP financial measures to the non-GAAP measures used in the calculation of STRATTEC’s EVA®.
Net Operating Profit After Cash-Basis Taxes:
2016 Net Income Attributable to STRATTEC as Reported | $ | 9.1 | ||
Deferred Tax Provision | 3.0 | |||
Other | 2.8 | |||
|
| |||
Net Operating Profit After Cash-Basis Taxes | $ | 14.9 | ||
|
|
Average Monthly Net Capital Employed:
Total STRATTEC Shareholders’ Equity as Reported at July 3, 2016 | $ | 139.3 | ||
Long-Term Liabilities | 23.4 | |||
Long-Term Assets – Other than Property, Plant and Equipment | (22.6 | ) | ||
Other | (7.0 | ) | ||
|
| |||
Net Capital Employed at July 3, 2016 | $ | 133.1 | ||
Impact of 12 Month Average | (5.4 | ) | ||
|
| |||
Average Monthly Net Capital Employed | $ | 127.7 | ||
|
|
EVA® is a registered trademark of Stern, Stewart & Co.
| 2016 STRATTEC Annual Report | 4 |
COMPANY DESCRIPTION
BASIC BUSINESS
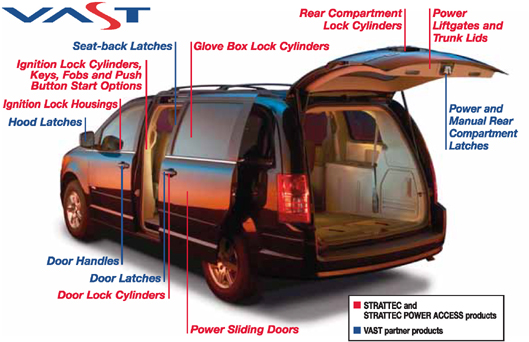
STRATTEC SECURITY CORPORATION designs, develops, manufactures and markets automotive access control products including mechanical locks and keys, electronically enhanced locks and keys, steering column and instrument panel ignition lock housings, latches, power sliding side door systems, power lift gate systems, power deck lid systems, door handles and related products for North American automotive customers. We also supply global automotive manufacturers through a unique strategic joint venture relationship with WITTE Automotive of Velbert, Germany and ADAC Automotive of Grand Rapids, Michigan called VAST LLC (“VAST”). Under this relationship STRATTEC, WITTE and ADAC market each company’s products to global customers under the “VAST” brand name. Our products are shipped to customer locations in the United States, Canada, Mexico, Europe, South America, Korea and China, and we provide full service and aftermarket support.
HISTORY
STRATTEC formerly was a division of Briggs & Stratton Corporation. In 1995, STRATTEC was spun off from Briggs & Stratton through a tax-free distribution to the then-existing Briggs & Stratton shareholders and has been an independent public company for over twenty-one years.
Our history in the automotive security business spans over 100 years. STRATTEC has been the world’s largest producer of automotive locks and keys since the late 1920s, and we currently maintain a dominant share of the North American markets for these products.
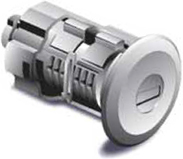
Lock Cylinder
PRODUCTS
Our traditional products are lock sets (locks and keys) for cars and light trucks. Typically, two keys are provided with each vehicle lockset. Most of the vehicles we currently supply are using keys with sophisticated radio frequency identification technology for additional theft prevention. Keys with remote entry devices integrated into a single unit and bladeless electronic keys have been added to our product line and are gaining in popularity.
Key Fob

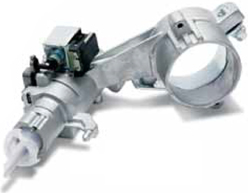
Steering Column Locking Mechanism
Ignition lock housings represent a growing access control product for us. These housings are the mating part for our ignition locks and typically are part of the steering column structure, although there are instrument panel- mounted versions for certain vehicle applications. These housings are either die cast from zinc or injection molded plastic and may include electronic components for theft deterrent systems.
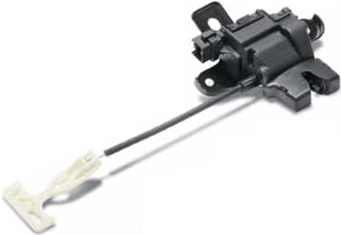
We are also developing additional access control products, including trunk latches, lift gate latches, tailgate latches, hood latches, side door latches and related hardware. With our acquisition of Delphi Corporation’s Power Products Group in fiscal 2009, we are now supplying power access devices for sliding side doors, lift gates and trunk lids. Through a joint venture formed with ADAC Automotive during fiscal 2007, we also supply door handle components and related vehicle access hardware.
| 2016 STRATTEC Annual Report | 5 |
COMPANY DESCRIPTION
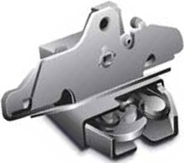
Trunk Latch
To maintain a strong focus on each of these access control products, we have Product Business Managers who oversee the product’s entire life cycle, including product concept, application, manufacturing, warranty analysis, service/aftermarket, and financial/commercial issues. The Product Business Managers work closely with our sales organization, our engineering group, and our manufacturing operations to assure their products are receiving the right amount of quality attention so that their value to STRATTEC and the market place is enhanced.
Key Fob

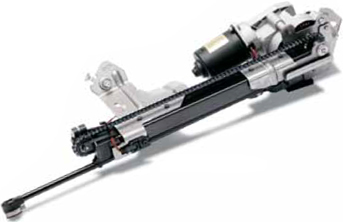
Power Sliding Door
MARKETS
We are a direct supplier to OEM automotive and light truck manufacturers as well as other transportation-related manufacturers. Our largest customers are Fiat Chrysler Automobiles, General Motors Company and Ford Motor Company. Our access control product mix varies by customer, but generally our overall sales tend to be highest in lock and key, followed by power access (produced by STRATTEC Power Access), ignition lock housings, the door handle and trim components produced by ADAC-STRATTEC de Mexico and latch mechanisms.
Direct sales to various OEMs represented approximately 74% of our total sales for fiscal 2016. The remainder of our revenue is received primarily through sales to the OEM service channels, the aftermarket and Tier 1 automotive supplier customers, and sales of certain products to non-automotive commercial customers.
Sales to our major automotive customers, both OEM and Tier 1, are coordinated through direct sales personnel located in our Detroit-area office. Sales are also facilitated through daily interaction between our Program Managers, Application Engineers and other product engineering personnel. Sales to other OEM customers are accomplished through a combination of our sales personnel located in Detroit and personnel in our Milwaukee headquarters office.

The majority of our OEM products are sold in North America. While some exporting is done to Tier 1 and automotive assembly plants in Europe, Asia and South America, we are in the process of expanding our presence in these markets and elsewhere through the Vehicle Access Systems Technology LLC (VAST) brand we jointly own with WITTE Automotive and ADAC Automotive. VAST is described in more detail on pages 8 and 9.
OEM service and replacement parts are sold to theOEM’s own service operations. In addition, we distribute our components and security products to the automotive aftermarket through approximately 50 authorized wholesale distributors, as well as other marketers and users of component parts, including export customers. Increasingly, our products find their way into the retail channel, specifically the hardware
| 2016 STRATTEC Annual Report | 6 |
COMPANY DESCRIPTION
store channel. Our ability to provide a full line of keys to that channel has been accomplished through the introduction of the STRATTEC “XL” key line. This extension to our line includes keys that we currently do not supply on an OE basis, including keys for Toyota, Honda and other popular domestic and import vehicles. This extended line of keys enables automotive repair specialists to satisfy consumer needs for repair or replacement parts. Our aftermarket activities are serviced through a warehousing operation in El Paso, Texas.
CUSTOMER SALES FOCUS
To bring the proper focus to the relationships with our major customers, we have seven customer-focused teams, each with a Director of Sales, one or two Engineering Program Managers and Customer Application Engineers. In addition to customer teams for General Motors, Ford and Fiat Chrysler, we currently have teams for New Domestic Vehicle Manufacturers (primarily the Japanese and Korean automotive manufactures), Driver Control/Ignition Lock Housing customers, Tier 1 customers, and Service and Aftermarket customers. Sales and engineering for ADAC-STRATTEC LLC are supported by our partner in this joint venture, ADAC Automotive.
Each Sales Director is responsible for the overall relationship between STRATTEC and a specific customer group. Program Managers are responsible for coordinating cross functional activities while managing new product programs for their customers.
Trunk Latch
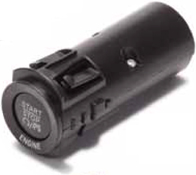
Push Button Start

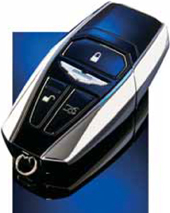
STRATTEC manufactures this Maserati electronic key fob.
PRODUCT ENGINEERING FOCUS
To best serve our customers’ product needs, STRATTEC’s engineering resources are organized into groups which focus on specific access control applications. We currently have six engineering groups: Locks and Keys, Aftermarket, Latches, Power Access Devices, Driver Control/Ignition Lock Housings and Electrical. Each group has a Product Business Manager, an Engineering Manager and a complement of skilled engineers who design and develop products for specific applications. In doing this, each engineering group works closely with the Customer teams, Engineering Program Managers, and Application Engineers.
Underlying this organization is a formalized product development process to identify and meet customer needs in the shortest possible time. By following this streamlined development system, we shorten product lead times, tighten our response to market changes and provide our customers with the optimum value solution to their security/access control requirements. STRATTEC is also ISO/TS 16949 and ISO 14001 certified. This means we embrace the philosophy that quality should exist not only in the finished product, but in every step of our processes as well.

The Aston Martin vehicles use an electronic key fob and mating docking station developed by STRATTEC exclusively for Aston Martin.
| 2016 STRATTEC Annual Report | 7 |
COMPANY DESCRIPTION

OPERATIONS
A significant number of the components that go into our products are manufactured at our headquarters in Milwaukee, Wisconsin. This facility produces zinc die cast components, stampings and milled key blades. We have three owned production facilities currently in operation in Juarez, Mexico operating as STRATTEC de Mexico. Plant No. 1 houses assembly operations for locksets, ignition lock housings, and our new STRATTEC Advanced Logic biometric security products. Plant No. 2 was built during fiscal 2009 to replace a leased facility. It houses our key finishing and plastic injection molding operations, as well as dedicated space for the assembly operations of ADAC-STRATTEC de Mexico. Plant No. 3 was purchased in Fiscal 2015 and houses both latch and power access assembly operations for STRATTEC Power Access de Mexico. Plant No. 4 is currently under construction in Leon, Mexico and will house our custom paint system for door handles and assembly for ADAC STRATTEC de Mexico. This facility is planned to be operational at the end of fiscal year 2017.


ADVANCED DEVELOPMENT
Research and development activities are centered around a dedicated research engineering staff we call our Advanced Development Group. This group has the responsibility for developing future products that will keep us in the forefront of the markets we serve. We primarily focus on electronic and mechanical access control products and modularization of related access/security control components. Once our Advanced Development Group establishes a proof-of-concept product utilizing new technology, with any further product development being shifted to our engineering groups for commercialization and product applications.
VEHICLE ACCESS SYSTEMS TECHNOLOGY LLC (VAST)
In fiscal 2001, we entered into a formal alliance with WITTE-Velbert GmbH, an automotive supplier based in Germany which designs, develops, manufactures and markets automotive access control products for European-based customers. This alliance consisted of two initiatives. The first was a set of legal agreements which allowed STRATTEC to manufacture and market WITTE’s core products in North America, and WITTE to manufacture and market STRATTEC’s core products in Europe. The second initiative was a 50:50 joint venture, WITTE-STRATTEC LLC, to invest in operations with local partners in strategic markets outside of Europe and North America.
| 2016 STRATTEC Annual Report | 8 |
COMPANY DESCRIPTION


In February of 2006, we announced the expansion of this alliance and related joint venture with the addition of a third partner, ADAC Plastics, Inc. ADAC, of Grand Rapids, Michigan, adds North American expertise in door handles, a part of WITTE’s core product line that STRATTEC did not support, and an expertise in color-matched painting of these components.
With the expansion of the alliance, we can offer a full range of access control related products available on a global basis to support customer programs. To identify this powerful combination of independent companies focused on working together, we renamed the joint venture Vehicle Access Systems Technology LLC (VAST LLC). We now refer to the combination of the alliance structure and JV simply as “VAST”. WITTE is now called WITTE Automotive, and ADAC is now doing business as ADAC Automotive. We have adopted a common graphic image in which we share a logo mark and colors, and a specific VAST logo used on the partners’ printed and electronic presentation materials. VAST made investments with a local partner in Brazil in September, 2001, and local partners in China in March, 2002. However, during fiscal 2010, VAST LLC purchased the remaining 40 percent interest of its local partners in the China venture. VAST China is now wholly owned by VAST LLC and had annual net sales of approximately $115 million during fiscal 2016. This was an important step which gives STRATTEC a one-third interest in VAST China’s activities in the important growing Chinese/Asian market. In March 2014, VAST LLC purchased the remaining 49 percent interest of its local partner in Brazil, which had annual net sales of approximately $1 million during fiscal 2016.
| 2016 STRATTEC Annual Report | 9 |
COMPANY DESCRIPTION
On April 30, 2015 VAST LLC executed a purchase agreement to become a 50:50 Joint Venture partner with Minda Management Services Limited, an affiliate of both Minda Corporation Limited and Spark Minda, Ashok Minda Group of New Delhi, India (collectively, “Minda”). VAST acquired a fifty percent equity interest in the former Minda-Valeo Security Systems joint venture entity, based in Pune, India, for approximately $12 million. This joint venture entity was renamed, Minda-VAST Access Systems (“Minda-VAST”). Minda-VAST has operations in Pune and Delhi and had annual sales of approximately $36 million during fiscal year 2016. Minda is a leading manufacturer of security & access products and handles, for both OEMs and the aftermarket in India.
VAST is the embodiment of STRATTEC’s, WITTE’s and ADAC’s globalization strategy. We are developing VAST as a global brand with which we are jointly pursuing business with identified global customers. Those identified customers are General Motors, Ford, Fiat/Chrysler, Volkswagen, Honda, Toyota, Renault/Nissan and Hyundai/Kia.
To manage our customer relationships and coordinate global ventures and activities, we have established a VAST Management Group led by a President. The Management Group includes three Vice Presidents, one each from WITTE, STRATTEC and ADAC. With the focus provided by this Management Group, VAST is able to manage global programs with a single point of contact for customers, with the added advantage of providing regional support from the partners’ operating entities. Combined with VAST LLC’s ventures in China and Brazil, and sales/engineering offices in Japan and Korea, this structure establishes our global footprint.
| 2016 STRATTEC Annual Report | 10 |
COMPANY DESCRIPTION
ADAC-STRATTEC de MEXICO
During fiscal 2007, we formed a new entity with ADAC Automotive called ADAC-STRATTEC LLC including a wholly owned Mexican subsidiary ADAC-STRATTEC de Mexico (ASdM). The purpose of this joint venture is to produce certain ADAC and STRATTEC products utilizing ADAC’s plastic molding injection expertise and STRATTEC’s assembly capability. ASdM currently operates out of defined space in STRATTEC de Mexico Plant No. 2 located in Juarez, Mexico. Products from this joint venture include non-painted door handle components and exterior trim components for OEM customers producing in North America. STRATTEC owns 51% of this joint venture and its financial results are consolidated into STRATTEC’s financial statements. In our fiscal years ending 2016 and 2015, ASdM was profitable and represented $61.4 and $60.9 million, respectively, of our consolidated net sales.
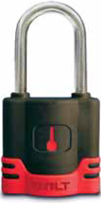
STRATTEC has introduced the BOLT line of products, the world’s first codeable padlock. In a simple one-step process, users can code the padlock to their vehicle key. This provides significant convenience by reducing the number of keys users need to secure their lockers, storage sheds and vehicle accessories such as tool boxes, trailer hitches, etc. You can buy this product direct at www.boltlock.com.
STRATTEC POWER ACCESS LLC
During fiscal year 2009, we formed a new subsidiary with WITTE Automotive called STRATTEC POWER ACCESS LLC (SPA) to acquire the North American business of the Delphi Power Products Group.

| 2016 STRATTEC Annual Report | 11 |
COMPANY DESCRIPTION
WITTE is a 20 percent minority owner. SPA in turn owns a Mexican subsidiary, STRATTEC POWER ACCESS de Mexico. The purpose of this subsidiary is to produce power access devices for sliding side doors, lift gates and trunk lids. STRATTEC POWER ACCESS de Mexico currently operates out of defined space in STRATTEC de Mexico Plant No. 3 located in Juarez, Mexico. Financial results for SPA are consolidated in STRATTEC’s financial statements. For fiscal years ending 2016 and 2015, SPA was profitable and represented $83.7 and $68.1 million, respectively, of our consolidated net sales.
STRATTEC ADVANCED LOGIC LLC
During the fourth quarter of fiscal year 2013, we formed a new joint venture with Actuator Systems LLC called NextLock LLC subsequently renamed STRATTEC Advanced Logic. The initial capitalization of the joint venture was $1.5 million. The purpose of this joint venture is to assemble and sell the next generation of biometric security products based upon the residential and commercial designs of Actuator Systems. This joint venture had minimal sales activity in both fiscal 2016 and 2015. During fiscal year 2015, STRATTEC Advanced Logic signed a marketing agreement with Westinghouse Security Products to sell under the Westinghouse brand name (see also www.westinghousesecurity.com). STRATTEC owns 51% of this joint venture and its financial results are accounted for on the equity method of accounting.

STRATTEC Advanced Logic Biometric Security Products
SEASONAL NATURE OF THE BUSINESS
The manufacturing of components used in automobiles is driven by the normal peaks and valleys associated with the automotive industry. Typically, the months of July and August are relatively slow as summer vacation shutdowns and model year changeovers occur at the automotive assembly plants. September volumes increase rapidly as each new model year begins. This volume strength continues through October and into early November. As the holiday and winter seasons approach, the demand for automobiles slows, as does production. March usually brings a major sales and production increase, which then continues through most of June. This results in our first fiscal quarter sales and operating results typically being our weakest, with the remaining quarters being more consistent.
ECONOMIC VALUE COMMITMENT
The underlying philosophy of our business and the means by which we measure our performance is Economic Value Added (EVA®). Simply stated, economic value is created when our business enterprise yields a return greater than the cost of capital we and our shareholders have invested in STRATTEC. The amount by which our return exceeds the cost of our capital is EVA®. In line with this philosophy, EVA® bonus plans are in effect for all of our U.S. associates, outside directors and many of our Mexico-based salaried associates as an incentive to help positively drive the economic value of our business.
STRATTEC’s significant market presence is the result of over a 100-year commitment to creating quality products and systems that are responsive to changing needs. As technologies advance and markets grow, STRATTEC retains that commitment to meeting and exceeding the expectations of our customers, and providing economic value to our shareholders.
| 2016 STRATTEC Annual Report | 12 |
| 2016 STRATTEC Annual Report | 13 |
MANAGEMENT’S DISCUSSION AND ANALYSIS
The following Discussion and Analysis should be read in conjunction with STRATTEC SECURITY CORPORATION’s accompanying Financial Statements and Notes thereto. Unless otherwise indicated, all references to years or quarters refer to fiscal years or fiscal quarters of STRATTEC.
EXECUTIVE OVERVIEW
Historically, a significant portion of our total net sales are to domestic automotive OEMs (General Motors, Ford and Fiat Chrysler). During the past two decades these customers lost North American market share to the New Domestic automotive manufacturers (primarily the Japanese and Korean automotive manufacturers). In addition to our dependence on our customers’ maintaining their market share, our financial performance depends in large part on conditions in the overall automotive industry, which in turn, are dependent upon the U.S. and global economies. During fiscal years 2016, 2015 and 2014, the above domestic automotive OEMs together represented 63 percent, 65 percent and 70 percent, respectively, of our total net sales.
During fiscal year 2016, we experienced stronger sales demand for our components from our major North American customers noted above as it relates to light trucks and both sport utility and car based utility vehicles in comparison to passenger cars, which was likely influenced by lower gas prices. If gas prices continue to remain low over the next year, we anticipate this consumer buying trend will continue.
Fiscal 2016 net sales were $401 million compared to $411 million in 2015 and $348 million in 2014. Net income attributable to STRATTEC for fiscal 2016 was $9.1 million compared to $20.7 million in 2015 and $16.4 million in 2014. The financial health of our three largest customers continues to improve. General Motors, Ford and Fiat Chrysler continued to report profitable results after implementing significant restructuring plans that modified their cost structures by closing manufacturing facilities, reducing benefits and wages and eliminating certain models and brands in 2009 and 2010. With the new United Auto Workers contracts signed in the United States during November 2015, our major customers will be migrating passenger car production from the United States into Mexico over the next 3-5 years to improve their overall profitability on these vehicles. STRATTEC in conjunction with our joint venture partner ADAC Automotive are currently building a new production facility in Leon, Mexico to capture these new opportunities as it relates to painted door handles and assemblies in the Mexican market.
As we look out into the future, the July 2016 projections from our third-party forecasting service indicate that North American light vehicle production will show steady to flat improvement for the next five years. By model year, based on these projections we are expecting a 2016 build of 17.8 million vehicles, 18.5 million vehicles for 2017, 18.4 million vehicles for 2018, 18.3 million vehicles for 2019 and 18.8 million vehicles for 2020. As part of this third party projection, General Motors Company and the Ford Motor Company are expected to experience flat vehicle production volumes in their production levels during this time period. Fiat Chrysler, however, is expected to slightly decrease production as they eliminate or reduce passenger car production on certain models during this time horizon. Of course, all of these forecasts are subject to variability based on what happens in the overall North American and global economies, especially as it relates to the current levels of employment, availability of consumer credit, home equity values, fluctuating fuel prices, changes in customer preferences regarding product quality issues, including related to recall and product warranty coverage issues, and other key factors that we believe could determine whether consumers can or will purchase new vehicles.
Focus and Strategy Going Forward
STRATTEC’s long-term strategy is focused on maximizing long-term shareholder value by driving profitable growth. Our management believes productivity improvements and cost reductions are critical to our competitiveness, while enhancing the value we deliver to our customers. In order to accomplish this, we have been pursuing, and we intend to continue to pursue, the following objectives as summarized below:
| • | Streamline and standardize processes to increase productivity and improve quality of our products |
| • | Maintain a disciplined and flexible cost structure to leverage scale and optimize asset utilization and procurement |
| • | Maintain our strong financial position by deploying capital spending targeted for growth and productivity improvement |
| • | Leverage the “VAST Brand” with customer relationships to generate organic growth from global programs |
| • | Offer our customers innovative products and cost savings solutions to meet their changing demands |
| • | Explore and execute targeted mergers and acquisitions with a disciplined due diligence approach and critical financial analysis to drive shareholder value |
| 2016 STRATTEC Annual Report | 14 |
MANAGEMENT’S DISCUSSION AND ANALYSIS
We use several key performance indicators to gauge progress toward achieving these objectives. These indicators include net sales growth, operating margin improvement, return on capital employed and cash flow from operations.
RESULTS OF OPERATIONS
2016 Compared to 2015
| Years Ended | ||||||||
| July 3, 2016 | June 28, 2015 | |||||||
Net sales (millions of dollars) | $ | 401.4 | $ | 411.5 | ||||
Net Sales to each of our customers or customer groups in the current year and prior year were as follows (millions of dollars):
| Years Ended | ||||||||
| July 3, 2016 | June 28, 2015 | |||||||
Fiat Chrysler Automobiles | $ | 115.9 | $ | 116.9 | ||||
General Motors Company | 79.9 | 105.8 | ||||||
Ford Motor Company | 57.3 | 45.5 | ||||||
Tier 1 Customers | 67.3 | 71.3 | ||||||
Commercial and Other OEM Customers | 49.3 | 41.7 | ||||||
Hyundai / Kia | 31.7 | 30.3 | ||||||
|
|
|
| |||||
Total | $ | 401.4 | $ | 411.5 | ||||
|
|
|
| |||||
Net sales were $401.4 million in 2016 compared to $411.5 million in 2015. Our 2016 fiscal year was 53 weeks while our 2015 fiscal year was the typical 52 weeks. The impact of the additional week of customer shipments during the current year increased sales by approximately $7.5 million. The overall reduction in sales in the current year as compared to the prior year was due to increased service parts sales to General Motors during the prior year, as well as current year customer vehicle production volume reductions on models for which we supply components, temporary shut-downs at customer production facilities, and agreed upon customer price reductions. The decreased sales to Fiat Chrysler Automobiles in the current year were due to reduced product content on certain vehicle models for which we supply components. Additionally, during the current year, Fiat Chrysler Automobiles temporarily shutdown production at its Sterling Heights, Michigan and Toluca, Mexico assembly plants which are primarily responsible for the production of the Chrysler 200 and Dodge Journey due to reduced sales demand for these vehicles. This shutdown reduced our sales by $8.9 million during the current year. These impacts were mostly offset by an increase in Chrysler Pacifica minivan production volumes for which we supply components. During the prior year, Fiat Chrysler implemented a temporary shutdown at its Windsor, Canada assembly plant to re-tool for production of the new Chrysler Pacifica minivan, which shutdown decreased our sales to Fiat Chrysler by $18 million. The negative effect of that shutdown was partially offset by increased service sales during the prior year in comparison to the current year. The decrease in sales to General Motors Company in the current year was attributed to incremental service parts sales of $34 million shipped in the prior year for parts used to support a recall campaign. Those incremental sales did not continue during the current year. In addition, the current year included $2.0 million of agreed upon price reductions, which began January 1, 2016 while the prior year included a $3.3 million sales concession that we granted to General Motors during the prior year. Increased sales to Ford Motor Company in the current year were attributed to higher vehicle production volumes and content on models for which we supply components, in particular for components we supply for F-150 pick-up trucks. Sales to Tier 1 Customers during the current year decreased in comparison to the prior year due to lower production volume on passenger cars for which we supply driver control and door handle components. Sales to commercial and other OEM Customers during the current year increased in comparison to the prior year. These customers represent purchasers of vehicle access control products, such as latches, fobs, and driver controls, that we have developed in recent years to complement our historic core business of locks and keys. The increase in sales to Hyundai / Kia in the current year was principally due to higher levels of sales on the Kia Sedona minivan for which we supply components.
| Years Ended | ||||||||
| July 3, 2016 | June 28, 2015 | |||||||
| Cost of Goods Sold (millions of dollars) | $ | 336.6 | $ | 338.8 | ||||
Direct material costs are the most significant component of our cost of goods sold and comprised $224.9 million or 66.8 percent of cost of goods sold in the current year compared to $217.1 million or 64.1 percent of cost of goods sold in the prior year. The increase in material costs year over year of $7.8 million or 3.6 percent was impacted by our product sales mix in the current year as compared to the prior year. The current year included increased sales of power access products as compared to the prior year. Power access products typically have a higher purchased content percentage as compared to our other access control products. In addition, increased scrap costs in the current year associated with new product launches contributed to the year over year increase in material costs.
| 2016 STRATTEC Annual Report | 15 |
MANAGEMENT’S DISCUSSION AND ANALYSIS
The remaining components of cost of goods sold consist of labor and overhead costs which decreased $10.0 million or 8.2 percent in the current year as compared to the prior year as the variable portion of these costs decreased due to the reduced sales volumes in 2016. In addition, the current year included a year-over-year decrease in customer warranty provisions of $8.4 million as the prior year included provisions for expected warranty payments to be settled in future periods, a reduction of approximately $8.7 million in the U.S. dollar value of our Mexican operations due to a favorable Mexican peso to U.S. dollar exchange rate and a reduction of approximately $2.4 million in expense provisions for the accrual of bonuses under our incentive bonus plans between years. Additionally, during the prior year, a lump sum bonus totaling $311,000 was paid to our Milwaukee represented hourly workers resulting from the ratification of a new 4-year labor contract. The average U.S. dollar/Mexican peso exchange rate increased to approximately 17.22 pesos to the dollar in the current year period from approximately 14.34 pesos to the dollar in the prior year period. These favorable impacts were partially offset by higher depreciation expense in 2016, increased 2016 manufacturing start-up costs associated with new product launches, and higher costs during 2016 associated with diversifying our products portfolio.
| Years Ended | ||||||||
| July 3, 2016 | June 28, 2015 | |||||||
| Gross Profit (millions of dollars) | $ | 64.8 | $ | 72.7 | ||||
Gross Profit as a percentage of net sales | 16.1 | % | 17.7 | % | ||||
The reduction in gross profit in the current year as compared to the prior year was the result of the reduction in sales partially offset by the reduction in cost of goods sold as discussed above. The reduction in gross profit as a percentage of net sales in the current year as compared to the prior year was the result of reduced sales of service parts related to the General Motors customer recall campaign noted above, which typically have higher gross profit margins as compared to gross profit margins on parts sold for new vehicle production, agreed upon customer price reductions that became effective at the start of the 2016 calendar year, reduced customer production volumes resulting in less favorable absorption of our fixed manufacturing costs, higher depreciation expense, increased 2016 manufacturing start-up costs associated with new product launches and higher costs associated with diversifying our products portfolio. These unfavorable impacts to the gross profit margin as a percentage of net sales were partially offset by a decrease in expense provisions for the accrual of bonuses under our incentive bonus plans, a reduction in the U.S. dollar value of the cost of our Mexican operations due to a favorable Mexican peso to U.S. dollar exchange rate between these years, and a lump sum bonus paid to our Milwaukee represented hourly workers during the prior year period resulting from the ratification of a new 4-year labor contract, all as discussed above.
Engineering, Selling and Administrative Expenses in the current year and prior year were as follows:
| Years Ended | ||||||||
| July 3, 2016 | June 28, 2015 | |||||||
| Expenses (millions of dollars) | $ | 43.9 | $ | 41.5 | ||||
Expenses as a percentage of net sales | 10.9 | % | 10.1 | % | ||||
Engineering, selling and administrative expenses increased approximately $2.4 million between periods. Higher selling and engineering costs associated with current product programs, an additional week of expense as a result of the 53 week fiscal year and higher engineering costs for new programs for which we are utilizing third party vendors for a portion of the development work were partially offset by a reduction of $1.9 million in expense provisions for the accrual of bonuses under our incentive bonus plans in the current year as compared to the prior year.
Income from operations in the current year was $20.9 million compared to $31.1 million in the prior year period. This decrease was the result of reduced sales and reduced gross profit margins during 2016 as well as an increase in engineering, selling and administrative expenses, all as discussed above.
The equity (loss) earnings of joint ventures was comprised of the following in the current year and prior year (thousands of dollars):
| Years Ended | ||||||||
| July 3, 2016 | June 28, 2015 | |||||||
Vehicle Access Systems Technology LLC | $ | (639 | ) | $ | 1,251 | |||
STRATTEC Advanced Logic, LLC | (1,596 | ) | (2,039 | ) | ||||
|
|
|
| |||||
| $ | (2,235 | ) | $ | (788 | ) | |||
|
|
|
| |||||
The current year equity loss of joint ventures for Vehicle Access Systems Technology LLC included a $6 million impairment charge related to its Minda-VAST Access Systems joint venture in India. STRATTEC’s portion of this impairment charge totaled $2 million. STRATTEC is not the primary beneficiary and does not control STRATTEC Advanced Logic, LLC (“SAL LLC”). Accordingly, our investment in SAL LLC is accounted for using the equity method. Even though we maintain a 51 percent ownership interest in SAL LLC, effective with our fiscal 2015 fourth quarter, 100 percent of the funding for SAL LLC was being made through loans from STRATTEC to SAL LLC. Therefore,
| 2016 STRATTEC Annual Report | 16 |
MANAGEMENT’S DISCUSSION AND ANALYSIS
STRATTEC began recognizing 100 percent of the losses of SAL LLC up to our committed financial support, which losses included write-offs of fixed assets and inventory totaling $381,000 in the prior year. In addition, the following losses were included in our current year and prior year Equity (Loss) Earnings of Joint Ventures for SAL LLC (thousands of dollars):
| Years Ended | ||||||||
| July 3, 2016 | June 28, 2015 | |||||||
Loss on Guarantee of SAL LLC Vendor Contract | $ | — | $ | 123 | ||||
Loss on Loan to SAL LLC | 225 | 100 | ||||||
Loss on Guarantee of SAL LLC Credit Facility | 247 | 488 | ||||||
|
|
|
| |||||
| $ | 472 | $ | 711 | |||||
|
|
|
| |||||
Effective November 1, 2014, a license agreement was signed with Westinghouse allowing SAL LLC to do business as Westinghouse Security. Payments required under this license agreement were guaranteed by STRATTEC. As of July 3, 2016 and June 28, 2015, STRATTEC had recorded a liability equal to the estimated fair value of the guarantee of these payments of $250,000, which amount was equal to the future payments required to be made under the license agreement as of these dates. STRATTEC’s proportionate share of the guarantee of these payments based on our ownership percentage in SAL LLC totaled $127,000, and accordingly, our investment in SAL LLC was increased by this amount as of July 3, 2016 and June 28, 2015. Our joint venture partner did not guarantee their proportionate share of the payments required under the license agreement. As a result, in the prior year, STRATTEC recorded a loss of $123,000 which was equal to our partner’s proportionate share, based upon their ownership interest in the joint venture, of the fair value of the STRATTEC guarantee.
During the fourth quarter of 2015, a loan was made from STRATTEC to SAL LLC in support of operating expenses and working capital needs. As of June 28, 2015, the outstanding loan amount totaled $100,000. A valuation reserve of $100,000 was recorded related to this loan as of June 28, 2015. During 2016, additional loans totaling $225,000 were made from STRATTEC to SAL LLC in support of operating expenses and working capital needs. An additional valuation reserve of $225,000 was recorded related to the additional loans during 2016. As of July 3, 2016, the outstanding loan amount totaled $325,000, which was fully offset by a valuation reserve of $325,000.
SAL LLC had a $1.5 million revolving credit facility with BMO Harris Bank N.A. with a maturity date of February 16, 2016 (the “SAL Credit Facility”), which was fully guaranteed by STRATTEC. Outstanding borrowings under the SAL Credit Facility as of February 16, 2016 and June 28, 2015 totaled $1.5 million and $995,000, respectively. SAL LLC did not have cash available to pay the outstanding debt balance as of the maturity date. Therefore, STRATTEC made a payment of $1.5 million on its guarantee on February 16, 2016. Prior to making the guarantee payment, STRATTEC had a recorded liability related to the guarantee of $1.5 million and $995,000 at February 16, 2016 and June 28, 2015, respectively, which amounts were equal to the estimated fair value of the guarantee as of these dates. As of June 28, 2015, the guarantee liability was included in Other Current Liabilities in the accompanying Consolidated Balance Sheets. STRATTEC’s proportionate share of the guarantee based on our ownership percentage in SAL LLC totaled $765,000 and $507,000, respectively, as of February 16, 2016 and June 28, 2015, and accordingly, our investment in SAL LLC included these amounts as of these dates. Our joint venture partner did not guarantee their proportionate share of the SAL Credit Facility. As a result, we recorded a loss equal to our partner’s proportionate share of the fair value of the STRATTEC guarantee based upon our partner’s ownership interest in the joint venture of $488,000 during fiscal 2015 and $247,000 during 2016.
Included in other income, net in the current year and prior year were the following items (thousands of dollars):
| Years Ended | ||||||||
| July 3, 2016 | June 28, 2015 | |||||||
Foreign currency transaction gain | $ | 2,559 | $ | 3,075 | ||||
Unrealized Loss on Peso Forward Contracts | (889 | ) | — | |||||
Realized Loss on Peso Forward Contracts | (1,196 | ) | — | |||||
Rabbi Trust (loss) gain | (41 | ) | 96 | |||||
Other | 235 | 310 | ||||||
|
|
|
| |||||
| $ | 668 | $ | 3,481 | |||||
|
|
|
| |||||
Foreign currency transaction gains resulted from activity associated with foreign denominated assets held by our Mexican subsidiaries. We entered into the Mexican Peso currency forward contracts to minimize earnings volatility resulting from changes in exchange rates affecting the U.S. dollar cost of our Mexican operations. Unrealized losses recognized as a result of mark-to-market adjustments as of July 3, 2016 may or may not be realized, depending upon the actual Mexican peso to U.S. dollar exchange rates experienced during the balance of the contract period. Our Rabbi Trust assets fund our amended and restated supplemental executive retirement plan. The investments held in the Trust are considered trading securities.
| 2016 STRATTEC Annual Report | 17 |
MANAGEMENT’S DISCUSSION AND ANALYSIS
Our effective income tax rate for 2016 was 26.4 percent compared to 27.6 percent in 2015. Our income tax provision for 2015 was affected by a lower statutory tax rate for income subject to tax in Mexico as compared to the statutory tax rate for income subject to tax in the U.S as well as a net reduction in our liability for unrecognized tax benefits of approximately $852,000. Our income tax provision for each of 2016 and 2015 was affected by the non-controlling interest portion of our pre-tax income. The decrease in the effective tax rate between periods was the result of a year-over-year increase in the non-controlling interest percentage of our pre-tax income.
2015 Compared to 2014
| Years Ended | ||||||||
| June 28, 2015 | June 29, 2014 | |||||||
Net sales (millions of dollars) | $ | 411.5 | $ | 348.4 | ||||
Net Sales to each of our customers or customer groups in 2015 and 2014 were as follows (millions of dollars):
| Years Ended | ||||||||
| June 28, 2015 | June 29, 2014 | |||||||
Fiat Chrysler Automobiles | $ | 116.9 | $ | 117.5 | ||||
General Motors Company | 105.8 | 79.5 | ||||||
Ford Motor Company | 45.5 | 46.6 | ||||||
Tier 1 Customers | 71.3 | 61.6 | ||||||
Commercial and Other OEM Customers | 41.7 | 36.0 | ||||||
Hyundai / Kia | 30.3 | 7.2 | ||||||
|
|
|
| |||||
Total | $ | 411.5 | $ | 348.4 | ||||
|
|
|
| |||||
The increase in sales to General Motors Company in 2015 was attributed to incremental service parts sales during the six months ended December 28, 2014 of $34.0 million related to a recall campaign. Incremental service parts sales during our fiscal 2014 fourth quarter totaled $11 million. The incremental sales adjusted to more normal levels during the second half of our fiscal 2015 and remained at normal levels thereafter. Sales to General Motors were also impacted by higher vehicle production volumes and greater product content on vehicle models for which we supply components that were introduced for the 2015 model year and a $3.3 million sales concession we granted to General Motors which negatively impacted 2015 revenues. Decreased sales to Fiat Chrysler Automobiles in 2015 were the result of Fiat Chrysler’s temporary shutdown of its Windsor, Canada assembly plant, which began in February 2015 and ended in May 2015, to re-tool the facility for the production of the new Chrysler minivan. This temporary plant shutdown decreased our net sales to Fiat Chrysler during 2015 by $18 million, which impact was mostly offset by increased sales related to higher customer vehicle production volumes and increased content on models for which we supply components and year-over-year increased service sales to Fiat Chrysler. Decreased sales to Ford Motor Company in 2015 were attributed to lower vehicle production volumes on models for which we supply components and in particular for components we supply on the F-150 pick-up trucks, which were partially offset by higher latch product sales to Ford in 2015 and increased content on models for which we supply components. Sales to Tier 1 Customers during 2015 increased in comparison to the prior year. These customers primarily represent purchasers of vehicle access control products, such as latches, fobs and driver controls, that we have developed in recent years to complement our historic core business of locks and keys. The increase in sales to Hyundai / Kia in 2015 was due to the ramp-up of the new Kia Sedona minivan for which we supply components.
| Years Ended | ||||||||
| June 28, 2015 | June 29, 2014 | |||||||
Cost of Goods Sold (millions of dollars) | $ | 338.8 | $ | 282.6 | ||||
Direct material costs are the most significant component of our cost of goods sold and comprised $217.1 million or 64.1 percent of cost of goods sold in 2015 compared to $184.0 million or 65.1 percent of cost of goods sold in 2014. The increase in material costs between these fiscal years of $33.1 million or 18.0 percent was due to increased sales volumes in 2015 as compared to 2014 as discussed above. The direct material costs were also impacted by higher purchased raw material costs for zinc during 2015 as compared to 2014. We have negotiated raw material price adjustment clauses with certain, but not all, of our customers to offset some of the market price fluctuations in the cost of zinc. During 2015, we used approximately 13.5 million pounds of zinc. Increased zinc costs during 2015, as adjusted for the impact of raw material price adjustments with certain customers, totaled approximately $525,000.
The remaining components of cost of goods sold consist of labor and overhead costs which increased $23.1 million or 23.4 percent in 2015 over 2014 as the variable portion of these costs increased due to the increased sales volumes during 2015. In addition, 2015 included a year-over-year increase in customer warranty provisions of $7.8 million for expected warranty payments to be settled in future periods, write-offs related to SAL LLC, our biometric joint venture, of $300,000 and an increase of $1.8 million in current year royalty costs related to sales of aftermarket product. These unfavorable impacts were partially offset by benefits of favorable absorption of the fixed portion of our labor and overhead costs resulting from increased sales volumes between periods, a reduction of approximately $4.2 million in the U.S. dollar costs of
| 2016 STRATTEC Annual Report | 18 |
MANAGEMENT’S DISCUSSION AND ANALYSIS
our Mexican operations due to a favorable Mexican peso to U.S. dollar exchange rate, and a reduction of approximately $1.5 million in expense provisions for the accrual of bonuses under our incentive bonus plans between periods. The average U.S. dollar/Mexican peso exchange rate increased to approximately 14.34 pesos to the dollar in 2015 from approximately 13.07 pesos to the dollar in 2014.
| Years Ended | ||||||||
| June 28, 2015 | June 29, 2014 | |||||||
Gross Profit (millions of dollars) | $ | 72.7 | $ | 65.8 | ||||
Gross Profit as a percentage of net sales | 17.7 | % | 18.9 | % | ||||
The improvement in gross profit in 2015 as compared to 2014 was the result of the increase in sales, partially offset by the increase in cost of goods sold as discussed above. The reduction in gross profit as a percentage of net sales in 2015 as compared to 2014 was the result of increased labor and overhead costs resulting from higher customer warranty provisions, write-offs related to SAL LLC and increased royalty costs as compared to 2014, partially offset by increased sales of service parts related to the General Motors’ recall campaign, which typically have higher gross profit margins as compared to gross profit margins on parts sold for new vehicle production, increased customer production volumes resulting in more favorable absorption of our fixed manufacturing costs, a favorable Mexican peso to U.S. dollar exchange rate and lower expense provisions for the accrual of bonuses under our incentive bonus plans in 2015 as compared to 2014, all as discussed above.
Engineering, Selling and Administrative Expenses in 2015 and 2014 were as follows:
| Years Ended | ||||||||
| June 28, 2015 | June 29, 2014 | |||||||
Expenses (millions of dollars) | $ | 41.5 | $ | 39.3 | ||||
Expenses as a percentage of net sales | 10.1 | % | 11.3 | % | ||||
Engineering, selling and administrative expenses increased approximately $2.2 million between periods while decreasing slightly as a percentage of our net sales to 10.1 percent in 2015 from 11.3 percent in 2014. Higher costs in support of our new Auburn Hills, Michigan sales and engineering facility and higher engineering and selling costs associated with current product programs as well as new product programs under development were partially offset by a reduction of $882,000 in expense provisions for the accrual of bonuses under our incentive bonus plans in 2015 as compared to 2014.
Income from operations in 2015 was $31.1 million compared to $26.5 million in 2014. This increase was the result of increased sales, partially offset by reduced gross profit margins during 2015, and an increase in engineering, selling and administrative expenses as discussed above.
The equity (loss) earnings of joint ventures was comprised of the following in 2015 and 2014 (thousands of dollars):
| Years Ended | ||||||||
| June 28, 2015 | June 29, 2014 | |||||||
| Vehicle Access Systems Technology LLC | $ | 1,251 | $ | 1,324 | ||||
STRATTEC Advanced Logic, LLC | (2,039 | ) | (367 | ) | ||||
|
|
|
| |||||
| $ | (788 | ) | $ | 957 | ||||
|
|
|
| |||||
STRATTEC is not the primary beneficiary and does not control SAL LLC. Accordingly, our investment in SAL LLC is accounted for using the equity method. Notwithstanding the existence of the SAL Credit Facility through February 16, 2016 described herein, as a result of STRATTEC’s guarantee of such credit facility and as a result of borrowing limitations imposed by the bank under such credit facility, even though we maintain a 51 percent ownership interest in SAL LLC, effective with our fiscal 2015 fourth quarter, 100 percent of the funding for SAL, LLC was being made through loans from STRATTEC to SAL LLC. Therefore, STRATTEC began recognizing 100 percent of the losses of SAL LLC up to our committed financial support, which losses included write-offs of fixed assets and inventory totaling $381,000 during 2015. In addition, the following losses were included in our 2015 Equity (Loss) Earnings of Joint Ventures for SAL LLC (thousands of dollars):
Loss on Guarantee of SAL LLC Vendor Contract | $ | 123 | ||
Loss on Loan to SAL LLC | $ | 100 | ||
Loss on Guarantee of SAL LLC Credit Facility | $ | 488 |
Effective November 1, 2014, a license agreement was signed with Westinghouse allowing SAL LLC to do business as Westinghouse Security. Payments required under this license agreement were guaranteed by STRATTEC. As of June 28, 2015, STRATTEC had recorded a liability equal to the estimated fair value of the guarantee of these payments of $250,000, which amount was equal to the future payments required to be made under the license agreement as of June 28, 2015. STRATTEC’s proportionate share of the guarantee of these payments based on our ownership percentage in SAL LLC totaled $127,000, and accordingly, we increased our investment in SAL LLC as of June 28, 2015 by this amount. Our joint venture partner did not guarantee their proportionate share of the payments required under the license agreement. As a result, STRATTEC recorded a loss of $123,000 which was equal to our partner’s proportionate share, based upon their ownership interest in the joint venture, of the fair value of the STRATTEC guarantee.
| 2016 STRATTEC Annual Report | 19 |
MANAGEMENT’S DISCUSSION AND ANALYSIS
During the fourth quarter of 2015, a loan was made from STRATTEC to SAL LLC in support of operating expenses and working capital needs. As of June 28, 2015, the outstanding loan amount totaled $100,000. A valuation reserve of $100,000 was recorded related to this loan as of June 28, 2015.
SAL LLC had a $1.5 million revolving credit facility with BMO Harris Bank N.A., which was fully guaranteed by STRATTEC. As of June 28, 2015, STRATTEC had recorded a liability equal to the estimated fair value of the guarantee of $995,000, which amount was equal to the outstanding borrowings on the SAL Credit Facility as of June 28, 2015. STRATTEC’s proportionate share of the guarantee based on our ownership percentage in SAL LLC totaled $507,000, and accordingly, we increased our investment in SAL LLC as of June 28, 2015 by this amount. Our joint venture partner did not guarantee their proportionate share of the SAL Credit Facility. As a result, STRATTEC recorded a loss of $488,000 which was equal to our partner’s proportionate share, based upon their ownership interest in the joint venture, of the fair value of the STRATTEC guarantee.
Included in other income, net in 2015 and 2014 were the following items (thousands of dollars):
| Years Ended | ||||||||
| June 28, 2015 | June 29, 2014 | |||||||
Foreign currency transaction gain (loss) | $ | 3,075 | $ | (36 | ) | |||
Rabbi Trust gain | 96 | 211 | ||||||
Other | 310 | 97 | ||||||
|
|
|
| |||||
| $ | 3,481 | $ | 272 | |||||
|
|
|
| |||||
Foreign currency transaction gains and losses resulted from activity associated with foreign denominated assets held by our Mexican subsidiaries. Our Rabbi Trust assets fund our amended and restated supplemental executive retirement plan. The investments held in the Trust are considered trading securities.
Our effective income tax rate for 2015 was 27.6 percent compared to 31.2 percent in 2014. Our income tax provision for each of 2015 and 2014 was affected by the non-controlling interest portion of our pre-tax income. Our income tax provision for 2015 was also affected by a lower statutory tax rate for income subject to tax in Mexico as compared to the statutory tax rate for income subject to tax in the U.S. Moreover, our income tax provision included a net reduction in our liability for unrecognized tax benefits of approximately $852,000 in 2015 compared to a reduction of approximately $221,000 in 2014 due to tax years that closed and changes in current and prior year tax positions. The decrease in the effective tax rate between periods was the result of the 2015 reduction in the liability for unrecognized tax benefits and a reduction in the statutory tax rate for income subject to tax in Mexico in 2015 versus 2014.
LIQUIDITY AND CAPITAL RESOURCES
Outstanding Receivable Balances from Major Customers
Our primary source of cash flow is from our major customers, which include Fiat Chrysler Automobiles LLC, General Motors Company and Ford Motor Company. As of the date of filing this Annual Report with the Securities and Exchange Commission, all of our customers are making payments on their outstanding accounts receivable in accordance with the payment terms included on their purchase orders. A summary of our outstanding receivable balances from our major customers as of July 3, 2016 was as follows (millions of dollars):
Fiat Chrysler Automobiles | $ | 18.1 | ||
General Motors Company | $ | 13.1 | ||
Ford Motor Company | $ | 6.9 |
Cash Balances in Mexico
We earn a portion of our operating income in Mexico, which is deemed to be permanently reinvested. As of July 3, 2016, $10.6 million of our $15.5 million cash and cash equivalents balance was deemed to be permanently reinvested in Mexico. Cash balances in Mexico will be used for future capital expenditures and future plant expansion in Mexico. We currently do not intend nor foresee a need to repatriate these funds. We expect existing domestic cash and cash equivalents, cash flows from operations, and borrowings under our credit facility to continue to be sufficient to fund our operating activities and cash commitments for investing and financing activities, such as regular quarterly dividends and capital expenditures, for at least the next 12 months and thereafter for the foreseeable future. Should we require more capital in the U.S. than is generated by our operations domestically, for example to fund significant discretionary activities, such as acquisitions of businesses and share repurchases, we could elect to repatriate future earnings from foreign jurisdictions. This alternative could result in higher effective tax rates and dilution of our earnings.
| 2016 STRATTEC Annual Report | 20 |
MANAGEMENT’S DISCUSSION AND ANALYSIS
Cash Flow Analysis
| Years Ended | ||||||||||||
| July 3, 2016 | June 28, 2015 | June 29, 2014 | ||||||||||
Cash Flows from (millions of dollars): | ||||||||||||
Operating Activities | $ | 8.2 | $ | 31.5 | $ | 11.5 | ||||||
Investing Activities | $ | (25.3 | ) | $ | (30.8 | ) | $ | (13.0 | ) | |||
Financing Activities | $ | 7.2 | $ | 5.8 | $ | 1.0 | ||||||
The decrease in cash provided by operating activities between 2015 and 2016 reflected a net increase in working capital requirements between the two years of $23.4 million, with the increase in our working capital requirements being made up of the following working capital changes (millions of dollars):
| Increase (Decrease) in Working Capital Requirements | ||||||||||||
| 2016 | 2015 | Change | ||||||||||
Accounts Receivable | $ | 5.1 | $ | (9.2 | ) | $ | 14.3 | |||||
Inventories | $ | 3.9 | $ | 4.3 | $ | (0.4 | ) | |||||
Customer Tooling | $ | 3.5 | $ | (1.8 | ) | $ | 5.3 | |||||
Other Assets | $ | 6.0 | $ | 3.3 | $ | 2.7 | ||||||
Accounts Payable and Other Liabilities | $ | 3.0 | $ | 1.5 | $ | 1.5 | ||||||
The year over year change in the accounts receivable balances reflected an increase in accounts receivable balances during 2016 compared to a reduction in accounts receivable balances during 2015. Receivable balances were increased at the start of the 2015 fiscal year as a result of $11 million of additional service parts sales in conjunction with General Motor’s recall campaign during the fourth quarter of 2014. The receivable balances related to the additional service parts sales were collected during 2015 reducing the accounts receivable balances during fiscal 2015. Additionally, higher sales during the fourth quarter of 2016 as compared to the fourth quarter of 2015 caused receivable balances to increase during fiscal 2016. The year over year change in customer tooling balances, which consisted of costs incurred for the development of tooling that will be directly reimbursed by the customer whose parts are produced from the tool, was the result of the timing of tooling development spending required to meet customer production requirements and related customer reimbursements. The year over year change in other assets was the result of a larger increase in the income tax recoverable balance in 2016 as compared to 2015, which was based on the required income tax provision and the timing and amounts of Federal and state tax payments made. The year over year change in the accounts payable and other liability balances was impacted by changes in accounts payable balances, accrued salaries and benefits balances and warranty reserve balances. The year over year change in accounts payable balances decreased working capital requirements $12.8 million between years. The changes in the accounts payable balances during each period 2016 and 2015 resulted from the timing of purchases and payments with our vendors based on normal payment terms. Additionally, increased accounts payable balances at June 2014 related to the General Motors’ recall campaign which were paid during 2015 increased the 2015 working capital requirements. The year over year change in accrued payroll and benefits balances increased working capital requirements $2.9 million between years as the accrual of bonuses under our incentive bonus program decreased between years. The provision for bonuses under our incentive bonus plans decreased $4.2 million between years while actual cash payments made decreased $2.1 million between years. The year over year change in warranty reserve balances increased working capital requirements $11.4 million between years. Warranty provisions decreased $8.4 million between years while warranty payments increased $2.6 million between years.
Other significant cash payments impacting net cash provided by operating activities during both the current year and prior year periods included cash contributions made to our qualified pension plan and cash payments made for Federal, state and foreign income taxes. Cash contributions made to our qualified pension plan totaled $3.0 million during both 2016 and 2015. Cash payments made for Federal, state and foreign income taxes totaled $4.7 million during 2016 compared to $14.8 million during 2015.
Net cash provided by operating activities was $31.5 million during 2015, compared to $11.5 million during 2014. The increase in cash provided by operating activities between these years reflected a net reduction in working capital requirements between the two years of $19.8 million, with the reduction being made up of the following working capital changes (millions of dollars):
| Increase (Decrease) in Working Capital Requirements | ||||||||||||
| 2015 | 2014 | Change | ||||||||||
Accounts Receivable | $ | (9.2 | ) | $ | 21.3 | $ | (30.5 | ) | ||||
Inventories | $ | 4.3 | $ | 6.2 | $ | (1.9 | ) | |||||
Customer Tooling | $ | (1.8 | ) | $ | 3.0 | $ | (4.8 | ) | ||||
Other Assets | $ | 3.3 | $ | 3.5 | $ | (0.2 | ) | |||||
Accounts Payable and Other Liabilities | $ | 1.5 | $ | (16.2 | ) | $ | 17.7 | |||||
| 2016 STRATTEC Annual Report | 21 |
MANAGEMENT’S DISCUSSION AND ANALYSIS
The year over year change in the accounts receivable balances reflected a reduction in accounts receivable balances during 2015 compared to an increase in accounts receivable balances during 2014. The 2014 account receivable balances increased as a result of $11 million of additional service parts sales in conjunction with General Motors’ recall campaign in 2014 and an overall increase in customer vehicle production volumes on models for which we supply components causing a reduction in 2015 balances and an increase in 2014 balances. The year over year change in the inventory balances was due to higher inventory balances required in June 2014 related to this customer’s recall campaign. The year over year change in customer tooling balances, which consisted of costs incurred for the development of tooling that will be directly reimbursed by the customer whose parts are produced from the tool, was the result of the timing of tooling development spending required to meet customer production requirements and related customer reimbursements. The year over year change in the accounts payable and other liability balances was the result of a reduction in accounts payable balances in 2015 and an increase in accounts payable balances in 2014, which occurred as a result of the timing of purchases and payments with our vendors based on normal payment terms as well as increased accounts payable balances at June 2014 related to the General Motors’ recall campaign.
Other significant cash payments impacting net cash provided by operating activities during both 2015 and 2014 included cash payments under our incentive bonus plans, cash contributions made to our qualified pension plan and cash payments made for Federal, state and foreign income taxes. Cash payments made under our incentive bonus plans totaled $7.3 million during 2015 compared to $4.8 million during 2014. Cash contributions made to our qualified pension plan totaled $3.0 million during 2015 compared to $4.0 million during 2014. Cash payments made for Federal, state and foreign income taxes totaled $14.8 million during 2015 compared to $5.4 million during 2014.
Net cash used by investing activities of $25.3 million during 2016, $30.8 million during 2015 and $13.0 million during 2014 included capital expenditures of $23.5 million, $26.1 million and $12.8 million, respectively. Capital expenditures during each year were made in support of requirements for new product programs and the upgrade and replacement of existing equipment. The 2015 capital expenditures included $2.1 million and $4.5 million for the purchase of additional facilities in Juarez, Mexico and Auburn Hills, Michigan, respectively. The Michigan building is being used as a sales and engineering office and replaced two current leased facilities in Michigan. The Juarez, Mexico building is being used as an additional facility to support current operations and was acquired in anticipation of both new and potential business awards in Mexico. The 2016 capital expenditures included $7.0 million for the purchase of land, equipment and the construction of a new facility in Leon, Mexico, which is expected to be used primarily to paint and assemble door handle products by ADAC-STRATTEC LLC. See further discussion related to this new facility under Future Capital Expenditures below. Net cash used by investing activities during 2016 and 2015 also included an investment in our VAST LLC joint venture of $220,000 and $4.4 million, respectively. The 2016 investment was made for the purpose of funding general operating expenses for Sistema de Acesso Veicular Ltda (formerly known as VAST do Brasil). The 2015 investment was made in support of the acquisition of a fifty percent equity interest in a joint venture entity, Minda VAST Access Systems, based in Pune, India, and in support of general operating expenses for the Brazilian entity. Additionally, during 2016, a $1.5 million investment in SAL LLC was made as the result of the payment on a guarantee of their debt facility. See further discussion under Credit Facilities and Guarantees below. During 2014, no capital contributions were made to SAL LLC or to VAST LLC. Loans were made by each partner, STRATTEC, WITTE and ADAC to our joint venture, VAST LLC, totaling $215,000 for each partner in 2015 and $285,000 for each partner in 2014. The loans were made in support of VAST LLC’s purchase of the non-controlling interest in the Brazilian entity and in support of funding general operating expenses of the Brazilian entity. During 2016, $100,000 of this outstanding loan balance was repaid. Loans were made from STRATTEC to SAL LLC totaling $225,000 during 2016 and $100,000 during 2015 in support of operating expenses and working capital needs.
Net cash provided by financing activities of $7.2 million during 2016 included $26.5 million of borrowings under credit facilities, $473,000 of proceeds from stock purchases and option plan exercises and $170,000 in excess tax benefits from option plan exercises, partially offset by $16.5 million for repayments of borrowings under credit facilities, $1.9 million for regular quarterly dividend payments to shareholders and $1.6 million for dividend payments to non-controlling interests in our subsidiaries. Net cash provided by financing activities of $5.8 million during 2015 included $9.0 million of borrowings under credit facilities, $553,000 of proceeds from stock purchases and option plan exercises and $367,000 in excess tax benefits from option plan exercises, partially offset by $1.5 million for repayments of borrowings under credit facilities, $1.7 million for regular quarterly dividend payments to shareholders and $882,000 for dividend payments to non-controlling interests in our subsidiaries. Net cash provided by financing activities of $961,000 during 2014 included $1.3 million of borrowings under credit facilities, $2.7 million of proceeds from stock purchases and option plan exercises and $495,000 in excess tax benefits from option plan exercises, mostly offset by $1 million for repayments of borrowings under credit facilities, $1.5 million for regular quarterly dividend payments to shareholders and $984,000 for dividend payments to non-controlling interests in our subsidiaries.
Qualified Defined Benefit Pension Plan
Our qualified defined benefit pension plan balance, included in other long-term assets in our accompanying Consolidated Balance Sheets, totaled $72,000 at July 3, 2016 and $7.7 million at June 28, 2015. The change in the other long-term assets balance related to this plan during 2016 was the result of the net impact of pension contributions, the actuarially calculated pension expense,
| 2016 STRATTEC Annual Report | 22 |
MANAGEMENT’S DISCUSSION AND ANALYSIS
reclassification adjustments from accumulated other comprehensive loss and the impact of the change in the year-end funded status of the plan. The 2016 pre-tax changes in plan assets and benefit obligations related to this plan recognized in other comprehensive income decreased our other long-term asset balance by approximately $9.4 million at July 3, 2016 compared to June 28, 2015. The resulting tax impact increased our deferred income tax asset balance by $3.5 million at July 3, 2016 in comparison to the balance as of June 28, 2015.
VAST LLC Cash Requirements
We currently anticipate that both VAST China and Minda-VAST Access Systems have adequate debt facilities in place over the next fiscal year to cover the future operating and capital requirements of each business. During 2016, capital contributions totaling $660,000 were made to VAST LLC for purposes of funding operations in Brazil. STRATTEC’s portion of the capital contributions totaled $220,000. During 2015, capital contributions totaling $13.2 million were made to VAST LLC in support of the acquisition of a fifty percent equity interest in a joint venture entity, Minda VAST Access Systems, based in Pune, India, and in support of general operating expenses for Sistema de Acesso Veicular Ltda (formerly known as VAST do Brasil). STRATTEC’s portion of the capital contributions totaled $4.4 million. Loans were made by each partner, STRATTEC, WITTE and ADAC, to VAST, LLC totaling $215,000 for each partner in 2015 and $285,000 for each partner in 2014. The loans were made in support of VAST LLC’s purchase of the non-controlling interest in the Braziian entity and in support of funding operating costs of the Brazilian entity. Additionally, we anticipate the Brazilian entity will require a capital contribution of approximately $600,000 collectively by all VAST partners to fund operations during the remainder of calendar 2016. STRATTEC’s portion of the capital contributions is anticipated to be $200,000.
ADAC-STRATTEC LLC Cash Requirements
As discussed under Future Capital Expenditures included herein, ADAC-STRATTEC de Mexico (ASdM), a wholly owned subsidiary of ADAC-STRATTEC LLC, which is a joint venture between STRATTEC SECURITY CORPORATION and ADAC Automotive, is in the process of constructing a new manufacturing facility in Leon, Mexico. Total capital expenditures required for the land, facility, paint system and assembly equipment is expected to total approximately $22 million. During 2016, capital expenditures for the land, facility and equipment totaled $7.0 million. We anticipate financing the required capital expenditures through a combination of partner capital contributions, bank loans and current operating cash flow. As a result, effective April 27, 2016, the ADAC-STRATTEC Credit Facility was amended to increase the available borrowings under the credit facility from $10 million to $20 million. Under the terms of the amended credit agreement, a capital contribution to ADAC- STRATTEC LLC of $6 million collectively from STRATTEC and ADAC is required to be completed by September 30, 2016. STRATTEC’s portion of the required capital contribution will be $3.06 million.
STRATTEC Advanced Logic, LLC Cash Requirements
Beginning with the fourth quarter of fiscal year 2015, STRATTEC provided 100 percent of the financial support to fund the start-up operating losses of SAL LLC due to our partner’s inability to contribute capital to this joint venture. We anticipate STRATTEC will continue to fund 100 percent of the start-up costs through fiscal year 2017.
Future Capital Expenditures
We anticipate capital expenditures will be approximately $30 million in fiscal 2017 in support of requirements for new product programs, the upgrade and replacement of existing equipment and the construction of a new facility in Leon, Mexico. On March 17, 2016, ASdM, a wholly owned subsidiary of ADAC-STRATTEC LLC, which is a joint venture between STRATTEC SECURITY CORPORATION and ADAC Automotive, purchased land in Leon, Mexico. ASdM is in the process of constructing a new manufacturing facility on this land. This facility is expected to be used primarily to paint and assemble door handle products and is expected to be completed and operational at the end of fiscal year 2017. Currently, the ADAC-STRATTEC LLC joint venture has net sales of approximately $60 million. With newly awarded customer business, we anticipate net sales will increase to approximately $120 million within the next two years. Total capital expenditures required for the land, facility, paint system and assembly equipment is expected to total approximately $22 million. During 2016, capital expenditures for the land, facility and equipment totaled $7.0 million. We anticipate financing the required capital expenditures through a combination of partner capital contributions, bank loans and current operating cash flow.
Stock Repurchase Program
Our Board of Directors has authorized a stock repurchase program to buy back outstanding shares of our common stock. Shares authorized for buy back under the program totaled 3,839,395 at July 3, 2016. A total of 3,655,322 shares have been repurchased over the life of the program through July 3, 2016, at a cost of approximately $136.4 million. No shares were repurchased during fiscal 2016 or 2015. Additional repurchases may occur from time to time and are expected to continue to be funded by cash flow from operations and current cash balances. At this time, we anticipate minimal or no stock repurchase activity in fiscal year 2017.
Credit Facilities and Guarantees
STRATTEC has a $30 million secured revolving credit facility (the “STRATTEC Credit Facility”) with BMO Harris Bank N.A. ADAC-STRATTEC LLC has a $20 million secured revolving credit facility (the “ADAC-STRATTEC Credit Facility”) with BMO Harris Bank N.A, which is guaranteed by
| 2016 STRATTEC Annual Report | 23 |
MANAGEMENT’S DISCUSSION AND ANALYSIS
STRATTEC. The credit facilities both expire August 1, 2019. Borrowings under either credit facility are secured by our U.S. cash balances, accounts receivable, inventory and fixed assets located in the U.S. Interest on borrowings under the ADAC-STRATTEC Credit Facility for periods prior to January 22, 2014 was at varying rates based, at our option, on the London Interbank Offering Rate (“LIBOR”) plus 1.75 percent or the bank’s prime rate. Interest on borrowings under the STRATTEC credit facility and effective on or after January 22, 2014 under the ADAC-STRATTEC Credit Facility is at varying rates based, at our option, on LIBOR plus 1.0 percent or the bank’s prime rate. Both credit facilities contain a restrictive financial covenant that requires the applicable borrower to maintain a minimum net worth level. The ADAC-STRATTEC Credit Facility includes an additional restrictive financial covenant that requires the maintenance of a minimum fixed charge coverage ratio as well as the requirements for a capital contribution to ADAC-STRATTEC LLC of $6 million collectively from STRATTEC and ADAC to be completed by September 30, 2016. STRATTEC’s portion of the required capital contribution will be $3.06 million. Outstanding borrowings under the STRATTEC Credit Facility totaled $11.5 million at July 3, 2016 and $7.0 million at June 28, 2015. The average outstanding borrowings and weighted average interest rate on the STRATTEC Credit Facility loans were approximately $7.6 million and 1.5 percent, respectively, during 2016. The average outstanding borrowings and weighted average interest rate on the STRATTEC Credit Facility loans were approximately $2.3 million and 1.2 percent, respectively, during 2015. Outstanding borrowings under the ADAC-STRATTEC Credit Facility totaled $8.5 million at July 3, 2016 and $3.0 million at June 28, 2015. The average outstanding borrowings and weighted average interest rate on the ADAC-STRATTEC Credit Facility loans were approximately $4.4 million and 1.3 percent, respectively, during 2016. The average outstanding borrowings and weighted average interest rate on the ADAC-STRATTEC Credit Facility loans were approximately $3.7 million and 1.2 percent, respectively, during 2015.
SAL LLC had a $1.5 million revolving credit facility with BMO Harris Bank N.A., which matured February 16, 2016 and was fully guaranteed by STRATTEC. Interest on borrowings under the SAL Credit Facility was at varying rates based, at SAL LLC’s option, on LIBOR plus 1.0 percent or the bank’s prime rate. Outstanding borrowings under the SAL Credit Facility as of February 16, 2016 and June 28, 2015 totaled $1.5 million and $995,000, respectively. SAL LLC did not have cash available to pay the outstanding debt balance as of the maturity date. Therefore, STRATTEC made a payment of $1.5 million on its guarantee on February 16, 2016.
Effective November 1, 2014, a license agreement was signed with Westinghouse allowing SAL LLC to do business as Westinghouse Security. Payments required under the agreement were guaranteed by STRATTEC. As of July 3, 2016, STRATTEC has recorded a liability equal to the estimated fair value of the guarantee of $250,000, which amount is equal to the future payments required to be made under the agreement as of July 3, 2016.
Inflation and Other Changes in Prices
Over the past several years, we have been impacted by rising health care costs, which have increased our cost of associate medical coverage. A portion of these increases have been offset by plan design changes and associate wellness initiatives. We have also been impacted by increases in the market price of zinc and brass and inflation in Mexico, which impacts the U. S. dollar costs of our Mexican operations. We have negotiated raw material price adjustment clauses with certain, but not all, of our customers to offset some of the market price fluctuations in the cost of zinc. We own and operate manufacturing operations in Mexico. As a result, a portion of our manufacturing costs are incurred in Mexican pesos, which causes our earnings and cash flows to fluctuate due to changes in the U.S. dollar/Mexican peso exchange rate. During 2016, we executed contracts with Bank of Montreal that provide for bi-weekly and monthly Mexican peso currency forward contracts for a portion of our estimated peso denominated operating costs. The current peso currency forward contracts include settlement dates that began on October 16, 2015 and end on June 15, 2018. No forward contracts were in place during fiscal 2015 or 2014. Our objective in entering into these currency forward contracts is to minimize our earnings volatility resulting from changes in exchange rates affecting the U.S. dollar cost of our Mexican operations. The Mexican peso forward contracts are not used for speculative purposes and are not designated as hedges. As a result, all currency forward contracts are recognized in our accompanying consolidated financial statements at fair value and changes in the fair value are reported in current earnings as part of Other Income, net.
The following table quantifies the outstanding Mexican peso forward contracts as of July 3, 2016 (thousands of dollars, except average forward contractual exchange rates):
| Effective | Notional | Average Forward Contractual | Fair | |||||||||||
| Dates | Amount | Exchange Rate | Value | |||||||||||
Buy MXP/Sell USD | July 15, 2016 - June 15, 2017 | $ | 24,000 | 17.95 | $ | (996 | ) | |||||||
Buy MXP/Sell USD | July 15, 2017 - June 15, 2018 | $ | 6,000 | 19.80 | $ | 107 | ||||||||
| 2016 STRATTEC Annual Report | 24 |
MANAGEMENT’S DISCUSSION AND ANALYSIS
The fair market value of all outstanding Mexican peso forward contracts in the accompanying Consolidated Balance Sheets was as follows (thousands of dollars):
| July 3, 2016 | June 28, 2015 | |||||||
Not Designed as hedging Instruments: | ||||||||
Other Long-term Assets: | ||||||||
Mexican Peso Forward Contracts | $ | 107 | $ | — | ||||
Other Current Liabilities: | ||||||||
Mexican Peso Forward Contracts | $ | 996 | $ | — | ||||
The pre-tax effects of the Mexican peso forward contracts are included in Other Income, net on the accompanying Consolidated Statements of Operations and Comprehensive Income and consisted of the following (thousands of dollars):
| Years Ended | ||||||||||||
| July 3, 2016 | June 28, 2015 | June 29, 2014 | ||||||||||
Not Designated as Hedging Instruments: | ||||||||||||
Realized Loss | $ | 1,196 | $ | — | $ | — | ||||||
Unrealized Loss | $ | 889 | $ | — | $ | — | ||||||
CONTRACTUAL OBLIGATIONS AND COMMITMENTS
Contractual obligations are as follows as of July 3, 2016 (thousands of dollars):
Contractual Obligation | Payments Due By Period | |||||||||||||||||||
| Total | Less Than 1 Year | 1-3 Years | 3-5 Years | More Than 5 Years | ||||||||||||||||
Operating Leases | $ | 1,839 | $ | 729 | $ | 936 | $ | 174 | $ | — | ||||||||||
Other Purchase Obligations | 45,937 | 23,912 | 18,989 | 3,036 | — | |||||||||||||||
Guarantees | 250 | — | 250 | — | — | |||||||||||||||
Pension and Postretirement Obligations(a) | 5,639 | 5,639 | — | — | — | |||||||||||||||
|
|
|
|
|
|
|
|
|
| |||||||||||
Total | $ | 53,665 | $ | 30,280 | $ | 20,175 | $ | 3,210 | $ | — | ||||||||||
|
|
|
|
|
|
|
|
|
| |||||||||||
| (a) | As disclosed in our Notes to Financial Statements, estimated cash funding related to our pension and postretirement benefit plans is expected to total $5.6 million in 2017. Because the timing of funding related to these plans beyond 2017 is uncertain, and is dependent on future movements in interest rates and investment returns, changes in laws and regulations, and other variables, pension and postretirement outflows beyond 2017 have not been included in the table above. |
Refer to the discussion of Commitments and Contingencies included in Notes to Financial Statements included within this 2016 Annual Report for further information related to purchase obligations.
Liabilities recognized for uncertain tax benefits of $471,000 are not presented in the table above due to uncertainty as to amounts and timing regarding future payments.
STRATTEC has a $30 million secured revolving credit facility with BMO Harris Bank N. A. ADAC-STRATTEC LLC has a $20 million secured revolving credit facility with BMO Harris Bank N.A., which is guaranteed by STRATTEC. Borrowings under the STRATTEC credit facility totaled $11.5 million at July 3, 2016. Borrowings under the ADAC-STRATTEC credit facility totaled $8.5 million at July 3, 2016.
JOINT VENTURES AND MAJORITY OWNED SUBSIDIARIES
We participate in certain Alliance Agreements with WITTE Automotive (“WITTE”) and ADAC Automotive (“ADAC”). WITTE, of Velbert, Germany, is a privately held automotive supplier. WITTE designs, manufactures and markets automotive components, including locks and keys, hood latches, rear compartment latches, seat back latches, door handles and specialty fasteners. WITTE’s primary market for these products has been Europe. ADAC, of Grand Rapids, Michigan, is a privately held automotive supplier and manufactures engineered products, including door handles and other automotive trim parts, utilizing plastic injection molding, automated painting and various assembly processes.
The Alliance Agreements include a set of cross-licensing agreements for the manufacture, distribution and sale of WITTE products by STRATTEC and ADAC in North America, and the manufacture, distribution and sale of STRATTEC and ADAC products by WITTE in Europe. Additionally, a joint venture company, Vehicle Access Systems Technology LLC (“VAST LLC”), in which WITTE, STRATTEC and ADAC each hold a one-third equity interest, exists to seek opportunities to manufacture and sell each company’s products in areas of the world outside of North America and Europe.
Sistema de Acesso Veicular Ltda (formerly known as VAST do Brasil) services customers in South America. Effective March 21, 2014, VAST LLC purchased the remaining non-controlling interest in the Brazilian entity. VAST Fuzhou, VAST Great Shanghai and VAST Shanghai Co. (collectively known as VAST China), provide a base of operations to service our automotive customers in the Asian market. VAST LLC also maintains branch offices in South Korea and Japan in support of customer sales and engineering requirements.
| 2016 STRATTEC Annual Report | 25 |
MANAGEMENT’S DISCUSSION AND ANALYSIS
Effective April 30, 2015, VAST LLC executed an agreement to become a 50:50 Joint Venture partner with Minda Management Services Limited an affiliate of both Minda Corporation Limited and Spark Minda, Ashok Minda Group of New Delhi, India (collectively “Minda”). VAST acquired a fifty percent equity interest in the former Minda-Valeo Security Systems joint venture entity, based in Pune, India, for approximately $12 million. This joint venture entity was renamed Minda-VAST Access Systems (“Minda-VAST”). The portion of the purchase price paid by each VAST LLC partner, STRATTEC, WITTE and ADAC, totaled $4 million. Minda-VAST has operations in Pune and Delhi and had annual sales of $36 million in our fiscal year 2016. Minda and its affiliates cater to the needs of all major car, motorcycle, commercial vehicle, tractor and off-road vehicle manufacturers in India. They are a leading manufacturer in the Indian marketplace of security & access products, handles, automotive safety, restraint systems, driver information and telematics systems for both OEMs and the aftermarket.
The VAST LLC investments are accounted for using the equity method of accounting. The activities related to the VAST LLC joint ventures resulted in equity loss of joint ventures to STRATTEC of approximately $639,000 during 2016 and equity earnings of joint ventures of approximately $1.3 million during both 2015 and 2014. The 2016 equity loss of joint venture for Vehicle Access Systems Technology LLC included a $6 million impairment charge related to its Minda-VAST Access Systems joint venture in India. STRATTEC’s portion of this impairment charge totaled $2 million. During 2016, capital contributions totaling $660,000 were made to VAST LLC for purposes of funding operations in Brazil. STRATTEC’s portion of the capital contributions totaled $220,000. During 2015, cash capital contributions totaling $13.2 million were made to VAST LLC in support of the acquisition of the 50 percent joint venture interest in Minda-VAST and in support of general operating expenses for the Brazilian entity. STRATTEC’s portion of the cash capital contributions totaled $4.4 million. No cash capital contributions were made to VAST LLC during 2014. Loans were made by each partner, STRATTEC, WITTE and ADAC, to VAST LLC totaling $215,000 for each partner in 2015 and $285,000 for each partner in 2014. The loans were made in support of VAST LLC’s purchase of the non-controlling interest in the Brazilian entity and in support of funding operating costs of the Brazilian entity. During 2016, loan repayments of $100,000 were made by VAST LLC to each partner.
ADAC-STRATTEC LLC, a Delaware limited liability company, was formed in fiscal year 2007 to support injection molding and door handle assembly operations in Mexico. ADAC-STRATTEC LLC was 51 percent owned by STRATTEC and 49 percent owned by ADAC for all periods presented in this report. An additional Mexican entity, ADAC-STRATTEC de Mexico, is wholly owned by ADAC-STRATTEC LLC. ADAC-STRATTEC LLC’s financial results are consolidated with the financial results of STRATTEC and resulted in increased net income to STRATTEC of approximately $2.9 million in 2016, $2.6 million in 2015 and $1.4 million in 2014.
STRATTEC POWER ACCESS LLC (“SPA”) was formed in fiscal year 2009 to supply the North American portion of the power sliding door, lift gate and deck lid system access control products which were acquired from Delphi Corporation. SPA was 80 percent owned by STRATTEC and 20 percent owned by WITTE for all periods presented in this report. An additional Mexican entity, STRATTEC POWER ACCESS de Mexico, is wholly owned by SPA. The financial results of SPA are consolidated with the financial results of STRATTEC and resulted in increased net income to STRATTEC of approximately $2.0 million in 2016, reduced net income to STRATTEC of approximately $269,000 in 2015, and increased income to STRATTEC of approximately $1.5 million in 2014.
STRATTEC Advanced Logic, LLC, was formed in fiscal 2013 to introduce a new generation of biometric security products based upon the designs of Actuator Systems LLC, our partner and the owner of the remaining ownership interest in SAL LLC. SAL LLC was 51 percent owned by STRATTEC for all periods presented in this report. The initial capitalization of SAL LLC totaled $1.5 million. STRATTEC’s portion of the initial capitalization totaled $765,000. Our investment in SAL LLC, for which we exercise significant influence but do not control and are not the primary beneficiary, is accounted for using the equity method. The activities related to the STRATTEC Advanced Logic, LLC joint venture resulted in an equity loss of joint ventures to STRATTEC of approximately $1.6 million in 2016, $2.0 million in 2015 and $367,000 in 2014. Effective with our fiscal 2015 fourth quarter, 100 percent of the funding for SAL LLC was being made through loans from STRATTEC to SAL LLC and through STRATTEC’s guarantee of the SAL Credit Facility which is discussed herein. Therefore, effective with our fiscal 2015 fourth quarter, even though STRATTEC maintains a 51 percent ownership interest in SAL LLC, STRATTEC began recognizing 100 percent of the losses of SAL LLC up to our committed financial support through Equity (Loss) Earnings of Joint Ventures in the accompanying Consolidated Statements of Income and Comprehensive Income. In addition, the equity loss of joint ventures for SAL LLC included the following for the periods presented (thousands of dollars):
| Years Ended | ||||||||
| July 3, 2016 | June 28, 2015 | |||||||
Loss on Guarantee of SAL LLC Vendor Contract | $ | — | $ | 123 | ||||
Loss on Loan to SAL LLC | 225 | 100 | ||||||
Loss on Guarantee of SAL LLC Credit Facility | 247 | 488 | ||||||
|
|
|
| |||||
| $ | 472 | $ | 711 | |||||
|
|
|
| |||||
| 2016 STRATTEC Annual Report | 26 |
MANAGEMENT’S DISCUSSION AND ANALYSIS
See further discussion under Equity (Loss) Earnings of Joint Ventures included in Notes to Financial Statements herein.
OTHER MATTERS
The Affordable Care Act (“ACA”), which was enacted in 2010 and is being phased in over several years, significantly affects the provision of both health care services and benefits in the United States. The ACA may impact our cost of providing our U.S. employees and retirees with health insurance and/or benefits, and may also impact various other aspects of our business. The ACA did not have a material impact on our fiscal 2016, 2015 or 2014 financial results. However, we are continuing to assess the impact of the ACA on our health care benefit costs.
CRITICAL ACCOUNTING POLICIES
We believe the following represents our critical accounting policies:
Pension and Postretirement Health Benefits– Pension and postretirement health obligations and costs are developed from actuarial valuations. The determination of the obligation and expense for pension and postretirement health benefits is dependent on the selection of certain assumptions used by actuaries in calculating such amounts. Those assumptions are described in the accompanying Notes to Financial Statements and include, among others, the discount rate, expected long-term rate of return on plan assets, retirement age and rates of increase in compensation and health care costs. We evaluate and update all of the assumptions annually on June 30, the measurement date. Refer to the accompanying Notes to Financial Statements for the impact of the pension and postretirement plans on our financial statements.
We determine the discount rate used to measure plan liabilities using prevailing market rates of a large population of high-quality, non-callable, corporate bonds currently available that, if the obligation was settled at the measurement date, would provide the necessary future cash flows to pay the benefit obligation when due. Using this methodology, we determined a discount rate of 3.79 percent to be appropriate as of July 3, 2016, which is a decrease of 0.74 percentage points from the rate of 4.53 percent used at June 30, 2015. The impact of this change increased our year-end 2016 projected pension benefit obligations by approximately $9.1 million, the year-end 2016 accumulated pension benefit obligations by approximately $9.1 million and the year- end 2016 accumulated postretirement obligation by approximately $48,000. This change is also expected to increase our 2017 pension expense by $870,000 and decrease our postretirement expense by $2,000. Our pension expense increases as the discount rate decreases. Lowering our 2016 discount rate assumption by 50 basis points would have increased our 2016 pension expense by approximately $580,000.
A significant element in determining our pension expense is the expected return on plan assets. Our assumption for the expected return on plan assets is based on historical results for similar allocations among asset classes and was 7.5 percent for 2014, 6.5 percent for 2015 and 5.45 percent for 2016. This assumption remained at 5.45 percent for 2017. The changes to this assumption reduced the expected return on plan assets by approximately $950,000 to 2014, $1,050,000 to 2015 and resulted in no change to 2016. Refer to the accompanying Notes to Financial Statements for additional information on how this rate was determined. Pension expense increases as the expected rate of return on plan assets decreases. Lowering the 2016 expected rate of return assumption for our plan assets by 50 basis points would have increased our 2016 pension expense by approximately $540,000.
The difference between the expected return and actual return on plan assets is deferred and, under certain circumstances, amortized over future years of service. Therefore, the deferral of past asset gains and losses ultimately affects future pension expense. This is also the case with changes to actuarial assumptions, including discount rate assumptions, pay rate assumptions, mortality assumptions, turnover assumptions and other demographic assumptions. As of June 30, 2016, we had $37 million of net unrecognized pension actuarial losses, which included deferred asset losses of $2 million and unrecognized postretirement actuarial losses of $4 million. These amounts represent potential future pension and postretirement expenses that would be amortized over average future service periods. The average remaining service period is about 8 years for the pension and postretirement plans.
As of June 30, 2015, we converted to the RP-2014 Blue Collared Mortality Table with Improvement Scale MP-2014 for calculating the year-end 2015 pension and postretirement obligations. The impact of this change increased our year-end 2015 projected pension benefit obligations by approximately $4.2 million and did not have a material effect on the year-end 2015 accumulated postretirement obligation. This change also increased our 2016 pension expense by $715,000 and did not have a material effect on our 2016 postretirement expense.
During fiscal years 2016, 2015 and 2014, we contributed $3 million, $3 million and $4 million, respectively, to our qualified pension plan. As discussed in the accompanying Notes to Financial Statements, on April 2, 2014, our Board of Directors approved a resolution to terminate the qualified pension plan. We intend to make future contributions for the qualified pension plan to ensure that there are sufficient assets to provide all Qualified Pension Plan benefits as of the anticipated distribution date. The amount of future contributions has not yet been determined. We have evaluated the potential impact of the Pension Protection Act (the “PPA”), which was passed into law on August 17, 2006, including funding stabilization relief passed subsequent to the PPA (collectively, the “Acts”), on our future pension plan funding requirements based on current market conditions. The Acts have not had and are not anticipated to have in future periods a material effect on our level of future funding requirements or on our liquidity and capital resources.
| 2016 STRATTEC Annual Report | 27 |
MANAGEMENT’S DISCUSSION AND ANALYSIS
As discussed in the accompanying Notes to Financial Statements, our Board of Directors adopted amendments to the SERP Plan on October 8, 2013 that were effective as of December 31, 2013 to simplify the SERP Plan benefit calculation. The impact of this change had an immaterial effect on our year-end 2014 projected benefit obligation and decreased our 2015 pension expense by $155,000.
A significant element in determining the postretirement health expense is the health care cost trend rates. We develop these rates based on historical cost data, the near-term outlook and an assessment of likely long-term trends. Changes in the health care cost trend rate assumption will have a significant effect on the postretirement benefit amounts reported. As of July 3, 2016, we updated the health care cost trend assumption. The impact of this update increased our 2016 postretirement health expense by approximately $1,000. Refer to the accompanying Notes to Financial Statements for an analysis of the impact of a one percent change in the trend rate.
While we believe that the assumptions used to determine our pension and postretirement health obligations and expenses are appropriate, significant differences in the actual experience or significant changes in the assumptions may materially affect the amounts of these obligations and our related future expense for these obligations.
Liability for Uncertain Tax Positions– We are subject to income taxation in many jurisdictions around the world. Significant management judgment is required in the accounting for income tax contingencies because the outcomes are often difficult to determine. We are required to measure and recognize uncertain tax positions that we have taken or expect to take in our income tax returns. The benefit of an uncertain tax position can only be recognized in the financial statements if management concludes that it is more likely than not that the position will be sustained with the tax authorities. For a position that is likely to be sustained, the benefit recognized in the financial statements is measured at the largest amount that is greater than 50 percent likely of being realized. A reserve is established for the difference between a position taken in an income tax return and the amount recognized in the financial statements. Refer to the discussion of Income Taxes included in the Notes to Financial Statements included within this 2016 Annual Report.
Other Reserves- We have reserves such as an environmental reserve, a warranty reserve, an incurred but not reported claim reserve for self-insured health plans, an allowance for doubtful accounts related to trade accounts receivable, an excess and obsolete inventory reserve and a repair and maintenance supply parts reserve. These reserves require the use of estimates and judgment with regard to risk exposure, ultimate liability and net realizable value.
Environmental Reserve – We have a liability recorded related to the estimated costs to remediate a site at our Milwaukee facility, which was contaminated by a solvent spill from a former above ground solvent storage tank occurring in 1985. The recorded environmental liability balance involves judgment and estimates. Our reserve estimate is based on a third party assessment of the costs to adequately cover the cost of active remediation of the contamination at this site. Actual costs might vary from this estimate for a variety of reasons including changes in laws and changes in the assessment of the level of remediation actually required at this site. Therefore, future changes in laws or the assessment of the level of remediation required could result in changes in our estimate of the required liability. Refer to the discussion of Commitments and Contingencies included in the Notes to Financial Statements included within this 2016 Annual Report.
Warranty Reserve – We have a warranty liability recorded related to our exposure to warranty claims in the event our products fail to perform as expected, and we may be required to participate in the repair costs incurred by our customers for such products. The recorded warranty liability balance involves judgment and estimates. Our liability estimate is based on an analysis of historical warranty data as well as current trends and information, including our customers’ recent extension or expansion of their warranty programs. Actual warranty costs might differ from estimates due to the level of actual claims varying from our claims experience and estimates and final negotiations and settlements reached with our customers. Therefore, future actual claims experience could result in changes in our estimates of the required liability. Refer to the discussion of Warranty Reserve under Organization and Summary of Significant Accounting Policies included in the Notes to Financial Statements included within this 2016 Annual Report.
Incurred But Not Reported Claim Reserve for Self-Insured Health Plans – We have self-insured medical and dental plans covering all eligible U.S. associates. The expected ultimate cost of claims incurred under these plans is subject to judgment and estimation. We estimate the ultimate expected cost of claims incurred under these plans based upon the aggregate liability for reported claims and an estimated additional liability for claims incurred but not reported. Our estimate of claims incurred but not reported is based on an analysis of historical data, current trends related to claims and health care costs and information available from our third-party administrator. Actual ultimate costs may vary from estimates due to variations in actual claims experience from past trends and large unexpected claims being filed. Therefore, changes in claims experience and large unexpected claims could result in changes to our estimate of the claims incurred but not reported liabilities. Refer to the discussion of Self Insurance Plans under Organization and Summary of Significant Accounting Policies included in the Notes to Financial Statements included within this 2016 Annual Report.
Allowance for Doubtful Accounts Related to Trade Accounts Receivable – Our trade accounts receivable consist primarily of receivables due from Original Equipment Manufacturers in the automotive industry and locksmith distributors relating to our service and aftermarket business. Our evaluation of the collectability of our trade accounts receivable involves judgment and estimates and includes a
| 2016 STRATTEC Annual Report | 28 |
MANAGEMENT’S DISCUSSION AND ANALYSIS
review of past due items, general economic conditions and the economic climate of the automotive industry as a whole. The estimate of the required reserve involves uncertainty as to future collectability of receivable balances. Refer to the discussion of Receivables under Organization and Summary of Significant Accounting Policies included in the Notes to Financial Statements included within this 2016 Annual Report.
Excess and Obsolete Inventory Reserve – We record a reserve for excess and obsolete inventory based on historical and estimated future demand and market conditions. The reserve level is determined by comparing inventory levels of individual materials and parts to historical usage and estimated future sales by analyzing the age of the inventory in order to identify specific material and parts that are unlikely to be sold. Technical obsolescence and other known factors are also considered in evaluating the reserve level. Actual future write-offs of inventory may differ from estimates and calculations used to determine reserve levels due to changes in customer demand, changes in technology and other factors. Refer to the discussion of Inventories under Organization and Summary of Significant Accounting Policies included in the Notes to Financial Statements included within this 2016 Annual Report.
Repair and Maintenance Supply Parts Reserve – We maintain an inventory of repair and maintenance parts in support of operations. This inventory includes critical repair parts for all production equipment as well as general maintenance items. The inventory of critical repair parts is required to avoid disruptions in our customers’ just-in-time production schedules due to lack of spare parts when equipment break-downs occur. Depending on maintenance requirements during the life of the equipment, excess quantities of repair parts arise. A repair and maintenance supply parts reserve is maintained to recognize the normal adjustment of inventory for obsolete and slow-moving repair and maintenance supply parts. Our evaluation of the reserve level involves judgment and estimates, which are based on a review of historical obsolescence and current inventory levels. Actual obsolescence may differ from estimates due to actual maintenance requirements differing from historical levels. This could result in changes to our estimated required reserve. Refer to the discussion of Repair and Maintenance Supply Parts under Organization and Summary of Significant Accounting Policies included in the Notes to Financial Statements included within this 2016 Annual Report.
We believe the reserves discussed above are estimated using consistent and appropriate methods. However, changes to the assumptions could materially affect the recorded reserves.
Stock-Based Compensation– Stock-based compensation cost is measured at the grant date based on the value of the award and is recognized as expense over the vesting period. Determining the fair value of stock-based awards at the grant date requires judgment, including estimating future volatility of our stock, the amount of stock-based awards that are expected to be forfeited and the expected term of awards granted. We estimate the fair value of stock options granted using the Black-Scholes option valuation model. We amortize the fair value of all awards on a straight-line basis over the vesting periods. The expected term of awards granted represents the period of time they are expected to be outstanding. We determine the expected term based on historical experience with similar awards, giving consideration to the contractual terms and vesting schedules. We estimate the expected volatility of our common stock at the date of grant based on the historical volatility of our common stock. The volatility factor used in the Black-Scholes option valuation model is based on our historical stock prices over the most recent period commensurate with the estimated expected term of the award. We base the risk-free interest rate used in the Black-Scholes option valuation model on the implied yield currently available on U.S. Treasury zero-coupon issues with a remaining term commensurate with the expected term of the award. We use historical data to estimate pre-vesting option forfeitures. We record stock-based compensation only for those awards that are expected to vest. If actual results differ significantly from these estimates, stock-based compensation expense and our results of operations could be materially impacted.
NEW ACCOUNTING STANDARDS
In May 2014, the FASB issued an update to the accounting guidance for the recognition of revenue arising from contracts with customers. The update supersedes most current revenue recognition guidance and outlines a single comprehensive model for revenue recognition based on the principle that an entity should recognize revenue in an amount that reflects the expected consideration to be received in the exchange of goods and services. The guidance update also requires additional disclosure about the nature, amount, timing and uncertainty of revenue and cash flows arising from customer contracts. The guidance update is effective for annual reporting periods beginning after December 15, 2017 and becomes effective for us at the beginning of our 2019 fiscal year. We are currently assessing the impact that this guidance will have on our consolidated financial statements.
In August 2014, the FASB issued an update to the accounting guidance on determining when and how to disclose going-concern uncertainties in the financial statements. The new guidance requires management to perform interim and annual assessments of an entity’s ability to continue as a going concern within one year of the date the financial statements are issued. An entity must provide certain disclosures if conditions or events raise substantial doubt about the entity’s ability to continue as a going concern. This accounting update is effective for annual and interim periods beginning on or after December 15, 2016, with early adoption permitted. We do not expect that the adoption of this pronouncement will have a material impact on our consolidated financial statements.
| 2016 STRATTEC Annual Report | 29 |
MANAGEMENT’S DISCUSSION AND ANALYSIS
In February 2015, the FASB issued an update to the accounting guidance that amends current consolidation guidance by modifying the evaluation of whether limited partnerships and similar legal entities are variable interest entities or voting interest entities, eliminating the presumption that a general partner should consolidate a limited partnership, and affects the consolidation analysis of reporting entities that are involved with variable interest entities. The update is effective for interim and annual reporting periods beginning after December 15, 2015, with early adoption permitted. The adoption of this pronouncement did not have a material impact on our consolidated financial statements.
In April 2015 and August 2015, the FASB issued updates to the accounting guidance for debt issuance costs. The updated guidance requires that debt issuance costs related to a recognized debt liability be presented in the balance sheet as a direct deduction from the carrying amount of that debt liability and allows an entity to defer and present debt issuance costs associated with a line of credit arrangement as an asset, regardless of whether there are any outstanding borrowings on the line of credit arrangement. The guidance updates are effective for financial statements issued for fiscal years beginning after December 15, 2015, and interim periods within those fical years. We do not expect that the adoption of this updated guidance will have a material impact on our consolidated financial statements.
In July 2015, the FASB issued an accounting standard to simplify the measurement of inventory by changing the subsequent measurement guidance from the lower of cost or market to the lower of cost and net realizable value for inventory. The standard update is effective for fiscal years beginning after December 15, 2016 and interim periods within those years, and early adoption is permitted. The standard is to be applied prospectively. We do not expect that the adoption of this pronouncement will have a material impact on our consolidated financial statements.
In November 2015, the FASB issued an update to an accounting standard to simplify the presentation of deferred income taxes by requiring that deferred tax assets and liabilities be classified as non-current in a classified statement of financial position, which would be a change from our historical presentation whereby certain of our deferred tax assets and liabilities were classified as current and the remainder were classified as non-current. The standard update is effective for fiscal years beginning after December 15, 2016 and interim periods within those years, and early adoption is permitted. The standard is to be applied either prospectively to all deferred tax assets and liabilities or retrospectively to all periods presented. We have elected to adopt this guidance effective July 3, 2016, and have applied the guidance retrospectively. We restated our consolidated balance sheet as of June 28, 2015 to reflect the reclassification of $9.6 million of deferred tax balances from current assets and $4.6 million of deferred income tax balances from non-current liabilities to a non-current asset balance.
In February 2016, the FASB issued an update to the accounting guidance for leases. The update increases the transparency and comparability among organizations by requiring lessees to recognize lease assets and lease liabilities on the balance sheet and to disclose key information about leasing arrangements. The guidance is effective for fiscal years beginning after December 15, 2018 and interim periods within those years. We are currently assessing the impact that this guidance will have on our consolidated financial statements.
In March 2016, the FASB issued an update to the accounting guidance for share-based payments. The update simplifies several aspects of the accounting for employee share-based payment transactions including the accounting for income taxes, forfeitures and statutory tax withholding requirements, as well as classification of such items in the statement of cash flows. The guidance is effective for fiscal years beginning after December 15, 2016 and interim periods within those years. We are currently assessing the impact that this guidance will have on our consolidated financial statements.
RISK FACTORS
We recognize we are subject to the following risk factors based on our operations and the nature of the automotive industry in which we operate:
Loss of Significant Customers, Vehicle Content, Vehicle Models and Market Share– Sales to General Motors Company, Ford Motor Company and Fiat Chrysler Automobiles represented approximately 63 percent of our annual net sales (based on fiscal 2016 results) and, accordingly, these customers account for a significant percentage of our outstanding accounts receivable. The contracts with these customers provide for supplying the customer’s requirements for a particular model. The contracts do not specify a specific quantity of parts. The contracts typically cover the life of a model, which averages approximately four to five years. Components for certain customer models may also be “market tested” annually. Therefore, the loss of any one of these customers, the loss of a contract for a specific vehicle model, a reduction in vehicle content, the early cancellation of a specific vehicle model, technological changes or a significant reduction in demand for certain key models could occur, and if so, could have a material adverse effect on our existing and future revenues and net income.
Our major customers also have significant under-funded legacy liabilities related to pension and postretirement health care obligations. The loss in our major customers’ North American automotive market share to the New Domestic automotive manufacturers (primarily the Japanese and Korean automotive manufacturers) and/or a significant decline in the overall market demand for new vehicles may ultimately result in severe financial difficulty for these customers, including bankruptcy. If our major customers cannot fund their operations, we may incur significant write-offs of accounts receivable, incur impairment charges or require restructuring actions.
Production Slowdowns by Customers– Our major customers and many of their suppliers were significantly impacted by the recession of 2008/2009. Many of our major customers instituted production cuts during our fiscal 2009 and 2010. While production subsequently increased after the cuts made in 2009, additional economic slowdowns could bring about new production cuts which could have a material adverse effect on our existing and future revenues and net income.
| 2016 STRATTEC Annual Report | 30 |
MANAGEMENT’S DISCUSSION AND ANALYSIS
Financial Distress of Automotive Supply Base– During calendar years 2009 and 2010, deteriorating automotive industry conditions adversely affected STRATTEC and our supply base. Lower production levels at our major customers, volatility in certain raw material and energy costs and the global credit market crisis resulted in severe financial distress among many companies within the automotive supply base. During the above time frame, several automotive suppliers filed for bankruptcy protection or ceased operations. The potential continuation or renewal of financial distress within the supply base and suppliers’ inability to obtain credit from lending institutions could lead to commercial disputes and possible supply chain interruptions. In addition, the potential for future adverse industry conditions may require us to provide financial assistance or other measures to ensure uninterrupted production. The continuation or renewal of these industry conditions could have a material adverse effect on our existing and future revenues and net income.
Shortage of Raw Materials or Components Supply– In the event of catastrophic acts of nature such as fires, tsunamis, hurricanes and earthquakes or a rapid increase in production demands, either we or our customers or other suppliers may experience supply shortages of raw materials or components. This could be caused by a number of factors, including a lack of production line capacity or manpower or working capital constraints. In order to manage and reduce the costs of purchased goods and services, we and others within our industry have been rationalizing and consolidating our supply base. As a result, there is greater dependence on fewer sources of supply for certain components and materials used in our products, which could increase the possibility of a supply shortage of any particular component. If any of our customers experience a material supply shortage, either directly or as a result of supply shortages at another supplier, that customer may halt or limit the purchase of our products. Similarly, if we or one of our own suppliers experience a supply shortage, we may become unable to produce the affected products if we cannot procure the components from another source. Such production interruptions could impede a ramp-up in vehicle production and could have a material adverse effect on our business, results of operations and financial condition.
We consider the production capacities and financial condition of suppliers in our selection process, and expect that they will meet our delivery requirements. However, there can be no assurance that strong demand, capacity limitations, shortages of raw materials, labor disputes or other problems will not result in any shortages or delays in the supply of components to us.
Cost Reduction– There is continuing pressure from our major customers to reduce the prices we charge for our products. This requires us to generate cost reductions, including reductions in the cost of components purchased from outside suppliers. If we are unable to generate sufficient production cost savings in the future to offset pre-programmed price reductions, our gross margin and profitability will be adversely affected.
Cyclicality and Seasonality in the Automotive Market– The automotive market is cyclical and is dependent on consumer spending, on the availability of consumer credit and to a certain extent, on customer sales incentives. Economic factors adversely affecting consumer demand for automobiles and automotive production, such as rising fuel costs, could adversely impact our net sales and net income. We typically experience decreased sales and operating income during the first fiscal quarter of each year due to the impact of scheduled customer plant shut-downs in July and new model changeovers during that period.
Foreign Operations– We own and operate manufacturing operations in Mexico. As discussed above under “Joint Ventures and Majority Owned Subsidiaries”, we also have joint venture and majority owned investments in Mexico, Brazil, China and India. As these operations continue to expand, their success will depend, in part, on our and our partners’ ability to anticipate and effectively manage certain risks inherent in international operations, including: enforcing agreements and collecting receivables through certain foreign legal systems, payment cycles of foreign customers, compliance with foreign tax laws, general economic and political conditions in these countries and compliance with foreign laws and regulations. The success of these joint venture operations may be impacted by our partners’ ability to influence business decisions and therefore the operating results of the joint ventures could be adversely impacted. These influences, as well as conflicts or disagreements with our joint venture partners, could negatively impact the operations and financial results of our joint venture investments, which could have an adverse impact on our financial results. In addition, failure of our partners to be able to continue to fund their portion of the joint venture operations could have a material adverse effect on the financial condition and financial results of our joint venture investments, which could have a material adverse effect on our financial results. The joint venture investments in China generated losses in 2012 and 2013 due to relocation costs associated with moves to a new facility and start-up costs associated with a new product line. These relocation costs and start-up costs have been financed internally and externally by VAST China. The impact of any future planned capital expenditures or future expansion by VAST LLC in China, Brazil and India, may result in the need for additional future capital contributions to fund the operations of these joint venture investments.
Currency Exchange Rate Fluctuations– Our sales are denominated in U.S. dollars. We have manufacturing operations in Mexico, and as a result, a portion of our manufacturing costs are incurred in Mexican pesos. Therefore, fluctuations in the U.S. dollar/Mexican peso exchange rate may have a material effect on our profitability, cash flows, financial position, and may significantly affect the comparability of our results between financial periods. Any depreciation in the value of the U.S. dollar in relation to the value of the Mexican peso will adversely affect the cost of our Mexican operations when translated into U.S. dollars. Similarly, any appreciation in the value of the U.S. dollar in relation to the value of the Mexican peso will decrease the cost of our Mexican operations when translated into U.S. dollars.
| 2016 STRATTEC Annual Report | 31 |
MANAGEMENT’S DISCUSSION AND ANALYSIS
Sources of and Fluctuations in Market Prices of Raw Materials– Our primary raw materials are high-grade zinc, brass, nickel, silver, aluminum, steel and plastic resins. These materials are generally available from a number of suppliers, but we have chosen to concentrate our sourcing with one primary vendor for each commodity or purchased component. We believe our sources of raw materials are reliable and adequate for our needs. However, the development of future sourcing issues related to using existing or alternative raw materials and the global availability of these materials as well as significant fluctuations in the market prices of these materials may have an adverse effect on our financial results if the increased raw material costs cannot be recovered from our customers.
Given the significant financial impact on us relating to changes in the cost of our primary raw materials, commencing with fiscal 2008 and thereafter, we began quoting quarterly material price adjustments for changes in our zinc costs in our negotiations with our customers. Our success in obtaining these quarterly price adjustments in our customer contracts is dependent on separate negotiations with each customer. It is not a standard practice for our customers to include such price adjustments in their contracts. We have been successful in obtaining quarterly price adjustments in some of our customer contracts. However, we have not been successful in obtaining the adjustments with all of our customers.
Disruptions Due to Work Stoppages and Other Labor Matters– Our major customers and many of their suppliers have unionized work forces. Work stoppages or slow-downs experienced by our customers or their suppliers could result in slow-downs or closures of assembly plants where our products are included in assembled vehicles. For example, strikes by a critical supplier called by the United Auto Workers led to extended shut-downs of most of General Motors’ North American assembly plants in February 2008 and in 1998. A material work stoppage experienced by one or more of our customers could have an adverse effect on our business and our financial results. In addition, all production associates at our Milwaukee facility are unionized. A sixteen-day strike by these associates in June 2001 resulted in increased costs as all salaried associates worked with additional outside resources to produce the components necessary to meet customer requirements. The current contract with the unionized associates is effective through September 17, 2018. We may encounter further labor disruption and we may also encounter unionization efforts in our other plants or other types of labor conflicts, any of which could have an adverse effect on our business and our financial results. Labor contracts between General Motors Company, Ford Motor Company and Fiat Chrysler Automobiles and their unionized associates under the United Auto Workers union expire in October and November 2019. In addition, their respective labor agreements with the Canadian auto workers union expire in September 2016. Labor disruptions encountered by our customers during the contract period could have an adverse effect on our business and our financial results.
Compliance Related to Regulations Related to Conflict Minerals– We are required to disclose the use of tin, tantalum, tungsten and gold (collectively, “conflict minerals”) mined from the Democratic Republic of the Congo and adjoining countries (the “covered countries”) if a conflict mineral(s) is necessary to the functionality of a product manufactured, or contracted to be manufactured, by us. We may determine, as part of our compliance efforts, that certain products or components we obtain from our suppliers could contain conflict minerals. If we are unable to conclude that all our products are free from conflict minerals originating from covered countries, this could have a negative impact on our business, reputation and/or results of operations. We may also encounter challenges to satisfy customers who require that our products be certified as conflict free, which could place us at a competitive disadvantage if we are unable to substantiate such a claim. Compliance with these rules could also affect the sourcing and availability of some of the minerals used in the manufacture of products or components we obtain from our suppliers, including our ability to obtain products or components in sufficient quantities and/or at competitive prices to sell to our customers.
Environmental, Safety and Other Regulations– We are subject to Federal, state, local and foreign laws and other legal requirements related to the generation, storage, transport, treatment and disposal of materials as a result of our manufacturing and assembly operations. These laws include, among others, the Resource Conservation and Recovery Act (as amended), the Clean Air Act (as amended) and the Comprehensive Environmental Response, Compensation and Liability Act (as amended). We have an environmental management system that is ISO-14001 certified. We believe that our existing environmental management system is adequate for current and anticipated operations and we have no current plans for substantial capital expenditures in the environmental area. An environmental reserve was established in 1995 for estimated costs to remediate a site at our Milwaukee facility. The site was contaminated from a former above-ground solvent storage tank, located on the east side of the facility. The contamination occurred in 1985 and is being monitored in accordance with Federal, state and local requirements. We do not currently anticipate any material adverse impact on our results of operations, financial condition or competitive position as a result of compliance with Federal, state, local and foreign environmental laws or other related legal requirements. However, risk of environmental liability and changes associated with maintaining compliance with environmental laws is inherent in the nature of our business and there is no assurance that material liabilities or changes could not arise.
Highly Competitive Automotive Supply Industry– The automotive component supply industry is highly competitive. Some of our competitors are companies, or divisions or subsidiaries of companies, that are larger than STRATTEC and have greater financial and technology capabilities. Our products may not be able to compete successfully with the products of these other companies, which could result in loss of customers and, as a result, decreased sales and profitability. Some of our major customers have previously announced that they will be reducing their supply base. This could potentially result in the loss of these customers and consolidation within the supply base. The loss of any of our major customers could have a material adverse effect on our existing and future net sales and net income.
| 2016 STRATTEC Annual Report | 32 |
MANAGEMENT’S DISCUSSION AND ANALYSIS
In addition, our competitive position in the North American automotive component supply industry could be adversely affected in the event that we are unsuccessful in making strategic investments, acquisitions or alliances or in establishing joint ventures that would enable us to expand globally. We principally compete for new business at the beginning of the development of new models and upon the redesign of existing models by our major customers. New model development generally begins two to five years prior to the marketing of such new models to the public. The failure to obtain new business on new models or to retain or increase business on redesigned existing models could adversely affect our business and financial results. In addition, as a result of relatively long lead times for many of our components, it may be difficult in the short-term for us to obtain new sales to replace any unexpected decline in the sale of existing products. Finally, we may incur significant product development expense in preparing to meet anticipated customer requirements which may not be recovered.
Program Volume and Pricing Fluctuations– We incur costs and make capital expenditures for new program awards based upon certain estimates of production volumes over the anticipated program life for certain vehicles. While we attempt to establish the price of our products for variances in production volumes, if the actual production of certain vehicle models is significantly less than planned, our net sales and net income may be adversely affected. We cannot predict our customers’ demands for the products we supply either in the aggregate or for particular reporting periods.
Investments in Customer Program Specific Assets– We make investments in machinery and equipment used exclusively to manufacture products for specific customer programs. This machinery and equipment is capitalized and depreciated over the expected useful life of each respective asset. Therefore, the loss of any one of our major customers, the loss of specific vehicle models or the early cancellation of a vehicle model could result in impairment in the value of these assets which may have a material adverse effect on our financial results.
STRATTEC Advanced Logic, LLC Joint Venture– As discussed under Joint Ventures and Majority Owned Subsidiaries herein, we maintain a 51 percent ownership interest in a joint venture, STRATTEC Advanced Logic, LLC, which was formed to introduce a new generation of biometric security products based upon the designs of Actuator Systems LLC, our partner and the owner of the remaining ownership interest in SAL LLC. The success of this joint venture operation may be impacted by the failure of our partner to be able to continue to fund their portion of the joint venture operations, which could have an adverse impact on our financial results. Furthermore, conflicts or disagreements with our joint venture partner, could negatively impact the operations and financial results of our joint venture investment, which could have an adverse impact on our financial results. The biometric security business is highly competitive. Some of the companies in the biometric security business are significantly larger than STRATTEC Advanced Logic, LLC and have greater financial and technology capabilities. Our products may not be able to compete successfully both on price and technology features within our markets.
Warranty Claims– We are exposed to warranty claims in the event that our products fail to perform as expected, and we may be required to participate in the repair costs incurred by our customers for such products. Our largest customers have recently extended and/or expanded their warranty protection for their vehicles. Other automotive OEMs have similarly extended and/or expanded their warranty programs. We are engaged in ongoing discussions with our customers regarding warranty information and potential claims. The results of these discussions could result in additional warranty charges/claims in future periods. Depending on the nature of and the volume of vehicles involved in the potential warranty claims, these charges could be material to our financial statements. The extended and/or expanded warranty trend may also result in higher cost recovery claims by OEMs from suppliers whose products incur a higher rate of warranty claims above an OEM derived nominal level. Prior to fiscal 2010, we had experienced relatively low warranty charges from our customers due to our commercial arrangements and improvements in the quality, reliability and durability of our products. Due to our largest customers’ extension and/or expansion of their warranty protection programs and demands for higher warranty cost sharing arrangements from their suppliers in their terms and conditions of purchase, including STRATTEC, we increased our provision to cover warranty exposures since fiscal year 2010. In 2015, our increased warranty provision was the result of various known or expected customer warranty issues outstanding and estimated future warranty costs to be incurred as of June 2015 for which amounts were reasonably estimable. As additional information becomes available, actual results may differ from recorded estimates. If our customers demand higher warranty-related cost recoveries, or if our products fail to perform as expected, it could result in the loss of current and future business and could have a material adverse impact on our results of operations and financial condition.
Cyber Vulnerability– Cyber attacks or security breaches could compromise confidential, business critical information, cause a disruption in our operations or harm our reputation. While we have a cyber security monitoring program, a significant cyber attack could result in loss of critical business information and/or could negatively impact our operations, any of which could have a negative impact on our financial results.
| 2016 STRATTEC Annual Report | 33 |
CONSOLIDATED STATEMENTS OF INCOME AND COMPREHENSIVE INCOME
(IN THOUSANDS, EXCEPT PER SHARE AMOUNTS)
| Years Ended | ||||||||||||
| July 3, 2016 | June 28, 2015 | June 29, 2014 | ||||||||||
NET SALES | $ | 401,419 | $ | 411,475 | $ | 348,419 | ||||||
Cost of goods sold | 336,594 | 338,815 | 282,621 | |||||||||
|
|
|
|
|
| |||||||
GROSS PROFIT | 64,825 | 72,660 | 65,798 | |||||||||
Engineering, selling, and administrative expenses | 43,917 | 41,534 | 39,274 | |||||||||
|
|
|
|
|
| |||||||
INCOME FROM OPERATIONS | 20,908 | 31,126 | 26,524 | |||||||||
Interest income | 25 | 185 | 106 | |||||||||
Equity (loss) earnings of joint ventures | (2,235 | ) | (788 | ) | 957 | |||||||
Interest expense | (176 | ) | (71 | ) | (45 | ) | ||||||
Other income, net | 668 | 3,481 | 272 | |||||||||
|
|
|
|
|
| |||||||
INCOME BEFORE PROVISION FOR INCOME TAXES AND NON-CONTROLLING INTEREST | 19,190 | 33,933 | 27,814 | |||||||||
Provision for income taxes | 5,068 | 9,382 | 8,674 | |||||||||
|
|
|
|
|
| |||||||
NET INCOME | 14,122 | 24,551 | 19,140 | |||||||||
Net income attributable to non-controlling interest | 4,973 | 3,897 | 2,716 | |||||||||
|
|
|
|
|
| |||||||
NET INCOME ATTRIBUTABLE TO STRATTEC SECURITY CORPORATION | $ | 9,149 | $ | 20,654 | $ | 16,424 | ||||||
|
|
|
|
|
| |||||||
COMPREHENSIVE INCOME: | ||||||||||||
NET INCOME | $ | 14,122 | $ | 24,551 | $ | 19,140 | ||||||
Currency translation adjustments | (5,248 | ) | (5,133 | ) | (140 | ) | ||||||
Pension and postretirement plan funded status adjustment, net of tax | (5,880 | ) | (1,851 | ) | 2,157 | |||||||
|
|
|
|
|
| |||||||
TOTAL OTHER COMPREHENSIVE (LOSS) INCOME | (11,128 | ) | (6,984 | ) | 2,017 | |||||||
|
|
|
|
|
| |||||||
COMPREHENSIVE INCOME | 2,994 | 17,567 | 21,157 | |||||||||
Comprehensive income attributable to non-controlling interest | 4,659 | 3,574 | 2,719 | |||||||||
|
|
|
|
|
| |||||||
COMPREHENSIVE (LOSS) INCOME ATTRIBUTABLE TO STRATTEC SECURITY CORPORATION | $ | (1,665 | ) | $ | 13,993 | $ | 18,438 | |||||
EARNINGS PER SHARE ATTRIBUTABLE TO STRATTEC SECURITY CORPORATION: | ||||||||||||
BASIC | $ | 2.55 | $ | 5.80 | $ | 4.70 | ||||||
|
|
|
|
|
| |||||||
DILUTED | $ | 2.51 | $ | 5.66 | $ | 4.59 | ||||||
|
|
|
|
|
| |||||||
AVERAGE SHARES OUTSTANDING: | ||||||||||||
BASIC | 3,559 | 3,515 | 3,428 | |||||||||
DILUTED | 3,621 | 3,604 | 3,513 | |||||||||
The accompanying Notes to Financial Statements are an integral part of these Consolidated Statements of Income and Comprehensive Income.
| 2016 STRATTEC Annual Report | 34 |
CONSOLIDATED BALANCE SHEETS
(IN THOUSANDS, EXCEPT SHARE AMOUNTS AND PER SHARE AMOUNTS)
| July 3, 2016 | June 28, 2015 | |||||||
ASSETS | ||||||||
CURRENT ASSETS: | ||||||||
Cash and cash equivalents | $ | 15,477 | $ | 25,695 | ||||
Receivables, less allowance for doubtful accounts of $500 at July 3, 2016 and June 28, 2015 | 63,726 | 58,807 | ||||||
Inventories, net | 38,683 | 34,786 | ||||||
Customer tooling in progress, net | 6,971 | 3,473 | ||||||
Income Taxes Recoverable | 3,826 | 1,006 | ||||||
Other current assets | 5,768 | 4,839 | ||||||
|
|
|
| |||||
Total current assets | 134,451 | 128,606 | ||||||
INVESTMENT IN JOINT VENTURES | 14,168 | 15,326 | ||||||
DEFERRED INCOME TAXES | 5,387 | 4,960 | ||||||
OTHER LONG-TERM ASSETS | 3,021 | 10,816 | ||||||
PROPERTY, PLANT AND EQUIPMENT, NET | 85,149 | 71,126 | ||||||
|
|
|
| |||||
| $ | 242,176 | $ | 230,834 | |||||
|
|
|
| |||||
LIABILITIES AND SHAREHOLDERS’ EQUITY | ||||||||
CURRENT LIABILITIES: | ||||||||
Accounts payable | $ | 32,416 | $ | 27,838 | ||||
Accrued liabilities: | ||||||||
Payroll and benefits | 11,210 | 16,107 | ||||||
Environmental | 1,365 | 1,383 | ||||||
Warranty | 9,228 | 11,835 | ||||||
Other | 9,996 | 7,572 | ||||||
|
|
|
| |||||
Total current liabilities | 64,215 | 64,735 | ||||||
COMMITMENTS AND CONTINGENCIES– see note beginning on page 51 | ||||||||
BORROWINGS UNDER CREDIT FACILITY | 20,000 | 10,000 | ||||||
ACCRUED PENSION OBLIGATIONS | 1,466 | 1,331 | ||||||
ACCRUED POSTRETIREMENT OBLIGATIONS | 1,262 | 1,657 | ||||||
OTHER LONG-TERM LIABILITIES | 721 | 710 | ||||||
SHAREHOLDERS’ EQUITY: Common stock, authorized 12,000,000 shares, $.01 par value, issued 7,188,363 shares at July 3, 2016 and 7,151,134 shares at June 28, 2015 | 72 | 71 | ||||||
Capital in excess of par value | 92,076 | 89,560 | ||||||
Retained earnings | 220,728 | 213,442 | ||||||
Accumulated other comprehensive loss | (37,673 | ) | (26,859 | ) | ||||
Less: Treasury stock at cost (3,622,506 shares at July 3, 2016 and 3,624,454 shares at June 28, 2015) | (135,871 | ) | (135,902 | ) | ||||
|
|
|
| |||||
Total STRATTEC SECURITY CORPORATION shareholders’ equity | 139,332 | 140,312 | ||||||
Non-controlling interest | 15,180 | 12,089 | ||||||
|
|
|
| |||||
Total shareholders’ equity | 154,512 | 152,401 | ||||||
|
|
|
| |||||
| $ | 242,176 | $ | 230,834 | |||||
|
|
|
| |||||
The accompanying Notes to Financial Statements are an integral part of these Consolidated Balance Sheets.
| 2016 STRATTEC Annual Report | 35 |
CONSOLIDATED STATEMENTS OF SHAREHOLDERS’ EQUITY
(IN THOUSANDS, EXCEPT PER SHARE AMOUNTS)
| Total | Common Stock | Capital in Excess of Par Value | Retained Earnings | Accumulated Other Comprehensive Loss | Treasury Stock | Non-Controlling Interest | ||||||||||||||||||||||
BALANCE June 30, 2013 | $ | 111,880 | $ | 70 | $ | 82,684 | $ | 179,614 | $ | (22,212 | ) | $ | (135,938 | ) | $ | 7,662 | ||||||||||||
|
|
|
|
|
|
|
|
|
|
|
|
|
| |||||||||||||||
Net income | 19,140 | — | — | 16,424 | — | — | 2,716 | |||||||||||||||||||||
Currency translation adjustments | (140 | ) | — | — | — | (143 | ) | — | 3 | |||||||||||||||||||
Pension and postretirement funded status adjustment, net of tax of $1,268 | 2,157 | — | — | — | 2,157 | — | — | |||||||||||||||||||||
Cash dividends declared ($0.44 per share) | (1,540 | ) | — | — | (1,540 | ) | — | — | — | |||||||||||||||||||
Cash dividends paid to non-controlling interests of subsidiaries | (984 | ) | — | — | — | — | — | (984 | ) | |||||||||||||||||||
Stock-based compensation and shortfall tax benefit | 1,648 | — | 1,648 | — | — | — | — | |||||||||||||||||||||
Stock Option Exercises | 2,683 | 1 | 2,682 | — | — | — | — | |||||||||||||||||||||
Employee stock purchases | 59 | — | 40 | — | — | 19 | — | |||||||||||||||||||||
|
|
|
|
|
|
|
|
|
|
|
|
|
| |||||||||||||||
BALANCE June 29, 2014 | $ | 134,903 | $ | 71 | $ | 87,054 | $ | 194,498 | $ | (20,198 | ) | $ | (135,919 | ) | $ | 9,397 | ||||||||||||
|
|
|
|
|
|
|
|
|
|
|
|
|
| |||||||||||||||
Net income | 24,551 | — | — | 20,654 | — | — | 3,897 | |||||||||||||||||||||
Currency translation adjustments | (5,133 | ) | — | — | — | (4,810 | ) | — | (323 | ) | ||||||||||||||||||
Pension and postretirement funded status adjustment, net of tax of $1,087 | (1,851 | ) | — | — | — | (1,851 | ) | — | — | |||||||||||||||||||
Cash dividends declared ($0.48 per share) | (1,710 | ) | — | — | (1,710 | ) | — | — | — | |||||||||||||||||||
Cash dividends paid to non-controlling interests of subsidiaries | (882 | ) | — | — | — | — | — | (882 | ) | |||||||||||||||||||
Stock-based compensation and shortfall tax benefit | 1,970 | — | 1,970 | — | — | — | — | |||||||||||||||||||||
Stock Option Exercises | 474 | — | 474 | — | — | — | — | |||||||||||||||||||||
Employee stock purchases | 79 | — | 62 | — | — | 17 | — | |||||||||||||||||||||
|
|
|
|
|
|
|
|
|
|
|
|
|
| |||||||||||||||
BALANCE June 28, 2015 | $ | 152,401 | $ | 71 | $ | 89,560 | $ | 213,442 | $ | (26,859 | ) | $ | (135,902 | ) | $ | 12,089 | ||||||||||||
|
|
|
|
|
|
|
|
|
|
|
|
|
| |||||||||||||||
Net income | 14,122 | — | — | 9,149 | — | — | 4,973 | |||||||||||||||||||||
Currency translation adjustments | (5,248 | ) | — | — | — | (4,934 | ) | — | (314 | ) | ||||||||||||||||||
Pension and postretirement funded status adjustment, net of tax of $3,454 | (5,880 | ) | — | — | — | (5,880 | ) | — | — | |||||||||||||||||||
Cash dividends declared ($0.52 per share) | (1,863 | ) | — | — | (1,863 | ) | — | — | — | |||||||||||||||||||
Cash dividends paid to non-controlling interests of subsidiaries | (1,568 | ) | — | — | — | — | — | (1,568 | ) | |||||||||||||||||||
Stock-based compensation and shortfall tax benefit | 2,075 | — | 2,075 | — | — | — | — | |||||||||||||||||||||
Stock Option Exercises | 364 | 1 | 363 | — | — | — | — | |||||||||||||||||||||
Employee stock purchases | 109 | — | 78 | — | — | 31 | — | |||||||||||||||||||||
|
|
|
|
|
|
|
|
|
|
|
|
|
| |||||||||||||||
BALANCE July 3, 2016 | $ | 154,512 | $ | 72 | $ | 92,076 | $ | 220,728 | $ | (37,673 | ) | $ | (135,871 | ) | $ | 15,180 | ||||||||||||
|
|
|
|
|
|
|
|
|
|
|
|
|
| |||||||||||||||
The accompanying Notes to Financial Statements are an integral part of these Consolidated Statements of Shareholders’ Equity.
| 2016 STRATTEC Annual Report | 36 |
CONSOLIDATED STATEMENTS OF CASH FLOWS
(IN THOUSANDS)
| Years Ended | ||||||||||||
| July 3, 2016 | June 28, 2015 | June 29, 2014 | ||||||||||
CASH FLOWS FROM OPERATING ACTIVITIES | ||||||||||||
Net Income | $ | 14,122 | $ | 24,551 | $ | 19,140 | ||||||
Adjustments to reconcile net income to net cash provided by operating activities: | ||||||||||||
Equity loss (earnings) of joint ventures | 2,235 | 788 | (957 | ) | ||||||||
Depreciation and amortization | 10,121 | 8,815 | 8,267 | |||||||||
Foreign currency transaction (gain) loss | (2,559 | ) | (3,075 | ) | 36 | |||||||
Unrealized loss on peso forward contracts | 889 | — | — | |||||||||
(Gain) loss on disposition of property, plant and equipment | (17 | ) | 154 | 170 | ||||||||
Deferred income taxes | 3,027 | (3,330 | ) | 1,447 | ||||||||
Stock based compensation expense | 1,625 | 1,323 | 1,128 | |||||||||
Change in operating assets and liabilities: | ||||||||||||
Receivables | (5,129 | ) | 9,155 | (21,291 | ) | |||||||
Inventories | (3,897 | ) | (4,284 | ) | (6,190 | ) | ||||||
Other assets | (9,481 | ) | (1,482 | ) | (6,535 | ) | ||||||
Accounts payable and accrued liabilities | (3,003 | ) | (1,463 | ) | 16,188 | |||||||
Other, net | 285 | 307 | 116 | |||||||||
|
|
|
|
|
| |||||||
Net cash provided by operating activities | 8,218 | 31,459 | 11,519 | |||||||||
|
|
|
|
|
| |||||||
CASH FLOWS FROM INVESTING ACTIVITIES | ||||||||||||
Investment in joint ventures | (1,720 | ) | (4,384 | ) | — | |||||||
Loan to Joint Venture | (225 | ) | (315 | ) | (285 | ) | ||||||
Repayments from loan to Joint Venture | 100 | — | — | |||||||||
Additions to property, plant and equipment | (23,496 | ) | (26,097 | ) | (12,812 | ) | ||||||
Proceeds received on sale of property, plant and equipment | 76 | 1 | 71 | |||||||||
|
|
|
|
|
| |||||||
Net cash used in investing activities | (25,265 | ) | (30,795 | ) | (13,026 | ) | ||||||
|
|
|
|
|
| |||||||
CASH FLOWS FROM FINANCING ACTIVITIES | ||||||||||||
Borrowings under credit facility | 26,500 | 9,000 | 1,250 | |||||||||
Repayments under credit facility | (16,500 | ) | (1,500 | ) | (1,000 | ) | ||||||
Exercise of stock options and employee stock purchases | 473 | 553 | 2,742 | |||||||||
Excess tax benefits from stock-based compensation | 170 | 367 | 495 | |||||||||
Dividends paid to non-controlling interests of subsidiaries | (1,568 | ) | (882 | ) | (984 | ) | ||||||
Dividends paid | (1,865 | ) | (1,711 | ) | (1,542 | ) | ||||||
|
|
|
|
|
| |||||||
Net cash provided by financing activities | 7,210 | 5,827 | 961 | |||||||||
|
|
|
|
|
| |||||||
FOREIGN CURRENCY IMPACT ON CASH | (381 | ) | (552 | ) | (5 | ) | ||||||
|
|
|
|
|
| |||||||
NET (DECREASE) INCREASE IN CASH AND CASH EQUIVALENTS | (10,218 | ) | 5,939 | (551 | ) | |||||||
CASH AND CASH EQUIVALENTS | ||||||||||||
Beginning of year | 25,695 | 19,756 | 20,307 | |||||||||
|
|
|
|
|
| |||||||
End of year | $ | 15,477 | $ | 25,695 | $ | 19,756 | ||||||
|
|
|
|
|
| |||||||
SUPPLEMENTAL DISCLOSURE OF CASH FLOW INFORMATION CASH PAID DURING THE PERIOD FOR: | ||||||||||||
Income taxes | $ | 4,699 | $ | 14,754 | $ | 5,441 | ||||||
Interest | $ | 157 | $ | 47 | $ | 42 | ||||||
NON-CASH INVESTING ACTIVITIES: | ||||||||||||
Change in capital expenditures in accounts payable | $ | 2,625 | $ | 136 | $ | — | ||||||
Guarantee of joint venture revolving credit facility | $ | 505 | $ | 995 | $ | — | ||||||
Guarantee of joint venture contract | $ | — | $ | 250 | $ | — | ||||||
The accompanying Notes to Financial Statements are an integral part of these Consolidated Statements of Cash Flows.
| 2016 STRATTEC Annual Report | 37 |
NOTES TO FINANCIAL STATEMENTS
ORGANIZATION AND SUMMARY OF SIGNIFICANT ACCOUNTING POLICIES
STRATTEC SECURITY CORPORATION designs, develops, manufactures and markets automotive access control products including mechanical locks and keys, electronically enhanced locks and keys, steering column and instrument panel ignition lock housings, latches, power sliding side door systems, power lift gate systems, power deck lid systems, door handles and related products for primarily North American automotive customers. We also supply global automotive manufacturers through a unique strategic relationship with WITTE Automotive of Velbert, Germany and ADAC Automotive of Grand Rapids, Michigan. Under this relationship, STRATTEC, WITTE and ADAC market the products of each company to global customers under the “VAST” brand name (as more fully described herein). STRATTEC products are shipped to customer locations in the United States, Canada, Mexico, Europe, South America, Korea, China and India, and we provide full service and aftermarket support for our products. We also maintain a 51 percent interest in a joint venture, STRATTEC Advanced Logic, LLC (“SAL LLC”), which exists to introduce a new generation of biometric security products based on the designs of Actuator Systems, our partner and the owner of the remaining ownership interest.
The accompanying consolidated financial statements reflect the consolidated results of STRATTEC SECURITY CORPORATION, its wholly owned Mexican subsidiary, STRATTEC de Mexico, and its majority owned subsidiaries, ADAC-STRATTEC, LLC and STRATTEC POWER ACCESS LLC. STRATTEC SECURITY CORPORATION is located in Milwaukee, Wisconsin. STRATTEC de Mexico is located in Juarez, Mexico. ADAC-STRATTEC, LLC and STRATTEC POWER ACCESS LLC have operations in El Paso, Texas and Juarez, Mexico. Equity investments in Vehicle Access Systems Technology LLC (“VAST LLC”) and SAL LLC for which we exercise significant influence but do not control and are not the primary beneficiary are accounted for using the equity method. VAST LLC consists primarily of three wholly owned subsidiaries in China, one wholly owned subsidiary in Brazil and one joint venture entity in India. SAL LLC is located in El Paso, Texas. We have only one reporting segment.
The significant accounting policies followed in the preparation of these financial statements, as summarized in the following paragraphs, are in conformity with accounting principles generally accepted in the United States of America (U.S. GAAP).
Principles of Consolidation and Presentation:The accompanying consolidated financial statements include the accounts of STRATTEC SECURITY CORPORATION, its wholly owned Mexican subsidiary, and its majority owned subsidiaries. Equity investments for which STRATTEC exercises significant influence but does not control and is not the primary beneficiary are accounted for using the equity method. All significant inter-company transactions and balances have been eliminated.
New Accounting Standards:In May 2014, the FASB issued an update to the accounting guidance for the recognition of revenue arising from contracts with customers. The update supersedes most current revenue recognition guidance and outlines a single comprehensive model for revenue recognition based on the principle that an entity should recognize revenue in an amount that reflects the expected consideration to be received in the exchange of goods and services. The guidance update also requires additional disclosure about the nature, amount, timing and uncertainty of revenue and cash flows arising from customer contracts. The guidance update is effective for annual reporting periods beginning after December 15, 2017 and becomes effective for us at the beginning of our 2019 fiscal year. We are currently assessing the impact that this guidance will have on our consolidated financial statements.
In August 2014, the FASB issued an update to the accounting guidance on determining when and how to disclose going-concern uncertainties in the financial statements. The new guidance requires management to perform interim and annual assessments of an entity’s ability to continue as a going concern within one year of the date the financial statements are issued. An entity must provide certain disclosures if conditions or events raise substantial doubt about the entity’s ability to continue as a going concern. This accounting update is effective for annual and interim periods beginning on or after December 15, 2016, with early adoption permitted. We do not expect that the adoption of this pronouncement will have a material impact on our consolidated financial statements.
In February 2015, the FASB issued an update to the accounting guidance that amends current consolidation guidance by modifying the evaluation of whether limited partnerships and similar legal entities are variable interest entities or voting interest entities, eliminating the presumption that a general partner should consolidate a limited partnership, and affects the consolidation analysis of reporting entities that are involved with variable interest entities. The update is effective for interim and annual reporting periods beginning after December 15, 2015, with early adoption permitted. The adoption of this pronouncement did not have a material impact on our consolidated financial statements.
In April 2015 and August 2015, the FASB issued updates to the accounting guidance for debt issuance costs. The updated guidance requires that debt issuance costs related to a recognized debt liability be presented in the balance sheet as a direct deduction from the carrying amount of that debt liability and allows an entity to defer and present debt issuance costs associated with a line of credit arrangement as an asset, regardless of whether there are any outstanding borrowings on the line of credit arrangement. The guidance updates are effective for financial statements issued for fiscal years beginning after December 15, 2015, and interim periods within those fical years. We do not expect that the adoption of this updated guidance will have a material impact on our consolidated financial statements.
| 2016 STRATTEC Annual Report | 38 |
NOTES TO FINANCIAL STATEMENTS
In July 2015, the FASB issued an accounting standard to simplify the measurement of inventory by changing the subsequent measurement guidance from the lower of cost or market to the lower of cost and net realizable value for inventory. The standard update is effective for fiscal years beginning after December 15, 2016 and interim periods within those years, and early adoption is permitted. The standard is to be applied prospectively. We do not expect that the adoption of this pronouncement will have a material impact on our consolidated financial statements.
In November 2015, the FASB issued an update to an accounting standard to simplify the presentation of deferred income taxes by requiring that deferred tax assets and liabilities be classified as non-current in a classified statement of financial position, which would be a change from our historical presentation whereby certain of our deferred tax assets and liabilities were classified as current and the remainder were classified as non-current. The standard update is effective for fiscal years beginning after December 15, 2016 and interim periods within those years, and early adoption is permitted. The standard is to be applied either prospectively to all deferred tax assets and liabilities or retrospectively to all periods presented. We have elected to adopt this guidance effective July 3, 2016, and have applied the guidance retrospectively. We restated our consolidated balance sheet as of June 28, 2015 to reflect the reclassification of $9.6 million of deferred tax balances from current assets and $4.6 million of deferred income tax balances from non-current liabilities to a non-current asset balance.
In February 2016, the FASB issued an update to the accounting guidance for leases. The update increases the transparency and comparability among organizations by requiring lessees to recognize lease assets and lease liabilities on the balance sheet and to disclose key information about leasing arrangements. The guidance is effective for fiscal years beginning after December 15, 2018 and interim periods within those years. We are currently assessing the impact that this guidance will have on our consolidated financial statements.
In March 2016, the FASB issued an update to the accounting guidance for share-based payments. The update simplifies several aspects of the accounting for employee share-based payment transactions including the accounting for income taxes, forfeitures and statutory tax withholding requirements, as well as classification of such items in the statement of cash flows. The guidance is effective for fiscal years beginning after December 15, 2016 and interim periods within those years. We are currently assessing the impact that this guidance will have on our consolidated financial statements.
Fiscal Year:Our fiscal year ends on the Sunday nearest June 30. The years ended July 3, 2016, June 28, 2015 and June 29, 2014 are comprised of 53, 52 and 52 weeks, respectively.
Use of Estimates:The preparation of financial statements in conformity with U.S. GAAP requires management to make estimates and assumptions that affect the reported amounts of assets, liabilities, revenues and expenses for the periods presented. These estimates and assumptions could also affect the disclosure of contingencies. Actual results and outcomes may differ from management’s estimates and assumptions.
Cash and Cash Equivalents:Cash and cash equivalents include all short-term investments with an original maturity of three months or less due to the short-term nature of the instruments. Excess cash balances are placed in short-term commercial paper. As of July 3, 2016, $10.6 million of our cash and cash equivalents balance held by our foreign subsidiaries in Mexico was deemed to be permanently reinvested.
Derivative Instruments:We own and operate manufacturing operations in Mexico. As a result, a portion of our manufacturing costs are incurred in Mexican pesos, which causes our earnings and cash flows to fluctuate due to changes in the U.S. dollar/Mexican peso exchange rate. During 2016, we executed contracts with Bank of Montreal that provide for bi-weekly and monthly Mexican peso currency forward contracts for a portion of our estimated peso denominated operating costs. The current peso currency forward contracts include settlement dates that began on October 16, 2015 and end on June 15, 2018. No forward contracts were in place during fiscal 2015 or 2014. Our objective in entering into these currency forward contracts is to minimize our earnings volatility resulting from changes in exchange rates affecting the U.S. dollar cost of our Mexican operations. The Mexican peso forward contracts are not used for speculative purposes and are not designated as hedges. As a result, all currency forward contracts are recognized in our accompanying consolidated financial statements at fair value and changes in the fair value are reported in current earnings as part of Other Income, net.
The following table quantifies the outstanding Mexican peso forward contracts as of July 3, 2016 (thousands of dollars, except average forward contractual exchange rates):
| Effective Dates | Notional Amount | Average Forward Contractual Exchange Rate | Fair Value | |||||||||||
Buy MXP/Sell USD | July 15, 2016 - June 15, 2017 | $ | 24,000 | 17.95 | $ | (996 | ) | |||||||
Buy MXP/Sell USD | July 15, 2017 - June 15, 2018 | $ | 6,000 | 19.80 | $ | 107 | ||||||||
The fair market value of all outstanding Mexican peso forward contracts in the accompanying Consolidated Balance Sheets was as follows (thousands of dollars):
| July 3, 2016 | June 28, 2015 | |||||||
Not Designed as hedging Instruments: | ||||||||
Other Long-term Assets: | ||||||||
Mexican Peso Forward Contracts | $ | 107 | $ | — | ||||
Other Current Liabilities: | ||||||||
Mexican Peso Forward Contracts | $ | 996 | $ | — | ||||
| 2016 STRATTEC Annual Report | 39 |
NOTES TO FINANCIAL STATEMENTS
The pre-tax effects of the Mexican peso forward contracts on the accompanying Consolidated Statements of Income and Comprehensive Income consisted of the following (thousands of dollars):
| Other income, net | ||||||||||||
| Years Ended | ||||||||||||
| July 3, 2016 | June 28, 2015 | June 29, 2014 | ||||||||||
Not Designated as Hedging Instruments: | ||||||||||||
Realized Loss | $ | 1,196 | $ | — | $ | — | ||||||
Unrealized Loss | $ | 889 | $ | — | $ | — | ||||||
Fair Value of Financial Instruments:The fair value of our cash and cash equivalents, accounts receivable, accounts payable and borrowings under our credit facilities approximated their book value as of July 3, 2016 and June 28, 2015. Fair Value is defined as the exchange price that would be received for an asset or paid for a liability (an exit price) in the principal or most advantageous market for the asset or liability in an orderly transaction between market participants on the measurement date. Valuation techniques used to measure fair value must maximize the use of observable inputs and minimize the use of unobservable inputs. There is an established fair value hierarchy based on three levels of inputs, of which the first two are considered observable and the last unobservable. Level 1 – Quoted prices in active markets for identical assets or liabilities. These are typically obtained from real-time quotes for transactions in active exchange markets involving identical assets. Level 2 – Inputs, other than quoted prices included within Level 1, which are observable for the asset or liability, either directly or indirectly. These are typically obtained from readily-available pricing sources for comparable instruments. Level 3 – Unobservable inputs, where there is little or no market activity for the asset or liability. These inputs reflect the reporting entity’s own assumptions of the data that market participants would use in pricing the asset or liability, based on the best information available in the circumstances. The following table summarizes our financial assets and liabilities measured at fair value on a recurring basis as of July 3, 2016 and June 28, 2015 (thousands of dollars):
| July 3, 2016 | June 28, 2015 | |||||||||||||||||||||||||||||||
| Level 1 | Level 2 | Level 3 | Total | Level 1 | Level 2 | Level 3 | Total | |||||||||||||||||||||||||
Assets: | ||||||||||||||||||||||||||||||||
Rabbi Trust Assets: | ||||||||||||||||||||||||||||||||
Stock Index Funds: | ||||||||||||||||||||||||||||||||
Small Cap | $ | 356 | $ | — | $ | — | $ | 356 | $ | 372 | $ | — | $ | — | $ | 372 | ||||||||||||||||
Mid Cap | 357 | — | — | 357 | 365 | — | — | 365 | ||||||||||||||||||||||||
Large Cap | 498 | — | — | 498 | 490 | — | — | 490 | ||||||||||||||||||||||||
International | 389 | — | — | 389 | 438 | — | — | 438 | ||||||||||||||||||||||||
Fixed Income Funds | 700 | — | — | 700 | 679 | — | — | 679 | ||||||||||||||||||||||||
Cash and Cash Equivalents | — | 3 | — | 3 | — | — | — | — | ||||||||||||||||||||||||
Mexican Peso Forward Contracts | — | 107 | — | 107 | — | — | — | — | ||||||||||||||||||||||||
|
|
|
|
|
|
|
|
|
|
|
|
|
|
|
| |||||||||||||||||
Total assets at fair value | $ | 2,300 | $ | 110 | $ | — | $ | 2,410 | $ | 2,344 | $ | — | $ | — | $ | 2,344 | ||||||||||||||||
|
|
|
|
|
|
|
|
|
|
|
|
|
|
|
| |||||||||||||||||
Liabilities: | ||||||||||||||||||||||||||||||||
Mexico Peso Forward Contracts | $ | — | $ | 996 | $ | — | $ | 996 | $ | — | $ | — | $ | — | $ | — | ||||||||||||||||
|
|
|
|
|
|
|
|
|
|
|
|
|
|
|
| |||||||||||||||||
The Rabbi Trust assets fund our supplemental executive retirement plan and are included in Other Long-Term Assets in the accompanying Consolidated Balance Sheets. Refer to discussion of Mexican peso forward contracts under Derivative Instruments above. The fair value of the Mexican peso forward contracts considers the remaining term, current exchange rate and interest rate differentials between the two currencies. There were no transfers between Level 1 and Level 2 assets during 2016 or 2015.
Receivables:Receivables consist primarily of trade receivables due from Original Equipment Manufacturers in the automotive industry and locksmith distributors relating to our service and aftermarket sales. We evaluate the collectability of receivables based on a number of factors. An allowance for doubtful accounts is recorded for significant past due receivable balances based on a review of the past due items, general economic conditions and the industry as a whole. Changes in the allowance for doubtful accounts were as follows (thousands of dollars):
| Balance, Beginning of Year | Provision for Doubtful Accounts | Net Write-Offs | Balance, End of Year | |||||||||||||
Year ended July 3, 2016 | $ | 500 | $ | — | $ | — | $ | 500 | ||||||||
Year ended June 28, 2015 | $ | 500 | $ | — | $ | — | $ | 500 | ||||||||
Year ended June 29, 2014 | $ | 500 | $ | — | $ | — | $ | 500 | ||||||||
| 2016 STRATTEC Annual Report | 40 |
NOTES TO FINANCIAL STATEMENTS
Inventories:Inventories are comprised of material, direct labor and manufacturing overhead, and are stated at the lower of cost or market using the first-in, first-out (“FIFO”) cost method of accounting. Inventories consisted of the following (thousands of dollars):
| July 3, 2016 | June 28, 2015 | |||||||
Finished products | $ | 10,137 | $ | 11,358 | ||||
Work in process | 8,291 | 7,746 | ||||||
Purchased materials | 23,055 | 17,982 | ||||||
|
|
|
| |||||
| 41,483 | 37,086 | |||||||
Excess and obsolete reserve | (2,800 | ) | (2,300 | ) | ||||
|
|
|
| |||||
Inventories, net | $ | 38,683 | $ | 34,786 | ||||
|
|
|
| |||||
We record a reserve for excess and obsolete inventory based on historical and estimated future demand and market conditions. The reserve level is determined by comparing inventory levels of individual materials and parts to historical usage and estimated future sales by analyzing the age of the inventory in order to identify specific materials and parts that are unlikely to be sold. Technical obsolescence and other known factors are also considered in evaluating the reserve level. The activity related to the excess and obsolete inventory reserve was as follows (thousands of dollars):
| Balance, Beginning of Year | Provision Charged to Expense | Amounts Written Off | Balance, End of Year | |||||||||||||
Year ended July 3, 2016 | $ | 2,300 | $ | 844 | $ | 344 | $ | 2,800 | ||||||||
Year ended June 28, 2015 | $ | 2,150 | $ | 655 | $ | 505 | $ | 2,300 | ||||||||
Year ended June 29, 2014 | $ | 1,500 | $ | 1,122 | $ | 472 | $ | 2,150 | ||||||||
Customer Tooling in Progress:We incur costs related to tooling used in component production and assembly. Costs for development of certain tooling, which will be directly reimbursed by the customer whose parts are produced from the tool, are accumulated on the balance sheet and are then billed to the customer. The accumulated costs are billed upon formal acceptance by the customer of products produced with the individual tool. Other tooling costs are not directly reimbursed by the customer. These costs are capitalized and amortized over the life of the related product based on the fact that the related tool will be used over the life of the supply arrangement. To the extent that estimated costs exceed expected reimbursement from the customer we will recognize a loss.
Repair and Maintenance Supply Parts:We maintain an inventory of repair and maintenance supply parts in support of operations. This inventory includes critical repair parts for all production equipment as well as general maintenance items. The inventory of critical repair parts is required to avoid disruptions in our customers’ just-in-time production schedules due to a lack of spare parts when equipment break-downs occur. All required critical repair parts are on hand when the related production equipment is placed in service and maintained to satisfy the customer model life production and service requirements, which may be 12 to 15 years. As repair parts are used, additional repair parts are purchased to maintain a minimum level of spare parts inventory. Depending on maintenance requirements during the life of the equipment, excess quantities of repair parts arise. Excess quantities are kept on hand and are not disposed of until the equipment is no longer in service. A repair and maintenance supply parts reserve is maintained to recognize the normal adjustment of inventory for obsolete and slow moving supply and maintenance parts. The adequacy of the reserve is reviewed periodically in relation to the repair parts inventory balances. The gross balance of the repair and maintenance supply parts inventory was approximately $3.2 million at July 3, 2016 and $2.9 million at June 28, 2015. The repair and maintenance supply parts inventory balance is included in Other Current Assets in the accompanying Consolidated Balance Sheets. The activity related to the repair and maintenance supply parts reserve was as follows (thousands of dollars):
| Balance, Beginning of Year | Provision Charged to Expense | Amounts Written Off | Balance, End of Year | |||||||||||||
Year ended July 3, 2016 | $ | 620 | $ | 366 | $ | 286 | $ | 700 | ||||||||
Year ended June 28, 2015 | $ | 585 | $ | 348 | $ | 313 | $ | 620 | ||||||||
Year ended June 29, 2014 | $ | 500 | $ | 102 | $ | 17 | $ | 585 | ||||||||
| 2016 STRATTEC Annual Report | 41 |
NOTES TO FINANCIAL STATEMENTS
Intangibles:Intangible assets that have defined useful lives were acquired in the purchase of the power sliding door, lift gate and deck lid system access control products from Delphi Corporation in 2009 and consist of patents, engineering drawings and software. The intangible assets balance is included in Other Long-term Assets in the accompanying Consolidated Balance Sheets. The carrying value and accumulated amortization were as follows (thousands of dollars):
| July 3, 2016 | June 28, 2015 | |||||||
Patents, engineering drawings and software | $ | 890 | $ | 890 | ||||
Less: accumulated amortization | (750 | ) | (651 | ) | ||||
|
|
|
| |||||
| $ | 140 | $ | 239 | |||||
|
|
|
| |||||
The remaining useful life of the intangible assets in the table above is approximately 1.4 years. Intangible amortization expense was $99,000 for each of the years ended July 3, 2016, June 28, 2015 and June 29, 2014. Intangible amortization expense is expected to be $99,000 in fiscal year 2017, $41,000 in fiscal 2018 and zero thereafter.
Property, Plant and Equipment:Property, plant and equipment are stated at cost. Property, plant and equipment are depreciated on a straight-line basis over the estimated useful lives of the assets as follows:
Classification | Expected Useful Lives | |
Land improvements | 20 years | |
Buildings and improvements | 15 to 35 years | |
Machinery and equipment | 3 to 10 years |
Property, plant and equipment consisted of the following (thousands of dollars):
| July 3, 2016 | June 28, 2015 | |||||||
Land and improvements | $ | 4,686 | $ | 4,246 | ||||
Buildings and improvements | 29,361 | 25,954 | ||||||
Machinery and equipment | 182,812 | 164,367 | ||||||
|
|
|
| |||||
| 216,859 | 194,567 | |||||||
Less: accumulated depreciation | (131,710 | ) | (123,441 | ) | ||||
|
|
|
| |||||
| $ | 85,149 | $ | 71,126 | |||||
|
|
|
| |||||
Depreciation expense was as follows for the periods indicated (thousands of dollars):
| Depreciation Expense | ||||
2016 | $ | 10,022 | ||
2015 | $ | 8,716 | ||
2014 | $ | 8,168 | ||
The gross and net book value of property, plant and equipment located outside of the United States, primarily in Mexico, were as follows (thousands of dollars):
| July 3, 2016 | June 28, 2015 | |||||||
Gross book value | $ | 97,537 | $ | 87,876 | ||||
Net book value | $ | 43,954 | $ | 38,138 | ||||
Long-lived assets are reviewed for impairment whenever events or changes in circumstances indicate that the carrying amount of an asset may not be recoverable. Recoverability of assets to be held and used is measured by a comparison of the carrying amount of an asset to future net undiscounted cash flows expected to be generated by the asset. If an asset is considered to be impaired, the impairment recognized is measured by the excess of the carrying amount of the asset over the fair value of the asset. Assets to be disposed of are reported at the lower of the carrying amount or fair value, less estimated costs to sell. There were no impairments recorded in the years ended July 3, 2016, June 28, 2015 or June 29, 2014.
Expenditures for repairs and maintenance are charged to expense as incurred. Expenditures for major renewals and betterments, which significantly extend the useful lives of existing plant and equipment, are capitalized and depreciated. Upon retirement or disposition of plant and equipment, the cost and related accumulated depreciation are removed from the accounts and any resulting gain or loss is recognized in income.
| 2016 STRATTEC Annual Report | 42 |
NOTES TO FINANCIAL STATEMENTS
Supplier Concentrations:The following inventory purchases were made from major suppliers during each fiscal year noted:
Fiscal Year | Percentage of Inventory Purchases | Number of Suppliers | ||||||
2016 | 36 | % | 6 | |||||
2015 | 27 | % | 5 | |||||
2014 | 38 | % | 7 | |||||
We have long-term contracts or arrangements with most of our suppliers to guarantee the availability of raw materials and component parts.
Labor Concentrations:We had approximately 3,877 full-time associates of which approximately 275 or 7.1 percent were represented by a labor union at July 3, 2016. The associates represented by a labor union account for all production associates at our Milwaukee facility. The current contract with the unionized associates is effective through September 17, 2018.
Revenue Recognition:Revenue is recognized upon the shipment of products, which is when title passes, payment terms are final, we have no remaining obligations and the customer is required to pay. Revenue is recognized net of estimated returns and discounts, which is recognized as a deduction from revenue at the time of the shipment. Price concessions agreed to with customers are recorded as a reduction of sales at the later of when revenue related to the specific sales is recognized or the date at which the price concessions are offered and committed to.
Research and Development Costs:Expenditures relating to the development of new products and processes, including significant improvements and refinements to existing products, are expensed as incurred. Research and development expenditures were approximately $430,000 in 2016, $280,000 in 2015 and $700,000 in 2014.
Other Income, Net:Net other income included in the accompanying Consolidated Statements of Income and Comprehensive Income primarily included foreign currency transaction gains and losses, realized and unrealized gains and losses on our Mexican Peso option contracts, and Rabbi Trust gains. Foreign currency transaction gains and losses were the result of foreign currency transactions entered into by our Mexican subsidiaries and fluctuations in foreign currency cash balances. We entered into the Mexican Peso currency option contracts during fiscal 2016 to minimize earnings volatility resulting from changes in exchange rates affecting the U.S. dollar cost of our Mexican operations. The Rabbi Trust assets fund our amended and restated supplemental executive retirement plan. The investments held in the Trust are considered trading securities. The impact of these items for the periods presented was as follows (thousands of dollars):
| Years Ended | ||||||||||||
| July 3, 2016 | June 28, 2015 | June 29, 2014 | ||||||||||
Foreign currency transaction gain (loss) | $ | 2,559 | $ | 3,075 | $ | (36 | ) | |||||
Rabbi Trust (loss) gain | (41 | ) | 96 | 211 | ||||||||
Unrealized loss on Mexican peso option contracts | (889 | ) | — | — | ||||||||
Realized loss on Mexican peso option contracts | (1,196 | ) | — | — | ||||||||
Other | 235 | 310 | 97 | |||||||||
|
|
|
|
|
| |||||||
| $ | 668 | $ | 3,481 | $ | 272 | |||||||
|
|
|
|
|
| |||||||
Self Insurance Plans:We have self-insured medical and dental plans covering all eligible U.S. associates. The claims handling process for the self-insured plans are managed by a third-party administrator. Stop-loss insurance coverage limits our liability on a per individual per calendar year basis. The per individual per calendar year stop-loss limit was $150,000 in each calendar year 2013 through 2016. Effective January 1, 2011, under Health Care Reform, there is no lifetime maximum for overall benefits.
The expected ultimate cost for claims incurred under the self-insured medical and dental plans as of the applicable balance sheet date is not discounted and is recognized as an expense on our Consolidated Statements of Income and Comprehensive Income. The expected ultimate cost of claims is estimated based upon the aggregate liability for reported claims and an estimated liability for claims incurred but not reported, which is based on an analysis of historical data, current health care trends and information available from the third-party administrator. The expected ultimate cost for claims incurred under the self-insured medical and dental plans that has not been paid as of the applicable balance sheet date is included in Accrued Liabilities: Payroll and Benefits in our accompanying Consolidated Balance Sheets.
Changes in the balance sheet amounts for self-insured plans were as follows (thousands of dollars):
| Balance, Beginning of Year | Provision Charged to Expense | Payments | Balance, End of Year | |||||||||||||
Year ended July 3, 2016 | $ | 420 | $ | 5,032 | $ | 5,032 | $ | 420 | ||||||||
Year ended June 28, 2015 | $ | 420 | $ | 4,756 | $ | 4,756 | $ | 420 | ||||||||
Year ended June 29, 2014 | $ | 420 | $ | 4,600 | $ | 4,600 | $ | 420 | ||||||||
| 2016 STRATTEC Annual Report | 43 |
NOTES TO FINANCIAL STATEMENTS
Warranty Reserve:We have a warranty liability recorded related to our known and potential exposure to warranty claims in the event our products fail to perform as expected, and in the event we may be required to participate in the repair costs incurred by our customers for such products. The recorded warranty liability balance involves judgment and estimates. Our liability estimate is based on an analysis of historical warranty data as well as current trends and information, including our customers’ recent extension and/or expansion of their warranty programs. In recent fiscal periods, our largest customers have extended their warranty protection for their vehicles and have since demanded higher warranty cost sharing arrangements from their suppliers in their terms and conditions to purchase, including from STRATTEC. During 2016, the warranty liability was reduced as a result of settlement payments of previously accrued customer warranty issues. The 2015 warranty provision included various known or expected customer warranty issues and estimated future warranty costs to be incurred as of June 2015 for which amounts were reasonably estimable. As additional information becomes available, actual results may differ from recorded estimates, which may require us to adjust the amount of our warranty provision.
Changes in the warranty reserve were as follows (thousands of dollars):
| Balance, Beginning of Year | Provision Charged to Expense | Payments | Balance, End of Year | |||||||||||||
Year ended July 3, 2016 | $ | 11,835 | $ | 583 | $ | 3,190 | $ | 9,228 | ||||||||
Year ended June 28, 2015 | $ | 3,462 | $ | 8,975 | $ | 602 | $ | 11,835 | ||||||||
Year ended June 29, 2014 | $ | 2,500 | $ | 1,153 | $ | 191 | $ | 3,462 | ||||||||
Foreign Currency Translation:The financial statements of our foreign subsidiaries and equity investees are translated into U.S. dollars using the exchange rate at each balance sheet date for assets and liabilities and the average exchange rate for each applicable period for sales, costs and expenses. Foreign currency translation adjustments are included as a component of accumulated other comprehensive loss. Foreign currency transaction gains and losses are included in other income, net in the accompanying Consolidated Statements of Income and Comprehensive Income.
Accumulated Other Comprehensive Loss:Accumulated other comprehensive loss was comprised of the following (thousands of dollars):
| July 3, 2016 | June 28, 2015 | June 29, 2014 | ||||||||||
Unrecognized pension and postretirement benefit liabilities, net of tax | $ | 24,518 | $ | 18,638 | $ | 16,787 | ||||||
Foreign currency translation | 13,155 | 8,221 | 3,411 | |||||||||
|
|
|
|
|
| |||||||
| $ | 37,673 | $ | 26,859 | $ | 20,198 | |||||||
|
|
|
|
|
| |||||||
Deferred taxes have not been provided for the foreign currency translation adjustments.
The following tables summarize the changes in accumulated other comprehensive loss (“AOCL”) for the years ended July 3, 2016 and June 28, 2015 (thousands of dollars):
| Year Ended July 3, 2016 | ||||||||||||
| | Foreign Currency — Translation | | | Retirement and — Postretirement Plans | | Total | ||||||
Balance June 28, 2015 | $ | 8,221 | $ | 18,638 | $ | 26,859 | ||||||
Other comprehensive loss before reclassifications | 5,248 | 11,640 | 16,888 | |||||||||
Income tax | — | (4,307 | ) | (4,307 | ) | |||||||
|
|
|
|
|
| |||||||
Net other comprehensive loss before reclassifications | 5,248 | 7,333 | 12,581 | |||||||||
Reclassifications: | ||||||||||||
Prior service credits(A) | — | 753 | 753 | |||||||||
Actuarial gains(A) | — | (3,059 | ) | (3,059 | ) | |||||||
|
|
|
|
|
| |||||||
Total reclassifications before tax | — | (2,306 | ) | (2,306 | ) | |||||||
Income Tax | — | 853 | 853 | |||||||||
|
|
|
|
|
| |||||||
Net reclassifications | — | (1,453 | ) | (1,453 | ) | |||||||
|
|
|
|
|
| |||||||
Other comprehensive loss | 5,248 | 5,880 | 11,128 | |||||||||
Other comprehensive loss attributable to Non-Controlling interest | 314 | — | 314 | |||||||||
|
|
|
|
|
| |||||||
Balance July 3, 2016 | $ | 13,155 | $ | 24,518 | $ | 37,673 | ||||||
|
|
|
|
|
| |||||||
| 2016 STRATTEC Annual Report | 44 |
NOTES TO FINANCIAL STATEMENTS
| Year Ended June 28, 2015 | ||||||||||||
| Foreign Currency — Translation Adjustments | Retirement and — Postretirement Plans | Total | ||||||||||
Balance June 29, 2014 | $ | 3,411 | $ | 16,787 | $ | 20,198 | ||||||
Other comprehensive loss before reclassifications | 5,133 | 5,654 | 10,787 | |||||||||
Income tax | — | (2,092 | ) | (2,092 | ) | |||||||
|
|
|
|
|
| |||||||
Net other comprehensive loss before reclassifications | 5,133 | 3,562 | 8,695 | |||||||||
Reclassifications: | ||||||||||||
Prior service credits(A) | — | 753 | 753 | |||||||||
Actuarial gains(A) | — | (3,468 | ) | (3,468 | ) | |||||||
|
|
|
|
|
| |||||||
Total reclassifications before tax | — | (2,715 | ) | (2,715 | ) | |||||||
Income Tax | — | 1,004 | 1,004 | |||||||||
|
|
|
|
|
| |||||||
Net reclassifications | — | (1,711 | ) | (1,711 | ) | |||||||
|
|
|
|
|
| |||||||
Other comprehensive loss | 5,133 | 1,851 | 6,984 | |||||||||
Other comprehensive loss attributable to Non-Controlling interest | 323 | — | 323 | |||||||||
|
|
|
|
|
| |||||||
Balance June 28, 2015 | $ | 8,221 | $ | 18,638 | $ | 26,859 | ||||||
|
|
|
|
|
| |||||||
| (A) | Amounts reclassified are included in the computation of net periodic benefit cost, which is included in Cost of Goods Sold and Engineering, Selling and Administrative expenses in the accompanying Consolidated Statements of Income and Comprehensive Income. See the Note Retirement Plans and Postretirement Costs in these notes to financial statements. |
Accounting For Stock-Based Compensation:We maintain an omnibus stock incentive plan. This plan provides for the granting of stock options, shares of restricted stock and stock appreciation rights. The Board of Directors has designated 1,850,000 shares of common stock available for the grant of awards under the plan. Remaining shares available to be granted under the plan as of July 3, 2016 were 230,289. Awards that expire or are cancelled without delivery of shares become available for re-issuance under the plan. We issue new shares of common stock to satisfy stock option exercises.
Nonqualified and incentive stock options and shares of restricted stock have been granted to our officers, outside directors and specified associates under the stock incentive plan. Stock options granted under the plan may not be issued with an exercise price less than the fair market value of the common stock on the date the option is granted. Stock options become exercisable as determined at the date of grant by the Compensation Committee of our Board of Directors. The options expire 10 years after the grant date unless an earlier expiration date is set at the time of grant. The options vest 1 to 4 years after the date of grant. Shares of restricted stock granted under the plan are subject to vesting criteria determined by the Compensation Committee of our Board of Directors at the time the shares are granted and have a minimum vesting period of three years from the date of grant. Restricted shares granted prior to August 2014 have voting and dividend rights, regardless of whether the shares are vested or unvested. Restricted shares granted during August 2014 and thereafter have voting rights, regardless of whether the shares are vested or unvested, but only have the right to receive cash dividends after such shares become vested. Prior to August 2015, the restricted stock grants issued vest 3 years after the date of grant. As of August 2015, restricted stock grants issued vest 3 to 5 years after the date of grant.
The fair value of each stock option grant was estimated as of the date of grant using the Black-Scholes pricing model. The resulting compensation cost for fixed awards with graded vesting schedules is amortized on a straight-line basis over the vesting period for the entire award. The expected term of awards granted is determined based on historical experience with similar awards, giving consideration to the contractual terms and vesting schedules. The expected volatility is determined based on our historical stock prices over the most recent period commensurate with the expected term of the award. The risk-free interest rate is based on U.S. Treasury zero-coupon issues with a remaining term commensurate with the expected term of the award. Expected pre-vesting option forfeitures are based primarily on historical data. The fair value of each restricted stock grant was based on the market price of the underlying common stock as of the date of grant. The resulting compensation cost is amortized on a straight line basis over the vesting period. We record stock based compensation only for those awards that are expected to vest.
Unrecognized compensation cost as of July 3, 2016 related to stock options and restricted stock granted under the plan was as follows (thousands of dollars):
| Compensation Cost | Weighted Average Period over which Cost is to be Recognized (in years) | |||||||
Stock options granted | $ | 143 | 0.5 | |||||
Restricted Stock granted | $ | 1,810 | 1.1 | |||||
| 2016 STRATTEC Annual Report | 45 |
NOTES TO FINANCIAL STATEMENTS
Unrecognized compensation cost will be adjusted for any future changes in estimated and actual forfeitures. Cash received from stock option exercises and the related income tax benefit were as follows (thousands of dollars):
Fiscal Year | Cash Received from Stock Option Exercises | Income Tax Benefit | ||||||
2016 | $ | 364 | $ | 196 | ||||
2015 | $ | 474 | $ | 458 | ||||
2014 | $ | 2,683 | $ | 729 | ||||
The intrinsic value of stock options exercised and the fair value of stock options vested were as follows (in thousands of dollars):
| Years Ended | ||||||||||||
| July 3, 2016 | June 28, 2015 | June 29, 2014 | ||||||||||
Intrinsic value of options exercised | $ | 529 | $ | 1,375 | $ | 2,134 | ||||||
Fair value of stock options vested | $ | 331 | $ | 382 | $ | 444 | ||||||
The grant date fair values and assumptions used to determine compensation expense recorded in the accompanying financial statements were as follows:
| Options Granted During | 2015 | 2014 | ||||||
Weighted average grant date fair value: | ||||||||
Options issued at grant date market value | n/a | n/a | ||||||
Options issued above grant date market value | $ | 34.93 | $ | 17.58 | ||||
Assumptions: | ||||||||
Risk free interest rates | 1.90 | % | 2.06 | % | ||||
Expected volatility | 57.83 | % | 58.75 | % | ||||
Expected dividend yield | 0.62 | % | 1.11 | % | ||||
Expected term (in years) | 6.0 | 6.0 | ||||||
No options were granted during the fiscal year ended July 3, 2016.
The range of options outstanding as of July 3, 2016 was as follows:
| Number of Options Outstanding/Exercisable | Weighted Average Exercise Price Outstanding/Exercisable | Weighted Average Remaining Contractual Life Outstanding (In Years) | ||||
$10.92-$18.49 | 44,414/44,414 | $15.14/$15.14 | 3.1 | |||
$26.53-$38.71 | 91,574/59,384 | $30.50/$26.06 | 6.2 | |||
$79.73 | 9,010/- | $79.73/$- | 8.1 | |||
| ||||||
| $28.86/$21.39 |
Income Taxes:Income taxes are accounted for under the asset and liability method. Deferred tax assets and liabilities are recognized for the future tax consequences attributable to differences between the financial statement carrying amounts of assets and liabilities and their respective tax bases and operating loss carry-forwards. Deferred tax assets and liabilities are measured using enacted tax rates expected to apply to taxable income in the years in which those temporary differences and operating loss carry-forwards are expected to be recovered, settled or utilized. The effect on deferred tax assets and liabilities of a change in tax rates is recognized in income in the period that includes the enactment date. Valuation allowances are recorded to reduce deferred tax assets when it is more likely than not that a tax benefit will not be realized. We recognize the benefit of an income tax position only if it is more likely than not (greater than 50 percent) that the tax position will be sustained upon tax examination, based solely on the technical merits of the tax position. Otherwise, no benefit is recognized. The tax benefits recognized are measured based on the largest benefit that has a greater than 50 percent likelihood of being realized upon ultimate settlement. Additionally, we accrue interest and related penalties, if applicable, on all tax exposures for which reserves have been established consistent with jurisdictional tax laws. Interest and penalties on uncertain tax positions are classified in the Provision for Income Taxes in the accompanying Consolidated Statements of Income and Comprehensive Income.
| 2016 STRATTEC Annual Report | 46 |
NOTES TO FINANCIAL STATEMENTS
INVESTMENT IN JOINT VENTURES AND MAJORITY OWNED SUBSIDIARIES
We participate in certain Alliance Agreements with WITTE Automotive (“WITTE”) and ADAC Automotive (“ADAC”). WITTE, of Velbert, Germany, is a privately held automotive supplier. WITTE designs, manufactures and markets automotive components, including locks and keys, hood latches, rear compartment latches, seat back latches, door handles and specialty fasteners. WITTE’s primary market for these products has been Europe. ADAC, of Grand Rapids, Michigan, is a privately held automotive supplier and manufactures engineered products, including door handles and other automotive trim parts, utilizing plastic injection molding, automated painting and various assembly processes.
The Alliance Agreements include a set of cross-licensing agreements for the manufacture, distribution and sale of WITTE products by STRATTEC and ADAC in North America, and the manufacture, distribution and sale of STRATTEC and ADAC products by WITTE in Europe. Additionally, a joint venture company, Vehicle Access Systems Technology LLC (“VAST LLC”), in which WITTE, STRATTEC and ADAC each hold a one-third equity interest, exists to seek opportunities to manufacture and sell each company’s products in areas of the world outside of North America and Europe.
Sistema de Acesso Veicular Ltda (formerly VAST do Brasil) services customers in South America. Effective March 21, 2014, VAST LLC purchased the remaining non-controlling interest in the Brazilian entity. VAST Fuzhou, VAST Great Shanghai and VAST Shanghai Co. (collectively known as VAST China), provide a base of operations to service our automotive customers in the Asian market. VAST LLC also maintains branch offices in South Korea and Japan in support of customer sales and engineering requirements.
Effective April 30, 2015, VAST LLC executed an agreement to become a 50:50 Joint Venture partner with Minda Management Services Limited an affiliate of both Minda Corporation Limited and Spark Minda, Ashok Minda Group of New Delhi, India (collectively “Minda”). VAST acquired a fifty percent equity interest in the former Minda-Valeo Security Systems joint venture entity, based in Pune, India, for approximately $12 million. This joint venture entity was renamed Minda-VAST Access Systems (“Minda-VAST”). The portion of the purchase price paid by each VAST LLC partner, STRATTEC, WITTE and ADAC, totaled $4 million. Minda-VAST has operations in Pune and Delhi and had annual sales of $36 million in our fiscal year 2016. Minda and its affiliates cater to the needs of all major car, motorcycle, commercial vehicle, tractor and off-road vehicle manufacturers in India. They are a leading manufacturer in the Indian marketplace of security & access products, handles, automotive safety, restraint systems, driver information and telematics systems for both OEMs and the aftermarket.
The VAST LLC investments are accounted for using the equity method of accounting. The activities related to the VAST LLC joint ventures resulted in equity loss of joint ventures to STRATTEC of approximately $639,000 during 2016 and equity earnings of joint ventures to STRATTEC of approximately $1.3 million during both 2015 and 2014. The current year equity loss of joint ventures for VAST LLC included a $6 million impairment charge related to its Minda-VAST Access Systems joint venture in India. STRATTEC’s portion of this impairment charge for 2016 totaled $2 million. During 2016, capital contributions totaling $660,000 were made to VAST LLC for purposes of funding operations in Brazil. STRATTEC’s portion of the capital contributions totaled $220,000. During 2015, cash capital contributions totaling $13.2 million were made to VAST LLC in support of the acquisition of the 50 percent joint venture interest in Minda-VAST and in support of general operating expenses for the Brazilian entity. STRATTEC’s portion of the cash capital contributions totaled $4.4 million. No cash capital contributions were made to VAST LLC during 2014. Loans were made by each partner, STRATTEC, WITTE and ADAC, to VAST LLC totaling $215,000 for each partner in 2015 and $285,000 for each partner in 2014. The loans were made in support of VAST LLC’s purchase of the non-controlling interest in the Brazilian entity and in support of funding operating costs of the Brazilian entity. During 2016, VAST LLC made loan repayments of $100,000 to each partner.
ADAC-STRATTEC LLC, a Delaware limited liability company, was formed in fiscal year 2007 to support injection molding and door handle assembly operations in Mexico. ADAC-STRATTEC LLC was 51 percent owned by STRATTEC and 49 percent owned by ADAC for all periods presented in this report. An additional Mexican entity, ADAC-STRATTEC de Mexico, is wholly owned by ADAC-STRATTEC LLC. ADAC-STRATTEC LLC’s financial results are consolidated with the financial results of STRATTEC and resulted in increased net income to STRATTEC of approximately $2.9 million in 2016, $2.6 million in 2015 and $1.4 million in 2014.
STRATTEC POWER ACCESS LLC (“SPA”) was formed in fiscal year 2009 to supply the North American portion of the power sliding door, lift gate and deck lid system access control products which were acquired from Delphi Corporation. SPA was 80 percent owned by STRATTEC and 20 percent owned by WITTE for all periods presented in this report. An additional Mexican entity, STRATTEC POWER ACCESS de Mexico, is wholly owned by SPA. The financial results of SPA are consolidated with the financial results of STRATTEC and resulted in increased net income to STRATTEC of approximately $2.0 million in 2016, reduced net income to STRATTEC of approximately $269,000 in 2015, and increased net income to STRATTEC of approximately $1.5 million in 2014.
| 2016 STRATTEC Annual Report | 47 |
NOTES TO FINANCIAL STATEMENTS
SAL LLC was formed in fiscal 2013 to introduce a new generation of biometric security products based upon the designs of Actuator Systems LLC, our partner and the owner of the remaining ownership interest in SAL LLC. SPA was 51 percent owned by STRATTEC for all periods presented in this report. The initial capitalization of SAL LLC totaled $1.5 million. STRATTEC’s portion of the initial capitalization totaled $765,000. Our investment in SAL LLC, for which we exercise significant influence but do not control and are not the primary beneficiary, is accounted for using the equity method. The activities related to the SAL LLC joint venture resulted in an equity loss of joint ventures to STRATTEC of approximately $1.6 million in 2016, $2.0 million in 2015 and $367,000 in 2014. Effective with our fiscal 2015 fourth quarter, 100 percent of the funding for SAL LLC was being made through loans from STRATTEC to SAL LLC and through STRATTEC’s guarantee of the SAL Credit Facility which is discussed herein. Therefore, effective with our fiscal 2015 fourth quarter, even though STRATTEC maintains a 51 percent ownership interest in SAL LLC, STRATTEC began recognizing 100 percent of the losses of SAL LLC up to our committed financial support through Equity (Loss) Earnings of Joint Ventures in the accompanying Consolidated Statements of Income and Comprehensive Income. In addition, the equity loss of joint ventures for SAL LLC included the following for the periods presented (thousands of dollars):
| Years Ended | ||||||||
| July 3, 2016 | June 28, 2015 | |||||||
Loss on Guarantee of SAL LLC Vendor Contract | $ | — | $ | 123 | ||||
Loss on Loan to SAL LLC | $ | 225 | $ | 100 | ||||
Loss on Guarantee of SAL LLC Credit Facility | $ | 247 | $ | 488 | ||||
STRATTEC’s joint venture investments are included in the accompanying Consolidated Balance Sheets as follows (thousands of dollars):
| July 3, 2016 | June 28, 2015 | |||||||
Investment in Joint Ventures: | ||||||||
Investment in VAST LLC | $ | 14,168 | $ | 15,326 | ||||
|
|
|
| |||||
Other Current Liabilities: | ||||||||
Investment in SAL LLC | $ | 1,265 | $ | 402 | ||||
|
|
|
| |||||
EQUITY (LOSS) EARNINGS OF JOINT VENTURES
As discussed above under the note Investment in Joint Ventures and Majority Owned Subsidiaries, we hold a one-third ownership interest in VAST LLC, for which we exercise significant influence but do not control and are not the primary beneficiary. Our investment in VAST LLC is accounted for using the equity method. The following are summarized statements of operations and summarized balance sheet data for VAST LLC (thousands of dollars):
| Years Ended | ||||||||||||
| July 3, 2016 | June 28, 2015 | June 29, 2014 | ||||||||||
Net sales | $ | 114,338 | $ | 124,929 | $ | 111,844 | ||||||
Cost of goods sold | 94,060 | 105,132 | 94,701 | |||||||||
|
|
|
|
|
| |||||||
Gross profit | 20,278 | 19,797 | 17,143 | |||||||||
Engineering, selling and administrative expense | 15,866 | 16,155 | 14,169 | |||||||||
Impairment Charge | 6,000 | — | — | |||||||||
|
|
|
|
|
| |||||||
(Loss) income from operations | (1,588 | ) | 3,642 | 2,974 | ||||||||
Other (expense) income, net | (115 | ) | 123 | 1,809 | ||||||||
|
|
|
|
|
| |||||||
(Loss) income before provision for income taxes | (1,703 | ) | 3,765 | 4,783 | ||||||||
Provision for income taxes | 168 | 41 | 810 | |||||||||
|
|
|
|
|
| |||||||
Net (loss) income | $ | (1,871 | ) | $ | 3,724 | $ | 3,973 | |||||
|
|
|
|
|
| |||||||
STRATTEC’s share of VAST LLC net (loss) income | $ | (624 | ) | $ | 1,241 | $ | 1,324 | |||||
Intercompany profit eliminations | (15 | ) | 10 | — | ||||||||
|
|
|
|
|
| |||||||
STRATTEC’s equity (loss) earnings of VAST LLC | $ | (639 | ) | $ | 1,251 | $ | 1,324 | |||||
|
|
|
|
|
| |||||||
| 2016 STRATTEC Annual Report | 48 |
NOTES TO FINANCIAL STATEMENTS
| July 3, 2016 | June 28, 2015 | |||||||
Cash and cash equivalents | $ | 6,584 | $ | 5,792 | ||||
Receivables, net | 24,557 | 23,511 | ||||||
Inventories, net | 13,500 | 13,792 | ||||||
Other current assets | 13,007 | 12,479 | ||||||
|
|
|
| |||||
Total current assets | 57,648 | 55,574 | ||||||
Property, plant and equipment, net | 26,557 | 26,070 | ||||||
Other long-term assets | 11,086 | 15,413 | ||||||
|
|
|
| |||||
Total assets | $ | 95,291 | $ | 97,057 | ||||
|
|
|
| |||||
Current liabilities | $ | 50,462 | $ | 43,605 | ||||
Long-term liabilities | 2,019 | 7,212 | ||||||
|
|
|
| |||||
Total liabilities | $ | 52,481 | $ | 50,817 | ||||
|
|
|
| |||||
Net assets | $ | 42,810 | $ | 46,240 | ||||
|
|
|
| |||||
STRATTEC’s share of VAST LLC net assets | $ | 14,270 | $ | 15,413 | ||||
|
|
|
| |||||
The current year equity loss of joint ventures for VAST LLC included a $6 million impairment charge related to its Minda-VAST Access Systems joint venture in India. STRATTEC’s portion of this impairment charge in 2016 totaled $2 million.
As discussed above under the note Investment in Joint Ventures and Majority Owned Subsidiaries, we hold a 51 percent ownership interest in a joint venture company, SAL LLC, which exists to introduce a new generation of biometric security products based upon the designs of Actuator Systems LLC, our partner. SAL LLC is considered a variable interest entity based on the STRATTEC guarantee. STRATTEC is not the primary beneficiary and does not control the entity. Accordingly, our investment in SAL LLC is accounted for using the equity method. SAL LLC had a $1.5 million revolving credit facility with BMO Harris Bank N.A. with a maturity date of February 16, 2016, which was fully guaranteed by STRATTEC. Outstanding borrowings under the SAL Credit Facility as of February 16, 2016 and June 28, 2015 totaled $1.5 million and $995,000, respectively. SAL LLC did not have cash available to pay the outstanding debt balance as of the maturity date. Therefore, STRATTEC made a payment of $1.5 million on its guarantee on February 16, 2016. Prior to making the guarantee payment, STRATTEC had recorded a liability related to the guarantee of $1.5 million and $995,000 at February 16, 2016 and June 28, 2015, respectively, which amounts were equal to the estimated fair value of the guarantee as of these dates. As of June 28, 2015, the guarantee liability was included in Other Current Liabilities in the accompanying Consolidated Balance Sheets. STRATTEC’s proportionate share of the guarantee based on our ownership percentage in SAL LLC totaled $765,000 and $507,000, respectively, as of February 16, 2016 and June 28, 2015, and accordingly, our investment in SAL LLC included these amounts as of these dates. Our joint venture partner did not guarantee their proportionate share of the SAL Credit Facility. As a result, we recorded a loss equal to our partner’s proportionate share of the fair value of the STRATTEC guarantee based upon our partner’s ownership interest in the joint venture of $488,000 during fiscal 2015 and $247,000 during 2016. This loss is included in Equity (Loss) Earnings of Joint Ventures for 2016 and 2015, as applicable, in the accompanying Consolidated Statements of Income and Comprehensive Income.
Effective November 1, 2014, a license agreement was signed with Westinghouse allowing SAL LLC to do business as Westinghouse Security. Payments required under this license agreement were guaranteed by STRATTEC. As of July 3, 2016 and June 28, 2015, STRATTEC had recorded a liability equal to the estimated fair value of the guarantee of these payments of $250,000, which amount is equal to the future payments required to be made under the license agreement as of these dates. The liability is included in Other Long-term Liabilities in the accompanying Consolidated Balance Sheets. STRATTEC’s proportionate share of the guarantee of these payments based on our ownership percentage in SAL LLC totals $127,000, and accordingly, our investment in SAL LLC was increased by this amount as of July 3, 2016 and June 28, 2015. Our joint venture partner did not guarantee their proportionate share of the payments required under the license agreement. As a result, STRATTEC recorded a loss of $123,000 which is equal to our partner’s proportionate share, based upon their ownership interest in the joint venture, of the fair value of the STRATTEC guarantee. This loss is included in Equity (Loss) Earnings of Joint Ventures for 2015 in the accompanying Consolidated Statements of Income and Comprehensive Income.
During 2015, a loan was made from STRATTEC to SAL LLC in support of operating expenses and working capital needs. As of June 28, 2015, the outstanding loan amount totaled $100,000. A valuation reserve of $100,000 was recorded related to this loan as of June 28, 2015. During 2016, additional loans totaling $225,000 were made from STRATTEC to SAL LLC in support of operating expenses and working capital needs. A valuation reserve of $225,000 was recorded related to the additional loans during 2016. The corresponding losses related to the valuation reserves are included in Equity (Loss) Earnings of Joint Ventures in the accompanying Consolidated Statements of Income and Comprehensive Income. As of July 3, 2016, the outstanding loan amount totaled $325,000, which was fully offset by a valuation reserve of $325,000.
| 2016 STRATTEC Annual Report | 49 |
NOTES TO FINANCIAL STATEMENTS
Even though we maintain a 51 percent ownership interest in SAL LLC, effective with our fiscal 2015 fourth quarter, 100 percent of the funding for SAL LLC was being made by loans from STRATTEC to SAL LLC. Therefore, STRATTEC began recognizing 100 percent of the losses of SAL LLC up to our committed financial support through Equity (Loss) Earnings of Joint Ventures in the accompanying Consolidated Statements of Income and Comprehensive Income effective with our fiscal 2015 fourth quarter.
The following are summarized statements of operations and summarized balance sheet data for SAL LLC (thousands of dollars):
| Years Ended | ||||||||||||
| July 3, 2016 | June 28, 2015 | June 29, 2014 | ||||||||||
Net sales | $ | 603 | $ | 49 | $ | — | ||||||
Cost of goods sold | 382 | 450 | — | |||||||||
|
|
|
|
|
| |||||||
Gross profit (loss) | 221 | (401 | ) | — | ||||||||
Engineering, selling and administrative expense | 1,311 | 1,492 | 720 | |||||||||
|
|
|
|
|
| |||||||
Loss from operations | (1,090 | ) | (1,893 | ) | (720 | ) | ||||||
Other expense, net | (34 | ) | (4 | ) | — | |||||||
|
|
|
|
|
| |||||||
Net loss | (1,124 | ) | $ | (1,897 | ) | (720 | ) | |||||
|
|
|
|
|
| |||||||
STRATTEC’s share of SAL LLC loss | $ | (1,124 | ) | $ | (1,328 | ) | $ | (367 | ) | |||
Loss on Guarantee of SAL LLC Vendor Contract | — | (123 | ) | — | ||||||||
Loss on Loan to SAL LLC | (225 | ) | (100 | ) | — | |||||||
Loss on Guarantee of SAL LLC Credit facility | (247 | ) | (488 | ) | — | |||||||
|
|
|
|
|
| |||||||
STRATTEC’s equity loss of SAL LLC | $ | (1,596 | ) | $ | (2,039 | ) | $ | (367 | ) | |||
|
|
|
|
|
| |||||||
| July 3, 2016 | June 28, 2015 | |||||||
Cash and cash equivalents | $ | 21 | $ | 71 | ||||
Receivables, net | 60 | 14 | ||||||
Inventories, net | 283 | 246 | ||||||
Property, plant and equipment, net | — | — | ||||||
|
|
|
| |||||
Total assets | $ | 364 | $ | 331 | ||||
|
|
|
| |||||
Current liabilities | $ | 1,256 | $ | 1,600 | ||||
|
|
|
| |||||
Net liabilities | $ | (892 | ) | $ | (1,269 | ) | ||
|
|
|
| |||||
STRATTEC’s share of SAL LLC net liabilities | $ | (455 | ) | $ | (647 | ) | ||
|
|
|
| |||||
We have sales of component parts to VAST LLC and SAL LLC, purchases of component parts from VAST LLC, expenses charged to VAST LLC for engineering and accounting services and expenses charged from VAST LLC to STRATTEC for general headquarter expenses. The following tables summarize the related party transactions with VAST LLC and SAL LLC for the periods indicated (thousands of dollars):
| Years Ended | ||||||||||||
| July 3, 2016 | June 28, 2015 | June 29, 2014 | ||||||||||
Sales to VAST LLC | $ | 304 | $ | 2,298 | $ | 231 | ||||||
Sales to SAL LLC | $ | 363 | $ | 157 | $ | — | ||||||
Purchases from VAST LLC | $ | 149 | $ | 164 | $ | 233 | ||||||
Expenses charged to VAST LLC | $ | 1,034 | $ | 832 | $ | 743 | ||||||
Expenses charged from VAST LLC | $ | 1,526 | $ | 1,825 | $ | 1,261 | ||||||
| July 3, 2016 | June 28, 2015 | |||||||||||
Accounts receivable from VAST LLC | $ | 55 | $ | 118 | ||||||||
Accounts receivable from SAL LLC | $ | 450 | $ | 278 | ||||||||
Current loan receivable from SAL LLC(A) | $ | 325 | $ | 100 | ||||||||
Long-term loan receivable from VAST LLC | $ | 400 | $ | 500 | ||||||||
Accounts payable to VAST LLC | $ | 213 | $ | 267 | ||||||||
| (A) | Based on the current financial position of SAL LLC, a valuation reserve has been established as of July 3, 2016 and June 28, 2015 for the full amount of the loan receivable balance. |
CREDIT FACILITIES AND GUARANTEES
STRATTEC has a $30 million secured revolving credit facility (the “STRATTEC Credit Facility”) with BMO Harris Bank N.A. ADAC-STRATTEC LLC has a $20 million secured revolving credit facility (the “ADAC-STRATTEC Credit Facility”) with BMO Harris Bank N.A., which is guaranteed by STRATTEC. The credit facilities both expire on August 1, 2019. Borrowings under either credit facility are secured by our U.S. cash balances, accounts receivable, inventory and fixed assets located in the U.S. Interest on borrowings under the STRATTEC Credit Facility is at varying rates based, at our option, on the LIBOR plus 1.0 percent or the bank’s prime rate. Interest on borrowings under the ADAC-STRATTEC Credit Facility for periods prior to January 22, 2014 was at varying rates based, at our option, on LIBOR plus 1.75 percent or the bank’s prime rate. As a result of an amendment to the ADAC-STRATTEC Credit Facility, effective January 22, 2014 and
| 2016 STRATTEC Annual Report | 50 |
NOTES TO FINANCIAL STATEMENTS
thereafter, interest on borrowings under this facility is based, at our option, on LIBOR plus 1.0 percent or the bank’s prime rate. Both credit facilities contain a restrictive financial covenant that requires the applicable borrower to maintain a minimum net worth level. The ADAC-STRATTEC Credit Facility includes an additional restrictive financial covenant that requires the maintenance of a minimum fixed charge coverage ratio as well as the requirements for a capital contribution to ADAC-STRATTEC LLC of $6 million collectively from STRATTEC and ADAC to be completed by September 30, 2016. STRATTEC’s portion of the required capital contribution will be $3.06 million. As of July 3, 2016, we were in compliance with all financial covenants.
Outstanding borrowings under the credit facilities referenced in the above paragraph as of the end of 2016 and 2015 were as follows (thousands of dollars):
| July 3, 2016 | June 28, 2015 | |||||||
STRATTEC Credit Facility | $ | 11,500 | $ | 7,000 | ||||
ADAC-STRATTEC Credit Facility | $ | 8,500 | $ | 3,000 | ||||
Average outstanding borrowings and the weighted average interest rate under each such credit facility during 2016 and 2015 were as follows (thousands of dollars):
| Average Outstanding Borrowings | Weighted Average Interest Rate | |||||||||||||||
| Years Ended | Years Ended | |||||||||||||||
| July 3, 2016 | June 28, 2015 | July 3, 2016 | June 28, 2015 | |||||||||||||
STRATTEC Credit Facility | $ | 7,608 | $ | 2,288 | 1.5 | % | 1.2 | % | ||||||||
ADAC-STRATTEC Credit Facility | $ | 4,443 | $ | 3,666 | 1.3 | % | 1.2 | % | ||||||||
We believe that the credit facilities referenced above are adequate, along with existing cash balances and cash flow from operations, to meet our anticipated capital expenditure, working capital, dividend and operating expenditure requirements.
SAL LLC had a $1.5 million revolving credit facility with BMO Harris Bank N.A. with a maturity date of February 16, 2016, which was fully guaranteed by STRATTEC. Interest on borrowings under the STRATTEC Advanced Logic Credit Facility (the “SAL Credit Facility”) is at varying rates based, at SAL LLC’s option, on LIBOR plus 1.0 percent or the bank’s prime rate. Outstanding borrowings under the SAL Credit Facility as of February 16, 2016 and June 28, 2015 totaled $1.5 million and $995,000, respectively. SAL LLC did not have cash available to pay the outstanding debt balance as of the maturity date. Therefore, STRATTEC made a payment of $1.5 million on its guarantee on February 16, 2016. Prior to making the guarantee payment, STRATTEC had a recorded liability related to the guarantee of $1.5 million and $995,000 at February 16, 2016 and June 28, 2015, respectively, which amounts were equal to the estimated fair value of the guarantee as of these dates. Effective November 1, 2014, a license agreement was signed with Westinghouse allowing SAL LLC to do business as Westinghouse Security. STRATTEC guaranteed payments under the Westinghouse agreement. As of July 3, 2016 and June 28, 2015, STRATTEC had recorded a liability related to the guarantee of $250,000, which amount is equal to the amount of the future payments required under the Westinghouse agreement as of July 3, 2016 and June 28, 2015, and which amount is also equal to the estimated fair value of the guarantee as of these dates. See further discussion under Equity (Loss) Earnings of Joint Ventures included herein.
COMMITMENTS AND CONTINGENCIES
We are from time to time subject to various legal actions and claims incidental to our business, including those arising out of alleged defects, alleged breaches of contracts, product warranties, intellectual property matters and employment related matters. It is our opinion that the outcome of such matters will not have a material adverse impact on the consolidated financial position, results of operations or cash flows of STRATTEC. With respect to warranty matters, although we cannot ensure that the future costs of warranty claims by customers will not be material, we believe our established reserves are adequate to cover potential warranty settlements.
We have a reserve for estimated costs to remediate an environmental contamination site at our Milwaukee facility. The site was contaminated by a solvent spill, which occurred in 1985, from a former above ground solvent storage tank located on the east side of the facility. The reserve was initially established in 1995. Due to changing technology and related costs associated with active remediation of the site, in fiscal 2010 the reserve was adjusted based on updated third party estimates to adequately cover the cost for active remediation of the contamination. Additionally, in fiscal 2016, STRATTEC obtained updated third party estimates for adequately covering the cost of active remediation of this contamination. Based upon the updated estimates, no further adjustment to the reserve was required. From 1995 through July 3, 2016, costs of approximately $509,000 have been incurred related to the installation of monitoring wells on the property and ongoing monitoring costs. We monitor and evaluate the site with the use of groundwater monitoring wells that are installed on the property. An environmental consultant samples these wells one or two times a year to determine the status of the contamination and the potential for remediation of the contamination by natural attenuation, the dissipation of the contamination over time to concentrations below applicable standards. If such sampling evidences a sufficient degree of and trend toward natural attenuation of the contamination, we may be able to obtain a closure letter from the regulatory authorities resolving the issue without the need for active remediation. If a sufficient degree and trend toward natural attenuation is not evidenced by sampling, a more active form of remediation beyond natural attenuation may be required. The sampling has not yet satisfied all of the requirements for closure by natural attenuation. As a result, sampling continues and the reserve remains at an amount to reflect the estimated cost of active remediation. The reserve is not measured on a discounted basis. We believe, based on findings-to-date and known environmental regulations, that the environmental reserve of $1.4 million at July 3, 2016, is adequate.
| 2016 STRATTEC Annual Report | 51 |
NOTES TO FINANCIAL STATEMENTS
At July 3, 2016, we had purchase commitments for the construction of a new ADAC-STRATTEC de Mexico manufacturing facility in Leon, Mexico, which is expected to be used primarily to paint and assemble door handle products, paint equipment to be installed and used at this new facility, zinc, other purchased parts and natural gas. We also had minimum rental commitments under non-cancelable operating leases with a term in excess of one year. The purchase and minimum rental commitments are payable as follows (thousands of dollars):
Fiscal Year | Purchase Commitments | Minimum Rental Commitments | ||||||
2017 | $ | 23,912 | $ | 729 | ||||
2018 | $ | 11,162 | $ | 520 | ||||
2019 | $ | 7,827 | $ | 416 | ||||
2020 | $ | 3,036 | $ | 174 | ||||
2021 | $ | — | $ | — | ||||
Rental expense under all non-cancelable operating leases was as follows (thousands of dollars):
Fiscal Year | Rental Expense | |||
2016 | $ | 691 | ||
2015 | $ | 993 | ||
2014 | $ | 849 | ||
INCOME TAXES
The provision for income taxes consisted of the following (thousands of dollars):
| Years Ended | ||||||||||||
| July 3, 2016 | June 28, 2015 | June 29, 2014 | ||||||||||
Currently payable: | ||||||||||||
Federal | $ | 18 | $ | 9,891 | $ | 4,811 | ||||||
State | 130 | 657 | 252 | |||||||||
Foreign | 1,893 | 2,164 | 2,164 | |||||||||
|
|
|
|
|
| |||||||
| 2,041 | 12,712 | 7,227 | ||||||||||
Deferred tax provision (benefit) | 3,027 | (3,330 | ) | 1,447 | ||||||||
|
|
|
|
|
| |||||||
| $ | 5,068 | $ | 9,382 | $ | 8,674 | |||||||
|
|
|
|
|
| |||||||
The items accounting for the difference between income taxes computed at the Federal statutory tax rate and the provision for income taxes were as follows:
| Years Ended | ||||||||||||
| July 3, 2016 | June 28, 2015 | June 29, 2014 | ||||||||||
U.S. statutory rate | 34.0 | % | 34.7 | % | 34.5 | % | ||||||
State taxes, net of Federal tax benefit | 1.3 | 0.7 | 1.0 | |||||||||
Foreign subsidiaries | 0.6 | (1.3 | ) | (0.9 | ) | |||||||
Non-controlling interest | (9.3 | ) | (4.1 | ) | (3.5 | ) | ||||||
Other | (0.2 | ) | (2.4 | ) | 0.1 | |||||||
|
|
|
|
|
| |||||||
| 26.4 | % | 27.6 | % | 31.2 | % | |||||||
|
|
|
|
|
| |||||||
The components of deferred tax assets were as follows (thousands of dollars):
| July 3, 2016 | June 28, 2015 | |||||||
Deferred income taxes: | ||||||||
Unrecognized pension and postretirement benefit plan liabilities | $ | 14,579 | $ | 11,125 | ||||
Accrued warranty | 1,376 | 3,250 | ||||||
Payroll-related accruals | 2,108 | 2,314 | ||||||
Customer sales concession reserve | — | 1,465 | ||||||
Stock-based compensation | 1,258 | 928 | ||||||
Inventory reserve | 873 | 722 | ||||||
Environmental reserve | 505 | 512 | ||||||
Repair and maintenance supply parts reserve | 259 | 229 | ||||||
Allowance for doubtful accounts | 185 | 185 | ||||||
NOL/credit carry-forwards | 145 | 105 | ||||||
Postretirement obligations | (227 | ) | (63 | ) | ||||
Accumulated depreciation | (6,135 | ) | (5,253 | ) | ||||
Accrued pension obligations | (13,197 | ) | (12,594 | ) | ||||
Joint Ventures | 1,706 | 481 | ||||||
Other | 1,952 | 1,554 | ||||||
|
|
|
| |||||
| $ | 5,387 | $ | 4,960 | |||||
|
|
|
| |||||
| 2016 STRATTEC Annual Report | 52 |
NOTES TO FINANCIAL STATEMENTS
Deferred income tax balances reflect the effects of temporary differences between the carrying amounts of assets and liabilities and their tax basis and are stated at enacted tax rates expected to be in effect when taxes are actually paid or recovered.
State operating loss and credit carry-forwards at July 3, 2016 resulted in future benefits of approximately $145,000 and expire in 2024. We believe that it is more likely than not that the results of future operations will generate sufficient taxable income and foreign source income to realize the deferred tax assets.
Foreign income before the provision for income taxes was $6.0 million in 2016, $5.9 million in 2015 and $6.6 million in 2014. No provision for Federal income taxes was made on earnings of foreign subsidiaries and joint ventures that are considered permanently invested or that would be offset by foreign tax credits upon distribution. Such undistributed earnings at July 3, 2016 were approximately $33.2 million.
The total liability for unrecognized tax benefits was $471,000 as of July 3, 2016 and $460,000 as of June 28, 2015 and was included in Other Long-term Liabilities in the accompanying Consolidated Balance Sheets. This liability includes approximately $441,000 of unrecognized tax benefits at July 3, 2016 and $437,000 at June 28, 2015 and approximately $30,000 of accrued interest at July 3, 2016 and $23,000 at June 28, 2015. This liability does not include an amount for accrued penalties. The amount of unrecognized tax benefits that, if recognized, would affect the effective tax rate was approximately $20,000 at July 3, 2016 and $32,000 at June 28, 2015. We recognize interest and penalties related to unrecognized tax benefits in the provision for income taxes.
A reconciliation of the beginning and ending amount of unrecognized tax benefits is as follows for the years ended July 3, 2016 and June 28, 2015 (thousands of dollars):
| Years Ended | ||||||||
| July 3, 2016 | June 28, 2015 | |||||||
Unrecognized tax benefits, beginning of year | $ | 437 | $ | 1,289 | ||||
Gross increases - tax positions in prior years | — | 3 | ||||||
Gross decreases - tax positions in prior years | (3 | ) | — | |||||
Gross increases - current period tax positions | 71 | 146 | ||||||
Tax Years Closed | (64 | ) | (1,001 | ) | ||||
|
|
|
| |||||
Unrecognized tax benefits, end of year | $ | 441 | $ | 437 | ||||
|
|
|
| |||||
We or one of our subsidiaries files income tax returns in the United States (Federal), Wisconsin (state), Michigan (state) and various other states, Mexico and other foreign jurisdictions. Tax years open to examination by tax authorities under the statute of limitations include fiscal 2013 through 2016 for Federal, fiscal 2010 through 2016 for most states and calendar 2011 through 2015 for foreign jurisdictions.
RETIREMENT PLANS AND POSTRETIREMENT COSTS
We have a qualified, noncontributory defined benefit pension plan (“Qualified Pension Plan”) covering substantially all U.S. associates. Benefits under the Qualified Pension Plan are based on years of service and final average compensation. Our policy is to fund for the Qualified Pension Plan at least the minimum actuarially computed annual contribution required under the Employee Retirement Income Security Act of 1974 (ERISA). Plan assets consist primarily of listed equity and fixed income securities. Effective December 31, 2009, an amendment to the Qualified Pension Plan discontinued the benefit accruals for salary increases and credited service rendered after that date. On April 2, 2014, our Board of Directors approved a resolution to terminate the Qualified Pension Plan. The termination of the Qualified Pension Plan is subject to the Internal Revenue Service’s (“IRS”) determination that the Qualified Pension Plan is qualified on termination. We believe it will take 18 to 24 months to finalize the complete termination of the Qualified Pension Plan after obtaining IRS approval. We have not yet received IRS approval that the qualified plan is qualified on termination. Additionally, we have amended the Qualified Pension Plan to provide that participants are 100 percent vested in their accrued benefits as of the effective date of the plan termination, to adopt a new standard for disability benefits that will apply when the plan’s assets are distributed due to the termination, to add a lump sum distribution option for employees and terminated vested participants who are not in payment status when Qualified Pension Plan assets are distributed due to the termination and to make certain other conforming amendments to the Qualified Pension Plan to comply with applicable laws that may be required by the IRS or may be deemed necessary or advisable to improve the administration of the
| 2016 STRATTEC Annual Report | 53 |
NOTES TO FINANCIAL STATEMENTS
Qualified Pension Plan or facilitate its termination and liquidation. We also intend to make contributions to the Trust Fund for the Qualified Pension Plan to ensure that there are sufficient assets to provide all Qualified Pension Plan benefits as of the anticipated distribution date. The financial impact of the plan termination will be recognized as a settlement of the Qualified Pension Plan liabilities. The settlement date and related financial impact have not yet been determined.
We have historically had in place a noncontributory supplemental executive retirement plan (“SERP”), which prior to January 1, 2014 was a nonqualified defined benefit plan that essentially mirrored the Qualified Pension Plan, but provided benefits in excess of certain limits placed on our Qualified Pension Plan by the Internal Revenue Code. As noted above, we froze our Qualified Pension Plan effective as of December 31, 2009 and the SERP provided benefits to participants as if the Qualified Pension Plan had not been frozen. Because the Qualified Pension Plan was frozen and because new employees were not eligible to participate in the Qualified Pension Plan, our Board of Directors adopted amendments to the SERP on October 8, 2013 that were effective as of December 31, 2013 to simplify the SERP calculation. The SERP is funded through a Rabbi Trust with BMO Harris Bank N.A. Under the amended SERP, participants received an accrued lump-sum benefit as of December 31, 2013 which was credited to each participant’s account. Subsequent to December 31, 2013, each eligible participant receives a supplemental retirement benefit equal to the foregoing lump sum benefit, plus an annual benefit accrual equal to 8% of the participant’s base salary and cash bonus, plus annual credited interest on the participant’s account balance. All current participants are fully vested in their account balances with any new individuals participating in the SERP effective on or after January 1, 2014 being subject to a five year vesting period. The SERP, which is considered a defined benefit plan under applicable rules and regulations, will continue to be funded through use of a Rabbi Trust to hold investment assets to be used in part to fund any future required lump sum benefit payments to participants. The foregoing amendments to the SERP did not have a material effect on our financial statements. The Rabbi Trust assets had a value of $2.3 million at both July 3, 2016 and June 28, 2015, and are included in Other Long-Term Assets in the accompanying Consolidated Balance Sheets. The projected benefit obligation under the amended SERP was $1.8 million at July 3, 2016 and $1.6 million at June 28, 2015, respectively. The SERP liabilities are included in the pension tables below. However, the Rabbi Trust assets are excluded from the tables as they do not qualify as plan assets.
We also sponsor a postretirement health care plan for all U.S. associates hired prior to June 1, 2001. The expected cost of retiree health care benefits is recognized during the years the associates who are covered under the plan render service. Effective January 1, 2010, an amendment to the postretirement health care plan limited the benefit for future eligible retirees to $4,000 per plan year and the benefit is further subject to a maximum five year coverage period based on the associate’s retirement date and age. The postretirement health care plan is unfunded.
Amounts included in accumulated other comprehensive loss, net of tax, at July 3, 2016, which have not yet been recognized in net periodic benefit cost were as follows (thousands of dollars):
| Pension and SERP | Postretirement | |||||||
Prior service cost (credit) | $ | 14 | $ | (1,246 | ) | |||
Net actuarial loss | 23,125 | 2,625 | ||||||
|
|
|
| |||||
| $ | 23,139 | $ | 1,379 | |||||
|
|
|
| |||||
Prior service cost (credit) and unrecognized net actuarial losses included in accumulated other comprehensive loss at July 3, 2016 which are expected to be recognized in net periodic benefit cost in fiscal 2017, net of tax, for the pension, SERP and postretirement plans are as follows (thousands of dollars):
| Pension and SERP | Postretirement | |||||||
Prior service cost (credit) | $ | 7 | $ | (481 | ) | |||
Net actuarial loss | 2,033 | 339 | ||||||
|
|
|
| |||||
| $ | 2,040 | $ | (142 | ) | ||||
|
|
|
| |||||
| 2016 STRATTEC Annual Report | 54 |
NOTES TO FINANCIAL STATEMENTS
The following tables summarize the pension, SERP and postretirement plans’ income and expense, funded status and actuarial assumptions for the years indicated (thousands of dollars). We use a June 30 measurement date for our pension and postretirement plans.
| Pension and SERP Benefits | Postretirement Benefits | |||||||||||||||||||||||
| Years Ended | Years Ended | |||||||||||||||||||||||
| July 3, 2016 | June 28, 2015 | June 29, 2014 | July 3, 2016 | June 28, 2015 | June 29, 2014 | |||||||||||||||||||
COMPONENTS OF NET PERIODIC BENEFIT COST: | ||||||||||||||||||||||||
Service cost | $ | 50 | $ | 64 | $ | 217 | $ | 12 | $ | 14 | $ | 15 | ||||||||||||
Interest cost | 4,387 | 4,173 | 4,407 | 87 | 114 | 157 | ||||||||||||||||||
Expected return on plan assets | (5,509 | ) | (6,174 | ) | (6,442 | ) | — | — | — | |||||||||||||||
Amortization of prior service cost (credit) | 11 | 11 | 12 | (764 | ) | (764 | ) | (764 | ) | |||||||||||||||
Amortization of unrecognized net loss | 2,443 | 2,775 | 2,665 | 616 | 693 | 847 | ||||||||||||||||||
|
|
|
|
|
|
|
|
|
|
|
| |||||||||||||
Net periodic benefit cost (credit) | $ | 1,382 | $ | 849 | $ | 859 | $ | (49 | ) | $ | 57 | $ | 255 | |||||||||||
|
|
|
|
|
|
|
|
|
|
|
| |||||||||||||
| Pension and SERP Benefits | Postretirement Benefits | |||||||||||||||
| 2016 | 2015 | 2016 | 2015 | |||||||||||||
WEIGHTED-AVERAGE ASSUMPTIONS: | ||||||||||||||||
Benefit Obligations: | ||||||||||||||||
Discount rate | 3.79 | % | 4.53 | % | 3.79 | % | 4.53 | % | ||||||||
Rate of compensation increases - SERP | 3.0 | % | 3.0 | % | n/a | n/a | ||||||||||
Net Periodic Benefit Cost: | ||||||||||||||||
Discount rate | 4.53 | % | 4.39 | % | 4.53 | % | 4.39 | % | ||||||||
Expected return on plan assets | 5.45 | % | 6.5 | % | n/a | n/a | ||||||||||
Rate of compensation increases - SERP | 3.0 | % | 3.0 | % | n/a | n/a | ||||||||||
CHANGE IN PROJECTED BENEFIT OBLIGATION: | ||||||||||||||||
Benefit obligation at beginning of year | $ | 99,329 | $ | 97,445 | $ | 2,179 | $ | 2,929 | ||||||||
Service cost | 50 | 64 | 12 | 14 | ||||||||||||
Interest cost | 4,387 | 4,173 | 87 | 114 | ||||||||||||
Actuarial loss (gain) | 6,783 | 2,118 | (281 | ) | (189 | ) | ||||||||||
Benefits paid | (4,397 | ) | (4,471 | ) | (395 | ) | (689 | ) | ||||||||
|
|
|
|
|
|
|
| |||||||||
Benefit obligation at end of year | $ | 106,152 | $ | 99,329 | $ | 1,602 | $ | 2,179 | ||||||||
|
|
|
|
|
|
|
| |||||||||
CHANGE IN PLAN ASSETS: | ||||||||||||||||
Fair value of plan assets at beginning of year | $ | 105,472 | $ | 104,340 | $ | — | $ | — | ||||||||
Actual return on plan assets | 371 | 2,450 | — | — | ||||||||||||
Employer contribution | 3,014 | 3,153 | 395 | 689 | ||||||||||||
Benefits paid | (4,397 | ) | (4,471 | ) | (395 | ) | (689 | ) | ||||||||
|
|
|
|
|
|
|
| |||||||||
Fair value of plan assets at end of year | $ | 104,460 | $ | 105,472 | $ | — | $ | — | ||||||||
|
|
|
|
|
|
|
| |||||||||
Funded status-(accrued) prepaid benefit obligations | $ | (1,692 | ) | $ | 6,143 | $ | (1,602 | ) | $ | (2,179 | ) | |||||
|
|
|
|
|
|
|
| |||||||||
AMOUNTS RECOGNIZED IN CONSOLIDATED BALANCE SHEETS: | ||||||||||||||||
Other long-term assets | $ | 72 | $ | 7,733 | $ | — | $ | — | ||||||||
Accrued payroll and benefits (current liabilities) | (299 | ) | (259 | ) | (340 | ) | (522 | ) | ||||||||
Accrued benefit obligations (long-term liabilities) | (1,465 | ) | (1,331 | ) | (1,262 | ) | (1,657 | ) | ||||||||
|
|
|
|
|
|
|
| |||||||||
Net amount recognized | $ | (1,692 | ) | $ | 6,143 | $ | (1,602 | ) | $ | (2,179 | ) | |||||
|
|
|
|
|
|
|
| |||||||||
CHANGES IN PLAN ASSETS AND BENEFIT OBLIGATIONS RECOGNIZED IN OTHER COMPREHENSIVE INCOME: | ||||||||||||||||
Net periodic benefit cost (credit) | $ | 1,382 | $ | 849 | $ | (49 | ) | $ | 57 | |||||||
|
|
|
|
|
|
|
| |||||||||
Net actuarial loss (gain) | 11,921 | 5,843 | (281 | ) | (189 | ) | ||||||||||
Amortization of prior service (cost) credits | (11 | ) | (11 | ) | 764 | 764 | ||||||||||
Amortization of unrecognized net loss | (2,443 | ) | (2,775 | ) | (616 | ) | (693 | ) | ||||||||
|
|
|
|
|
|
|
| |||||||||
Total recognized in other comprehensive loss (income), before tax | 9,467 | 3,057 | (133 | ) | (118 | ) | ||||||||||
|
|
|
|
|
|
|
| |||||||||
Total recognized in net periodic benefit cost and other comprehensive loss (income), before tax | $ | 10,849 | $ | 3,906 | $ | (182 | ) | $ | (61 | ) | ||||||
|
|
|
|
|
|
|
| |||||||||
| 2016 STRATTEC Annual Report | 55 |
NOTES TO FINANCIAL STATEMENTS
The pension benefits have a separately determined accumulated benefit obligation, which is the actuarial present value of benefits based on service rendered and current and past compensation levels. This differs from the projected benefit obligation in that it includes no assumptions about future compensation levels. The following table summarizes the accumulated benefit obligations and projected benefit obligations for the pension and SERP (thousands of dollars):
| Pension | SERP | |||||||||||||||
| July 3, 2016 | June 28, 2015 | July 3, 2016 | June 28, 2015 | |||||||||||||
Accumulated benefit obligation | $ | 104,388 | $ | 97,739 | $ | 1,435 | $ | 1,245 | ||||||||
Projected benefit obligation | $ | 104,388 | $ | 97,739 | $ | 1,764 | $ | 1,590 | ||||||||
For measurement purposes as it pertains to the estimated obligation associated with retirees prior to January 1, 2012, a 7 percent annual rate increase in the per capita cost of covered health care benefits was assumed for fiscal 2017; the rate was assumed to decrease gradually to 5 percent by the year 2022 and remain at that level thereafter.
The health care cost trend assumption has a significant effect on the postretirement benefit amounts reported. A 1% change in the health care cost trend rates would have the following effects (thousands of dollars):
| 1% Increase | 1% Decrease | |||||||
Effect on total of service and interest cost components in fiscal 2016 | $ | 1 | $ | (1 | ) | |||
Effect on postretirement benefit obligation as of July 3, 2016 | $ | 13 | $ | (12 | ) | |||
We employ a total return investment approach whereby a mix of equities and fixed income investments are used to maximize the long-term return of plan assets for a prudent level of risk. Risk tolerance is established through careful consideration of short and long-term plan liabilities, plan funded status and corporate financial condition. The investment portfolio primarily contains a diversified blend of equity and fixed income investments. Furthermore, equity investments are diversified across U.S. and non-U.S. stocks, as well as growth and value style managers, and small, mid and large market capitalizations. The investment portfolio does not include any real estate holdings, but had a small allocation to hedge funds in 2015. The investment policy of the plan prohibits investment in STRATTEC stock. Investment risk is measured and monitored on an ongoing basis through periodic investment portfolio reviews, annual liability measurements and periodic asset/liability studies. The pension plan weighted-average asset allocations by asset category were as follows for 2016 and 2015:
| Target Allocation | July 3, 2016 | June 28, 2015 | ||||||||||
Equity investments | 35 | % | 38 | % | 35 | % | ||||||
Fixed-income investments | 30 | 27 | 26 | |||||||||
Cash | 35 | 35 | 39 | |||||||||
|
|
|
|
|
| |||||||
Total | 100 | % | 100 | % | 100 | % | ||||||
|
|
|
|
|
| |||||||
The following is a summary, by asset category, of the fair value of pension plan assets at the June 30, 2016 and June 30, 2015 measurement dates (thousands of dollars):
| June 30, 2016 | June 30, 2015 | |||||||||||||||||||||||||||||||
| Level 1 | Level 2 | Level 3 | Total | Level 1 | Level 2 | Level 3 | Total | |||||||||||||||||||||||||
Asset Category | ||||||||||||||||||||||||||||||||
Cash and cash equivalents | $ | — | $ | 36,706 | $ | — | $ | 36,706 | $ | — | $ | 41,241 | $ | — | $ | 41,241 | ||||||||||||||||
Equity Securities/Funds: | ||||||||||||||||||||||||||||||||
Small Cap | 1,714 | — | — | 1,714 | — | — | — | — | ||||||||||||||||||||||||
Mid Cap | 12,341 | — | — | 12,341 | 10,766 | — | — | 10,766 | ||||||||||||||||||||||||
Large Cap | 18,678 | — | — | 18,678 | 17,965 | — | — | 17,965 | ||||||||||||||||||||||||
International | 7,132 | — | — | 7,132 | 8,483 | — | — | 8,483 | ||||||||||||||||||||||||
Fixed Income Bond Funds/Bonds | 4,837 | 23,052 | — | 27,889 | 5,041 | 21,925 | — | 26,966 | ||||||||||||||||||||||||
Hedge Funds | — | — | — | — | — | — | 51 | 51 | ||||||||||||||||||||||||
|
|
|
|
|
|
|
|
|
|
|
|
|
|
|
| |||||||||||||||||
Total | $ | 44,702 | $ | 59,758 | $ | — | $ | 104,460 | $ | 42,255 | $ | 63,166 | $ | 51 | $ | 105,472 | ||||||||||||||||
|
|
|
|
|
|
|
|
|
|
|
|
|
|
|
| |||||||||||||||||
The following table summarizes the changes in Level 3 investments for the pension plan assets during the measurement year ended June 30, 2016 (thousands of dollars):
| Fair Value June 28, 2015 | Net Purchases and Sales | Realized and Unrealized Gain, net | Fair Value July 3, 2016 | |||||||||||||
Hedge Funds | $ | 51 | $ | (51 | ) | $ | — | $ | — | |||||||
There were no transfers in or out of Level 3 investments during the year ended June 30, 2016.
The expected long-term rate of return on U.S. pension plan assets used to calculate net periodic benefit cost was 5.45 percent for 2017 and 2016. The target asset allocation is 35 percent public equity and 65 percent fixed income/cash. The 5.45 percent is approximated by applying returns of 10 percent on public equity and 3 percent on fixed income to the target allocation. The actual historical returns are also relevant. Annualized returns for periods ended June 30, 2016 were 4.29 percent for 5 years, 4.2 percent for 10 years, 4.33 percent for 15 years, 5.33 percent for 20 years, 6.07 percent for 25 years and 6.61 percent for 30 years.
We expect to contribute approximately $5 million to our qualified pension plan, $299,000 to our SERP and $340,000 to our postretirement health care plan in fiscal 2017. The following benefit payments, which reflect expected future service, as appropriate, are expected to be paid during the fiscal years noted below (thousands of dollars):
| Pension and SERP Benefits | Postretirement Benefits | |||||||
2017 | $ | 5,181 | $ | 340 | ||||
2018 | $ | 5,185 | $ | 299 | ||||
2019 | $ | 5,462 | $ | 240 | ||||
2020 | $ | 5,802 | $ | 176 | ||||
2021 | $ | 6,363 | $ | 151 | ||||
2022-2026 | $ | 30,667 | $ | 398 | ||||
| 2016 STRATTEC Annual Report | 56 |
NOTES TO FINANCIAL STATEMENTS
All U.S. associates may participate in our 401(k) Plan. We contribute 100 percent up to the first 5 percent of eligible compensation that a participant contributes to the plan. Our contributions to the 401(k) Plan were as follows (thousands of dollars):
| Years Ended | ||||||||||||
| July 3, 2016 | June 28, 2015 | June 29, 2014 | ||||||||||
Company Contributions | $ | 1,783 | $ | 1,729 | $ | 1,605 | ||||||
SHAREHOLDERS’ EQUITY
We have 12,000,000 shares of authorized common stock, par value $.01 per share, with 3,565,857 and 3,526,700 shares outstanding at July 3, 2016 and June 28, 2015, respectively. Holders of our common stock are entitled to one vote for each share on all matters voted on by shareholders.
Our Board of Directors authorized a stock repurchase program to buy back up to 3,839,395 outstanding shares of our common stock as of July 3, 2016. As of July 3, 2016, 3,655,322 shares have been repurchased under this program at a cost of approximately $136.4 million. No shares were repurchased under this program during 2016 or 2015.
EARNINGS PER SHARE (“EPS”)
Basic earnings per share is computed on the basis of the weighted average number of shares of common stock outstanding during the period. Diluted earnings per share is computed on the basis of the weighted average number of shares of common stock plus the potential dilutive common shares outstanding during the period using the treasury stock method. Potential dilutive common shares include outstanding stock options and unvested restricted stock awards. A reconciliation of the components of the basic and diluted per share computations follows (in thousands, except per share amounts):
| Years Ended | ||||||||||||
| July 3, 2016 | June 28, 2015 | June 29, 2014 | ||||||||||
Net Income Attributable to STRATTEC | $ | 9,149 | $ | 20,654 | $ | 16,424 | ||||||
Less: Income Attributable to Participating Securities | 58 | 258 | 296 | |||||||||
|
|
|
|
|
| |||||||
Net Income Attributable to Common Shareholders | $ | 9,091 | $ | 20,396 | $ | 16,128 | ||||||
|
|
|
|
|
| |||||||
Weighted Average Shares of Common Stock Outstanding | 3,559 | 3,515 | 3,428 | |||||||||
Incremental Shares – Stock based Compensation | 62 | 89 | 85 | |||||||||
|
|
|
|
|
| |||||||
Diluted Weighted Average Shares of Common Stock Outstanding | 3,621 | 3,604 | 3,513 | |||||||||
|
|
|
|
|
| |||||||
Basic Earnings Per Share | $ | 2.55 | $ | 5.80 | $ | 4.70 | ||||||
|
|
|
|
|
| |||||||
Diluted Earnings Per Share | $ | 2.51 | $ | 5.66 | $ | 4.59 | ||||||
|
|
|
|
|
| |||||||
We consider unvested restricted stock that provides the holder with a non-forfeitable right to receive dividends to be a participating security.
Options to purchase shares of common stock that were excluded from the calculation of diluted earnings per share because their inclusion would have been antidilutive were as follows:
Years Ended | Number of Options Excluded | |||
July 3, 2016 | 9,010 | |||
June 28, 2015 | 10,000 | |||
June 29, 2014 | — | |||
STOCK OPTION AND PURCHASE PLANS
A summary of stock option activity under our stock incentive plan was as follows:
| Shares | Weighted Average Exercise Price | Weighted Average Remaining Contractual Term (in years) | Aggregate Intrinsic Value (in thousands) | |||||||||||||
Balance at June 30, 2013 | 271,455 | $ | 27.19 | |||||||||||||
Granted | 40,000 | $ | 38.71 | |||||||||||||
Exercised | (92,256 | ) | $ | 29.08 | ||||||||||||
Expired | (22,500 | ) | $ | 58.33 | ||||||||||||
Terminated | (11,457 | ) | $ | 30.61 | ||||||||||||
|
| |||||||||||||||
Balance at June 29, 2014 | 185,242 | $ | 24.73 | |||||||||||||
|
| |||||||||||||||
Granted | 10,000 | $ | 79.73 | |||||||||||||
Exercised | (22,746 | ) | $ | 20.83 | ||||||||||||
Terminated | (8,589 | ) | $ | 37.43 | ||||||||||||
|
| |||||||||||||||
Balance at June 28, 2015 | 163,907 | $ | 27.97 | |||||||||||||
|
| |||||||||||||||
Exercised | (16,909 | ) | $ | 21.55 | ||||||||||||
Terminated | (2,000 | ) | $ | 17.59 | ||||||||||||
|
| |||||||||||||||
Balance at July 3, 2016 | 144,998 | $ | 28.86 | 5.4 | $ | 2,290 | ||||||||||
|
| |||||||||||||||
Exercisable as of: | ||||||||||||||||
July 3, 2016 | 103,798 | $ | 21.39 | 4.6 | $ | 2,174 | ||||||||||
June 28, 2015 | 91,103 | $ | 19.86 | 4.1 | $ | 4,592 | ||||||||||
June 29, 2014 | 76,699 | $ | 16.91 | 4.3 | $ | 3,769 | ||||||||||
| 2016 STRATTEC Annual Report | 57 |
NOTES TO FINANCIAL STATEMENTS
Options granted at a price greater than the market value on the date of grant included in the table above were as follows:
| 2015 | 2014 | |||||||
Shares | 10,000 | 40,000 | ||||||
Exercise Price | $ | 79.73 | $ | 38.71 | ||||
A summary of restricted stock activity under our stock incentive plan was as follows:
| Shares | Weighted Average Grant Date Fair Value | |||||||
Nonvested Balance at June 30, 2013 | 61,250 | $ | 22.42 | |||||
Granted | 24,950 | $ | 37.29 | |||||
Vested | (19,350 | ) | $ | 20.40 | ||||
Forfeited | (3,250 | ) | $ | 27.88 | ||||
|
| |||||||
Nonvested Balance at June 29, 2014 | 63,600 | $ | 28.64 | |||||
|
| |||||||
Granted | 25,000 | $ | 70.90 | |||||
Vested | (18,100 | ) | $ | 23.02 | ||||
Forfeited | (4,150 | ) | $ | 45.71 | ||||
|
| |||||||
Nonvested Balance at June 28, 2015 | 66,350 | $ | 45.03 | |||||
|
| |||||||
Granted | 28,750 | $ | 69.02 | |||||
Vested | (20,300 | ) | $ | 23.69 | ||||
Forfeited | (3,050 | ) | $ | 59.92 | ||||
|
| |||||||
Nonvested Balance at July 3, 2016 | 71,750 | $ | 60.05 | |||||
|
| |||||||
We have an Employee Stock Purchase Plan to provide substantially all U.S. full-time associates an opportunity to purchase shares of STRATTEC common stock through payroll deductions. A participant may contribute a maximum of $5,200 per calendar year to the plan. On the last day of each month or if such date is not a trading day on the most recent previous trading day, participant account balances are used to purchase shares of our common stock at the average of the highest and lowest reported sales prices of a share of STRATTEC common stock on the NASDAQ Global Market. A total of 100,000 shares may be issued under the plan. Shares issued from treasury stock under the plan totaled 1,948 at an average price of $55.77 during 2016, 1,038 at an average price of $76.06 during 2015 and 1,181 at an average price of $49.53 during 2014. A total of 67,184 shares remain available for purchase under the plan as of July 3, 2016.
EXPORT SALES
Total export sales, sales from the United States to locations outside of the United States, are summarized as follows (thousands of dollars and percent of total net sales):
| Years Ended | ||||||||||||||||||||||||
| July 3, 2016 | June 28, 2015 | June 29, 2014 | ||||||||||||||||||||||
| Net Sales | % | Net Sales | % | Net Sales | % | |||||||||||||||||||
Export Sales | $ | 152,728 | 38 | % | $ | 141,584 | 34 | % | $ | 119,099 | 34 | % | ||||||||||||
Countries for which customer sales account for ten percent or more of total net sales are summarized as follows (thousands of dollars and percent of total net sales):
| Years Ended | ||||||||||||||||||||||||
| July 3, 2016 | June 28, 2015 | June 29, 2014 | ||||||||||||||||||||||
| Net Sales | % | Net Sales | % | Net Sales | % | |||||||||||||||||||
Export Sales into Canada | $ | 74,310 |
| 19 | % | $ | 60,987 | 15 | % | $ | 76,736 | 22 | % | |||||||||||
PRODUCT SALES
Sales by product group were as follows (thousands of dollars and percent of total net sales):
| Years Ended | ||||||||||||||||||||||||
| July 3, 2016 | June 28, 2015 | June 29, 2014 | ||||||||||||||||||||||
| Net Sales | % | Net Sales | % | Net Sales | % | |||||||||||||||||||
Keys & Locksets | $ | 113,765 | 28 | % | $ | 114,287 | 28 | % | $ | 115,379 | 33 | % | ||||||||||||
Power Access | 83,747 | 21 | 68,078 | 16 | 60,141 | 17 | ||||||||||||||||||
Door Handles & Exterior Trim | 61,376 | 15 | 60,864 | 15 | 48,034 | 14 | ||||||||||||||||||
Driver Controls | 55,955 | 14 | 57,894 | 14 | 53,729 | 16 | ||||||||||||||||||
Aftermarket & OE Service | 48,200 | 12 | 78,717 | 19 | 49,586 | 14 | ||||||||||||||||||
Latches | 28,023 | 7 | 24,320 | 6 | 14,664 | 4 | ||||||||||||||||||
Other | 10,353 | 3 | 7,315 | 2 | 6,886 | 2 | ||||||||||||||||||
|
|
|
|
|
|
|
|
|
|
|
| |||||||||||||
| $ | 401,419 | 100 | % | $ | 411,475 | 100 | % | $ | 348,419 | 100 | % | |||||||||||||
|
|
|
|
|
|
|
|
|
|
|
| |||||||||||||
SALES AND RECEIVABLE CONCENTRATION
Sales to our largest customers were as follows (thousands of dollars and percent of total net sales):
| Years Ended | ||||||||||||||||||||||||
| July 3, 2016 | June 28, 2015 | June 29, 2014 | ||||||||||||||||||||||
| Net Sales | % | Net Sales | % | Net Sales | % | |||||||||||||||||||
Fiat Chrysler Automobiles | $ | 115,858 | 29 | % | $ | 116,914 | 28 | % | $ | 117,502 | 34 | % | ||||||||||||
General Motors Company | 79,893 | 20 | % | 105,809 | 26 | % | 79,526 | 23 | % | |||||||||||||||
Ford Motor Company | 57,317 | 14 | % | 45,415 | 11 | % | 46,619 | 13 | % | |||||||||||||||
|
|
|
|
|
| |||||||||||||||||||
| $ | 253,068 | 63 | % | $ | 268,138 | 65 | % | $ | 243,647 | 70 | % | |||||||||||||
|
|
|
|
|
| |||||||||||||||||||
Receivables from our largest customers were as follows (thousands of dollars and percent of gross receivables):
| July 3, 2016 | June 28, 2015 | |||||||||||||||
| Receivables | % | Receivables | % | |||||||||||||
Fiat Chrysler Automobiles | $ | 18,103 | 28 | % | $ | 17,060 | 29 | % | ||||||||
General Motors Company | 13,090 | 21 | % | 8,751 | 15 | % | ||||||||||
Ford Motor Company | 6,863 | 11 | % | 7,340 | 12 | % | ||||||||||
|
|
|
| |||||||||||||
| $ | 38,056 | 60 | % | $ | 33,151 | 56 | % | |||||||||
|
|
|
| |||||||||||||
| 2016 STRATTEC Annual Report | 58 |
REPORTS
REPORT ON MANAGEMENT’S ASSESSMENT OF INTERNAL CONTROL OVER FINANCIAL REPORTING
STRATTEC SECURITY CORPORATION is responsible for the preparation, integrity, and fair presentation of the consolidated financial statements included in this annual report. The consolidated financial statements and notes included in this annual report have been prepared in conformity with accounting principles generally accepted in the United States of America and necessarily include some amounts that are based on management’s best estimates and judgments.
We, as management of STRATTEC SECURITY CORPORATION, are responsible for establishing and maintaining effective internal control over financial reporting that is designed to produce reliable financial statements in conformity with United States generally accepted accounting principles. The system of internal control over financial reporting as it relates to the financial statements is evaluated for effectiveness by management and tested for reliability through a program of internal audits. Actions are taken to correct potential deficiencies as they are identified. Any system of internal control, no matter how well designed, has inherent limitations, including the possibility that a control can be circumvented or overridden and misstatements due to error or fraud may occur and not be detected. Also, because of changes in conditions, internal control effectiveness may vary over time. Accordingly, even an effective system of internal control will provide only reasonable assurance with respect to financial statement preparation.
The Audit Committee of the Company’s Board of Directors, consisting entirely of independent directors, meets regularly with management and the independent registered public accounting firm, and reviews audit plans and results, as well as management’s actions taken in discharging responsibilities for accounting, financial reporting, and internal control. Deloitte & Touche LLP, independent registered public accounting firm, has direct and confidential access to the Audit Committee at all times to discuss the results of their examinations.
Management assessed the Corporation’s system of internal control over financial reporting as of July 3, 2016, in relation to criteria for effective internal control over financial reporting as described inInternal Control—Integrated Framework (2013), issued by the Committee of Sponsoring Organizations of the Treadway Commission (COSO). Based on the assessment, management concluded that, as of July 3, 2016, its system of internal control over financial reporting was effective and met the criteria of theInternal Control—Integrated Framework. Deloitte & Touche LLP, independent registered public accounting firm, has issued an attestation report on the Corporation’s internal control over financial reporting, which is included herein.
|  | |||
| Frank J. Krejci | Patrick J. Hansen | |||
| President and | Senior Vice President and | |||
| Chief Executive Officer | Chief Financial Officer | |||
| 2016 STRATTEC Annual Report | 59 |
REPORTS
REPORT OF INDEPENDENT REGISTERED PUBLIC ACCOUNTING FIRM
To the Board of Directors and Shareholders of STRATTEC SECURITY CORPORATION:
We have audited the internal control over financial reporting of STRATTEC SECURITY CORPORATION and subsidiaries (the “Company”) as of July 3, 2016, based on criteria established inInternal Control — Integrated Framework (2013) issued by the Committee of Sponsoring Organizations of the Treadway Commission. The Company’s management is responsible for maintaining effective internal control over financial reporting and for its assessment of the effectiveness of internal control over financial reporting, included in the accompanying Report on Management’s Assessment of Internal Control over Financial Reporting. Our responsibility is to express an opinion on the Company’s internal control over financial reporting based on our audit.
We conducted our audit in accordance with the standards of the Public Company Accounting Oversight Board (United States). Those standards require that we plan and perform the audit to obtain reasonable assurance about whether effective internal control over financial reporting was maintained in all material respects. Our audit included obtaining an understanding of internal control over financial reporting, assessing the risk that a material weakness exists, testing and evaluating the design and operating effectiveness of internal control based on the assessed risk, and performing such other procedures as we considered necessary in the circumstances. We believe that our audit provides a reasonable basis for our opinion.
A company’s internal control over financial reporting is a process designed by, or under the supervision of, the company’s principal executive and principal financial officers, or persons performing similar functions, and effected by the company’s board of directors, management, and other personnel to provide reasonable assurance regarding the reliability of financial reporting and the preparation of financial statements for external purposes in accordance with generally accepted accounting principles. A company’s internal control over financial reporting includes those policies and procedures that (1) pertain to the maintenance of records that, in reasonable detail, accurately and fairly reflect the transactions and dispositions of the assets of the company; (2) provide reasonable assurance that transactions are recorded as necessary to permit preparation of financial statements in accordance with generally accepted accounting principles, and that receipts and expenditures of the company are being made only in accordance with authorizations of management and directors of the company; and (3) provide reasonable assurance regarding prevention or timely detection of unauthorized acquisition, use, or disposition of the company’s assets that could have a material effect on the financial statements.
Because of the inherent limitations of internal control over financial reporting, including the possibility of collusion or improper management override of controls, material misstatements due to error or fraud may not be prevented or detected on a timely basis. Also, projections of any evaluation of the effectiveness of the internal control over financial reporting to future periods are subject to the risk that the controls may become inadequate because of changes in conditions, or that the degree of compliance with the policies or procedures may deteriorate.
In our opinion, the Company maintained, in all material respects, effective internal control over financial reporting as of July 3, 2016, based on the criteria established inInternal Control — Integrated Framework (2013) issued by the Committee of Sponsoring Organizations of the Treadway Commission.
We have also audited, in accordance with the standards of the Public Company Accounting Oversight Board (United States), the consolidated financial statements as of and for the year ended July 3, 2016 of the Company and our report dated September 8, 2016 expressed an unqualified opinion on those consolidated financial statements.

Deloitte & Touche LLP
Milwaukee, Wisconsin
September 8, 2016
| 2016 STRATTEC Annual Report | 60 |
REPORTS
REPORT OF INDEPENDENT REGISTERED PUBLIC ACCOUNTING FIRM
To the Board of Directors and Shareholders of STRATTEC SECURITY CORPORATION:
We have audited the accompanying consolidated balance sheets of STRATTEC SECURITY CORPORATION and subsidiaries (the “Company”) as of July 3, 2016 and June 28, 2015, and the related consolidated statements of income and comprehensive income (loss), shareholders’ equity, and cash flows for each of the three years in the period ended July 3, 2016. These consolidated financial statements are the responsibility of the Company’s management. Our responsibility is to express an opinion on these consolidated financial statements based on our audits.
We conducted our audits in accordance with the standards of the Public Company Accounting Oversight Board (United States). Those standards require that we plan and perform the audit to obtain reasonable assurance about whether the consolidated financial statements are free of material misstatement. An audit includes examining, on a test basis, evidence supporting the amounts and disclosures in the financial statements. An audit also includes assessing the accounting principles used and significant estimates made by management, as well as evaluating the overall financial statement presentation. We believe that our audits provide a reasonable basis for our opinion.
In our opinion, such consolidated financial statements present fairly, in all material respects, the financial position of STRATTEC SECURITY CORPORATION and subsidiaries as of July 3, 2016 and June 28, 2015, and the results of their operations and their cash flows for the three years in the period ended July 3, 2016, in conformity with accounting principles generally accepted in the United States of America.
We have also audited, in accordance with the standards of the Public Company Accounting Oversight Board (United States), the Company’s internal control over financial reporting as of July 3, 2016, based on the criteria established inInternal Control — Integrated Framework (2013) issued by the Committee of Sponsoring Organizations of the Treadway Commission and our report dated September 8, 2016 expressed an unqualified opinion on the Company’s internal control over financial reporting.

Deloitte & Touche LLP
Milwaukee, Wisconsin
September 8, 2016
| 2016 STRATTEC Annual Report | 61 |
FINANCIAL SUMMARY
FIVE-YEAR FINANCIAL SUMMARY
The financial data for each period presented below reflects the consolidated results of STRATTEC SECURITY CORPORATION and its wholly owned Mexican subsidiary and its majority owned subsidiaries. Fiscal years 2012 through 2015 have been retrospectively adjusted for the adoption of an update to an accounting standard issued by the FASB which simplifies the presentation of deferred taxes in a classified statement of financial position by requiring that deferred tax assets and liabilities be classified as non-current. The information below should be read in conjunction with “Management’s Discussion and Analysis,” and the Financial Statements and Notes thereto included elsewhere herein. The following data are in thousands of dollars except per share amounts.
| Fiscal Years | ||||||||||||||||||||
| 2016 | 2015 | 2014 | 2013 | 2012 | ||||||||||||||||
INCOME STATEMENT DATA | ||||||||||||||||||||
Net sales | $ | 401,419 | $ | 411,475 | $ | 348,419 | $ | 298,179 | $ | 279,234 | ||||||||||
Gross profit | 64,825 | 72,660 | 65,798 | 53,866 | 50,263 | |||||||||||||||
Engineering, selling, and administrative expenses | 43,917 | 41,534 | 39,274 | 34,934 | 33,920 | |||||||||||||||
Loss on settlement of pension obligation | — | — | — | 2,144 | — | |||||||||||||||
|
|
|
|
|
|
|
|
|
| |||||||||||
Income from operations | 20,908 | 31,126 | 26,524 | 16,788 | 16,343 | |||||||||||||||
Interest income | 25 | 185 | 106 | 21 | 69 | |||||||||||||||
Equity (loss) earnings of joint ventures | (2,235 | ) | (788 | ) | 957 | (225 | ) | (1,071 | ) | |||||||||||
Interest expense | (176 | ) | (71 | ) | (45 | ) | (34 | ) | (81 | ) | ||||||||||
Other income, net | 668 | 3,481 | 272 | 329 | 582 | |||||||||||||||
|
|
|
|
|
|
|
|
|
| |||||||||||
Income before taxes and non-controlling interest | 19,190 | 33,933 | 27,814 | 16,879 | 15,842 | |||||||||||||||
Provision for income taxes | 5,068 | 9,382 | 8,674 | 5,366 | 3,589 | |||||||||||||||
|
|
|
|
|
|
|
|
|
| |||||||||||
Net income | 14,122 | 24,551 | 19,140 | 11,513 | 12,253 | |||||||||||||||
Net income attributable to non-controlling interest | 4,973 | 3,897 | 2,716 | 2,138 | 3,460 | |||||||||||||||
|
|
|
|
|
|
|
|
|
| |||||||||||
Net income attributable to STRATTEC SECURITY CORPORATION | $ | 9,149 | $ | 20,654 | $ | 16,424 | $ | 9,375 | $ | 8,793 | ||||||||||
|
|
|
|
|
|
|
|
|
| |||||||||||
Earnings per share attributable to STRATTEC SECURITY CORPORATION: | ||||||||||||||||||||
Basic | $ | 2.55 | $ | 5.80 | $ | 4.70 | $ | 2.77 | $ | 2.66 | ||||||||||
Diluted | $ | 2.51 | $ | 5.66 | $ | 4.59 | $ | 2.72 | $ | 2.64 | ||||||||||
Cash dividends declared per share | $ | 0.52 | $ | 0.48 | $ | 0.44 | $ | 0.40 | $ | 0.40 | ||||||||||
BALANCE SHEET DATA Net working capital | $ | 70,236 | $ | 63,871 | $ | 64,705 | $ | 51,507 | $ | 39,099 | ||||||||||
Total assets | $ | 242,176 | $ | 230,834 | $ | 207,909 | $ | 168,491 | $ | 166,038 | ||||||||||
Long-term liabilities | $ | 23,449 | $ | 13,698 | $ | 7,743 | $ | 5,886 | $ | 21,667 | ||||||||||
Total STRATTEC SECURITY CORPORATION Shareholders’ equity | $ | 139,332 | $ | 140,312 | $ | 125,506 | $ | 104,218 | $ | 80,552 | ||||||||||
| 2016 STRATTEC Annual Report | 62 |
FINANCIAL SUMMARY
QUARTERLY FINANCIAL DATA (UNAUDITED)
The following data are in thousands of dollars except per share amounts.
| Gross Profit | Net Income Attributable to STRATTEC | Earnings Per Share | Cash Dividends Declared Per Share | Market Price Per Share | ||||||||||||||||||||||||||||||
| Quarter | Net Sales | Basic | Diluted | High | Low | |||||||||||||||||||||||||||||
2016 | First | $ | 96,513 | $ | 16,499 | $ | 3,273 | $ | 0.92 | $ | 0.90 | $ | 0.13 | $ | 78.79 | $ | 60.19 | |||||||||||||||||
| Second | 102,511 | 18,610 | 3,403 | 0.95 | 0.93 | 0.13 | $ | 71.61 | $ | 55.17 | ||||||||||||||||||||||||
| Third | 94,048 | 14,521 | 1,889 | 0.53 | 0.52 | 0.13 | $ | 60.00 | $ | 44.62 | ||||||||||||||||||||||||
| Fourth(1) | 108,347 | 15,195 | 584 | 0.16 | 0.16 | 0.13 | $ | 60.38 | $ | 39.38 | ||||||||||||||||||||||||
|
|
|
|
|
|
|
|
|
|
|
| |||||||||||||||||||||||
| TOTAL | $ | 401,419 | $ | 64,825 | $ | 9,149 | $ | 2.55 | $ | 2.51 | $ | 0.52 | ||||||||||||||||||||||
|
|
|
|
|
|
|
|
|
|
|
| |||||||||||||||||||||||
2015 | First | $ | 122,242 | $ | 28,057 | $ | 9,300 | $ | 2.63 | $ | 2.55 | $ | 0.12 | $ | 89.87 | $ | 60.45 | |||||||||||||||||
| Second | 101,990 | 18,452 | 5,778 | 1.62 | 1.58 | 0.12 | $ | 110.96 | $ | 72.13 | ||||||||||||||||||||||||
| Third | 88,817 | 15,751 | 4,376 | 1.23 | 1.20 | 0.12 | $ | 86.98 | $ | 60.29 | ||||||||||||||||||||||||
| Fourth(2) | 98,426 | 10,400 | 1,200 | 0.34 | 0.33 | 0.12 | $ | 89.89 | $ | 60.11 | ||||||||||||||||||||||||
|
|
|
|
|
|
|
|
|
|
|
| |||||||||||||||||||||||
| TOTAL | $ | 411,475 | $ | 72,660 | $ | 20,654 | $ | 5.80 | $ | 5.66 | $ | 0.48 | ||||||||||||||||||||||
|
|
|
|
|
|
|
|
|
|
|
| |||||||||||||||||||||||
| (1) | Our 2016 fiscal fourth quarter was impacted by approximately $2.0 million of equity loss of joint ventures resulting from a $6 million impairment charge recognized by VAST LLC related to its Minda-VAST Access Systems joint venture in India. STRATTEC’s portion of this impairment charge totaled $2 million. |
| (2) | Our 2015 fiscal fourth quarter was impacted by approximately $8.5 million of customer warranty provisions for expected warranty payments to be settled in future periods. Also impacting our 2015 fiscal fourth quarter was an equity loss from our investment in our SAL LLC joint venture of $1.1 million. Notwithstanding the existence of the SAL Credit Facility described herein, as a result of STRATTEC’s guarantee of such credit facility and as a result of borrowing limitations imposed by the bank under such credit facility, even though we maintain a 51 percent ownership interest in SAL LLC, effective with our fiscal 2015 fourth quarter, 100 percent of the funding for SAL LLC was being made through loans from STRATTEC to SAL LLC in addition to the credit facility guarantee. Therefore, STRATTEC began recognizing 100 percent of the losses of SAL LLC up to our committed financial support in our Consolidated Statements of Income and Comprehensive Income beginning with our 2015 fiscal fourth quarter. In addition, the following losses are included in our 2015 fiscal fourth quarter equity loss of joint ventures for SAL LLC (thousands of dollars): |
Loss on Guarantee of SAL LLC Vendor Contract | $ | 123 | ||
Loss on Loan to SAL LLC | $ | 100 | ||
Loss on Guarantee of SAL LLC Credit Facility | $ | 121 |
Registered shareholders of record at July 3, 2016, were 1,285.
| 2016 STRATTEC Annual Report | 63 |
PERFORMANCE GRAPH
The chart below shows a comparison of the cumulative return since July 3, 2011 had $100 been invested at the close of business on July 3, 2011 in STRATTEC Common Stock, the NASDAQ Composite Index (all issuers), and the Dow Jones U.S. Auto Parts Index.
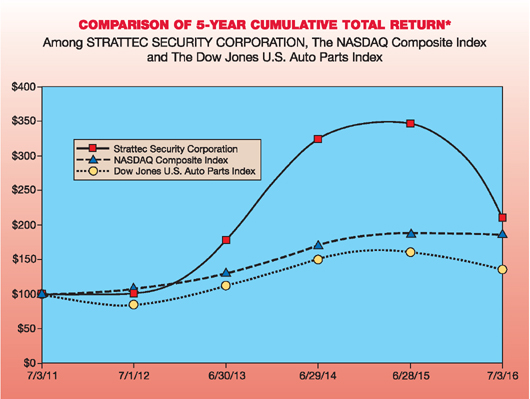
| 7/3/11 | 7/1/12 | 6/30/13 | 6/29/14 | 6/28/15 | 7/3/16 | |||||||||||||||||||
STRATTEC Security Corporation** | 100.00 | 101.36 | 183.13 | 326.57 | 349.44 | 212.50 | ||||||||||||||||||
NASDAQ Composite Index | 100.00 | 108.58 | 128.19 | 169.08 | 192.10 | 187.57 | ||||||||||||||||||
Dow Jones U.S. Auto Parts Index | 100.00 | 77.15 | 110.67 | 150.43 | 162.17 | 141.30 | ||||||||||||||||||
| * | $100 invested on 7/3/11 in stock or in index, including reinvestment of dividends. Indexes calculated on a month-end basis. |
| ** | The Friday fiscal year end closing price of STRATTEC Common Stock on July 1, 2011 was $21.13, the closing price on June 29, 2012 was $21.04, the closing price on June 28, 2013 was $37.36, the closing price on June 27, 2014 was $66.06, the closing price on June 26, 2015 was $70.26 and the closing price on July 1, 2016 was $42.33. |
| 2016 STRATTEC Annual Report | 64 |