A Winning Combination for Shareholders and Customers June 6, 2005 Exhibit 99.2 |
Focused Credit Card Lender to Mainstream America Leading National Financial Retailer to the Broad Middle Market 6th Largest Retail Bank 9th Largest Credit Card Company Compelling Strategic Fit 2 |
Consideration Value 0.45 WaMu shares Implied Per Share Value $18.71 Consideration Mix 89% Washington Mutual Stock / 11% Cash Total Transaction Value $6.45 Billion Termination Fee $225 Million Caps and Collars None Implied Transaction Multiples 10.7x 2006 GAAP EPS 1.93x 3/31/05 Book Value Tax Treatment Tax-free reorganization; except for cash received Management Strategy All top managers have been retained Approvals Regulatory and Providian shareholder approval Expected Closing 4th Quarter 2005 Due Diligence Completed Transaction Overview Note: Implied value based on WaMu's closing price of $41.57 on Friday, June 3, 2005. |
Strategically Compelling Combination Strengthens WaMu's leadership position with middle market consumers Accelerates card growth through WaMu's national distribution and customer base Builds on WaMu's payments position in debit cards (#3) Strong card platform with proven management team Diversifies portfolio and earnings Improves risk-adjusted profitability and adds recurring fee income Turn-key transaction: low risk execution and good cultural fit Significant funding and capital advantages for Providian's card business Financially attractive transaction |
WaMu Profile Leading retailer of financial services for consumers and small businesses Well positioned in key growth markets Innovative and successful retail bank Top tier prime and non-prime mortgage lender Nation's leading multi-family lender Strong track record in credit risk management Attractive history of dividend growth Building momentum in productivity and efficiency |
National Multi-Channel Distribution Network Retail Mortgage Lending Wholesale, Correspondent and/or Consumer Direct Mortgage Lending Multi-Family Markets 1,968 Retail Banking Stores 341 Retail Mortgage Offices 40 Mutli-family Lending Offices 3,389 ATMs Online Banking: wamu.com Retail Banking and Home Loan Offices in 29 of top 50 MSAs As of 3/31/2005 |
Providian Profile National marketing program Full spectrum focus Broad product array Data driven strategy Multi-channels Balanced result National marketing program Full spectrum focus Co-branded and affinity Limited # of partners Proprietary and cooperative issuance Balanced result Strong Brand, Innovative Products and Services Superior Customer Care Efficient Balance Sheet and Operations Partnership Marketing Providian Marketing Retail marketing program Full spectrum focus Full retail integration Customer direct response Small business program Specialty programs Balanced result Retail Bank Marketing Current Two-Pronged Strategy "Enhanced" Growth Strategy |
Providian's Focus on the Broad Middle Market Source: Providian Prospect Database. Providian-Branded Partnership 600-619 0.078 0.045 620-639 0.151 0.115 640-659 0.182 0.14 660-679 0.167 0.155 680-699 0.134 0.142 700-719 0.108 0.115 720-739 0.0775 0.09 740-759 0.045 0.07 760-779 0.028 0.06 780-799 0.013 0.05 800-819 0.004 0.03 FICO Scores |
Managed Portfolio Old New Total 2 0 16934 16934 3 0 16676 16676 4 0 17245 17245 5 0 17901 17901 6 0 18536 18536 Providian - A Proven Asset Generator 12/31/03 3/31/04 6/30/04 9/30/04 12/31/04 9.5% growth Note: Receivables on a managed basis. ($ in millions) |
Providian's Improving Credit Performance ($ in millions) 30+ Delinquency Rate 30 - 59 Days 60 - 89 Days 90+ Days Total 2001 0.0881 975 625 1273 2873 2002 0.1111 700 500 980 2180 2003 0.0929 475.097 364.023 734.107 1573.227 2004 0.0616 353.055 262.683 525.739 1141.477 Q1 '05 0.0516 273.235 210.014 450.167 933.416 Managed Net Credit Loss Rate Net Credit Losses 2001 0.1078 3217 2002 0.1629 3525 2003 0.1582 2798 2004 0.1165 2004 Q1 '05 0.0843 379 ($ in millions) Managed Delinquencies Managed Net Credit Losses |
Potential Revenue Opportunities from Combined Operations As of March 2005 11.7M Retail and Mortgage Households 1,968 Retail Banking Stores 9.2M Debit Cards $136B Retail Deposits $46B Home Equity 2.1M On-line Retail Customers 9.4M Credit Cards Sophisticated Direct Mail Partnership Networks Strong Web Presence Rewards Program 11 |
Providian Has a Proven Management Team Name Position Years with Providian Industry Experience Industry Experience Joseph Saunders President, CEO and Chairman 3 years 21 years Fleet Credit Card - CEO and Chairman (1997-2001) Household Credit Services - Head of credit card operations; various executive positions Anthony Vuoto CFO and Vice Chairman 3 years 20 years First USA Bank Citibank Chaomei Chen Vice Chairman - Credit and Collections 21/2 years 9+ years Fleet Credit Card PNC National Bank Household Credit Services American Express Citicorp Susan Gleason Vice Chairman - Operations & Technology 3 years 25+ years Fleet Credit Card Household Credit Services Richard Leweke Vice Chairman and Chief Human Resources Officer 2 years 13 years California Federal Bank Ford Motor Company Ellen Richey General Counsel, Secretary, and Vice Chairman - Enterprise Risk Management 10+ years 11 years Farella, Braun & Martel Warren Wilcox Vice Chairman - Marketing and Strategic Planning 3 years 20+ years Fleet Credit Card Household Credit Services Fair, Isaac and Company Citigroup |
WM Standalone Percentage Prime SFR 0.53 HE & HELOCS 0.21 Multifamily 0.11 Non-Prime SFR 0.1 Other Loans 0.05 Providian Diversifies WaMu's Loan Portfolio WM Standalone - $214B 1 Reflects Providian managed credit card receivables. WM Pro Forma with Providian - $232B WM Pro Forma with Private Percentage Prime SFR 0.48 HE & HELOCS 0.2 Multifamily 0.1 Non-Prime SFR 0.09 Credit Cards 0.08 Other Loans 0.05 1 As of 3/31/2005 |
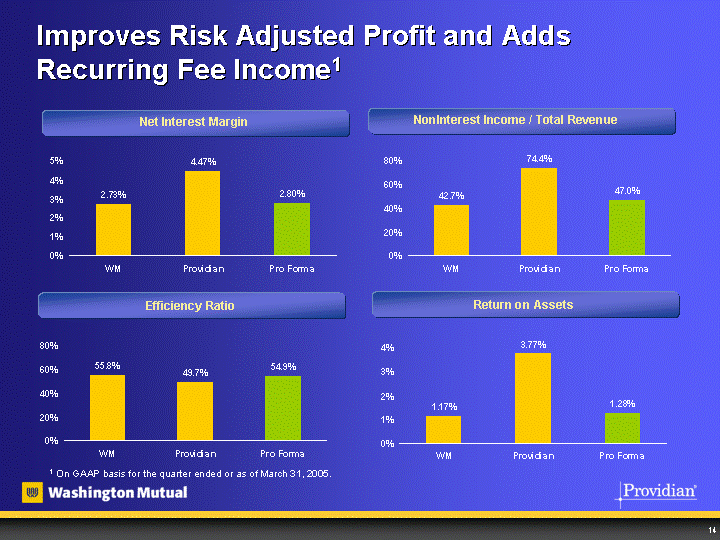
Improves Risk Adjusted Profit and Adds Recurring Fee Income1 NIM WM 0.0273 Providian 0.0447 Pro Forma 0.028 Efficiency Ratio WM 0.558 Providian 0.497 Pro Forma 0.549 Efficiency Ratio Net Interest Margin Fee Income / Revenue Fourth Fifth Sixth Seventh Eighth WM 0.427 3961 2876 1297 466 267 Providian 0.744199686 3691 2876 1027 1333 303 Pro Forma 0.47 NonInterest Income / Total Revenue 1 On GAAP basis for the quarter ended or as of March 31, 2005. Return on Assets ROAA WM 0.0117 Providian 0.0377 Pro Forma 0.0128 |
WB STI WM Pro Forma NCC USB BAC WFC JPM C East 0.0008 0.0013 0.0022 0.0031 0.0053 0.0068 0.0071 0.0082 0.0137 Lower Credit Risk than Banking Peers Pro Forma Net Charge-Off Ratio 1 1 On GAAP basis annualized data for Q1 2005. Source: SNL DataSource 0.22% |
Low Risk Execution and Good Cultural Fit No distraction to WaMu's ongoing business initiatives Continuity of strong Providian management team Joe Saunders to lead business All top managers have been retained Plans in place to retain substantially all employees Operate Providian as fourth major business unit of WaMu Reporting to President and COO, Steve Rotella Include Providian team on key WaMu governance committees Merge Providian National Bank into Washington Mutual Bank |
Integration Approach Low degree of difficulty compared to past acquisitions Developed preliminary work plan during comprehensive due diligence No change in operation of Providian's core credit card competencies Establishing Merger Integration Office Apply WaMu's project management methodology Connect financial reporting, treasury and risk management functions Leverage WaMu's support and governance structures Complete development of point of sale and cross sale linkages to retail banking and home loans Merger Sponsors Steve Rotella/Joe Saunders Integration Responsibility WaMu and Providian Leaders Merger Integration WaMu and Providian Leaders |
WaMu Unlocks Additional Value at Providian Reduced Liquidity Requirements Improves Profitability Eliminate negative spread on $4.8 billion in current liquidity portfolio Funding Advantage WaMu diversified funding base reduces costs and funding risk WaMu investment grade rating reduces costs Improved securitization execution Better access to prime customer segment space Capital levels exceeded industry benchmarks Consolidation with WaMu allows release of excess capital |
Projected earnings based on First Call mean estimates for WaMu and Providian1 Expected savings - $60 million pre-tax 8% of Providian's non-marketing related cost base Phased in 65% in 2006 and 100% thereafter Funding synergies - $48 million pre-tax Related to re-pricing Providian's wholesale deposit funding over time Elimination of its liquidity pool Tangible equity to exceed new minimum target of 5.50% for the projections period Expected revenue enhancements from WaMu distribution channels not included Transaction and other integration-related charges of approximately $200 million to be charged to goodwill Intangibles created in transaction include: Transaction Assumptions 1 Consensus EPS estimates as of June 3, 2005 are $3.61 and $1.59 for 2005, and $3.95 and $1.75 for 2006, for WaMu and Providian, respectively. 2007 EPS estimates use WaMu's long term growth rate of 10% (Source: First Call). 2 PCCR stands for Purchased Credit Card Relationships. Intangible Amount Period PCCR2 $550 million 10 Years Partnerships & Other $45 million 3-5 Years Goodwill $3.1 billion NA |
Pro Forma Earnings Impact ($ in millions, all figures are after-tax) Projections for Fiscal Year Earnings Projections 2006E 2007E WaMu Stand-alone $3,513 $3,854 Providian Stand-alone 585 644 Balance Sheet Synergies 27 29 Cost Saves 24 36 PCCR & Other Purchase Accounting Adjustments (69) (61) Pro Forma Earnings $4,079 $4,502 1 1 1Based on First Call consensus estimates as of June 3, 2005. Providian Pro Forma 567 648 Providian Pro Forma as a % of Total Pro Forma 13.9% 14.4% |
Pro Forma EPS Impact Projections for Fiscal Year Earnings Projections 2006E 2007E Current First Call EPS Estimates 1 WaMu Stand-alone $3.95 $4.35 Pro Forma GAAP EPS $3.99 $4.44 Accretion to Washington Mutual ($) $0.04 $0.09 Accretion to Washington Mutual (%) 1.1% 2.1% Cash EPS WaMu Stand-alone $3.99 $4.38 Pro Forma Cash EPS $4.09 $4.52 Accretion to Washington Mutual ($) $0.10 $0.14 Accretion to Washington Mutual (%) 2.5% 3.2% 1Based on First Call consensus estimates as of June 3, 2005. Average Shares2 WaMu Stand-alone 889 887 Pro Forma 1,022 1,016 2Share buy back to maintain targeted capital levels |
Updated Five Year Financial Targets ROACE1 High teens Earnings per share growth1 Double digit Efficiency ratio1 < 50% NPA/total assets2 < 1% Tangible equity/total tangible assets2 > 5.50% Targets 2005 - 2009 1 Average over the cycle 2 Period end |
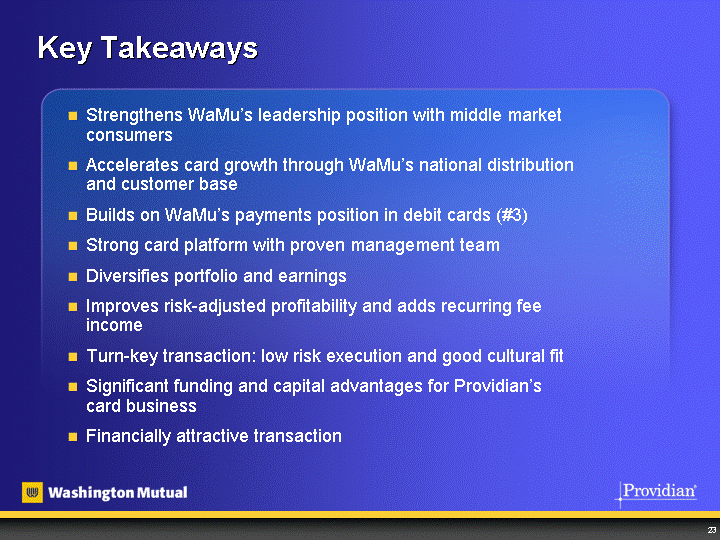
Key Takeaways Strengthens WaMu's leadership position with middle market consumers Accelerates card growth through WaMu's national distribution and customer base Builds on WaMu's payments position in debit cards (#3) Strong card platform with proven management team Diversifies portfolio and earnings Improves risk-adjusted profitability and adds recurring fee income Turn-key transaction: low risk execution and good cultural fit Significant funding and capital advantages for Providian's card business Financially attractive transaction |
Appendix |
Pro Forma Balance Sheet / Capital Ratios Based on financial data as of March 31, 2005. |
GAAP to Cash Reconciliation Projections for Fiscal Year Earnings Projections 2006E 2007E Pro Forma GAAP Earnings $4,079 $4,502 Add Back: PCCR Amortization 60 54 Partnership Alliances 6 6 Subtract: Liability Mark-to-market ($10) ($10) Cash Earnings $4,182 $4,595 1Based on First Call consensus estimates as of June 3, 2005. Non-Compete Agreements 4 4 Deferred Acquisition Costs and Prepaid Securities Fees 8 6 Debt Issuance Costs 1 1 WaMu Standalone Intangible Amortization $34 $32 |
Transaction Disclosure In connection with the proposed transaction, Washington Mutual, Inc. and Providian Financial Corporation will prepare a registration statement on Form S-4 containing a proxy statement/prospectus for the stockholders of Providian to be filed with the SEC. Investors are urged to read the proxy statement/prospectus regarding the proposed transaction when it becomes available, because it will contain important information. The registration statement containing the proxy statement/prospectus and other documents will be available free of charge at the SEC's Internet site: (http://www.sec.gov). The registration statement containing the proxy statement/prospectus (when it is available) and the other documents may also be obtained for free by accessing Washington Mutual's website at www.wamu.com under the tab "About WaMu" and then under the heading "Investor Relations" or by accessing Providian's website at www.providian.com under the tab "About Providian" and then under the heading "Investor Relations." Information regarding the persons who may, under the rules of the SEC, be considered participants in the solicitation of Providian shareholders in connection with the proposed transaction will be set forth in the proxy statement/prospectus filed when it is filed with the SEC." |
Forward Looking Disclosure Statements contained in these materials which are not historical facts are forward-looking statements within the meaning of the Providian Securities Litigation Reform Act of 1995. These forward-looking statements include, but are not limited to, statements about the benefits of the merger between Washington Mutual, Inc. and Providian Financial Corporation, including future financial and operating results and performance; statements about Washington Mutual's and Providian's plans, objectives, expectations and intentions with respect to future operations, products and services; and other statements identified by words such as "expects," "anticipates," "intends," "plans," "believes," "seeks," "estimates", "will", "should", "may" or words of similar meaning. These forward-looking statements are based upon the current beliefs and expectations of Washington Mutual's and Providian's management and are inherently subject to significant business, economic and competitive uncertainties and contingencies, many of which are difficult to predict and generally beyond the control of Washington Mutual and Providian. In addition, these forward-looking statements are subject to assumptions with respect to future business strategies and decisions that are subject to change. Actual results may differ materially from the anticipated results discussed in these forward-looking statements. The following factors, among others, could cause actual results to differ materially from the anticipated results or other expectations expressed in the forward-looking statements: (1) the businesses of Washington Mutual and Providian may not be combined successfully, or such combination may take longer, be more difficult, time-consuming or costly to accomplish than expected; (2) the expected growth opportunities and cost savings from the merger may not be fully realized or may take longer to realize than expected; (3) operating costs, customer losses and business disruption following the merger, including adverse effects on relationships with employees, may be greater than expected; (4) governmental approvals of the merger may not be obtained, or adverse regulatory conditions may be imposed in connection with governmental approvals of the merger; (5) the stockholders of Providian may fail to approve the merger; (6) adverse governmental or regulatory policies may be enacted; (7) competition from other financial services companies in Washington Mutual's and Providian's markets; and (8) general business and economic conditions, including movements in interest rates, which could adversely affect credit quality and loan originations. Additional factors that could cause actual results to differ materially from those expressed in the forward-looking statements are discussed in the 2004 Annual Reports on Form 10-K of Washington Mutual and Providian filed with the Securities and Exchange Commission and available at the SEC's Internet site (http://www.sec.gov). Neither Washington Mutual nor Providian undertakes any obligation to update any forward-looking statements to reflect circumstances or events that occur after the date on which each statements were made. |