Exhibit 99.1

| Prepared Remarks — October 17, 2007 | Page 3 |
While customer growth and fee revenue growth continue on track, weakness in the housing and credit markets resulted in a $227 million increase in the Retail Bank’s loan loss provision for the quarter, depressing the segment’s net income for the quarter to $453 million, compared to $555 million in the third quarter of last year.

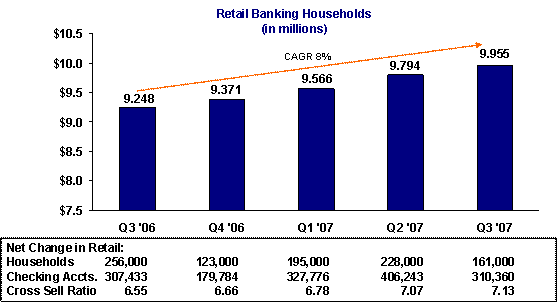
Our Retail Bank continues to drive solid household growth through all of its products, in stores and online, growing retail banking households 8 percent year over year and increasing the cross sell ratio to 7.13 from 6.55 in the third quarter of a year ago.
Our small business program continues to deliver good results, adding 69,000 net new checking accounts during the third quarter and increasing average deposits to $8.8 billion up 22 percent from the third quarter of 2006.
Page 10
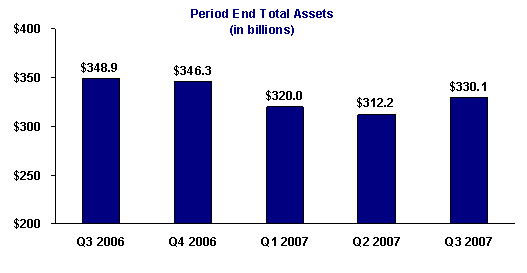
In the third quarter, this funding flexibility allowed us to increase the loan portfolio by $22 billion, including the $17 billion of warehouse loans we moved to portfolio as I discussed earlier. We also more than doubled the level of our cash and cash equivalents to $11.4 billion to further strengthen our liquidity position during this period of extreme market volatility. The result was an increase in quarter-end assets of about 6 percent to $330 billion.
During the third quarter, home loan originations of $22.3 billion were down 28 percent, primarily due to lower home refinancing activity. Conforming originations totaled 43 percent of the quarter’s origination volume but increased to 51 percent for the month of September. Going forward, we see origination growth slowing but the quality of additions to the portfolio continuing to improve. We also anticipate the level of loan prepayments to decline as the housing market slows and, therefore, expect to see less runoff of our existing loan portfolio.
Yield Curve and Net Interest Margin
Net interest income of $2.0 billion for the quarter was down $20 million on a linked quarter basis, as the one percent increase in average interest-earning assets mostly offset a 4 basis point decline in the net interest margin. The slight decline in net interest margin in the quarter was the result of higher-cost wholesale borrowings funding the quarter’s asset growth, diminishing the relative contribution of our noninterest bearing deposits to our net interest margin.
Our primary short-term funding from the FHLB and wholesale borrowings from other sources continue to be indexed to 3-month LIBOR. Although the Fed Funds rate was cut 50 basis points on September 18th, we have not seen the full benefit because the capital markets disruption has resulted in a significant widening in the spread between Fed Funds and 3-month LIBOR. Historically, 3-month LIBOR has tracked approximately 10 to 30 basis points above the Fed Funds rate but at quarter end this spread had widened to 48 basis points. We expect this difference to diminish as capital markets normalize, but until it does our funding costs will remain somewhat higher.
Page 11

Capital and Liquidity
As I mentioned previously, we have proactively managed our assets and diversified our funding and capital over the past 15 months. We ended the quarter with a tangible capital ratio of 5.61 percent, in excess of our target of 5.50 percent. As I mentioned previously we doubled our cash position during the quarter, which depressed our tangible capital ratio somewhat but it also pre-funded a portion of our anticipated fourth quarter asset growth.
With that, let’s transition to updating our 2007 earnings driver guidance.
Earnings Driver Guidance
This update of our earnings drivers for 2007 reflects the current environment and our expectations for the remainder of the year.
2007 Earnings Driver Guidance |
Driver | July 2007 Guidance | October 2007 Guidance |
1) Average assets | 5% — 7% decline |
2) Net interest margin | 2.85% - 2.95% |
3) Credit provisioning | $1.5 — $1.7 billion | $2.7 — 2.9 billion |
4) Depositor and other retail banking fees | 12% — 14% growth |
5) Noninterest income | $6.9 — $7.1 billion | $6.4 - $6.5 billion |
6) Noninterest expense | $8.4 - $8.5 billion |
Average Assets
Through the first nine months of the year, average assets were down 7 percent from 2006. With only one quarter to go, we don’t expect the average to change much. In the fourth quarter, we expect to grow the balance sheet by about $5 billion bringing total assets up to about $335 billion.