Washington Mutual, Inc.
Prepared Remarks for Fourth Quarter 2005 Earnings Conference Call
January 18, 2006
Please see the Forward-Looking Statement at the end of this document
 | Remarks of Kerry Killinger Chairman and CEO |
Good afternoon everyone and thank you for joining us. This afternoon I’ll review our performance for the fourth quarter and the full year of 2005.
As Alan mentioned, joining me on the call is Steve Rotella, our President and COO and Tom Casey, our CFO.
Before we get started, I’d like to point out a couple of changes we made this quarter to improve our communications with you. As I hope you saw on our web site, we have added charts and graphs to our prepared remarks to help illustrate our performance. And for the first time, we have posted those comments in advance of the call so that you can more easily follow our presentation.
Now, let’s get started.
Fourth Quarter 2005 Earnings
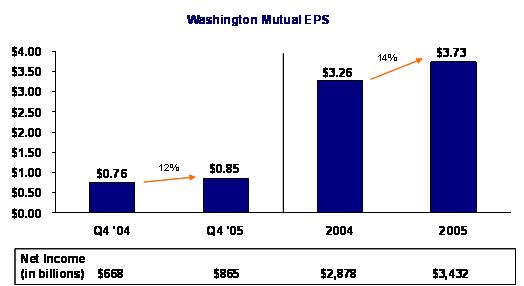
Earlier this afternoon, we announced another solid quarter’s earnings, with net income of $865 million, or 85 cents per diluted share. On a per-share basis, these earnings represented a 12 percent increase over last year’s fourth quarter results.
For the full year, our net income totaled $3.4 billion, or $3.73 per diluted share, up 14 percent on a per-share basis from 2004.
Reflecting our positive outlook about the future and our continued solid performance, I am pleased to announce that our Board of Directors once again increased the cash dividend by a penny to 50 cents per share. This represents the 42nd consecutive
quarter that the cash dividend has been increased.
| | | |
| | | |
| | | |
| | | |
 | | Prepared Remarks - January 18, 2006 | Page 2 |
As you heard from us several times since the third quarter, we were expecting the operating environment for mortgage banking to be much more challenging during the fourth quarter. In particular, we anticipated that intense competitive pressure in both the prime and subprime businesses would put pressure on gain on sale margins. In addition, we forecasted that a flatter yield curve would result in significantly higher risk management costs of our mortgage servicing rights.
And this is exactly what happened, and our results reflect it.
So, although our EPS came in below last quarter, we saw the challenges that faced us going into the quarter and delivered solid performance despite them. We are comfortable with 2005’s financial performance and the progress we have made in all of our business segments. During the past year each of our businesses drove net income growth and continued to improve the productivity of their operations.
Let me now recap the performance of our business segments for this past quarter and year.
Retail Banking
First, Retail Banking
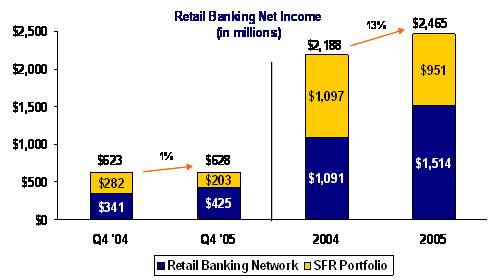
For the year, Retail Bank net income was $2.5 billion, up 13 percent from the year before.
If you just look at the contribution to net income from our retail banking network, as depicted in the chart on page 3 of our written comments, it was up 39 percent to $1.5 billion in 2005 from the prior year, while the contribution to net income attributable to the SFR portfolio declined 13 percent year-over-year to $951 million due to the continued rise in short-term interest rates.
That very solid 39 percent increase reflects the continued strong momentum of our retail banking network.
For the fourth quarter, total Retail Bank net income was $628 million and up only slightly from the same quarter of 2004. Again, the continued strong underlying operations of the retail banking network, which contributed $425 million to net income in the quarter, up 25% from the same quarter of 2004, more than offset the net interest margin compression in the single-family residential portfolio. It’s important to note that the earnings on the portfolio are expected to recover once short-term interest rates stabilize and the portfolio, which is primarily comprised of loans priced on a moving treasury average, fully reprices.
| | | Prepared Remarks - January 18, 2006 | Page 3 |
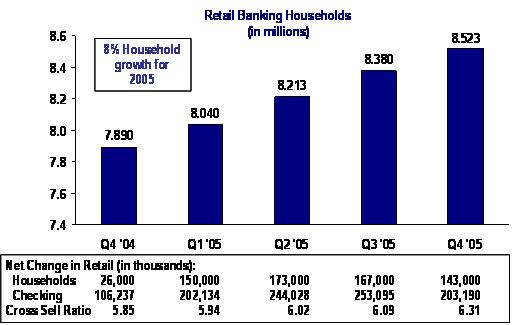
As we’ve said many times before, household growth is a key driver of our retail banking strategy with a focus on establishing the customer’s core transaction account. During the fourth quarter we added 143,000 net new retail banking households to total 8.5 million at the end of the year, an increase of 8 percent over the past twelve months.
Also during the quarter, our retail stores opened more than 203,000 net new checking accounts, up 91 percent from the fourth quarter of 2004. The increase is largely attributed to strong growth in free checking and momentum in attracting small businesses relationships - both areas of continued focus.
Moving to deposits, average retail deposit balances grew $1.5 billion or 1 percent during the fourth quarter, which is traditionally a slower deposit growth period because of seasonal spending.
| | | Prepared Remarks - January 18, 2006 | Page 4 |
For the full year, average retail deposits grew $6.6 billion or 5 percent. We continue to grow our deposits in a cost-effective manner and were successful in this effort in 2005. For the year, our cost of total average deposits increased by only 77 basis points despite a 200 basis point rise in the Federal Funds rate.
We told you last quarter that we would market credit cards to our existing Washington Mutual customers as soon as possible and that we were optimistic about the sales potential. I am pleased to tell you today that our marketing efforts have exceeded all of our initial projections so far. After just a few weeks of marketing in the fourth quarter, Card Services added 160,000 WaMu retail card accounts from our Retail Banking customer base. As expected our customers have been very receptive to the idea of having a WaMu credit card.
As the heart of our business operations, the Retail Bank continues to drive high quality, sustainable earnings and we are very confident in our ability to continue to prosper in this very competitive industry.
And we will continue to invest in our retail banking network.
For example, during the fourth quarter we opened 95 retail banking stores, bringing us to a total of 210 new stores for the year. In 2006 we plan to continue our “in market” store expansion targeting between 150 and 200 new stores for the year.
Card Services
Shifting to our newest business line, Card Services -- during its first quarter of operations our team turned in excellent results, generating net income of $166 million. And our integration process continues on target.
The profitability in the quarter demonstrates the continued success our credit card team has had in building and running a solid card franchise in what has always been an extremely competitive space.
As you know, the fourth quarter represented the first quarter that Card Services was under the WaMu umbrella.
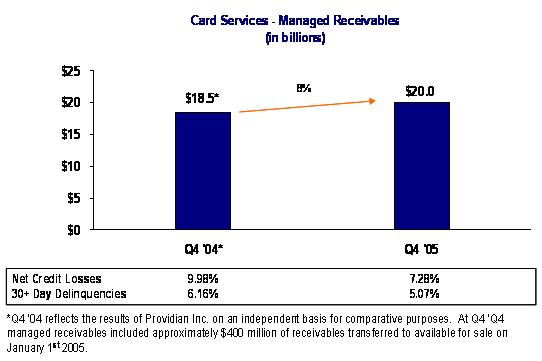
During that time, we had the inaugural kick-off of specific marketing programs targeting WaMu retail customers. The results for the quarter were very encouraging. Our total managed receivables increased by close to $700 million in the period, or an annualized growth rate of 14 percent. As I mentioned earlier, a significant portion of this growth was the direct result of cross selling cards to Washington Mutual’s retail customer base.
| | | Prepared Remarks - January 18, 2006 | Page 5 |
Credit surfaced as an issue of concern for the card industry during the fourth quarter as there was a historically high level of bankruptcy filings in anticipation of the implementation of the new bankruptcy laws in October. However, the credit quality of our card portfolio continued to be very strong.
Specifically, managed net credit losses, at 7.28 percent, were flat with the third quarter and 30-plus day managed delinquency rate ended the period at 5.07 percent, up slightly from the third quarter.
While we are pleased with our performance thus far, we will continue to focus on managing our credit risks in this group appropriately, as a critical factor for success in the credit card industry.
It’s very clear to us that the Card Services group is an excellent fit for Washington Mutual and meets a critical product need for our customers. We continue to be very pleased with the management team and are comfortable that we will meet - or exceed - the accretion estimates we projected for this acquisition.
Commercial Group
Our third business line is the Commercial Group, which generated net income of $164 million, up 21 percent from the same quarter last year. Net income for the full year of 2005 totaled $750 million up 13 percent from 2004.
| | | Prepared Remarks - January 18, 2006 | Page 6 |
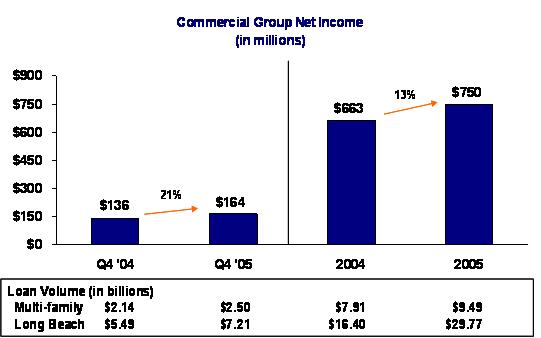
Our industry leading multi-family lending business continued to deliver strong growth and asset quality. Multi-family lending volume of $2.5 billion was up 17 percent from the same quarter a year earlier.
Multi-family lending for the year totaled $9.8 billion and pushed our loans outstanding to $25.6 billion at the end of the quarter, up 15 percent over the past 12 months.
And the credit quality of our multi-family portfolio continued to be extremely high with nonperforming loans to total loans remaining at about 9 basis points.
The subprime lending environment continues to be challenging with narrowing margins and the anticipation of a less favorable credit environment. Long Beach Mortgage spent much of 2005 focused on driving greater efficiency and leveraging its scale. This paid off in total loan volume of $29.8 billion for 2005 up 81 percent from 2004. In 2006 we are continuing to drive further productivity. In addition, in the fourth quarter we announced that we were moving Long Beach Mortgage and Mortgage Banker Finance into our Home Loans segment under the leadership of David Schneider - our President of our Home Loans group. We expect this to offer significant efficiency and opportunities to leverage our distribution channels.
Home Loans
Finally, I’d like to talk about our Home Loans business.
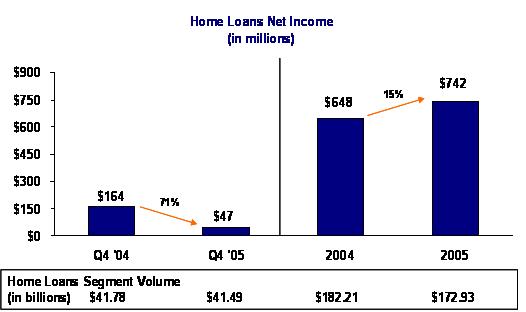
As predicted, our Home Loans net income for the fourth quarter of $47 million was down from $164 million for the same quarter last year.
The primary driver for the decrease was the increased cost of MSR risk management activities due to the flat interest rate environment.
It is important to note that while our risk management strategy was effective during the quarter the interest rate environment was not as favorable as in prior quarters during the year. Tom will go into more detail on the MSR, but we expect the interest rate environment in 2006 will continue to present challenges to our MSR risk management activities.
Despite the more challenging MSR environment in the fourth quarter, for the year net income for our Home Loans group totaled $742 million for 2005, up 15 percent over 2004.
| | | Prepared Remarks - January 18, 2006 | Page 7 |
Over the course of 2005, we essentially rebuilt our Home Loans operation and added significant senior management. Year over year, the team reduced annual expenses by nearly $350 million, while growing the sales force of retail loan officers by approximately 500.
Our ultimate goal is to be “best in class” in both our origination and servicing as well as to have a nimble cost structure that can effectively adjust to changing market conditions. We are making good progress toward that goal.
Summary
To wrap everything up, I believe our performance for 2005 was strong given the challenging operating environment. Each of our businesses made significant progress in growing their business lines and improving their productivity. We have a strong platform with the right management team to capitalize on the opportunities we expect in 2006.
I’ll now turn it over to Tom to go into more specifics on our financial performance.
| | | Prepared Remarks - January 18, 2006 | Page 8 |
Washington Mutual, Inc.
Prepared Remarks for Fourth Quarter 2005 Earnings Conference Call
January 18, 2006
 | Remarks of Tom Casey Executive Vice President and CFO |
Thank you, Kerry.
Our performance for the fourth quarter showed strong progress in most of our business lines but also was challenged by the changing interest rate environment. The quarter was highlighted by the addition of our Card Services Group, which had strong earnings and added a significant new core product for our customers. On the challenging front, continued rising short-term interest rates and a flat yield curve impacted both our net interest margin and the cost of our MSR risk management.
Asset Growth and Net Interest Margin
Let’s start by recapping our asset growth and net interest margin. The addition of the Card Services Group helped drive a $23 billion or a 7 percent increase in average assets during the fourth quarter. Over the course of 2005 average assets grew $43 billion or 15 percent. As we have discussed in the past, we continue to remix our balance sheet toward assets with higher risk-adjusted yields than single-family residential loans. In addition to credit card loans, the average balances of several other targeted loan categories were up sharply. Home equity average balances were up $12 billion or 34%, specialty mortgage finance average balances grew nearly $5 billion or 30% and multi-family average balances outstanding increased $3 billion or 14%.
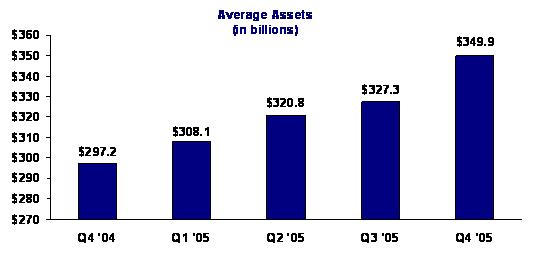
During 2005 our average asset growth helped offset the impact of margin compression caused by rising short-term interest rates. The net result was an 11 percent increase in net interest income over 2004.
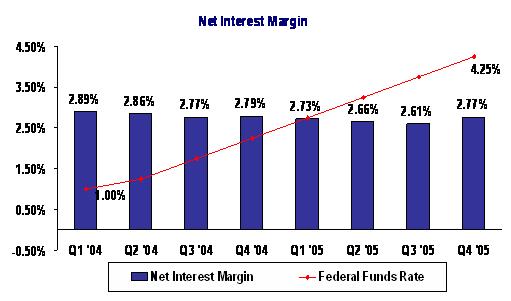
In the fourth quarter, the higher yielding credit card loans also helped offset margin compression in the remainder of our portfolio. As a result our net interest margin expanded to 2.77 percent compared to 2.61 percent in the third quarter with the yield on interest earning assets increasing 51 bps while the cost of interest bearing liabilities increased only 37 bps.
There continues to be significant speculation in the market that the Fed may be near the end of its current cycle of rate tightening. We can’t predict when short-term rates will stabilize, but once they do, we expect our net interest margin to recover over the course of about four quarters as our adjustable-rate loans fully reprice to market interest rates.
| | | Prepared Remarks - January 18, 2006 | Page 9 |
Credit
Turning to credit, our loan loss provision for the quarter was $121 million compared to net charge-offs of $137 million. Credit cards which are new to our portfolio this quarter had an average yield of 11.96 percent but also a higher degree of credit risk. In the fourth quarter $99 million of the provision was related to credit card loans. The remaining provision of $22 million related to the balance of the portfolio and was in line with the third quarter provisioning which included a $37 million special provision for potential hurricane-related losses.
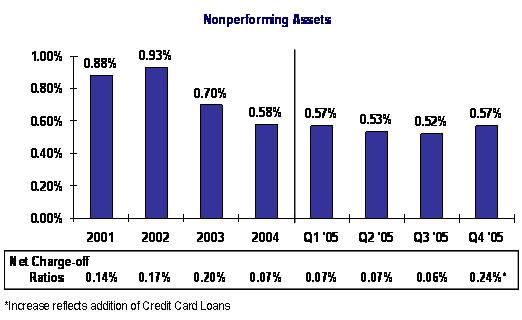
Nonperforming assets of $2 billion grew $241 million during the quarter due to an increase in nonaccrual single family home loans. A portion of this increase was due to delinquencies from loans in hurricane impacted areas.
Despite this increase, nonperforming assets totaled only 57 basis points of total assets at year end. This level is below our target of 1 percent over the five year cycle and was up only 5 basis points from 52 basis points at the end of the third quarter. The third quarter NPA ratio represented a five year low for the company. Our credit quality continued to be strong through most of 2005; but we continue to proactively manage our portfolio to minimize credit risk, understanding that a more difficult environment may be ahead of us.
| | | Prepared Remarks - January 18, 2006 | Page 10 |
Noninterest Income
Let’s move on to noninterest income which increased $219 million on a linked quarter basis primarily due to the addition of Card Services partially offset by higher costs associated with MSR risk management.
Card services generated $313 million in revenue from sales and servicing of loans as well as $139 million in card fees.
Depositor and other retail banking fees demonstrated strong momentum in 2005. You might remember after the first quarter we lowered our expectations for deposit fee income from 10 percent to a range of 8-10 percent. Our fourth quarter retail banking fees were up 14 percent from last year’s fourth quarter, bringing our 2005 growth to 10% and carrying strong momentum into 2006.
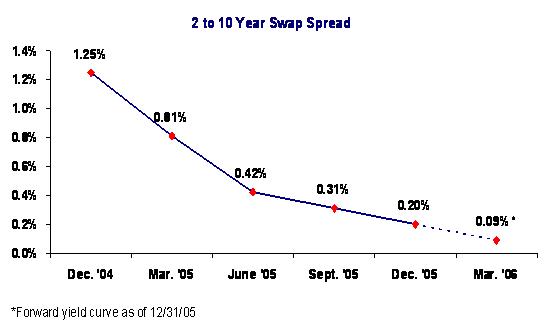
As anticipated and discussed with you during our last quarter’s call, rising short-term interest rates and a flat yield curve added significantly to the cost of managing our MSR risks, during the quarter. We also saw pressure on our gain on sale margins, especially for subprime loans. During the fourth quarter our gain on sale of loans totaled $238 million resulting in an all-in gain of 46 basis points down from 63 basis points on a linked quarter basis.
Our 2005 guidance for revenue from sales and servicing of home mortgage loans, inclusive of all MSR risk management instruments, as detailed on page WM-15 of our press release, was a range between $1.6 and $1.8 billion. We came in at the upper end of that range.
As we head into 2006 the environment for hedging the MSR continues to be challenging. The impact of the environment on our results is demonstrated by the spread between the 2-year and 10-year swaps. That spread has dropped by more than a full percentage point over the past year. This reduces the interest we receive on our swap and TBA hedges and thereby increases our overall cost to hedge.
The value of our MSR increased to $8 billion at year-end from $7 billion at the end of the third quarter reflecting higher interest rates and a slower anticipated level of loan prepayments. Our MSR capitalization rate was 1.43 percent compared to 1.29 percent at the end of the third quarter.
| | | Prepared Remarks - January 18, 2006 | Page 11 |
Noninterest Expense
Now, onto noninterest expense, which was $2.3 billion, up 18 percent on a linked quarter basis primarily due to the addition of the Card Services Group. Also impacting noninterest expense was the opening of 95 new retail banking stores, Providian integration costs and expenses resulting from hurricane-related damages. Total noninterest expense for the full year was $7.9 billion. After factoring in the impact of the new Card Services Group, our noninterest expense for the year was essentially flat with 2004 at $7.5 billion as $347 million in savings in our home loans segment helped fund the growth in our retail bank and commercial group.
Earnings Driver Guidance
Before I conclude my remarks, let me walk you through our present view concerning our six earnings drivers for the coming year.
Driver | Guidance |
| Average assets | 6-8 percent growth |
| Net interest margin | 2.70-2.80 percent |
| Credit provisioning | $750-850 million |
| Depositor and other retail banking fees | 10-12 percent growth |
| Noninterest income | $7.1-7.4 billion |
| Noninterest expense | $9.0 billion |
First, let’s look at asset growth. We anticipate average asset growth in the range of 6 to 8 percent year over year. About half of that growth will come from the full year impact of adding Providian credit card assets. We currently expect to hold fewer of the loans we originate in portfolio and will sell more of them into the secondary market. The current flat yield curve and tight asset spreads makes it difficult to generate assets with adequate risk-adjusted yields. As rates have moved up, credit spreads have widened and we have increased our pricing, so this outlook may change.
As I mentioned at our investor day we continued to buy back our stock and during the fourth quarter we repurchased 18.9 million shares We ended the year with a capital ratio of 5.73 percent well in excess of our 5.50 percent target so we have some flexibility here and we’ll actively manage our asset growth and share buy backs in 2006.
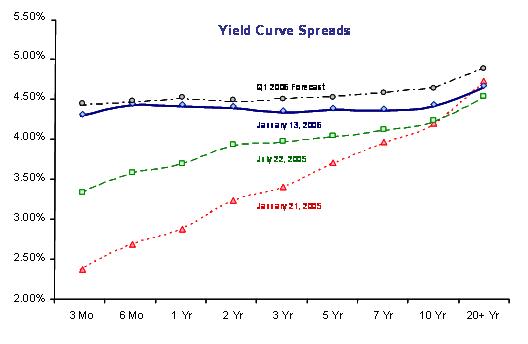
The second driver is our Net Interest Margin. As we look to 2006 and consider today’s forward curve, we still believe our Net Interest Margin will be in the range of 2.70 to 2.80 percent in 2006. The forward curve is currently projecting one or two more Federal Reserve rate increases so with that assumption we would expect to see some further compression of our margin in the first part of the year followed by some degree of recovery during the second half. However, I’d like to point out that if we were to see an inverted curve scenario, as we have seen recently, this could put additional downward pressure on the margin.
Our third driver is Credit Provisioning. We currently expect credit provisioning to be $750 million to $850 million for the year, which assumes a much more difficult credit environment than this past quarter. As we did last year we will carefully monitor this driver and update you on our quarterly earnings calls as we progress each quarter.
Our fourth driver is Depositor and Other Retail Banking Fees. After growing these fees at a rate of 10 percent in 2005, we are expecting to grow in the range of 10 to 12 percent in 2006. Our retail bank continues to add accounts and households at a very good pace and this translates into stronger fee income as well as asset growth and other product sales.
| | | Prepared Remarks - January 18, 2006 | Page 12 |
We told you during our Investor Day that we projected our fifth driver -- total noninterest income for 2006 -- to be in the range of $7.1 to $7.4 billion. We continue to be comfortable with that range; however, we believe the quarterly trend may be lower in the first couple of quarters and build over the course of the year. The primary factor influencing this trend will be the hedging expense of the MSR as the yield curve remains relatively flat but we also expect other revenues to grow over time along with our business.
Our final driver is Noninterest Expense. Over the last three years, we have focused on reducing costs and driving efficiencies across our businesses. As Kerry will elaborate, we will focus in 2006 to improve productivity and position our support operations in cost-effective labor markets. However, we anticipate that expenses will be up to support further retail expansion and growth. At this time, we continue to target a noninterest expense of $9 billion for 2006.
So that is how we see our 2006 drivers shaping up. We will watch these drivers closely throughout the year and provide you with updates during our quarterly earnings call.
I’ll now turn it back over to Kerry for his summary comments.
| | | Prepared Remarks - January 18, 2006 | Page 13 |
| | Kerry Killinger Chairman and CEO (continued) |
Thanks, Tom.
As Tom commented we are heading into 2006 with a continuation of the same challenging interest rate environment that we faced during the later part of 2005. The yield curve is extremely flat and at times even inverted. Although we continue to experience very good credit performance there is concern that this trend my change. We will continue to tackle these challenges in 2006 with the same focus we applied throughout 2005.
However, there is also good basis for optimism. The Federal Reserve has softened its tone on the outlook for further increases in the Fed Funds rate. And as we have said many times, once short-term interest rates stabilize our net interest margin will expand with the repricing of our indexed loans. With this comes positive financial leverage. The increased net interest income derived from the wider Net Interest Margin will produce earnings that will drive further asset growth, fund dividend increases and enable additional share repurchases. The result is expected to be a higher return on equity and an improved operating efficiency ratio.
Beyond anticipating the recovery of our net interest margin we are taking proactive steps to improve the productivity of our operations. For example, we recently combined Long Beach Mortgage and Mortgage Banker Finance with Home Loans. We expect this to offer significant efficiency and opportunities to leverage our distribution channels. In the future we will report Long Beach and Mortgage Banker Finance results as part of the Home Loans Group.
In the past three years our team has done an outstanding job of expense management. Now we must move to a new level by reshaping our operations to support our ambitious growth plan and achieve top tier productivity. One important contributor will be the reorganization of our back office support groups from one shaped by historic acquisitions to an operation driven by our core business activities across the country. This reorganization will involve relocating more of our operations to lower cost domestic markets and increasing our use of off-shore resources where appropriate. We currently utilize about 1,600 off-shore FTEs and we expect this number to grow to over 6,000 over the next two years. And we expect our new low cost center in San Antonio to grow to about 3,000 FTEs over the next two years.
As part of this effort, today we informed approximately 1,000 employees from our Chatsworth, California facility that over the next few months the majority of their positions would be relocated to our regional operations center in San Antonio, Texas, with a small portion of the work currently done there migrating to global vendors.
So in conclusion our business units are well positioned in excellent markets and we have the right management in place. Each of our businesses has solid business plans that include emphasis on growth and improved productivity and they are off to a good start.
With that, Steve, Tom and I are happy to field your questions.
| | | Prepared Remarks - January 18, 2006 | Page 14 |
Forward-Looking Statement
Our Form 10-K for 2004 and other documents that we filed with the Securities and Exchange Commission have forward-looking statements. In addition, our senior management may make forward-looking statements orally to analysts, investors, the media and others. Forward-looking statements can be identified by the fact that they do not relate strictly to historical or current facts. They often include words such as “expects,” “anticipates,” “intends,” “plans,” “believes,” “seeks,” “estimates,” or words of similar meaning, or future or conditional verbs such as “will,” “would,” “should,” “could” or “may.” Forward-looking statements provide our expectations or predictions of future conditions, events or results. They are not guarantees of future performance. By their nature, forward-looking statements are subject to risks and uncertainties. These statements speak only as of the date they are made. We do not undertake to update forward-looking statements to reflect the impact of circumstances or events that arise after the date the forward-looking statements were made. There are a number of factors, many of which are beyond our control that could cause actual conditions, events or results to differ significantly from those described in the forward-looking statements. Some of these factors are:
| | · | Volatile interest rates impact the mortgage banking business and could adversely affect earnings; |
| | · | Rising unemployment or a decrease in housing prices could adversely affect credit performance; |
| | · | The potential for negative amortization in the option adjustable-rate mortgage product could have an adverse effect on the company's credit performance; |
| | · | The company faces competition from banking and nonbanking companies; |
| | · | Changes in the regulation of financial services companies and housing government-sponsored enterprises, and in particular, declines in the liquidity of the mortgage loan secondary market, could adversely affect business; |
| | · | General business and economic conditions, including movements in interest rates, the slope of the yield curve and the potential overextension of housing prices in certain geographic markets, may significantly affect the company’s business activities and earnings; |
| | · | Negative public opinion could damage the company’s reputation and adversely affect earnings; and, |
| | · | Matters related to Washington Mutual Card Services, including, among others, risk related to integration of systems and the realization of expected growth opportunities. |