Exhibit 99.3
Washington Mutual, Inc.
Prepared Remarks for First Quarter 2006 Earnings Conference Call
April 18, 2006
Please see the Forward-Looking Statement at the end of this document
 | Remarks of Kerry Killinger Chairman and CEO |
Good afternoon - or evening, as the case may be - thank you for joining us for our first quarter earnings call.
Q1 2006 Earnings
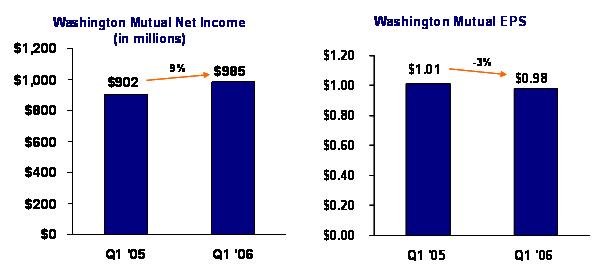
Earlier today, concurrent with our Annual Shareholders’ meeting, we announced first quarter net income of $985 million, or $0.98 per diluted share, compared to $902 million or $1.01 per diluted share in the first quarter a year ago and $0.85 per diluted share in the fourth quarter of 2005.
Our Board of Directors once again increased the cash dividend by one cent to 51 cents per share - the 43rd consecutive quarter the Board has elected to increase the cash dividend.
Before I get started, I’d like to welcome Regina Montoya who was elected to our board of directors earlier today. Regina is the chief executive officer of Washington D.C.-based New America Alliance and is a nationally-recognized leader in the legal, corporate and nonprofit communities.
I’d also like to welcome James Corcoran. James is our new President of Retail Banking. We’re very excited to have him as he joins us for a period of substantial growth for our Retail Banking group. He has a proven track record of driving significant organic growth and bottom line results. He comes to us from Halifax Bank of Scotland, where he was the Managing Director of Retail Distribution since 2000. He has extensive consumer banking experience from prior positions at First USA, Citicorp and American Express. James will report directly to our President and COO Steve Rotella.
This past quarter we had outstanding results in Retail Banking and Card Services, as well as solid performance in our Commercial Group. At the same time, the ongoing difficult interest-rate environment continued to challenge the results in our Home Loans business.
 |
| Prepared Remarks - April 18, 2006 | Page 2 |
Net income in our two most profitable segments - Retail Banking and Card Services - was up significantly, with fee income in Retail Banking, in particular, up sharply from a year ago. Customer growth was very strong in both segments, fueled by the introduction of new products. By the end of the quarter, we had attracted 210,000 net new retail households and opened 340,000 net new checking accounts, which was a record for us. Strong cross selling efforts by Card Services resulted in 256,000 WaMu credit card accounts, which was about one-third of our gross new card account growth. Both of these businesses are demonstrating very strong momentum.
We continued to see strong multi-family loan demand in our Commercial Group; however, earnings were down on a comparative basis, primarily due to significant one-time gains in the prior quarters. While the increase in interest rates also put pressure on the net interest margin, we do expect it to recover once short-term interest rates stabilize.
Results in our Home Loans business continue to be negatively impacted by rising short-term interest rates and the flat yield curve. Our Mortgage Servicing Right hedging costs remained very high and we saw some slowing in our lending volumes. While we are taking steps to adjust our business to the environment, which I’ll come back to, there will be a lag before we see the full benefit of these actions.
We had very good financial results across most of our operations, despite the difficult interest rate environment. The one area which has negatively impacted earnings is our MSR hedging costs, which increased $364 million during the past year, negatively impacting after tax net income by $226 million, or 23 cents per share. This MSR hedging impact reflects the adoption of the new accounting pronouncement for these assets with pro forma application to prior periods that Tom will discuss in more detail. The important point, however, is that the positive results of the rest of the company nearly offset that shortfall. I’m very encouraged by the positive changes and results we are seeing across the company.
Retail Banking
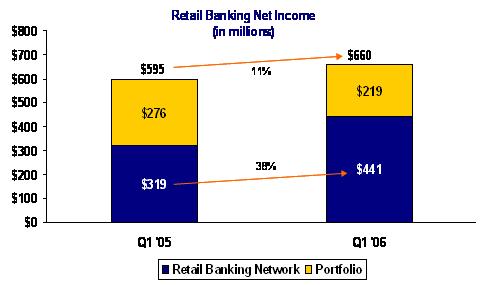
As I mentioned, we continued to see strong results from our Retail Banking operations. Net income of $660 million was up 11 percent from the same quarter a year ago and up 5 percent on a linked quarter basis. Retail banking net income (net of portfolio management) of $441 million was up 38 percent from the same period a year ago.
Depositor and other retail banking fees of $578 million were up 18 percent year over year, and down only slightly on a linked quarter basis, despite the seasonal decline generally experienced in the first quarter.
| |
| Prepared Remarks - April 18, 2006 | Page 3 |
On March 13th we launched our new WaMu Free CheckingTM product - an innovative new product designed to once again shake up the banking industry. As one of the first banks to offer Free Checking over 10 years ago, we have once again redefined Free Checking with this innovative new product and added more fuel to our already very effective Retail Banking model. Supported by a new national advertising campaign, the response has been tremendous - from customers as well as non-customers alike.
The new product has turbo-charged our successful Retail Banking model, driving in new households and new checking account customers. Net new account growth of 340,000 set a new record for the company. And we expect this momentum to continue at a very strong pace. Retail banking households grew this past year at about a 9 percent annual pace and we anticipate that the pace may quicken as the new product gains momentum. Cross-sales also continued to increase reaching 6.46 products per household at quarter end.

In addition to our exciting new product, we are also focused on the considerable growth opportunities in Small Business Banking. And we continue to see impressive growth. Net new small business checking accounts of 53,000 were up 23 percent year over year and 28 percent on a linked quarter basis. A few weeks ago, we announced that Frank Vella had joined us from JPMorgan Chase, where he spent nearly 10 years in Small Business Banking, to head up our efforts and increase our momentum in this important segment.
Card Services
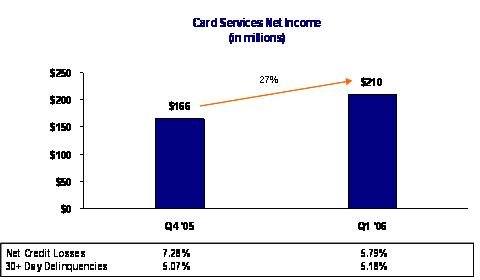
Turning to Card Services, net income of $210 million was up 27 percent from the fourth quarter of 2005. We’re very pleased with the performance of Card Services and their customer growth for the quarter. Despite what is normally a seasonal paydown period, average managed receivables topped $20 billion with over 10 million customers. And credit remained very strong.
WaMu retail card growth was 256,000 accounts in the first quarter, adding to the strong production of our national and partnership programs. Since we added Card Services on October 1st, we have booked 417,000 new accounts with Washington Mutual customers.
I’m pleased to report that we have now implemented our pre-approved card distribution capability in WaMu retail stores throughout most of the country. The rollout will be completed by the end of this month. And because our market studies indicate that the WaMu name tests stronger than Providian, we will use WaMu in all of our new sales campaigns and will transition legacy cards branded under the Providian name out to the Washington Mutual name.
| |
| Prepared Remarks - April 18, 2006 | Page 4 |
The acquisition of Providian was a terrific transaction for WaMu and our shareholders. It met a critical product need for our customers, with an excellent platform and top-notch management team. The integration of Card Services has been nearly flawless and is effectively completed with employee benefit programs, department consolidations and most systems already converted. In the end, we will deliver on or exceed all the projections we set out for you last June when we announced the deal. In short, I’m very pleased with our team and the work they’ve done on this one.
Commercial Group
The Commercial group continued to drive strong loan volume, especially in their industry leading multi-family market, with total loan volume up 14 percent year over year.
However, net income was down primarily due to significant one-time gains in the prior quarters. Last year’s first quarter included $59 million or $36 million after tax, from gain on sale from a real estate investment. Excluding the real estate gain, net income for the first quarter declined 26 percent from the same quarter in the prior year.

The decline in net income was primarily due to net interest margin compression, resulting from the lag in our adjustable-rate loan portfolio compared to rising short-term interest rates. As with the portfolio in the Retail Bank, we anticipate a similar margin recovery in our multi-family portfolio once the Fed stops raising interest rates.
| |
| Prepared Remarks - April 18, 2006 | Page 5 |
Home Loans
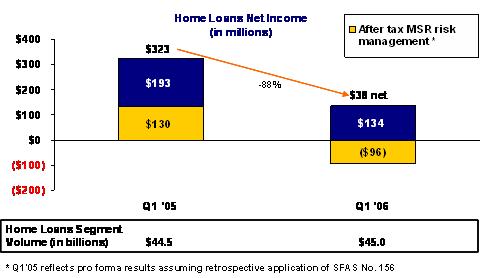
Wrapping up with our Home Loans Group - which now includes Long Beach Mortgage - net income for the quarter was $38 million versus net income of $323 million in the first quarter of 2005 and $45 million in the fourth quarter of 2005.
As we told you during our January earnings conference call, we expected the difficult environment to continue in the first quarter. And as I’ve said, the cost of hedging our Mortgage Servicing Right continues to be high.
Excluding MSR risk management, home loans net income was $134 million compared to $193 million in the same quarter last year. The largest driver of the difference was net interest income, which declined 32 percent to $268 million from $396 million in the first quarter of last year. The decline was primarily driven by the compression of the net interest margin on our loans held for sale portfolio.
Although the industry remains competitive, during the first quarter our gain on sale margins increased, which partially offset a lower volume of loans sold during the quarter.
Our Home Loans management team is intensely focused on quickly and effectively adjusting our operations to improve profitability in this more challenging, lower lending volume environment. This means taking actions to lower our expenses, improve our efficiency and increase productivity.
These strategies include focusing on the cross-business opportunities we have identified, targeting the most profitable products, as well as consolidating real estate and moving back office functions to lower cost domestic and offshore locations such as the consolidation of our Home Loans processing offices from 26 to 16 offices during the first quarter which resulted in an elimination of approximately 2,500 jobs.
The realignment of Long Beach Mortgage under one management team in the Home Loans group also allows us to streamline and simplify operations and drive efficiencies and operational excellence consistently across all our single-family residential mortgage lending operations.
The results of both of these significant actions will be reflected in reduced costs over the rest of the year. We will continue to focus on adjusting the cost structure of the home loans business and managing capacity to better match current and anticipated mortgage market conditions.
Summary
That was a quick overview of the performance of each of our businesses in the quarter. Now, I’ll turn it over to Tom to go into more specifics on our financial performance.
| |
| Prepared Remarks - April 18, 2006 | Page 6 |
 | Remarks of Tom Casey Executive Vice President and CFO |
Thank you, Kerry.
As you said, most of our businesses are doing extremely well, despite the difficult interest rate environment. We had outstanding customer and revenue growth in both our Retail Bank and Card Services businesses and this led directly to improved bottom line results for both. The performance of Home Loans continues to be impacted by higher interest rates and the flat yield curve, but our team is working hard to adjust to the environment.
Asset Growth and Net Interest Margin
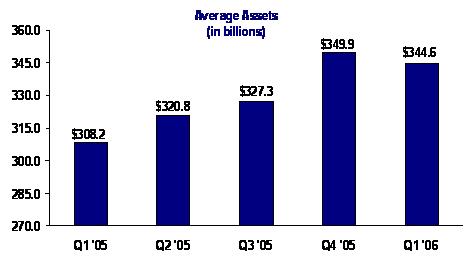
Let me start out by reviewing our balance sheet activity. As we told you during last quarter’s earnings call, we are looking for modest asset growth for the year. While average assets for the first quarter are up 12 percent from a year ago, we expect average asset growth to slow for the remainder of the year to around 3 or 4 percent.
On the liabilities side of the balance sheet, while average deposits for the quarter were lower, the end of period balances were up 4 percent, reflecting steady growth. The increase can be attributed to significant growth in most product categories towards the end of the quarter. Compared with the first quarter of 2005, average deposits were up $15.9 billion, or 9 percent, primarily due to the addition in deposits from Providian and growth in both retail and wholesale deposits.
Before I review our income performance for the quarter, I need to explain a change in revenue classification that impacted both net interest income and noninterest income. During the first quarter, we reclassified prepayment fee income from noninterest income to interest income on loans. This change was done in conjunction with revised guidance issued by the OTS on their regulatory reports to make OTS reporting consistent with that of other banking agencies. The change had no bottom line impact for the first quarter. Prior periods were also restated and the full impact for 2005 was to move $335 million from noninterest income to interest income. This reclassification resulted in an increase in our 2005 net interest margin of about 10 basis points. This change will have an impact on our earnings driver guidance that I’ll review with you in just a few minutes.
So, with the reclassification adjustment covered, let’s review the impact of further Federal Reserve tightening during the first quarter. We saw our net interest margin compress 13 basis points during the quarter to 2.75 percent. About 6 basis points of the decrease was attributable to the rise in short-term interest rates. This is about the same as we’ve seen in recent quarters. Another contributing factor to the decline in net interest margin was the result of the timing of securitizations of our credit card receivables. While average managed card receivables increased $614 million on a linked quarter basis, the receivables on a GAAP basis actually declined
| |
| Prepared Remarks - April 18, 2006 | Page 7 |
$451 million due to securitization transactions. So while the NIM is down, the economics of securitized credit card receivables flows through revenue from sales and servicing from consumer loans in noninterest income.
At some point short-term interest rates will stabilize. When that happens, our portfolio of lagging index loans will fully catch up to market interest rates. In the past we have indicated that our normalized NIM is in the range of 3.00 to 3.10 percent, so with the prepayment change I mentioned, it should now be in a range of 3.10 to 3.20 percent.
Credit
Turning to credit - we are pleased with the ongoing strong credit performance of our portfolio. The economy remains strong, and the quality of our portfolio continues to be fairly stable with only a slight increase in our nonperforming assets.
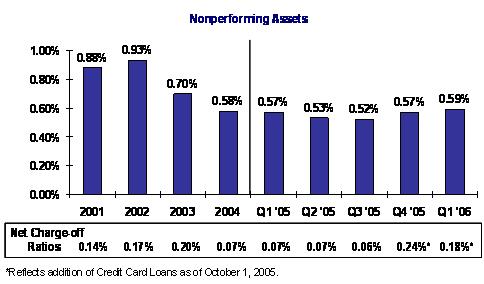
Our Credit Card portfolio, in particular, had very low charge offs during the quarter. This, in part, was due to the acceleration of bankruptcy claims and thereby charge offs in the fourth quarter of last year with the anticipated change in bankruptcy law. The result was a benefit in the first quarter which had lower charge offs and a lower provision. We expect both charge offs and the provision related to credit cards to increase to a more normal level in future quarters now that this bankruptcy law transition is behind us.
As a result of the favorable credit performance, especially in our Credit Card portfolio, our provision for the quarter was $82 million, compared to $217 million in the fourth quarter.
| |
| Prepared Remarks - April 18, 2006 | Page 8 |
Noninterest Income
Noninterest income of $1.7 billion for the quarter was up 8 percent on a linked quarter basis and 29 percent year over year. The increase from last year was primarily due to the addition of Card Services, which added approximately $570 million in revenue compared to the first quarter of 2005. Also, as we disclosed in our 10K, this past quarter’s noninterest income included a pretax goodwill settlement of $134 million related to a claim by Home Savings, whom we acquired in 1998.
An important story in noninterest income is the 18 percent growth, year over year, in depositor and other retail banking fees driven by our Retail Bank. We expect strong depositor fee growth to continue throughout the year, as we attract customers with our new WaMu Free CheckingTM product.
Higher interest rates and the competitive mortgage environment have challenged the production side of our mortgage banking operations, but we’re actually performing fairly well. Lending volume for the quarter totaled $55 billion, down 13 percent on a linked quarter basis, but a decline of only 8 percent from the same quarter a year ago. During the first quarter we generated $209 million gain on sale compared to $238 million in the fourth quarter of last year. Improvement in the gain on sale margins during the first quarter, when compared to the fourth quarter of last year, helped offset the 33 percent reduction in loans sold on a linked quarter basis.
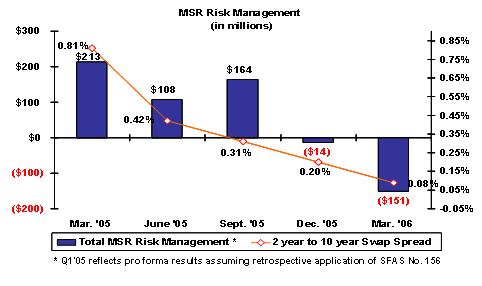
However, offsetting a portion of the revenue momentum of the organization is the growing cost of hedging our MSR. We have been telling you over the past six months of the rising hedging costs as the yield curve has flattened. During the first quarter of this year, the total cost of MSR risk management was $151 million compared to the pro forma net revenue of $213 million from this activity in the first quarter of last year. This $364 million increase in MSR risk management costs has occurred during a period of extreme flattening of the yield curve. As an illustration, over the past year, the 2-year to 10-year swap spread has compressed from 81 basis points to only 8 basis points.
While not materially impacting the result of our MSR hedging program, during the first quarter we did adopt SFAS No. 156, the new standard Accounting for Servicing of Financial Assets. The standard permits the recognition of mortgage servicing rights at fair value and eliminates the lower of cost or market accounting requirement. To reflect the change in accounting, we revised our disclosure on pages WM-12 and WM-13 to include pro forma financial results. In particular, I’d like to draw your attention to schedule WM-13 in which we provide a total MSR risk management measure that we believe provides a very good view of the cost and performance of our hedging program. We continue to be satisfied with the quality and effectiveness of our hedging program, but clearly the cost of hedging the MSR in this interest rate environment is very expensive, and we are taking steps to reduce our hedging costs while maintaining our risk management discipline.
| |
| Prepared Remarks - April 18, 2006 | Page 9 |
Noninterest Expense
Shifting to noninterest expense - while noninterest expense was up 20 percent on a year over year basis, primarily due to the addition of Card Services, operating expenses actually declined
3 percent on a linked quarter basis
Our expense management focus is not just on cutting costs but, more importantly, on driving improved productivity so we can fund our growth, as well as achieve our efficiency target. This means that we are fueling the company’s growth prospects - and not reducing them by short sighted cost cuts. Each of our businesses has critical productivity measures by which they manage their operations.
Overall, I’m pleased with the energy and management focus we have on effective expense management. We will continue with our outsourcing, offshoring and other efficiency efforts and I expect our noninterest expense to decline during the remainder of the year.
Capital Management
Before I give an update on our earnings drivers, I’d like to take a moment to comment on capital management. In addition to driving earnings growth, it’s important for us to effectively deploy capital to maximize shareholder value.
During the first quarter, we announced the issuance of $2 billion in Perpetual Non-cumulative Preferred securities. These securities qualify as Tier 1 regulatory capital and are classified as minority interest on our balance sheet. Importantly, the rating agencies also assign a high level of equity content for these securities in their capital evaluations. At quarter end, our tangible capital ratio, including these Preferred securities was 5.85 percent, putting us well in excess of our target ratio of 5.50 percent. Also, our Tier 1 capital to adjusted total assets for Washington Mutual Bank equaled 6.86 percent.
During the quarter asset growth was modest, so limited capital was needed to fund growth. We utilized our excess capital, as well as a portion of the proceeds from the preferred securities, to repurchase 47 million shares of common stock. As a result, we ended the quarter with 959 million shares outstanding, down 4 percent from year-end 2005.
As we look forward, we continue to generate sufficient capital to grow the balance sheet and maintain our dividend. We intend to complement our capital generating capability with the use of hybrid securities, such as these new preferred securities, as the market continues to mature.
Earnings Driver Guidance
Now, let me walk you through our present thinking concerning our six earnings drivers.
Driver | January 2006 Guidance | New Guidance |
| 1) Average Asset Growth | 6-8 percent |
| 2) Net interest margin | 2.70-2.80 percent | 2.75-2.85 percent |
| 3) Credit provisioning | $750-$850 million | $650-$750 million |
| 4) Depositor and other retail banking fees | 10-12 percent growth | 12-14 percent growth |
| 5) Noninterest income | $7.1-$7.4 billion | $6.5-$6.8 billion |
| 6) Noninterest expense | $9.0 billion | $8.6-$8.8 billion |
1) Average Assets
We continue to be comfortable with average asset growth guidance of 6 to 8 percent. This guidance anticipates approximately 3 to 4 percent further asset growth for the remainder of the year.
| |
| Prepared Remarks - April 18, 2006 | Page 10 |
2) Net Interest Margin
Our beginning of the year guidance for the net interest margin of 2.70 to 2.80 percent was prior to the reclassification of prepayment fees. Adjusting for that reclassification, our initial guidance would have been 2.80 to 2.90 percent.
Our original guidance was also based on the forward yield curve, which at the start of the year projected one to two 25 basis point Fed Fund increases. With those increases occurring in the first quarter, the forward yield curve is now anticipating an additional one to two more 25 basis points rate increases. As a result, we now believe our margin for the full year will fall into a range of 2.75 to 2.85 percent. The one variable we can’t predict is what the Fed and interest rates will do, so we will continue to update you each quarter on this driver.
3) Credit Provisioning
Credit quality continues to surpass our expectations. Given the good credit quality and provision level of this quarter, we are revising our credit provision outlook downward to $650 to $750 million.
4) Depositor and Retail Banking Fees
Our new WaMu Free CheckingTM product has us feeling very confident about our Retail Bank’s momentum. We expect we will give up some fee income as customers migrate to the new Free Checking product, but based on the first quarter’s strong results, we are raising our guidance for depositor and other retail banking fees to 12 to 14 percent.
5) Noninterest Income
Now let’s talk about noninterest income. We’re reducing our guidance for noninterest income by $600 million. Half, or $300 million, of this adjustment is due to the reclassification of prepayment fee income that I just covered. So that’s just a shift from one revenue line item to another. While there are many moving parts within noninterest income, the one we are most concerned about is our MSR hedging costs. As I reviewed with you, the cost of hedging our MSR is very expensive in the current interest rate environment. While we are taking actions to reduce this cost, we don’t see the interest rate environment improving in the short term, so we are reducing our guidance by another $300 million. So our new guidance for noninterest income is a range of $6.5 to $6.8 billion.
6) Noninterest Expense
Noninterest expense is something we are better able to control. Over the past three years, we have done a good job of keeping costs essentially flat. However, more needs to be done if we are to achieve our operating efficiency goal. This year we expect several activities to drive our operating costs lower:
| | · | First, we expect that our cost savings from the Card Services group to exceed our original projection by approximately 40 percent. |
| | · | Second, the Home Loans efficiency efforts, as well as the consolidation of Long Beach that began during the first quarter, will drive savings starting in the second quarter. |
| | · | Third, we have revised expense targets across the company and are implementing strategies to achieve them. |
| | · | And lastly, our outsourcing and off-shore activities are underway, and we expect to see the benefits in our operating costs in the second half of the year. |
As a result, we are lowering our noninterest expense target by an additional $200 to $400 million to a range of $8.6 to $8.8 billion.
So Kerry, despite some headwinds from the interest rate environment, we’re making great progress across the company toward achieving our longer-term goals. I’ll now turn it back over to you for your summary comments.
| |
| Prepared Remarks - April 18, 2006 | Page 11 |
| Remarks of Kerry Killinger Chairman and CEO (continued) |
Thanks, Tom.
As we wrap up our overview of first quarter results, I want to emphasize that overall I am very pleased with our progress and performance in the quarter.
Our underlying strategies are working well.
| | · | Our retail banking and credit card operations are producing excellent results; |
| | · | Expense management and credit costs are being tightly managed; |
| | · | We are being responsive to the environmental challenges currently putting pressure on our net interest margin and MSR hedging costs; and |
| | · | Our effective capital management and corresponding share repurchase program are positioning us well for the future. |
In summary, I believe we are setting the stage for strong performance when the interest rate environment improves. I believe that we are in the low part of the cycle and the work we are doing on reducing costs and increasing productivity will have leveraged benefits in a stable interest rate environment.
As Tom said, once the Fed stops tightening, we should see improvement in the net interest margin by 35-45 basis points or so over the following four quarters. So with over $300 billion of assets, this could be a significant boost to net interest income.
Finally, let me reiterate that our management team is committed to achieving the goals we’ve set in our 5-year plan of double-digit EPS growth and bringing our efficiency ratio down to below 50 percent.
I believe we are making excellent progress and that this will help drive superior shareholder returns over the next few years.
With that, Steve, Tom and I are happy to field your questions.
| |
| Prepared Remarks - April 18, 2006 | Page 12 |
Forward-Looking Statement
Our Form 10-K for 2005 and other documents that we filed with the Securities and Exchange Commission have forward-looking statements. In addition, our senior management may make forward-looking statements orally to analysts, investors, the media and others. Forward-looking statements can be identified by the fact that they do not relate strictly to historical or current facts. They often include words such as “expects,” “anticipates,” “intends,” “plans,” “believes,” “seeks,” “estimates,” or words of similar meaning, or future or conditional verbs such as “will,” “would,” “should,” “could” or “may.” Forward-looking statements provide our expectations or predictions of future conditions, events or results. They are not guarantees of future performance. By their nature, forward-looking statements are subject to risks and uncertainties. These statements speak only as of the date they are made. We do not undertake to update forward-looking statements to reflect the impact of circumstances or events that arise after the date the forward-looking statements were made. There are a number of factors, many of which are beyond our control that could cause actual conditions, events or results to differ significantly from those described in the forward-looking statements. Some of these factors are:
| | · | Volatile interest rates impact the mortgage banking business and could adversely affect earnings; |
| | · | Rising unemployment or a decrease in housing prices could adversely affect credit performance; |
| | · | The potential for negative amortization in the option adjustable-rate mortgage product could have an adverse effect on the company's credit performance; |
| | · | The company faces competition from banking and nonbanking companies; |
| | · | Changes in the regulation of financial services companies and housing government-sponsored enterprises, and in particular, declines in the liquidity of the mortgage loan secondary market, could adversely affect business; |
| | · | General business and economic conditions, including movements in interest rates, the slope of the yield curve and the potential overextension of housing prices in certain geographic markets, may significantly affect the company’s business activities and earnings; |
| | · | Negative public opinion could damage the company’s reputation and adversely affect earnings; and, |
| | · | Matters related to Washington Mutual Card Services, including, among others, risk related to integration of systems and the realization of expected growth opportunities. |
