Exhibit 99.3
![](https://capedge.com/proxy/8-K/0001157523-07-009942/alogo.jpg)
Washington Mutual, Inc.
Prepared Remarks for Third Quarter 2007 Earnings Conference Call
October 17, 2007
Please see the Cautionary Statements at the end of this document
![]() | Remarks of Kerry Killinger Chairman and CEO |
Good afternoon, everyone. Thank you for joining us today as we review the results of what was a very challenging third quarter.
As Alan mentioned, joining me today on the call is Tom Casey, our CFO, who will discuss our quarterly performance in more detail and update our 2007 earnings drivers. We will be discussing earnings drivers for 2008 at our Investor Day on November 7th. Our President, Steve Rotella, will also be available to answer questions at the end of our remarks this afternoon.
Third Quarter 2007 Earnings
As we announced on October 5th, our results for the third quarter were significantly impacted by further weakening in the housing market and capital market disruptions. Our loan loss provision of $967 million for the quarter increased from $372 million in the prior quarter. In addition, our quarterly earnings were negatively impacted by valuation adjustments across several asset classes. And as a result, our third quarter net income of $210 million, or 23 cents per share, was down from $748 million, or 77 cents per share in the third quarter of 2006.
![](https://capedge.com/proxy/8-K/0001157523-07-009942/graphic1.jpg)
Yesterday, the Board of Directors declared a dividend of $0.56 per common share for the quarter. The Board of Directors considered a variety of financial factors, including the company's earnings, capital and liquidity position. These same factors and considerations are reviewed by the Board each quarter.
Before I go into detail regarding the performance of our business operations, I’ll make a few comments regarding the market environment we experienced during the most recent quarter. From time to time, financial markets go through periods of significant volatility and disruption, such as we recently experienced. It is during these periods that a company’s asset, capital and liquidity management capabilities are tested. I’m very pleased with how we’ve managed the company through this period of stress. Our retail deposit franchise remains strong, providing us with a stable and reliable source of funding for our assets, and our management team has spent much of the last year diversifying our borrowing sources and proactively addressing the rapidly changing market conditions.
![]() | Prepared Remarks - October 17, 2007 | Page 2 |
I also think it is important to understand that the impact on our earnings of the severe market conditions was two-fold, one transitional and the second more long-lasting. First, as Tom will review in detail, was the impact of market illiquidity for mortgage and other financial instruments during the quarter. This impact resulted in market value losses in the quarter, most of which are not cash losses and generally are expected to be accreted back into income over the life of the related assets.
The second factor impacting earnings was an acceleration in the downturn in the housing markets. We first became concerned about a potential housing bubble in the summer of 2005 and began then preparing for a correction. As you can see from the housing price appreciation chart in our prepared remarks, the correction has been much more dramatic and rapid than the build-up. We now know that many markets, such as Florida and California, are experiencing price declines. When we looked at the situation two years ago, indications were that a correction in housing would likely be softened by continued good economic growth and employment, as well as historically low interest rates. In the third quarter, the so called “soft landing” quickly transitioned to a severe downturn as conditions in the capital markets deteriorated and home prices fell.
![](https://capedge.com/proxy/8-K/0001157523-07-009942/graphic2.jpg)
We are proactively managing delinquencies in our home loans portfolio with a focus on keeping as many of our borrowers as possible in their homes. We have staffed up our loan servicing groups and implemented several outreach programs especially for our subprime borrowers. As Tom will review with you later, the factor we expect to exert the greatest influence on the level of losses as we work through this period is home prices. We will continue to monitor them very closely.
Now, let’s look at the performance in each of our business units.
Retail Banking
I’ll begin with our Retail Banking business which continues to drive strong net checking growth. During the third quarter the retail bank added over 310,000 net new checking accounts, bringing the year-to-date total to over 1.0 million and achieving in nine months our stated goal of adding more than one million net new accounts for the year.
![]() | Prepared Remarks - October 17, 2007 | Page 3 |
While customer growth and fee revenue growth continue on track, weakness in the housing and credit markets resulted in a $227 million increase in the Retail Bank’s loan loss provision for the quarter, depressing the segment’s net income for the quarter to $453 million, compared to $555 million in the third quarter of last year.
![](https://capedge.com/proxy/8-K/0001157523-07-009942/graphic3.jpg)
Our Retail Bank continues to drive solid household growth through all of its products, in stores and online, growing retail banking households 8 percent year over year and increasing the cross sell ratio to 7.13 from 6.55 in the third quarter of a year ago.
![](https://capedge.com/proxy/8-K/0001157523-07-009942/graphic4.jpg)
Our small business program continues to deliver good results, adding 69,000 net new checking accounts during the third quarter and increasing average deposits to $8.8 billion up 22 percent from the third quarter of 2006.
We continue to invest in growing our Retail Banking channel, opening 10 new retail stores during the quarter. However, we are also very focused on ensuring that each of our stores remains profitable and cost effective. As a result, during the third quarter we consolidated 33 stores, about half of which were acquired last year as part of the CCBI acquisition. In the fourth quarter, we expect to have net openings of about 50 stores.
![]() | Prepared Remarks - October 17, 2007 | Page 4 |
Card Services
Card Services continues to drive record account growth in the third quarter adding 945,000 new credit cards accounts, with solid account growth in all channels. The sale of retail accounts to WaMu customers continues to account for approximately one-third of all account growth year to date. Period-end managed receivables of $26.2 billion were up 5 percent from the second quarter and up 18 percent from the prior year.
![](https://capedge.com/proxy/8-K/0001157523-07-009942/graphic5.jpg)
Net income for the third quarter of $102 million was down from $141 million on a linked quarter basis, primarily due to a $65 million valuation adjustment in retained interests. This writedown was primarily driven by higher discount rates associated with the market disruption during the third quarter.
Credit continues to perform within our target for risk-adjusted returns. At 5.73 percent of period-end managed receivables, the 30-plus day managed delinquency rate was up from 5.11 percent in the prior quarter reflecting, in part, seasonal trends. Net credit losses of 6.37 percent were down slightly from the second quarter, as the third quarter’s substantial growth in managed receivables more than offset an increase in charge-offs.
Commercial Group
The Commercial Group continues to deliver good results, despite being impacted by capital market volatility in the third quarter. Net income of $54 million was down from $113 million in the prior quarter due to the decline in noninterest income.
The $34 million loss in noninterest income was primarily due to a $21 million loss on sale of loans, net of hedging, which included an $8 million negative adjustment to the carrying value of $2 billion in loans moved from held for sale to the held for investment portfolio. This compares with second quarter noninterest income of $62 million, which included $63 million in gain on sale. And as we noted during last quarter’s earnings call, noninterest income in the second quarter reflected favorable hedging results.
![]() | Prepared Remarks - October 17, 2007 | Page 5 |
Third quarter loan volume of $4.1 billion was down somewhat from the record volume of $4.3 billion in the second quarter, but remained very solid.
![](https://capedge.com/proxy/8-K/0001157523-07-009942/graphic6.jpg)
Home Loans
The capital market disruptions in the third quarter had the most significant impact on the performance of our Home Loans group. The segment incurred a net loss of $348 million in the third quarter compared to a $37 million loss in the second quarter.
The Home Loans provision for loan losses increased by $222 million from the prior quarter, due to further weakness in the subprime portfolio and the movement of loans we would hold for sale under normal capital market conditions to the held for investment portfolio in this segment.
![](https://capedge.com/proxy/8-K/0001157523-07-009942/graphic7.jpg)
![]() | Prepared Remarks - October 17, 2007 | Page 6 |
The decline in noninterest income for the third quarter reflected the company’s net loss on sale of $222 million compared to a second quarter net gain of $192 million on sale of mortgage loans. The third quarter loss included $139 million in negative adjustments to the carrying value related to the $15 billion of home loans moved to the investment portfolio as well as other home loan sales and risk management activities that were also impacted by the market disruption during the quarter.
Partially offsetting these losses were stronger MSR valuation and risk management results of $222 million for the third quarter, compared to a loss of $21 million in the prior quarter.
Loan volume in this segment declined 26 percent to $26 billion for the third quarter. The decline was primarily due to a 35 percent reduction in refinancing volume as many borrowers held back refinancing plans as nonconforming loan rates increased. We also continued to deemphasize our subprime mortgage channel lending focus during the third quarter, resulting in an 80 percent decline in subprime volume on a linked quarter basis.
Before turning it over to Tom, I want to comment on the OTS consent order referred to in our press release. We are fully committed to improving and strengthening the controls and processes in our Bank Secrecy Act program. As we said in the press release, the order does not impose any fines or restrictions on our business activities or growth initiatives.
I’ll now turn it over to Tom.
![]() | Prepared Remarks - October 17, 2007 | Page 7 |
![]() | Remarks of Tom Casey Executive Vice President and CFO |
Thank you, Kerry.
Kerry gave you a good summary of the performance of our businesses during the quarter. We continue to drive good customer growth and deliver strong earnings from most of our businesses. However, our third quarter was greatly impacted by disruptions in the credit markets and further weakening in the housing market. I’m going to walk you through our results and provide you with details around how the market disruption affected some of our asset valuations, as well as how the weakening housing market is affecting our business. I will also give you our current outlook on earnings drivers for 2007.
Market disruptions
Let’s look first at the direct impact of the capital market disruption on our Q3 results. We have three significant asset classes that we mark to market or that we carry at the lower of cost or market, or “LOCOM.” They are: our warehouse of home, multi-family and commercial real estate loans held for sale; trading assets that we hold as part of our asset sale and securitization activities and our mortgage servicing rights. This quarter, we also recorded impairment in the value of some of our investment securities.
In the LOCOM category are our warehouse loans. As Kerry mentioned, we took downward adjustments of $147 million in the quarter related to $17 billion in held for sale single-family, multi-family and commercial real estate loans that were moved to our investment portfolio.
$139 million of that $147 million loss resulted when we moved $15 billion in single-family home loans to held for investment. The loans included $7.7 billion of jumbo hybrid and fixed-rate loans, $4.9 billion of Option ARMs, $1.1 billion of subprime loans and $1.3 billion of home equity and other loan types. Approximately 99 percent of these loans were performing when moved.
In addition to the $139 million loss on movement of home loans from the warehouse to the investment portfolio, the market disruption also impacted sales and risk management activities affecting other loans during the quarter, which together resulted in a total loss of $222 million, net of hedging and risk management. This compares to a net gain on sale of $192 million in the second quarter driving a $414 million swing in this component of our noninterest income.
In the first mark to market category—trading assets—we recorded a $153 million net loss. This included a $62 million reduction in the value on securities associated with our mortgage securitization programs, a $65 million reduction in the valuation of our credit card retained interests, and a $43 million reduction in the valuation of subprime residuals. At the end of September, our subprime residual book value was only $37 million and we are not currently creating any new subprime residuals.
The second mark to market category—mortgage servicing rights—moved sharply in the opposite direction. During the quarter, MSR valuation and risk management resulted in income of $222 million compared to a loss of $21 million in the second quarter. The improved MSR and hedging performance was significantly affected by the weakening housing market as projections for loan prepayments slowed considerably during the quarter.
Finally, as I mentioned, we evaluated our investment securities portfolio and recognized an impairment of $104 million for unrealized losses on some of our mortgage related holdings where we deemed the reduction in market value to be “other than temporary.” These securities were primarily investment grade mortgage-backed securities.
![]() | Prepared Remarks - October 17, 2007 | Page 8 |
Credit Quality and Provision for Loan Losses
Next let’s look at the impact of credit quality on our provision for loan losses.
There has been a significant and abrupt change in the health of the housing market since our second quarter earnings call. At that time, we noted significant slowing in the pace of home price appreciation in most parts of the country and absolute declines in some markets. Since August, the lack of secondary market liquidity for anything but agency conforming loans has resulted in sharply higher interest rates on all nonconforming prime loans, and subprime loans have become largely unavailable at any price. Many non-bank lenders have gone out of business or have severely curtailed their operations. This has increased the cost and decreased the availability of housing credit and contributed to the slowing of home sales. In combination, these factors are putting significant downward pressure on housing prices, especially in high-cost markets and in markets where subprime loans were most prevalent. The national inventory of unsold homes has increased from 6.5 months in January to 10 months in August, its highest level in 25 years. Home builders are aggressively cutting new home prices, and many other indices are moving negatively. As a result, most markets in the country likely have experienced actual price declines.
This dramatic change in the housing and credit environment is changing consumer behavior in a manner that adversely impacted our third quarter credit results. Specifically, the combination of reduced liquidity for mortgages and the slowing housing market has accelerated delinquencies, as borrowers who are under payment pressure can no longer look to refinancing, home equity loans or quick sales as answers to their problems.
Our nonperforming assets increased to 1.65 percent of assets at quarter end from 1.29 percent of assets at the end of the second quarter. As with the second quarter, subprime loans had the largest rate of nonperforming assets. However, during the third quarter we also saw an increase in prime home loan NPAs. The quarter end NPAs included 16 basis points in restructured loans.
![](https://capedge.com/proxy/8-K/0001157523-07-009942/graphic8.jpg)
![]() | Prepared Remarks - October 17, 2007 | Page 9 |
![](https://capedge.com/proxy/8-K/0001157523-07-009942/graphic9.jpg)
In contrast to our home loans portfolio, our credit card, multi-family and commercial real estate portfolios continue to perform well. The most significant external factor affecting the performance of our card portfolio is the level of unemployment, which remained relatively stable during the quarter. Our 30-plus day managed delinquencies increased to 5.73 percent from 5.11 percent in the prior quarter, while the managed net credit losses declined to 6.37 percent from 6.49 percent on a linked quarter basis. We continue to proactively manage the credit quality of this portfolio.
Our $39 billion multi-family and commercial real estate loan portfolio continues to perform well, with non-performing assets of 43 basis points at the end of the third quarter and no net charge-offs for the year.
As a result of the significant changes in the housing market and the performance trends of our portfolio we increased the provision for loan losses to $967 million for the third quarter from $372 million in the second quarter. This brought our allowance for loan and lease losses to $1.9 billion at quarter end, up 21 percent from the end of the second quarter. The higher level of provisioning reflects increases in delinquencies and charge-offs during the quarter, and the $22 billion increase in the quarter-end portfolio of loans held for investment.
As we did last quarter, we have provided you with a comprehensive set of charts as an appendix to these remarks which include additional credit statistics related to our loan portfolios. We also intend to go into more detail about our current credit outlook at our investor day on November 7th
Asset Growth
I’ll now shift over to review our balance sheet management. Over this past year, high levels of liquidity in the capital markets for mortgage assets and a flat yield curve have made it very difficult to add assets with acceptable risk-adjusted returns to our balance sheet. As a result, we reduced our total assets from $351 billion in June of 2006 to $312 billion in June of 2007. Instead of using our excess capital to grow the balance sheet, we returned it to our shareholders through share repurchases. During this time, we also proactively diversified our funding sources and added funding capacity by reducing our FHLB advances to $21 billion at June 30th 2007 from $55 billion a year earlier. This put us in a much stronger position to withstand the market disruption of the third quarter.
![]() | Prepared Remarks - October 17, 2007 | Page 10 |
![](https://capedge.com/proxy/8-K/0001157523-07-009942/graphic10.jpg)
In the third quarter, this funding flexibility allowed us to increase the loan portfolio by $22 billion, including the $17 billion of warehouse loans we moved to portfolio as I discussed earlier. We also more than doubled the level of our cash and cash equivalents to $11.4 billion to further strengthen our liquidity position during this period of extreme market volatility. The result was an increase in quarter-end assets of about 6 percent to $330 billion.
During the third quarter, home loan originations of $22.3 billion were down 28 percent, primarily due to lower home refinancing activity. Conforming originations totaled 43 percent of the quarter’s origination volume but increased to 51 percent for the month of September. Going forward, we see origination growth slowing but the quality of additions to the portfolio continuing to improve. We also anticipate the level of loan prepayments to decline as the housing market slows and, therefore, expect to see less runoff of our existing loan portfolio.
Yield Curve and Net Interest Margin
Net interest income of $2.0 billion for the quarter was down $20 million on a linked quarter basis, as the one percent increase in average interest-earning assets mostly offset a 4 basis point decline in the net interest margin. The slight decline in net interest margin in the quarter was the result of higher-cost wholesale borrowings funding the quarter’s asset growth, diminishing the relative contribution of our noninterest bearing deposits to our net interest margin.
Our primary short-term funding from the FHLB and wholesale borrowings from other sources continue to be indexed to 3-month LIBOR. Although the Fed Funds rate was cut 50 basis points on September 18th, we have not seen the full benefit because the capital markets disruption has resulted in a significant widening in the spread between Fed Funds and 3-month LIBOR. Historically, 3-month LIBOR has tracked approximately 10 to 30 basis points above the Fed Funds rate but at quarter end this spread had widened to 52 basis points. We expect this difference to diminish as capital markets normalize, but until it does our funding costs will remain somewhat higher.
![]() | Prepared Remarks - October 17, 2007 | Page 11 |
![](https://capedge.com/proxy/8-K/0001157523-07-009942/graphic11.jpg)
Capital and Liquidity
As I mentioned previously, we have proactively managed our assets and diversified our funding and capital over the past 15 months. We ended the quarter with a tangible capital ratio of 5.61 percent, in excess of our target of 5.50 percent. As I mentioned previously we doubled our cash position during the quarter, which depressed our tangible capital ratio somewhat but it also pre-funded a portion of our anticipated fourth quarter asset growth.
With that, let’s transition to updating our 2007 earnings driver guidance.
Earnings Driver Guidance
This update of our earnings drivers for 2007 reflects the current environment and our expectations for the remainder of the year.
2007 Earnings Driver Guidance | ||
Driver | July 2007 Guidance | October 2007 Guidance |
1) Average assets | 5% – 7% decline | |
2) Net interest margin | 2.85% - 2.95% | |
3) Credit provisioning | $1.5 – $1.7 billion | $2.7 – 2.9 billion |
4) Depositor and other retail banking fees | 12% – 14% growth | |
5) Noninterest income | $6.9 – $7.1 billion | $6.4 - $6.5 billion |
6) Noninterest expense | $8.4 - $8.5 billion |
Average Assets
Through the first nine months of the year, average assets were down 7 percent from 2006. With only one quarter to go, we don’t expect the average to change much. In the fourth quarter, we expect to grow the balance sheet by about $5 billion bringing total assets up to about $335 billion.
![]() | Prepared Remarks - October 17, 2007 | Page 12 |
Net Interest Margin
As we look out at the remainder of the year, the forward yield curve anticipates another 25 basis point cut in the Fed Funds rate by year end. While downward pressure on rates appears to be strong, the outlook changes daily as economic news becomes available. Any rate cut during the fourth quarter will primarily benefit 2008, assuming that LIBOR rates decline as well.
With our net interest margin through the end of the third quarter at 2.85 percent, we expect to complete the year with a NIM at the lower end of our guidance range of 2.85 percent to 2.95 percent.
Credit Provision
As we consider our credit provisioning outlook for the remainder of the year, let me just say that I have never seen housing credit conditions change so significantly over such a short period of time. Nor can I remember a period when there was less clarity about near-term housing and credit trends.
As I discussed in detail earlier, we have seen a sharp deterioration in the housing market since our second quarter earnings call and a further acceleration of adverse trends in our portfolio since we updated our guidance last in September. The guidance I provide you today is based on our best thinking given the facts that are currently available. However, we expect the market will continue to change quickly.
The main drivers of our credit provision are the level of delinquencies and charge-offs in our portfolio, both of which rose sharply in the third quarter as home prices declined in many of our major markets. Based on our current view of the macro environment for housing and our own portfolio data, we expect delinquencies and charge-offs in our portfolio to increase further during the fourth quarter.
Considering the weakening housing market and adverse trends in the third quarter, our best estimate at this time is that charge-offs in our portfolio will increase between 20 and 40 percent in the fourth quarter and that our total 2007 provision will be between $2.7 and $2.9 billion.
Depositor and other retail banking fees
The Retail Bank continues to have strong account growth, and with a 13 percent increase in depositor and other retail banking fees over the first nine months of last year, we continue to be comfortable with our guidance to 12 to 14 percent.
Noninterest Income
Noninterest income in the third quarter of $1.4 billion was down $379 million from the second quarter, primarily due to the market disruption in the quarter. While we don’t anticipate further deterioration in the capital markets, we also don’t believe there will be an immediate recovery of the secondary market for mortgages. Therefore, we expect the gain on sale in the fourth quarter to be modest. As a result, we are reducing our earnings guidance for noninterest income for the year by $500 million to $6.4 to $6.5 billion.
Noninterest Expense
Management remains focused on tight expense management and driving productivity and we have done a good job of that this past year. One by-product of the difficult credit period we are going through is higher foreclosure and problem loan expense. Despite this upward pressure, we expect our expenses for the year to remain in the guidance range of $8.4 to $8.5 billion.
I’ll now turn it back over to Kerry for his closing comments.
![]() | Prepared Remarks - October 17, 2007 | Page 13 |
![]() | Remarks of Kerry Killinger Chairman and CEO (continued) |
Thanks, Tom.
In wrapping up our prepared comments, let me offer the perspective of an 18-year CEO and a 35-year financial executive who has been through a lot of cycles.
We are primarily impacted by interest rate, yield curve, housing and economic cycles. Cycles come and go. When cycles are in your favor, you need to plan for the inevitable downturn. And when they are against you, you need to work through them and prepare for the inevitable upturn.
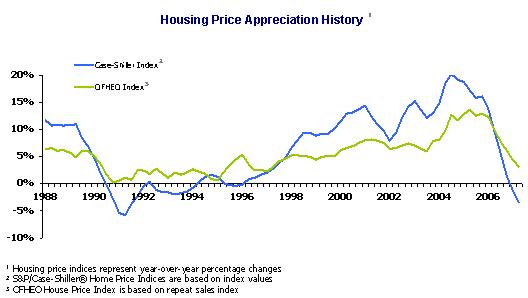
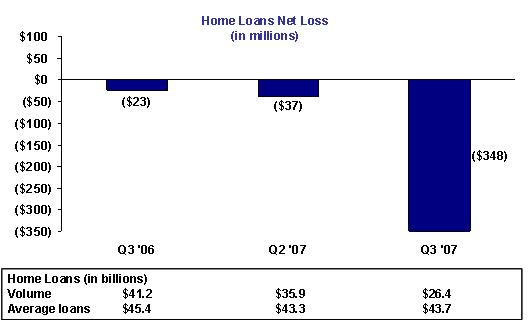
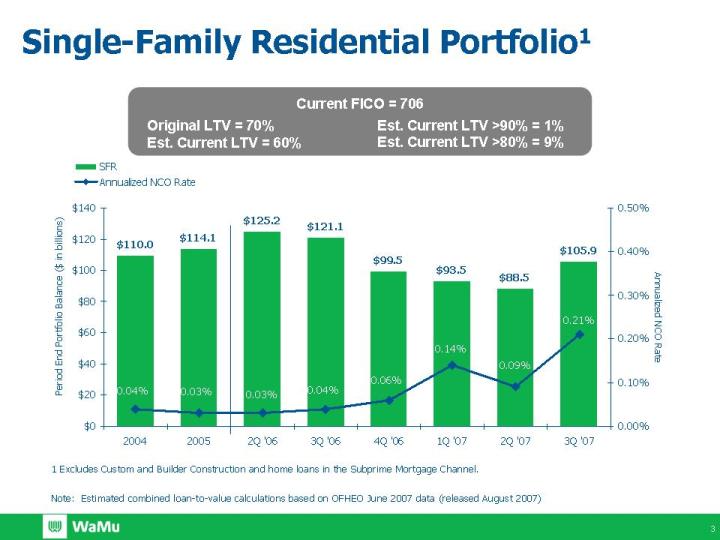
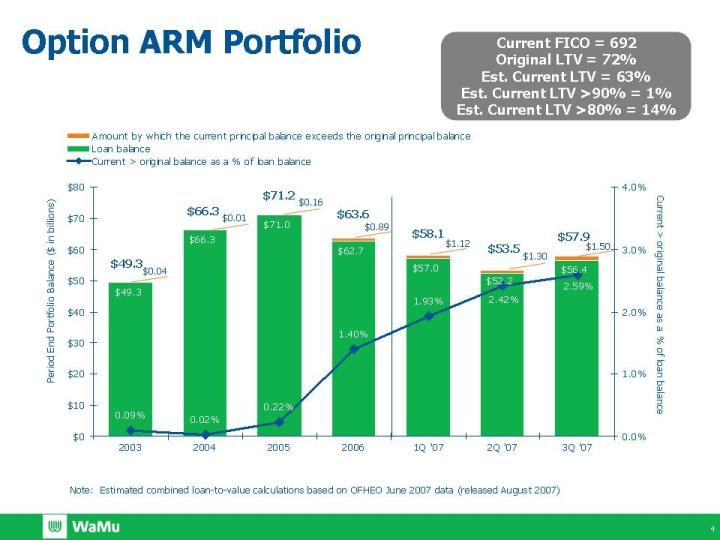
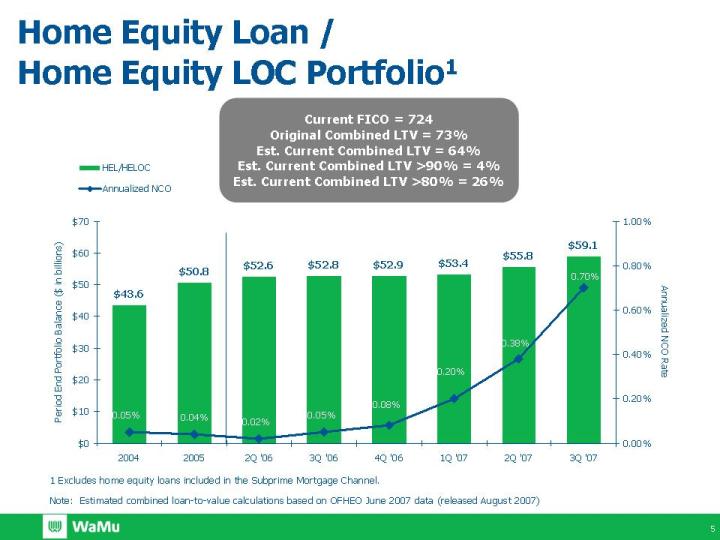
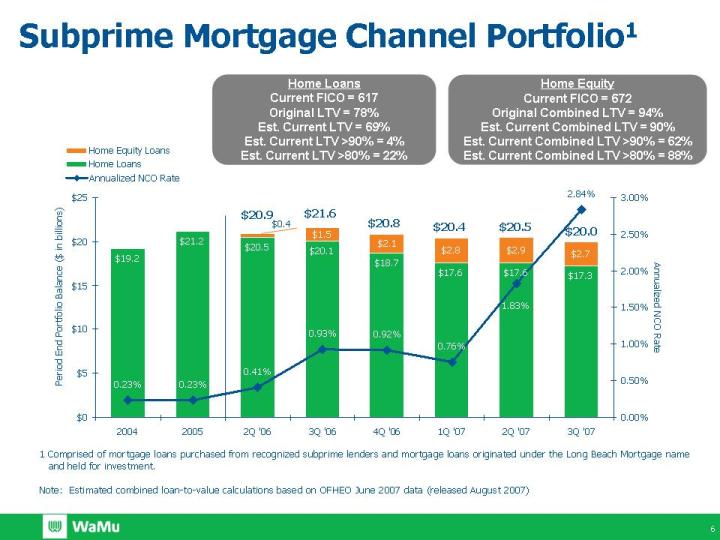
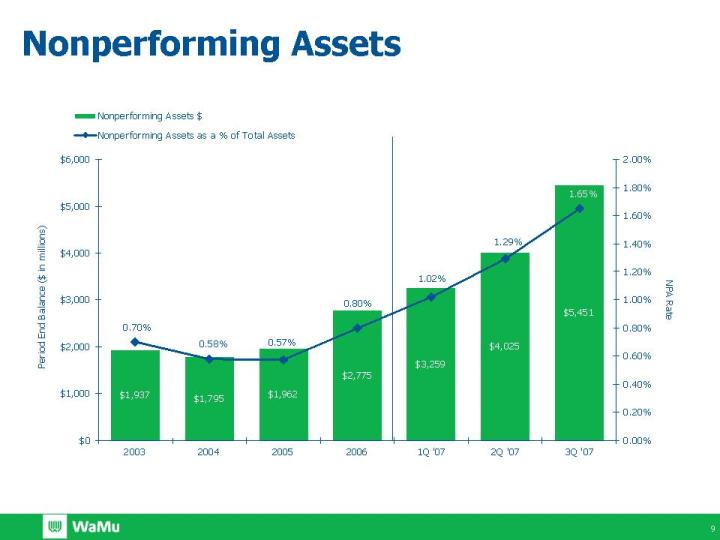
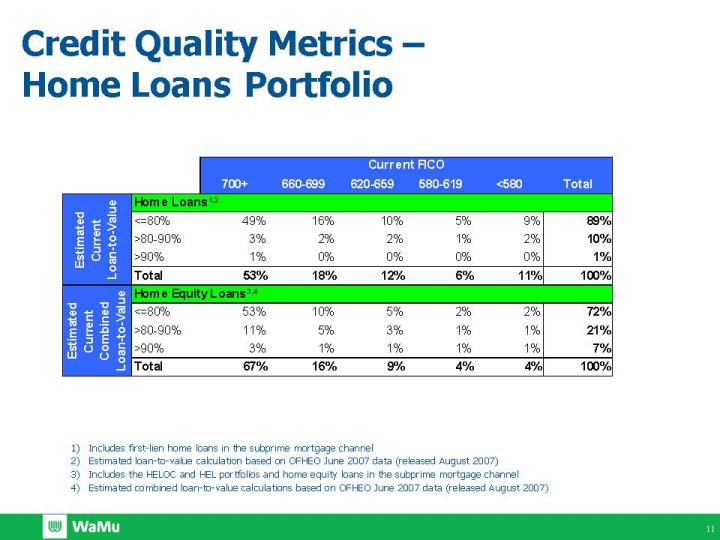
Today, the cycle that is working against us is a declining housing market. As Tom noted, current housing market conditions are very challenging. Housing inventories are rising, demand is falling and prices are declining in most markets. Delinquencies and foreclosures are rising. We expected a downturn from the cyclical highs of a couple of years ago, but as I said earlier, we are definitely experiencing an accelerating downturn at this time. However, I remind everyone that housing will continue to be vital to consumers and will recover at some point. It is not possible to predict the timing, but I expect us to work our way through this downturn and for market conditions to improve.
The cycle of rising short term interest rates and an inverted yield curve which negatively impacted us over the past few years appears to be improving. Most forecasters expect short-term interest rates to fall and the yield curve to steepen. However, the capital markets illiquidity we have experience4d has added a new variable.
My attitude on difficult cycles is that you may not like them, but you must deal with them. And the faster you deal with them, the better. When difficult conditions hit, as owners of the company, we need to ask three key questions: Is management on top of the situation? Does the company have the financial strength to make it through the bottom of the cycle? Does the company have growth prospects once the cycle improves?
On the first point, I believe this management team is strong, deep and is diligently addressing the challenges posed by this environment.
Regarding our financial strength, we have appropriate capital and sources of liquidity to work our way through the cycle.
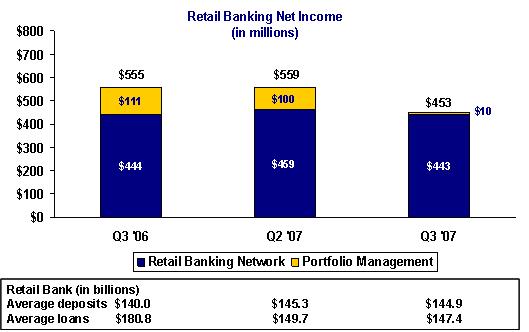
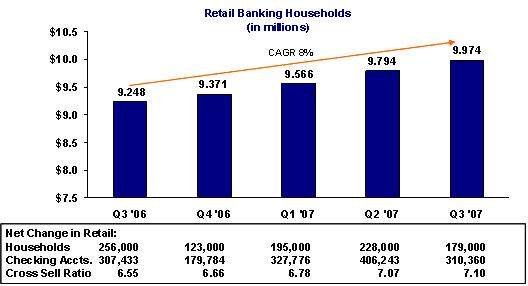
And regarding future growth prospects, we have a high growth retail banking powerhouse driving strong customer growth, increasing cross sales and double digit fee income growth. We have great opportunities to further increase our sales of credit cards, mortgage loans, securities and insurance products to our banking customers. And we are doing the right things to make our home loans operations profitable once the environment stabilizes.
We have also vigorously attacked expenses, giving us excellent operating leverage.
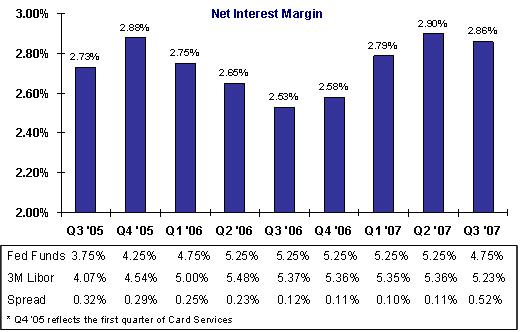
And finally, we have good margin expansion potential if the interest rate environment were to return to more normal conditions. The Fed has reduced rates 50 basis points and appears ready to reduce rates further if economic conditions warrant it. As Tom commented, our short-term funding is primarily LIBOR based which typically follows the Fed Funds rate. A return to a more normal yield curve and lower LIBOR rates would be quite beneficial to our net interest margin.
![]() | Prepared Remarks - October 17, 2007 | Page 14 |
So while we are very attentive to the short term challenges, it is just as important to keep our focus on the long term value creation potential for the company. And we believe that value creation potential is excellent.
Before we take questions, I want to invite you to join us in New York at the Sheraton New York Hotel and Towers on November 7th for our 2007 Investor Day Conference. At that time, we will provide you further detail on credit and our initial outlook for 2008.
With that, Tom, Steve and I would be happy to take your questions.
![](https://capedge.com/proxy/8-K/0001157523-07-009942/slide1.jpg)
1 Credit Risk Management Q3 2007 Prepared Remarks Appendix October 17, 2007
![](https://capedge.com/proxy/8-K/0001157523-07-009942/slide2.jpg)
2 Loan Portfolio Mix $237.1 Billion As of 9/30/07 ($ in billions) 1 Single-Family Residential excludes Custom and Builder Construction and home loans in the Subprime Mortgage Channel. 2 Home Equity excludes home equity loans included in the Subprime Mortgage Channel. 3 Managed Credit Card balances are $17.4 billion higher. Single-Family Residential1 $105.9 45% Home Equity2 $59.1 25% 13% Multi-Family $30.8 Subprime Mortgage Channel $20.0 Credit Cards3 $8.8 Other Commercial $10.2 Other $2.3 8% 4% 4% 1%
![](https://capedge.com/proxy/8-K/0001157523-07-009942/slide3.jpg)
3 1 Excludes Custom and Builder Construction and home loans in the Subprime Mortgage Channel. Note: Estimated combined loan-to-value calculations based on OFHEO June 2007 data (released August 2007) Current FICO = 706 Original LTV = 70% Est. Current LTV = 60% Est. Current LTV>90% = 1% Est. Current LTV>80% = 9% Single-Family Residential Portfolio1
![](https://capedge.com/proxy/8-K/0001157523-07-009942/slide4.jpg)
4 Current FICO = 692 Original LTV = 72% Est. Current LTV = 63% Est. Current LTV>90% = 1% Est. Current LTV>80% = 14% $0.04 $0.01 $0.16 $0.89 $1.12 $49.3 $66.3 $71.2 $63.6 $58.1 $1.30 $53.5 Current> original balance as a % of loan balance Option ARM Portfolio Period End Portfolio Balance ($ in billions) $1.50 $57.9 Note: Estimated combined loan-to-value calculations based on OFHEO June 2007 data (released August 2007)
![](https://capedge.com/proxy/8-K/0001157523-07-009942/slide5.jpg)
5 Current FICO = 724 Original Combined LTV = 73% Est. Current Combined LTV = 64% Est. Current Combined LTV>90% = 4% Est. Current Combined LTV>80% = 26% 1 Excludes home equity loans included in the Subprime Mortgage Channel. Note: Estimated combined loan-to-value calculations based on OFHEO June 2007 data (released August 2007) Home Equity Loan / Home Equity LOC Portfolio1
![](https://capedge.com/proxy/8-K/0001157523-07-009942/slide6.jpg)
6 1 Comprised of mortgage loans purchased from recognized subprime lenders and mortgage loans originated under the Long Beach Mortgage name and held for investment. Note: Estimated combined loan-to-value calculations based on OFHEO June 2007 data (released August 2007) Home Loans Current FICO = 617 Original LTV = 78% Est. Current LTV = 69% Est. Current LTV>90% = 4% Est. Current LTV>80% = 22% Home Equity Current FICO = 672 Original Combined LTV = 94% Est. Current Combined LTV = 90% Est. Current Combined LTV>90% = 62% Est. Current Combined LTV>80% = 88% $20.9 Subprime Mortgage Channel Portfolio1 $0.4 $21.6 $20.8 $20.4 $20.5 $20.0
![](https://capedge.com/proxy/8-K/0001157523-07-009942/slide7.jpg)
7 1 Other Commercial consists of Other Real Estate and Commercial Loans. 1 $31.2 $32.8 $34.0 $35.1 $38.6 $38.0 $38.0 Commercial Portfolio $41.0
![](https://capedge.com/proxy/8-K/0001157523-07-009942/slide8.jpg)
8 Data presented for periods prior to 4Q ‘05 is for Providian Financial Corp. Managed Card Services Portfolio
![](https://capedge.com/proxy/8-K/0001157523-07-009942/slide9.jpg)
9 Nonperforming Assets
![](https://capedge.com/proxy/8-K/0001157523-07-009942/slide10.jpg)
10 1 Net charge-offs and provision for 2005 reflect the acquisition of Providian on 10/1/2005. Allowance for Loan and Lease Losses 1
![](https://capedge.com/proxy/8-K/0001157523-07-009942/slide11.jpg)
11 Credit Quality Metrics – Home Loans Portfolio Includes first-lien home loans in the subprime mortgage channel Estimated loan-to-value calculation based on OFHEO June 2007 data (released August 2007) Includes the HELOC and HEL portfolios and home equity loans in the subprime mortgage channel Estimated combined loan-to-value calculations based on OFHEO June 2007 data (released August 2007)
![](https://capedge.com/proxy/8-K/0001157523-07-009942/slide12.jpg)
12 This presentation contains forward-looking statements, which are not historical facts and pertain to future operating results. These forward-looking statements are within the meaning of the Private Securities Litigation Reform Act of 1995. These forward-looking statements include, but are not limited to, statements about our plans, objectives, expectations and intentions and other statements contained in this document that are not historical facts. When used in this presentation, the words “expects,” “anticipates,” intends,” “plans,” believes,” “seeks,” estimates,” or words of similar meaning, or future or conditional verbs such as statements inherently subject to significant business, economic and competitive uncertainties and contingencies, many of which are beyond our control. In addition, these forward-looking statements are subject to assumptions with respect to future business strategies and decisions that are subject to change. Actual results may differ materially from the results discussed in these forward-looking statements for the reasons, among others, discussed under the heading “Factors That May Affect Future Results” in Washington Mutual’s 2006 Annual Report on Form 10-K and “Cautionary Statements” in our Forms 10-Q for the quarters ended March 31, 2007 and June 30, 2007 which include: Volatile interest rates and their impact on the mortgage banking business; Credit risk; Operational risk; Risks related to credit card operations; Changes in the regulation of financial services companies, housing government-sponsored enterprises and credit card lenders; Competition from banking and nonbanking companies; General business, economic and market conditions; Reputational risk; Liquidity risk. There are other factors not described in our 2006 Form 10-K and Form 10-Q for the quarter ended March 31, 2007 and June 30, 2007 which are beyond the Company’s ability to anticipate or control that could cause results to differ. Cautionary Statements