MANAGEMENT’S DISCUSSION AND ANALYSIS OF FINANCIAL CONDITION AND RESULTS OF OPERATIONS
The following discussion and analysis is intended to assist readers in understanding the consolidated financial condition and results of operations of IBERIABANK Corporation (the “Company”) and its subsidiary as of December 31, 2002 and 2003 and for the years ended December 31, 2001 through 2003. This review should be read in conjunction with the audited consolidated financial statements, accompanying footnotes and supplemental financial data included herein.
FINANCIAL OVERVIEW
The Company’s net income for 2003 totaled $23.6 million, or $3.42 per share on a diluted basis. This is a 13% increase over the $3.02 per share, or $18.5 million earned for 2002. Earnings performance for 2003 was influenced by the acquisition of Acadiana Bancshares, Inc. (“Acadiana”) in the first quarter of 2003, and other factors, the key components of which are summarized below.
| | • | Total assets of the Company increased to $2.1 billion at the end of 2003, or 35%, from $1.6 billion at the end of 2002. This strong growth is reflective not only of the $302.5 million asset base obtained through the Acadiana acquisition, but organic growth through new and deepened client relationships amounting to $242.7 million as well. Shareholders’ equity for the same periods improved from $139.6 million at the end of 2002 to $195.2 million at the end of 2003. |
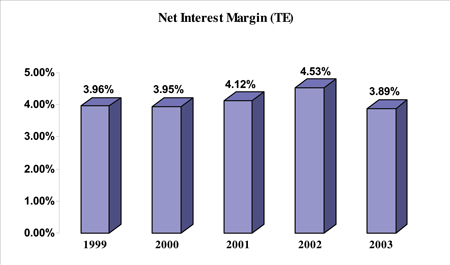
| | • | Net interest income increased by $8.0 million, or 13%. This was largely due to increased volume and improvement in the mix of both earning assets and deposits. The corresponding net interest margin ratio on a tax-equivalent basis declined to 3.89% from 4.53%. This was primarily the result of higher mortgage prepayment speeds which resulted in increased premium amortizations on related products and also a downward trend in spreads associated with the earning asset growth. Additionally, the Acadiana acquisition resulted in increased net interest income, but a reduction of the margin as a result of marking the acquired asset and liability mix to current yields. |
| | • | Improvement in noninterest income of $5.2 million, or 29%, was reflected in 2003 as compared to the prior year. Increased gains on the sales of mortgage loans in the secondary market as mortgage loan refinancing hit all-time highs and also service charge fees derived from deposit accounts were the major contributing factors to the growth. |
| | • | Noninterest expense increased by $6.6 million, or 15%, from 2002 to 2003. The increase was due in part to the inclusion of expenses related to the acquisition of Acadiana. Compensation expense increased $3.5 million mainly as a result of new hires associated with this acquisition. It was also due in part to the rising cost of the Employee Stock Ownership Plan (“ESOP”) as it relates to the improved value of Company stock and continuance of the Company to hire strategically in markets across the state. Other increases were primarily associated with infrastructure improvements. |
| | • | The Company provided $6.3 million for possible loan losses for 2003 as compared to $6.2 million for 2002 to bring the allowance for loan losses as a percent of total loans to 1.29% at the end of the year, as compared to 1.25% at the end of 2002. Net charge-offs for 2003 were $3.6 million, or 0.28% of average loans, compared to $4.2 million, or 0.43% a year earlier. The coverage of nonperforming assets by the allowance for loan losses was 2.5 times at the end of 2003, as compared to 2.0 times at the end of 2002. |
The year 2003 also set the stage for future expansion with the announcements of several strategic hires, the development of a branch in Shreveport, Louisiana and our entrance into Baton Rouge, Louisiana with the acquisition of Alliance Bank of Baton Rouge in the first quarter of 2004. Also scheduled for early in 2004 is the opening of a private banking branch office in New Orleans, Louisiana. These steps take advantage of lending opportunities that are believed to exist due to the size and flexibility of the Company as compared to its competitors, primarily with
commercial and private banking clients. It is anticipated that these relationships will result in increased deposits, as well. The Company will continue to analyze the potential for growth in new and existing markets as they arise.
The Company’s continuing focus is that of a high performing institution. Management believes that improvement in core earnings drives shareholder value and has adopted a mission statement that is designed to provide guidance for management, our associates and Board of Directors regarding the sense of purpose and direction of the Company. We are extremely shareholder and client focused, expect high performance from our associates, believe in a strong sense of community and strive to make the Company a great place to work. Earnings guidance, based on expectations of the Company, is provided during the year through press releases, which are available on our website and also disclosed through the Form 8-K current event filings with the Securities and Exchange Commission (“SEC”).
Inherent in any organization are risks associated with the industry. The most important risk factors affecting the success of the Company are believed to be the management of loan credit risk and interest rate risk, which are discussed under their respective sections entitled “Loans and Asset Quality” and “Asset Liability Management and Market Risk” later in this discussion.
APPLICATION OF CRITICAL ACCOUNTING POLICIES
In preparing financial reports, management is required to apply significant judgment to various accounting, reporting and disclosure matters. Management must use assumptions and estimates to apply these principles where actual measurement is not possible or practical. The accounting principles and methods used by the Company conform with accounting principles generally accepted in the United States and general banking practices. Estimates and assumptions most significant to the Company relate primarily to the allowance for loan losses, intangible assets and stock option compensation. These significant estimates and assumptions are summarized in the following discussion and are further analyzed in the footnotes to the consolidated financial statements.
The determination of the allowance for loan losses, which represents management’s estimate of probable losses inherent in the Company’s credit portfolio, involves a high degree of judgment and complexity. The Company’s policy is to establish reserves for estimated losses on delinquent and other problem loans when it is determined that losses are expected to be incurred on such loans and leases. Management’s determination of the adequacy of the allowance is based on various factors, including an evaluation of the portfolio, past loss experience, current economic conditions, the volume and type of lending conducted by the Company, composition of the portfolio, the amount of the Company’s classified assets, seasoning of the loan portfolio, the status of past due principal and interest payments, and other relevant factors. Changes in such estimates may have a significant impact on the financial statements. For further discussion of the allowance for loan losses, see the Loan and Asset Quality section of this analysis and Note 1 to the Consolidated Financial Statements.
Generally accepted accounting principles require the Company to perform a goodwill valuation at least annually. Impairment testing of goodwill is a two step process that first compares the fair value of goodwill with its carrying amount, and second measures impairment loss by comparing the implied fair value of goodwill with the carrying amount of that goodwill. Based on management’s goodwill impairment tests, there was no impairment of goodwill in 2002 or 2003.
The Company has elected to account for its stock option plans under the intrinsic value method of Accounting Principles Board (APB) Opinion No. 25,Accounting for Stock Issued to Employees. In accordance with APB Opinion No. 25, compensation expense relating to stock options is not reflected in net income provided the exercise price of the stock options granted equals or exceeds the market value of the underlying common stock at the date of grant. The Company’s practice has been to grant options at no less than the fair market value of the stock at the date of grant. Statement of Financial Accounting Standard (FAS) No. 123,Accounting for Stock-Based Compensation, encourages all entities to adopt a fair value based method of accounting for employee stock compensation plans, whereby compensation cost is measured at the grant date based on the value of the award and is recognized over the service period, which is usually the vesting period. Given the Company’s election to continue with the accounting methodology in APB Opinion No. 25, management is required to provide proforma disclosures of net income and earnings per share and other disclosures, as if the fair value based method of accounting had been applied.
Management utilizes the Black-Scholes option valuation model to estimate the fair value of stock options. The option valuation model requires the input of highly subjective assumptions, including the expected stock price volatility. Changes in the subjective input assumptions can materially affect the fair value estimate. For additional discussion of the Company’s stock options plans, see Note 15 to the Consolidated Financial Statements.
FINANCIAL CONDITION
Earning Assets
Earning assets are composed of interest or dividend-bearing assets, including loans, securities, short-term investments and loans held for sale. Interest income associated with earning assets is the Company’s primary source of income. Total average earning assets increased $454.7 million, or 34%, in 2003 as compared to 2002. The year-end mix of earning assets shown in the following chart reflects the mix between investment securities and the major loan groups.
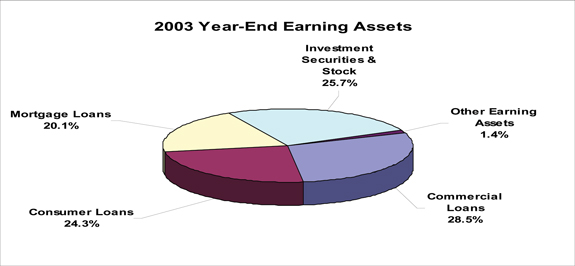
Loans and Asset Quality –The loan portfolio increased $367.9 million, or 35.2%, to $1.4 billion at December 31, 2003, compared to $1.0 billion at December 31, 2002. The increase in loans since year-end 2002 was due to non-acquisition related internal growth of $202.5 million, as well as $192.3 million of additional loans obtained through the acquisition of Acadiana, less the sale of $26.9 million of residential mortgage loans obtained through the acquisition. Commercial loans increased $139.0 million, or 33.6%, mortgage loans increased $165.7 million, or 74.1%, and consumer loans increased $63.2 million, or 15.5%. Excluding the accounting effect of the acquisition, commercial loans increased $68.5 million, residential mortgage loans increased $102.7 million and consumer loans increased $31.3 million.
Growth in the commercial loan portfolio came primarily from traditional commercial, private banking and institutional sectors of the New Orleans and Acadiana Markets, with no one customer representing a disproportionate percentage of the increase. Mortgage loan growth is primarily the result of larger private banking residential and construction loan originations that provide relationships with high net worth clients. The Company continues to sell the majority of conforming fixed rate mortgage loan originations and recognize the associated fee income rather than assume the rate risk associated with these longer term assets. Consumer loans are mainly composed of indirect automobile loans collateralized by both new and used vehicles, home equity loans and other consumer loans. Consumer loan growth came primarily from retail home equity loans and was bolstered by a modest increase in other consumer categories. The Company maintains a focus on loans believed to be prime, or lower risk, consumer loans.
The loss of any one customer, or group of customers engaged in similar activities, would not have a material adverse effect on the Company. The percentage of fixed rate loans within the total loan portfolio has decreased slightly from 71% in 2002 to 69% in 2003.
The following table sets forth the composition of the Company’s loan portfolio as of December 31 for the years indicated.
TABLE 1 – LOAN PORTFOLIO COMPOSITION
| | | | | | | | | | | | | | | | | | | | | | | | | | | | | | |
| | | December 31,
| |
(dollars in thousands)
| | 2003
| | | | | 2002
| | | | | 2001
| | | | | 2000
| | | | | 1999
| | | |
Commercial loans: | | | | | | | | | | | | | | | | | | | | | | | | | | | | | | |
Real estate | | $ | 352,031 | | 25 | % | | $ | 254,688 | | 25 | % | | $ | 228,284 | | 24 | % | | $ | 196,479 | | 21 | % | | $ | 157,248 | | 19 | % |
Other | | | 201,020 | | 14 | | | | 159,339 | | 15 | | | | 117,530 | | 12 | | | | 78,986 | | 8 | | | | 82,485 | | 10 | |
| | |
|
| |
|
| |
|
| |
|
| |
|
| |
|
| |
|
| |
|
| |
|
| |
|
|
Total commercial loans | | | 553,051 | | 39 | | | | 414,027 | | 40 | | | | 345,814 | | 36 | | | | 275,465 | | 29 | | | | 239,733 | | 29 | |
| | |
|
| |
|
| |
|
| |
|
| |
|
| |
|
| |
|
| |
|
| |
|
| |
|
|
Mortgage loans: | | | | | | | | | | | | | | | | | | | | | | | | | | | | | | |
Residential 1-4 family | | | 338,965 | | 24 | | | | 207,130 | | 20 | | | | 198,403 | | 21 | | | | 279,193 | | 30 | | | | 266,161 | | 31 | |
Construction | | | 50,295 | | 4 | | | | 16,470 | | 1 | | | | 5,915 | | 1 | | | | 7,482 | | 1 | | | | 6,381 | | 1 | |
| | |
|
| |
|
| |
|
| |
|
| |
|
| |
|
| |
|
| |
|
| |
|
| |
|
|
Total mortgage loans | | | 389,260 | | 28 | | | | 223,600 | | 21 | | | | 204,318 | | 22 | | | | 286,675 | | 31 | | | | 272,542 | | 32 | |
| | |
|
| |
|
| |
|
| |
|
| |
|
| |
|
| |
|
| |
|
| |
|
| |
|
|
Loans to individuals: | | | | | | | | | | | | | | | | | | | | | | | | | | | | | | |
Indirect automobile | | | 229,636 | | 16 | | | | 219,280 | | 21 | | | | 220,698 | | 23 | | | | 205,143 | | 22 | | | | 179,350 | | 21 | |
Home equity | | | 174,740 | | 12 | | | | 122,799 | | 12 | | | | 114,056 | | 12 | | | | 108,070 | | 11 | | | | 91,531 | | 11 | |
Other | | | 65,662 | | 5 | | | | 64,786 | | 6 | | | | 71,129 | | 7 | | | | 65,172 | | 7 | | | | 59,722 | | 7 | |
| | |
|
| |
|
| |
|
| |
|
| |
|
| |
|
| |
|
| |
|
| |
|
| |
|
|
Total consumer loans | | | 470,038 | | 33 | | | | 406,865 | | 39 | | | | 405,883 | | 42 | | | | 378,385 | | 40 | | | | 330,603 | | 39 | |
| | |
|
| |
|
| |
|
| |
|
| |
|
| |
|
| |
|
| |
|
| |
|
| |
|
|
| | | | | | | | | | |
Total loans receivable | | $ | 1,412,349 | | 100 | % | | $ | 1,044,492 | | 100 | % | | $ | 956,015 | | 100 | % | | $ | 940,525 | | 100 | % | | $ | 842,878 | | 100 | % |
| | |
|
| |
|
| |
|
| |
|
| |
|
| |
|
| |
|
| |
|
| |
|
| |
|
|
Commercial Loans.Commercial real estate and commercial business loans generally have shorter repayment periods and more frequent repricing opportunities than residential 1-4 family loans. The Company has increased its investment in commercial real estate loans from $254.7 million, or 24.4% of the total loan portfolio, as of December 31, 2002, to $352.0 million, or 24.9% of the total loan portfolio, as of December 31, 2003. The properties securing the Company’s commercial real estate loans are located in the Company’s market area, and include owner-occupied, multi-family, strip shopping centers, professional office buildings, small retail establishments and warehouses. The Company’s underwriting standards generally provide for loan terms of three to five years, with amortization schedules of no more than twenty years. Low loan-to-value ratios are maintained and usually limited to no more than 80%. As a rule, the Company obtains personal guarantees of the principals as additional security for most commercial real estate loans.
As of December 31, 2003, the Company’s commercial business loans amounted to $201.0 million, or 14.2% of the Company’s gross loan portfolio. The Company originates commercial business loans on a secured and, to a lesser extent, unsecured basis. The Company’s commercial business loans may be structured as term loans or revolving lines of credit. Term loans are generally structured with terms of no more than three to five years, with amortization schedules of no more than seven years. The Company’s commercial business term loans are generally secured by equipment, machinery or other corporate assets. The Company also provides for revolving lines of credit generally structured as advances upon perfected security interests in accounts receivable and inventory. Revolving lines of credit generally have an annual maturity. As a rule, the Company obtains personal guarantees of the principals as additional security for commercial business loans.
Mortgage Loans.Residential 1-4 family loans comprise substantially all of the Company’s mortgage loans. Properties located in its market area and originated under terms and documentation which permit their sale in the secondary market secure the vast majority of the Company’s residential 1-4 family mortgage loan portfolio. To reduce portfolio rate risk, the Company’s practice has been to sell, or hold for sale in the secondary market, the majority of all conforming fixed rate mortgage loan originations and retain adjustable rate mortgage loan originations in the portfolio. Larger mortgage loans of private banking clients and prospects are also retained to enhance relationships, and also due to the expected shorter durations and relatively lower servicing costs associated with loans of this size.
As a result of the decline in long-term rates over the past three years, with a low point in the middle of 2003, there was a considerable amount of refinancing activity in mortgage loan portfolios industry-wide as well as increased construction lending. Accordingly, mortgage loan originations hit record levels in 2003. Consistent with previous practice, the Company continued to sell in the secondary market the majority of newly originated and refinanced conventional loans, as well as a portion of the construction loans as they move to long-term financing. This was done to reduce portfolio rate risk on loans with longer expected durations and limited cross-sell opportunities. During 2003, the mortgage loan portfolio grew by $165.7 million, or 74.1%. The increase was due to internal growth of $102.7 million plus $89.9 million of residential mortgage loans obtained through the acquisition of Acadiana, net of $26.9 million of this group sold immediately after the acquisition due to expected prepayment acceleration. Mortgage loan internal growth was primarily the result of construction lending and retention of larger private banking residential loans. Additionally, opportunities available in the secondary market afforded the ability to selectively purchase in-market jumbo (over $333,700 individually) mortgage loans as part of the Company’s efforts to expand private banking relationships. If conventional mortgage rates remain unchanged or increase, it is expected that mortgage loan activity will slow as a result of the smaller population of existing mortgage loans that would benefit from refinancing. At December 31, 2003, $278.8 million, or 71.6%, of the Company’s residential 1-4 family mortgage and construction loans were fixed rate loans and $110.5 million, or 28.4%, were adjustable rate loans.
Consumer Loans.The Company offers consumer loans in order to provide a full range of retail financial services to its customers. The Company originates substantially all of such loans in its primary market area. At December 31, 2003, $470.0 million, or 33.3% of the Company’s total loan portfolio, was comprised of consumer loans, compared to $406.9 million, or 39.0% at the end of 2002. During 2003, the consumer loan portfolio increased $63.2 million, or 15.5%. The increase was due to $31.9 million of consumer loans obtained through the acquisition of Acadiana, as well as internal growth of $31.3 million.
Indirect automobile loans comprised the largest component of the Company’s consumer loan portfolio. Independent automobile dealerships originate these loans and forward applications to Company personnel for approval or denial. The Company relies on the dealerships, in part, for loan qualifying information. To that extent, there is risk inherent in indirect automobile loans associated with fraud or negligence by the automobile dealership. To limit this risk, an emphasis is placed on established dealerships that have demonstrated reputable behavior, both within the communities we serve and through long-term relationships with the Company. Growth in the indirect automobile loan category was $10.4 million, or 4.7%. This growth was achieved while maintaining a focus on prime, or low risk, paper. Captive finance companies continue to provide a high level of competition for this business. At December 31, 2003, $229.6 million, or 16.3% of the Company’s total loan portfolio, consisted of indirect automobile loans.
The remainder of the consumer loan portfolio at December 31, 2003 was composed of home equity loans, direct automobile loans, credit card loans and other consumer loans. Consumer loan growth, primarily driven by $51.9 million in home equity loans, was bolstered by a modest increase in other consumer categories. At December 31, 2003, $174.7 million, or 12.4% of the Company’s total loan portfolio, made up the home equity loan balance. At December 31, 2003, the Company’s direct automobile loans amounted to $24.8 million, or 1.8% of the Company’s total loan portfolio. The Company’s VISA and MasterCard credit card loans totaled $9.0 million, or 0.6% of the Company’s total loan portfolio at such date. The Company’s other personal consumer loans amounted to $31.9 million, or 2.3% of the Company’s total loan portfolio, at December 31, 2003.
Loan Maturities.The following table sets forth the scheduled contractual maturities of the Company’s loan portfolio at December 31, 2003, unadjusted for scheduled principal reductions, prepayments or repricing opportunities. Demand loans, loans having no stated schedule of repayments and no stated maturity and overdraft loans are reported as due in one year or less. The average life of a loan may be substantially less than the contractual terms because of prepayments. As a result, scheduled contractual amortization of loans is not reflective of the expected term of the Company’s loan portfolio. Over 78% of the value of loans with maturities greater than one year bears a fixed rate of interest.
TABLE 2 – LOAN MATURITIES BY TYPE
| | | | | | | | | | | | |
(dollars in thousands)
| | One Year or Less
| | One Through Five Years
| | After Five Years
| | Total
|
Commercial real estate | | $ | 89,982 | | $ | 207,223 | | $ | 54,826 | | $ | 352,031 |
Commercial other | | | 81,686 | | | 77,150 | | | 42,184 | | | 201,020 |
Mortgage residential 1-4 family | | | 6,309 | | | 15,111 | | | 317,545 | | | 338,965 |
Mortgage construction | | | 50,295 | | | — | | | — | | | 50,295 |
Consumer | | | 103,564 | | | 239,206 | | | 127,268 | | | 470,038 |
| | |
|
| |
|
| |
|
| |
|
|
Total | | $ | 331,836 | | $ | 538,690 | | $ | 541,823 | | $ | 1,412,349 |
| | |
|
| |
|
| |
|
| |
|
|
Asset Quality.The credit quality of the Company’s assets has continued to improve as management has assertively worked to enhance underwriting risk/return dynamics within the loan portfolio. Over time, management has significantly increased the allowance for loan losses, tightened underwriting guidelines and procedures, adopted more conservative consumer loan charge-off and nonaccrual guidelines, rewritten the loan policy and developed an internal loan review function. As the Company has transitioned the loan portfolio to be more representative of a commercial bank, there is recognition of a potential for higher charge-off and nonperforming levels, but also a potential higher level of return for investors. Management believes that historically it has recognized and disclosed significant problem loans quickly and taken prompt action in addressing material weaknesses in those credits. The Company will continue to monitor the risk adjusted level of return within the loan portfolio.
Written underwriting standards established by the Board of Directors and management govern the lending activities of the Company. The commercial credit department, in conjunction with senior lending personnel, underwrites all commercial business and commercial real estate loans. The Company provides centralized underwriting of all residential mortgage, construction and consumer loans. Established loan origination procedures require appropriate documentation including financial data and credit reports. For loans secured by real property, the Company generally requires property appraisals, title insurance or a title opinion, hazard insurance and flood insurance, where appropriate.
Loan payment performance is monitored and late charges are assessed on past due accounts. A centralized department collects delinquent consumer, residential mortgage and construction loans. Every effort is made to minimize any potential loss, including instituting legal proceedings, as necessary. Commercial loans of the Company are periodically reviewed through a loan review process. All other loans are also subject to loan review through a periodic sampling process.
The Company utilizes an asset risk classification system in compliance with guidelines established by the Federal Reserve Board as part of its efforts to improve commercial asset quality. In connection with examinations of insured institutions, both federal and state examiners also have the authority to identify problem assets and, if appropriate, classify them. There are three classifications for problem assets: “substandard,” “doubtful” and “loss.” Substandard assets have one or more defined weaknesses and are characterized by the distinct possibility that the insured institution will sustain some loss if the deficiencies are not corrected. Doubtful assets have the weaknesses of substandard assets with the additional characteristic that the weaknesses make collection or liquidation in full questionable and there is a high probability of loss based on currently existing facts, conditions and values. An asset classified as loss is not considered collectable and of such little value that continuance as an asset of the Company is not warranted. Commercial loans with adverse classifications are reviewed by the Loan Committee of the Board of Directors at least monthly. Loans are placed on nonaccrual status when, in the judgment of management, the probability of collection of interest is deemed to be insufficient to warrant further accrual. When a loan is placed on nonaccrual status, previously accrued but unpaid interest for the current year is deducted from interest income. Prior year interest is charged-off to the allowance for loan losses.
At December 31, 2003, the Company had $12.4 million of assets classified as substandard, $501,000 of assets classified as doubtful, and no assets classified as loss. At such date, the aggregate of the Company’s classified assets amounted to 0.61% of total assets.
Real estate acquired by the Company as a result of foreclosure or by deed-in-lieu of foreclosure is classified as real estate owned until sold, and is carried at the balance of the loan at the time of acquisition or at estimated fair value less estimated costs to sell, whichever is less.
Under Generally Accepted Accounting Principles, the Company is required to account for certain loan modifications or restructurings as “troubled debt restructurings.” In general, the modification or restructuring of a debt constitutes a troubled debt restructuring if the Company for economic or legal reasons related to the borrower’s financial difficulties grants a concession to the borrower that the Company would not otherwise consider under current market conditions. Debt restructurings or loan modifications for a borrower do not necessarily always constitute troubled debt restructurings, however, and troubled debt restructurings do not necessarily result in nonaccrual loans. The Company had no troubled debt restructuring as of December 31, 2003.
Nonperforming loans, defined for these purposes as nonaccrual loans plus accruing loans past due 90 days or more, totaled $5.1 million and $4.3 million at December 31, 2003 and 2002, respectively. The Company’s foreclosed property amounted to $2.1 million and $2.3 million at December 31, 2003 and 2002, respectively. Nonperforming assets, which consist of nonperforming loans plus foreclosed property, were $7.3 million, or 0.34% of total assets at December 31, 2003, compared to $6.6 million, or 0.42% of total assets at December 31, 2002.
The Company has shown continuing improvement in asset quality despite annualized double-digit growth in loans. Although the balance of nonperforming assets increased, the relative level of these assets as a percentage of total assets declined considerably from 0.42% at the end of 2002 to 0.34% at the end of 2003. The increase in nonperforming assets of $646,000 during this period was due to increases in the amount of nonaccrual loans and loans past due, partially offset by reductions in the amount of foreclosed property. Foreclosed properties, representing approximately 29% of total nonperforming assets, declined slightly. This category is principally composed of one commercial real estate property, which was sold to a third party in January 2004. The following table sets forth the composition of the Company’s nonperforming assets, including accruing loans past due 90 or more days, as of the dates indicated.
TABLE 3 – NONPERFORMING ASSETS AND TROUBLED DEBT RESTRUCTURINGS
| | | | | | | | | | | | | | | | | | | | |
| | | December 31,
| |
(dollars in thousands)
| | 2003
| | | 2002
| | | 2001
| | | 2000
| | | 1999
| |
Nonaccrual loans: | | | | | | | | | | | | | | | | | | | | |
Commercial, financial and agricultural | | $ | 1,838 | | | $ | 1,693 | | | $ | 4,088 | | | $ | 5,169 | | | $ | 1,293 | |
Mortgage | | | 552 | | | | 334 | | | | 122 | | | | 137 | | | | 208 | |
Loans to individuals | | | 1,512 | | | | 1,230 | | | | 1,053 | | | | 161 | | | | 429 | |
| | |
|
|
| |
|
|
| |
|
|
| |
|
|
| |
|
|
|
Total nonaccrual loans | | | 3,902 | | | | 3,257 | | | | 5,263 | | | | 5,467 | | | | 1,930 | |
Accruing loans 90 days or more past due | | | 1,220 | | | | 1,086 | | | | 1,691 | | | | 2,074 | | | | 1,203 | |
| | |
|
|
| |
|
|
| |
|
|
| |
|
|
| |
|
|
|
Total nonperforming loans (1) | | | 5,122 | | | | 4,343 | | | | 6,954 | | | | 7,541 | | | | 3,133 | |
Foreclosed property | | | 2,134 | | | | 2,267 | | | | 6,009 | | | | 421 | | | | 185 | |
| | |
|
|
| |
|
|
| |
|
|
| |
|
|
| |
|
|
|
Total nonperforming assets (1) | | | 7,256 | | | | 6,610 | | | | 12,963 | | | | 7,962 | | | | 3,318 | |
Performing troubled debt restructurings | | | — | | | | — | | | | — | | | | — | | | | — | |
| | |
|
|
| |
|
|
| |
|
|
| |
|
|
| |
|
|
|
Total nonperforming assets and troubled debt restructurings (1) | | $ | 7,256 | | | $ | 6,610 | | | $ | 12,963 | | | $ | 7,962 | | | $ | 3,318 | |
| | |
|
|
| |
|
|
| |
|
|
| |
|
|
| |
|
|
|
Nonperforming loans to total loans (1) | | | 0.36 | % | | | 0.42 | % | | | 0.73 | % | | | 0.80 | % | | | 0.37 | % |
Nonperforming assets to total assets (1) | | | 0.34 | % | | | 0.42 | % | | | 0.91 | % | | | 0.57 | % | | | 0.24 | % |
Nonperforming assets and troubled | | | | | | | | | | | | | | | | | | | | |
debt restructurings to total assets (1) | | | 0.34 | % | | | 0.42 | % | | | 0.91 | % | | | 0.57 | % | | | 0.24 | % |
| | |
|
|
| |
|
|
| |
|
|
| |
|
|
| |
|
|
|
| (1) | Nonperforming loans and assets include accruing loans 90 days or more past due |
Allowance For Loan Losses.Based on facts and circumstances available, management of the Company believes that the allowance for loan losses was adequate at December 31, 2003 to cover any potential losses in the Company’s loan portfolio. However, future adjustments to this allowance may be necessary, and the Company’s results of operations could be adversely affected if circumstances differ substantially from the assumptions used by management in determining the allowance for loan losses. Losses in the loan portfolio, net of recoveries, are charged-off against the allowance and reduce the balance. Provisions for loan losses, which are charged against income, increase the allowance.
In determining the amount of the allowance for loan losses, management uses information from its portfolio management process, relationship managers and ongoing loan review efforts to stratify the loan portfolio into asset risk classifications and assign a general or specific reserve allocation. General reserve estimated loss percentages are based on the current and historical loss experience of each loan category, regulatory guidelines for losses, the status of past due payments, and management’s judgment of economic conditions and related level of risk assumed. Specific reserves are determined on a loan-by-loan basis based on management’s evaluation of loss exposure for each credit, given current payment status of the loan and the value of any underlying collateral. Loans for which specific reserves are provided are excluded from the general reserve calculations described above to prevent duplicate reserves. Additionally, an unallocated reserve for the total loan portfolio is established to address 1) the imprecision and estimation risk inherent in the calculations of general and specific reserves, and 2) management’s evaluation of various conditions that are not directly measured by any other component of the allowance. Such components would include current general economic conditions affecting key lending areas, credit quality trends, collateral values, loan volumes and concentrations, seasoning of the loan portfolios and the findings of internal credit examinations.
The following table presents the allocation of the allowance for loan losses and the percentage of the total amount of loans in each loan category listed as of the dates indicated.
TABLE 4 – ALLOCATION OF THE ALLOWANCE FOR LOAN LOSSES
| | | | | | | | | | | | | | | | | | | | | | | | | | | | | | |
| | | December 31,
| |
(dollars in thousands)
| | 2003
| | | | | 2002
| | | | | 2001
| | | | | 2000
| | | | | 1999
| | | |
Commercial, financial and agricultural | | $ | 9,237 | | 39 | % | | $ | 6,243 | | 40 | % | | $ | 5,066 | | 36 | % | | $ | 4,152 | | 29 | % | | $ | 3,484 | | 29 | % |
Real estate – mortgage | | | 913 | | 24 | | | | 569 | | 20 | | | | 555 | | 21 | | | | 763 | | 30 | | | | 773 | | 31 | |
Real estate – construction | | | 135 | | 4 | | | | 45 | | 1 | | | | 17 | | 1 | | | | 21 | | 1 | | | | 18 | | 1 | |
Loans to individuals | | | 5,707 | | 33 | | | | 4,992 | | 39 | | | | 5,000 | | 42 | | | | 4,616 | | 40 | | | | 3,828 | | 39 | |
Unallocated | | | 2,238 | | N/A | | | | 1,252 | | N/A | | | | 479 | | N/A | | | | 687 | | N/A | | | | 646 | | N/A | |
| | |
|
| |
|
| |
|
| |
|
| |
|
| |
|
| |
|
| |
|
| |
|
| |
|
|
Total allowance for loan losses | | $ | 18,230 | | 100 | % | | $ | 13,101 | | 100 | % | | $ | 11,117 | | 100 | % | | $ | 10,239 | | 100 | % | | $ | 8,749 | | 100 | % |
| | |
|
| |
|
| |
|
| |
|
| |
|
| |
|
| |
|
| |
|
| |
|
| |
|
|
The allowance for loan losses amounted to $18.2 million, or 1.29% and 355.9% of total loans and total nonperforming loans, respectively, at December 31, 2003 compared to 1.25% and 301.6%, respectively, at December 31, 2002. The allowance for loan losses increased $5.1 million, or 39.1%, from $13.1 million at December 31, 2002. The increase included a $6.3 million provision for loan losses and $2.4 million assigned to loans acquired as part of the Acadiana acquisition. On a percentage basis, net charge-offs for 2003 were 0.28% of total average loans, down from 0.43% in 2002. The Company believes this level of net charge-offs was more favorable than that of peer institutions with assets in the $1 to $3 billion range based on data published by the Federal Financial Institutions Examination Council (“FFIEC”). The following table sets forth the activity in the Company’s allowance for loan losses during the periods indicated.
TABLE 5 – SUMMARY OF ACTIVITY IN THE ALLOWANCE FOR LOAN LOSSES
| | | | | | | | | | | | | | | | | | | | |
| | | Years Ended December 31,
| |
(dollars in thousands)
| | 2003
| | | 2002
| | | 2001
| | | 2000
| | | 1999
| |
Allowance at beginning of period | | $ | 13,101 | | | $ | 11,117 | | | $ | 10,239 | | | $ | 8,749 | | | $ | 7,135 | |
Allowance from acquisition | | | 2,439 | | | | — | | | | — | | | | — | | | | — | |
Provisions | | | 6,300 | | | | 6,197 | | | | 5,046 | | | | 3,861 | | | | 2,836 | |
Charge-offs: | | | | | | | | | | | | | | | | | | | | |
Commercial, financial and agricultural | | | 1,617 | | | | 1,331 | | | | 1,861 | | | | 1,174 | | | | 140 | |
Mortgage | | | 37 | | | | 60 | | | | 15 | | | | 37 | | | | 71 | |
Loans to individuals | | | 3,128 | | | | 3,391 | | | | 2,797 | | | | 1,654 | | | | 1,460 | |
| | |
|
|
| |
|
|
| |
|
|
| |
|
|
| |
|
|
|
Total charge-offs | | | 4,782 | | | | 4,782 | | | | 4,673 | | | | 2,865 | | | | 1,671 | |
| | |
|
|
| |
|
|
| |
|
|
| |
|
|
| |
|
|
|
Recoveries: | | | | | | | | | | | | | | | | | | | | |
Commercial, financial and agricultural | | | 504 | | | | 68 | | | | 110 | | | | 52 | | | | 86 | |
Mortgage | | | 21 | | | | 35 | | | | 17 | | | | 22 | | | | 37 | |
Loans to individuals | | | 647 | | | | 466 | | | | 378 | | | | 420 | | | | 326 | |
| | |
|
|
| |
|
|
| |
|
|
| |
|
|
| |
|
|
|
Total recoveries | | | 1,172 | | | | 569 | | | | 505 | | | | 494 | | | | 449 | |
| | |
|
|
| |
|
|
| |
|
|
| |
|
|
| |
|
|
|
Net charge-offs | | | (3,610 | ) | | | (4,213 | ) | | | (4,168 | ) | | | (2,371 | ) | | | (1,222 | ) |
| | |
|
|
| |
|
|
| |
|
|
| |
|
|
| |
|
|
|
Allowance at end of period | | $ | 18,230 | | | $ | 13,101 | | | $ | 11,117 | | | $ | 10,239 | | | $ | 8,749 | |
| | |
|
|
| |
|
|
| |
|
|
| |
|
|
| |
|
|
|
Allowance for loan losses to nonperforming assets(1) | | | 251.2 | % | | | 198.2 | % | | | 85.8 | % | | | 128.6 | % | | | 263.7 | % |
Allowance for loan losses to total loans at end of period | | | 1.29 | % | | | 1.25 | % | | | 1.16 | % | | | 1.09 | % | | | 1.04 | % |
Net charge-offs to average loans | | | 0.28 | % | | | 0.43 | % | | | 0.44 | % | | | 0.26 | % | | | 0.15 | % |
| | |
|
|
| |
|
|
| |
|
|
| |
|
|
| |
|
|
|
| (1) | Nonperforming loans and assets include accruing loans 90 days or more past due |
Investment Securities – The Company’s investment securities consist primarily of securities issued by the U.S. Government and federal agency obligations and mortgage-backed securities. As of December 31, 2003, the Company’s investment securities available for sale amounted to $426.1 million, which includes a pre-tax net unrealized gain of $1.4 million, and its investment securities held to maturity amounted to $53.5 million with a pre-tax net unrealized gain of $1.7 million. At such date, investment securities available for sale consisted of $350.9 million of mortgage-backed securities, $48.2 million of obligations of state and political subdivisions, $27.0 million of U.S. Government and federal agency obligations, and $57,000 of marketable equity securities. At December 31, 2003, investment securities held to maturity consisted of $23.3 million of mortgage-backed securities, $17.1 million of obligations of state and political subdivisions, and $13.1 million of U.S. Government and federal agency obligations. See Note 3 of the Consolidated Financial Statements.
Investment securities increased by an aggregate of $111.5 million, or 30.3%, to $479.6 million at December 31, 2003, compared to $368.1 million at December 31, 2002. This increase was due to investment securities of $58.9 million obtained through the acquisition of Acadiana and purchases of investment securities amounting to $336.3 million, both of which were partially offset by $176.3 million from maturities, prepayments and calls, $100.1 million from sales of investment securities, $5.8 million from the amortization of premiums and accretion of discounts, and a decrease of $1.5 million in the market value of investment securities available for sale. Funds generated as a result of sales and prepayments were used to fund loan growth and purchase other securities. The Company continues to monitor market conditions and take advantage of market opportunities with appropriate rate and risk return elements. Note 3 of the Consolidated Financial Statements provides further information on the Company’s investment securities.
Other Earning Assets – Included in other earning assets are short-term investments resulting from excess funds that fluctuate daily depending on the funding needs of the Company. These funds are currently invested overnight in an interest-bearing deposit account at the Federal Home Loan Bank (“FHLB”) of Dallas, the total balance of which earns interest at the current FHLB discount rate. The balance in interest-bearing deposits at other institutions decreased $6.5 million, or 23.9%, from $27.2 million at December 31, 2002 to $20.7 million at December 31, 2003. The average rate on these funds during 2003 was 1.21%, compared to 1.59% during 2002.
Also a component of other earning assets are loans held for sale, which decreased $2.9 million, or 33.4%, to $5.8 million at December 31, 2003 compared to $8.7 million at December 31, 2002. Loans held for sale have primarily been fixed rate single-family residential mortgage loans under contract to be sold in the secondary market. In most cases, loans in this category are sold within thirty days. During 2003, approximately 66% of total single-family mortgage originations of the Bank were sold in the secondary market as compared to 72% in 2002.
Funding Sources
Deposits obtained from clients in its primary market areas are the Company’s principal source of funds for use in lending and other business purposes. The Company attracts local deposit accounts by offering a wide variety of accounts, competitive interest rates and convenient branch office locations and service hours. Increasing core deposits through the development of client relationships is a continuing focus of the Company. Other funding sources include short-term and long-term borrowings, subordinated debt and shareholders’ equity. The following discussion highlights the major changes in the mix of funding sources during 2003.
Deposits – The Company has been successful in raising deposits in all of the markets in which it has a presence and believes the increase to be the result of several factors including the development of customer relationships and opportunities in the public funds arena. On average, excluding an increase in time deposits acquired through the acquisition of Acadiana, the Company experienced a decline in fixed rate certificates of deposit due primarily to reduced pricing. The balances stabilized in the latter months of 2003. The decline in average time deposits was offset by increases in other interest-bearing deposit accounts.
Deposits at December 31, 2003 reflected an increase of $346.9 million, or 27.9%, to $1.6 billion as compared to $1.2 billion at December 31, 2002. The growth in deposits includes $210.0 million of deposits acquired from the acquisition of Acadiana, which was completed during the first quarter of 2003. Since the end of 2002, noninterest-
bearing checking accounts increased $30.8 million, or 19.4%, interest-bearing checking account deposits increased $168.1 million, or 59.7%, savings and money market accounts increased $30.8 million, or 9.6%, and certificate of deposit accounts increased $117.2 million, or 24.3%. Excluding the effect of Acadiana, noninterest-bearing checking accounts increased $9.9 million, or 6.2%, interest-bearing checking account deposits increased $130.7 million, or 46.4%, savings and money market accounts increased $17.0 million, or 5.3%, and certificate of deposit accounts decreased $20.7 million, or 4.3%.
Certificates of deposit $100,000 and over increased $64.7 million, or 42.9%, from $150.9 million at December 31, 2002 to $215.7 million at December 31, 2003. At December 31, 2003, $189.8 million, or 11.9%, of the Company’s total deposits were noninterest-bearing, compared to $159.0 million, or 12.8%, at December 31, 2002. The following table shows large-denomination certificates of deposit by remaining maturities. Additional information regarding deposits is provided in Note 8 of the Consolidated Financial Statements.
TABLE 6 – REMAINING MATURITY OF CDS $100,000 AND OVER
| | | | | | | | | |
| | | December 31,
|
(dollars in thousands)
| | 2003
| | 2002
| | 2001
|
3 months or less | | $ | 67,555 | | $ | 45,254 | | $ | 46,846 |
Over 3-12 months | | | 87,869 | | | 68,434 | | | 73,735 |
Over 12-36 months | | | 35,906 | | | 25,081 | | | 25,134 |
More than 36 months | | | 24,329 | | | 12,157 | | | 8,233 |
| | |
|
| |
|
| |
|
|
Total | | $ | 215,659 | | $ | 150,926 | | $ | 153,948 |
| | |
|
| |
|
| |
|
|
Borrowings and Debt – Advances from the FHLB of Dallas may be obtained by the Company upon the security of the common stock it owns in that bank and certain of its residential mortgage loans and investment securities, provided certain standards related to creditworthiness have been met. Such advances are made pursuant to several credit programs, each of which has its own interest rate and range of maturities. The level of short-term borrowings can fluctuate significantly on a daily basis depending on funding needs and the source of funds chosen to satisfy those needs. The Company’s short-term borrowings at December 31, 2003 were comprised of $19.6 million of securities sold under agreements to repurchase and $143.0 million of advances from the FHLB of Dallas. The average amount of short-term borrowings in 2003 was $115.0 million.
The Company’s short-term borrowings of $96.8 million at December 31, 2002 consisted of $21.8 million of securities sold under agreements to repurchase and $75.0 million of advances from the FHLB of Dallas. Total short-term borrowings increased $65.8 million, or 68.0%, to $162.6 million at December 31, 2003 compared to $96.8 million at December 31, 2002. The weighted average rate on short-term borrowings was 1.13% at December 31, 2003, compared to 1.36% at December 31, 2002. For additional information regarding short-term borrowings, see Note 9 of the Consolidated Financial Statements.
At December 31, 2003, the Company’s long-term borrowings increased $80.8 million, or 107.1%, to $156.3 million at December 31, 2003, compared to $75.5 million at December 31, 2002. The primary reason for the increase in long-term debt was due to the assumption of $73.7 million in FHLB of Dallas fixed-rate advances as a result of the Acadiana transaction. The majority of the Company’s long-term borrowings, $135.7 million, were comprised primarily of fixed-rate advances from the FHLB of Dallas which cannot be paid off without incurring substantial prepayment penalties. The remaining debt consists of $20.6 million of junior subordinated debt as a result of a $10.3 million trust preferred offering, which closed in November 2002, and a second $10.3 million offering, which closed in June 2003.
Junior subordinated debt consists of a total of $20.6 million in Junior Subordinated Deferrable Interest Debentures of the Company issued to statutory trusts that were funded by the issuance of floating rate capital securities of the trusts. The issues of $10.3 million each bear interest rates equal to three-month LIBOR plus 3.25% and 3.15%,
respectively. The debentures qualify as Tier 1 Capital for regulatory purposes. The terms of the securities is 30 years and, subject to regulatory requirements, are callable at par by the Company anytime after 5 years. Interest is payable quarterly and may be deferred at any time at the election of the Company for up to 20 consecutive quarterly periods. During any deferral period the Company is subject to certain restrictions, including being prohibited from declaring dividends to its common shareholders. For additional information see Note 10 of the Consolidated Financial Statements.
Shareholders’ Equity – Shareholders’ equity provides a source of permanent funding, allows for future growth and provides the Company with a cushion to withstand unforeseen adverse developments. At December 31, 2003, shareholders’ equity totaled $195.2 million, an increase of $55.6 million, or 39.8%, compared to $139.6 million at December 31, 2002. The increase in shareholders’ equity in 2003 was the result of the issuance of $38.4 million of common stock as a result of the purchase accounting transaction with Acadiana, net income of $23.6 million, $2.2 million of common stock released by the Company’s Employee Stock Ownership Plan (“ESOP”) trust, $1.1 million of common stock earned by participants in the Company’s Recognition and Retention Plan (“RRP”) trust and $3.0 million for the sale of treasury stock for stock options exercised. Such increases were partially offset by cash dividends declared on the Company’s common stock of $6.0 million, repurchases of $6.2 million of the Company’s common stock that were placed into treasury and a $529,000 reduction in other comprehensive income.
RESULTS OF OPERATIONS
The Company reported net income of $23.6 million, $18.5 million and $14.5 million for the years ended December 31, 2003, 2002 and 2001, respectively. Earnings per share (“EPS”) on a diluted basis, including any one-time items, was $3.42 for 2003, $3.02 for 2002 and $2.36 for 2001. In accordance with new accounting standards issued in 2001, the amortization of goodwill ceased completely beginning in 2002. During 2003, interest income increased $9.0 million, interest expense increased $971,000, the provision for loan losses increased $103,000, noninterest income increased $5.2 million, noninterest expense increased $6.6 million and income tax expense increased $1.4 million. Cash earnings, defined as net income before the amortization of acquisition intangibles, amounted to $24.1 million, $18.7 million and $16.9 million for the years ended December 31, 2003, 2002 and 2001, respectively. Included in 2003 earnings are the results of operations of Acadiana from the acquisition date of February 28, 2003 forward.
Net Interest Income – Net interest income is the difference between interest realized on earning assets and interest paid on interest-bearing liabilities. Net interest income is also the driver of core earnings and, as such, is subject to constant scrutiny by management. The rate of return and relative risk associated with earning assets are weighed to determine the appropriateness and mix of earning assets. Additionally, the need for lower cost funding sources is weighed against relationships with clients and future growth requirements. The Company’s average interest rate spread, which is the difference between the yields earned on earning assets and the rates paid on interest-bearing liabilities, was 3.67%, 4.19% and 3.54% during the years ended December 31, 2003, 2002 and 2001, respectively. The Company’s net interest margin on a taxable equivalent (TE) basis, which is net interest income (TE) as a percentage of average earning assets, was 3.89%, 4.53% and 4.12% during the years ended December 31, 2003, 2002 and 2001, respectively.
Net interest income increased $8.0 million, or 13.5%, in 2003 to $67.6 million compared to $59.6 million in 2002. This increase was due to a $9.0 million, or 10.3%, increase in interest income, which was partially offset by a $971,000, or 3.5%, increase in interest expense. In 2002, net interest income increased $5.2 million, or 9.6%, to $59.6 million compared to $54.4 million in 2001. The reason for the increase was an $18.1 million, or 39.2%, decrease in interest expense, which was partially offset by a $12.8 million, or 12.8%, decrease in interest income.
The improvement in net interest income was the result of increased volumes and an improved mix of earning assets and deposits. Although earnings improved through increased net interest income, the related net interest spread and margin ratios compressed, driven in part by prepayments of mortgage instruments as refinancing of residential loans hit all-time highs. Mortgage rates continued their downward trend through the first half of 2003 as the impact of the Federal Reserve Board’s (“FRB”) monetary policy, which took the targeted federal funds rate to a historical low, influenced long-term expectations. This impact was felt generally, and on mortgage products as well, as cash flows associated with existing mortgage products increased through the refinancing or prepayment of the underlying instruments. This resulted in increased cash for reinvestment purposes in a relatively low rate environment. Accordingly, the related premiums shortened also, the impact of which was realized through increased premium amortization on related products in both the bond and loan portfolios which reduced net interest income.
Refinancing of mortgage loans at lower rates for existing customers also served to drive down yields. Conversely, gains associated with the sale of mortgage loans that are recorded as noninterest income, reflected large increases in 2003 and improved earnings. It is anticipated that mortgage loan demand, and concurrently premium amortization associated with mortgage loan products, will slow from the elevated levels experienced in 2003 given the decreasing population of existing mortgage loans that would benefit from refinancing and somewhat higher long-term rate expectations going forward.
Also during 2003, as a result of the low interest rate environment, new volume spreads in other earning assets trended lower as well. On the funding side, the Company issued $10.3 million in junior subordinated debt in 2002 and 2003, swapped to an average rate of 6.28%, which negatively impacts the margin in the short run, but provides additional low-cost capital for future growth. Additionally, the change in the balance sheet mix as a result of the recent Acadiana acquisition and subsequent purchase accounting adjustments marking the Acadiana portfolios to market yields, while positive to net interest income, lowered the net interest spread and margin.
The Company will continue to monitor investment opportunities and weigh the associated risk/return. Volume increases in earning assets and improvements in the mix of earning assets and interest-bearing liabilities should improve net interest income, but may negatively impact the net interest margin ratio. The Company has engaged in interest rate swap transactions, which are a form of derivative financial instrument, to modify the net interest sensitivity to levels deemed to be appropriate. Through this instrument, interest rate risk is managed by hedging with
an interest rate swap contract designed to pay fixed and receive floating interest. The interest rate swaps of the Company were executed to modify net interest sensitivity to levels deemed appropriate.
Average loans made up 72.8% of average earning assets as of December 31, 2003 as compared to 72.7% at December 31, 2002. Overall, average loans increased 34.1% in 2003. The increase in average loans was mainly funded by increased borrowings. Average investment securities made up 24.2% of average earning assets at December 31, 2003 compared to 24.1% at December 31, 2002. Average interest-bearing deposits made up 83.3% of average interest-bearing liabilities at December 31, 2003 compared to 93.1% at December 31, 2002. Average borrowings made up 16.7% of average interest-bearing liabilities at December 31, 2003 compared to 6.9% at December 31, 2002. Tables 7 and 8 further explain the changes in net interest income.
The following table sets forth, for the periods indicated, information regarding (i) the total dollar amount of interest income of the Company from earning assets and the resultant average yields; (ii) the total dollar amount of interest expense on interest-bearing liabilities and the resultant average rate; (iii) net interest income; (iv) net interest spread; and (v) net interest margin. Information is based on average daily balances during the indicated periods. Investment security market value adjustments and trade-date accounting adjustments are not considered to be earning assets and, as such, the net effect is included in nonearning assets. Tax equivalent (TE) yields are calculated using a marginal tax rate of 35%.
TABLE 7 – AVERAGE BALANCES, NET INTEREST INCOME AND INTEREST YIELDS / RATES
| | | | | | | | | | | | | | | | | | | | | | | | | | | | | | |
| | | Years Ended December 31,
| |
(dollars in thousands)
| | 2003
| | | 2002
| | | 2001
| |
| | | | | | | | Average | | | | | | | | Average | | | | | | | | Average | |
| | | Average | | | | | Yield/ | | | Average | | | | | Yield/ | | | Average | | | | | Yield/ | |
| | | Balance
| | | Interest
| | Rate
| | | Balance
| | | Interest
| | Rate
| | | Balance
| | | Interest
| | Rate
| |
| | | | | | | | | |
Earning assets: | | | | | | | | | | | | | | | | | | | | | | | | | | | | | | |
Loans receivable: | | | | | | | | | | | | | | | | | | | | | | | | | | | | | | |
Mortgage loans | | $ | 340,738 | | | $ | 20,628 | | 6.05 | % | | $ | 197,239 | | | $ | 14,881 | | 7.54 | % | | $ | 252,696 | | | $ | 19,859 | | 7.86 | % |
Commercial loans (TE) | | | 511,634 | | | | 25,987 | | 5.26 | | | | 378,090 | | | | 23,211 | | 6.27 | | | | 298,586 | | | | 23,945 | | 7.98 | |
Consumer and other loans | | | 456,766 | | | | 32,602 | | 7.14 | | | | 400,997 | | | | 33,061 | | 8.24 | | | | 396,778 | | | | 35,461 | | 8.94 | |
| | |
|
|
| |
|
| | | | |
|
|
| |
|
| | | | |
|
|
| |
|
| | | |
Total loans | | | 1,309,138 | | | | 79,217 | | 6.12 | | | | 976,326 | | | | 71,153 | | 7.34 | | | | 948,060 | | | | 79,265 | | 8.35 | |
| | |
|
|
| |
|
| | | | |
|
|
| |
|
| | | | |
|
|
| |
|
| | | |
Loans held for sale | | | 14,172 | | | | 893 | | 6.30 | | | | 6,149 | | | | 362 | | 5.89 | | | | 9,184 | | | | 682 | | 7.43 | |
Investment securities (TE) | | | 434,767 | | | | 15,667 | | 3.91 | | | | 323,571 | | | | 15,316 | | 4.93 | | | | 296,782 | | | | 17,833 | | 6.08 | |
Other earning assets | | | 39,440 | | | | 785 | | 1.99 | | | | 36,732 | | | | 721 | | 1.96 | | | | 68,725 | | | | 2,588 | | 3.77 | |
| | |
|
|
| |
|
| | | | |
|
|
| |
|
| | | | |
|
|
| |
|
| | | |
Total earning assets | | | 1,797,517 | | | | 96,562 | | 5.50 | | | | 1,342,778 | | | | 87,552 | | 6.61 | | | | 1,322,751 | | | | 100,368 | | 7.60 | |
| | |
|
|
| |
|
| | | | |
|
|
| |
|
| | | | |
|
|
| |
|
| | | |
Allowance for loan losses | | | (16,491 | ) | | | | | | | | | (11,774 | ) | | | | | | | | | (10,061 | ) | | | | | | |
Nonearning assets | | | 183,669 | | | | | | | | | | 133,415 | | | | | | | | | | 106,290 | | | | | | | |
| | |
|
|
| | | | | | | |
|
|
| | | | | | | |
|
|
| | | | | | |
Total assets | | $ | 1,964,695 | | | | | | | | | $ | 1,464,419 | | | | | | | | | $ | 1,418,980 | | | | | | | |
| | |
|
|
| | | | | | | |
|
|
| | | | | | | |
|
|
| | | | | | |
| | | | | | | | | |
Interest-bearing liabilities: | | | | | | | | | | | | | | | | | | | | | | | | | | | | | | |
Deposits: | | | | | | | | | | | | | | | | | | | | | | | | | | | | | | |
NOW accounts | | $ | 358,327 | | | | 3,245 | | 0.91 | | | $ | 258,087 | | | | 3,055 | | 1.18 | | | $ | 207,851 | | | | 3,473 | | 1.67 | |
Savings and money market accounts | | | 354,997 | | | | 2,924 | | 0.82 | | | | 318,708 | | | | 4,353 | | 1.37 | | | | 291,009 | | | | 7,794 | | 2.68 | |
Certificates of deposit | | | 601,339 | | | | 14,865 | | 2.47 | | | | 497,988 | | | | 17,154 | | 3.44 | | | | 572,532 | | | | 30,860 | | 5.39 | |
| | |
|
|
| |
|
| | | | |
|
|
| |
|
| | | | |
|
|
| |
|
| | | |
Total interest-bearing deposits | | | 1,314,663 | | | | 21,034 | | 1.60 | | | | 1,074,783 | | | | 24,562 | | 2.29 | | | | 1,071,392 | | | | 42,127 | | 3.93 | |
Short-term borrowings | | | 115,014 | | | | 1,428 | | 1.22 | | | | 32,961 | | | | 613 | | 1.83 | | | | 13,508 | | | | 617 | | 4.51 | |
Long-term debt | | | 148,841 | | | | 6,467 | | 4.29 | | | | 46,346 | | | | 2,783 | | 5.92 | | | | 47,308 | | | | 3,274 | | 6.83 | |
| | |
|
|
| |
|
| | | | |
|
|
| |
|
| | | | |
|
|
| |
|
| | | |
Total interest-bearing liabilities | | | 1,578,518 | | | | 28,929 | | 1.83 | | | | 1,154,090 | | | | 27,958 | | 2.42 | | | | 1,132,208 | | | | 46,018 | | 4.06 | |
| | | | | | |
|
| | | | | | | | |
|
| | | | | | | | |
|
| | | |
| Noninterest-bearing demand deposits | | | 183,478 | | | | | | | | | | 149,739 | | | | | | | | | | 140,393 | | | | | | | |
| Noninterest-bearing liabilities | | | 22,282 | | | | | | | | | | 19,965 | | | | | | | | | | 12,473 | | | | | | | |
| | |
|
|
| | | | | | | �� |
|
|
| | | | | | | |
|
|
| | | | | | |
Total liabilities | | | 1,784,278 | | | | | | | | | | 1,323,794 | | | | | | | | | | 1,285,074 | | | | | | | |
| Shareholders’ equity | | | 180,417 | | | | | | | | | | 140,625 | | | | | | | | | | 133,906 | | | | | | | |
| | |
|
|
| | | | | | | |
|
|
| | | | | | | |
|
|
| | | | | | |
Total liabilities and shareholders’ equity | | $ | 1,964,695 | | | | | | | | | $ | 1,464,419 | | | | | | | | | $ | 1,418,980 | | | | | | | |
| | |
|
|
| | | | | | | |
|
|
| | | | | | | |
|
|
| | | | | | |
| | | | | | | | | |
| Net earning assets | | $ | 218,999 | | | | | | | | | $ | 188,688 | | | | | | | | | $ | 190,543 | | | | | | | |
| | |
|
|
| | | | | | | |
|
|
| | | | | | | |
|
|
| | | | | | |
| | | | | | | | | |
| Net interest spread | | | | | | $ | 67,633 | | 3.67 | % | | | | | | $ | 59,594 | | 4.19 | % | | | | | | $ | 54,350 | | 3.54 | % |
| | | | | | |
|
| |
|
| | | | | |
|
| |
|
| | | | | |
|
| |
|
|
| | | | | | | | | |
| Net interest income (TE) / Net interest margin (TE) | | | | | | $ | 70,236 | | 3.89 | % | | | | | | $ | 61,063 | | 4.53 | % | | | | | | $ | 54,777 | | 4.12 | % |
| | | | | | |
|
| |
|
| | | | | |
|
| |
|
| | | | | |
|
| |
|
|
The following table analyzes the dollar amount of changes in interest income and interest expense for major components of earning assets and interest-bearing liabilities. The table distinguishes between (i) changes attributable to volume (changes in average volume between periods times the average yield/rate for the two periods), (ii) changes attributable to rate (changes in average rate between periods times the average volume for the two periods), and (iii) total increase (decrease).
TABLE 8 – SUMMARY OF CHANGES IN NET INTEREST INCOME
| | | | | | | | | | | | | | | | | | | | | | | |
| | | 2003 / 2002 Change Attributable To
| | | 2002 / 2001 Change Attributable To
| |
(dollars in thousands)
| | Volume
| | Rate
| | | Total Increase (Decrease)
| | | Volume
| | | Rate
| | | Total Increase (Decrease)
| |
Earning assets: | | | | | | | | | | | | | | | | | | | | | | | |
Loans: | | | | | | | | | | | | | | | | | | | | | | | |
Mortgage loans | | $ | 9,757 | | $ | (4,010 | ) | | $ | 5,747 | | | $ | (4,271 | ) | | $ | (707 | ) | | $ | (4,978 | ) |
Commercial loans | | | 7,491 | | | (4,715 | ) | | | 2,776 | | | | 5,628 | | | | (6,362 | ) | | | (734 | ) |
Consumer and other loans | | | 4,289 | | | (4,748 | ) | | | (459 | ) | | | 362 | | | | (2,762 | ) | | | (2,400 | ) |
Loans held for sale | | | 489 | | | 42 | | | | 531 | | | | (202 | ) | | | (118 | ) | | | (320 | ) |
Investment securities | | | 4,635 | | | (4,284 | ) | | | 351 | | | | 1,439 | | | | (3,956 | ) | | | (2,517 | ) |
Other earning assets | | | 54 | | | 10 | | | | 64 | | | | (916 | ) | | | (951 | ) | | | (1,867 | ) |
| | |
|
| |
|
|
| |
|
|
| |
|
|
| |
|
|
| |
|
|
|
Total net change in income on earning assets | | | 26,715 | | | (17,705 | ) | | | 9,010 | | | | 2,040 | | | | (14,856 | ) | | | (12,816 | ) |
| | |
|
| |
|
|
| |
|
|
| |
|
|
| |
|
|
| |
|
|
|
Interest-bearing liabilities: | | | | | | | | | | | | | | | | | | | | | | | |
Deposits: | | | | | | | | | | | | | | | | | | | | | | | |
NOW accounts | | | 1,047 | | | (857 | ) | | | 190 | | | | 717 | | | | (1,135 | ) | | | (418 | ) |
Savings and money market accounts | | | 397 | | | (1,826 | ) | | | (1,429 | ) | | | 560 | | | | (4,001 | ) | | | (3,441 | ) |
Certificates of deposit | | | 3,057 | | | (5,346 | ) | | | (2,289 | ) | | | (3,293 | ) | | | (10,413 | ) | | | (13,706 | ) |
Borrowings | | | 6,712 | | | (2,213 | ) | | | 4,499 | | | | 987 | | | | (1,482 | ) | | | (495 | ) |
| | |
|
| |
|
|
| |
|
|
| |
|
|
| |
|
|
| |
|
|
|
Total net change in expense on interest-bearing liabilities | | | 11,213 | | | (10,242 | ) | | | 971 | | | | (1,029 | ) | | | (17,031 | ) | | | (18,060 | ) |
| | |
|
| |
|
|
| |
|
|
| |
|
|
| |
|
|
| |
|
|
|
Change in net interest income | | $ | 15,502 | | $ | (7,463 | ) | | $ | 8,039 | | | $ | 3,069 | | | $ | 2,175 | | | $ | 5,244 | |
| | |
|
| |
|
|
| |
|
|
| |
|
|
| |
|
|
| |
|
|
|
Provision for Loan Losses – The allowance for loan losses is maintained at a level considered appropriate by management based on various factors as they relate to the collectability of the Company’s loan portfolio. Increases to the allowance for loan losses are achieved through provisions for loan losses that are charged against income. Management of the Company assesses the allowance for loan losses on a quarterly basis and will make provisions for loan losses as deemed appropriate in order to maintain the adequacy of the allowance for loan losses.
As a result of continued improvement in asset quality, the Company reported no significant change in the loan loss provision, even as loans increased at a double-digit pace. During 2003, the Company made a provision for loan losses of $6.3 million compared to $6.2 million and $5.0 million for 2002 and 2001, respectively. Net loan charge-offs were $3.6 million for 2003 compared to $4.2 million for 2002. The slightly higher provision for 2003 is attributable to loan growth and changes in the mix of loans from period to period, offset by improved charge-offs to the previously established reserves and overall improvement in asset quality. The allowance for loan losses as a percentage of outstanding loans, net of unearned income, was 1.29% at December 31, 2003, compared to 1.25% at year-end 2002. A discussion of credit quality can be found in the section on “Loans and Asset Quality” in this analysis.
Noninterest Income – The Company reported noninterest income of $23.1 million compared to $17.9 million for 2002. The primary reasons for the $5.2 million, or 29.1%, increase in noninterest income were a $2.1 million, or 101.8%, increase in gains on the sale of mortgage loans in the secondary market, a $1.7 million, or 17.0%, increase in service charges on deposit accounts, a $201,000, or 12.5%, increase in ATM fee income from increased usage, a $310,000, or 25.6%, increase in earnings and cash surrender value of bank owned life insurance, a $594,000, or 60.8%, increase in broker sales commissions, and a $39,000 increase in other net noninterest income. These increases were partially offset by a $72,000, or 17.7%, decrease in gains on sale of assets. Additionally, the year 2003 included a $267,000 gain on the sale of investment securities compared to a $42,000 loss in 2002. It is anticipated that a rise in mortgage rates will have a dampening effect on the residential loan refinancing market and moderate mortgage loan sales and related gains.
Total noninterest income amounted to $17.9 million and $15.1 million for the years ended December 31, 2002 and 2001, respectively. The primary reasons for the $2.7 million, or 18.0%, increase in noninterest income was a $1.9
million, or 24.0%, increase in service charges on deposit accounts, a $934,000, or 338.3%, increase in earnings and cash surrender value of bank owned life insurance, a $118,000, or 7.9%, increase in ATM fee income from increased usage, and a $105,000, or 34.9%, increase in gain on sale of assets. These increases were partially offset by a $153,000, or 6.8%, decrease in gains on the sale of mortgage loans in the secondary market and a $51,000, decrease in other net noninterest income. The additional gain on the sale of mortgage loans in 2001 was solely attributable to the sale of a select group of older mortgage loans originated through the construction process in previous years. Additionally, the year 2002 included a $42,000 loss on the sale of investment securities compared to a $119,000 gain in 2001.
Noninterest Expense – Ongoing attention to expense control is part of the corporate culture. As a result, increased expenses are primarily related to the impact of the Acadiana acquisition which was completed in the first quarter of 2003 and infrastructure improvements throughout the Company. Noninterest expense includes costs related to salary and employee benefits, occupancy and equipment, communication and delivery, marketing and business development, amortization of acquisition intangibles and other expenses. Noninterest expense amounted to $50.6 million, $44.0 million and $41.7 million for the three years ended December 31, 2003, 2002 and 2001, respectively. The principal reason for the $6.6 million, or 15.0%, increase in noninterest expense for 2003 compared to 2002 was an increase in salaries and employee benefits of $3.5 million, or 15.3%, due largely to the increased staffing levels associated with the Acadiana acquisition and management’s commitment to hire strategically and compensate competitively across the markets. In addition, the Company also experienced a rising cost of employee benefits due in part to the increased market value of the Company’s common stock as it relates to the Company’s ESOP amounting to $332,000. Other expense increases included $841,000 in building and occupancy expense, $538,000 in amortization of acquisition intangibles related to the Acadiana acquisition, $405,000 in the franchise and share tax assessments, $249,000 in marketing and business development expense, $211,000 in communication and delivery expense, $207,000 in data processing expense, primarily as a result of technology improvements, $158,000 in printing and supplies expense, and $379,000 in legal and professional expense. Additionally, the Company recorded a prepayment penalty of $236,000 on the early retirement of long-term debt outstanding at the FHLB of Dallas. Other net noninterest expenses increased $935,000. Such increases were partially offset by a $1.1 million decrease in OREO related charges due to a reduced level of OREO properties and writedowns.
The principal reason for the $2.3 million, or 5.6%, increase in noninterest expense for 2002 compared to 2001 was an increase in salaries and employee benefits of $1.9 million, or 8.9%. This was due in part to improving the delivery system across the state, management’s commitment to improve overall staffing and competitive compensation across the markets. In addition, the Company also experienced a rising cost associated with employee benefits due in part to the increased market value of the Company’s common stock as it relates to the Company’s ESOP amounting to $383,000. Other expense increases included $324,000 in the franchise and share tax assessments, $130,000 in marketing and business development expense, $200,000 in data processing expense, primarily as a result of improvements in technology, $686,000 in legal and professional expense, and $1.3 million in OREO related charges, primarily related to writedowns. Other net noninterest expenses increased by $635,000. Such increases were partially offset by a $66,000, or 8.8%, decrease in printing and supplies expense, and a pre-tax decrease of $2,751,000 from non-amortization of goodwill as a result of adopting FAS 142.
Income Taxes – For the years ended December 31, 2003, 2002 and 2001 the Company incurred income tax expense of $10.2 million, $8.8 million and $8.2 million, respectively. The Company’s effective tax rate amounted to 30.3%, 32.2% and 36.2% during 2003, 2002 and 2001, respectively. The difference between the effective tax rate and the statutory tax rate primarily relates to variances in items that are either nontaxable or non-deductible, primarily the effect of tax-exempt income, the non-deductibility of part of the amortization of acquisition intangibles, and the non-deductible portion of the ESOP compensation expense. The change in the effective rate for 2002 was mainly attributable to the elimination of the non-deductible portion of goodwill upon the adoption of FAS 142 and additional tax-exempt income. For more information, see Note 12 of the Consolidated Financial Statements.
CAPITAL RESOURCES
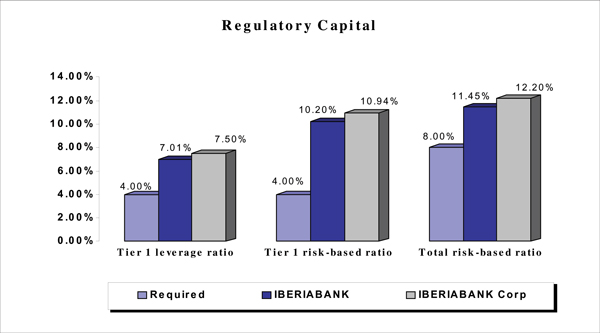
Federal regulations impose minimum regulatory capital requirements on all institutions with deposits insured by the Federal Deposit Insurance Corporation. The FRB imposes similar capital regulations on bank holding companies. Compliance with bank and bank-holding company regulatory capital requirements, which include leverage and risk-
based capital guidelines, are monitored by the Company on an ongoing basis. Under the risk-based capital method, a risk weight is assigned to balance sheet and off-balance sheet items based on regulatory guidelines. At December 31, 2003, the Company exceeded all regulatory capital ratio requirements with a Tier 1 leverage capital ratio of 7.50%, a Tier 1 risk-based capital ratio of 10.94% and a total risk-based capital ratio of 12.20%. At December 31, 2003, IBERIABANK (the “Bank”) exceeded all regulatory capital ratio requirements with a Tier 1 leverage capital ratio of 7.01%, a Tier 1 risk-based capital ratio of 10.20% and a total risk-based capital ratio of 11.45%.
In addition, the Company issued junior subordinated debt totaling $20.6 million, which may be included in Tier 1 capital up to 25% of the total of the Company’s core capital elements, including the junior subordinated debt. For additional information, see Note 10 of the Consolidated Financial Statements.
LIQUIDITY
The Company’s liquidity, represented by cash and cash equivalents, is a product of its operating, investing and financing activities. The Company manages its liquidity with the objective of maintaining sufficient funds to respond to the needs of depositors and borrowers and to take advantage of earnings enhancement opportunities. The primary sources of funds for the Company are deposits, borrowings, repayments and maturities of loans and investment securities, securities sold under agreements to repurchase, as well as funds provided from operations. Certificates of deposit scheduled to mature in one year or less at December 31, 2003 totaled $386.8 million. Based on past experience, management believes that a significant portion of maturing deposits will remain with the Company. Additionally, the majority of the investment security portfolio is classified by the Company as available-for-sale which provides the ability to liquidate securities as needed. Due to the relatively short planned duration of the investment security portfolio, the Company continues to experience significant cash flows on a normal basis.
While scheduled cash flows from the amortization and maturities of loans and securities are relatively predictable sources of funds, deposit flows and prepayments of loan and investment securities are greatly influenced by general interest rates, economic conditions and competition. The FHLB of Dallas provides an additional source of liquidity to make funds available for general requirements and also to assist with the variability of less predictable funding sources. At December 31, 2003, the Company had $278.7 million of outstanding advances from the FHLB of Dallas. Additional advances available at December 31, 2003 from the FHLB of Dallas amounted to $158.3 million. The Company and the Bank also have various funding arrangements with commercial banks providing up to $65
million in the form of federal funds and other lines of credit. At December 31, 2003, there was no balance outstanding on these lines and all of the funding was available to the Company.
Liquidity management is both a daily and long-term function of business management. Excess liquidity is generally invested in short-term investments such as overnight deposits. On a longer-term basis, the Company maintains a strategy of investing in various lending and investment security products. The Company uses its sources of funds primarily to meet its ongoing commitments and fund loan commitments. The Company has been able to generate sufficient cash through its deposits as well as borrowings and anticipates it will continue to have sufficient funds to meet its liquidity requirements.
ASSET/ LIABILITY MANAGEMENT AND MARKET RISK
The principal objective of the Company’s asset and liability management function is to evaluate the interest rate risk included in certain balance sheet accounts, determine the appropriate level of risk given the Company’s business focus, operating environment, capital and liquidity requirements and performance objectives, establish prudent asset concentration guidelines and manage the risk consistent with Board approved guidelines. Through such management, the Company seeks to reduce the vulnerability of its operations to changes in interest rates. The Company’s actions in this regard are taken under the guidance of the Asset/Liability Committee (“ALCO”), which is comprised of members of the Company’s senior management. ALCO normally meets monthly to review, among other things, the sensitivity of the Company’s assets and liabilities to interest rate changes, local and national market conditions and interest rates. In connection therewith, ALCO generally reviews the Company’s liquidity, cash flow needs, maturities of investments, deposits, borrowings and capital position.
The objective of interest rate risk management is to control the effects that interest rate fluctuations have on net interest income and on the net present value of the Company’s earning assets and interest-bearing liabilities. Management and the Board are responsible for managing interest rate risk and employing risk management policies that monitor and limit this exposure. Interest rate risk is measured using net interest income simulation and asset/liability net present value sensitivity analyses. The Company uses financial modeling to measure the impact of changes in interest rates on the net interest margin and predict market risk. Estimates are based upon numerous assumptions including the nature and timing of interest rate levels including yield curve shape, prepayments on loans and securities, deposit decay rates, pricing decisions on loans and deposits, reinvestment/replacement of asset and liability cash flows and others. These analyses provide a range of potential impacts on net interest income and portfolio equity caused by interest rate movements.
Included in ALCO modeling are instantaneous parallel rate shifts scenarios, which are utilized to establish exposure limits. These scenarios are known as “rate shocks” because all rates are modeled to change instantaneously by the indicated shock amount, rather than a gradual rate shift over a period of time that has traditionally been more realistic. As of December 31, 2003, the simulation of these shocks indicated that an instantaneous and sustained 200 basis point rise in rates would decrease net interest income over the following 12 months by approximately 1.3%, while a 200 point decline in rates would decrease net interest income over the following 12 months by approximately 3.0% from an unchanged rate environment. For the same period, the model indicated that an instantaneous and sustained 100 basis point rise in rates would increase net interest income over the following 12 months by approximately 0.5%, while a 100 point decline in rates would decrease net interest income over the following 12 months by approximately 0.3% from an unchanged rate environment. Computations of interest rate risk under these scenarios do not necessarily include certain actions that management may undertake to manage this risk in response to anticipated changes in interest rates.
The rate environment is a function of the monetary policy of the FRB. The principal tools of the FRB for implementing monetary policy are open market operations, or the purchases and sales of U.S. Treasury and federal agency securities. The FRB’s objective for open market operations has varied over the years, but the focus has gradually shifted toward attaining a specified level of the federal funds rate to achieve the long-run goals of price stability and sustainable economic growth. The federal funds rate is the basis for overnight funding and drives the short end of the yield curve. Longer maturities are influenced by FRB purchases and sales and also expectations of
monetary policy going forward. The FRB has continued to reduce the targeted level for the federal funds rate since the beginning of 2001, reaching an all-time low of 1.00% in mid-2003 and maintaining this target for the remainder of 2003. Although each FRB rate reduction becomes more challenging to offset, deposit rate reductions and less aggressive repricing of the maturing certificate of deposit portfolio in the current low rate environment has allowed the Company to reduce funding costs at this time and thereby offset the negative impact of recent FRB rate movements. Although management believes that the Company is not significantly affected by changes in interest rates over an extended period of time, a continued period of low interest rates will exert downward pressure on the net interest margin and net interest income. The Company is most impacted at this time by the overall low level of rates and limited ability to reduce transaction and limited-transaction deposit accounts rates further. Under traditional measures of interest rate gap positions, the Company has shifted to a moderately liability sensitive position in the short-term.
As part of its asset/liability management strategy, the Company has emphasized the origination of commercial and consumer loans, which typically have shorter terms than residential mortgage loans and/or adjustable or variable rates of interest. The majority of fixed-rate, long-term residential loans were sold in the secondary market during 2003 and 2002 to avoid assumption of the rate risk associated with longer duration assets in the current low rate environment. As of December 31, 2003, $435.9 million, or 30.9%, of the Company’s total loan portfolio had adjustable interest rates.
The Company’s strategy with respect to liabilities in recent periods has been to emphasize transaction accounts, particularly noninterest bearing transaction accounts, which are not as sensitive to changes in interest rates as certificates of deposit. At December 31, 2003, 62.3% of the Company’s deposits were in transaction and limited-transaction accounts, compared to 61.2% at December 31, 2002. Noninterest bearing transaction accounts totaled 11.9% of total deposits at December 31, 2003, compared to 12.8% of total deposits at December 31, 2002.
As part of an overall interest rate risk management strategy, off-balance sheet derivatives may also be used as an efficient way to modify the repricing or maturity characteristics of on-balance sheet assets and liabilities. Management may from time to time engage in interest rate swaps to effectively manage interest rate risk. As of December 31, 2003, the Company had no derivatives other than interest-rate swaps accounted for as cash-flow hedges, all of which met the criteria to be classified as effective hedges. Through these instruments, interest rate risk is managed by hedging with an interest rate swap contract designed to pay fixed and receive floating interest. The interest rate swaps of the Company were executed to modify net interest sensitivity to levels deemed appropriate.
OTHER OFF-BALANCE SHEET ACTIVITIES
In the normal course of business, the Company is a party to a number of activities that contain credit, market and operational risk that are not reflected in whole or in part in the Company’s consolidated financial statements. Such activities include traditional off-balance sheet credit-related financial instruments, commitments under operating leases and long-term debt. The Company provides customers with off-balance sheet credit support through loan commitments, lines of credit and standby letters of credit. Many of the unused commitments are expected to expire unused or be only partially used; therefore, the total amount of unused commitments does not necessarily represent future cash requirements. The Company anticipates it will continue to have sufficient funds together with available borrowings to meet its current commitments. At December 31, 2003, the total approved loan commitments outstanding amounted to $30.9 million. At the same date, commitments under unused lines of credit, including credit card lines, amounted to $266.3 million. Included in these totals are commercial commitments amounting to $155.8 million as shown in Table 9 below.
TABLE 9 – COMMERCIAL COMMITMENT EXPIRATION PER PERIOD
| | | | | | | | | | | | | | | |
(dollars in thousands)
| | Less Than 1 Year
| | 1 – 3 Years
| | 4 – 5 Years
| | Over 5 Years
| | Total
|
Unused commercial lines of credit | | $ | 115,538 | | $ | 12,650 | | $ | — | | $ | 699 | | $ | 128,887 |
Unused loan commitments | | | 24,453 | | | — | | | — | | | — | | | 24,453 |
Standby letters of credit | | | 2,400 | | | 88 | | | — | | | — | | | 2,488 |
| | |
|
| |
|
| |
|
| |
|
| |
|
|
Total | | $ | 142,391 | | $ | 12,738 | | $ | — | | $ | 699 | | $ | 155,828 |
| | |
|
| |
|
| |
|
| |
|
| |
|
|
The Company has entered into a number of long-term leasing arrangements to support the ongoing activities of the Company. The required payments under such commitments and long-term debt at December 31, 2003 are shown in Table 10 below.
TABLE 10 – LONG-TERM LEASES AND LONG-TERM DEBT COMMITMENTS
| | | | | | | | | | | | | | | | | | | | | |
(dollars in thousands)
| | 2004
| | 2005
| | 2006
| | 2007
| | 2008
| | 2009 and After
| | Total
|
Operating leases | | $ | 838 | | $ | 685 | | $ | 435 | | $ | 259 | | $ | 213 | | $ | 683 | | $ | 3,113 |
Long-term debt | | | — | | | 250 | | | 2,000 | | | 22,310 | | | 29,310 | | | 102,421 | | | 156,291 |
| | |
|
| |
|
| |
|
| |
|
| |
|
| |
|
| |
|
|
Total | | $ | 838 | | $ | 935 | | $ | 2,435 | | $ | 22,569 | | $ | 29,523 | | $ | 103,104 | | $ | 159,404 |
| | |
|
| |
|
| |
|
| |
|
| |
|
| |
|
| |
|
|
IMPACT OF INFLATION AND CHANGING PRICES
The consolidated financial statements and related financial data presented herein have been prepared in accordance with generally accepted accounting principles, which generally require the measurement of financial position and operating results in terms of historical dollars, without considering changes in relative purchasing power over time due to inflation. Unlike most industrial companies, virtually all of the Company’s assets and liabilities are monetary in nature. As a result, interest rates generally have a more significant impact on the Company’s performance than does the effect of inflation. Although fluctuation in interest rates are neither completely predictable nor controllable, the Company regularly monitors its interest rate position and oversees its financial risk management by establishing policies and operating limits. Interest rates do not necessarily move in the same direction or in the same magnitude as the prices of goods and services, since such prices are affected by inflation to a larger extent than interest rates. Although not as critical to the banking industry as to other industries, inflationary factors may have some impact on the Company’s growth, earnings, total assets and capital levels. Management does not expect inflation to be a significant factor in 2004.
ACQUISITION ACTIVITIES
On February 28, 2003, the Company completed its acquisition of Acadiana Bancshares, Inc. (“Acadiana”), holding company of LBA Savings Bank. As consideration the Company issued 981,821 shares of common stock and paid approximately $9.8 million in cash to Acadiana shareholders. In accordance with FAS No. 141, the transaction was accounted for as a purchase. This acquisition enhances the Company’s position as a leading financial services provider in its primary market base area and in the state of Louisiana. For further information, see Note 2 to the Consolidated Financial Statements and the Company’s Current Report filed on Form 8-K dated February 28, 2003.
The consolidated statement of income includes the results of operations for Acadiana from the acquisition date. The transaction resulted in $24.1 million of goodwill, $4.0 million of core deposit intangibles and $313,000 of other intangibles. The amount allocated to the core deposit intangible was determined by an independent valuation and is
being amortized over the estimated useful life of eight years using a double declining method. The amount allocated to other intangibles represents the estimated value assigned to mortgage servicing rights and is being amortized over an estimated useful life of seven years using the interest method.
In the acquisition, shareholders of Acadiana received total consideration of $39.38 per outstanding share of Acadiana common stock in a combination of the Company’s common stock and cash.
On February 29, 2004, the Company acquired all of the outstanding stock of Alliance Bank (“Alliance”) for 287,285 shares of the Company’s common stock valued at $15.5 million. The transaction is accounted for under the purchase method of accounting. The acquisition expands the Company’s presence into Baton Rouge, Louisiana. At December 31, 2003, total assets of Alliance were $76.1 million, including $53.8 million in loans receivable and $18.3 million in investment securities. Total deposits at such date were $65.1 million.
SELECTED CONSOLIDATED FINANCIAL AND OTHER DATA
| | | | | | | | | | | | | | | |
| | | December 31,
|
(dollars in thousands, except per share data)
| | 2003
| | 2002
| | 2001
| | 2000
| | 1999
|
| | | | | |
Balance Sheet Data | | | | | | | | | | | | | | | |
Total assets | | $ | 2,115,811 | | $ | 1,570,588 | | $ | 1,426,825 | | $ | 1,396,162 | | $ | 1,363,578 |
Cash and cash equivalents | | | 69,571 | | | 63,775 | | | 51,681 | | | 34,541 | | | 47,713 |
Loans receivable | | | 1,412,349 | | | 1,044,492 | | | 956,015 | | | 940,525 | | | 842,878 |
Investment securities | | | 479,622 | | | 368,122 | | | 321,907 | | | 344,545 | | | 384,881 |
Goodwill and acquisition intangibles | | | 62,786 | | | 35,401 | | | 35,644 | | | 38,796 | | | 42,063 |
Deposit accounts | | | 1,589,106 | | | 1,242,232 | | | 1,237,394 | | | 1,143,187 | | | 1,100,014 |
Borrowings | | | 318,881 | | | 172,261 | | | 43,776 | | | 114,843 | | | 135,053 |
Shareholders' equity | | | 195,169 | | | 139,598 | | | 134,417 | | | 127,042 | | | 117,189 |
Book value per share (1) | | $ | 29.28 | | $ | 24.88 | | $ | 23.03 | | $ | 20.99 | | $ | 18.62 |
Tangible book value per share(1) (2) | | | 19.86 | | | 18.57 | | | 16.92 | | | 14.58 | | | 11.94 |
| | |
|
| |
|
| |
|
| |
|
| |
|
|
| |
| | | Years Ended December 31,
|
(dollars in thousands, except per share data)
| | 2003
| | 2002
| | 2001
| | 2000
| | 1999
|
| | | | | |
Income Statement Data | | | | | | | | | | | | | | | |
Interest income | | $ | 96,562 | | $ | 87,552 | | $ | 100,368 | | $ | 103,966 | | $ | 95,029 |
Interest expense | | | 28,929 | | | 27,958 | | | 46,018 | | | 52,730 | | | 45,380 |
| | |
|
| |
|
| |
|
| |
|
| |
|
|
Net interest income | | | 67,633 | | | 59,594 | | | 54,350 | | | 51,236 | | | 49,649 |
Provision for loan losses | | | 6,300 | | | 6,197 | | | 5,046 | | | 3,861 | | | 2,836 |
| | |
|
| |
|
| |
|
| |
|
| |
|
|
Net interest income after provision for loan losses | | | 61,333 | | | 53,397 | | | 49,304 | | | 47,375 | | | 46,813 |
Noninterest income | | | 23,064 | | | 17,866 | | | 15,144 | | | 12,818 | | | 13,735 |
Noninterest expense | | | 50,629 | | | 44,032 | | | 41,711 | | | 39,704 | | | 44,881 |
| | |
|
| |
|
| |
|
| |
|
| |
|
|
Income before income taxes | | | 33,768 | | | 27,231 | | | 22,737 | | | 20,489 | | | 15,667 |
Income taxes | | | 10,216 | | | 8,778 | | | 8,229 | | | 7,514 | | | 6,138 |
| | |
|
| |
|
| |
|
| |
|
| |
|
|
Net income | | $ | 23,552 | | $ | 18,453 | | $ | 14,508 | | $ | 12,975 | | $ | 9,529 |
| | |
|
| |
|
| |
|
| |
|
| |
|
|
Earnings per share—basic | | $ | 3.71 | | $ | 3.26 | | $ | 2.48 | | $ | 2.14 | | $ | 1.55 |
Earnings per share—diluted | | $ | 3.42 | | $ | 3.02 | | $ | 2.36 | | $ | 2.12 | | $ | 1.53 |
Cash earnings per share—diluted | | $ | 3.49 | | $ | 3.06 | | $ | 2.76 | | $ | 2.54 | | $ | 1.95 |
Cash dividends per share | | $ | 0.90 | | $ | 0.76 | | $ | 0.70 | | $ | 0.66 | | $ | 0.63 |
| | |
|
| |
|
| |
|
| |
|
| |
|
|
23
| | | | | | | | | | | | | | | |
| | | At or For the Years Ended December 31,
| |
| | | 2003
| | | 2002
| | | 2001
| | | 2000
| | | 1999
| |
Key Ratios (3) | | | | | | | | | | | | | | | |
Return on average assets | | 1.20 | % | | 1.26 | % | | 1.02 | % | | 0.94 | % | | 0.70 | % |
Return on average equity | | 13.05 | | | 13.12 | | | 10.83 | | | 10.75 | | | 7.84 | |
Return on average tangible equity (2) | | 19.57 | | | 17.78 | | | 17.51 | | | 19.32 | | | 15.68 | |
Equity to assets at end of period | | 9.22 | | | 8.89 | | | 9.42 | | | 9.10 | | | 8.59 | |
Earning assets to interest-bearing liabilities | | 113.87 | | | 116.35 | | | 116.83 | | | 114.66 | | | 112.83 | |
Interest rate spread (4) | | 3.67 | | | 4.19 | | | 3.54 | | | 3.36 | | | 3.50 | |
Net interest margin (TE) (4) (5) | | 3.89 | | | 4.53 | | | 4.12 | | | 3.95 | | | 3.96 | |
Noninterest expense to average assets | | 2.58 | | | 3.01 | | | 2.94 | | | 2.87 | | | 3.31 | |
Efficiency ratio (6) | | 55.82 | | | 56.85 | | | 60.02 | | | 61.99 | | | 70.81 | |
Tangible efficiency ratio (TE) (2) (5) | | 52.96 | | | 55.03 | | | 55.03 | | | 56.72 | | | 65.29 | |
Dividend payout ratio | | 25.37 | | | 23.68 | | | 28.71 | | | 31.42 | | | 41.88 | |
| | | | | |
Asset Quality Data | | | | | | | | | | | | | | | |
Nonperforming assets to total assets at end of period (7) | | 0.34 | % | | 0.42 | % | | 0.91 | % | | 0.57 | % | | 0.24 | % |
Allowance for loan losses to nonperforming loans at end of period (7) | | 355.92 | | | 301.64 | | | 159.86 | | | 135.78 | | | 279.25 | |
Allowance for loan losses to total loans at end of period | | 1.29 | | | 1.25 | | | 1.16 | | | 1.09 | | | 1.04 | |
| | | | | |
Consolidated Capital Ratios | | | | | | | | | | | | | | | |
Tier 1 leverage capital ratio | | 7.50 | % | | 7.62 | % | | 6.95 | % | | 6.67 | % | | 6.26 | % |
Tier 1 risk-based capital ratio | | 10.94 | | | 10.66 | | | 9.96 | | | 10.05 | | | 9.42 | |
Total risk-based capital ratio | | 12.20 | | | 11.89 | | | 11.09 | | | 11.19 | | | 10.43 | |
| | |
|
| |
|
| |
|
| |
|
| |
|
|
| (1) | Shares used for book value purposes exclude shares held in treasury and unreleased shares held by the Employee Stock Ownership Plan at the end of the period. |
| (2) | Tangible calculations eliminate the effect of goodwill and acquisition related intangible assets and the corresponding amortization expense on a tax-effected basis where applicable. |
| (3) | With the exception of end-of-period ratios, all ratios are based on average daily balances during the respective periods. |
| (4) | Interest rate spread represents the difference between the weighted average yield on earning assets and the weighted average cost of interest-bearing liabilities. Net interest margin represents net interest income as a percentage of average earning assets. |
| (5) | Fully taxable equivalent (TE) calculations include the tax benefit associated with related income sources that are tax-exempt using a marginal tax rate of 35%. |
| (6) | The efficiency ratio represents noninterest expense as a percentage of total revenues. Total revenues is the sum of net interest income and noninterest income. |
| (7) | Nonperforming loans consist of nonaccruing loans and loans 90 days or more past due. Nonperforming assets consist of nonperforming loans and repossessed assets. |
24
INDEPENDENT AUDITORS’ REPORT
To the Board of Directors
IBERIABANK Corporation
We have audited the accompanying consolidated balance sheets of IBERIABANK Corporation and Subsidiary as of December 31, 2003 and 2002, and the related consolidated statements of income, shareholders’ equity, and cash flows for each of the three years in the period ended December 31, 2003. These consolidated financial statements are the responsibility of the Company’s management. Our responsibility is to express an opinion on these consolidated financial statements based on our audits.
We conducted our audits in accordance with U.S. generally accepted auditing standards. Those standards require that we plan and perform the audit to obtain reasonable assurance about whether the financial statements are free of material misstatement. An audit includes examining, on a test basis, evidence supporting the amounts and disclosures in the financial statements. An audit also includes assessing the accounting principles used and significant estimates made by management, as well as evaluating the overall financial statement presentation. We believe that our audits provide a reasonable basis for our opinion.
In our opinion, the consolidated financial statements referred to above present fairly, in all material respects, the financial position of IBERIABANK Corporation and Subsidiary as of December 31, 2003 and 2002, and the results of its operations and its cash flows for each of the three years in the period ended December 31, 2003, in conformity with U. S. generally accepted accounting principles.
/s/ Castaing, Hussey & Lolan, LLC
New Iberia, Louisiana
February 13, 2004, except for
Note 2 as to which the
date is February 29, 2004
IBERIABANK CORPORATION AND SUBSIDIARY
Consolidated Balance Sheets
December 31, 2003 and 2002
| | | | | | | | |
(dollars in thousands, except share data)
| | 2003
| | | 2002
| |
Assets | | | | | | | | |
Cash and due from banks | | $ | 48,849 | | | $ | 36,555 | |
Interest-bearing deposits in banks | | | 20,722 | | | | 27,220 | |
| | |
|
|
| |
|
|
|
Total cash and cash equivalents | | | 69,571 | | | | 63,775 | |
Securities available for sale, at fair value | | | 426,130 | | | | 309,636 | |
Securities held to maturity, fair values of $55,207 and $60,600, respectively | | | 53,492 | | | | 58,486 | |
Mortgage loans held for sale | | | 5,781 | | | | 8,683 | |
Loans, net of unearned income | | | 1,412,349 | | | | 1,044,492 | |
Allowance for loan losses | | | (18,230 | ) | | | (13,101 | ) |
| | |
|
|
| |
|
|
|
Loans, net | | | 1,394,119 | | | | 1,031,391 | |
Premises and equipment, net | | | 31,992 | | | | 18,161 | |
Goodwill | | | 59,523 | | | | 35,401 | |
Other assets | | | 75,203 | | | | 45,055 | |
| | |
|
|
| |
|
|
|
Total Assets | | $ | 2,115,811 | | | $ | 1,570,588 | |
| | |
|
|
| |
|
|
|
Liabilities | | | | | | | | |
Deposits: | | | | | | | | |
Noninterest-bearing | | $ | 189,786 | | | $ | 159,005 | |
Interest-bearing | | | 1,399,320 | | | | 1,083,227 | |
| | |
|
|
| |
|
|
|
Total deposits | | | 1,589,106 | | | | 1,242,232 | |
Short-term borrowings | | | 162,590 | | | | 96,803 | |
Long-term debt | | | 156,291 | | | | 75,458 | |
Other liabilities | | | 12,655 | | | | 16,497 | |
| | |
|
|
| |
|
|
|
Total Liabilities | | | 1,920,642 | | | | 1,430,990 | |
| | |
|
|
| |
|
|
|
Shareholders’ Equity | | | | | | | | |
Preferred stock, $1 par value - 5,000,000 shares authorized | | | — | | | | — | |
Common stock, $1 par value - 25,000,000 shares authorized; 8,362,492 and 7,380,671 shares issued, respectively | | | 8,362 | | | | 7,381 | |
Additional paid-in-capital | | | 114,674 | | | | 72,769 | |
Retained earnings | | | 119,967 | | | | 102,390 | |
Unearned compensation | | | (2,668 | ) | | | (2,690 | ) |
Accumulated other comprehensive income | | | 183 | | | | 712 | |
Treasury stock at cost - 1,644,034 and 1,667,842 shares, respectively | | | (45,349 | ) | | | (40,964 | ) |
| | |
|
|
| |
|
|
|
Total Shareholders’ Equity | | | 195,169 | | | | 139,598 | |
| | |
|
|
| |
|
|
|
Total Liabilities and Shareholders’ Equity | | $ | 2,115,811 | | | $ | 1,570,588 | |
| | |
|
|
| |
|
|
|
The accompanying Notes to Consolidated Financial Statements are an integral part of these Financial Statements.
IBERIABANK CORPORATION AND SUBSIDIARY
Consolidated Statements of Income
Years Ended December 31, 2003, 2002 and 2001
| | | | | | | | | | |
(dollars in thousands, except per share data)
| | 2003
| | 2002
| | | 2001
|
Interest and Dividend Income | | | | | | | | | | |
Loans, including fees | | $ | 79,217 | | $ | 71,153 | | | $ | 79,265 |
Mortgage loans held for sale, including fees | | | 893 | | | 362 | | | | 682 |
Investment securities: | | | | | | | | | | |
Taxable interest | | | 13,201 | | | 14,130 | | | | 17,435 |
Tax-exempt interest | | | 2,466 | | | 1,186 | | | | 398 |
Other | | | 785 | | | 721 | | | | 2,588 |
| | |
|
| |
|
|
| |
|
|
Total interest and dividend income | | | 96,562 | | | 87,552 | | | | 100,368 |
| | |
|
| |
|
|
| |
|
|
Interest Expense | | | | | | | | | | |
Deposits | | | 21,034 | | | 24,562 | | | | 42,127 |
Short-term borrowings | | | 1,428 | | | 613 | | | | 617 |
Long-term debt | | | 6,467 | | | 2,783 | | | | 3,274 |
| | |
|
| |
|
|
| |
|
|
Total interest expense | | | 28,929 | | | 27,958 | | | | 46,018 |
| | |
|
| |
|
|
| |
|
|
Net interest income | | | 67,633 | | | 59,594 | | | | 54,350 |
Provision for loan losses | | | 6,300 | | | 6,197 | | | | 5,046 |
| | |
|
| |
|
|
| |
|
|
Net interest income after provision for loan losses | | | 61,333 | | | 53,397 | | | | 49,304 |
| | |
|
| |
|
|
| |
|
|
Noninterest Income | | | | | | | | | | |
Service charges on deposit accounts | | | 11,683 | | | 9,984 | | | | 8,054 |
ATM fee income | | | 1,810 | | | 1,609 | | | | 1,491 |
Gain on sale of loans, net | | | 4,199 | | | 2,081 | | | | 2,234 |
Gain on sale of assets | | | 334 | | | 406 | | | | 301 |
Gain (loss) on sale of investments, net | | | 267 | | | (42 | ) | | | 119 |
Other income | | | 4,771 | | | 3,828 | | | | 2,945 |
| | |
|
| |
|
|
| |
|
|
Total noninterest income | | | 23,064 | | | 17,866 | | | | 15,144 |
| | |
|
| |
|
|
| |
|
|
Noninterest Expense | | | | | | | | | | |
Salaries and employee benefits | | | 26,585 | | | 23,066 | | | | 21,187 |
Occupancy and equipment | | | 6,273 | | | 5,432 | | | | 5,439 |
Communication and delivery | | | 2,762 | | | 2,551 | | | | 2,510 |
Franchise and shares tax | | | 2,086 | | | 1,681 | | | | 1,357 |
Data processing | | | 1,663 | | | 1,456 | | | | 1,256 |
Marketing and business development | | | 1,255 | | | 1,006 | | | | 876 |
Printing, stationery and supplies | | | 845 | | | 687 | | | | 753 |
Amortization of acquisition intangibles | | | 781 | | | 243 | | | | 3,151 |
Other expenses | | | 8,379 | | | 7,910 | | | | 5,182 |
| | |
|
| |
|
|
| |
|
|
Total noninterest expense | | | 50,629 | | | 44,032 | | | | 41,711 |
| | |
|
| |
|
|
| |
|
|
Income before income tax expense | | | 33,768 | | | 27,231 | | | | 22,737 |
Income tax expense | | | 10,216 | | | 8,778 | | | | 8,229 |
| | |
|
| |
|
|
| |
|
|
Net Income | | $ | 23,552 | | $ | 18,453 | | | $ | 14,508 |
| | |
|
| |
|
|
| |
|
|
Earnings per share - basic | | $ | 3.71 | | $ | 3.26 | | | $ | 2.48 |
Earnings per share - diluted | | $ | 3.42 | | $ | 3.02 | | | $ | 2.36 |
| | |
|
| |
|
|
| |
|
|
The accompanying Notes to Consolidated Financial Statements are an integral part of these Financial Statements.
IBERIABANK CORPORATION AND SUBSIDIARY
Consolidated Statements of Shareholders’ Equity
Years Ended December 31, 2003, 2002 and 2001
| | | | | | | | | | | | | | | | | | | | | | | | | | |
(dollars in thousands, except share and per share data)
| | Common Stock
| | Additional Paid-In Capital
| | Retained Earnings
| | | Unearned Compensation
| | | Accumulated Other Comprehensive Income
| | | Treasury Stock
| | | Total
| |
Balance, December 31, 2000 | | $ | 7,381 | | $ | 69,231 | | $ | 77,963 | | | $ | (4,654 | ) | | $ | (2,293 | ) | | $ | (20,586 | ) | | $ | 127,042 | |
Comprehensive income: | | | | | | | | | | | | | | | | | | | | | | | | | | |
Net income | | | | | | | | | 14,508 | | | | | | | | | | | | | | | | 14,508 | |
Change in unrealized loss on securities available for sale, net of deferred taxes | | | | | | | | | | | | | | | | | 3,032 | | | | | | | | 3,032 | |
| | | | | | | | | | | | | | | | | | | | | | | | |
|
|
|
Total comprehensive income | | | | | | | | | | | | | | | | | | | | | | | | | 17,540 | |
Cash dividends declared, $.70 per share | | | | | | | | | (4,165 | ) | | | | | | | | | | | | | | | (4,165 | ) |
Reissuance of treasury stock under stock option plan, net of shares surrendered in payment, including tax benefit, 29,308 shares | | | | | | 155 | | | | | | | | | | | | | | | 197 | | | | 352 | |
Common stock released by ESOP trust | | | | | | 906 | | | | | | | 546 | | | | | | | | | | | | 1,452 | |
Common stock earned by participants of recognition and retention plan trust, including tax benefit | | | | | | 185 | | | | | | | 425 | | | | | | | | | | | | 610 | |
Treasury stock acquired at cost, 300,000 shares | | | | | | | | | | | | | | | | | | | | | (8,414 | ) | | | (8,414 | ) |
| | |
|
| |
|
| |
|
|
| |
|
|
| |
|
|
| |
|
|
| |
|
|
|
Balance, December 31, 2001 | | | 7,381 | | | 70,477 | | | 88,306 | | | | (3,683 | ) | | | 739 | | | | (28,803 | ) | | | 134,417 | |
Comprehensive income: | | | | | | | | | | | | | | | | | | | | | | | | | | |
Net income | �� | | | | | | | | 18,453 | | | | | | | | | | | | | | | | 18,453 | |
Change in unrealized gain on securities available for sale, net of deferred taxes | | | | | | | | | | | | | | | | | 1,157 | | | | | | | | 1,157 | |
Change in fair value of derivatives used for cash flow hedges, net of tax effect | | | | | | | | | | | | | | | | | (1,184 | ) | | | | | | | (1,184 | ) |
| | | | | | | | | | | | | | | | | | | | | | | | |
|
|
|
Total comprehensive income | | | | | | | | | | | | | | | | | | | | | | | | | 18,426 | |
Cash dividends declared, $.76 per share | | | | | | | | | (4,369 | ) | | | | | | | | | | | | | | | (4,369 | ) |
Reissuance of treasury stock under stock option plan, net of shares surrendered in payment, including tax benefit, 52,628 shares | | | | | | 645 | | | | | | | | | | | | | | | 483 | | | | 1,128 | |
Common stock released by ESOP trust | | | | | | 1,337 | | | | | | | 509 | | | | | | | | | | | | 1,846 | |
Common stock earned by participants of recognition and retention plan trust, including tax benefit | | | | | | 310 | | | | | | | 484 | | | | | | | | | | | | 794 | |
Treasury stock acquired at cost, 334,300 shares | | | | | | | | | | | | | | | | | | | | | (12,644 | ) | | | (12,644 | ) |
| | |
|
| |
|
| |
|
|
| |
|
|
| |
|
|
| |
|
|
| |
|
|
|
Balance, December 31, 2002 | | | 7,381 | | | 72,769 | | | 102,390 | | | | (2,690 | ) | | | 712 | | | | (40,964 | ) | | | 139,598 | |
Comprehensive income: | | | | | | | | | | | | | | | | | | | | | | | | | | |
Net income | | | | | | | | | 23,552 | | | | | | | | | | | | | | | | 23,552 | |
Change in unrealized gain on securities available for sale, net of deferred taxes | | | | | | | | | | | | | | | | | (993 | ) | | | | | | | (993 | ) |
Change in fair value of derivatives used for cash flow hedges, net of tax effect | | | | | | | | | | | | | | | | | 464 | | | | | | | | 464 | |
| | | | | | | | | | | | | | | | | | | | | | | | |
|
|
|
Total comprehensive income | | | | | | | | | | | | | | | | | | | | | | | | | 23,023 | |
Cash dividends declared, $.90 per share | | | | | | | | | (5,975 | ) | | | | | | | | | | | | | | | (5,975 | ) |
Reissuance of treasury stock under stock option plan, net of shares surrendered in payment, including tax benefit, 127,068 shares | | | | | | 1,653 | | | | | | | | | | | | | | | 1,340 | | | | 2,993 | |
Common stock released by ESOP trust | | | | | | 1,768 | | | | | | | 473 | | | | | | | | | | | | 2,241 | |
Common stock earned by participants of recognition and retention plan trust, including tax benefit | | | | | | 458 | | | | | | | 613 | | | | | | | | | | | | 1,071 | |
Common stock issued for recognition and retention plan | | | | | | 612 | | | | | | | (1,064 | ) | | | | | | | 452 | | | | — | |
Common stock issued for acquisition | | | 981 | | | 37,414 | | | | | | | | | | | | | | | | | | | 38,395 | |
Treasury stock acquired at cost, 127,400 shares | | | | | | | | | | | | | | | | | | | | | (6,177 | ) | | | (6,177 | ) |
| | |
|
| |
|
| |
|
|
| |
|
|
| |
|
|
| |
|
|
| |
|
|
|
Balance, December 31, 2003 | | $ | 8,362 | | $ | 114,674 | | $ | 119,967 | | | $ | (2,668 | ) | | $ | 183 | | | $ | (45,349 | ) | | $ | 195,169 | |
| | |
|
| |
|
| |
|
|
| |
|
|
| |
|
|
| |
|
|
| |
|
|
|
The accompanying Notes to Consolidated Financial Statements are an integral part of these Financial Statements.
IBERIABANK CORPORATION AND SUBSIDIARY
Consolidated Statements of Cash Flows
Years Ended December 31, 2003, 2002 and 2001
| | | | | | | | | | | | |
(dollars in thousands)
| | 2003
| | | 2002
| | | 2001
| |
Cash Flows from Operating Activities | | | | | | | | | | | | |
Net income | | $ | 23,552 | | | $ | 18,453 | | | $ | 14,508 | |
Adjustments to reconcile net income to net cash provided by operating activities: | | | | | | | | | | | | |
Depreciation and amortization | | | 4,112 | | | | 3,872 | | | | 6,440 | |
Provision for loan losses | | | 6,300 | | | | 6,197 | | | | 5,046 | |
Noncash compensation expense | | | 2,710 | | | | 2,217 | | | | 1,717 | |
Gain on sale of assets | | | (414 | ) | | | (391 | ) | | | (256 | ) |
(Gain) Loss on sale of investments | | | (267 | ) | | | 42 | | | | (119 | ) |
Amortization of premium/discount on investments | | | 5,790 | | | | 2,491 | | | | 722 | |
Current provision for deferred income taxes | | | 216 | | | | (678 | ) | | | 107 | |
Net change in loans held for sale | | | 6,475 | | | | 7,184 | | | | (12,520 | ) |
Other operating activities, net | | | (10,531 | ) | | | (2,651 | ) | | | (13,891 | ) |
| | |
|
|
| |
|
|
| |
|
|
|
Net Cash Provided by Operating Activities | | | 37,943 | | | | 36,736 | | | | 1,754 | |
| | |
|
|
| |
|
|
| |
|
|
|
Cash Flows from Investing Activities | | | | | | | | | | | | |
Proceeds from sales of securities available for sale | | | 100,452 | | | | 26,288 | | | | 118,851 | |
Proceeds from maturities, prepayments and calls of securities available for sale | | | 145,731 | | | | 162,094 | | | | 56,601 | |
Purchases of securities available for sale | | | (328,222 | ) | | | (278,370 | ) | | | (122,332 | ) |
Proceeds from maturities, prepayments and calls of securities held to maturity | | | 30,529 | | | | 48,096 | | | | 20,212 | |
Purchases of securities held to maturity | | | (8,119 | ) | | | (4,855 | ) | | | (46,277 | ) |
Proceeds from sale of loans | | | 26,913 | | | | — | | | | — | |
Increase in loans receivable, net | | | (209,959 | ) | | | (100,122 | ) | | | (26,875 | ) |
Proceeds from sale of premises and equipment | | | 880 | | | | 160 | | | | 1,181 | |
Purchases of premises and equipment | | | (8,381 | ) | | | (1,582 | ) | | | (1,256 | ) |
Proceeds from disposition of real estate owned | | | 1,881 | | | | 4,304 | | | | 1,579 | |
Cash received in excess of cash paid in acquisition | | | 21,120 | | | | — | | | | — | |
Cash paid in excess of cash received on branch sale | | | — | | | | (5,999 | ) | | | — | |
Other investing activities, net | | | (5,030 | ) | | | (4,101 | ) | | | 2,674 | |
| | |
|
|
| |
|
|
| |
|
|
|
Net Cash (Used in) Provided by Investing Activities | | | (232,205 | ) | | | (154,087 | ) | | | 4,358 | |
| | |
|
|
| |
|
|
| |
|
|
|
Cash Flows from Financing Activities | | | | | | | | | | | | |
Increase in deposits | | | 137,915 | | | | 16,969 | | | | 94,207 | |
Net change in short-term borrowings | | | 64,461 | | | | 84,464 | | | | (41,661 | ) |
Proceeds from long-term debt | | | 20,000 | | | | 52,000 | | | | — | |
Repayments of long-term debt | | | (12,535 | ) | | | (7,979 | ) | | | (29,406 | ) |
Dividends paid to shareholders | | | (5,185 | ) | | | (4,066 | ) | | | (3,981 | ) |
Proceeds from sale of treasury stock for stock options exercised | | | 1,770 | | | | 701 | | | | 283 | |
Costs of issuance of common stock in acquisition | | | (191 | ) | | | — | | | | — | |
Payments to repurchase common stock | | | (6,177 | ) | | | (12,644 | ) | | | (8,414 | ) |
| | |
|
|
| |
|
|
| |
|
|
|
Net Cash Provided by Financing Activities | | | 200,058 | | | | 129,445 | | | | 11,028 | |
| | |
|
|
| |
|
|
| |
|
|
|
Net Increase In Cash and Cash Equivalents | | | 5,796 | | | | 12,094 | | | | 17,140 | |
Cash and Cash Equivalents at Beginning of Period | | | 63,775 | | | | 51,681 | | | | 34,541 | |
| | |
|
|
| |
|
|
| |
|
|
|
Cash and Cash Equivalents at End of Period | | $ | 69,571 | | | $ | 63,775 | | | $ | 51,681 | |
| | |
|
|
| |
|
|
| |
|
|
|
Supplemental Schedule of Noncash Activities | | | | | | | | | | | | |
Acquisition of real estate in settlement of loans | | $ | 1,702 | | | $ | 1,550 | | | $ | 7,217 | |
Common stock issued in acquisition | | $ | 38,586 | | | $ | — | | | $ | — | |
Exercise of stock options with payment in company stock | | $ | 798 | | | $ | 495 | | | $ | 521 | |
| | |
|
|
| |
|
|
| |
|
|
|
Supplemental Disclosures | | | | | | | | | | | | |
Cash paid for: | | | | | | | | | | | | |
Interest on deposits and borrowings | | $ | 30,023 | | | $ | 29,170 | | | $ | 47,369 | |
Income taxes, net | | $ | 8,665 | | | $ | 8,825 | | | $ | 8,350 | |
| | |
|
|
| |
|
|
| |
|
|
|
The accompanying Notes to Consolidated Financial Statements are an integral part of these Financial Statements.
IBERIABANK CORPORATION AND SUBSIDIARY
Notes to Consolidated Financial Statements
NOTE 1 – SIGNIFICANT ACCOUNTING POLICIES:
NATURE OF OPERATIONS: IBERIABANK Corporation, (the “Company”) is a Louisiana corporation that serves as the bank holding company for IBERIABANK, (the “Bank”) a Louisiana chartered state commercial bank. Through the Bank, the Company offers commercial and retail products and services to customers throughout the state, including south central Louisiana, north Louisiana and the greater New Orleans area. Management of the Company monitors the revenue streams of the various products, services and markets; however, operations are managed and financial performance is evaluated on a company-wide basis. Accordingly, all of the Company’s banking operations are considered by management to be aggregated in one reportable operating segment.
PRINCIPLES OF CONSOLIDATION: The consolidated financial statements include the accounts of IBERIABANK Corporation and its wholly owned subsidiary, IBERIABANK, as well as all of the Bank’s subsidiaries, Iberia Financial Services, LLC, Acadiana Holdings, LLC, Jefferson Insurance Corporation, Metro Service Corporation, Finesco, LLC and IBERIABANK Insurance Services, LLC. All significant intercompany balances and transactions have been eliminated in consolidation.
USE OF ESTIMATES: The preparation of financial statements in conformity with generally accepted accounting principles requires management to make estimates and assumptions that affect the amounts reported in the consolidated financial statements and accompanying notes. Actual results could differ from those estimates. A material estimate that is susceptible to significant change in the near term is the allowance for loan losses.
CONCENTRATION OF CREDIT RISKS: Most of the Company’s business activity is with customers located within the State of Louisiana. The Company’s lending activity is concentrated in the Company’s three market areas in Louisiana. The Company in recent years has emphasized originations of commercial loans, private banking mortgage loans and indirect automobile loans. Repayment of loans is expected to come from cash flow of the borrower. Losses are limited by the value of the collateral upon default of the borrowers.
CASH AND CASH EQUIVALENTS: For purposes of presentation in the consolidated statements of cash flows, cash and cash equivalents are defined as cash, interest-bearing deposits and noninterest-bearing demand deposits at other financial institutions. The Bank is required to maintain average balances on hand or with the Federal Reserve Bank. At December 31, 2003 and 2002, these reserve balances amounted to $15,829,000 and $2,437,000, respectively.
INVESTMENT SECURITIES: Debt securities that management has the ability and intent to hold to maturity are classified as held to maturity and carried at cost, adjusted for amortization of premiums and accretion of discounts using methods approximating the interest method. Securities not classified as held to maturity or trading, including equity securities with readily determinable fair values, are classified as available for sale and recorded at fair value, with unrealized gains and losses excluded from earnings and reported in other comprehensive income. Declines in the value of individual held to maturity and available for sale securities below their cost that are other than temporary are included in earnings as realized losses. The cost of securities sold is recognized using the specific identification method.
MORTGAGE LOANS HELD FOR SALE: Mortgage loans originated and intended for sale in the secondary market are carried at the lower of cost or estimated fair value in the aggregate. Net unrealized losses, if any, are recognized through a valuation allowance by charges to income.
LOANS: Loans receivable are stated at the unpaid principal balances, less the allowance for loan losses and net deferred loan origination fees and unearned discounts. Interest income on loans is accrued over the term of the loans based on the principal balance outstanding. Loan origination fees, net of certain direct origination costs, are deferred and recognized as an adjustment of the related loan yield, using the interest method.
The accrual of interest on commercial loans is discontinued at the time the loan is 90 days delinquent unless the credit is well-secured and in process of collection. Mortgage, credit card and other personal loans are typically charged off to net collateral value, less cost to sell, no later than 180 days past due. In all cases, loans are placed on nonaccrual or charged off at an earlier date if collection of principal or interest is considered doubtful.
In general, all interest accrued but not collected for loans that are placed on nonaccrual or charged off is reversed against interest income. The interest on these loans is accounted for on the cash-basis method or cost-recovery method, until qualifying for return to accrual. Loans are returned to accrual status when all principal and interest amounts contractually due are brought current and future payments are reasonably assured.
ALLOWANCE FOR LOAN LOSSES: The allowance for loan losses is established as losses are estimated to have occurred through a provision charged to earnings. Loan losses are charged against the allowance when management believes the uncollectibility of a loan balance is confirmed. Subsequent recoveries, if any, are credited to the allowance. Allowances for impaired loans are generally determined based on collateral values or the present value of estimated cash flows. Changes in the allowance related to impaired loans are charged or credited to the provision for loan losses.
The allowance for loan losses is maintained at a level which, in management’s opinion, is adequate to absorb credit losses inherent in the portfolio. The amount of the allowance is based on management’s evaluation of various factors, including the collectibility of the loan portfolio, credit concentrations, trends in historical loss experience, specific impaired loans, and economic conditions. This evaluation is inherently subjective as it requires estimates that are susceptible to significant revision as more information becomes available.
The allowance consists of specific, general and unallocated components. The specific component relates to loans that are classified as doubtful, substandard or special mention. The general component covers non-classified loans and is based on historical loss experience adjusted for qualitative factors. An unallocated component is maintained to cover uncertainties that could affect management’s estimate of probable losses. The unallocated component of the allowance reflects the margin of imprecision inherent in the underlying assumptions used in the methodologies for estimating specific and general losses in the portfolio.
A loan is considered impaired when, based on current information and events, it is probable that the Company will be unable to collect the scheduled payments of principal or interest when due according to the contractual terms of the loan agreement. Factors considered by management in determining impairment include payment status, collateral value, and the probability of collecting scheduled principal and interest payments when due. Loans that experience insignificant payment delays and payment shortfalls generally are not classified as impaired. The impairment loss is measured on a loan by loan basis for commercial and construction loans by either the present value of expected future cash flows discounted at the loan’s effective interest rate, the loan’s obtainable market price, or the fair value of the collateral if the loan is collateral dependent.
Large groups of smaller balance homogeneous loans are collectively evaluated for impairment. Accordingly, the Company does not separately identify individual consumer, residential and small business loans for impairment disclosures.
CREDIT RELATED FINANCIAL INSTRUMENTS:In the ordinary course of business, the Company has entered into commitments to extend credit, including commitments under credit card arrangements, commercial letters of credit and standby letters of credit. Such financial instruments are recorded when they are funded.
LOAN SERVICING: Mortgage servicing rights are recognized on loans sold where the institution retains the servicing rights. Capitalized mortgage servicing rights are reported in other assets and are amortized into non-interest income. Impairment of mortgage servicing rights is assessed based on the fair value of those rights. Fair values are estimated using discounted cash flows based on a current market interest rate.
FORECLOSED PROPERTY: Real estate and other assets acquired in settlement of loans are recorded at the balance of the loan or at estimated fair value less estimated selling costs, whichever is less, at the date acquired. Subsequent to foreclosure, management periodically performs valuations and the assets are carried at the lower of cost or fair value less estimated selling costs. Revenue and expenses from operations, gain or loss on sale and changes in the valuation allowance are included in net expenses from foreclosed assets. There was no allowance for losses on foreclosed property at December 31, 2003 and 2002.
PREMISES AND EQUIPMENT: Land is carried at cost. Buildings and equipment are carried at cost, less accumulated depreciation computed on a straight line basis over the estimated useful lives of 15 to 40 years for buildings and 5 to 10 years for furniture, fixtures and equipment.
GOODWILL: Goodwill is accounted for in accordance with Statement of Financial Accounting Standards (“FAS”) No. 142,Goodwill and Other Intangible Assets, and accordingly is not amortized but is evaluated at least annually for impairment. Prior to the adoption of FAS 142 on January 1, 2002, goodwill was amortized over periods ranging from 15 to 25 years using the straight-line method.
TRANSFERS OF FINANCIAL ASSETS: Transfers of financial assets are accounted for as sales when control over the assets has been surrendered. Control over transferred assets is deemed to be surrendered when 1) the assets have been isolated from the Company, 2) the transferee obtains the right, free of conditions that constrain it from taking advantage of that right, to pledge or exchange the transferred assets, and 3) the Company does not maintain effective control over the transferred assets through an agreement to repurchase them before their maturity.
INCOME TAXES: The Company and all subsidiaries file a consolidated federal income tax return on a calendar year basis. Deferred income tax assets and liabilities are determined using the liability (or balance sheet) method. Under this method, the net deferred tax asset or liability is determined based on the tax effects of the temporary differences between the book and tax bases of the various balance sheet assets and liabilities and gives current recognition to changes in tax rates and laws. The measurement of deferred tax assets is reduced, if necessary, by the amount of any tax benefits that, based on available evidence, are not expected to be realized.
DERIVATIVE FINANCIAL INSTRUMENTS:The Company may enter into derivative contracts for the purposes of managing exposure to interest rate risk or to meet the financing needs of its customers. In accordance with FAS No. 133,Accounting for Derivative Instruments and Hedging Activities, as amended, all derivatives are required to be recorded on the balance sheet at fair value.
The Company utilizes interest rate swap agreements to convert a portion of its variable-rate debt to a fixed rate (cash flow hedge). Interest rate swaps are contracts in which a series of interest rate flows are exchanged over a prescribed period. The notional amount on which the interest payments are based is not exchanged.
For derivatives designated as hedging the exposure to changes in the fair value of an asset or liability (fair value hedge), the gain or loss is recognized in earnings in the period of change together with the offsetting loss or gain to the hedged item attributable to the risk being hedged. Earnings will be affected to the extent to which the hedge is not effective in achieving offsetting changes in fair value. For derivatives designated as hedging exposure to variable cash flows of a forecasted transaction (cash flow hedge), the effective portion of the derivative’s gain or loss is initially reported as a component of other comprehensive income and subsequently reclassified into earnings when the forecasted transaction affects earnings or when the hedge is terminated. The ineffective portion of the gain or loss is reported in earnings immediately. For derivatives that are not designated as hedging instruments, changes in the fair value of the derivatives are recognized in earnings immediately.
In applying hedge accounting for derivatives, the Company establishes a method for assessing the effectiveness of the hedging derivative and a measurement approach for determining the ineffective aspect of the hedge upon the inception of the hedge. These methods are consistent with the Company’s approach to managing risk.
STOCK COMPENSATION PLANS: FAS No. 123,Accounting for Stock-Based Compensation, encourages all entities to adopt a fair value based method of accounting for employee stock compensation plans, whereby compensation cost is measured at the grant date based on the value of the award and is recognized over the service period, which is usually the vesting period. It also allows an entity to continue to measure compensation cost for those plans using the intrinsic value based method of accounting prescribed by Accounting Principles Board Opinion (“APB”) No. 25,Accounting for Stock Issued to Employees,whereby compensation cost is the excess, if any, of the quoted market price of the stock at the grant date (or other measurement date) over the amount an employee must pay to acquire the stock. Stock options issued under the Company’s stock option plans generally have no intrinsic value at the grant date, and under Opinion No. 25 no compensation cost is recognized for them. The Company has elected to continue with the accounting methodology in Opinion No. 25 and, as a result, has provided proforma disclosures of net income and earnings per share and other disclosures, as if the fair value based method of accounting had been applied. See Note 15 for additional information on the Company’s stock compensation plans.
EARNINGS PER COMMON SHARE: Basic earnings per share represents income available to common shareholders divided by the weighted average number of common shares outstanding during the period. Diluted earnings per share reflects additional common shares that would have been outstanding if dilutive potential common shares had been issued, as well as any adjustment to income that would result from the assumed issuance. Potential common shares that may be issued by the Company relate to outstanding stock options and unvested restricted stock, and are determined using the treasury stock method.
COMPREHENSIVE INCOME: Accounting principles generally require that recognized revenue, expenses, gains and losses be included in net income. Although certain changes in assets and liabilities, such as unrealized gains and losses on available for sale securities, are reported as a separate component of the equity section of the balance sheet, such items, along with net income, are components of comprehensive income.
SEGMENT INFORMATION: FAS No. 131,Disclosures about Segments of an Enterprise and Related Information, requires the reporting of information about a company’s operating segments using a “management approach.” The Statement requires that reportable segments be identified based upon those revenue-producing components for which separate financial information is produced internally and are subject to evaluation by the chief operating decision maker in deciding how to allocate resources to segments.
The Company has evaluated its potential operating segments against the criteria specified in the Statement and has determined that no operating segment disclosures are required in 2003, 2002 or 2001.
EFFECTS OF NEW ACCOUNTING PRONOUNCEMENTS: In November 2002, the FASB issued Interpretation No. 45,Guarantor’s Accounting and Disclosure Requirements for Guarantees, Including Indirect Guarantees of Indebtedness of Others(FIN 45), which covers guarantees such as standby letters of credit, performance guarantees, and direct or indirect guarantees of the indebtedness of others, but not guarantees of funding. FIN 45 requires a guarantor to recognize, at the inception of a guarantee, a liability in an amount equal to the fair value of the obligation undertaken in issuing the guarantee, and requires disclosure about the maximum potential payments that might be required, as well as the collateral or other recourse obtainable. The recognition and measurement provisions of FIN 45 were effective on a prospective basis after December 31, 2002, and its adoption has not had a significant effect on the Company’s consolidated financial statements.
In December 2002, the FASB issued Statement No. 148,Accounting for Stock-Based Compensation-Transition and Disclosure-an Amendment of FASB Statement No. 123. The Statement amends FAS No.
123,Accounting for Stock-Based Compensation, to provide alternative methods of transition for an entity that voluntarily changes to the fair value based method of accounting for stock-based employee compensation. It also amends the disclosure provisions of that Statement to require prominent disclosure about the effects on reported net income of an entity’s accounting policy decisions with respect to stock-based employee compensation. The Statement also amends APB Opinion No. 28,Interim Financial Reporting, to require disclosure about those effects in interim financial information. The Company currently does not account for its stock options under FAS 123/148.
In January 2003, the FASB issued Interpretation No. 46,Consolidation of Variable Interest Entities(FIN 46), which establishes guidance for determining when an entity should consolidate another entity that meets the definition of a variable interest entity. FIN 46 requires a variable interest entity to be consolidated by a company if that company will absorb a majority of the expected losses, will receive a majority of the expected residual returns, or both. Transferors to qualified special-purpose entities (“QSPEs”) and certain other interests in a QSPE are not subject to the requirements of FIN 46. On December 17, 2003, the FASB revised FIN 46 (FIN 46R) and deferred the effective date of FIN 46 to no later than the end of the first reporting period that ends after March 15, 2004, however, for special-purpose entities the Company would be required to apply FIN 46 as of December 31, 2003. As a result of the Interpretation, the Company deconsolidated Junior Subordinated Deferrable Interest Debentures during 2003.
In April 2003, the FASB issued FAS No. 149,Amendment of Statement 133 on Derivative Instruments and Hedging Activities. This Statement amends FAS No. 133,Accounting for Derivative Instruments and Hedging Activities and clarifies accounting for derivative instruments, including certain derivative instruments embedded in other contracts, and for hedging activities under FAS No. 133. This Statement is effective for contracts entered into or modified after June 30, 2003, except in certain circumstances, and for hedging relationships designated after June 30, 2003. This Statement did not have a material effect on the Company’s consolidated financial statements.
In May 2003, the FASB issued FAS No. 150,Accounting for Certain Financial Instruments with Characteristics of Both Liabilities and Equity. This Statement provides new rules on the accounting for certain financial instruments that, under previous guidance, issuers could account for as equity. Such financial instruments include mandatorily redeemable shares, instruments that require the issuer to buy back some of its shares in exchange for cash or other assets, or obligations that can be settled with shares, the monetary value of which is fixed. Most of the guidance in FAS No. 150 is effective for financial instruments entered into or modified after May 31, 2003, and otherwise is effective at the beginning of the first interim period beginning after June 30, 2003. This Statement had no effect on the Company’s consolidated financial statements.
In December 2003, the FASB issued FAS No. 132 (revised 2003),Employers’ Disclosures about Pensions and Postretirement Benefits. This Statement requires additional disclosures about the assets, obligations and cash flows of defined benefit pension and postretirement plans, as well as the expense recorded for such plans. This Statement had no effect on the Company’s consolidated financial statements.
In December 2003, the Accounting Standards Executive Committee issued Statement of Position 03-3,Accounting for Certain Loans or Debt Securities Acquired in a Transfer (“SOP 03-3”). SOP 03-3 addressed accounting for differences between contractual cash flows and cash flows expected to be collected from an investor’s initial investment in loans or debt securities (loans) acquired in a transfer if those differences are attributable, at least in part, to credit quality. SOP 03-3 includes loans acquired in purchase business combinations, but does not apply to loans originated by the entity. SOP 03-3 is effective for loans acquired in fiscal years beginning after December 15, 2004 although earlier adoption is encouraged. The adoption of this new statement of position is not expected to have a material impact on the Company’s consolidated financial statements.
RECLASSIFICATIONS: Certain reclassifications have been made to the 2001 and 2002 consolidated financial statements in order to conform to the classifications adopted for reporting in 2003.
NOTE 2 – ACQUISITION ACTIVITY:
The Company completed the acquisition of 100% of the outstanding stock of Acadiana Bancshares, Inc. (“Acadiana”) at the close of business on February 28, 2003, in exchange for 981,821 shares valued at $38.6 million or $39.30 per share and $9.8 million in cash. The shares were valued by using the closing price of the Company’s stock for the three days immediately prior to, and after, February 14, 2003, the earliest date that the number of shares to be issued was known. This acquisition enhances the Company’s position as a leading financial services provider in its primary market base area and in the state of Louisiana.
The consolidated statement of income includes the results of operations for Acadiana from the acquisition date. The transaction resulted in $24.1 million of goodwill, $4.0 million of core deposit intangibles and $313,000 of other intangibles. The goodwill acquired is not tax deductible. The amount allocated to the core deposit intangible was determined by an independent valuation and is being amortized over the estimated useful life of eight years using a double declining method. The amount allocated to other intangibles represents the estimated value assigned to mortgage servicing rights and is being amortized over an estimated useful life of seven years using an interest method.
In the acquisition, shareholders of Acadiana received total consideration of $39.38 per outstanding share of Acadiana common stock in a combination of the Company’s common stock and cash. The combination was accounted for as a purchase with the purchase price allocated as follows:
| | | | |
(dollars in thousands)
| | Amount
| |
Cash and due from banks | | $ | 30,901 | |
Investment securities | | | 58,912 | |
Loans held for sale | | | 3,573 | |
Loans, net | | | 189,570 | |
Premises and equipment | | | 8,719 | |
Goodwill | | | 24,122 | |
Core deposit and other intangibles | | | 4,357 | |
Other assets | | | 16,390 | |
Deposits | | | (209,972 | ) |
Short-term borrowings | | | (1,326 | ) |
Long-term debt | | | (73,707 | ) |
Other liabilities | | | (3,173 | ) |
| | |
|
|
|
Total purchase price | | $ | 48,366 | |
| | |
|
|
|
The results of operations of the Company subsequent to the acquisition date are included in the Company’s consolidated statements of income. The following pro forma information for the years ended December 31, 2003 and 2002 reflects the Company’s estimated consolidated results of operations as if the acquisition of Acadiana occurred at January 1 of the respective period, unadjusted for potential cost savings.
| | | | | | |
(dollars in thousands, except per share data)
| | 2003
| | 2002
|
Interest and dividend income | | $ | 99,143 | | $ | 105,919 |
Interest expense | | | 29,981 | | | 35,627 |
| | |
|
| |
|
|
Net interest income | | | 69,162 | | | 70,292 |
Provision for loan losses | | | 6,300 | | | 6,197 |
| | |
|
| |
|
|
Net interest income after provision for loan losses | | | 62,862 | | | 64,095 |
Noninterest income | | | 23,476 | | | 20,050 |
Noninterest expense | | | 52,078 | | | 53,344 |
| | |
|
| |
|
|
Income before income taxes | | | 34,260 | | | 30,801 |
Income tax expense | | | 10,176 | | | 10,045 |
| | |
|
| |
|
|
Net income | | $ | 24,084 | | $ | 20,756 |
| | |
|
| |
|
|
Earnings per share – basic | | $ | 3.70 | | $ | 3.12 |
Earnings per share – diluted | | $ | 3.42 | | $ | 2.93 |
| | |
|
| |
|
|
On February 29, 2004, the Company acquired all of the outstanding stock of Alliance Bank (“Alliance”) for 287,285 shares of the Company’s common stock valued at $15,496,000. The transaction is accounted for under the purchase method of accounting. The acquisition expands the Company’s presence into Baton Rouge, Louisiana. At December 31, 2003, total assets of Alliance were $76,099,000, including $53,764,000 in loans receivable and $18,310,000 in investment securities. Total deposits at such date were $65,124,000.
NOTE 3 – INVESTMENT SECURITIES:
The amortized cost and fair values of investment securities, with gross unrealized gains and losses, consist of the following:
| | | | | | | | | | | | | |
(dollars in thousands)
| | Amortized Cost
| | Gross Unrealized Gains
| | Gross Unrealized Losses
| | | Fair Value
|
December 31, 2003 | | | | | | | | | | | | | |
Securities available for sale: | | | | | | | | | | | | | |
U.S. Government and federal agency obligations | | $ | 26,805 | | $ | 147 | | $ | — | | | $ | 26,952 |
Obligations of state and political subdivisions | | | 46,839 | | | 1,437 | | | (26 | ) | | | 48,250 |
Mortgage backed securities | | | 351,046 | | | 1,916 | | | (2,091 | ) | | | 350,871 |
Marketable equity securities | | | 51 | | | 6 | | | — | | | | 57 |
| | |
|
| |
|
| |
|
|
| |
|
|
Total securities available for sale | | $ | 424,741 | | $ | 3,506 | | $ | (2,117 | ) | | $ | 426,130 |
| | |
|
| |
|
| |
|
|
| |
|
|
Securities held to maturity: | | | | | | | | | | | | | |
U.S. Government and federal agency obligations | | $ | 13,101 | | $ | 232 | | $ | (3 | ) | | $ | 13,330 |
Obligations of state and political subdivisions | | | 17,134 | | | 744 | | | — | | | | 17,878 |
Mortgage backed securities | | | 23,257 | | | 760 | | | (18 | ) | | | 23,999 |
| | |
|
| |
|
| |
|
|
| |
|
|
Total securities held to maturity | | $ | 53,492 | | $ | 1,736 | | $ | (21 | ) | | $ | 55,207 |
| | |
|
| |
|
| |
|
|
| |
|
|
December 31, 2002 | | | | | | | | | | | | | |
Securities available for sale: | | | | | | | | | | | | | |
U.S. Government and federal agency obligations | | $ | 5,000 | | $ | 157 | | $ | — | | | $ | 5,157 |
Obligations of state and political subdivisions | | | 25,506 | | | 438 | | | (37 | ) | | | 25,907 |
Mortgage backed securities | | | 253,467 | | | 2,598 | | | (425 | ) | | | 255,640 |
Other debt securities | | | 15,441 | | | 265 | | | (74 | ) | | | 15,632 |
Marketable equity securities | | | 7,305 | | | — | | | (5 | ) | | | 7,300 |
| | |
|
| |
|
| |
|
|
| |
|
|
Total securities available for sale | | $ | 306,719 | | $ | 3,458 | | $ | (541 | ) | | $ | 309,636 |
| | |
|
| |
|
| |
|
|
| |
|
|
Securities held to maturity: | | | | | | | | | | | | | |
U.S. Government and federal agency obligations | | $ | 10,000 | | $ | 344 | | $ | — | | | $ | 10,344 |
Obligations of state and political subdivisions | | | 17,285 | | | 327 | | | (72 | ) | | | 17,540 |
Mortgage backed securities | | | 31,201 | | | 1,515 | | | — | | | | 32,716 |
| | |
|
| |
|
| |
|
|
| |
|
|
Total securities held to maturity | | $ | 58,486 | | $ | 2,186 | | $ | (72 | ) | | $ | 60,600 |
| | |
|
| |
|
| |
|
|
| |
|
|
Securities with carrying values of $321,370,000 and $160,352,000 were pledged to secure public deposits and other borrowings at December 31, 2003 and 2002, respectively.
The amortized cost and estimated fair value by maturity of investment securities at December 31, 2003 are shown in the following table. Securities are classified according to their contractual maturities without consideration of principal amortization, potential prepayments or call options. Accordingly, actual maturities may differ from contractual maturities.
| | | | | | | | | | | | | | | |
| | | Weighted
Average
Yield
| | | Securities
Available for Sale
| | Securities
Held to Maturity
|
(dollars in thousands)
| | | Amortized
Cost
| | Fair
Value
| | Amortized
Cost
| | Fair
Value
|
Within one year or less | | 1.97 | % | | $ | 1,127 | | $ | 1,130 | | $ | — | | $ | — |
One through five years | | 3.85 | | | | 22,526 | | | 22,826 | | | 8,606 | | | 8,765 |
After five through ten years | | 3.79 | | | | 134,496 | | | 135,056 | | | 11,261 | | | 11,436 |
Over ten years | | 4.23 | | | | 266,541 | | | 267,061 | | | 33,625 | | | 35,006 |
Marketable equity securities | | 1.92 | | | | 51 | | | 57 | | | — | | | — |
| | |
|
| |
|
| |
|
| |
|
| |
|
|
Totals | | 4.06 | % | | $ | 424,741 | | $ | 426,130 | | $ | 53,492 | | $ | 55,207 |
| | |
|
| |
|
| |
|
| |
|
| |
|
|
Management evaluates securities for other-than-temporary impairment at least quarterly, and more frequently when economic or market concerns warrant such evaluation. Consideration is given to (1) the length of time and the extent to which the fair value has been less than cost, (2) the financial condition and near-term prospects of the issuer, and (3) the intent and ability of the Company to retain its investment in the issuer for a period of time sufficient to allow for any anticipated recovery in fair value. In analyzing an issuer’s financial condition, management considers whether the securities are issued by the federal government or its agencies, whether downgrades by bond rating agencies have occurred, and industry analysts’ reports.
Information pertaining to securities with gross unrealized losses at December 31, 2003, aggregated by investment category and length of time that individual securities have been in a continuous loss position, follows:
| | | | | | | | | | | | | |
| | | Less Than Twelve
Months
| | Over Twelve Months
|
(dollars in thousands)
| | Gross Unrealized Losses
| | | Fair
Value
| | Gross Unrealized Losses
| | | Fair
Value
|
Securities available for sale: | | | | | | | | | | | | | |
Obligations of state and political subdivisions | | $ | (26 | ) | | $ | 4,628 | | $— | | | $ | — |
Mortgage backed securities | | | (2,029 | ) | | | 171,874 | | (62 | ) | | | 5,118 |
| | |
|
|
| |
|
| |
|
| |
|
|
Total securities available for sale | | $ | (2,055 | ) | | $ | 176,502 | | $(62 | ) | | $ | 5,118 |
| | |
|
|
| |
|
| |
|
| |
|
|
Securities held to maturity: | | | | | | | | | | | | | |
U.S. Government and federal agency obligations | | $ | (3 | ) | | $ | 1,958 | | $— | | | $ | — |
Mortgage backed securities | | | (18 | ) | | | 2,449 | | — | | | | — |
| | |
|
|
| |
|
| |
|
| |
|
|
Total securities held to maturity | | $ | (21 | ) | | $ | 4,407 | | $— | | | $ | — |
| | |
|
|
| |
|
| |
|
| |
|
|
At December 31, 2003, seventy-five debt securities have unrealized losses with aggregate depreciation of 1.20% from the Company’s amortized cost basis. Two of the seventy-five securities have been in a continuous loss position for over twelve months. The two securities have an aggregate amortized cost basis and unrealized loss of $5,179,000 and $62,000, respectively. The unrealized losses for each of the seventy-five securities relate principally to market interest rate changes. As management has the ability to hold debt securities until maturity, or for the foreseeable future if classified as available for sale, no declines are deemed to be other than temporary.
The following is a summary of realized gains and losses from the sale of securities available for sale:
| | | | | | | | | | | | |
| | | Years Ended December 31,
| |
(dollars in thousands)
| | 2003
| | | 2002
| | | 2001
| |
Realized gains | | $ | 648 | | | $ | 257 | | | $ | 184 | |
Realized losses | | | (381 | ) | | | (299 | ) | | | (65 | ) |
| | |
|
|
| |
|
|
| |
|
|
|
Net realized gains (losses) | | $ | 267 | | | $ | (42 | ) | | $ | 119 | |
| | |
|
|
| |
|
|
| |
|
|
|
The tax benefit (provision) applicable to these realized gains and losses is calculated at the federal income tax rate of 35%.
NOTE 4 – LOANS RECEIVABLE:
Loans receivable at December 31, 2003 and 2002 consists of the following:
| | | | | | |
(dollars in thousands)
| | 2003
| | 2002
|
Residential mortgage loans: | | | | | | |
Residential 1-4 family | | $ | 338,965 | | $ | 207,130 |
Construction | | | 50,295 | | | 16,470 |
| | |
|
| |
|
|
Total residential mortgage loans | | | 389,260 | | | 223,600 |
| | |
|
| |
|
|
Commercial loans: | | | | | | |
Real estate | | | 352,031 | | | 254,688 |
Business | | | 201,020 | | | 159,339 |
| | |
|
| |
|
|
Total commercial loans | | | 553,051 | | | 414,027 |
| | |
|
| |
|
|
Consumer loans: | | | | | | |
Indirect automobile | | | 229,636 | | | 219,280 |
Home equity | | | 174,740 | | | 122,799 |
Other | | | 65,662 | | | 64,786 |
| | |
|
| |
|
|
Total consumer loans | | | 470,038 | | | 406,865 |
| | |
|
| |
|
|
Total loans receivable | | $ | 1,412,349 | | $ | 1,044,492 |
| | |
|
| |
|
|
Loans receivable include approximately $435,901,000 and $301,623,000 of adjustable rate loans and $976,448,000 and $742,869,000 of fixed rate loans at December 31, 2003 and 2002, respectively.
The amount of loans for which the accrual of interest has been discontinued totaled approximately $3,902,000 and $3,257,000 at December 31, 2003 and 2002, respectively.
A summary of changes in the allowance for loan losses for the years ended December 31, 2003, 2002 and 2001 is as follows:
| | | | | | | | | | | | |
(dollars in thousands)
| | 2003
| | | 2002
| | | 2001
| |
Balance, beginning of year | | $ | 13,101 | | | $ | 11,117 | | | $ | 10,239 | |
Addition due to purchase transaction | | | 2,439 | | | | — | | | | — | |
Provision charged to operations | | | 6,300 | | | | 6,197 | | | | 5,046 | |
Loans charged-off | | | (4,782 | ) | | | (4,782 | ) | | | (4,673 | ) |
Recoveries | | | 1,172 | | | | 569 | | | | 505 | |
| | |
|
|
| |
|
|
| |
|
|
|
Balance, end of year | | $ | 18,230 | | | $ | 13,101 | | | $ | 11,117 | |
| | |
|
|
| |
|
|
| |
|
|
|
The following is a summary of information pertaining to impaired loans as of December 31:
| | | | | | |
(dollars in thousands)
| | 2003
| | 2002
|
Impaired loans without a valuation allowance | | $ | — | | $ | — |
Impaired loans with a valuation allowance | | | 3,353 | | | 3,504 |
| | |
|
| |
|
|
Total impaired loans | | $ | 3,353 | | $ | 3,504 |
| | |
|
| |
|
|
Valuation allowance related to impaired loans | | $ | 728 | | $ | 304 |
| | |
|
| |
|
|
| | | | | | | | | |
(dollars in thousands)
| | 2003
| | 2002
| | 2001
|
Average investment in impaired loans | | $ | 3,534 | | $ | 3,651 | | $ | 7,561 |
Interest income recognized on impaired loans | | | 211 | | | 236 | | | 230 |
Interest income recognized on a cash basis on impaired loans | | | 170 | | | 240 | | | 230 |
As of December 31, 2003, the Company is also committed to lend an additional $134,000 to two customers whose loans are classified as impaired.
NOTE 5 – LOAN SERVICING:
Mortgage loans serviced for others are not included in the accompanying consolidated balance sheets. The unpaid principal balances of mortgage loans serviced for others were $27,340,000 and $16,094,000 at December 31, 2003 and 2002, respectively. Custodial escrow balances maintained in connection with the foregoing portfolio of loans serviced for others, and included in demand deposits, were approximately $76,000 and $58,000 at December 31, 2003 and 2002, respectively.
The balance of mortgage servicing rights was $279,000 and $122,000 at December 31, 2003 and 2002, respectively. The increase in mortgage servicing rights is the result of the acquisition of Acadiana.
NOTE 6 – PREMISES AND EQUIPMENT:
Premises and equipment at December 31, 2003 and 2002 is summarized as follows:
| | | | | | |
(dollars in thousands)
| | 2003
| | 2002
|
Land | | $ | 4,921 | | $ | 3,379 |
Buildings | | | 24,825 | | | 15,767 |
Furniture, fixtures and equipment | | | 19,433 | | | 14,418 |
| | |
|
| |
|
|
Total premises and equipment | | | 49,179 | | | 33,564 |
Less accumulated depreciation | | | 17,187 | | | 15,403 |
| | |
|
| |
|
|
Total premises and equipment, net | | $ | 31,992 | | $ | 18,161 |
| | |
|
| |
|
|
Depreciation expense was $2,571,000, $2,341,000 and $2,559,000 for the years ended December 31, 2003, 2002 and 2001, respectively.
The Company actively engages in leasing office space that it has available. Leases have different terms ranging from monthly rental to five-year leases. At December 31, 2003, the monthly lease income was $74,000 per month. Total lease income for 2003, 2002 and 2001 was $884,000, $304,000 and $288,000, respectively. Income from leases was reported as a reduction in occupancy and equipment expense. The total allocated cost of the portion of the buildings held for lease at December 31, 2003 and 2002 was $4,404,000 and $1,995,000, respectively, with related accumulated depreciation of $937,000 and $746,000, respectively.
The Company leases certain branch offices, land and ATM facilities through non-cancelable operating leases with terms that range from one to twenty years, with renewal options thereafter. Total rent expense for the years ended December 31, 2003, 2002 and 2001 amounted to $914,000, $805,000 and $674,000, respectively.
Minimum future annual rent commitments under these agreements for the indicated periods follow:
| | | |
(dollars in thousands)
| | Amount
|
Year Ending December 31, | | | |
2004 | | $ | 838 |
2005 | | | 685 |
2006 | | | 435 |
2007 | | | 259 |
2008 | | | 213 |
2009 and thereafter | | | 683 |
| | |
|
|
Total | | $ | 3,113 |
| | |
|
|
NOTE 7 – GOODWILL AND OTHER INTANGIBLE ASSETS:
Effective January 1, 2002, the Company adopted the requirements of FAS No. 142,Goodwill and Other Intangible Assets. Under FAS No. 142, goodwill and intangible assets deemed to have indefinite lives are no longer amortized but are subject to annual impairment tests in accordance with the provisions of FAS No. 142. Other intangible assets continue to be amortized over their useful lives.
The Company performed the required annual impairment tests of goodwill as of October 1, 2003 and 2002. The results of these tests did not indicate impairment of the Company’s recorded goodwill. Changes to the carrying amount of goodwill not subject to amortization for the years ended December 31, 2003 and 2002 follows:
| | | |
(dollars in thousands)
| | Amount
|
Balance, December 31, 2001 | | $ | 35,401 |
Impairment losses | | | — |
| | |
|
|
Balance, December 31, 2002 | | $ | 35,401 |
Goodwill acquired during year | | | 24,122 |
Impairment losses | | | — |
| | |
|
|
Balance, December 31, 2003 | | $ | 59,523 |
| | |
|
|
The Company’s purchase accounting intangible assets which are subject to amortization include core deposit intangibles and mortgage servicing rights with the following carrying values:
| | | | | | | | | | | | |
| | | As of December 31, 2003
| | As of December 31, 2002
|
(dollars in thousands)
| | Gross
Carrying
Amount
| | Accumulated
Amortization
| | Gross
Carrying
Amount
| | Accumulated
Amortization
|
Core deposit intangibles | | $ | 4,044 | | $ | 781 | | $ | — | | $ | — |
Mortgage servicing rights | | | 313 | | | 131 | | | — | | | — |
| | |
|
| |
|
| |
|
| |
|
|
Totals | | $ | 4,357 | | $ | 912 | | $ | — | | $ | — |
| | |
|
| |
|
| |
|
| |
|
|
| | | |
(dollars in thousands)
| | Amount
|
Aggregate amortization expense: | | | |
For the year ended December 31, 2002 | | $ | 243 |
For the year ended December 31, 2003 | | | 912 |
| | | | |
Estimated amortization expense: | | | |
For the year ended December 31, 2004 | | $ | 809 |
For the year ended December 31, 2005 | | | 632 |
For the year ended December 31, 2006 | | | 493 |
For the year ended December 31, 2007 | | | 370 |
For the year ended December 31, 2008 | | | 360 |
The following table illustrates the impact goodwill amortization has had on operating results:
| | | | | | | | | |
| | | For The Years Ended December 31,
|
(dollars in thousands, except per share data)
| | 2003
| | 2002
| | 2001
|
Net income: | | | | | | | | | |
Reported net income | | $ | 23,552 | | $ | 18,453 | | $ | 14,508 |
Goodwill amortization (net of tax effect) | | | — | | | — | | | 2,023 |
| | |
|
| |
|
| |
|
|
Adjusted net income | | $ | 23,552 | | $ | 18,453 | | $ | 16,531 |
| | |
|
| |
|
| |
|
|
Basic earnings per share: | | | | | | | | | |
Reported net income | | $ | 3.71 | | $ | 3.26 | | $ | 2.48 |
Goodwill amortization (net of tax effect) | | | — | | | — | | | 0.35 |
| | |
|
| |
|
| |
|
|
Adjusted net income | | $ | 3.71 | | $ | 3.26 | | $ | 2.83 |
| | |
|
| |
|
| |
|
|
Diluted earnings per share: | | | | | | | | | |
Reported net income | | $ | 3.42 | | $ | 3.02 | | $ | 2.36 |
Goodwill amortization (net of tax effect) | | | — | | | — | | | 0.33 |
| | |
|
| |
|
| |
|
|
Adjusted net income | | $ | 3.42 | | $ | 3.02 | | $ | 2.69 |
| | |
|
| |
|
| |
|
|
NOTE 8 – DEPOSITS:
Certificates of deposit with a balance of $100,000 and over were $215,659,000 and $150,926,000 at December 31, 2003 and 2002, respectively.
A schedule of maturities of certificates of deposit as of December 31, 2003 is as follows:
| | | |
(dollars in thousands)
| | Amount
|
Year Ending December 31, | | | |
2004 | | $ | 386,758 |
2005 | | | 105,012 |
2006 | | | 39,690 |
2007 | | | 47,858 |
2008 | | | 14,540 |
2009 and thereafter | | | 5,229 |
| | |
|
|
Total | | $ | 599,087 |
| | |
|
|
NOTE 9 – SHORT-TERM BORROWINGS:
Short-term borrowings at December 31, 2003 and 2002 are summarized as follows:
| | | | | | |
(dollars in thousands)
| | 2003
| | 2002
|
Securities sold under agreements to repurchase | | $ | 19,590 | | $ | 21,803 |
Federal Home Loan Bank advances | | | 143,000 | | | 75,000 |
| | |
|
| |
|
|
Total short-term borrowings | | $ | 162,590 | | $ | 96,803 |
| | |
|
| |
|
|
Securities sold under agreements to repurchase, which are classified as secured borrowings, generally mature daily. Securities sold under agreements to repurchase are reflected at the amount of cash received in connection with the transaction. The Company may be required to provide additional collateral based on the fair value of the underlying securities.
The short-term borrowings at December 31, 2003 consist of FHLB advances with maturity terms ranging from one day to 365 days, at fixed interest rates ranging from 1.05% to 1.46%. The short-term borrowings at December 31, 2002 consist of FHLB advances with maturity terms of 2 days, at fixed interest rates ranging from 1.30% to 1.35%.
| | | | | | | | | | | | |
(dollars in thousands)
| | 2003
| | | 2002
| | | 2001
| |
Outstanding at December 31 | | $ | 162,590 | | | $ | 96,803 | | | $ | 12,339 | |
Maximum month-end outstandings | | | 162,590 | | | | 96,803 | | | | 52,058 | |
Average daily outstandings | | | 115,014 | | | | 32,961 | | | | 13,508 | |
Average rate during the year | | | 1.24 | % | | | 1.86 | % | | | 4.57 | % |
Average rate at year end | | | 1.13 | % | | | 1.36 | % | | | 2.57 | % |
NOTE 10 – LONG-TERM DEBT:
Long-term debt at December 31, 2003 and 2002 is summarized as follows:
| | | | | | |
(dollars in thousands)
| | 2003
| | 2002
|
Federal Home Loan Bank notes at: | | | | | | |
1.11 to 1.21% variable, 3 month LIBOR index | | $ | 35,000 | | $ | 35,000 |
1.59 to 8.70% fixed | | | 100,671 | | | 30,458 |
Junior Subordinated debt | | | 20,620 | | | 10,000 |
| | |
|
| |
|
|
Total long-term debt | | $ | 156,291 | | $ | 75,458 |
| | |
|
| |
|
|
FHLB advance repayments are amortized over periods ranging from three to thirty years, and have a balloon feature at maturity. Advances are collateralized by a blanket pledge of mortgage loans and a secondary pledge of FHLB stock and FHLB demand deposits. Total additional advances available from the FHLB at December 31, 2003 were $68,018,000 under the blanket floating lien and $90,256,000 with a pledge of investment securities. The weighted average rate at December 31, 2003 was 4.41%.
Junior Subordinated Debt consists of a total of $20,620,000 in Junior Subordinated Deferrable Interest Debentures of the Company issued to statutory trusts that were funded by the issuance of floating rate capital securities of the trusts. The issues of $10,310,000 each were completed in November 2002 and June 2003 bearing interest rates equal to the three-month London Interbank Offered Rates (LIBOR) plus 3.25% and 3.15%, respectively. The debentures qualify as Tier 1 Capital for regulatory purposes. The term of the securities is 30 years, and they are callable at par by the Company anytime after 5 years. Interest is payable quarterly and may be deferred at any time at the election of the Company for up to 20 consecutive quarterly periods. During such period the Company is subject to certain restrictions, including being prohibited from declaring dividends to its common shareholders.
Advances and long-term debt at December 31, 2003 have maturities in future years as follows:
| | | |
(dollars in thousands)
| | Amount
|
Year Ending December 31, | | | |
2004 | | $ | — |
2005 | | | 250 |
2006 | | | 2,000 |
2007 | | | 22,310 |
2008 | | | 29,310 |
2009 and thereafter | | | 102,421 |
| | |
|
|
Total | | $ | 156,291 |
| | |
|
|
NOTE 11 - ON-BALANCE SHEET DERIVATIVE INSTRUMENTS AND HEDGING ACTIVITIES:
The Company has stand alone derivative financial instruments in the form of interest rate swap agreements, which derive their value from underlying interest rates. These transactions involve both credit and market risk. The notional amounts are amounts on which calculations, payments, and the value of the derivatives are based. Notional amounts do not represent direct credit exposures. Direct credit exposure is limited to the net difference between the calculated amounts to be received and paid, if any. Such difference, which represents the fair value of the derivative instruments, is reflected on the Company’s balance sheet in other assets and other liabilities.
The Company is exposed to credit-related losses in the event of nonperformance by the counterparties to these agreements. The Company controls the credit risk of its financial contracts through credit approvals, limits and monitoring procedures, and does not expect any counterparties to fail their obligations. The Company deals only with primary dealers.
Derivative instruments are generally either negotiated over-the-counter (OTC) contracts or standardized contracts executed on a recognized exchange. Negotiated OTC derivative contracts are generally entered into between two counterparties that negotiate specific agreement terms, including the underlying instrument, amount, exercise prices and maturity.
The Company instituted partial hedges against the effect of rising interest rates on its variable rate debt by entering into interest rate swap agreements during 2003 and 2002 whereby the Company will receive quarterly variable rate payments and pay fixed rates on notional amounts totaling $20,000,000. Net settlements on the swap agreements are accrued monthly, effectively converting $20,000,000 of junior subordinated debt from variable rates to an average fixed rate of 6.28%. The Bank also entered into interest rate swap agreements during 2002 whereby the Bank will receive quarterly variable rate payments and pay fixed rates on notional amounts totaling $25,000,000. Net settlements on the swap agreements are accrued monthly, effectively converting $25,000,000 of FHLB advances from variable rates to an average fixed rate of 4.74%. The interest rate swaps mature from 2007 to 2009, which match the maturity or call date of the underlying debt.
No interest rate swap agreements were terminated prior to maturity in 2003 or 2002. Changes in the fair value of interest rate swaps designated as hedging instruments of the variability of cash flows associated with long-term debt are reported in other comprehensive income. These amounts subsequently are reclassified into interest expense as a yield adjustment in the same period in which the related interest on the long-term debt affects earnings. As a result of these interest rate swaps, interest expense was increased by $1,178,000 and $437,000 for the years ended December 31, 2003 and 2002, respectively.
Risk management results for the years ended December 31, 2003 and 2002 related to the balance sheet hedging of long-term debt indicate that the hedges were 100% effective and that there was no component of the derivative instruments’ gain or loss which was excluded from the assessment of hedge effectiveness.
NOTE 12 – INCOME TAXES:
The provision for income tax expense consists of the following:
| | | | | | | | | | | |
| | | Years Ended December 31,
|
(dollars in thousands)
| | 2003
| | | 2002
| | | 2001
|
Current expense: | | | | | | | | | | | |
Federal | | $ | 8,554 | | | $ | 8,832 | | | $ | 7,946 |
State | | | — | | | | — | | | | 3 |
| | |
|
|
| |
|
|
| |
|
|
Total current expense | | | 8,554 | | | | 8,832 | | | | 7,949 |
Deferred federal expense | | | 216 | | | | (678 | ) | | | 107 |
Tax credits | | | (91 | ) | | | — | | | | — |
Tax benefits allocated to paid in capital | | | 1,537 | | | | 624 | | | | 173 |
| | |
|
|
| |
|
|
| |
|
|
Total income tax expense | | $ | 10,216 | | | $ | 8,778 | | | $ | 8,229 |
| | |
|
|
| |
|
|
| |
|
|
There was an overpayment of federal income taxes of $2,058,000 and $52,000 at December 31, 2003 and 2002, respectively.
The provision for federal income taxes differs from the amount computed by applying the federal income tax statutory rate of 35 percent on income from operations as indicated in the following analysis:
| | | | | | | | | | | | |
| | | Years Ended December 31,
| |
(dollars in thousands)
| | 2003
| | | 2002
| | | 2001
| |
Federal tax based on statutory rate | | $ | 11,819 | | | $ | 9,531 | | | $ | 7,958 | |
Increase (decrease) resulting from: | | | | | | | | | | | | |
Effect of tax-exempt income | | | (2,227 | ) | | | (1,378 | ) | | | (374 | ) |
Amortization of acquisition intangibles | | | — | | | | 85 | | | | 376 | |
Interest and other nondeductible expenses | | | 240 | | | | 161 | | | | 83 | |
Nondeductible ESOP expense | | | 518 | | | | 389 | | | | 242 | |
State income tax on non-bank entities | | | — | | | | — | | | | 3 | |
Tax credit | | | (91 | ) | | | — | | | | — | |
Other | | | (43 | ) | | | (10 | ) | | | (59 | ) |
| | |
|
|
| |
|
|
| |
|
|
|
Income tax expense | | $ | 10,216 | | | $ | 8,778 | | | $ | 8,229 | |
| | |
|
|
| |
|
|
| |
|
|
|
Effective rate | | | 30.3 | % | | | 32.2 | % | | | 36.2 | % |
| | |
|
|
| |
|
|
| |
|
|
|
The net deferred tax asset (liability) at December 31, 2003 and 2002 is as follows:
| | | | | | | | |
(dollars in thousands)
| | 2003
| | | 2002
| |
Deferred tax asset: | | | | | | | | |
Allowance for loan losses | | $ | 6,005 | | | $ | 4,034 | |
Real estate owned | | | 358 | | | | 271 | |
Deferred compensation | | | 226 | | | | 230 | |
Time deposits | | | 848 | | | | — | |
Borrowings | | | 2,235 | | | | — | |
Unrealized loss on cash flow hedges | | | 388 | | | | 638 | |
Other | | | 758 | | | | 496 | |
| | |
|
|
| |
|
|
|
Subtotal | | | 10,818 | | | | 5,669 | |
| | |
|
|
| |
|
|
|
Deferred tax liability: | | | | | | | | |
FHLB stock | | | (1,773 | ) | | | (1,045 | ) |
Premises and equipment | | | (2,582 | ) | | | (1,579 | ) |
Acquisition premium | | | (2,596 | ) | | | (727 | ) |
Unrealized gain on investments classified as available for sale | | | (486 | ) | | | (1,021 | ) |
Other | | | (862 | ) | | | (274 | ) |
| | |
|
|
| |
|
|
|
Subtotal | | | (8,299 | ) | | | (4,646 | ) |
| | |
|
|
| |
|
|
|
Deferred tax asset, net | | $ | 2,519 | | | $ | 1,023 | |
| | |
|
|
| |
|
|
|
At December 31, 2003, the Company has a $319,000 net operating loss carry-forward obtained through an acquisition.
Retained earnings at December 31, 2003 and 2002 included approximately $21,864,000 and $14,791,000, respectively accumulated prior to January 1, 1987 for which no provision for federal income taxes has been made. If this portion of retained earnings is used in the future for any purpose other than to absorb bad debts, it will be added to future taxable income.
NOTE 13 – EARNINGS PER SHARE:
Weighted average shares of common stock outstanding for basic EPS excludes the weighted average shares not released by the Employee Stock Ownership Plan (“ESOP”) of 77,209, 126,287 and 179,007 shares at December 31, 2003, 2002 and 2001, respectively and the weighted average unvested shares in the Recognition and Retention Plan (“RRP”) of 135,673, 146,662 and 172,573 shares at December 31, 2003, 2002 and 2001, respectively. Shares not included in the calculation of diluted EPS because they are anti-dilutive were stock options of 29,000, 14,000 and 44,283 and RRP grants of 7,000, 7,000 and 6,026 at December 31, 2003, 2002 and 2001, respectively. The following sets forth the computation of basic net income per common share and diluted net income per common share.
| | | | | | | | | |
| | | Years Ended December 31,
|
| | | 2003
| | 2002
| | 2001
|
Numerator: | | | | | | | | | |
Income applicable to common shares | | $ | 23,552,000 | | $ | 18,453,000 | | $ | 14,508,000 |
| | |
|
| |
|
| |
|
|
Denominator: | | | | | | | | | |
Weighted average common shares outstanding | | | 6,343,467 | | | 5,662,810 | | | 5,843,861 |
Effect of dilutive securities: | | | | | | | | | |
Stock options outstanding | | | 504,837 | | | 420,788 | | | 267,618 |
RRP grants | | | 37,244 | | | 35,846 | | | 31,479 |
| | |
|
| |
|
| |
|
|
Weighted average common shares outstanding - assuming dilution | | | 6,885,548 | | | 6,119,444 | | | 6,142,958 |
| | |
|
| |
|
| |
|
|
Earnings per common share | | $ | 3.71 | | $ | 3.26 | | $ | 2.48 |
Earnings per common share – assuming dilution | | $ | 3.42 | | $ | 3.02 | | $ | 2.36 |
| | |
|
| |
|
| |
|
|
NOTE 14 – CAPITAL REQUIREMENTS AND OTHER REGULATORY MATTERS:
The Company (on a consolidated basis) and the Bank are subject to various regulatory capital requirements administered by the federal and state banking agencies. Failure to meet minimum capital requirements can initiate certain mandatory and possibly additional discretionary actions by regulators that, if undertaken, could have a direct material effect on the Company’s financial statements. Under capital adequacy guidelines and the regulatory framework for prompt corrective action, the Company and the Bank must meet specific capital guidelines that involve quantitative measures of their assets, liabilities and certain off-balance sheet items as calculated under regulatory accounting practices. The capital amounts and classification are also subject to qualitative judgments by the regulators about components, risk weightings and other factors. Prompt corrective action provisions are not applicable to bank holding companies.
Quantitative measures established by regulation to ensure capital adequacy require the Company and the Bank to maintain minimum amounts and ratios of total and Tier 1 capital to risk-weighted assets and of Tier 1 capital to average assets. Management believes, as of December 31, 2003 and 2002, that the Company and the Bank met all capital adequacy requirements to which they are subject.
As of December 31, 2003, the most recent notification from the Federal Deposit Insurance Corporation categorized the Bank as well capitalized under the regulatory framework for prompt corrective action. To be categorized as well capitalized, an institution must maintain minimum total risk-based, Tier 1 risk-based and Tier 1 leveraged ratios as set forth in the following table. There are no conditions or events since the notification that management believes have changed the Bank’s category. The Company’s and the Bank’s actual capital amounts and ratios as of December 31, 2003 and 2002 are also presented in the table.
| | | | | | | | | | | | | | | | | | |
| | | Actual
| | | Minimum
| | | Well Capitalized
| |
(dollars in thousands)
| | Amount
| | Ratio
| | | Amount
| | Ratio
| | | Amount
| | Ratio
| |
December 31, 2003 | | | | | | | | | | | | | | | | | | |
Tier 1 leverage capital: | | | | | | | | | | | | | | | | | | |
IBERIABANK Corporation | | $ | 152,792 | | 7.50 | % | | $ | 81,542 | | 4.00 | % | | $ | N/A | | N/A | % |
IBERIABANK | | | 142,144 | | 7.01 | | | | 81,112 | | 4.00 | | | | 101,390 | | 5.00 | |
Tier 1 risk-based capital: | | | | | | | | | | | | | | | | | | |
IBERIABANK Corporation | | | 152,792 | | 10.94 | | | | 55,841 | | 4.00 | | | | N/A | | N/A | |
IBERIABANK | | | 142,144 | | 10.20 | | | | 55,745 | | 4.00 | | | | 83,617 | | 6.00 | |
Total risk-based capital: | | | | | | | | | | | | | | | | | | |
IBERIABANK Corporation | | | 170,255 | | 12.20 | | | | 111,681 | | 8.00 | | | | N/A | | N/A | |
IBERIABANK | | | 159,578 | | 11.45 | | | | 111,490 | | 8.00 | | | | 139,362 | | 10.00 | |
| | | | | | | | | | | | | | | | | | | |
December 31, 2002 | | | | | | | | | | | | | | | | | | |
Tier 1 leverage capital: | | | | | | | | | | | | | | | | | | |
IBERIABANK Corporation | | $ | 113,469 | | 7.62 | % | | $ | 59,536 | | 4.00 | % | | $ | N/A | | N/A | % |
IBERIABANK | | | 104,715 | | 7.05 | | | | 59,393 | | 4.00 | | | | 74,241 | | 5.00 | |
Tier 1 risk-based capital: | | | | | | | | | | | | | | | | | | |
IBERIABANK Corporation | | | 113,469 | | 10.66 | | | | 42,596 | | 4.00 | | | | N/A | | N/A | |
IBERIABANK | | | 104,715 | | 9.86 | | | | 42,501 | | 4.00 | | | | 63,752 | | 6.00 | |
Total risk-based capital: | | | | | | | | | | | | | | | | | | |
IBERIABANK Corporation | | | 126,570 | | 11.89 | | | | 85,191 | | 8.00 | | | | N/A | | N/A | |
IBERIABANK | | | 117,816 | | 11.09 | | | | 85,003 | | 8.00 | | | | 106,254 | | 10.00 | |
NOTE 15 – BENEFIT PLANS:
401 ( K ) PROFIT SHARING PLAN
The Company has a 401(k) Profit Sharing Plan covering substantially all of its employees. Annual employer contributions to the plan are set by the Board of Directors. No contributions were made by the Company for the years ended December 31, 2003, 2002 and 2001. The Plan provides, among other things, that participants in the Plan be able to direct the investment of their account balances within the Profit Sharing Plan into alternative investment funds. Participant deferrals under the salary reduction election may be matched by the employer based on a percentage to be determined annually by the employer.
EMPLOYEE STOCK OWNERSHIP PLAN
In 1995, the Company established an ESOP for the benefit of all eligible employees of the Bank. The leveraged ESOP is accounted for in accordance with American Institute of Certified Public Accountants (“AICPA”) Statement of Procedures (“SOP”) 93-6,Employers’ Accounting for Employee Stock Ownership Plans.
Full-time employees of the Bank who have been credited with at least 1,000 hours of service during a 12- month period and who have attained age 21 are eligible to participate in the ESOP. It is anticipated that contributions will be made to the plan in amounts necessary to amortize the debt to the Company over a period of 10 years.
Under SOP 93-6, unearned ESOP shares are not considered outstanding and are shown as a reduction of shareholders’ equity as unearned compensation. Dividends on unallocated ESOP shares are considered to be compensation expense. The Company will recognize compensation cost equal to the fair value of the ESOP shares during the periods in which they become committed to be released. To the extent that the fair value of the Company’s ESOP shares differ from the cost of such shares, this differential will be credited to equity. The Company will receive a tax deduction equal to the cost of the shares released. As the loan is internally leveraged, the loan receivable from the ESOP to the Company is not reported as an asset nor is the debt of the ESOP shown as a Company liability. Dividends on allocated shares have been used to pay the ESOP debt.
Compensation cost related to the ESOP for the years ended December 31, 2003, 2002 and 2001 was $1,953,000, $1,621,000 and $1,238,000, respectively. The fair value of the unearned ESOP shares, using the closing quoted market price per share at year end was approximately $3,183,000 and $4,065,000 at December 31, 2003 and 2002, respectively.
A summary of the ESOP share allocation as of December 31 of the year indicated is as follows:
| | | | | | | | | |
| | | 2003
| | | 2002
| | | 2001
| |
Shares allocated beginning of year | | 371,525 | | | 355,789 | | | 343,029 | |
Shares allocated during the year | | 47,259 | | | 50,899 | | | 54,539 | |
Shares distributed during the year | | (36,943 | ) | | (35,163 | ) | | (41,779 | ) |
| | |
|
| |
|
| |
|
|
Total allocated shares held by ESOP at year end | | 381,841 | | | 371,525 | | | 355,789 | |
Unreleased shares | | 53,960 | | | 101,219 | | | 152,118 | |
| | |
|
| |
|
| |
|
|
Total ESOP shares | | 435,801 | | | 472,744 | | | 507,907 | |
| | |
|
| |
|
| |
|
|
STOCK OPTION PLANS
The Company issues stock options under various plans to directors, officers and other key employees. The option exercise price cannot be less than the fair value of the underlying common stock as of the date of the option grant and the maximum option term cannot exceed ten years. The stock options granted have vesting periods from two to seven years. There was no compensation expense recorded in 2003, 2002 or 2001 related to stock option plans. At December 31, 2003 future awards of 681,807 shares could be made under the stock option plans.
The stock option plans also permit the granting of Stock Appreciation Rights (“SAR’s”). SAR’s entitle the holder to receive, in the form of cash or stock, the increase in the fair value of Company stock from the date of grant to the date of exercise. No SAR’s have been issued under the plans.
The following table summarizes the activity related to stock options:
| | | | | | |
| | | Options
Outstanding
| | | Weighted
Average
Exercise
Price
|
At January 1, 2001 | | 923,815 | | | $ | 16.64 |
Granted | | 199,833 | | | | 25.92 |
Canceled | | (63,981 | ) | | | 17.94 |
Exercised | | (48,781 | ) | | | 16.48 |
| | |
|
| |
|
|
At December 31, 2001 | | 1,010,886 | | | | 18.40 |
Granted | | 198,750 | | | | 29.51 |
Canceled | | (19,933 | ) | | | 22.38 |
Exercised | | (66,229 | ) | | | 18.06 |
| | |
|
| |
|
|
At December 31, 2002 | | 1,123,474 | | | | 20.31 |
Granted | | 214,750 | | | | 40.45 |
Canceled | | (22,098 | ) | | | 31.22 |
Exercised | | (144,962 | ) | | | 17.71 |
| | |
|
| |
|
|
At December 31, 2003 | | 1,171,164 | | | $ | 24.12 |
| | |
|
| |
|
|
Exercisable at December 31, 2001 | | 447,806 | | | $ | 16.57 |
Exercisable at December 31, 2002 | | 532,603 | | | $ | 17.20 |
Exercisable at December 31, 2003 | | 568,879 | | | $ | 18.41 |
| | | | | | | |
The following table presents the weighted average remaining life as of December 31, 2003 for options outstanding within the stated exercise prices:
| | | | | | | | | | |
| | | Outstanding
| | Exercisable
|
Exercise
Price Range
Per Share
| | Number
Of
Options
| | Weighted
Average
Exercise
Price
| | Weighted
Average
Remaining
Life
| | Number
Of
Options
| | Weighted
Average
Exercise
Price
|
| $13.38 to $15.06 | | 180,300 | | $13.74 | | 6.1 years | | 93,210 | | $13.78 |
| $15.88 | | 280,361 | | $15.88 | | 2.4 years | | 280,361 | | $15.88 |
| $16.31 to $19.75 | | 49,927 | | $18.33 | | 5.3 years | | 32,499 | | $18.30 |
| $20.25 to $25.00 | | 119,001 | | $22.39 | | 5.7 years | | 62,939 | | $22.31 |
| $25.13 to $29.80 | | 317,975 | | $27.47 | | 7.7 years | | 97,070 | | $27.13 |
| $34.28 to $39.92 | | 175,600 | | $38.44 | | 9.2 years | | 2,400 | | $37.42 |
| $40.09 to $53.70 | | 48,000 | | $47.08 | | 9.4 years | | 400 | | $40.09 |
In October 1995, the FASB issued FAS 123, which requires disclosure of the compensation cost for stock-based incentives granted after January 1, 1995 based on the fair value at grant date for awards. Applying FAS 123 would result in pro forma net income and earnings per share amounts as follows:
| | | | | | | | | |
(dollars in thousands, except per share data)
| | 2003
| | 2002
| | 2001
|
Net income: | | | | | | | | | |
Reported | | $ | 23,552 | | $ | 18,453 | | $ | 14,508 |
Deduct: stock option compensation expense under the fair value method, net of related tax effect | | | 1,110 | | | 1,031 | | | 661 |
| | |
|
| |
|
| |
|
|
Pro forma | | $ | 22,442 | | $ | 17,422 | | $ | 13,847 |
| | |
|
| |
|
| |
|
|
Earnings per share: | | | | | | | | | |
As reported – basic | | $ | 3.71 | | $ | 3.26 | | $ | 2.48 |
diluted | | | 3.42 | | | 3.02 | | | 2.36 |
Pro forma – basic | | | 3.54 | | | 3.08 | | | 2.37 |
diluted | | | 3.30 | | | 2.89 | | | 2.28 |
The fair value of each option is estimated on the date of grant using an option-pricing model with the following weighted average assumptions used for 2003, 2002 and 2001 grants: dividend yields of 1.94, 2.10 and 2.64 percent; expected volatility of 23.42, 18.32 and 29.91 percent; risk-free interest rate of 3.70, 5.04 and 5.30 percent; and expected lives of 7.0, 7.0 and 8.5 years. The weighted average fair value per share at the date of grant for shares granted during 2003, 2002 and 2001 was $8.29, $7.14 and $8.54, respectively.
RESTRICTED STOCK PLANS
The Company established the RRP for certain officers and directors during the year ended December 31, 1996. A supplemental stock benefit plan adopted in 1999 and the 2001 Incentive Plan also allow grants of restricted stock. The cost of the shares of restricted stock awarded under these plans is recorded as unearned compensation, a contra equity account. The fair value of the shares on the date of award is recognized as compensation expense over the vesting period, which is generally seven years. The holders of the restricted stock receive dividends and have the right to vote the shares. For the years ended December 31, 2003, 2002 and 2001 the amount included in compensation expense was $757,000, $596,000 and $479,000 respectively. At December 31, 2003, 314 shares were available in the RRP plan for future awards. The weighted average grant date fair value of the restricted stock granted during the years ended December 31, 2003, 2002 and 2001 was $43.22, $30.74 and $28.00, respectively. A summary of the changes in awarded shares follows:
| | | | | | | | | |
| | | 2003
| | | 2002
| | | 2001
| |
Balance, beginning of year | | 96,693 | | | 90,967 | | | 132,280 | |
Granted | | 68,550 | | | 35,000 | | | 4,313 | |
Forfeited | | (2,000 | ) | | (1,716 | ) | | (17,008 | ) |
Earned and issued | | (32,347 | ) | | (27,558 | ) | | (28,618 | ) |
| | |
|
| |
|
| |
|
|
Balance, end of year | | 130,896 | | | 96,693 | | | 90,967 | |
| | |
|
| |
|
| |
|
|
NOTE 16 – RELATED PARTY TRANSACTIONS:
In the ordinary course of business, the Bank has granted loans to executive officers and directors and their affiliates amounting to $897,000 and $1,319,000 at December 31, 2003 and 2002, respectively. During the year ended December 31, 2003, total principal additions were $1,274,000 and total principal payments were $1,696,000.
IBERIABANK CORPORATION AND SUBSIDIARY
Notes to Consolidated Financial Statements
NOTE 17 – OFF-BALANCE SHEET ACTIVITIES:
The Company is a party to financial instruments with off-balance sheet risk in the normal course of business to meet the financing needs of its customers. These financial instruments include commitments to extend credit and standby letters of credit. Such commitments involve, to varying degrees, elements of credit and interest rate risk in excess of the amount recognized in the consolidated balance sheets. The same credit policies are used in these commitments as for on-balance sheet instruments. The Company’s exposure to credit loss in the event of nonperformance by the other parties is represented by the contractual amount of the financial instruments.
At December 31, 2003 and 2002, the Company had the following financial instruments outstanding, whose contract amounts represent credit risk:
| | | | | | |
| | | Contract Amount
|
(dollars in thousands)
| | 2003
| | 2002
|
Commitments to grant loans | | $ | 30,949 | | $ | 23,071 |
Unfunded commitments under lines of credit | | | 266,342 | | | 193,876 |
Commercial and standby letters of credit | | | 2,488 | | | 1,503 |
Commitments to extend credit are agreements to lend to a customer as long as there is no violation of any condition established in the contract. Commitments generally have fixed expiration dates or other termination clauses and may require payment of a fee. Since many of the commitments are expected to be drawn upon, the total commitment amounts generally represent future cash requirements. The Company evaluates each customer’s credit-worthiness on a case-by-case basis. The amount of collateral, if deemed necessary by the Company upon extension of credit, is based on management’s credit evaluation of the counterparty.
Unfunded commitments under commercial lines-of-credit, revolving credit lines and overdraft protection agreements are commitments for possible future extensions of credit to existing customers. These lines-of-credit usually do not contain a specified maturity date and may not be drawn upon to the total extent to which the Company is committed.
The Company is subject to certain claims and litigation arising in the ordinary course of business. In the opinion of management, after consultation with legal counsel, the ultimate disposition of these matters is not expected to have a material effect on the consolidated financial position of the Company.
NOTE 18 – FAIR VALUE OF FINANCIAL INSTRUMENTS:
The fair value of a financial instrument is the current amount that would be exchanged between willing parties, other than in a forced liquidation. Fair value is best determined based upon quoted market prices. However, in many instances, there are no quoted market prices for the Company’s various financial instruments. In cases where quoted market prices are not available, fair values are based on estimates using present value or other valuation techniques. Those techniques are significantly affected by the assumptions used, including the
IBERIABANK CORPORATION AND SUBSIDIARY
Notes to Consolidated Financial Statements
discount rate and estimates of future cash flows. Accordingly, the fair value estimates may not be realized in an immediate settlement of the instrument. FAS 107 excludes certain financial instruments and all non-financial instruments from its disclosure requirements. Accordingly, the aggregate fair value amounts presented may not necessarily represent the underlying fair value of the Company.
The following methods and assumptions were used to estimate the fair value of each class of financial instruments for which it is practicable to estimate that value:
Cash and Cash Equivalents: The carrying amounts of cash and short-term instruments approximate their fair value. The carrying amounts of interest-bearing deposits maturing within ninety days approximate their fair values.
Investment Securities: Fair value equals quoted market prices and dealer quotes.
Loans: The fair value of mortgage loans receivable was estimated based on present values using entry-value rates at December 31, 2003 and 2002, weighted for varying maturity dates. Other loans receivable were valued based on present values using entry-value interest rates at December 31, 2003 and 2002 applicable to each category of loans. Fair values of mortgage loans held for sale are based on commitments on hand from investors or prevailing market prices.
Deposits: The fair value of NOW accounts, money market deposits and savings accounts was the amount payable on demand at the reporting date. Certificates of deposit were valued using a weighted average rate calculated based upon rates at December 31, 2003 and 2002 for deposits of similar remaining maturities.
Short-term Borrowings: The carrying amounts of short-term borrowings maturing within ninety days approximate their fair values.
Long-term Borrowings: The fair values of the Company’s long-term borrowings are estimated using discounted cash flow analyses based on the Company’s current incremental borrowing rates for similar types of borrowing arrangements.
Derivative Instruments:Fair values for interest rate swap agreements are based upon the amounts required to settle the contracts.
Off-Balance Sheet Items: The Company has outstanding commitments to extend credit and standby letters of credit. These off-balance sheet financial instruments are generally exercisable at the market rate prevailing at the date the underlying transaction will be completed and, therefore, have no current fair value.
IBERIABANK CORPORATION AND SUBSIDIARY
Notes to Consolidated Financial Statements
The estimated fair values and carrying amounts of the Company’s financial instruments are as follows:
| | | | | | | | | | | | |
| | | December 31, 2003
| | December 31, 2002
|
(dollars in thousands)
| | Carrying
Amount
| | Fair Value
| | Carrying
Amount
| | Fair Value
|
Financial Assets | | | | | | | | | | | | |
Cash and cash equivalents | | $ | 69,571 | | $ | 69,571 | | $ | 63,775 | | $ | 63,775 |
Investment securities | | | 479,622 | | | 481,337 | | | 368,122 | | | 370,236 |
Loans and loans held for sale, net | | | 1,399,900 | | | 1,433,860 | | | 1,040,074 | | | 1,054,414 |
Derivative instruments | | | 296 | | | 296 | | | — | | | — |
| | | | |
Financial Liabilities | | | | | | | | | | | | |
Deposits | | $ | 1,589,106 | | $ | 1,594,249 | | $ | 1,242,232 | | $ | 1,245,646 |
Short-term borrowings | | | 162,590 | | | 162,590 | | | 96,803 | | | 96,803 |
Long-term debt | | | 156,291 | | | 153,042 | | | 75,458 | | | 77,180 |
Derivative instruments | | | 1,404 | | | 1,404 | | | 1,822 | | | 1,822 |
The fair value estimates presented herein are based upon pertinent information available to management as of December 31, 2003 and 2002. Although management is not aware of any factors that would significantly affect the estimated fair value amounts, such amounts have not been comprehensively revalued for purposes of these financial statements since that date and, therefore, current estimates of fair value may differ significantly from the amounts presented herein.
NOTE 19 – COMPREHENSIVE INCOME:
The following is a summary of the components of other comprehensive income:
| | | | | | | | | | | | |
| | | Years Ended December 31,
| |
(dollars in thousands)
| | 2003
| | | 2002
| | | 2001
| |
Unrealized gain (loss) on securities available for sale, net | | $ | (1,261 | ) | | $ | 1,738 | | | $ | 4,784 | |
Reclassification adjustment for net (gains) losses realized in net income | | | (267 | ) | | | 42 | | | | (119 | ) |
| | |
|
|
| |
|
|
| |
|
|
|
Net unrealized gain (loss) | | | (1,528 | ) | | | 1,780 | | | | 4,665 | |
Tax effect | | | 535 | | | | (623 | ) | | | (1,633 | ) |
| | |
|
|
| |
|
|
| |
|
|
|
Net-of-tax amount | | | (993 | ) | | | 1,157 | | | | 3,032 | |
| | |
|
|
| |
|
|
| |
|
|
|
Unrealized gain (loss) on cash flow hedges | | | 715 | | | | (1,822 | ) | | | — | |
Tax effect | | | (251 | ) | | | 638 | | | | — | |
| | |
|
|
| |
|
|
| |
|
|
|
Net-of-tax amount | | | 464 | | | | (1,184 | ) | | | — | |
| | |
|
|
| |
|
|
| |
|
|
|
Other comprehensive income (loss), net of income taxes | | $ | (529 | ) | | $ | (27 | ) | | $ | 3,032 | |
| | |
|
|
| |
|
|
| |
|
|
|
NOTE 20 – RESTRICTIONS ON DIVIDENDS, LOANS AND ADVANCES:
The Bank is restricted under applicable laws in the payment of dividends to an amount equal to current year earnings plus undistributed earnings for the immediately preceding year, unless prior permission is received from the Commissioner of Financial Institutions for the State of Louisiana. Dividends payable without permission by the Bank in 2004 will be limited to 2004 earnings plus an additional $13,189,000.
Accordingly, at January 1, 2004, $192,629,000 of the Company’s equity in the net assets of the Bank was restricted. Funds available for loans or advances by the Bank to the Company amounted to $16,038,000.
In addition, dividends paid by the Bank to the Company would be prohibited if the effect thereof would cause the Bank’s capital to be reduced below applicable minimum capital requirements.
IBERIABANK CORPORATION AND SUBSIDIARY
Notes to Consolidated Financial Statements
NOTE 21 - CONDENSED PARENT COMPANY ONLY FINANCIAL STATEMENTS:
Condensed financial statements of IBERIABANK Corporation (parent company only) are shown below. The parent company has no significant operating activities.
Condensed Balance Sheets
December 31, 2003 and 2002
| | | | | | |
(dollars in thousands)
| | 2003
| | 2002
|
Assets | | | | | | |
Cash in bank | | $ | 2,777 | | $ | 9,552 |
Investment in subsidiary | | | 205,005 | | | 141,223 |
Other assets | | | 10,241 | | | 856 |
| | |
|
| |
|
|
Total assets | | $ | 218,023 | | $ | 151,631 |
| | |
|
| |
|
|
Liabilities and Shareholders’ Equity | | | | | | |
Liabilities | | $ | 22,854 | | $ | 12,033 |
Shareholders’ equity | | | 195,169 | | | 139,598 |
| | |
|
| |
|
|
Total liabilities and shareholders’ equity | | $ | 218,023 | | $ | 151,631 |
| | |
|
| |
|
|
Condensed Statements of Income
Years Ended December 31, 2003, 2002 and 2001
| | | | | | | | | |
(dollars in thousands)
| | 2003
| | 2002
| | 2001
|
Operating income | | | | | | | | | |
Dividends from subsidiary | | $ | 12,000 | | $ | 18,000 | | $ | 15,050 |
Interest income | | | 64 | | | 24 | | | 29 |
| | |
|
| |
|
| |
|
|
Total operating income | | | 12,064 | | | 18,024 | | | 15,079 |
| | |
|
| |
|
| |
|
|
Operating expenses | | | | | | | | | |
Interest expense | | | 1,046 | | | 152 | | | 172 |
Other expenses | | | 1,634 | | | 1,241 | | | 1,049 |
| | |
|
| |
|
| |
|
|
Total operating expenses | | | 2,680 | | | 1,393 | | | 1,221 |
| | |
|
| |
|
| |
|
|
Income before income tax expense and increase in equity in undistributed earnings of subsidiary | | | 9,384 | | | 16,631 | | | 13,858 |
Income tax benefit | | | 915 | | | 476 | | | 414 |
| | |
|
| |
|
| |
|
|
Income before increase in equity in undistributed earnings of subsidiary | | | 10,299 | | | 17,107 | | | 14,272 |
Increase in equity in undistributed earnings of subsidiary | | | 13,253 | | | 1,346 | | | 236 |
| | |
|
| |
|
| |
|
|
Net Income | | $ | 23,552 | | $ | 18,453 | | $ | 14,508 |
| | |
|
| |
|
| |
|
|
IBERIABANK CORPORATION AND SUBSIDIARY
Notes to Consolidated Financial Statements
Condensed Statements of Cash Flows
Years Ended December 31, 2003, 2002 and 2001
| | | | | | | | | | | | |
(dollars in thousands)
| | 2003
| | | 2002
| | | 2001
| |
Cash Flows from Operating Activities | | | | | | | | | | | | |
Net income | | $ | 23,552 | | | $ | 18,453 | | | $ | 14,508 | |
Adjustments to reconcile net income to net cash provided by operating activities: | | | | | | | | | | | | |
Depreciation and amortization | | | 47 | | | | 12 | | | | — | |
Increase in equity in net income of subsidiary | | | (13,253 | ) | | | (1,346 | ) | | | (236 | ) |
Noncash compensation expense | | | 759 | | | | 596 | | | | 479 | |
Increase in dividend receivable from subsidiary | | | (8,000 | ) | | | — | | | | — | |
Other, net | | | 1,644 | | | | 186 | | | | 2,955 | |
| | |
|
|
| |
|
|
| |
|
|
|
Net Cash Provided by Operating Activities | | | 4,749 | | | | 17,901 | | | | 17,706 | |
| | |
|
|
| |
|
|
| |
|
|
|
Cash Flows from Investing Activities | | | | | | | | | | | | |
Cash paid in excess of cash received in acquisition | | | (9,538 | ) | | | — | | | | — | |
Purchases of premise and equipment | | | — | | | | (223 | ) | | | — | |
Capital contributed to subsidiary | | | (97 | ) | | | (123 | ) | | | (152 | ) |
Payments received from ESOP | | | 394 | | | | 500 | | | | 578 | |
| | |
|
|
| |
|
|
| |
|
|
|
Net Cash Provided by (Used in) Investing Activities | | | (9,241 | ) | | | 154 | | | | 426 | |
| | |
|
|
| |
|
|
| |
|
|
|
Cash Flows from Financing Activities | | | | | | | | | | | | |
Dividends paid to shareholders | | | (5,185 | ) | | | (4,066 | ) | | | (3,981 | ) |
Proceeds from long-term debt | | | 10,000 | | | | 10,000 | | | | — | |
Repayments of long-term debt | | | (2,500 | ) | | | — | | | | (9,225 | ) |
Net change in short-term borrowings | | | — | | | | (4,250 | ) | | | 4,250 | |
Costs of issuance of common stock in acquisition | | | (191 | ) | | | — | | | | — | |
Payments to repurchase common stock | | | (6,177 | ) | | | (12,644 | ) | | | (8,414 | ) |
Proceeds from sale of treasury stock for stock options exercised | | | 1,770 | | | | 701 | | | | 283 | |
| | |
|
|
| |
|
|
| |
|
|
|
Net Cash Used in Financing Activities | | | (2,283 | ) | | | (10,259 | ) | | | (17,087 | ) |
| | |
|
|
| |
|
|
| |
|
|
|
Net Increase (Decrease) in Cash and Cash Equivalents | | | (6,775 | ) | | | 7,796 | | | | 1,045 | |
Cash and Cash Equivalents at Beginning of Period | | | 9,552 | | | | 1,756 | | | | 711 | |
| | |
|
|
| |
|
|
| |
|
|
|
Cash and Cash Equivalents at End of Period | | $ | 2,777 | | | $ | 9,552 | | | $ | 1,756 | |
| | |
|
|
| |
|
|
| |
|
|
|
IBERIABANK CORPORATION AND SUBSIDIARY
Notes to Consolidated Financial Statements
NOTE 22 - QUARTERLY RESULTS OF OPERATIONS:
| | | | | | | | | | | | |
(dollars in thousands, except per share data)
| | First
Quarter
| | Second
Quarter
| | Third
Quarter
| | Fourth
Quarter
|
Year Ended December 31, 2003 | | | | | | | | | | | | |
Total interest income | | $ | 22,612 | | $ | 24,707 | | $ | 24,082 | | $ | 25,161 |
Total interest expense | | | 6,699 | | | 7,642 | | | 7,383 | | | 7,205 |
| | |
|
| |
|
| |
|
| |
|
|
Net interest income | | | 15,913 | | | 17,065 | | | 16,699 | | | 17,956 |
Provision for loan losses | | | 1,575 | | | 1,574 | | | 1,599 | | | 1,552 |
| | |
|
| |
|
| |
|
| |
|
|
Net interest income after provision for loan losses | | | 14,338 | | | 15,491 | | | 15,100 | | | 16,404 |
Noninterest income | | | 4,872 | | | 5,996 | | | 6,514 | | | 5,682 |
Noninterest expense | | | 11,722 | | | 12,867 | | | 12,923 | | | 13,117 |
| | |
|
| |
|
| |
|
| |
|
|
Income before income taxes | | | 7,488 | | | 8,620 | | | 8,691 | | | 8,969 |
Income tax expense | | | 2,270 | | | 2,641 | | | 2,614 | | | 2,691 |
| | |
|
| |
|
| |
|
| |
|
|
Net Income | | $ | 5,218 | | $ | 5,979 | | $ | 6,077 | | $ | 6,278 |
| | |
|
| |
|
| |
|
| |
|
|
Earnings per share - basic | | $ | 0.90 | | $ | 0.92 | | $ | 0.93 | | $ | 0.96 |
Earnings per share - diluted | | $ | 0.83 | | $ | 0.85 | | $ | 0.86 | | $ | 0.88 |
| | |
|
| |
|
| |
|
| |
|
|
Year Ended December 31, 2002 | | | | | | | | | | | | |
Total interest income | | $ | 22,174 | | $ | 22,016 | | $ | 21,720 | | $ | 21,642 |
Total interest expense | | | 7,723 | | | 7,078 | | | 6,710 | | | 6,447 |
| | |
|
| |
|
| |
|
| |
|
|
Net interest income | | | 14,451 | | | 14,938 | | | 15,010 | | | 15,195 |
Provision for loan losses | | | 1,200 | | | 1,798 | | | 1,500 | | | 1,699 |
| | |
|
| |
|
| |
|
| |
|
|
Net interest income after provision for loan losses | | | 13,251 | | | 13,140 | | | 13,510 | | | 13,496 |
Noninterest income | | | 3,587 | | | 4,942 | | | 4,733 | | | 4,604 |
Noninterest expense | | | 10,321 | | | 11,195 | | | 11,299 | | | 11,217 |
| | |
|
| |
|
| |
|
| |
|
|
Income before income taxes | | | 6,517 | | | 6,887 | | | 6,944 | | | 6,883 |
Income tax expense | | | 2,130 | | | 2,246 | | | 2,236 | | | 2,166 |
| | |
|
| |
|
| |
|
| |
|
|
Net Income | | $ | 4,387 | | $ | 4,641 | | $ | 4,708 | | $ | 4,717 |
| | �� |
|
| |
|
| |
|
| |
|
|
Earnings per share - basic | | $ | 0.77 | | $ | 0.81 | | $ | 0.83 | | $ | 0.85 |
Earnings per share - diluted | | $ | 0.72 | | $ | 0.75 | | $ | 0.76 | | $ | 0.79 |
| | |
|
| |
|
| |
|
| |
|
|
Corporate
information
CORPORATE HEADQUARTERS
IBERIABANK Corporation
200 West Congress Street
Lafayette, LA 70501
(337) 521-4003
CORPORATE MAILING ADDRESS
P.O. Box 52747
Lafayette, LA 70505-2747
INTERNET ADDRESS
www.iberiabank.com
ANNUAL MEETING
IBERIABANK Corporation Annual Meeting of Shareholders will be held on Wednesday, April 28, 2004 at 10:00 a.m. in the Cabildo Room at the Hotel Inter-Continental, located at 444 St. Charles Avenue, New Orleans, Louisiana
SHAREHOLDER ASSISTANCE
Shareholders requesting a change of address, records or information about lost certificates should contact:
Investor Relations
Registrar and Transfer Company
10 Commerce Drive
Cranford, NJ 07016
(800) 368-5948
www.invrelations@RTCO.com
FOR INFORMATION
Copies of the Company's financial reports, including forms 10-K and 10-Q, are available without cost by sending a written request to Investor Relations at the corporate mailing address noted above.This and other information regarding IBERIABANK Corporation and IBERIABANK may be accessed from our web site. In addition, shareholders and others may contact:
Daryl G. Byrd
President and CEO
(337) 521-4003
John R. Davis
Senior Executive Vice President
(337) 521-4005
| | | | | | | | | | | | | | | |
| STOCK INFORMATION |
| | | MARKET PRICE
| | | DIVIDENDS |
2002
| | HIGH
| | | LOW
| | | CLOSING
| | | DECLARED
|
First Quarter | | $ | 34.67 | | | $ | 27.35 | | | $ | 34.67 | | | $ | 0.18 |
Second Quarter | | $ | 40.54 | | | $ | 34.77 | | | $ | 40.54 | | | $ | 0.18 |
Third Quarter | | $ | 41.00 | | | $ | 36.00 | | | $ | 37.63 | | | $ | 0.20 |
Fourth Quarter | | $ | 40.16 | | | $ | 35.64 | | | $ | 40.16 | | | $ | 0.20 |
| | |
|
|
| |
|
|
| |
|
|
| |
|
|
| | |
| | | MARKET PRICE
| | | DIVIDENDS |
2003
| | HIGH
| | | LOW
| | | CLOSING
| | | DECLARED
|
First Quarter | | $ | 41.03 | | | $ | 38.06 | | | $ | 40.70 | | | $ | 0.20 |
Second Quarter | | $ | 50.60 | | | $ | 39.87 | | | $ | 49.00 | | | $ | 0.22 |
Third Quarter | | $ | 52.62 | | | $ | 47.75 | | | $ | 52.62 | | | $ | 0.24 |
Fourth Quarter | | $ | 60.20 | | | $ | 50.83 | | | $ | 59.00 | | | $ | 0.24 |
At December 31, 2003, IBERIABANK Corporation had approximately 1,350 shareholders of record.
SECURITIES LISTING
IBERIABANK Corporation’s common stock trades on the NASDAQ Stock Market under the symbol “IBKC”. In local and national newspapers, the company is listed under "IBERIABANK".
DIVIDEND REINVESTMENT PLAN
IBERIABANK Corporation shareholders may take advantage of our Dividend Reinvestment Plan. This program provides a convenient, economical way for shareholders to increase their holdings of the Company’s common stock. The shareholder pays no brokerage commissions or service charges while participating in the plan. A nominal fee is charged at the time that an individual terminates plan participation. This plan does not currently offer participants the ability to purchase additional shares with optional cash payments.
To enroll in the IBERIABANK Corporation Dividend Reinvestment Plan, shareholders must complete an enrollment form. A summary of the plan and enrollment forms are available from the Registrar and Transfer Company at the address provided under Shareholder Assistance.