Exhibit 99.1
IBERIABANK CORPORATION [LOGO]
FOR IMMEDIATE RELEASE
October 19, 2005
Contact:
Daryl G. Byrd, President and CEO (337) 521-4003
John R. Davis, Senior Executive Vice President (337) 521-4005
IBERIABANK Corporation Reports Third Quarter Earnings
LAFAYETTE, LOUISIANA — IBERIABANK Corporation(NASDAQ: IBKC), the holding company of the 118-year-old IBERIABANK (http://www.iberiabank.com), announced details regarding one-time costs associated with hurricane-related activities, the financial results for the quarter ended September 30, 2005, and a progress update regarding significant expansion initiatives. Overall, the Company believes issues associated with Hurricanes Katrina and Rita have been fully analyzed and addressed. All but one of the Company’s 43 offices are fully operational, and all associates are actively serving clients. Exclusive of one-time hurricane-related charges, the Company reported record earnings and fully diluted earnings per share (“EPS”) for the quarter ended September 30, 2005 and improved asset quality during the third quarter compared to the second quarter of 2005 (“linked quarter basis”). At September 30, 2005, total loan and deposit volumes were at record high levels. The Company’s opportunistic expansion initiative remains on track with management’s expectations, with a roll-out of new facilities staged over the next two quarters.
Daryl G. Byrd, President and CEO of IBERIABANK Corporation, remarked, “The actions we demonstrated over the last seven weeks reflect critical elements of our mission statement: exceptional value-based client service, a great place to work, growth consistent with high performance, shareholder-focus, and a strong sense of community. Immediately after the storms passed, we secured our people and their families, ensured a safe working environment for our associates and focused our entire organization on serving our clients’ needs. Our organization worked relentlessly to assist our clients and communities in the rebuilding process. We proactively communicated with the investment community and shareholders as to our situation and we implemented an opportunistic expansion initiative. I am very proud of our associates in the exceptional teamwork and care they demonstrated during this period.”
Byrd continued, “The southeastern part of the United States is no stranger to severe and indiscriminate storm activity. As indicated below, hurricanes and tropical storms are quite common in the entire region. What made the situations unique with Hurricanes Katrina and Rita were the widespread nature and extreme severity of the storms, the punishing aftermath to our local region, the impact on the national economic infrastructure, and the enormous magnitude of the reconstruction process. Never has such a widespread area faced dislocation, destruction, and an historic opportunity for rebirth. The unique culture of our region provides a strong mortar to bond the foundation blocks of the rebuilding process. The most powerful storms on record are no match for the determination of the people of Louisiana.”
% of Atlantic Ocean Hurricane And Tropical Storm Impacts By State 1994-2005
| | | | | | | | | | | | | | | | |
| | | Florida | | N.C. | | Texas | | Alabama | | Miss. | | Louisiana | | Other | | Atlantic |
Total | | 18% | | 9% | | 6% | | 6% | | 6% | | 6% | | 19% | | 30% |
Note: Hurricanes and tropical storm impacts perwww.wunderground.com maps. Some storms had multiple state impacts.
On August 29, 2005, Hurricane Katrina, a category 4 storm, made landfall in southeastern Louisiana and the coast of Mississippi. Hurricane Katrina, and its destructive aftermath, is considered to have been the most devastating and costly storm in our nation’s history. Near-term estimates placed the cost of rebuilding at $200 billion, and final cost estimates approximate $300 billion. The near-term estimate of $200 billion is 13 times greater than the rebuilding cost of Hurricane Andrew in 1992 and over 16 times greater than aggregate rebuilding efforts for the multiple hurricanes that ravaged sections of Florida in 2004. The devastation caused by this storm is without precedent and, according to President George W. Bush, rebuilding is considered to constitute “the largest reconstruction effort the world has ever seen.”
The Company has eight offices in the affected New Orleans area. All but one of the eight offices are fully functional and operating under normal conditions. Within one week of the storm’s passing, all 71 associates in the New Orleans market were secured, and shortly thereafter, the majority of these associates were assisting clients. Access to client accounts was unaffected by the storm. During the third quarter of 2005, the Company incurred approximately $1.1 million in net charge-offs associated with Hurricane Katrina, $100,000 in costs associated with insurance deductibles and facility repair in the New Orleans region, and $150,000 in other hurricane-related expenses. The Company incurred a $12.8 million special provision for loan losses associated with Hurricane Katrina. The Company estimates NSF service charge income and ATM fee income were negatively impacted by approximately $66,000 on a pre-tax basis immediately following Hurricane Katrina.
On September 23, 2005, Hurricane Rita, a category 3 storm, made landfall in southwestern Louisiana and southeastern Texas. This storm caused significant wind damage primarily in the area near Beaumont, Texas and Lake Charles, Louisiana. The Company has no operations in that area. The storm also caused flooding in five parishes in Louisiana, including Vermilon Parish, in which the Company has clients that experienced business disruption and property flooding.
The Company has 22 offices in the Acadiana region in south-central Louisiana. All 22 offices are fully functional and operating under normal conditions. Access to client accounts was unaffected by the storm. In the third quarter of 2005, the Company incurred no net charge-offs related to Hurricane Rita and approximately $100,000 in hurricane-related expenses. The Company recorded a $1.6 million special provision for loan losses associated with Hurricane Rita. NSF and ATM income were not materially impacted by Hurricane Rita.
Loan Loss Reserve Methodology
The Company’s ability to reconnect with associates and clients rapidly afforded an opportunity to estimate potential credit issues associated with the storms, and assist in meeting clients’ needs. All commercial, private banking, and institutional clients and 97% of small business clients affected by Hurricane Katrina have been contacted by the Company. Similarly, the majority of commercial, private banking, institutional, and small business clients affected by Hurricane Rita have been contacted as well.
Immediately after each storm passed, the Company’s credit team began intense analysis of affected portfolios, client flood and property and casualty insurance coverage, impacts on sources of repayment and underlying collateral, and client payment probability. Flood mapping technology, physical inspection, and client conversations provided valuable assistance in the analytical work.
The framework for the analysis involved first determining which clients were in the affected areas. Second, clients were grouped by segment type (commercial, private banking, mortgage, indirect automobile, etc.). Third, segmented clients were analyzed in detail and parsed into three risk categories—low, medium and high. Low risk clients had no impact, or relatively insignificant impact as a result of the storm. Medium risk clients had some impact on their primary or secondary sources of repayment, but had adequate liquidity to satisfy their obligations. Finally, high risk clients had potentially significant problems that affected both primary and secondary sources of repayment. Reserve levels were then placed against
2
particular credits based on estimated default levels and loss expectations. For example, for residential mortgage loans, a 50% default rate was assumed for high risk clients on the gross loan balance outstanding (not net of estimated insurance proceeds), and a 40% loss rate was assumed. Medium risk residential mortgage clients were assumed to have a 35% default rate and a loss rate of 20%. Low risk clients were assumed to have a 20% default rate and a 10% loss rate. Similar methodologies were used for other segments and risk categories, though default rates and loss expectation levels differed between various segments and categories.
While the Company is comfortable with the framework utilized and reserves incurred, actual default and loss rates may differ materially from levels assumed by the Company. No material consideration was given for any federal assistance and private mortgage insurance (“PMI”), and only minimal land values were assumed. Federal and/or state assistance may be forthcoming, but the outcome is uncertain at this stage. PMI exists for 6% and 11% of residential mortgage loans affected by Hurricanes Katrina and Rita, respectively. Given limited real estate transaction closings since Hurricane Katrina, no determination can be made regarding land values at this stage. However, the Company decided a conservative approach was warranted in the abundance of caution and collateral uncertainty. The risk classifications and reserve allocation methodology are subject to change as particular situations continue to evolve.
Branch Expansion Initiative
The most severe elements of Hurricane Katrina passed to the east of the Company’s operations and headquarters, and Hurricane Rita to the west. The Company was uniquely positioned geographically among large Louisiana-based bank holding companies in southern Louisiana. The Company’s associates remained in continuous contact with clients, and clients had uninterrupted access to their accounts. While some of the Company’s offices were affected by the storms, all but one of the Company’s affected offices were restored within days after the storms passed.
The Company announced a branch expansion initiative on September 16, 2005, that was a result of the Company’s unique strategic position, client dislocation, recruitment opportunities, and facility and site availability. The Company purchased 12 modular facilities and has purchased, or executed purchase contracts on, 10 branch sites in Lafayette (River Ranch), Broussard (near Highways 90 and 182), Baton Rouge area (Coursey Boulevard, Highland Road, Prairieville, and Dutchtown), Covington (Highway 21), Slidell (Gause Boulevard), Houma (St. Charles Street), Laplace (Belle Terre Boulevard), and New Orleans (Elmwood). Site preparations are underway in many locations, and branch roll-out is expected to be staged over the next six months. Many branches are expected to be fully operational before the end of 2005. Some locations are expected to be converted to traditional “brick and mortar” offices, while many may remain modular units for the foreseeable future.
The total cost for the 12 fully furnished modular units was $1.4 million. Related equipment, including platform systems, PCs, signage, ATMs and other equipment was $3.4 million. The cost of land purchases was $5.0 million. The Company believes modular branch facilities cost approximately one-third the cost of traditional “brick and mortar” structures, thus providing a very cost-effective distribution system. This approach also substantially reduces the risk of branch expansion, given the relatively mobile nature of the modular units. Essentially, the Company is able to cater to the geographic needs of its client base.
Financial Results
Due to the impact of the hurricanes, the Company reported a net loss of $1.3 million for the quarter ended September 30, 2005 or a $0.15 loss per share. The Company incurred, on a pre-tax basis, an aggregate one-time loan loss provision of $14.4 million, one-time expenses of $346,000, and approximately $66,000 in reduced NSF/ATM revenues during the third quarter of 2005 in association with these storms. Excluding this one-time hurricane-related pre-tax impact of $14.8 million ($9.6 million on an
3
after-tax basis), net income for the third quarter was $8.2 million, a 17% increase over the same period in 2004, and a 1% increase compared to the second quarter of 2005. On this same basis, the Company earned $0.84 per diluted share for the quarter, up 8% from the same period in 2004, and up 2% on a linked quarter basis.
The Company believes the presentation of financial results excluding the impact of one-time hurricane-related costs and lost revenues and one-time merger related costs associated with the acquisition of American Horizons Bancorp, Inc. provides a fair representation of the underlying performance of the Company’s core operations during 2005, which may be useful for comparison purposes.
Additional Highlights For The Quarter Ended September 30, 2005
| | • | | Total assets were $2.8 billion at September 30, 2005, up 15% compared to one year ago. Similarly, total deposits were a record $2.1 billion, up 19% compared to one year ago and total loans were a record $1.9 billion, up 18%. |
| | • | | Tax-equivalent net interest margin was 3.47%, down seven basis points compared to 3.54% in the second quarter of 2005. The margin compression during the third quarter was the result of temporary excess cash reserves associated with the storms (two of the seven basis point decline) and higher liability pricing. The higher liability costs were the result of client migration into higher-yielding deposit accounts, higher CD repricing, and escalated overnight borrowing costs. The yield on average earning assets grew 10 basis points, and the cost of interest-bearing liabilities increased 21 basis points. Average non-interest bearing demand deposits increased 7% on a linked quarter basis. |
| | • | | Exclusive of one-time hurricane related provision and expenses, return on average assets (“ROA”) was 1.19% for the third quarter of 2005, return on average equity (“ROE”) was 12.27% and return on average tangible equity was 20.26%. |
| | • | | Nonperforming assets (“NPAs”) decreased by $2.0 million, or 27%, between June 30, 2005 and September 30, 2005. NPAs as a percentage of total assets were 0.20% at September 30, 2005 compared to 0.27% at June 30, 2005, and 0.26% one year ago. Exclusive of hurricane-related provisions, coverage ratios of nonperforming loans and nonperforming assets at September 30, 2005 were 488% and 435%, respectively. |
| | • | | During the third quarter of 2005, the Company recorded no security gains or losses and mortgage loan gains of $0.6 million. |
| | • | | Tier 1 leverage ratio was 7.45% at September 30, 2005, down 16 basis points from 7.61% at June 30, 2005, and down five basis points compared to one year ago. At September 30, 2005, the Company’s Tier 1 risk-based capital ratio was 10.56%, and total risk-based capital ratio was 11.82%. |
| | • | | The Company paid a 5-for-4 stock split in the form of a stock dividend on August 15, 2005 to shareholders of record on August 1, 2005. All per share figures in this release have been adjusted for the stock split. |
| | • | | On September 19, 2005, the Company declared a quarterly cash dividend of $0.26 per share, an increase of 16% compared to the same quarter last year and an 8% increase on a linked quarter basis. Over the last thirteen quarters, the Company has increased the quarterly cash dividend by 81%. |
4
Total shareholders’ equity decreased $6 million, or 2%, at September 30, 2005 compared to June 30, 2005, and increased $45 million, or 21% compared to one year ago. At September 30, 2005 the Company’s equity-to-assets ratio was 9.29%, compared to 9.74% at June 30, 2005 and 8.84% one year ago. Book value per share at September 30, 2005 was $27.26, down $0.74 per share or 3% compared to June 30, 2005 and up 10% compared to one year ago. Tangible book value per share was $16.60, a decrease of 4% compared to June 30, 2005 and 2% compared to one year ago.
Loans And Deposits
Total loans increased $49 million, or 3%, between June 30, 2005 and September 30, 2005, and up 18% compared to one year ago. The Company’s commercial loan pipeline remains extremely strong. Period-end loan volume increased $28 million, or 3% between June 30, 2005 and September 30, 2005. The yield on average commercial loans climbed 15 basis points on a linked quarter basis to yield 5.81%.
Residential mortgage loans increased $15 million, or 3% compared to June 30, 2005. The average yield on mortgage loans increased seven basis points on a linked quarter basis. Residential loans are comprised of construction loans, private banking mortgages, and retail permanent mortgage loans. Construction loans totaled $31 million, up 13% compared to June 30, 2005, and down 12% since one year ago. Construction loans account for less than 2% of total loans. The Company believes the current low level of construction and land development loans allows the Company to expand this segment of the portfolio, in association with the rebuilding process for Hurricanes Katrina and Rita, and maintain effective risk diversification. Private banking mortgages increased $18 million, or 13%, during the quarter. At September 30, 2005, the private banking mortgage portfolio had a weighted average coupon of 5.25% and a weighted average maturity of 16.4 years. The retail mortgage portfolio totals $276 million, with 5.51% weighted average coupon, 17.3 weighted average maturity, and an average loan-to-value of 51%. Approximately half of the retail mortgage portfolio is comprised of adjustable rate mortgages (“ARMs”). The Company holds no option-ARMs, negative amortization ARMs or interest-only ARMs in its retail mortgage loan portfolio.
The volume of mortgage loan originations totaled $65 million in the third quarter of 2005, down 3% compared to the second quarter of 2005. The pipeline of mortgage loans in process at September 30, 2005 was $66 million compared to $67 million at June 30, 2005. During the third quarter of 2005, the Company sold into the secondary market $6 million in residential mortgage loans recently released from construction that were held in the loan portfolio compared to $7 million in the second quarter of 2005 and $13 million in the first quarter of 2005. These loan sales were part of the Company’s stated plans to sell into the secondary market recently originated, mortgage production, including permanent mortgage loans coming out of construction. Residential mortgage loan sale gains were up 5% on a linked quarter basis to $0.6 million.
Indirect loan volume increased $5 million in the third quarter of 2005, up 2% on a linked quarter basis. In the quarter ended September 30, 2005, the yield on the indirect loan portfolio climbed eight basis points on a linked quarter basis to 6.14%.
The Company experienced strong deposit growth in the third quarter of 2005, after a fairly soft second quarter of 2005. At September 30, 2005, noninterest bearing deposits climbed $53 million, or 20% and interest bearing deposits grew $25 million, or 1% on a linked quarter basis. The Company’s liability cost structure increased during the quarter as some clients migrated out of lower cost deposits into higher yielding accounts. Additionally, $130 million in time deposits repriced at higher rates during the third quarter of 2005. The cost of average interest-bearing deposits increased 21 basis points on a linked quarter basis. The yield on average NOW accounts climbed 19 basis points, savings and money market products increased 24 basis points and the yield on average CDs increased 21 basis points.
5
Investment Portfolio And Funding
The investment portfolio totaled $551 million at September 30, 2005, a decline of $29 million or 5% compared to June 30, 2005. As a percentage of assets, the investment portfolio declined to 20% at September 30, 2005, compared to 21% at June 30, 2005, and 24% one year ago. The book yield on the investment portfolio remained unchanged on a linked quarter basis. Bond premium amortization in the third quarter of 2005 was unchanged from the prior two quarters at $0.6 million. Given general mortgage refinancing levels and anticipated prepayment speeds, management estimates premium amortization in the third quarter of 2005 may be at levels similar to the last four quarters.
The Company’s investment portfolio lengthened slightly during the quarter. At September 30, 2005, the portfolio had a modified duration of 3.4 years compared to 3.1 years at June 30, 2005 and 3.6 years one year ago. The Company’s investment portfolio has very limited extension risk. Based on modeling at September 30, 2005, a parallel and instantaneous 300 basis point increase in interest rates would extend the portfolio by only 0.8 years. At current projected speeds, the portfolio is expected to generate approximately $103 million in cash flows over the next 15 months. The portfolio had an unrealized loss of $5.1 million at September 30, 2005 compared to a $0.5 million loss at June 30, 2005, and an unrealized gain of $2.9 million one year ago.
The Company regularly reviews the influence of interest rates on the Company’s profitability and earnings growth prospects. Asset/liability management modeling at September 30, 2005 indicated the Company’s interest rate risk position is fairly balanced. A 100 basis point instantaneous and parallel upward shift in interest rates would be estimated to increase net interest income over 12 months by 1.2%. Similarly, a 100 basis point decrease in interest rates would be expected to increase net interest income by 0.6%. The influence of a flattening yield curve, using the forward curve as a guide, would have an anticipated negative impact on net interest income of 0.6% compared to the base case scenario of no change in interest rates.
Asset Quality
The Company believes that it uses a conservative definition of NPAs. The Company considers NPAs to include nonaccruing loans, accruing loans more than 90 days past due, foreclosed assets, and Other Real Estate Owned. NPAs amounted to $5.4 million at September 30, 2005, down $2.0 million, or 27%, compared to June 30, 2005. NPAs equated to 0.20% of total assets compared to 0.27% of total assets at June 30, 2005. The allowance for loan losses was 2.03% at September 30, 2005 and equated to 700% of NPAs. Excluding hurricane-related provisions, the Company’s reserve coverage of NPAs was 455% at September 30, 2005 up from 339% at June 30, 2005. Loans past due 30 days or more (including nonaccruing loans) represented 0.72% of total loans at September 30, 2005 a significant improvement over 0.82% at June 30, 2005.
On September 8, 2005, the Company sold nearly $4 million in nonperforming loans to a third party with a resulting gain of $290,000, a recovery of $65,000 and a reduction of goodwill of $348,000. This loan sale was contemplated well in advance of storm-related activity.
The ratio of net charge-offs to average loans was 0.39% in the third quarter of 2005 compared to 0.14% in the second quarter of 2005. The Company recorded net charge-offs of $1.1 million in the third quarter in association with seven credits in the New Orleans market. Excluding this special $1.1 million charge-off, the ratio of net charge-offs to average loans was 0.16% in the third quarter of 2005. During the third quarter, the Company charged off approximately $0.4 million associated with a commercial credit in the New Orleans market prior to Hurricane Katrina. The charge-off of this credit and associated loan loss provision were not included in the special hurricane provisions described earlier.
6
Operating Results
The Company’s tax-equivalent net interest margin declined seven basis points on a linked quarter basis, two basis points of which were the result of excess cash temporarily retained in association with the hurricanes. Average earning assets increased less than $10 million on a linked quarter basis, as average loan growth of $19 million was offset by a $21 million decline in average investments. Total tax-equivalent revenues declined $0.3 million, or 1%, on a linked quarter basis. Tax-equivalent net interest income decreased $0.2 million, or 1%, between the two linked quarters.
Noninterest income in the third quarter of 2005 decreased $0.1 million, or 2% on a linked quarter basis. Service charge income on deposit accounts decreased approximately $0.1 million, or 3%, on a linked quarter basis, primarily due to the waivers on NSF charges in the New Orleans market. ATM fee income declined 9%, as a result of foreign ATM surcharge waivers for New Orleans clients using non-IBERIABANK ATMs. The Company’s previously disclosed sale of nonperforming assets at September 8, 2005 also impacted noninterest income during the quarter.
Noninterest expenses decreased $0.3 million, or 2% on a linked quarter basis. Excluding one-time hurricane-related costs, the comparable figures were declines of $0.6 million and 4%, respectively. The Company’s tax-equivalent tangible efficiency ratio (a measure of a bank’s operating efficiency) improved from 54.1% in the second quarter of 2005 to 53.7% in the third quarter of 2005. Excluding one-time hurricane-related costs, the tangible efficiency ratio in the third quarter of 2005 was 52.5%.
Through September 30, 2005, the branch expansion initiative had an insignificant impact on the financial results of the Company. Fourth quarter of 2005 will be negatively impacted as a result of costs such as depreciation, staffing, and marketing associated with branch expansion initiative are incurred, with limited initial revenue until loans and deposits associated with the branches are booked. The Company currently estimates the branch initiative will have a $0.04 negative impact on EPS in the fourth quarter of 2005.
Management stated today that, exclusive of costs associated with the branch expansion initiative the Company expects EPS in the fourth quarter of 2005 to be in the range of $0.80 to $0.85 per fully diluted share. This EPS comfort range is based on management’s current information, estimates and assumptions. One fundamental assumption is the projected continuing flattening of the yield curve in 2005 as presented in current forward interest rate curves and immaterial additional hurricane-related costs. Turmoil in the banking market in Louisiana has presented significant recruiting opportunities for the Company. The Company anticipates a material expense associated with strategic recruits in the fourth quarter of 2005 that will be offset by a gain on the sale of excess land in northeast Louisiana.
For the full year of 2005, the Company expects EPS to be in the range of $2.18 to $2.23. On an adjusted basis that excludes one-time merger related costs associated with the acquisition of American Horizons (approximately $0.04 per share in the first quarter of 2005), one-time hurricane-related impact (approximately $0.99 per share in the third quarter of 2005), and costs associated with the branch expansion initiative (approximately $0.04 per share in the fourth quarter of 2005), the 2005 annual EPS would be $3.25 to $3.30, or equivalent to $4.06 to $4.13 per share on a pre-split basis. The adjusted figures are consistent with prior management guidance.
Based on a closing stock price on October 19, 2005 of $50.02 per share, the Company’s common stock traded at a price-to-earnings ratio of 13.9 times current average analyst estimates of $3.61 per fully diluted EPS for 2006, and 1.83 times September 30, 2005 book value per share of $27.26. On September 19, 2005, the Company declared a quarterly cash dividend of $0.26 per share, payable to shareholders of record as of September 30, 2005. This dividend level represented a 16% increase over the same period last year and equated to an annualized dividend rate of $1.04 per share and an indicated dividend yield of 2.08%.
7
In association with this earnings release, will host a live conference call to discuss the financial results for the quarter just completed. The telephone conference call will be held on Thursday, October 20, 2005, beginning at 8:00 a.m. Central Time by dialing 1-800-288-8975. The confirmation code for the call is 797147. A replay of the call will be available until midnight Central Time on October 27, 2005 by dialing 1-800-475-6701. The confirmation code for the replay is 797147. A supplemental PowerPoint presentation is available on the Company’s website atwww.iberiabank.com/invest.cfm?page=invest_relations_redirect.cfm.
IBERIABANK Corporation is one of the oldest financial institutions with continuous operations in the State of Louisiana and soon to be the second largest Louisiana-based bank holding company. The Company operates 43 offices located in New Orleans, Baton Rouge, Shreveport, Northeast Louisiana, and the Acadiana region of Louisiana. The Company’s common stock trades on NASDAQ under the symbol “IBKC” and the Company’s market capitalization is approximately $470 million.
This press release contains financial information determined by methods other than in accordance with GAAP. The Company’s management uses these non-GAAP measures in their analysis of the Company’s performance. These measures typically adjust GAAP performance measures to exclude the effects of the amortization of intangibles and include the tax benefit associated with revenue items that are tax-exempt. Since the presentation of these GAAP performance measures and their impact differ between companies, management believes presentations of these non-GAAP financial measures provide useful supplemental information that is essential to a proper understanding of the operating results of the Company’s core businesses. These non-GAAP disclosures should not be viewed as a substitute for operating results determined in accordance with GAAP, nor are they necessarily comparable to non-GAAP performance measures that may be presented by other companies.
Forward Looking Statements
To the extent that statements in this press release relate to future plans, objectives, financial results or performance of IBERIABANK Corporation, these statements are deemed to be forward-looking statements within the meaning of the Private Securities Litigation Reform Act of 1995. Such statements, which are based on management’s current information, estimates and assumptions and the current economic environment, are generally identified by the use of the words “plan”, “believe”, “expect”, “intend”, “anticipate”, “estimate”, “project” or similar expressions. IBERIABANK Corporation’s actual strategies and results in future periods may differ materially from those currently expected due to various risks and uncertainties. Factors that may cause actual results to differ materially from these forward-looking statements include, but are not limited to, changes in market and economic conditions, including current forward interest rate curves; changes in interest rates, deposit flows, loan demand and real estate values; competitive pressures; changes in accounting principles, policies or guidelines; changes in the Company’s loan or investment portfolio; legislative or regulatory changes; changes in monetary or fiscal policies; military or terrorist activities; litigation costs and expenses; and other economic, competitive, governmental, regulatory and technological factors affecting the Company’s business activities and prospects. Factors affecting IBERIABANK Corporation are discussed in the Company’s periodic and other filings with the Securities and Exchange Commission, available at the SEC’s website,www.sec.gov, and the Company’s website,www.iberiabank.com.
8
IBERIABANK CORPORATION
FINANCIAL HIGHLIGHTS
| | | | | | | | | | | | | | | | | | | | | | | | | | |
| | | For The Quarter Ended September 30,
| | | For The Quarter Ended
June 30,
| |
| | | Reported
2005
| | | Impact of
Hurricanes
| | | Adjusted
2005
| | | 2004
| | | % Change
| | | 2005
| | | % Change
| |
Income Data (in thousands): | | | | | | | | | | | | | | | | | | | | | | | | | | |
Net Interest Income | | $ | 21,042 | | | | — | | | $ | 21,042 | | | $ | 19,231 | | | 9 | % | | $ | 21,275 | | | (1 | %) |
Net Interest Income (TE)(1) | | | 21,870 | | | | — | | | | 21,870 | | | | 19,950 | | | 10 | % | | | 22,080 | | | (1 | %) |
Net Income (Loss) | | | (1,341 | ) | | | 9,587 | | | | 8,246 | | | | 7,036 | | | 17 | % | | | 8,128 | | | 1 | % |
| | | | | | | |
Per Share Data: | | | | | | | | | | | | | | | | | | | | | | | | | | |
Net Income (Loss)—Basic | | $ | (0.15 | ) | | $ | 1.05 | | | $ | 0.90 | | | $ | 0.84 | | | 7 | % | | $ | 0.88 | | | 2 | % |
Net Income (Loss)—Diluted | | | (0.15 | ) | | | 0.99 | | | | 0.84 | | | | 0.78 | | | 8 | % | | | 0.82 | | | 2 | % |
Book Value | | | 27.26 | | | | 1.01 | | | | 28.27 | | | | 24.89 | | | 14 | % | | | 28.00 | | | 1 | % |
Tangible Book Value(2) | | | 16.60 | | | | 1.01 | | | | 17.61 | | | | 16.91 | | | 4 | % | | | 17.23 | | | 2 | % |
Cash Dividends | | | 0.26 | | | | — | | | | 0.26 | | | | 0.22 | | | 16 | % | | | 0.24 | | | 8 | % |
| | | | | | | |
Number of Shares Outstanding: | | | | | | | | | | | | | | | | | | | | | | | | | | |
Basic Shares (Average) | | | 9,176,517 | | | | | | | | 9,176,517 | | | | 8,360,589 | | | 10 | % | | | 9,233,918 | | | (1 | %) |
Diluted Shares (Average) | | | 9,176,517 | | | | | | | | 9,855,266 | | | | 9,039,252 | | | 9 | % | | | 9,860,666 | | | (0.1 | %) |
Book Value Shares (Period End)(5) | | | 9,469,544 | | | | | | | | 9,469,544 | | | | 8,578,443 | | | 10 | % | | | 9,422,454 | | | 0.5 | % |
| | | | | | | |
Key Ratios:(3) | | | | | | | | | | | | | | | | | | | | | | | | | | |
Return on Average Assets | | | (0.19 | %) | | | 1.38 | % | | | 1.19 | % | | | 1.17 | % | | | | | | 1.20 | % | | | |
Return on Average Equity | | | (2.00 | %) | | | 14.27 | % | | | 12.27 | % | | | 13.34 | % | | | | | | 12.22 | % | | | |
Return on Average Tangible Equity (2) | | | (2.74 | %) | | | 23.00 | % | | | 20.26 | % | | | 20.23 | % | | | | | | 20.26 | % | | | |
Net Interest Margin (TE)(1) | | | 3.47 | % | | | — | | | | 3.47 | % | | | 3.58 | % | | | | | | 3.54 | % | | | |
Efficiency Ratio | | | 57.0 | % | | | (1.3 | %) | | | 55.7 | % | | | 56.7 | % | | | | | | 57.3 | % | | | |
Tangible Efficiency Ratio (TE)(1)(2) | | | 53.7 | % | | | (1.2 | %) | | | 52.5 | % | | | 53.8 | % | | | | | | 54.1 | % | | | |
Average Loans to Average Deposits | | | 89.8 | % | | | — | | | | 89.8 | % | | | 88.5 | % | | | | | | 90.4 | % | | | |
Nonperforming Assets to Total Assets(4) | | | 0.20 | % | | | (0.01 | %) | | | 0.19 | % | | | 0.26 | % | | | | | | 0.27 | % | | | |
Allowance for Loan Losses to Loans | | | 2.03 | % | | | (0.71 | %) | | | 1.32 | % | | | 1.24 | % | | | | | | 1.37 | % | | | |
Net Charge-offs to Average Loans | | | 0.39 | % | | | (0.23 | %) | | | 0.16 | % | | | 0.17 | % | | | | | | 0.14 | % | | | |
Average Equity to Average Total Assets | | | 9.74 | % | | | — | | | | 9.74 | % | | | 8.76 | % | | | | | | 9.80 | % | | | |
Tier 1 Leverage Ratio | | | 7.45 | % | | | 0.37 | % | | | 7.82 | % | | | 7.50 | % | | | | | | 7.61 | % | | | |
Dividend Payout Ratio | | | — | | | | — | | | | 30.3 | % | | | 27.2 | % | | | | | | 27.8 | % | | | |
| (1) | Fully taxable equivalent (TE) calculations include the tax benefit associated with related income sources that are tax-exempt using a marginal tax rate of 35%. |
| (2) | Tangible calculations eliminate the effect of goodwill and acquisition related intangible assets and the corresponding amortization expense on a tax-effected basis where applicable. |
| (3) | All ratios are calculated on an annualized basis for the period indicated. |
| (4) | Nonperforming assets consist of nonaccruing loans, accruing loans 90 days or more past due and repossessed assets. |
| (5) | Shares used for book value purposes exclude shares held in treasury and unreleased shares held by the Employee Stock Ownership Plan at the end of the period. |
IBERIABANK CORPORATION
CONDENSED CONSOLIDATED FINANCIAL INFORMATION
(dollars in thousands except per share data)
| | | | | | | | | | | | | | | | | | | |
BALANCE SHEET (End of Period)
| | September 30,
| | | June 30, 2005
| | | December 31, 2004
| |
| | | 2005
| | | 2004
| | | % Change
| | | |
ASSETS | | | | | | | | | | | | | | | | | | | |
Cash and Due From Banks | | $ | 50,901 | | | $ | 39,396 | | | 29.2 | % | | $ | 48,528 | | | $ | 33,940 | |
Interest-bearing Deposits in Banks | | | 65,330 | | | | 13,719 | | | 376.2 | % | | | 13,615 | | | | 19,325 | |
| | |
|
|
| |
|
|
| |
|
| |
|
|
| |
|
|
|
Total Cash and Equivalents | | | 116,231 | | | | 53,115 | | | 118.8 | % | | | 62,143 | | | | 53,265 | |
Investment Securities Available for Sale | | | 521,104 | | | | 540,425 | | | (3.6 | %) | | | 548,972 | | | | 526,933 | |
Investment Securities Held to Maturity | | | 30,008 | | | | 41,756 | | | (28.1 | %) | | | 31,226 | | | | 40,022 | |
| | |
|
|
| |
|
|
| |
|
| |
|
|
| |
|
|
|
Total Investment Securities | | | 551,112 | | | | 582,181 | | | (5.3 | %) | | | 580,198 | | | | 566,955 | |
Mortgage Loans Held for Sale | | | 15,581 | | | | 10,624 | | | 46.7 | % | | | 16,546 | | | | 8,109 | |
Loans, Net of Unearned Income | | | 1,879,304 | | | | 1,599,609 | | | 17.5 | % | | | 1,830,070 | | | | 1,650,626 | |
Allowance for Loan Losses | | | (38,078 | ) | | | (19,885 | ) | | 91.5 | % | | | (25,102 | ) | | | (20,116 | ) |
| | |
|
|
| |
|
|
| |
|
| |
|
|
| |
|
|
|
Loans, net | | | 1,841,226 | | | | 1,579,724 | | | 16.6 | % | | | 1,804,968 | | | | 1,630,510 | |
Premises and Equipment | | | 50,866 | | | | 37,595 | | | 35.3 | % | | | 47,548 | | | | 39,557 | |
Goodwill and Acquisition Intangibles | | | 100,948 | | | | 68,519 | | | 47.3 | % | | | 101,436 | | | | 68,310 | |
Mortgage Servicing Rights | | | 113 | | | | 199 | | | (43.0 | %) | | | 133 | | | | 176 | |
Other Assets | | | 101,115 | | | | 82,979 | | | 21.9 | % | | | 95,734 | | | | 81,720 | |
| | |
|
|
| |
|
|
| |
|
| |
|
|
| |
|
|
|
Total Assets | | $ | 2,777,192 | | | $ | 2,414,936 | | | 15.0 | % | | $ | 2,708,706 | | | $ | 2,448,602 | |
| | |
|
|
| |
|
|
| |
|
| |
|
|
| |
|
|
|
LIABILITIES AND SHAREHOLDERS' EQUITY | | | | | | | | | | | | | | | | | | | |
Noninterest-bearing Deposits | | $ | 317,665 | | | $ | 219,339 | | | 44.8 | % | | $ | 264,439 | | | $ | 218,859 | |
Interest-bearing Deposits | | | 1,785,046 | | | | 1,546,606 | | | 15.4 | % | | | 1,760,201 | | | | 1,554,630 | |
| | |
|
|
| |
|
|
| |
|
| |
|
|
| |
|
|
|
Total Deposits | | | 2,102,711 | | | | 1,765,945 | | | 19.1 | % | | | 2,024,640 | | | | 1,773,489 | |
Short-term Borrowings | | | 90,745 | | | | 165,000 | | | (45.0 | %) | | | 119,500 | | | | 192,000 | |
Securities Sold Under Agreements to Repurchase | | | 52,459 | | | | 49,139 | | | 6.8 | % | | | 41,850 | | | | 44,453 | |
Long-term Debt | | | 258,580 | | | | 206,512 | | | 25.2 | % | | | 243,652 | | | | 206,089 | |
Other Liabilities | | | 14,565 | | | | 14,788 | | | (1.5 | %) | | | 15,256 | | | | 12,409 | |
| | |
|
|
| |
|
|
| |
|
| |
|
|
| |
|
|
|
Total Liabilities | | | 2,519,060 | | | | 2,201,384 | | | 14.4 | % | | | 2,444,898 | | | | 2,228,440 | |
Total Shareholders' Equity | | | 258,132 | | | | 213,552 | | | 20.9 | % | | | 263,808 | | | | 220,162 | |
| | |
|
|
| |
|
|
| |
|
| |
|
|
| |
|
|
|
Total Liabilities and Shareholders' Equity | | $ | 2,777,192 | | | $ | 2,414,936 | | | 15.0 | % | | $ | 2,708,706 | | | $ | 2,448,602 | |
| | |
|
|
| |
|
|
| |
|
| |
|
|
| |
|
|
|
| | | | | | | | | | | | | | | | | | | |
INCOME STATEMENT
| | For The Three Months Ended
September 30,
| | | For The Nine Months Ended
September 30,
| |
| | | 2005
| | | 2004
| | % Change
| | | 2005
| | 2004
| | % Change
| |
Interest Income | | $ | 34,541 | | | $ | 28,047 | | 23.2 | % | | $ | 99,543 | | $ | 79,641 | | 25.0 | % |
Interest Expense | | | 13,499 | | | | 8,816 | | 53.1 | % | | | 36,678 | | | 24,325 | | 50.8 | % |
| | |
|
|
| |
|
| |
|
| |
|
| |
|
| |
|
|
Net Interest Income | | | 21,042 | | | | 19,231 | | 9.4 | % | | | 62,865 | | | 55,316 | | 13.6 | % |
Provision for Loan Losses | | | 15,164 | | | | 857 | | 1669.7 | % | | | 16,444 | | | 2,616 | | 528.5 | % |
| | |
|
|
| |
|
| |
|
| |
|
| |
|
| |
|
|
Net Interest Income After Provision for Loan Losses | | | 5,878 | | | | 18,374 | | (68.0 | %) | | | 46,421 | | | 52,700 | | (11.9 | %) |
Service Charges | | | 3,576 | | | | 3,317 | | 7.8 | % | | | 10,400 | | | 9,266 | | 12.2 | % |
ATM / Debit Card Fee Income | | | 633 | | | | 523 | | 21.1 | % | | | 1,933 | | | 1,474 | | 31.1 | % |
BOLI Cash Surrender Value Income | | | 510 | | | | 443 | | 15.2 | % | | | 1,471 | | | 1,210 | | 21.6 | % |
Gain on Sale of Loans, net | | | 864 | | | | 592 | | 45.9 | % | | | 1,971 | | | 2,059 | | (4.3 | %) |
Other Gains (Losses) | | | 10 | | | | 16 | | (34.9 | %) | | | 234 | | | 530 | | (55.9 | %) |
Other Noninterest Income | | | 1,047 | | | | 966 | | 8.3 | % | | | 3,458 | | | 2,699 | | 28.1 | % |
| | |
|
|
| |
|
| |
|
| |
|
| |
|
| |
|
|
Total Noninterest Income | | | 6,640 | | | | 5,857 | | 13.4 | % | | | 19,467 | | | 17,238 | | 12.9 | % |
Salaries and Employee Benefits | | | 7,995 | | | | 7,923 | | 0.9 | % | | | 24,466 | | | 22,557 | | 8.5 | % |
Occupancy and Equipment | | | 2,145 | | | | 1,720 | | 24.7 | % | | | 6,068 | | | 5,134 | | 18.2 | % |
Amortization of Acquisition Intangibles | | | 307 | | | | 222 | | 38.4 | % | | | 908 | | | 674 | | 34.7 | % |
Other Noninterest Expense | | | 5,326 | | | | 4,364 | | 22.1 | % | | | 16,053 | | | 13,092 | | 22.6 | % |
| | |
|
|
| |
|
| |
|
| |
|
| |
|
| |
|
|
Total Noninterest Expense | | | 15,773 | | | | 14,229 | | 10.8 | % | | | 47,495 | | | 41,457 | | 14.6 | % |
Income (Loss) Before Income Taxes | | | (3,255 | ) | | | 10,002 | | (132.5 | %) | | | 18,393 | | | 28,481 | | (35.4 | %) |
Income Taxes | | | (1,914 | ) | | | 2,966 | | (164.5 | %) | | | 4,306 | | | 8,467 | | (49.1 | %) |
| | |
|
|
| |
|
| |
|
| |
|
| |
|
| |
|
|
Net Income (Loss) | | $ | (1,341 | ) | | $ | 7,036 | | (119.1 | %) | | $ | 14,087 | | $ | 20,014 | | (29.6 | %) |
| | |
|
|
| |
|
| |
|
| |
|
| |
|
| |
|
|
Earnings (Loss) Per Share, diluted | | $ | (0.15 | ) | | $ | 0.78 | | (119.3 | %) | | $ | 1.44 | | $ | 2.20 | | (34.7 | %) |
| | |
|
|
| |
|
| |
|
| |
|
| |
|
| |
|
|
IBERIABANK CORPORATION
CONDENSED CONSOLIDATED FINANCIAL INFORMATION
(dollars in thousands except per share data)
| | | | | | | | | | | | | | | | | | | | |
| | | For The Quarter Ended
| |
BALANCE SHEET (Average)
| | September 30,
2005
| | | June 30,
2005
| | | March 31,
2005
| | | December 31,
2004
| | | September 30,
2004
| |
ASSETS | | | | | | | | | | | | | | | | | | | | |
Cash and Due From Banks | | $ | 53,087 | | | $ | 47,302 | | | $ | 47,631 | | | $ | 39,342 | | | $ | 39,305 | |
Interest-bearing Deposits in Banks | | | 25,384 | | | | 16,326 | | | | 21,648 | | | | 22,207 | | | | 12,921 | |
Investment Securities | | | 568,356 | | | | 590,950 | | | | 575,846 | | | | 574,843 | | | | 599,601 | |
Mortgage Loans Held for Sale | | | 15,621 | | | | 12,436 | | | | 10,360 | | | | 12,209 | | | | 8,488 | |
Loans, Net of Unearned Income | | | 1,854,951 | | | | 1,836,362 | | | | 1,771,488 | | | | 1,627,276 | | | | 1,566,672 | |
Allowance for Loan Losses | | | (25,184 | ) | | | (25,104 | ) | | | (23,142 | ) | | | (19,994 | ) | | | (19,722 | ) |
Other Assets | | | 246,144 | | | | 245,432 | | | | 223,068 | | | | 189,577 | | | | 188,195 | |
| | |
|
|
| |
|
|
| |
|
|
| |
|
|
| |
|
|
|
Total Assets | | $ | 2,738,358 | | | $ | 2,723,704 | | | $ | 2,626,899 | | | $ | 2,445,460 | | | $ | 2,395,461 | |
| | |
|
|
| |
|
|
| |
|
|
| |
|
|
| |
|
|
|
| | | | | |
LIABILITIES AND SHAREHOLDERS' EQUITY | | | | | | | | | | | | | | | | | | | | |
Noninterest-bearing Deposits | | $ | 286,959 | | | $ | 267,004 | | | $ | 243,738 | | | $ | 223,921 | | | $ | 212,931 | |
Interest-bearing Deposits | | | 1,778,336 | | | | 1,763,875 | | | | 1,693,723 | | | | 1,556,184 | | | | 1,556,492 | |
| | |
|
|
| |
|
|
| |
|
|
| |
|
|
| |
|
|
|
Total Deposits | | | 2,065,295 | | | | 2,030,879 | | | | 1,937,461 | | | | 1,780,105 | | | | 1,769,423 | |
Short-term Borrowings | | | 86,902 | | | | 120,138 | | | | 141,020 | | | | 171,522 | | | | 181,658 | |
Securities Sold Under Agreements to Repurchase | | | 46,786 | | | | 51,805 | | | | 50,550 | | | | 51,240 | | | | 45,891 | |
Long-term Debt | | | 258,090 | | | | 240,637 | | | | 228,035 | | | | 206,317 | | | | 175,032 | |
Other Liabilities | | | 14,693 | | | | 13,430 | | | | 17,943 | | | | 18,194 | | | | 13,596 | |
| | |
|
|
| |
|
|
| |
|
|
| |
|
|
| |
|
|
|
Total Liabilities | | | 2,471,766 | | | | 2,456,889 | | | | 2,375,009 | | | | 2,227,378 | | | | 2,185,600 | |
Total Shareholders' Equity | | | 266,592 | | | | 266,815 | | | | 251,890 | | | | 218,082 | | | | 209,861 | |
| | |
|
|
| |
|
|
| |
|
|
| |
|
|
| |
|
|
|
Total Liabilities and Shareholders' Equity | | $ | 2,738,358 | | | $ | 2,723,704 | | | $ | 2,626,899 | | | $ | 2,445,460 | | | $ | 2,395,461 | |
| | |
|
|
| |
|
|
| |
|
|
| |
|
|
| |
|
|
|
| | |
| | | 2005
| | | 2004
| |
INCOME STATEMENT
| | Third
Quarter
| | | Second
Quarter
| | | First
Quarter
| | | Fourth
Quarter
| | | Third
Quarter
| |
Interest Income | | $ | 34,541 | | | $ | 33,549 | | | $ | 31,454 | | | $ | 28,969 | | | $ | 28,047 | |
Interest Expense | | | 13,499 | | | | 12,274 | | | | 10,905 | | | | 9,657 | | | | 8,816 | |
| | |
|
|
| |
|
|
| |
|
|
| |
|
|
| |
|
|
|
Net Interest Income | | | 21,042 | | | | 21,275 | | | | 20,549 | | | | 19,312 | | | | 19,231 | |
Provision for Loan Losses | | | 15,164 | | | | 630 | | | | 650 | | | | 1,425 | | | | 857 | |
| | |
|
|
| |
|
|
| |
|
|
| |
|
|
| |
|
|
|
Net Interest Income After Provision for Loan Losses | | | 5,878 | | | | 20,645 | | | | 19,899 | | | | 17,887 | | | | 18,374 | |
Total Noninterest Income | | | 6,640 | | | | 6,745 | | | | 6,081 | | | | 5,979 | | | | 5,857 | |
Total Noninterest Expense | | | 15,773 | | | | 16,047 | | | | 15,676 | | | | 13,440 | | | | 14,229 | |
| | |
|
|
| |
|
|
| |
|
|
| |
|
|
| |
|
|
|
Income (Loss) Before Income Taxes | | | (3,255 | ) | | | 11,343 | | | | 10,304 | | | | 10,426 | | | | 10,002 | |
Income Taxes | | | (1,914 | ) | | | 3,215 | | | | 3,004 | | | | 3,101 | | | | 2,966 | |
| | |
|
|
| |
|
|
| |
|
|
| |
|
|
| |
|
|
|
Net Income (Loss) | | $ | (1,341 | ) | | $ | 8,128 | | | $ | 7,300 | | | $ | 7,325 | | | $ | 7,036 | |
| | |
|
|
| |
|
|
| |
|
|
| |
|
|
| |
|
|
|
Earnings (Loss) Per Share, basic | | $ | (0.15 | ) | | $ | 0.88 | | | $ | 0.81 | | | $ | 0.88 | | | $ | 0.84 | |
| | |
|
|
| |
|
|
| |
|
|
| |
|
|
| |
|
|
|
Earnings (Loss) Per Share, diluted | | $ | (0.15 | ) | | $ | 0.82 | | | $ | 0.75 | | | $ | 0.80 | | | $ | 0.78 | |
| | |
|
|
| |
|
|
| |
|
|
| |
|
|
| |
|
|
|
Book Value Per Share | | $ | 27.26 | | | $ | 28.00 | | | $ | 27.64 | | | $ | 25.62 | | | $ | 24.89 | |
| | |
|
|
| |
|
|
| |
|
|
| |
|
|
| |
|
|
|
Return on Average Assets | | | (0.19 | %) | | | 1.20 | % | | | 1.13 | % | | | 1.19 | % | | | 1.17 | % |
Return on Average Equity | | | (2.00 | %) | | | 12.22 | % | | | 11.75 | % | | | 13.36 | % | | | 13.34 | % |
Return on Average Tangible Equity | | | (2.74 | %) | | | 20.26 | % | | | 18.70 | % | | | 19.84 | % | | | 20.23 | % |
IBERIABANK CORPORATION
CONDENSED CONSOLIDATED FINANCIAL INFORMATION
(dollars in thousands)
| | | | | | | | | | | | | | | | | | | |
LOANS RECEIVABLE
| | September 30,
| | | June 30, 2005
| | | December 31, 2004
| |
| | | 2005
| | | 2004
| | | % Change
| | | |
Residential Mortgage Loans: | | | | | | | | | | | | | | | | | | | |
Residential 1-4 Family | | $ | 419,357 | | | $ | 379,730 | | | 10.4 | % | | $ | 407,726 | | | $ | 387,085 | |
Construction | | | 30,805 | | | | 34,912 | | | (11.8 | %) | | | 27,329 | | | | 33,031 | |
| | |
|
|
| |
|
|
| |
|
| |
|
|
| |
|
|
|
Total Residential Mortgage Loans | | | 450,162 | | | | 414,642 | | | 8.6 | % | | | 435,055 | | | | 420,116 | |
Commercial Loans: | | | | | | | | | | | | | | | | | | | |
Real Estate | | | 530,678 | | | | 397,710 | | | 33.4 | % | | | 516,378 | | | | 419,427 | |
Business | | | 346,741 | | | | 276,895 | | | 25.2 | % | | | 332,602 | | | | 307,614 | |
| | |
|
|
| |
|
|
| |
|
| |
|
|
| |
|
|
|
Total Commercial Loans | | | 877,419 | | | | 674,605 | | | 30.1 | % | | | 848,980 | | | | 727,041 | |
Consumer Loans: | | | | | | | | | | | | | | | | | | | |
Indirect Automobile | | | 235,353 | | | | 228,829 | | | 2.9 | % | | | 229,910 | | | | 222,481 | |
Home Equity | | | 239,834 | | | | 211,088 | | | 13.6 | % | | | 239,770 | | | | 213,533 | |
Automobile | | | 23,114 | | | | 21,630 | | | 6.9 | % | | | 23,711 | | | | 20,064 | |
Credit Card Loans | | | 8,191 | | | | 8,093 | | | 1.2 | % | | | 8,123 | | | | 8,743 | |
Other | | | 45,231 | | | | 40,722 | | | 11.1 | % | | | 44,521 | | | | 38,648 | |
| | |
|
|
| |
|
|
| |
|
| |
|
|
| |
|
|
|
Total Consumer Loans | | | 551,723 | | | | 510,362 | | | 8.1 | % | | | 546,035 | | | | 503,469 | |
| | |
|
|
| |
|
|
| |
|
| |
|
|
| |
|
|
|
Total Loans Receivable | | | 1,879,304 | | | | 1,599,609 | | | 17.5 | % | | | 1,830,070 | | | | 1,650,626 | |
| | | | | | | | | | |
|
| | | | | | | | |
Allowance for Loan Losses | | | (38,078 | ) | | | (19,885 | ) | | | | | | (25,102 | ) | | | (20,116 | ) |
| | |
|
|
| |
|
|
| | | | |
|
|
| |
|
|
|
Loans Receivable, Net | | $ | 1,841,226 | | | $ | 1,579,724 | | | | | | $ | 1,804,968 | | | $ | 1,630,510 | |
| | |
|
|
| |
|
|
| | | | |
|
|
| |
|
|
|
| | | |
ASSET QUALITY DATA
| | September 30,
| | | June 30, 2005
| | | December 31, 2004
| |
| | | 2005
| | | 2004
| | | % Change
| | | |
Nonaccrual Loans | | $ | 3,465 | | | $ | 4,258 | | | (18.6 | %) | | $ | 6,558 | | | $ | 4,455 | |
Foreclosed Assets | | | 5 | | | | 30 | | | (81.7 | %) | | | 60 | | | | 9 | |
Other Real Estate Owned | | | 365 | | | | 787 | | | (53.7 | %) | | | 240 | | | | 483 | |
Accruing Loans More Than 90 Days Past Due | | | 1,605 | | | | 1,139 | | | 40.9 | % | | | 540 | | | | 1,209 | |
| | |
|
|
| |
|
|
| |
|
| |
|
|
| |
|
|
|
Total Nonperforming Assets(1) | | $ | 5,440 | | | $ | 6,214 | | | (12.5 | %) | | $ | 7,398 | | | $ | 6,156 | |
| | |
|
|
| |
|
|
| |
|
| |
|
|
| |
|
|
|
| | | | | |
Nonperforming Assets to Total Assets(1) | | | 0.20 | % | | | 0.26 | % | | (23.9 | %) | | | 0.27 | % | | | 0.25 | % |
Nonperforming Assets to Total Loans + OREO(1) | | | 0.29 | % | | | 0.39 | % | | (25.5 | %) | | | 0.40 | % | | | 0.37 | % |
Allowance for Loan Losses to Nonperforming Loans(1) | | | 751.1 | % | | | 368.4 | % | | 103.9 | % | | | 353.6 | % | | | 355.2 | % |
Allowance for Loan Losses to Nonperforming Assets(1) | | | 700.0 | % | | | 320.0 | % | | 118.7 | % | | | 339.3 | % | | | 326.8 | % |
Allowance for Loan Losses to Total Loans | | | 2.03 | % | | | 1.24 | % | | 63.0 | % | | | 1.37 | % | | | 1.22 | % |
Year to Date Charge-offs | | $ | 4,432 | | | $ | 2,564 | | | 72.8 | % | | $ | 2,036 | | | $ | 4,112 | |
Year to Date Recoveries | | $ | 1,407 | | | $ | 1,017 | | | 38.4 | % | | $ | 849 | | | $ | 1,370 | |
| (1) | Nonperforming loans consist of nonaccruing loans and accruing loans 90 days or more past due. Nonperforming assets consist of nonperforming loans and repossessed assets. |
| | | | | | | | | | | | | | | |
DEPOSITS
| | September 30,
| | | June 30, 2005
| | December 31, 2004
|
| | | 2005
| | 2004
| | % Change
| | | |
Noninterest-bearing Demand Accounts | | $ | 317,665 | | $ | 219,339 | | 44.8 | % | | $ | 264,439 | | $ | 218,859 |
NOW Accounts | | | 546,017 | | | 514,189 | | 6.2 | % | | | 546,859 | | | 532,584 |
Savings and Money Market Accounts | | | 502,479 | | | 411,606 | | 22.1 | % | | | 483,057 | | | 393,772 |
Certificates of Deposit | | | 736,550 | | | 620,811 | | 18.6 | % | | | 730,285 | | | 628,274 |
| | |
|
| |
|
| |
|
| |
|
| |
|
|
Total Deposits | | $ | 2,102,711 | | $ | 1,765,945 | | 19.1 | % | | $ | 2,024,640 | | $ | 1,773,489 |
| | |
|
| |
|
| |
|
| |
|
| |
|
|
IBERIABANK CORPORATION
CONDENSED CONSOLIDATED FINANCIAL INFORMATION
Taxable Equivalent Basis
(dollars in thousands)
| | | | | | | | | | | | | | |
| | | For The Quarter Ended
| |
| | | September 30, 2005
| | | September 30, 2004
| |
| | | Average
Balance
| | | Average
Yield/Rate (%)
| | | Average
Balance
| | | Average
Yield/Rate (%)
| |
ASSETS | | | | | | | | | | | | | | |
Earning Assets: | | | | | | | | | | | | | | |
Loans Receivable: | | | | | | | | | | | | | | |
Mortgage Loans | | $ | 443,644 | | | 5.39 | % | | $ | 405,524 | | | 5.43 | % |
Commercial Loans (TE)(1) | | | 862,834 | | | 5.81 | % | | | 656,323 | | | 4.86 | % |
Consumer and Other Loans | | | 548,473 | | | 6.86 | % | | | 504,825 | | | 6.46 | % |
| | |
|
|
| | | | |
|
|
| | | |
Total Loans | | | 1,854,951 | | | 6.02 | % | | | 1,566,672 | | | 5.52 | % |
Mortgage Loans Held for Sale | | | 15,621 | | | 5.68 | % | | | 8,488 | | | 4.76 | % |
Investment Securities (TE)(1)(2) | | | 571,725 | | | 4.42 | % | | | 600,659 | | | 4.40 | % |
Other Earning Assets | | | 52,421 | | | 4.16 | % | | | 36,351 | | | 2.39 | % |
| | |
|
|
| | | | |
|
|
| | | |
Total Earning Assets | | | 2,494,718 | | | 5.61 | % | | | 2,212,170 | | | 5.16 | % |
Allowance for Loan Losses | | | (25,184 | ) | | | | | | (19,722 | ) | | | |
Nonearning Assets | | | 268,824 | | | | | | | 203,013 | | | | |
| | |
|
|
| | | | |
|
|
| | | |
Total Assets | | $ | 2,738,358 | | | | | | $ | 2,395,461 | | | | |
| | |
|
|
| | | | |
|
|
| | | |
| | | | |
LIABILITIES AND SHAREHOLDERS' EQUITY | | | | | | | | | | | | | | |
Interest-bearing Liabilities: | | | | | | | | | | | | | | |
Deposits: | | | | | | | | | | | | | | |
NOW Accounts | | $ | 542,518 | | | 1.76 | % | | $ | 516,417 | | | 1.15 | % |
Savings and Money Market Accounts | | | 501,449 | | | 1.44 | % | | | 413,115 | | | 0.77 | % |
Certificates of Deposit | | | 734,369 | | | 3.00 | % | | | 626,960 | | | 2.43 | % |
| | |
|
|
| | | | |
|
|
| | | |
Total Interest-bearing Deposits | | | 1,778,336 | | | 2.18 | % | | | 1,556,492 | | | 1.57 | % |
Short-term Borrowings | | | 133,688 | | | 2.74 | % | | | 227,549 | | | 1.38 | % |
Long-term Debt | | | 258,090 | | | 4.21 | % | | | 175,032 | | | 4.22 | % |
| | |
|
|
| | | | |
|
|
| | | |
Total Interest-bearing Liabilities | | | 2,170,114 | | | 2.46 | % | | | 1,959,073 | | | 1.78 | % |
Noninterest-bearing Demand Deposits | | | 286,959 | | | | | | | 212,931 | | | | |
Noninterest-bearing Liabilities | | | 14,693 | | | | | | | 13,596 | | | | |
| | |
|
|
| | | | |
|
|
| | | |
Total Liabilities | | | 2,471,766 | | | | | | | 2,185,600 | | | | |
Shareholders' Equity | | | 266,592 | | | | | | | 209,861 | | | | |
| | |
|
|
| | | | |
|
|
| | | |
Total Liabilities and Shareholders' Equity | | $ | 2,738,358 | | | | | | $ | 2,395,461 | | | | |
| | |
|
|
| | | | |
|
|
| | | |
| | | | |
Net Earning Assets | | $ | 324,604 | | | | | | $ | 253,097 | | | | |
Net Interest Spread | | $ | 21,042 | | | 3.15 | % | | $ | 19,231 | | | 3.38 | % |
Tax-equivalent Benefit | | | 828 | | | 0.13 | % | | | 719 | | | 0.12 | % |
Net Interest Income (TE) / Net Interest Margin (TE)(1) | | $ | 21,870 | | | 3.47 | % | | $ | 19,950 | | | 3.58 | % |
| (1) | Fully taxable equivalent (TE) calculations include the tax benefit associated with related income sources that are tax-exempt using a marginal tax rate of 35%. |
| (2) | Balances exclude unrealized gain or loss on securities available for sale and impact of trade date accounting. |
IBERIABANK CORPORATION
CONDENSED CONSOLIDATED FINANCIAL INFORMATION
Taxable Equivalent Basis
(dollars in thousands)
| | | | | | | | | | | | | | |
| | | For The Nine Months Ended
| |
| | | September 30, 2005
| | | September 30, 2004
| |
| | | Average
Balance
| | | Average
Yield/Rate (%)
| | | Average
Balance
| | | Average
Yield/Rate (%)
| |
ASSETS | | | | | | | | | | | | | | |
Earning Assets: | | | | | | | | | | | | | | |
Loans Receivable: | | | | | | | | | | | | | | |
Mortgage Loans | | $ | 433,568 | | | 5.35 | % | | $ | 393,369 | | | 5.50 | % |
Commercial Loans (TE)(1) | | | 850,346 | | | 5.64 | % | | | 613,880 | | | 4.79 | % |
Consumer and Other Loans | | | 537,325 | | | 6.76 | % | | | 490,608 | | | 6.57 | % |
| | |
|
|
| | | | |
|
|
| | | |
Total Loans | | | 1,821,239 | | | 5.90 | % | | | 1,497,857 | | | 5.56 | % |
Mortgage Loans Held for Sale | | | 12,825 | | | 5.40 | % | | | 9,781 | | | 4.93 | % |
Investment Securities (TE)(1)(2) | | | 578,080 | | | 4.43 | % | | | 561,277 | | | 4.29 | % |
Other Earning Assets | | | 48,213 | | | 3.64 | % | | | 37,658 | | | 2.03 | % |
| | |
|
|
| | | | |
|
|
| | | |
Total Earning Assets | | | 2,460,357 | | | 5.51 | % | | | 2,106,573 | | | 5.15 | % |
Allowance for Loan Losses | | | (24,484 | ) | | | | | | (19,319 | ) | | | |
Nonearning Assets | | | 260,856 | | | | | | | 215,259 | | | | |
| | |
|
|
| | | | |
|
|
| | | |
Total Assets | | $ | 2,696,729 | | | | | | $ | 2,302,513 | | | | |
| | |
|
|
| | | | |
|
|
| | | |
| | | | |
LIABILITIES AND SHAREHOLDERS' EQUITY | | | | | | | | | | | | | | |
Interest-bearing Liabilities: | | | | | | | | | | | | | | |
Deposits: | | | | | | | | | | | | | | |
NOW Accounts | | $ | 559,124 | | | 1.60 | % | | $ | 506,120 | | | 1.04 | % |
Savings and Money Market Accounts | | | 465,805 | | | 1.20 | % | | | 401,771 | | | 0.77 | % |
Certificates of Deposit | | | 720,692 | | | 2.80 | % | | | 624,640 | | | 2.38 | % |
| | |
|
|
| | | | |
|
|
| | | |
Total Interest-bearing Deposits | | | 1,745,621 | | | 1.99 | % | | | 1,532,531 | | | 1.51 | % |
Short-term Borrowings | | | 165,522 | | | 2.37 | % | | | 177,116 | | | 1.24 | % |
Long-term Debt | | | 242,364 | | | 4.19 | % | | | 162,328 | | | 4.27 | % |
| | |
|
|
| | | | |
|
|
| | | |
Total Interest-bearing Liabilities | | | 2,153,507 | | | 2.27 | % | | | 1,871,975 | | | 1.73 | % |
Noninterest-bearing Demand Deposits | | | 266,059 | | | | | | | 203,839 | | | | |
Noninterest-bearing Liabilities | | | 15,343 | | | | | | | 18,497 | | | | |
| | |
|
|
| | | | |
|
|
| | | |
Total Liabilities | | | 2,434,909 | | | | | | | 2,094,311 | | | | |
Shareholders' Equity | | | 261,820 | | | | | | | 208,202 | | | | |
| | |
|
|
| | | | |
|
|
| | | |
Total Liabilities and Shareholders' Equity | | $ | 2,696,729 | | | | | | $ | 2,302,513 | | | | |
| | |
|
|
| | | | |
|
|
| | | |
| | | | |
Net Earning Assets | | $ | 306,850 | | | | | | $ | 234,598 | | | | |
Net Interest Spread | | $ | 62,865 | | | 3.24 | % | | $ | 55,316 | | | 3.42 | % |
Tax-equivalent Benefit | | | 2,421 | | | 0.13 | % | | | 2,082 | | | 0.13 | % |
Net Interest Income (TE) / Net Interest Margin (TE)(1) | | $ | 65,286 | | | 3.52 | % | | $ | 57,398 | | | 3.62 | % |
| (1) | Fully taxable equivalent (TE) calculations include the tax benefit associated with related income sources that are tax-exempt using a marginal tax rate of 35%. |
| (2) | Balances exclude unrealized gain or loss on securities available for sale and impact of trade date accounting. |
IBERIABANK CORPORATION
RECONCILIATION TABLE
(dollars in thousands)
| | | | | | | | | | | | |
| | | For The Three Months Ended
| |
| | | 9/30/2005
| | | 6/30/2005
| | | 9/30/2004
| |
Net Interest Income | | $ | 21,042 | | | $ | 21,275 | | | $ | 19,231 | |
Effect of Tax Benefit on Interest Income | | | 828 | | | | 805 | | | | 719 | |
| | |
|
|
| |
|
|
| |
|
|
|
Net Interest Income (TE)(1) | | | 21,870 | | | | 22,080 | | | | 19,950 | |
| | |
|
|
| |
|
|
| |
|
|
|
Noninterest Income | | | 6,640 | | | | 6,745 | | | | 5,857 | |
Effect of Tax Benefit on Noninterest Income | | | 275 | | | | 272 | | | | 239 | |
| | |
|
|
| |
|
|
| |
|
|
|
Noninterest Income (TE)(1) | | | 6,915 | | | | 7,017 | | | | 6,096 | |
| | |
|
|
| |
|
|
| |
|
|
|
Total Revenues (TE)(1) | | $ | 28,785 | | | $ | 29,097 | | | $ | 26,046 | |
| | |
|
|
| |
|
|
| |
|
|
|
| | | |
Total Noninterest Expense | | $ | 15,773 | | | $ | 16,047 | | | $ | 14,229 | |
Less Intangible Amortization Expense | | | (307 | ) | | | (316 | ) | | | (222 | ) |
| | |
|
|
| |
|
|
| |
|
|
|
Tangible Operating Expense(2) | | $ | 15,466 | | | $ | 15,731 | | | $ | 14,007 | |
| | |
|
|
| |
|
|
| |
|
|
|
| | | |
Return on Average Equity | | | (2.00 | %) | | | 12.22 | % | | | 13.34 | % |
Effect of Intangibles(2) | | | (0.74 | %) | | | 8.04 | % | | | 6.89 | % |
| | |
|
|
| |
|
|
| |
|
|
|
Return on Average Tangible Equity(2) | | | (2.74 | %) | | | 20.26 | % | | | 20.23 | % |
| | |
|
|
| |
|
|
| |
|
|
|
| | | |
Efficiency Ratio | | | 57.0 | % | | | 57.3 | % | | | 56.7 | % |
Effect of Tax Benefit Related to Tax Exempt Income | | | (2.2 | %) | | | (2.1 | %) | | | (2.1 | %) |
| | |
|
|
| |
|
|
| |
|
|
|
Efficiency Ratio (TE)(1) | | | 54.8 | % | | | 55.2 | % | | | 54.6 | % |
Effect of Amortization of Intangibles | | | (1.1 | %) | | | (1.1 | %) | | | (0.8 | %) |
| | |
|
|
| |
|
|
| |
|
|
|
Tangible Efficiency Ratio (TE)(1)(2) | | | 53.7 | % | | | 54.1 | % | | | 53.8 | % |
| (1) | Fully taxable equivalent (TE) calculations include the tax benefit associated with related income sources that are tax-exempt using a marginal tax rate of 35%. |
| (2) | Tangible calculations eliminate the effect of goodwill and acquisition related intangible assets and the corresponding amortization expense on a tax-effected basis where applicable. |

IBERIABANK CorporationTM
Supplemental Presentation
3rd Quarter Earnings Release
10/20/05

Forward Looking Statements
Safe Harbor
Statements contained in this presentation which are not historical facts and which pertain to future operating results of IBERIABANK Corporation and its subsidiaries constitute “forward-looking statements” within the meaning of the Private Securities Litigation Reform Act of 1995. These forward-looking statements involve significant risks and uncertainties. Actual results may differ materially from the results discussed in these forward-looking statements. Factors that might cause such a difference include, but are not limited to, those discussed in the Company’s periodic filings with the SEC.
Outline
Hurricanes And Tropical Storms Credit Impact Of Hurricanes Katrina And Rita Branch Impact And Branch Expansion Initiative Summary Financial Impact

Hurricanes And Tropical Storms
Other Landfalls
Georgia
South Carolina
Louisiana
Mississippi
Alabama
Texas
North Carolina
Florida
Atlantic Ocean
0% 5% 10% 15% 20% 25% 30%
% Of Hurricane/Tropical Storm Impacts 1994-2005
Source: Management using www.wunderground.com maps; Some storms had multiple state impacts

Credit Impact Of Hurricanes Katrina and Rita

Combined Hurricane Winds
IBERIABANK NEWBranches Hurricane Winds (mph)
IBERIABANK Branches
0 – 40
41 – 50
51 – 60
61 – 70
71 – 80
81 – 90
91 – 100
101 – 110
111 – 120
121 – 155
Source: LAGIC
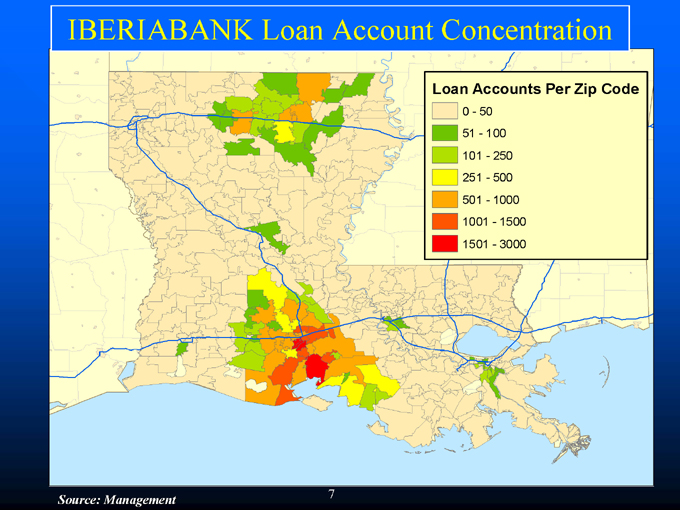
IBERIABANK Loan Account Concentration
Loan Accounts Per Zip Code
0—50
51—100 101—250 251—500 501—1000 1001—1500 1501—3000
Source: Management

IBERIABANK Loan Account Concentration-New Orleans Area
Flood Area
Loan Accounts Per Zip Code
0—50
51—100 101—250 251—500 501—1000 1001 -1500
1501 -3000
Source: Management
Flood Estimate Source: FEMA
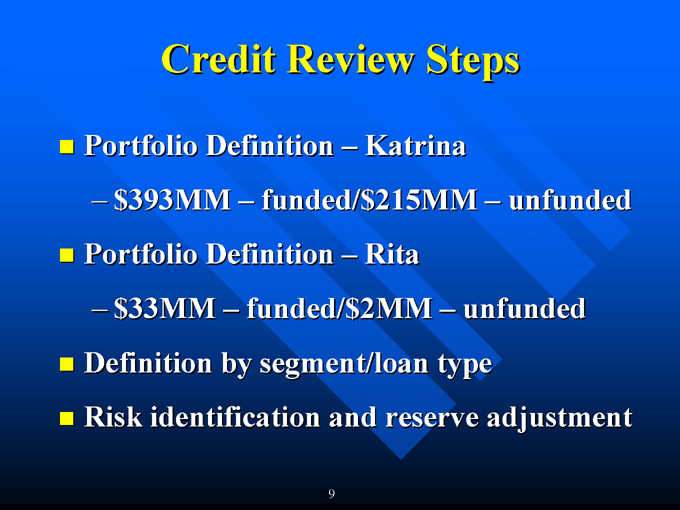
Credit Review Steps
Portfolio Definition – Katrina $393MM – funded/$215MM – unfunded
Portfolio Definition – Rita $33MM – funded/$2MM – unfunded
Definition by segment/loan type
Risk identification and reserve adjustment
9
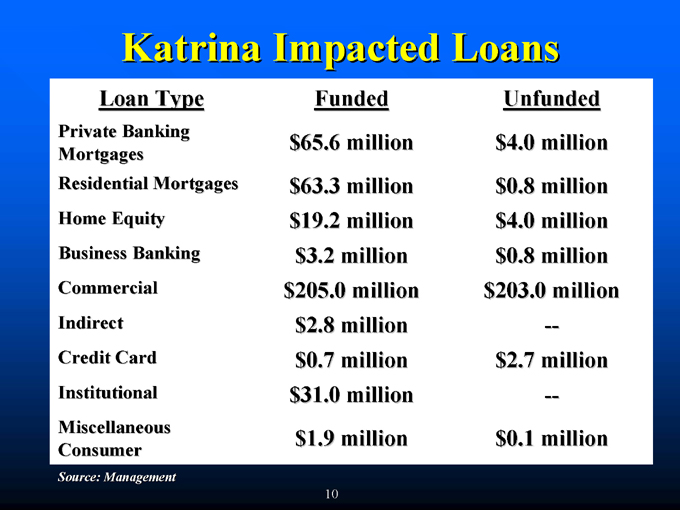
Katrina Impacted Loans
Loan | | Type Funded Unfunded |
Private | | Banking Mortgages $65.6 million $4.0 million |
Residential | | Mortgages $63.3 million $0.8 million |
Home | | Equity $19.2 million $4.0 million |
Business | | Banking $3.2 million $0.8 million |
Commercial | | $205.0 million $203.0 million |
Credit | | Card $0.7 million $2.7 million |
Institutional | | $31.0 million — |
Miscellaneous | | Consumer $1.9 million $0.1 million |
Source: Management
10

Rita Impacted Loans
Loan | | Type Funded Unfunded |
Residential | | Mortgages $4.3 million — |
Home | | Equity $6.3 million $0.9 million |
Commercial/Small | | Business $8.2 million $0.9 million |
Institutional | | $0.4 million — |
Miscellaneous | | Consumer $2.1 million $0.3 million |
Source: Management
11

Example—New Orleans Private Banking Mortgage Portfolio
Private Banking Mortgages—$65.2MM
Issues/Actions
Identification of “at risk” loans
Categorization of loans as follows:
Low risk – no concerns or dependence on New Orleans Medium risk – concerns about primary or secondary sources of repayment – adequate liquidity High risk – concerns about primary and secondary sources of repayment due to flood– limited liquidity
Setting of Reserve
12
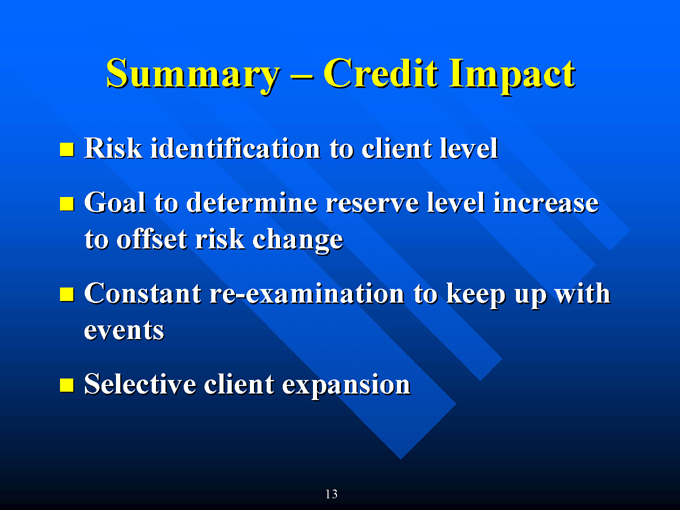
Summary – Credit Impact
Risk identification to client level Goal to determine reserve level increase to offset risk change Constant re-examination to keep up with events Selective client expansion
13

Branch Impact And Branch Expansion Initiative
14

Hurricane Katrina Winds
IBERIABANK NEWBRANCHES Hurricane (mph)
IBERIABANK Branches
0 – 40
41 – 50
51 – 60
61 – 70
71 – 80
81 – 90
91 – 100
101 – 110
111 – 120
121 – 155
Source: LAGIC
15

Hurricane Rita Winds
IBERIABANK New Branches Hurricane Rita Winds (mph)
IBERIABANK Branches
20 – 30
30 – 40
40 – 50
50 – 60
60 – 80
80 – 90
90 – 100
100 – 110
110 – 120
120 – 125
Source: LAGIC
16
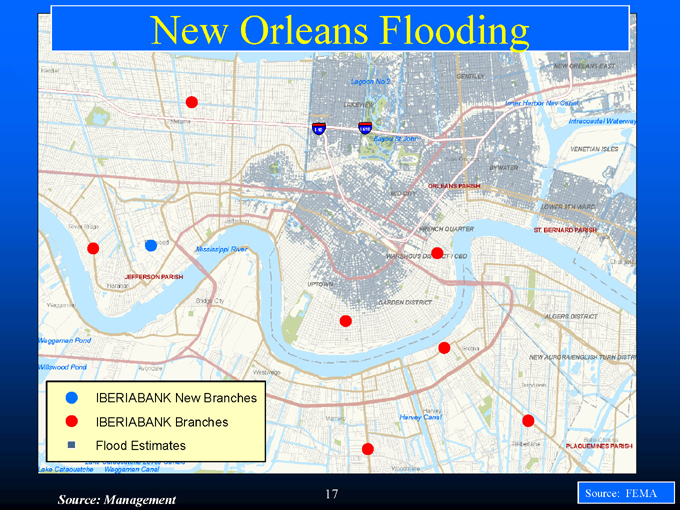
New Orleans Flooding
IBERIABANK New Branches IBERIABANK Branches Flood Estimates
Source: Management
Source: FEMA
17
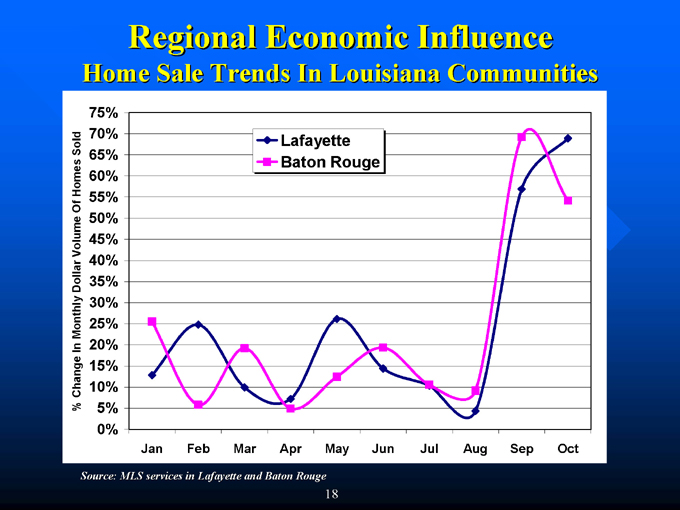
Regional Economic Influence
Home Sale Trends In Louisiana Communities
% Change In Monthly Dollar Volumes of Homes Sold
75% 70% 65% 60% 55% 50% 45% 40% 35% 30% 25% 20% 15% 10% 5% 0%
Lafayette Baton Rouge
Jan Feb Mar Apr May Jun Jul Aug Sep Oct
Source: MLS services in Lafayette and Baton Rouge
18

Summary Financial Impact
19
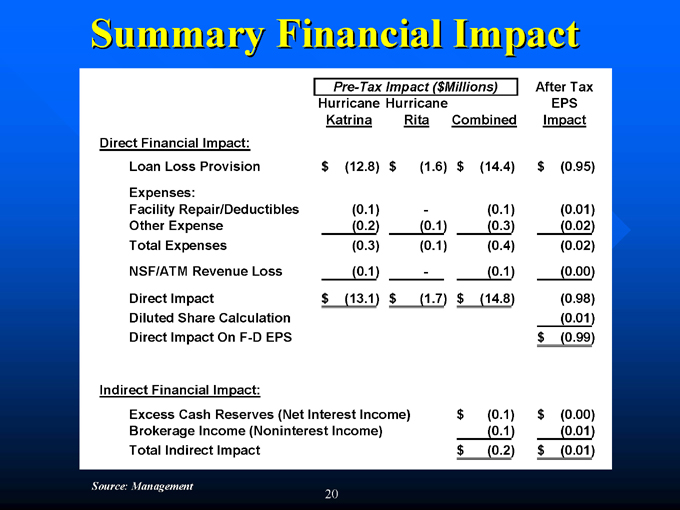
Summary Financial Impact
Pre-Tax | | Impact ($Millions) After Tax |
Hurricane | | Katrina Hurricane Rita Combined EPS Impact |
Loan | | Loss Provision $(12.8) $(1.6) $(14.4) $(0.95) |
Facility | | Repair/Deductibles (0.1)—(0.1) (0.01) |
Other | | Expense (0.2) (0.1) (0.3) (0.02) |
Total | | Expenses (0.3) (0.1) (0.4) (0.02) |
NSF/ATM | | Revenue Loss (0.1)—(0.1) (0.00) |
Direct | | Impact $(13.1) $(1.7) $(14.8) (0.98) |
Diluted | | Share Calculation (0.01) |
Direct | | Impact On F-D EPS $(0.99) |
Indirect | | Financial Impact: |
Excess | | Cash Reserves (Net Interest Income) $(0.1) $(0.00) |
Brokerage | | Income (Noninterest Income) (0.1) (0.01) |
Total | | Indirect Impact $(0.2) $(0.01) |
Source: Management
20
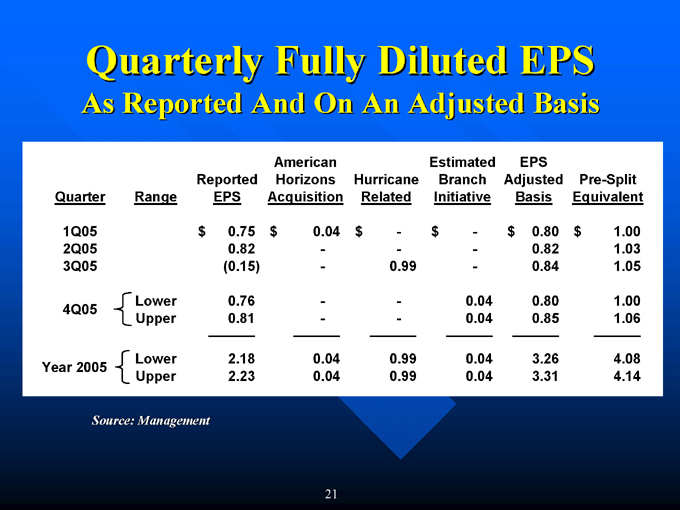
Quarterly Fully Diluted EPS
As Reported And On An Adjusted Basis
Quarter Range Reported EPS American Horizons Acquisition Hurricane Related Estimated Branch Initiative EPS Adjusted Basis Pre-Split Equivalent
1Q05 | | $0.75 $0.04 $- $- $0.80 $1.00 |
3Q05 | | (0.15)—0.99—0.84 1.05 |
4Q05 | | Lower 0.76—- 0.04 0.80 1.00 |
Upper | | 0.81—- 0.04 0.85 1.06 |
Year | | 2005 Lower 2.18 0.04 0.99 0.04 3.26 4.08 |
Upper | | 2.23 0.04 0.99 0.04 3.31 4.14 |
Source: Management
21