4Q08 Earnings Conference Call Supplemental Materials Exhibit 99.2 |
2 Forward Looking Statements Forward Looking Statements Safe Harbor Safe Harbor Statements Statements contained contained in in this this presentation presentation which which are are not not historical historical facts facts and and which which pertain pertain to to future future operating operating results results of of IBERIABANK IBERIABANK Corporation Corporation and and its its subsidiaries subsidiaries constitute constitute “forward-looking “forward-looking statements” statements” within within the the meaning meaning of of the the Private Private Securities Securities Litigation Litigation Reform Reform Act Act of of 1995. 1995. These These forward-looking forward-looking statements statements involve involve significant significant risks risks and and uncertainties. uncertainties. Actual Actual results results may may differ differ materially materially from from the the results results discussed discussed in in these these forward-looking forward-looking statements. statements. Factors Factors that that might might cause cause such such a a difference difference include, include, but but are are not not limited limited to, to, those those discussed discussed in in the the Company’s Company’s periodic periodic filings filings with with the the SEC. SEC. |
3 Introductory Comments |
4 Introductory Comments Introductory Comments Summary Summary Favorable Balance Sheet Composition Favorable Balance Sheet Composition Continued Good Asset Quality Continued Good Asset Quality Net Interest Margin Improvement Net Interest Margin Improvement Favorable Interest Rate And Credit Risk Positioning Favorable Interest Rate And Credit Risk Positioning ANB Acquisition Completed And Assimilated ANB Acquisition Completed And Assimilated Memphis Will Be A Very Good Growth Engine Memphis Will Be A Very Good Growth Engine We Avoided What Ails The Banking Industry We Avoided What Ails The Banking Industry Unique And Well Positioned For Future Opportunities Unique And Well Positioned For Future Opportunities |
5 Introductory Comments Introductory Comments Distinctively Different Distinctively Different One Of Oldest Banks In LA - One Of Oldest Banks In LA - March 12, 1887 March 12, 1887 No Toxic Investments No Toxic Investments Positioned Well For Mortgage Refinancing Wave Positioned Well For Mortgage Refinancing Wave Stable And Countercyclical Markets Stable And Countercyclical Markets Strong Tailwinds – Strong Tailwinds – Energy And Katrina Rebuild Energy And Katrina Rebuild Favorable Competitive Dynamics Favorable Competitive Dynamics Extremely Small C&D Exposure Extremely Small C&D Exposure Take Corrective Action Early & Aggressively Take Corrective Action Early & Aggressively Extremely Well Capitalized Extremely Well Capitalized Growth Opportunities Growth Opportunities |
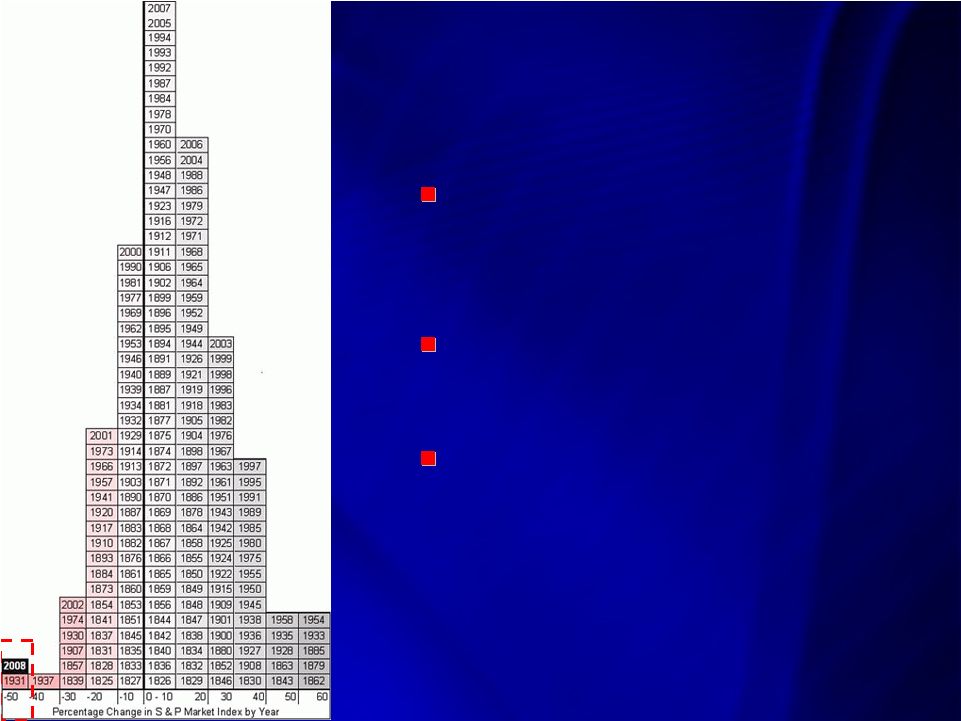
6 Introductory Comments Introductory Comments Annual Stock Market Returns Annual Stock Market Returns The Second Worst Stock The Second Worst Stock Market Performance In The Market Performance In The Last 183 Years Last 183 Years Average Mutual Fund Average Mutual Fund Declined 30% Declined 30% Financial Sector Was One Of Financial Sector Was One Of The Worst Performing Sectors The Worst Performing Sectors In 2008, With Average In 2008, With Average Financial Fund Down 42% Financial Fund Down 42% Sources: Washington Post, January 11, 2009 and Sources: Washington Post, January 11, 2009 and http://bigpicture.typepad.com/comments/markets/index.html |
7 Introductory Comments Introductory Comments 2008 Returns By Index 2008 Returns By Index +2.7% -60% -50% -40% -30% -20% -10% 0% 10% % Change In Price In 2008 Banks $5B-$10B Assets Small Cap Banks Banks $1B-$5B Assets NASDAQ Banks Southwest Banks Banks Pink Sheets S&P Diversified Banks Banks <$250M Assets SNL Midwest Banks Banks $500M-$1B Assets Micro Cap Banks Banks <$500M Assets Banks $250M-$500M Assets SNL All Banks Large Cap Banks Mid-Atlantic Banks Banks >$10B Assets S&P Regional Banks NYSE Banks Mid Cap Banks S&P Banks KBW Banks New England Banks Southeast Banks IBERIABANK Corporation SNL Reported Indexes Source: SNL Through December 31, 2008 Source: SNL Through December 31, 2008 |
8 Introductory Comments Introductory Comments Annual Change In Stock Price Annual Change In Stock Price 58% 27% 45% 47% 13% -4% 16% -21% 3% -15% -60% -40% -20% 0% 20% 40% 60% 2000 2001 2002 2003 2004 2005 2006 2007 2008 YTD 2009 IBKC S&P Banks NASDAQ Banks DJIA S&P 500 Russell 2000 Source: Stifel Nicolaus through January 16, 2009 |
9 Asset Quality |
10 Asset Quality Asset Quality Recent Developments Recent Developments $3.6 Million Loan Fraud In Northeast Arkansas At Pulaski $3.6 Million Loan Fraud In Northeast Arkansas At Pulaski • • Arkansas Client With 15-Year Relationship Arkansas Client With 15-Year Relationship • • Fraudulent Collateral Documentation Was The Main Issue Fraudulent Collateral Documentation Was The Main Issue • • Confirmed Fraud In January 2009 Confirmed Fraud In January 2009 • • Isolated Event And Not Indicative Of Broader Portfolio Concerns Isolated Event And Not Indicative Of Broader Portfolio Concerns • • Charge-Off Of $3.6 Million Or $0.17 EPS Impact In 4Q08 Charge-Off Of $3.6 Million Or $0.17 EPS Impact In 4Q08 $9.2 Million Commercial Past Due At IBERIABANK $9.2 Million Commercial Past Due At IBERIABANK • • Business In Liquidation Mode Business In Liquidation Mode • • $0.6 Million Revolving Line Of Credit Secured By Receivables $0.6 Million Revolving Line Of Credit Secured By Receivables • • Term Loans Totaling $8.6 Million On Four Aircraft Term Loans Totaling $8.6 Million On Four Aircraft • • Primary Guarantor Deposited $3.2 Million In Escrow At The Company To Primary Guarantor Deposited $3.2 Million In Escrow At The Company To Cover Shortfalls As Aircraft Are Sold Cover Shortfalls As Aircraft Are Sold • • Loans Will Remain Past Due Until Aircraft Are Sold Loans Will Remain Past Due Until Aircraft Are Sold • • Any Loss On These Credits Is Expected To Be Immaterial Any Loss On These Credits Is Expected To Be Immaterial |
11 Asset Quality Asset Quality Loan Portfolio Mix $000s % of CRE % Loans C&D-Pulaski 27,951 $ 2% 1% C&D-IBERIABANK 168,070 12% 5% CRE-Owner Occupied 650,695 46% 17% CRE-Non-Owner Occupied 562,596 40% 15% Total Commercial RE 1,409,312 $ 100% 38% Loan Portfolio Composition Business 21% All Other Loans 4% Residential 13% Indirect Automobile 7% Other Consumer 2% Automobile 1% Home Equity 13% Commercial RE 38% Credit Card 1% |
12 Asset Quality Asset Quality Pulaski Pulaski Builder Builder Exposure Exposure # Of Loans $ Funded % Of Line Average Funded Committed Committed %Total Funded $ Funded Builder Loans Memphis Area 10,946 $ 10,963 $ 53 39.2% 100% 206,523 $ North Mississippi 2,763 2,763 13 9.9% 100% 212,567 $ Little Rock 6,482 6,600 29 23.2% 98% 223,530 $ Northeast Ark. 1,640 1,753 14 5.9% 94% 117,160 $ Northwest Ark. 6,119 6,148 54 21.9% 100% 113,319 $ Total 27,951 $ 28,227 $ 163 100.0% 99% 171,478 $ On 9/30/08 34,562 $ 35,256 $ 209 100.0% 98% 165,368 $ By Dollar Amount ($000) Development Lot House <100% House 100% Development House <100% House 100% Loans Loans Complete Complete Loans Lots Complete Complete Memphis Area 2,063 $ 2,878 $ - $ 6,005 $ 1 71 0 39 North Mississippi - 143 - 2,621 0 3 0 12 Little Rock 2,273 331 81 3,796 1 21 1 19 Northeast Ark. - 820 154 666 0 16 2 4 Northwest Ark. - 1,213 125 4,781 0 24 1 31 Total 4,336 $ 5,384 $ 360 $ 17,870 $ 2 135 4 105 On 9/30/08 4,326 $ 5,913 $ 1,421 $ 22,902 $ 2 156 10 140 % Of Total - 12/31/08 16% 19% 1% 64% 1% 55% 2% 43% % Of Total - 9/30/08 13% 17% 4% 66% 1% 51% 3% 45% By Dollar Amount ($000) Number % Balance Funded Loans Discounts & % Discounts & Balance Current 30- 59 60- 89 > 90 Nonaccrual Reserves Nonaccrual Reserves Builder Loans Memphis Area 10,946 $ 3,661 $ 2,203 $ - $ - $ 5,082 $ 1,323 $ 46.4% 12.09% North Mississippi 2,763 - - - - 2,763 108 100.0% 3.92% Little Rock 6,482 6,299 - - - 183 157 2.8% 2.42% Northeast Ark. 1,640 797 - - - 844 151 51.4% 9.21% Northwest Ark. 6,119 4,492 152 - - 1,475 690 24.1% 11.27% Total 27,951 $ 15,249 $ 2,355 $ - $ - $ 10,347 $ 2,429 $ 37.0% 8.69% On 9/30/08 34,562 $ 17,917 $ 765 $ 898 $ 1,547 $ 13,435 $ 2,913 $ 38.9% 8.43% By Dollar Amount ($000) # Of Days Past Due |
13 Asset Quality Asset Quality 4Q08 Compared To Prior Quarters ($thousands) 1Q08 2Q08 3Q08 4Q08 1Q08 2Q08 3Q08 4Q08 1Q08 2Q08 3Q08 4Q08 Nonaccruals 4,408 $ 6,295 $ 5,784 $ 6,487 $ 29,698 $ 24,534 $ 20,297 $ 21,337 $ 34,107 $ 30,829 $ 26,081 $ 27,825 $ OREO & Foreclosed 2,164 850 959 2,167 7,560 8,862 11,485 14,146 9,724 9,712 12,444 16,312 90+ Days Past Due 1,437 867 1,567 1,309 2,394 501 3,329 1,172 3,831 1,367 4,895 2,481 Nonperforming Assets 8,009 $ 8,012 $ 8,309 $ 9,962 $ 39,652 $ 33,897 $ 35,111 $ 36,655 $ 47,662 $ 41,908 $ 43,420 $ 46,618 $ NPAs/Assets 0.22% 0.22% 0.22% 0.26% 2.73% 2.12% 2.23% 2.42% 0.93% 0.79% 0.81% 0.83% NPAs/(Loans + OREO) 0.30% 0.29% 0.29% 0.34% 5.03% 4.10% 4.13% 4.28% 1.39% 1.18% 1.16% 1.24% LLR/Loans 0.92% 0.92% 0.91% 0.92% 1.89% 1.81% 1.67% 1.68% 1.14% 1.12% 1.09% 1.09% Net Charge-Offs/Loans 0.10% 0.04% 0.03% 0.11% 0.58% 0.35% 1.02% 1.93% 0.21% 0.11% 0.26% 0.53% Past Dues: 30-89 Days Past Due 9,604 $ 7,842 $ 6,329 $ 18,810 $ 9,725 $ 8,722 $ 7,525 $ 12,050 $ 19,329 $ 16,564 $ 13,854 $ 30,860 $ 90+ days Past Due 1,437 867 1,567 1,309 2,394 501 3,329 1,172 3,831 1,367 4,895 2,481 Nonaccual Loans 4,408 6,295 5,784 6,487 29,698 24,534 20,297 21,337 34,107 30,829 26,081 27,825 Total 30+ Past Dues 15,449 $ 15,004 $ 13,679 $ 26,606 $ 41,817 $ 33,756 $ 31,151 $ 34,560 $ 57,267 $ 48,760 $ 44,830 $ 61,166 $ % Loans 0.58% 0.55% 0.49% 0.92% 4.99% 3.88% 3.71% 4.10% 1.69% 1.38% 1.24% 1.63% Loan Mix: Commercial 55.7% 54.2% 55.5% 57.6% 65.3% 65.8% 61.8% 60.4% 57.1% 56.2% 57.0% 58.3% Consumer 13.9% 14.5% 14.5% 14.0% 22.8% 22.8% 24.0% 23.7% 16.3% 16.7% 16.7% 16.2% Mortgage 19.0% 18.1% 16.9% 15.9% 7.2% 6.6% 7.7% 8.7% 16.6% 15.8% 14.8% 14.3% Business Banking 2.3% 4.1% 3.7% 3.3% 1.2% 1.1% 2.2% 2.7% 2.1% 3.4% 3.3% 3.1% Indirect 9.1% 9.1% 9.4% 9.2% 0.0% 0.0% 0.0% 0.0% 7.0% 7.0% 7.2% 7.1% Credit Cards 0.0% 0.0% 0.0% 0.0% 3.5% 3.7% 4.3% 4.5% 0.9% 0.9% 1.0% 1.0% Total Loans 100.0% 100.0% 100.0% 100.0% 100.0% 100.0% 100.0% 100.0% 100.0% 100.0% 100.0% 100.0% IBERIABANK Pulaski IBERIABANK Corporation |
14 Asset Quality Asset Quality Trends – Trends – Entity NPAs & Past Dues Entity NPAs & Past Dues (Dollars in $000s) 3Q07 4Q07 1Q08 2Q08 3Q08 Q408 $Chg 9/30/07 12/31/07 3/31/08 6/30/08 9/30/08 12/31/08 Last Qtr. Nonaccrual Louisiana 2,994 $ 3,545 $ 4,408 $ 6,295 $ 5,784 $ 6,487 $ 703 $ Pulaski 13,197 32,562 29,698 24,534 20,297 21,337 1,040 Consolidated 16,191 $ 36,107 $ 34,107 $ 30,829 $ 26,081 $ 27,825 $ 1,744 $ - OREO & Foreclosed Assets Louisiana 1,937 $ 1,688 $ 2,164 $ 850 $ 959 $ 2,167 $ 1,208 $ Pulaski 4,796 7,726 7,560 8,862 11,485 14,146 2,661 Consolidated 6,733 $ 9,414 $ 9,724 $ 9,712 $ 12,444 $ 16,312 $ 3,868 $ - Accruing 90+ Days Past Due Louisiana 1,067 $ 1,684 $ 1,437 $ 867 $ 1,567 $ 1,309 $ (258) $ Pulaski 4,046 971 2,394 501 3,329 1,172 (2,157) Consolidated 5,113 $ 2,655 $ 3,831 $ 1,367 $ 4,895 $ 2,481 $ (2,414) $ - Total NPAs Louisiana 5,998 $ 6,917 $ 8,009 $ 8,012 $ 8,309 $ 9,963 $ 1,654 $ Pulaski 22,039 41,258 39,653 33,896 35,111 36,655 1,544 Consolidated 28,037 $ 48,176 $ 47,662 $ 41,908 $ 43,420 $ 46,618 $ 3,198 $ NPAs / Total Assets Louisiana 0.17% 0.19% 0.22% 0.22% 0.22% 0.26% Pulaski 1.61% 3.13% 2.73% 2.12% 2.23% 2.42% Consolidated 0.58% 0.98% 0.93% 0.79% 0.81% 0.83% 30- 89 Days Past Due Louisiana 6,197 $ 10,042 $ 9,604 $ 7,842 $ 6,329 $ 18,810 $ 12,481 $ Pulaski 9,030 8,202 9,725 8,722 7,525 12,050 4,525 Consolidated 15,227 $ 18,244 $ 19,329 $ 16,564 $ 13,854 $ 30,860 $ 17,007 $ 30- 89 Days PDs / Loans Louisiana 0.25% 0.38% 0.36% 0.29% 0.23% 0.65% Pulaski 1.05% 0.97% 1.25% 1.01% 0.90% 1.43% Consolidated 0.46% 0.53% 0.56% 0.47% 0.38% 0.82% |
15 Asset Quality Asset Quality Trends – Entity LLR & Net COs Entity LLR & Net COs (Dollars in $000s) 3Q07 4Q07 1Q08 2Q08 3Q08 Q408 $Chg 9/30/07 12/31/07 3/31/08 6/30/08 9/30/08 12/31/08 Last Qtr. Loan Loss Reserve* Louisiana 23,669 $ 24,417 $ 24,434 $ 24,962 $ 25,528 $ 26,671 $ 1,143 $ Pulaski 12,044 13,868 14,769 14,791 14,022 14,201 179 Consolidated 35,713 $ 38,285 $ 39,203 $ 39,753 $ 39,551 $ 40,872 $ 1,321 $ LLR / Total Loans Louisiana 0.95% 0.93% 0.92% 0.92% 0.91% 0.92% Pulaski 1.47% 1.72% 1.89% 1.81% 1.67% 1.68% Consolidated 1.08% 1.12% 1.14% 1.12% 1.09% 1.09% Net Charge-Offs Louisiana 230 $ 230 $ 678 $ 283 $ 183 $ 801 $ 618 $ Pulaski 190 178 1,100 702 2,150 4,084 1,934 Consolidated 420 $ 408 $ 1,778 $ 985 $ 2,333 $ 4,885 $ 2,552 $ Net COs/Avg Loans Louisiana 0.04% 0.12% 0.10% 0.04% 0.03% 0.11% Pulaski 0.09% 0.14% 0.58% 0.35% 1.02% 1.93% Consolidated 0.05% 0.12% 0.21% 0.11% 0.26% 0.53% LLR Coverage Of NPAs Louisiana 395% 353% 305% 312% 307% 268% Pulaski 55% 34% 37% 44% 40% 39% Consolidated 127% 79% 82% 95% 91% 88% * Does not include loan discounts associated with acquisitions. |
16 Asset Quality Asset Quality Loan Mix And 30 Days+ Past Due (Dollars in $000s) 3Q07 4Q07 1Q08 2Q08 3Q08 Q408 9/30/07 12/31/07 3/31/08 6/30/08 9/30/08 12/31/08 % of Outstandings Commercial 55.3% 56.7% 57.1% 56.2% 57.0% 58.3% Mortgage 17.6% 16.8% 16.6% 15.8% 14.8% 14.3% Consumer 16.4% 16.0% 16.3% 16.7% 16.7% 16.2% Indirect 7.3% 7.0% 7.0% 7.0% 7.2% 7.1% Business Banking 1.8% 1.8% 2.1% 3.4% 3.3% 3.1% Credit Cards 1.6% 1.7% 0.9% 0.9% 1.0% 1.0% Total Loans 100.0% 100.0% 100.0% 100.0% 100.0% 100.0% Past Due 30+ Days* Commercial 1.21% 1.95% 2.00% 1.60% 1.31% 1.91% Mortgage 0.82% 1.06% 0.90% 0.95% 1.00% 0.97% Consumer 1.39% 1.74% 1.66% 1.45% 1.43% 1.55% Indirect 0.66% 1.21% 0.97% 0.75% 0.89% 1.08% Business Banking 0.04% 0.11% 1.30% 0.75% 0.77% 1.10% Credit Cards 0.94% 0.82% 1.44% 1.02% 1.15% 1.55% Total Loans 1.10% 1.66% 1.69% 1.38% 1.24% 1.63% Louisiana 0.41% 0.59% 0.59% 0.55% 0.49% 0.91% Pulaski 3.04% 4.93% 4.99% 3.88% 3.71% 4.10% Consolidated 1.10% 1.66% 1.69% 1.38% 1.24% 1.63% * Includes nonaccruing loans |
17 Asset Quality Asset Quality Legacy – Classified Assets Classified Assets Note: Classified Assets Include Substandard, Doubtful and Loss Note: Classified Assets Include Substandard, Doubtful and Loss $- $5,000 $10,000 $15,000 $20,000 $25,000 $30,000 Classified Assets - Legacy IBERIABANK Loss Doubtful Substandard |
18 Asset Quality Asset Quality Consolidated – Classified Assets Classified Assets Note: Classified Assets Include Substandard, Doubtful and Loss Note: Classified Assets Include Substandard, Doubtful and Loss $- $5,000 $10,000 $15,000 $20,000 $25,000 $30,000 $35,000 $40,000 $45,000 $50,000 Classified Assets - IBERIABANK & Pulaski Pulaski IBERIABANK |
19 Asset Quality Asset Quality Loan Loss Reserve Loan Loss Reserve Louisiana Franchise – Louisiana Franchise – Improved Situation Improved Situation • • 85% Of LA Loan Portfolio Is In South Louisiana 85% Of LA Loan Portfolio Is In South Louisiana • • South Louisiana Credits Performing Very Well South Louisiana Credits Performing Very Well • • Classified Assets And NPAs Remain Strong Classified Assets And NPAs Remain Strong • • $1.9 Million Loan Loss Provision In 4Q08 (3Q08 = $0.7 Million) $1.9 Million Loan Loss Provision In 4Q08 (3Q08 = $0.7 Million) Pulaski Franchise – Pulaski Franchise – Mixed Situation Mixed Situation • • Most Of Loan Portfolio Is In Very Good Shape Most Of Loan Portfolio Is In Very Good Shape • • Construction Portfolio Improving Construction Portfolio Improving • • Aggressively Addressing Potential Problems Aggressively Addressing Potential Problems • • $4.3 Million Loan Loss Provision in 4Q08 (3Q08 = $1.4 Million) $4.3 Million Loan Loss Provision in 4Q08 (3Q08 = $1.4 Million) $4.9 Million In Net $4.9 Million In Net Charge-Offs In Charge-Offs In 4Q08 (0.53% 4Q08 (0.53% Loans) Loans) 4Q07 1Q08 2Q08 3Q08 4Q08 Net Charge-Offs 1,029 $ 1,778 $ 985 $ 2,333 $ 4,885 $ Loan Growth 1,375 (63) 1,302 968 1,256 Change In Asset Quality 1,198 980 (750) (1,171) 65 Loan Loss Provision 3,602 $ 2,695 $ 1,537 $ 2,131 $ 6,206 $ Net Charge-Offs/Avg. Loans 0.12% 0.22% 0.11% 0.26% 0.53% Loan Loss Reserve/Loans 1.12% 1.14% 1.12% 1.09% 1.09% |
20 Asset Quality Asset Quality C&D Loans C&D Loans Compared To Compared To Peers Peers Source: SNL, using most recent quarterly information Source: SNL, using most recent quarterly information 5% 14% 16% 17% 17% 18% 23% 32% 37% 40% 0% 5% 10% 15% 20% 25% 30% 35% 40% IBKC SFNC CCBG TRMK HBHC BXS WTNY SBCF OZRK UCBI Construction & Land Development Loans / Total Loans (Most Recent Quarter Information) 0% 0% 0% 1% 2% 3% 3% 4% 9% 10% 0.0% 1.0% 2.0% 3.0% 4.0% 5.0% 6.0% 7.0% 8.0% 9.0% 10.0% 11.0% BXS OZRK UCBI SFNC HBHC WTNY CCBG TRMK SBCF IBKC C&D Nonaccruals / Total C&D Loans (Most Recent Quarter Information) One Of The Lowest One Of The Lowest Levels Of C&D Loan Levels Of C&D Loan Exposure Compared Exposure Compared To Peers To Peers One Of The Highest One Of The Highest Levels Of C&D Levels Of C&D Nonaccrual Loans Nonaccrual Loans Addressing C&D Addressing C&D Exposure Assertively Exposure Assertively |
21 Asset Quality Asset Quality Commercial Real Estate Portfolio Commercial Real Estate Portfolio Note: Note: Includes Includes commercial commercial construction construction and and land land development development loans loans IBERIABANK Pulaski Bank TOTAL Non-Owner Occupied Current 478.6 $ 176.9 $ 655.4 $ Past Due 0.8 7.4 8.2 Nonaccrual 0.7 15.0 15.6 Total 480.0 $ 199.3 $ 679.3 $ % Nonaccrual 0.14% 7.52% 2.30% Owner Occupied Current 585.8 $ 137.1 $ 722.9 $ Past Due 3.4 0.6 4.0 Nonaccrual 1.8 1.3 3.1 Total 591.0 $ 139.1 $ 730.1 $ % Nonaccrual 0.30% 0.96% 0.43% Total CRE 1,071.0 $ 338.3 $ 1,409.3 $ % Nonaccrual 0.23% 4.83% 1.33% Last Qtr (9/30/08) 0.27% 4.73% 1.36% Non-Owner Occup/Tier 1 Cap. 146% 148% 107% |
22 Asset Quality Asset Quality Commercial Portfolio Composition Commercial Portfolio Composition 0% 1% 1% 1% 2% 2% 3% 3% 3% 4% 4% 4% 5% 6% 6% 6% 7% 7% 8% 10% 17% 0% 2% 4% 6% 8% 10% 12% 14% 16% 18% % Of Commercial Loan Portfolio At 12/31/08 Communications Education Storage Religious Wholesalers Transport Households Agriculture Retail Manufacturing Real Estate-Other Energy Hospitality Governmental Heavy/Civil Construction Construction Financial/Insurance Other RE-Owner Occupied Medical RE-Non-Owner Occupied Note: Note: Includes Includes commercial commercial construction construction and and land land development development loans loans |
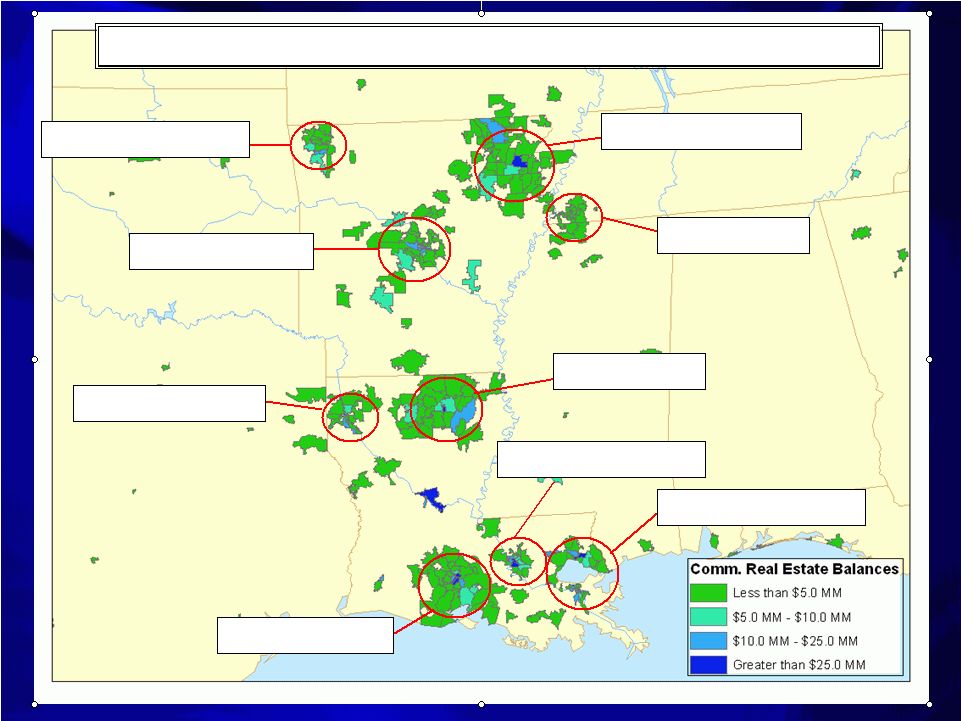
Commercial Real Estate Portfolio – Balances By Zip Code Acadiana 17% Baton Rouge 11% New Orleans 19% Monroe 6% Shreveport 6% Little Rock 11% NW Arkansas 3% Memphis 2% NE Arkansas 6% |
Commercial C&I (Non- Real Estate) Portfolio – Balances By Zip Code Acadiana 9% Baton Rouge 13% New Orleans 13% Monroe 8% Shreveport 5% Little Rock 6% NW Arkansas 3% Memphis 6% NE Arkansas 6% |
25 Consumer Loan Portfolio |
26 Consumer Portfolio Consumer Portfolio By Product – Score Distribution Score Distribution Note: Excludes Credit Cards Note: Excludes Credit Cards Volume Score Volume Score Volume Score HELOC 113 $ 738 23 $ 734 136 $ 738 Home Equity Loans 208 724 145 726 353 725 Unsecured Lines 14 729 2 727 15 729 Unsecured 20 687 8 680 27 685 Other Secured 42 696 13 682 54 693 Indirect Auto 250 715 - - 250 715 Total 645 $ 720 190 $ 722 835 $ 721 Consumer Portfolio - Product Type And Average Score IBERIABANK Pulaski IBERIABANK Corp Score Intervals HELOC Home Equity Loans Unsecured Lines Unsecured Other Secured Indirect Auto 800 + 10% 12% 4% 5% 13% 13% 750 - 799 35% 35% 26% 23% 21% 29% 700 - 749 25% 24% 22% 23% 21% 21% 650 - 699 16% 14% 24% 22% 16% 17% 600 - 649 6% 7% 10% 12% 11% 9% 550 - 599 3% 4% 6% 6% 7% 5% 500 - 549 2% 3% 4% 5% 6% 4% 450 - 499 0% 1% 1% 2% 2% 1% 400 - 449 0% 0% 0% 0% 0% 0% Other 1% 1% 3% 1% 3% 1% Total 100% 100% 100% 100% 100% 100% Avg. Score 738 725 729 685 693 715 Consumer Portfolio - Score Distribution By Product |
27 Consumer Portfolio Consumer Portfolio Score Distribution Improvement Note: Excludes Credit Cards Note: Excludes Credit Cards Score Tier 1st Qtr 2008 % 4th Qtr 2008 % Change Score Tier 1st Qtr 2008 % 4th Qtr 2008 % Change 800 > 12.2% 10.9% -1.3% 800 > 10.9% 12.8% 1.9% 750 - 799 29.9% 32.6% 2.7% 750 - 799 24.1% 28.7% 4.6% 700 - 749 22.5% 24.2% 1.7% 700 - 749 19.2% 21.4% 2.2% 650 - 699 16.3% 15.4% -0.9% 650 - 699 18.0% 17.3% -0.7% 600 - 649 8.1% 7.6% -0.5% 600 - 649 10.3% 9.0% -1.3% 550 - 599 4.9% 4.1% -0.8% 550 - 599 5.2% 4.8% -0.5% 500 - 549 3.2% 3.1% -0.1% 500 - 549 4.1% 3.6% -0.5% 450 - 499 1.1% 0.8% -0.3% 450 - 499 1.3% 1.0% -0.3% 400 - 449 0.1% 0.0% -0.1% 400 - 449 0.1% 0.0% -0.1% No Update 0.4% 0.3% -0.1% No Update 0.2% 0.2% 0.0% No Score 0.7% 0.5% -0.2% No Score 6.0% 0.6% -5.4% Lack of Hist 0.2% 0.1% -0.1% Lack of Hist 0.4% 0.3% -0.1% Deceased 0.2% 0.3% 0.1% Deceased 0.2% 0.0% -0.2% Total 100% 100% Total 100% 100% Consumer Loan Portfolio Comparison Indirect Portfolio Comparison |
28 Consumer Consumer Portfolio Portfolio Past Dues Past Dues By Product By Product Generally Generally Good Good Quality, But Quality, But Recent Recent Softness Softness Late In 4Q08 Late In 4Q08 6/30/07 9/30/07 12/31/07 3/31/08 6/30/08 9/30/08 12/31/08 Home Equity Lines of Credit 30 to 59 Days Past Due 0.28% 0.63% 0.44% 1.10% 0.34% 0.31% 0.24% 60 to 89 Days Past Due 0.07% 0.09% 0.15% 0.04% 0.02% 0.15% 0.13% Over 90 Days Past Due 0.00% 0.02% 0.00% 0.10% 0.06% 0.09% 0.11% Total 30+ Days Past Due 0.36% 0.75% 0.59% 1.24% 0.43% 0.55% 0.48% Net Charge-Offs -0.10% 0.31% 0.12% 0.00% 0.02% 0.01% 0.15% Home Equity Term Loans 30 to 59 Days Past Due 0.76% 0.71% 0.96% 0.85% 0.35% 0.25% 0.80% 60 to 89 Days Past Due 0.25% 0.15% 0.17% 0.07% 0.30% 0.18% 0.09% Over 90 Days Past Due 0.29% 0.22% 0.13% 0.10% 0.11% 0.30% 0.05% Total 30+ Days Past Due 1.29% 1.08% 1.26% 1.03% 0.77% 0.73% 0.93% Net Charge-Offs -0.01% 0.06% -0.02% 0.04% 0.01% 0.04% 0.21% Indirect Auto Loans 30 to 59 Days Past Due 0.33% 0.35% 0.71% 0.49% 0.34% 0.45% 0.59% 60 to 89 Days Past Due 0.05% 0.05% 0.15% 0.08% 0.04% 0.12% 0.18% Over 90 Days Past Due 0.01% 0.04% 0.12% 0.03% 0.07% 0.07% 0.05% Non Accrual 0.28% 0.23% 0.27% 0.39% 0.33% 0.28% 0.82% Total 30+ Days PD + NAs 0.67% 0.68% 1.24% 1.00% 0.78% 0.92% 0.92% Net Charge-Offs 0.25% 0.14% 0.18% 0.45% 0.14% 0.20% Credit Card Loans 30 to 59 Days Past Due 0.21% 0.42% 0.36% 0.49% 0.35% 0.49% 0.49% 60 to 89 Days Past Due 0.14% 0.16% 0.10% 0.26% 0.30% 0.21% 0.45% Over 90 Days Past Due 0.35% 0.36% 0.36% 0.68% 0.37% 0.45% 0.61% Total 30+ Days Past Due 0.70% 0.94% 0.82% 1.44% 1.02% 1.15% 1.55% Net Charge-Offs 0.99% 1.81% 0.71% 2.95% 1.57% 1.05% 1.34% Other Consumer Loans 30 to 59 Days Past Due 0.90% 1.10% 1.53% 1.63% 1.20% 0.76% 1.20% 60 to 89 Days Past Due 0.25% 0.15% 0.36% 0.29% 0.90% 0.46% 0.35% Over 90 Days Past Due 0.25% 0.04% 0.15% 0.14% 0.10% 0.53% 0.82% Total 30+ Days Past Due 1.40% 1.29% 2.04% 2.05% 2.20% 1.74% 2.37% Net Charge-Offs 0.27% 0.82% 0.69% 0.66% 1.36% 1.55% 1.88% Consumer Portfolio - Quarterly Credit Statistics Loans Past Due As % Of Product Loans |
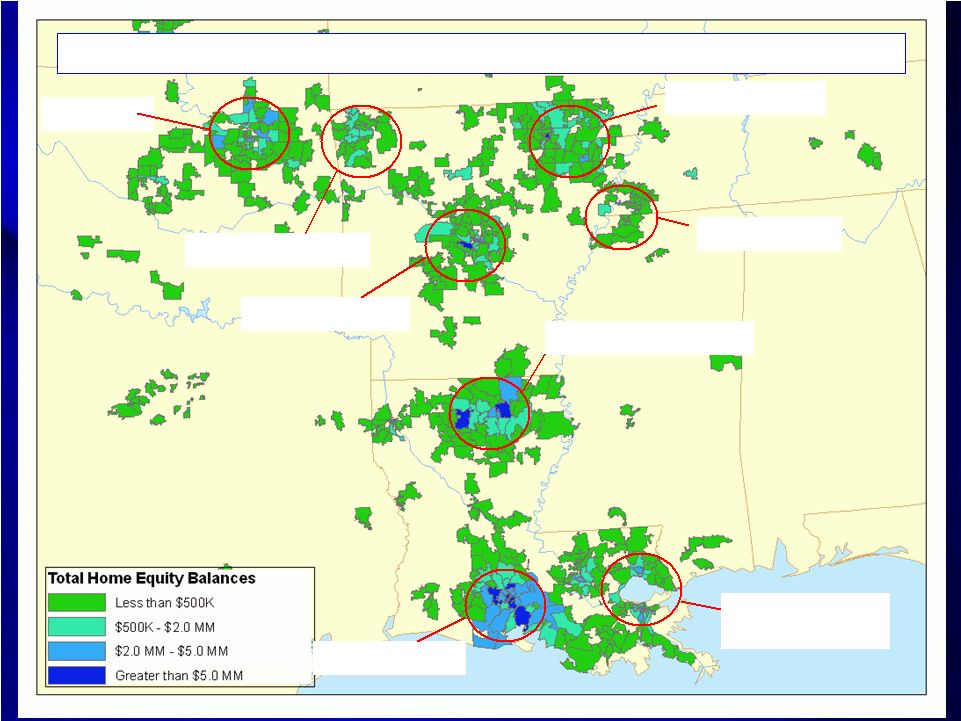
HOME EQUITY PORTFOLIO - BALANCES BY ZIP CODE Acadiana 38% Monroe/ Ruston 9% New Orleans/ Northshore 8% Little Rock 10% Jonesboro 9% Tulsa 10% NW Arkansas 2% Memphis 1% Home Home Equity Equity Portfolio: Portfolio: LA = 61% LA = 61% AR = 23% AR = 23% OK = 12% OK = 12% |
30 Consumer Portfolio Consumer Portfolio By Product – Origination Mix Origination Mix 15% 32% 31% 22% 0% 10% 20% 30% 40% 50% 60% 70% 80% 90% 100% 1Q06 2Q06 3Q06 4Q06 1Q07 2Q07 3Q07 4Q07 1Q08 2Q08 3Q08 4Q08 Quarter Originations - Product Total % Home Equity 2nd Home Equity 1st HELOC 2nd HELOC 1st |
31 Consumer Portfolio Consumer Portfolio By Product – Loan-To-Values Loan-To-Values Loan-to-Values At Time Of Origination 42% 78% 60% 77% 68% 0% 10% 20% 30% 40% 50% 60% 70% 80% 90% 100% 1Q06 2Q06 3Q06 4Q06 1Q07 2Q07 3Q07 4Q07 1Q08 2Q08 3Q08 4Q08 Quarter HELOC 1st HELOC 2nd Home Equity 1st Home Equity 2nd Total |
32 INDIRECT AUTOMOBILE PORTFOLIO - BALANCES BY ZIP CODE Acadiana 79% Monroe/ Ruston 5% 98% Of 98% Of Indirect Indirect Automobile Automobile Portfolio Is Portfolio Is In Louisiana In Louisiana |
33 Consumer Portfolio Consumer Portfolio Indirect – 30+ Days Past Dues 30+ Days Past Dues Note: Excludes Nonaccruing Note: Excludes Nonaccruing Nonaccruing Loans Loans Indirect Auto Portfolio Loans Past Due 30 Days Or More 0.84% 0.00% 0.20% 0.40% 0.60% 0.80% 1.00% 1.20% 1.40% 1.60% 1.80% 2.00% 2.20% 2.40% Month |
34 Consumer Portfolio Consumer Portfolio Indirect – Net Charge-Offs Net Charge-Offs Indirect Auto Portfolio Annualized Net Charge-Offs As % Of Loans 0.44% 0.00% 0.20% 0.60% 0.80% 1.00% 1.20% 1.40% 1.60% 1.80% 2.00% 2.20% 2.40% Month 0.40% |
35 Financial Overview |
36 Financial Overview Financial Overview Favorable Balance Sheet Growth Favorable Balance Sheet Growth 4Q08 Results 4Q08 Results • • Loans +$115mm, +3% Loans +$115mm, +3% • • Deposits +$61mm +2% Deposits +$61mm +2% • • Loan/Deposits = 94% Loan/Deposits = 94% • • Equity = +$216mm, +42% Equity = +$216mm, +42% • • Equity/Assets = 13.15% Equity/Assets = 13.15% • • Tier 1 Leverage = 11.27% Tier 1 Leverage = 11.27% • • Div Payout = 68%* Div Payout = 68%* • • ROA = 0.62%* ROA = 0.62%* • • ROE = 5.80%* ROE = 5.80%* • • ROTE = 11.74%* ROTE = 11.74%* • • Efficiency Ratio = 70.5%* Efficiency Ratio = 70.5%* • • Tang Eff. Ratio = 67.4%* Tang Eff. Ratio = 67.4%* • • BV/Share = $40.53 BV/Share = $40.53 • • Tang BV/Share = $24.20 Tang BV/Share = $24.20 * Includes fraud loss incurred * Includes fraud loss incurred during the quarter during the quarter $600 $1,000 $1,400 $1,800 $2,200 $2,600 $3,000 $3,400 $3,800 $4,200 Loans Deposits Quarterly Averages Annual Average Balances -1% 20% 17 % 17% 22% 34% 1% 3% 7% 4% 13% 15% 12% 17 % 46% 56% 36% 42% 55% 46% 52% 43% 45% 52% 23% 15% 15% 12% 16% 11% 9% 14% |
37 Financial Overview Financial Overview Mortgage Quarterly Revenues Closed $924mm Closed $924mm In 2008, Down In 2008, Down 6% Vs. $987mm 6% Vs. $987mm In 2007 In 2007 In 4Q08 Closed In 4Q08 Closed $183mm (-16% $183mm (-16% Vs. 3Q08) Vs. 3Q08) In 4Q08 Sold In 4Q08 Sold $189mm (-22% $189mm (-22% Vs. 3Q08) Vs. 3Q08) 4Q08 Vs. 3Q08: 4Q08 Vs. 3Q08: 14% Decrease In 14% Decrease In Mtg. Revenues Mtg. Revenues $140mm Locked $140mm Locked Pipeline 1/9/09 Pipeline 1/9/09 $- $0.5 $1.0 $1.5 $2.0 $2.5 $3.0 $3.5 $4.0 $4.5 $5.0 $5.5 $6.0 $6.5 2003 2004 2005 2006 2007 2008 Mortgage Gains On Sale Of Loans 1st Qtr 2nd Qtr 3rd Qtr 4th Qtr ** ** Assumes Pulaski's acquisition of IBERIABANK Mortgage beginning in February 2007 |
38 Financial Overview Financial Overview Title Insurance Qtrly Revenues Revenues Completed And Completed And Integrated Integrated United Title-LA United Title-LA In April 2007 In April 2007 And American And American Abstract In Abstract In March 2008 March 2008 2008: Revenues 2008: Revenues Of $19mm (+22% Of $19mm (+22% Vs. 2007) Vs. 2007) 4Q08: $3.8mm In 4Q08: $3.8mm In Revenues (-27% Revenues (-27% Vs. 3Q08) Vs. 3Q08) Significant Significant Order Count Order Count Growth Recently Growth Recently $- $0.5 $1.0 $1.5 $2.0 $2.5 $3.0 $3.5 $4.0 $4.5 $5.0 $5.5 $6.0 $6.5 2003 2004 2005 2006 2007 2008 Title Insurance Revenues 1st Qtr 2nd Qtr 3rd Qtr 4th Qtr * * Includes United Title in April 2007 ** ** Includes American Abstract in March 2008 |
39 Financial Overview Financial Overview Fixed Asset Gain In 4Q08 Source: Christies Source: Christies 7-Foot Tall Statue Carved In 7-Foot Tall Statue Carved In 127 A.D. Commemorates 127 A.D. Commemorates Roman Emperor Hadrian Roman Emperor Hadrian (117 to 138 A.D.) (117 to 138 A.D.) Company Purchased The Company Purchased The Statue In 1957 For $3,000 Statue In 1957 For $3,000 Net Proceeds To The Net Proceeds To The Company From The Sale Company From The Sale Was $0.7 Million Was $0.7 Million $0.1 Million Loss On Other $0.1 Million Loss On Other Fixed Assets In 4Q08 Fixed Assets In 4Q08 |
40 Financial Overview Financial Overview Quarterly Repricing Schedule Quarterly Repricing Schedule Excess Cash Remains To Be Deployed Excess Cash Remains To Be Deployed Favorable Deposit Repricing Opportunities Favorable Deposit Repricing Opportunities Short-Term Funding Costs Have Declined Short-Term Funding Costs Have Declined 1Q09 2Q09 3Q09 4Q09 1Q10 Cash Equivalents 215.8 $ - $ - $ - $ - $ 0.25% 0.00% 0.00% 0.00% 0.00% Investments 121.5 $ 118.5 $ 100.4 $ 75.8 $ 51.8 $ 3.46% 4.96% 4.98% 4.94% 4.80% Loans 1,632.7 $ 222.0 $ 179.6 $ 149.2 $ 124.8 $ 4.12% 6.35% 6.44% 6.56% 6.60% Time Deposits 492.0 $ 264.6 $ 237.2 $ 189.6 $ 75.0 $ 3.31% 2.91% 3.46% 2.94% 3.69% Borrowed Funds 391.8 $ 6.4 $ 58.0 $ 31.5 $ 20.2 $ 2.60% 4.33% 4.79% 5.37% 5.38% |
41 Base Blue Forward Change In: -200 bp -100 bp Case +100 bp +200 bp Chip Curve Net Interest Income -7% -4% 0% 5% 9% 0% 2% Economic Value of Equity -21% -8% 0% 6% 9% -- -- Financial Overview Financial Overview Interest Rate Simulations Interest Rate Simulations Source: Bancware Source: Bancware Bancware model, as of December 31, 2008 model, as of December 31, 2008 As Rates Have Fallen, Become More Asset Sensitive As Rates Have Fallen, Become More Asset Sensitive Degree Is A Function Of The Reaction Of Competitors To Degree Is A Function Of The Reaction Of Competitors To Changes In Deposit Pricing Changes In Deposit Pricing Forward Curve Has A Positive Impact Over 12 Months Forward Curve Has A Positive Impact Over 12 Months |
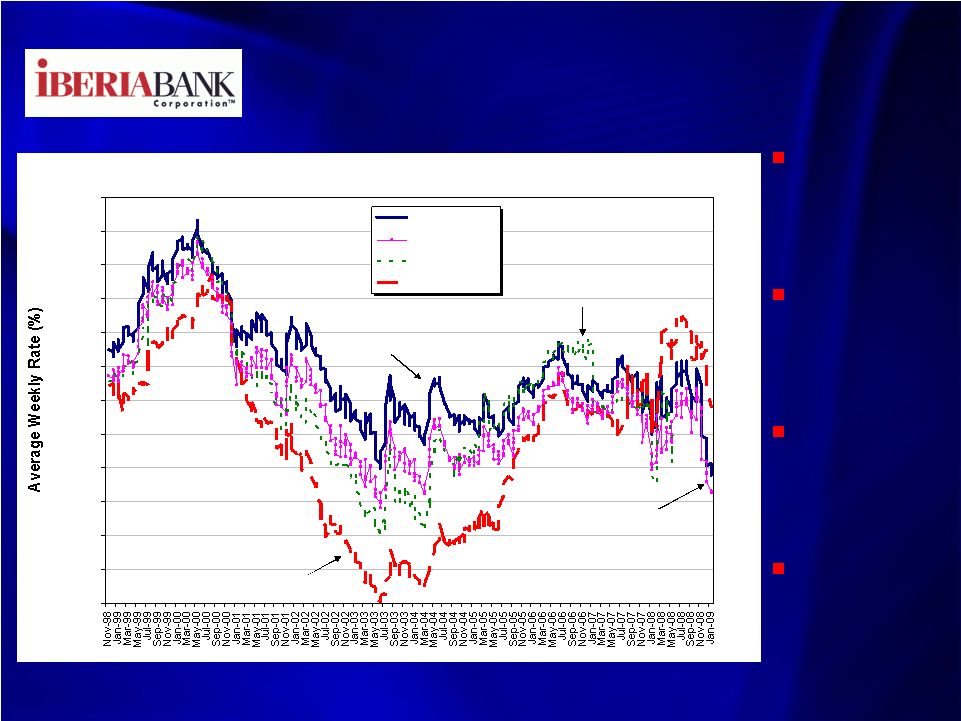
42 Financial Overview Financial Overview Trends - Mortgage Interest Rates Mortgage Interest Rates Source: Bloomberg Source: Bloomberg Mortgage Mortgage Rates Have Rates Have Converged Converged Since 2003 Since 2003 Substantial Substantial Drop In Drop In Conforming Conforming Rates Rates Blistering Blistering Refi Refi Activity Activity – – Greatest Greatest Since 2003 Since 2003 Spreads Spreads Have Have Widened As Widened As Well Well Mortgage Interest Rate Trend 4.89% 4.63% 5.89% 3.00% 3.50% 4.00% 4.50% 5.00% 5.50% 6.00% 6.50% 7.00% 7.50% 8.00% 8.50% 9.00% 30-year 15-year 5/1 ARM 1-Year ARM 30-Year Fixed 1-Year ARM 5/1 ARM 15-Year Fixed |
43 Financial Overview Financial Overview Trends – Jumbo Mortgage Rates Jumbo Mortgage Rates Source: Bloomberg Source: Bloomberg Subprime Mtg. Subprime Mtg. Market Gone Market Gone Alt-A Market Is Alt-A Market Is Stalled Stalled Jumbo Market Jumbo Market Spreads Are Spreads Are Very Wide Very Wide Shift From Shift From These These Products To Products To FHA/VA & FHA/VA & Conforming Conforming Half Of Our Half Of Our Production Is Production Is Now FHA/VA Now FHA/VA Weekly National 30-Year Mortgage Rates 5.32% 6.68% 5.25% 5.50% 5.75% 6.00% 6.25% 6.50% 6.75% 7.00% 7.25% 7.50% 7.75% 8.00% 8.25% 8.50% 8.75% Conforming Jumbo 136 bps |
44 Markets |
45 Markets Markets Memphis Opportunity Memphis Opportunity $28 $28 Billion Billion Deposit Deposit Memphis Memphis Market Market - - A A Unique Unique Growth Growth Opportunity Opportunity Large & Small Banks Have Experienced Difficulties Large & Small Banks Have Experienced Difficulties We Recently Recruited 7 New Team Members We Recently Recruited 7 New Team Members $28 Million Deposits And $73mm In Credit Commitments $28 Million Deposits And $73mm In Credit Commitments Source: FDIC For Memphis MSA At June 30, 2008 Source: FDIC For Memphis MSA At June 30, 2008 First Horizon 36.6% Regions 15.2% SunTrust 8.2% BancorpSouth 3.9% Bank of America 3.5% |
46 Markets - Markets - Branches Branches Branch Expansion Initiative Branch Expansion Initiative Period-End Loan And Deposit Volumes 13 Offices 13 Offices 4Q08 Loans 4Q08 Loans Of $142 mm Of $142 mm (+83% Over (+83% Over 1-Year) 1-Year) 4Q08 4Q08 Deposits Of Deposits Of $200 mm $200 mm (+113% (+113% Over 1- Over 1- Year) Year) Closed One Closed One Office Office (Prairieville) (Prairieville) $- $25 $50 $75 $100 $125 $150 $175 $200 $225 2Q05 4Q05 2Q06 4Q06 2Q07 4Q07 2Q08 4Q08 Deposits Loans |
47 Markets – Markets – Branches Branches Historical Office Optimization Historical Office Optimization Entered 3 New Markets Entered 3 New Markets Acquired 12 Offices (All) Acquired 12 Offices (All) Closed/Consolidated 18 Closed/Consolidated 18 Offices (All Types) Offices (All Types) Opened 10 New Bank Opened 10 New Bank Offices Offices Opened 7 Mortgage Opened 7 Mortgage Offices Offices Divested/Sold 1 Office Divested/Sold 1 Office 5 Office Realignments 5 Office Realignments Entered 13 New Markets Entered 13 New Markets Acquired 94 Offices (All) Acquired 94 Offices (All) Closed/Consolidated 23 Closed/Consolidated 23 Offices (All Types) Offices (All Types) Opened 10 New Bank Opened 10 New Bank Offices Offices Opened 7 Mortgage Opened 7 Mortgage Offices Offices Opened 1 Title Office Opened 1 Title Office 11 Office Realignments 11 Office Realignments 1999 Through 2005 1999 Through 2005 Since 2005 Since 2005 |
48 Markets – Markets – Local Economies Local Economies Oil & Gas Impact Oil & Gas Impact Source: Bloomberg Source: Bloomberg $5.59 $40.83 $- $2.00 $4.00 $6.00 $8.00 $10.00 $12.00 $14.00 $16.00 $- $20.00 $40.00 $60.00 $80.00 $100.00 $120.00 $140.00 $160.00 Natural Gas (Left Scale) Crude Oil (Right Scale) Natural Gas Crude Oil Natural Gas Average = $4.03 Crude Oil Average = $34.66 |
49 Markets – Markets – Local Economies Local Economies Unemployment – Vs. U.S. MSAs Vs. U.S. MSAs Source: U.S. Department of Labor, Bureau of Labor Statistics Source: U.S. Department of Labor, Bureau of Labor Statistics Markets We Markets We Serve Have Serve Have Fairly Low Fairly Low Unemploy- Unemploy- ment ment Levels Levels Many Of Our Many Of Our Markets Markets Have Also Have Also Improved In Improved In Ranking Ranking Ranking 369 U.S. MSAs November 2008 Unemployment Rates (Blue) Dashed Lines Indicate Nov 07, Feb 08 & Aug 08 - 1.0 2.0 3.0 4.0 5.0 6.0 7.0 8.0 9.0 10.0 11.0 12.0 13.0 14.0% 1 11 21 31 41 51 61 71 81 91 101 111 121 131 141 151 161 171 181 191 201 211 221 231 241 251 261 271 281 291 301 311 321 331 341 351 361 6.5% U.S. Avg = 6.1% #20 Houma, LA 3.6% #17 Lafayette, LA 3.5% #70 Baton Rouge, LA 4.8% #79 Alexandria, LA 4.9% #79 New Orleans, LA 4.9% #160 Shreveport, LA 5.9% #30 NW AR 3.9% #48 Little Rock, AR 4.4% #64 Jonesboro, AR 4.7% #244 Memphis, TN 6.9% Nov 07 Feb 08 #55 Lake Charles, LA 4.5% #123 Monroe, LA 5.5% Nov 08 Aug 08 |
50 Markets – Markets – Local Economies Local Economies Housing’s Share Of State GDP Source: NAHB; Figures represent 2005 levels as indicative of peak period US Average: 16.6% Arkansas: 12.4% Mississippi: 12.1% Louisiana: 9.4% 5.0% 10.0% 15.0% 20.0% 25.0% 30.0% Nevada Hawaii Florida Arizona California Maryland Colorado Idaho Montana Oregon New Jersey Virginia Washington New Vermont Rhode Island Utah Maine South Carolina Massachusett United States Illinois Minnesota New York Georgia North Carolina Wisconsin Michigan Connecticut Tennessee Pennsylvania Missouri New Mexico Ohio Indiana Alabama Kentucky Kansas Wyoming West Virginia Arkansas Iowa Oklahoma Mississippi Nebraska Texas Delaware South Dakota North Dakota District of Alaska Louisiana Housing Share Of State GDP Nationwide, Housing Peaked In 2005 Housing Was A Substantial Contributor To State Economic Growth--Now Working In Reverse Our Markets: Minimal Impact |
51 Markets – Markets – Local Economies Local Economies Freddie Mac – Freddie Mac – Regional Prices Regional Prices FHLMC, “National Home-Value Drop Accelerates FHLMC, “National Home-Value Drop Accelerates in Third Quarter”, December 1, 2008 in Third Quarter”, December 1, 2008 Last 5-Year Housing Price Last 12 Region States Included Change Months 3Q08 West South Central LA, AR, TX, OK 25.9% 0.5% 0.0% Middle Atlantic NY, NJ, PA 33.4% -2.2% -0.1% West North Central IA, KS, MN, MO, ND, NE, SD 12.7% -2.6% -0.5% East South Central TN, AL, MS, KY 23.6% -1.3% -1.1% New England CT, MA, ME, NH, RI, VT 13.9% -5.1% -1.1% East North Central IL, IN, MI, OH, WI 5.7% -3.9% -1.2% South Atlantic NC, SC, FL, GA, VA, MD, WV, DC, DE 27.6% -6.8% -2.1% Mountain AZ, CO, ID, MT, NM, NV, UT, WY 33.1% -7.6% -2.3% Pacific CA, OR, WA, HI, AK 18.0% -20.2% -5.4% United States 20.5% -7.2% -1.9% |
52 Markets – Markets – Local Economies Local Economies House Price Decline Probability House Price Decline Probability Local Housing Local Housing Prices Did Not Prices Did Not Escalate Escalate Rapidly, So Rapidly, So Little House Little House Price “Snap- Price “Snap- Back” Back” According To According To PMI, Our PMI, Our Markets Have Markets Have Some Of The Some Of The Lowest Lowest Probabilities Probabilities To Exhibit To Exhibit Housing Price Housing Price Declines Over Declines Over Next 2 Years Next 2 Years Source: PMI Economic Real Estate Trends, Winter 2009 Source: PMI Economic Real Estate Trends, Winter 2009 Ranking 381 U.S. MSAs PMI Housing Risk Index Probability That House Prices Will Be Lower In 2 Years 0 10 20 30 40 50 60 70 80 90 100 28.9 MSA Average = 28.9 Baton Rouge, LA 2.5 Alexandria, LA 1.3 New Orleans, LA 2.6 Lowest Ratings (<1.0): Houma, LA Jonesboro, AR, Lafayette, LA, Lake Charles, LA, Little Rock, AR, Monroe, LA, Shreveport, LA NW AR 4.3 Memphis, TN 2.1 |
53 Markets – Markets – Local Economies Local Economies Forbes – Forbes – Strongest Housing Mkts Strongest Housing Mkts McAllen, TX McAllen, TX Syracuse, NY Syracuse, NY Pittsburgh, PA Pittsburgh, PA Buffalo, NY Buffalo, NY El Paso, TX El Paso, TX Tulsa, OK (Mortgage) Tulsa, OK (Mortgage) Houston, TX Houston, TX Charleston, SC Charleston, SC Little Rock, AR Little Rock, AR Birmingham, AL Birmingham, AL Ft. Worth, TX Ft. Worth, TX New Orleans, LA New Orleans, LA Dallas, TX (Mortgage) Dallas, TX (Mortgage) Austin, TX Austin, TX Rochester, NY Rochester, NY San Antonio, TX San Antonio, TX Augusta, GA Augusta, GA Baton Rouge, LA Baton Rouge, LA Memphis, TN Memphis, TN Oklahoma City, OK Oklahoma City, OK Albany, NY Albany, NY Indianapolis, IN Indianapolis, IN Columbia, SC Columbia, SC Scranton, PA Scranton, PA Omaha, NE Omaha, NE Forbes, “America’s 25 Strongest Housing Markets, January 7, 2009: Forbes, “America’s 25 Strongest Housing Markets, January 7, 2009: |
54 Markets - Markets - Housing Housing Local – Local – Lafayette Home Inventory Lafayette Home Inventory Lafayette & Lafayette & Acadiana Acadiana Housing Housing Inventories Inventories Declined Declined Throughout Throughout 2008 2008 Remains Remains Half The Half The National National Average For Average For Housing Housing Supply Supply Source: Van Eaton & Romero and Bloomberg Source: Van Eaton & Romero and Bloomberg Months Supply Of Housing - U.S. Versus Lafayette & Acadiana Region 11.2 11.5 5.8 6.9 - 1 2 3 4 5 6 7 8 9 10 11 12 13 Sep 05 Mar 06 Dec 06 Feb 07 Jun 07 Sep 07 Oct 07 Nov 07 Dec 07 Feb 08 Mar 08 Jun 08 Sep 08 Oct 08 Nov 08 Dec 08 U.S. Average-Existing Homes U.S. Average-New Homes Lafayette-All Properties All Acadiana Parishes U.S. New Homes U.S. Existing Homes Acadiana Region Lafayette |
55 Summary Of IBKC Summary Of IBKC Industry Operating Environment--Challenging Industry Operating Environment--Challenging • • Housing Housing • • Credit Risk Credit Risk • • Interest Rate Risk Interest Rate Risk • • Operations Risk Operations Risk We Tend To Move “Ahead Of The Curve” We Tend To Move “Ahead Of The Curve” Focus On Long-Term Investments & Payback Focus On Long-Term Investments & Payback Organic And External Growth Organic And External Growth Both Expense Control And Revenue Growth Both Expense Control And Revenue Growth EPS/Stock Price Linkage - EPS/Stock Price Linkage - Shareholder Focus Shareholder Focus Favorable Risk/Return Compared To Peers Favorable Risk/Return Compared To Peers |