Exhibit 99.1

Once In A Blue Moon
Gulf South Bank Conference 2010

Forward Looking Statements Safe Harbor
Statements contained in this presentation which are not historical facts and which pertain to future operating results of IBERIABANK Corporation and its subsidiaries constitute “forward-looking statements” within the meaning of the Private Securities Litigation Reform Act of 1995. These forward-looking statements involve significant risks and uncertainties. Actual results may differ materially from the results discussed in these forward-looking statements. Factors that might cause such a difference include, but are not limited to, those discussed in the Company’s periodic filings with the SEC.

Company Overview
3
IBKC Overview
Summary
Headquartered In Lafayette, Louisiana
Since 1887 – 2nd Oldest & 2nd Largest LA-Based Bank $10.4 Billion in Assets Market Cap of Approximately $1.7 Billion Relatively Strong Asset Quality Measures Conservative and We Don’t Cut Corners Minimize Loan Concentrations Core Funded Asset Sensitive Large Fee-Based Businesses Well Versed FDIC-Assisted Transactions Operations in 12 States
IBKC Overview
A Few Recent Activities
First FDIC-Assisted Acquisition (ANB In 2Q08) $110 Million Common Stock Issued (4Q08)
Added Teams In Mobile, New Orleans & Houston (1Q09) First In U.S. To Pay Back TARP Preferred Stock (1Q09) Second in U.S. To Buy Back TARP Warrants (2Q09) Changed Thrift Sub. Name To IBERIABANK fsb (2Q09) Second FDIC Acquisition (CapitalSouth In 3Q09) Added Team In Birmingham (3Q09) $165 Million Common Stock Issued (3Q09) Third & Fourth FDIC Acquisitions (Orion/Century In 4Q09) $329 Million Common Stock Issued (1Q10) Conversions of CapitalSouth And Century (4Q09 & 2Q10)

Markets
6
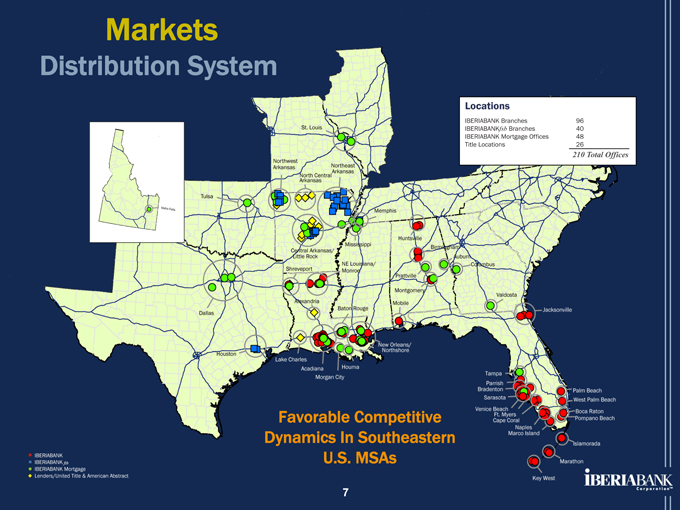
Markets
Distribution System
Locations
IBERIABANK Branches 96
IBERIABANKfsb Branches 40
IBERIABANK Mortgage Offices 48
Title Locations 26
210 Total Offices
Favorable Competitive Dynamics In Southeastern U.S. MSAs
7
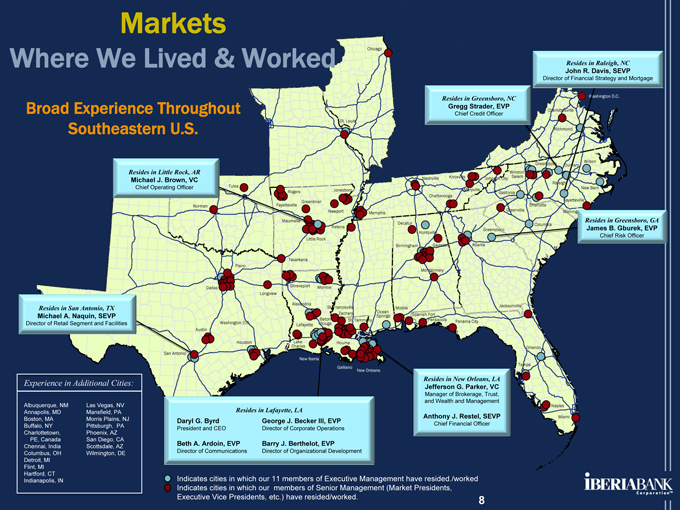
Markets
Where We Lived & Worked
Broad Experience Throughout Southeastern U.S.
Resides in Greensboro, NC
Gregg Strader, EVP
Chief Credit Officer
Resides in Raleigh, NC
John R. Davis, SEVP
Director of Financial Strategy and Mortgage
Resides in Little Rock, AR
Michael J. Brown, VC
Chief Operating Officer
Resides in San Antonio, TX
Michael A. Naquin, SEVP
Director of Retail Segment and Facilities
Resides in Greensboro, GA
James B. Gburek, EVP
Chief Risk Officer
Resides in Lafayette, LA
Daryl G. Byrd George J. Becker III, EVP
President and CEO Director of Corporate Operations
Beth A. Ardoin, EVP Barry J. Berthelot, EVP
Director of Communications Director of Organizational Development
Resides in New Orleans, LA
Jefferson G. Parker, VC
Manager of Brokerage, Trust, and Wealth and Management
Anthony J. Restel, SEVP
Chief Financial Officer
Experience in Additional Cities:
Albuquerque, NM Las Vegas, NV
Annapolis, MD Mansfield, PA
Boston, MA Morris Plains, NJ
Buffalo, NY Pittsburgh, PA
Charlottetown, Phoenix, AZ
PE, Canada San Diego, CA
Chennai, India Scottsdale, AZ
Columbus, OH Wilmington, DE
Detroit, MI
Flint, MI
Hartford, CT
Indianapolis, IN
Indicates cities in which our 11 members of Executive Management have resided./worked Indicates cities in which our members of Senior Management (Market Presidents, Executive Vice Presidents, etc.) have resided/worked. 8
Markets
MSA Unemployment Rates
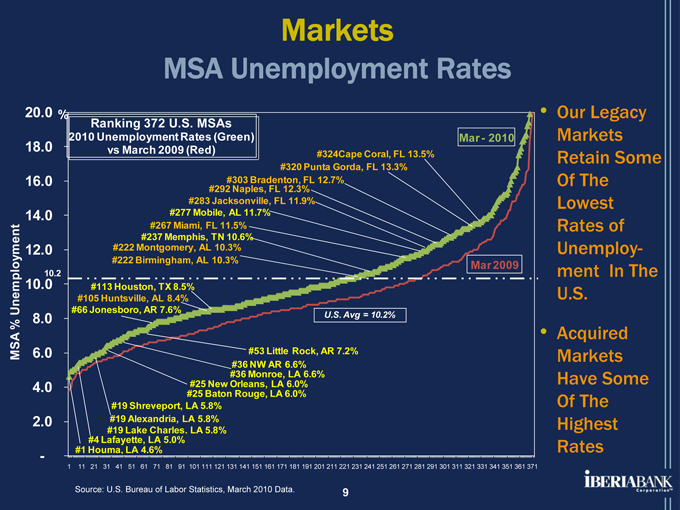
Ranking 372 U.S. MSAs 2010 Unemployment Rates (Green) vs March 2009 (Red)
20.0 % 18.0 16.0 14.0
12.0 10.0 10.2 8.0
6.0 4.0 2.0 -
MSA Unemployment%
#324Cape Coral, FL 13.5% #320 Punta Gorda, FL 13.3%
#292 #303 Naples, Bradenton, FL 12.3% FL 12.7% #283 Jacksonville, FL 11.9% #277 Mobile, AL 11.7% #267 Miami, FL 11.5% #237 Memphis, TN 10.6% #222 Montgomery, AL 10.3% #222 Birmingham, AL 10.3%
#113 Houston, TX 8.5% #105 Huntsville, AL 8.4% #66 Jonesboro, AR 7.6%
#53 Little Rock, AR 7.2% #36 NW AR 6.6% #36 Monroe, LA 6.6% #25 New Orleans, LA 6.0% #25 Baton Rouge, LA 6.0% #19 Shreveport, LA 5.8% #19 Alexandria, LA 5.8% #19 Lake Charles, LA 5.8%
#4 Lafayette, LA 5.0%
#1 Houma, LA 4.6%
U.S. Avg = 10.2%
Mar - 2010
Mar 2009
1 11 21 31 41 51 61 71 81 91 101 111 121 131 141 151 161 171 181 191 201 211 221 231 241 251 261 271 281 291 301 311 321 331 341 351 361 371
Our Legacy Markets Retain Some Of The Lowest Rates of Unemployment In The U.S.
Acquired Markets Have Some Of The Highest Rates
Source: U.S. Bureau of Labor Statistics, March 2010 Data. 9
Markets
Favorable And Diverse Growth
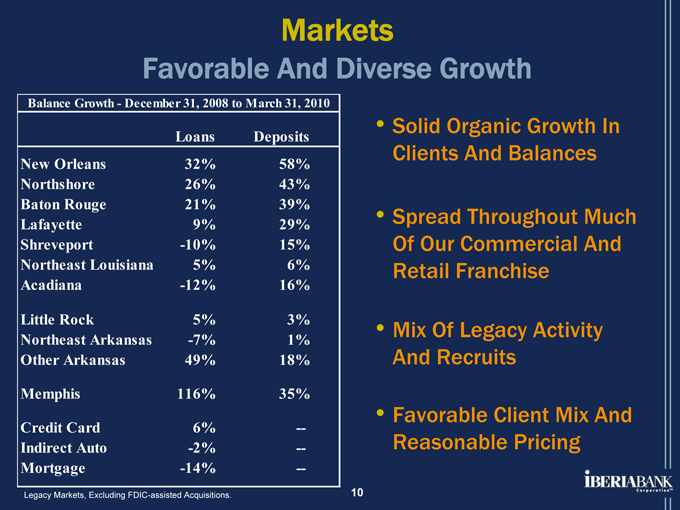
Balance Growth - December 31, 2008 to March 31, 2010
Loans Deposits
New Orleans 32% 58%
Northshore 26% 43%
Baton Rouge 21% 39%
Lafayette 9% 29%
Shreveport -10% 15%
Northeast Louisiana 5% 6%
Acadiana -12% 16%
Little Rock 5% 3%
Northeast Arkansas -7% 1%
Other Arkansas 49% 18%
Memphis 116% 35%
Credit Card 6% -
Indirect Auto -2% -
Mortgage -14% -
Solid Organic Growth In Clients And Balances
Spread Throughout Much Of Our Commercial And Retail Franchise
Mix Of Legacy Activity And Recruits
Favorable Client Mix And Reasonable Pricing
Legacy Markets, Excluding FDIC-assisted Acquisitions.
10
Markets
Organic Growth And Recruiting
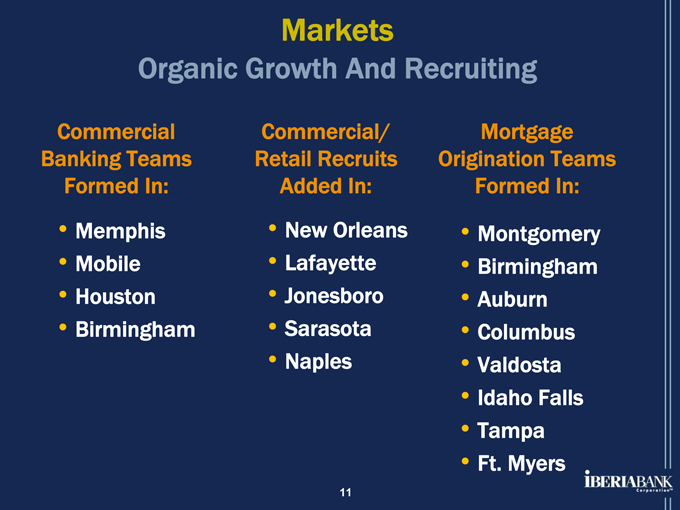
Commercial Banking Teams Formed In:
• Memphis
• Mobile
• Houston
• Birmingham
Commercial/ Retail Recruits Added In:
• New Orleans
• Lafayette
• Jonesboro
• Sarasota
• Naples
Mortgage Origination Teams Formed In:
• Montgomery
• Birmingham
• Auburn
• Columbus
• Valdosta
• Idaho Falls
• Tampa
• Ft. Myers
11

Asset Quality
12
Asset Quality
Loan Portfolio Diversification
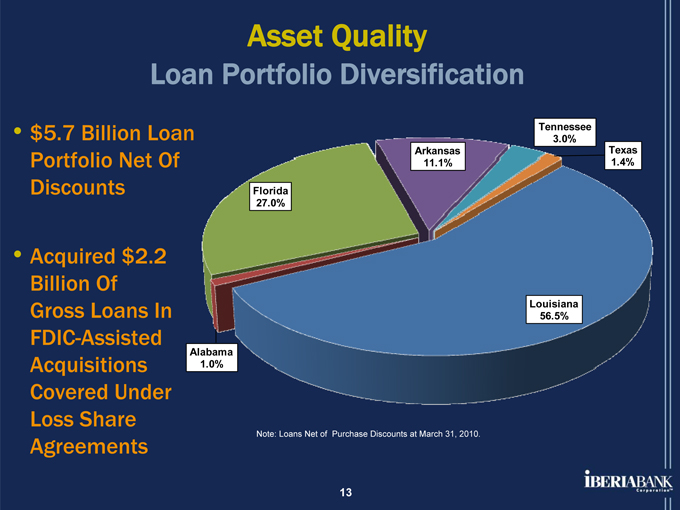
$5.7 Billion Loan Portfolio Net Of Discounts
Acquired $2.2 Billion Of Gross Loans In FDIC-Assisted Acquisitions Covered Under Loss Share Agreements
Tennessee 3.0%
Arkansas 11.1%
Florida 27.0%
Alabama 1.0%
Texas 1.4%
Louisiana 56.5%
Note: Loans Net of Purchase Discounts at March 31, 2010.
13
Asset Quality
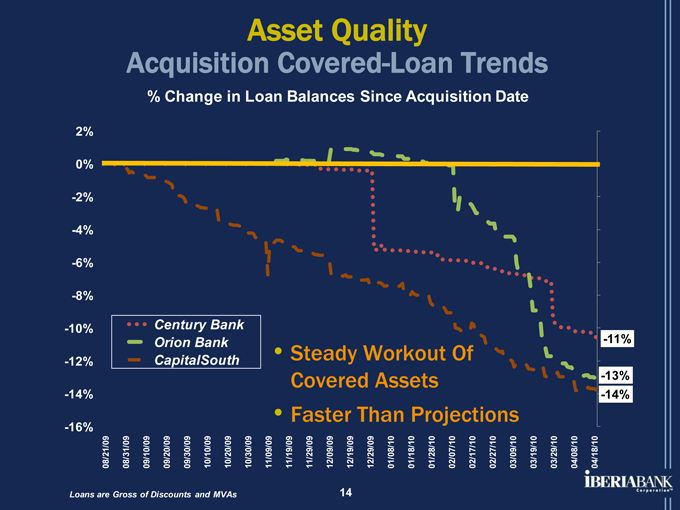
Acquisition Covered-Loan Trends
% Change in Loan Balances Since Acquisition Date
2% 0% -2% -4% -6% -8% -10% -12% -14% -16%
Century Bank Orion Bank CapitalSouth
Steady Workout Of Covered Assets Faster Than Projections
-11%
-13% -14%
08/21/09 08/31/09 09/10/09 09/20/09 09/30/09 10/10/09 10/20/09 10/30/09 11/09/09 11/19/09 11/29/09 12/09/09 12/19/09 12/29/09 01/08/10 01/18/10 01/28/10 02/07/10 02/17/10 02/27/10 03/09/10 03/19/10 03/29/10 04/08/10 04/18/10
Loans are Gross of Discounts and MVAs
14
Asset Quality
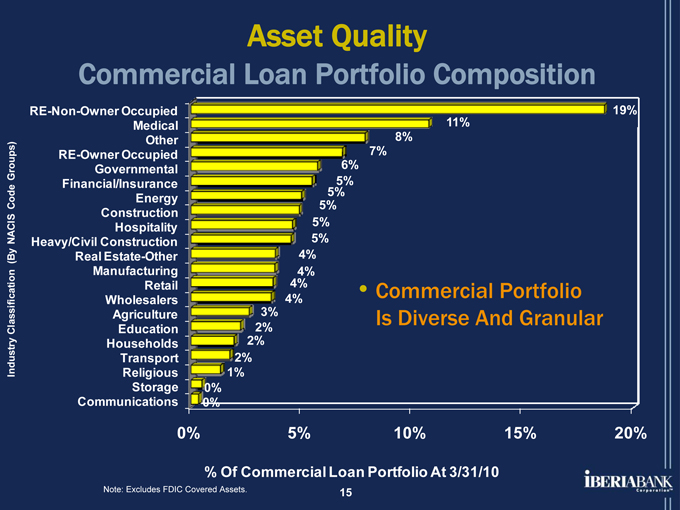
Commercial Loan Portfolio Composition
RE-Non-Owner Occupied
Medical
Other
RE-Owner Occupied
Governmental
Financial/Insurance
Energy
Construction
Hospitality
Heavy/Civil Construction
Real Estate-Other
Manufacturing
Retail
Wholesalers
Agriculture
Education
Households
Transport
Religious
Storage
Communications
19% 11% 8% 7% 6%
5% 5% 5% 5% 5% 4% 4%
4% • Commercial Portfolio
4%
Is Diverse And Granular
3%
2% 2% 2% 1% 0% 0%
0% 5% 10% 15% 20%
% Of Commercial Loan Portfolio At 3/31/10
Note: Excludes FDIC Covered Assets.
Industry Classification (By NACIS Code Groups)
15
Asset Quality
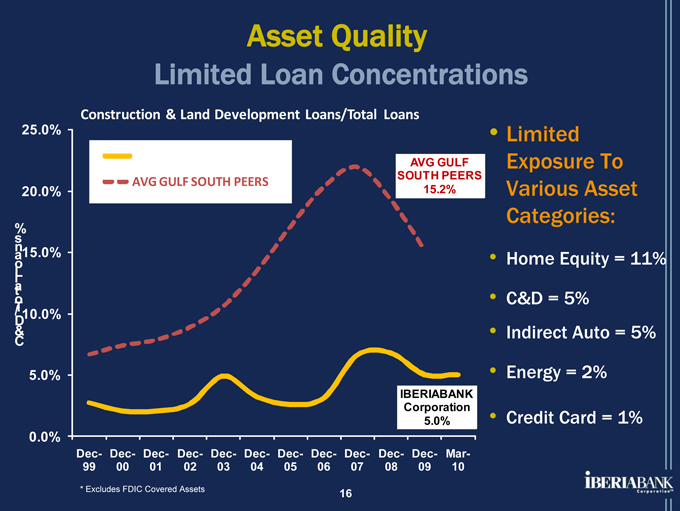
Limited Loan Concentrations
Construction & Land Development Loans/Total Loans
25.0% 20.0% 15.0% 10.0% 5.0% 0.0%
AVG GULF SOUTH PEERS
AVG GULF SOUTH PEERS
15.2%
IBERIABANK Corporation 5.0%
Limited Exposure To Various Asset Categories:
Home Equity = 11%
C&D = 5% Indirect Auto = 5%
Energy = 2%
Credit Card = 1%
Dec- Dec- Dec- Dec- Dec- Dec- Dec- Dec- Dec- Dec- Dec- Mar-
99 00 01 02 03 04 05 06 07 08 09 10
* | | Excludes FDIC Covered Assets 16 |
C&D Total Loans %
Asset Quality
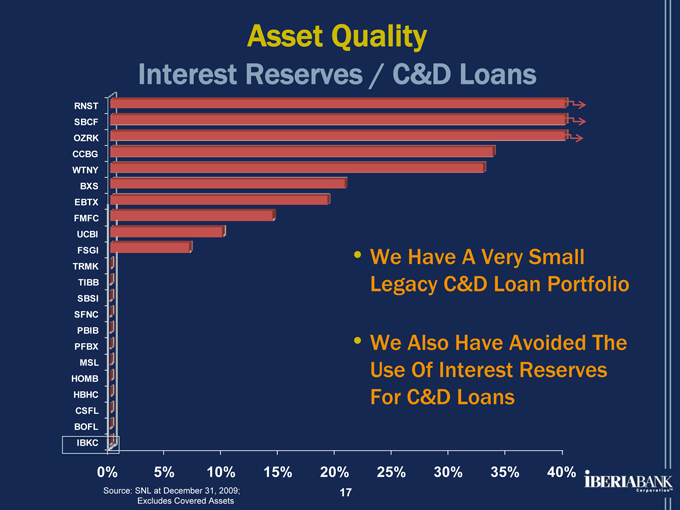
Interest Reserves / C&D Loans
RNST SBCF OZRK CCBG WTNY
BXS EBTX FMFC UCBI FSGI TRMK
TIBB SBSI SFNC PBIB PFBX
MSL HOMB HBHC CSFL BOFL
IBKC
We Have A Very Small Legacy C&D Loan Portfolio
We Also Have Avoided The Use Of Interest Reserves For C&D Loans
0% 5% 10% 15% 20% 25% 30% 35% 40%
Source: SNL at December 31, 2009; 17 Excludes Covered Assets
Asset Quality
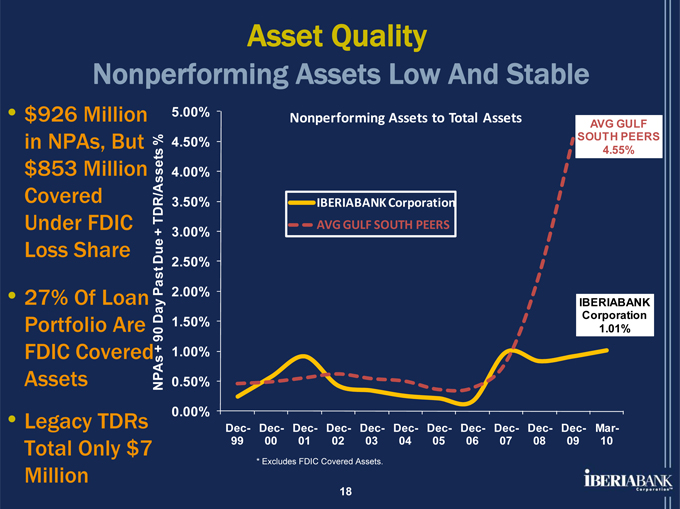
Nonperforming Assets Low And Stable
$926 Million in NPAs, But $853 Million Covered Under FDIC Loss Share
27% Of Loan Portfolio Are FDIC Covered Assets Legacy TDRs Total Only $7 Million
NPAs 90+ Day Past Due TDR/Assets+ %
5.00% 4.50% 4.00% 3.50% 3.00% 2.50% 2.00% 1.50% 1.00% 0.50% 0.00%
Nonperforming Assets to Total Assets
IBERIABANK Corporation AVG GULF SOUTH PEERS
AVG GULF SOUTH PEERS
4.55%
IBERIABANK Corporation 1.01%
Dec- Dec- Dec- Dec- Dec- Dec- Dec- Dec- Dec- Dec- Dec- Mar-
99 00 01 02 03 04 05 06 07 08 09 10
* | | Excludes FDIC Covered Assets. |
18
Asset Quality
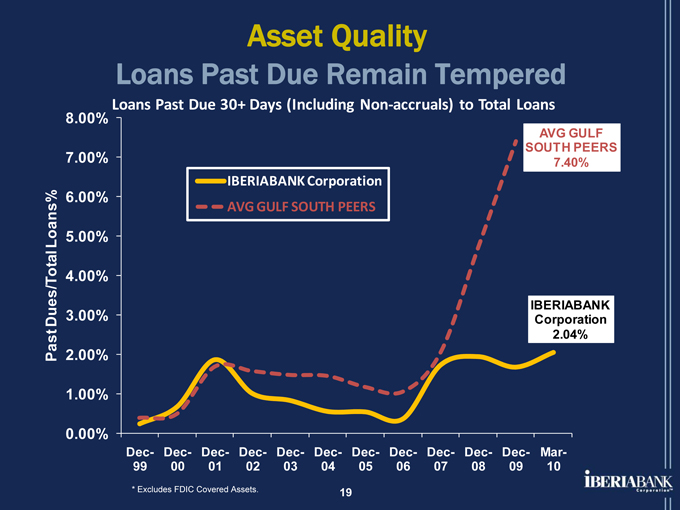
Loans Past Due Remain Tempered
Loans Past Due 30+ Days (Including Non-accruals) to Total Loans
Past Dues/Total Loans%
8.00% 7.00% 6.00% 5.00% 4.00% 3.00% 2.00% 1.00% 0.00%
IBERIABANK Corporation AVG GULF SOUTH PEERS
AVG GULF SOUTH PEERS
7.40%
IBERIABANK Corporation 2.04%
Dec- Dec- Dec- Dec- Dec- Dec- Dec- Dec- Dec- Dec- Dec- Mar-
99 00 01 02 03 04 05 06 07 08 09 10
* | | Excludes FDIC Covered Assets. 19 |
Asset Quality
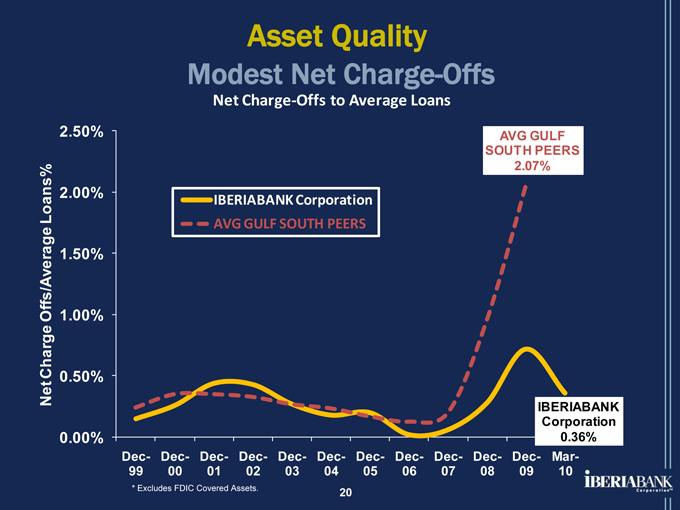
Modest Net Charge-Offs
Net Charge-Offs to Average Loans
Net Charge Offs/Average Loans%
2.50% 2.00% 1.50% 1.00% 0.50% 0.00%
IBERIABANK Corporation AVG GULF SOUTH PEERS
AVG GULF SOUTH PEERS
2.07%
Dec- Dec- Dec- Dec- Dec- Dec- Dec- Dec- Dec- Dec- Dec- Mar-
99 00 01 02 03 04 05 06 07 08 09 10
* | | Excludes FDIC Covered Assets. 20 |
IBERIABANK Corporation 0.36%

Financials
21
Financials
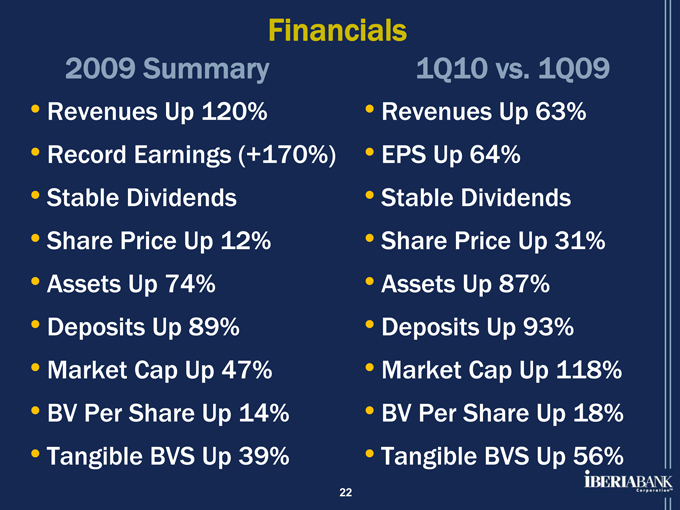
2009 Summary
Revenues Up 120% Record Earnings (+170%) Stable Dividends Share Price Up 12% Assets Up 74% Deposits Up 89% Market Cap Up 47% BV Per Share Up 14% Tangible BVS Up 39%
1Q10 vs. 1Q09
Revenues Up 63% EPS Up 64% Stable Dividends Share Price Up 31% Assets Up 87% Deposits Up 93% Market Cap Up 118% BV Per Share Up 18% Tangible BVS Up 56%
22
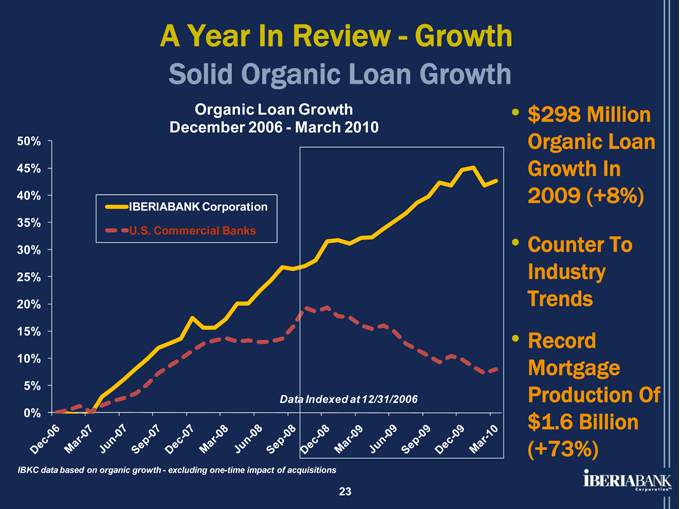
A Year In Review - Growth
Solid Organic Loan Growth
Organic Loan Growth December 2006 - March 2010
50% 45% 40% 35% 30% 25% 20% 15% 10% 5% 0%
IBERIABANK Corporation
U.S. Commercial Banks
Data Indexed at 12/31/2006
Dec-06
Mar-07
Jun-07
Sep-07
Dec-07
Mar-08
Jun-08
Sep-08
Dec-08
Mar-09
Jun-09
Sep-09
Dec-09
Mar-10
$298 Million Organic Loan Growth In 2009 (+8%)
Counter To Industry Trends Record Mortgage Production Of $1.6 Billion (+73%)
IBKC data based on organic growth - excluding one-time impact of acquisitions
23
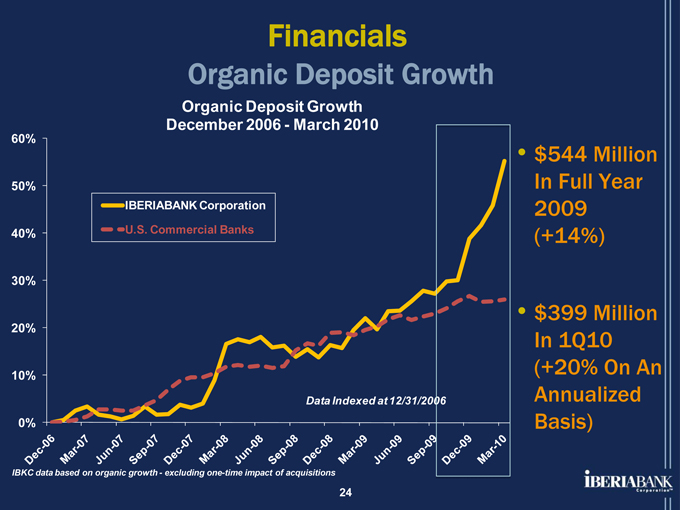
Financials
Organic Deposit Growth
Organic Deposit Growth December 2006 - March 2010
60% 50% 40% 30% 20% 10% 0%
IBERIABANK Corporation
U.S. Commercial Banks
Data Indexed at 12/31/2006
Dec-06
Mar-07
Jun-07
Sep-07
Dec-07
Mar-08
Jun-08
Sep-08
Dec-08
Mar-09
Jun-09
Sep-09
Dec-09
Mar-10
IBKC data based on organic growth - excluding one-time impact of acquisitions
24
$544 Million In Full Year 2009 (+14%)
$399 Million In 1Q10 (+20% On An Annualized Basis)
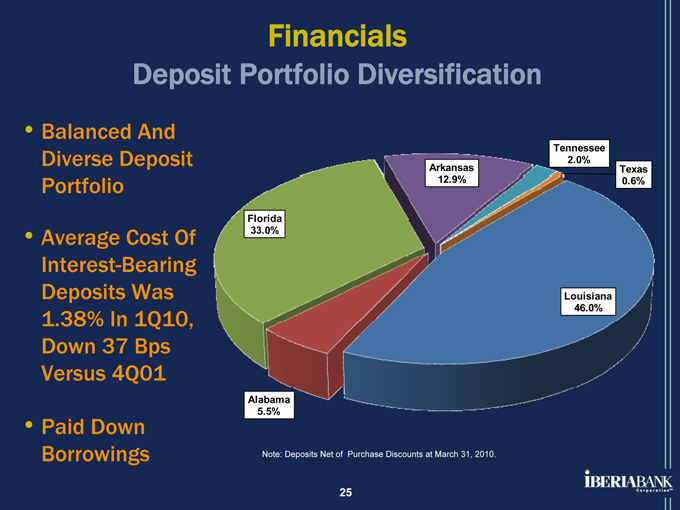
Financials
Deposit Portfolio Diversification
Balanced And Diverse Deposit Portfolio
Average Cost Of Interest-Bearing Deposits Was 1.38% In 1Q10, Down 37 Bps Versus 4Q01
Paid Down Borrowings
Florida 33.0%
Arkansas 12.9%
Tennessee 2.0%
Texas 0.6%
Louisiana 46.0%
Alabama 5.5%
Note: Deposits Net of Purchase Discounts at March 31, 2010.
25
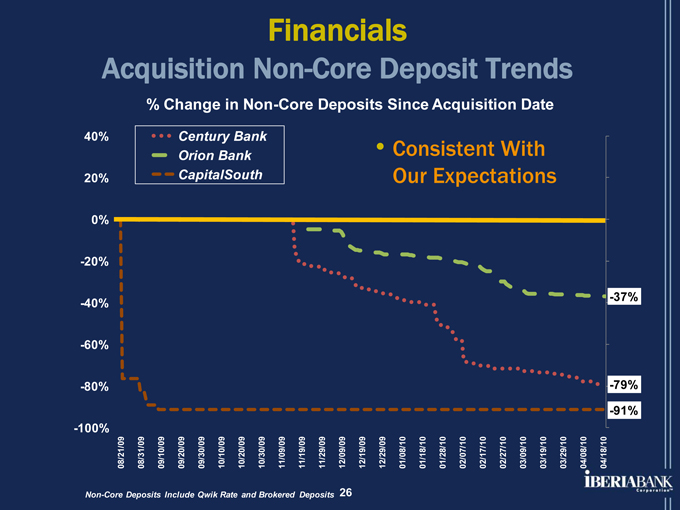
Financials
Acquisition Non-Core Deposit Trends
% Change in Non-Core Deposits Since Acquisition Date
Century Bank Orion Bank CapitalSouth
Consistent With Our Expectations
40% 20% 0% -20% -40% -60% -80% -100%
-37%
-79%
-91%
08/21/09 08/31/09 09/10/09 09/20/09 09/30/09 10/10/09 10/20/09 10/30/09 11/09/09 11/19/09 11/29/09 12/09/09 12/19/09 12/29/09 01/08/10 01/18/10 01/28/10 02/07/10 02/17/10 02/27/10 03/09/10 03/19/10 03/29/10 04/08/10 04/18/10
Non-Core Deposits Include Qwik Rate and Brokered Deposits 26
Financials
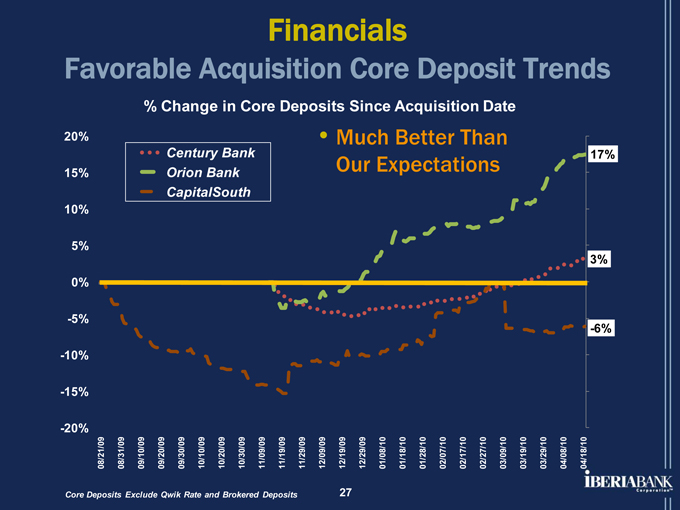
Favorable Acquisition Core Deposit Trends
% Change in Core Deposits Since Acquisition Date
Century Bank Orion Bank CapitalSouth
Much Better Than Our Expectations
20% 15% 10% 5% 0% -5% -10% -15% -20%
08/21/09 08/31/09 09/10/09 09/20/09 09/30/09 10/10/09 10/20/09 10/30/09 11/09/09 11/19/09 11/29/09 12/09/09 12/19/09 12/29/09 01/08/10 01/18/10 01/28/10 02/07/10 02/17/10 02/27/10 03/09/10 03/19/10 03/29/10 04/08/10 04/18/10
17% 3% -6%
Core Deposits Exclude Qwik Rate and Brokered Deposits 27
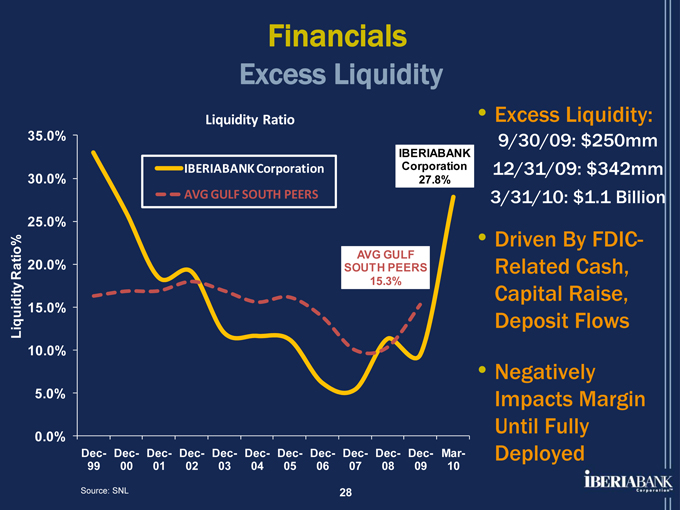
Financials
Excess Liquidity
Liquidity Ratio
IBERIABANK Corporation AVG GULF SOUTH PEERS
IBERIABANK Corporation 27.8%
AVG GULF SOUTH PEERS
15.3%
Liquidity Ratio%
35.0% 30.0% 25.0% 20.0% 15.0% 10.0% 5.0% 0.0%
Excess Liquidity:
9/30/09: $250mm 12/31/09: $342mm 3/31/10: $1.1 Billion
Driven By FDIC-Related Cash, Capital Raise, Deposit Flows
Negatively Impacts Margin Until Fully Deployed
Dec- Dec- Dec- Dec- Dec- Dec- Dec- Dec- Dec- Dec- Dec- Mar-
99 00 01 02 03 04 05 06 07 08 09 10
Source: SNL
28
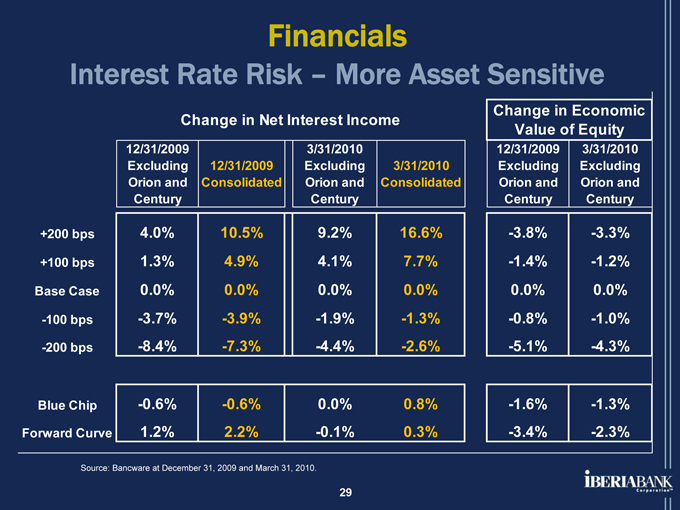
Financials
Interest Rate Risk – More Asset Sensitive
Change in Net Interest Income
12/31/2009 3/31/2010
Excluding 12/31/2009 Excluding 3/31/2010
Orion and Consolidated Orion and Consolidated
Century Century
+200 bps 4.0% 10.5% 9.2% 16.6%
+100 bps 1.3% 4.9% 4.1% 7.7%
Base Case 0.0% 0.0% 0.0% 0.0%
-100 bps -3.7% -3.9% -1.9% -1.3%
-200 bps -8.4% -7.3% -4.4% -2.6%
Blue Chip -0.6% -0.6% 0.0% 0.8%
Forward Curve 1.2% 2.2% -0.1% 0.3%
Change in Economic
Value of Equity
12/31/2009 3/31/2010
Excluding Excluding
Orion and Orion and
Century Century
-3.8% -3.3%
-1.4% -1.2%
0.0% 0.0%
-0.8% -1.0%
-5.1% -4.3%
-1.6% -1.3%
-3.4% -2.3%
Source: Bancware at December 31, 2009 and March 31, 2010.
29

FDIC-Assisted Opportunities
30
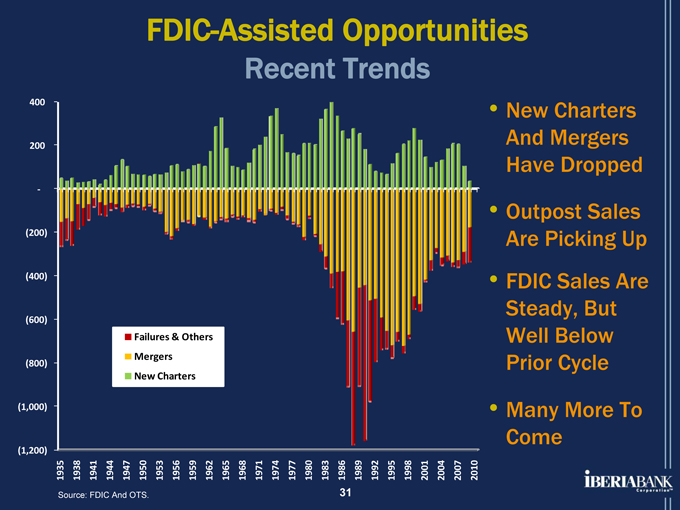
FDIC-Assisted Opportunities
Recent Trends
400 200 -(200) (400) (600) (800) (1,000) (1,200)
Failures & Others Mergers New Charters
New Charters
And Mergers Have Dropped
Outpost Sales Are Picking Up FDIC Sales Are Steady, But Well Below Prior Cycle
Many More To Come
1935
Source: 1938 FDIC 1941 And 1944
1947
OTS. 1950 1953 1956 1959 1962 1965 1968 1971 1974 1977 1980 1983
31 1986 1989 1992 1995 1998 2001 2004 2007 2010
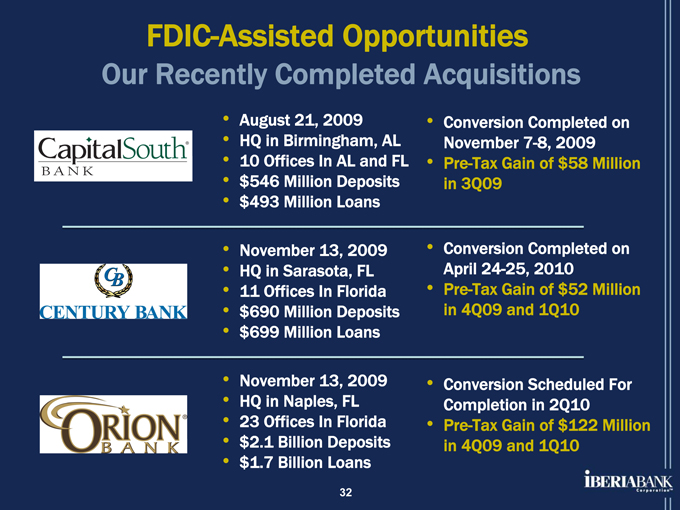
FDIC-Assisted Opportunities
Our Recently Completed Acquisitions
August 21, 2009 HQ in Birmingham, AL
10 Offices In AL and FL $546 Million Deposits $493 Million Loans
Conversion Completed on November 7-8, 2009 Pre-Tax Gain of $58 Million in 3Q09
November 13, 2009 HQ in Sarasota, FL
11 Offices In Florida $690 Million Deposits $699 Million Loans
Conversion Completed on April 24-25, 2010 Pre-Tax Gain of $52 Million in 4Q09 and 1Q10
November 13, 2009 HQ in Naples, FL
23 Offices In Florida $2.1 Billion Deposits $1.7 Billion Loans
Conversion Scheduled For Completion in 2Q10 Pre-Tax Gain of $122 Million in 4Q09 and 1Q10
32
FDIC-Assisted Opportunities
Summary of FDIC-Assisted Acquisitions
Total Assets of $3.8 Billion Total Deposits of $3.0 Billion
Deposits Assumed at a Discount of $39 Million Gross Loans of $2.2 Billion Loans Purchased at a $500 Million Discount Loans Come With FDIC Loss Share Protection Pre-Tax Gain of $231 Million
44 Offices in 9 MSAs in Alabama & Florida Fixed Assets /Owned Property at Appraised Value
33
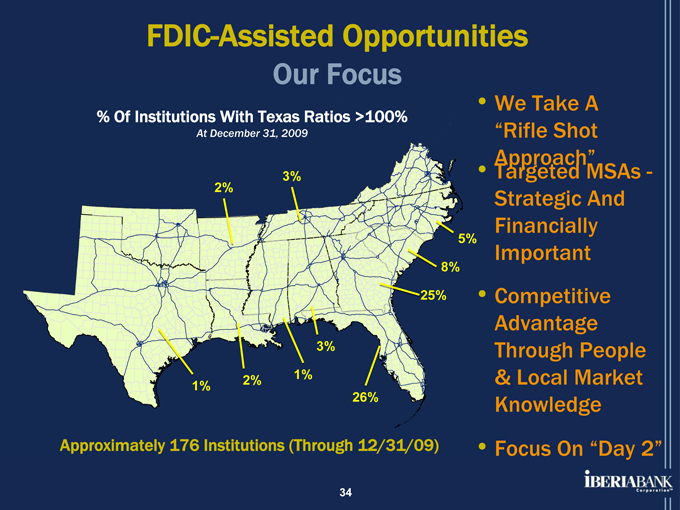
FDIC-Assisted Opportunities
Our Focus
% Of Institutions With Texas Ratios >100%
At December 31, 2009
We Take A “Rifle Shot Approach” Targeted MSAs -Strategic And Financially Important Competitive Advantage Through People
& Local Market Knowledge Focus On “Day 2”
3% 2%
5% 8% 25%
3%
2% 1% 1%
26%
Approximately 176 Institutions (Through 12/31/09)
34

Shareholders
35
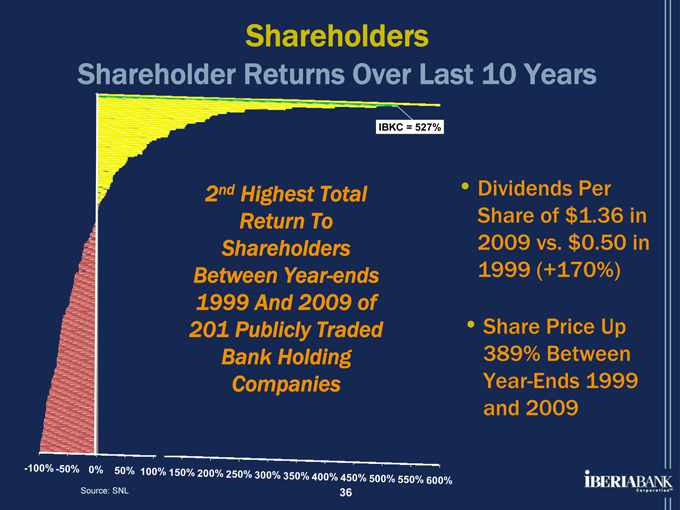
Shareholders
Shareholder Returns Over Last 10 Years
IBKC = 527%
2nd Highest Total Return To Shareholders Between Year-ends 1999 And 2009 of 201 Publicly Traded Bank Holding Companies
Dividends Per Share of $1.36 in 2009 vs. $0.50 in 1999 (+170%)
Share Price Up 389% Between Year-Ends 1999 and 2009
-100% -50% 0% 50% 100% 150%
200% 250% 300% 350% 400% 450%
500% 550% 600%
Source: SNL 36
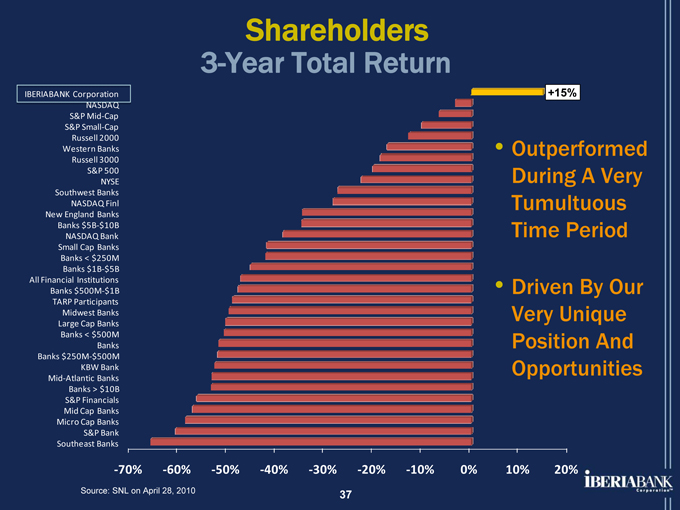
Shareholders
3-Year Total Return
IBERIABANK Corporation
NASDAQ
S&P Mid-Cap
S&P Small-Cap
Russell 2000
Western Banks
Russell 3000
S&P 500
NYSE
Southwest Banks
NASDAQ Finl
New England Banks
Banks $5B-$10B
NASDAQ Bank
Small Cap Banks
Banks < $250M
Banks $1B-$5B
All Financial Institutions
Banks $500M-$1B
TARP Participants
Midwest Banks
Large Cap Banks
Banks < $500M
Banks
Banks $250M-$500M
KBW Bank
Mid-Atlantic Banks
Banks > $10B
S&P Financials
Mid Cap Banks
Micro Cap Banks
S&P Bank
Southeast Banks
+15%
• Outperformed During A Very Tumultuous Time Period
• Driven By Our Very Unique Position And Opportunities
-70% -60% -50% -40% -30% -20% -10% 0% 10% 20%
Source: SNL on April 28, 2010 37
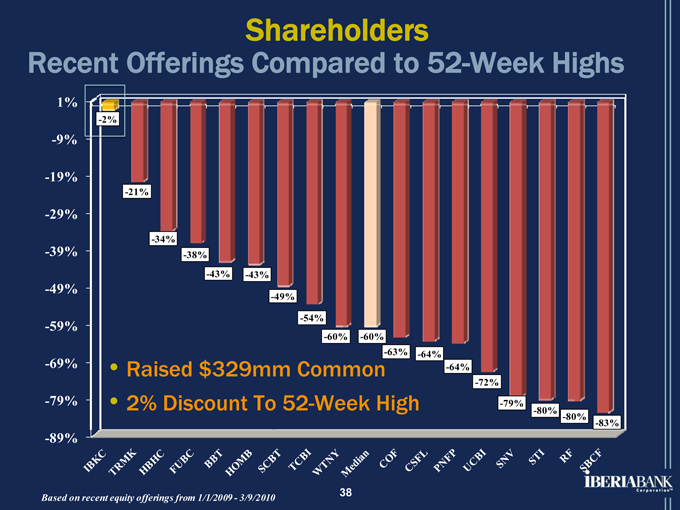
Shareholders
Recent Offerings Compared to 52-Week Highs
1% -9% -19% -29% -39% -49% -59% -69% -79% -89%
-2%
-21%
-34% -38%
-43% -43%
-49%
-54%
-60% -60%
-63% -64%
• Raised $329mm Common -64%
-72%
• 2% Discount To 52-Week High -79%
-80% -80% -83%
IBKC
TRMK
HBHC
FUBC
BBT
HOMB
SCBT
TCBI
WTNY
Median
COF
CSFL
PNFP
UCBI
SNV STI
RF
SBCF
38
Based on recent equity offerings from 1/1/2009 - 3/9/2010
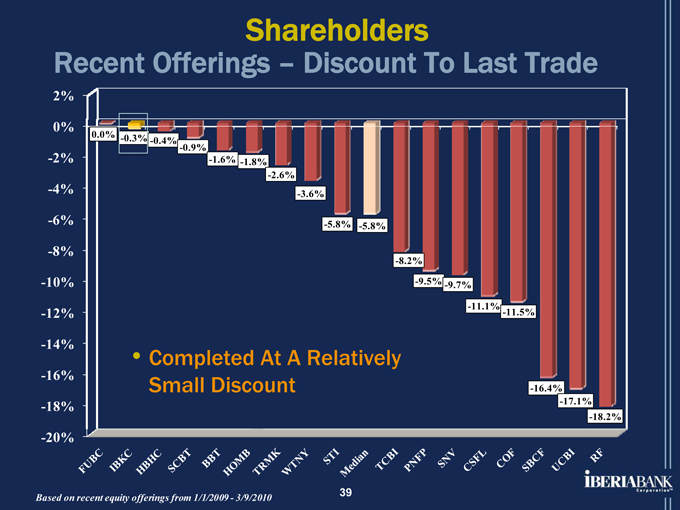
Shareholders
Recent Offerings – Discount To Last Trade
2% 0% -2% -4% -6% -8% -10% -12% -14% -16% -18% -20%
Completed At A Relatively Small Discount
0.0%
-0.3% -0.4% -0.9%
-1.6% -1.8% -2.6% -3.6%
-5.8% -5.8%
-8.2%
-9.5% -9.7% -11.1% -11.5%
-16.4% -17.1% -18.2%
IBKC
TRMK
HBHC
FUBC
BBT
HOMB
SCBT
TCBI
WTNY
Median
COF
CSFL
PNFP
UCBI
SNV STI
RF
SBCF
39
Based on recent equity offerings from 1/1/2009 - 3/9/2010
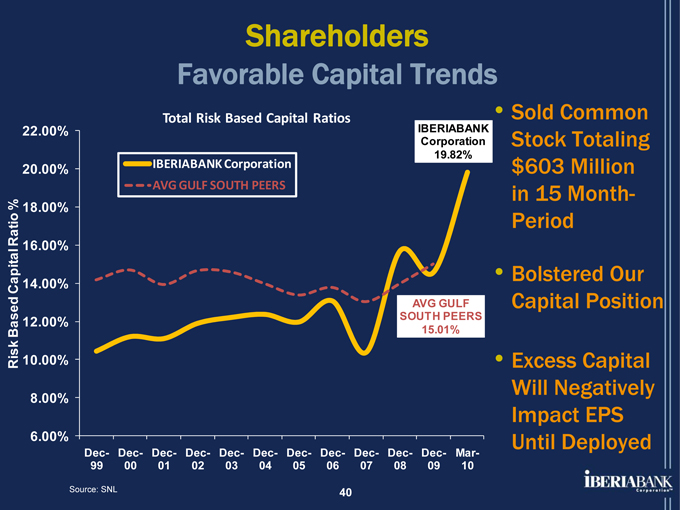
Shareholders
Favorable Capital Trends
Total Risk Based Capital Ratios
IBERIABANK Corporation 19.82%
IBERIABANK Corporation AVG GULF SOUTH PEERS
AVG GULF SOUTH PEERS
15.01%
Risk Based Capital Ratio %
22.00% 20.00% 18.00% 16.00% 14.00% 12.00% 10.00% 8.00% 6.00%
Dec- Dec- Dec- Dec- Dec- Dec- Dec- Dec- Dec- Dec- Dec- Mar-
99 00 01 02 03 04 05 06 07 08 09 10
Source: SNL 40
Sold Common Stock Totaling $603 Million in 15 Month-Period
Bolstered Our Capital Position
Excess Capital Will Negatively Impact EPS Until Deployed
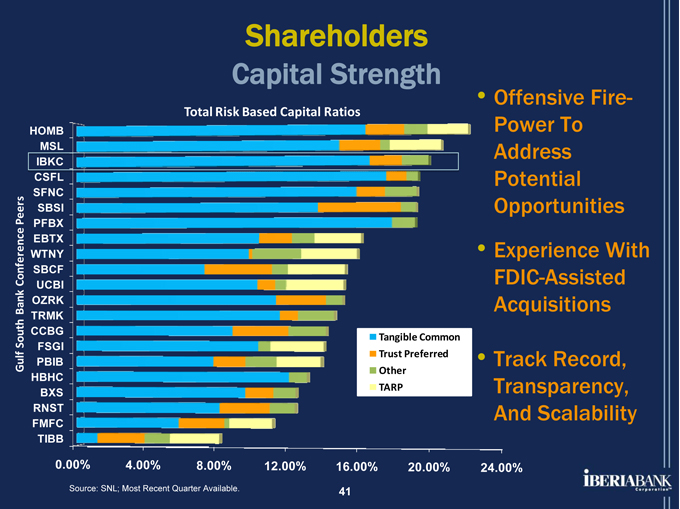
Shareholders
Capital Strength
Total Risk Based Capital Ratios
Gulf South Bank Conference Peers
HOMB MSL
IBKC CSFL SFNC SBSI PFBX EBTX WTNY SBCF UCBI OZRK TRMK CCBG
FSGI PBIB HBHC
BXS RNST FMFC TIBB
Offensive Fire-Power To Address Potential Opportunities Experience With FDIC-Assisted Acquisitions
Track Record, Transparency, And Scalability
Tangible Common Trust Preferred Other TARP
0.00% 4.00% 8.00% 12.00% 16.00% 20.00% 24.00%
Source: SNL; Most Recent Quarter Available. 41
Summary
42
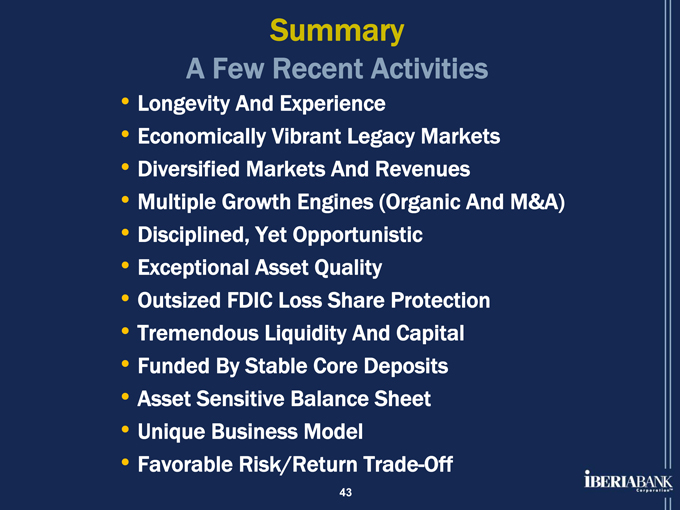
Summary
A Few Recent Activities
Longevity And Experience
Economically Vibrant Legacy Markets
Diversified Markets And Revenues
Multiple Growth Engines (Organic And M&A)
Disciplined, Yet Opportunistic
Exceptional Asset Quality
Outsized FDIC Loss Share Protection
Tremendous Liquidity And Capital
Funded By Stable Core Deposits
Asset Sensitive Balance Sheet
Unique Business Model
Favorable Risk/Return Trade-Off
43

IBERIA BANK
44

Appendix
45
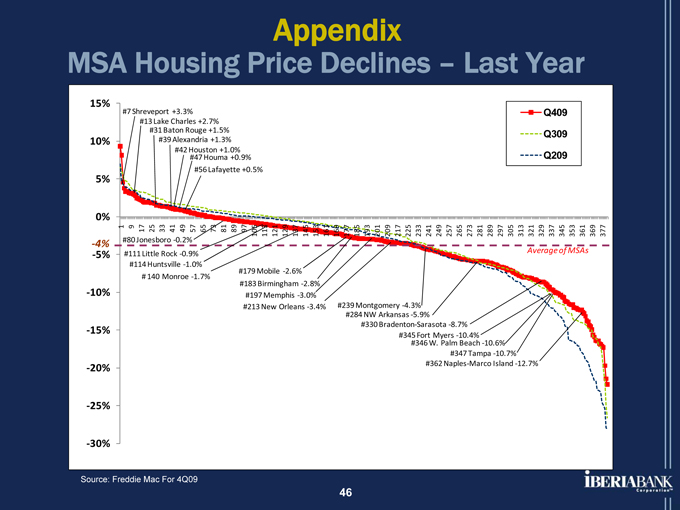
Appendix
MSA Housing Price Declines – Last Year
15% 10% 5%
0%
-4%
-5% -10% -15% -20% -25% -30%
#7 Shreveport +3.3% #13 Lake Charles +2.7% #31 Baton Rouge +1.5% #39 Alexandria +1.3% #42 Houston +1.0% #47 Houma +0.9% #56 Lafayette +0.5%
Q409 Q309 Q209
#80 Jonesboro -0.2% #111 Little Rock -0.9% #114 Huntsville -1.0%
# 140 Monroe -1.7%
#179 Mobile -2.6% #183 Birmingham -2.8% #197 Memphis -3.0% #213 New Orleans -3.4%
#239 Montgomery -4.3% #284 NW Arkansas -5.9%
#330 Bradenton-Sarasota -8.7%
#345 #346 Fort W. Myers Palm - 10.4% Beach -10.6% #347 Tampa -10.7% #362 Naples-Marco Island -12.7%
1
9
17
25
33
41
49
57
65
73
81
89
97
105
113
121
129
137
145
153
161
169
177
185
193
201
209
217
225
233
241
249
257
265
273
281
289
297
305
313
321
329
337
345
353
361
369
377
Average of MSAs
Source: Freddie Mac For 4Q09
46
Appendix
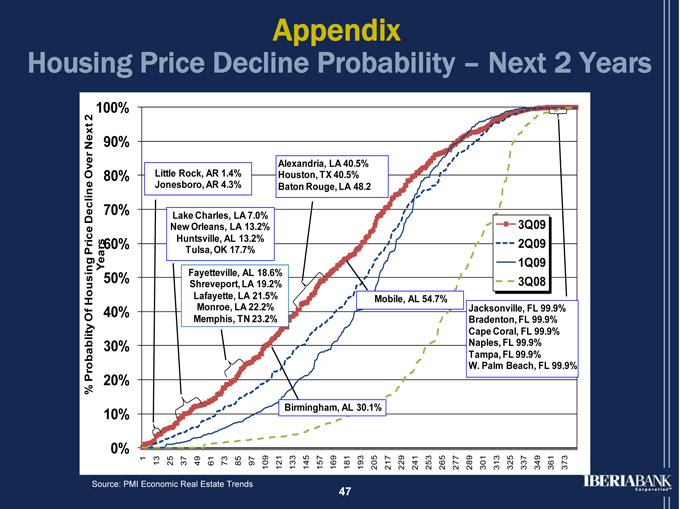
Housing Price Decline Probability – Next 2 Years
% Probablity Of Housing Price Decline Over Next 2
100% 90% 80% 70%
Years 60%
50% 40% 30% 20% 10% 0%
Little Rock, AR 1.4% Jonesboro, AR 4.3%
Alexandria, LA 40.5% Houston, TX 40.5% Baton Rouge, LA 48.2
Lake Charles, LA 7.0% New Orleans, LA 13.2% Huntsville, AL 13.2% Tulsa, OK 17.7%
Fayetteville, AL 18.6% Shreveport, LA 19.2% Lafayette, LA 21.5% Monroe, LA 22.2% Memphis, TN 23.2%
Mobile, AL 54.7%
3Q09 2Q09 1Q09 3Q08
Jacksonville, FL 99.9% Bradenton, FL 99.9% Cape Coral, FL 99.9% Naples, FL 99.9% Tampa, FL 99.9% W. Palm Beach, FL 99.9%
Birmingham, AL 30.1%
13
25
37
49
61
73
85
97
109
121
133
145
157
169
181
193
205
217
229
241
253
265
277
289
301
313
325
337
349
361
373
Source: PMI Economic Real Estate Trends
47
Appendix
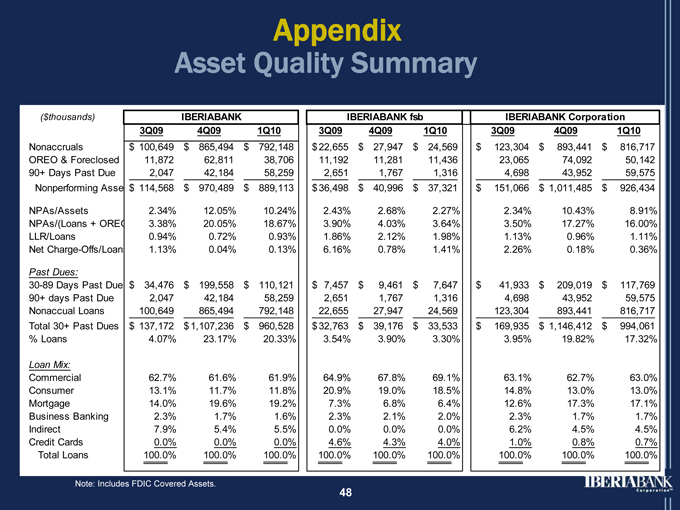
Asset Quality Summary
($thousands) IBERIABANK IBERIABANK fsb IBERIABANK Corporation
3Q09 4Q09 1Q10 3Q09 4Q09 1Q10 3Q09 4Q09 1Q10
Nonaccruals $ 100,649 $ 865,494 $ 792,148 $ 22,655 $ 27,947 $ 24,569 $ 123,304 $ 893,441 $ 816,717
OREO & Foreclosed 11,872 62,811 38,706 11,192 11,281 11,436 23,065 74,092 50,142
90+ Days Past Due 2,047 42,184 58,259 2,651 1,767 1,316 4,698 43,952 59,575
Nonperforming Asse $ 114,568 $ 970,489 $ 889,113 $ 36,498 $ 40,996 $ 37,321 $ 151,066 $ 1,011,485 $ 926,434
NPAs/Assets 2.34% 12.05% 10.24% 2.43% 2.68% 2.27% 2.34% 10.43% 8.91%
NPAs/(Loans + OREO 3.38% 20.05% 18.67% 3.90% 4.03% 3.64% 3.50% 17.27% 16.00%
LLR/Loans 0.94% 0.72% 0.93% 1.86% 2.12% 1.98% 1.13% 0.96% 1.11%
Net Charge-Offs/Loans 1.13% 0.04% 0.13% 6.16% 0.78% 1.41% 2.26% 0.18% 0.36%
Past Dues:
30-89 Days Past Due $ 34,476 $ 199,558 $ 110,121 $ 7,457 $ 9,461 $ 7,647 $ 41,933 $ 209,019 $ 117,769
90+ days Past Due 2,047 42,184 58,259 2,651 1,767 1,316 4,698 43,952 59,575
Nonaccual Loans 100,649 865,494 792,148 22,655 27,947 24,569 123,304 893,441 816,717
Total 30+ Past Dues $ 137,172 $ 1,107,236 $ 960,528 $ 32,763 $ 39,176 $ 33,533 $ 169,935 $ 1,146,412 $ 994,061
% Loans 4.07% 23.17% 20.33% 3.54% 3.90% 3.30% 3.95% 19.82% 17.32%
Loan Mix:
Commercial 62.7% 61.6% 61.9% 64.9% 67.8% 69.1% 63.1% 62.7% 63.0%
Consumer 13.1% 11.7% 11.8% 20.9% 19.0% 18.5% 14.8% 13.0% 13.0%
Mortgage 14.0% 19.6% 19.2% 7.3% 6.8% 6.4% 12.6% 17.3% 17.1%
Business Banking 2.3% 1.7% 1.6% 2.3% 2.1% 2.0% 2.3% 1.7% 1.7%
Indirect 7.9% 5.4% 5.5% 0.0% 0.0% 0.0% 6.2% 4.5% 4.5%
Credit Cards 0.0% 0.0% 0.0% 4.6% 4.3% 4.0% 1.0% 0.8% 0.7%
Total Loans 100.0% 100.0% 100.0% 100.0% 100.0% 100.0% 100.0% 100.0% 100.0%
Note: Includes FDIC Covered Assets.
48
Appendix
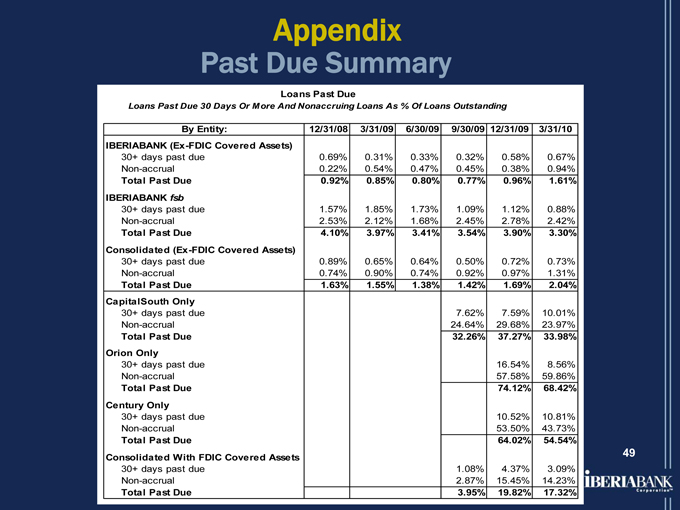
Past Due Summary
Loans Past Due
Loans Past Due 30 Days Or More And Nonaccruing Loans As % Of Loans Outstanding
By Entity: 12/31/08 3/31/09 6/30/09 9/30/09 12/31/09 3/31/10
IBERIABANK (Ex-FDIC Covered Assets)
30+ days past due 0.69% 0.31% 0.33% 0.32% 0.58% 0.67%
Non-accrual 0.22% 0.54% 0.47% 0.45% 0.38% 0.94%
Total Past Due 0.92% 0.85% 0.80% 0.77% 0.96% 1.61%
IBERIABANK fsb
30+ days past due 1.57% 1.85% 1.73% 1.09% 1.12% 0.88%
Non-accrual 2.53% 2.12% 1.68% 2.45% 2.78% 2.42%
Total Past Due 4.10% 3.97% 3.41% 3.54% 3.90% 3.30%
Consolidated (Ex-FDIC Covered Assets)
30+ days past due 0.89% 0.65% 0.64% 0.50% 0.72% 0.73%
Non-accrual 0.74% 0.90% 0.74% 0.92% 0.97% 1.31%
Total Past Due 1.63% 1.55% 1.38% 1.42% 1.69% 2.04%
CapitalSouth Only
30+ days past due 7.62% 7.59% 10.01%
Non-accrual 24.64% 29.68% 23.97%
Total Past Due 32.26% 37.27% 33.98%
Orion Only
30+ days past due 16.54% 8.56%
Non-accrual 57.58% 59.86%
Total Past Due 74.12% 68.42%
Century Only
30+ days past due 10.52% 10.81%
Non-accrual 53.50% 43.73%
Total Past Due 64.02% 54.54%
Consolidated With FDIC Covered Assets
30+ days past due 1.08% 4.37% 3.09%
Non-accrual 2.87% 15.45% 14.23%
Total Past Due 3.95% 19.82% 17.32%
49

Appendix
Other Asset Quality Information
(Dollars in $000s) 1Q09 2Q09 3Q09 4Q09 1Q10** 1Q10
3/31/09 6/30/09 9/31/09 12/31/09 3/31/10 3/31/10
% of Outstandings Commercial 59.5% 60.9% 63.1% 62.7% 65.3% 63.0%
Mortgage 13.6% 12.5% 12.6% 17.3% 10.6% 17.1%
Consumer 16.1% 15.9% 14.8% 13.0% 14.6% 13.0%
Indirect 7.0% 7.1% 6.2% 4.5% 6.2% 4.5%
Business Banking 2.8% 2.6% 2.3% 1.7% 2.3% 1.7%
Credit Cards 1.0% 1.0% 1.0% 0.8% 1.0% 0.7%
Total Loans 100.0% 100.0% 100.0% 100.0% 100.0% 100.0%
Past Due 30+ Days* Commercial 1.82% 1.45% 4.82% 24.62% 2.15% 21.17%
Mortgage 0.85% 1.25% 4.25% 17.52% 1.78% 16.72%
Consumer 1.53% 1.20% 1.82% 9.74% 2.06% 8.06%
Indirect 0.97% 1.06% 1.05% 1.19% 1.01% 1.01%
Business Banking 0.83% 1.29% 1.33% 2.17% 2.73% 2.73%
Credit Cards 1.63% 1.32% 1.20% 1.52% 1.73% 2.12%
Total Loans 1.55% 1.38% 3.95% 19.82% 2.04% 17.34%
IBERIABANK 0.85% 0.80% 4.06% 23.04% 1.61% 20.24%
IBERIABANK fsb 3.97% 3.41% 3.54% 3.90% 3.30% 3.30%
Consolidated 1.55% 1.38% 3.95% 19.82% 2.04% 17.34%
* | | Includes nonaccruing loans |
** Excludes FDIC assisted acquisitions
50

Consumer Portfolio - Quarterly Credit Statistics
Loans Past Due As A % of Product Loans
12/31/08 3/31/09 6/30/09 9/30/09 12/31/09 3/31/10
Home Equity Lines of Credit
30 to 59 Days Past Due 0.24% 0.68% 0.19% 0.32% 0.57% 0.86%
60 to 89 Days Past Due 0.13% 0.07% 0.14% 0.07% 0.33% 0.14%
Over 90 Days Past Due 0.11% 0.11% 0.19% 0.13% 0.07% 0.14%
Total 30+ Days Past Due 0.48% 0.86% 0.52% 0.51% 0.98% 1.14%
Net Charge-Offs 0.15% 0.23% 0.07% 1.25% 0.35% 0.47%
Home Equity Term Loans
30 to 59 Days Past Due 0.80% 0.56% 0.46% 0.57% 0.85% 1.08%
60 to 89 Days Past Due 0.09% 0.17% 0.17% 0.20% 0.22% 0.18%
Over 90 Days Past Due 0.05% 0.06% 0.28% 0.21% 0.32% 0.19%
Total 30+ Days Past Due 0.93% 0.79% 0.91% 0.98% 1.38% 1.45%
Net Charge-Offs 0.21% 0.13% 0.18% 0.81% 0.08% 0.46%
Indirect Loans
30 to 59 Days Past Due 0.59% 0.54% 0.49% 0.51% 0.64% 0.49%
60 to 89 Days Past Due 0.18% 0.12% 0.19% 0.16% 0.10% 0.07%
Over 90 Days Past Due 0.05% 0.05% 0.07% 0.06% 0.09% 0.07%
Non Accrual 0.30% 0.30% 0.32% 0.36% 0.39% 0.40%
Total 30+ Days Past Due 1.12% 1.00% 1.08% 1.08% 1.23% 1.04%
Net Charge-Offs 0.44% 0.43% 0.42% 0.54% 0.43% 0.31%
Credit Card Loans
30 to 59 Days Past Due 0.49% 0.27% 0.42% 0.32% 0.40% 0.37%
60 to 89 Days Past Due 0.45% 0.38% 0.18% 0.24% 0.30% 0.48%
Over 90 Days Past Due 0.61% 0.99% 0.72% 0.64% 0.54% 0.00%
Total 30+ Days Past Due 1.55% 1.63% 1.32% 1.20% 1.24% 0.85%
Net Charge-Offs 1.34% 2.82% 4.31% 2.48% 2.63% 3.03%
Other Consumer Loans
30 to 59 Days Past Due 1.20% 1.07% 0.70% 0.47% 0.83% 0.58%
60 to 89 Days Past Due 0.35% 0.15% 0.13% 0.33% 0.75% 0.25%
Over 90 Days Past Due 0.82% 0.12% 0.23% 0.36% 0.35% 0.45%
Total 30+ Days Past Due 2.37% 1.34% 1.07% 1.15% 1.94% 1.28%
Net Charge-Offs 1.88% 2.03% 1.40% 3.35% 1.54% 2.57%
Source: SNL on April 28, 2010 21
Appendix
Consumer Portfolio Past Dues
51
Appendix
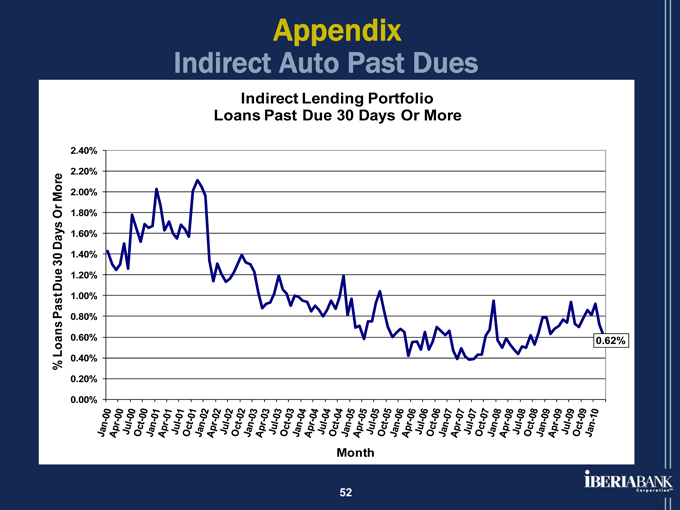
Indirect Auto Past Dues
Indirect Lending Portfolio Loans Past Due 30 Days Or More
% Loans Past Due 30 Days Or More
2.40% 2.20% 2.00% 1.80% 1.60% 1.40% 1.20% 1.00% 0.80% 0.60% 0.40% 0.20% 0.00%
0.62%
Jan-00
Apr-00
Jul-00
Oct-00
Jan-01
Apr-01
Jul-01
Oct-01
Jan-02
Apr-02
Jul-02
Oct-02
Jan-03
Apr-03
Jul-03
Oct-03
Jan-04
Apr-04
Jul-04
Oct-04
Jan-05
Apr-05
Jul-05
Oct-05
Jan-06
Apr-06
Jul-06
Oct-06
Jan-07
Apr-07
Jul-07
Oct-07
Jan-08
Apr-08
Jul-08
Oct-08
Jan-09
Apr-09
Jul-09
Oct-09
Jan-10
Month
52
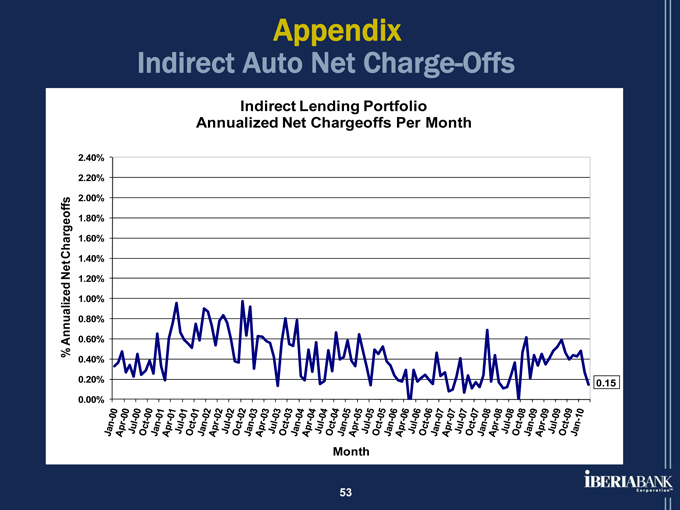
Appendix
Indirect Auto Net Charge-Offs
Indirect Lending Portfolio Annualized Net Chargeoffs Per Month
% Annualized Net Chargeoffs
2.40% 2.20% 2.00% 1.80% 1.60% 1.40% 1.20% 1.00% 0.80% 0.60% 0.40% 0.20% 0.00%
Jan-00
Apr-00
Jul-00
Oct-00
Jan-01
Apr-01
Jul-01
Oct-01
Jan-02
Apr-02
Jul-02
Oct-02
Jan-03
Apr-03
Jul-03
Oct-03
Jan-04
Apr-04
Jul-04
Oct-04
Jan-05
Apr-05
Jul-05
Oct-05
Jan-06
Apr-06
Jul-06
Oct-06
Jan-07
Apr-07
Jul-07
Oct-07
Jan-08
Apr-08
Jul-08
Oct-08
Jan-09
Apr-09
Jul-09
Oct-09
Jan-10
Month
0.15
53
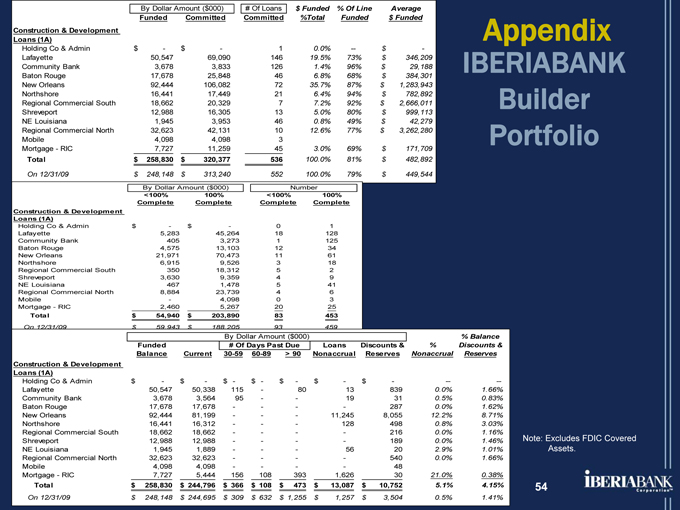
By Dollar Amount ($000) # Of Loans $ Funded% Of Line Average
Funded Committed Committed%Total Funded $ Funded
Construction & Development
Loans (1A)
Holding Co & Admin $- $- 1 0.0% - $ -
Lafayette 50,547 69,090 146 19.5% 73% $ 346,209
Community Bank 3,678 3,833 126 1.4% 96% $ 29,188
Baton Rouge 17,678 25,848 46 6.8% 68% $ 384,301
New Orleans 92,444 106,082 72 35.7% 87% $ 1,283,943
Northshore 16,441 17,449 21 6.4% 94% $ 782,892
Regional Commercial South 18,662 20,329 7 7.2% 92% $ 2,666,011
Shreveport 12,988 16,305 13 5.0% 80% $ 999,113
NE Louisiana 1,945 3,953 46 0.8% 49% $ 42,279
Regional Commercial North 32,623 42,131 10 12.6% 77% $ 3,262,280
Mobile 4,098 4,098 3
Mortgage - RIC 7,727 11,259 45 3.0% 69% $ 171,709
Total $ 258,830 $ 320,377 536 100.0% 81% $ 482,892
On 12/31/09 $ 248,148 $ 313,240 552 100.0% 79% $ 449,544
By Dollar Amount ($000) Number
<100% 100% <100% 100%
Complete Complete Complete Complete
Construction & Development
Loans (1A)
Holding Co & Admin $-$-0 1
Lafayette 5,283 45,264 18 128
Community Bank 405 3,273 1 125
Baton Rouge 4,575 13,103 12 34
New Orleans 21,971 70,473 11 61
Northshore 6,915 9,526 3 18
Regional Commercial South 350 18,312 5 2
Shreveport 3,630 9,359 4 9
NE Louisiana 467 1,478 5 41
Regional Commercial North 8,884 23,739 4 6
Mobile - 4,098 0 3
Mortgage - RIC 2,460 5,267 20 25
Total $ 54,940 $ 203,890 83 453
On 12/31/09 $ 59,943 $ 188,205 93 459
By Dollar Amount ($000)% Balance
Funded # Of Days Past Due Loans Discounts &% Discounts &
Balance Current 30-59 60-89 > 90 Nonaccrual Reserves Nonaccrual Reserves
Construction & Development
Loans (1A)
Holding Co & Admin $- $- $- $- $- $- $-
Lafayette 50,547 50,338 115 - 80 13 839 0.0% 1.66%
Community Bank 3,678 3,564 95 - 19 31 0.5% 0.83%
Baton Rouge 17,678 17,678 - 287 0.0% 1.62%
New Orleans 92,444 81,199 - 11,245 8,055 12.2% 8.71%
Northshore 16,441 16,312 - 128 498 0.8% 3.03%
Regional Commercial South 18,662 18,662 - 216 0.0% 1.16%
Shreveport 12,988 12,988 - 189 0.0% 1.46%
NE Louisiana 1,945 1,889 - 56 20 2.9% 1.01%
Regional Commercial North 32,623 32,623 - 540 0.0% 1.66%
Mobile 4,098 4,098 - 48
Mortgage - RIC 7,727 5,444 156 108 393 1,626 30 21.0% 0.38%
Total $ 258,830 $ 244,796 $ 366 $ 108 $ 473 $ 13,087 $ 10,752 5.1% 4.15%
On 12/31/09 $ 248,148 $ 244,695 $ 309 $ 632 $ 1,255 $ 1,257 $ 3,504 0.5% 1.41%
Appendix
IBERIABANK Builder Portfolio
Note: Excludes FDIC Covered Assets.
54
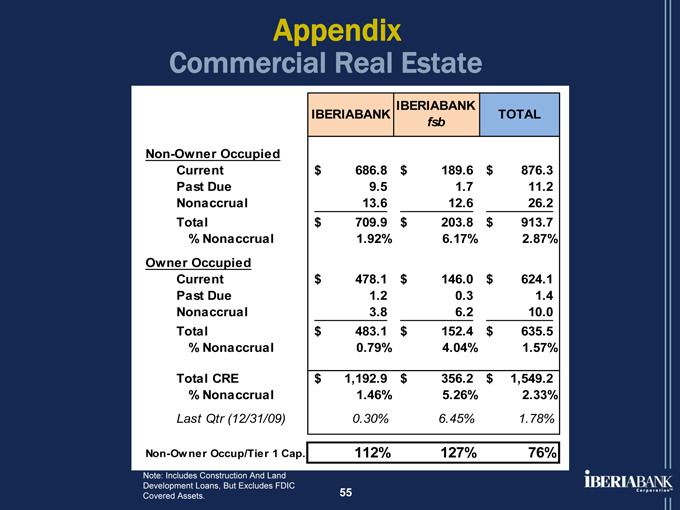
Appendix
Commercial Real Estate
IBERIABANK IBERIABANK TOTAL
fsb
Non-Owner Occupied
Current $ 686.8 $ 189.6 $ 876.3
Past Due 9.5 1.7 11.2
Nonaccrual 13.6 12.6 26.2
Total $ 709.9 $ 203.8 $ 913.7
% Nonaccrual 1.92% 6.17% 2.87%
Owner Occupied
Current $ 478.1 $ 146.0 $ 624.1
Past Due 1.2 0.3 1.4
Nonaccrual 3.8 6.2 10.0
Total $ 483.1 $ 152.4 $ 635.5
% Nonaccrual 0.79% 4.04% 1.57%
Total CRE $ 1,192.9 $ 356.2 $ 1,549.2
% Nonaccrual 1.46% 5.26% 2.33%
Last Qtr (12/31/09) 0.30% 6.45% 1.78%
Non-Owner Occup/Tier 1 Cap. 112% 127% 76%
Note: Includes Construction And Land Development Loans, But Excludes FDIC
Covered Assets. 55
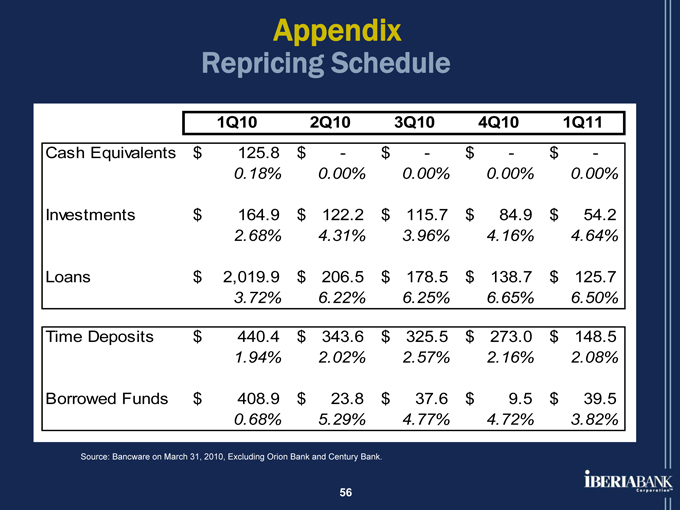
Appendix
Repricing Schedule
1Q10 2Q10 3Q10 4Q10 1Q11
Cash Equivalents $ 125.8 $ - $ - $ - $ -
0.18% 0.00% 0.00% 0.00% 0.00%
Investments $ 164.9 $ 122.2 $ 115.7 $ 84.9 $ 54.2
2.68% 4.31% 3.96% 4.16% 4.64%
Loans $ 2,019.9 $ 206.5 $ 178.5 $ 138.7 $ 125.7
3.72% 6.22% 6.25% 6.65% 6.50%
Time Deposits $ 440.4 $ 343.6 $ 325.5 $ 273.0 $ 148.5
1.94% 2.02% 2.57% 2.16% 2.08%
Borrowed Funds $ 408.9 $ 23.8 $ 37.6 $ 9.5 $ 39.5
0.68% 5.29% 4.77% 4.72% 3.82%
Source: Bancware on March 31, 2010, Excluding Orion Bank and Century Bank.
56
Appendix
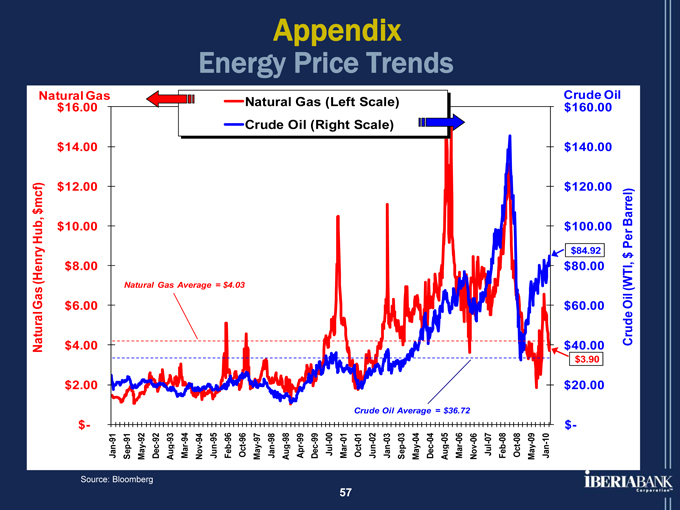
Energy Price Trends
Natural Gas (Henry Hub, $mcf)
Natural Gas $16.00
$14.00 $12.00 $10.00 $8.00 $6.00 $4.00 $2.00 $-
Natural Gas (Left Scale) Crude Oil (Right Scale)
Natural Gas Average = $4.03
Crude Oil Average = $36.72
Jan-91
Sep-91
May-92
Dec-92
Aug-93
Mar-94
Nov-94
Jun-95
Feb-96
Oct-96
May-97
Jan-98
Aug-98
Apr-99
Dec-99
Jul-00
Mar-01
Oct-01
Jun-02
Jan-03
Sep-03
May-04
Dec-04
Aug-05
Mar-06
Nov-06
Jul-07
Feb-08
Oct-08
May-09
Jan-10
Crude
$160.00
$140.00
$120.00
$100.00
$84.92
$80.00
$60.00
$40.00
$3.90
$20.00
$-
Crude Oil (WTI, $ Per Barrel)
Source: Bloomberg
57

Appendix
Mortgage Quarterly Revenues
Mortgage Gains On Sale Of Loans
Quarterly Mortgage Revenues ($ Million) $
$11.0 $10.0 $9.0 $8.0 $7.0 $6.0 $5.0 $4.0 $3.0 $2.0 $1.0 $-
1st Qtr 2nd Qtr 3rd Qtr 4th Qtr
2003 2004 2005 2006 2007 2008 2009 2010
** Assumes Pulaski’s acquisition of IBERIABANK Mortgage beginning in February 2007
58
In 1Q10 Closed $295mm (-16% Vs. 4Q09)
In 1Q10 Sold $287mm (-14% Vs. 4Q09)
5th Highest Revenue Quarter in Company History
1Q10 Vs. 4Q09: 13% Decrease In Mtg. Revenues
$169mm Locked Pipeline 4/16/10
Appendix
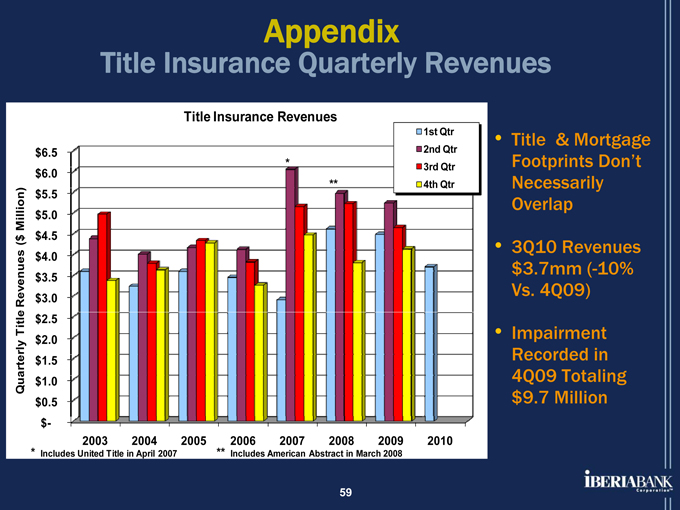
Title Insurance Quarterly Revenues
Quarterly Title Revenues ($ Million)
$6.5 $6.0 $5.5 $5.0 $4.5 $4.0 $3.5 $3.0 $2.5 $2.0 $1.5 $1.0 $0.5 $-
2003 2004 2005 2006 2007 2008 2009 2010
Includes United Title in April 2007 ** Includes American Abstract in March 2008
Title Insurance Revenues
1st Qtr 2nd Qtr 3rd Qtr 4th Qtr
Title & Mortgage Footprints Don’t Necessarily Overlap
3Q10 Revenues $3.7mm (-10% Vs. 4Q09)
Impairment Recorded in 4Q09 Totaling $9.7 Million
59

60