2Q10 Earnings Conference Call Supplemental Materials July 21, 2010 Exhibit 99.2 |
2 Forward Looking Statements Safe Harbor Statements contained in this presentation which are not historical facts and which pertain to future operating results of IBERIABANK Corporation and its subsidiaries constitute “forward-looking statements” within the meaning of the Private Securities Litigation Reform Act of 1995. These forward-looking statements involve significant risks and uncertainties. Actual results may differ materially from the results discussed in these forward-looking statements. Factors that might cause such a difference include, but are not limited to, those discussed in the Company’s periodic and other filings with the SEC. |
3 Introductory Comments |
4 Introductory Comments Summary – Position Favorable Balance Sheet Composition Very Balanced; Core Funded; Low C&D Exposure Continued Good Asset Quality; Extraordinary Capital Favorable Interest Rate And Credit Risk Positioning Some of the Highest Capital Ratios of Bank Holding Companies with More Than $5 Billion in Assets Approximately $1.0 Billion in Excess Cash Future Growth Engines in Multiple Markets Strategic Recruiting Continued During The 2 nd Quarter Fortunately, We Avoided What Ails The Banking Industry Remain Well Positioned For Future Opportunities |
Corporate Overview 2Q10 Deposit Market Share as of June 30, 2009 Source: SNL Financial Map Reflects Locations as of June 30, 2010 NASDAQ Traded IBKC Headquarters Lafayette, LA Founded 1887 Market Cap $ 1.4 Billion Locations 214 (Bank Branches 134) FTE’s 1,993 Asset Size $ 10.4 Billion Deposits $ 8.1 Billion Loans $ 5.8 Billion Clients 216,000 Subsidiaries IBERIABANK IBERIABANK fsb Lenders Title Arkansas 36 Branches $964 mm deposits #11 Rank 23 Non-bank Offices Texas 2 Branches Opened in 2009 Not Yet Ranked 3 Non-bank Offices Louisiana 50 Branches $3.14 bil deposits #5 Rank 22 Non-bank Offices Alabama 8 Branches $411 mm deposits #23 Rank 3 Non-bank Offices Florida 36 Branches $2.96 bil deposits #20 Rank 8 Non-bank Offices Tennessee 2 Branches $101 mm deposits #145 Rank 1 Non-bank Office |
6 Introductory Comments Strategic Goals & Priorities • Double-Digit Annual EPS Growth • ROTE Of 23% - 25% • Bank Tangible Efficiency < 50% • Top Quartile Asset Quality • Develop Memphis, Mobile & Houston • Deepen Share In Little Rock, Baton Rouge, New Orleans, And Shreveport • Expand Wealth Management/Financial Advisory Business • Provide Depth For Unusual Opportunities • Grind Our Way Through The Credit Cycle Strategic Strategic Goals Goals 18-Month 18-Month Priorities Priorities |
7 Financial Overview |
8 Introductory Comments Summary – 2Q10 and 6/30/10 T/E Net Interest Income Up $1.7mm (+2%) Credit Quality Statistics Excluding FDIC Covered Assets: • NPA/Assets = 0.91% (1.01% in 1Q10) • 30+ Days Past Due = 1.90% (2.04% in 1Q10) • Loan Loss Reserve/Loans = 1.52% (1.53% in 1Q10) • Net COs/Avg Loans = 0.57% (0.41% in 1Q10) • Provision = $6mm ($13mm in 1Q10) Minimal Investment Sale Gains in 2Q10 ($0.1mm Gain in 1Q10) One-Time Acquisition Related Costs = $3.5mm ($2.3mm in 1Q10) EPS = $0.33, Down 45% from 1Q10 $6.4mm or $0.15 EPS Impact In 2Q10 Related To Additional Impairment On FDIC Covered Assets |
9 Financial Overview Favorable Balance Sheet Growth 2Q10 Results 2Q10 Results • Loans +$21mm, +0.4% • Deposits +$119mm +1% • Loan/Deposits = 71% • Equity = +$6mm, +1% • Equity/Assets = 12.56% • Tier 1 Leverage = 11.15% • Div Payout = 103.3% • ROA = 0.34% • ROE = 2.73% • ROTE = 3.73% • Efficiency Ratio = 75% • Tang Eff. Ratio = 72% • BV/Share = $48.31 • Tang BV/Share = $38.71 |
New Markets Loans 10 data through July 19, 2010 |
New Markets Non-Core Deposits 11 data through July 19, 2010 |
New Markets Core Deposits 12 Deposit data through July 19, 2010 |
13 Financial Overview Trends - Mortgage Interest Rates Source: Bloomberg Source: Bloomberg Conforming Rates Remain Low Substantial Refi Activity Sales Spreads Remain Favorable Improved Competitive Dynamics In Mortgage Business |
14 Financial Overview Trends – Jumbo Mortgage Rates Source: Bloomberg Source: Bloomberg Subprime Mtg. Market Gone & Alt-A Market Is Stalled Jumbo Spread Has Narrowed Considerably Mix Of FHA/VA & Conforming Product In June, 42% Of Our Production Was FHA/VA And 45% Was Conventional |
15 Financial Overview Mortgage Quarterly Revenues In 2Q10 Closed $442mm (+50% Vs. 1Q10) In 2Q10 Sold $400mm (+39% Vs. 1Q10) 2 nd Highest Revenue Quarter in Company History 2Q10 Vs. 1Q10: 44% Increase In Mtg. Revenues $197mm Locked Pipeline on 7/16/10 |
16 Financial Overview Title Insurance Qtrly Revenues Title & Mortgage Footprints Don’t Necessarily Overlap 2Q10: $4.8mm In Revenues (+30% Vs. 1Q10) Impairment Recorded in 4Q09 Totaling $9.7 mm |
17 Financial Overview Quarterly Repricing Schedule Excess Cash Methodically Being Deployed Favorable Repricing Opportunities Includes Orion Bank and Century Bank Acquisitions 2Q10 3Q10 4Q10 1Q11 2Q11 Cash Equivalents 1,094.1 $ - $ - $ - $ - $ 1.27% 0.00% 0.00% 0.00% 0.00% Investments 191.6 $ 157.0 $ 109.3 $ 96.4 $ 77.6 $ 3.69% 4.24% 4.49% 4.31% 4.45% Loans 2,427.8 $ 295.6 $ 326.5 $ 282.3 $ 221.0 $ 4.86% 6.09% 5.04% 5.50% 5.22% Time Deposits 667.1 $ 579.2 $ 471.7 $ 453.6 $ 219.3 $ 2.08% 1.87% 1.85% 1.77% 2.06% Borrowed Funds 407.9 $ 8.5 $ 39.8 $ 1.0 $ 6.3 $ 1.76% 4.94% 2.41% 4.12% 4.59% |
18 Financial Overview Interest Rate Simulations Source: Bancware Source: Bancware Bancware model, as of June 30, 2010 model, as of June 30, 2010 As Rates Have Fallen And Cash Has Accumulated, Become More Asset Sensitive Degree Is A Function Of The Reaction Of Competitors To Changes In Deposit Pricing Forward Curve Has A Positive Impact Over 12 Months Includes FDIC Assisted Acquisitions of CapitalSouth, Orion and Century Base Blue Forward Change In: -200 bp -100 bp Case +100 bp +200 bp Chip Curve Net Interest Income -2.2% -1.6% 0.0% 10.0% 20.4% 2.0% 1.2% Economic Value of Equity -9.8% -5.7% 0.0% 2.4% 1.4% -0.7% 0.7% |
19 Capital Annual Change In Stock Price |
20 Capital Last 12 Months Price Change By Index Source: SNL Through July 19, 2010 Source: SNL Through July 19, 2010 (20.0) (15.0) (10.0) (5.0) - 5.0 10.0 15.0 20.0 25.0 30.0 35.0 New England Banks Banks $500M-$1B Micro Cap Banks Banks $1B-$5B Banks $250M-$500M Banks < $500M NASDAQ Bank Western Banks Banks < $250M NASDAQ Finl NYSE Large Cap Banks Banks Mid-Atlantic Banks Banks > $10B S&P 500 Southeast Banks Russell 3000 All Financial Institutions S&P Financials NASDAQ Russell 2000 S&P Small-Cap S&P Bank Banks $5B-$10B Midwest Banks Small Cap Banks IBERIABANK Corporation S&P Mid-Cap KBW Bank Mid Cap Banks Southwest Banks TARP Participants +24% |
21 Capital 3 Years Price Change By Index Source: SNL Through July 16, 2010 Source: SNL Through July 16, 2010 (80.0) (70.0) (60.0) (50.0) (40.0) (30.0) (20.0) (10.0) - 10.0 Southeast Banks S&P Bank Micro Cap Banks Mid Cap Banks S&P Financials Banks > $10B KBW Bank Banks Mid-Atlantic Banks Large Cap Banks TARP Participants Midwest Banks Banks $250M-$500M Banks < $500M All Financial Institutions Banks $500M-$1B Banks $1B-$5B Banks < $250M Small Cap Banks NASDAQ Bank New England Banks Banks $5B-$10B NASDAQ Finl Southwest Banks NYSE Western Banks S&P 500 Russell 3000 Russell 2000 S&P Small-Cap S&P Mid-Cap NASDAQ IBERIABANK Corporation +10% |
22 Asset Quality |
Residential 7% Home Equity 8% Credit Card 1% Automobile 1% Indirect Automobile 4% Other Consumer 1% Business 17% Commercial RE 23% All Other Loans 2% CapitalSouth Gross Loans = 4%, Discount = 1% Orion Gross Loans = 13%, Discount = 9% Century Gross Loans = 6%, Discount = 3% indicates loan discount 23 Asset Quality Loan Portfolio Mix % based on gross portfolio – excluding discounts on loans acquired in FDIC-assisted transactions $000s % of CRE % Loans C&D-IBERIABANK fsb 59,218 $ 4% 1% C&D-IBERIABANK 243,191 16% 4% CRE-Owner Occupied 588,305 38% 9% CRE-Non-Owner Occupied 670,320 43% 10% Total Commercial RE 1,561,034 $ 100% 23% |
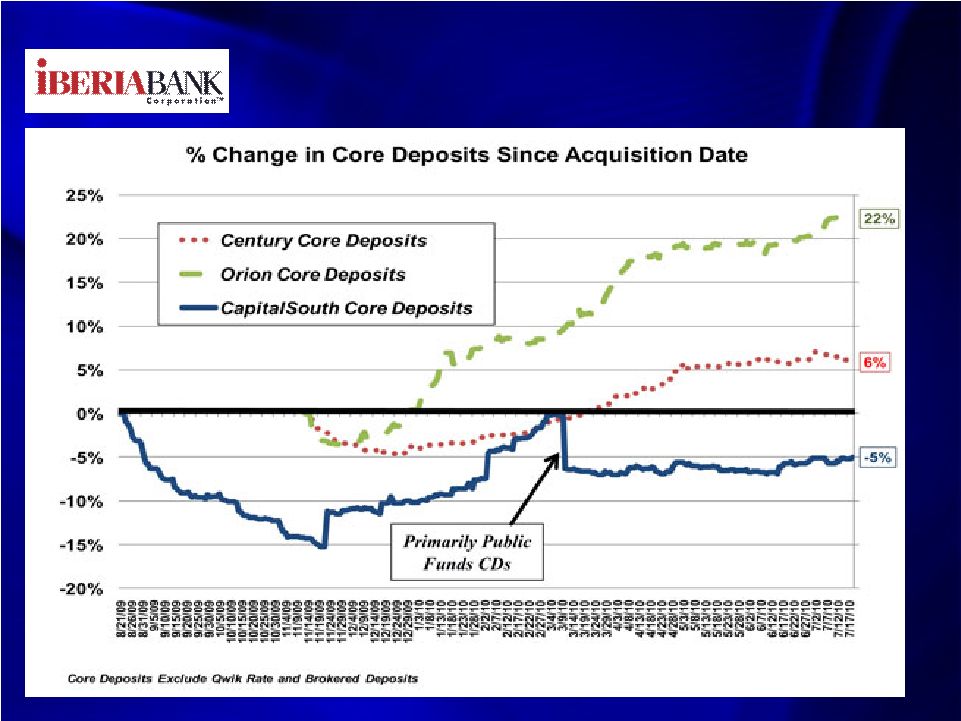
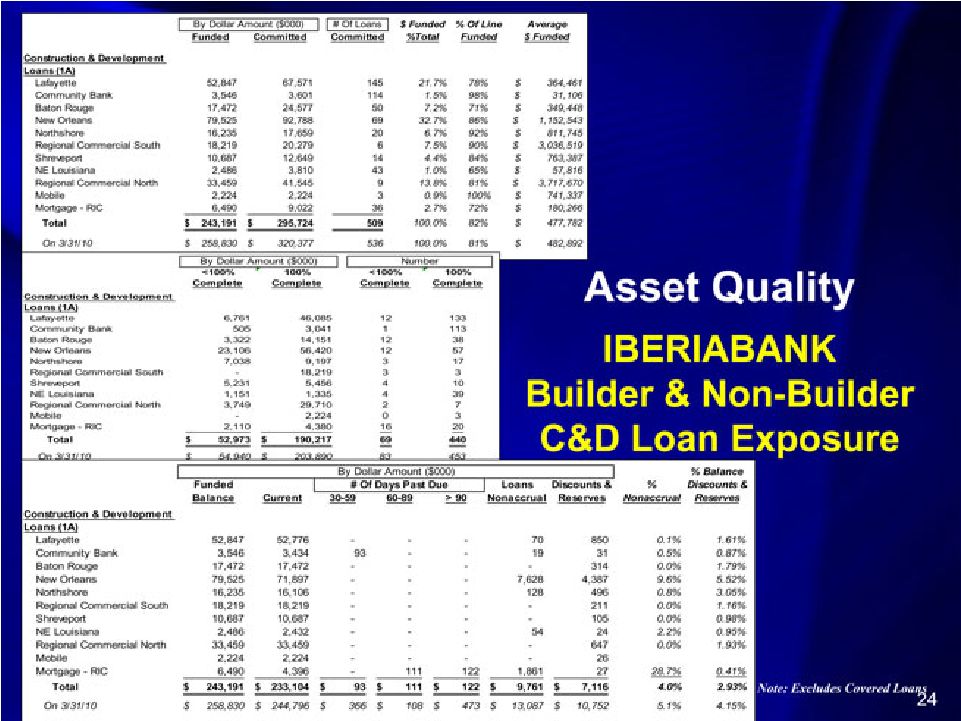
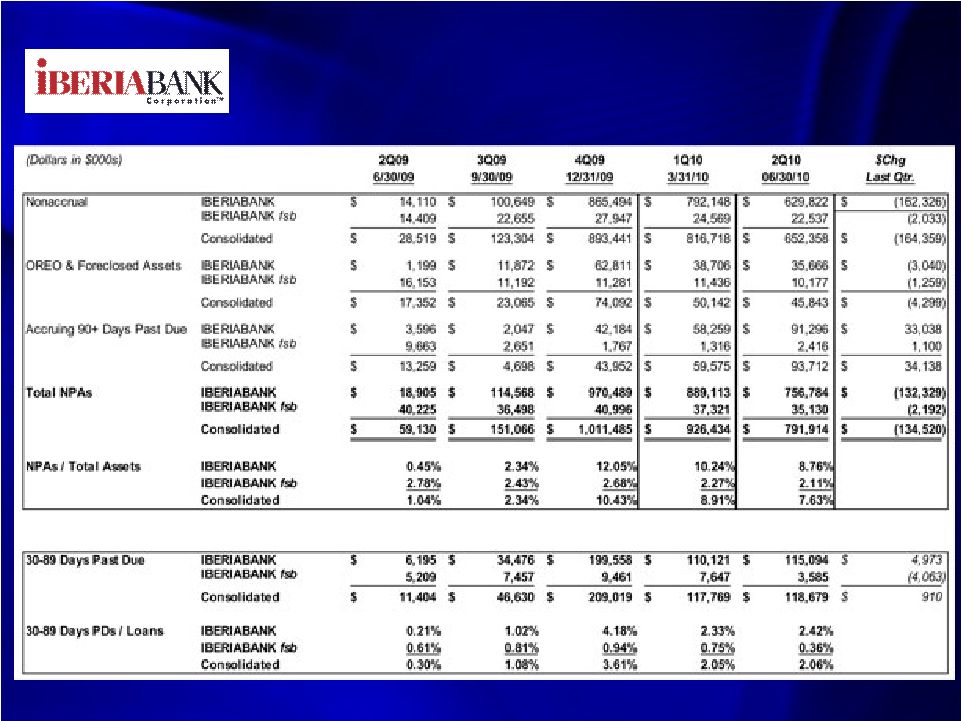
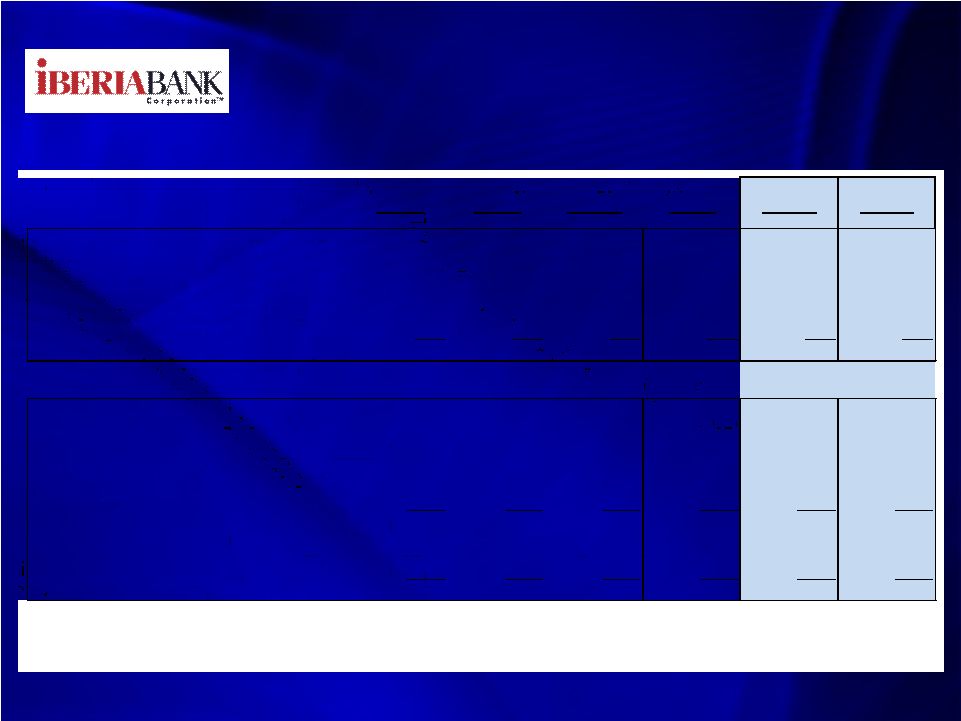
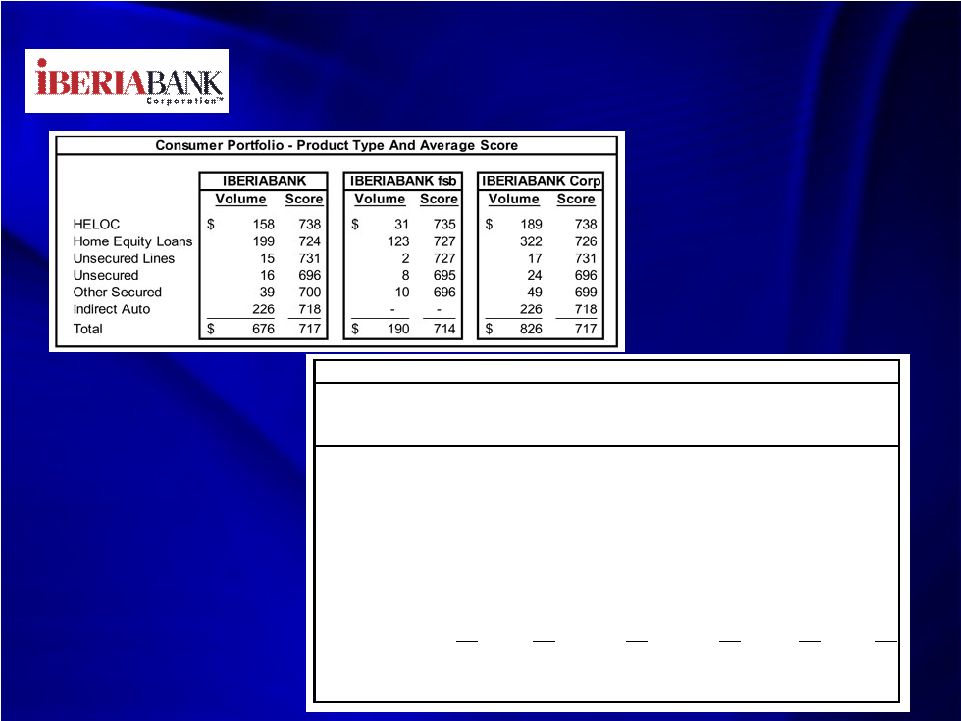
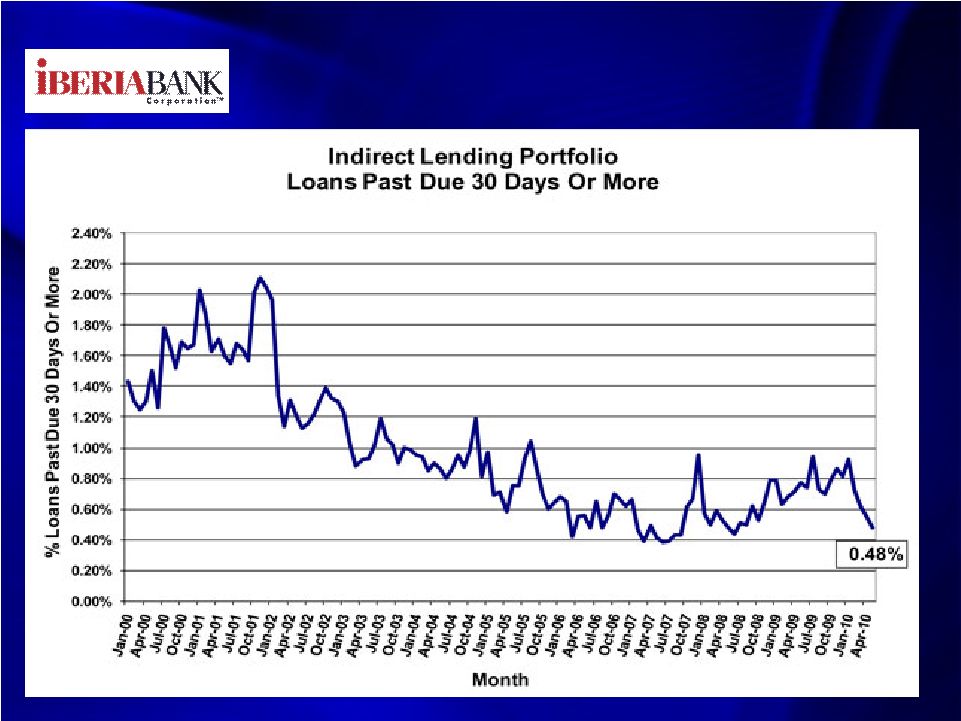
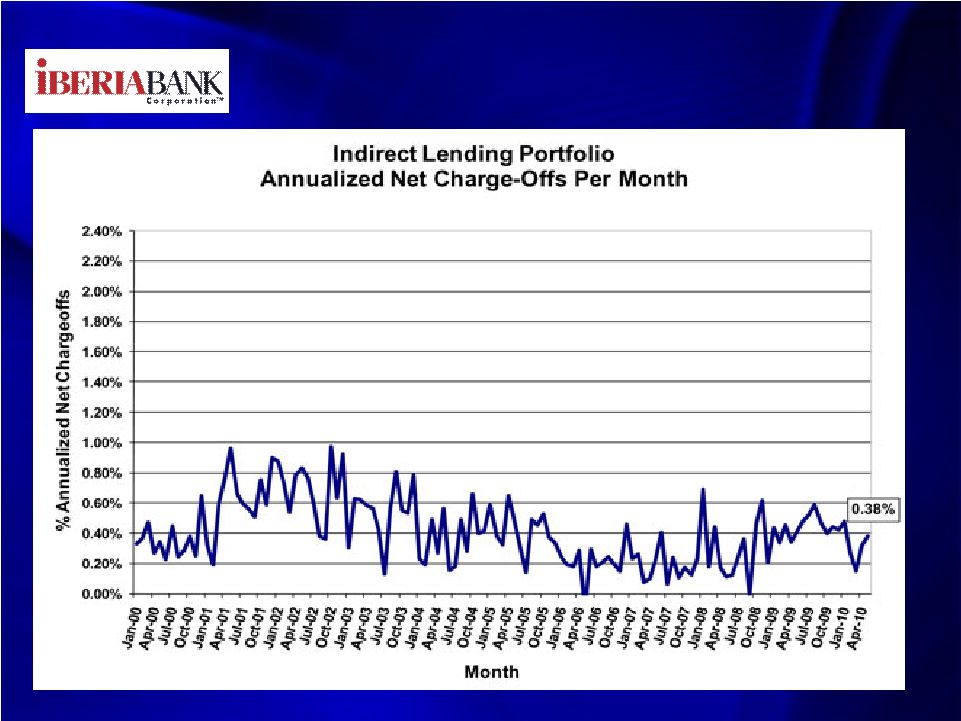
25 Asset Quality 2Q10 Compared To Prior Quarters Note: Includes FDIC Assisted Acquisitions ($thousands) 4Q09 1Q10 2Q10 4Q09 1Q10 2Q10 4Q09 1Q10 2Q10 Nonaccruals 865,494 $ 792,148 $ 629,822 $ 27,947 $ 24,569 $ 22,537 $ 893,441 $ 816,717 $ 652,358 $ OREO & Foreclosed 62,811 38,706 35,666 11,281 11,436 10,177 74,092 50,142 45,843 90+ Days Past Due 42,184 58,259 91,296 1,767 1,316 2,416 43,952 59,575 93,712 Nonperforming Assets 970,489 $ 889,113 $ 756,784 $ 40,996 $ 37,321 $ 35,130 $ 1,011,485 $ 926,434 $ 791,914 $ NPAs/Assets 12.05% 10.24% 8.76% 2.68% 2.27% 2.11% 10.43% 8.91% 7.63% NPAs/(Loans + OREO) 20.05% 18.67% 15.77% 4.03% 3.64% 3.49% 17.27% 16.00% 13.64% LLR/Loans 0.72% 0.93% 1.59% 2.12% 1.98% 2.04% 0.96% 1.11% 1.67% Net Charge-Offs/Loans 0.04% 0.13% 0.47% 0.78% 1.41% 0.31% 0.18% 0.36% 0.44% Past Dues: 30-89 Days Past Due 199,558 $ 110,121 $ 115,094 $ 9,461 $ 7,647 $ 3,585 $ 209,019 $ 117,769 $ 118,679 $ 90+ days Past Due 42,184 58,259 91,296 1,767 1,316 2,416 43,952 59,575 93,712 Nonaccual Loans 865,494 792,148 629,822 27,947 24,569 22,537 893,441 816,717 652,358 Total 30+ Past Dues 1,107,236 $ 960,528 $ 836,213 $ 39,176 $ 33,533 $ 28,537 $ 1,146,412 $ 994,061 $ 864,750 $ % Loans 23.17% 20.33% 17.55% 3.90% 3.30% 2.86% 19.82% 17.32% 15.01% Loan Mix: Commercial 61.6% 61.9% 64.6% 67.8% 69.1% 68.5% 62.7% 63.0% 65.0% Consumer 11.7% 11.8% 13.3% 19.0% 18.5% 18.9% 13.0% 13.0% 14.3% Mortgage 19.6% 19.2% 14.9% 6.8% 6.4% 6.6% 17.3% 17.1% 13.6% Business Banking 1.7% 1.6% 1.6% 2.1% 2.0% 1.9% 1.7% 1.7% 1.7% Indirect 5.4% 5.5% 5.6% 0.0% 0.0% 0.0% 4.5% 4.5% 4.7% Credit Cards 0.0% 0.0% 0.0% 4.3% 4.0% 4.1% 0.8% 0.7% 0.7% Total Loans 100.0% 100.0% 100.0% 100.0% 100.0% 100.0% 100.0% 100.0% 100.0% IBERIABANK IBERIABANK fsb IBERIABANK Corporation |
26 Asset Quality Loans Past Due + Non-Accruals By Entity: 3/31/09 6/30/09 9/30/09 12/31/09 3/31/10 6/30/10 IBERIABANK (Ex-FDIC Covered Assets) 30+ days past due 0.31% 0.33% 0.32% 0.58% 0.67% 0.81% Non-accrual 0.54% 0.47% 0.45% 0.38% 0.94% 0.78% Total Past Due 0.85% 0.80% 0.77% 0.96% 1.61% 1.59% IBERIABANK fsb 30+ days past due 1.85% 1.73% 1.09% 1.12% 0.88% 0.60% Non-accrual 2.12% 1.68% 2.45% 2.78% 2.42% 2.26% Total Past Due 3.97% 3.41% 3.54% 3.90% 3.30% 2.86% Consolidated (Ex-FDIC Covered Assets) 30+ days past due 0.65% 0.64% 0.50% 0.72% 0.73% 0.77% Non-accrual 0.90% 0.74% 0.92% 0.97% 1.31% 1.13% Total Past Due 1.55% 1.38% 1.42% 1.69% 2.04% 1.90% CapitalSouth Only 30+ days past due 7.62% 7.59% 10.01% 9.78% Non-accrual 24.64% 29.68% 23.97% 26.19% Total Past Due 32.26% 37.27% 33.98% 35.97% Orion Only 30+ days past due 16.54% 8.56% 12.49% Non-accrual 57.58% 59.86% 41.73% Total Past Due 74.12% 68.42% 54.22% Century Only 30+ days past due 10.52% 10.81% 11.79% Non-accrual 53.50% 43.73% 45.10% Total Past Due 64.02% 54.54% 56.89% Consolidated With FDIC Covered Assets 30+ days past due 1.08% 4.37% 3.09% 3.69% Non-accrual 2.87% 15.45% 14.23% 11.32% Total Past Due 3.95% 19.82% 17.32% 15.01% Loans Past Due Loans Past Due 30 Days Or More And Nonaccruing Loans As % Of Loans Outstanding |
27 Asset Quality Trends – Entity NPAs & Past Dues Note: Includes FDIC Assisted Acquisitions |
28 Asset Quality Trends – Entity LLR & Net COs Note: Includes FDIC Assisted Acquisitions (Dollars in $000s) 2Q09 3Q09 4Q09 1Q10 2Q10 $Chg 6/30/09 9/30/09 12/31/09 3/31/10 06/30/10 Last Qtr. Loan Loss Reserve* IBERIABANK 30,098 $ 31,629 $ 34,431 $ 43,763 $ 75,660 $ 31,897 $ IBERIABANK fsb 16,231 17,158 21,337 20,112 20,340 228 Consolidated 46,329 $ 48,787 $ 55,768 $ 63,875 $ 96,000 $ 32,125 $ LLR / Total Loans IBERIABANK 1.01% 0.94% 0.72% 0.93% 1.59% IBERIABANK fsb 1.89% 1.86% 2.12% 1.98% 2.04% Consolidated 1.21% 1.13% 0.96% 1.11% 1.67% Net Charge-Offs IBERIABANK 553 $ 8,943 $ 419 $ 1,530 $ 5,351 $ 3,821 $ IBERIABANK fsb 2,562 14,041 1,865 3,564 760 (2,804) Consolidated 3,116 $ 22,984 $ 2,284 $ 5,094 $ 6,111 $ 1,017 $ Net COs/Avg Loans IBERIABANK 0.08% 1.13% 0.04% 0.13% 0.46% IBERIABANK fsb 1.22% 6.16% 0.78% 1.41% 0.31% Consolidated 0.33% 2.26% 0.18% 0.36% 0.44% LLR Coverage Of NPAs IBERIABANK 159% 28% 4% 5% 10% IBERIABANK fsb 40% 47% 52% 54% 58% Consolidated 78% 32% 6% 7% 12% * Does not include loan discounts associated with acquisitions. |
29 Asset Quality Loan Mix And 30 Days+ Past Due (Dollars in $000s) 2Q09 3Q09 4Q09 1Q10 2Q10** 2Q10 6/30/09 9/31/09 12/31/09 3/31/10 06/30/10 06/30/10 % of Outstandings Commercial 60.9% 63.1% 62.7% 63.0% 65.7% 65.0% Mortgage 12.5% 12.6% 17.3% 17.1% 10.2% 13.6% Consumer 15.9% 14.8% 13.0% 13.0% 14.6% 14.3% Indirect 7.1% 6.2% 4.5% 4.5% 6.4% 4.7% Business Banking 2.6% 2.3% 1.7% 1.7% 2.3% 1.7% Credit Cards 1.0% 1.0% 0.8% 0.7% 1.0% 0.7% Total Loans 100.0% 100.0% 100.0% 100.0% 100.0% 100.0% Past Due 30+ Days* Commercial 1.45% 4.82% 24.62% 21.17% 2.04% 17.08% Mortgage 1.25% 4.25% 17.52% 16.61% 1.92% 16.54% Consumer 1.20% 1.82% 9.74% 8.06% 1.68% 10.96% Indirect 1.06% 1.05% 1.19% 1.01% 0.78% 0.78% Business Banking 1.29% 1.33% 2.17% 2.73% 2.51% 2.51% Credit Cards 1.32% 1.20% 1.52% 2.12% 1.48% 1.71% Total Loans 1.38% 3.95% 19.82% 17.32% 1.90% 15.01% IBERIABANK 0.80% 4.06% 23.04% 20.21% 1.59% 17.42% IBERIABANK fsb 3.41% 3.54% 3.90% 3.30% 2.86% 2.86% Consolidated 1.38% 3.95% 19.82% 17.32% 1.90% 15.01% * Includes nonaccruing loans ** Excludes FDIC assisted acquisitions |
30 Asset Quality Loan Loss Reserve IBERIABANK Franchise • IBERIABANK Comprises 82% Of Consolidated Loan Portfolio • Legacy IBERIABANK Credits Performing Very Well • Classified Assets And NPAs Remain Favorable • $ 12 Million Loan Loss Provision In 2Q10 (1Q10 = $11 Million) IBERIABANKfsb Franchise • Construction Portfolio Continues To Compress • Continuing To Aggressively Address Potential Problems • $1 Million Loan Loss Provision in 2Q10 (1Q10 = $2 Million) $6.0 Million In Legacy Net Charge-Offs In 2Q10 (0.57% Of Average Loans) 2Q09 3Q09 4Q09 1Q10 2Q10 Net Charge-Offs - Legacy IBKC 5,358 $ 22,980 $ 2,283 $ 5,094 $ 5,956 $ Loan Growth 864 5,325 14,326 (501) 354 Change In Asset Quality 3,803 (3,009) (7,350) 8,608 158 Loan Loss Provision - Legacy IBKC 10,025 $ 25,295 $ 9,260 $ 13,201 $ 6,468 $ Loan Loss Provision - FDIC Acqs. - - - - 6,431 Total Loan Loss Provision 10,025 $ 25,295 $ 9,260 $ 13,201 $ 12,899 $ Net Charge-Offs/Avg. Loans 0.33% 2.25% 0.18% 0.36% 0.44% Loan Loss Reserve/Loans 1.21% 1.14% 0.96% 1.11% 1.67% |
31 Asset Quality C&D Loans And NPAs Compared To Peers Source: SNL, using most recent quarterly information Source: SNL, using most recent quarterly information The Lowest Level Of C&D Loan Exposure Compared To Peers One Of The Lowest Levels Of NPAs Compared To Peers 0.0% 5.0% 10.0% 15.0% 20.0% 25.0% 30.0% 35.0% IBKC SFNC SBCF HBHC TRMK PNFP CCBG BXS PRSP WTNY UCBI OZRK 5.0% C&D Loans / Total Loans 0.00% 2.00% 4.00% 6.00% 8.00% 10.00% PRSP IBKC - Ex Acquisitions HBHC SFNC BXS PNFP TRMK OZRK WTNY CCBG UCBI SBCF 0.91% 9.30% IBKC Including Acquisitions NPAs / Total Assets |
32 Asset Quality Commercial Real Estate Loan Portfolio Excludes covered loans related to FDIC-Assisted Acquisitions |
33 Asset Quality Commercial Real Estate Loan Portfolio Note: Includes commercial construction and land development loans Excludes covered loans related to FDIC-Assisted Acquisitions IBERIABANK IBERIABANK fsb TOTAL Non-Owner Occupied Current 696.5 $ 169.8 $ 866.3 $ Past Due 15.1 0.8 15.8 Nonaccrual 10.0 11.7 21.7 Total 721.6 $ 182.3 $ 903.8 $ % Nonaccrual 1.39% 6.41% 2.40% Owner Occupied Current 518.9 $ 127.7 $ 646.6 $ Past Due 2.4 0.1 2.5 Nonaccrual 3.7 4.4 8.1 Total 525.1 $ 132.1 $ 657.2 $ % Nonaccrual 0.71% 3.30% 1.23% Total CRE 1,246.6 $ 314.4 $ 1,561.0 $ % Nonaccrual 1.10% 5.10% 1.91% Last Qtr (3/31/10) 1.46% 5.26% 2.33% Non-Owner Occup/Tier 1 Cap. 98% 112% 74% |
34 Asset Quality Commercial Loan Composition Note: At June 30, 2010; Includes commercial construction and land development loans – excludes Covered Assets |
35 Consumer Loan Portfolio |
36 Consumer Loan Portfolio By Product – Score Distribution Note: Excludes Credit Cards Note: Excludes Credit Cards Excludes Covered Loans from FDIC Acquisitions Score Intervals HELOC Home Equity Loans Unsecured Lines Unsecured Other Secured Indirect Auto 800 + 11% 13% 4% 5% 6% 14% 750 - 799 36% 34% 22% 25% 26% 30% 700 - 749 25% 23% 32% 25% 26% 21% 650 - 699 15% 14% 18% 20% 17% 17% 600 - 649 4% 7% 9% 10% 10% 8% 550 - 599 4% 4% 5% 6% 6% 5% 500 - 549 2% 3% 5% 6% 5% 3% 450 - 499 1% 1% 2% 2% 2% 1% 400 - 449 0% 0% 0% 0% 1% 0% Other 2% 1% 3% 2% 1% 1% Total 100% 100% 100% 100% 100% 100% Avg. Score 738 726 731 692 696 718 Consumer Portfolio - Score Distribution By Product |
37 Consumer Loan Portfolio Past Dues By Product Generally Good And Stable Asset Quality Across Consumer Products Excludes Covered Loans from FDIC Acquisitions 3/31/09 6/30/09 9/30/09 12/31/09 3/31/10 6/30/10 Home Equity Lines of Credit 30 to 59 Days Past Due 0.68% 0.19% 0.32% 0.57% 0.86% 0.47% 60 to 89 Days Past Due 0.07% 0.14% 0.07% 0.33% 0.14% 0.05% Over 90 Days Past Due 0.11% 0.19% 0.13% 0.07% 0.14% 0.29% Total 30+ Days Past Due 0.86% 0.52% 0.51% 0.98% 1.14% 0.80% Net Charge-Offs 0.23% 0.07% 1.25% 0.35% 0.47% 0.58% Home Equity Term Loans 30 to 59 Days Past Due 0.56% 0.46% 0.57% 0.85% 1.08% 0.45% 60 to 89 Days Past Due 0.17% 0.17% 0.20% 0.22% 0.18% 0.24% Over 90 Days Past Due 0.06% 0.28% 0.21% 0.32% 0.19% 0.13% Total 30+ Days Past Due 0.79% 0.91% 0.98% 1.38% 1.45% 0.82% Net Charge-Offs 0.13% 0.18% 0.81% 0.08% 0.46% 0.93% Indirect Loans 30 to 59 Days Past Due 0.54% 0.49% 0.51% 0.64% 0.49% 0.30% 60 to 89 Days Past Due 0.12% 0.19% 0.16% 0.10% 0.07% 0.08% Over 90 Days Past Due 0.05% 0.07% 0.06% 0.09% 0.07% 0.03% Non Accrual 0.30% 0.32% 0.36% 0.39% 0.40% 0.39% Total 30+ Days Past Due 1.00% 1.08% 1.08% 1.23% 1.04% 0.80% Net Charge-Offs 0.43% 0.42% 0.54% 0.43% 0.31% 0.39% Credit Card Loans 30 to 59 Days Past Due 0.27% 0.42% 0.32% 0.40% 0.37% 0.37% 60 to 89 Days Past Due 0.38% 0.18% 0.24% 0.30% 0.48% 0.21% Over 90 Days Past Due 0.99% 0.72% 0.64% 0.54% 0.00% 0.00% Total 30+ Days Past Due 1.63% 1.32% 1.20% 1.24% 0.85% 0.58% Net Charge-Offs 2.82% 4.31% 2.48% 2.63% 3.03% 3.03% Other Consumer Loans 30 to 59 Days Past Due 1.07% 0.70% 0.47% 0.83% 0.58% 0.42% 60 to 89 Days Past Due 0.15% 0.13% 0.33% 0.75% 0.25% 0.21% Over 90 Days Past Due 0.12% 0.23% 0.36% 0.35% 0.45% 0.10% Total 30+ Days Past Due 1.34% 1.07% 1.15% 1.94% 1.28% 0.73% Net Charge-Offs 2.03% 1.40% 3.35% 1.54% 2.57% 1.45% Consumer Loan Portfolio - Quarterly Credit Statistics Loans Past Due As A % of Product Loans |
38 Consumer Loan Portfolio By Product – Origination Mix |
39 Consumer Loan Portfolio By Product – Loan-To-Values |
40 Consumer Loan Portfolio Indirect – 30+ Days Past Dues |
41 Consumer Loan Portfolio Indirect – Net Charge-Offs |
42 Markets |
43 Markets – Local Economies Unemployment – vs. U.S. MSAs Source: U.S. Department of Labor, Bureau of Labor Statistics Source: U.S. Department of Labor, Bureau of Labor Statistics Consistently Low Rates Of Unemploy- ment In Our Legacy MSAs Many Of Our Legacy Markets Not Dependent On Housing For Growth Assets In FDIC- Assisted Acquisition Markets Are Protected Under Loss- Share Agreements |
44 Markets – Local Economies Freddie Mac – Regional Prices FHLMC, "U.S. Home Prices Declined 1.1% Over Last Four Quarters" May 26, 2010 Source: Freddie Mac Source: Freddie Mac Last 5-Year Housing Price Last 12 1Q10 vs. Region States Included Change Months 4Q09 Pacific CA, OR, WA, HI, AK -13.2% 4.5% -7.8% Middle Atlantic NY, NJ, PA 10.1% 1.0% -1.7% West South Central LA, AR, TX, OK 16.6% 0.7% -3.5% West North Central IA, KS, MN, MO, ND, NE, SD -0.2% -1.3% -12.1% New England CT, MA, ME, NH, RI, VT -6.5% -1.7% -4.5% East South Central TN, AL, MS, KY 8.7% -1.8% -11.9% East North Central IL, IN, MI, OH, WI -8.9% -3.4% -11.2% South Atlantic -5.2% -4.0% -8.8% Mountain AZ, CO, ID, MT, NM, NV, UT, WY -4.4% -6.1% -10.8% United States -2.7% -1.1% -8.0% |
45 Markets – Local Economies Housing Price Change Vs. U.S. MSAs Source: Freddie Mac, 1Q10 Data Source: Freddie Mac, 1Q10 Data |
46 Markets – Local Economies House Price Decline Probability Local Housing Prices Did Not Escalate Rapidly, So Little House Price “Snap- Back” According To PMI, Our Legacy Markets Have Some Of The Lowest Probabilities To Exhibit Housing Price Declines Over Next 2 Years Source: PMI Economic Real Estate Trends Source: PMI Economic Real Estate Trends |
47 IBERIABANK Market Demographics Source: SNL Financial |
48 Markets – Branches Historical Office Optimization Entered 3 New Markets Acquired 12 Offices (All) Closed/Consolidated 18 Offices (All Types) Opened 10 New Bank Offices Opened 7 Mortgage Offices Divested/Sold 1 Office 5 Office Realignments 1999 Through 2005 Since 2005 Entered 26 New Markets Acquired 138 Offices (All) Closed/Consolidated 29 Offices (All Types) Opened 15 New Bank Offices Opened 22 Mortgage Offices Opened 1 Title Office 11 Office Realignments |
49 Markets - Branches Branch Expansion Initiative Period-End Loan And Deposit Volumes Post Katrina Branch Expansion 13 Offices 2Q10 Loans Of $184 mm (+15% Over 1-Year) 2Q10 Deposits Of $346 mm (+41% Over 1-Year) |
50 Markets – Local Economies Oil & Gas Impact Source: Bloomberg Source: Bloomberg |
51 Summary Of IBKC Industry Operating Environment--Challenging • Housing • Credit Risk • Interest Rate Risk • Operations Risk We Tend To Move “Ahead Of The Curve” Focus On Long-Term Investments & Payback Organic And External Growth Expense Controls And Revenue Growth EPS/Stock Price Linkage - Shareholder Focus Favorable Risk/Return Compared To Peers |
52 Loss Share Accounting Example |
$20 Million Loan Portfolio Split Into 5 Pools Original Discounts - $8 Million (Estimated Losses = 40%) Pool 1 Pool 2 Pool 3 Pool 4 Pool 5 Original Loan Balance $2,500,000 $2,500,000 $5,000,000 $9,000,000 $1,000,000 Discount $500,000 $1,000,000 $3,500,000 $2,700,000 $300,000 Loss Share Example Pool Assumptions |
54 Impairment in Pool 5 • New Estimated Loss is $500,000 • Original Assigned Discount in Pool is $300,000 • Results in $200,000 of Additional Impairment Accounting Entries: • Increase Provision Expense = $40,000 • Increase Indemnification Asset = $160,000 • Increase Loan Loss Reserve = $200,000 Loss Share Example Loss Within A Pool |
55 Loss Share Example Loan Improvement Improvement in Pool 1 • New Estimated Loss is $300,000 • Original Assigned Discount in Pool is $500,000 • Results in $200,000 of Future Interest Income. • The $200,000 of Future Interest Income will be Recognized Over the Remaining Life of the Pool Using the Discounted Cash Flow Method. |
56 Loss Share Example Consolidated Impact Additional Impairment on Pool 5 (200,000) $ Improvement - Less Losses on Pool 1 $200,000 Net Change in Credit Expectations $0 Provision Expense (40,000) $ Income Reclass1 - $ Net Impact (40,000) $ Loan Loss Reserve $200,000 Indemnification Asset 160,000 $ 1) Under an 80/20 loss share with the FDIC, the $200,000 in improvement will result in approximately $40,000 in additional interest income recognized over the life of the pool and starting in the following quarter. Quarterly Credit Adjustments Quarterly Accounting - Income Statement Quarterly Accounting - Balance Sheet |