 Gulf South Bank Conference Gulf South Bank Conference May 2011 May 2011 Exhibit 99.1 |
 Safe Harbor And 425 Language Safe Harbor And 425 Language Statements contained in this presentation which are not historical facts and which pertain to future operating results of IBERIABANK Corporation and its subsidiaries constitute “forward-looking statements” within the meaning of the Private Securities Litigation Reform Act of 1995. These forward-looking statements involve significant risks and uncertainties. Actual results may differ materially from the results discussed in these forward-looking statements. Factors that might cause such a difference include, but are not limited to, those discussed in the Company’s periodic filings with the SEC. In connection with the proposed mergers, IBERIABANK Corporation has filed Registration Statements on Form S-4 that contain a proxy statement/prospectus. INVESTORS AND SECURITY HOLDERS ARE URGED TO CAREFULLY READ THE PROXY STATEMENT/PROSPECTUS REGARDING THE PROPOSED TRANSACTIONS WHEN THEY BECOME AVAILABLE, BECAUSE THEY WILL CONTAIN IMPORTANT INFORMATION. Investors and security holders may obtain a free copy of the proxy statement/prospectus (when it is available) and other documents containing information about IBERIABANK Corporation, Cameron Bancshares, Inc. and OMNI BANCSHARES Inc., without charge, at the SEC's web site at http://www.sec.gov. Copies of the proxy statement/prospectus and the SEC filings that will be incorporated by reference in the proxy statement/prospectus may also be obtained for free from the IBERIABANK Corporation website, www.iberiabank.com, under the heading “Investor Information”. This communication is not an offer to purchase shares of Cameron Bancshares, Inc. common stock or OMNI BANCSHARES, Inc. common stock, nor is it an offer to sell shares of IBERIABANK Corporation common stock which may be issued in either proposed merger. Any issuance of IBERIABANK Corporation common stock in either proposed merger would have to be registered under the Securities Act of 1933, as amended, and such IBERIABANK Corporation common stock would be offered only by means of a prospectus complying with the Act. 2 |
 Company Company Overview Overview |
 • Headquartered In Lafayette, Louisiana • Since 1887 – 2 nd Oldest & 2 nd Largest LA-Based Bank • Approximately $10 Billion in Assets • Market Cap of Approximately $1.6 Billion • Relatively Strong Asset Quality Measures • Conservative and We Don’t Cut Corners • Minimize Loan Concentrations • Core Funded • Balanced From An Interest Rate Risk Position • Large Fee-Based Businesses • Completed Five FDIC-Assisted Transactions • Announced Two Live-Bank Deals • Operations in 12 States Summary IBKC Overview IBKC Overview 4 |
 A Few Recent Activities IBKC Overview IBKC Overview 5 1Q08 Company Reached $5 Billion in Assets Capital - Issued $7 Million in Trust Preferred 2Q08 FDIC - Acquired ANB (Bentonville, AR) 3Q08 Capital - Issued $90 Million in TARP Preferred Stock 4Q08 Capital - Issued $110 Million in Common Stock Added Teams in Mobile, New Orleans and Houston 1Q09 Capital - First in the U.S. To Pay Back TARP Preferred Stock Capital - Second in the U.S. To Buy Back TARP Warrants 2Q09 Pulaski Bank & Trust Becomes IBERIABANK fsb FDIC - Acquired CapitalSouth Bank (Birmingham, AL) 3Q09 Added Team In Birmingham Capital - Issued $165 Million in Common Stock 4Q09 FDIC - Acquired Orion Bank (Naples, FL) And Century Bank (Sarasota, FL) Converted Systems For CapitalSouth Bank 1Q10 Capital - Issued $329 Million in Common Stock Reported Insignificant Exposure to Deepwater Horizon Event in Gulf Of Mexico 2Q10 Converted Systems For Orion Bank And Century Bank Company Reached $10 Billion in Assets 3Q10 FDIC - Acquired Sterling Bank (Lantana, FL) Converted Systems For Sterling Bank 4Q10 Launched IBERIA Capital Partners And IBERIA Wealth Advisors Merged And Converted IBERIABANK fsb 1Q11 Announced Acquisition of OMNI BANCSHARES, Inc. (Metairie, LA) Announced Asset Acquisition of Florida Trust Company (Naples/Ft. Lauderdale, FL) Announced Acquisition of Cameron Bancshares, Inc. (Lake Charles, LA) |
 6 IBKC Overview IBKC Overview Our Locations |
 Daryl G. Byrd President and CEO Beth A. Ardoin, EVP Director of Communications Resides in Lafayette, LA Indicates cities in which our members of Senior Management (Market Presidents, Executive Vice Presidents, etc.) have resided/worked. Resides in Greensboro, GA James B. Gburek, EVP Chief Risk Officer IBKC Overview IBKC Overview Where We Lived & Worked Albuquerque, NM Annapolis, MD Boston, MA Buffalo, NY Charlottetown, PE, Canada Chennai, India Columbus, OH Detroit, MI Flint, MI Hartford, CT Indianapolis, IN Experience in Additional Cities: Las Vegas, NV Mansfield, PA Morris Plains, NJ Pittsburgh, PA Phoenix, AZ San Diego, CA Scottsdale, AZ Wilmington, DE Resides in Greensboro, NC Gregg Strader, EVP Chief Credit Officer Resides in Raleigh, NC John R. Davis, SEVP Director of Financial Strategy and Mortgage Broad Experience Throughout Southeastern U.S. George J. Becker III, EVP Director of Corporate Operations Barry J. Berthelot, EVP Director of Organizational Development Resides in New Orleans, LA Michael J. Brown, VC Chief Operating Officer Jefferson G. Parker, VC Manager of Brokerage, Trust, and Wealth and Management Anthony J. Restel, SEVP Chief Financial Officer Robert B. Worley General Counsel Indicates cities in which our 11 members of Executive Management have resided/worked |
    MSA Unemployment Rates IBKC Overview IBKC Overview • Our Legacy Markets Retain Some Of The Lowest Rates of Unemploy- ment In The U.S. • Acquired Markets Have Some Of The Highest Rates Source: U.S. Bureau of Labor Statistics, February 2011 Data. 8 Ranking 372 U.S. MSAs February 2011 Unemployment Rates (Red) Dashed: Dec 2010, Feb 2010, Feb - 2010 Feb - 2011 Dec - 2010 |
 Organic Growth And Recruiting • Memphis • Mobile • Houston • Birmingham IBKC Overview IBKC Overview • New Orleans • Lafayette • Jonesboro • Sarasota • Naples • Montgomery • Birmingham • Auburn • Columbus • Idaho Falls • Tampa • Ft. Myers • Sarasota • Deland, FL Commercial Banking Teams Formed In: Commercial/ Retail Recruits Added In: Mortgage Origination Teams Formed In: • Built Iberia Capital Partners • Commenced Operation in 3Q10 • 25 Professionals based in New Orleans 9 |
 Asset Quality Asset Quality |
 Loan Portfolio Diversification Asset Quality Asset Quality • $6.1 Billion Loan Portfolio • Acquired $2.6 Billion Of Gross Loans In FDIC-Assisted Acquisitions Covered Under Loss Share Agreements Note: Loans Net of Purchase Discounts at March 31, 2011 11 |
 Nonperforming Assets Low And Stable Asset Quality Asset Quality • $913 Million in NPAs, But $835 Million Covered Under FDIC Loss Share • Legacy TDRs Total Only $23 Million * Excludes FDIC Covered Assets. • 25% Of Loans Are FDIC Covered Assets 12 IBERIABANK Corporation 1.01% AVG GULF SOUTH PEERS 4.02% 0.00% 0.50% 1.00% 1.50% 2.00% 2.50% 3.00% 3.50% 4.00% 4.50% Dec- 99 Dec- 00 Dec- 01 Dec- 02 Dec- 03 Dec- 04 Dec- 05 Dec- 06 Dec- 07 Dec- 08 Dec- 09 Dec- 10 Mar- 11 Nonperforming Assets to Total Assets IBERIABANK Corporation AVG GULF SOUTH PEERS |
 Loans Past Due Remain Tempered Asset Quality Asset Quality * Excludes FDIC Covered Assets. 13 IBERIABANK Corporation 1.65% AVG GULF SOUTH PEERS 7.91% 0.00% 1.00% 2.00% 3.00% 4.00% 5.00% 6.00% 7.00% 8.00% 9.00% Dec- 99 Dec- 00 Dec- 01 Dec- 02 Dec- 03 Dec- 04 Dec- 05 Dec- 06 Dec- 07 Dec- 08 Dec- 09 Dec- 10 Mar- 11 Loans Past Due 30+ Days (Including Non-accruals) to Total Loans IBERIABANK Corporation AVG GULF SOUTH PEERS |
 Modest Net Charge-Offs Asset Quality Asset Quality * Excludes FDIC Covered Assets. 14 IBERIABANK Corporation -0.06% AVG GULF SOUTH PEERS 1.30% -0.20% 0.00% 0.20% 0.40% 0.60% 0.80% 1.00% 1.20% 1.40% Dec- 99 Dec- 00 Dec- 01 Dec- 02 Dec- 03 Dec- 04 Dec- 05 Dec- 06 Dec- 07 Dec- 08 Dec- 09 Dec- 10 Mar- 11 Net Charge -Offs to Average Loans IBERIABANK Corporation AVG GULF SOUTH PEERS |
 Financials Financials |
 2010 Summary • Revenues Up 48%* • EPS Down (-78%) • Stable Dividends • Share Price Up 10% • Assets Up 3% • Deposits Up 5% • Market Cap Up 43% • BV Per Share Up 5% • Tangible BVS Up 14% Financials Financials 1Q11 vs. 4Q10 • Revenues Down 3% • EPS Up 12% • Stable Dividends • Share Price Up 2% • Assets Down 1% • Deposits Down 1% • Market Cap Up 2% • BV Per Share Up 0% • Tangible BVS Up 1% * Excludes gains on acquisitions 16 |
  Solid Organic Loan Growth Financials Financials • $223 Million Organic Loan Growth Since 2009 (+7%) • Counter To Industry Trends 17 0% 10% 20% 30% 40% 50% 60% Data Indexed at 12/31/2006 Organic Loan Growth December 2006 - March 2011 IBERIABANK Corporation U.S. Commercial Banks IBKC data based on organic growth - excluding one-time impact of acquisitions |
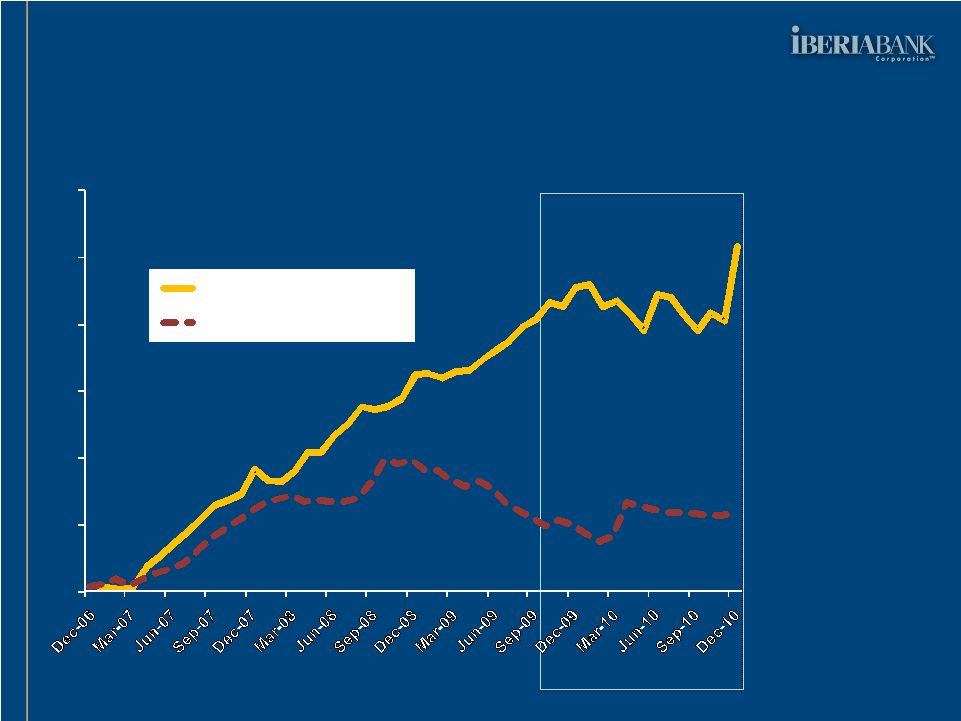 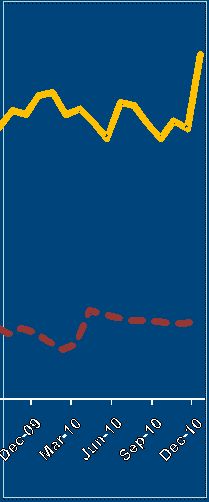 Organic Deposit Growth Financials Financials • $797 Million Since 2008 (+28%) • $253 Million Since 2009 2010 (+8%) 18 0% 10% 20% 30% 40% 50% 60% Data Indexed at 12/31/2006 Organic Loan Growth December 2006 - December 2010 IBERIABANK Corporation U.S. Commercial Banks IBKC data based on organic growth - excluding one-time impact of acquisitions |
 Deposit Portfolio Diversification Financials Financials • Balanced And Diverse Deposit Portfolio • Average Cost Of Interest-Bearing Deposits Was 1.10% In 1Q11, Down 10 Bps Versus 4Q10 (March 2011 was 1.07%) Note: Deposits Net of Purchase Discounts at March 31, 2011 • Paid Down Borrowings 19 Louisiana 48.1% Alabama 5.7% Florida 30.0% Arkansas 12.5% Tennessee 1.8% Texas 1.9% |
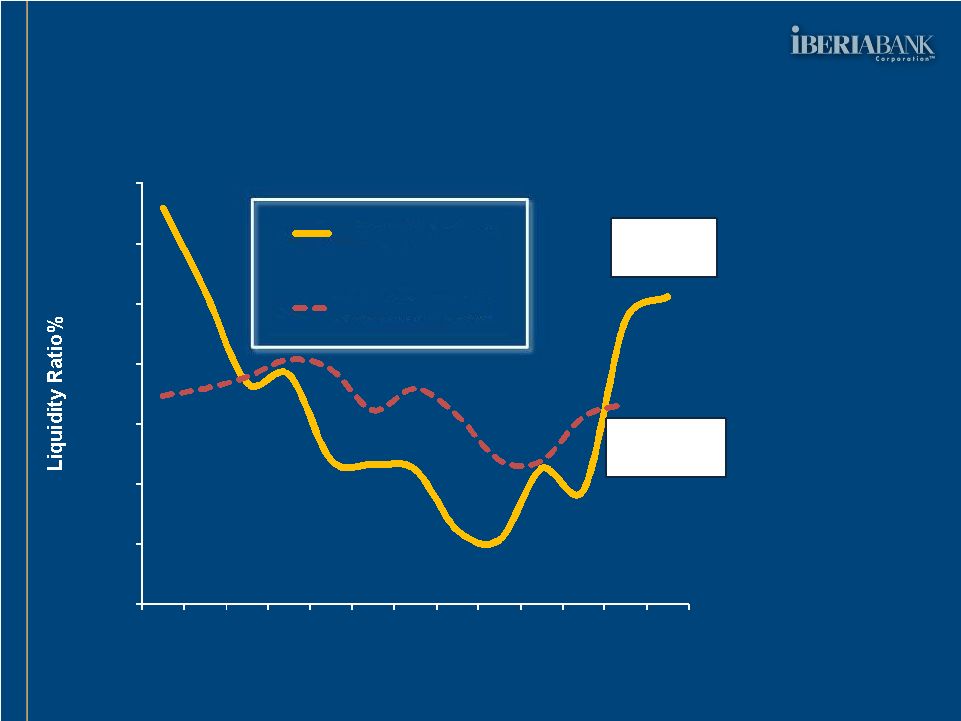 Excess Liquidity Financials Financials • Excess Liquidity: • Negatively Impacted Margin Until Fully Deployed 1Q10: $543 Million 2Q10: $1.1 Billion 3Q10: $1.0 Billion 4Q10: $616 Million 1Q11: $217 Million • Driven By FDIC- Related Cash, Capital Raise, Deposit Flows Source: SNL 20 IBERIABANK Corporation 25.6% AVG GULF SOUTH PEERS 17.1% 0.0% 5.0% 10.0% 15.0% 20.0% 25.0% 30.0% 35.0% Dec- 99 Dec- 00 Dec- 01 Dec- 02 Dec- 03 Dec- 04 Dec- 05 Dec- 06 Dec- 07 Dec- 08 Dec- 09 Dec- 10 Mar- 11 Liquidity Ratio IBERIABANK Corporation AVG GULF SOUTH PEERS |
 Interest Rate Risk –Asset Sensitive Financials Financials Source: Bancware at June 30, 2010, September 30, 2010, December 31, 2010 and March 31, 2011 21 6/30/10 Consolidated 9/30/10 Consolidated 12/31/10 Consolidated 3/31/11 Consolidated 6/30/10 Consolidated 9/30/10 12/31/10 Consolidated 3/31/11 Consolidated +200 bps 20.4% 12.2% 2.3% 1.5% 1.4% 0.8% -3.6% -3.8% +100 bps 10.0% 5.7% 0.8% 0.4% 2.4% 3.5% -0.7% -1.1% Base Case 0.0% 0.0% 0.0% 0.0% 0.0% 0.0% 0.0% 0.0% -100 bps -1.6% -0.6% 0.4% 0.3% -5.7% -3.2% -3.1% -2.9% -200 bps -2.2% 1.1% -0.7% 0.1% -9.8% -5.7% -13.1% -12.3% Blue Chip 2.0% -0.1% -0.2% 0.0% -0.7% 6.8% 1.7% -0.5% Forward Curve 1.2% 0.1% 0.1% 0.1% 0.7% 3.5% 0.5% -0.7% Change in Net Interest Income Change in Economic Value of Equity Consolidated |
 Service Charges/Revenues Financials Financials 22 • Less Reliance On Service Charge Income And Consumer Fees Than Peers • 77% Of Eligible Accounts With Overdraft Activity Have Opted-In To Overdraft Services (Reg-E) 0.0% 5.0% 10.0% 15.0% 20.0% 25.0% TIBB EBTX PBIB IBKC WTNY CSFL UCBI SBCF PFBX FSGI HOMB TRMK BXS HBHC SFNC FMFC RNST SBSI MSL CCBG OZRK IBKC = 5.2% Source: SNL Data as of most recent quarter Non-Interest Income Excludes Gains on Acquisitions and Investment Sales |
 Acquisitions Acquisitions |
 New Charters, Acquisitions & Failures Acquisitions Acquisitions • New Charters And Mergers Have Dropped • Outpost Sales Are Spotty • FDIC Sales Are Steady, But Well Below Prior Cycle • Many More To Come Source: FDIC And OTS. – data through December 31, 2010 24 (1,200) (1,000) (800) (600) (400) (200) - 200 400 Failures & Others Mergers New Charters |
 Summary of Our FDIC-Assisted Acquisitions • Total Assets of $4.2 Billion • Total Deposits of $3.4 Billion • Deposits Assumed at a Discount of $39 Million • Gross Loans of $2.5 Billion • Loans Purchased at a $515 Million Discount • Loans Come With FDIC Loss Share Protection • Pre-Tax Gain of $231 Million • 50 Offices in 9 MSAs in Alabama & Florida • Fixed Assets /Owned Property at Appraised Value Acquisitions Acquisitions 25 |
 OMNI BANCSHARES, Inc. • Announced February 22, 2011 • Adds 14 branches – nearly doubles branches and market share in New Orleans MSA • Complementary client base – enhances ability to compete and capitalize on current market dislocation • Total Loans: $525 million • Total Assets: $735 million • Total Deposits: $646 million • Total Equity: $31 million plus $15 million TRP • Total deal value of $40 million plus assume $24 million in trust preferred and HC debt • B/T credit mark of $51 million (9% of loans) • Price / Tangible Book: 1.3x • Core Deposit Premium: 1.8% • Adjusted Core Deposit Premium: 6.2% • Accretive to EPS • Slightly dilutive to TVBS • High teens IRR Non-FDIC Acquisitions Non-FDIC Acquisitions 26 IBERIABANK Branches OMNI Branches |
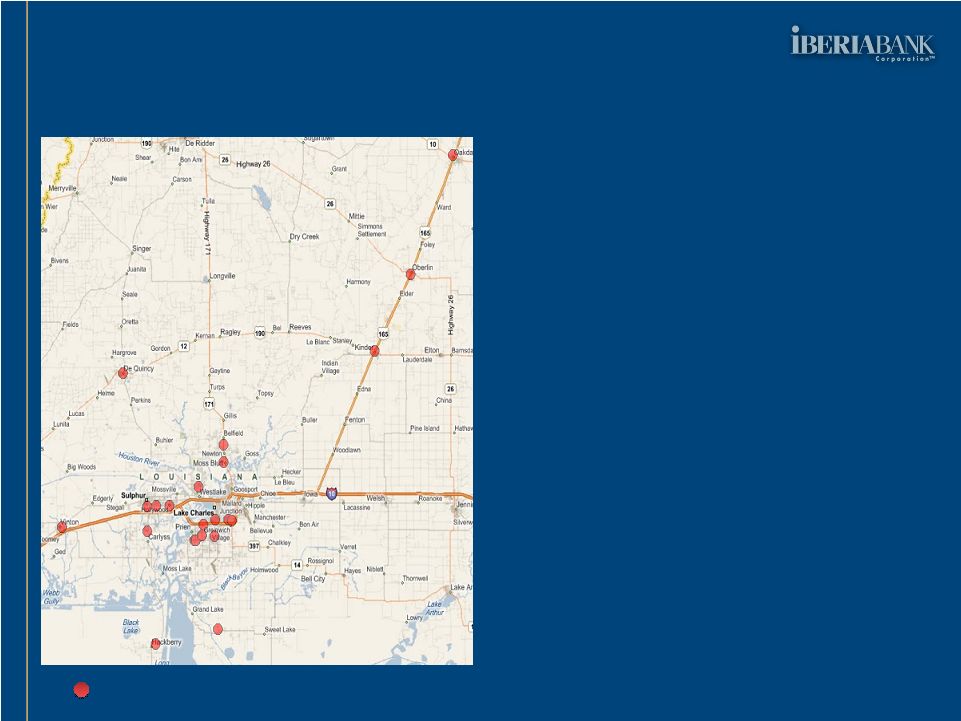 Cameron Bancshares, Inc. Non-FDIC Acquisitions Non-FDIC Acquisitions 27 Cameron Branches • Announced March 11, 2011 • Adds 22 branches in Lake Charles MSA • Attractive, established client base including a favorable small business and retail client mix • Total Loans: $408 million • Total Assets: $706 million • Total Deposits: $575 million • Total Equity: $77 million • Total deal value of $133 million • Includes $25 million, pre-tax credit mark (6% of loans) • Price / Tangible Book: 1.7x • Core Deposit Premium: 13.4% • Adjusted Core Deposit Premium: 12.3% • Accretive to EPS • Slightly dilutive to TVBS • IRR in excess of 20% |
 Summary • Total Assets of $1.4 Billion (+14%) • Securities of $0.3 Billion (+12%) • Total Loans of $0.9 Billion (+15%) • Total Deposits of $1.2 Billion (+15%) • Shareholders Equity of $0.1 Billion (+8%) • 36 Offices in 3 MSAs in Louisiana (+25%) • 497 Employees (+23%) Non-FDIC Acquisitions Non-FDIC Acquisitions 28 Data as of December 31, 2010 |
 Non-FDIC Acquisitions Non-FDIC Acquisitions Pro Forma Balance Sheet And Capital Ratios 29 Pro Forma IBKC OMNI Cameron As of Stand Alone Stand Alone Stand Alone 12/31/10 Cash & Equivalents 338 55 25 353 Securities 2,089 91 230 2,411 Gross Loans 6,119 525 408 7,009 Reserves (136) (8) (5) (136) Net Loans 5,983 517 403 6,873 Goodwill 234 - - 323 Identifiable Intangibles 30 - - 36 Other Asset 1,352 71 47 1,486 Total Assets 10,027 735 706 11,481 Deposits 7,915 645 575 9,135 Borrowings 653 57 48 710 Other Liabilities 156 2 6 163 Total Liabilities 8,723 704 628 10,007 Non-Controlling Interests - - - - Preferred Equity - - - - Common Equity 1,303 31 77 1,474 Total Liabilities & Equity 10,027 735 706 11,481 Tangible Common Equity 1,040 31 77 1,115 Tangible Assets 9,763 735 706 11,122 TCE/TA 10.65% 4.23% 10.96% 10.03% Tangible Book Value per Share $38.68 $14.72 $112.34 $37.15 Tier 1 Leverage 11.24% 5.72% 10.96% 10.66% Tier 1 RBC 18.48% 7.75% 16.35% 17.05% Total Risk Based 19.74% 9.86% 17.53% 18.36% At December 31, 2010 |
 Summary Summary |
   -100% 0% 100% 200% 300% 400% 500% 600% 10 Year Total Cumulative Return % Publicly Traded BHCs in AL, AR, FL, GA, LA, MS, NC, SC, TN, TX Shareholder Returns Over Last 10 Years Summary Summary • Dividends Per Share of $1.36 in 2010 vs. $0.53 in 2000 (+156%) • Share Price Up 215% Between 1Q01 and 1Q11 Source: SNL and Bloomberg 7 th Highest Total Return To Shareholders Over The 10 Years Ended March 31, 2011 of 176 Publicly Traded Bank Holding Companies IBKC = 296% 31 |
 3-Year Total Return Summary Summary Source: SNL on May 6, 2011 • Outperformed During A Very Tumultuous Time Period • Driven By Our Very Unique Position And Opportunities 32 -70% -60% -50% -40% -30% -20% -10% 0% 10% 20% Southeast Banks Micro Cap Banks Banks < $250M Mid Cap Banks TARP Participants S&P Bank Banks < $500M Banks > $10B Banks $250M-$500M S&P Financials Banks KBW Bank Banks $1B-$5B Large Cap Banks Midwest Banks Mid-Atlantic Banks Banks $500M-$1B Small Cap Banks Banks $5B-$10B New England Banks All Financial Institutions NASDAQ Bank NASDAQ Finl Southwest Banks Western Banks NYSE S&P 500 Russell 3000 NASDAQ Russell 2000 IBERIABANK Corporation S&P Mid-Cap S&P Small-Cap +15% |
 Summary Summary Over The Past Three Years…. Over The Past Three Years…. Total Revenues Of $1.2 Billion Earned $243 Million; $13.26 EPS Paid $76 Million In Dividends, Or $4.08 Per Share (31% Payout) Improved Asset Quality And Capital Strength Added: • +$5 Billion Assets (Doubled) • +76 New Locations • +803 Associates • +$19.62 In Tangible BVS • +$1 Billion Market Cap. At The End Of 2010: • Total Assets Of $10 Billion • 2,097 Associates • Operations In 12 States |
 IBERIABANK Corporation • Longevity And Experience • Economically Vibrant Legacy Markets • Diversified Markets And Revenues • Multiple Growth Engines (Organic And M&A) • Disciplined, Yet Opportunistic • Exceptional Asset Quality • Outsized FDIC Loss Share Protection • Tremendous Liquidity And Capital • Funded By Stable Core Deposits • Balanced From An Interest Rate Risk Position • Unique Business Model • Favorable Risk/Return Trade-Off Summary Summary 34 |
 |
 Appendix Appendix |
 Overview OMNI BANCSHARES, Inc. OMNI BANCSHARES, Inc. Markets 37 Headquartered in Metairie (suburb of New Orleans) Bank founded in 1988 in response to the need for a community- oriented, community-involved financial institution Focused on needs-based selling to attract, retain and deepen customer relationships Chairman & CEO Jim Hudson was honored by the ABA as the Community Banker of the Year for quickly restoring banking operations following Hurricane Katrina Financial Highlights Total Loans: $525 million Total Assets: $735 million Total Deposits: $646 million Total Equity: $31 million plus $15 million trust preferred 13 branches in 5 New Orleans MSA parishes and 1 branch in Baton Rouge Key MSAs: New Orleans, Baton Rouge At December 31, 2010 |
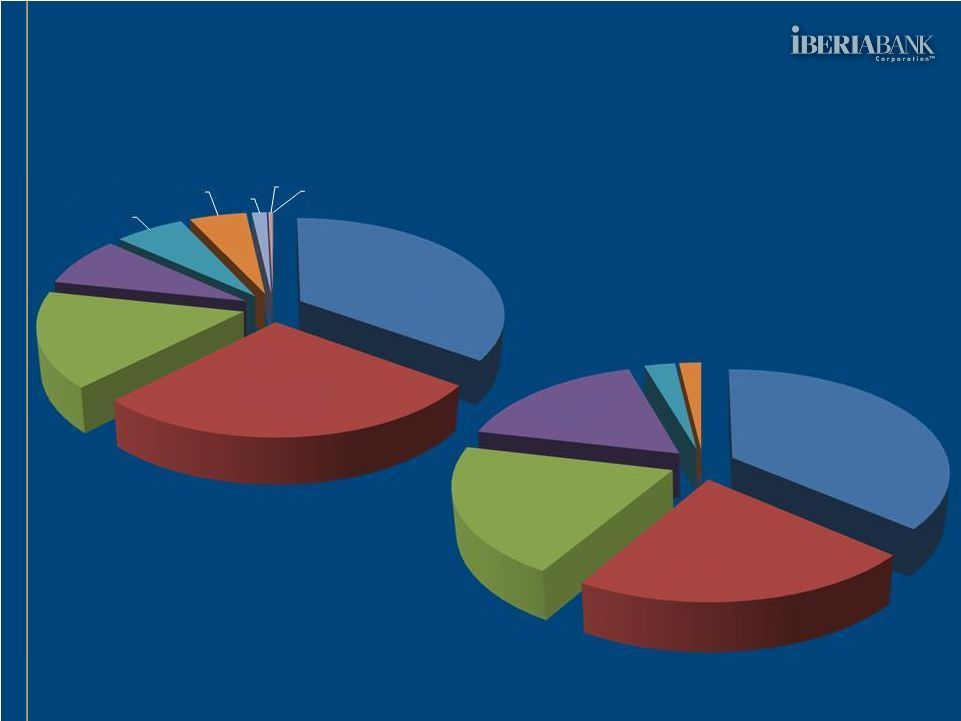 OMNI OMNI - - Loan Loan & & Deposit Deposit Portfolios Portfolios Loans - $525 Million Deposits - $646 Million Balances at December 31, 2010 38 Non Farm Non-Res RE 35% Residential 1-4 Family 27% Construction 16% Commercial 8% Multi Family 6% Other RE Loans 5% Consumer 1% Visa 0% Other 0% MMDA 36% Non-Interest Bearing 22% CDs < $100M 20% CDs > $100M 17% Savings 3% IRAs 2% |
 OMNI OMNI - - Strengthens Our New Orleans Franchise Strengthens Our New Orleans Franchise Source: SNL Financial Deposit Data as of June 2010 IBERIABANK Branches Omni Branches New Orleans MSA Rank Company Branches Deposits Mkt. Share 1 Capital One 60 $ 8.6 27% 2 Hancock/ Whitney 59 4.5 18 3 JPMorgan 38 4.2 16 4 Regions 34 2.4 9 5 Pro Forma IBERIABANK 26 1.3 4 5 First NBC 15 1.1 3 6 Fidelity Homestead 14 0.8 3 7 Gulf Coast 14 0.7 3 8 IBERIABANK 12 0.7 2 9 Omni Bank 14 0.6 2 10 First Trust 8 0.5 2 39 |
 OMNI - OMNI - New Orleans/Baton Rouge Distribution New Orleans/Baton Rouge Distribution Main Office – Metairie Deposits: $175 million Kenner Office Deposits: $46 million Mandeville Office (Northshore) Deposits: $30 million Harvey Office (West Bank) Deposits: $38 million Baton Rouge Office Deposits: $37 million Gretna Office (West Bank) Deposits: $59 million 40 |
 Diligence Scope OMNI - OMNI - Credit Summary Credit Summary Total 44 people over 3 weeks; credit team was 10 people over 1 week Reviewed approximately half of the loan portfolio’s outstanding balances Sampled 36% of OMNI’s $148 million 1-4 family residential loan portfolio All loans are in-market loans Primarily small business, retail and institutional focus No industry concentrations Very granular loan portfolio Credit mark: approximately $51 million (b/t) Loan Portfolio Comments Loan Portfolio Composition (Include unfunded commitments) Loans $ mm %Total #Notes Avg. ($000) 1-4 Family Residential $148 26% 950 $156 1-4 Family HELOC 13 2 305 43 1-4 Family Construction 38 7 224 168 Construction/Land 53 9 230 230 CRE-Owner Occupied 122 21 306 398 CRE-Non-Owner Occup. 91 16 156 580 CRE-Multifamily 52 9 77 669 C&I 44 8 525 83 Consumer 7 1 741 10 Other Loans 8 1 100 85 Total Loans $574 100% 3,114 $184 41 |
 Merger -Related Costs OMNI - OMNI - Costs And Synergies Costs And Synergies Merger Considerations Approximately $15 million in costs: Pay all outstanding Change in Control agreements totaling $3.4 million $3.4 million in contract terminations $1.7 million in severance/retention $1.4 million lease terminations $1.3 million in property costs $3.8 million other merger-related costs Costs incurred primarily between merger announcement and conversion Annual Synergies Approximately $9 million annually: $4.6 million in compensation/benefits $1.9 million IT, equipment, outside services $0.9 million in legal/professional fees $1.6 million in other cost savings No corporate or bank board seats 2 employment & 1 consulting agreement Convert OMNI stock options to IBKC options (remain out of the money) No branch divestitures anticipated Consolidate aggregate 5 offices 42 |
 OMNI - OMNI - Transaction Overview Transaction Overview (1) Price collars up 5% (IBKC price greater than $60.53) and down 5% (IBKC price less than $54.77), at which points the stock consideration to OMNI shareholders becomes fixed (2) Based on IBKC’s closing price of $57.17 per share as of February 18, 2011 (3) Adjusted core deposit premium calculation based on adjusted tangible book value which is equal to stated tangible book value less the after-tax credit mark on loans at close net of allowances 43 Consideration: Tax-free, stock -for-stock exchange Fixed exchange ratio of 0.3313 share of IBKC common stock for each OMNI share (1) Deal Value: $40 million (2) plus assume $24 million in trust preferred and holding company debt Valuation Multiples: Price / Tangible Book: 1.3x Core Deposit Premium: 1.8% Adjusted Core Deposit Premium (3) : 6.2% Due Diligence: Completed comprehensive due diligence Detailed loan and securities analysis Required Approvals: OMNI shareholder approval Customary regulatory approvals Timing: Expected closing in second quarter of 2011 |
 OMNI - OMNI - Financial Assumptions & Impact Financial Assumptions & Impact Conservative Financial Assumptions Attractive Financial Impact Credit Mark: $51 million, pre-tax; 9% of total OMNI loans Including prior NCOs, represents cumulative loss of 11% of OMNI’s legacy portfolio Other Marks: Estimated to be immaterial in aggregate Cost Savings: Cost savings of approximately $9 million, pre-tax annually Represents approximately 25% of OMNI’s operating non-interest expenses Fully achieved by the second half of 2012 Revenue synergies identified, but not included in estimates Merger Related Costs: Approximately $15 million, pre-tax Immediately accretive to net income and EPS, excluding impact of merger-related costs Slightly dilutive to tangible book value per share High teens IRR, well in excess of our cost of capital Strong pro forma capital ratios: * Pro forma as if acquisition completed at December 31, 2010 IBKC Pro Forma * Pre-Acquisition Combination TCE Ratio 10.65% 9.96% Leverage Ratio 11.24% 10.60% Tier 1 Risk Based Capital Ratio 18.48% 17.21% Total Risk Based Capital Ratio 19.74% 18.54% 44 |
 OMNI - OMNI - Transaction Rationale Transaction Rationale Compelling Strategic Rationale Financially Attractive Low Risk Lower-risk, in-market acquisition of a Greater New Orleans-based community bank Attractive, established client base; complements our client base Nearly doubles our distribution and market share in the New Orleans MSA Adds 14 branches and approximately $646 million of deposits Favorable small business and retail client mix Enhances our ability to compete and capitalize on current market dislocation Significant combination benefits including identified cost savings and opportunity to utilize our product set Expected to be immediately accretive to net income and EPS, excluding one-time merger costs Partial deployment of proceeds from common stock sold in March 2010 Maintains strong pro forma capital ratios Anticipated high teens internal rate of return Companies know one another well Comprehensive due diligence including detailed credit analysis Similar cultures and strong business fit Proven track record of well-priced, well-integrated transactions 45 |
 2010 Net Income: $9.3 million Total Loans: $408 million Total Assets: $706 million Total Deposits: $575 million Total Equity: $77 million NPAs/Total Assets: 1.34% (5- year average of 0.43%) Overview Cameron Bancshares, Inc. Cameron Bancshares, Inc. Markets Headquartered in Lake Charles, Louisiana (Calcasieu Parish) Bank founded in 1966 Extremely profitable – Average ROA and ROE of 1.45% and 14.59% over the past 5 years, respectively. Core funded with cost of funds of 0.83% (5-year average of 1.26%) Focus on retail and small business Sizeable auto lending business (6% of loans) Excellent marketing programs Named “Best Bank” in The Times of Southwest Louisiana 12 straight years and “Best Bank” in Lagniappe’s Best of Lake Charles readers poll 10 straight years. CEO Roy M. Raftery, Jr. is 68 years old 22 branches and 48 ATMs in greater Lake Charles market area Key MSAs: Lake Charles Concentrated distribution system (convenience strategy) Financial Highlights At December 31, 2010 46 |
 MMDA 6% Now Accounts 27% Non-Interest Bearing 29% CDs < $100M 12% CDs > $100M 16% Savings 10% Cameron - Cameron - Loan and Deposit Portfolios Loan and Deposit Portfolios Loans - $408 Million Deposits - $575 Million Balances at December 31, 2010 Non Farm Non-Res RE 43% Residential 1-4 Family 20% Commercial 13% Consumer 11% Construction 10% Multi Family 2% Other 2% Visa 0% 47 |
 Cameron Cameron - - Strengthens Our Louisiana Franchise Strengthens Our Louisiana Franchise Source: SNL Financial Deposit Data as of June 2010 Cameron Branches 48 Lake Charles MSA Rank Company Branches Deposits Mkt. Share 1 Capital One 15 $ 834 27% 2 JPMorgan 12 597 19 3 IBERIABANK/ Cameron 19 538 17 4 First Federal 7 349 11 5 Hancock/ Whitney 5 250 8 6 Jeff Davis 8 234 7 7 Business First 1 105 3 8 Louisiana Community 4 55 2 9 Midsouth 3 55 2 10 Financial Corp. 2 43 1 |
 Cameron - Cameron - Greater Lake Charles Distribution Greater Lake Charles Distribution Main Office – Lake Charles Deposits: $163 million Ryan St. Office Deposits: $37 million Westlake Office Deposits: $25 million Maplewood Office Deposits: $39 million Oak Park Office Deposits: $25 million De Quincy Office Deposits: $23 million Source: Company reports at December 31, 2010 49 |
 Diligence Scope Cameron Cameron - - Credit Credit Summary Summary Total 50 people over 3 weeks; credit team was 12 people over 1 week Reviewed $279 million or over 70% of the loan portfolio’s outstanding balances All loans are in-market loans Primarily small business, retail and consumer focus No industry concentrations Very granular loan portfolio Credit mark: approximately $25 million (6% of loans). Loan Portfolio Comments Loan Portfolio Composition Source: Company reports at December 31, 2010 – excludes overdraft loans and loans in process Loans $ mm %Total #Notes Avg. Size ($000) Commercial RE $212 53% 465 $455 RE Other $41 10% 270 $152 Motor Vehicle $26 6% 2,272 $11 Res 1st Mtg Family $36 9% 484 $74 Other RE $28 7% 331 $85 Rec, Notes, Life Ins., Bonds, CDs, Svgs $24 6% 579 $41 Unsecured $11 3% 1,379 $8 Inventory $7 2% 22 $327 Mobile Home $2 0% 72 $22 Boat/Airplane/Travel/ RV/Motor Cycle $4 1% 300 $13 2nd Mtg. Family Home $3 1% 43 $77 Other $10 2% 602 $16 Total Loans $403 6,819 $59 (Include unfunded commitments) 50 |
 Merger -Related Costs Cameron - Cameron - Costs And Synergies Costs And Synergies Merger Considerations Approximately $11.2 million in costs: Pay all outstanding Change in Control agreements totaling $3.1 million $1.8 million in contract terminations $1.3 million in severance/retention $1.0 million in property costs $4.0 million other merger-related costs Costs incurred primarily between merger announcement and conversion Annual Synergies Approximately $5.5 million annually: $3.2 million in compensation/benefits $1.3 million IT, equipment, outside services $1.0 million in other cost savings No corporate or bank board seats One employment agreement No stock options or warrants No branch divestitures anticipated Consolidate 2 offices 51 |
 Cameron Cameron - - Transaction Overview Transaction Overview (1) Price collars up 10% (IBKC price greater than $61.81) and down 10% (IBKC price less than $50.57), at which points the stock consideration to Cameron shareholders becomes fixed (2) Based on IBKC’s closing price of $55.64 per share as of March 10, 2011 (3) Adjusted core deposit premium calculation based on adjusted tangible book value which is equal to stated tangible book value less the after-tax credit mark on loans at close net of allowances 52 Consideration: Tax-free, stock-for-stock exchange Fixed exchange ratio of 3.464 shares of IBKC common stock for each Cameron share (1) Deal Value: $133 million (2) Valuation Multiples: Price / Tangible Book: 1.7x Core Deposit Premium: 13.4% Adjusted Core Deposit Premium (3) : 12.3% Due Diligence: Completed comprehensive due diligence Detailed loan and securities analysis Cleanest credit portfolio reviewed to date Required Approvals: Cameron shareholder approval Customary regulatory approvals Timing: Expected closing in second quarter of 2011 |
 Accretive to EPS, excluding impact of merger-related costs 1% accretive to book value per share. 1% dilutive to tangible book value per share IRR estimated to be above 20%, Cameron - Cameron - Financial Assumptions & Impact Financial Assumptions & Impact Conservative Financial Assumptions Attractive Financial Impact IBKC Pro Forma * Pre-Acquisition Combination TCE Ratio 10.65% 10.72% Leverage Ratio 11.24% 11.25% Tier 1 Risk Based Capital Ratio 18.48% 18.17% Total Risk Based Capital Ratio 19.74% 19.43% 53 Credit Mark: $25 million, pre-tax; 6% of total Cameron loans Including prior NCOs, represents cumulative loss of 7% of Cameron’s legacy portfolio Other Marks: Estimates include approximately $31 million in mark to market adjustments Cost Savings: Cost savings of approximately $5.5 million, pre-tax annually Represents approximately 23% of Cameron’s operating non-interest expenses Fully achieved by the second half of 2012 Revenue synergies identified, but not included in estimates Merger Related Costs: Approximately $11 million, pre-tax |
 Enter Lake Charles market through acquisition of a well regarded and highly performing Lake Charles-based community bank Attractive, established client base; complements our client base Adds 22 branches and approximately $575 million of deposits Favorable small business and retail client mix Highly profitable institution with significant market share Opportunity to expand middle-market and private banking markets Combination benefits including identified cost savings and opportunity to utilize our product set Expected to be 3% to 5% accretive to EPS, excluding one-time merger costs, assuming synergies fully phased-in Maintain strong pro forma capital ratios Internal rate of return estimated to be above 20% Companies know one another well Significant experience in the Lake Charles market Comprehensive due diligence including detailed credit analysis Similar low risk cultures and strong business fit Proven track record of well-priced, well-integrated transactions Successfully completed two simultaneous acquisitions (Pulaski/ Pocahontas and Orion/Century) Cameron - Cameron - Transaction Rationale Transaction Rationale Compelling Strategic Rationale Financially Attractive Low Risk 54 Compelling Strategic Rationale Financially Attractive Low Risk |
 Appendix Appendix Other Other 55 |
 MSA Home Price Trends Appendix Appendix • Our Legacy Markets Did Not Experience The “Boom-And-Bust” Housing Cycle 56 NEW ORLEANS-METAIRIE-KENNER LA MSA LAFAYETTE LA MSA BATON ROUGE LA MSA BRADENTON-SARASOTA-VENICE FL MSA NAPLES-MARCO ISLAND FL MSA BIRMINGHAM-HOOVER AL MSA WEST PALM BEACH-BOCA RATON-BOYNTON LAS VEGAS-PARADISE NV MSA ATLANTA-SANDY SPRINGS-MARIETTA GA FORT LAUDERDALE-POMPANO-DEERFIELD - FL |
 MSA Housing Price Declines – Last Year Appendix Appendix Source: Freddie Mac For 4Q10 57 4Q10 3Q10 2Q10 1Q10 #189 Alexandria -1.1% #229 Memphis -1.8% #161 Lafayette - 0.7% #90 Jonesboro +0.3%% #224 Lake Charles -2.4% -1.0.% #331 NW Arkansas -5.0% #228 Baton Rouge -1.8% -1.4% # 81 Monroe +0.5% #344 Mobile -5.9% #85 Shreveport +0.4% Average of MSAs - #275 Birmingham -2.7% #178 Montgomery -0.8% - #134 Huntsville - 0.2% #111 Houston +0.0% #348 Tampa -6.3% #254 W. Palm Beach -2.3% #25 Fort Myers +1.7% #356 Bradenton-Sarasota -6.8% #75 Naples - Marco Island +0.62% #361 Jacksonville -7.8% -40.0% -35.0% -30.0% -25.0% -20.0% -15.0% -10.0% -5.0% 0.0% 5.0% 10.0% 15.0% 1.7% #193 Little Rock -1.2% #205 New Orleans #181 Houma |
 Housing Price Decline Probability – Next 2 Years Appendix Appendix Source: PMI Economic Real Estate Trends: 2Q10 data 58 Jonesboro, AR 1.7% Shreveport, LA 7.1% Little Rock, AR 7.5% Baton Rouge, LA 40.5% Lake Charles, LA 45.9% Lafayette, LA 31.1% Mobile, AL 31.4% New Orleans, LA 34.2% Alexandria, LA 34.6% Montgomery, AL 13.1% Monroe, LA 17.6% Birmingham, AL 21.9% Huntsville, AL 22.3% Memphis, TN 27.7% NW Arkansas, 29.6% W. Palm Beach, FL 99.5% Jacksonville, FL 99.6% Tampa, FL 99.7% Bradenton, FL 99.8% Cape Coral, FL 99.9% Naples, FL 99.9% Houston, TX 56.9% 0% 10% 20% 30% 40% 50% 60% 70% 80% 90% 100% 2Q10 1Q10 4Q09 3Q09 |
  By Entity: 12/31/09 3/31/10 6/30/10 9/30/10 12/31/10 3/31/11** Consolidated (Ex-FDIC Covered Assets) 30+ days past due 0.72% 0.73% 0.77% 0.52% 0.33% 0.35% Non-accrual 0.97% 1.31% 1.13% 0.96% 1.11% 1.30% Total Past Due 1.69% 2.04% 1.90% 1.48% 1.44% 1.65% CapitalSouth Only 30+ days past due 5.69% 7.54% 7.83% 7.94% 7.10% 7.85% Non-accrual 22.25% 25.23% 23.87% 23.38% 21.12% 21.47% Total Past Due 27.94% 32.77% 31.70% 31.32% 28.22% 29.32% Orion Only 30+ days past due 8.72% 4.64% 8.51% 3.59% 6.11% 4.24% Non-accrual 30.37% 36.63% 34.06% 36.26% 34.52% 36.07% Total Past Due 39.09% 41.27% 42.57% 39.85% 40.63% 40.31% Century Only 30+ days past due 6.03% 7.04% 7.58% 3.53% 5.44% 5.18% Non-accrual 30.67% 35.90% 38.31% 40.57% 41.39% 42.15% Total Past Due 36.70% 42.94% 45.89% 44.10% 46.83% 47.33% Sterling Only 30+ days past due 7.31% 10.68% 12.17% Non-accrual 20.08% 26.68% 28.59% Total Past Due 27.39% 37.36% 40.76% Consolidated With FDIC Covered Assets 30+ days past due 3.60% 3.09% 3.48% 1.98% 2.44% 2.04% Non-accrual 12.70% 14.23% 13.01% 12.95% 12.10% 11.89% Total Past Due 16.30% 17.32% 16.49% 14.93% 14.54% 13.93% Loans Past Due Loans Past Due 30 Days Or More And Nonaccruing Loans As % Of Loans Outstanding Past Due Summary Appendix Appendix 59 |
 Consumer Portfolio Past Dues Appendix Appendix 21 60 Generally Good And Stable Asset Quality Across Consumer Products 3/31/10 6/30/10 9/30/10 12/31/10 3/31/11 Home Equity Lines of Credit 30 to 59 Days Past Due 0.86% 0.47% 0.24% 0.21% 0.21% 60 to 89 Days Past Due 0.14% 0.05% 0.03% 0.28% 0.01% Over 90 Days Past Due 0.14% 0.29% 0.15% 0.00% 0.00% Total 30+ Days Past Due 1.14% 0.80% 0.42% 0.49% 0.22% Net Charge-Offs 0.47% 0.58% 0.87% 1.28% 0.90% Home Equity Term Loans 30 to 59 Days Past Due 1.08% 0.45% 0.28% 0.57% 0.29% 60 to 89 Days Past Due 0.18% 0.24% 0.16% 0.17% 0.01% Over 90 Days Past Due 0.19% 0.13% 0.31% 0.00% 0.00% Total 30+ Days Past Due 1.45% 0.82% 0.75% 0.75% 0.31% Net Charge-Offs 0.46% 0.93% 0.21% 0.65% 0.82% Indirect Loans 30 to 59 Days Past Due 0.49% 0.30% 0.34% 0.40% 0.34% 60 to 89 Days Past Due 0.07% 0.08% 0.09% 0.07% 0.02% Over 90 Days Past Due 0.07% 0.03% 0.03% 0.00% 0.00% Non Accrual 0.40% 0.39% 0.35% 0.42% 0.40% Total 30+ Days Past Due 1.04% 0.80% 0.81% 0.89% 0.76% Net Charge-Offs 0.31% 0.39% 0.13% 0.39% 0.17% Credit Card Loans 30 to 59 Days Past Due 0.37% 0.37% 0.35% 0.34% 0.26% 60 to 89 Days Past Due 0.48% 0.21% 0.21% 0.22% 0.32% Over 90 Days Past Due 0.00% 0.00% 0.00% 0.00% 0.00% Non Accrual 0.88% 0.90% 0.86% 0.88% 1.02% Total 30+ Days Past Due 1.73% 1.47% 1.41% 1.44% 1.60% Net Charge-Offs 3.03% 3.03% 2.16% 1.98% 1.76% Other Consumer Loans 30 to 59 Days Past Due 0.58% 0.42% 0.48% 0.36% 0.26% 60 to 89 Days Past Due 0.25% 0.21% 0.10% 0.10% 0.09% Over 90 Days Past Due 0.45% 0.10% 0.04% 0.00% 0.00% Total 30+ Days Past Due 1.28% 0.73% 0.62% 0.46% 0.35% Net Charge-Offs 2.57% 1.45% 2.11% 1.86% 0.74% Total Consumer Loans Total 30+ Days Past Due 1.11% 0.68% 0.57% 0.58% 0.31% Net Charge-Offs 0.71% 0.84% 0.60% 0.90% 0.71% Loans Past Due As A % of Product Loans Consumer Loan Portfolio - Quarterly Credit Statistics |
  Commercial Real Estate Appendix Appendix Note: Includes Construction And Land Development Loans, But Excludes FDIC Covered Assets. 61 Mar 2010 Jun 2010 Sep 2010 Dec 2010 Mar 2011 Non-Owner Occupied Current 876.3 $ 866.3 $ 910.5 $ 895.0 $ 916.1 $ Past Due 11.2 15.8 1.5 2.5 6.8 Nonaccrual 26.2 21.7 18.4 22.7 31.9 Total 913.7 $ 903.8 $ 930.5 $ 920.2 $ 954.8 $ % Nonaccrual 2.87% 2.40% 1.98% 2.46% 3.34% Owner Occupied Current 624.1 $ 646.6 $ 605.2 $ 632.6 $ 691.2 $ Past Due 1.4 2.5 7.3 1.7 0.8 Nonaccrual 10.0 8.1 5.0 5.6 5.9 Total 635.5 $ 657.2 $ 617.5 $ 639.9 $ 697.9 $ % Nonaccrual 1.57% 1.23% 0.81% 0.88% 0.84% Total CRE 1,549.2 $ 1,561.0 $ 1,548.0 $ 1,560.1 $ 1,652.7 $ % Nonaccrual 2.33% 1.91% 1.52% 1.81% 2.29% Non-Owner Occup/RBC 76% 74% 78% 76% 100% |
 Repricing Schedule Appendix Appendix Source: Bancware March 31, 2011 62 2Q11 3Q11 4Q11 1Q12 2Q12 Cash Equivalents 202.5 $ - $ - $ - $ - $ 0.57% 0.00% 0.00% 0.00% 0.00% Investments 113.6 $ 110.2 $ 121.3 $ 79.5 $ 88.8 $ 4.06% 4.14% 3.26% 4.01% 3.69% Loans 3,408.9 $ 326.6 $ 257.2 $ 231.1 $ 195.3 $ 3.52% 5.21% 5.63% 5.75% 5.88% Time Deposits 657.0 $ 521.2 $ 438.7 $ 317.0 $ 212.3 $ 1.42% 1.40% 1.76% 1.93% 2.35% Borrowed Funds 329.4 $ 4.6 $ 1.7 $ 13.1 $ 5.6 $ 1.26% 3.64% 3.57% 3.28% 1.85% |
 Energy Price Trends Appendix Appendix $4.23 $107.12 $- $20.00 $40.00 $60.00 $80.00 $100.00 $120.00 $140.00 $160.00 $- $2.00 $4.00 $6.00 $8.00 $10.00 $12.00 $14.00 $16.00 Natural Gas Crude Oil Natural Gas Average = $4.04 Crude Oil Average = $39.18 Source: Bloomberg Natural Gas (Left Scale) Crude Oil (Right Scale) 63 |
 Appendix Appendix • In 1Q11 Closed $289mm (-44% Vs. 4Q10) • In 1Q11 Sold $319mm (-47% Vs. 4Q10) • 1Q11 Vs. 4Q10: 45% Decrease In Mtg. Revenues • 1Q11 Vs. 1Q10: 21% Increase In Mtg. Revenues • $122mm Locked Pipeline 4/22/11 Mortgage Quarterly Revenues 64 $ - $1.0 $2.0 $3.0 $4.0 $5.0 $6.0 $7.0 $8.0 $9.0 $10.0 $11.0 $12.0 $13.0 $14.0 $15.0 $16.0 $17.0 2003 2004 2005 2006 2007 2008 2009 2010 2011 Mortgage Gains On Sale Of Loans 1st Qtr 2nd Qtr ** Assumes Pulaski's acquisition of IBERIANBANK Mortgage beginning in February 2007 3rd Qtr 4th Qtr |
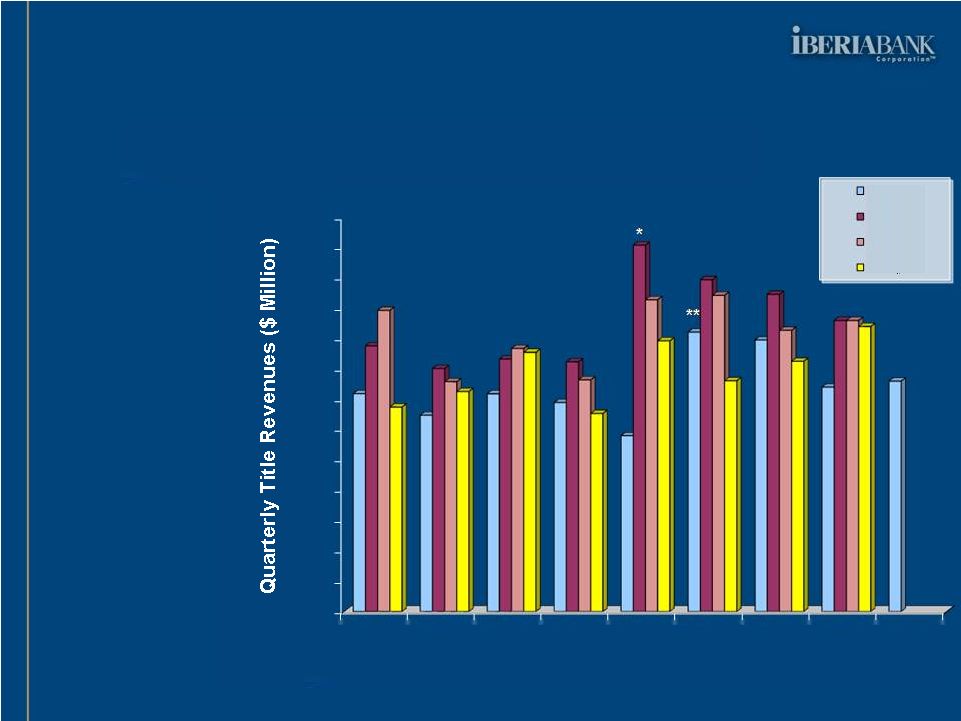 Appendix Appendix Title Insurance Quarterly Revenues 65 • Title & Mortgage Footprints Don’t Necessarily Overlap • 1Q11: $3.8mm In Revenues (- 19% Vs. 4Q10) • New CEO For Title Business On 10/25/10 $- $0.5 $1.0 $1.5 $2.0 $2.5 $3.0 $3.5 $4.0 $4.5 $5.0 $5.5 $6.0 $6.5 2003 2004 2005 2006 2007 2008 2009 2010 2011 Title Insurance Revenues 1st Qtr 2nd Qtr 3rd Qtr 4th Qtr * Includes United Title in April 2007 ** Includes American Abstract in March 2008 |
 66 FDIC Loss Share FDIC Loss Share Performance Performance |
 FDIC Loss Share Performance FDIC Loss Share Performance Covered Portfolio Performance 67 ($ in thousands) 1 Excludes non-reimbursable expenses and accrued interest, which totaled $13.8mm life-to-date at March 31, 2011. Original Estimated Losses Additional Impairment Losses to Date 1 Estimated Remaining Losses @ 03/31/11 Projected Total Losses FDIC Threshold Projected Credit Improvement Projected Credit Improvement excl. Additional Impairment CapitalSouth 113,500 $ 20,584 $ 47,254 $ 33,585 $ 80,839 $ 135,000 $ 32,661 $ 53,245 $ Acquired 8/21/2009 Orion Bank 862,681 $ 38,728 $ 401,830 $ 195,112 $ 596,942 $ 550,000 $ 265,739 $ 304,467 $ Acquired 11/13/09 Century Bank 296,809 $ 33,396 $ 131,279 $ 154,134 $ 285,413 $ 285,000 $ 11,396 $ 44,792 $ Acquired 11/13/09 Sterling Bank 84,305 $ - $ 13,828 $ 70,477 $ 84,305 $ 52,000 $ - $ - Acquired 7/23/10 Total 1,357,295 $ 92,708 $ 594,191 $ 453,308 $ 1,047,499 $ 309,796 $ 402,504 $ |
 FDIC Loss Share Performance FDIC Loss Share Performance Covered Portfolio Performance 68 ($ in thousands) Impairment Change Additional Impairment Loan Recapture Loan Impairment Total Loan Impairment ORE Impairment Other 1 Additional Impairment 12/31/2010 Q1 2011 Q1 2011 Q1 2011 Q1 2011 3/31/2011 CapitalSouth 11,099 $ (1,741) $ 8,909 $ 7,169 $ 75 $ 2,242 $ 20,584 $ Acquired 8/21/2009 Orion Bank 35,273 $ (6,317) $ 3,916 $ (2,401) $ 803 $ 5,054 $ 38,728 $ Acquired 11/13/09 Century Bank 27,256 $ (2,800) $ 4,470 $ 1,670 $ 1,172 $ 3,299 $ 33,396 $ Acquired 11/13/09 Sterling Bank - $ - $ - $ - $ - $ - $ - $ Acquired 7/23/10 Total 73,627 $ (10,858) $ 17,296 $ 6,438 $ 2,049 $ 10,594 $ 92,708 $ Net Loans 1,519,556 $ Notes: % of Net Loans 6.1% 1 Represents ORE impairments prior to 12/31/2010 Gross Loans 2,128,894 $ % of Gross Loans 4.4% |
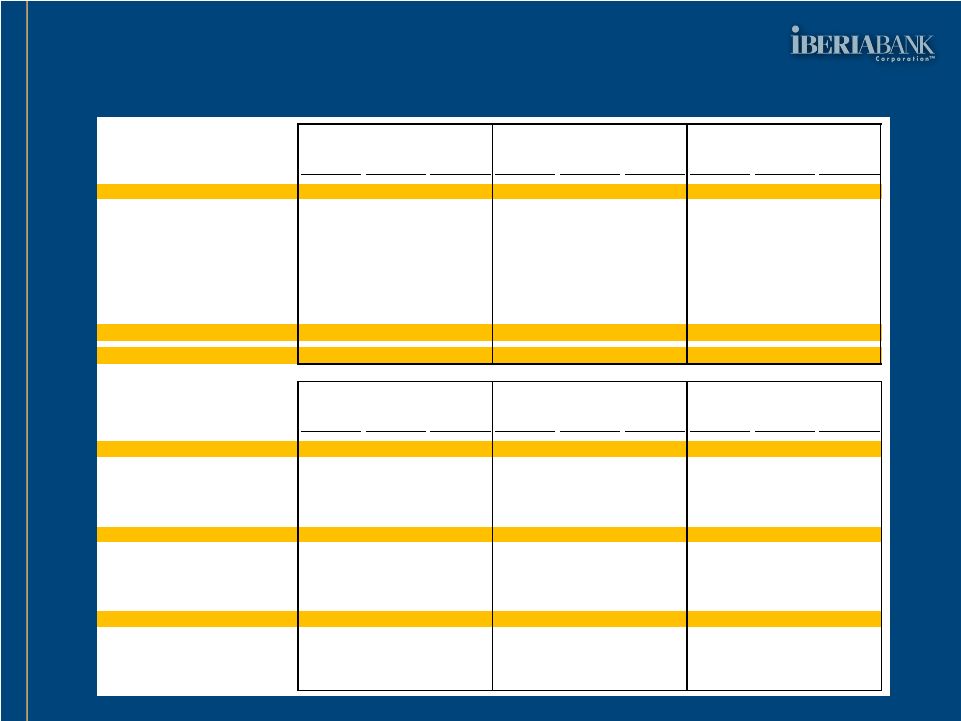 FDIC Loss Share Performance FDIC Loss Share Performance Covered Loan Portfolio Rollforward 69 ($ in thousands) Average Income / Expense Average Yield Average Income / Expense Average Yield Average Income / Expense Average Yield Covered Loans 1,571,248 36,709 9.199% 1,466,627 39,453 10.592% 1,545,551 54,118 14.049% Mortgage Loans 289,197 7,479 10.345% 247,827 6,159 9.941% 253,360 6,865 10.839% Indirect Automobile - - 0.000% - - 0.000% - - 0.000% Credit Card 1,204 25 8.374% 1,154 20 6.934% 1,083 19 7.091% Consumer 190,836 2,893 6.015% 213,082 3,225 6.005% 196,378 3,926 8.107% Line Of Credit-Consumer Loans 84,514 1,623 7.618% 79,958 4,582 22.733% 79,580 7,391 37.664% Commercial & Business Banking 1,004,908 24,688 9.636% 924,098 25,467 10.792% 1,015,204 35,917 14.155% Loans in Process 589 - 0.000% 508 - 0.000% (54) - 0.000% Overdrafts 1 - 0.000% 0 - 0.000% 0 - 0.000% FDIC Loss Share Receivable 865,810 (5,025) -2.271% 899,558 (8,619) -3.749% 708,809 (21,913) -12.366% Net Covered Loan Portfolio 2,437,058 31,684 5.133% 2,366,185 30,834 5.143% 2,254,360 32,205 5.744% Average Income / Expense Average Yield Average Income / Expense Average Yield Average Income / Expense Average Yield Covered Loans 1,571,248 36,709 9.199% 1,466,627 39,453 10.592% 1,545,551 54,118 14.049% CapitalSouth Bank 273,100 5,268 7.634% 250,865 8,355 13.171% 251,762 10,188 16.262% Orion Bank 817,253 20,627 9.881% 742,289 24,721 13.046% 823,081 32,651 16.025% Century Bank 366,169 8,860 9.580% 332,360 3,878 4.610% 339,135 9,156 10.795% Sterling Bank 114,725 1,953 5.860% 141,113 2,499 6.770% 131,574 2,123 6.472% FDIC Loss Share Receivable 865,810 (5,025) -2.271% 899,558 (8,619) -3.749% 708,809 (21,913) -12.366% CapitalSouth Bank 77,103 (954) -4.840% 79,553 (2,600) -12.788% 58,914 (1,877) -12.744% Orion Bank 551,435 (4,562) -3.237% 555,610 (5,568) -3.921% 418,948 (18,861) -18.009% Century Bank 186,425 349 0.732% 197,355 (593) -1.177% 163,829 (1,385) -3.383% Sterling Bank 50,847 141 1.089% 67,040 142 0.830% 67,119 210 1.253% Net Covered Loan Portfolio 2,437,058 31,684 5.133% 2,366,185 30,834 5.143% 2,254,360 32,205 5.744% CapitalSouth Bank 350,204 4,314 4.887% 330,418 5,756 6.921% 310,676 8,311 10.762% Orion Bank 1,368,688 16,066 4.596% 1,297,899 19,153 5.783% 1,242,029 13,790 4.546% Century Bank 552,594 9,209 6.595% 529,715 3,285 2.457% 502,963 7,770 6.177% Sterling Bank 165,573 2,095 4.393% 208,153 2,641 4.854% 198,692 2,333 4.709% 3Q2010 4Q2010 1Q2011 3Q2010 4Q2010 1Q2011 |