Exhibit 99.2

Exhibit 99.2
2Q11 Earnings Conference Call
Supplemental Materials
July 26, 2011
Forward Looking Statements
Safe Harbor
Statements contained in this presentation which are not historical facts and which pertain to future operating results of IBERIABANK Corporation and its subsidiaries constitute “forward-looking statements” within the meaning of the Private Securities Litigation Reform Act of 1995. These forward-looking statements involve significant risks and uncertainties. Actual results may differ materially from the results discussed in these forward-looking statements. Factors that might cause such a difference include, but are not limited to, those discussed in the Company’s periodic and other filings with the SEC.

Introductory Comments

Introductory Comments
Summary – Position
Favorable Balance Sheet Composition
Very Balanced; Core Funded; Low C&D Exposure
Continued Good Asset Quality; Extraordinary Capital
Favorable Interest Rate And Credit Risk Positioning
Some of the Highest Capital Ratios of Bank Holding Companies With More Than $5 Billion in Assets
Legacy Deposit Growth in 2Q11 And Improved Deposit Mix
Future Growth Engines in Multiple Markets
Strategic Recruiting Continued During The 2nd Quarter
Fortunately, We Avoided What Ails The Banking Industry
Remain Well Positioned For Future Opportunities
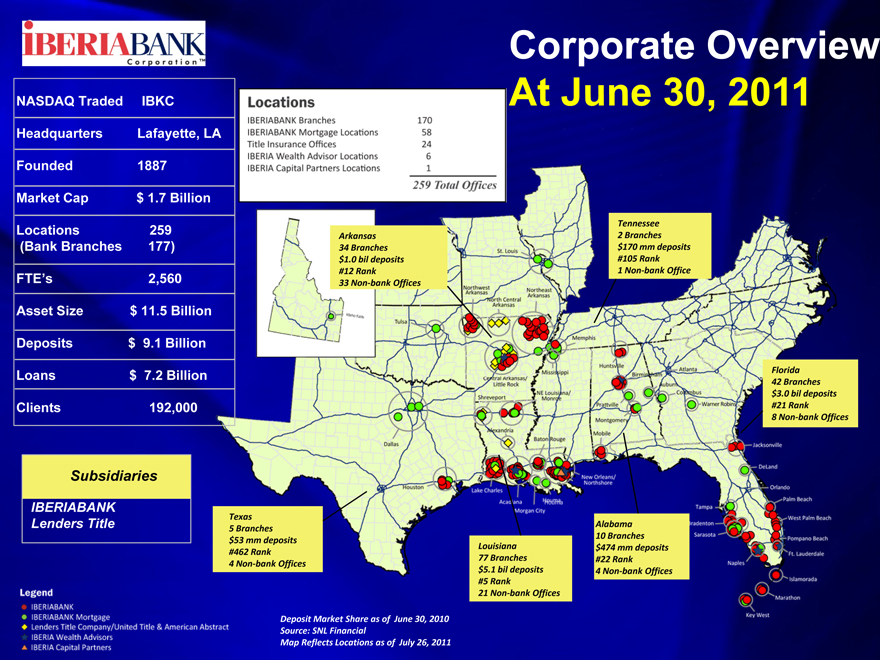
Corporate Overview At June 30, 2011
NASDAQ Traded IBKC Headquarters Lafayette, LA Founded 1887 Market Cap $ 1.7 Billion
Locations 259 (Bank Branches 177)
FTE’s 2,560 Asset Size $ 11.5 Billion Deposits $ 9.1 Billion Loans $ 7.2 Billion Clients 192,000
Subsidiaries
IBERIABANK Lenders Title
Deposit Market Share as of June 30, 2010 Source: SNL Financial Map Reflects Locations as of July 26, 2011
Texas
5 | | Branches $53 mm deposits #462 Rank |
Louisiana
77 Branches $5.1 bil deposits
#5 Rank
21 Non? bank Offices
Alabama
10 Branches $474 mm deposits #22 Rank
Arkansas
34 Branches $1.0 bil deposits #12 Rank
33 Non? bank Offices
Tennessee
2 | | Branches $170 mm deposits #105 Rank |
Florida
42 Branches $3.0 bil deposits #21 Rank
Legend
IBERIABANK
IBERIABANK Mortgage
Lenders Title Company/United Title & American Abstract
IBERIA Wealth Advisors
IBERIA Capital Partners
Locations 170
IBERIABANK Branches 58
IBERIABANK Mortgage Locations 24
Title Insurance Offices 6
IBERIA Wealth Advisors Locations 1

Financial Overview
Financial Overview
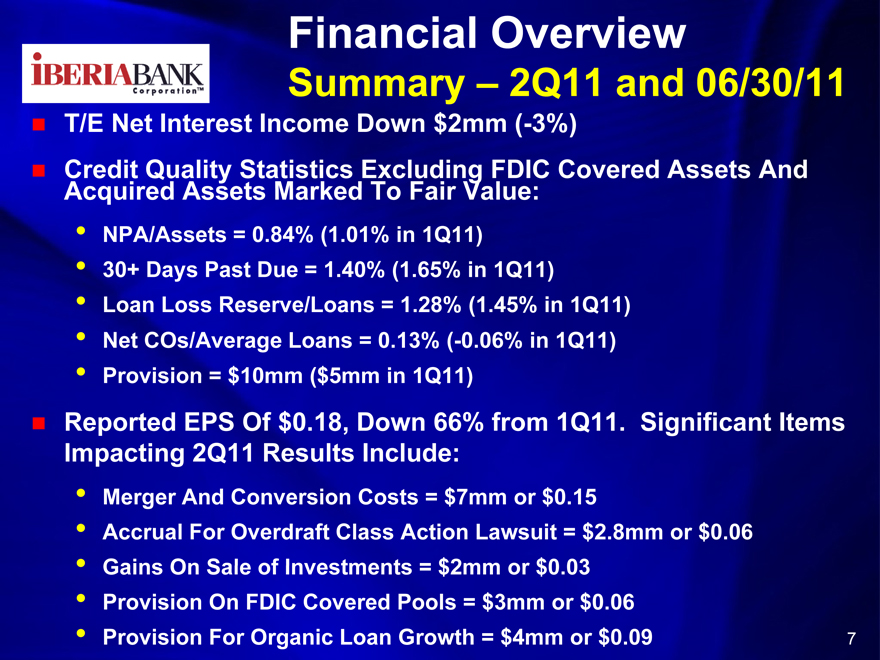
Summary – 2Q11 and 06/30/11
T/E Net Interest Income Down $2mm (-3%)
Credit Quality Statistics Excluding FDIC Covered Assets And Acquired Assets Marked To Fair Value:
• NPA/Assets = 0.84% (1.01% in 1Q11)
• 30+ Days Past Due = 1.40% (1.65% in 1Q11)
• Loan Loss Reserve/Loans = 1.28% (1.45% in 1Q11)
• Net COs/Average Loans = 0.13% (-0.06% in 1Q11)
• Provision = $10mm ($5mm in 1Q11)
Reported EPS Of $0.18, Down 66% from 1Q11. Significant Items Impacting 2Q11 Results Include:
• Merger And Conversion Costs = $7mm or $0.15
• Accrual For Overdraft Class Action Lawsuit = $2.8mm or $0.06
• Gains On Sale of Investments = $2mm or $0.03
• Provision On FDIC Covered Pools = $3mm or $0.06
• Provision For Organic Loan Growth = $4mm or $0.09
7
Financial Overview
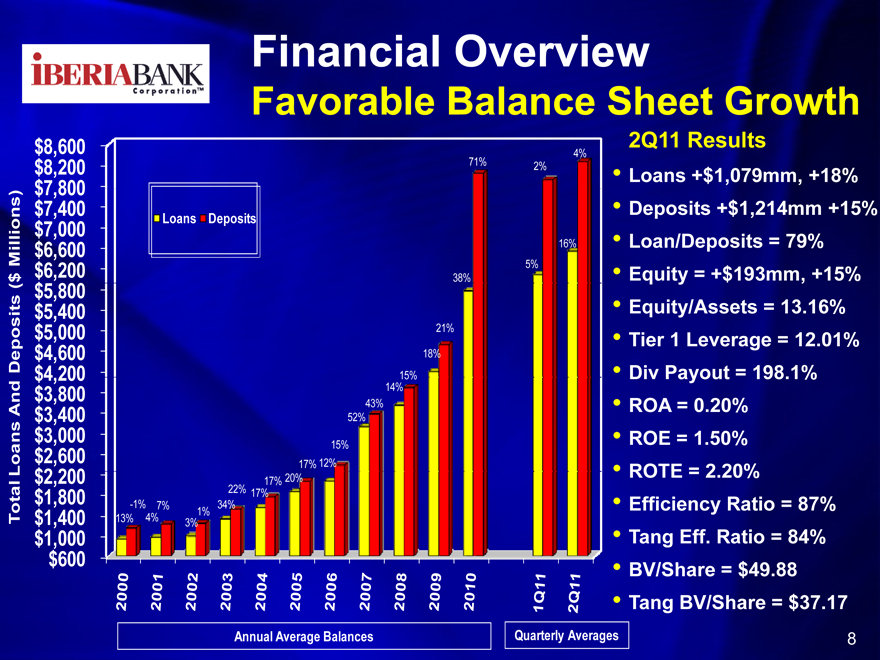
Favorable Balance Sheet Growth
2Q11 Results
• Loans +$1,079mm, +18%
• Deposits +$1,214mm +15%
• Loan/Deposits = 79%
• Equity = +$193mm, +15%
• Equity/Assets = 13.16%
• Tier 1 Leverage = 12.01%
• Div Payout = 198.1%
• ROA = 0.20%
• ROE = 1.50%
• ROTE = 2.20%
• Efficiency Ratio = 87%
• Tang Eff. Ratio = 84%
• BV/Share = $49.88
• Tang BV/Share = $37.17
Annual Average Balances
Quarterly Averages
$8,600 $8,200 $7,800 $7,400 $7,000 $6,600 $6,200 $5,800 $5,400 $5,000 $4,600 $4,200 $3,800 $3,400 $3,000 $2,600 $2,200 $1,800 $1,400 $1,000 $600
Loans Deposits
13% 16% 5% 38%
21%
18% 15% 14% 43% 52%
15% 17% 12% 17% 20% 22% 17% -1% 7% 34% 1% 4%4% 71% 2%
2000 2001 2002 2003 2004 2005 2006 2007 2008 2009 2010 1Q11 2Q11
Total Loans And Deposits ($ Millions)
8
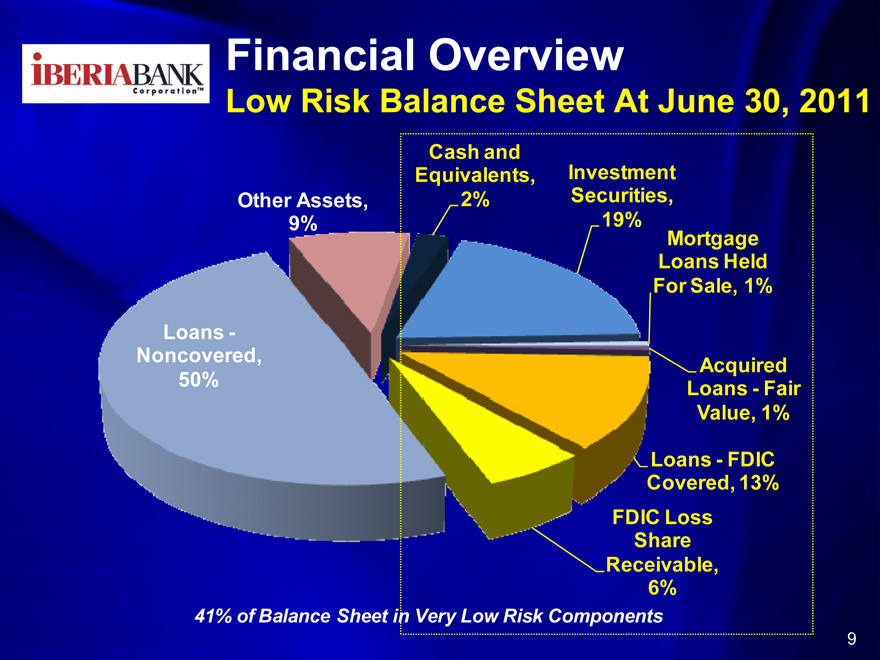
Financial Overview
Low Risk Balance Sheet At June 30, 2011
Other Assets, 9%
Cash and Equivalents, 2%
Investment Securities, 19%
Mortgage Loans Held For Sale, 1%
Acquired Loans—Fair Value, 1%
FDIC Loss Share Receivable, 6%
41% of Balance Sheet in Very Low Risk Components
Loans -Noncovered, 50%
9
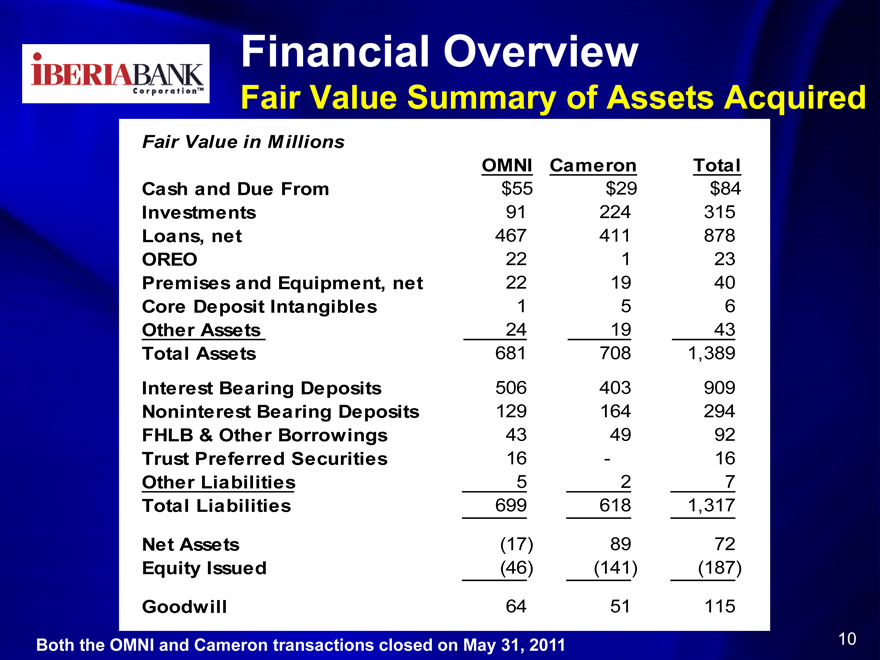
Financial Overview
Fair Value Summary of Assets Acquired
Fair Value in Millions
OMNI Cameron Total
Cash and Due From $55 $29 $84
Investments 91 224 315
Loans, net 467 411 878
OREO 22 1 23
Premises and Equipment, net 22 19 40
Core Deposit Intangibles 1 5 6
Other Assets 24 19 43
Total Assets 681 708 1,389
Interest Bearing Deposits 506 403 909
Noninterest Bearing Deposits 129 164 294
FHLB & Other Borrowings 43 49 92
Trust Preferred Securities 16—16
Other Liabilities 5 2 7
Total Liabilities 699 618 1,317
Net Assets(17) 89 72
Equity Issued(46)(141)(187)
Goodwill 64 51 115
Both the OMNI and Cameron transactions closed on May 31, 2011
10
IBERIA BANK
Corporationtm
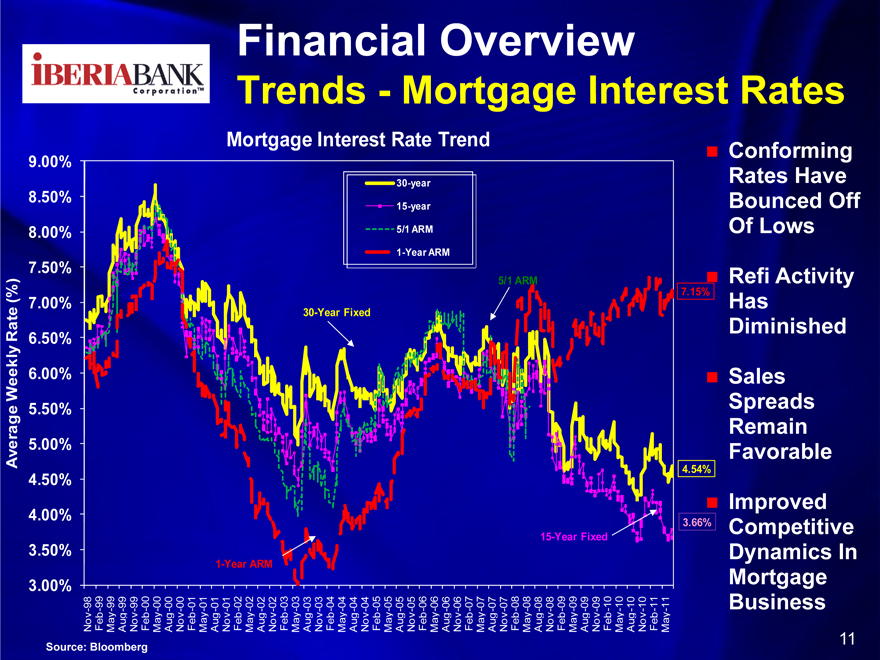
Financial Overview
Trends—Mortgage Interest Rates
Mortgage Interest Rate Trend
30-year
15-year 5/1 ARM
1-Year ARM
9.00% 8.50% 8.00%
7.50% (%) 7.00% Rate 6.50% Weekly 6.00% 5.50% Average 5.00% 4.50%
4.00% 3.50% 3.00%
Nov-98 Feb-99 May-99 Aug-99 Nov-99 Feb-00 May-00 Aug-00 Nov-00 Feb-01 May-01 Aug-01 Nov-01 Feb-02 May-02 Aug-02 Nov-02 Feb-03 May-03 Aug-03 Nov-03 Feb-04 May-04 Aug-04 Nov-04 Feb-05 May-05 Aug-05 Nov-05 Feb-06 May-06 Aug-06 Nov-06 Feb-07 May-07 Aug-07 Nov-07 Feb-08 May-08 Aug-08 Nov-08 Feb-09 May-09 Aug-09 Nov-09 Feb-10 May-10 Aug-10 Nov-10 Feb-11 May-11
Source: Bloomberg
Conforming Rates Have Bounced Off Of Lows
Refi Activity Has Diminished
Sales Spreads Remain Favorable
Improved Competitive Dynamics In Mortgage Business 30-Year Fixed 1-Year ARM 5/1 ARM 4.54% 3.66% 15-Year Fixed 7.15% 1-Year ARM
11
IBERIA BANK
Corporationtm
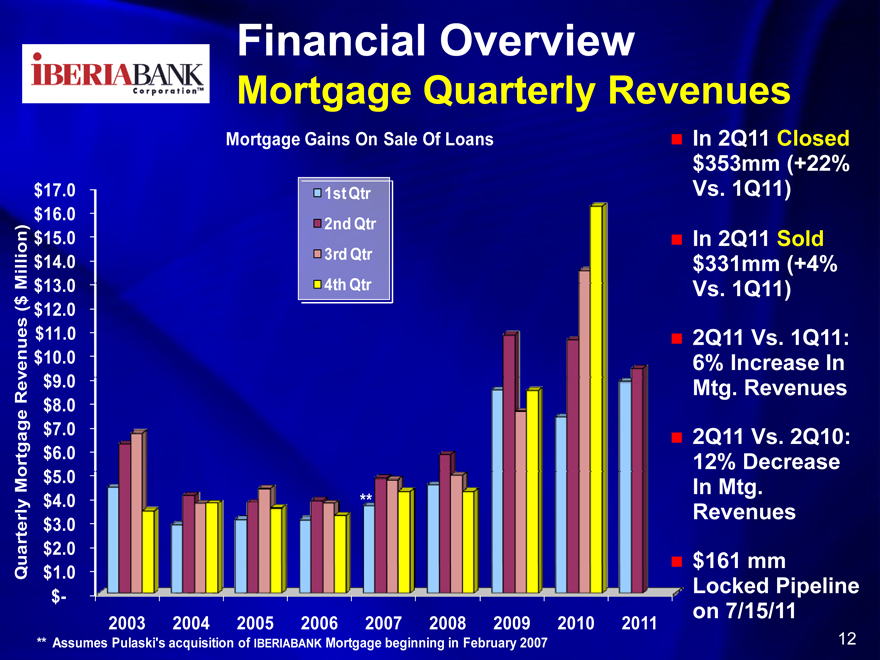
Financial Overview
Mortgage Quarterly Revenues
Mortgage Gains On Sale Of Loans
1st Qtr 2nd Qtr 3rd Qtr 4th Qtr
$17.0 $16.0 $15.0 Million) $14.0 $13.0
( $ $12.0 $11.0 Revenues $10.0 $9.0 $8.0 $7.0 Mortgage $6.0 $5.0 $4.0 $3.0 Quarterly $2.0 $1.0 $-
2003 2004 2005 2006 2007 2008 2009 2010 2011
** Assumes Pulaski’s acquisition of IBERIABANK Mortgage beginning in February 2007
In 2Q11 Closed $353mm (+22% Vs. 1Q11)
In 2Q11 Sold $331mm (+4% Vs. 1Q11)
2Q11 Vs. 1Q11:
6% Increase In Mtg. Revenues
2Q11 Vs. 2Q10: 12% Decrease In Mtg.
Revenues
$161 mm Locked Pipeline on 7/15/11
12**
IBERIA BANK
Corporationtm
Financial Overview
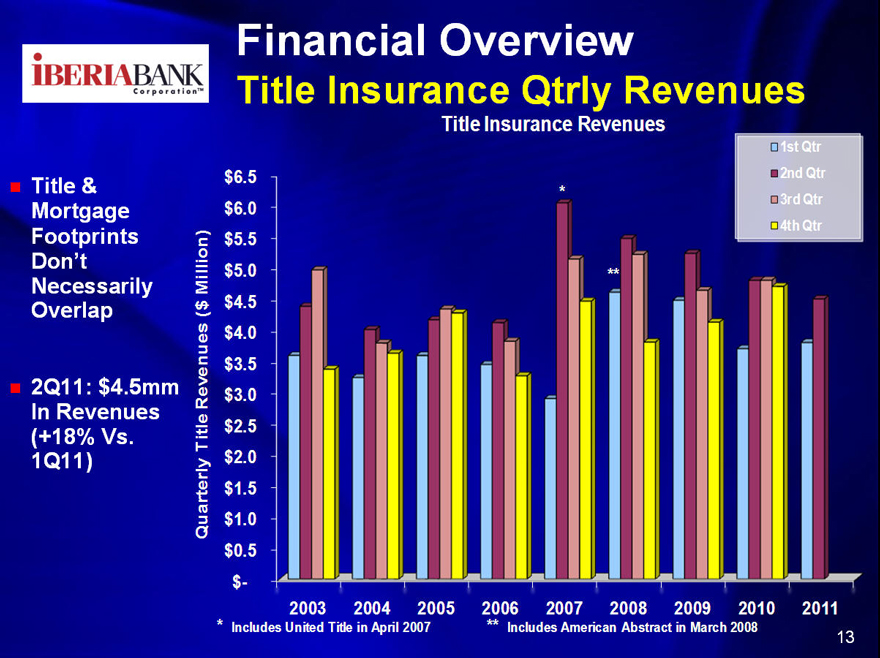
Title Insurance Qtrly Revenues
Title Insurance Revenues
Title & Mortgage Footprints Don’t Necessarily Overlap
2Q11: $4.5mm In Revenues (+18% Vs. 1Q11)
$6.5 $6.0 $5.5 ( $ Million) $5.0 $4.5 Revenues $4.0 $3.5 $3.0 Title $2.5 $2.0 $1.5 Quarterly $1.0 $0.5 $-
2003 2004 2005 2006 2007 2008 2009 2010 2011
* Includes United Title in April 2007 ** Includes American Abstract in March 2008
13 * **
IBERIA BANK
Corporationtm
Financial Overview
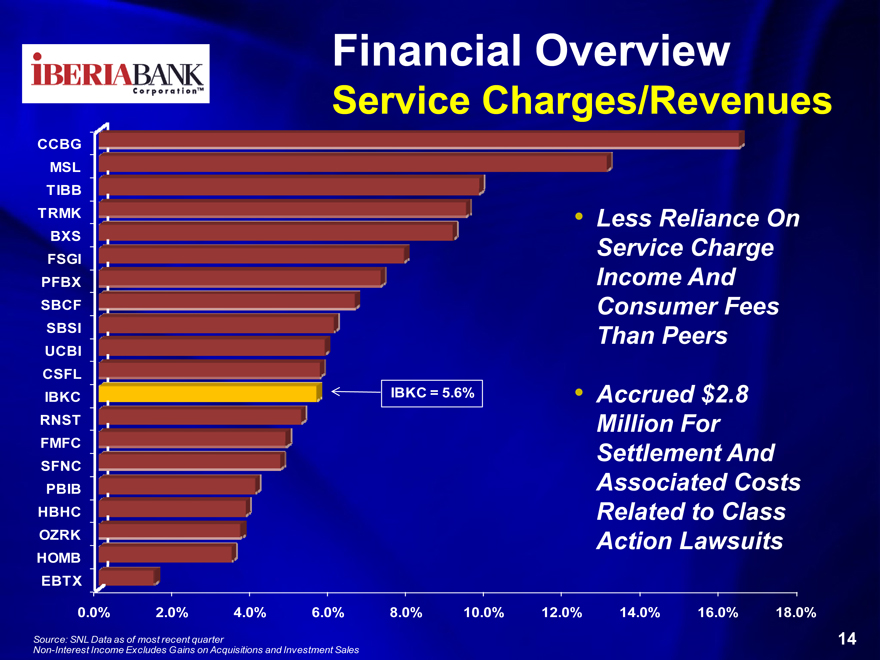
Service Charges/Revenues
CCBG MSL
TIBB TRMK
BXS FSGI PFBX SBCF SBSI UCBI CSFL IBKC RNST FMFC SFNC PBIB HBHC OZRK HOMB EBTX
0.0% 2.0% 4.0% 6.0% 8.0% 10.0% 12.0% 14.0% 16.0% 18.0%
• Less Reliance On Service Charge Income And Consumer Fees Than Peers
• Accrued $2.8 Million For Settlement And Associated Costs Related to Class Action Lawsuits
IBKC = 5.6%
Source: SNL Data as of most recent quarter
Non-Interest Income Excludes Gains on Acquisitions and Investment Sales
14
IBERIA BANK
Corporationtm
Financial Overview
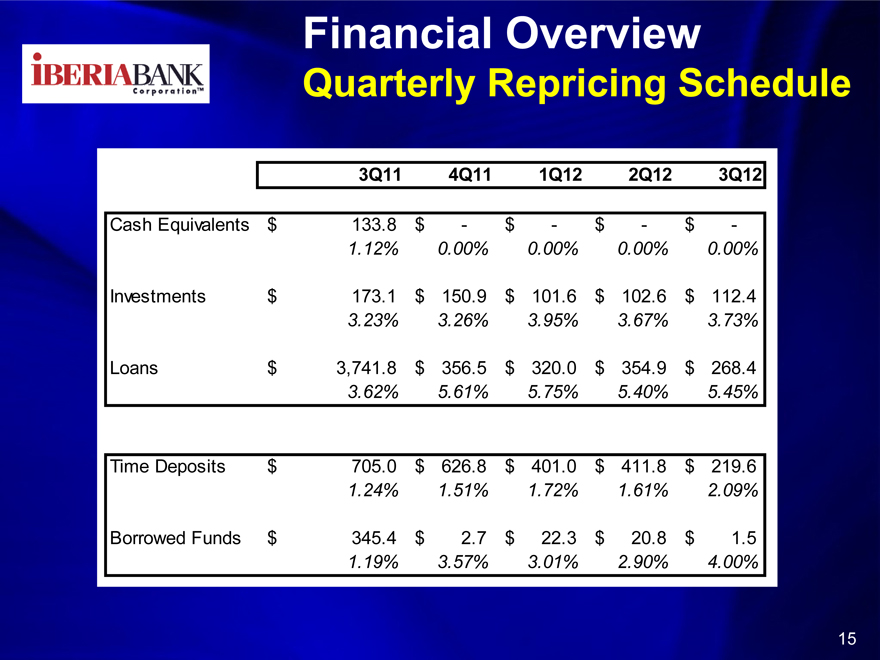
Quarterly Repricing Schedule
3Q11 4Q11 1Q12 2Q12 3Q12
Cash Equivalents $ 133.8 $ — $ — $ — $ -
1.12% 0.00% 0.00% 0.00% 0.00%
Investments $ 173.1 $ 150.9 $ 101.6 $ 102.6 $ 112.4
3.23% 3.26% 3.95% 3.67% 3.73%
Loans $ 3,741.8 $ 356.5 $ 320.0 $ 354.9 $ 268.4
3.62% 5.61% 5.75% 5.40% 5.45%
Time Deposits $ 705.0 $ 626.8 $ 401.0 $ 411.8 $ 219.6
1.24% 1.51% 1.72% 1.61% 2.09%
Borrowed Funds $ 345.4 $ 2.7 $ 22.3 $ 20.8 $ 1.5
1.19% 3.57% 3.01% 2.90% 4.00%
15
IBERIABANK
Corporation tm
Financial Overview
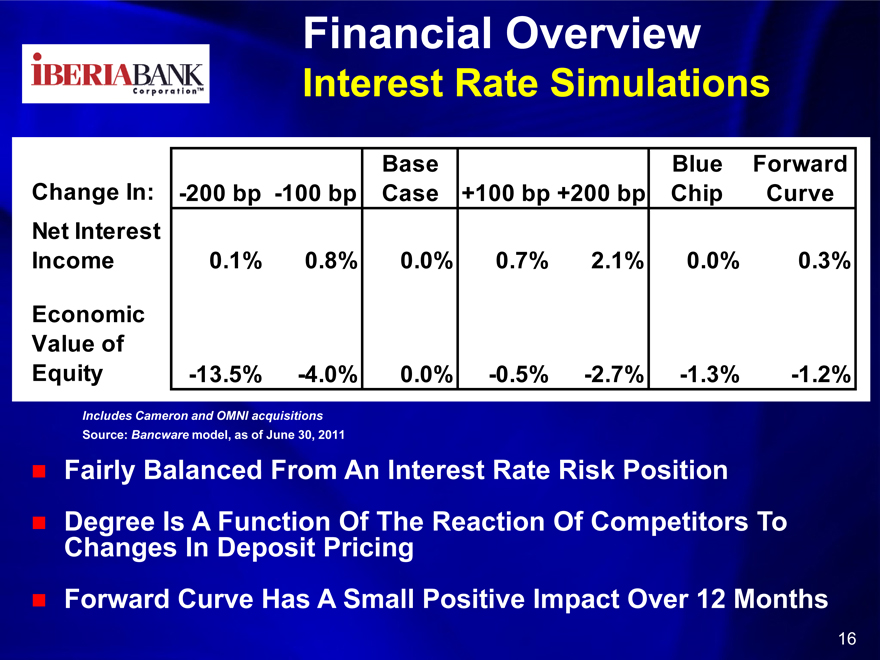
Interest Rate Simulations
Base Blue Forward
Change In: -200 bp -100 bp Case +100 bp +200 bp Chip Curve
Net Interest
Income 0.1% 0.8% 0.0% 0.7% 2.1% 0.0% 0.3%
Economic
Value of
Equity -13.5% -4.0% 0.0% -0.5% -2.7% -1.3% -1.2%
Includes Cameron and OMNI acquisitions
Source: Bancware model, as of June 30, 2011
Fairly Balanced From An Interest Rate Risk Position Degree Is A Function Of The Reaction Of Competitors To Changes In Deposit Pricing Forward Curve Has A Small Positive Impact Over 12 Months
16
IBERIABANK
Corporation tm
Financial Overview
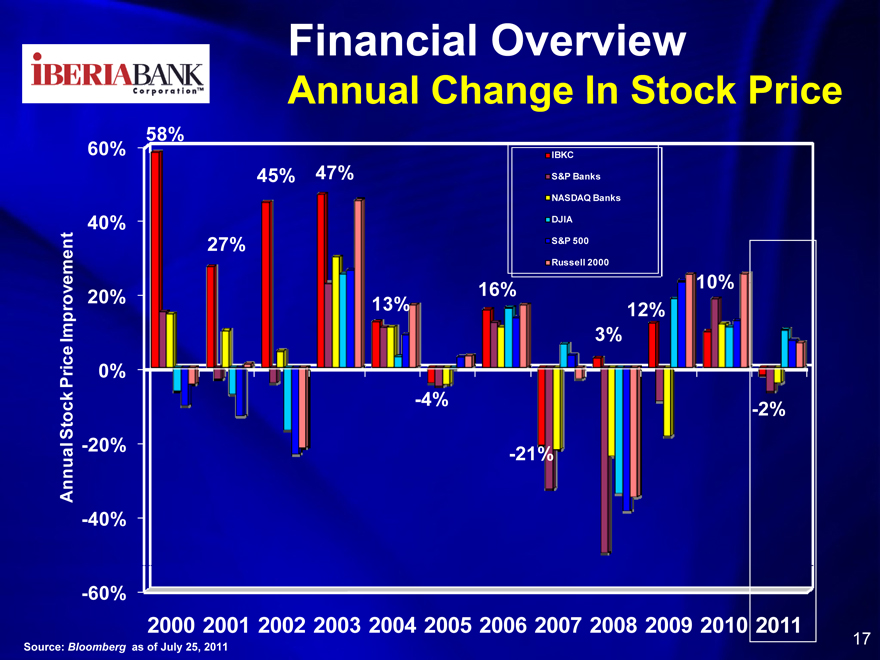
Annual Change In Stock Price
Annual Stock Price Improvement
— -
60% 40% 20% 0%- 20%- 40%- 60%
58% 27% 45% 47% 13% 16% 3% 12% 10% -4% -21% -2%
IBKC S&P Banks NASDAQ Banks DJIA
S&P 500
Russell 2000
2000 2001 2002 2003 2004 2005 2006 2007 2008 2009 20102011
Source: Bloomberg as of July 25, 2011
17
IBERIABANK
Corporation tm
Financial Overview
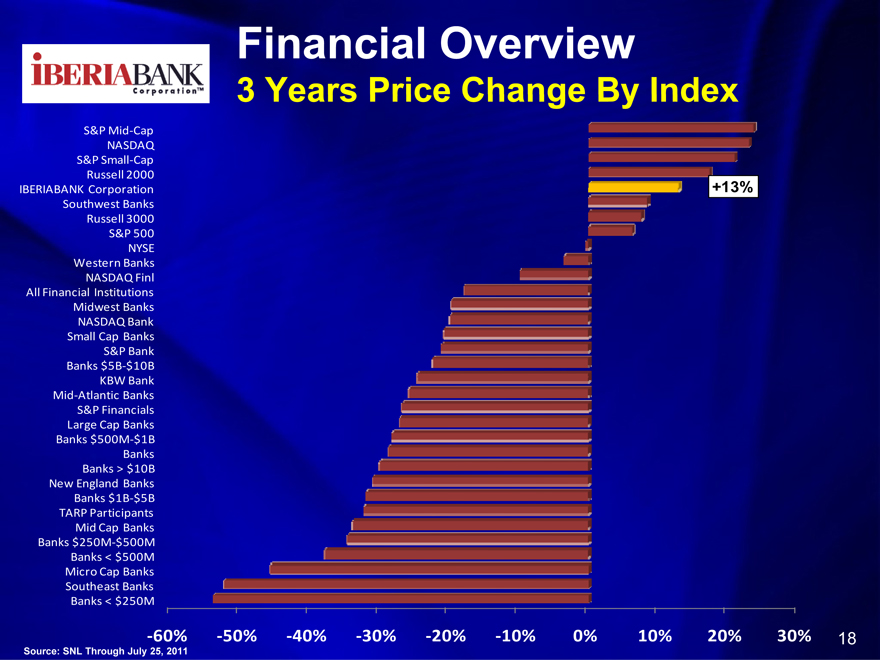
3 Years Price Change By Index
S&P Mid-Cap
NASDAQ
S&P Small-Cap
Russell 2000
IBERIABANK Corporation
Southwest Banks
Russell 3000
S&P 500
NYSE
Western Banks
NASDAQ Finl
All Financial Institutions
Midwest Banks
NASDAQ Bank
Small Cap Banks
S&P Bank
Banks $5B-$10B
KBW Bank
Mid-Atlantic Banks
S&P Financials
Large Cap Banks
Banks $500M-$1B
Banks
Banks > $10B
New England Banks
Banks $1B-$5B
TARP Participants
Mid Cap Banks
Banks $250M-$500M
Banks < $500M
Micro Cap Banks
Southeast Banks
Banks < $250M
+13%
-60% -50% -40% -30% -20% -10% 0% 10% 20% 30%
Source: SNL Through July 25, 2011
18

IBERIABANK
Corporation tm
Asset Quality
19
IBERIABANK
Corporation tm
Asset Quality
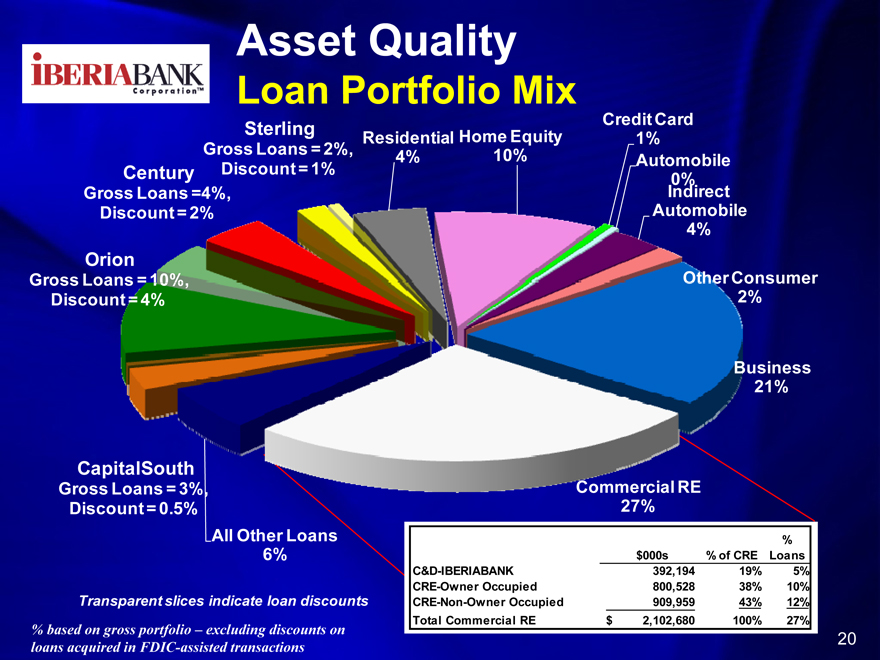
Loan Portfolio Mix
Sterling Gross Loans = 2%, Discount = 1%
Century Gross Loans =4%, Discount = 2%
Orion Gross Loans = 10%, Discount = 4%
CapitalSouth Gross Loans = 3%, Discount = 0.5%
All Other Loans 6%
Transparent slices indicate loan discounts
% based on gross portfolio – excluding discounts on loans acquired in FDIC-assisted transactions
Residential Home Equity
4% 10%
Credit Card 1% Automobile 0% Indirect Automobile 4%
Other Consumer 2%
Business 21%
Commercial RE 27%
% Loans
$000s % of CRE
C&D-IBERIABANK 392,194 19% 5%
CRE-Owner Occupied 800,528 38% 10%
CRE-Non-Owner Occupied 909,959 43% 12%
Total Commercial RE $ 2,102,680 100% 27%
20
Asset Quality
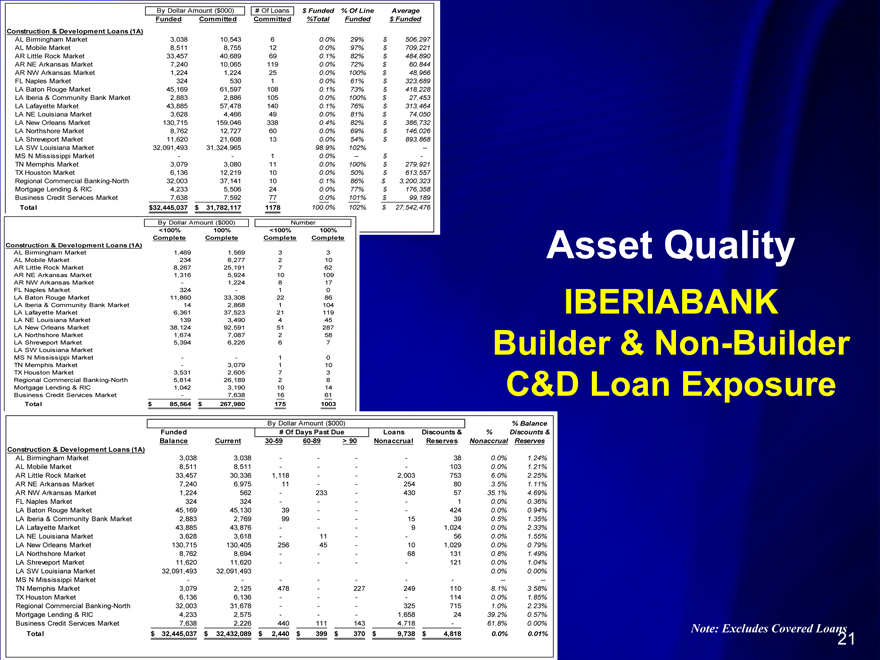
IBERIABANK Builder & Non-Builder C&D Loan Exposure
By Dollar Amount ($000) # Of Loans $ Funded % Of Line Average
Funded Committed Committed %Total Funded $ Funded Construction & Development Loans (1A)
AL Birmingham Market 3,038 10,543 6 0.0% 29% $ 506,297 AL Mobile Market 8,511 8,755 12 0.0% 97% $ 709,221 AR Little Rock Market 33,457 40,689 69 0.1% 82% $ 484,890 AR NE Arkansas Market 7,240 10,065 119 0.0% 72% $ 60,844 AR NW Arkansas Market 1,224 1,224 25 0.0% 100% $ 48,966 FL Naples Market 324 530 1 0.0% 61% $ 323,689 LA Baton Rouge Market 45,169 61,597 108 0.1% 73% $ 418,228 LA Iberia & Community Bank Market 2,883 2,886 105 0.0% 100% $ 27,453 LA Lafayette Market 43,885 57,478 140 0.1% 76% $ 313,464 LA NE Louisiana Market 3,628 4,466 49 0.0% 81% $ 74,050 LA New Orleans Market 130,715 159,046 338 0.4% 82% $ 386,732 LA Northshore Market 8,762 12,727 60 0.0% 69% $ 146,026 LA Shreveport Market 11,620 21,608 13 0.0% 54% $ 893,868 LA SW Louisiana Market 32,091,493 31,324,965 98.9% 102% — MS N Mississippi Market — —1 0.0% — $ -TN Memphis Market 3,079 3,080 11 0.0% 100% $ 279,921 TX Houston Market 6,136 12,219 10 0.0% 50% $ 613,557 Regional Commercial Banking-North 32,003 37,141 10 0.1% 86% $ 3,200,323 Mortgage Lending & RIC 4,233 5,506 24 0.0% 77% $ 176,358 Business Credit Services Market 7,638 7,592 77 0.0% 101% $ 99,189
Total $ 32,445,037 $ 31,782,117 1178 100.0% 102% $ 27,542,476
By Dollar Amount ($000) Number
<100% 100% <100% 100%
Complete Complete Complete Complete
Construction & Development Loans (1A)
AL Birmingham Market 1,469 1,569 3 3 AL Mobile Market 234 8,277 2 10 AR Little Rock Market 8,267 25,191 7 62 AR NE Arkansas Market 1,316 5,924 10 109 AR NW Arkansas Market — 1,224 8 17 FL Naples Market 324 —1 0 LA Baton Rouge Market 11,860 33,308 22 86 LA Iberia & Community Bank Market 14 2,868 1 104 LA Lafayette Market 6,361 37,523 21 119 LA NE Louisiana Market 139 3,490 4 45 LA New Orleans Market 38,124 92,591 51 287 LA Northshore Market 1,674 7,087 2 58 LA Shreveport Market 5,394 6,226 6 7 LA SW Louisiana Market MS N Mississippi Market — —1 0 TN Memphis Market — 3,079 1 10 TX Houston Market 3,531 2,605 7 3 Regional Commercial Banking-North 5,814 26,189 2 8 Mortgage Lending & RIC 1,042 3,190 10 14 Business Credit Services Market — 7,638 16 61
Total $ 85,564 $ 267,980 175 1003
By Dollar Amount ($000) % Balance
Funded # Of Days Past Due Loans Discounts & % Discounts & Balance Current 30-59 60-89 > 90 Nonaccrual Reserves Nonaccrual Reserves Construction & Development Loans (1A)
AL Birmingham Market 3,038 3,038 — — — — 38 0.0% 1.24% AL Mobile Market 8,511 8,511 — — — — 103 0.0% 1.21% AR Little Rock Market 33,457 30,336 1,118 — — 2,003 753 6.0% 2.25% AR NE Arkansas Market 7,240 6,975 11 — — 254 80 3.5% 1.11% AR NW Arkansas Market 1,224 562 — 233 — 430 57 35.1% 4.69% FL Naples Market 324 324 — — — — 1 0.0% 0.36% LA Baton Rouge Market 45,169 45,130 39 — — — 424 0.0% 0.94% LA Iberia & Community Bank Market 2,883 2,769 99 — — 15 39 0.5% 1.35% LA Lafayette Market 43,885 43,876 — — — 9 1,024 0.0% 2.33% LA NE Louisiana Market 3,628 3,618 — 11 — — 56 0.0% 1.55% LA New Orleans Market 130,715 130,405 256 45 — 10 1,029 0.0% 0.79% LA Northshore Market 8,762 8,694 — — — 68 131 0.8% 1.49% LA Shreveport Market 11,620 11,620 — — — — 121 0.0% 1.04% LA SW Louisiana Market 32,091,493 32,091,493 0.0% 0.00% MS N Mississippi Market — — — — — — —— — TN Memphis Market 3,079 2,125 478 — 227 249 110 8.1% 3.58% TX Houston Market 6,136 6,136 — — — — 114 0.0% 1.85% Regional Commercial Banking-North 32,003 31,678 — — — 325 715 1.0% 2.23% Mortgage Lending & RIC 4,233 2,575 — — — 1,658 24 39.2% 0.57% Business Credit Services Market 7,638 2,226 440 111 143 4,718 —61.8% 0.00%
Total $ 32,445,037 $ 32,432,089 $ 2,440 $ 399 $ 370 $ 9,738 $ 4,818 0.0% 0.01%
Note: Excludes Covered Loans
21
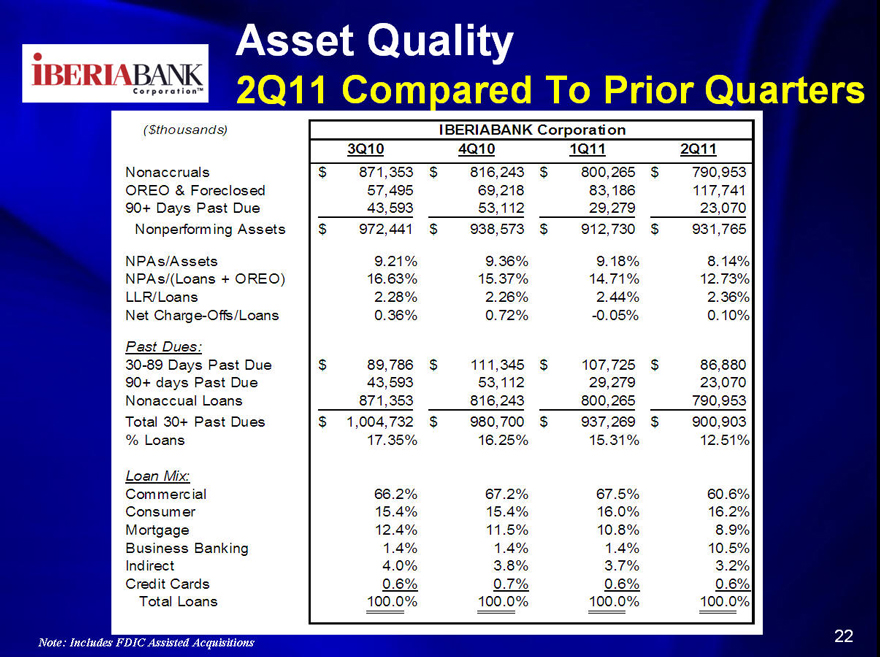
Asset Quality
2Q11 Compared To Prior Quarters
($thousands) IBERIABANK Corporation
3Q10 4Q10 1Q11 2Q11
Nonaccruals $ 871,353 $ 816,243 $ 800,265 $ 790,953 OREO & Foreclosed 57,495 69,218 83,186 117,741 90+ Days Past Due 43,593 53,112 29,279 23,070 Nonperforming Assets $ 972,441 $ 938,573 $ 912,730 $ 931,765
NPAs/Assets 9.21% 9.36% 9.18% 8.14% NPAs/(Loans + OREO) 16.63% 15.37% 14.71% 12.73% LLR/Loans 2.28% 2.26% 2.44% 2.36% Net Charge-Offs/Loans 0.36% 0.72% -0.05% 0.10%
Past Dues:
30-89 Days Past Due $ 89,786 $ 111,345 $ 107,725 $ 86,880 90+ days Past Due 43,593 53,112 29,279 23,070 Nonaccual Loans 871,353 816,243 800,265 790,953 Total 30+ Past Dues $ 1,004,732 $ 980,700 $ 937,269 $ 900,903
% Loans 17.35% 16.25% 15.31% 12.51%
Loan Mix:
Commercial 66.2% 67.2% 67.5% 60.6% Consumer 15.4% 15.4% 16.0% 16.2% Mortgage 12.4% 11.5% 10.8% 8.9% Business Banking 1.4% 1.4% 1.4% 10.5% Indirect 4.0% 3.8% 3.7% 3.2% Credit Cards 0.6% 0.7% 0.6% 0.6% Total Loans 100.0% 100.0% 100.0% 100.0%
Note: Includes FDIC Assisted Acquisitions
22
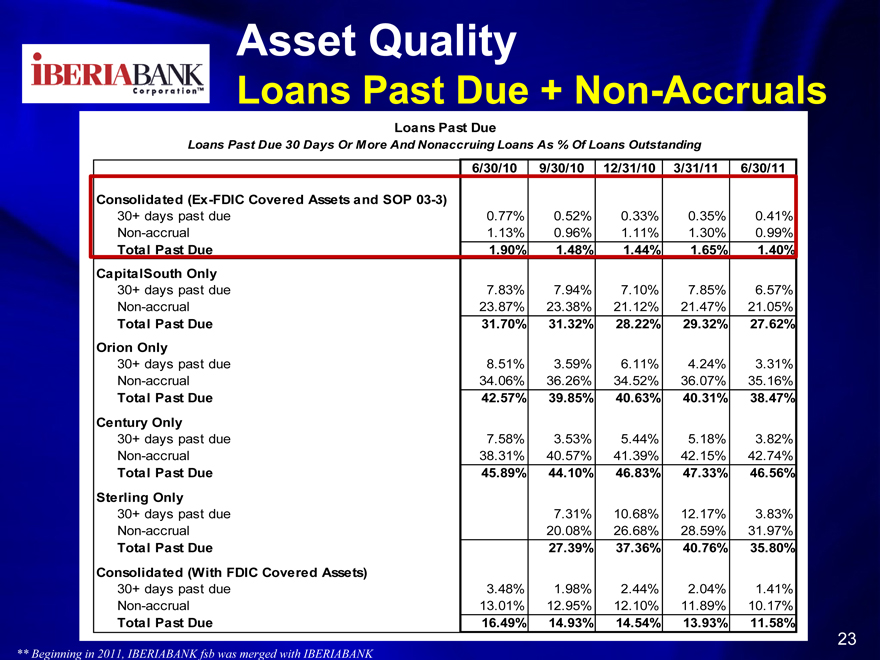
Asset Quality
Loans Past Due + Non-Accruals
Loans Past Due
Loans Past Due 30 Days Or More And Nonaccruing Loans As % Of Loans Outstanding
6/30/10 9/30/10 12/31/10 3/31/11 6/30/11
Consolidated (Ex-FDIC Covered Assets and SOP 03-3)
30+ days past due 0.77% 0.52% 0.33% 0.35% 0.41% Non-accrual 1.13% 0.96% 1.11% 1.30% 0.99%
Total Past Due 1.90% 1.48% 1.44% 1.65% 1.40% CapitalSouth Only
30+ days past due 7.83% 7.94% 7.10% 7.85% 6.57% Non-accrual 23.87% 23.38% 21.12% 21.47% 21.05%
Total Past Due 31.70% 31.32% 28.22% 29.32% 27.62% Orion Only
30+ days past due 8.51% 3.59% 6.11% 4.24% 3.31% Non-accrual 34.06% 36.26% 34.52% 36.07% 35.16%
Total Past Due 42.57% 39.85% 40.63% 40.31% 38.47% Century Only
30+ days past due 7.58% 3.53% 5.44% 5.18% 3.82% Non-accrual 38.31% 40.57% 41.39% 42.15% 42.74%
Total Past Due 45.89% 44.10% 46.83% 47.33% 46.56% Sterling Only
30+ days past due 7.31% 10.68% 12.17% 3.83% Non-accrual 20.08% 26.68% 28.59% 31.97%
Total Past Due 27.39% 37.36% 40.76% 35.80% Consolidated (With FDIC Covered Assets)
30+ days past due 3.48% 1.98% 2.44% 2.04% 1.41% Non-accrual 13.01% 12.95% 12.10% 11.89% 10.17%
Total Past Due 16.49% 14.93% 14.54% 13.93% 11.58%
23
** Beginning in 2011, IBERIABANK fsb was merged with IBERIABANK
23
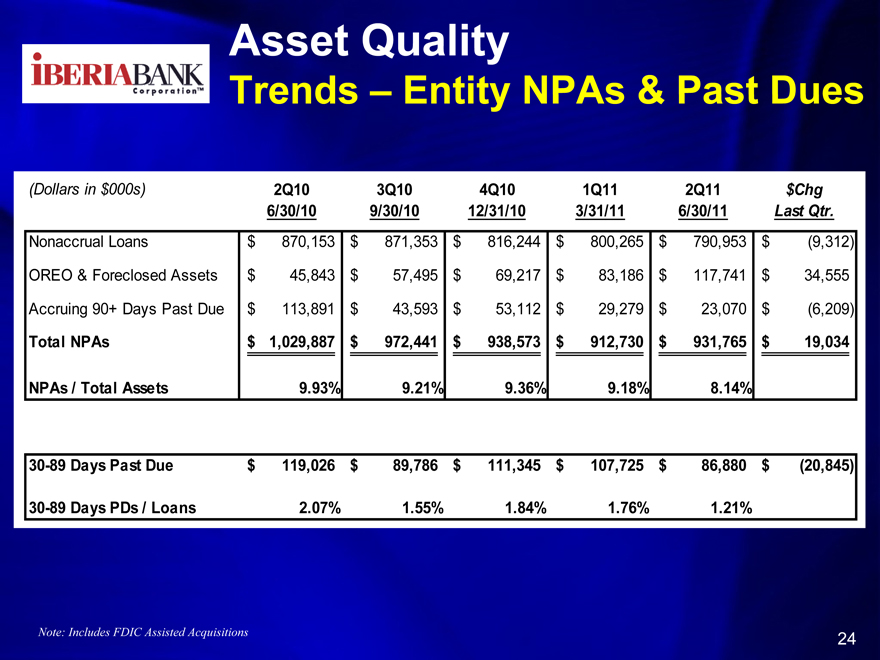
Asset Quality
Trends – Entity NPAs & Past Dues
(Dollars in $000s) 2Q10 3Q10 4Q10 1Q11 2Q11 $Chg 6/30/10 9/30/10 12/31/10 3/31/11 6/30/11 Last Qtr.
Nonaccrual Loans $ 870,153 $ 871,353 $ 816,244 $ 800,265 $ 790,953 $ (9,312)
OREO & Foreclosed Assets $ 45,843 $ 57,495 $ 69,217 $ 83,186 $ 117,741 $ 34,555
Accruing 90+ Days Past Due $ 113,891 $ 43,593 $ 53,112 $ 29,279 $ 23,070 $ (6,209)
Total NPAs $ 1,029,887 $ 972,441 $ 938,573 $ 912,730 $ 931,765 $ 19,034
NPAs / Total Assets 9.93% 9.21% 9.36% 9.18% 8.14%
30-89 Days Past Due $ 119,026 $ 89,786 $ 111,345 $ 107,725 $ 86,880 $ (20,845)
30-89 Days PDs / Loans 2.07% 1.55% 1.84% 1.76% 1.21%
Note: Includes FDIC Assisted Acquisitions
24
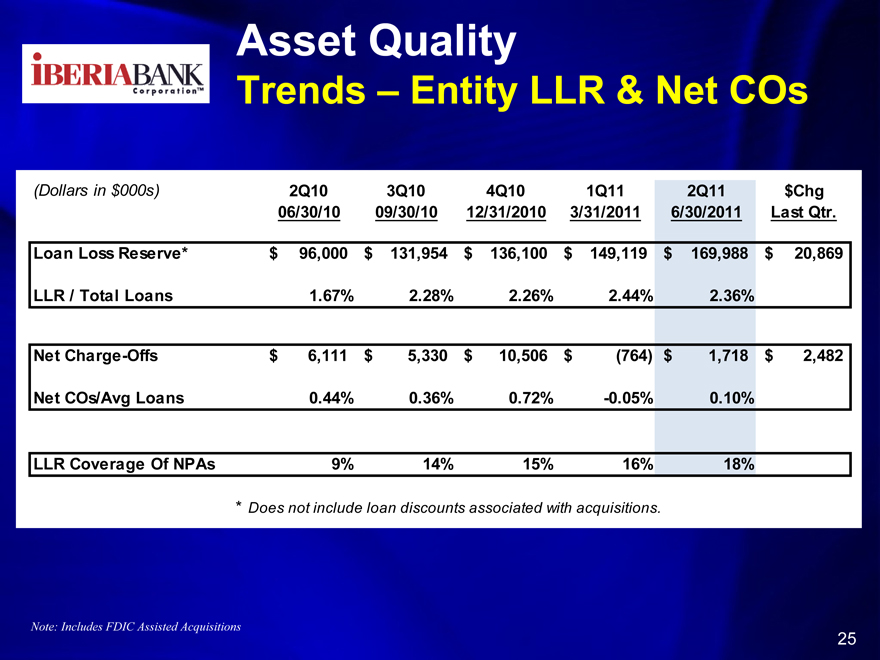
Asset Quality
Trends – Entity LLR & Net COs
(Dollars in $000s) 2Q10 3Q10 4Q10 1Q11 2Q11 $Chg 06/30/10 09/30/10 12/31/2010 3/31/2011 6/30/2011 Last Qtr.
Loan Loss Reserve* $ 96,000 $ 131,954 $ 136,100 $ 149,119 $ 169,988 $ 20,869
LLR / Total Loans 1.67% 2.28% 2.26% 2.44% 2.36%
Net Charge-Offs $ 6,111 $ 5,330 $ 10,506 $ (764) $ 1,718 $ 2,482
Net COs/Avg Loans 0.44% 0.36% 0.72% -0.05% 0.10%
LLR Coverage Of NPAs 9% 14% 15% 16% 18%
* Does not include loan discounts associated with acquisitions.
Note: Includes FDIC Assisted Acquisitions
25
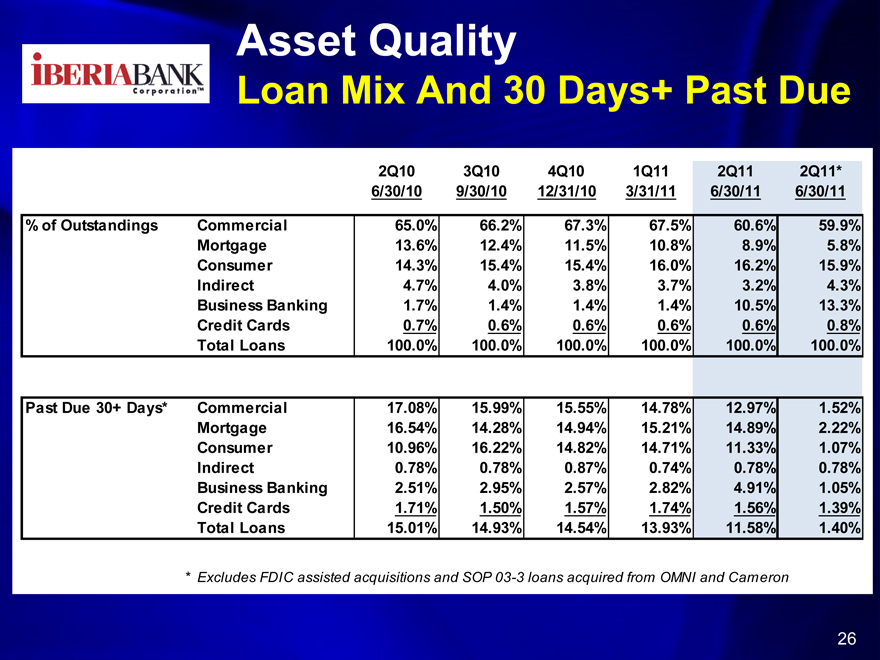
Asset Quality
Loan Mix And 30 Days+ Past Due
2Q10 3Q10 4Q10 1Q11 2Q11 2Q11* 6/30/10 9/30/10 12/31/10 3/31/11 6/30/11 6/30/11
% of Outstandings Commercial 65.0% 66.2% 67.3% 67.5% 60.6% 59.9% Mortgage 13.6% 12.4% 11.5% 10.8% 8.9% 5.8% Consumer 14.3% 15.4% 15.4% 16.0% 16.2% 15.9% Indirect 4.7% 4.0% 3.8% 3.7% 3.2% 4.3% Business Banking 1.7% 1.4% 1.4% 1.4% 10.5% 13.3% Credit Cards 0.7% 0.6% 0.6% 0.6% 0.6% 0.8% Total Loans 100.0% 100.0% 100.0% 100.0% 100.0% 100.0%
Past Due 30+ Days* Commercial 17.08% 15.99% 15.55% 14.78% 12.97% 1.52% Mortgage 16.54% 14.28% 14.94% 15.21% 14.89% 2.22% Consumer 10.96% 16.22% 14.82% 14.71% 11.33% 1.07% Indirect 0.78% 0.78% 0.87% 0.74% 0.78% 0.78% Business Banking 2.51% 2.95% 2.57% 2.82% 4.91% 1.05% Credit Cards 1.71% 1.50% 1.57% 1.74% 1.56% 1.39% Total Loans 15.01% 14.93% 14.54% 13.93% 11.58% 1.40%
* Excludes FDIC assisted acquisitions and SOP 03-3 loans acquired from OMNI and Cameron
26
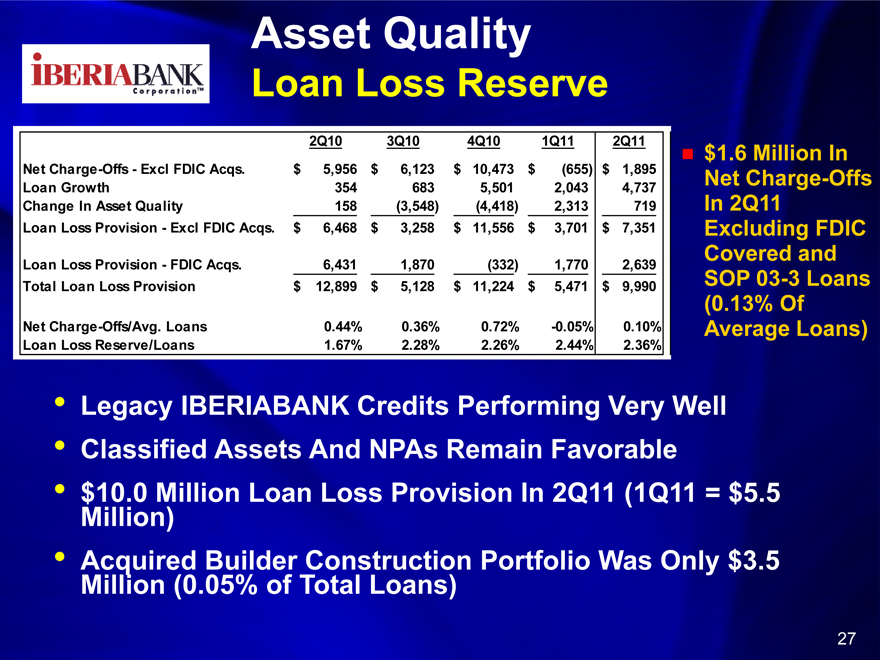
Asset Quality
Loan Loss Reserve
2Q10 3Q10 4Q10 1Q11 2Q11
$1.6 Million In
Net Charge-Offs—Excl FDIC Acqs. $ 5,956 $ 6,123 $ 10,473 $ (655) $ 1,895 Net Charge-Offs Loan Growth 354 683 5,501 2,043 4,737 Change In Asset Quality 158 (3,548) (4,418) 2,313 719 In 2Q11 Loan Loss Provision—Excl FDIC Acqs. $ 6,468 $ 3,258 $ 11,556 $ 3,701 $ 7,351 Excluding FDIC
Covered and
Loan Loss Provision—FDIC Acqs. 6,431 1,870 (332) 1,770 2,639
Total Loan Loss Provision $ 12,899 $ 5,128 $ 11,224 $ 5,471 $ 9,990 SOP 03-3 Loans
(0.13% Of Net Charge-Offs/Avg. Loans 0.44% 0.36% 0.72% -0.05% 0.10% Average Loans) Loan Loss Reserve/Loans 1.67% 2.28% 2.26% 2.44% 2.36%
• Legacy IBERIABANK Credits Performing Very Well
• Classified Assets And NPAs Remain Favorable
• $10.0 Million Loan Loss Provision In 2Q11 (1Q11 = $5.5 Million)
• Acquired Builder Construction Portfolio Was Only $3.5 Million (0.05% of Total Loans)
27
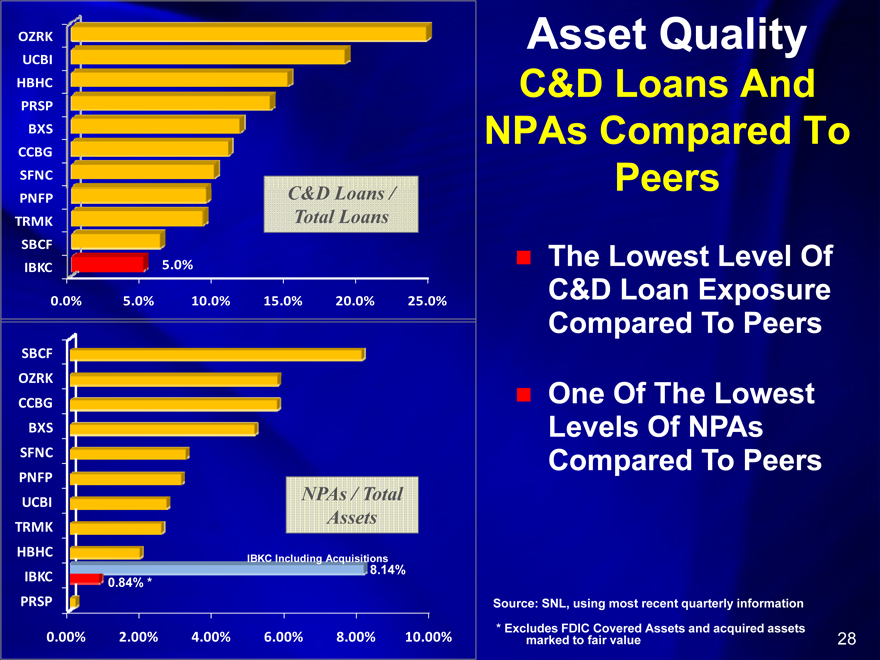
Asset Quality
C&D Loans And NPAs Compared To Peers
The Lowest Level Of C&D Loan Exposure Compared To Peers
One Of The Lowest Levels Of NPAs Compared To Peers
Source: SNL, using most recent quarterly information
* Excludes FDIC Covered Assets and acquired assets marked to fair value
OZRK UCBI HBHC PRSP
BXS CCBG SFNC PNFP TRMK SBCF
IBKC
0.0% 5.0% 10.0% 15.0% 20.0% 25.0%
5.0%
C&D Loans / Total Loans
SBCF OZRK CCBG
BXS SFNC PNFP UCBI TRMK HBHC
IBKC PRSP
NPAs / Total Assets
IBKC Including Acquisitions 8.14%
0.84% *
0.00% 2.00% 4.00% 6.00% 8.00% 10.00%
28
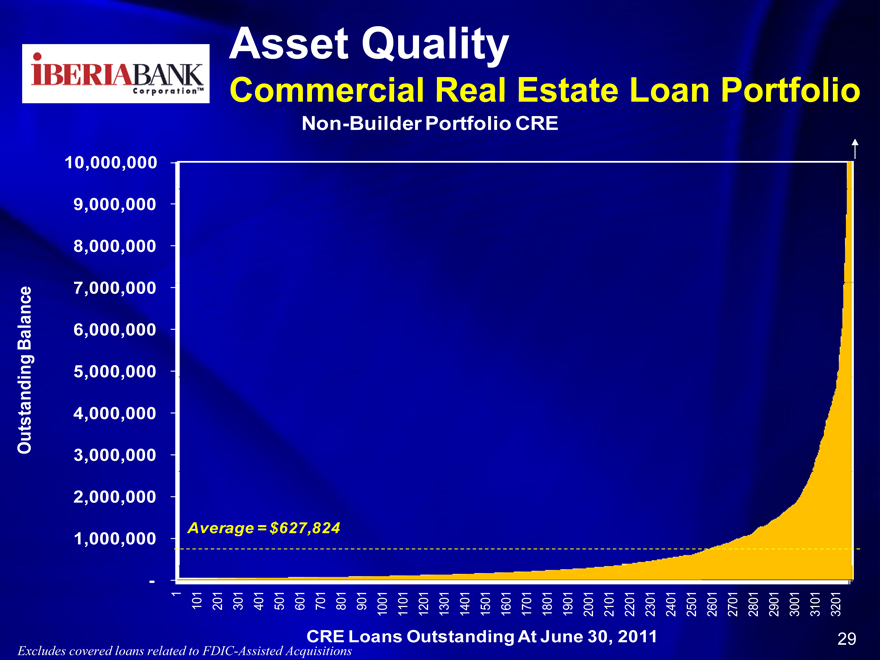
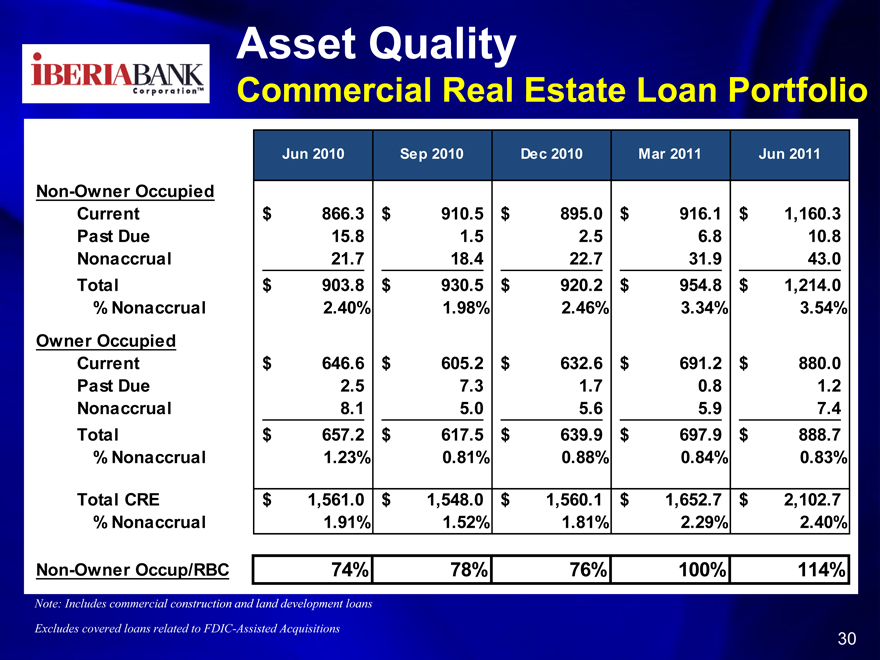
Asset Quality
Commercial Real Estate Loan Portfolio
Non-Builder Portfolio CRE
10,000,000 9,000,000 8,000,000 7,000,000 6,000,000 5,000,000 4,000,000 3,000,000 2,000,000 1,000,000
Outstanding Balance
Average = $627, 824
-
1 101 201 301 401 501 601 701 801 901 1001 1101 1201 1301 1401 1501 1601 1701 1801 1901 2001 2101 2201 2301 2401 2501 2601 2701 2801 2901 3001 3101 3201
CRE Loans Outstanding At June 30, 2011
Excludes covered loans related to FDIC-Assisted Acquisitions
29
Asset Quality
Commercial Real Estate Loan Portfolio
Jun 2010 Sep 2010 Dec 2010 Mar 2011 Jun 2011
Non-Owner Occupied
Current $ 866.3 $ 910.5 $ 895.0 $ 916.1 $ 1,160.3 Past Due 15.8 1.5 2.5 6.8 10.8 Nonaccrual 21.7 18.4 22.7 31.9 43.0 Total $ 903.8 $ 930.5 $ 920.2 $ 954.8 $ 1,214.0
% Nonaccrual 2.40% 1.98% 2.46% 3.34% 3.54% Owner Occupied Current $ 646.6 $ 605.2 $ 632.6 $ 691.2 $ 880.0 Past Due 2.5 7.3 1.7 0.8 1.2 Nonaccrual 8.1 5.0 5.6 5.9 7.4 Total $ 657.2 $ 617.5 $ 639.9 $ 697.9 $ 888.7
% Nonaccrual 1.23% 0.81% 0.88% 0.84% 0.83%
Total CRE $ 1,561.0 $ 1,548.0 $ 1,560.1 $ 1,652.7 $ 2,102.7
% Nonaccrual 1.91% 1.52% 1.81% 2.29% 2.40% Non-Owner Occup/RBC 74% 78% 76% 100% 114%
Note: Includes commercial construction and land development loans
Excludes covered loans related to FDIC-Assisted Acquisitions
30
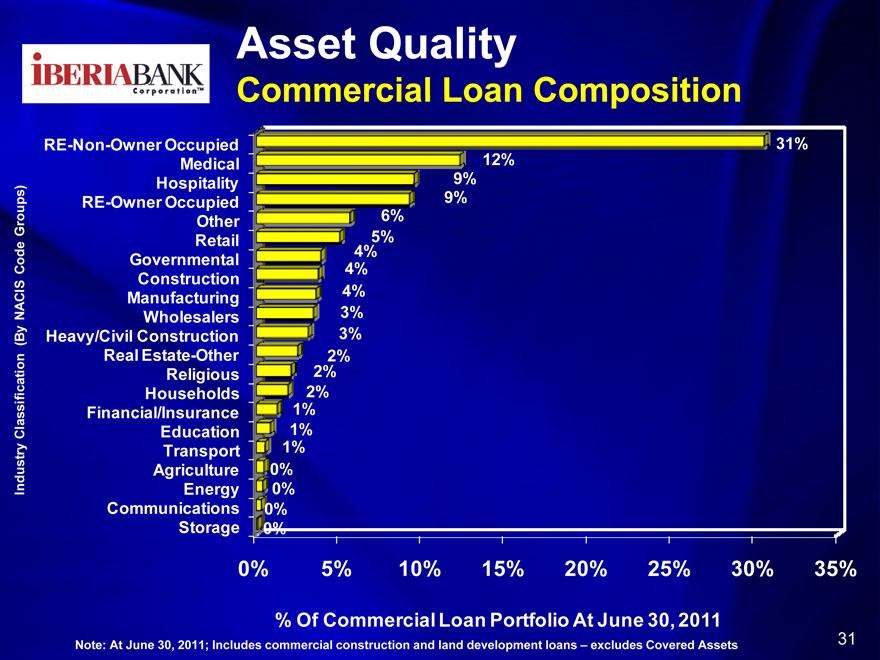
Asset Quality
CorporationTM
Commercial Loan Composition
RE-Non-Owner Occupied Medical Hospitality RE-Owner Occupied
Groups) Other
Retail Code Governmental Construction Manufacturing Wholesalers
NACIS(By
Heavy/Civil Construction Classification Real Estate-Other Religious Households Financial/Insurance
Education
Transport Agriculture Industry Energy Communications Storage
0% 5% 10% 15% 20% 25% 30% 35%
% Of Commercial Loan Portfolio At June 30, 2011
Note: At June 30, 2011; Includes commercial construction and land development loans – excludes Covered Assets
31%
12%
9%
9%
5%
6%
4%
4%
4%
3%
3%
2%
2%
2%
1%
1%
1%
0%
0%
0%
0%
31

CorporationTM
Consumer Loan Portfolio
32
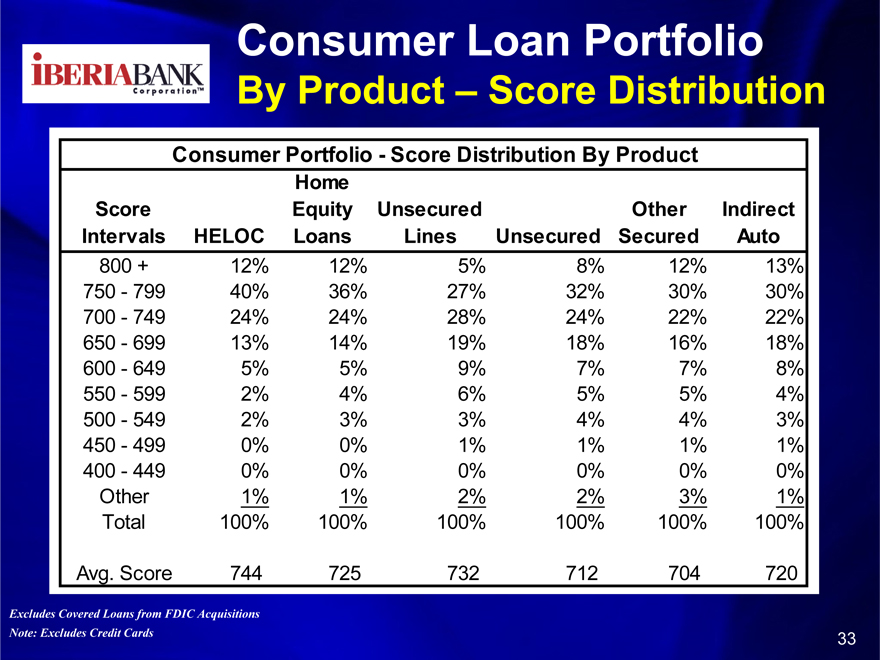
CorporationTM
Consumer Loan Portfolio
By Product – Score Distribution
Consumer Portfolio—Score Distribution By Product Home
Score Equity Unsecured Other Indirect Intervals HELOC Loans Lines Unsecured Secured Auto
800 + 12% 12% 5% 8% 12% 13% 750—799 40% 36% 27% 32% 30% 30% 700—749 24% 24% 28% 24% 22% 22% 650—699 13% 14% 19% 18% 16% 18% 600—649 5% 5% 9% 7% 7% 8% 550—599 2% 4% 6% 5% 5% 4% 500—549 2% 3% 3% 4% 4% 3% 450—499 0% 0% 1% 1% 1% 1% 400—449 0% 0% 0% 0% 0% 0% Other 1% 1% 2% 3% 1% Total 100% 100% 100% 100% 100% 100%
Avg. Score 744 725 732 712 704 720
Excludes Covered Loans from FDIC Acquisitions Note: Excludes Credit Cards
33
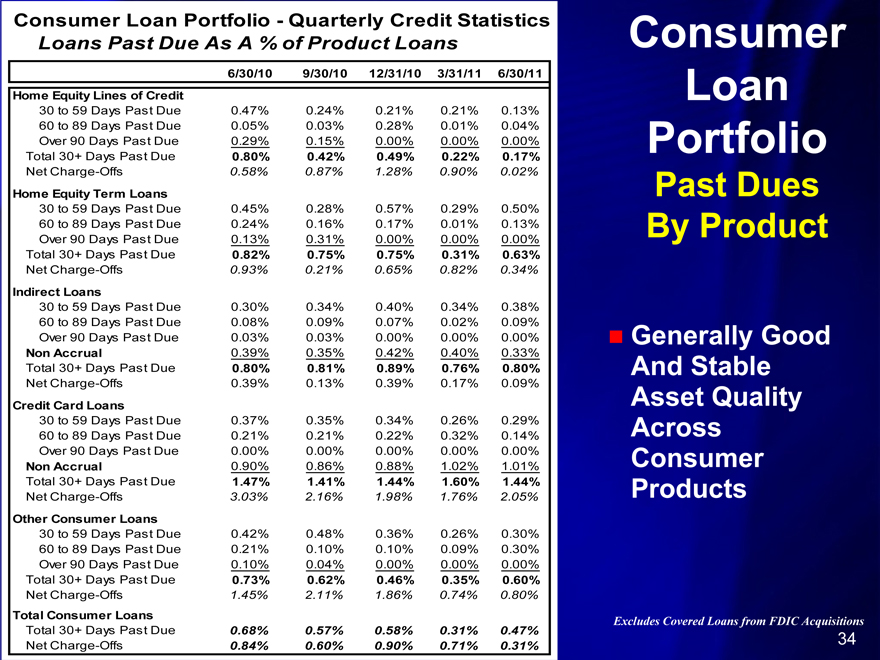
CorporationTM
Consumer Loan Portfolio—Quarterly Credit Statistics
Loans Past Due As A % of Product Loans
6/30/10 9/30/10 12/31/10 3/31/11 6/30/11 Home Equity Lines of Credit
30 to 59 Days Past Due 0.47% 0.24% 0.21% 0.21% 0.13% 60 to 89 Days Past Due 0.05% 0.03% 0.28% 0.01% 0.04% Over 90 Days Past Due 0.29% 0.15% 0.00% 0.00% 0.00% Total 30+ Days Past Due 0.80% 0.42% 0.49% 0.22% 0.17%
Net Charge-Offs 0.58% 0.87% 1.28% 0.90% 0.02%
Home Equity Term Loans
30 to 59 Days Past Due 0.45% 0.28% 0.57% 0.29% 0.50% 60 to 89 Days Past Due 0.24% 0.16% 0.17% 0.01% 0.13% Over 90 Days Past Due 0.13% 0.31% 0.00% 0.00% 0.00% Total 30+ Days Past Due 0.82% 0.75% 0.75% 0.31% 0.63%
Net Charge-Offs 0.93% 0.21% 0.65% 0.82% 0.34%
Indirect Loans
30 to 59 Days Past Due 0.30% 0.34% 0.40% 0.34% 0.38% 60 to 89 Days Past Due 0.08% 0.09% 0.07% 0.02% 0.09% Over 90 Days Past Due 0.03% 0.03% 0.00% 0.00% 0.00% Non Accrual 0.39% 0.35% 0.42% 0.40% 0.33% Total 30+ Days Past Due 0.80% 0.81% 0.89% 0.76% 0.80%
Net Charge-Offs 0.39% 0.13% 0.39% 0.17% 0.09%
Credit Card Loans
30 to 59 Days Past Due 0.37% 0.35% 0.34% 0.26% 0.29% 60 to 89 Days Past Due 0.21% 0.21% 0.22% 0.32% 0.14% Over 90 Days Past Due 0.00% 0.00% 0.00% 0.00% 0.00% Non Accrual 0.90% 0.86% 0.88% 1.02% 1.01% Total 30+ Days Past Due 1.47% 1.41% 1.44% 1.60% 1.44%
Net Charge-Offs 3.03% 2.16% 1.98% 1.76% 2.05%
Other Consumer Loans
30 to 59 Days Past Due 0.42% 0.48% 0.36% 0.26% 0.30% 60 to 89 Days Past Due 0.21% 0.10% 0.10% 0.09% 0.30% Over 90 Days Past Due 0.10% 0.04% 0.00% 0.00% 0.00% Total 30+ Days Past Due 0.73% 0.62% 0.46% 0.35% 0.60%
Net Charge-Offs 1.45% 2.11% 1.86% 0.74% 0.80%
Total Consumer Loans
Total 30+ Days Past Due 0.68% 0.57% 0.58% 0.31% 0.47% Net Charge-Offs 0.84% 0.60% 0.90% 0.71% 0.31%
Consumer Loan Portfolio
Past Dues By Product
Generally Good And Stable Asset Quality Across Consumer Products
Excludes Covered Loans from FDIC Acquisitions
34
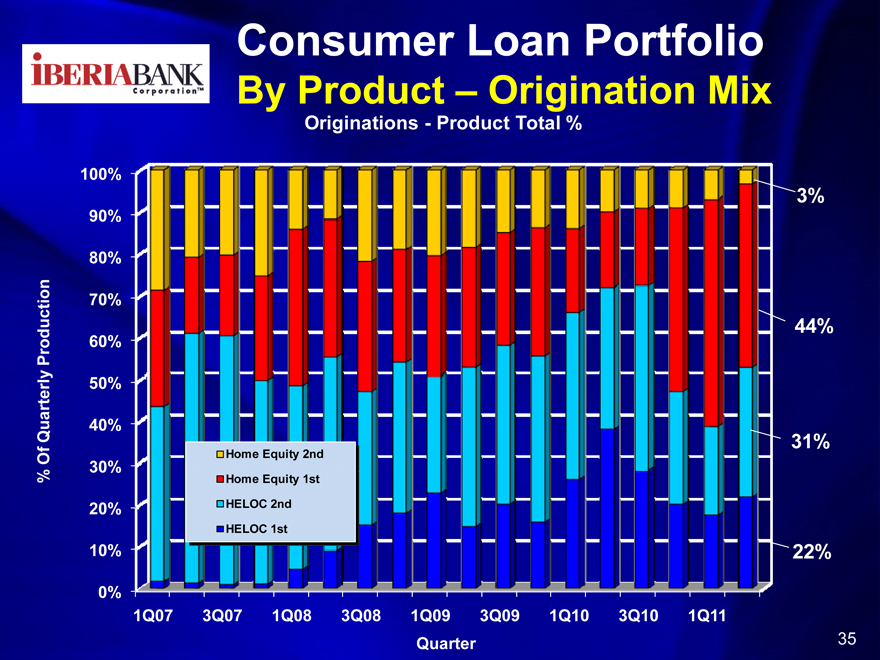
CorporationTM
Consumer Loan Portfolio
By Product – Origination Mix
Originations—Product Total %
Home Equity 2nd Home Equity 1st HELOC 2nd HELOC 1st
100% 90% 80%
70% Production 60% 50% Quarterly % Of 40% 30%
20% 10% 0%
1Q07 3Q07 1Q08 3Q08 1Q09 3Q09 1Q10 3Q10 1Q11 Quarter
3%
44%
31%
22%
35
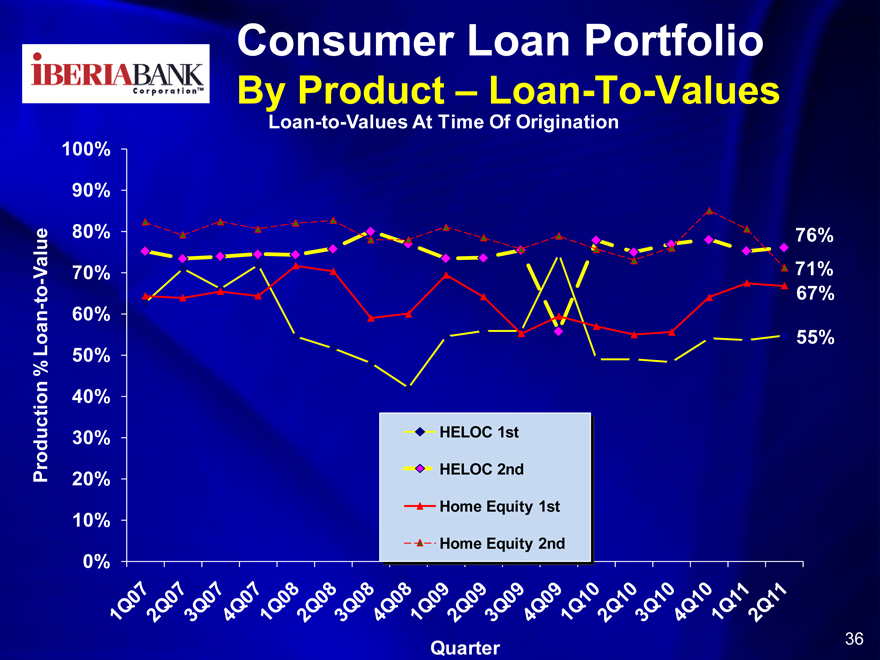
CorporationTM
Consumer Loan Portfolio
By Product – Loan-To-Values
Loan-to-Values At Time Of Origination
HELOC 1st HELOC 2nd Home Equity 1st Home Equity 2nd
100%
90%
Value 80%
- 70%—to 60% Loan% 50%
40% Production 30% 20%
10%
0%
1Q07
2Q07
3Q07
4Q07
1Q08
2Q08
3Q08
4Q08
1Q09
2Q09
3Q09
4Q09
1Q10
2Q10
3Q10
4Q10
1Q11
2Q11
Quarter
36
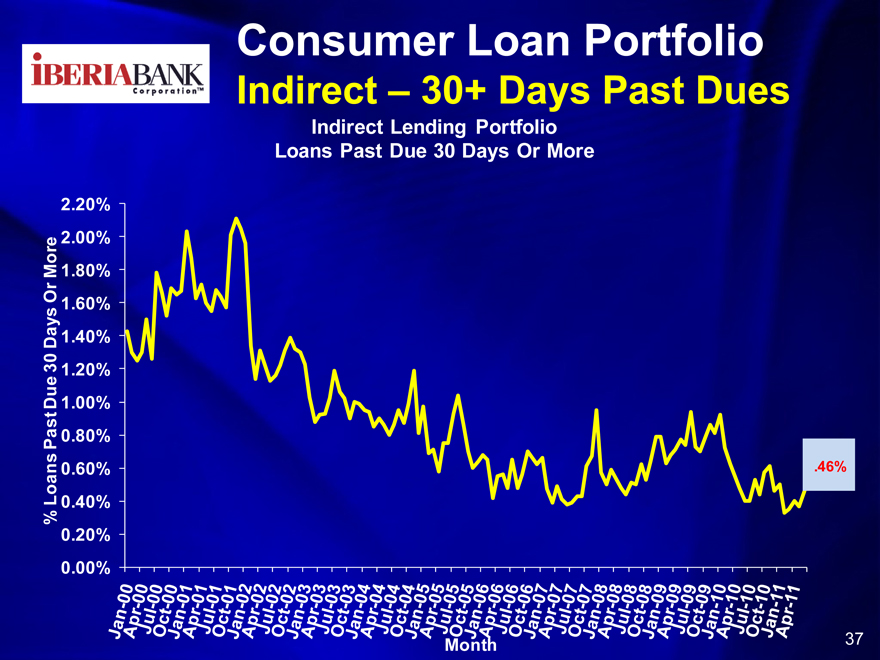
CorporationTM
Consumer Loan Portfolio
Indirect – 30+ Days Past Dues
Indirect Lending Portfolio Loans Past Due 30 Days Or More
% Loans Past Due 30 Days Or More 0.00% 0.20% 0.40% 0.60% 0.80% 1.00% 1.20% 1.40% 1.60% 1.80% 2.00% 2.20%
Jan-00
Apr-00
Jul-00
oct-00
Jan-01
Apr-01
Jul-01
oct-01
Jan-02
Apr-02
Jul-02
oct-02
Jan-03
Apr-03
Jul-03
oct-03
Jan-04
Apr-04
Jul-04
oct-04
Jan-05
Apr-05
Jul-05
oct-05
Jan-06
Apr-06
Jul-06
oct-06
Jan-07
Apr-07
Jul-07
oct-07
Jan-08
Apr-08
Jul-08
oct-08
Jan-09
Apr-09
Jul-09
oct-09
Jan-10
Apr-10
Jul-10
oct-10
Jan-11
Apr-11
.46%
Month
37
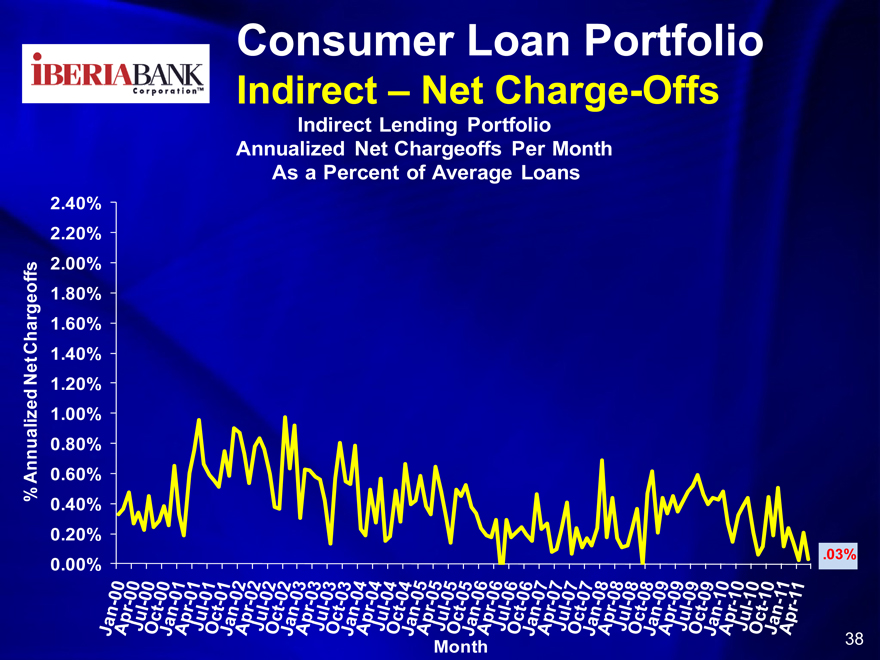
CorporationTM
Consumer Loan Portfolio
Indirect – Net Charge-Offs
Indirect Lending Portfolio Annualized Net Chargeoffs Per Month As a Percent of Average Loans
2.40% 2.20% 2.00% 1.80% Chargeoffs 1.60% Net 1.40% 1.20% 1.00% % Annualized 0.80% 0.60% 0.40% 0.20% 0.00%
Jan-00
Apr-00
Jul-00
oct-00
Jan-01
Apr-01
Jul-01
oct-01
Jan-02
Apr-02
Jul-02
oct-02
Jan-03
Apr-03
Jul-03
oct-03
Jan-04
Apr-04
Jul-04
oct-04
Jan-05
Apr-05
Jul-05
oct-05
Jan-06
Apr-06
Jul-06
oct-06
Jan-07
Apr-07
Jul-07
oct-07
Jan-08
Apr-08
Jul-08
oct-08
Jan-09
Apr-09
Jul-09
oct-09
Jan-10
Apr-10
Jul-10
oct-10
Jan-11
Apr-11
.03%
Month
38

CorporationTM
FDIC Loss Share Performance
39
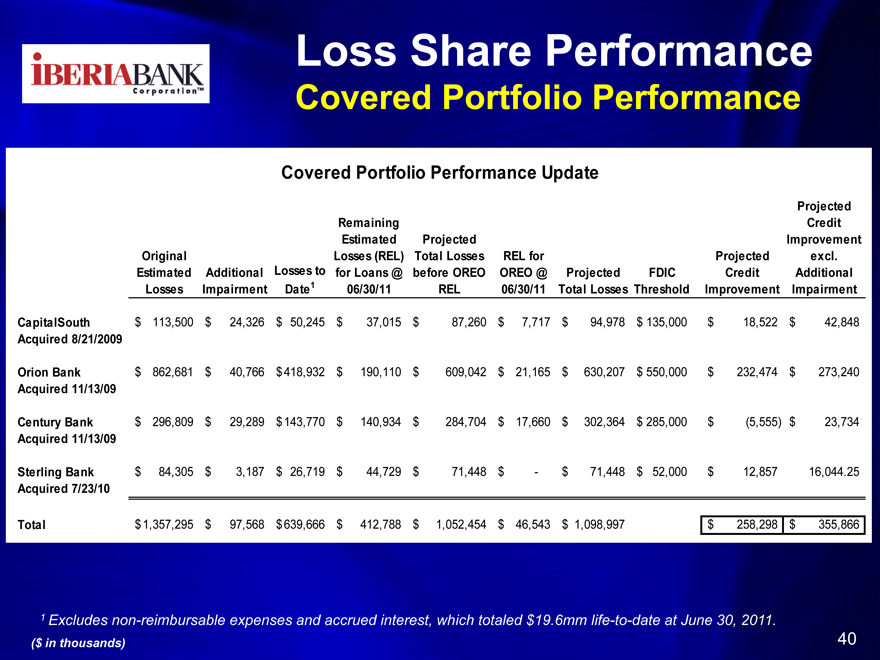
CorporationTM
Loss Share Performance
Covered Portfolio Performance
Covered Portfolio Performance Update
Projected Remaining Credit Estimated Projected Improvement Original Losses (REL) Total Losses REL for Projected excl. Estimated Additional Losses to for Loans @ before OREO OREO @ Projected FDIC Credit Additional Losses Impairment Date1 06/30/11 REL 06/30/11 Total Losses Threshold Improvement Impairment
CapitalSouth $ 113,500 $ 24,326 $ 50,245 $ 37,015 $ 87,260 $ 7,717 $ 94,978 $ 135,000 $ 18,522 $ 42,848
Acquired 8/21/2009
Orion Bank $ 862,681 $ 40,766 $418,932 $ 190,110 $ 609,042 $ 21,165 $ 630,207 $ 550,000 $ 232,474 $ 273,240
Acquired 11/13/09
Century Bank $ 296,809 $ 29,289 $ 143,770 $ 140,934 $ 284,704 $ 17,660 $ 302,364 $ 285,000 $ (5,555) $ 23,734
Acquired 11/13/09
Sterling Bank $ 84,305 $ 3,187 $ 26,719 $ 44,729 $ 71,448 $ —$ 71,448 $ 52,000 $ 12,857 16,044.25
Acquired 7/23/10
Total $ 1,357,295 $ 97,568 $ 639,666 $ 412,788 $ 1,052,454 $ 46,543 $ 1,098,997 $ 258,298 $ 355,866
1 Excludes non-reimbursable expenses and accrued interest, which totaled $19.6mm life-to-date at June 30, 2011.
($ in thousands)
40
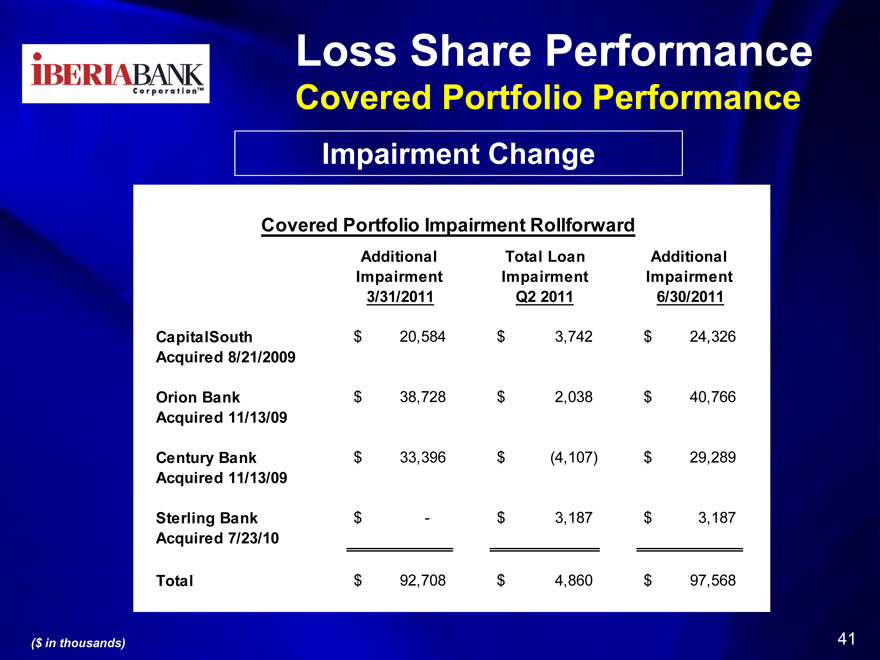
CorporationTM
Loss Share Performance
Covered Portfolio Performance
Impairment Change
Covered Portfolio Impairment Rollforward
Additional Total Loan Additional Impairment Impairment Impairment 3/31/2011 Q2 2011 6/30/2011
CapitalSouth $ 20,584 $ 3,742 $ 24,326
Acquired 8/21/2009
Orion Bank $ 38,728 $ 2,038 $ 40,766
Acquired 11/13/09
Century Bank $ 33,396 $ (4,107) $ 29,289
Acquired 11/13/09
Sterling Bank $ —$ 3,187 $ 3,187
Acquired 7/23/10
Total $ 92,708 $ 4,860 $ 97,568
($ in thousands)
41
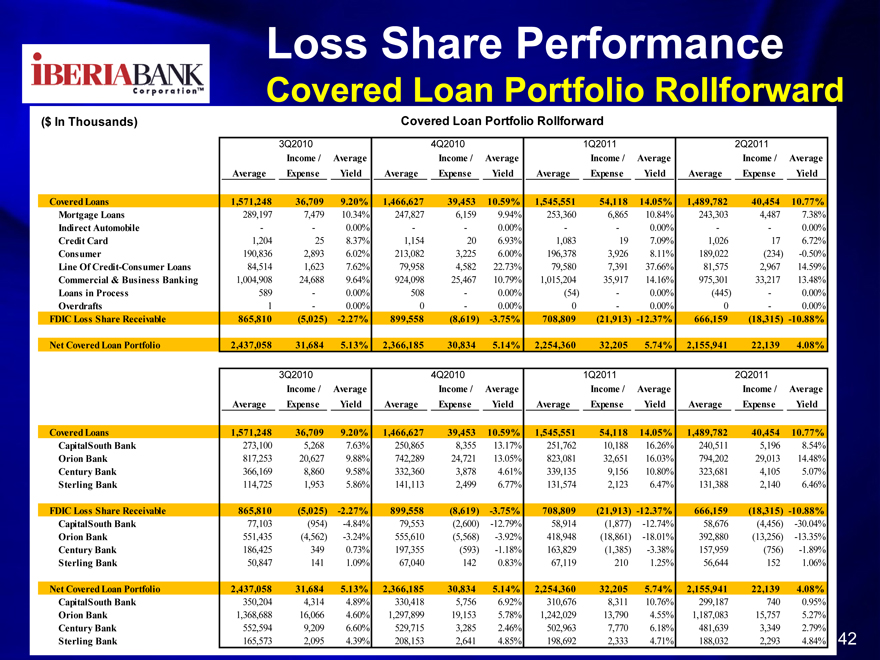
Corporatio TM
Loss Share Performance
Covered Loan Portfolio Rollforward
($ In Thousands) Covered Loan Portfolio Rollforward
3Q2010 4Q2010 1Q2011 2Q2011
Income / Average Income / Average Income / Average Income / Average Average Expense Yield Average Expense Yield Average Expense Yield Average Expense Yield
Covered Loans 1,571,248 36,709 9.20% 1,466,627 39,453 10.59% 1,545,551 54,118 14.05% 1,489,782 40,454 10.77% Mortgage Loans 289,197 7,479 10.34% 247,827 6,159 9.94% 253,360 6,865 10.84% 243,303 4,487 7.38% Indirect Automobile — —0.00% — —0.00% — —0.00% — —0.00% Credit Card 1,204 25 8.37% 1,154 20 6.93% 1,083 19 7.09% 1,026 17 6.72% Consumer 190,836 2,893 6.02% 213,082 3,225 6.00% 196,378 3,926 8.11% 189,022 (234) -0.50% Line Of Credit-Consumer Loans 84,514 1,623 7.62% 79,958 4,582 22.73% 79,580 7,391 37.66% 81,575 2,967 14.59% Commercial & Business Banking 1,004,908 24,688 9.64% 924,098 25,467 10.79% 1,015,204 35,917 14.16% 975,301 33,217 13.48% Loans in Process 589 —0.00% 508 —0.00% (54) —0.00% (445) —0.00% Overdrafts 1 —0.00% 0 —0.00% 0 —0.00% 0 —0.00%
FDIC Loss Share Receivable 865,810 (5,025) -2.27% 899,558 (8,619) -3.75% 708,809 (21,913) -12.37% 666,159 (18,315) -10.88%
Net Covered Loan Portfolio 2,437,058 31,684 5.13% 2,366,185 30,834 5.14% 2,254,360 32,205 5.74% 2,155,941 22,139 4.08%
3Q2010 4Q2010 1Q2011 2Q2011
Income / Average Income / Average Income / Average Income / Average Average Expense Yield Average Expense Yield Average Expense Yield Average Expense Yield
Covered Loans 1,571,248 36,709 9.20% 1,466,627 39,453 10.59% 1,545,551 54,118 14.05% 1,489,782 40,454 10.77% CapitalSouth Bank 273,100 5,268 7.63% 250,865 8,355 13.17% 251,762 10,188 16.26% 240,511 5,196 8.54% Orion Bank 817,253 20,627 9.88% 742,289 24,721 13.05% 823,081 32,651 16.03% 794,202 29,013 14.48% Century Bank 366,169 8,860 9.58% 332,360 3,878 4.61% 339,135 9,156 10.80% 323,681 4,105 5.07% Sterling Bank 114,725 1,953 5.86% 141,113 2,499 6.77% 131,574 2,123 6.47% 131,388 2,140 6.46%
FDIC Loss Share Receivable 865,810 (5,025) -2.27% 899,558 (8,619) -3.75% 708,809 (21,913) -12.37% 666,159 (18,315) -10.88% CapitalSouth
Bank 77,103 (954) -4.84% 79,553 (2,600) -12.79% 58,914 (1,877) -12.74% 58,676 (4,456) -30.04% Orion Bank 551,435 (4,562) -3.24% 555,610 (5,568) -3.92% 418,948 (18,861) -18.01% 392,880 (13,256) -13.35% Century Bank 186,425 349 0.73% 197,355 (593) -1.18% 163,829 (1,385) -3.38% 157,959 (756) -1.89% Sterling Bank 50,847 141 1.09% 67,040 142 0.83% 67,119 210 1.25% 56,644 152 1.06%
Net Covered Loan Portfolio 2,437,058 31,684 5.13% 2,366,185 30,834 5.14% 2,254,360 32,205 5.74% 2,155,941 22,139 4.08% CapitalSouth Bank 350,204 4,314 4.89% 330,418 5,756 6.92% 310,676 8,311 10.76% 299,187 740 0.95% Orion Bank 1,368,688 16,066 4.60% 1,297,899 19,153 5.78% 1,242,029 13,790 4.55% 1,187,083 15,757 5.27% Century Bank 552,594 9,209 6.60% 529,715 3,285 2.46% 502,963 7,770 6.18% 481,639 3,349 2.79% Sterling Bank 165,573 2,095 4.39% 208,153 2,641 4.85% 198,692 2,333 4.71% 188,032 2,293 4.84%
42

CorporationTM
Markets
43
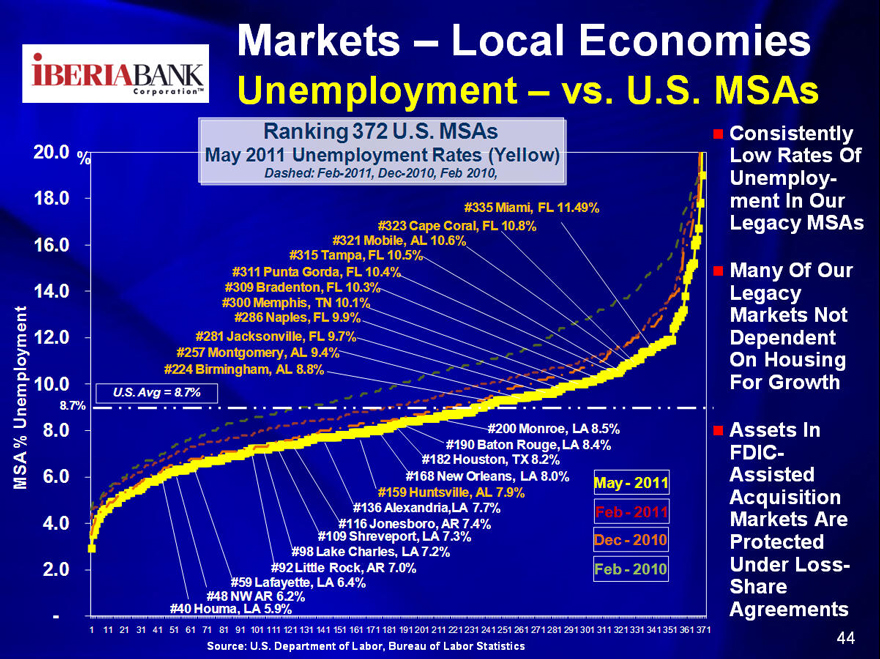
CorporationTM
Markets – Local Economies
Unemployment – vs. U.S. MSAs
Ranking 372 U.S. MSAs May 2011 Unemployment Rates (Yellow)
Dashed: Feb-2011, Dec-2010, Feb 2010,
#335 Miami, FL 11.49% #323 Cape Coral, FL 10.8% #321 Mobile, AL 10.6% #315 Tampa, FL 10.5% #311 Punta Gorda, FL 10.4% #309 Bradenton, FL 10.3% #300 Memphis, TN 10.1% #286 Naples, FL 9.9% #281 Jacksonville, FL 9.7% #257 Montgomery, AL 9.4% #224 Birmingham, AL 8.8%
U.S. Avg = 8.7%
#200 Monroe, LA 8.5% #190 Baton Rouge, LA 8.4% #182 Houston, TX 8.2% #168 New Orleans, LA 8.0% May—2011 #159 Huntsville, AL 7.9% #136 Alexandria,LA 7.7% Feb—2011 #116 Jonesboro, AR 7.4% #109 Shreveport, LA 7.3% Dec—2010 #98 Lake Charles, LA 7.2% #92 Little Rock, AR 7.0% Feb—2010 #59 Lafayette, LA 6.4% #48 NW AR 6.2% #40 Houma, LA 5.9%
Consistently Low Rates Of Unemployment In Our Legacy MSAs
Many Of Our Legacy Markets Not Dependent On Housing For Growth
Assets In FDIC-Assisted Acquisition Markets Are Protected Under Loss-Share Agreements
20.0 18.0 16.0
14.0 12.0 10.0 Unemployment 8.7
% 8.0 MS A%6.0 4.0
2.0
-
1 11 21 31 41 51 61 71 81 91 101 111 121 131 141 151 161 171 181 191 201 211 221 231 241 251 261 271 281 291 301 311 321 331 341 351 361 371
Source: U.S. Department of Labor, Bureau of Labor Statistics
44
IBERIABANK
CorporationTM
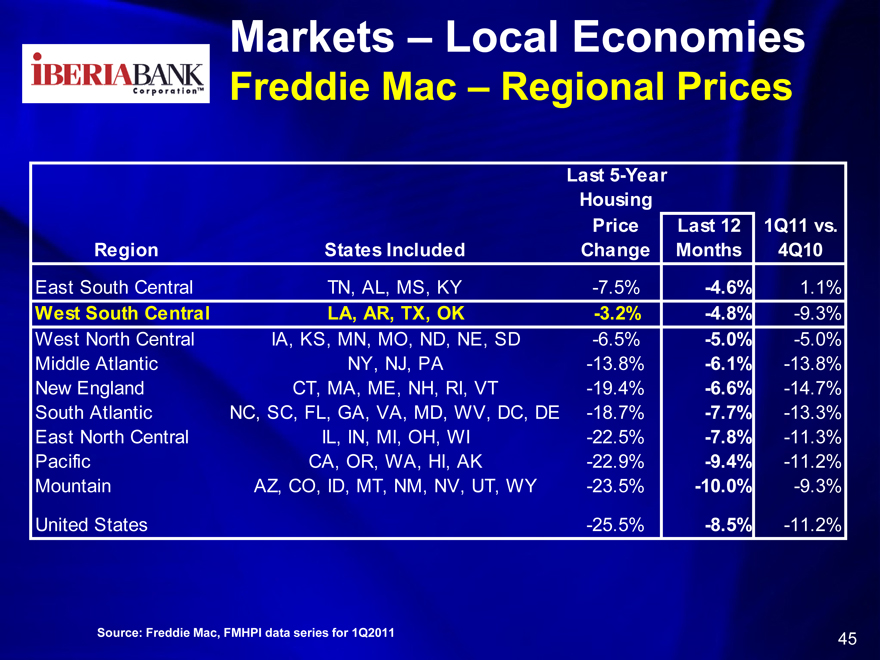
Markets – Local Economies
Freddie Mac – Regional Prices
Last 5-Year Housing
Price Last 12 1Q11 vs. Region States Included Change Months 4Q10
East South Central TN, AL, MS, KY -7.5% -4.6% 1.1%
West South Central LA, AR, TX, OK -3.2% -4.8% -9.3% West North Central IA, KS, MN, MO, ND, NE, SD -6.5% -5.0% -5.0% Middle Atlantic NY, NJ, PA -13.8% -6.1% -13.8% New England CT, MA, ME, NH, RI, VT -19.4% -6.6% -14.7% South Atlantic NC, SC, FL, GA, VA, MD, WV, DC, DE -18.7% -7.7% -13.3% East North Central IL, IN, MI, OH, WI -22.5% -7.8% -11.3% Pacific CA, OR, WA, HI, AK -22.9% -9.4% -11.2% Mountain AZ, CO, ID, MT, NM, NV, UT, WY -23.5% -10.0% -9.3%
United States -25.5% -8.5% -11.2%
Source: Freddie Mac, FMHPI data series for 1Q2011
45
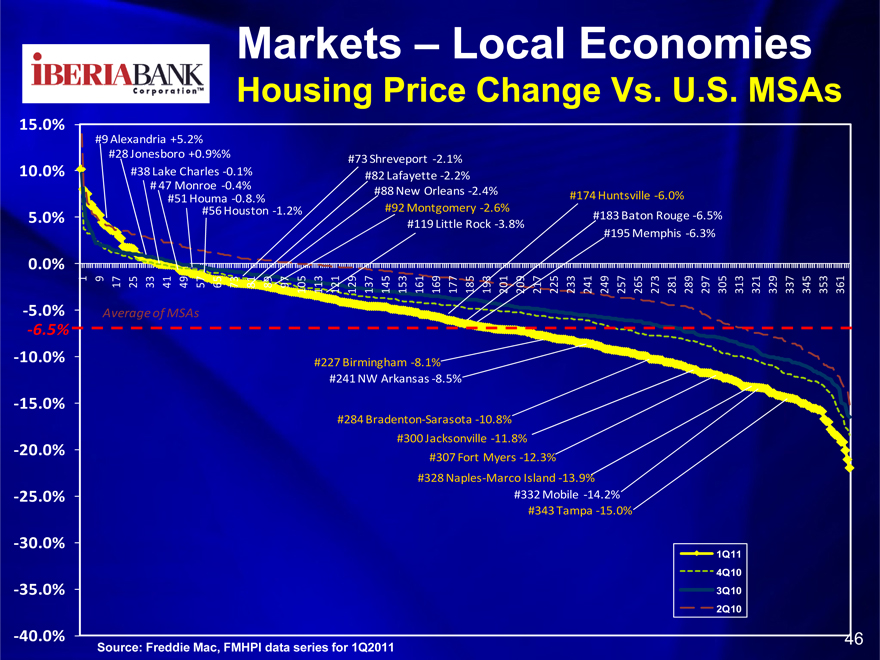
Markets – Local Economies
Housing Price Change Vs. U.S. MSAs
15.0% 10.0% 5.0% 0.0%
- 5.0%
- 6.5%
- 10.0% - 15.0% - 20.0% - 25.0% - 30.0% - 35.0% - 40.0%
#9 Alexandria +5.2% #28 Jonesboro +0.9%% #38 Lake Charles -0 .1%
# 47 Monroe - 0.4% #51 Houma 0- .8.% #56 Houston 1- .2%
#73 Shreveport -2 .1% #82 Lafayette -2 .2% #88 New Orleans -2 .4% #92 Montgomery -2 .6% #119 Little Rock -3 .8%
#174 Huntsville -6 .0% #183 Baton Rouge -6 .5% #195 Memphis -6 .3%
9 17 25 33 41 49 57 65 73 81 89 97 105 113 121 129 137 145 153 161
169
177
185
193
201
209
217
225 233
241 249 257 265 273 281 289 297 305
313
321
329
337
345
353 361
Averageof MSAs
#227 Birmingham -8 .1% #241 NW Arkansas -8 .5%
#284 Bradenton- Sarasota -10 .8% #300 Jacksonville -11 .8% #307 Fort Myers -12 .3% #328 Naples- Marco Island -13 .9% #332 Mobile -14 .2% #343 Tampa -15 .0%
1Q11 4Q10 3Q10 2Q10
Source: Freddie Mac, FMHPI data series for 1Q2011
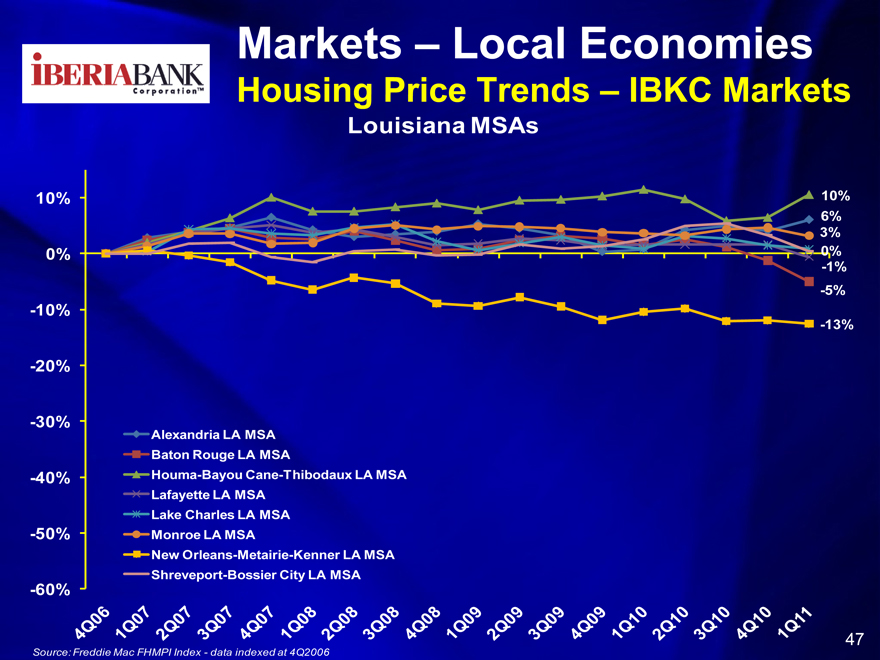
Markets – Local Economies
Housing Price Trends – IBKC Markets
Louisiana MSAs
10% 10%
6% 3%
0% 0%
-1% -5%
-10%
-13%
-20%
-30% Alexandria LA MSA Baton Rouge LA MSA
-40% Houma-Bayou Cane-Thibodaux LA MSA Lafayette LA MSA
Lake Charles LA MSA -50% Monroe LA MSA
New Orleans-Metairie-Kenner LA MSA Shreveport-Bossier City LA MSA
-60%
Source: Freddie Mac FHMPI Index—data indexed at 4Q2006
47
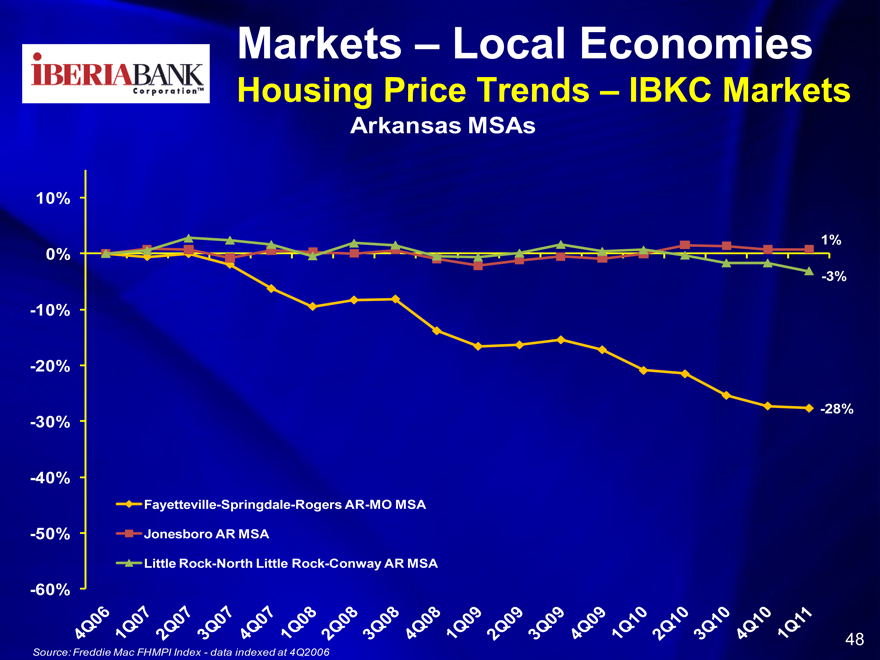
Markets – Local Economies
Housing Price Trends – IBKC Markets
Arkansas MSAs
10%
1%
0%
-3%
-10%
-20%
-30% -28%
-40%
Fayetteville-Springdale-Rogers AR-MO MSA
-50% Jonesboro AR MSA
Little Rock-North Little Rock-Conway AR MSA
-60%
Source: Freddie Mac FHMPI Index-data indexed at 4Q2006
48
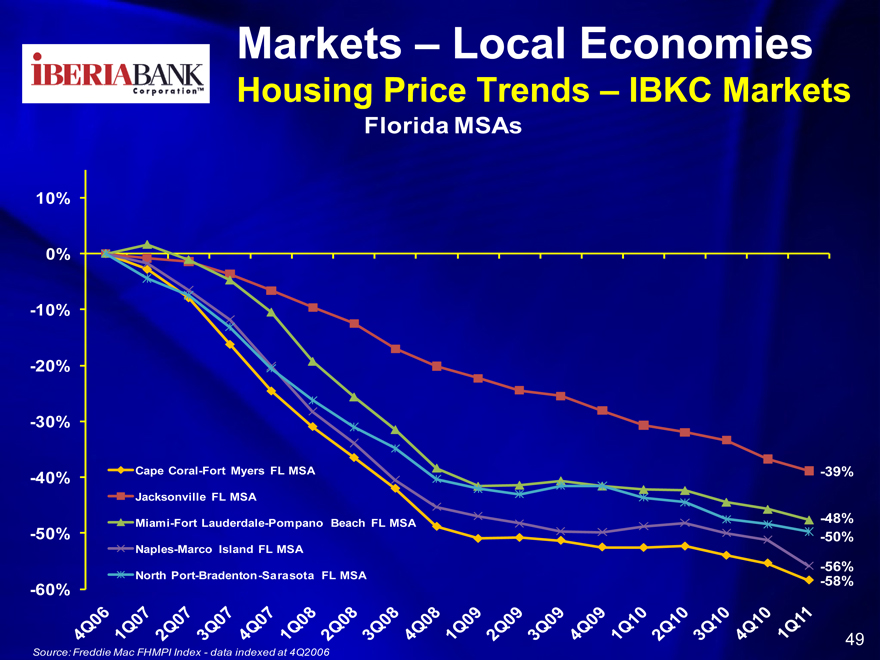
Markets – Local Economies
Housing Price Trends – IBKC Markets
Florida MSAs
10% 0% -10% -20% -30%
-40% Cape Coral-Fort Myers FL MSA -39% Jacksonville FL MSA
Miami-Fort Lauderdale-Pompano Beach FL MSA -48%
-50% -50%
Naples-Marco Island FL MSA
-56%
North Port-Bradenton-Sarasota FL MSA -58%
-60%
4Q06 1Q07 2Q07 3Q07 4Q07 1Q08 2Q08 3Q08 4Q08 1Q09 2Q09 3Q09 4Q09 1Q10 2Q10 3Q10 4Q10 1Q11
Source: Freddie Mac FHMPI Index-data indexed at 4Q2006
49
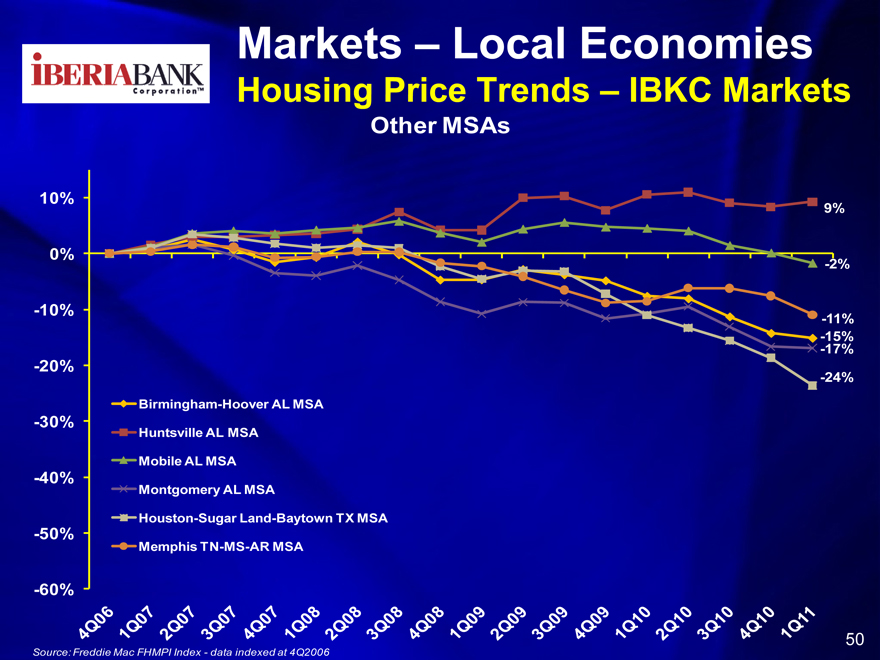
Markets – Local Economies
Housing Price Trends – IBKC Markets
Other MSAs
10%
9%
0%
-2%
-10%
-11%-17%-15%
-20%
-24% Birmingham-Hoover AL MSA
-30%
Huntsville AL MSA
Mobile AL MSA
-40%
Montgomery AL MSA
Houston-Sugar Land-Baytown TX MSA -50% Memphis TN-MS-AR MSA
-60%
4Q06 1Q07 2Q07 3Q07 4Q07 1Q08 2Q08 3Q08 4Q08 1Q09
2Q09 3Q09
4Q09
1Q092Q10 3Q10 4Q10 1Q11
Source: Freddie Mac FHMPI Index-data indexed at 4Q2006
50
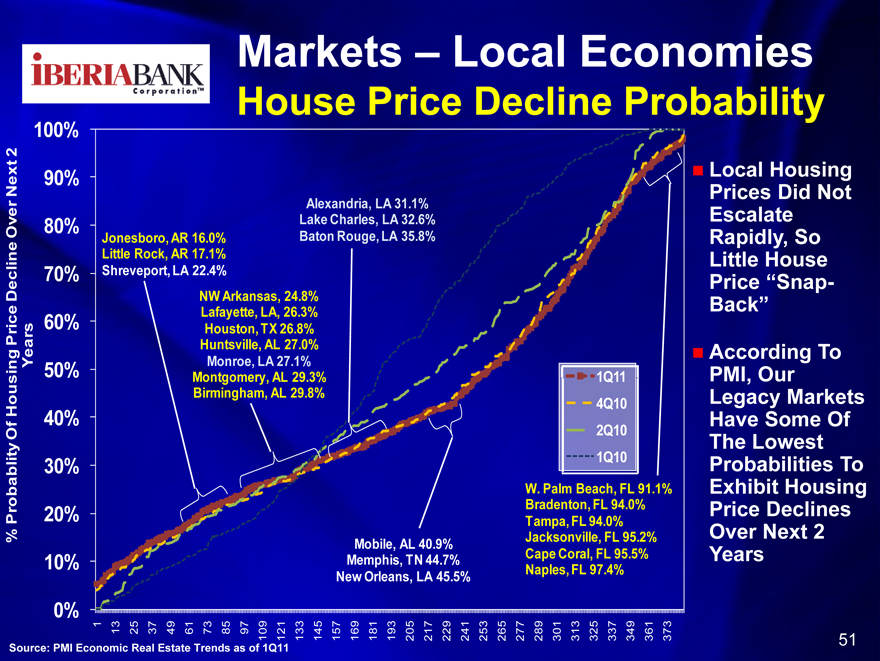
Markets – Local Economies
House Price Decline Probability
100%
2
Local Housing
ext 90%
N Prices Did Not
Alexandria, LA 31.1%
Lake Charles, LA 32.6% Escalate Over 80% Jonesboro, AR 16.0% Baton Rouge, LA 35.8% Rapidly, So Little Rock, AR 17.1% Little House cline 70% Shreveport, LA 22.4%
Price “Snap-
De NW Arkansas, 24.8%
Back”
60% Lafayette, LA, 26.3% Price Houston, TX 26.8%
Huntsville, AL 27.0% According To ing Years 50% Monroe, LA 27.1% Montgomery, AL 29.3% 1Q11 PMI, Our Birmingham, AL 29.8% Legacy Markets Hous 4Q10
Of 40% 2Q10 Have Some Of The Lowest lity 30% 1Q10 Probabilities To
W. Palm Beach, FL 91.1% Exhibit Housing Probab 20% Bradenton, FL 94.0% Price Declines Tampa, FL 94.0%
Over Next 2
% Jacksonville, FL 95.2% Mobile, AL 40.9%
10% Memphis, TN 44.7% Cape Coral, FL 95.5% Years Naples, FL 97.4% New Orleans, LA 45.5%
0% 1 13 25 37 49 61 73 85 97 109 121 133 145 157 169 181 193 205 217 229 241 253 265 277 289 301 313 325 337 349 361 373 51
Source: PMI Economic Real Estate Trends as of 1Q11
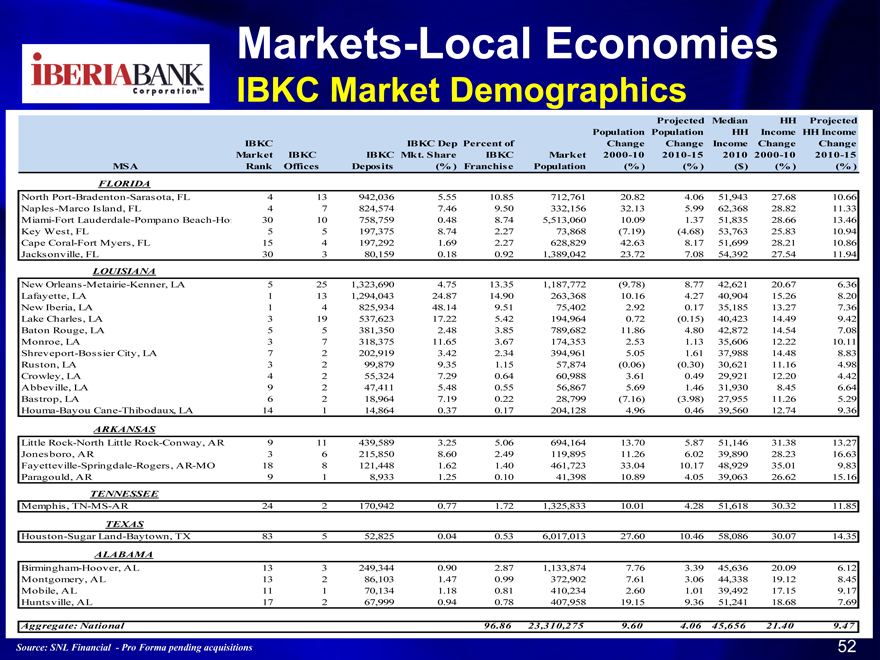
Markets-Local Economies
IBKC Market Demographics
Projected Median
HH Projected
Population Population HH Income HH Income
IBKC IBKC Dep Percent of Change Change Income Change Change Market IBKC IBKC Mkt. Share
IBKC Market 2000-10 2010-15 2010 2000-10
2010-15 MSA Rank Offices Deposits (% ) Franchise Population (% ) (% ) ($) (% ) (% )
FLORIDA North Port-Bradenton-Sarasota, FL 4 13 942,036
5.55 10.85 712,761 20.82 4.06 51,943
27.68 10.66 Naples-Marco Island, FL 4 7
824,574 7.46 9.50 332,156 32.13 5.99 62,368 28.82 11.33
Miami-Fort Lauderdale-Pompano Beach-Ho:
30 10
758,759 0.48
8.74 5,513,060
10.09 1.37
51,835 28.66
13.46 Key West, FL
5 5
197,375
8.74 2.27 73,868 (7.19) (4.68)
53,763 25.83
10.94
Cape Coral-Fort Myers, FL
15 4
197,292 1.69
2.27 628,829
42.63 8.17 51,699 28.21 10.86
Jacksonville, FL 30
3
80,159 0.18 0.92 1,389,042 23.72 7.08
54,392 27.54 11.94
LOUISIANA
New Orleans-Metairie-Kenner, LA
5 25
1,323,690 4.75
13.35 1,187,772 (9.78) 8.77 42,621
20.67 6.36
Lafayette, LA 1 13 1,294,043 24.87 14.90 263,368 10.16 4.27 40,904
15.26 8.20 New Iberia, LA 1 4
825,934 48.14 9.51 75,402
2.92 0.17
35,185 13.27 7.36 Lake Charles, LA 3 19 537,623 17.22 5.42 194,964 0.72 (0.15) 40,423 14.49 9.42 Baton Rouge, LA 5 5
381,350
2.48
3.85 789,682 11.86 4.80 42,872 14.54 7.08
Monroe, LA 3 7 318,375 11.65 3.67 174,353 2.53 1.13 35,606 12.22 10.11 Shreveport-Bossier City, LA 7 2
202,919
3.42
2.34
394,961
5.05
1.61
37,988
14.48
8.83
Ruston, LA
3
2
99,879
9.35
1.15
57,874
(0.06)
(0.30)
30,621
11.16
4.98
Crowley, LA 4 2 55,324 7.29 0.64 60,988 3.61 0.49 29,921 12.20 4.42 Abbeville, LA
9
2 47,411 5.48 0.55 56,867 5.69 1.46 31,930 8.45 6.64 Bastrop, LA 6
2 18,964 7.19 0.22 28,799 (7.16) (3.98) 27,955 11.26 5.29
Houma-Bayou Cane-Thibodaux, LA 14 1 14,864 0.37 0.17 204,128 4.96 0.46 39,560 12.74 9.36
ARKANSAS
Little Rock-North Little Rock-Conway, AR
9 11 439,589 3.25 5.06 694,164 13.70 5.87 51,146 31.38 13.27 Jonesboro, AR 3 6 215,850
8.60 2.49 119,895 11.26 6.02 39,890 28.23 16.63 Fayetteville-Springdale-Rogers, AR-MO 18 8 121,448 1.62
1.40 461,723 33.04 10.17 48,929 35.01 9.83 Paragould, AR 9 1 8,933 1.25 0.10 41,398 10.89 4.05 39,063 26.62 15.16 TENNESSEE
Memphis, TN-MS-AR
24 2 170,942 0.77 1.72 1,325,833 10.01 4.28 51,618 30.32 11.85 TEXAS Houston-Sugar Land-Baytown, TX 83
5 52,825 0.04 0.53 6,017,013 27.60 10.46
58,086
30.07
14.35
ALABAMA
Birmingham-Hoover, AL
13
3
249,344
0.90
2.87
1,133,874
7.76
3.39
45,636
20.09
6.12
Montgomery, AL
13
2
86,103
1.47
0.99
372,902
7.61
3.06
44,338
19.12
8.45
Mobile, AL
11
1
70,134
1.18
0.81
410,234
2.60
1.01
39,492
17.15
9.17
Huntsville, AL
17
2
67,999
0.94
0.78
407,958
19.15
9.36
51,241
18.68
7.69
Aggregate: National
96.86
23,310,275
9.60
4.06
45,656
21.40
9.47
Source: SNL Financial —Pro Forma pending acquisitions
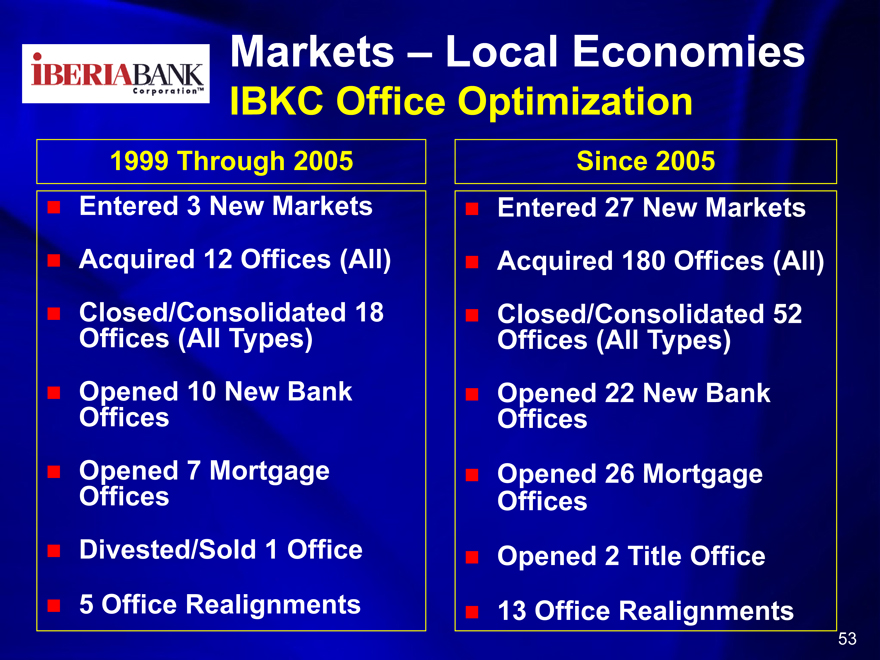
Markets – Local Economies
IBKC Office Optimization
1999 Through 2005 Since 2005
Entered 3 New Markets Entered 27 New Markets
Acquired 12 Offices (All) Acquired 180 Offices (All)
Closed/Consolidated 18 Closed/Consolidated 52 Offices (All Types) Offices (All Types)
Opened 10 New Bank Opened 22 New Bank Offices Offices
Opened 7 Mortgage Opened 26 Mortgage Offices Offices
Divested/Sold 1 Office Opened 2 Title Office
5 Office Realignments 13 Office Realignments
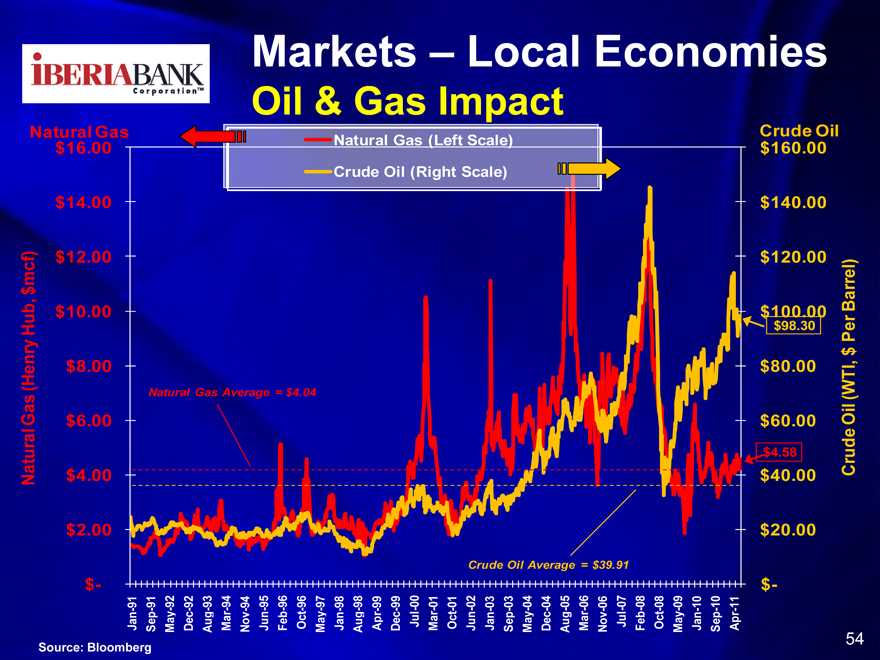
Markets – Local Economies
Oil & Gas Impact
Natural Gas Crude Oil
$16.00 Natural Gas (Left Scale) $160.00 Crude Oil (Right Scale)
$14.00 $140.00
cf) $12.00 $120.00 el) $ m Barr
$10.00 $100.00
Hub, $98.30
Per $ enry $8.00 $80.00 I,
(H Natural Gas Average = $4.04 (WT
Gas Oil
$6.00 $60.00 tural $4.58 rude Na $4.00 $40.00 C
$2.00 $20.00
Crude Oil Average = $39.91
$- $-
Jan-91 Sep -91 May -92 Dec-92 Aug-93 Mar-94 Nov-94 Jun-95 Feb-96 Oct-96 May -97 Jan-98 Aug-98 Apr -99 Dec-99 Jul-00 Mar-01 Oct-01 Jun-02 Jan-03 Sep -03 May -04 Dec-04 Aug-05 Mar-06 Nov-06 Jul-07 Feb-08 Oct-08 May -09 Jan-10 Sep -10 Apr -11
Source: Bloomberg 54
Summary Of IBKC
Industry Operating Environment—Challenging
•Housing
•Credit Risk
•Interest Rate Risk
•Operations Risk
We Tend To Move “Ahead Of The Curve”
Focus On Long-Term Investments & Payback
Organic And External Growth
Expense Controls And Revenue Growth
EPS/Stock Price Linkage—Shareholder Focus
Favorable Risk/Return Compared To Peers