![]() 2Q13 Earnings Conference Call Supplemental Presentation 2Q13 Earnings Conference Call Supplemental Presentation July 23, 2013 July 23, 2013 Exhibit 99.2 |
![]() Safe Harbor Language To the extent that statements in this presentation and the accompanying press release relate to future plans, objectives, financial results or performance of IBERIABANK Corporation, these statements are deemed to be forward-looking statements within the meaning of the Private Securities Litigation Reform Act of 1995. Such statements, which are based on management’s current information, estimates and assumptions and the current economic environment, are generally identified by the use of the words “plan”, “believe”, “expect”, “intend”, “anticipate”, “estimate”, “project” or similar expressions. IBERIABANK Corporation’s actual strategies and results in future periods may differ materially from those currently expected due to various risks and uncertainties. Actual results could differ materially because of factors such as the level of market volatility, our ability to execute our growth strategy, including the availability of future FDIC-assisted failed bank opportunities, unanticipated losses related to the integration of, and refinements to purchase accounting adjustments for, acquired businesses and assets and assumed liabilities in these transactions, adjustments of fair values of acquired assets and assumed liabilities and of deferred taxes in acquisitions, actual results deviating from the Company’s current estimates and assumptions of timing and amounts of cash flows, credit risk of our customers, effects of the on-going correction in residential real estate prices and reduced levels of home sales, sufficiency of our allowance for loan losses, changes in interest rates, access to funding sources, reliance on the services of executive management, competition for loans, deposits and investment dollars, reputational risk and social factors, changes in government regulations and legislation, increases in FDIC insurance assessments, geographic concentration of our markets and economic conditions in these markets, rapid changes in the financial services industry, dependence on our operational, technological, and organizational systems or infrastructure and those of third-party providers of those services, hurricanes and other adverse weather events, the modest trading volume of our common sock, and valuation of intangible assets. These and other factors that may cause actual results to differ materially from these forward-looking statements are discussed in the Company’s Annual Report on Form 10-K, subsequent Quarterly Reports on Form 10-Q, and other filings with the Securities and Exchange Commission (the “SEC”), available at the SEC’s website, http://www.sec.gov, and the Company’s website, http://www.iberiabank.com, under the heading “Investor Information.” All information in this presentation and the accompanying press release is as of the date of this release. The Company undertakes no duty to update any forward-looking statement to conform to the statement to actual results or changes in the Company’s expectations. Certain tabular presentations may not reconcile because of rounding. 2 2 |
![]() 3 • Operating EPS of $0.80 driven by higher net interest margin, relatively flat operating expenses and balanced organic loan and core deposit growth • Organic loan growth: • Core deposit growth: • Deployed $335 million in excess liquidity through increased loan originations • 16 basis point net interest margin increase • Tax equivalent net interest income increased $4 million or 4% offsetting a $241 million or 2% decline in average earning assets • $2 million loan loss provision - $3 million provision on legacy portfolio offset by $1 million recovery on the non covered acquired portfolio Introductory Comments Second Quarter 2013 – Summary Comments $394 million since March 31, 2013 (+21% annualized) $1.7 billion since year-end 2011 (+18% annualized) $66 million since March 31, 2012 (+3% annualized) $1.7 billion since year-end 2011 (+16% annualized) 12 bps due to deployment of excess liquidity into loans 5 bps due to decline in deposit costs |
![]() 4 Financial Overview Financial Overview Performance Metrics – Yields and Costs • Investment yield unchanged at 1.92% • Net covered loan yield declined 24 bps due to lower income and higher covered loan balances; decline in non-covered loan yield of 4 bps • Average noninterest bearing deposits up $72 million (15% annualized) • Margin improved 16 bps to 3.39%; • 12 bps due to deployment of low yielding excess liquidity into higher yielding loans • Interest bearing deposit costs declined 5 bps 3/31/2013 6/30/2013 Investment Securities 1.92% 1.92% (0) bps Covered Loans & Loss Share Receivable 5.35% 5.11% (24) bps Noncovered Loans 4.44% 4.40% (4) bps Loans & Loss Share Receivable 4.36% 4.35% (1) bps Mortgage Loans Held For Sale 2.97% 3.17% 20 bps Other Earning Assets 0.52% 0.87% 35 bps Total Earning Assets 3.70% 3.80% 10 bps Interest Bearing Deposits 0.47% 0.42% (5) bps Short-Term Borrowings 0.19% 0.16% (3) bps Long-Term Borrowings 3.16% 3.39% 23 bps Total Interest Bearing Liabilities 0.58% 0.51% (7) bps Net Interest Spread 3.12% 3.29% 17 bps Net Interest Margin 3.23% 3.39% 16 bps (1) Earning asset yields are shown on a fully taxable equivalent basis. Basis Point Change For Quarter Ended: |
![]() 5 Financial Overview Non-Interest Income Trends • Gains on sale of investments decreased $2.4 million or 102% • Mortgage loan income declined $1.2 million or 6% • Title insurance income increased $0.7 million, or 13% • Increased brokerage commissions of $0.3 million or 9% • Deposit service charge income increased $0.3 million, or 5%, from 1Q13 2Q13 originations up 23% from 1Q13 Refinancings were 31% of production, down from 40% in 1Q13 Sales up 11% in 2Q13 and up 27% over 2Q13 $18 million in 2Q13 revenues (down 6%) due to pipeline valuations Margins declined slightly; Small buyback costs Pipeline of $265 million at quarter-end and $270 million on July 12 (+6%) Noninterest Income ($000s) 2Q12 3Q12 4Q12 1Q13 2Q13 $ Change % Change Service Charges on Deposit Accounts 6,625 $ 6,952 $ 7,295 $ 6,797 $ 7,106 $ 309 $ 5% ATM / Debit Card Fee Income 2,166 2,377 2,412 2,183 2,357 174 8% BOLI Proceeds and CSV Income 905 916 909 939 901 (38) -4% Mortgage Income 18,185 23,215 22,935 18,931 17,708 (1,223) -6% Gain (Loss) on Sale of Investments, Net 901 41 (4) 2,359 (57) (2,416) -102% Title Revenue 5,339 5,623 5,492 5,021 5,696 675 13% Broker Commissions 3,102 3,092 4,192 3,534 3,863 329 9% Other Noninterest Income 4,471 4,337 4,928 4,727 4,915 188 4% Noninterest income excluding non-operating income 41,694 46,553 48,158 44,491 42,489 (2,002) -5% Non-operating income - - 2,196 - - - - Total Noninterest Income 41,694 $ 46,553 $ 50,354 $ 44,491 $ 42,489 $ (2,002) $ -5% 2Q13 vs. 1Q13 th |
![]() 6 Financial Overview Non-Interest Expense • Noninterest expenses excluding non-operating items flat as compared to 1Q13 • Total expenses down $28 million, or 19%, in 2Q13 • Occupancy and branch closure costs up $5 million • No merger-related costs incurred, down $0.2 million from 1Q13 Linked quarter increases/(decreases) of: Mortgage commissions 1.8 $ mil. Severance expense 1.6 Litigation 0.2 FHLB debt extinguishment (2.3) OREO expense (0.6) Occupancy expense (0.5) 0.2 $ Noninterest Expense ($000s) 2Q12 3Q12 4Q12 1Q13 2Q13 $ Change % Change Mortgage Commissions 5,612 $ 6,006 $ 5,747 $ 4,327 $ 6,127 $ 1,800 $ 42% Hospitalization Expense 3,404 3,773 4,005 4,407 3,994 (413) -9% Other Salaries and Benefits 48,011 49,270 50,675 53,668 53,694 26 0% Salaries and Employee Benefits 57,028 $ 59,049 $ 60,426 $ 62,402 $ 63,815 $ 1,413 $ 2% Credit/Loan Related 4,835 4,846 4,386 3,739 4,168 429 11% Occupancy and Equipment 12,852 13,500 14,413 14,774 14,321 (453) -3% Amortization of Acquisition Intangibles 1,289 1,287 1,285 1,183 1,181 (2) 0% All Other Noninterest Expense 27,105 26,611 30,328 28,050 26,681 (1,369) -5% Nonint. Exp. (Ex-Non-Operating Exp.) 103,109 $ 105,293 $ 110,838 $ 110,148 $ 110,166 $ 18 $ 0% Severance 1,053 712 370 97 1,670 1,573 1616% Occupancy and Branch Closure Costs 2,743 284 711 375 4,925 4,550 1214% Impairment of Indemnification Asset - - - 31,813 - (31,813) -100% Debt Prepayment - - - 2,307 - (2,307) -100% Termination of Debit Card Rewards Program - - - - 450 450 100% Consulting and Professional 1,661 574 339 - 150 150 100% Merger-Related Expenses 456 2,985 1,183 157 - (157) -100% Total Noninterest Expense 109,022 $ 109,848 $ 113,441 $ 144,898 $ 117,361 $ (27,536) $ -19% Tangible Efficiency Ratio - excl Nonop Exp 74.4% 71.2% 72.5% 76.0% 74.2% 2Q13 vs. 1Q13 |
![]() 7 Financial Overview Non-Operating Items • Amortization of indemnification asset of $5.0 million in 2Q13 ($0.11 EPS) • Branch closure expense of $4.9 million in 2Q13 ($0.11 EPS) • 2Q13 Severance expense of $1.7 million ($0.04 EPS) (1) Per share amounts may not appear to foot due to rounding (2) After-tax amounts estimated based on a 35% marginal tax rate (3) Includes the impact of the adoption of ASU 2012-06 in the three-month periods ending June 30, 2013 and March 31, 2013 (4) Adjustments represent additonal amortization on the Company's loss share receivable due to the adoption of ASU 2012-06 for the three month-periods ending June 30, 2013 and March 31, 2013. The amounts included above represents the incremental amortization as calculated using the yield on the covered portfolio for the three month period ending December 31, 2012. The Company expects the additional amortization (calculated on the same basis as the amount above) over the next four quarters to be as follows: RECONCILIATION OF NON-GAAP FINANCIAL MEASURES (1) (dollars in thousands) |
![]() 8 Financial Overview Performance Metrics – Quarterly Trends • Average earning assets down $241 million (-2%) • T/E net interest income up $4 million (+4%) • Provision of $2 million: • Net charge-offs: $1.1 million (0.05% annualized rate) • Non covered acquired loan loss provision reversal: $1.5 million • All other provision: $3.3 million 6/30/2012 9/30/2012 12/31/2012 3/31/2013 6/30/2013 Net Income ($ in thousands) 12,560 $ 21,234 $ 23,208 $ 717 $ 15,590 $ 2074% Per Share Data: Fully Diluted Earnings 0.43 $ 0.73 $ 0.79 $ 0.02 $ 0.53 $ 2011% Operating Earnings (Non-GAAP) (1) 0.54 0.83 0.80 0.86 0.80 -7% Pre-provision Operating Earnings (Non-GAAP) 0.73 0.92 0.91 0.66 0.73 10% Tangible Book Value 37.28 37.07 37.34 36.93 36.30 -2% Key Ratios: Return on Average Assets 0.43% 0.69% 0.73% 0.02% 0.49% 46 bps Return on Average Common Equity 3.36% 5.56% 6.02% 0.19% 4.09% 390 bps Return on Average Tangible Common Equity (Non-GAAP) 4.86% 7.91% 8.62% 0.55% 5.96% 541 bps Net Interest Margin (TE) (2) 3.59% 3.58% 3.55% 3.23% 3.39% 16 bps Tangible Efficiency Ratio (TE) (2) (Non-GAAP) 78.2% 74.3% 73.2% 102.4% 81.9% (2,051) bps Tangible Common Equity Ratio (Non-GAAP) 9.37% 9.01% 8.66% 8.75% 8.69% (6) bps Tier 1 Leverage Ratio 10.42% 10.01% 9.70% 9.37% 9.59% 22 bps Tier 1 Common Ratio (Non-GAAP) 12.97% 12.04% 11.74% 11.39% 11.08% (31) bps Total Risk Based Capital Ratio 15.54% 14.54% 14.19% 13.80% 13.45% (35) bps Net Charge-Offs to Average Loans (3) 0.07% 0.11% 0.01% 0.06% 0.05% (1) bps Nonperforming Assets to Total Assets (3) 0.84% 0.81% 0.85% 0.83% 0.86% 3 bps (1) Excludes the impact of the adoption of the new accounting standard. (2) Fully taxable equivalent basis. (3) Excluding FDIC Covered Assets and acquired impaired loans. %/Basis Point Change For Quarter Ended: |
![]() 9 Interest Rate Risk Quarterly Re-pricing Schedule • $1.7 Billion in time deposits re-price over next 12 months at weighted average 0.68% rate • During 2Q13, new and re-priced time deposits were booked at an average cost of 0.32% • In 2Q13, retention rate of time deposits was 83% with average reduction in rate of 25 basis points $ in millions Note: Amounts exclude re-pricing of assets and liabilities from prior quarters Excludes FDIC loans and receivable, non-accrual loans and market value adjustments 3Q13 4Q13 1Q14 2Q14 3Q14 Cash Equivalents Balance 162.2 $ - $ - $ - $ - $ Rate 1.28% 0.00% 0.00% 0.00% 0.00% Investments Balance 101.5 $ 85.1 $ 82.9 $ 83.2 $ 83.7 $ Rate 2.83% 2.79% 2.59% 2.84% 3.04% Fixed Rate Loans Balance 337.2 $ 247.7 $ 237.0 $ 233.6 $ 207.6 $ Rate 5.30% 5.15% 5.12% 5.09% 5.08% Variable Rate Loans Balance 3,736.7 $ 16.7 $ 16.8 $ 24.1 $ 4.0 $ Rate 3.34% 4.30% 4.46% 4.61% 4.68% Held for Sale Loans Balance 162.0 $ - $ - $ - $ - $ Rate 2.85% 0.00% 0.00% 0.00% 0.00% Time Deposits Balance 609.4 $ 419.9 $ 374.1 $ 250.7 $ 79.8 $ Rate 0.52% 0.76% 0.85% 0.66% 0.84% Repos Balance 289.4 $ - $ - $ - $ - $ Rate 0.15% 0.00% 0.00% 0.00% 0.00% Borrowed Funds Balance 135.0 $ 1.0 $ 0.8 $ 1.6 $ 8.8 $ Rate 3.47% 4.20% 3.92% 4.15% 4.51% |
![]() 10 Interest Rate Risk Simulations Source: Bancware model, as of June 30, 2013 * Assumes instantaneous and parallel shift in interest rates based on static balance sheet • Asset sensitive from an interest rate risk position • The degree of asset sensitivity is a function of the reaction of competitors to changes in deposit pricing • Forward curve has a slightly positive impact over 12 months Base Blue Forward Change In: -200 bp* -100 bp* Case +100 bp* +200 bp* Chip Curve Net Interest Income -4.4% -1.7% 0.0% 3.3% 6.8% 0.1% 0.9% Economic Value of Equity -15.5% -13.5% 0.0% 4.7% 8.3% 0.0% 0.0% |
![]() 11 Operating Improvement Initiative Composition of Expected Benefits – Updated for 2Q13 Expense Initiatives Compensation Branch closures Other reductions Branch closings Closing 11 branch offices (+2 branches from 1Q13) Contracts Consumer products IT Maintenance Consulting Marketing & Technology Telephone Other Items Business travel Occupancy expense Professional services Revenue Enhancements Loan related fee income Mortgage mandatory delivery Increased origination activity Service fees $ in millions $20.8 million pre-tax net benefit realized in 2014 and beyond 40% of initiatives, representing 34% of total benefits, were completed through June 2013 Salary & Benefits 40% Branch Closings 18% Contracts 13% Marketing & Technology 7% Other Expense 13% Total Expense 92% Revenue Enhancements 8% 100% |
![]() 12 Operating Improvement Initiative Timing of Expected Net Benefits $ in thousands $20.8 million annual pre-tax earnings run-rate improvement by 1Q14 92% expense reductions 8% revenue improvements Aggregate anticipated $8.0 million pre-tax implementation costs – up from $3.9 million in 1Q13 91% or $7.0 million of total implementation costs were incurred in 2Q13 Net benefit of $3.8 million in 2013 2Q13 3Q13 4Q13 1Q14 2Q14 3Q14 4Q14 1Q15 2013 2014 2015 Actual Estimated Estimated Estimated Estimated Estimated Estimated Estimated Estimated Estimated Estimated Expense Reductions : Branch closings $585 $749 $951 $951 $951 $951 $951 $951 $2,286 $3,806 $3,806 Contracts $229 $359 $490 $645 $645 $645 $645 645 1,078 2,580 2,580 Marketing & Technology $63 $190 $236 $236 $236 $236 $236 236 490 945 945 Other expense $436 $1,048 $1,196 $896 $896 $896 $896 $896 2,680 3,583 3,583 Salary & benefits $1,056 $1,628 $2,018 $2,078 $2,078 $2,078 $2,078 2,078 4,702 8,310 8,310 $2,369 $3,974 $4,892 $4,806 $4,806 $4,806 $4,806 $4,806 $11,235 $19,224 $19,224 Revenue improvements - 213 389 389 389 389 389 389 601 1,555 1,555 Total earnings enhancement $2,369 $4,186 $5,280 $5,195 $5,195 $5,195 $5,195 $5,195 $11,836 $20,779 $20,779 Implementation cost (7,037) (1,000) - - - - - - (8,036) - - Net Benefit ($4,667) $3,187 $5,280 $5,195 $5,195 $5,195 $5,195 $5,195 $3,800 $20,779 $20,779 Impact to Full Year Quarterly Impact: |
![]() 13 Asset Quality Non-Performing Assets Trends $ in thousands |
![]() 14 Asset Quality Legacy Portfolio Asset Quality Summary (Excludes FDIC covered assets and acquired impaired loans) • NPAs equated to 0.86% of total assets, up 3 bps compared to 1Q13 • $183 million in classified assets (-14% from 1Q13) • $108 million special mention loans (-3% from 1Q13) • Net charge-offs of $1.0 million or an annualized rate of 0.05% of average loans • $3.3 million provision for legacy franchise in 2Q13 ($ thousands) 6/30/2012 3/31/2013 6/30/2013 Nonaccrual Loans 66,545 $ 66,659 $ 71,556 $ 8% 7% OREO 18,681 26,515 25,893 39% -2% Accruing Loans 90+ Days Past Due 1,275 2,827 2,118 66% -25% Nonperforming Assets 86,501 96,001 99,567 15% 4% Past Due Loans 84,653 85,398 93,872 11% 10% Classified Loans 200,872 213,589 183,414 -9% -14% Nonperforming Assets/Assets 0.84% 0.83% 0.86% 2 bps 3 bps NPAs/(Loans + OREO) 1.33% 1.27% 1.25% (8) bps (2) bps Classified Assets/Total Assets 1.94% 1.84% 1.59% (35) bps (25) bps (Past Dues & Nonaccruals)/Loans 1.30% 1.13% 1.18% (12) bps 5 bps Provision For Loan Losses 4,271 $ (3,941) $ 3,344 $ -22% -185% Net Charge-Offs/(Recoveries) 1,102 1,170 1,029 -7% -12% Provision Less Net Charge-Offs 3,169 $ (5,111) $ 2,315 $ -27% -145% Net Charge-Offs/Average Loans 0.07% 0.06% 0.05% (2) bps (1) bps Allowance For Loan Losses/Loans 1.23% 0.99% 0.84% (39) bps (15) bps Allowance For Credit Losses/Loans 1.23% 0.99% 0.97% (26) bps (2) bps For Quarter Ended: % or Basis Point Change Year/Year Qtr/Qtr |
![]() 15 Asset Quality Total Portfolio Trends ($thousands) Nonaccruals 625,938 $ 463,075 $ 409,775 $ -35% -12% OREO & Foreclosed 129,917 131,836 129,607 0% -2% 90+ Days Past Due 8,270 5,697 4,126 -50% -28% Nonperforming Assets 764,126 $ 600,608 $ 543,508 $ -29% -10% NPAs/Assets 6.30% 4.63% 4.24% (206) bps (39) bps NPAs/(Loans + OREO) 9.71% 6.87% 6.02% (369) bps (85) bps LLR/Loans 2.42% 2.21% 1.83% (59) bps (38) bps ACL/Loans 2.42% 2.21% 1.95% (47) bps (26) bps Net Charge-Offs/Loans 0.06% 0.06% 0.05% (1) bps (1) bps Past Dues: 30-89 Days Past Due 46,391 $ 33,227 $ 35,204 $ -24% 6% 90+ days Past Due 8,270 5,697 4,126 -50% -28% Nonaccual Loans 625,938 463,075 409,775 -35% -12% Total 30+ Past Dues 680,599 $ 501,999 $ 449,105 $ -34% -11% % Loans 8.80% 5.84% 5.04% (376) (80) Total Portfolio 2Q12 1Q13 2Q13 % or Basis Point Change Year/Year Qtr/Qtr |
![]() 16 Markets Loan Growth Organic Loan Growth $ in millions * Organic loan growth excludes the outstanding balance of loans acquired in non-covered transactions (e.g., OMNI, Cameron, and Florida Gulf) at the date of the acquisition in the respective acquisition periods 2nd Quarter 2013: • $394 million, or +5% (+21% annualized) Since YE 2011: • $1.7 billion, or +28% (+19% annualized) Since YE 2009: • $2.8 billion, or +69% (+20% annualized) • The FDIC covered loan portfolio declined 45%, or $752 million (13% annualized rate) |
![]() 17 Markets Net Loan Growth By State – 2Q13 $ in millions Excludes covered loan portfolio |
![]() 18 Markets Quarterly Organic Loan Growth *Organic loan growth excludes the outstanding balance of loans acquired in all transactions at the date of the acquisition in the respective acquisition periods • First quarter of each year tends to exhibit slower loan growth than other quarters |
![]() 19 Markets Loan Originations 2Q13 –Top Markets $ in millions • $1.2 billion in total funded loans and unfunded loan commitments originated in 2Q13 • Significant growth in Houston, New Orleans, Lafayette, Birmingham and Baton Rouge • Continued growth in other markets in which we have invested heavily Loan commitments and originations include renewals |
![]() 20 Excludes acquired deposits Organic Deposit Growth • Core deposit growth of $66 million, or +0.08% (+3% annualized) • Decrease of $45 million, or -0.4% in 2Q13 (-2% Annualized) • $84 million (4%) growth in NIB deposits for 2Q13 • $110 million (5%) decline in time deposits in 2Q13 Total Deposit Growth Markets Organic Deposit Growth $ in millions 2nd Quarter 2013: |
![]() 21 Markets Non-Interest Bearing Deposit Accounts • Strong account growth in high-focus markets |
![]() 22 Markets Noninterest Bearing Deposits % of Total Deposits • Since 2010, total noninterest bearing deposits have increased $1.2 billion or +134% (+54% annualized rate) • Strong growth in 2Q13; +$84 million on a linked quarter basis (17% annualized rate) • Top 2Q13 noninterest bearing deposit growth markets include Houston, New Orleans, Birmingham, and Baton Rouge Noninterest bearing deposits at period-end |
![]() 23 Markets 2Q13 Highlights • Loan pricing and structure remain competitive for target commercial and business banking clients. • Houston, New Orleans, Acadiana, Birmingham and Baton Rouge showed strong commercial loan originations • Loans and commitments originated during 2Q13 of $1.2 billion with 50% fixed rate and 50% floating rate • Commercial loans originated and funded in 2Q13 totaled $499 million with a mix of 35% fixed and 65% floating ($826 in commercial loan commitments during the quarter) • Strong commercial pipeline of $738 million at quarter-end • Small business loan originations, including lines of credit, grew $87 million or 13% in 2Q13 (50% annualized) • Period-end core deposit growth of $66 million, with non-interest bearing deposits up $84 million ($72 million linked quarter growth on an average balance basis) |
![]() 24 Retail and Small Business 2Q13 Progress • Completed closure and consolidation of 3 branches in the second quarter of 2013, as planned, with another 10 branches to be closed in the third quarter. • Balanced loan growth with Small Business, Consumer and Mortgage accounting for 46% of total bank-wide loan growth: • Small Business of $61 million • Indirect of $10 million • Direct Consumer and Mortgage of $108 million • Small Business account growth decreased 5% on a linked quarter basis and increased 16% from 2Q12 • Consumer accounts growth decreased 7% on a linked quarter basis and up 38% from 2Q12 • Continued emphasis on branch efficiency, productivity and enhanced digital delivery, with Retail staffing mid July down 7.8% from end of first qtr, with staff costs down 6.7%. FTEs and staff costs to decline further in 3rd qtr with branch closures. • Continued investment with the addition of 4 new business bankers during the 2nd quarter • Checking account growth in new accounts remains strong, with account openings off slightly from prior quarter: |
![]() 25 Wealth And Capital Markets 2Q13 Progress • ICP/IWA revenues of $3.0 million (up 3% compared to 1Q13 and up 46% from 2Q12) • ICP currently provides research coverage on 72 public energy companies • IWA assets under management increased 1%, to $1.1 billion at June 30, 2013 |
![]() Appendix 26 |
![]() 27 4.00% 5.00% 6.00% 7.00% 8.00% 9.00% 10.00% $0 $200 $400 $600 $800 $1,000 Q1 2013 Q2 2013 Q3 2013 Q4 2013 Q1 2014 Q2 2014 Q3 2014 Q4 2014 Q1 2015 Projected Average Loan Balances and Net Yields Projected Average Balance Projected Net Yield Appendix Expected Amortization Comparison |
![]() 28 Appendix Expected Amortization Comparison $(30.00) $(25.00) $(20.00) $(15.00) $(10.00) $(5.00) $- Q1 2013 Q2 2013 Q3 2013 Q4 2013 Q1 2014 Q2 2014 Q3 2014 Q4 2014 Q1 2015 Millions Indemnification Asset Expected Amortization ($ in Millions) Current Method Legacy Method |
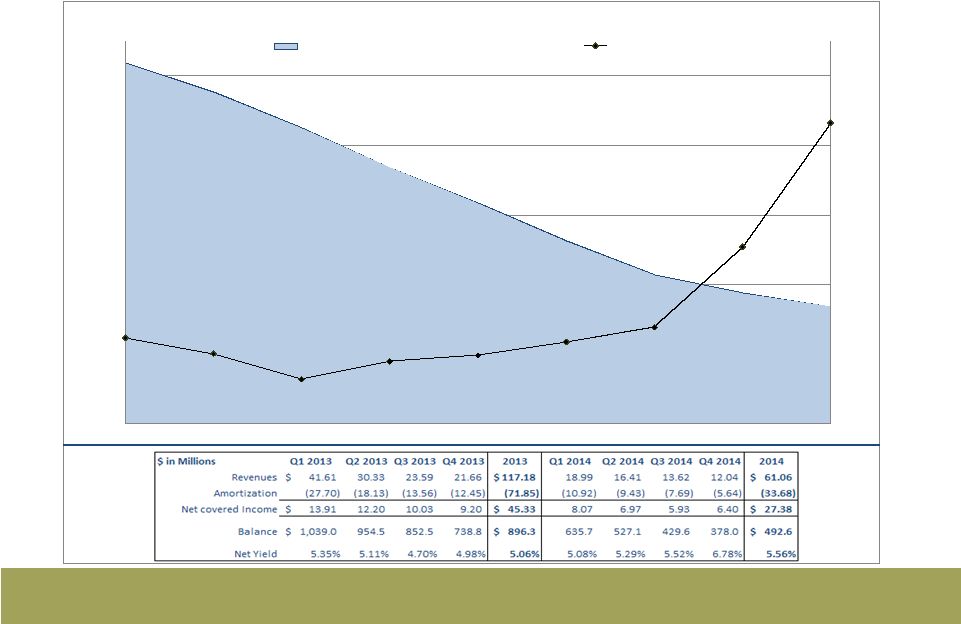
![]() 29 Appendix FDIC Covered Loan Portfolio Roll Forward Average Income / Expense Average Yield Average Income / Expense Average Yield Average Income / Expense Average Yield Average Income / Expense Average Yield Covered Loans 1,153,954 55,400 18.878% 1,112,153 49,550 17.528% 1,039,469 41,607 16.047% 954,555 30,324 12.619% Mortgage Loans 169,580 5,306 12.517% 155,989 5,318 13.636% 180,902 4,398 9.724% 170,420 4,135 9.706% Indirect Automobile (0) - 0.000% (0) - 0.000% (0) - 0.000% - - 0.000% Credit Card 853 14 6.746% 860 14 6.664% 824 13 6.565% 789 14 7.147% Consumer 149,877 5,282 14.020% 148,001 5,308 14.267% 130,960 3,509 10.867% 126,164 2,594 8.248% Line Of Credit-Consumer Loans 72,598 3,462 18.971% 69,910 3,661 20.831% 41,802 3,200 31.044% 40,543 2,967 29.355% Commercial & Business Banking 761,048 41,335 21.257% 737,394 35,250 18.706% 684,981 30,487 17.803% 616,642 20,613 13.224% Loans in Process (3) - 0.000% (1) - 0.000% (1) - 0.000% (3) - 0.000% Overdrafts 0 - 0.000% 0 - 0.000% 0 - 0.000% 0 - 0.000% FDIC Loss Share Receivable 448,746 (33,488) -29.201% 411,328 (28,201) -26.828% 384,319 (27,702) -28.832% 268,700 (18,130) -26.692% Net Covered Loan Portfolio 1,602,700 21,912 7.596% 1,523,481 21,349 7.678% 1,423,788 13,905 5.351% 1,223,255 12,194 5.110% Average Income / Expense Average Yield Average Income / Expense Average Yield Average Income / Expense Average Yield Average Income / Expense Average Yield Covered Loans 1,153,954 55,400 18.878% 1,112,153 49,550 17.528% 1,039,469 41,607 16.047% 954,555 30,324 12.619% CapitalSouth Bank 169,584 6,480 15.034% 150,872 6,737 17.537% 138,793 4,109 11.855% 131,981 3,610 10.852% Orion Bank 651,176 35,154 21.221% 641,252 29,720 18.235% 597,706 25,287 16.960% 548,977 17,685 12.789% Century Bank 244,874 8,047 12.967% 232,967 7,137 12.108% 219,726 6,401 11.703% 199,836 4,943 9.869% Sterling Bank 88,322 5,718 25.371% 87,063 5,956 26.806% 83,245 5,810 27.941% 73,762 4,087 21.956% FDIC Loss Share Receivable 448,746 (33,488) -29.201% 411,328 (28,201) -26.828% 384,319 (27,702) -28.832% 268,700 (18,130) -26.692% CapitalSouth Bank 40,443 (3,213) -31.088% 35,811 (3,431) -37.492% 29,301 (2,388) -32.596% 18,955 (2,347) -48.987% Orion Bank 271,457 (22,983) -33.130% 251,749 (17,944) -27.892% 235,594 (17,330) -29.423% 164,219 (10,492) -25.277% Century Bank 101,167 (3,875) -14.987% 92,076 (3,200) -13.601% 90,384 (4,100) -18.146% 65,145 (3,105) -18.857% Sterling Bank 35,680 (3,417) -37.472% 31,691 (3,625) -44.761% 29,040 (3,884) -53.502% 20,382 (2,185) -42.404% Net Covered Loan Portfolio 1,153,954 21,912 7.596% 1,112,153 21,349 7.678% 1,039,469 13,905 5.351% 954,555 12,194 5.110% CapitalSouth Bank 169,584 3,267 7.706% 150,872 3,305 8.764% 138,793 1,721 4.961% 131,981 1,262 3.826% Orion Bank 651,176 12,171 7.477% 641,252 11,776 7.345% 597,706 7,958 5.326% 548,977 7,192 5.240% Century Bank 244,874 4,173 6.816% 232,967 3,937 6.760% 219,726 2,301 4.188% 199,836 1,837 3.678% Sterling Bank 88,322 2,301 10.420% 87,063 2,331 10.709% 83,245 1,925 9.252% 73,762 1,903 10.317% 2Q2013 3Q2012 4Q2012 1Q2013 2Q2013 3Q2012 4Q2012 1Q2013 |