
4Q13 Earnings Conference Call
Supplemental Presentation
January 28, 2014
iBERIABANK Corporation TM
Safe Harbor Language
Statements contained in this presentation which are not historical facts and which pertain to future operating results of IBERIABANK Corporation and its subsidiaries constitute “forward-looking statements” within the meaning of the Private Securities Litigation Reform
Act of 1995. These forward-looking statements involve significant risks and uncertainties. Actual results may differ materially from the results discussed in these forward-looking statements. Factors that might cause such a difference include, but are not limited to, those discussed in IBERIABANK Corporation’s periodic filings with the SEC.
In connection with the proposed merger, IBERIABANK Corporation will file a Registration Statement on Form S-4 that will contain a proxy statement / prospectus. INVESTORS AND SECURITY HOLDERS ARE URGED TO CAREFULLY READ THE PROXY STATEMENT / PROSPECTUS REGARDING THE PROPOSED TRANSACTION WHEN IT BECOMES AVAILABLE, BECAUSE IT WILL CONTAIN IMPORTANT INFORMATION. Investors and security holders may obtain a free copy of the proxy statement / prospectus (when it is available) and other documents containing information about IBERIABANK Corporation and
Teche Holding Company, without charge, at the SEC’s website at http://www.sec.gov. Copies of the proxy statement / prospectus and the SEC filings that will be incorporated by reference in the proxy statement / prospectus may also be obtained for free from the IBERIABANK
Corporation website, www.iberiabank.com, under the heading “Investor Information”.
This communication is not a solicitation of any vote or approval, is not an offer to purchase shares of Teche Holding Company common stock, nor is it an offer to sell shares of IBERIABANK Corporation common stock which may be issued in any proposed merger with Teche Holding Company. The issuance of IBERIABANK Corporation common stock in any proposed merger with Teche Holding Company would have to be registered under the Securities Act of 1933, as amended, and such IBERIABANK Corporation common stock would be offered only by means of a prospectus complying with the Act.
2 2
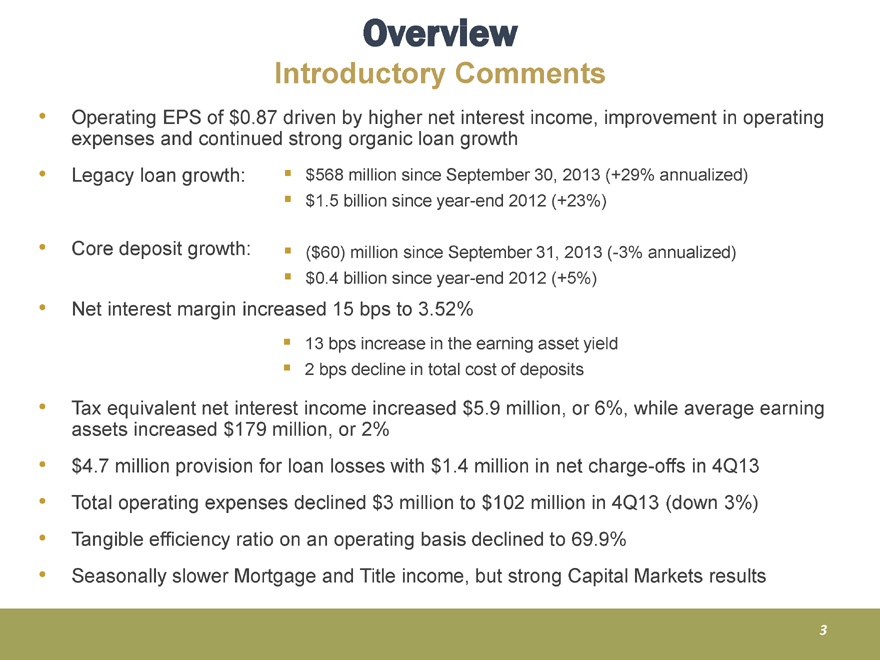
Overview
Introductory Comments
Operating EPS of $0.87 driven by higher net interest income, improvement in operating expenses and continued strong organic loan growth
Legacy loan growth:
$568 million since September 30, 2013 (+29% annualized)
$1.5 billion since year-end 2012 (+23%)
Core deposit growth:
($60) million since September 31, 2013 (-3% annualized)
$0.4 billion since year-end 2012 (+5%)
Net interest margin increased 15 bps to 3.52%
13 bps increase in the earning asset yield
2 bps decline in total cost of deposits
Tax equivalent net interest income increased $5.9 million, or 6%, while average earning assets increased $179 million, or 2%
$4.7 million provision for loan losses with $1.4 million in net charge-offs in 4Q13
Total operating expenses declined $3 million to $102 million in 4Q13 (down 3%)
Tangible efficiency ratio on an operating basis declined to 69.9%
Seasonally slower Mortgage and Title income, but strong Capital Markets results
3
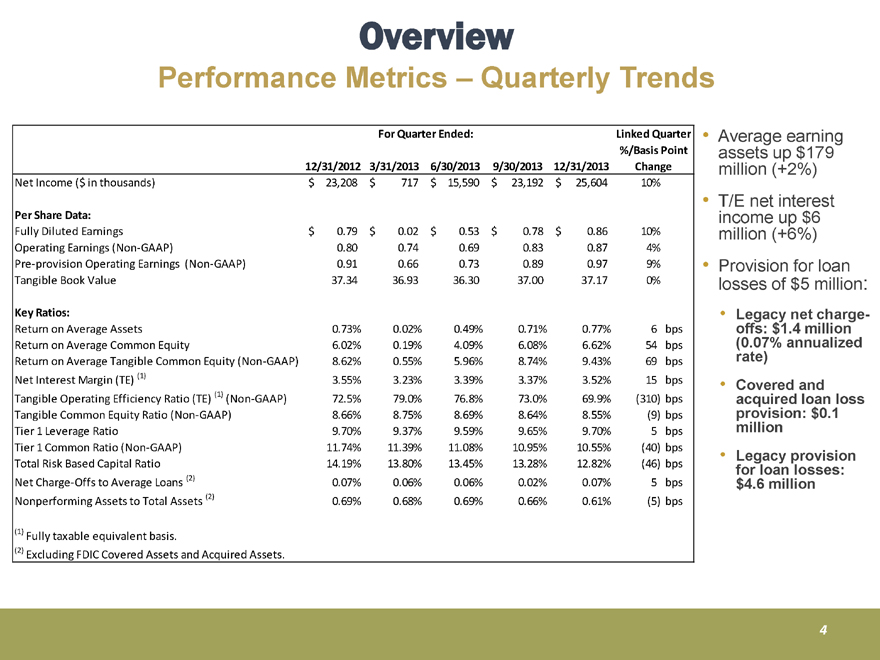
Overview
Performance Metrics – Quarterly Trends
For Quarter Ended:
Linked Quarter %/Basis Point
12/31/2012 3/31/2013 6/30/2013 9/30/2013 12/31/2013 Change
Net Income ($ in thousands) $ 23,208 $ 717 $ 15,590 $ 23,192 $ 25,604 10%
Per Share Data:
Fully Diluted Earnings $ 0.79 $ 0.02 $ 0.53 $ 0.78 $ 0.86 10%
Operating Earnings (Non-GAAP) 0.80 0.74 0.69 0.83 0.87 4%
Pre-provision Operating Earnings (Non-GAAP) 0.91 0.66 0.73 0.89 0.97 9%
Tangible Book Value 37.34 36.93 36.30 37.00 37.17 0%
Key Ratios:
Return on Average Assets 0.73% 0.02% 0.49% 0.71% 0.77% 6 bps
Return on Average Common Equity 6.02% 0.19% 4.09% 6.08% 6.62% 54 bps
Return on Average Tangible Common Equity (Non-GAAP) 8.62% 0.55% 5.96% 8.74% 9.43% 69 bps
Net Interest Margin (TE) (1) 3.55% 3.23% 3.39% 3.37% 3.52% 15 bps
Tangible Operating Efficiency Ratio (TE) (1) (Non-GAAP) 72.5% 79.0% 76.8% 73.0% 69.9% (310) bps
Tangible Common Equity Ratio (Non-GAAP) 8.66% 8.75% 8.69% 8.64% 8.55% (9) bps
Tier 1 Leverage Ratio 9.70% 9.37% 9.59% 9.65% 9.70% 5 bps
Tier 1 Common Ratio (Non-GAAP) 11.74% 11.39% 11.08% 10.95% 10.55% (40) bps
Total Risk Based Capital Ratio 14.19% 13.80% 13.45% 13.28% 12.82% (46) bps
Net Charge-Offs to Average Loans (2) 0.07% 0.06% 0.06% 0.02% 0.07% 5 bps
Nonperforming Assets to Total Assets (2) 0.69% 0.68% 0.69% 0.66% 0.61% (5) bps
(1) Fully taxable equivalent basis.
(2) Excluding FDIC Covered Assets and Acquired Assets.
Average earning assets up $179 million (+2%)
T/E net interest income up $6 million (+6%) Provision for loan losses of $5 million:
Legacy net charge-offs: $1.4 million (0.07% annualized rate)
Covered and acquired loan loss provision: $0.1 million
Legacy provision for loan losses: $4.6 million
4
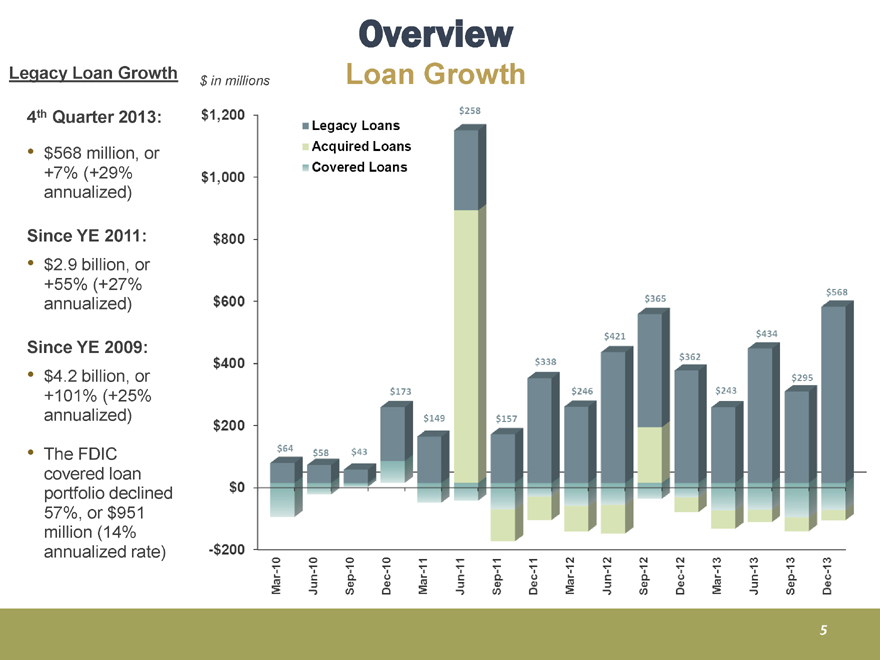
Overview
Loan Growth
Legacy Loan Growth
$ in millions
4th Quarter 2013:
$568 million, or +7% (+29% annualized)
Since YE 2011:
$2.9 billion, or +55% (+27% annualized)
Since YE 2009:
$4.2 billion, or +101% (+25% annualized)
The FDIC covered loan portfolio declined 57%, or $951 million (14% annualized rate)
$1,200 $1,000 $800 $600 $400 $200 $0 -$200
Legacy Loans
Acquired Loans
Covered Loans
$64 $58 $43 $173 $149 $258 $157 $338 $246 $421 $365 $362 $243 $434 $295 $568
Mar-10 Jun-10 Sep-10 Dec-10 Mar-11 Jun-11 Sep-11 Dec-11 Mar-12 Jun-12 Sep-12 Dec-12 Mar-13 Jun-13 Sep-13 Dec-13
5
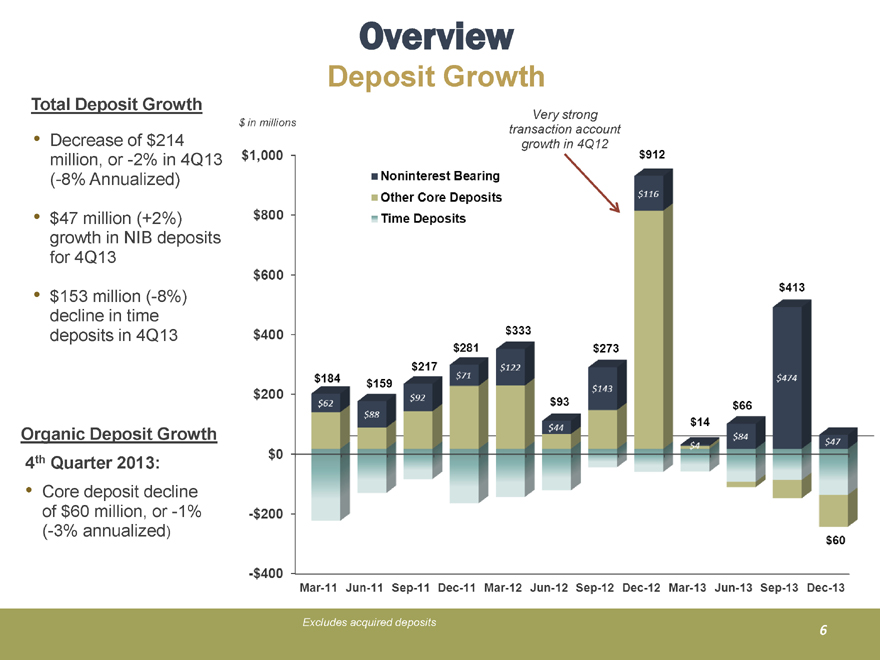
Overview
Deposit Growth
Total Deposit Growth
$ in millions
Decrease of $214 million, or -2% in 4Q13 (-8% Annualized)
$47 million (+2%) growth in NIB deposits for 4Q13
$153 million (-8%) decline in time deposits in 4Q13
Organic Deposit Growth
4th Quarter 2013:
Core deposit decline of $60 million, or -1% (-3% annualized)
$1,000 $800 $600 $400 $200 $0 -$200 -$400
Very strong transaction account growth in 4Q12
Noninterest Bearing
Other Core Deposits
Time Deposits
$184 $159 $217 $281 $333 $93 $273 $912 $14 $66 $413 $60
$62 $88 $92 $71 $122 $44 $143 $4 $84 $474 $47
Mar-11 Jun-11 Sep-11 Dec-11 Mar-12 Jun-12 Sep-12 Dec-12 Mar-13 Jun-13 Sep-13 Dec-13
Excludes acquired deposits
6
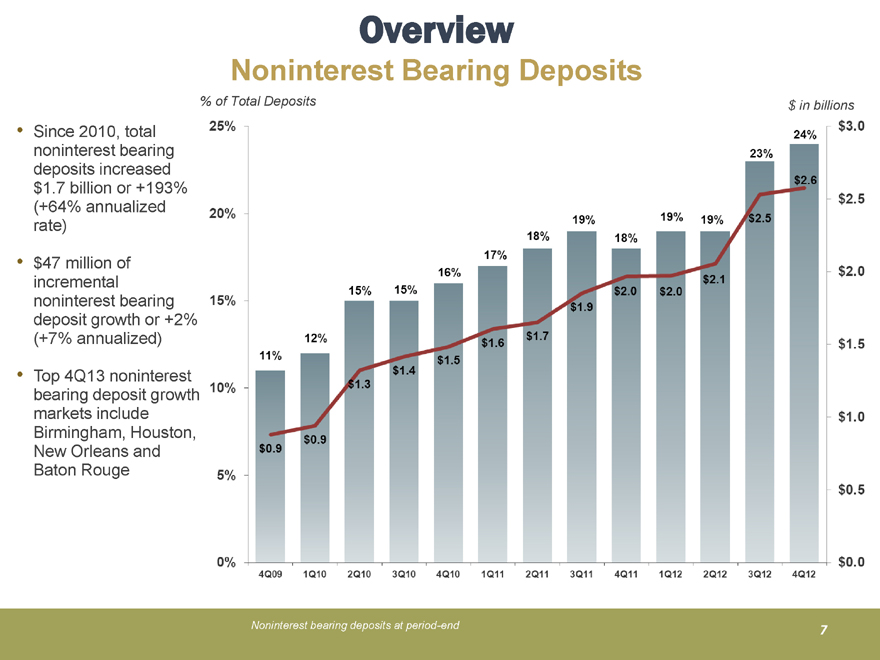
Overview
Noninterest Bearing Deposits
% of Total Deposits
Since 2010, total noninterest bearing deposits increased $1.7 billion or +193% (+64% annualized rate)
$47 million of incremental noninterest bearing deposit growth or +2% (+7% annualized)
Top 4Q13 noninterest bearing deposit growth markets include Birmingham, Houston, New Orleans and Baton Rouge
25% 20% 15% 10% 5% 0%
11% 12% 15% 15% 16% 17% 18% 19% 18% 19% 19% 23% 24%
$0.9 $0.9 $1.3 $1.4 $1.5 $1.6 $1.7 $1.9 $2.0 $2.0 $2.1 $2.5 $2.6
$ in billions
$3.0 $2.5 $2.0 $1.5 $1.0 $0.5 $0.0
4Q09 1Q10 2Q10 3Q10 4Q10 1Q11 2Q11 3Q11 4Q11 1Q12 2Q12 3Q12 4Q12
Noninterest bearing deposits at period-end
7
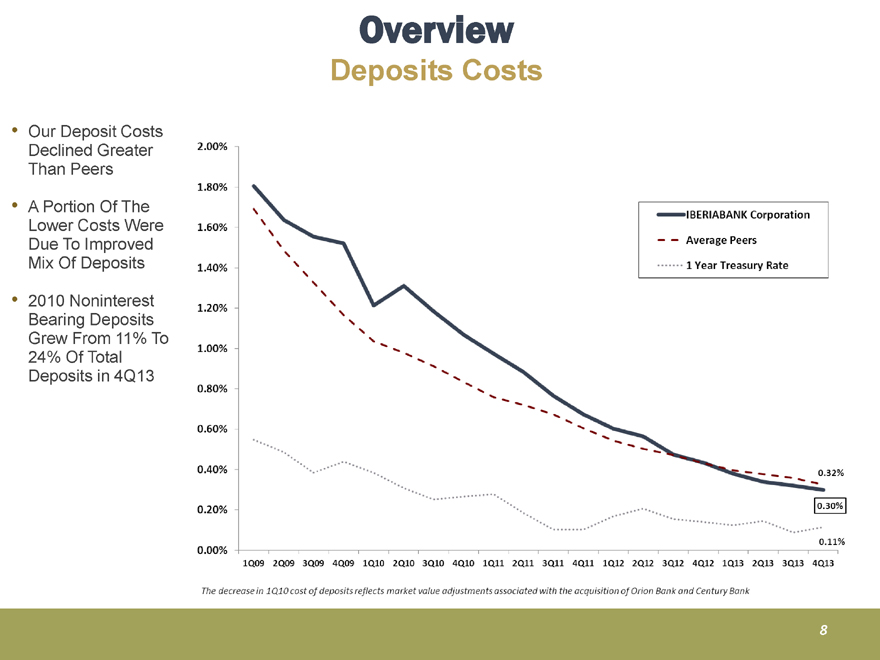
Overview
Deposits Costs
Our Deposit Costs Declined Greater Than Peers
A Portion Of The Lower Costs Were Due To Improved Mix Of Deposits
2010 Noninterest Bearing Deposits Grew From 11% To 24% Of Total Deposits in 4Q13
IBERIABANK Corporation
Average Peers
1 Year Treasury Rate
0.32% 0.30% 0.11%
2.00% 1.80% 1.60% 1.40% 1.20% 1.00% 0.80% 0.60% 0.40% 0.20% 0.00%
1Q09 2Q09 3Q09 4Q09 1Q10 2Q10 3Q10 4Q10 1Q11 2Q11 3Q11 4Q11 1Q12 2Q12 3Q12 4Q12 1Q13 2Q13 3Q13 4Q13
The decrease in 1Q10 cost of deposits reflects market value adjustments associated with the acquisition of Orion Bank and Century Bank
8
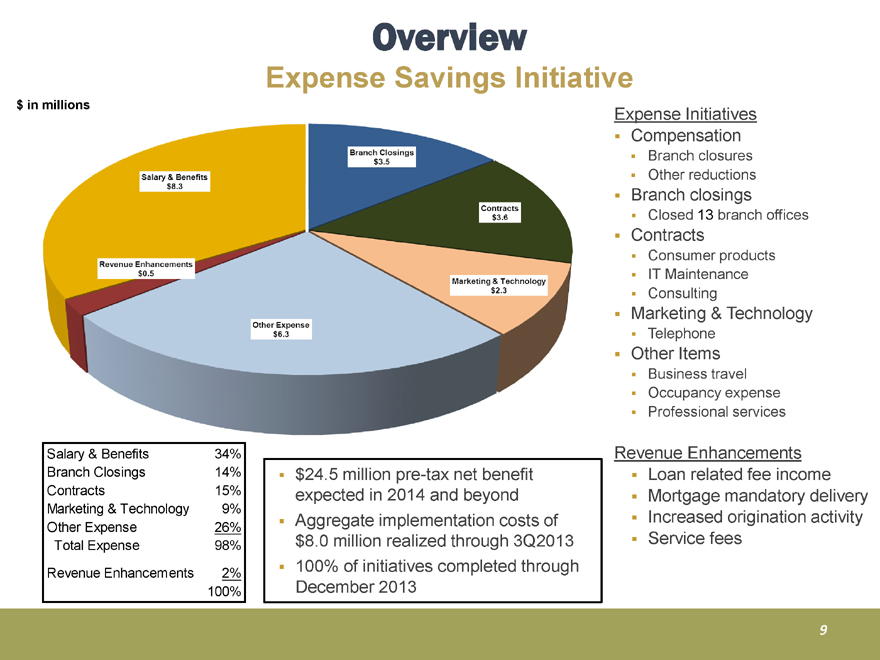
Overview
Expense Savings Initiative
$ in millions
Salary & Benefits $8.3
Branch Closings $3.5
Contracts $3.6
Marketing & Technology $2.3
Other Expense $6.3
Revenue Enhancements $0.5
Expense Initiatives
Compensation
Branch closures
Other reductions
Branch closings
Closed 13 branch offices
Contracts
Consumer products
IT Maintenance Consulting
Marketing & Technology
Telephone
Other Items
Business travel
Occupancy expense
Professional services
Revenue Enhancements
Loan related fee income
Mortgage mandatory delivery
Increased origination activity
Service fees
Salary & Benefits 34%
Branch Closings 14%
Contracts 15%
Marketing & Technology 9%
Other Expense 26%
Total Expense 98%
Revenue Enhancements 2%
100%
$24.5 million pre-tax net benefit expected in 2014 and beyond
Aggregate implementation costs of $8.0 million realized through 3Q2013
100% of initiatives completed through December 2013
9
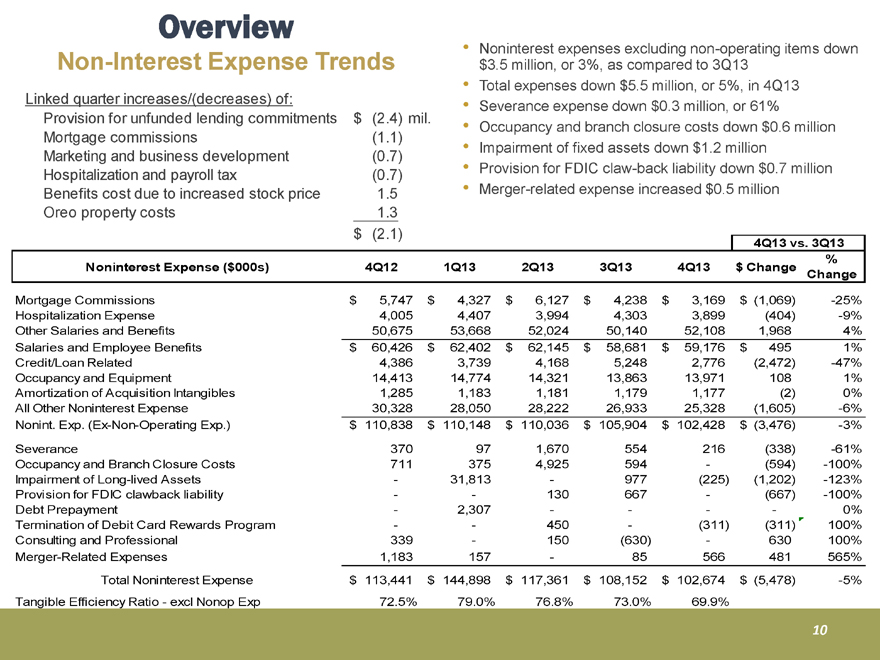
Overview
Non-Interest Expense Trends
Linked quarter increases/(decreases) of:
Provision for unfunded lending commitments $ (2.4) mil.
Mortgage commissions (1.1)
Marketing and business development (0.7)
Hospitalization and payroll tax (0.7)
Benefits cost due to increased stock price 1.5
Oreo property costs 1.3
$ (2.1)
Noninterest expenses excluding non-operating items down $3.5 million, or 3%, as compared to 3Q13
Total expenses down $5.5 million, or 5%, in 4Q13
Severance expense down $0.3 million, or 61%
Occupancy and branch closure costs down $0.6 million Impairment of fixed assets down $1.2 million
Provision for FDIC claw-back liability down $0.7 million
Merger-related expense increased $0.5 million
4Q13 vs. 3Q13
%
Noninterest Expense ($000s) 4Q12 1Q13 2Q13 3Q13 4Q13 $ Change
Change
Mortgage Commissions $ 5,747 $ 4,327 $ 6,127 $ 4,238 $ 3,169 $ (1,069) -25%
Hospitalization Expense 4,005 4,407 3,994 4,303 3,899 (404) -9%
Other Salaries and Benefits 50,675 53,668 52,024 50,140 52,108 1,968 4%
Salaries and Employee Benefits $ 60,426 $ 62,402 $ 62,145 $ 58,681 $ 59,176 $ 495 1%
Credit/Loan Related 4,386 3,739 4,168 5,248 2,776 (2,472) -47%
Occupancy and Equipment 14,413 14,774 14,321 13,863 13,971 108 1%
Amortization of Acquisition Intangibles 1,285 1,183 1,181 1,179 1,177 (2) 0%
All Other Noninterest Expense 30,328 28,050 28,222 26,933 25,328 (1,605) -6%
Nonint. Exp. (Ex-Non-Operating Exp.) $ 110,838 $ 110,148 $ 110,036 $ 105,904 $ 102,428 $ (3,476) -3%
Severance 370 97 1,670 554 216 (338) -61%
Occupancy and Branch Closure Costs 711 375 4,925 594 — (594) -100%
Impairment of Long-lived Assets — 31,813 — 977 (225) (1,202) -123%
Provision for FDIC clawback liability — — 130 667 — (667) -100%
Debt Prepayment — 2,307 — — — —0%
Termination of Debit Card Rewards Program — — 450 — (311) (311) 100%
Consulting and Professional 339 — 150 (630) — 630 100%
Merger-Related Expenses 1,183 157 — 85 566 481 565%
Total Noninterest Expense $ 113,441 $ 144,898 $ 117,361 $ 108,152 $ 102,674 $ (5,478) -5%
Tangible Efficiency Ratio - excl Nonop Exp 72.5% 79.0% 76.8% 73.0% 69.9%
10
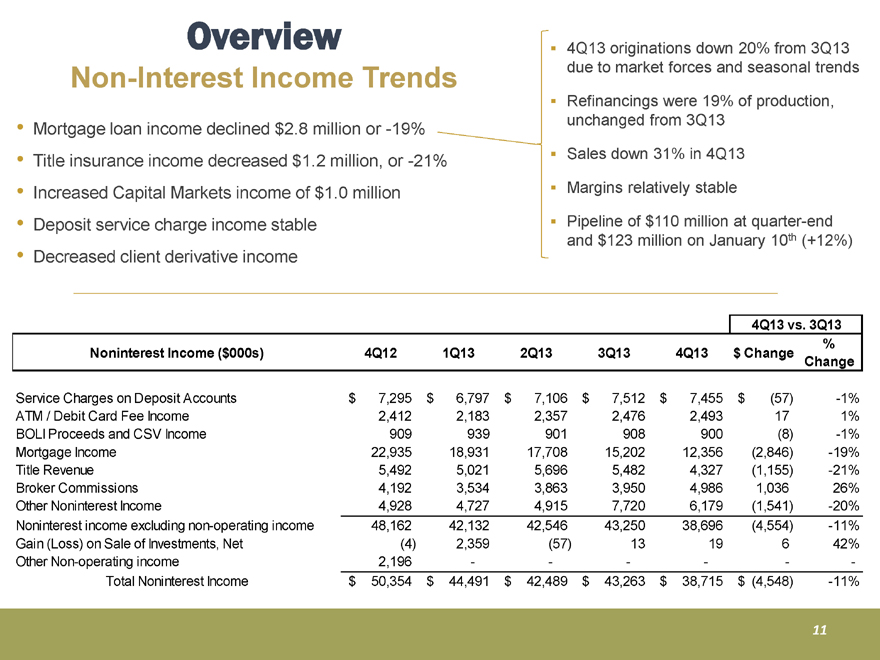
Overview
Non-Interest Income Trends
Mortgage loan income declined $2.8 million or -19%
Title insurance income decreased $1.2 million, or -21%
Increased Capital Markets income of $1.0 million
Deposit service charge income stable
Decreased client derivative income
4Q13 originations down 20% from 3Q13 due to market forces and seasonal trends
Refinancings were 19% of production, unchanged from 3Q13
Sales down 31% in 4Q13
Margins relatively stable
Pipeline of $110 million at quarter-end and $123 million on January 10th (+12%)
4Q13 vs. 3Q13
%
Noninterest Income ($000s) 4Q12 1Q13 2Q13 3Q13 4Q13 $ Change
Service Charges on Deposit Accounts $ 7,295 $ 6,797 $ 7,106 $ 7,512 $ 7,455 $ (57) -1%
ATM / Debit Card Fee Income 2,412 2,183 2,357 2,476 2,493 17 1%
BOLI Proceeds and CSV Income 909 939 901 908 900 (8) -1%
Mortgage Income 22,935 18,931 17,708 15,202 12,356 (2,846) -19%
Title Revenue 5,492 5,021 5,696 5,482 4,327 (1,155) -21%
Broker Commissions 4,192 3,534 3,863 3,950 4,986 1,036 26%
Other Noninterest Income 4,928 4,727 4,915 7,720 6,179 (1,541) -20%
Noninterest income excluding non-operating income 48,162 42,132 42,546 43,250 38,696 (4,554) -11%
Gain (Loss) on Sale of Investments, Net (4) 2,359 (57) 13 19 6 42%
Other Non-operating income 2,196— — — — — — —
Total Noninterest Income $ 50,354 $ 44,491 $ 42,489 $ 43,263 $ 38,715 $ (4,548) -11%
11
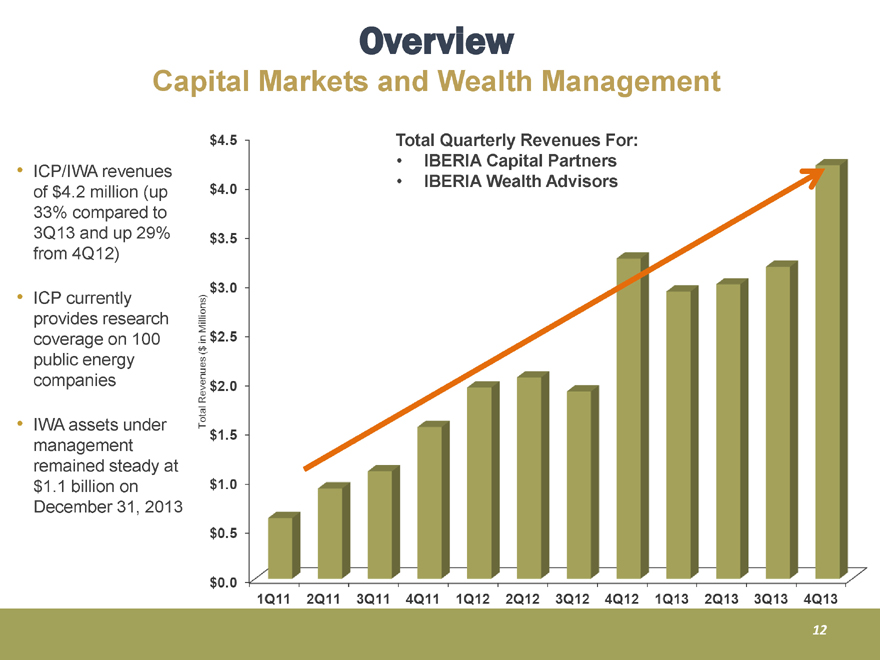
Overview
Capital Markets and Wealth Management
Total Quarterly Revenues For:
IBERIA Capital Partners
IBERIA Wealth Advisors
ICP/IWA revenues of $4.2 million (up 33% compared to 3Q13 and up 29% from 4Q12)
ICP currently provides research coverage on 100 public energy companies
IWA assets under management remained steady at $1.1 billion on December 31, 2013
Total Revenues ($ in Millions)
$4.5 $4.0 $3.5 $2.5 $2.0 $1.5 $1.0 $0.5 $0.0
1Q11 2Q11 3Q11 4Q11 1Q12 2Q12 3Q12 4Q12 1Q13 2Q13 3Q13 4Q13
12
Overview
Small Business and Retail
No closures or consolidation of branches in the fourth quarter of 2013 - Closed 13 branches
and consolidated 4 branches over the past 12 months
Small Business loan growth of $34 million
Indirect loan growth of $5 million
Direct Consumer and Mortgage loan growth of $62 million
Increased Credit Card growth to $3.7 million for the quarter
Completed conversion to new Merchant Services partner
Checking account growth compares favorably to same quarter last year:
Small Business checking accounts increased 12% year-over-year
Consumer checking accounts increased 1% year-over-year
Branch efficiency, productivity and enhanced digital delivery efforts were completed by mid-
October, establishing our new run rate for the 4th quarter and beyond:
Retail staffing down 5.5% from end of the second quarter
Staff costs down 5.8% from end of the second quarter
13
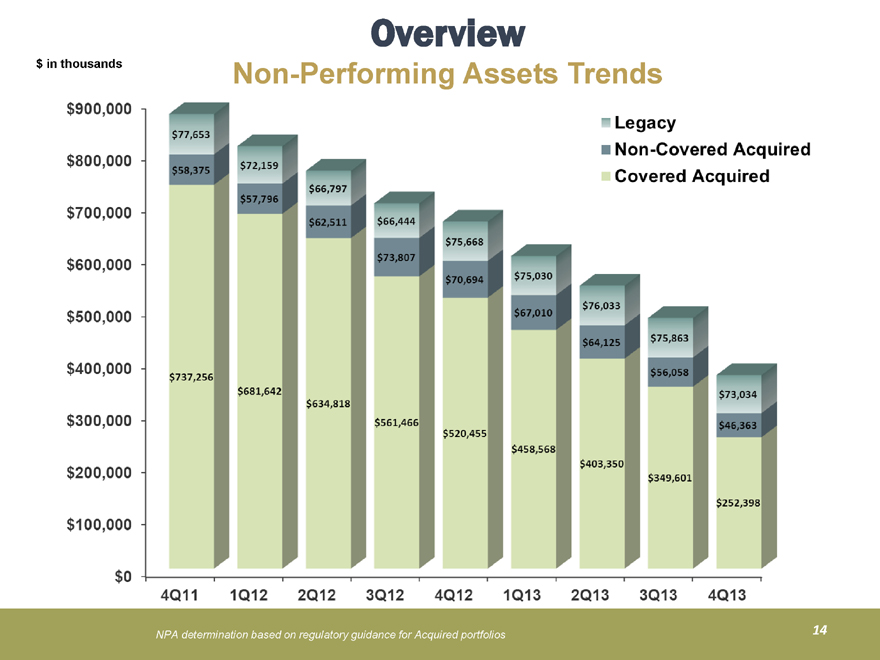
Overview
Non-Performing Assets Trends
$ in thousands
Legacy
Non-Covered Acquired
Covered Acquired
$900,000 $800,000 $700,000 $600,000 $500,000 $400,000 $300,000 $200,000 $100,000 $0
$77,653 $72,159 $66,797 $66,444 $75,668 $75,030 $76,033 $75,863 $73,034
$58,375 $57,796 $62,511 $73,807 $70,694 $67,010 $64,125 $56,058 $46,363
$737,256 $681,642 $634,818 $561,466 $520,455 $458,568 $403,350 $349,601 $252,398
4Q11 1Q12 2Q12 3Q12 4Q12 1Q13 2Q13 3Q13 4Q13
NPA determination based on regulatory guidance for Acquired portfolios
14
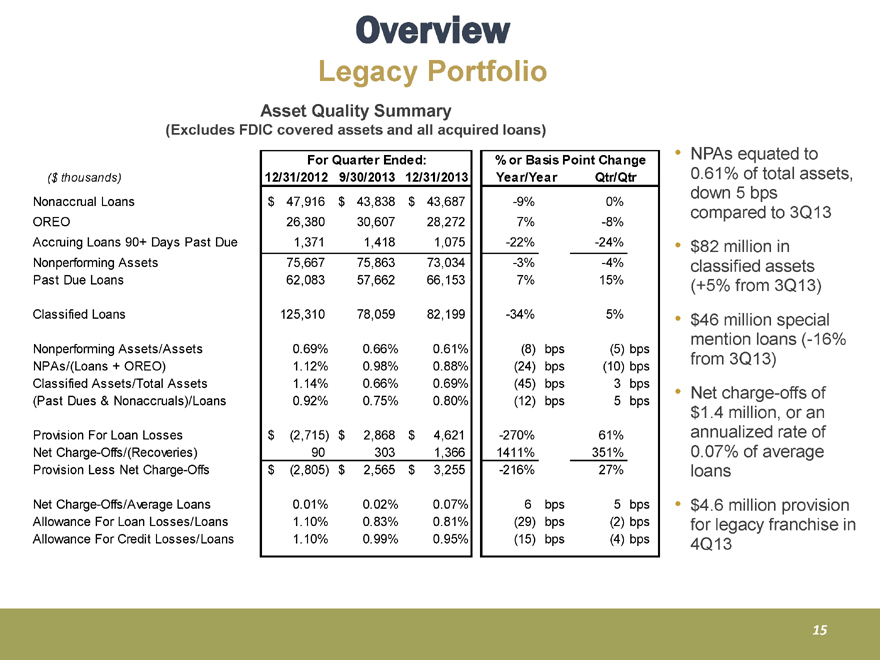
Overview
Legacy Portfolio
Asset Quality Summary
(Excludes FDIC covered assets and all acquired loans)
($ thousands)
For Quarter Ended: 12/31/2012 9/30/2013 12/31/2013
% or Basis Point Change Year/Year Qtr/Qtr
Nonaccrual Loans $ 47,916 $ 43,838 $ 43,687 -9% 0%
OREO 26,380 30,607 28,272 7% -8%
Accruing Loans 90+ Days Past Due 1,371 1,418 1,075 -22% -24%
Nonperforming Assets 75,667 75,863 73,034 -3% -4%
Past Due Loans 62,083 57,662 66,153 7% 15%
Classified Loans 125,310 78,059 82,199 -34% 5%
Nonperforming Assets/Assets 0.69% 0.66% 0.61% (8) bps (5) bps
NPAs/(Loans + OREO) 1.12% 0.98% 0.88% (24) bps (10) bps
Classified Assets/Total Assets 1.14% 0.66% 0.69% (45) bps 3 bps
(Past Dues & Nonaccruals)/Loans 0.92% 0.75% 0.80% (12) bps 5 bps
Provision For Loan Losses $ (2,715) $ 2,868 $ 4,621 -270% 61%
Net Charge-Offs/(Recoveries) 90 303 1,366 1411% 351%
Provision Less Net Charge-Offs $ (2,805) $ 2,565 $ 3,255 -216% 27%
Net Charge-Offs/Average Loans 0.01% 0.02% 0.07% 6 bps 5 bps
Allowance For Loan Losses/Loans 1.10% 0.83% 0.81% (29) bps (2) bps
Allowance For Credit Losses/Loans 1.10% 0.99% 0.95% (15) bps (4) bps
NPAs equated to 0.61% of total assets, down 5 bps compared to 3Q13
$82 million in classified assets (+5% from 3Q13)
$46 million special mention loans (-16% from 3Q13)
Net charge-offs of $1.4 million, or an annualized rate of 0.07% of average loans
$4.6 million provision for legacy franchise in 4Q13
15
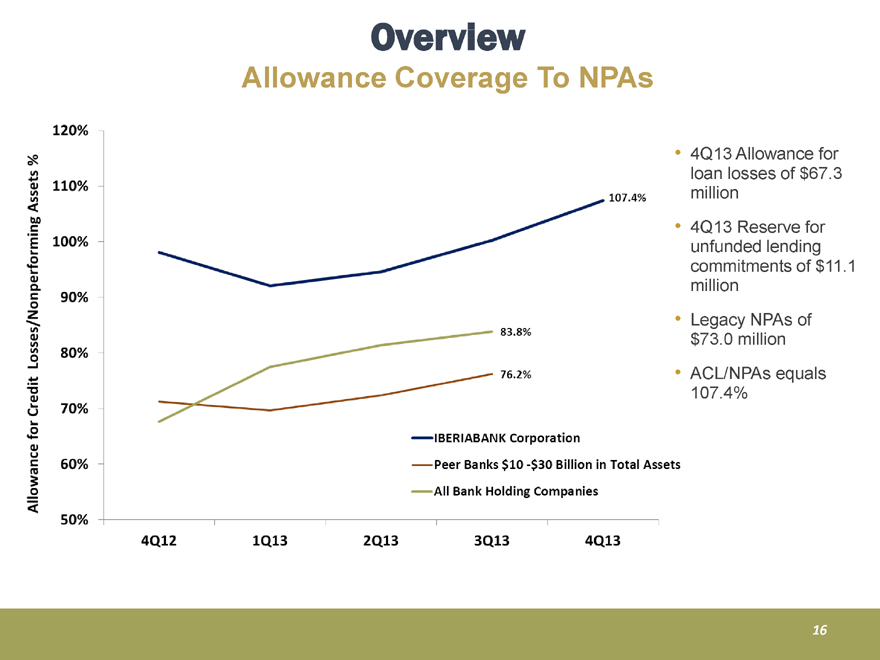
Overview
Allowance Coverage To NPAs
Allowance for Credit Losses/Nonperforming Assets %
120% 110% 100% 90% 80% 70% 60% 50%
4Q12 1Q13 2Q13 3Q13 4Q13
107.4% 83.8% 76.2%
IBERIABANK Corporation
Peer Banks $10 -$30 Billion in Total Assets
All Bank Holding Companies
4Q13 Allowance for loan losses of $67.3 million
4Q13 Reserve for unfunded lending commitments of $11.1 million
Legacy NPAs of $73.0 million ACL/NPAs equals 107.4%
16
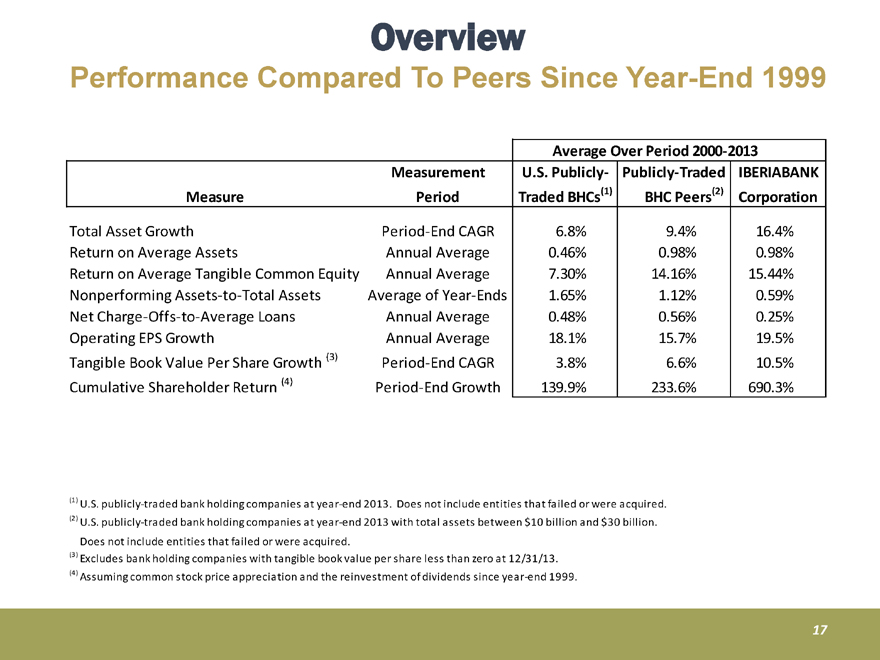
Overview
Performance Compared To Peers Since Year-End 1999
Average Over Period 2000-2013
Measurement U.S. Publicly- Publicly-Traded IBERIABANK
Measure Period Traded BHCs(1) BHC Peers(2) Corporation
Total Asset Growth Period-End CAGR 6.8% 9.4% 16.4%
Return on Average Assets Annual Average 0.46% 0.98% 0.98%
Return on Average Tangible Common Equity Annual Average 7.30% 14.16% 15.44%
Nonperforming Assets-to-Total Assets Average of Year-Ends 1.65% 1.12% 0.59%
Net Charge-Offs-to-Average Loans Annual Average 0.48% 0.56% 0.25%
Operating EPS Growth Annual Average 18.1% 15.7% 19.5%
Tangible Book Value Per Share Growth (3) Period-End CAGR 3.8% 6.6% 10.5%
Cumulative Shareholder Return (4) Period-End Growth 139.9% 233.6% 690.3%
(1) U.S. publicly-traded bank holding companies at year-end 2013. Does not include entities that failed or were acquired.
(2) U.S. publicly-traded bank holding companies at year-end 2013 with total assets between $10 billion and $30 billion. Does not include entities that failed or were acquired.
(3) Excludes bank holding companies with tangible book value per share less than zero at 12/31/13.
(4) Assuming common stock price appreciation and the reinvestment of dividends since year-end 1999.
17

Acquisition of Teche Holding Company
18
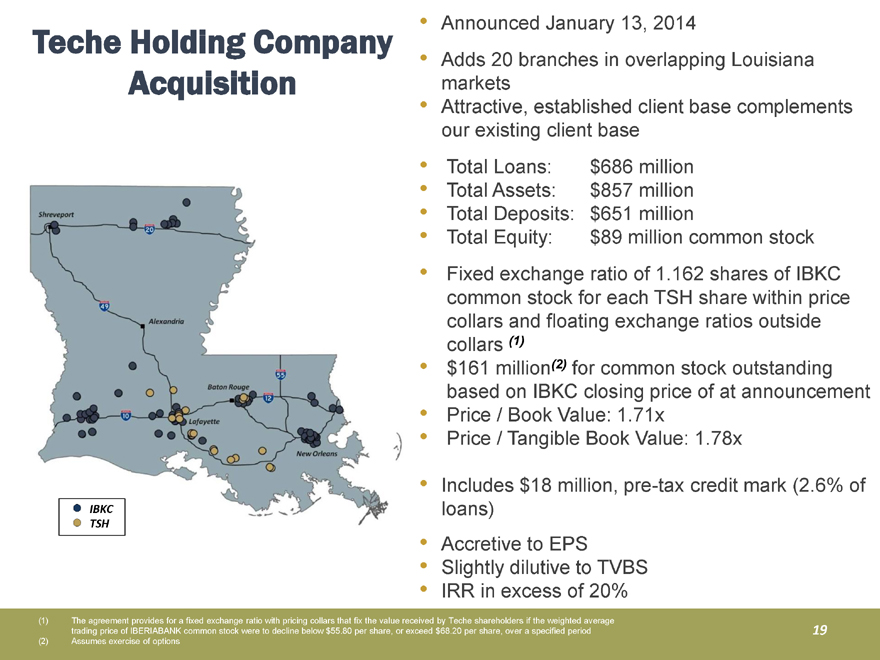
Teche Holding Company
Acquisition
IBKC
TSH
Announced January 13, 2014
Adds 20 branches in overlapping Louisiana markets
Attractive, established client base complements our existing client base
Total Loans: $686 million
Total Assets: $857 million
Total Deposits: $651 million
Total Equity: $89 million common stock
Fixed exchange ratio of 1.162 shares of IBKC common stock for each TSH share within price collars and floating exchange ratios outside collars (1)
$161 million(2) for common stock outstanding based on IBKC closing price of at announcement
Price / Book Value: 1.71x
Price / Tangible Book Value: 1.78x
Includes $18 million, pre-tax credit mark (2.6% of loans)
Accretive to EPS
Slightly dilutive to TVBS
IRR in excess of 20%
(1) The agreement provides for a fixed exchange ratio with pricing collars that fix the value received by Teche shareholders if the weighted average trading price of IBERIABANK common stock were to decline below $55.80 per share, or exceed $68.20 per share, over a specified period
(2) Assumes exercise of options
19
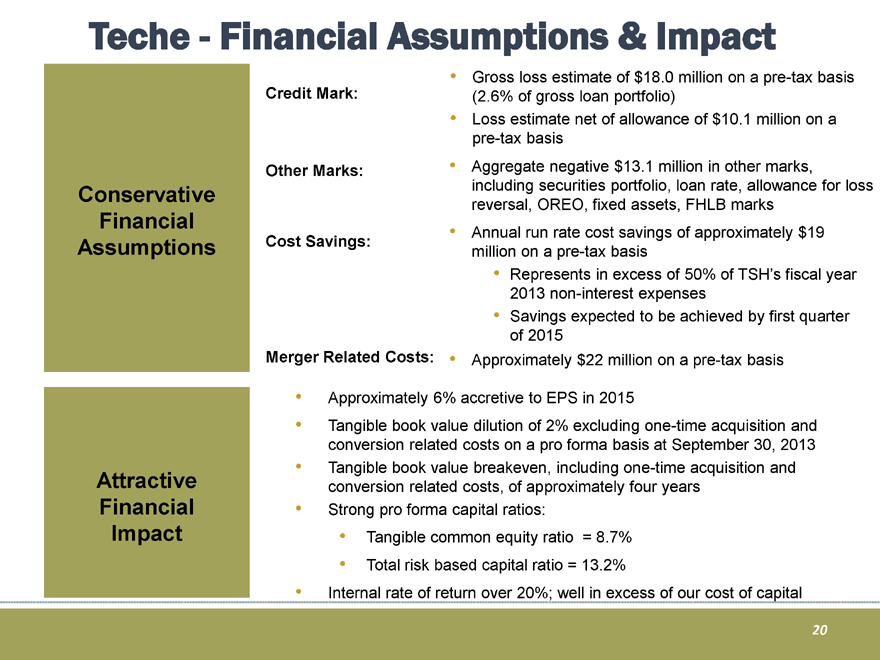
Teche - Financial Assumptions & Impact
Conservative Financial Assumptions
Credit Mark: Other Marks: Cost Savings:
Gross loss estimate of $18.0 million on a pre-tax basis
(2.6% of gross loan portfolio)
Loss estimate net of allowance of $10.1 million on a pre-tax basis Aggregate negative $13.1 million in other marks, including securities portfolio, loan rate, allowance for loss reversal, OREO, fixed assets, FHLB marks Annual run rate cost savings of approximately $19 million on a pre-tax basis
Represents in excess of 50% of TSH’s fiscal year
2013 non-interest expenses
Savings expected to be achieved by first quarter of 2015
Merger Related Costs:
Approximately $22 million on a pre-tax basis
Approximately 6% accretive to EPS in 2015
Tangible book value dilution of 2% excluding one-time acquisition and conversion related costs on a pro forma basis at September 30, 2013 Tangible book value breakeven, including one-time acquisition and conversion related costs, of approximately four years Strong pro forma capital ratios:
Tangible common equity ratio = 8.7% Total risk based capital ratio = 13.2%
Internal rate of return over 20%; well in excess of our cost of capital
20

Appendix
21
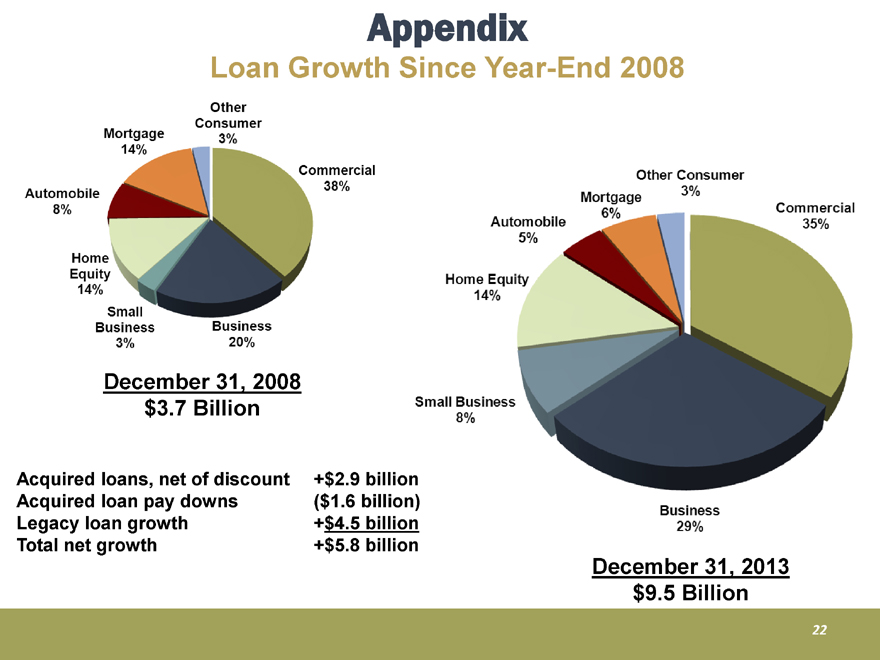
Appendix
Loan Growth Since Year-End 2008
Acquired loans, net of discount +$2.9 billion
Acquired loan pay downs ($1.6 billion)
Legacy loan growth +$4.5 billion
Total net growth +$5.8 billion
Automobile 8%
Mortgage 14%
Other Consumer 3%
Commercial 38%
Business 20%
Small Business 3%
Home Equity 14%
December 31, 2008
$3.7 Billion
Home Equity 14%
Automobile 5%
Mortgage 6%
Other Consumer 3%
Commercial 35%
Business 29%
Small Business 8%
December 31, 2013
$9.5 Billion
22
Appendix
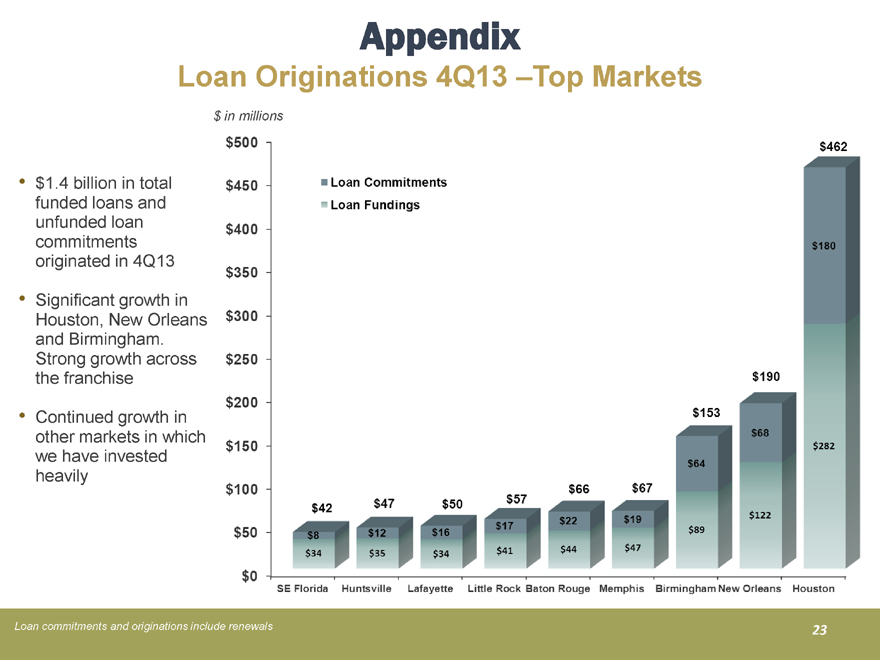
Loan Originations 4Q13 –Top Markets
$1.4 billion in total funded loans and unfunded loan commitments originated in 4Q13
Significant growth in Houston, New Orleans and Birmingham. Strong growth across the franchise
Continued growth in other markets in which we have invested heavily
$ in millions
$500
$450
$400
$350
$300
$250
$200
$150
$100
$50
$0
Loan Commitments
Loan Fundings
$42 $8 $34
$47 $12 $35
$50 $16 $34
$57 $17 $41
$66 $22 $44
$67 $19 $47
$153 $64 $89
$190 $68 $122
$462 $180 $282
SE Florida Huntsville Lafayette Little Rock Baton Rouge Memphis Birmingham New Orleans Houston
Loan commitments and originations include renewals
23
Appendix
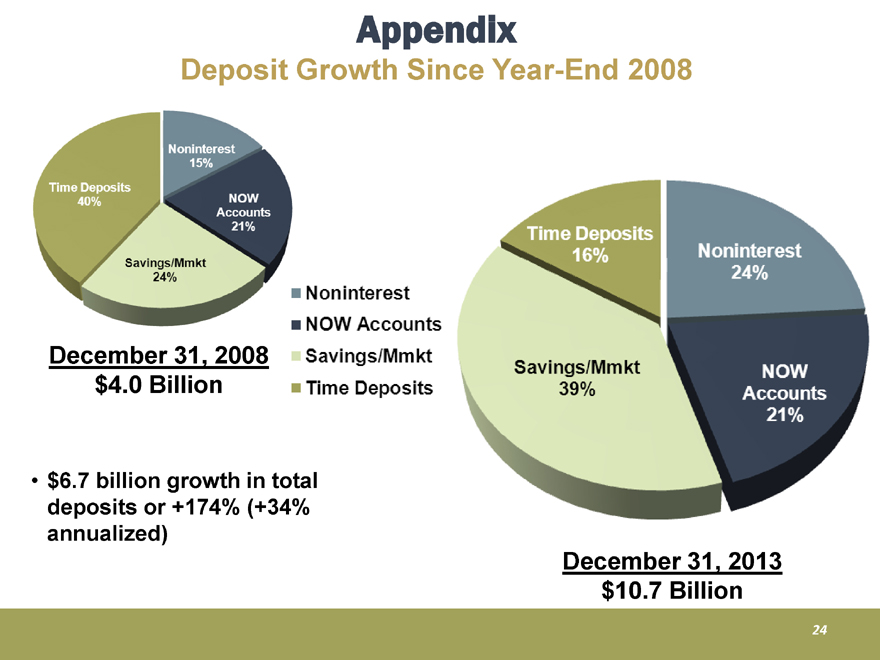
Deposit Growth Since Year-End 2008
Time Deposits 40%
Noninterest 15%
NOW Accounts 21%
Savings/Mmkt 24%
Noninterest
NOW Accounts
Savings/Mmkt
Time Deposits
December 31, 2008
$4.0 Billion
Time Deposits 16%
Noninterest 24%
NOW Accounts 21%
Savings/Mmkt 39%
December 31, 2013
$10.7 Billion
$6.7 billion growth in total deposits or +174% (+34% annualized)
24
Appendix
Market Highlights For 4Q13
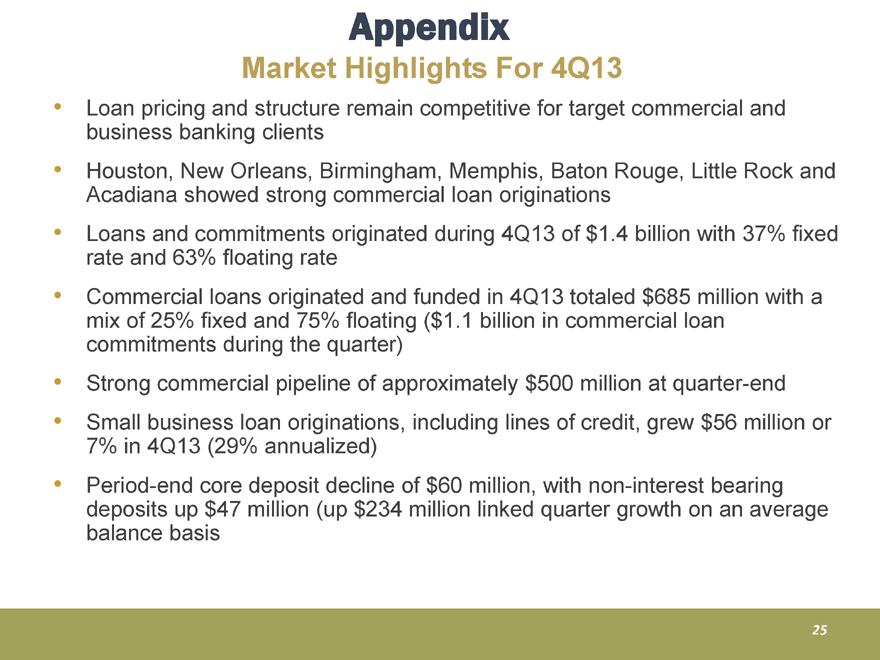
Loan pricing and structure remain competitive for target commercial and business banking clients
Houston, New Orleans, Birmingham, Memphis, Baton Rouge, Little Rock and Acadiana showed strong commercial loan originations Loans and commitments originated during 4Q13 of $1.4 billion with 37% fixed rate and 63% floating rate Commercial loans originated and funded in 4Q13 totaled $685 million with a mix of 25% fixed and 75% floating ($1.1 billion in commercial loan commitments during the quarter)
Strong commercial pipeline of approximately $500 million at quarter-end
Small business loan originations, including lines of credit, grew $56 million or 7% in 4Q13 (29% annualized) Period-end core deposit decline of $60 million, with non-interest bearing deposits up $47 million (up $234 million linked quarter growth on an average balance basis
25
Appendix
Asset Quality Portfolio Trends
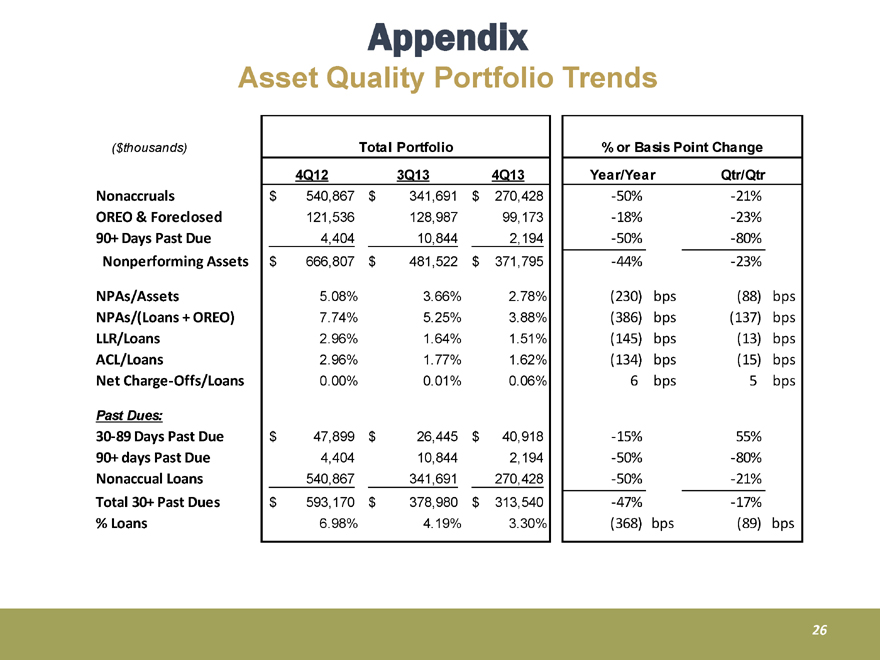
($thousands)
Nonaccruals OREO & Foreclosed 90+ Days Past Due Nonperforming Assets
NPAs/Assets NPAs/(Loans + OREO) LLR/Loans ACL/Loans Net Charge-Offs/Loans
Past Dues:
30-89 Days Past Due 90+ days Past Due Nonaccual Loans Total 30+ Past Dues
% Loans
Total Portfolio
4Q12 3Q13 4Q13
$ 540,867 $ 341,691 $ 270,428
121,536 128,987 99,173
4,404 10,844 2,194
$ 666,807 $ 481,522 $ 371,795
5.08% 3.66% 2.78%
7.74% 5.25% 3.88%
2.96% 1.64% 1.51%
2.96% 1.77% 1.62%
0.00% 0.01% 0.06%
$ 47,899 $ 26,445 $ 40,918
4,404 10,844 2,194
540,867 341,691 270,428
$ 593,170 $ 378,980 $ 313,540
6.98% 4.19% 3.30%
% or Basis Point Change
Year/Year Qtr/Qtr
-50% -21%
-18% -23%
-50% -80%
-44% -23%
(230) bps (88) bps
(386) bps (137) bps
(145) bps (13) bps
(134) bps (15) bps
6 bps 5 bps
-15% 55%
-50% -80%
-50% -21%
-47% -17%
(368) bps (89) bps
26

Appendix
Non-Operating Items (Non-GAAP)
RECONCILIATION OF NON-GAAP FINANCIAL MEASURES (1)
(dollars in thousands)
Net Income (Loss) (GAAP)
Noninterest income adjustments Loss (Gain) on sale of investments Other noninterest income
Noninterest expense adjustments Merger-related expenses Severance expenses Impairment of indemnification asset Provision for FDIC clawback liability
Occupancy expenses and branch closure expenses Termination of debit card rewards program Professional expenses and litigation settlements Operating earnings (Non-GAAP) (3)
Covered and acquired impaired (reversal of) provision for loan losses Other (reversal of) provision for loan losses Pre-provision operating earnings (Non-GAAP) (3)
For The Quarter Ended
December 31, 2012 September 30, 2013
Dollar Amount Dollar Amount
Pre-tax After-tax (2) Per share Pre-tax After-tax (2) Per share
$ 32,037 $ 23,208 $ 0.79 $ 30,549 $ 23,192 $ 0.78
4 3 - (13) (8) 0.00
(2,196) (1,427) (0.0483) - - -
1,183 769 0.03 85 55 0.00
370 241 0.01 554 360 0.01
- - - 977 635 0.02
- - - 667 434 0.01
711 462 0.02 594 386 0.01
- - - - - -
339 220 0.01 (630) (410) (0.01)
32,450 23,476 0.80 32,783 24,644 0.83
7,581 4,928 0.17 (854) (555) (0.02)
(2,715) (1,765) (0.06) 2,868 1,864 0.07
$ 37,314 $ 26,639 $ 0.91 $ 34,797 $ 25,953 $ 0.89
December 31, 2013
Dollar Amount
Pre-tax After-tax (2) Per share
$ 34,779 $ 25,604 $ 0.86
(19) (12) (0.00)
- - -
566 368 0.01
216 141 0.00
(225) (146) (0.00)
- - -
- - -
(311) (202) (0.01)
- - -
35,006 25,753 0.87
79 51 0.00
4,621 3,004 0.10
$ 39,706 $ 28,808 $ 0.97
(1) Per share amounts may not appear to foot due to rounding. (2) After-tax amounts estimated based on a 35% marginal tax rate.
(3) Includes the impact of the adoption of ASU 2012-06 in the three-month periods ending December 31, 2013 and September 30, 2013.
4Q13 Pre-tax merger related expenses of $0.6 million and $0.4 million on an after-tax basis ($0.01 EPS) 4Q13 Pre-tax provision for loan losses of $4.7 million or $3.0 million on an after-tax basis ($0.10 EPS)
27
Appendix
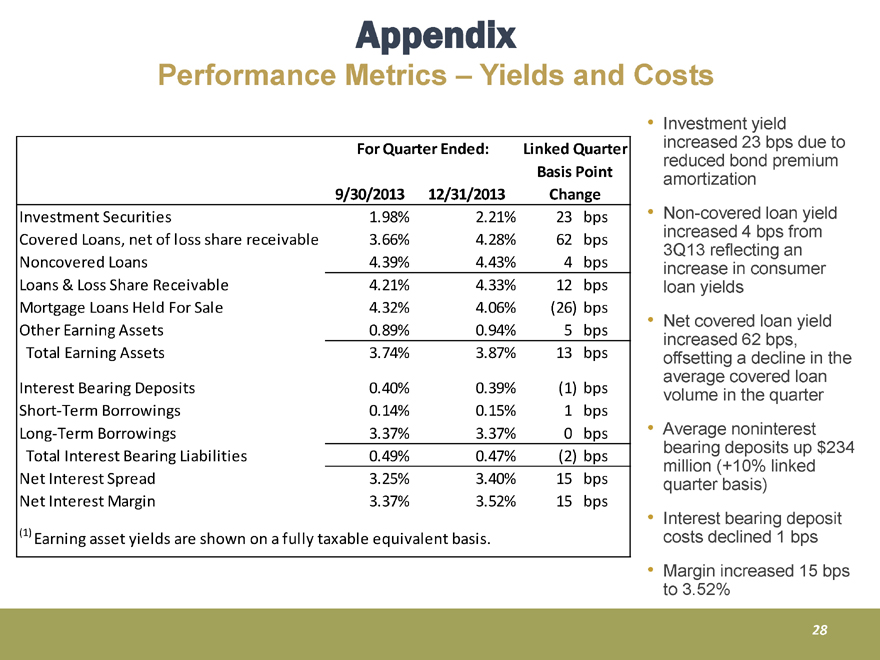
Performance Metrics – Yields and Costs
For Quarter Ended:
Linked Quarter Basis Point Change
9/30/2013 12/31/2013
Investment Securities 1.98% 2.21% 23 bps
Covered Loans, net of loss share receivable 3.66% 4.28% 62 bps
Noncovered Loans 4.39% 4.43% 4 bps
Loans & Loss Share Receivable 4.21% 4.33% 12 bps
Mortgage Loans Held For Sale 4.32% 4.06% (26) bps
Other Earning Assets 0.89% 0.94% 5 bps
Total Earning Assets 3.74% 3.87% 13 bps
Interest Bearing Deposits 0.40% 0.39% (1) bps
Short-Term Borrowings 0.14% 0.15% 1 bps
Long-Term Borrowings 3.37% 3.37% 0 bps
Total Interest Bearing Liabilities 0.49% 0.47% (2) bps
Net Interest Spread 3.25% 3.40% 15 bps
Net Interest Margin 3.37% 3.52% 15 bps
(1) Earning asset yields are shown on a fully taxable equivalent basis.
Investment yield increased 23 bps due to reduced bond premium amortization
Non-covered loan yield increased 4 bps from 3Q13 reflecting an increase in consumer loan yields
Net covered loan yield increased 62 bps, offsetting a decline in the average covered loan volume in the quarter
Average noninterest bearing deposits up $234 million (+10% linked quarter basis)
Interest bearing deposit costs declined 1 bps
Margin increased 15 bps to 3.52%
28
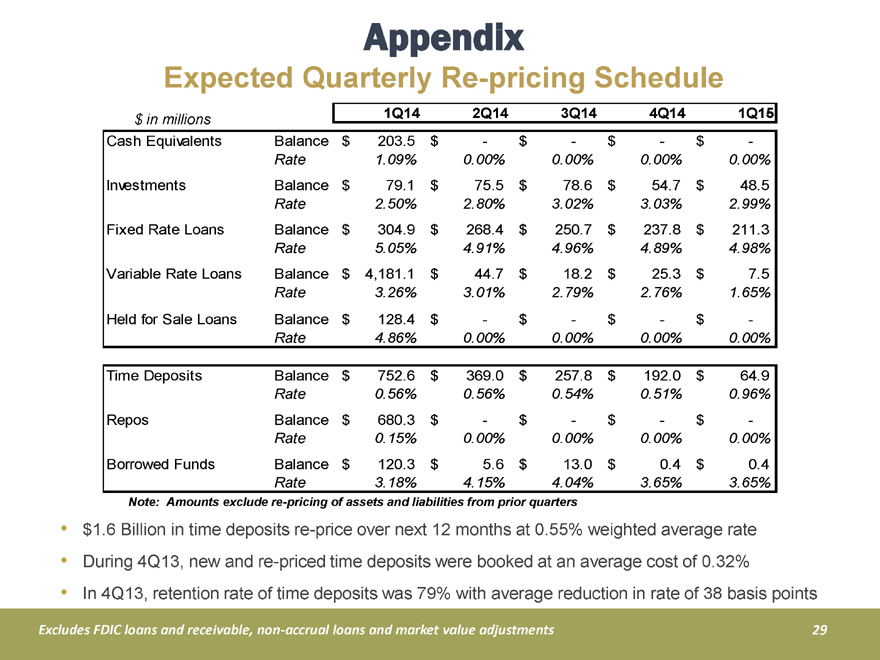
Appendix
Expected Quarterly Re-pricing Schedule
$ in millions 1Q14 2Q14 3Q14 4Q14 1Q15
Cash Equivalents
Balance $ 203.5 $ - $ - $ - $ -
Rate 1.09% 0.00% 0.00% 0.00% 0.00%
Investments
Balance $ 79.1 $ 75.5 $ 78.6 $ 54.7 $ 48.5
Rate 2.50% 2.80% 3.02% 3.03% 2.99%
Fixed Rate Loans
Balance $ 304.9 $ 268.4 $ 250.7 $ 237.8 $ 211.3
Rate 5.05% 4.91% 4.96% 4.89% 4.98%
Variable Rate Loans
Balance $ 4,181.1 $ 44.7 $ 18.2 $ 25.3 $ 7.5
Rate 3.26% 3.01% 2.79% 2.76% 1.65%
Held for Sale Loans
Balance $ 128.4 $ - $ - $ - $ -
Rate 4.86% 0.00% 0.00% 0.00% 0.00%
Time Deposits
Balance $ 752.6 $ 369.0 $ 257.8 $ 192.0 $ 64.9
Rate 0.56% 0.56% 0.54% 0.51% 0.96%
Repos
Balance $ 680.3 $ - $ - $ - $ -
Rate 0.15% 0.00% 0.00% 0.00% 0.00%
Borrowed Funds
Balance $ 120.3 $ 5.6 $ 13.0 $ 0.4 $ 0.4
Rate 3.18% 4.15% 4.04% 3.65% 3.65%
Note: Amounts exclude re-pricing of assets and liabilities from prior quarters
$1.6 Billion in time deposits re-price over next 12 months at 0.55% weighted average rate
During 4Q13, new and re-priced time deposits were booked at an average cost of 0.32%
In 4Q13, retention rate of time deposits was 79% with average reduction in rate of 38 basis points
Excludes FDIC loans and receivable, non-accrual loans and market value adjustments
29
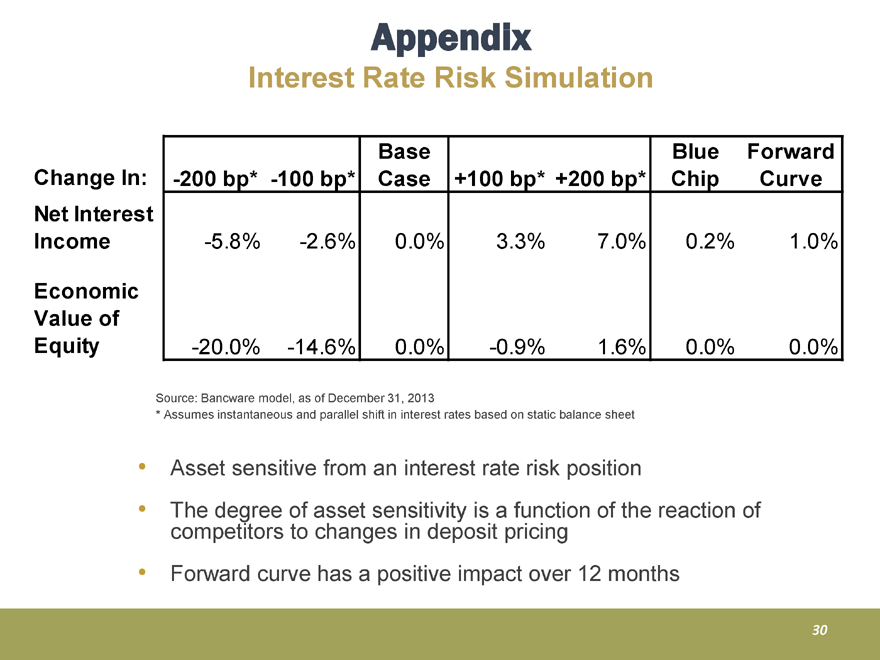
Appendix
Interest Rate Risk Simulation
Change In:
Net Interest Income
Economic Value of Equity
-200 bp* -100 bp* Base Case +100 bp* +200 bp* Blue Chip Forward Curve
-5.8% -2.6% 0.0% 3.3% 7.0% 0.2% 1.0%
-20.0% -14.6% 0.0% -0.9% 1.6% 0.0% 0.0%
Source: Bancware model, as of December 31, 2013
* Assumes instantaneous and parallel shift in interest rates based on static balance sheet
Asset sensitive from an interest rate risk position
The degree of asset sensitivity is a function of the reaction of competitors to changes in deposit pricing
Forward curve has a positive impact over 12 months
30
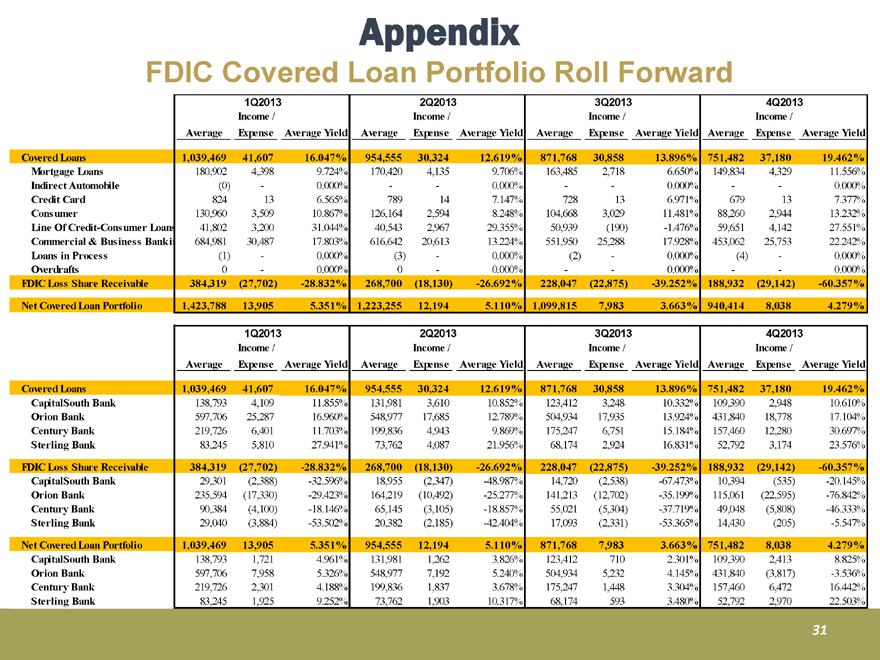
Appendix
FDIC Covered Loan Portfolio Roll Forward
1Q2013
2Q2013
3Q2013
4Q2013
Average
Income / Expense
Average Yield
Average
Income / Expense
Average Yield
Average
Income / Expense
Average Yield
Average
Income / Expense
Average Yield
Covered Loans 1,039,469 41,607 16.047% 954,555 30,324 12.619% 871,768 30,858 13.896% 751,482 37,180 19.462%
Mortgage Loans 180,902 4,398 9.724% 170,420 4,135 9.706% 163,485 2,718 6.650% 149,834 4,329 11.556%
Indirect Automobile (0) - 0.000% - - 0.000% - - 0.000% - - 0.000%
Credit Card 824 13 6.565% 789 14 7.147% 728 13 6.971% 679 13 7.377%
Consumer 130,960 3,509 10.867% 126,164 2,594 8.248% 104,668 3,029 11.481% 88,260 2,944 13.232%
Line Of Credit-Consumer Loans 41,802 3,200 31.044% 40,543 2,967 29.355% 50,939 (190) -1.476% 59,651 4,142 27.551%
Commercial & Business Banki 684,981 30,487 17.803% 616,642 20,613 13.224% 551,950 25,288 17.928% 453,062 25,753 22.242%
Loans in Process (1) - 0.000% (3) - 0.000% (2) - 0.000% (4) - 0.000%
Overdrafts 0 - 0.000% 0 - 0.000% - - 0.000% - - 0.000%
FDIC Loss Share Receivable 384,319 (27,702) -28.832% 268,700 (18,130) -26.692% 228,047 (22,875) -39.252% 188,932 (29,142) -60.357%
Net Covered Loan Portfolio 1,423,788 13,905 5.351% 1,223,255 12,194 5.110% 1,099,815 7,983 3.663% 940,414 8,038 4.279%
1Q2013
2Q2013
3Q2013
4Q2013
Average Income / Expense Average Yield Average Income / Expense Average Yield Average Income / Expense Average Yield Average Income / Expense Average Yield
Covered Loans 1,039,469 41,607 16.047% 954,555 30,324 12.619% 871,768 30,858 13.896% 751,482 37,180 19.462%
CapitalSouth Bank 138,793 4,109 11.855% 131,981 3,610 10.852% 123,412 3,248 10.332% 109,390 2,948 10.610%
Orion Bank 597,706 25,287 16.960% 548,977 17,685 12.789% 504,934 17,935 13.924% 431,840 18,778 17.104%
Century Bank 219,726 6,401 11.703% 199,836 4,943 9.869% 175,247 6,751 15.184% 157,460 12,280 30.697%
Sterling Bank 83,245 5,810 27.941% 73,762 4,087 21.956% 68,174 2,924 16.831% 52,792 3,174 23.576%
FDIC Loss Share Receivable 384,319 (27,702) -28.832% 268,700 (18,130) -26.692% 228,047 (22,875) -39.252% 188,932 (29,142) -60.357%
CapitalSouth Bank 29,301 (2,388) -32.596% 18,955 (2,347) -48.987% 14,720 (2,538) -67.473% 10,394 (535) -20.145%
Orion Bank 235,594 (17,330) -29.423% 164,219 (10,492) -25.277% 141,213 (12,702) -35.199% 115,061 (22,595) -76.842%
Century Bank 90,384 (4,100) -18.146% 65,145 (3,105) -18.857% 55,021 (5,304) -37.719% 49,048 (5,808) -46.333%
Sterling Bank 29,040 (3,884) -53.502% 20,382 (2,185) -42.404% 17,093 (2,331) -53.365% 14,430 (205) -5.547%
Net Covered Loan Portfolio 1,039,469 13,905 5.351% 954,555 12,194 5.110% 871,768 7,983 3.663% 751,482 8,038 4.279%
CapitalSouth Bank 138,793 1,721 4.961% 131,981 1,262 3.826% 123,412 710 2.301% 109,390 2,413 8.825%
Orion Bank 597,706 7,958 5.326% 548,977 7,192 5.240% 504,934 5,232 4.145% 431,840 (3,817) -3.536%
Century Bank 219,726 2,301 4.188% 199,836 1,837 3.678% 175,247 1,448 3.304% 157,460 6,472 16.442%
Sterling Bank 83,245 1,925 9.252% 73,762 1,903 10.317% 68,174 593 3.480% 52,792 2,970 22.503%
31
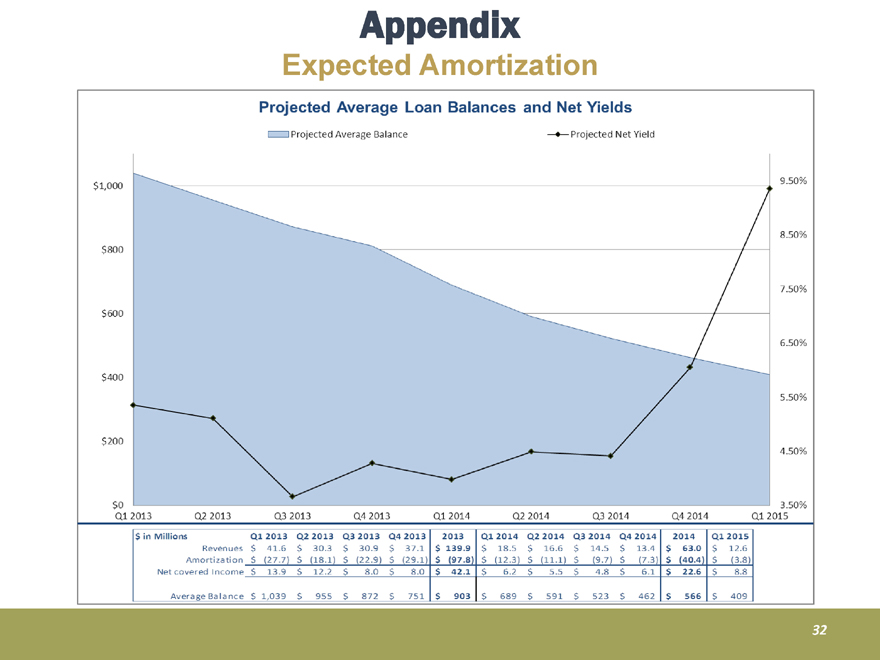
Appendix
Expected Amortization
Projected Average Loan Balances and Net Yields
Projected Average Balance
Projected Net Yield
$1,000
$800
$600
$400
$200
$0
Q1 2013 Q2 2013 Q3 2013 Q4 2013 Q1 2014 Q2 2014 Q3 2014 Q4 2014 Q1 2015
9.50%
8.50%
7.50%
6.50%
5.50%
4.50%
3.50%
$ in Millions
Q1 2013 Q2 2013 Q3 2013 Q4 2013 2013
Q1 2014 Q2 2014 Q3 2014 Q4 2014 2014 Q1 2015
Revenues
$ 41.6 $ 30.3 $ 30.9 $ 37.1 $ 139.9
$ 18.5 $ 16.6 $ 14.5 $ 13.4 $ 63.0 $ 12.6
Amortization
$ (27.7) $ (18.1) $ (22.9) $ (29.1) $ (97.8)
$ (12.3) $ (11.1) $ (9.7) $ (7.3) $ (40.4) $ (3.8)
Net covered Income
$ 13.9 $ 12.2 $ 8.0 $ 8.0 $ 42.1
$ 6.2 $ 5.5 $ 4.8 $ 6.1 $ 22.6 $ 8.8
Average Balance
$ 1,039 $ 995 $ 872 $ 751 $ 903
$ 689 $ 591 $ 523 $ 462 $ 566 $ 409
32