1Q14 Earnings Conference Call
Supplemental Presentation
April 23, 2014
Safe Harbor Language
Statements contained in this presentation which are not historical facts and which pertain to future operating results of IBERIABANK Corporation and its subsidiaries constitute “forward-looking statements” within the meaning of the Private Securities Litigation Reform Act of 1995. These forward-looking statements involve significant risks and uncertainties. Actual results may differ materially from the results discussed in these forward-looking statements. Factors that might cause such a difference include, but are not limited to, those discussed in IBERIABANK Corporation’s periodic filings with the SEC. IBERIABANK Corporation undertakes no obligation to update or reissue any forward-looking statements, whether as a result of new information, future events or otherwise. In connection with the proposed mergers with Teche Holding Company and First Private Holdings, Inc., IBERIABANK Corporation has filed Registration Statements on Form S-4 that contain a proxy statement / prospectus. INVESTORS AND SECURITY HOLDERS ARE URGED TO CAREFULLY READ THE PROXY STATEMENT / PROSPECTUS REGARDING THE PROPOSED TRANSACTIONS, BECAUSE IT CONTAINS IMPORTANT INFORMATION. Investors and security holders may obtain a free copy of the proxy statement / prospectus and other documents containing information about IBERIABANK Corporation, Teche Holding Company and First Private Holdings, Inc., without charge, at the SEC’s website at http://www.sec.gov. Copies of the proxy statement / prospectus and the SEC filings that will be incorporated by reference in the proxy statement / prospectus may also be obtained for free from the IBERIABANK Corporation website, www.iberiabank.com, under the heading “Investor Information”. This communication is not a solicitation of any vote or approval, is not an offer to purchase shares of common stock of Teche Holding Company or First Private Holdings, Inc., nor is it an offer to sell shares of IBERIABANK Corporation common stock which may be issued in either proposed merger. The issuance of IBERIABANK Corporation common stock in any proposed merger would have to be registered under the Securities Act of 1933, as amended, and such IBERIABANK Corporation common stock would be offered only by means of a prospectus complying with the Act.
Overview
Introductory Comments
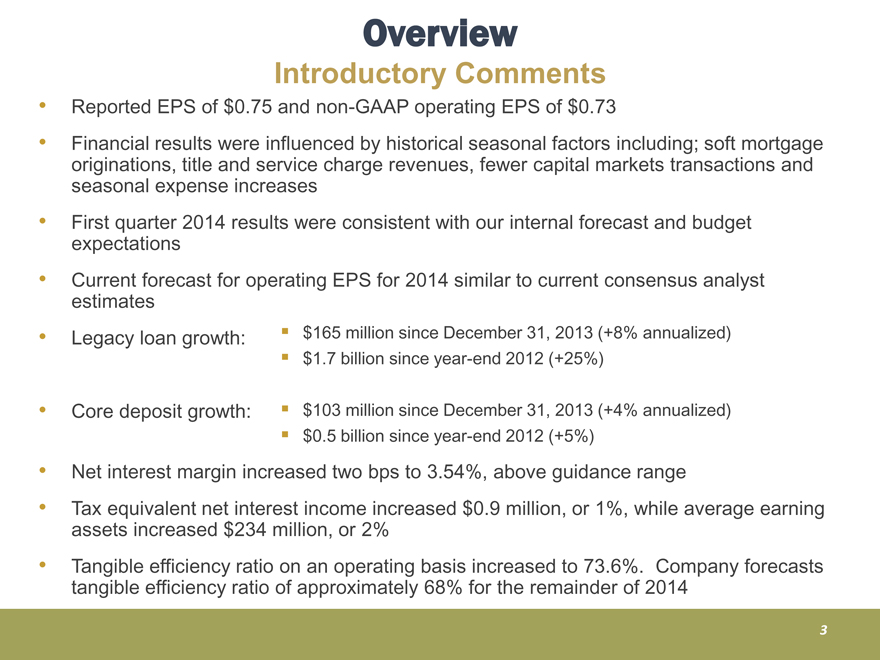
Reported EPS of $0.75 and non-GAAP operating EPS of $0.73
Financial results were influenced by historical seasonal factors including; soft mortgage originations, title and service charge revenues, fewer capital markets transactions and seasonal expense increases
First quarter 2014 results were consistent with our internal forecast and budget expectations
Current forecast for operating EPS for 2014 similar to current consensus analyst estimates
Legacy loan growth: $165 million since December 31, 2013 (+8% annualized)
$1.7 billion since year-end 2012 (+25%)
Core deposit growth:
$103 million since December 31, 2013 (+4% annualized)
$0.5 billion since year-end 2012 (+5%)
Net interest increased two bps to 3.54%, above guidance range
Tax equivalent net interest income increased $0.9 million, or 1%, while average earning assets increased $234 million, or 2%
Tangible an operating basis efficiency ratio on increased to 73.6%. Company forecasts tangible efficiency ratio of approximately 68% for the remainder of 2014
3
Overview
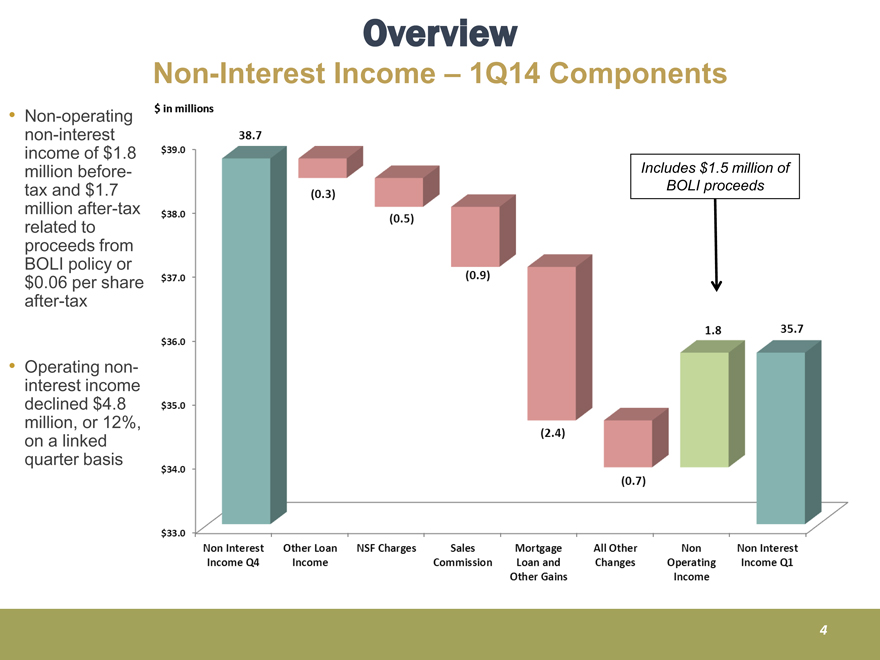
Non-Interest Income – 1Q14 Components
Non-operating non-interest income of $1.8 million before-tax and Includes $1.5 million of tax $1.7 BOLI proceeds million after-tax related to proceeds from BOLI policy or $0.06 per share after-tax
Operating non-interest income declined $4.8 million, or 12%, on a linked quarter basis
$39.0
$38.0
$37.0
$36.0
$35.0
$34.0
$33.0
38.7
(0.3)
(0.5)
(0.9)
(2.4)
(0.7)
1.8
35.7
Non Interest Income Q4
Other Loan Income
NSF Charges
Sales Commission
Mortgage Loan and Other Gains
All Other Changes Non Operating Income Non Interest Income Q1
4
Overview
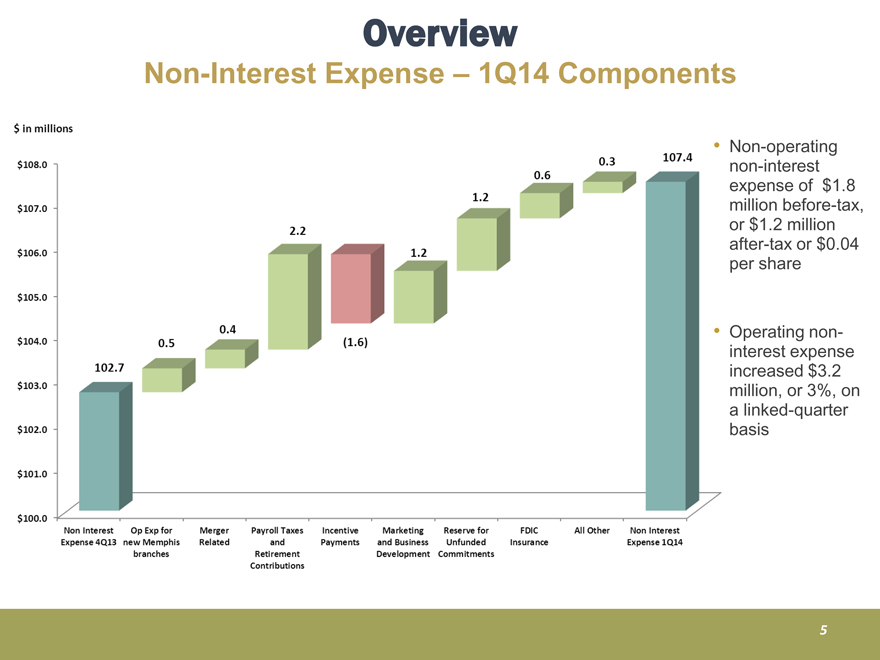
Non-Interest Expense – 1Q14 Components
Non-operating non-interest expense of $1.8 million before-tax, or $1.2 million after-tax or $0.04 per share
Operating non-interest expense increased $3.2 million, or 3%, on a linked-quarter basis
$ In millions
$108.0
$107.0
$106.0
$105.0
$104.0
$103.0
$102.0
$101.0
$100.0
102.7
0.5
0.4
2.2
(1.6)
1.2
1.2
0.6
0.3
107.4
Non interest Expenses 4Q13
Op Exp for new Memphis Branches
Merger Related
Payroll Taxes and Retirement Contributions Incentive Payment
Marketing and Business Development
Reserve for Unfunded commitments
FDIC Insurance All Other Non Interest Expense 1Q14
5
Overview
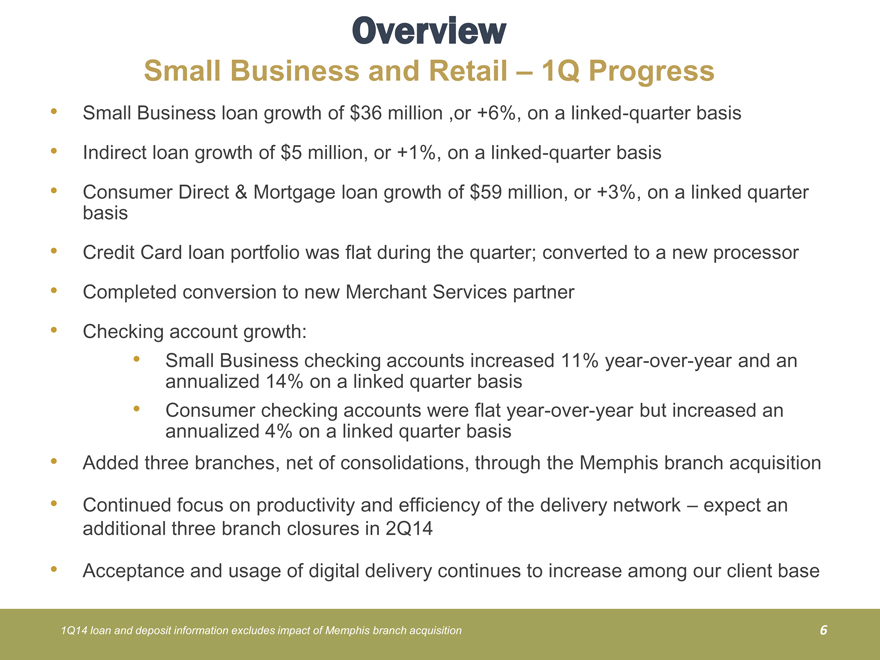
Small Business and Retail – 1Q Progress
Small Business loan growth of $36 million ,or +6%, on a linked-quarter basis
Indirect loan growth of $5 million, or +1%, on a linked-quarter basis
Consumer Direct & Mortgage loan growth of $59 million, or +3%, on a linked quarter basis
Credit Card loan portfolio was flat during the quarter; converted to a new processor
Completed conversion to new Merchant Services partner
Checking account growth:
Small Business checking accounts increased 11% year-over-year and an annualized 14% on a linked quarter basis
Consumer checking accounts were flat year-over-year but increased an annualized 4% on a linked quarter basis
Added three branches, net of consolidations, through the Memphis branch acquisition
Continued focus on productivity and efficiency of the delivery network – expect an additional three branch closures in 2Q14
Acceptance and usage of digital delivery continues to increase among our client base 1Q14 loan and deposit information excludes impact of Memphis branch acquisition
6
Overview
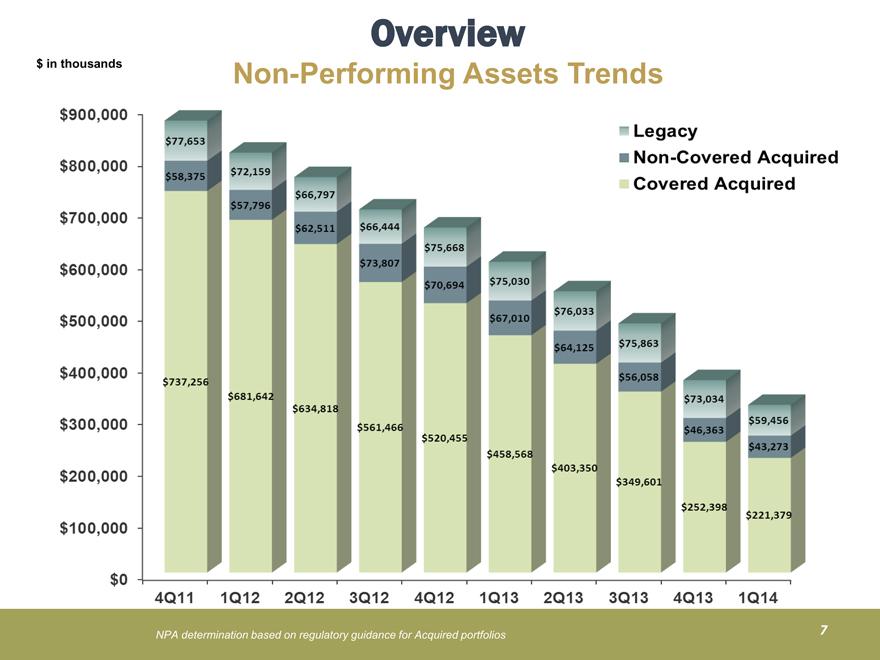
Non-Performing Assets Trends $ in thousands
NPA determination based on regulatory guidance for Acquired portfolios
$900,000
$800,000
$700,000
$600,000
$500,000
$400,000
$300,000
$200,000
$100,000
$0
4Q11
1Q12
2Q12
3Q12
4Q12
1Q13
2Q13
3Q13
4Q13
1Q14
$737,256
$681,642
$634,818
$561,466
$520,455
$458,568
$403,350
$349,601
$252,398
$221,379
$58,375
$77,653
$72,159
$57,769
$66,797
$62,511
$66,444
$73,807
$75,668
$70,694
$75,030
$67,010
$76,033
$64,125
$75,863
$56,058
$73,034
$46,363
$59,456
$43,273
Legacy Non-Covered Acquired Covered Acquired
Overview
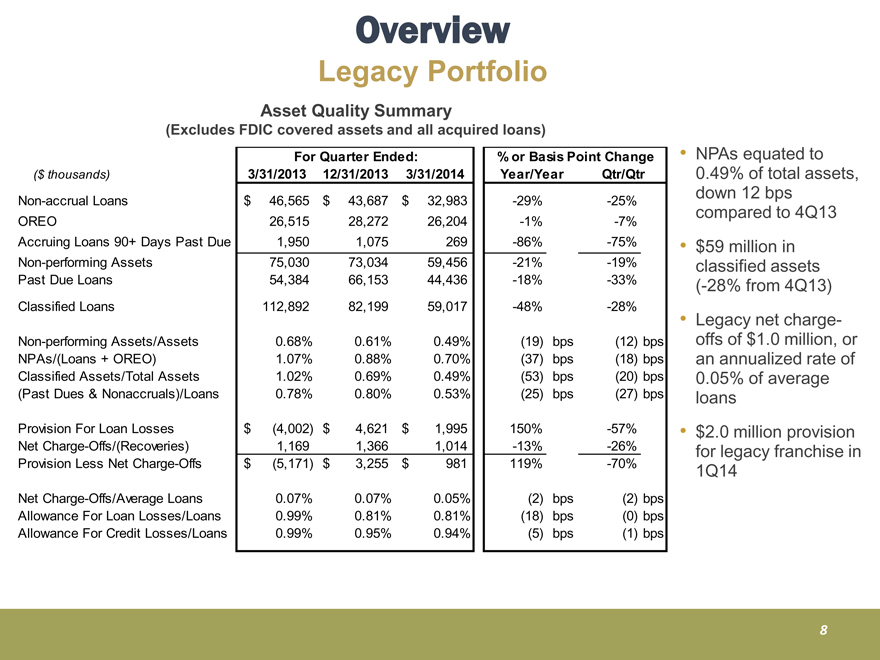
Legacy Portfolio
Asset Quality Summary
(Excludes FDIC covered assets and all acquired loans)
NPAs equated to
0.49% of total assets,
($ thousands) 3/31/2013 12/31/2013 3/31/2014
% or Basis Point Change
Year/Year Qtr/Qtr
For Quarter Ended:
down 12 bps
compared to 4Q13
$59 million in
classified assets
Non-accrual Loans $ 46,565 $ 43,687 $ 32,983 -29% -25%
OREO 26,515 28,272 26,204 -1% -7%
Accruing Loans 90+ Days Past Due 1,950 1,075 269 -86% -75%
Non-performing Assets 75,030 73,034 59,456 -21% -19%
54,384 66,153 44,436 -18% -33%
(-28% from 4Q13)
Legacy net charge-offs
of $1.0 million, or
an annualized rate of
0 05% Past Due Loans Classified Loans 112,892 82,199 59,017 -48% -28%
Non-performing Assets/Assets 0.68% 0.61% 0.49% (19) bps (12) bps
NPAs/(Loans + OREO) 1.07% 0.88% 0.70% (37) bps (18) bps
Classified 1.02% 0.69% 0.49% (53) bps (20) bps
of average
loans
$2.0 million provision
for legacy franchise in
1Q14
Assets/Total Assets 1.02% 0.69% 0.49% (Past Dues & Nonaccruals)/Loans 0.78% 0.80% 0.53% (25) bps (27) bps
Provision For Loan Losses $ (4,002) $ 4,621 $ 1,995 150% -57%
Net Charge-Offs/(Recoveries) 1,169 1,366 1,014 -13% -26%
Provision Less Net Charge-Offs $ (5,171) $ 3,255 $ 981 119% -70% Net Charge-Offs/Average Loans 0.07% 0.07% 0.05% (2) bps (2) bps
Allowance For Loan Losses/Loans 0.99% 0.81% 0.81% (18) bps (0) bps
Allowance For Credit Losses/Loans 0.99% 0.95% 0.94% (5) bps (1) bps
8
Overview
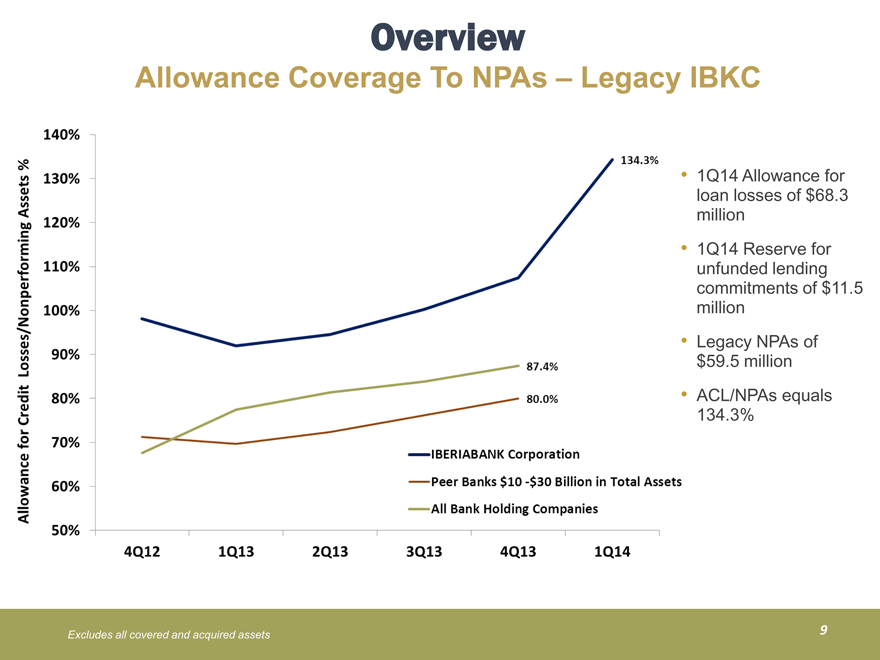
Allowance Coverage To NPAs – Legacy IBKC
1Q14 Allowance for loan losses of $68.3 million
1Q14 Reserve for unfunded lending commitments of $11.5 million
Legacy NPAs of $59.5 million
ACL/NPAs equals 134.3% Excludes all covered and acquired assets
140%
130%
120%
110%
100%
134.3%
90%
80%
70%
60%
50%
4Q12
1Q13
2Q13
3Q13
4Q13
1Q14
87.4%
80.0%
IBERIABANK Corporation Peer Banks $10-$30 Billion In Total Assets
All Bank Holding Companies
9
Seasonal
Influences
10
Seasonal Influences
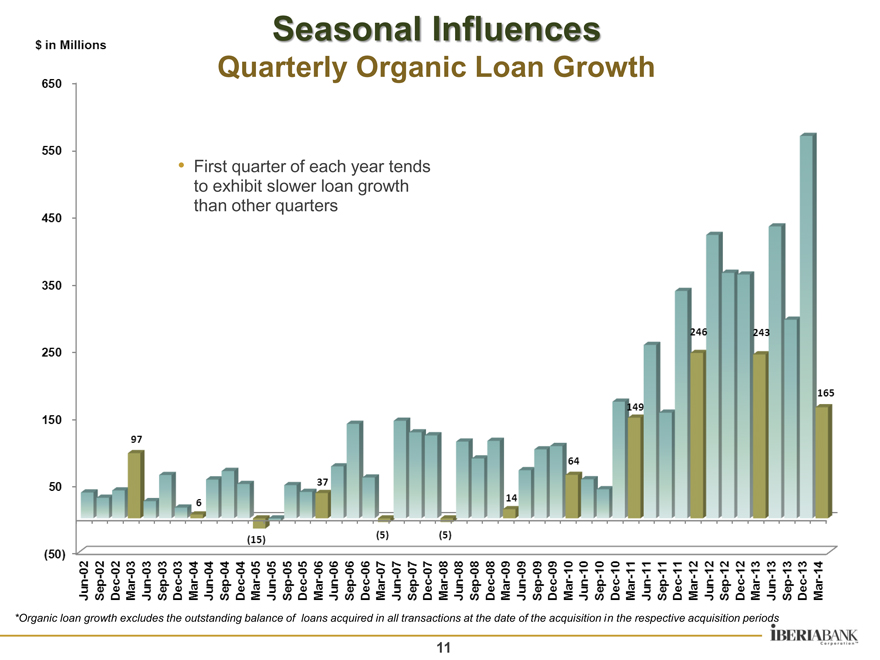
Quarterly Organic Loan Growth
First quarter of each year tends to exhibit slower loan growth than other quarters
$ In Millions
650 550 450 350 250 150 50 (50)
Jun-02 Sep-02 Dec-02 Mar-03 Jun-03 Sep-03 Dec-03 Mar-04 Jun-04 Sep-04 Dec-04 Mar-05 Jun-05 Sep-05 Dec-05 Mar-06 Jun-06 Sep-06 Dec-06 Mar-07 Jun-07 Sep-07 Dec-07 Mar-08 Jun-08 Sep-08 Dec-08 Mar-09 Jun-09 Sep-09 Dec-09 Mar-10 Jun-10 Sep-10 Dec-10 Mar-11 Jun-11 Sep-11 Dec-11 Mar-12 Jun-12 Sep-12 Dec-12 Mar-13 Jun-13 Sep-13 Dec-13 Mar-14
97 6 37 14 64 149 246 243 165 (15) (5) (5)
*Organic loan growth excludes the outstanding balance of loans acquired in all transactions at the date of the acquisition in the respective acquisition periods
11
Seasonal Influences
Quarterly Organic Core Deposit Growth
$ in Millions
1,000 900 800 700 600 500 400 300 200 100 -
(100) 23 91 48 61 56 126 207 322 184 333 14 102
Jun-02 Sep-02 Dec-02 Mar-03 Jun-03 Sep-03 Dec-03 Mar-04 Jun-04 Sep-04 Dec-04 Mar-05 Jun-05 Sep-05 Dec-05 Mar-06 Jun-06 Sep-06 Dec-06 Mar-07 Jun-07 Sep-07 Dec-07 Mar-08 Jun-08 Sep-08 Dec-08 Mar-09 Jun-09 Sep-09 Dec-09 Mar-10 Jun-10 Sep-10 Dec-10 Mar-11 Jun-11 Sep-11 Dec-11 Mar-12 Jun-12 Sep-12 Dec-12 Mar-13 Jun-13 Sep-13 Dec-13 Mar-14
Core deposits are defined as total deposits less time deposits
Organic growth excludes the impact of acquired core deposits in all transactions at the date of the acquisition in the respective acquisition periods
12
Seasonal Influences
Mortgage Income
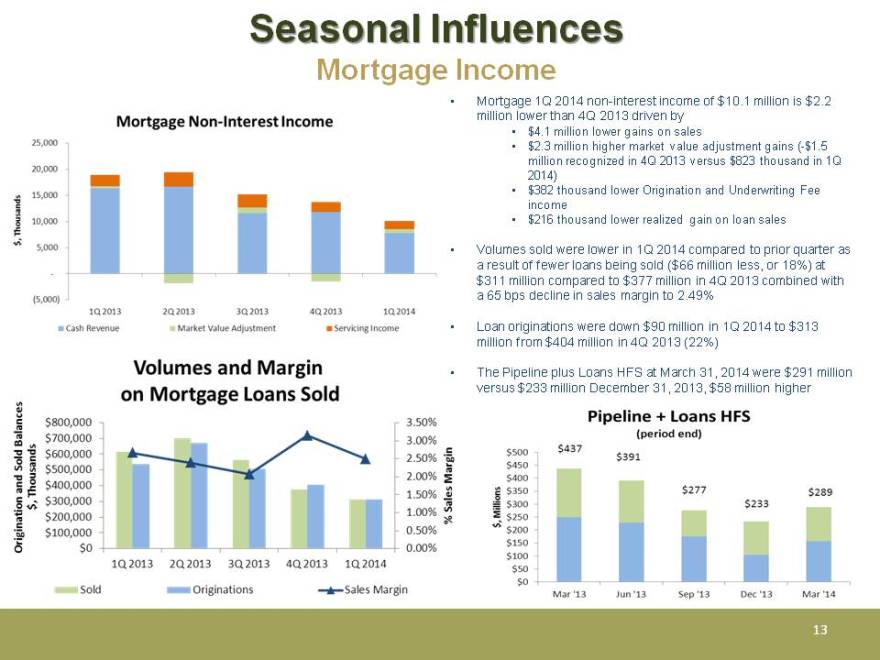
Mortgage 1Q 2014 non-interest income of $10.1 million is $2.2 million lower than 4Q 2013 driven by
$4.1 million lower gains on sales
$2.3 million higher market value adjustment gains (-$1.5 million recognized in 4Q 2013 versus $823 thousand in 1Q 2014)
$382 thousand lower Origination and Underwriting Fee income
$216 thousand lower realized gain on loan sales
Volumes sold were lower in 1Q 2014 compared to prior quarter as a result of fewer loans being sold ($66 million less, or 18%) at $311 million compared to $377 million in 4Q 2013 combined with a 65 bps decline in sales margin to 2.49%
Loan originations were down $90 million in 1Q 2014 to $313 million from $404 million in 4Q 2013 (22%)
The Pipeline plus Loans HFS at March 31, 2014 were $291 million versus $233 million December 31, 2013, $58 million higher
13
Seasonal Influences
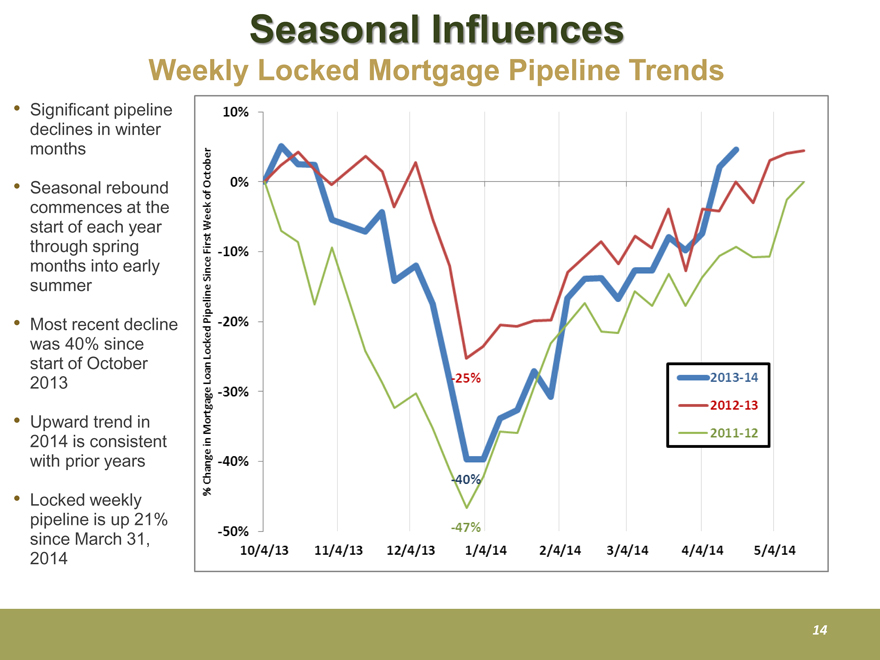
Weekly Locked Mortgage Pipeline Trends
Significant pipeline declines in winter months
Seasonal rebound commences at the start of each year through spring months into early summer
Most recent decline was 40% since start of October 2013
Upward trend in 2014 is consistent with prior years
Locked weekly pipeline is up 21% since March 31, 2014
10% 0% -10% -20% -30% -40% -50%
10/4/13 11/4/13 12/4/13 1/4/14 2/4/14 3/4/14 4/4/14 5/4/14
-25% -40% -47%
% Change in Mortgage Loan Locked Pipeline Since First Week of October
2013-14 2012-13 2011-12
14
Seasonal Influences
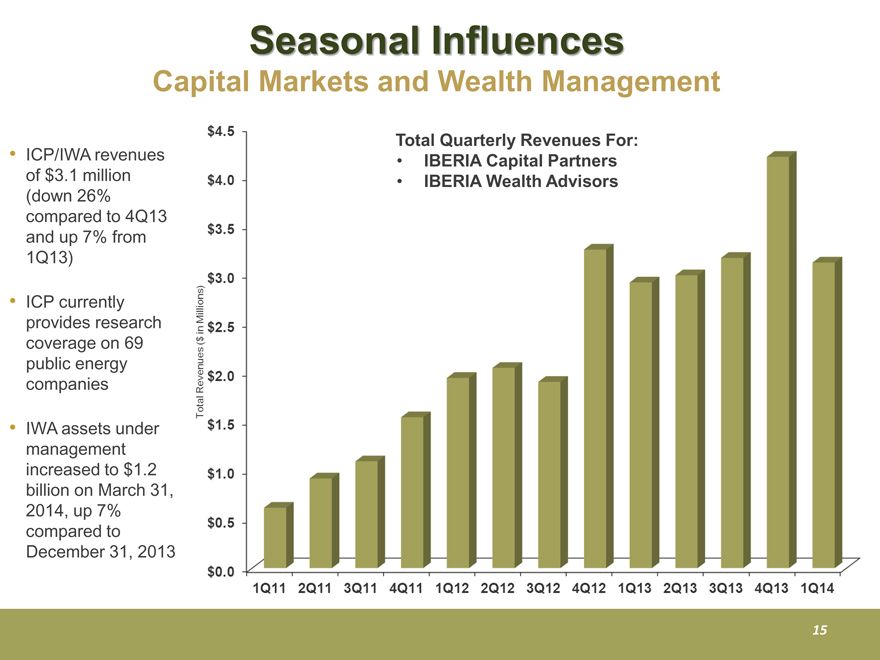
Capital Markets and Wealth Management
ICP/IWA revenues of $3.1 million Total Quarterly Revenues For:
$4.5 $4.0 $3.5 $3.0 $2.5 $2.0 $1.5 $1.0 $0.5 $0.0
1Q11 2Q11 3Q11 4Q11 1Q12 2Q12 3Q12 4Q12 1Q13 2Q13 3Q13 4Q13 1Q14
Total Revenues ($ in Millions)
IBERIA Capital Partners
IBERIA Wealth Advisors (down 26% compared to 4Q13 and up 7% from 1Q13)
ICP currently provides research coverage on 69 public energy companies
IWA assets under management increased to $1.2 billion on March 31, 2014, up 7% compared to December 31, 2013
15
Seasonal Influences
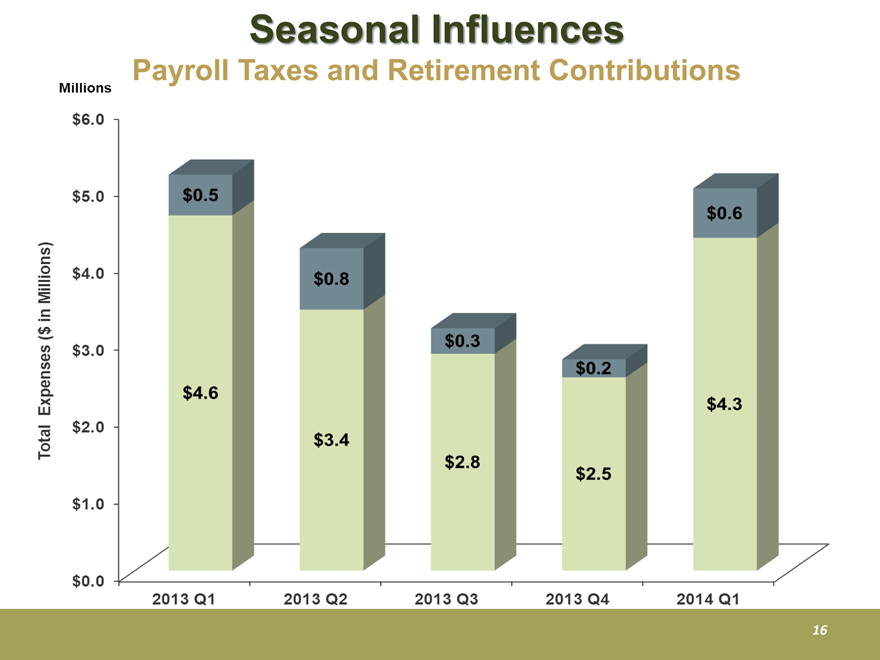
Payroll Taxes and Retirement Contributions
Millions $6.0 $5.0 $4.0 $3.0 $2.0 $1.0 $0.0
2013Q1 2013Q2 2013Q3 2013Q4 2014Q1
$4.6 $3.4 $2.8 $2.5 $4.3
$0.5 $0.8 $0.3 $0.2 $0.6
Total Expenses ($ in Millions)
16
Seasonal Influences
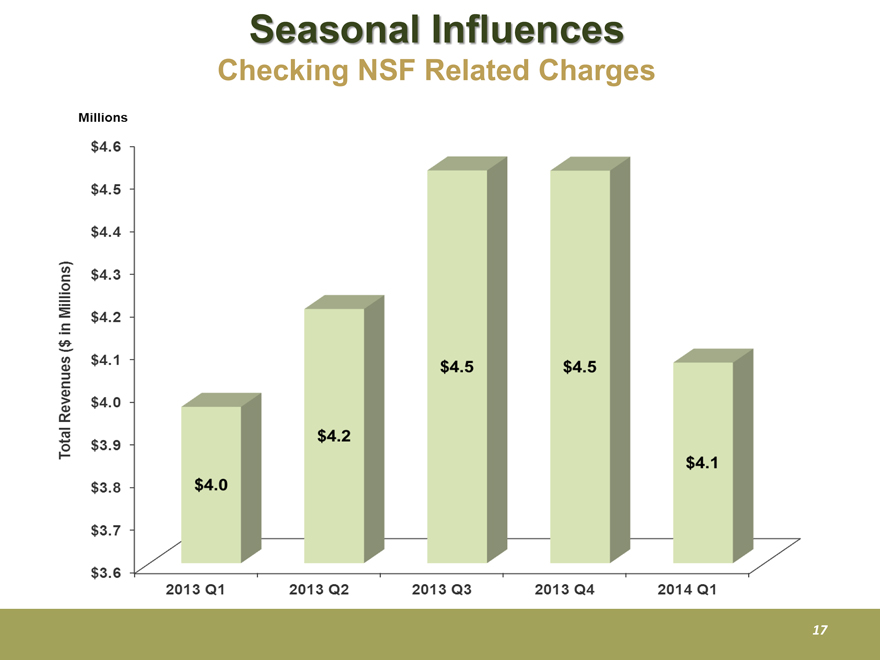
Checking NSF Related Charges
Millions $4.6 $4.5 $4.4 $4.3 $4.2 $4.1 $4.0 $3.9 $3.8 $3.7 $3.6
2013Q1 2013Q2 2013Q3 2013Q4 2014Q1
$4.0 $4.2 $4.5 $4.5 $4.1
Total Revenues ($ in Millions)
17
Acquisition
Updates
18
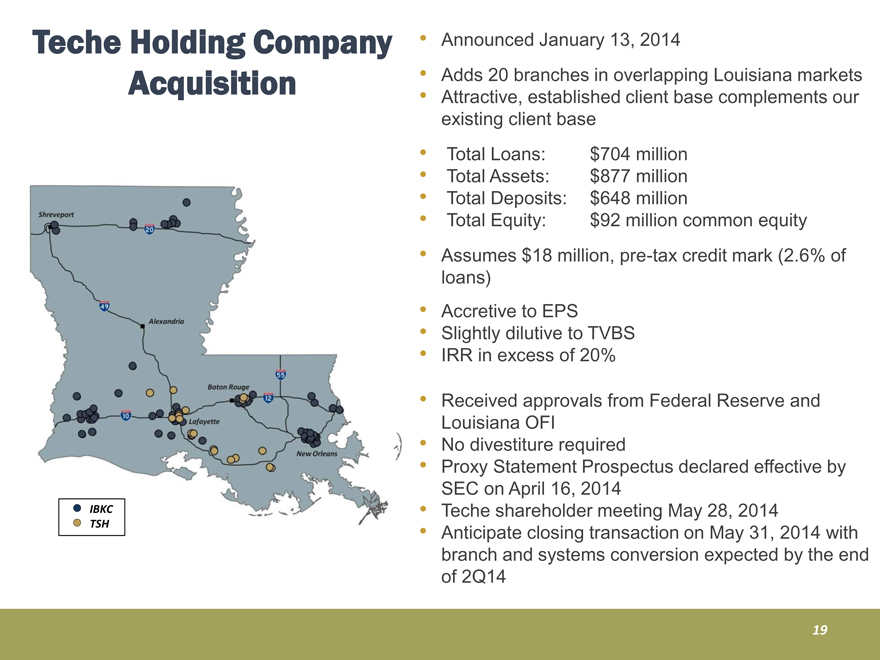
Teche Holding Company Acquisition
Announced January 13, 2014
Adds 20 branches in overlapping Louisiana markets
established Teche Holding Company Acquisition Attractive, client base complements our existing client base
Total Loans: $704 million
Total Assets: $877 million
Total Deposits: $648 million
Total Equity: $92 million common equity
Assumes $18 million, pre-tax credit mark (2.6% of loans)
Accretive to EPS
Slightly dilutive to TVBS
IRR in excess of 20%
Received approvals from Federal Reserve and Louisiana OFI
No divestiture required
Proxy Statement Prospectus declared effective by SEC on April 16, 2014
Teche shareholder meeting May 28, 2014
Anticipate closing transaction on May 31, 2014 with branch and systems conversion expected by the end of 2Q14
IBKC
TSH
19
First Private
Announced February 11, 2014
banking Dallas First Private Holdings, Inc.
Acquisition New market acquisition of Dallas, Texas private bank
Adds two locations with established and complementary customer profile 2500 Dallas Parkway Dallas, $42.7 million
Total Loans: $257 million
Total Assets: $357 million
Total Deposits: $318 million
Total Equity: $33 million common equity
Assumes $4 million, pre-tax credit mark (1.5% of loans)
Slightly dilutive to 2015 EPS, 2% accretive in 2016
Slightly accretive to TVBS 0.1%
IRR in excess of 20%
Filed regulatory applications 8201 Preston Rd. Dallas, TX $262.5 million
Filed Proxy Statement Prospectus with SEC on March 28, 2014
Anticipate closing transaction on June 30, 2014
Plano Carrollton Farmers Branch
20
Appendix
21
Appendix
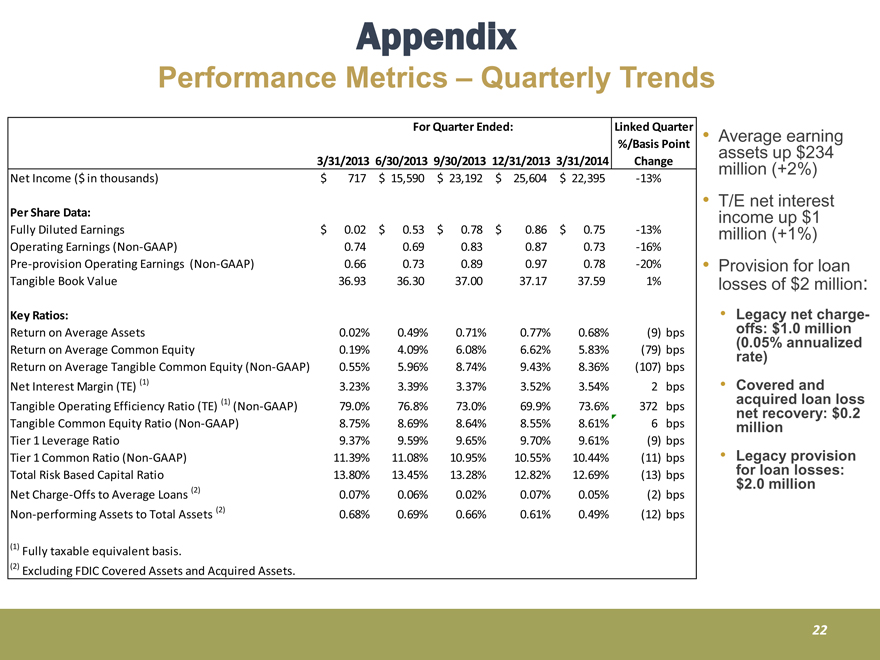
Performance Metrics – Quarterly Trends
Average earning assets up $234 million (+2%) 3/31/2013 6/30/2013 9/30/2013 12/31/2013 3/31/2014
Net Income ($ in thousands) $ 717 $ 15,590 $ 23,192 $ 25,604 $ 22,395 -13%
Linked Quarter
Change
%/Basis Point
For Quarter Ended:
T/E net interest
income up $1
million (+1%)
Provision for loan
million:
Per Share Data:
Fully Diluted Earnings $ 0 .02 $ 0 .53 $ 0 .78 $ 0.86 $ 0 .75 -13%
Operating Earnings (Non-GAAP) 0.74 0.69 0.83 0.87 0.73 -16%
Pre-provision Operating Earnings (Non-GAAP) 0.66 0.73 0.89 0.97 0.78 -20%
Tangible 36.93 36.30 37.00 37.17 37.59 1%
losses of $2
• Legacy net charge-offs:
$1.0 million
(0.05% annualized
rate)
Book Value 36.93 36.30 37.00 37.17 37.59 1% Key Ratios:
Return on Average Assets 0.02% 0.49% 0.71% 0.77% 0.68% (9) bps
Return on Average Common Equity 0.19% 4.09% 6.08% 6.62% 5.83% (79) bps
Return on Average Tangible Common Equity (Non-GAAP) 0.55% 5.96% 8.74% 9.43% 8.36% (107) bps
Covered and
acquired loan loss
net recovery: $0.2
million
Legacy provision
losses:
Net Interest Margin (TE) (1) 3.23% 3.39% 3.37% 3.52% 3.54% 2 bps
Tangible Operating Efficiency Ratio (TE) (1) (Non-GAAP) 79.0% 76.8% 73.0% 69.9% 73.6% 372 bps
Tangible Common Equity Ratio (Non-GAAP) 8.75% 8.69% 8.64% 8.55% 8.61% 6 bps
Tier 1 Leverage Ratio 9.37% 9.59% 9.65% 9.70% 9.61% (9) bps
Tier 1 Common Ratio (Non-GAAP) 11.39% 11.08% 10.95% 10.55% 10.44% (11) bps
(13) b for loan $2.0 million Total Risk Based Capital Ratio 13.80% 13.45% 13.28% 12.82% 12.69% bps
Net Charge-Offs to Average Loans (2) 0.07% 0.06% 0.02% 0.07% 0.05% (2) bps
Non-performing Assets to Total Assets (2) 0.68% 0.69% 0.66% 0.61% 0.49% (12) bps
(1) Fully taxable equivalent basis.
(2) Excluding FDIC Covered Assets and Acquired Assets.
22
Appendix
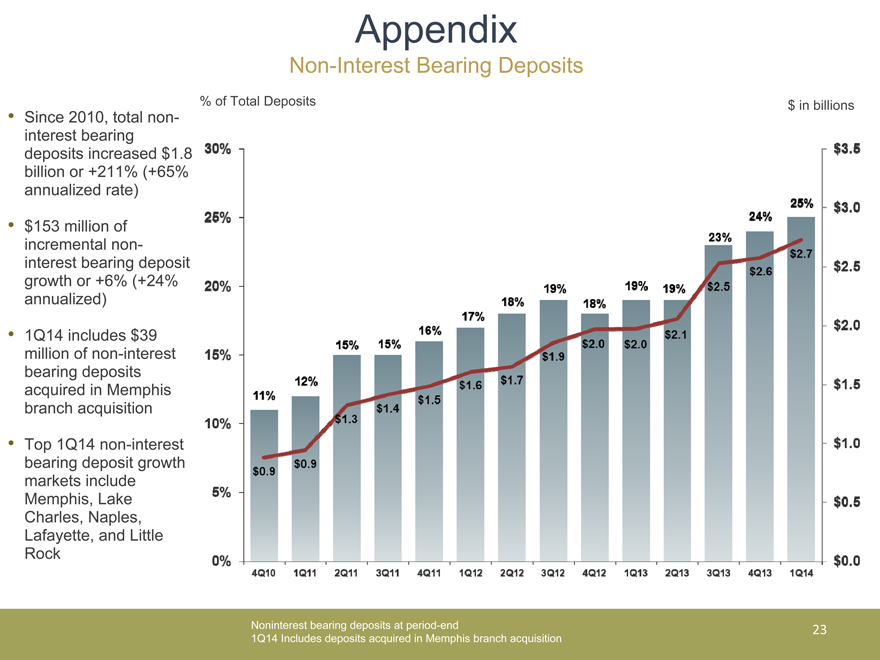
Non-Interest Bearing Deposits
% of Total Deposits
Since 2010, total non-interest bearing deposits increased $1.8 billion or +211% (+65% annualized rate)
$153 million of incremental non-interest bearing deposit growth or +6% (+24% annualized)
1Q14 includes $39 million of non-interest bearing deposits acquired in Memphis branch acquisition
Top 1Q14 non-interest bearing deposit growth markets include Memphis, Lake Charles, Naples, Lafayette, and Little Rock
$ in billions
Noninterest bearing deposits at period-end
1Q14 Includes deposits acquired in Memphis branch acquisition
23
Appendix
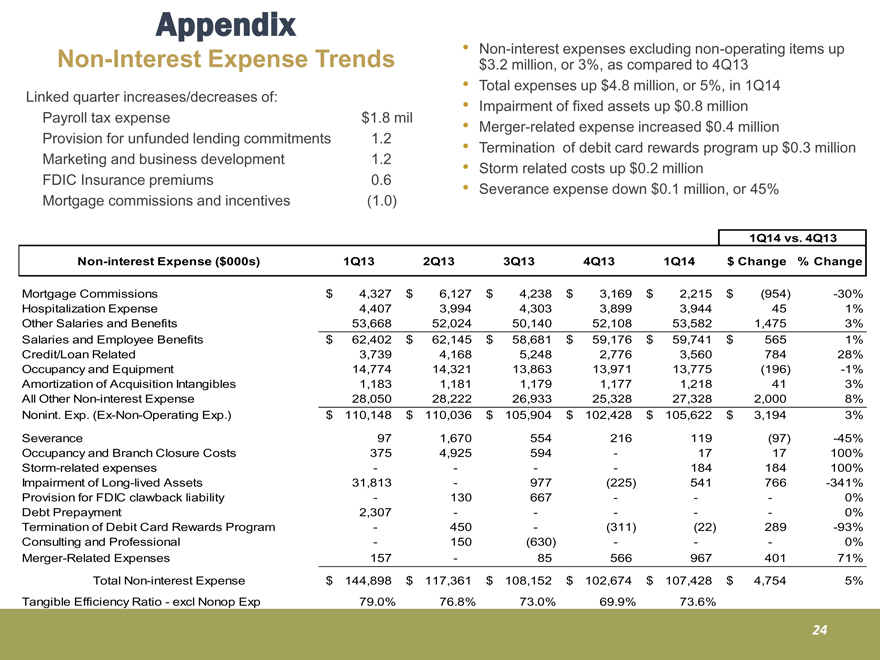
Non-Interest Expense Trends • Non-interest expenses excluding non-operating items up
$3.2 million, or 3%, as compared to 4Q13
• | | Total expenses up $4.8 million, or 5%, in 1Q14 Linked Impairment of fixed assets up $0.8 million |
• | | Merger-related expense increased $0.4 million |
• | | Termination of debit card rewards program up $0.3 million |
• | | Storm related costs up $0.2 million |
• | | 0.1 million quarter increases/decreases of: Payroll tax expense $1.8 mil Provision for unfunded lending commitments 1.2 Marketing and business development 1.2 FDIC Insurance premiums 0.6 Severance expense down $0.1 million, or 45% Mortgage commissions and incentives (1.0) |
Non-interest Expense ($000s) 1Q13 2Q13 3Q13 4Q13 1Q14 $ Change % Change
1Q14 vs. 4Q13
Mortgage Commissions $4,327 $ 6,127 $ 4,238 $ 3,169 $ 2,215 $ (954) -30%
Hospitalization Expense 4,407 3,994 4,303 3,899 3,944 4 5 1%
Other Salaries and Benefits 5 3,668 52,024 50,140 52,108 53,582 1,475 3%
Salaries and Employee Benefits $ 62,402 $ 62,145 $ 58,681 $ 59,176 $ 59,741 $ 565 1%
Credit/Loan Related 3,739 4,168 5,248 2,776 3,560 784 28%
Occupancy and Equipment 1 4,774 14,321 13,863 13,971 13,775 (196) -1%
Amortization of Acquisition Intangibles 1,183 1,181 1,179 1,177 1,218 4 1 3%
All Other Non-interest Expense 2 8,050 28,222 26,933 25,328 27,328 2,000 8%
Nonint. Exp. (Ex-Non-Operating Exp.) $ 110,148 $ 110,036 $ 105,904 $ 102,428 $ 105,622 $ 3,194 3%
Severance 97 1,670 554 216 119 (97) -45%
Occupancy and Branch Closure Costs 375 4,925 594—17 17 100%
Storm-related expenses — — 184 184 100%
Impairment of Long-lived Assets 3 1,813—977 (225) 541 766 -341%
Provision for FDIC clawback liability—130 667 ——0%
Debt Prepayment 2,307 — ——0%
Termination of Debit Card Rewards Program—450—(311) (22) 289 -93%
Consulting and Professional—150 (630) ——0%
Merger-Related Expenses 157—85 566 967 401 71%
Total Non-interest Expense $ 144,898 $ 117,361 $ 108,152 $ 102,674 $ 107,428 $ 4,754 5%
Tangible Efficiency Ratio—excl Nonop Exp 79.0% 76.8% 73.0% 69.9% 73.6%
24
Appendix
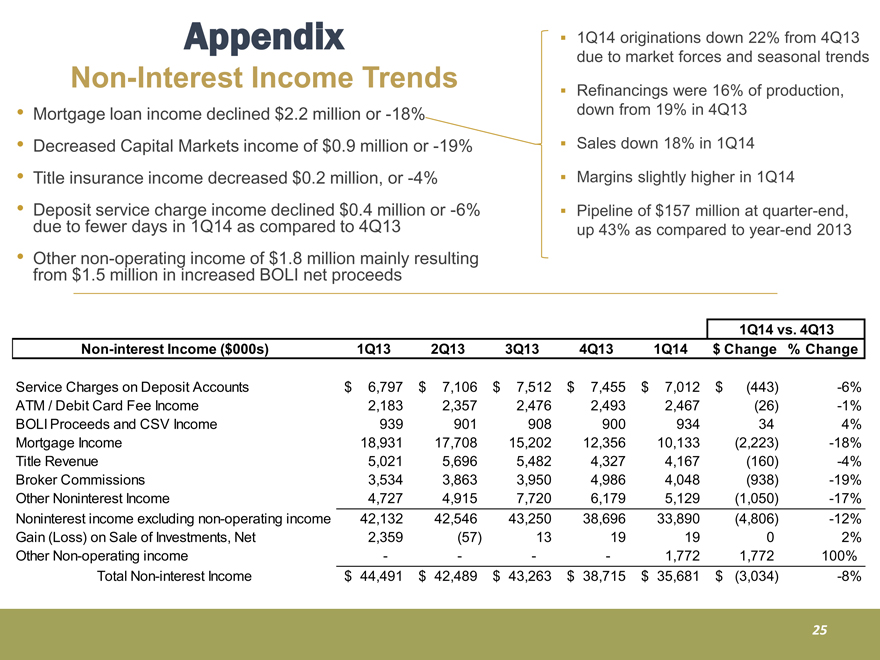
Non-Interest Income Trends
1Q14 originations down 22% from 4Q13
due to market forces and seasonal trends
Refinancings were • Mortgage loan income declined $2.2 million or -18%
Decreased Capital Markets income of $0.9 million or -19%
Title insurance income decreased $0.2 million, or -4%
16% of production,
down from 19% in 4Q13
Sales down 18% in 1Q14
Margins slightly higher in 1Q14
Deposit service charge income declined $0.4 million or -6%
due to fewer days in 1Q14 as compared to 4Q13
Other non-operating income of $1.8 million mainly resulting
from $1.5 million in increased BOLI net proceeds
Pipeline of $157 million at quarter-end,
up 43% as compared to year-end 2013
Non-interest Income ($000s) 1Q13 2Q13 3Q13 4Q13 1Q14 $ Change % Change
1Q14 vs. 4Q13
Service Charges on Deposit Accounts 6,79$ 7 $ 7,106 $ 7,512 $ 7,455 $ 7,012 $ (443) -6%
ATM / Debit Card Fee Income 2,183 2,357 2,476 2,493 2,467 ( 26) -1%
BOLI Proceeds and CSV Income 9 39 901 908 900 934 34 4%
Mortgage Income 18,931 17,708 15,202 12,356 10,133 (2,223) -18%
Title Revenue 5,021 5,696 5,482 4,327 4,167 (160) -4%
Broker Commissions 3,534 3,863 3,950 4,986 4,048 (938) -19%
Other Noninterest Income 4,727 4,915 7,720 6,179 5,129 (1,050) -17%
Noninterest income excluding non-operating income 42,132 42,546 43,250 38,696 33,890 (4,806) -12%
Gain (Loss) on Sale of Investments, Net 2,359 ( 57) 13 19 19 0 2%
Other Non-operating income — — 1,772 1,772 100%
Total Non-interest Income $ 44,491 $ 42,489 $ 43,263 $ 38,715 $ 35,681 $ (3,034) -8%
25
Appendix
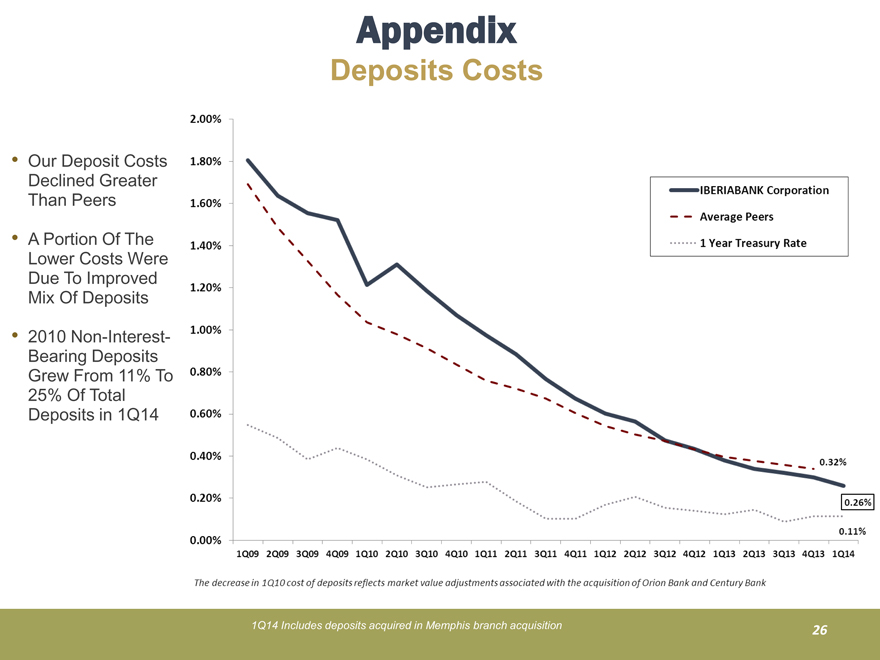
Deposits Costs
• | | Our Deposit Costs Declined Greater Than Peers |
• | | A Portion Of The Lower Costs Were Due To Improved Mix Of Deposits |
• | | 2010 Non-Interest- Bearing Deposits Grew From 11% To 25% Of Total Deposits in 1Q14 1Q14 Includes deposits acquired in Memphis branch acquisition |
IBERIABANK Corporation
Average Peers
1 Year Treasury Rate
2.00% 1.80% 1.60% 1.40% 1.20% 1.00% 0.80% 0.60% 0.40% 0.20% 0.00%
1Q09 2Q09 3Q09 4Q09 1Q10 2Q10 3Q10 4Q10 1Q11 2Q11 3Q11 4Q11 1Q12 2Q12 3Q12 4Q12 1Q13 2Q13 3Q13 4Q13 1Q14
0.11% 0.26% 0.32%
The decrease in 1Q10 cost of deposits reflects market value adjustments associated with the acquisition of Orion Bank and Century Bank
26
Appendix
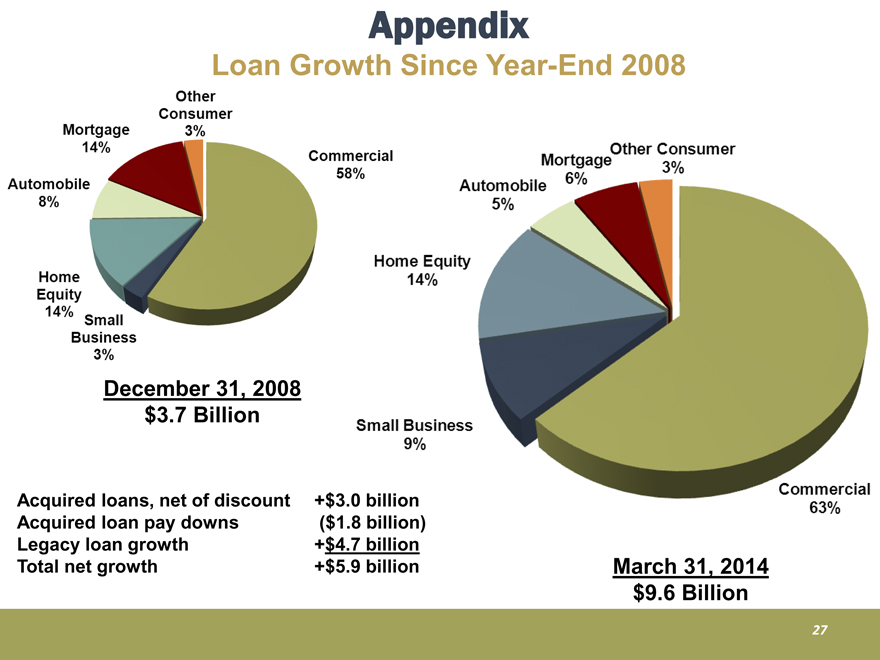
Loan Growth Since Year-End 2008
December 31, 2008
$3.7 Billion
March 31 Acquired loans, net of discount +$3.0 billion
Acquired loan pay downs ($1.8 billion)
Legacy loan growth +$4.7 billion
Total net growth
, 2014
$9.6 Billion
+$5.9 billion
Other Consumer Mortgage 14% Automobile 8% Home Equity 14% Small Business 3% Commercial 58% Home Equity 14%
Automobile 5% Mortgage 6% Other Consumer 3% Commercial 63%
27
Appendix
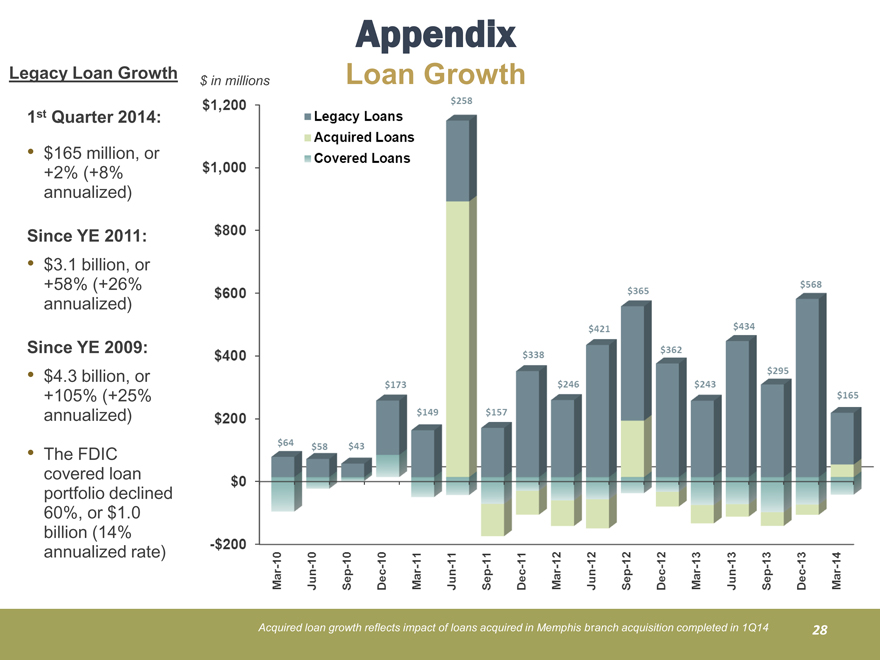
Legacy Loan Growth $ in millions Loan Growth
1st Quarter 2014:
+2% (+8%
annualized)
Since YE 2011:
+58% (+26%
annualized)
Since YE 2009:
+105% (+25%
annualized)
loan portfolio
declined 60%, or
$1.0 billion (14%
annualized rate)
Legacy Loans
Acquired Loans
Covered Loans
$ in millions
$1,200 $1,00 $800 $600 $400 $200 $0 -$200
Mar-10 Jun-10 Sep-10 Dec-10 Mar-11 Jun-11 Sep-11 Dec-11 Mar-12 Jun-12 Sep-12 Dec-12 Mar-13 Jun-13 Sep-13 Dec-13 Mar-14
$64 $58 $43 $173 $149 $258 $157 $338 $246 $421 $365 $362 $243 $434 $295 $568 $165
Acquired loan growth reflects impact of loans acquired in Memphis branch acquisition completed in 1Q14 28
Appendix
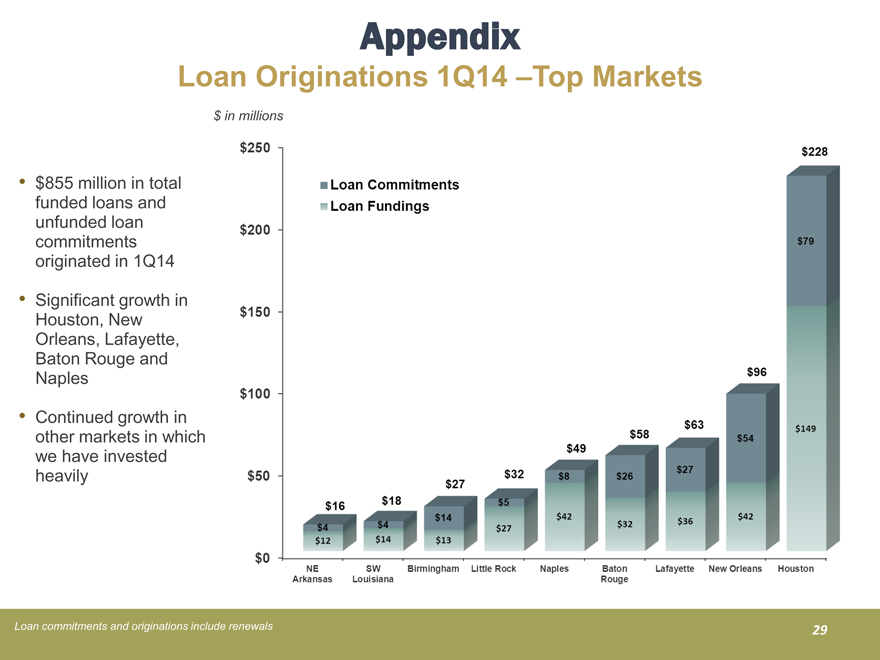
Loan Originations 1Q14 –Top Markets
$ in millions
funded loans and
unfunded loan
commitments
originated in 1Q14
Houston, New
Orleans, Lafayette,
Baton Rouge and
Naples
• | | Continued growth in other markets in which we have invested heavily |
Loan Commitments
Loan Fundings
$250 $200 $150 $100 $50 0
$16 $18 $27 $32 $49 $58 $63 $96 $228
$4 $4 $14 $5 $8 $26 $27 $54 $79
$12 $14 $13 $27 $42 $32 $36 $42 $149
NE Arkansas SW Louisiana Birmingham Little Rock Naples Baton Rouge Lafayette New Orleans Houston
Loan commitments and originations include renewals
29
Appendix
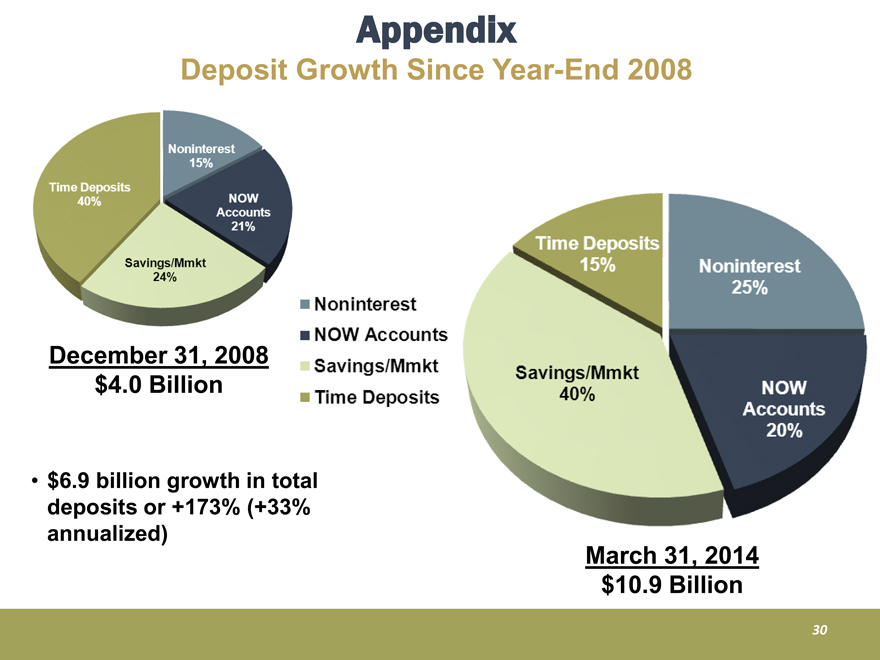
Deposit Growth Since Year-End 2008
December 31, 2008
$4 4.0 Billion
$
March 31, 2014
• | | 6.9 billion growth in total |
deposits or +173% (+33%
annualized)
$10.9 Billion
Time Deposits 40% Noninterest 15% Savings/Mmkt 24% Time Deposits 15% Noninterest 25% Now Accounts 20% Savings/Mmkt 40%
Noninterest
Now Accounts
Savings/Mmkt
Time Deposits
30
Appendix
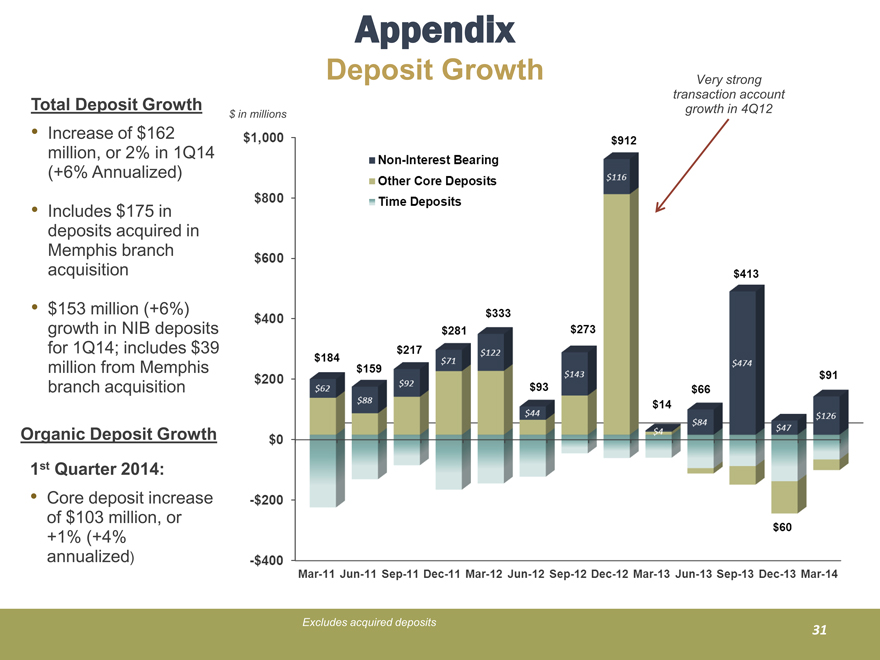
Deposit Growth Very strong
$ in millions
Increase of $162
million, or 2% in 1Q14
(+6% Annualized)
Total Deposit Growth transaction account
growth in 4Q12
Includes $175 in
deposits acquired in
Memphis branch
acquisition
$153 million (+6%)
growth in NIB deposits
for 1Q14; includes $39
million from Memphis
$1,000 $800 $600 $400 $200 $0 -$200 $400
Mar-11 Jun-11 Sep-11 Dec-11 Mar-12 Jun-12 Sep-12 Dec-12 Mar-13 Jun-13 Sep-13 Dec-13 Mar-14
$184 $62 $159 $88 $217 $92 $281 $71 $333 $122 $93 $44 $273 $143 $912 $116 $14 $4 $66 $84 $413 $474 $47 $91 $126 $60
Non-Interest Bearing Other Core Deposits Time Deposits
Organic Deposit Growth
1st Quarter 2014:
branch acquisition
1 • Core deposit increase
of $103 million, or
+1% (+4%
annualized)
Excludes acquired deposits
31
Appendix
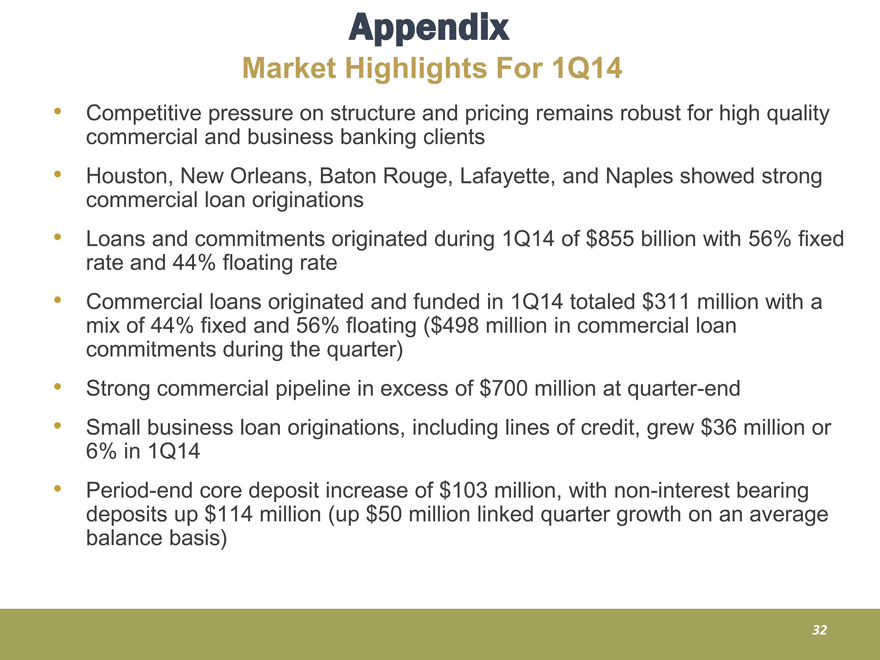
Market Highlights For 1Q14
Competitive pressure on structure and pricing remains robust for high quality commercial and business banking clients
Houston, New Orleans, Baton Rouge, Lafayette, and Naples showed strong commercial loan originations
Loans and commitments originated during 1Q14 of $855 billion with 56% fixed rate and 44% floating rate
Commercial loans originated and funded in 1Q14 totaled $311 million with a mix of 44% fixed and 56% floating ($498 million in commercial loan commitments during the quarter)
Strong commercial pipeline in excess of $700 million at quarter-end
Small business loan originations, including lines of credit, grew $36 million or 6% in 1Q14
Period-end core deposit increase of $103 million, with non-interest bearing deposits up $114 million (up $50 million linked quarter growth on an average balance basis)
32
Appendix
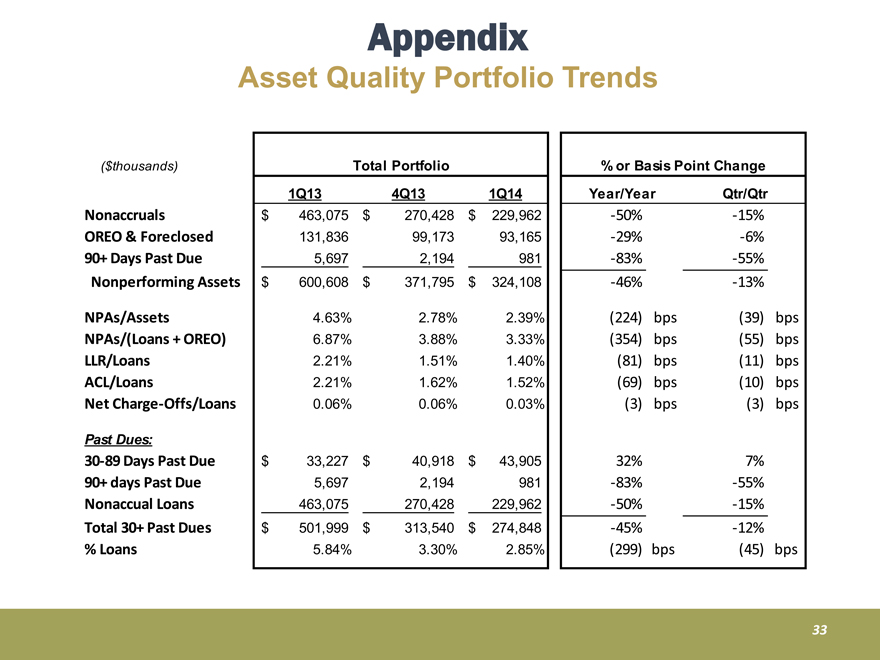
Asset Quality Portfolio Trends
($thousands)
1Q14 1Q13 4Q13
% or Basis Point Change
Total Portfolio
Nonaccruals $ 4 63,075 $ 2 70,428 $ 229,962 -50% -15%
OREO & Foreclosed 131,836 99,173 93,165 -29% -6%
90+ Days Past Due 5,697 2,194 981 -83% -55%
Assets $ 600 608 $ 371 795 $ 324 108 -46% -13%
Year/Year Qtr/Qtr
NPAs/Assets 4.63% 2.78% 2.39% (224) bps ( 39) bps
NPAs/(Loans + OREO) 6.87% 3.88% 3.33% (354) bps ( 55) bps
LLR/Loans 2.21% 1.51% 1.40% (81) bps ( 11) bps
ACL/Loans 2.21% 1.62% 1.52% (69) bps (10) bps
Net Charge-Offs/Loans 0.06% 0.06% 0.03% (3) bps ( 3) bps
Past Dues:
30-89 Days Past Due $ 33,227 $ 40,918 $ 43,905 32% 7%
90+ days Past Due 5,697 2,194 981 -83% -55%
Nonaccual Loans 463,075 270,428 229,962 -50% -15%
Total 30+ Past Dues $ 5 01,999 $ 3 13,540 $ 274,848 -45% -12%
% Loans 5.84% 3.30% 2.85% (299) bps ( 45) bps
33
Appendix
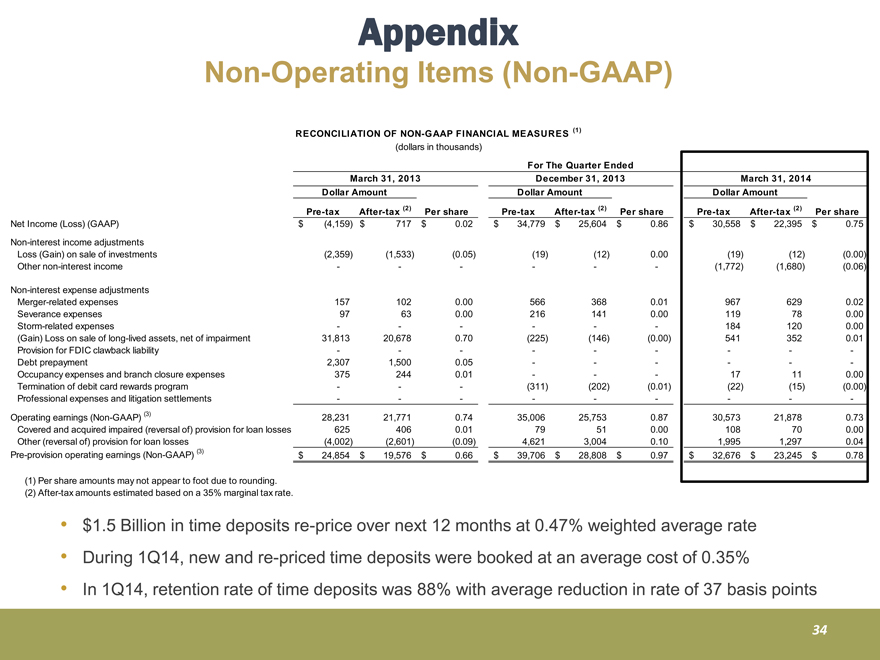
Non-Operating Items (Non-GAAP)
RECONCILIATION OF NON-GAAP FINANCIAL MEASURES (1)
(dollars in thousands)
For The Quarter Ended
March 31, 2013 December 31, 2013 March 31, 2014
D ll A t D ll A t D ll A t
Pre-tax After-tax (2) Per share Pre-tax After-tax (2) Per share Pre-tax After-tax (2) Per share
Net Income (Loss) (GAAP) (4,159$ ) $ 717 $ 0.02 $ 34,779 $ 25,604 $ 0.86 $ 30,558 $ 22,395 $ 0.75
Non-interest income adjustments
Loss (Gain) on sale of investments (2,359) (1,533) (0.05) (19) (12) 0.00 (19) (12) (0.00)
Other non-interest income — — — (1,772) (1,680) (0.06)
Dollar Amount Dollar Amount Dollar Amount
Non-interest expense adjustments
Merger-related expenses 157 102 0.00 566 368 0.01 967 629 0.02
Severance expenses 9 7 63 0.00 216 141 0.00 119 7 8 0.00
Storm-related expenses — — — 184 120 0.00
(Gain) Loss on sale of long-lived assets, net of impairment 31,813 20,678 0.70 (225) (146) (0.00) 541 352 0.01
Provision for FDIC clawback liability — — — ——
Debt prepayment 2,307 1,500 0.05 — — —
Occupancy expenses and branch closure expenses 375 244 0.01 ——17 11 0.00
Termination of debit card rewards program ——(311) (202) (0.01) (22) (15) (0.00)
Professional expenses and litigation settlements — — — ——
Operating earnings (Non-GAAP) (3) 28,231 21,771 0.74 35,006 25,753 0.87 30,573 21,878 0.73
Covered and acquired impaired (reversal of) provision for loan losses 625 406 0.01 7 9 51 0.00 108 7 0 0.00
Other (reversal of) provision for loan losses (4,002) (2,601) (0.09) 4,621 3,004 0.10 1,995 1,297 0.04
Pre-provision operating earnings (Non-GAAP) (3) $ 2 4,854 $ 19,576 $ 0.66 $ 39,706 $ 28,808 $ 0.97 $ 32,676 $ 23,245 $ 0.78
(1) Per share amounts may not appear to foot due to rounding.
(2) After-tax amounts estimated based on a 35% marginal tax rate.
$1.5 Billion in time deposits re-price over next 12 months at 0.47% weighted average rate
During 1Q14, new and re-priced time deposits were booked at an average cost of 0.35%
In 1Q14, retention rate of time deposits was 88% with average reduction in rate of 37 basis points
34
Appendix
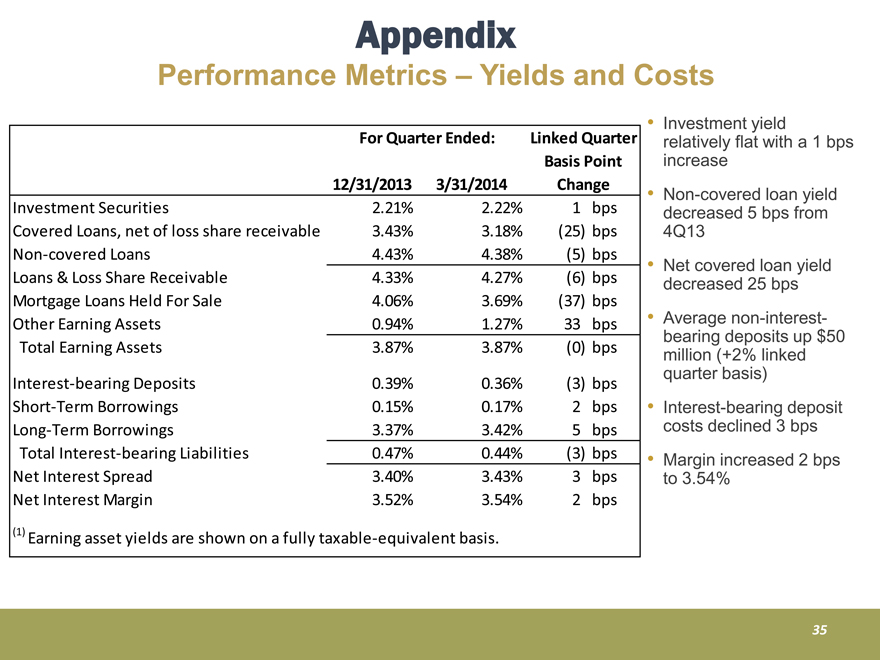
Performance Metrics – Yields and Costs
Investment yield
relatively flat with a 1 bps
increase
12/31/2013 3/31/2014
Linked Quarter
Change
For Quarter Ended:
Basis Point
Non-covered loan yield
decreased 5 bps from
4Q13
Net covered loan yield
decreased 25bps Investment Securities 2.21% 2.22% 1 bps
Covered Loans, net of loss share receivable 3.43% 3.18% (25) bps
Non-covered Loans 4.43% 4.38% ( 5) bps
4.33% 4.27% (6) bps
bps
Average non-interest-bearing
deposits up $50
million (+2% linked
quarter basis Loans & Loss Share Receivable Mortgage Loans Held For Sale 4.06% 3.69% (37) bps
Other Earning Assets 0.94% 1.27% 33 bps
Total Earning Assets 3.87% 3.87% ( 0) bps
Interest-bearing deposit
costs declined 3 bps
Margin increased 2 bps
Interest-bearing Deposits 0.39% 0.36% (3) bps
Short-Term Borrowings 0.15% 0.17% 2 bps
Long-Term Borrowings 3.37% 3.42% 5 bps
Total Interest-bearing Liabilities 0.47% 0.44% ( 3) bps
Net Interest Spread 3.40% 3.43% 3 bps to 3.54%
Net Interest Margin 3.52% 3.54% 2 bps
(1) Earning asset yields are shown on a fully taxable-equivalent basis.
35
Appendix
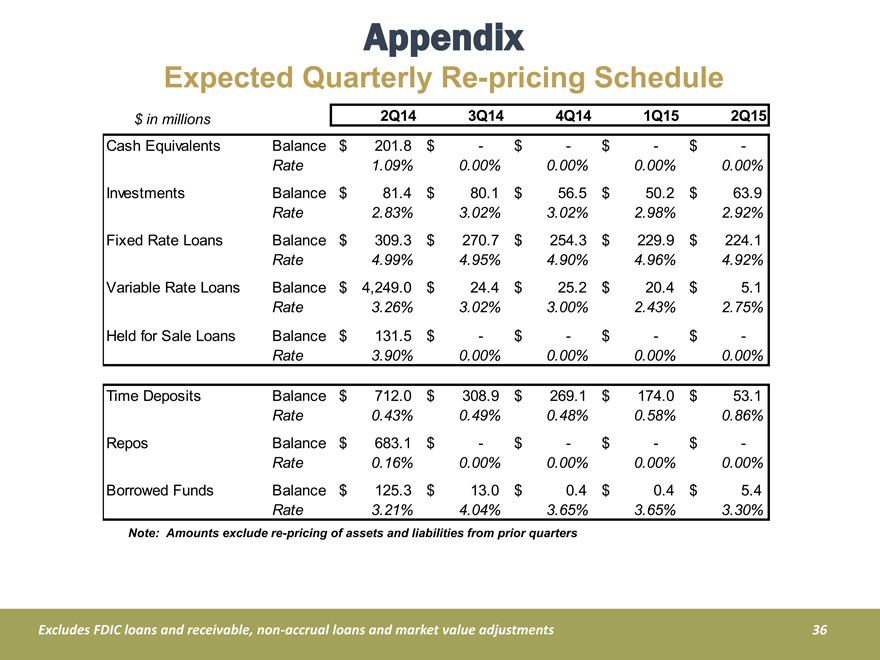
Expected Quarterly Re-pricing Schedule
$ in millions 2Q14 3Q14 4Q14 1Q15 2Q15
Cash Equivalents Balance $ 201.8 $—$—$—$—
Rate 1.09% 0.00% 0.00% 0.00% 0.00%
Investments Balance $ 81.4 $ 80.1 $ 56.5 $ 50.2 $ 63.9
Rate 2.83% 3.02% 3.02% 2.98% 2.92%
Fixed Rate Loans Balance $ 309.3 $ 270.7 $ 254.3 $ 229.9 $ 224.1
Rate 4.99% 4.95% 4.90% 4.96% 4.92%
Variable Rate Loans Balance $ 4,249.0 $ 24.4 $ 25.2 $ 20.4 $ 5.1
Rate 3.26% 3.02% 3.00% 2.43% 2.75%
Held for Sale Loans Balance $ 131.5 $—$—$—$—
Rate 3.90% 0.00% 0.00% 0.00% 0.00%
Time Deposits Balance $ 712.0 $ 308.9 $ 269.1 $ 174.0 $ 53.1
Rate 0.43% 0.49% 0.48% 0.58% 0.86%
Repos Balance $ 683.1 $—$—$—$—
Rate 0.16% 0.00% 0.00% 0.00% 0.00%
Note: Amounts exclude re-pricing of assets and liabilities from prior quarters
Borrowed Funds Balance $ 125.3 $ 13.0 $ 0.4 $ 0.4 $ 5.4
Rate 3.21% 4.04% 3.65% 3.65% 3.30%
Excludes FDIC loans and receivable, non-accrual loans and market value adjustments
36
Appendix
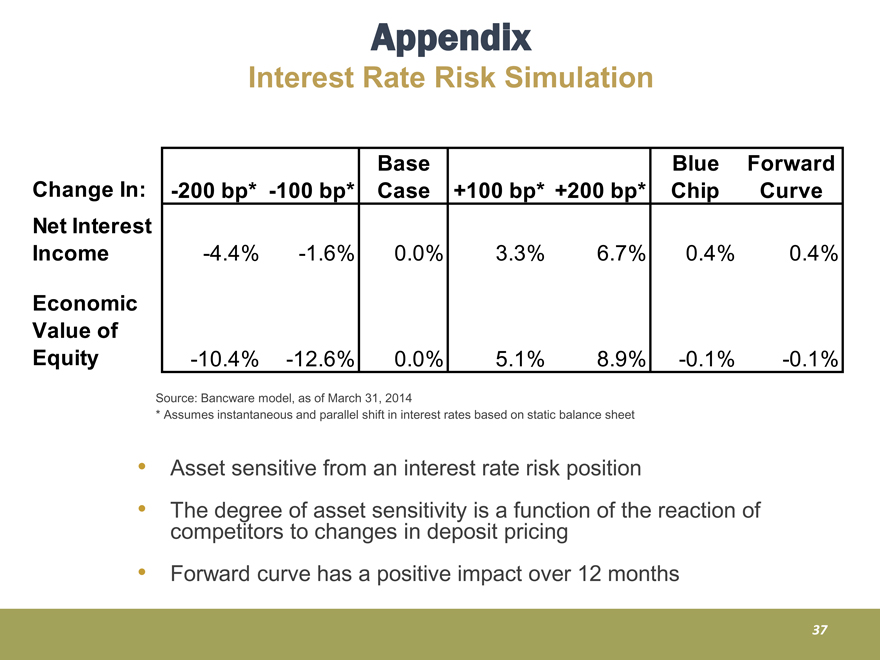
Interest Rate Risk Simulation
Base Blue Forward
Change In: -200 bp* -100 bp* Case +100 bp* +200 bp* Chip Curv
Net Interest
Income -4.4% -1.6% 0.0% 3.3% 6.7% 0.4% 0.4%
Economic
Value of
Equity -10.4% -12.6% 0.0% 5.1% 8.9% -0.1% -0.1%
Source: Bancware model, as of March 31, 2014
* Assumes instantaneous and parallel shift in interest rates based on static balance sheet
Asset sensitive from an interest rate risk position
The degree of asset sensitivity is a function of the reaction of competitors to changes in deposit pricing
Forward curve has a positive impact over 12 months
37
Financial
Assumptions
And Impact Of
Pending
Acquisitions
38
Appendix
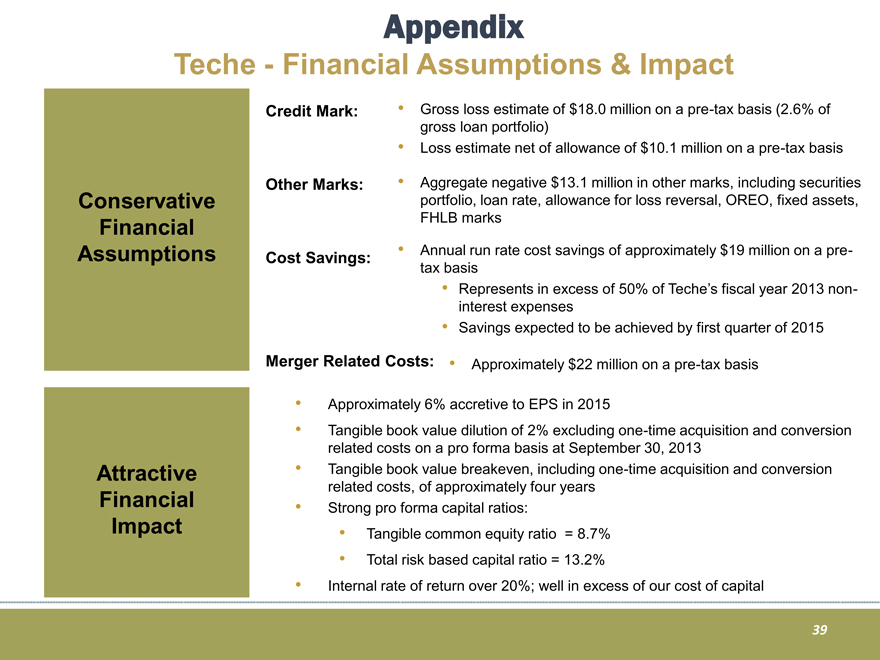
Teche—Financial Assumptions & Impact
Gross loss estimate of $18.0 million on a pre-tax basis (2.6% of gross loan portfolio)
Loss estimate net of allowance of $10.1 million on a pre-tax basis
Aggregate negative $ 13.1 million in other marks, including securities
Credit Mark:
Conservative
Financial
Assumptions
Other Marks:
Cost Savings:
portfolio, loan rate, allowance for loss reversal, OREO, fixed assets,
FHLB marks
Annual run rate cost savings of approximately $19 million on a pre-tax
basis
Merger Related Costs:
Represents in excess of 50% of Teche’s fiscal year 2013 non-interest
expenses
Savings expected to be achieved by first quarter of 2015
Approximately $22 million on a pre-tax basis
Approximately 6% accretive to EPS in 2015
Tangible book value dilution of 2% excluding one-time acquisition and conversion
related costs on a pro forma basis at September 30, 2013
Tangible book value breakeven one
breakeven, including one-time acquisition and conversion
related costs, of approximately four years
Strong pro forma capital ratios:
Tangible common equity ratio = 8.7%
Total risk based capital ratio = 13.2%
Attractive Financial
Impact
Internal rate of return over 20%; well in excess of our cost of capital
39
Appendix
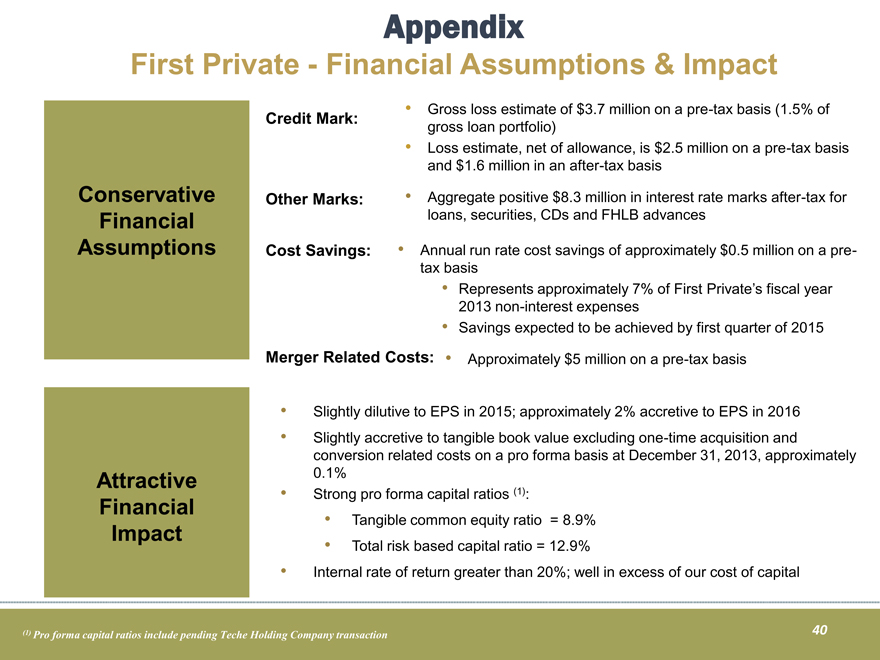
First Private—Financial Assumptions & Impact
Credit Mark: Gross loss estimate of $3.7 million on a pre-tax basis (1.5% of
gross loan portfolio)
Loss estimate, net of allowance, is $2.5 million on a pre-tax basis
and $1.6 million in an after-tax basis
Conservative
Financial
Assumptions
Other Marks:
Cost Savings: Annual run rate cost savings of approximately $0.5 million on a pre-tax
basis
Aggregate positive $8.3 million in interest rate marks after-tax for
loans, securities, CDs and FHLB advances
Merger Related Costs:
Represents approximately 7% of First Private’s fiscal year
2013 non-interest expenses
Savings expected to be achieved by first quarter of 2015
Approximately $5 million on a pre-tax basis
Slightly dilutive to EPS in 2015; approximately 2% accretive to EPS in 2016
Slightly accretive to tangible book value excluding one-time acquisition and
conversion related costs on a pro forma basis at December 31, 2013, approximately
Attractive 0.1%
Financial
Impact
Strong pro forma capital ratios (1):
Tangible common equity ratio = 8.9%
Total risk based capital ratio = 12.9%
Internal rate of return greater than 20%; well in excess of our cost of capital
(1) Pro forma capital ratios include pending Teche Holding Company transaction
40
Appendix
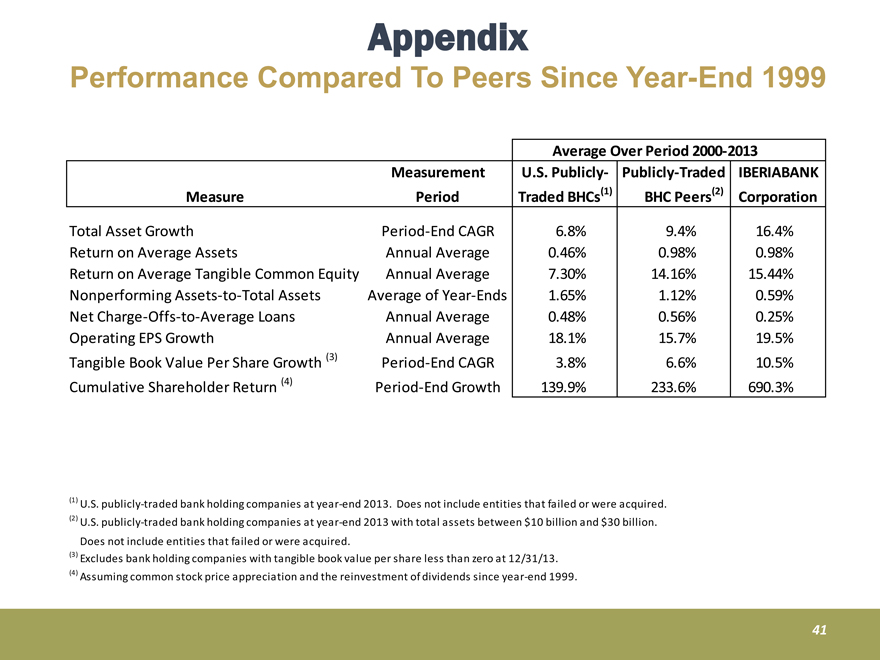
Performance Compared To Peers Since Year-End 1999
Measurement
Average Over Period 2000-2013
(2)
U.S. Publicly-
(1)
Publicly-Traded IBERIABANK
Measure Period
Total Asset Growth Period-End CAGR 6.8% 9.4% 16.4%
Return on Average Assets Annual Average 0.46% 0.98% 0.98%
Return on Average Tangible Common Equity Annual Average 7.30% 14.16% 15.44%
BHC PeersTraded BHCsCorporation
Nonperforming Assets-to-Total Assets Average of Year-Ends 1.65% 1.12% 0.59%
Net Charge-Offs-to-Average Loans Annual Average 0.48% 0.56% 0.25%
Operating EPS Growth Annual Average 18.1% 15.7% 19.5%
Tangible Book Value Per Share Growth (3) Period-End CAGR 3.8% 6.6% 10.5%
) Cumulative Shareholder Return 4) Period-End Growth 139.9% 233.6% 690.3%
(1) U.S. publicly-traded bank holding companies at year-end 2013. Does not include entities that failed or were acquired.
(2) U.S. publicly-traded bank holding companies at year-end 2013 with total assets between $10 billion and $30 billion.
Does not include entities that failed or were acquired.
(3) Excludes bank holding companies with tangible book value per share less than zero at 12/31/13.
(4) Assuming common stock price appreciation and the reinvestment of dividends since year-end 1999.
41
Appendix
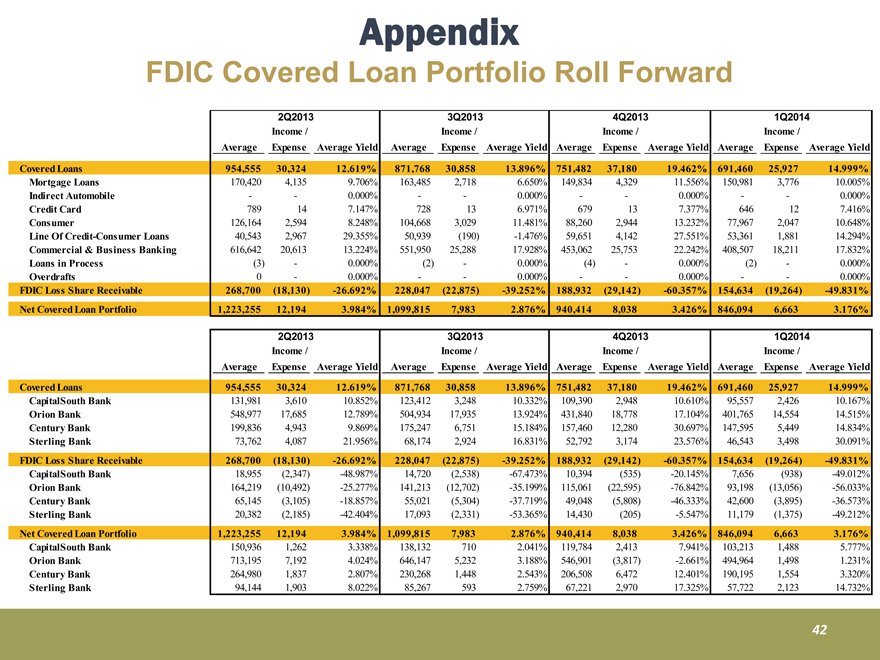
FDIC Covered Loan Portfolio Roll Forward
2Q2013 3Q2013 4Q2013 1Q2014
Income / Income / Income / Income /
Average Expense Average Yield Average Expense Average Yield Average Expense Average Yield Average Expense Average Yield
Covered Loans 954,555 30,324 12.619% 871,768 30,858 13.896% 751,482 37,180 19.462% 691,460 25,927 14.999%
Mortgage Loans 170,420 4,135 9.706% 163,485 2,718 6.650% 149,834 4,329 11.556% 150,981 3,776 10.005%
Indirect Automobile - - 0.000% - - 0.000% - - 0.000% - - 0.000%
Credit Card 789 14 7.147% 728 13 6.971% 679 13 7.377% 646 12 7.416%
Consumer 126,164 2,594 8.248% 104,668 3,029 11.481% 88,260 2,944 13.232% 77,967 2,047 10.648%
Line Of Credit-Consumer Loans 40,543 2,967 29.355% 50,939 (190) -1.476% 59,651 4,142 27.551% 53,361 1,881 14.294%
Commercial & Business Banking 616,642 20,613 13.224% 551,950 25,288 17.928% 453,062 25,753 22.242% 408,507 18,211 17.832%
Loans in Process (3) - 0.000% (2) - 0.000% (4) - 0.000% (2) - 0.000%
Overdrafts 0 - 0.000% - - 0.000% - - 0.000% - - 0.000%
FDIC Loss Share Receivable 268,700 (18,130) -26.692% 228,047 (22,875) -39.252% 188,932 (29,142) -60.357% 154,634 (19,264) -49.831%
Net Covered Loan Portfolio 1,223,255 12,194 3.984% 1,099,815 7,983 2.876% 940,414 8,038 3.426% 846,094 6,663 3.176%
2Q2013 3Q2013 4Q2013 1Q2014
Income / Income / Income / Income /
Average Expense Average Yield Average Expense Average Yield Average Expense Average Yield Average Expense Average Yield
Covered Loans 954,555 30,324 12.619% 871,768 30,858 13.896% 751,482 37,180 19.462% 691,460 25,927 14.999%
CapitalSouth Bank 131,981 3,610 10.852% 123,412 3,248 10.332% 109,390 2,948 10.610% 95,557 2,426 10.167%
Orion Bank 548,977 17,685 12.789% 504,934 17,935 13.924% 431,840 18,778 17.104% 401,765 14,554 14.515%
Century Bank 199,836 4,943 9.869% 175,247 6,751 15.184% 157,460 12,280 30.697% 147,595 5,449 14.834%
Sterling Bank 73,762 4,087 21.956% 68,174 2,924 16.831% 52,792 3,174 23.576% 46,543 3,498 30.091%
FDIC Loss Share Receivable 268,700 (18,130) -26.692% 228,047 (22,875) -39.252% 188,932 (29,142) -60.357% 154,634 (19,264) -49.831%
CapitalSouth Bank 18,955 (2,347) -48.987% 14,720 (2,538) -67.473% 10,394 (535) -20.145% 7,656 (938) -49.012%
Orion Bank 164,219 (10,492) -25.277% 141,213 (12,702) -35.199% 115,061 (22,595) -76.842% 93,198 (13,056) -56.033%
Century Bank 65,145 (3,105) -18.857% 55,021 (5,304) -37.719% 49,048 (5,808) -46.333% 42,600 (3,895) -36.573%
Sterling Bank 20,382 (2,185) -42.404% 17,093 (2,331) -53.365% 14,430 (205) -5.547% 11,179 (1,375) -49.212%
Net Covered Loan Portfolio 1,223,255 12,194 3.984% 1,099,815 7,983 2.876% 940,414 8,038 3.426% 846,094 6,663 3.176%
CapitalSouth Bank 150,936 1,262 3.338% 138,132 710 2.041% 119,784 2,413 7.941% 103,213 1,488 5.777%
Orion Bank 713,195 7,192 4.024% 646,147 5,232 3.188% 546,901 (3,817) -2.661% 494,964 1,498 1.231%
Century Bank 264,980 1,837 2.807% 230,268 1,448 2.543% 206,508 6,472 12.401% 190,195 1,554 3.320%
Sterling Bank 94,144 1,903 8.022% 85,267 593 2.759% 67,221 2,970 17.325% 57,722 2,123 14.732%
42
Appendix
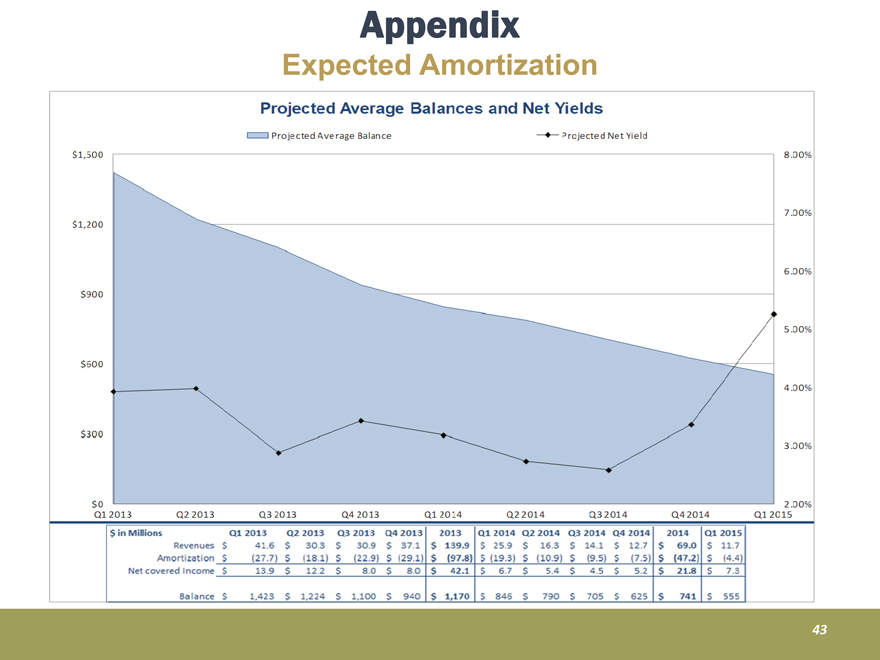
Expected Amortization
43