 MAKING THE MOST OF IT November 2014 |
Safe Harbor And Legend 2 Statements contained in this presentation which are not historical facts and which pertain to future operating results of IBERIABANK Corporation and its subsidiaries constitute “forward-looking statements” within the meaning of the Private Securities Litigation Reform Act of 1995. These forward-looking statements involve significant risks and uncertainties. Actual results may differ materially from the results discussed in these forward-looking statements. Factors that might cause such a difference include, but are not limited to, those discussed in IBERIABANK Corporation’s periodic filings with the SEC. In connection with the proposed mergers, IBERIABANK Corporation will file Registration Statements on Form S-4 that will contain proxy statement / prospectuses. INVESTORS AND SECURITY HOLDERS ARE URGED TO CAREFULLY READ THE PROXY STATEMENT/ PROSPECTUSES REGARDING THE PROPOSED TRANSACTIONS WHEN THEY BECOME AVAILABLE, BECAUSE THEY WILL CONTAIN IMPORTANT INFORMATION. Investors and security holders may obtain a free copy of the proxy statement / prospectuses and other documents containing information about IBERIABANK Corporation, Florida Bank Group, Inc. and Old Florida Bancshares, Inc., without charge, at the SEC’s website at http://www.sec.gov. Copies of the proxy statement / prospectuses and the SEC filings that will be incorporated by reference in the proxy statement / prospectuses may also be obtained for free from the IBERIABANK Corporation website, www.iberiabank.com, under the heading “Investor Information”. This communication is not a solicitation of any vote or approval, is not an offer to purchase shares of Old Florida Bancshares, Inc. common stock or Florida Bank Group, Inc. common stock, nor is it an offer to sell shares of IBERIABANK Corporation common stock which may be issued in the proposed mergers with Florida Bank Group, Inc. and Old Florida Bancshares, Inc. The issuance of IBERIABANK Corporation common stock in the proposed mergers with Florida Bank Group, Inc. and Old Florida Bancshares, Inc. would have to be registered under the Securities Act of 1933, as amended (the “Act”), and such IBERIABANK Corporation common stock would be offered only by means of prospectuses complying with the Act. |
INTRODUCTION Summary • Headquartered in Lafayette, Louisiana • Since 1887 – Oldest And Largest Louisiana-Based Bank • Diverse US Gulf Coast Presence – Texas To Florida • Pro Forma Assets Of Over $17 Billion • Pro Forma Market Capitalization Of Over $2.5 Billion • Strong Asset Quality Measures • Conservative And We Don’t Cut Corners • Limit Loan Concentrations • Asset Sensitive From An Interest Rate Risk Position • Large, Diverse Fee-Based Businesses • Completed Five FDIC-Assisted Transactions • Completed Five Live-Bank Transactions, With Two Pending • Executing Efficiency And Process Improvements 3 |
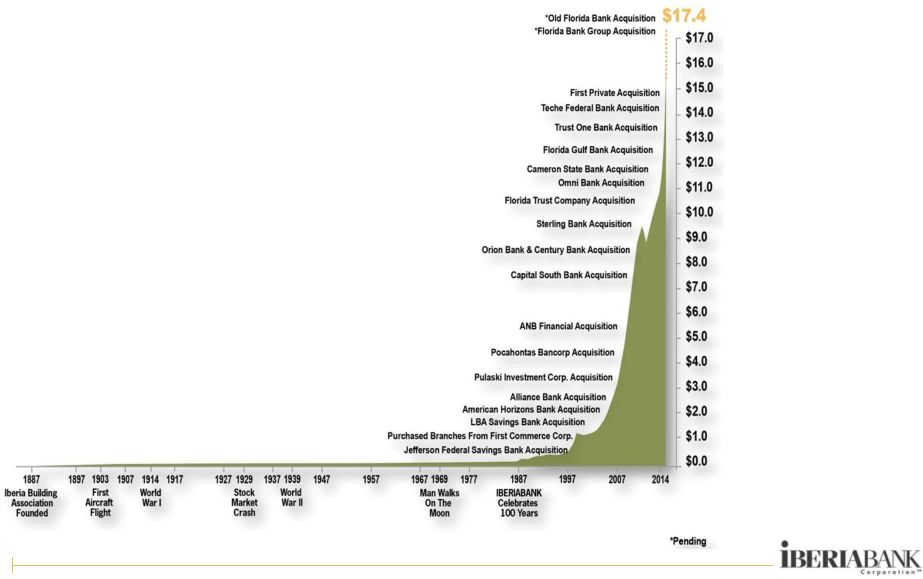 INTRODUCTION Our Growth Path 4 ASSET GROWTH 1887-2014 • Six-Fold Growth Compared To The Banking Industry • Asset Growth Is A Function Of Both Internal (“Organic”) Growth And Acquisitions • Averaged One Or Two Acquisitions Per Year • We Are Very Selective Regarding Our Acquisition Targets |
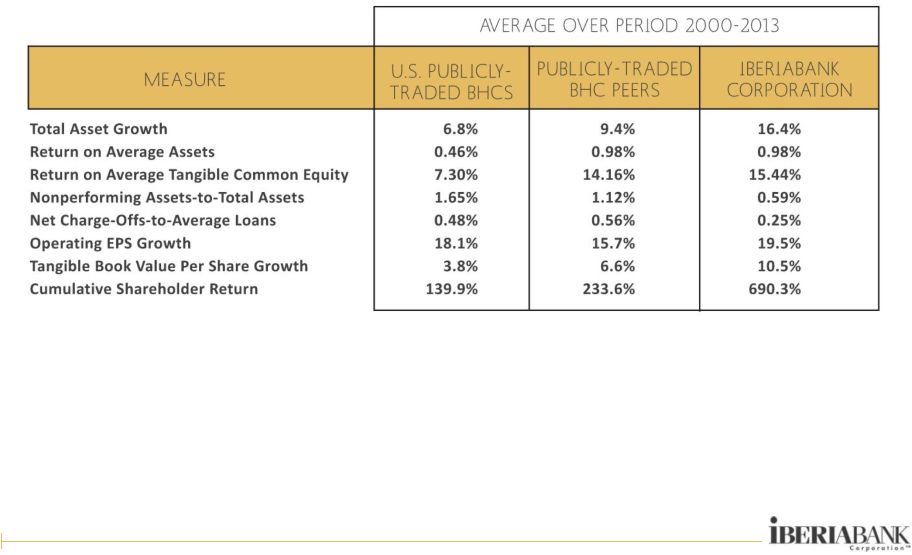 INTRODUCTION Results Compared To Peers • Very Difficult Period: Credit & Interest Rate Cycles, Bank Crisis, Hurricanes • Since Year-End 1999, We Have Outperformed Peers In Many Aspects • Peers Include Both All Publicly Traded U.S. Bank Holding Companies And $10 To $30 Billion-Asset Publicly Traded Bank Holding Companies 5 Source: SNL Financial |
 INTRODUCTION Strategic Goals And Executive Compensation • Key Long-Term Financial Goals Through 2016 Are As Follows: Return on Average Tangible Equity of 13% To 17% Tangible Efficiency Ratio Of 60% Or Less Asset Quality In The Top 10% Of Our Peers Double-Digit Percentage Growth In Fully-Diluted Operating EPS • Company Continues To Focus On Improving Operating Efficiency And Profitability 6 STRATEGIC GOALS EXECUTIVE COMP CHANGES • Executive Compensation Programs Were Redesigned To Align With Strategic Goals, Profitability Focus, And Shareholder Value Creation • Short-Term Incentive Programs Place Greater Emphasis On Pre- Established Performance Objectives (As Opposed To Discretionary Objectives) • Long-Term Incentive Programs Place Greater Emphasis On Performance-Based Metrics (As Opposed To Time-Based Metrics) |
 PRIMARY FOCUS “ ” Things do not change, we do. - Henry David Thoreau 7 |
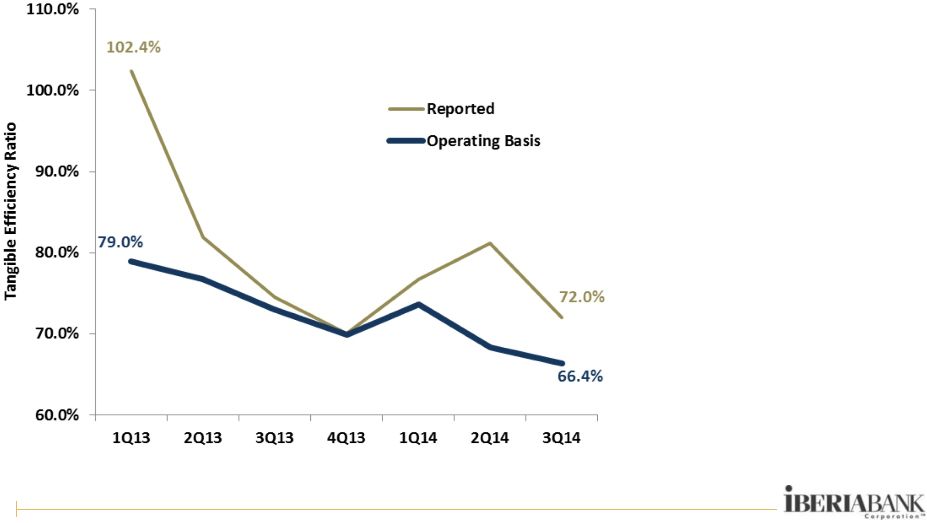 QUARTERLY EFFICIENCY RATIOS PRIMARY FOCUS Operating Efficiency Initiative • In Early 2013, Projected Pre-Tax Savings Of $21 Million On An Annualized Run-Rate Basis, Or $0.46 Per Share After-Tax Annually • During 2013, Achieved More Than $24 Million Annualized Pre-Tax Run-Rate Savings • In 2014, Another Initiative Is Projected To Achieve An Additional $10.7 Million In Run- Rate Savings: Through 3Q14, 85% Of Savings Achieved 8 |
 PRIMARY FOCUS Optimize Client Distribution Points • Enhanced Mobile Banking And Technological Enhancements 9 • Opened Two Branches In 2Q14 And One Branch In 3Q14 • Closed Three Branches In 2Q14 • Adding Two Additional Branch Openings By Year- End 2014 • Added 14 Branches From Three Acquisitions, Net Of Consolidations, In The First Half Of 2014 |
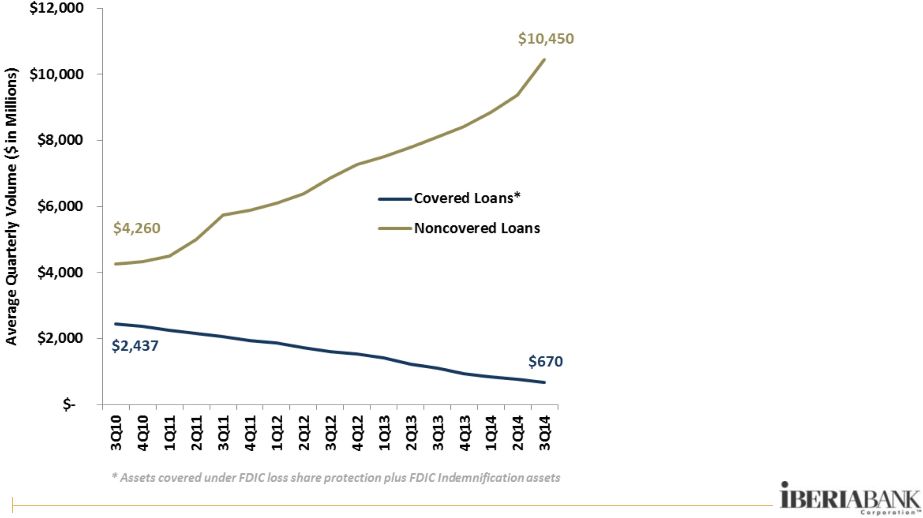 FDIC & NON-FDIC LOAN TRENDS PRIMARY FOCUS Continue FDIC Loan Resolution • Through The Third Quarter Of 2014, FDIC-Covered Loans Declined $270 Million, Or 29% • The FDIC Loss Share Receivable Declined $67 Million, Or 42% • Certain FDIC Loss Share Programs Will Begin To Expire In 2014 • To Date, Credit Results Were Substantially Better Than We Expected 10 |
 COMMERCIAL COMMITMENT TRENDS PRIMARY FOCUS Grow High-Quality Client Base • Aggregate Year-To-Date Loan Growth Of $1.6 Billion, Or 17%, Through Third Quarter Of 2014 • Legacy Loan Growth Was $892 million, Or 11% (14% Annualized), Through Third Quarter Of 2014 • Notable Strength In: Houston Birmingham New Orleans Baton Rouge Memphis • Unfunded Commitments And Unused Lines Grew $241 Million, Or 8% Since Year- End 2014 11 ---------------------------Year Ends ------------------------------ |
 PRIMARY FOCUS Execute Small Business & Retail Initiatives • In 2012, We Launched A Restructuring Of The Small Business Lending Process • Additional Bankers Were Added In 2013 To Increase Small Business Loan Volume • We Host A Small Business Website, Titled “Small Business Insights” At www.iberiabank.biz • Gaining Retail Branch Efficiency • In 2013, Deployed 23 Cash Teller Recyclers (Gaining Speed Of Transactions And Efficiencies) • Digital Banking Services Through Mobile Apps For iPhone, Android, And Our New iPad App • Recently Added Mobile Deposit Capture Service – Allows Clients To Make Deposits By Scanning Checks Quickly And Easily On Their Smartphones SMALL BUSINESS RETAIL BANKING 12 |
 PRIMARY FOCUS Revenue Growth From Fee Income Businesses 13 Full Year 2013 vs. 2012 3Q 2014 vs. 3Q 2013 IBERIA Capital Partners +63% +64% IBERIA Wealth Advisors +26% -3% IBERIA Financial Services -7% +12% Treasury Management +31% +22% IBERIABANK Mortgage Company -18% -16% Lenders Title Company -2% +2% |
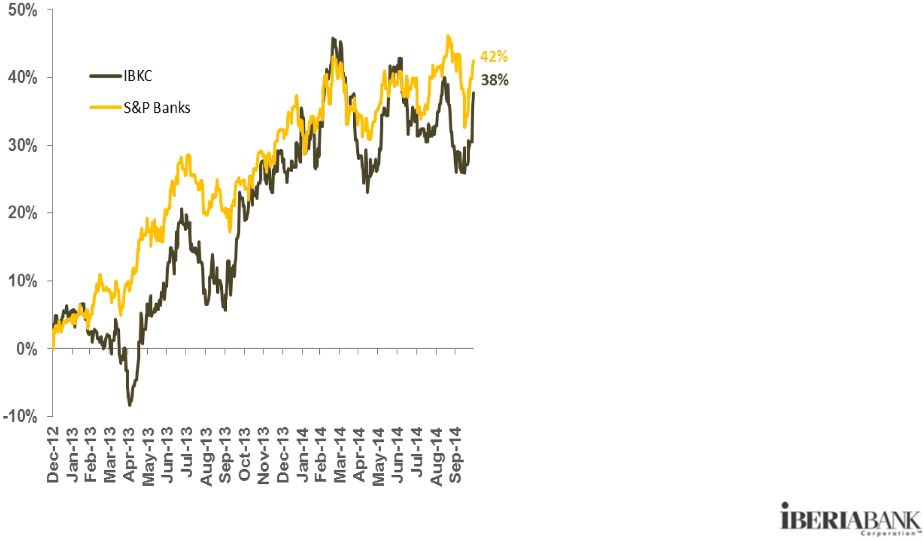 STOCK PRICE TREND SINCE YEAR-END 2012 PRIMARY FOCUS Improve Shareholder Returns • After Many Poor Years, 2013 Was An Outstanding Year For Many Bank Stocks • In 1Q14, Adjustment In FDIC Loss Share Accounting Resulted In A Near-Term Negative Impact To Share Price • In 2Q14, Subsequent Efficiency Improvements Resulted In Rebound In Market Price • From Year-End 2012 Through October 29, 2014, Our Total Shareholder Return Was 43%. Since Year-End 1999, Our Annualized Total Return was 15% 14 Indexed results through October 29, 2014 Source: Bloomberg |
 L O N G - T E R M P E R S P E C T I V E “ ” 15 Our favorite holding period is forever. - Warren Buffett |
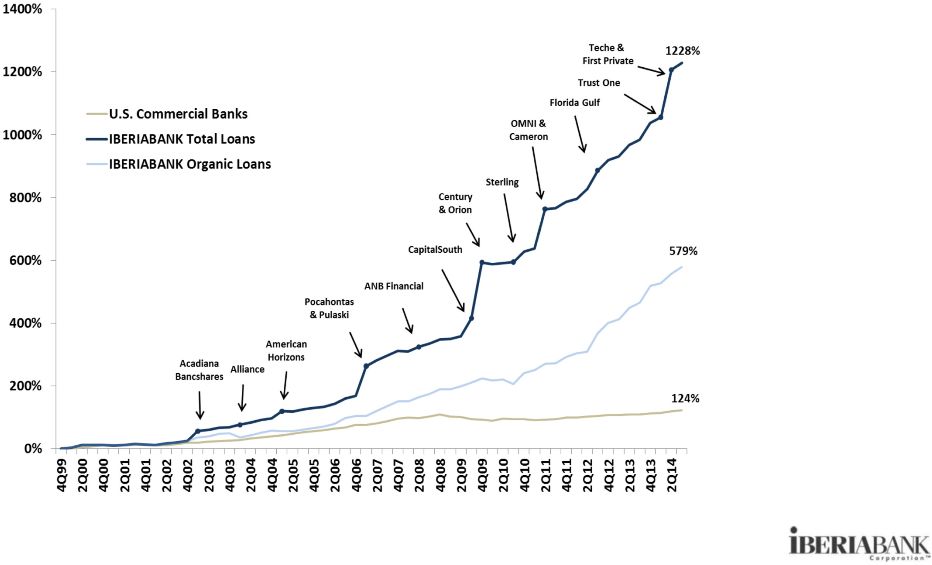 Data indexed at December 31, 1999 Organic loan growth excludes the impact of loan runoff on the FDIC covered loan portfolio. LOAN GROWTH 1999 - September 2014 LONG-TERM PERSPECTIVE Loan Growth Compared To Industry • Between 2007 And 2012, We Tripled Our Total Loans • Since 1999, Our Organic Loan Growth Was Four Times Higher Than The Banking Industry • Average Loans Up 13% In 2013 Versus 2012 • Pending Florida Bank Group And Old Florida Bancshares Acquisitions Will Add Approximately $1.4 Billion in Total Loans 16 Source: Federal Reserve Board |
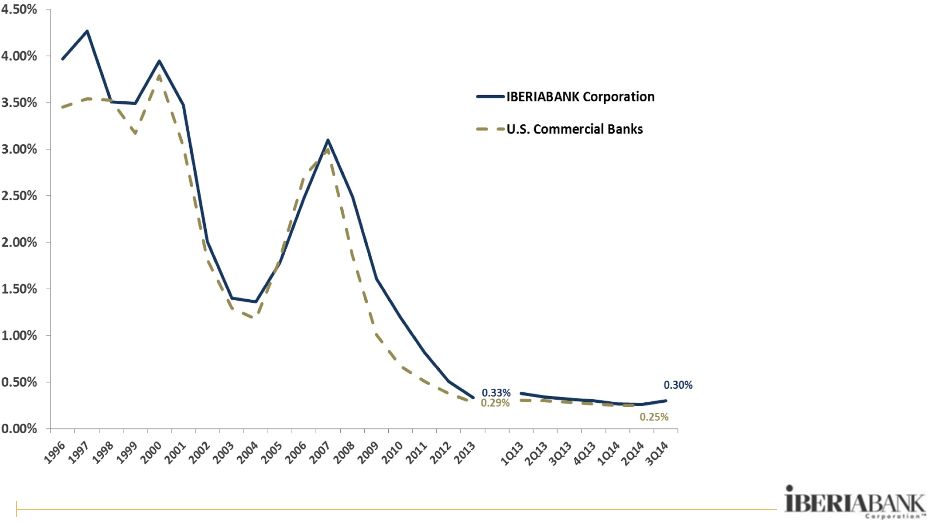
 AVERAGE LOAN YIELD 1996 - September 2014 LONG-TERM PERSPECTIVE Loan Yield Trends Compared To Industry • Loan Yield Was Consistent With Industry Until 2010 • Higher Yield After That Period Due, In Part, To FDIC Loss Share Asset Yields • Favorable Loan Yield Trend In The Second Half Of 2013 17 Source: SNL Financial |
 CORE DEPOSIT GROWTH 1999 - September 2014 Core Deposit Growth Compared To Industry LONG-TERM PERSPECTIVE • Between 2007 And 2012, We Tripled Our Total Deposits • Five-Fold Growth In Organic Core Deposits Versus Industry • Average Total Deposits Up 10% In 2013 Versus 2012 • Strong Average Non- Interest Bearing Deposit Growth (Up 29%) • Pending Florida Bank Group And Old Florida Bancshares Acquisitions Will Add Approximately $1.4 Billion in Core Deposits 18 Source: Federal Reserve Board |
 AVERAGE COST OF DEPOSITS 1996 - September 2014 LONG-TERM PERSPECTIVE Deposit Cost Trends Compared To Industry • Our Deposit Costs Have Generally Kept Pace With Industry Deposit Cost Structure • In 2013, We Were Approximately On Par With Industry • Part Of Cost Reduction Was Due To Favorable Deposit Mix Improvement (More Non-interest Bearing Deposits) 19 Source: SNL Financial |
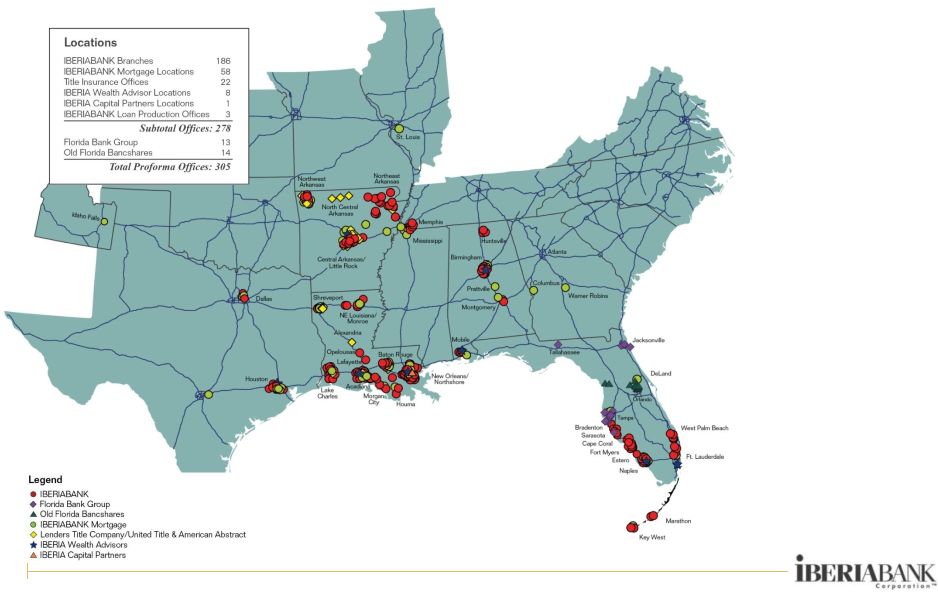
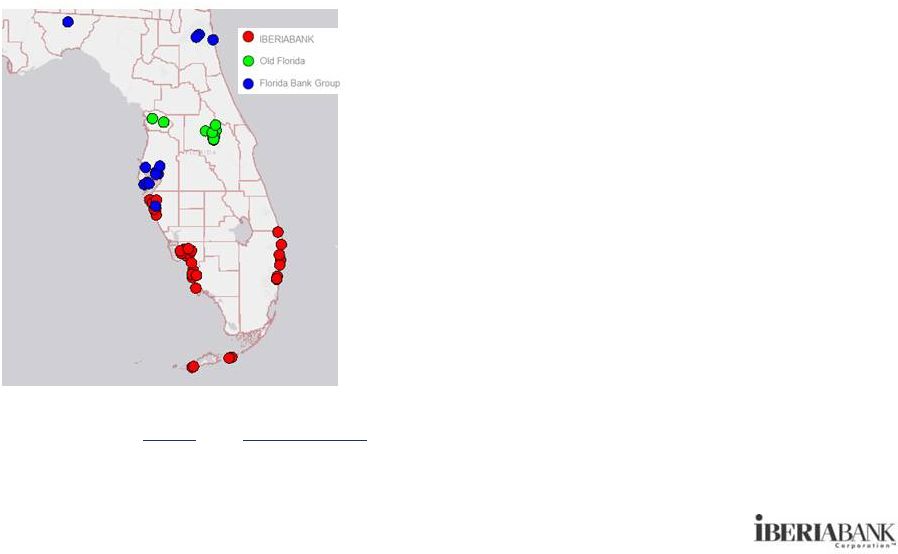
 Loans By State Deposits By State LONG-TERM PERSPECTIVE Geographic Diversification • Prior To 2007, 100% Of Loans And Deposits In Louisiana, Nearly All Of Which Were Concentrated In Four Markets • On A Pro Forma Basis Louisiana Loans and Deposits Will Account For Approximately 43% and 46, Of Total Franchise, Respectively • Pro Forma Of Pending Acquisitions Florida Will Account For 20% Of Total Loans And 27% Of Total Deposits • Provides Significant Client Geographic Diversification 20 IBERIABANK loan and deposit information pro forma giving effect to pending acquisitions of Florida Bank Group, Inc. and Old Florida Bancshares, Inc. |
 Summary Trends LONG-TERM PERSPECTIVE • Doubled In Size Between 1999 And The Time Of Hurricane Katrina • Four-Fold Increase In Size Post-Katrina • More Geographic And Client Diversification • Expansion Into Significant Growth Markets • Paid Quarterly Cash Dividends For 76 Consecutive Quarters Pre-Historic Era Hurricane Katrina Era Recent Time Period 21 * trailing twelve months Total Loans $0.8 billion $1.9 billion $11.1 billion Total Deposits $1.1 $2.2 $12.4 Total Assets $1.4 $2.9 $15.5 Market Capitalization $86 million $487 million $2.1 billion Mortgage Loan Production < $50 million $235 million $1.6 billion * Locations 43 44 278 MSAs Served 3 5 25 Associates (full-time equivalent) 535 686 2,703 Advisory Boards None 5 13 Shareholders of Record 1,140 1,700 2,890 Analyst Coverage 2 10 11 Top 3 Shareholders 23.0% 14.0% 16.0% Period-End Share Price 11.00 $ 51.01 $ 62.51 $ Tangible Book Value Per Share 9.95 $ 17.07 $ 37.41 $ Price to Tangible BVS 1.11 times 2.99 times 1.67 times Operating Earnings Per Share 1.28 $ 2.24 $ 3.61 $ * Annual Dividends Per Share 0.53 $ 1.00 $ 1.36 $ Dividend Payout Ratio 41% 45% 38% Year-End 1999 Year-End 2005 September 30, 2014 |
 PLANTING SEEDS The difference between ordinary and extraordinary is that little extra. - Jimmy Johnson “ ” 22 |
 PLANTING SEEDS IBERIABANK Mortgage Company Overall Industry Changes: What We Are Doing: QUARTERLY MORTGAGE LOAN ORIGINATION GROWTH (% Change Since 1Q 2008) 23 Source: Mortgage Bankers Association 3Q14 • Mortgage Market Is Smaller From The Peak • Fewer Players • Regulatory Risk And Burden Is Increasing • GSE Reform On The Horizon • Digital And Internet Impact • Recruiting And Retaining Experienced High Performing Originators • Working Closer With Branches • Improving Efficiency In Processes And Staffing |
 PLANTING SEEDS IBERIA Capital Partners ICP REVENUES AND EQUITY RESEARCH COVERAGE • ICP Started in 4Q10 • In 2013, ICP Launched Coverage On 39 Energy- Related; By Year- End, ICP Had Research Coverage On 100 Companies • In 2013, Completed 23 Equity And Fixed Income Investment Banking Transactions • ICP Turned Profitable in 2013 24 |
 SMALL BUSINESS LOAN VOLUME TRENDS PLANTING SEEDS Small Business Initiative • Economy Is Improving, Leading To An Increase In Small Business Loan Demand • Hired Additional Business Bankers • Trained And Focused Branch Managers On Serving And Calling On Small Businesses • Built Out Underwriting Platform • Favorable Loan Growth 25 Acquired approximately $250 million in small business loans from Teche in 2Q14 |
 THE RIGHT PARTNERS “ ” Few men have the virtue to withstand the highest bidder. - George Washington 26 |
 Florida Bank Group, Inc. THE RIGHT PARTNERS 27 • Announced October 3, 2014 • In market and new-market acquisition of a Florida-based commercial bank based in Tampa, Florida • As of September 30, 2014: • Total Loans: $324 million • Total Assets: $518 million • Total Deposits: $393 million • Total Equity: $37 million common stock and $25 million in convertible preferred equity • Combination cash and common stock with aggregate cash consideration not to exceed 50% of total consideration • $7.81 in cash per Florida Bank Group common share, and • Fixed exchange ratio of 0.149 of a share of IBKC common stock for each Florida Bank Group share within price collars and floating exchange ratios outside of the collars (1) , • $87 million (1) for common stock outstanding based on IBKC closing price of $62.61 on October 2, 2014 • $17.14 per Florida Bank Group share outstanding (1) • $3.5 million in cash liquidation value of options • Neutral to 2015 EPS and accretive thereafter • Slightly dilutive to TVBS (less than 1%) • IRR in excess of 20% Shareholders’ With All Other Equity Adjustments (2) • Price / Total Book: 142% 126% • Price / Tangible Book: 142% 126% Adds 13 branches in Florida – eight offices in Tampa, three in Jacksonville, one in Sarasota and one in Tallahassee (1) If the weighted average trading price of IBERIABANK common stock were to go below $56.79 per share, or to exceed $76.83 per share, over a specified period, the value of the common stock portion of the transaction would become fixed and the exchange ratio would float (2) Assumes the impact of cash liquidation for options, reversal of $23.4 million of deferred tax asset valuation allowance, credit loss assumptions, interest rate adjustments and fair value marks to facilities |
 Notes: (1) The agreement provides for a fixed exchange ratio with pricing collars that fix the value received by Old Florida’s shareholders if the weighted average trading price of IBERIABANK Corporation’s common stock were to decline below $57.31 per share, or exceed $70.05 per share, over a specified period (2) Assumes common and preferred converted shares and no exercise of options outstanding (3) Assumes all stock options outstanding are cashed out at consummation • Announced October 27, 2014 • New-market acquisition of an Orlando, Florida-based commercial bank • Adds 14 offices in Florida – 12 offices in Orlando and two offices north of Tampa As of September 30, 2014: • Total Loans: $1.1 billion • Total Assets: $1.4 billion • Total Deposits: $1.2 billion • Total Equity: $146 million total shareholders’ equity • Tax-free, stock-for-stock exchange • Fixed exchange ratio of 0.34 share of IBKC common stock for each Old Florida Bancshares, Inc. share within collars and floating exchange rations outside of collars (1) • $238 million for total equity (2) outstanding based on IBKC’s closing price of $64.13 on October 23, 2014 • $21.80 per Old Florida common share outstanding (2) • Estimated $21 million in cash liquidation value of all options outstanding (3) • Approximately 2% accretive to EPS in 2016 and 3% accretive in 2017 • TBVS dilution of approximately 2% at consummation • TBVS breakeven in less than four years • IRR in excess of 20% THE RIGHT PARTNERS 28 Old Florida Bancshares, Inc. Shareholders’ Aggregate Value Equity (2) Including Options (3) • Price / Total Book: 163% 178% • Price / Tangible Book: 170% 185% |
 THIRD QUARTER 2014 We cannot direct the wind, but we can adjust the sails. - Bertha Calloway “ ” 29 |
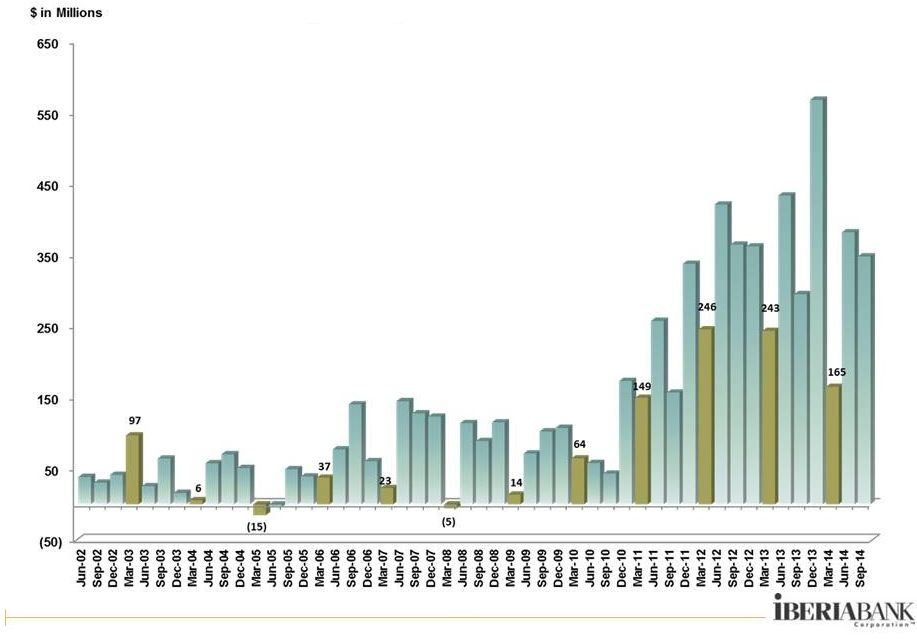 SEASONAL INFLUENCES Quarterly Organic Loan Growth 30 • First quarter of each year tends to exhibit slower loan growth than other quarters • 3Q14 organic loan growth of $348 million, down $34 million, or 10%, compared to 2Q14 growth |
 THIRD QUARTER 2014 – OVERVIEW Non-Performing Asset Trends 31 NPA determination based on regulatory guidance for Acquired portfolios 3Q14 includes $13 million of bank-related properties reclassified to OREO |
 THIRD QUARTER 2014 – OVERVIEW Non-Interest Bearing Deposits 32 % of Total Deposits • $110 million of incremental non- interest-bearing deposit growth or +4% (+14% annualized) in 3Q14 • Top 3Q14 non- interest-bearing deposit growth markets include Houston, Baton Rouge, New Orleans, Birmingham and Sarasota $ in billions Non-interest-bearing deposits at period-end |
 SEASONAL INFLUENCES Mortgage Income 33 • Mortgage 3Q14 Non-Interest Income of $12.8 million is $5.1 million lower than 2Q14 driven by • $7.0 million lower market value adjustment gains (-$4.5 million recognized in 3Q14 versus +$2.5 million in 2Q14) • $1.8 million higher gains on increased sales volume (+24%) and higher sales margins (+6%) • $62,000 higher servicing income • Loan originations were up $20 million in 3Q14 to $456 million from $436 million in 2Q14 (+5%) • The Pipeline plus Loans HFS at September 30th was 11% lower than at June 30, 2014 |
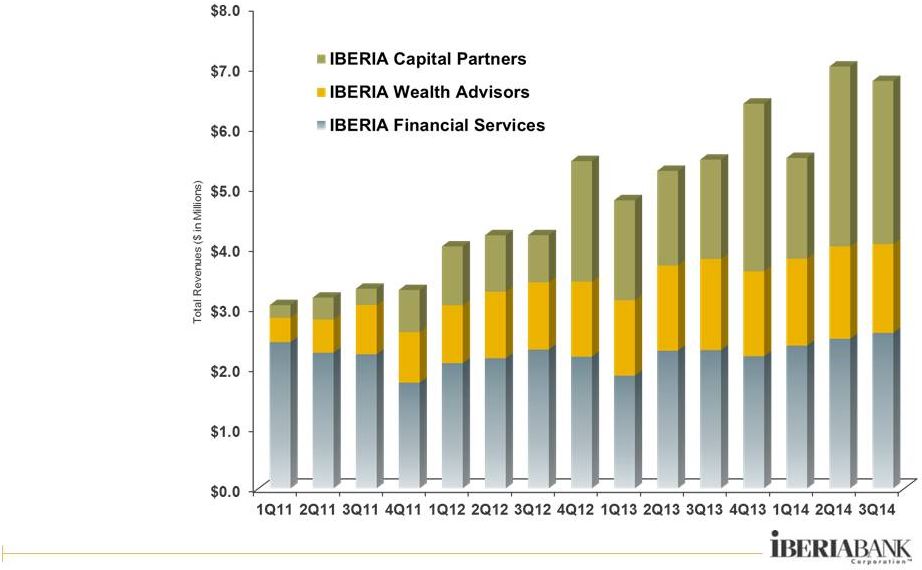 SEASONAL INFLUENCES Capital Markets And Wealth Management 34 • ICP revenues of $2.7 million, or -9%, compared to 2Q14 • IWA revenues of $1.5 million, or -4%, compared to 2Q14 • IFS revenues of $2.6 million, or +4%, compared to 2Q14 • ICP currently provides research coverage on 77 public energy companies • IWA assets under management increased $5 million to $1.2 billion on September 30, 2014 |
Summary IBERIABANK Corporation 35 • Longevity and Experience • Economically Vibrant Legacy Markets • Diversified Markets and Revenues • Multiple Growth Engines (Organic and M&A) • Disciplined, Yet Opportunistic • Exceptional Asset Quality • Outsized FDIC Loss Share Protection • Tremendous Capital Strength • Funded By Stable Core Deposits • Asset-Sensitive (Interest Rate Risk Position) • Unique Business Model • Favorable Risk/Return Trade-Off |
 |
 APPENDIX I skate where the puck is going to be, not where it has been. 37 - Wayne Gretzky |
 APPENDIX Performance Metrics – Quarterly Trends 38 • Average earning assets up $1.3 billion (+10%) • T/E net interest income up $12 million (+11%) • Provision for loan losses of $6 million: • Legacy net charge- offs: $2.1 million (0.09% annualized rate) • Covered and acquired net charge offs: $0.1 million (0.02% annualized rate) • Legacy provision for loan losses: $4.0 million 9/30/2013 12/31/2013 3/31/2014 6/30/2014 9/30/2014 Net Income ($ in thousands) 23,192 $ 25,604 $ 22,395 $ 18,548 $ 29,744 $ 60% Per Share Data: Fully Diluted Earnings 0.78 $ 0.86 $ 0.75 $ 0.60 $ 0.89 $ 48% Operating Earnings (Non-GAAP) 0.83 0.87 0.73 0.96 1.00 4% Pre-provision Operating Earnings (Non-GAAP) 0.89 0.97 0.78 1.06 1.11 5% Tangible Book Value 37.00 37.17 37.59 37.41 37.91 1% Key Ratios: Return on Average Assets 0.71% 0.77% 0.68% 0.53% 0.76% 23 bps Return on Average Common Equity 6.08% 6.62% 5.83% 4.56% 6.52% 196 bps Return on Average Tangible Common Equity (Non-GAAP) 8.74% 9.43% 8.36% 6.62% 9.68% 306 bps Net Interest Margin (TE) (1) 3.37% 3.52% 3.54% 3.48% 3.47% (1) bps Tangible Operating Efficiency Ratio (TE) (1) (Non-GAAP) 73.0% 69.9% 73.6% 68.3% 66.4% (182) bps Tangible Common Equity Ratio (Non-GAAP) 8.64% 8.55% 8.61% 8.46% 8.47% 1 bps Tier 1 Leverage Ratio 9.65% 9.70% 9.61% 10.03% 9.22% (81) bps Tier 1 Common Ratio (Non-GAAP) 10.95% 10.55% 10.44% 10.33% 10.34% 1 bps Total Risk Based Capital Ratio 13.28% 12.82% 12.69% 12.43% 12.42% (1) bps Net Charge-Offs to Average Loans (2) 0.02% 0.07% 0.05% 0.04% 0.09% 5 bps Non-performing Assets to Total Assets (2) 0.66% 0.61% 0.49% 0.53% 0.46% (7) bps (1) Fully taxable equivalent basis. (2) Excluding FDIC Covered Assets and Acquired Assets. For Quarter Ended: Linked Quarter %/Basis Point Change |
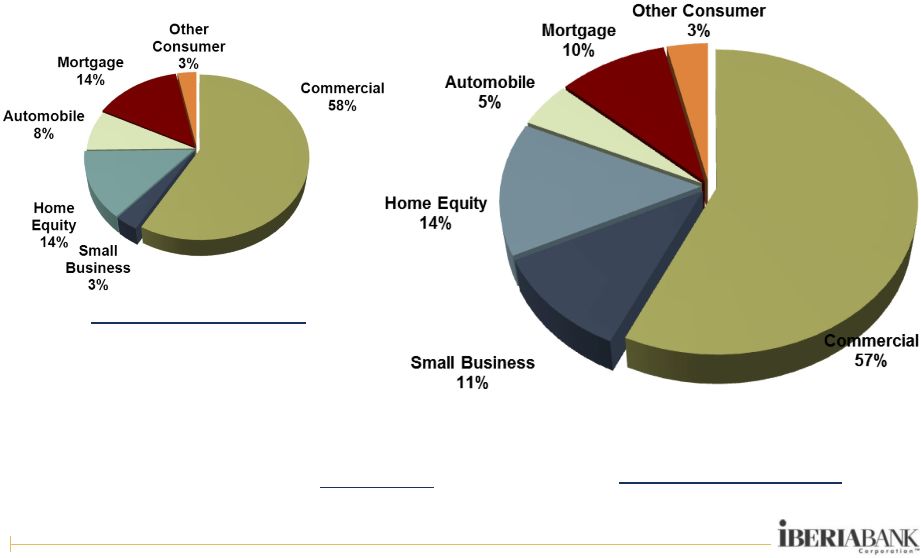
 APPENDIX Financial Summary – 3Q14 39 • Reported EPS of $0.89 and non-GAAP operating EPS of $1.00 • Tax equivalent net interest income increased $12.0 million, or 11% from 2Q14, while average earning assets increased $1.3 billion, or 10% • Branch and systems conversion of First Private Bank completed over the weekend of September 6-7, 2014 • Legacy loan growth: • Legacy deposit growth: • Net interest margin decreased one basis point to 3.47% from June 30, 2014, due mainly to a one basis point increase in the yield on earning assets offset by a three basis point increase in cost of funds -- within previously disclosed guidance range of 3.45% to 3.50% • Operating tangible efficiency ratio improved from 68.3% to 66.4% • Tax-equivalent operating revenues increased $9.1 million, or 6%, on a linked quarter basis while operating expenses increased $3.4 million, or 3%, resulting in improved operating leverage $348 million since June 30, 2014 (+16% annualized), including $146 million of Commercial and $202 million of Small Business and Consumer Growth in the loan portfolio was balanced with 58% Retail and Small Business and 42% Commercial $397 million since June 30, 2014 (+13% annualized) $110 million increase in non-interest bearing deposits (+14% annualized) |
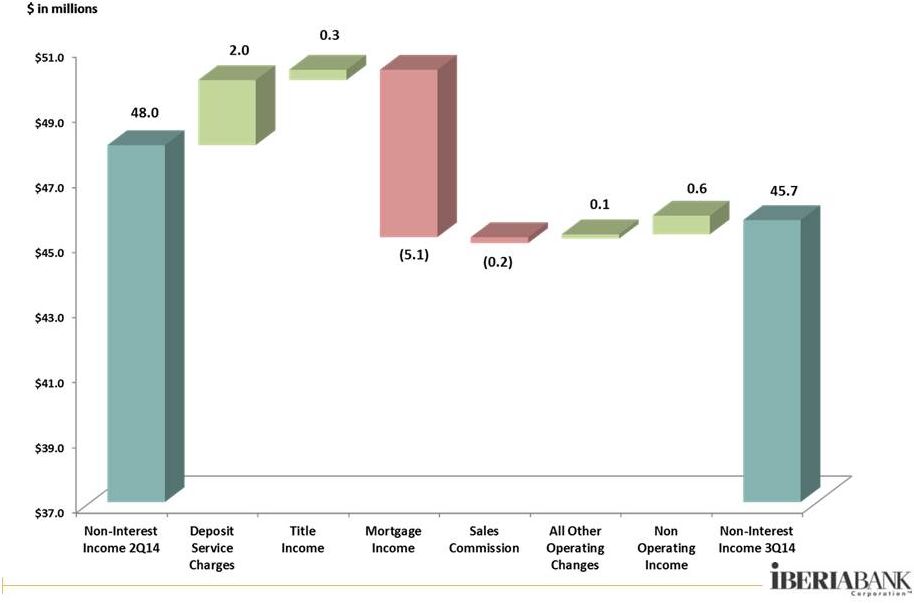 APPENDIX Non-Interest Income – 3Q14 Components 40 • Operating non-interest income decreased $2.9 million, or -6%, on a linked quarter basis |
 • Deposit service charge income increased $2.0 million or 24% • ATM/Debit card fee income increased $0.4 million or 12% • Title revenue increased $0.3 million, or 6% • Mortgage income decreased $5.1 million or 29% • Decreased broker commissions income of $0.2 million or -3% • Gains on sale of investments increased $0.6 million APPENDIX Non-Interest Income Trends 41 3Q14 originations up 5% from 2Q14 Refinancings were 25% of production, up from 13% in 2Q14 Sales up 24% in 3Q14 Margins 6% higher in 3Q14 Pipeline of $170 million at quarter-end, down 6% as compared to June 30, 2014. At October 10, 2014, the locked pipeline was $194 million or +8% over September 30, 2014 Non-interest Income ($000s) 3Q13 4Q13 1Q14 2Q14 3Q14 $ Change % Change Service Charges on Deposit Accounts 7,512 $ 7,455 $ 7,012 $ 8,203 $ 10,205 $ 2,002 $ 24% ATM / Debit Card Fee Income 2,476 2,493 2,467 2,937 3,287 350 12% BOLI Proceeds and CSV Income 908 900 934 934 1,047 113 12% Mortgage Income 15,202 12,356 10,133 17,957 12,814 (5,143) -29% Title Revenue 5,482 4,327 4,167 5,262 5,577 315 6% Broker Commissions 3,950 4,986 4,048 5,479 5,297 (182) -3% Other Noninterest Income 7,720 6,179 5,129 7,182 6,854 (328) -5% Noninterest income excluding non-operating income 43,250 38,696 33,890 47,954 45,081 (2,873) -6% Gain (Loss) on Sale of Investments, Net 13 19 19 8 582 574 6797% Other Non-operating income - - 1,772 1 - (1) -100% Total Non-interest Income 43,263 $ 38,715 $ 35,681 $ 47,963 $ 45,663 $ (2,300) $ -5% 3Q14 vs. 2Q14 |
 APPENDIX Non-Interest Expense –3Q14 Components 42 • Non-operating non-interest expense of $6.4 million before-tax, or $4.2 million after-tax or $0.12 per share • Operating non- interest expense increased $3.4 million, or 3%, on a linked-quarter basis • $1.7 million of the operating expense increase was due to the full quarter impact of Teche and First Private |
 APPENDIX Non-Interest Expense Trends 43 Linked quarter increases/decreases of: Salary and benefits expense $0.4 mil Credit/Loan related expense 1.5 Hospitalization expense 1.0 Other Incentives (1.6) Increased due to the timing and consummation of Teche and First Private added approximately $1.7 million in operating expenses in 3Q14 • Non-interest expenses excluding non-operating items up $3.4 million, or 3%, as compared to 2Q14 • Total expenses down $7.3 million, or -6%, in 3Q14 • Severance expense down $4.2 million, mostly related to Teche acquisition • Impairment of long-lived assets up $3.0 million • Merger-related expense decreased $8.7 million • Operating Tangible Efficiency Ratio of 66.4%, down 190 bps Non-interest Expense ($000s) 3Q13 4Q13 1Q14 2Q14 3Q14 $ Change % Change Mortgage Commissions 4,238 $ 3,169 $ 2,215 $ 3,481 $ 3,912 $ 431 $ 12% Hospitalization Expense 4,303 3,899 3,944 3,661 4,611 950 26% Other Salaries and Benefits 50,140 52,108 53,582 55,921 54,898 (1,023) -2% Salaries and Employee Benefits 58,681 $ 59,176 $ 59,741 $ 63,063 $ 63,421 $ 358 $ 1% Credit/Loan Related 5,248 2,776 3,560 3,093 4,569 1,476 48% Occupancy and Equipment 13,863 13,971 13,775 13,918 14,580 662 5% Amortization of Acquisition Intangibles 1,179 1,177 1,218 1,244 1,493 249 20% All Other Non-interest Expense 26,933 25,328 27,328 28,913 29,602 689 2% Nonint. Exp. (Ex-Non-Operating Exp.) 105,904 $ 102,428 $ 105,622 $ 110,231 $ 113,666 $ 3,435 $ 3% Severance 554 216 119 5,466 1,226 (4,240) -78% Occupancy and Branch Closure Costs 594 - 17 14 - (14) -100% Storm-related expenses - - 184 4 1 (3) -78% Impairment of Long-lived Assets, net of gains on sales 977 (225) 541 1,241 4,213 2,972 239% Provision for FDIC clawback liability 667 - - - (797) (797) 100% Debt Prepayment - - - - - - 0% Termination of Debit Card Rewards Program - (311) (22) - - - 0% Consulting and Professional (630) - - - - - 0% Merger-Related Expenses 85 566 967 10,419 1,752 (8,667) -83% Total Non-interest Expense 108,152 $ 102,674 $ 107,428 $ 127,375 $ 120,060 $ (7,315) $ -6% Tangible Efficiency Ratio - excl Nonop-Exp 73.0% 69.9% 73.6% 68.3% 66.4% 3Q14 vs. 2Q14 |
 APPENDIX Legacy Credit Portfolio 44 Asset Quality Summary (Excludes FDIC covered assets and all acquired loans) • NPAs equated to 0.46% of total assets, down 7 bps compared to 2Q14. Includes $13 million of bank- related properties • $67 million in classified assets (down $0.3 million from 2Q14) • Legacy net charge- offs of $2.1 million, or an annualized rate of 0.09% of average loans • $4 million provision for legacy franchise in 3Q14 ($ thousands) 9/30/2013 6/30/2014 9/30/2014 Non-accrual Loans 43,838 $ 34,187 $ 38,060 $ -13% 11% OREO 30,607 34,794 23,477 -23% -33% Accruing Loans 90+ Days Past Due 1,418 20 4 -100% -78% Non-performing Assets 75,863 69,001 61,542 -19% -11% Note: NPAs excluding Former Bank Properties 65,345 50,415 48,808 -25% -3% Past Due Loans 57,662 48,189 50,505 -12% 5% Classified Loans 78,059 67,796 67,462 -14% 0% Non-performing Assets/Assets 0.66% 0.53% 0.46% (20) bps (7) bps NPAs/(Loans + OREO) 0.98% 0.78% 0.67% (31) bps (11) bps Classified Assets/Total Assets 0.66% 0.52% 0.50% (16) bps (2) bps (Past Dues & Nonaccruals)/Loans 0.75% 0.55% 0.55% (20) bps 0 bps Provision For Loan Losses 2,868 $ 3,004 $ 4,022 $ 40% 34% Net Charge-Offs/(Recoveries) 303 759 2,131 604% 181% Provision Less Net Charge-Offs 2,565 $ 2,245 $ 1,891 $ -26% -16% Net Charge-Offs/Average Loans 0.02% 0.04% 0.09% 7 bps 5 bps Allowance For Loan Losses/Loans 0.83% 0.80% 0.79% (4) bps (1) bps Allowance For Credit Losses/Loans 0.99% 0.93% 0.92% (7) bps (1) bps For Quarter Ended: % or Basis Point Change Year/Year Qtr/Qtr |
 APPENDIX Capital Ratios 45 • The decline in Tier 1 leverage ratio in 3Q14 was due to the manner in which the leverage ratio is calculated using capital in the numerator at period-end and average total assets in the denominator • Commencing in 2015, the Company will experience a 50% phase-out of Tier 1 capital treatment for its trust preferred securities with no commensurate change in total regulatory capital • In addition, by year-end 2014, the Company will experience the expiration of FDIC loss share protection on non-single family loans associated with three FDIC–assisted transactions • Change in Tier 1 Leverage ratio due to estimated impact of acquisitions on average total assets used in calculations Estimated Future Impacts: • Anticipated 50% phase- out of trust preferred securities beginning in 2015 • Expiration of loss share coverage on three FDIC- assisted transactions Q2 2014 Q3 2014 Well Capitalized Minimum Tier 1 Leverage 10.03% 9.22% (81) bps 5.00% Tier 1 Risk Based 11.23% 11.23% 0 bps 6.00% Tier 1 Common Risk Based 10.33% 10.34% 1 bps 3.00% Total Risk Based 12.43% 12.42% (1) bps 10.00% Tangible Common Equity / Tangible Assets 8.46% 8.47% 1 bps N/A IBERIABANK Corporation Capital Ratios Change Estimated Proforma Impact on 3Q 2014 Capital Ratios Phase out of Trust Preferred Securites (50% Phase Out) (36) bps (45) bps - bps End of Loss Share - certain covered assets - bps (14) bps (17) bps Total Impact (36) bps (59) bps (17) bps Total Risk Based Tier 1 Risk Based Tier 1 Leverage |
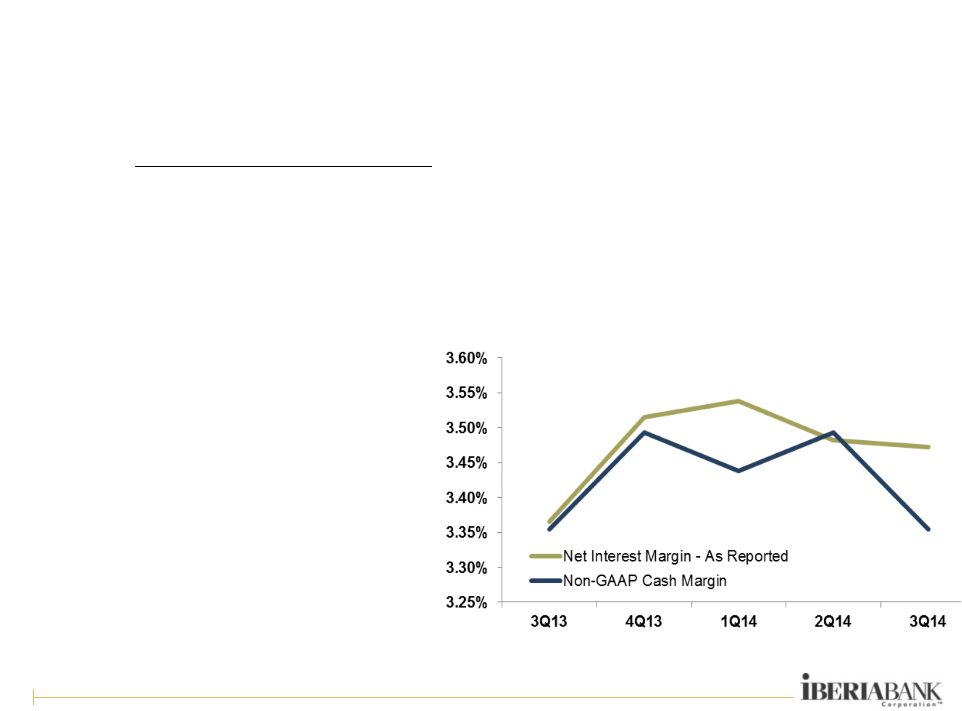  APPENDIX Non-GAAP Cash Margin 46 • Adjustments represent accounting impacts of purchase discounts on acquired loans and related accretion as well as the I/A and related amortization on the covered portfolio Balances, as Reported Adjustments As Adjusted 3Q13 Average Balance 11,674,648 (199,543.31) 11,475,104 Income 97,452 101 97,554 Rate 3.37% -0.01% 3.35% 4Q13 Average Balance 11,853,895 (192,574.05) 11,661,322 Income 103,438 (2,061) 101,377 Rate 3.52% -0.02% 3.49% 1Q14 Average Balance 12,088,182 (171,440.32) 11,916,741 Income 104,408 (2,517) 101,890 Rate 3.54% -0.10% 3.44% 2Q14 Average Balance 12,693,217 (156,606) 12,536,611 Income 108,979 687 109,665 Rate 3.48% 0.01% 3.49% 3Q14 Average Balance 13,990,968 (157,213) 13,833,755 Income 121,041 (3,544) 117,497 Rate 3.47% -0.12% 3.35% |
 APPENDIX Loan Growth Since Year-End 2008 47 December 31, 2008 $3.7 Billion September 30, 2014 $11.1 Billion Acquired loans, net of discount +$4.0 billion Acquired loan pay downs ($2.1 billion) Legacy loan growth +$5.4 billion Total net growth +$7.3 billion |
 APPENDIX Deposit Growth Since Year-End 2008 48 December 31, 2008 $4.0 Billion • $8.4 billion growth in total deposits or +210% (+36% annualized) September 30, 2014 $12.4 Billion |
APPENDIX Small Business and Retail – 3Q14 Progress 49 • Small Business loan growth of $87 million, or +12%, on a linked-quarter basis • Indirect loan growth of $3 million, or +1%, on a linked-quarter basis • Consumer Direct & Mortgage loan growth of $128 million, or +7%, on a linked quarter basis • Credit Card loan growth of $3 million, or +5%, on a linked quarter basis • Checking account growth: • Small Business checking accounts increased 13% year-over-year and an annualized 9% on a linked quarter basis • Consumer checking accounts increased slightly year-over-year but decreased an annualized 6% on a linked quarter basis due to expected attrition from recently converted Teche portfolio • Continued focus on productivity and efficiency of the delivery network – opened one branch in 3Q14, did not close any branches in 3Q14, and two additional branch openings targeted by year-end 2014 • Acceptance and usage of digital delivery continues to increase among our client base Excludes acquired loans and deposits |
APPENDIX Market Highlights For 3Q14 50 • Competitive pressure remains strong for high quality commercial and business banking clients in terms of both pricing and structure • Houston, New Orleans, Baton Rouge, Birmingham, and Huntsville showed strong commercial loan originations • Total commitments originated during 3Q14 of $1.2 billion with 34% fixed rate and 66% floating rate • Commercial loans originated and funded in 3Q14 totaled $445 million with a mix of 23% fixed and 77% floating ($775 million in commercial loan commitments during the quarter) • Strong commercial pipeline in excess of $629 million at quarter-end • Total Small Business loan growth of $66 million, or +6%, on a linked-quarter basis • Period-end core deposit increase of $307 million, with non-interest bearing deposits up $110 million (up $309 million linked quarter growth on an average balance basis) – mainly as a result of the Teche and First Private acquisitions |
 APPENDIX Weekly Locked Mortgage Pipeline Trends 51 • Significant pipeline declines in winter months • Seasonal rebound commences at the start of each year through spring months into early summer • Most recent decline was 40% since start of October 2013 • 2014 trending is consistent with prior years • Weekly locked pipeline was $194 million at October 10, 2014, up 8% since September 30, 2014 |
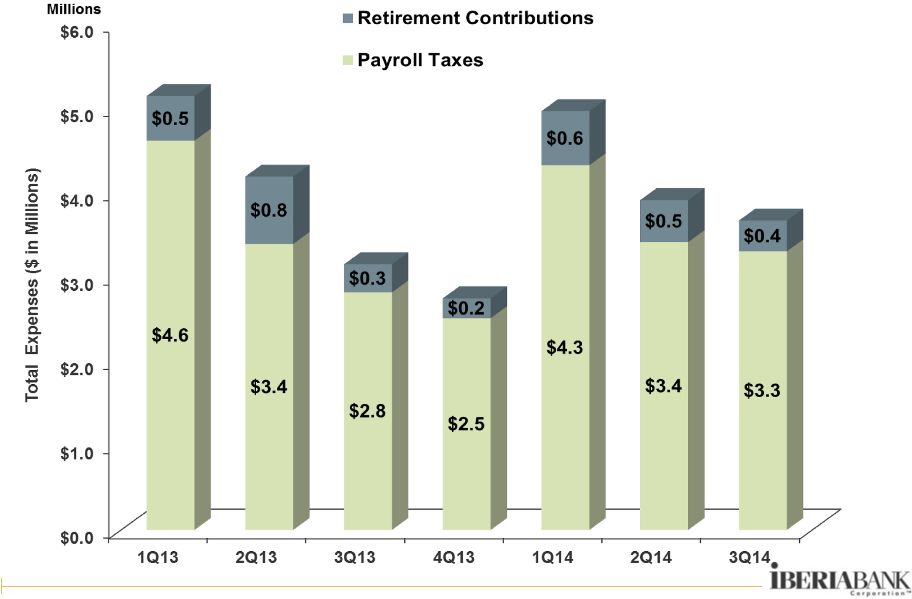 APPENDIX Payroll Taxes And Retirement Contributions 52 3Q14 includes full quarter of Teche and First Private results |
 APPENDIX Checking NSF-Related Charges 53 3Q14 includes full quarter of Teche and First Private results |
 APPENDIX Non-Operating Items (Non-GAAP) 54 For The Quarter Ended September 30, 2013 June 30, 2014 September 30, 2014 Dollar Amount Dollar Amount Dollar Amount Pre-tax After-tax (2) Per share Pre-tax After-tax (2) Per share Pre-tax After-tax (2) Per share Net Income (Loss) (GAAP) $ 30,549 $ 23,192 $ 0.78 $ 24,819 $ 18,548 $ 0.60 $ 40,930 $ 29,744 $ 0.89 Non-interest income adjustments Gain on sale of investments and other non-interest income (13) (8) (0.00) (9) (6) (0.00) (582) (378) (0.01) Non-interest expense adjustments Merger-related expenses 85 55 0.00 10,419 6,840 0.22 1,752 1,139 0.04 Severance expenses 554 360 0.01 5,466 3,553 0.11 1,226 797 0.02 (Gain) Loss on sale of long-lived assets, net of impairment 977 635 0.02 1,241 807 0.03 4,213 2,738 0.08 (Reversal of) Provision for FDIC clawback liability 667 434 0.01 - - - (797) (518) (0.02) Other non-operating non-interest expense (36) (23) (0.00) 18 12 0.00 1 1 (0.00) Operating earnings (Non-GAAP) (3) 32,783 24,644 0.83 41,954 29,754 0.96 46,743 33,523 1.00 Covered and acquired impaired (reversal of) provision for loan losses (854) (555) (0.02) 1,744 1,134 0.04 1,692 1,100 0.03 Other (reversal of) provision for loan losses 2,868 1,864 0.07 3,004 1,953 0.06 4,022 2,614 0.08 Pre-provision operating earnings (Non-GAAP) (3) $ 34,797 $ 25,954 $ 0.89 $ 46,702 $ 32,841 $ 1.06 $ 52,457 $ 37,237 $ 1.11 (dollars in thousands) Non-operating adjustments equal to $5.8 million pre-tax or $0.11 EPS after-tax: • 3Q14 Merger related expense of $1.8 million pre-tax or $0.04 EPS after-tax • 3Q14 Severance expense of $1.2 million pre-tax or $0.02 EPS after-tax • Net impairment expense of $4.2 million pre-tax or $0.08 EPS after-tax (1) Per share amounts may not appear to foot due to rounding. (2) After-tax amounts estimated based on a 35% marginal tax rate. • Reversal of provisioning for FDIC clawback liability of $0.7 million pre-tax or $0.02 after tax RECONCILIATION OF NON-GAAP FINANCIAL MEASURES (1) |
 APPENDIX Expected Quarterly Re-Pricing Schedule 55 Excludes FDIC loans and receivable, non-accrual loans and market value adjustments $ in millions Note: Amounts exclude re-pricing of assets and liabilities from prior quarters 4Q14 1Q15 2Q15 3Q15 4Q15 Cash Equivalents Balance 481.1 $ - $ - $ - $ - $ Rate 0.69% 0.00% 0.00% 0.00% 0.00% Investments Balance 68.6 $ 60.9 $ 77.1 $ 84.1 $ 82.9 $ Rate 3.02% 2.97% 2.92% 2.75% 2.82% Fixed Rate Loans Balance 200.2 $ 145.0 $ 158.9 $ 177.3 $ 150.6 $ Rate 4.94% 4.95% 5.05% 4.96% 4.91% Variable Rate Loans Balance 4,840.3 $ 35.4 $ 40.4 $ 44.4 $ 17.5 $ Rate 3.28% 3.02% 3.11% 3.54% 3.36% Held for Sale Loans Balance 148.5 $ - $ - $ - $ - $ Rate 3.52% 0.00% 0.00% 0.00% 0.00% Time Deposits Balance 702.8 $ 314.2 $ 321.9 $ 256.4 $ 104.6 $ Rate 0.38% 0.62% 0.70% 0.80% 0.84% Repos/ST Debt Balance 504.8 $ 180.0 $ 125.0 $ - $ - $ Rate 0.15% 0.19% 0.20% 0.00% 0.00% Borrowed Funds Balance 126.5 $ 2.1 $ 10.1 $ 3.3 $ 1.9 $ Rate 3.11% 3.20% 3.49% 3.95% 3.60% |
 APPENDIX Interest Rate Simulation 56 • Asset sensitive from an interest rate risk position • The degree of asset sensitivity is a function of the reaction of competitors to changes in deposit pricing • Forward curve has a positive impact over 12 months Source: Bancware model, as of September 30, 2014 * Assumes instantaneous and parallel shift in interest rates based on static balance sheet Base Blue Forward Change In: -200 bp* -100 bp* Case +100 bp* +200 bp* Chip Curve Net Interest Income -4.6% -2.0% 0.0% 4.9% 9.8% 1.1% 1.0% Economic Value of Equity -12.1% -17.7% 0.0% 2.7% 7.8% -0.1% -0.1% |
 APPENDIX Expected Amortization 57 Projected average balance includes the balance of the Indemnification Asset $ in Millions Q1 2013 Revenues Amortization 41.6 $ 30.3 $ $ 13.9 $ Q2 2013 Q3 2013 Q4 2013 2013 Q1 2014 Q2 2014 Q3 2014 Q4 2014 2014 Q1 2015 (17.0) (25.1) $ $ $ $ 11.9 (27.7) (18.1) $ (29.1) (97.8) $ (8.7) (70.1) $ Net covered Income $ 12.2 Balance 1,424 $ 1,224 $ $ $ $ 23.0 $ $ 93.1 $ $ (22.9) $ (4.0) $ 42.1 $ 5.1 $ $ 23.0 1,100 $ 941 $ 1,171 $ 846 $ 756 $ 670 $ 573 $ 711 504 30.9 $ 139.9 25.9 30.2 13.9 $ 6.7 $ 6.0 5.3 $ 7.9 $ $ $ 8.0 37.1 $ 8.0 (19.3) 2.00% 3.00% 4.00% 5.00% 6.00% 7.00% 8.00% $0 $300 $600 $900 $1,200 $1,500 Q1 2013 Q2 2013 Q3 2013 Q4 2013 Q1 2014 Q2 2014 Q3 2014 Q4 2014 Q1 2015 Projected Average Balance Projected Net Yield $ $ $ $ Projected Average Balances and Net Yields |