|
ANALYST-INVESTOR DAY
Presentation Materials
February 27, 2015
1
|
Safe Harbor And Legend
To the extent that statements in this presentation relate to future plans, objectives, financial results or performance of IBERIABANK Corporation, these statements are deemed to be forward-looking statements within the meaning of the Private Securities Litigation Reform Act of 1995. Such statements, which are based on management’s current information, estimates and assumptions and the current economic environment, are generally identified by the use of the words “plan”, “believe”, “expect”, “intend”, “anticipate”, “estimate”, “project” or similar expressions. The Company’s actual strategies, results and financial condition in future periods may differ materially from those currently expected due to various risks and uncertainties. Forward-looking statements are subject to numerous assumptions, risks and uncertainties that change over time and could cause actual results or financial condition to differ materially from those expressed in or implied by such statements. Consequently, no forward-looking statement can be guaranteed. Hypothetical information isnot aprojection of future performance.
In connection with the pending transactions with Florida Bank Group, Inc., Old Florida Bancshares, Inc., and Georgia Commerce Bancshares, Inc., IBERIABANK Corporation has filed Registration Statements on Form S-4 that contain proxy statement / prospectuses. INVESTORS AND SECURITY HOLDERS ARE URGED TO CAREFULLY READ THE PROXY STATEMENT / PROSPECTUSES REGARDING THE PROPOSED TRANSACTIONS, BECAUSE SUCH DOCUMENTS CONTAIN IMPORTANT INFORMATION. Investors and security holders may obtain a free copy of the proxy statement / prospectuses (when they are available) and other documents containing information about the pending transactions, without charge, at the SEC’s website at http://www.sec.gov. Copies of the proxy statement / prospectuses and the SEC filings that will be incorporated by reference in the proxy statement / prospectuses may also be obtained forfree from the IBERIABANK Corporation website, www.iberiabank.com, under the heading “Investor Information.”
This communication is not a solicitation of any vote or approval, is not an offer to purchase shares of common stock of Georgia Commerce Bancshares, Inc., nor is it an offer to sell shares of IBERIABANK Corporation common stock which may be issued in the proposed merger. The issuance of IBERIABANK Corporation common stock in any proposed merger would have to be registered under the Securities Act of 1933, as amended, and such IBERIABANK Corporation common stock would be offered only by means of a prospectus complying with the Act.
2
|
DISCUSSION TOPICS
Overview
Welcome, Introductions, and Logistics…
Energy Discussion
Update Regarding Our Recent Initiatives.
Guest Speaker
Our Markets and Growth
M&A Update
Interest Rate Risk
Strategic Goals
Closing
Daryl Byrd Randy Bryan Kevin Rafferty Carmen Jordan Bryan Chapman
Anthony Restel Stephen Moret
Secretary of the Louisiana of Economic Development
Michael Brown John Davis Anthony Restel Anthony Restel Daryl Byrd
3
|

ENERGY DISCUSSION
4
|
ENERGY DISCUSSION
Presenting Today
J. Randolph Bryan – Chief Risk Officer
Energy Lending Team Leadership
Bryan Chapman – EVP / Energy Lending
Carmen Jordan – EVP / Houston Market President
Kevin Rafferty – EVP / Texas State President
IBERIA Capital Partners Leadership / Available for Q&A
Jefferson G. Parker – Vice Chairman & President, IBERIA Capital Partners
Cliff Worley – Managing Director—Investment Banking
5
|
ENERGY DISCUSSION
Risks And Potential Impact
We think about risks presented by the decline in energy commodity prices across four perspectives, and its impact on:
The energy lending portfolio from an asset quality standpoint
The local markets in which we operate that have a significant energy presence, primarily Houston and Lafayette and the individuals and non-energy related businesses that operate there
Our forecast for growth and earnings
Our share price
6
|
ENERGY DISCUSSION
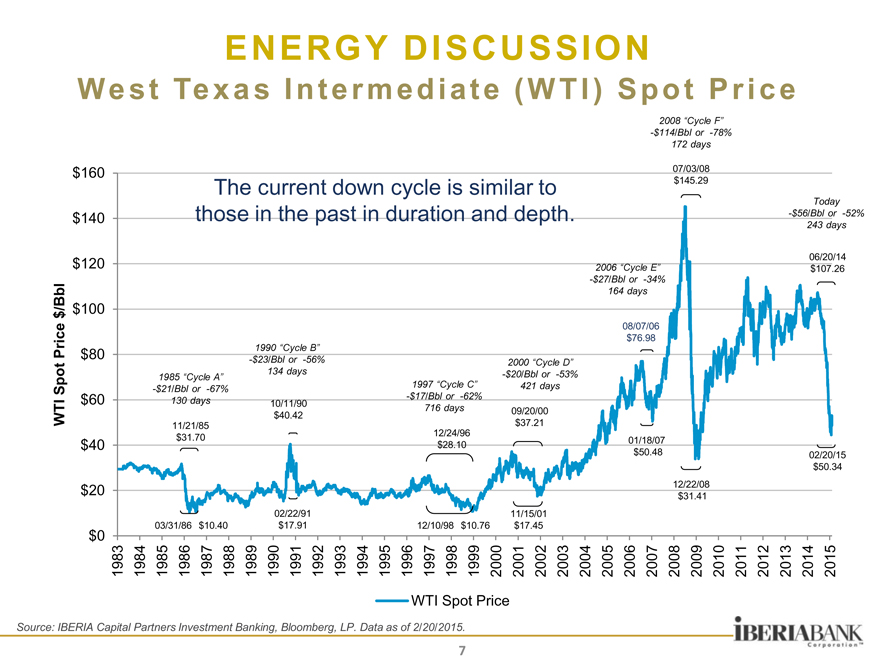
West Texas Intermediate (WTI) Spot Price
WTI Spot Price
$160 $140 $120 $100 $80 $60 $40 $20 $0
1983
1984
1985
1986
1987
1988
1989
1990
1991
1992
1993
1994
1995
1996
1997
1998
1999
2000
2001
2002
2003
2004
2005
2006
2007
2008
2009
2010
2011
2012
2013
2014
2015
The current down cycle is similar to those in the past in duration and depth.
2008 “Cycle F”
-$114/Bbl or -78% 172 days
07/03/08 $145.29
Today
-$56/Bbl or -52% 243 days
06/20/14 $107.26
2006 “Cycle E”
-$27/Bbl or -34% 164 days
08/07/06 $76.98
1985 “Cycle A”
-$21/Bbl or -67% 130 days
11/21/85 $31.70
1990 “Cycle B”
-$23/Bbl or -56% 134 days
10/11/90 $40.42
1997 “Cycle C”
-$17/Bbl or -62% 716 days
12/24/96 $28.10
2000 “Cycle D”
-$20/Bbl or -53% 421 days
09/20/00 $37.21
01/18/07 $50.48
12/22/08 $31.41
02/20/15 $50.34
02/22/91 11/15/01
03/31/86 $10.40 $17.91 12/10/98 $10.76 $17.45
WTI Spot Price
Source: IBERIA Capital Partners Investment Banking, Bloomberg, LP. Data as of 2/20/2015.
7
|
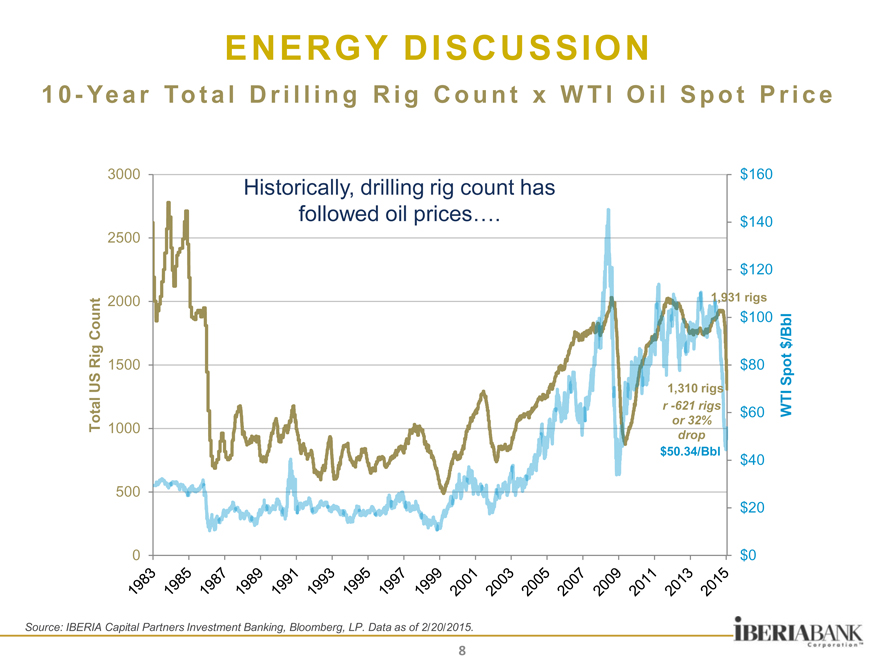
3000 2500 2000 1500 1000 500 0
Total US Rig Count
Historically, drilling rig count has followed oil prices….
1,931 rigs
$160 $140 $120
$100 $80 $60 $40 $20 $0
WTI Spot
1,310 rigs r -621 rigs or 32% drop $50.34/Bbl
Source: IBERIA Capital Partners Investment Banking, Bloomberg, LP. Data as of 2/20/2015.
8
|
ENERGY DISCUSSION
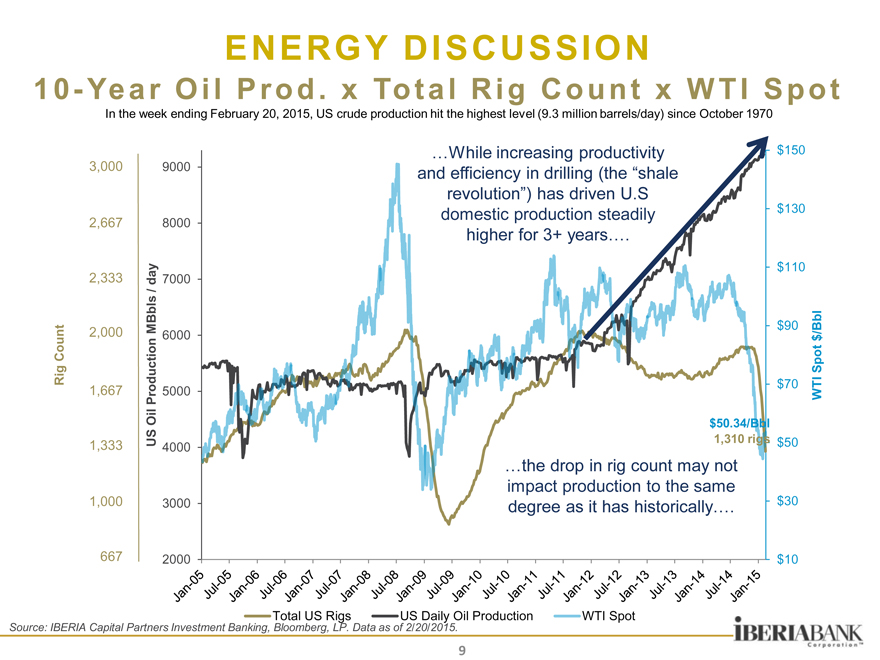
10-Year Oil Prod. x Total Rig Count x WTI Spot
In the week ending February 20, 2015, US crude production hit the highest level (9.3 million barrels/day) since October 1970
…While increasing productivity and efficiency in drilling (the “shale revolution”) has driven U.S domestic production steadily higher for 3+ years….
3,000
2,667
2,333
2,000
1,667
1,333
1,000
667
Rig Count
US Oil Production MBbls / day
9000 8000 7000 6000 5000 4000 3000 2000
9000 8000 7000 6000 5000 4000 3000 2000
$150
$130
$110
$90 /Bbl $ Spot
$70 WTI $50
$30
$10
$50.34/Bbl 1,310 rigs
Total US Rigs US Daily Oil Production WTI Spot
Source: IBERIA Capital Partners Investment Banking, Bloomberg, LP. Data as of 2/20/2015.
9
|
ENERGY DISCUSSION
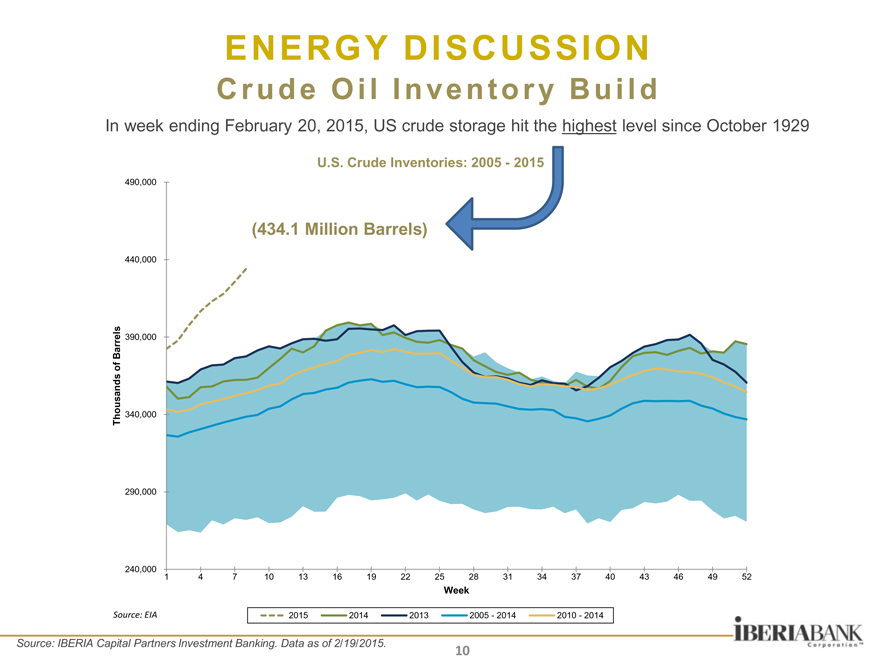
Crude Oil Inventory Build
In week ending February 20, 2015, US crude storage hit the highest level since October 1929
U.S. Crude Inventories: 2005—2015
490,000
440,000
Barrels 390,000 of s Thousand 340,000
290,000
240,000 1
Source: EIA
(434.1 Million Barrels)
4 7 10 1316 192225 2831 3437 404346 4952
Week
2015 2014 2013 2005—2014 2010—2014
Source: IBERIA Capital Partners Investment Banking. Data as of 2/19/2015.
10
|

ENERGY DISCUSSION
Global Crude Supply Versus Demand
Downside Risk As Supply Continues To Outstrip Demand
Million barrels / day
96 94 92 90 88 86 84 82 80 78
4Q14 oversupply of ~914,000 Barrels / day
projections
6 5 4 3 2 1 0 -1 -2 -3
Million barrels / day
Most recent 4 quarters of oversupply, with 4 more projected
2010 2011 2012 2013 2014 2015 2016
Implied Stock Change and Balance Global Supply Global Demand
Source: EIA, Short-Term Energy Outlook, February 2015.
11
|
ENERGY DISCUSSION
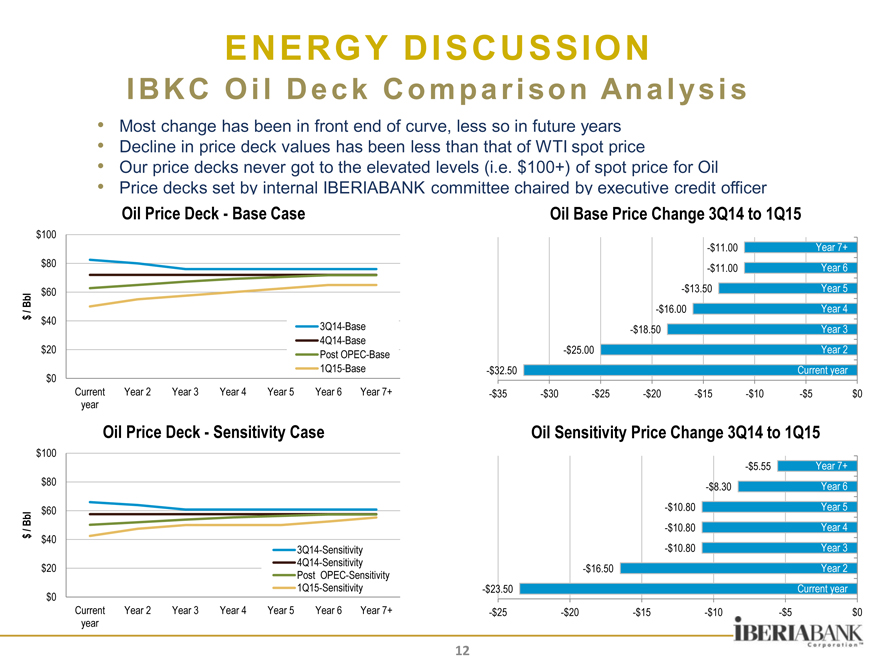
IBKC Oil Deck Comparison Analysis
Most change has been in front end of curve, less so in future years
Decline in price deck values has been less than that of WTI spot price
Our price decks never got to the elevated levels (i.e. $100+) of spot price for Oil
Price decks set by internal IBERIABANK committee chaired by executive credit officer
Oil Price Deck—Base Case Oil Base Price Change 3Q14 to 1Q15
$100
$80
$60
Bbl / $ $40
$20
$0
$100
$80
$60
Bbl / $ $40
$20
$0
3Q14-Base 4Q14-Base Post OPEC-Base 1Q15-Base
Current Year 2 Year 3 Year 4 Year 5 Year 6 Year 7+ year
Oil Price Deck—Sensitivity Case
3Q14-Sensitivity 4Q14-Sensitivity Post OPEC-Sensitivity 1Q15-Sensitivity Current Year 2 Year 3 Year 4 Year 5 Year 6 Year 7+ year
Oil Base Price Change 3Q14 to 1Q15
-$11.00 Year 7+
-$11.00 Year 6
-$13.50 Year 5
-$16.00 Year 4
-$18.50 Year 3
-$25.00 Year 2
-$32.50 Current year
-$35 -$30 -$25 -$20 -$15 -$10 -$5 $0
Oil Sensitivity Price Change 3Q14 to 1Q15
-$5.55 Year 7+
-$8.30 Year 6
-$10.80 Year 5
-$10.80 Year 4
-$10.80 Year 3
-$16.50 Year 2
-$23.50 Current year
-$25 -$20 -$15 -$10 -$5 $0
|
ENERGY DISCUSSION
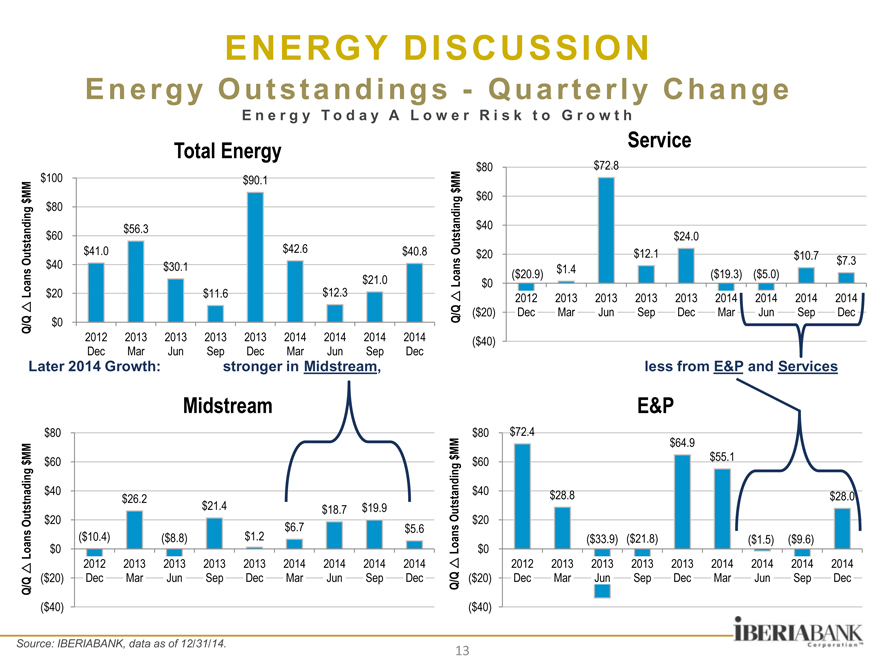
Energy Outstandings—Quarterly Change
Energy T o d a y A L o w e r R i s k t o G r o w t h
Service Total Energy $72.8
M $100 $90.1 $ M $80
$56.3 $60
Outstanding $41.0 $42.6 $40.8 ns $40 $30.1
$21.0 Loa $20 $11.6 $12.3
Q/Q $0
2012 2013 2013 2013 2013 2014 2014 2014 2014 Dec Mar Jun Sep Dec Mar Jun Sep Dec
Later 2014 Growth: stronger in Midstream,
Midstream
$80
$60 g $40 $26.2 $21.4 $18.7 $19.9
Outstnadin $20 $6.7 $5.6
($10.4) ($8.8) $1.2
Loans $0
2012 2013 2013 2013 2013 2014 2014 2014 2014
($20) Dec Mar Jun Sep Dec Mar Jun Sep Dec
Q/Q
($40)
$80 $72.8 $ MM $60
Outstanding $40 $24.0
$20 $12.1 $10.7 $7.3 oans ($20.9) $1.4 ($19.3) ($5.0) L $0 2012 2013 2013 2013 2013 2014 2014 2014 2014 Q/Q ($20) Dec Mar Jun Sep Dec Mar Jun Sep Dec
($40)
less from E&P and Services
E&P
$80 $72.4 $64.9 $55.1 g $60
Outstandin $40 $28.8 $28.0 $20
($33.9) ($21.8) ($1.5) ($9.6)
Loans $0
2012 2013 2013 2013 2013 2014 2014 2014 2014 Q/Q ($20) Dec Mar Jun Sep Dec Mar Jun Sep Dec
($40)
Source: IBERIABANK, data as of 12/31/14.
13
|
ENERGY DISCUSSION
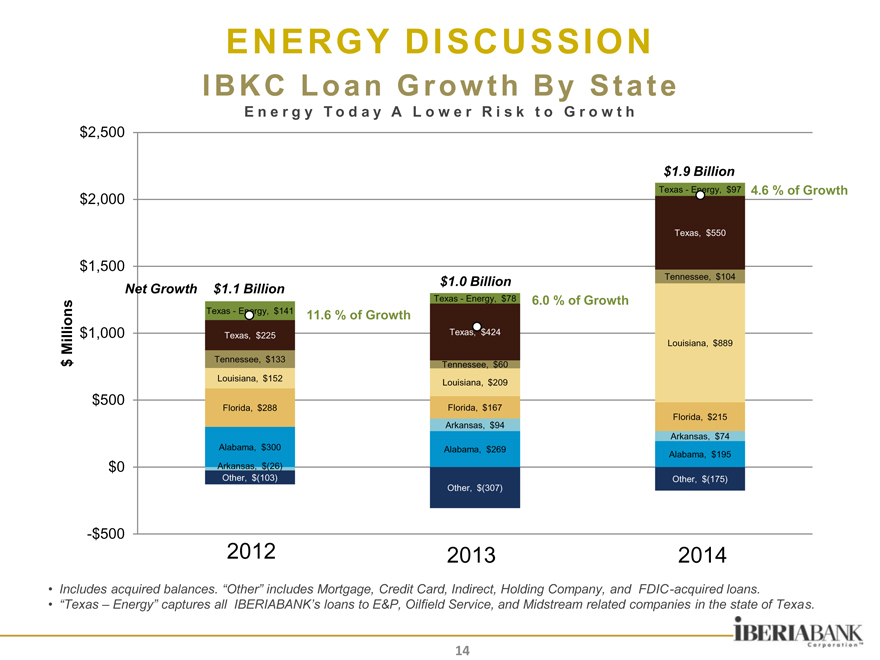
IBKC LoanGrowthByState
Energy T o d a y A L o w e r R i s k t o G r o w t h
$2,500
$2,000
$1,500
Millions $1,000 $
$500
$0
-$500
$1.9 Billion
Texas—Energy, $97 4.6 % of Growth
Texas, $550
$1.0 Billion Tennessee, $104
Net Growth $1.1 Billion Texas—Energy, $78 6.0 % of Growth
Texas—Energy, $141 11.6 % of Growth
Texas, $225 Texas, $424
Louisiana, $889 Tennessee, $133 Tennessee, $60 Louisiana, $152 Louisiana, $209
Florida, $288 Florida, $167
Arkansas, $94 Florida, $215 Arkansas, $74 Alabama, $300 Alabama, $269 Alabama, $195 Arkansas, $(26) Other, $(103) Other, $(175) Other, $(307)
2012 2013 2014
Includes acquired balances. “Other” includes Mortgage, Credit Card, Indirect, Holding Company, and FDIC-acquired loans.
“Texas – Energy” captures all IBERIABANK’s loans to E&P, Oilfield Service, and Midstream related companies in the state of Texas.
14
|
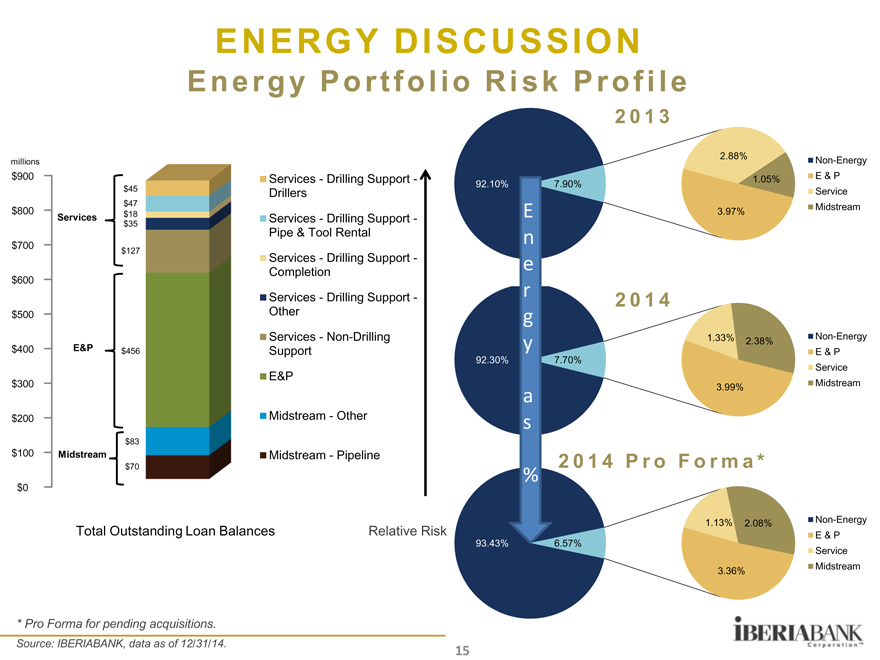
ENERGY DISCUSSION
Energy Portfolio Risk Profile
2013
millions
$900 Services—Drilling Support -
$45 Drillers
$47
$800 Services $18 Services—Drilling Support -
$35
Pipe & Tool Rental
$700 $127
Services—Drilling Support -
Completion
$600
Services—Drilling Support -
$500 Other
Services—Non-Drilling
$400 E&P $456 Support
$300 E&P
$200 Midstream—Other
$83
$100 Midstream Midstream—Pipeline
$70
$0
Total Outstanding Loan Balances Relative Risk
2.88% Non-Energy
1.05% E & P
92.10% 7.90%
Service
E 3.97% Midstream
n
e
r 2014
g
y 1.33% 2.38% Non-Energy
E & P
92.30% 7.70%
Service
Midstream
a 3.99%
s
2 0 1 4 P r o F o r m a *
%
1.13% 2.08% Non-Energy
E & P
93.43% 6.57%
Service
3.36% Midstream
* Pro Forma for pending acquisitions.
Source: IBERIABANK, data as of 12/31/14.
15
|
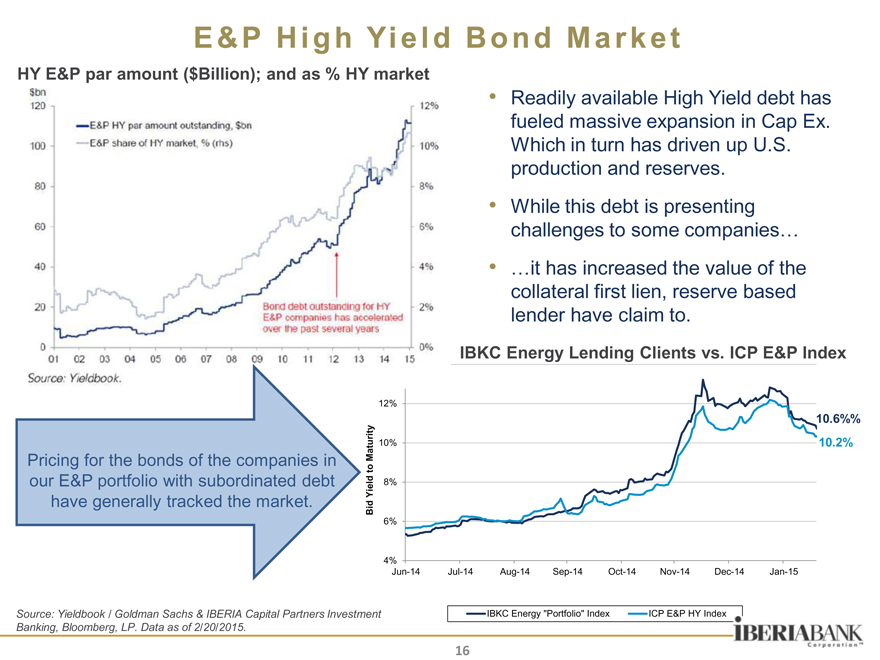
E&P High Yield Bond Market
HY E&P par amount ($Billion); and as % HY market
Source: Yieldbook / Goldman Sachs & IBERIA Capital Partners Investment Banking, Bloomberg, LP. Data as of 2/20/2015.
Readily available High Yield debt has fueled massive expansion in Cap Ex. Which in turn has driven up U.S. production and reserves.
While this debt is presenting challenges to some companies…
…it has increased the value of the collateral first lien, reserve based lender have claim to.
IBKC Energy Lending Clients vs. ICP E&P Index
12%
10.6%%
Maturity 10% 10.2% o t Yield 8% Bid
6%
4%
Jun-14 Jul-14 Aug-14 Sep-14 Oct-14 Nov-14 Dec-14 Jan-15
IBKC Energy “Portfolio” Index ICP E&P HY Index
16
|
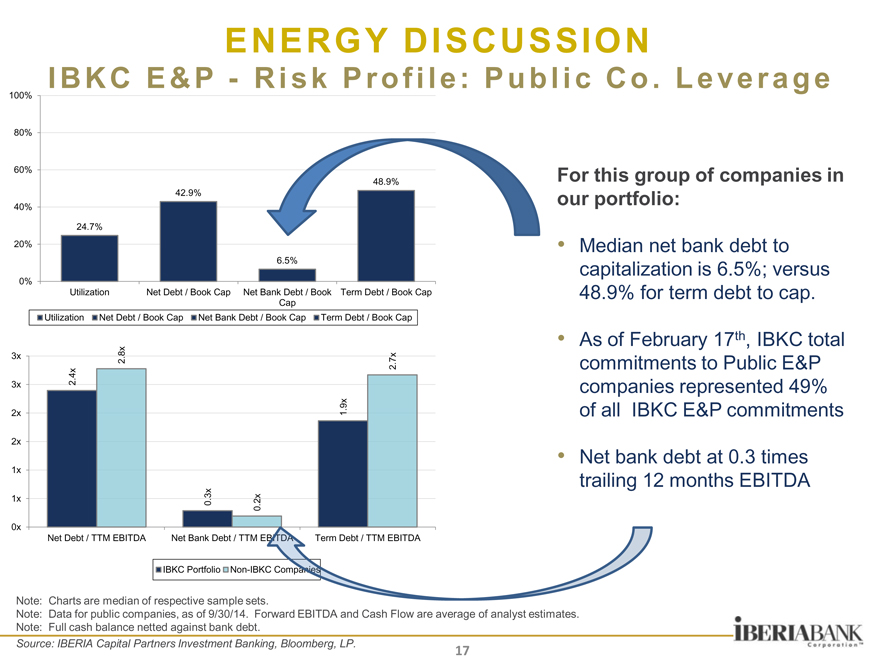
ENERGY DISCUSSION
IBKC E&P—Risk Profile: Public Co. Leverage
100%
80%
60%
48.9%
42.9% 40%
24.7% 20%
6.5%
0%
Utilization Net Debt / Book Cap Net Bank Debt / Book Term Debt / Book Cap Cap Utilization Net Debt / Book Cap Net Bank Debt / Book Cap Term Debt / Book Cap
3x . 8x
2 . 7x 2 . 4x
3x 2
. 9x
2x 1 2x
1x
1x . 3x
0 . 2x 0
0x
Net Debt / TTM EBITDA Net Bank Debt / TTM E rm Debt / TTM EBITDA
IBKC Portfolio Non-IBKC Com
For this group of companies in our portfolio:
Median net bank debt to capitalization is 6.5%; versus 48.9% for term debt to cap.
As of February 17th, IBKC total commitments to Public E&P companies represented 49% of all IBKC E&P commitments
Net bank debt at 0.3 times trailing 12 months EBITDA
Note: Charts are median of respective sample sets.
Note: Data for public companies, as of 9/30/14. Forward EBITDA and Cash Flow are average of analyst estimates. Note: Full cash balance netted against bank debt.
Source: IBERIA Capital Partners Investment Banking, Bloomberg, LP.
17
|
18
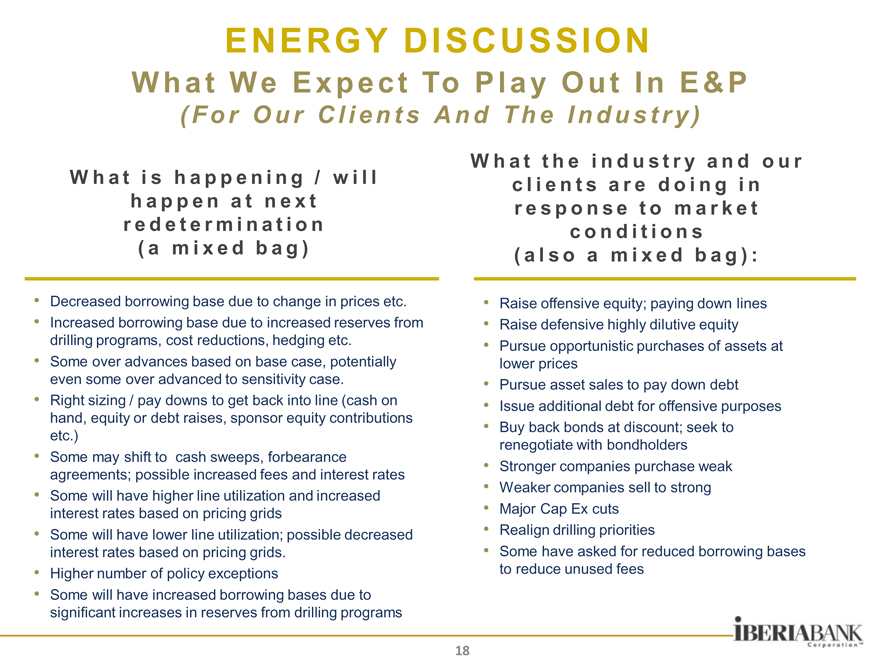
Decreased borrowing base due to change in prices etc.
Increased borrowing base due to increased reserves from drilling programs, cost reductions, hedging etc.
Some over advances based on base case, potentially even some over advanced to sensitivity case.
Right sizing / pay downs to get back into line (cash on hand, equity or debt raises, sponsor equity contributions etc.)
Some may shift to cash sweeps, forbearance agreements; possible increased fees and interest rates
Some will have higher line utilization and increased interest rates based on pricing grids
Some will have lower line utilization; possible decreased interest rates based on pricing grids.
Higher number of policy exceptions
Some will have increased borrowing bases due to significant increases in reserves from drilling programs
Raise offensive equity; paying down lines
Raise defensive highly dilutive equity
Pursue opportunistic purchases of assets at lower prices
Pursue asset sales to pay down debt
Issue additional debt for offensive purposes
Buy back bonds at discount; seek to renegotiate with bondholders
Stronger companies purchase weak
Weaker companies sell to strong
Major Cap Ex cuts
Realign drilling priorities
Some have asked for reduced borrowing bases to reduce unused fees
W h a t t h e i n d u s t r y a n d o u r c l i e n t s a r e d o i n g i n r e s p o n s e t o m a r k e t c o n d i t i o n s ( a l s o a m i x e d b a g ) :
W h a t i s h a p p e n i n g / w i l l h a p p e n a t n e x t r e d e t e r m i n a t i o n ( a m i x e d b a g )
ENERGY DISCUSSION
What We Expect To Play Out In E&P
( F o r O u r C l i e n t s A n d T h e I n d u s t r y )
ENERGY DISCUSSION
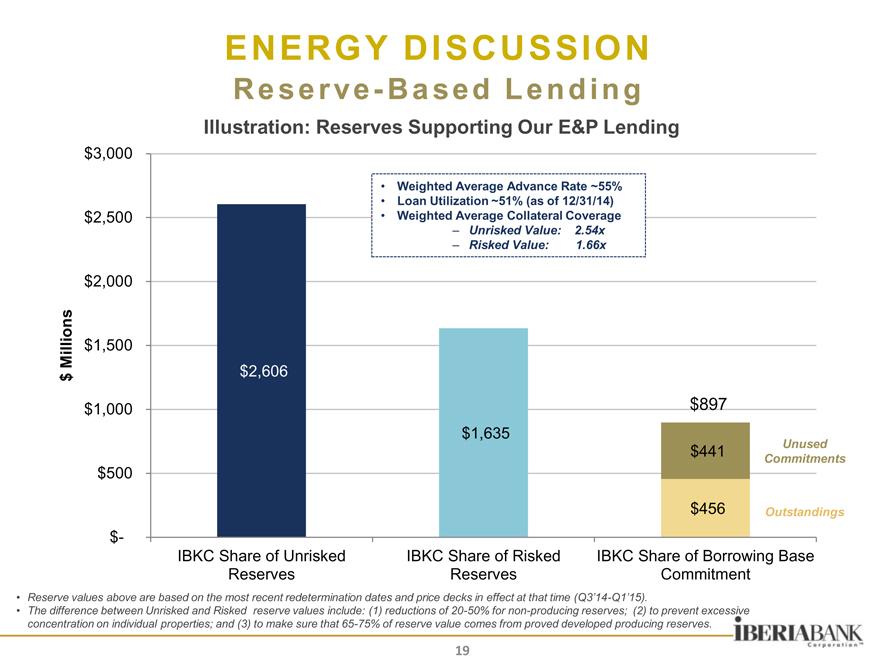
Reserve-Based Lending
Illustration: Reserves Supporting Our E&P Lending
$ Millions
$3,000 $2,500 $2,000 $1,500 $1,000 $500 $-
Weighted Average Advance Rate ~55%
Loan Utilization ~51% (as of 12/31/14)
Weighted Average Collateral Coverage
– Unrisked Value: 2.54x
– Risked Value: 1.66x
$2,606 $897 $1,635
Unused
$441
Commitments
$456 Outstandings
IBKC Share of Unrisked IBKC Share of Risked IBKC Share of Borrowing Base Reserves Reserves Commitment
Reserve values above are based on the most recent redetermination dates and price decks in effect at that time (Q3’14-Q1’15).
The difference between Unrisked and Risked reserve values include: (1) reductions of 20-50% for non-producing reserves; (2) to prevent excessive concentration on individual properties; and (3) to make sure that 65-75% of reserve value comes from proved developed producing reserves.
19
|
ENERGY DISCUSSION
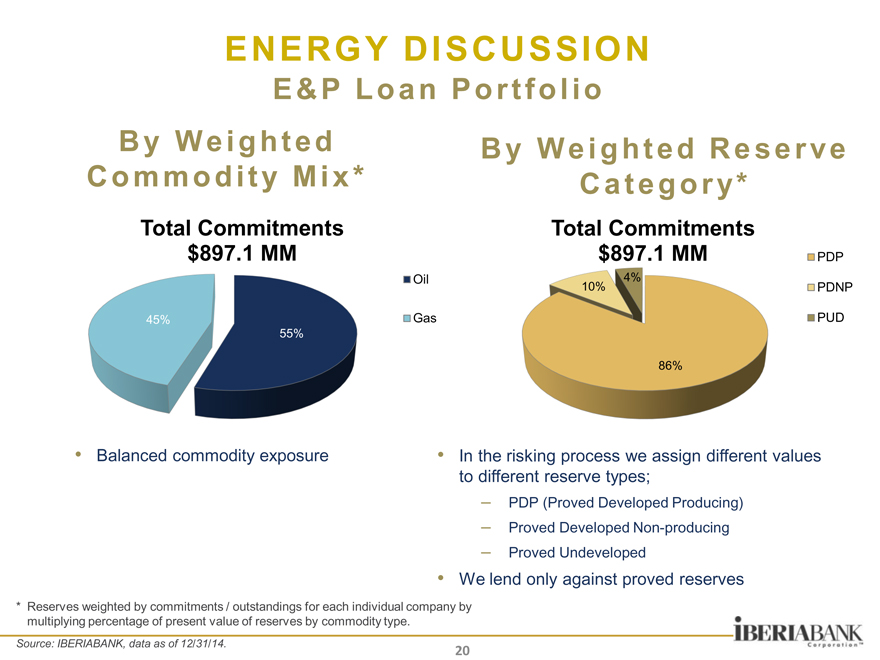
E&P Loan Portfolio
By Weighted By Weighted Reserve Commodity Mix* Category*
Total Commitments Total Commitments $897.1 MM $897.1 MM PDP
PDNP
PUD
45%
55%
Oil
Gas
Balanced commodity exposure
In the risking process we assign different values to different reserve types;
– PDP (Proved Developed Producing)
– Proved Developed Non-producing
– Proved Undeveloped
We lend only against proved reserves
* Reserves weighted by commitments / outstandings for each individual company by multiplying percentage of present value of reserves by commodity type.
Source: IBERIABANK, data as of 12/31/14.
20
|
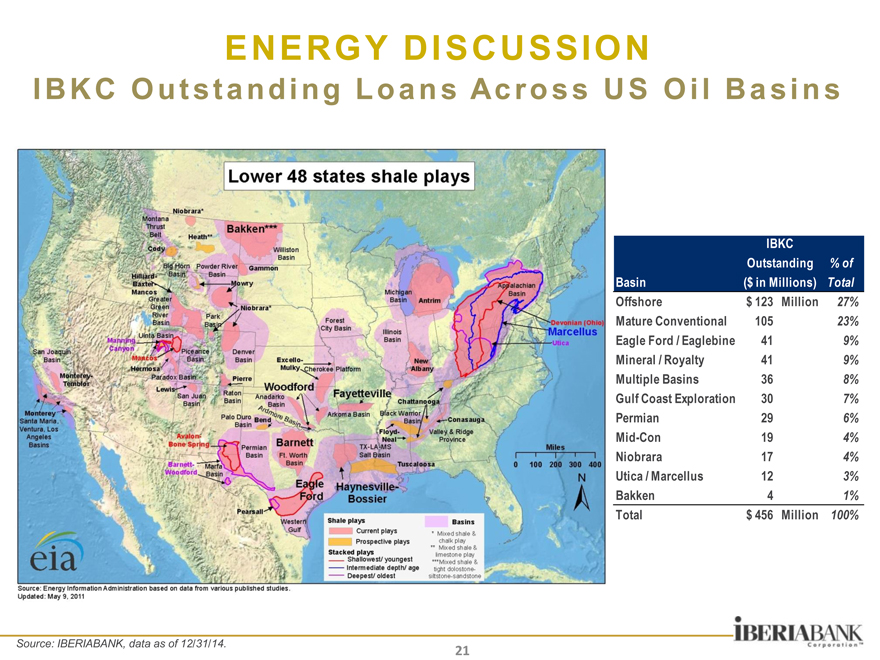
ENERGY DISCUSSION
IBKC Outstanding Loans Across US Oil Basins
IBKC
Outstanding % of
Basin ($ in Millions) Total
Offshore $ 123 Million 27%
Mature Conventional 105 23%
Eagle Ford / Eaglebine 41 9%
Mineral / Royalty 41 9%
Multiple Basins 36 8%
Gulf Coast Exploration 30 7%
Permian 29 6%
Mid-Con 19 4%
Niobrara 17 4%
Utica / Marcellus 12 3%
Bakken 4 1%
Total $ 456 Million 100%
Source: IBERIABANK, data as of 12/31/14.
21
|
Estimated Oil
US D&C Capex ($mm) Production (MBbl/d)
Prev New Prev New
Company 2014 2015 2015 2014 2015 2015
APA $5,400 $4,000 $2,200 144 165 147
AR $2,400 N/A $1,600 N/A N/A 4.0
BCEI $572 N/A $382 N/A N/A N/A
CLR $4,085 $4,030 $2,373 123 N/A N/A
COP $6,500 N/A $5,000 780.7 N/A 804.1
CPE $234 $294 $174 4.6 6.8 6.5
CRK $508 $534 $244 12.0 16.7 10.4
CRZO $714 $762 $460 18.9 27.3 22.0
CVX $8,799 N/A $8,200 N/A N/A N/A
CXO $2,300 $2,700 $1,800 70.6 93.2 84.6
DNR $900 $950 $505 73.0 76.7 74.5
EOG $6,500 N/A $4,000 282.0 317.5 280.0
EOX $284 $237 $76 3.4 5.4 4.2
EPE $1,800 N/A $1,100 54.8 N/A 60.0
FANG $450 $736 $425 14.2 21.7 19.4
GDP $342 $175 $90 2.9 6.5 5.0
HES $2,550 N/A $1,990 127.0 N/A N/A
HK $1,100 $750 $400 35 41.1 35.7
LINE $1,550 N/A $730 73.0 N/A 63.4
LPI $1,007 $922 $430 18.3 24.4 20.8
MTDR $478 $500 $269 16.1 26.2 22.8
NBL $3,200 N/A $1,800 68.0 N/A 71.0
OAS $1,327 $1,378 $744 40.1 52.2 43.0
PDCE $628 $557 $473 11.8 N/A 14.0
PE $430 N/A $203 7.8 N/A 10.9
PVA $630 N/A $290 13.7 N/A 14.5
PXD $3,186 N/A $1,547 87.0 N/A 103.7
ROSE $1,200 $950 $750 17.6 21.6 21.3
RRC $1,190 $1,066 $722 N/A N/A N/A
RSPP $425 N/A $400 8.5 N/A 13
SGY $895 $875 $392 15.6 20.2 16.3
SN $715 $1,076 $569 16.5 23.1 18.6
SWN $2,105 N/A $2,435 N/A N/A N/A
TPLM $418 $505 $175 8.9 12.6 10.0
UPL $600 N/A $460 10.4 18.4 N/A
XEC $1,880 N/A 1000 42.8 N/A N/A
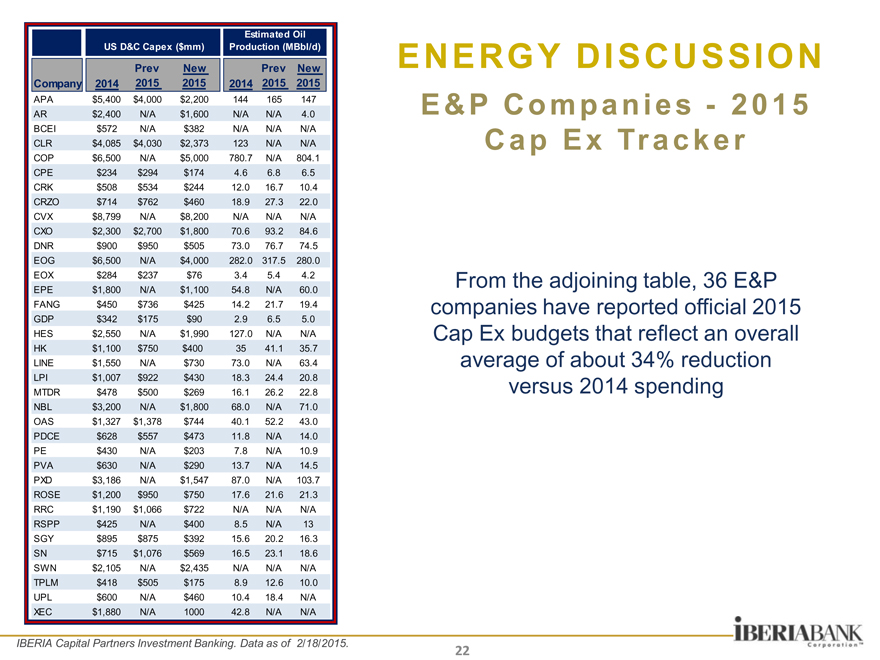
ENERGY DISCUSSION
E&P Companies—2015 Cap Ex Tracker
From the adjoining table, 36 E&P companies have reported official 2015 Cap Ex budgets that reflect an overall average of about 34% reduction versus 2014 spending
IBERIA Capital Partners Investment Banking. Data as of 2/18/2015.
22
|
ENERGY DISCUSSION
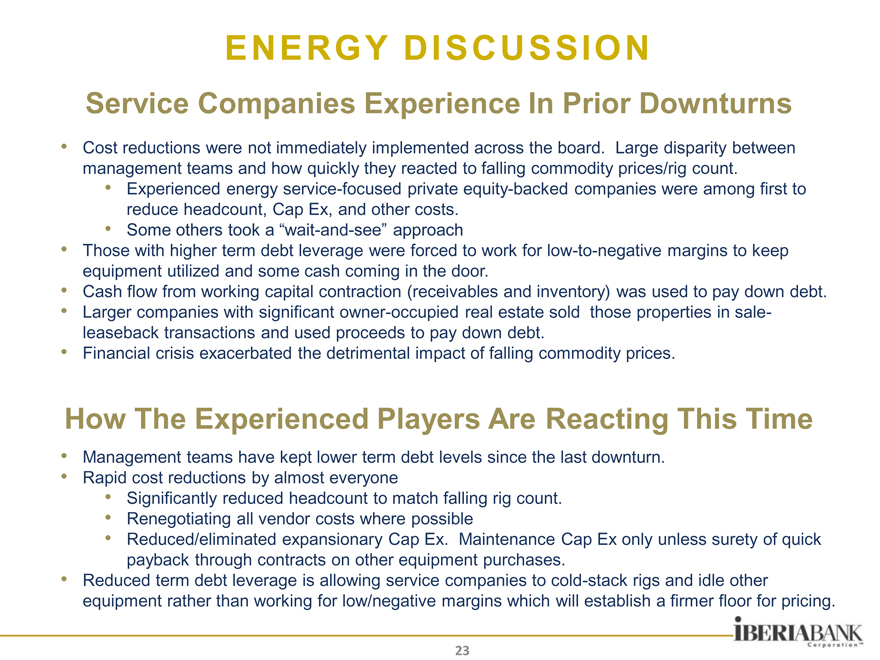
Service Companies Experience In Prior Downturns
Cost reductions were not immediately implemented across the board. Large disparity between management teams and how quickly they reacted to falling commodity prices/rig count.
Experienced energy service-focused private equity-backed companies were among first to reduce headcount, Cap Ex, and other costs.
Some others took a “wait-and-see” approach
Those with higher term debt leverage were forced to work for low-to-negative margins to keep equipment utilized and some cash coming in the door.
Cash flow from working capital contraction (receivables and inventory) was used to pay down debt.
Larger companies with significant owner-occupied real estate sold those properties in sale-leaseback transactions and used proceeds to pay down debt.
Financial crisis exacerbated the detrimental impact of falling commodity prices.
How The Experienced Players Are Reacting This Time
Management teams have kept lower term debt levels since the last downturn.
Rapid cost reductions by almost everyone
Significantly reduced headcount to match falling rig count.
Renegotiating all vendor costs where possible
Reduced/eliminated expansionary Cap Ex. Maintenance Cap Ex only unless surety of quick payback through contracts on other equipment purchases.
Reduced term debt leverage is allowing service companies to cold-stack rigs and idle other equipment rather than working for low/negative margins which will establish a firmer floor for pricing.
23
|
ENERGY DISCUSSION
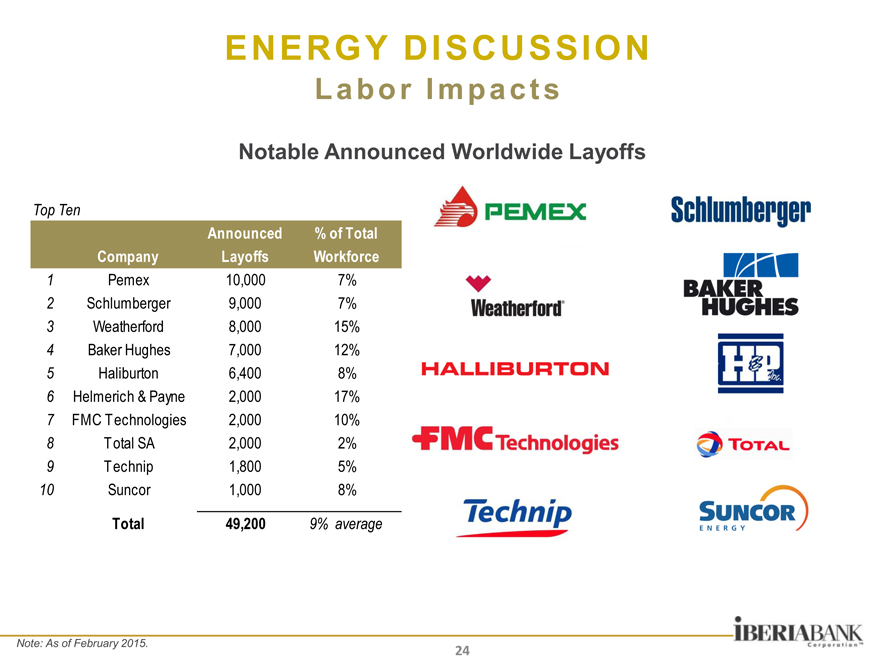
Labor Impacts
Notable Announced Worldwide Layoffs
Top Ten
Announced % of Total
Company Layoffs Workforce
1 Pemex 10,000 7%
2 Schlumberger 9,000 7%
3 Weatherford 8,000 15%
4 Baker Hughes 7,000 12%
5 Haliburton 6,400 8%
6 Helmerich & Payne 2,000 17%
7 FMC Technologies 2,000 10%
8 Total SA 2,000 2%
9 Technip 1,800 5%
10 Suncor 1,000 8%
Total 49,200 9% average
Note: As of February 2015.
24
|
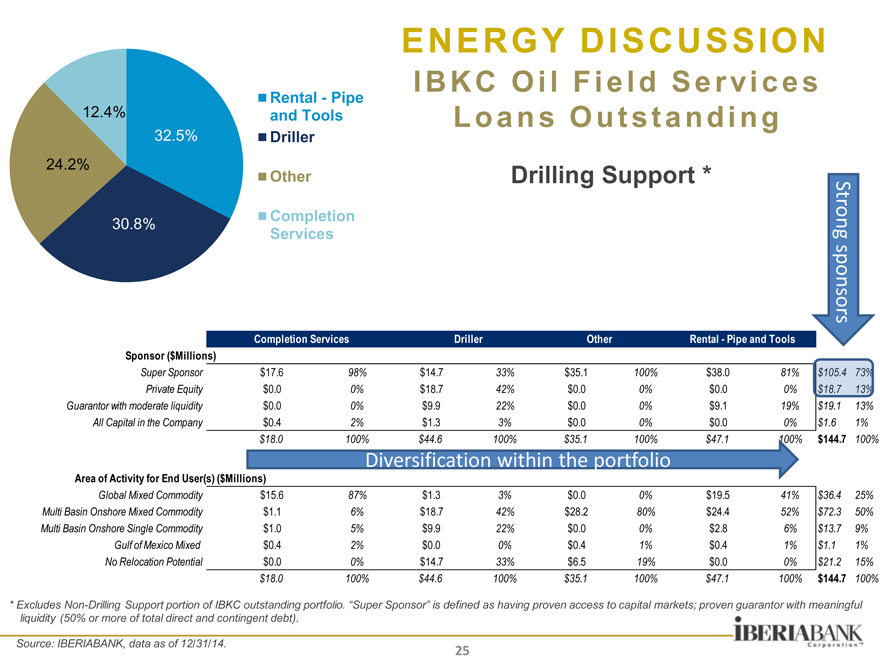
ENERGY DISCUSSION
IBKC Oil Field Services Loans Outstanding
Drilling Support *
Rental—Pipe and Tools Driller
Other
Completion Services
12.4%
32.5%
24.2%
30.8%
Strong sponsors
Completion Services Driller Other Rental—Pipe and Tools
Sponsor ($Millions)
Super Sponsor $17.6 98% $14.7 33% $35.1 100% $38.0 81%
Private Equity $0.0 0% $18.7 42% $0.0 0% $0.0 0%
Guarantor with moderate liquidity $0.0 0% $9.9 22% $0.0 0% $9.1 19% $19.1 13%
All Capital in the Company $0.4 2% $1.3 3% $0.0 0% $0.0 0% $1.6 1%
$18.0 100% $44.6 100% $35.1 100% $47.1 100% $144.7 100%
Diversification within the portfolio
Area of Activity for End User(s) ($Millions)
Global Mixed Commodity $15.6 87% $1.3 3% $0.0 0% $19.5 41% $36.4 25%
Multi Basin Onshore Mixed Commodity $1.1 6% $18.7 42% $28.2 80% $24.4 52% $72.3 50%
Multi Basin Onshore Single Commodity $1.0 5% $9.9 22% $0.0 0% $2.8 6% $13.7 9%
Gulf of Mexico Mixed $0.4 2% $0.0 0% $0.4 1% $0.4 1% $1.1 1%
No Relocation Potential $0.0 0% $14.7 33% $6.5 19% $0.0 0% $21.2 15%
$18.0 100% $44.6 100% $35.1 100% $47.1 100% $144.7 100%
* Excludes Non-Drilling Support portion of IBKC outstanding portfolio. “Super Sponsor” is defined as having proven access to capital markets; proven guarantor with meaningful liquidity (50% or more of total direct and contingent debt).
Source: IBERIABANK, data as of 12/31/14.
25
|
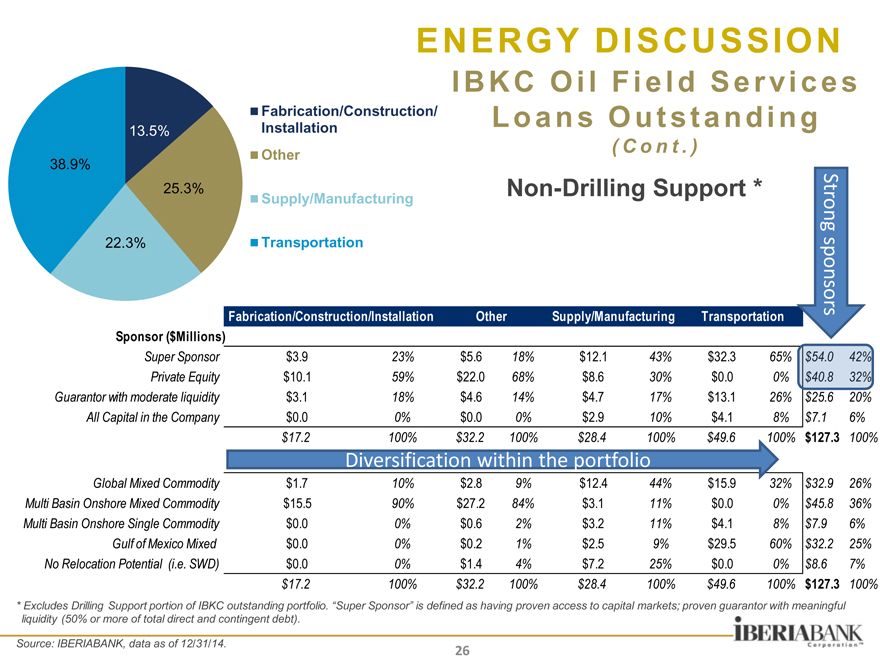
ENERGY DISCUSSION
IBKC Oil Field Services
Fabrication/Construction/ Loans Outstanding Installation
(Cont.)
Other
Supply/Manufacturing Non-Drilling Support * St Transportation rong spon
sors
13.5%
38.9%
25.3%
22.3%
Fabrication/Construction/Installation Other Supply/Manufacturing Transportation
Sponsor ($Millions)
Super Sponsor $3.9 23% $5.6 18% $12.1 43% $32.3 65%
Private Equity $10.1 59% $22.0 68% $8.6 30% $0.0 0%
Guarantor with moderate liquidity $3.1 18% $4.6 14% $4.7 17% $13.1 26% $25.6 20%
All Capital in the Company $0.0 0% $0.0 0% $2.9 10% $4.1 8% $7.1 6%
$17.2 100% $32.2 100% $28.4 100% $49.6 100% $127.3 100%
Diversification within the portfolio
Global Mixed Commodity $1.7 10% $2.8 9% $12.4 44% $15.9 32% $32.9 26%
Multi Basin Onshore Mixed Commodity $15.5 90% $27.2 84% $3.1 11% $0.0 0% $45.8 36%
Multi Basin Onshore Single Commodity $0.0 0% $0.6 2% $3.2 11% $4.1 8% $7.9 6%
Gulf of Mexico Mixed $0.0 0% $0.2 1% $2.5 9% $29.5 60% $32.2 25%
No Relocation Potential (i.e. SWD) $0.0 0% $1.4 4% $7.2 25% $0.0 0% $8.6 7%
$17.2 100% $32.2 100% $28.4 100% $49.6 100% $127.3 100%
* Excludes Drilling Support portion of IBKC outstanding portfolio. “Super Sponsor” is defined as having proven access to capital markets; proven guarantor with meaningful liquidity (50% or more of total direct and contingent debt).
Source: IBERIABANK, data as of 12/31/14.
26
|
ENERGY DISCUSSION
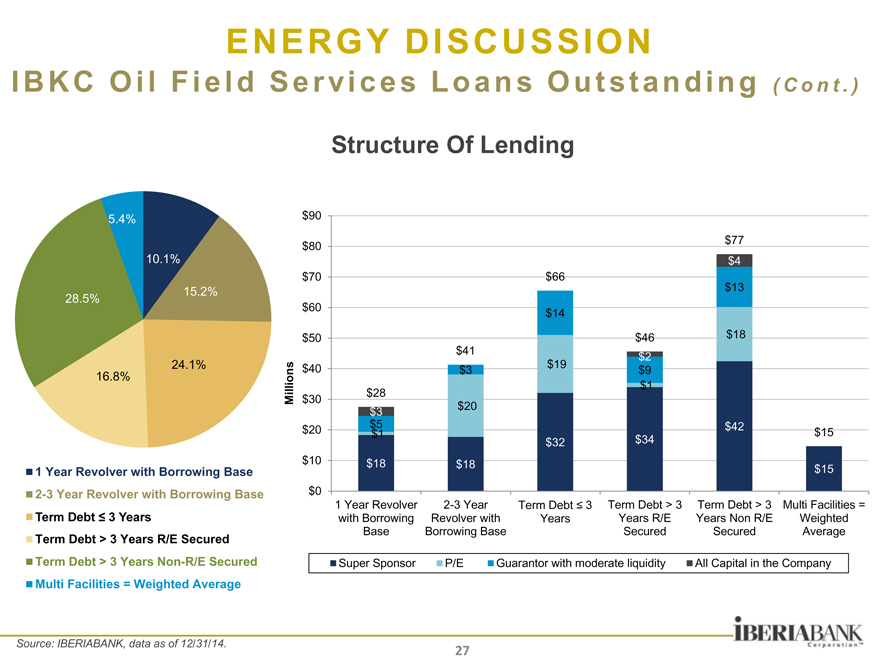
IBKC Oil Field Services Loans Outstanding ( Cont. )
Structure Of Lending
5.4%
10.1%
15.2%
28.5%
24.1%
16.8%
$90
$80 $77
$4
$70 $66
$13
$60 $14
$50 $46 $18
$41 $2
$40 $3 $19 $9
$1
$30 $28
$3 $20
$20 $$5 1 $42 $ 15
$32 $34
$10 $18 $18 $ 15
$0
1 Year Revolver 2-3 Year Term Debt 3 Term Debt > 3 Term Debt > 3 Multi Facilities =
with Borrowing Revolver with Years Years R/E Years Non R/E Weighted
Base Borrowing Base Secured Secured Average
Millions
1 Year Revolver with Borrowing Base 2-3 Year Revolver with Borrowing Base Term Debt 3 Years Term Debt > 3 Years R/E Secured Term Debt > 3 Years Non-R/E Secured Multi Facilities = Weighted Average
Super Sponsor P/E Guarantor with moderate liquidity All Capital in the Company
Source: IBERIABANK, data as of 12/31/14.
27
|
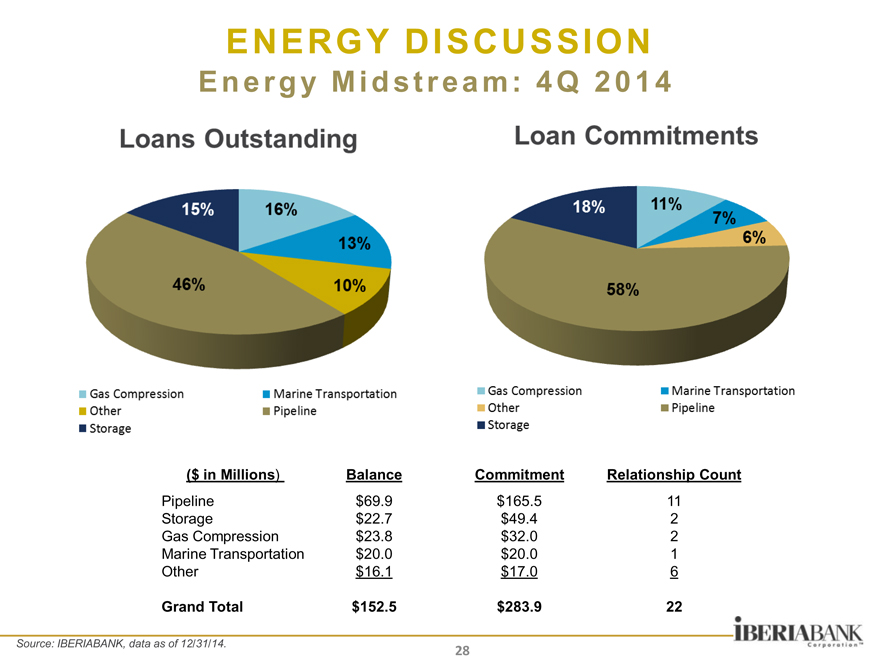
ENERGY DISCUSSION
Energy Midstream: 4Q 2014
($ in Millions) Balance Commitment Relationship Count
Pipeline $69.9 $165.5 11
Storage $22.7 $49.4 2
Gas Compression $23.8 $32.0 2
Marine Transportation $20.0 $20.0 1
Other $16.1 $17.0 6
Grand Total $152.5 $283.9 22
Source: IBERIABANK, data as of 12/31/14.
28
|
ENERGY DISCUSSION
Economic Impact In Acadiana And Houston
Acadiana
Total jobs in Acadiana is 301,017
The Mining industry represents approximately 10% of Acadiana’s workforce, but accounts for approximately 19% of total earnings
Houston
Total jobs (non farm payroll employment) in Houston is 2.9 million
The Mining industry represents approximately 4% of Houston’s workforce, but accounts for approximately 12% of total earnings
Dallas
Total jobs (non farm payroll employment) in Dallas is 3.2 million
The Mining industry represents approximately 1% of Dallas’s workforce, but accounts for approximately 2% of total earnings
29
|
3,600
TX
3,400 TX, 3,403
ND
3,200 CA
AK
3,000 OK
NM
2,800
CO
2,600 WY
l
Oi LA
Crude
2,400 All Other
2,200
of
Barrels 2,000
of
1,800
Thousands 1,600
in
on 1,400
Producti 1,200 ND, 1,187
1,000
800
600 All Other, 598
CA, 563
AK, 517
400 OK, 342
NM, 342
CO, 229
200 WY, 219
LA, 182
81 82 83 84 85 86 87 88 89 90 91 92 93 94 95 96 97 98 99 00 01 02 03 04 05 06 07 08 09 10 11 12 13 14
Jan Jan Jan Jan Jan Jan Jan Jan Jan Jan Jan Jan Jan Jan Jan Jan Jan Jan Jan Jan Jan Jan Jan Jan Jan Jan Jan Jan Jan Jan Jan Jan Jan Jan
Source: Bloomberg LP.; Excludes Offshore Production 30
|
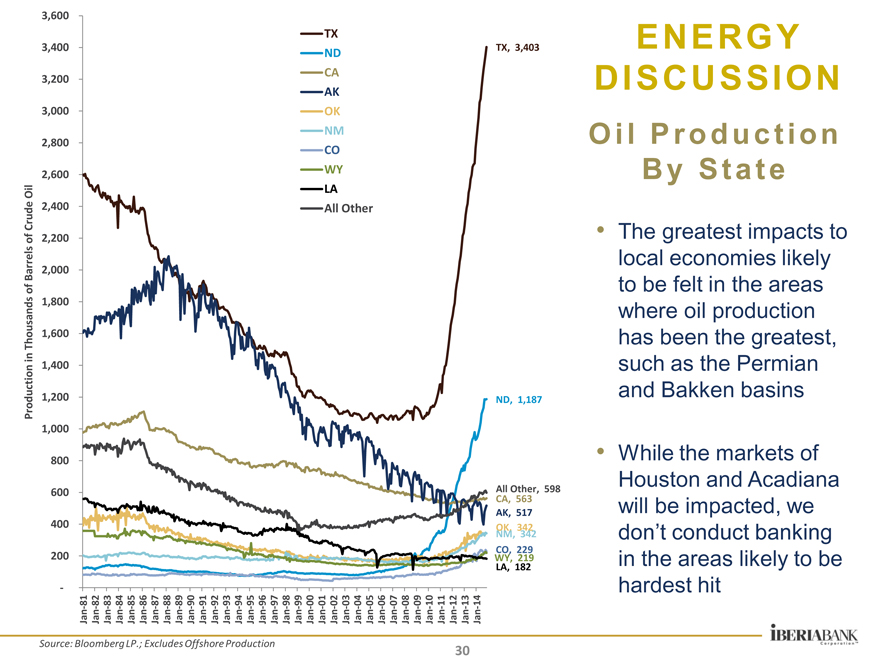
ENERGY DISCUSSION
Oil Production By State
The greatest impacts to local economies likely to be felt in the areas where oil production has been the greatest, such as the Permian and Bakken basins
While the markets of Houston and Acadiana will be impacted, we don’t conduct banking in the areas likely to be hardest hit
|
ENERGY DISCUSSION
Economic Impact In Texas
The Company follows five economists that make employment and economic impact forecasts. These forecasts cover the entire Texas economy as well as the Houston and Dallas markets specifically.
Despite the drop in commodity prices and the resulting job losses, each of the forecasts projects job growth for Texas, Dallas, and Houston.
Dallas is likely the least affected by the commodity price decline. Many Dallas industries (such as trucking, transportation, and distribution) will likely experience a positive benefit from the decline in energy prices.
Houston will likely experience a decline in the number of mining-related jobs and a large drop in mining payrolls. This drop will be cushioned by other industries that have previously had difficulty in filling positions and the growth in industrial construction-related job growth. As a result, Houston is still projected to add jobs in both 2015 and 2016.
To date, these Texas markets have not experienced significant issues from layoffs
31
|
ENERGY DISCUSSION
Potential Risk: Non-Owner Occupied RE
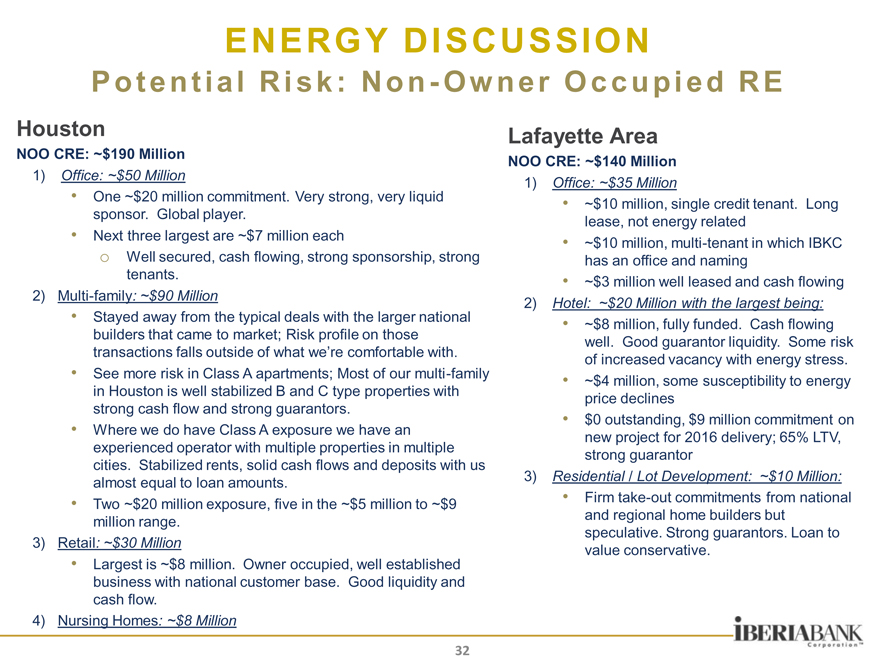
Houston
NOO CRE: ~$190 Million
1) Office: ~$50 Million
One ~$20 million commitment. Very strong, very liquid sponsor. Global player.
Next three largest are ~$7 million each o Well secured, cash flowing, strong sponsorship, strong tenants.
2) Multi-family: ~$90 Million
Stayed away from the typical deals with the larger national builders that came to market; Risk profile on those transactions falls outside of what we’re comfortable with.
See more risk in Class A apartments; Most of our multi-family in Houston is well stabilized B and C type properties with strong cash flow and strong guarantors.
Where we do have Class A exposure we have an experienced operator with multiple properties in multiple cities. Stabilized rents, solid cash flows and deposits with us almost equal to loan amounts.
Two ~$20 million exposure, five in the ~$5 million to ~$9 million range.
3) Retail: ~$30 Million
Largest is ~$8 million. Owner occupied, well established business with national customer base. Good liquidity and cash flow.
4) Nursing Homes: ~$8 Million
Lafayette Area
NOO CRE: ~$140 Million
1) Office: ~$35 Million
~$10 million, single credit tenant. Long lease, not energy related
~$10 million, multi-tenant in which IBKC has an office and naming
~$3 million well leased and cash flowing
2) Hotel: ~$20 Million with the largest being:
~$8 million, fully funded. Cash flowing well. Good guarantor liquidity. Some risk of increased vacancy with energy stress.
~$4 million, some susceptibility to energy price declines
$0 outstanding, $9 million commitment on new project for 2016 delivery; 65% LTV, strong guarantor
3) Residential / Lot Development: ~$10 Million:
Firm take-out commitments from national and regional home builders but speculative. Strong guarantors. Loan to value conservative.
32
|
ENERGY DISCUSSION
Potential Risk: State and Local Governments
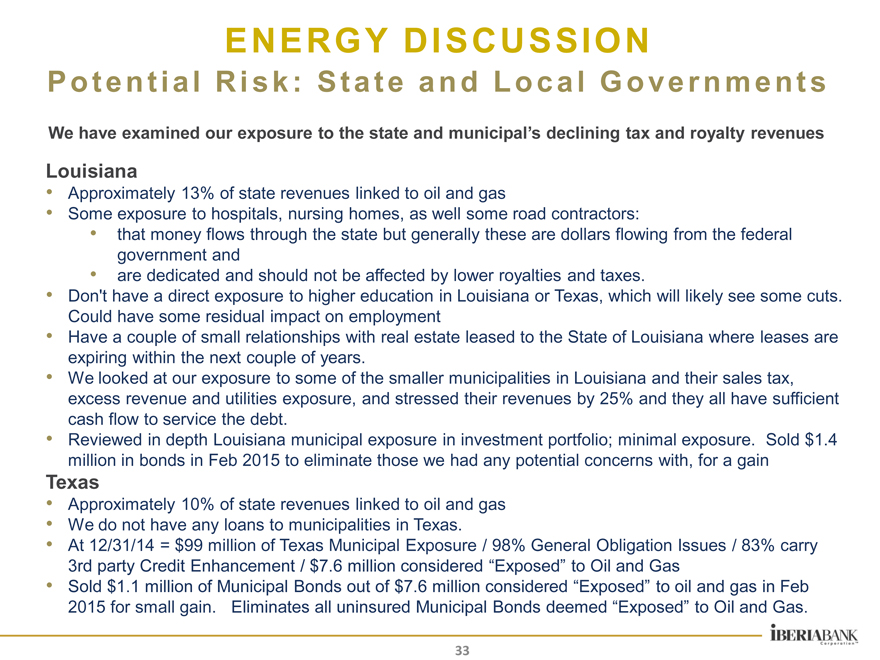
We have examined our exposure to the state and municipal’s declining tax and royalty revenues
Louisiana
Approximately 13% of state revenues linked to oil and gas
Some exposure to hospitals, nursing homes, as well some road contractors:
that money flows through the state but generally these are dollars flowing from the federal government and are dedicated and should not be affected by lower royalties and taxes.
Don’t have a direct exposure to higher education in Louisiana or Texas, which will likely see some cuts. Could have some residual impact on employment
Have a couple of small relationships with real estate leased to the State of Louisiana where leases are expiring within the next couple of years.
We looked at our exposure to some of the smaller municipalities in Louisiana and their sales tax, excess revenue and utilities exposure, and stressed their revenues by 25% and they all have sufficient cash flow to service the debt.
Reviewed in depth Louisiana municipal exposure in investment portfolio; minimal exposure. Sold $1.4 million in bonds in Feb 2015 to eliminate those we had any potential concerns with, for a gain
Texas
Approximately 10% of state revenues linked to oil and gas
We do not have any loans to municipalities in Texas.
At 12/31/14 = $99 million of Texas Municipal Exposure / 98% General Obligation Issues / 83% carry 3rd party Credit Enhancement / $7.6 million considered “Exposed” to Oil and Gas
Sold $1.1 million of Municipal Bonds out of $7.6 million considered “Exposed” to oil and gas in Feb 2015 for small gain. Eliminates all uninsured Municipal Bonds deemed “Exposed” to Oil and Gas.
33
|
ENERGY DISCUSSION
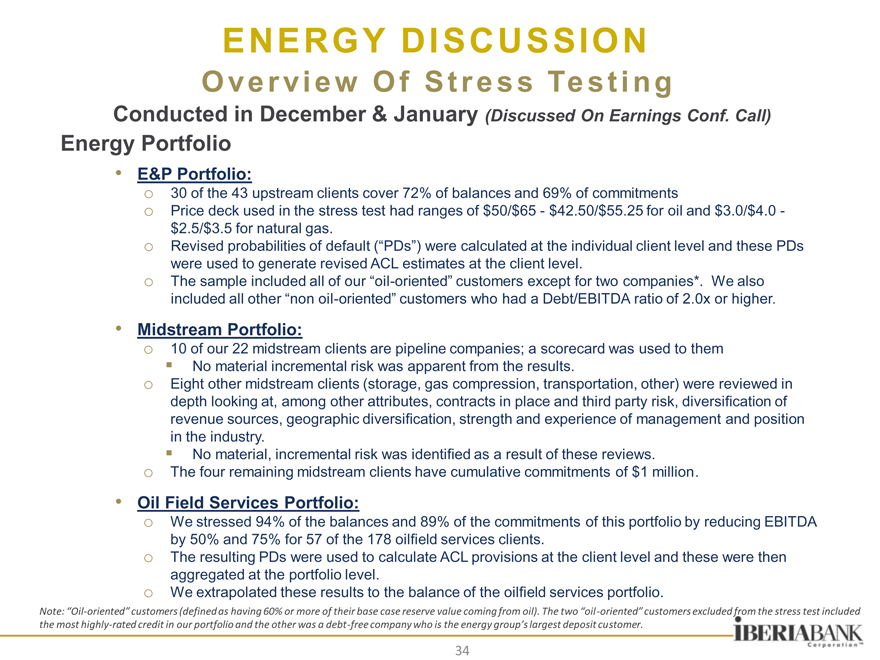
Overview Of Stress Testing
Conducted in December & January (Discussed On Earnings Conf. Call)
Energy Portfolio
E&P Portfolio: o 30 of the 43 upstream clients cover 72% of balances and 69% of commitments o Price deck used in the stress test had ranges of $50/$65—$42.50/$55.25 for oil and $3.0/$4.0 -$2.5/$3.5 for natural gas. o Revised probabilities of default (“PDs”) were calculated at the individual client level and these PDs were used to generate revised ACL estimates at the client level. o The sample included all of our “oil-oriented” customers except for two companies*. We also included all other “non oil-oriented” customers who had a Debt/EBITDA ratio of 2.0x or higher.
Midstream Portfolio: o 10 of our 22 midstream clients are pipeline companies; a scorecard was used to them No material incremental risk was apparent from the results. o Eight other midstream clients (storage, gas compression, transportation, other) were reviewed in depth looking at, among other attributes, contracts in place and third party risk, diversification of revenue sources, geographic diversification, strength and experience of management and position in the industry.
No material, incremental risk was identified as a result of these reviews. o The four remaining midstream clients have cumulative commitments of $1 million.
Oil Field Services Portfolio: o We stressed 94% of the balances and 89% of the commitments of this portfolio by reducing EBITDA by 50% and 75% for 57 of the 178 oilfield services clients. o The resulting PDs were used to calculate ACL provisions at the client level and these were then aggregated at the portfolio level. o We extrapolated these results to the balance of the oilfield services portfolio.
Note: “Oil oriented” customers (defined as having 60% or more of their base case reserve value coming from oil). The two “oil oriented” customers excluded from the stress test included the most highly rated credit in our portfolio and the other was a debt free company who is the energy group’s largest deposit customer.
34
|
ENERGY DISCUSSION
Overview Of Stress Testing ( Continued )
Conducted in December & January (Discussed On Earnings Conf. Call)
Consumer and Business Banking Loans in Houston & Acadiana Portfolios
Business Banking >= $1 Million: o We stressed the EBITDA for C&I clients in this portfolio similarly as oil field service clients. The resulting average PD declines were applied across this entire portfolio and an incremental ACL for this portfolio was calculated.
Business Banking < $1 Million: o This is a scored portfolio – we ran three scenarios and re-calculated PDs.
We reduced business bureau scores 20, 30 and 40 points.
Consumer Portfolio: o This is also a scored portfolio – we ran three scenarios and re-calculated PDs. We reduced FICO scores by 20, 40, and 60 points. The rationale is based on prior experience during the economic decline of 2007-2010.
35
|
ENERGY DISCUSSION
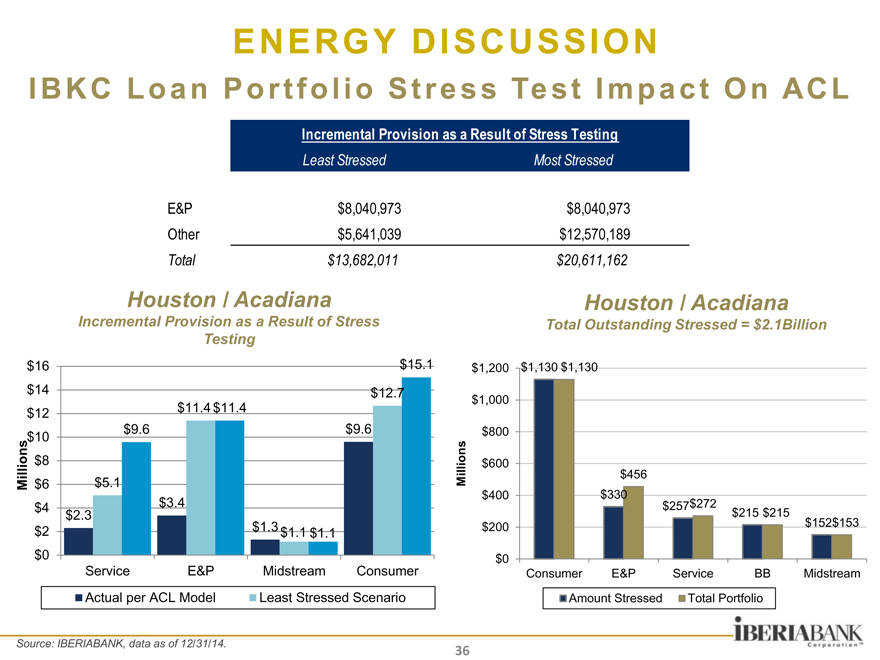
IBKC Loan Portfolio Stress Test Impact On ACL
Incremental Provision as a Result of Stress Testing
Least Stressed Most Stressed
E&P $8,040,973 $8,040,973 Other $5,641,039 $12,570,189
Total $13,682,011 $20,611,162
Houston / Acadiana Houston / Acadiana
Incremental Provision as a Result of Stress Total Outstanding Stressed = $2.1Billion Testing
$16 $15.1
$14 $12.7
$12 $11.4 $11.4
$10 $9.6 $9.6
lions $8
Mil $6 $5.1
$4 $3.4
$2.3
$2 $1.3 $1.1 $1.1
$0
Service E&P Midstream Consumer
Actual per ACL Model Least Stressed Scenario
$1,200 $1,130 $1,130
$1,000
$800
lions $600
Mil $456
$400 $330
$257$272 $215 $215
$200 $152$153
$0
Consumer E&P Service BB Midstream
Amount Stressed Total Portfolio
Source: IBERIABANK, data as of 12/31/14.
36
|
ENERGY DISCUSSION
IBERIA Capital Partners
Energy Investment Banking Themes
“Finger on the Pulse”
Houston Versus Lafayette
Conversations Between E&P and Oilfield Service Companies
Decreasing Service Costs
Conversations Between Industry and Buyside / Sellside
Capital Availability
M&A
Not All Companies Are Created Equal
Basins
Strategies
Management Teams
37
|
ENERGY DISCUSSION
Conclusions
The industry has always had its up-and-down cycles, and that will continue
IBERIABANK will continue to manage the risks and serve our clients
Our company is well diversified from a geographic and industry standpoint and is not reliant on the energy sector for an outsized portion of our growth
We approach energy lending with the same discipline as other aspects of our business, including strong sponsors and management teams, appropriate structures and terms, adherence to concentration limits, etc.
Reserve-based E&P loans are the largest portion of our energy exposure and carries very low risk of loss
Our midstream exposure has very limited direct commodity risk exposure
Our Oilfield Service exposure is limited in size, well diversified across drilling and non-drilling related activities, and is to experienced operators with strong sponsorship
Some of our clients (businesses and individuals) will face some difficulties. We will provide allowance as needed, though we remain comfortable with our current reserve level. There will be some impact, but we believe it will remain very manageable.
We believe an information gap continues to drive equity markets. Our stress test process provides in-depth information and very helpful risk management insight.
38
|

INITIATIVES UPDATE
“Things do not change, we do.
-Henry David “ Thoreau
39
|
INITIATIVES UPDATE
IBERIA Capital Partners Investment
IBERIA Capital Partners (“ICP”) created in October 2010 with receipt of its broker dealer license
Niche focus on energy related companies
– Exploration & Production, Midstream, Service & Supply, and Shipping
ICP revenue comes from trading, research income and investment banking
35 Full-Time Employees
Current coverage on 79 publicly traded companies
Participated in 58 investment banking transactions since formation
Strong growth in revenues from formation through 3Q14.
Energy commodity price declines in 4Q14 led to significant reduction in investment banking revenue opportunities
– $1 million reduction in revenue compared to 3Q14
40
|
INITIATIVES UPDATE
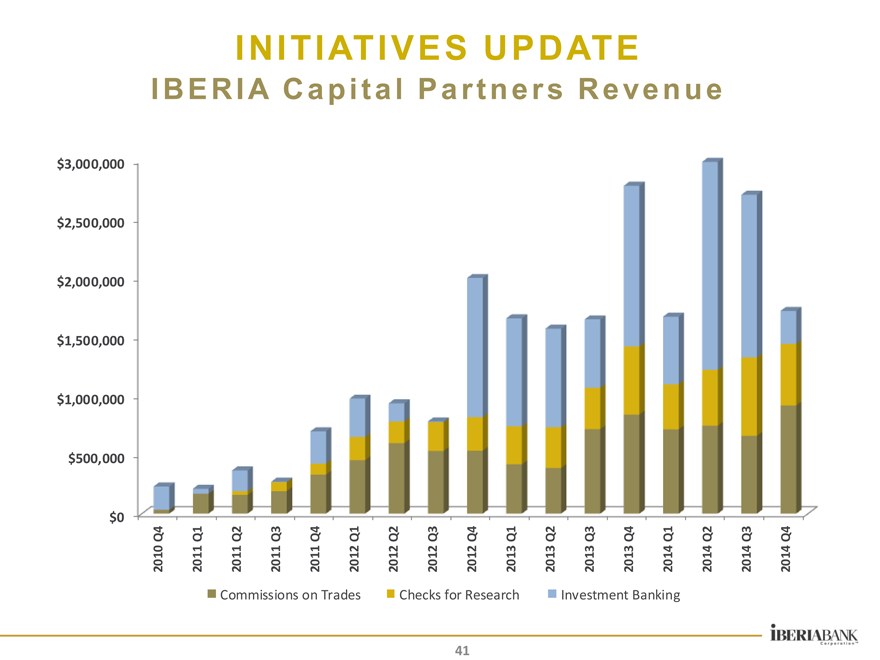
IBERIA Capital Partners Revenue
$3,000,000 $2,500,000 $2,000,000 $1,500,000 $1,000,000 $500,000 $0
2010 Q4 2011 Q1 2011 Q2 2011 Q3 2011 Q4 2012 Q1 2012 Q2 2012 Q3 2012 Q4 2013 Q1 2013 Q2 2013 Q3 2013 Q4 2014 Q1 2014 Q2 2014 Q3 2014 Q4
Commissions on Trades Checks for Research Investment Banking
41
|
INITIATIVES UPDATE
Iberia Wealth Advisors
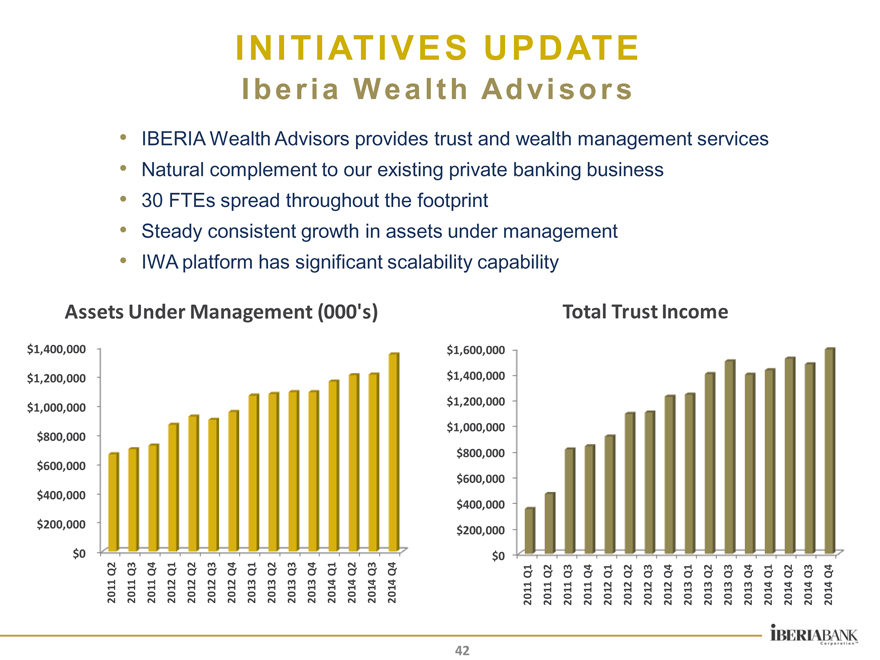
IBERIA Wealth Advisors provides trust and wealth management services
Natural complement to our existing private banking business
30 FTEs spread throughout the footprint
Steady consistent growth in assets under management
IWA platform has significant scalability capability
Total Trust Income
$1,600,000 $1,400,000 $1,200,000 $1,000,000 $800,000 $600,000 $400,000 $200,000 $0
2011 Q1 2011 Q2 2011 Q3 2011 Q4 2012 Q1 2012 Q2 2012 Q3 2012 Q4 2013 Q1 2013 Q2 2013 Q3 2013 Q4 2014 Q1 2014 Q2 2014 Q3 2014 Q4
Assets Under Management (000’s)
$1,400,000 $1,200,000 $1,000,000 $800,000 $600,000 $400,000 $200,000 $0
2011 Q2 2011 Q3 2011 Q4 2012 Q1 2012 Q2 2012 Q3 2012 Q4 2013 Q1 2013 Q2 2013 Q3 2013 Q4 2014 Q1 2014 Q2 2014 Q3 2014 Q4
42
|
INITIATIVES UPDATE
Bank Capital Markets
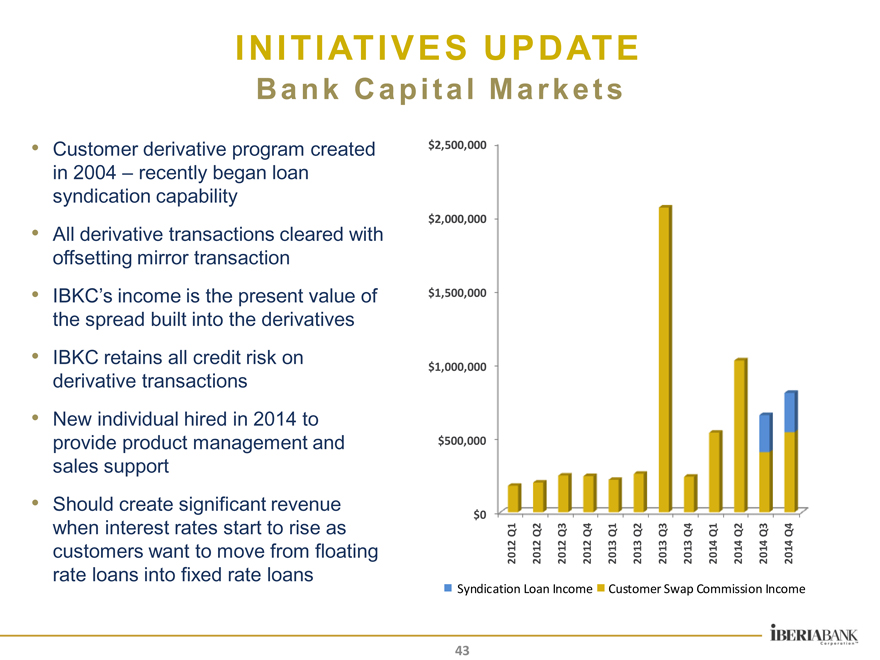
Customer derivative program created in 2004 – recently began loan syndication capability
All derivative transactions cleared with offsetting mirror transaction
IBKC’s income is the present value of the spread built into the derivatives
IBKC retains all credit risk on derivative transactions
New individual hired in 2014 to provide product management and sales support
Should create significant revenue when interest rates start to rise as customers want to move from floating rate loans into fixed rate loans
$2,500,000 $2,000,000 $1,500,000 $1,000,000 $500,000 $0
2012 Q1 2012 Q2 2012 Q3 2012 Q4 2013 Q1 2013 Q2 2013 Q3 2013 Q4 2014 Q1 2014 Q2 2014 Q3 2014 Q4
Syndication Loan Income Customer Swap Commission Income
43
|
INITIATIVES UPDATE
Business Banking Investment
Bankers
– Hired experienced Business Bankers
– Implemented performance management process
Business Loan Center
– Relationships $2MM and under
– Hired experienced management and underwriting team
– Implemented enhanced portfolio management systems and processes
Infrastructure
– Implemented Banker’s sales management environment
– New incentive plan and pricing model
Deposits and Fees
– Business Checking product development and marketing plan
– New Merchant Services provider
– Partnership with Treasury Management
– New Credit Card processor
44
|
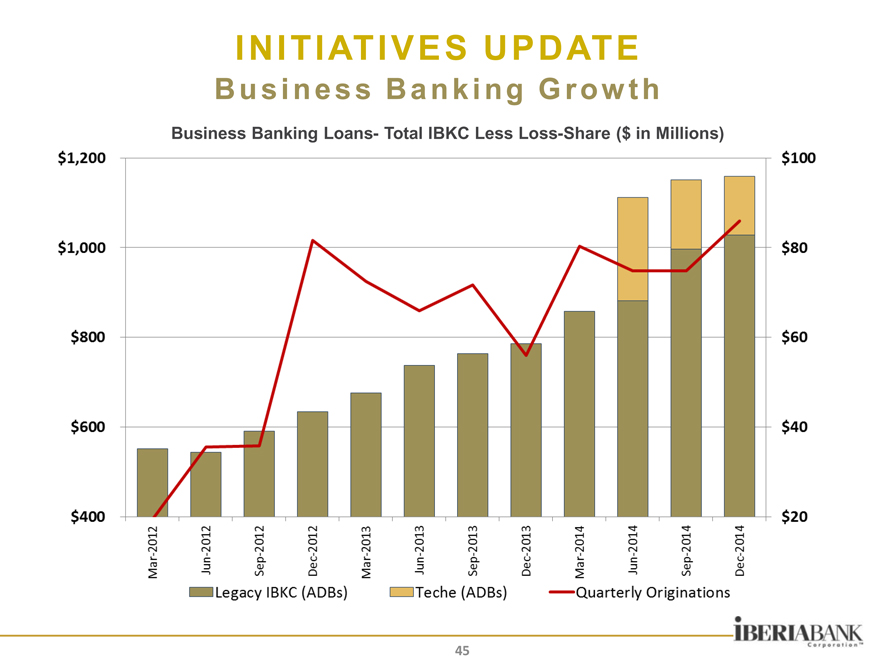
INITIATIVES UPDATE
Business Banking Growth
Business Banking Loans- Total IBKC Less Loss-Share ($ in Millions)
45
|
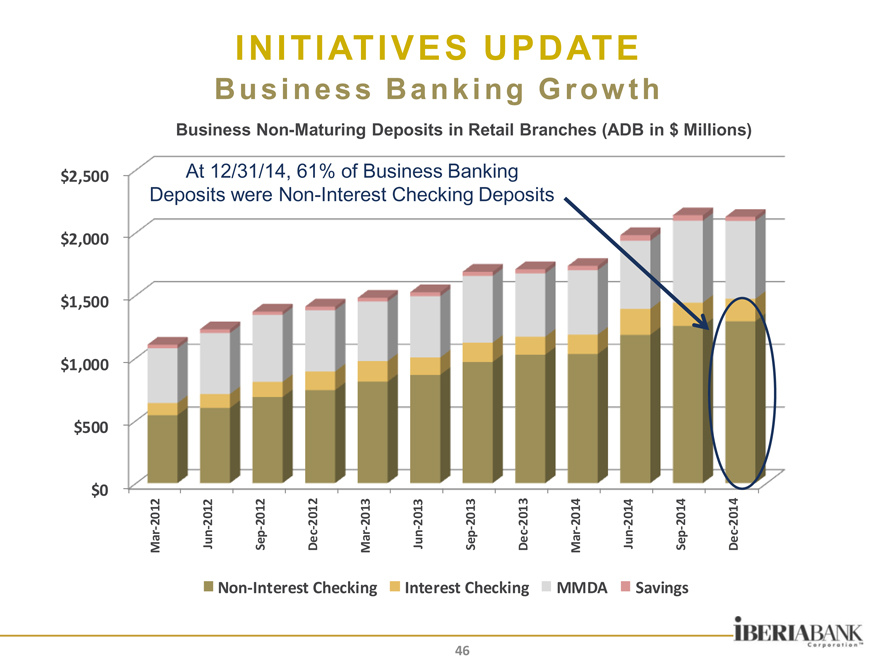
INITIATIVES UPDATE
Business Banking Growth
Business Non-Maturing Deposits in Retail Branches (ADB in $ Millions)
$2,500 At 12/31/14, 61% of Business Banking
Deposits were Non-Interest Checking Deposits
$2,000
$1,500
$1,000
$500
$0
2012 2012 2012 2012 2013 2013 2013 2013 2014 2014 2014 2014
Jun Dec Jun Dec Jun Dec
Mar Sep Mar Sep Mar Sep
Non Interest Checking Interest Checking MMDA Savings
46
|
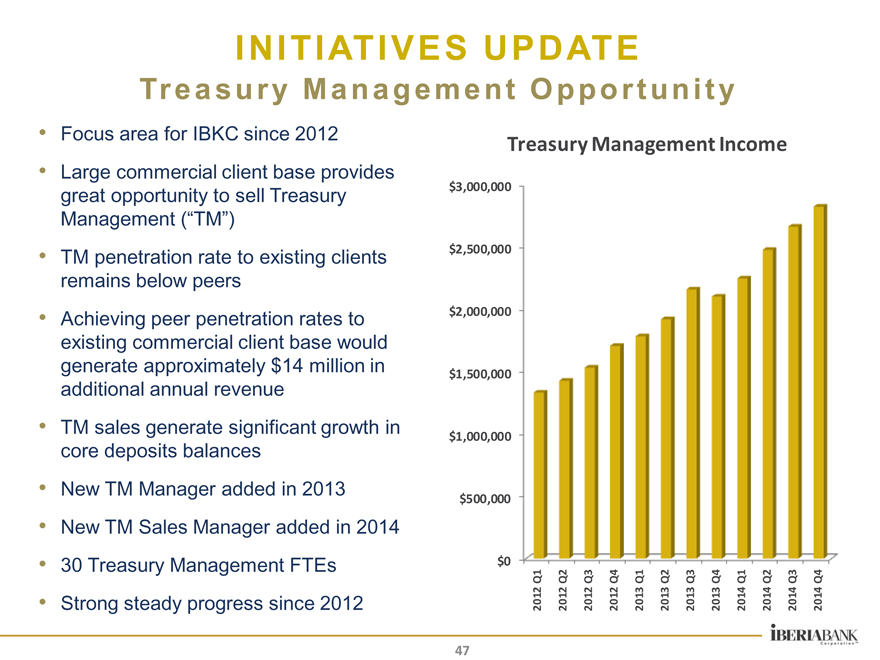
INITIATIVES UPDATE
Treasury Management Opportunity
Focus area for IBKC since 2012
Large commercial client base provides great opportunity to sell Treasury Management (“TM”)
TM penetration rate to existing clients remains below peers
Achieving peer penetration rates to existing commercial client base would generate approximately $14 million in additional annual revenue
TM sales generate significant growth in core deposits balances
New TM Manager added in 2013
New TM Sales Manager added in 2014
30 Treasury Management FTEs
Strong steady progress since 2012
Treasury Management Income
$3,000,000 $2,500,000 $2,000,000 $1,500,000 $1,000,000 $500,000 $0
2012 Q1 2012 Q2 2012 Q3 2012 Q4 2013 Q1 2013 Q2 2013 Q3 2013 Q4 2014 Q1 2014 Q2 2014 Q3 2014 Q4
47
|

MARKETS & GROWTH
I skate where the puck is going “to be, not where it has been.”
-Wayne Gretzky
48
|
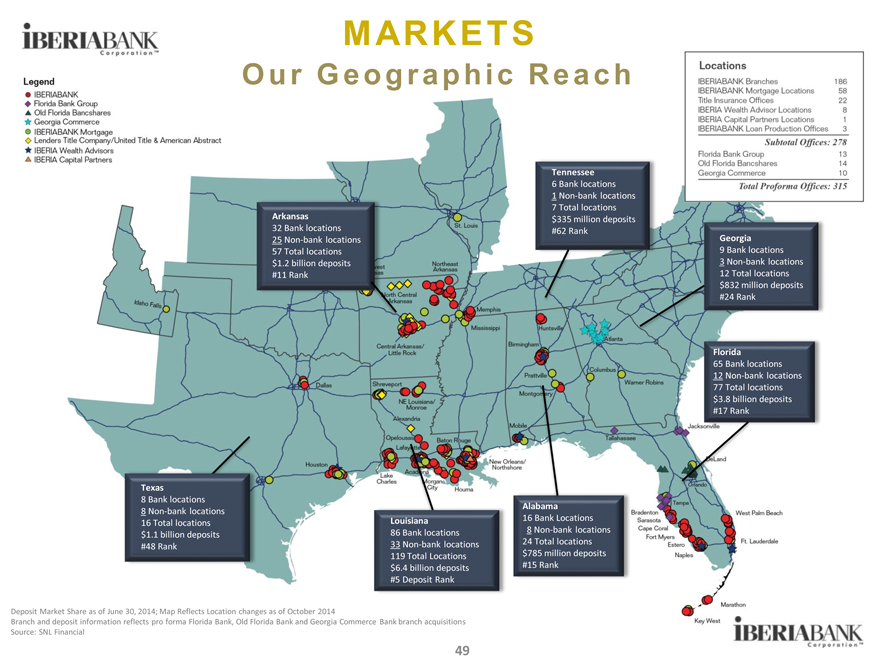
MARKETS
Our Geographic Reach
Arkansas
32 Bank locations
25 Non bank locations
57 Total locations
$1.2 billion deposits #11 Rank
Tennessee
6 Bank locations
1 Non bank locations
7 Total locations $335 million deposits #62 Rank
Georgia
9 Bank locations
3 Non bank locations
12 Total locations $832 million deposits #24 Rank
Florida
65 Bank locations
12 Non bank locations
77 Total locations
$3.8 billion deposits #17 Rank
Alabama
16 Bank Locations
8 Non bank locations
24 Total locations $785 million deposits #15 Rank
Louisiana
86 Bank locations
33 Non bank locations 119 Total Locations
$6.4 billion deposits
#5 Deposit Rank
Texas
8 Bank locations
8 Non bank locations
16 Total locations
$1.1 billion deposits #48 Rank
Deposit Market Share as of June 30, 2014; Map Reflects Location changes as of October 2014
Branch and deposit information reflects pro forma Florida Bank, Old Florida Bank and Georgia Commerce Bank branch acquisitions Source: SNL Financial
49
|
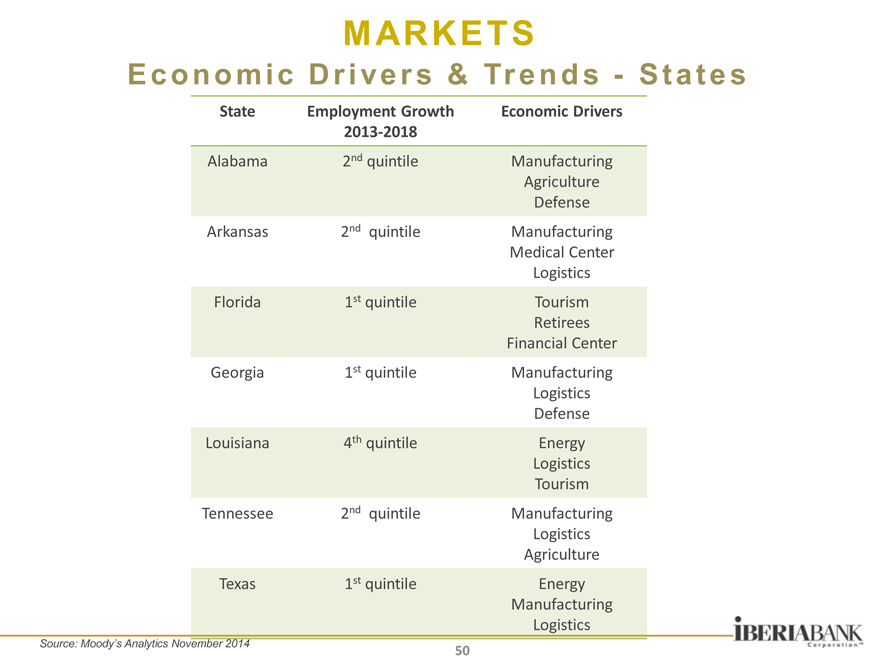
MARKETS
Economic Drivers & Trends— States
State Employment Growth Economic Drivers
2013 2018
Alabama 2nd quintile Manufacturing
Agriculture
Defense
Arkansas 2nd quintile Manufacturing
Medical Center
Logistics
Florida 1st quintile Tourism
Retirees
Financial Center
Georgia 1st quintile Manufacturing
Logistics
Defense
Louisiana 4th quintile Energy
Logistics
Tourism
Tennessee 2nd quintile Manufacturing
Logistics
Agriculture
Texas 1st quintile Energy
Manufacturing
Logistics
Source: Moody’s Analytics November 2014
50
|
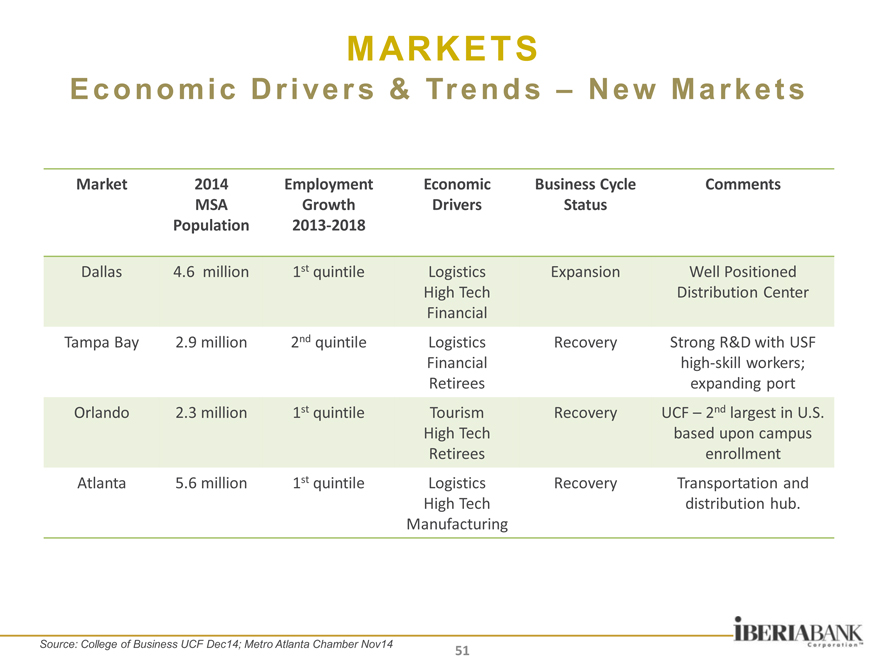
MARKETS
Economic Drivers & Trends – New Markets
Market 2014 Employment Economic Business Cycle Comments
MSA Growth Drivers Status
Population 2013 2018
Dallas 4.6 million 1st quintile Logistics Expansion Well Positioned
High Tech Distribution Center
Financial
Tampa Bay 2.9 million 2nd quintile Logistics Recovery Strong R&D with USF
Financial high skill workers;
Retirees expanding port
Orlando 2.3 million 1st quintile Tourism Recovery UCF – 2nd largest in U.S.
High Tech based upon campus
Retirees enrollment
Atlanta 5.6 million 1st quintile Logistics Recovery Transportation and
High Tech distribution hub.
Manufacturing
Source: College of Business UCF Dec14; Metro Atlanta Chamber Nov14
51
|
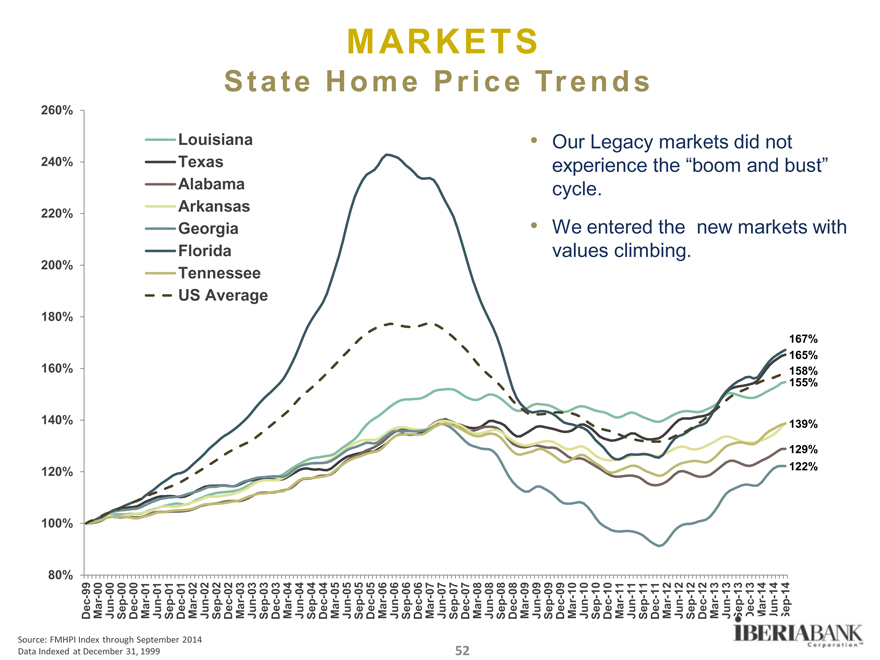
MARKETS
State Home Price Trends
Louisiana Texas Alabama Arkansas Georgia Florida Tennessee US Average
Our Legacy markets did not experience the “boom and bust” cycle.
We entered the new markets with values climbing.
260% 240% 220% 200% 180% 160% 140% 120% 100% 80%
Dec-99
Mar- 00
Jun-00
Sep-00
Dec-00
Mar- 01
Jun-01
Sep-01
Dec-01
Mar- 02
Jun-02
Sep-02
Dec-02
Mar- 03
Jun-03
Sep-03
Dec-03
Mar- 04
Jun-04
Sep-04
Dec-04
Mar- 05
Jun-05
Sep-05
Dec-05
Mar- 06
Jun-06
Sep-06
Dec-06
Mar- 07
Jun-07
Sep-07
Dec-07
Mar- 08
Jun-08
Sep-08
Dec-08
Mar- 09
Jun-09
Sep-09
Dec-09
Mar- 10
Jun-10
Sep-10
Dec-10
Mar- 11
Jun-11
Sep-11
Dec-11
Mar- 12
Jun-12
Sep-12
Dec-12
Mar- 13
Jun-13
Sep-13
Dec-13
Mar- 14
Jun-14
Sep-14
167% 165% 158% 155%
139%
129% 122%
Source: FMHPI Index through September 2014
Data Indexed at December 31, 1999 52
|
MARKETS
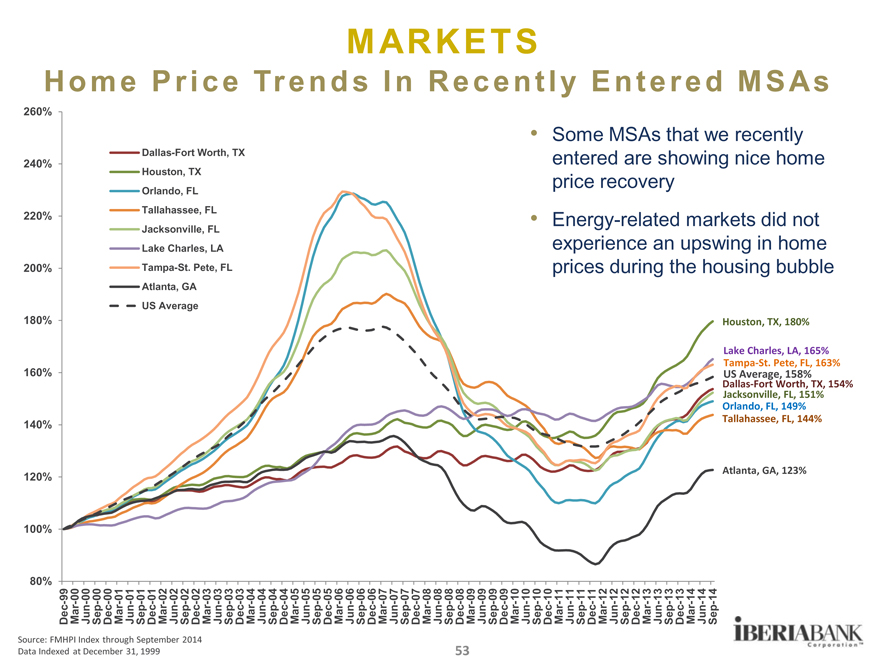
Home Price Trends In Recently Entered MSAs
Dallas-Fort Worth, TX Houston, TX
Orlando, FL Tallahassee, FL Jacksonville, FL Lake Charles, LA Tampa-St. Pete, FL Atlanta, GA US Average
260% 240% 220% 200% 180% 160% 140% 120% 100% 80%
Some MSAs that we recently entered are showing nice home price recovery
Energy-related markets did not experience an upswing in home prices during the housing bubble
Houston, TX, 180%
Lake Charles, LA, 165% Tampa St. Pete, FL, 163%
US Average, 158%
Dallas Fort Worth, TX, 154% Jacksonville, FL, 151% Orlando, FL, 149% Tallahassee, FL, 144%
Atlanta, GA, 123%
Dec-99 Mar-00 Jun-00 Sep-00 Dec-00 Mar-01 Jun-01 Sep-01 Dec-01 Mar-02 Jun-02 Sep-02 Dec-02 Mar-03 Jun-03 Sep-03 Dec-03 Mar-04 Jun-04 Sep-04 Dec-04 Mar-05 Jun-05 Sep-05 Dec-05 Mar-06 Jun-06 Sep-06 Dec-06 Mar-07 Jun-07 Sep-07 Dec-07 Mar-08 Jun-08 Sep-08 Dec-08 Mar-09 Jun-09 Sep-09 Dec-09 Mar-10 Jun-10 Sep-10 Dec-10 Mar-11 Jun-11 Sep-11 Dec-11 Mar-12 Jun-12 Sep-12 Dec-12 Mar-13 Jun-13 Sep-13 Dec-13 Mar-14 Jun-14 Sep-14
Source: FMHPI Index through September 2014
Data Indexed at December 31, 1999 53
|
MARKETS
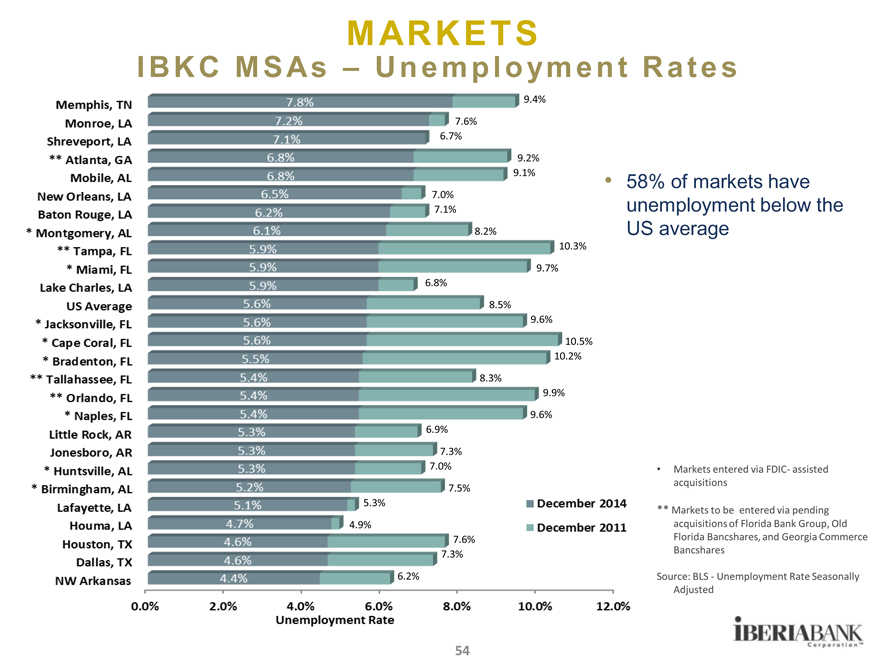
IBKC MSAs – Unemployment Rates
IBKC MSAs – Unemployment
9.4%
7.6%
6.7%
9.2%
9.1%
7.0%
7.1%
8.2%
10.3%
9.7%
6.8%
8.5%
9.6%
10.5%
10.2%
8.3%
9.9%
9.6%
6.9%
7.3%
7.0%
7.5%
5.3%
4.9%
7.6%
7.3%
6.2%
58% of markets have unemployment below the US average
Markets entered via FDIC assisted acquisitions
** Markets to be entered via pending acquisitions of Florida Bank Group, Old Florida Bancshares, and Georgia Commerce Bancshares
Source: BLS Unemployment Rate Seasonally Adjusted
54
|
GROWTH
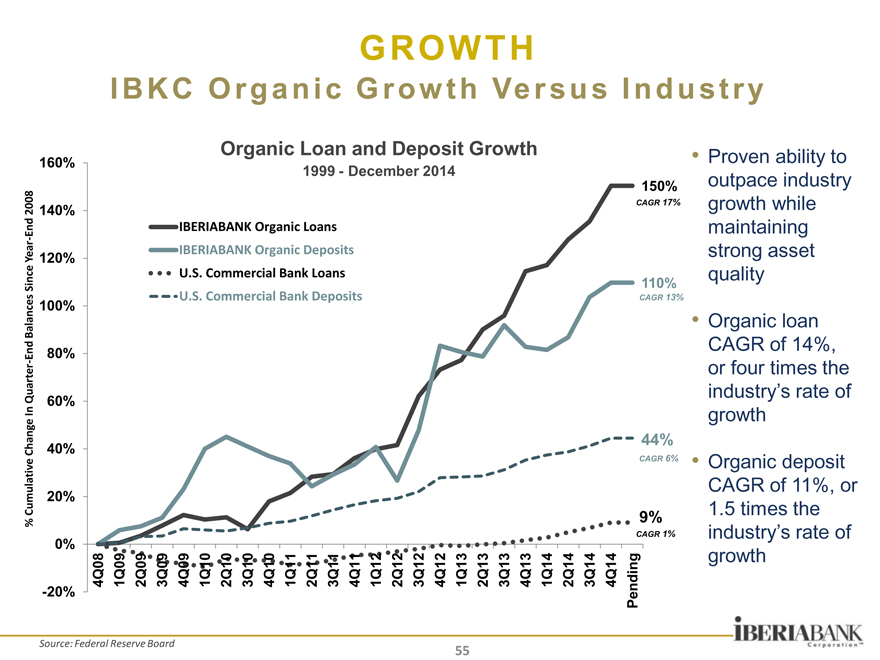
IBKC Organic Growth Versus Industry
% Cumulati ve Change In Quar ter End Balances Si nce Year End 2008
- 20% 40% 60% 80% 100% 120% 140% 160% 20% 0%
Organic Loan and Deposit Growth
1999—December 2014
IBERIABANK Organic Loans IBERIABANK Organic Deposits U.S. Commercial Bank Loans U.S. Commercial Bank Deposits
150%
CAGR 17%
110%
CAGR 13%
44%
CAGR 6%
9%
CAGR 1%
Proven ability to outpace industry growth while maintaining strong asset quality
Organic loan CAGR of 14%, or four times the industry’s rate of growth
Organic deposit CAGR of 11%, or 1.5 times the industry’s rate of growth
4Q08
1Q09
2Q09
3Q09
4Q09
1Q10
2Q10
3Q10
4Q10
1Q11
2Q11
3Q11
4Q11
1Q12
2Q12
3Q12
4Q12
1Q13
2Q13
3Q13
4Q13
1Q14
2Q14
3Q14
4Q14 Pending
CAGR
Source: Federal Reserve Board
55
|
GROWTH
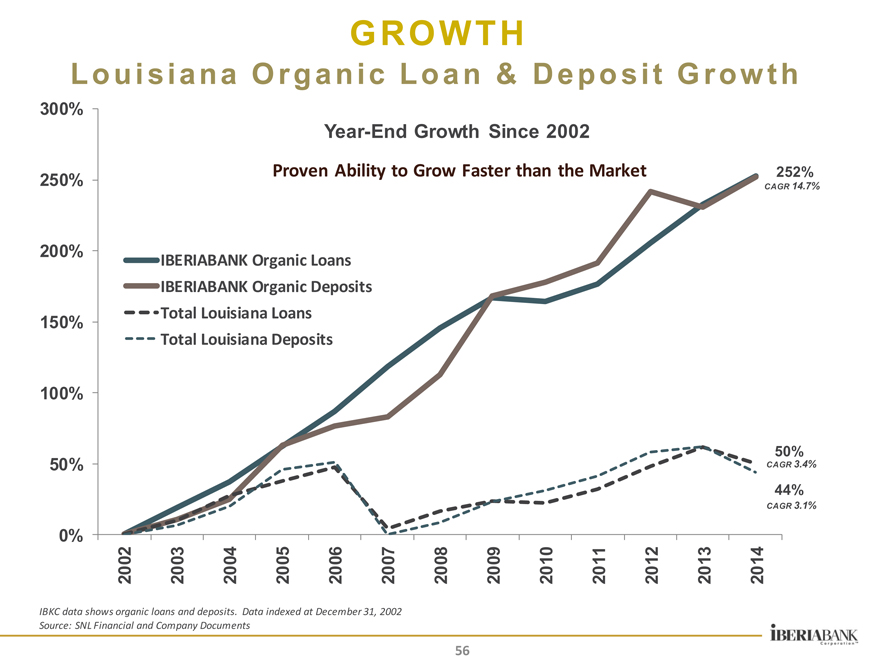
Louisiana Organic Loan & Deposit Growth
Year-End Growth Since 2002
Proven Ability to Grow Faster than the Market
300%
250%
200%
150%
100%
50%
0%
IBERIABANK Organic Loans IBERIABANK Organic Deposits Total Louisiana Loans Total Louisiana Deposits
252%
CAGR 14.7%
50%
CAGR 3.4%
44%
CAGR 3.1%
2002
2003
2004
2005
2006
2007
2008
2009
2010
2011
2012
2013
2014
IBKC data shows organic loans and deposits. Data indexed at December 31, 2002 Source: SNL Financial and Company Documents
56
|
GROWTH
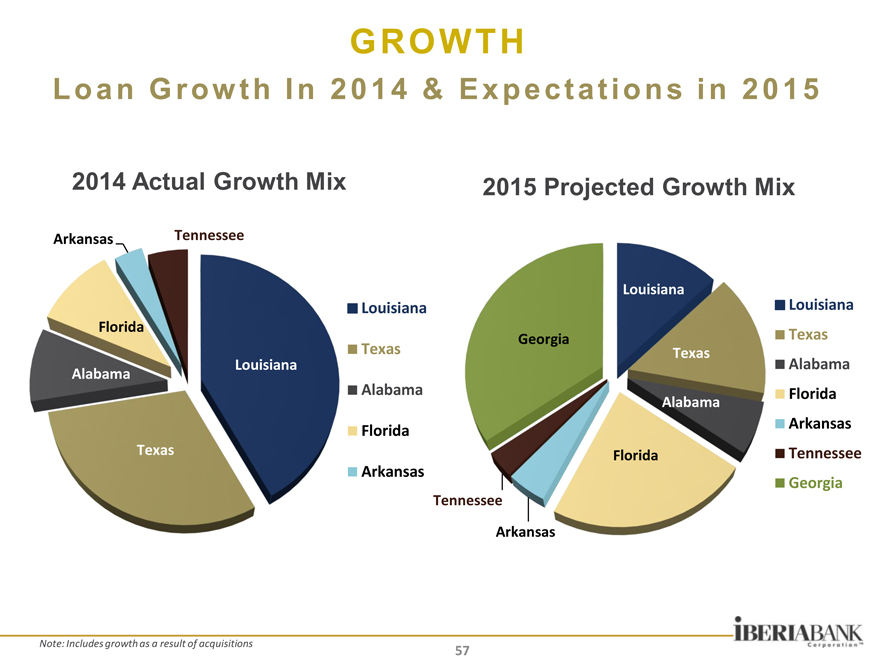
Loan Growth In 2014 & Expectations in 2015
2014 Actual Growth Mix 2015 Projected Growth Mix
Arkansas Tennessee
Florida
Louisiana Alabama
Texas
Louisiana Texas Alabama Florida Arkansas
Louisiana
Georgia
Texas Alabama Florida
Louisiana Texas Alabama Florida Arkansas Tennessee Georgia
Tennessee
Arkansas
Note: Includes growth as a result of acquisitions
57
|
GROWTH
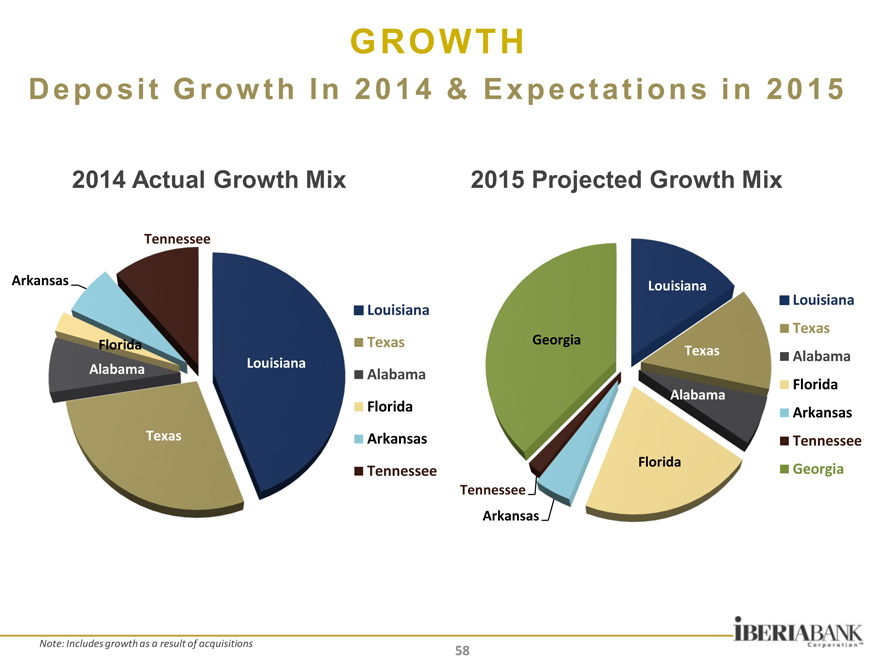
Deposit Growth In 2014 & Expectations in 2015
2014 Actual Growth Mix 2015 Projected Growth Mix
Tennessee
Arkansas Louisiana
Louisiana
Louisiana
Texas
Florida Texas Georgia
Texas Alabama
Alabama Louisiana Alabama
Florida
Alabama
Florida Arkansas
Texas Arkansas Tennessee
Florida
Tennessee Georgia
Tennessee
Arkansas
Note: Includes growth as a result of acquisitions 58
|
GROWTH
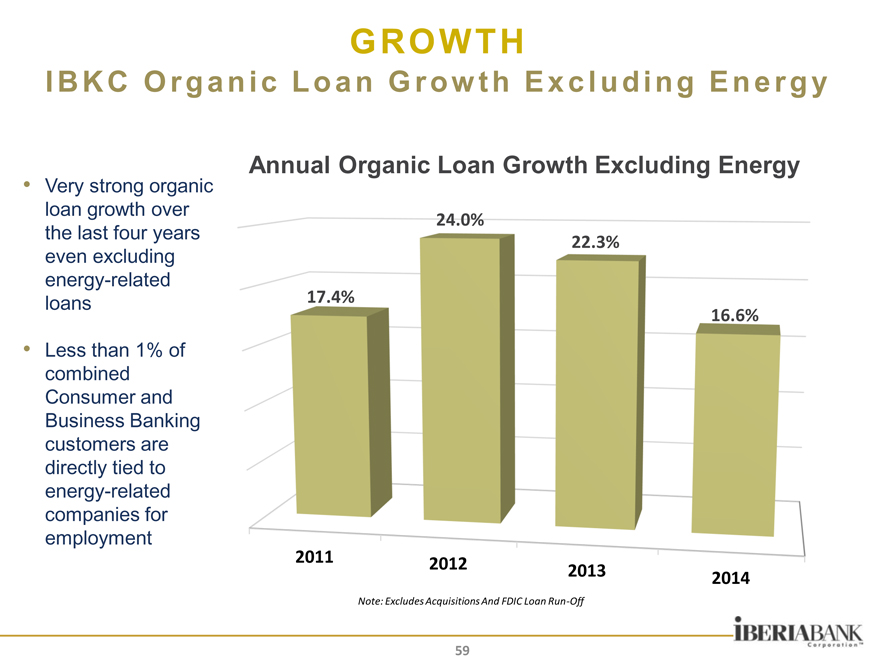
IBKC Organic Loan Growth Excluding Energy
Very strong organic loan growth over the last four years even excluding energy-related loans
Less than 1% of combined Consumer and Business Banking customers are directly tied to energy-related companies for employment
Annual Organic Loan Growth Excluding Energy
24.0%
22.3%
17.4%
16.6%
2011 2012
2013 2014
Note: Excludes Acquisitions And FDIC Loan Run Off
59
|
DIVERSIFICATION
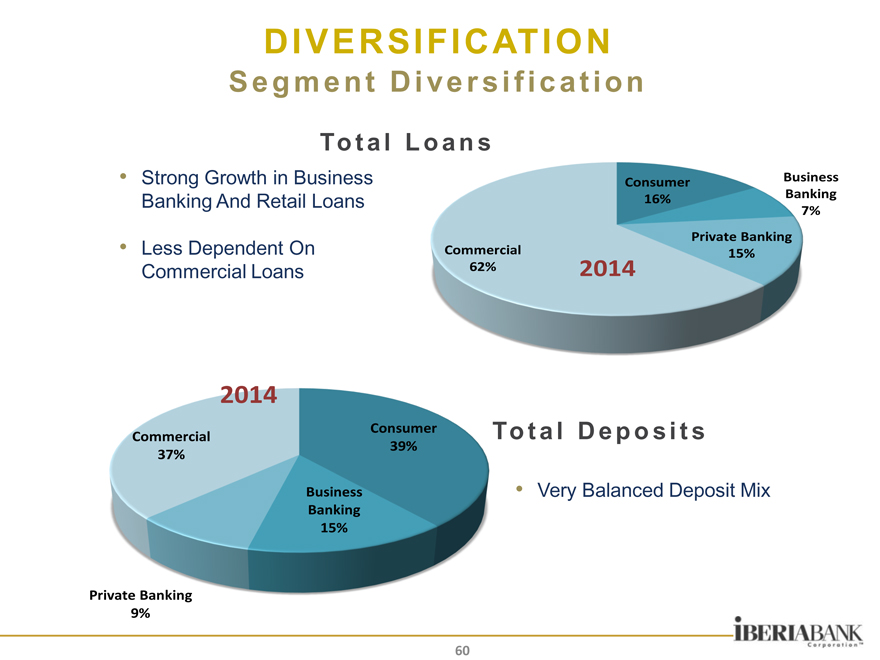
Segment Diversification
To t a l L o a n s
Strong Growth in Business Banking And Retail Loans
Less Dependent On Commercial Loans
Consumer Business
16% Banking
7%
Private Banking
Commercial 15%
62% 2014
2014
Consumer Commercial 39% 37%
Business Banking 15%
To t a l D e p o s i t s
Very Balanced Deposit Mix
Private Banking 9%
60
|
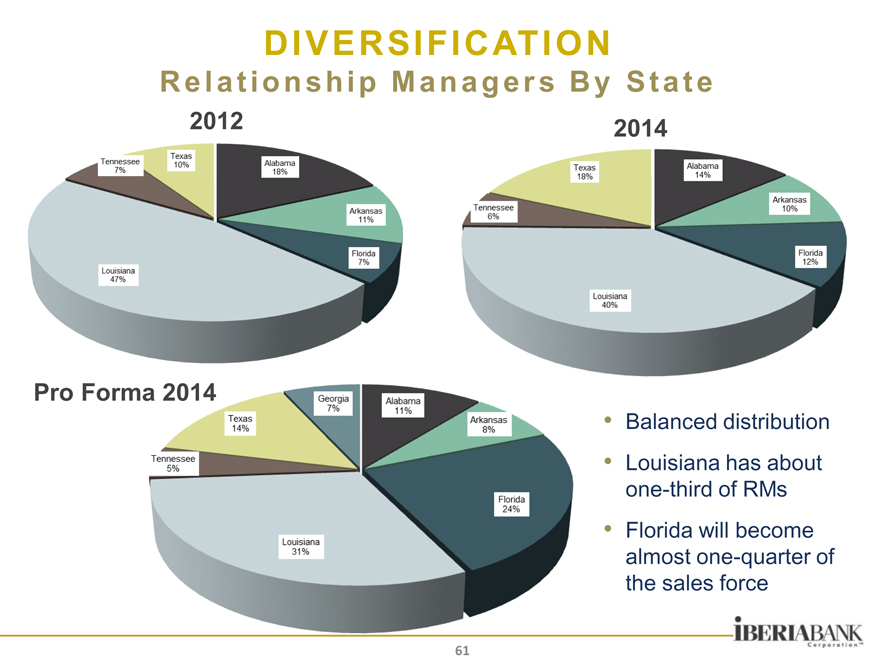
DIVERSIFICATION
Relationship Managers By State
2012 2014
Pro Forma 2014
Balanced distribution Louisiana has about one-third of RMs Florida will become almost one-quarter of the sales force
61
|
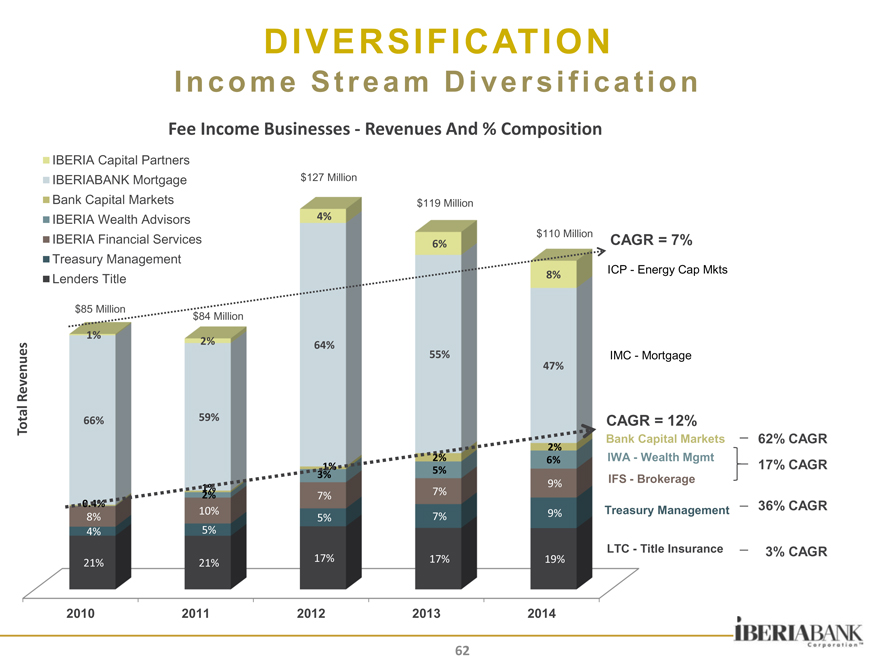
DIVERSIFICATION
I n c o m e S t r e a m D i ve r s i f i c a ti o n
Fee Income Businesses—Revenues And % Composition
IBERIA Capital Partners
IBERIABANK Mortgage $127 Million
Bank Capital Markets $119 Million
IBERIA Wealth Advisors 4%
IBERIA Financial Services $110 Million CAGR = 7%
6%
Treasury Management
ICP—Energy Cap Mkts
Lenders Title 8%
$85 Million
$84 Million
1%
2% 64%
es 55% IMC—Mortgage
enu 47%
Rev
Total 66% 59% CAGR = 12%
Bank Capital Markets 62% CAGR
2%
2% 6% IWA—Wealth Mgmt
1% 5% 17% CAGR
3% IFS—Brokerage
9%
2% 1% 7% 7%
0.4% |
| 10% 9% Treasury Management 36% CAGR |
8% 5% 7%
4% 5%
LTC—Title Insurance 3% CAGR
21% 21% 17% 17% 19%
2010 2011 2012 2013 2014
62
|
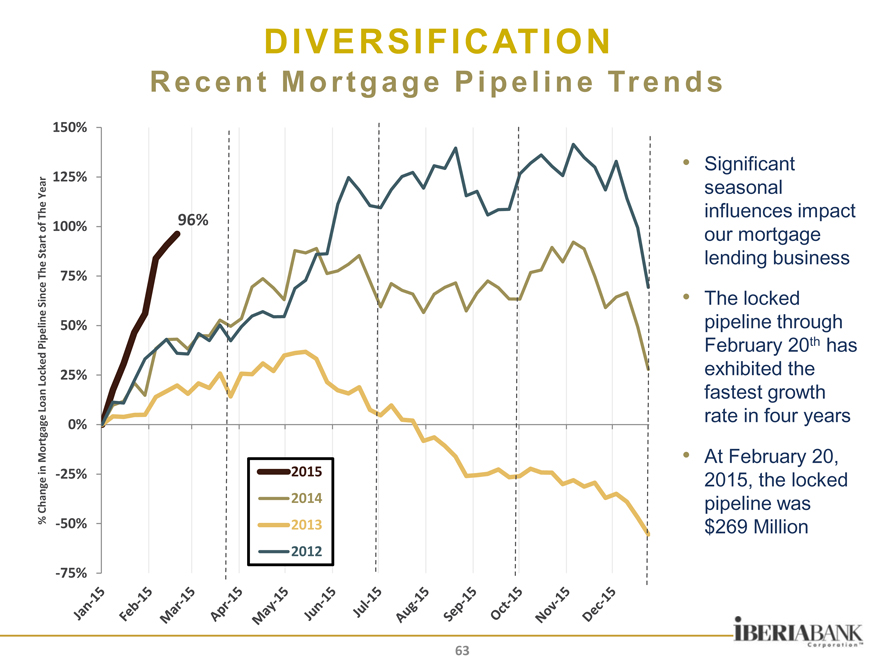
DIVERSIFICATION
R e c e n t M o r t g a g e P i p e l i n e Tr e n d s
% Change in Mortgage Loan Locked Pipeline Since The Start of The Year
-75% -50% -25% 0% 25% 50% 75% 100% 125% 150%
96%
2012 2013 2014 2015
Significant seasonal influences impact our mortgage lending business
The locked pipeline through February 20th has exhibited the fastest growth rate in four years
At February 20, 2015, the locked pipeline was $269 Million
63
|
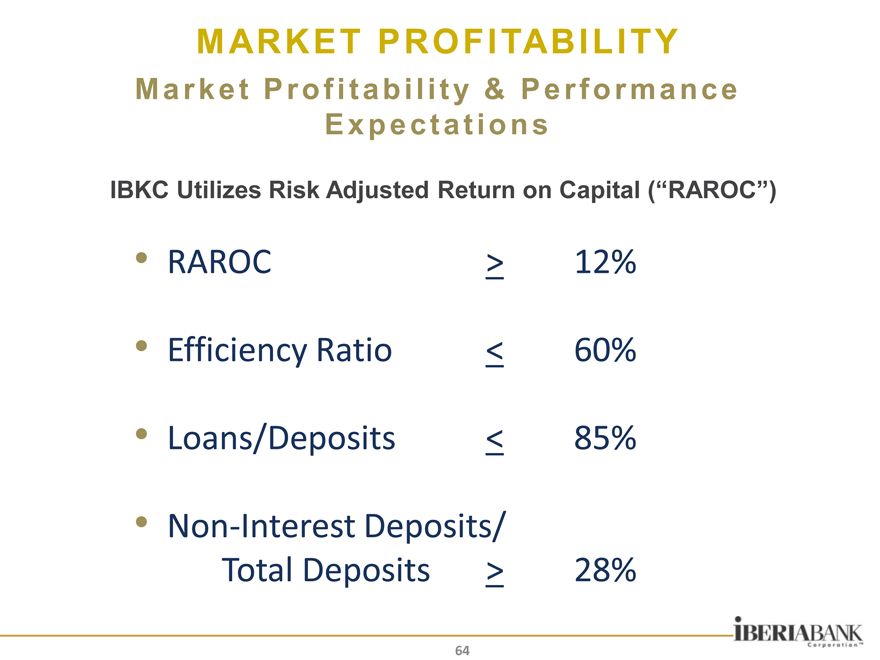
M ARKET PROFITABILITY
M a r k e t P r o f i t a b i l i t y & P e r f o r ma nc e E x p e c t a t i o ns
IBKC Utilizes Risk Adjusted Return on Capital (“RAROC”)
RAROC > 12%
Efficiency Ratio < 60%
Loans/Deposits < 85%
Non-Interest Deposits/
Total Deposits > 28%
64
|
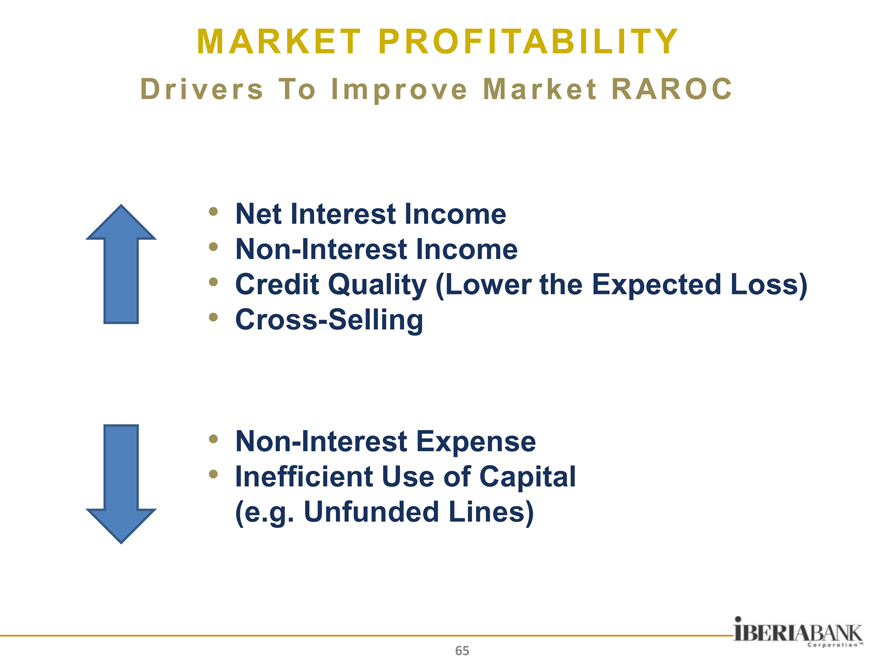
M ARKET PROFITABILITY
D r i ve r s To I m p r o ve M a r k e t R AR O C
Net Interest Income Non-Interest Income
Credit Quality (Lower the Expected Loss) Cross-Selling
Non-Interest Expense Inefficient Use of Capital (e.g. Unfunded Lines)
65
|
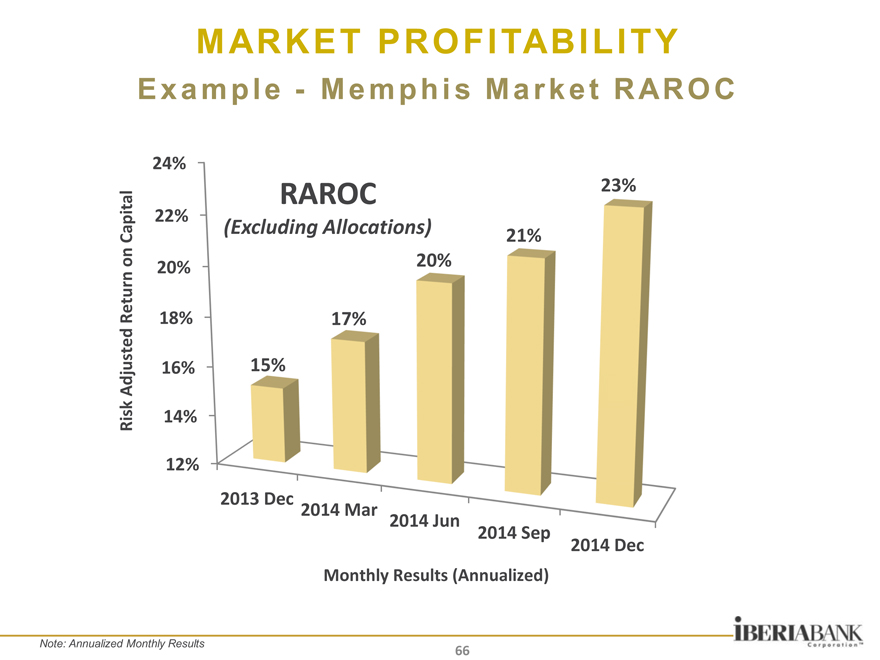
M ARKET PROFITABILITY
E x a m p l e—M e m p h i s M a r k e t R AR O C
24%
RAROC 23%
22%
Capital(Excluding Allocations) 21%
on 20% 20%
turn
Re 18% 17%
d
juste 16% 15%
d
A
isk 14%
R
12%
2013 Dec
2014 Mar 2014 Jun
2014 Sep
2014 Dec
Monthly Results (Annualized)
Note: Annualized Monthly Results
66
|
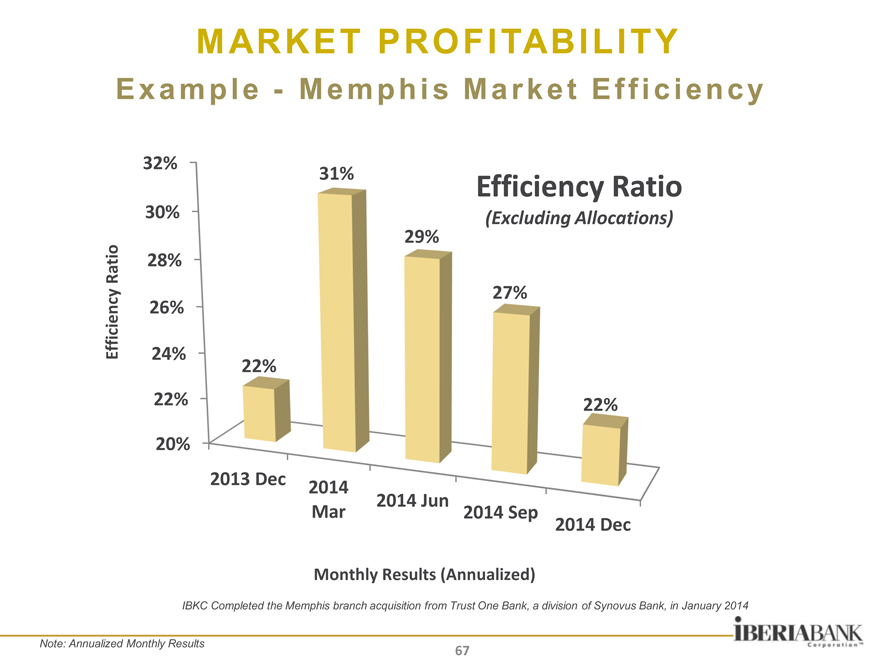
M ARKET PROFITABILITY
E x a m p l e—M e m p h i s M a r k e t E f f i c i e n c y
32%
31% Efficiency Ratio
30%(Excluding Allocations)
29%
atio 28%
R
27%
ncy 26%
e
i
c
i
Eff 24%
22%
22% 22%
20%
2013 Dec 2014
2014 Jun
Mar 2014 Sep
2014 Dec
Monthly Results (Annualized)
IBKC Completed the Memphis branch acquisition from Trust One Bank, a division of Synovus Bank, in January 2014
Note: Annualized Monthly Results
67
|
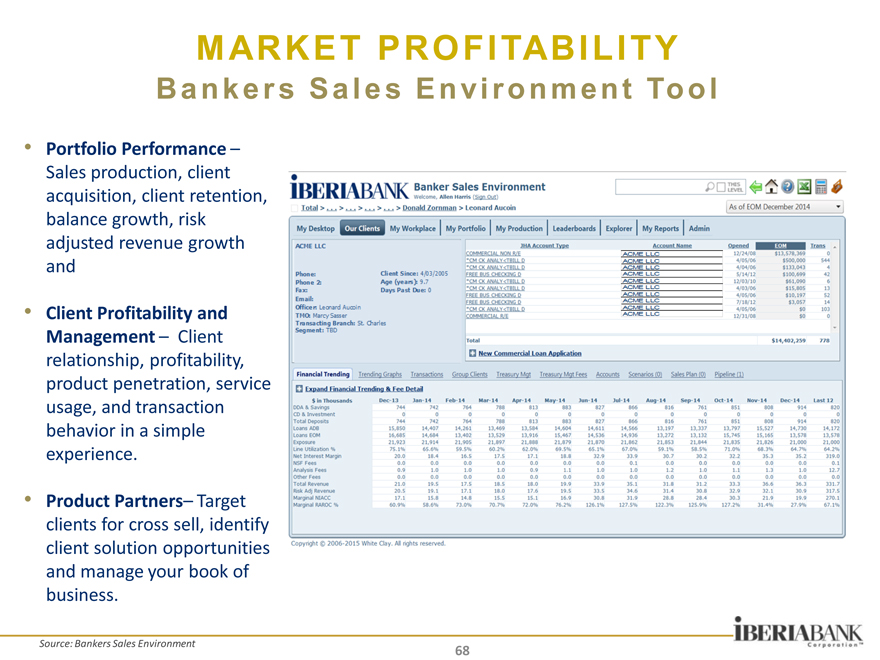
M ARKET PROFITABILITY
B a n k e r s S a l e s E n vi r o n m e n t To o l
Portfolio Performance –
Sales production, client acquisition, client retention, balance growth, risk adjusted revenue growth and
Client Profitability and Management – Client relationship, profitability, product penetration, service usage, and transaction behavior in a simple experience.
Product Partners– Target clients for cross sell, identify client solution opportunities and manage your book of business.
Source: Bankers Sales Environment
68
|
M ARKET PROFITABILITY
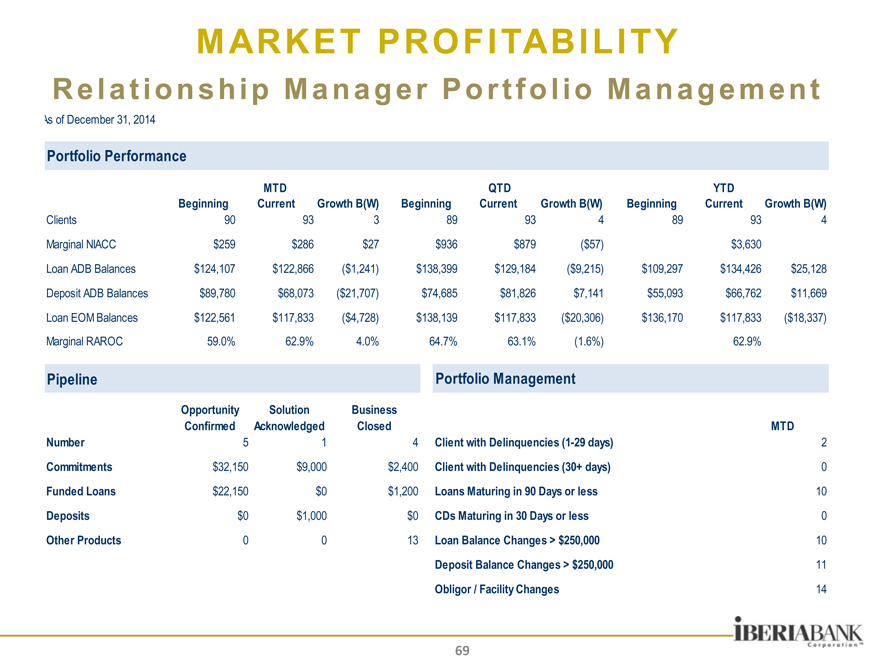
R e l a t i o ns hi p M a n a g e r P o r t f o l i o M a n a g e m e nt
As of December 31, 2014
Portfolio Performance
MTD QTD YTD
Beginning Current Growth B(W) Beginning Current Growth B(W) Beginning Current Growth B(W)
Clients 90 93 3 89 93 4 89 93 4
Marginal NIACC $259 $286 $27 $936 $879($57) $3,630
Loan ADB Balances $124,107 $122,866($1,241) $138,399 $129,184($9,215) $109,297 $134,426 $25,128
Deposit ADB Balances $89,780 $68,073($21,707) $74,685 $81,826 $7,141 $55,093 $66,762 $11,669
Loan EOM Balances $122,561 $117,833($4,728) $138,139 $117,833($20,306) $136,170 $117,833($18,337)
Marginal RAROC 59.0% 62.9% 4.0% 64.7% 63.1%(1.6%) 62.9%
Pipeline
Opportunity Solution Business
Confirmed Acknowledged Closed
Number 5 1 4
Commitments $32,150 $9,000 $2,400
Funded Loans $22,150 $0 $1,200
Deposits $0 $1,000 $0
Other Products 0 0 13
Portfolio Management
MTD
Client with Delinquencies (1-29 days) 2
Client with Delinquencies (30+ days) 0
Loans Maturing in 90 Days or less 10
CDs Maturing in 30 Days or less 0
Loan Balance Changes > $250,000 10
Deposit Balance Changes > $250,000 11
Obligor / Facility Changes 14
69
|
M ARKETS & GROWTH
Ar e a s O f P r i m a ry F o c u s
Market and Client Profitability Deposit Growth Diversification Business Banking
Non-Interest Income (Including Treasury Management and Bank Capital Markets) Optimize The Delivery System (Including Electronic Banking)
70
|

M&A DI SCUSSION
Few men have the virtue to “ withstand the highest bidder.
—George “
Washington
71
|
M &A
O u r M & A C h a r a c t e ri s t i c s
Acquisitions Supplement Our Organic Growth Engine
CAGR Since 1999: 14% Organic Loans, 18% Core Deposits
Fee Income Focus (Historically 27-31% Of Revenues)
Southeastern United States: Texas-to-Virginia-to-Florida
Metropolitan Market Focus – Where Our Business Model Works, Favorable Competitive Dynamics, And People Connectivity
Lower Risk Posture, But Opportunistic Approach To M&A
Involved In Many Opportunities, But Very Selective and Disciplined
Primary Objectives:
Enter Desirable And Targeted Markets Most Effectively And Efficiently Geographic And Revenue Diversification Cost-Effective Distribution, Favorable Clients, Leadership Add Long-Term Shareholder Value Through Synergies And Growth
72
|
M &A
H i s t o r i c a l P e r s pe c t i ve
Since 2001, 21 Acquisitions in Five States and Three Pending Deals
Including FDIC-Assisted, Live Bank, Branch Purchases, and Non-Bank
According to SNL, We Were:
– One Of The Most Active FDIC Bidders (25 Bids)
– One Of The Most Active FDIC Acquirers (Completed Five FDIC Deals)
– One Of The Most Active Live Bank Acquirers Since 2010
Aggregate Purchases of $12.3 Billion in Assets, $7.5 Billion in Loans, and $9.8 Billion in Deposits, Including Pending Transactions
On Four Occasions, We Completed Two Deals At The Same Time
On One Occasion, We Completed Three Deals At The Same Time
Our Pending Deals Are The First Time We Are Working Three Deals With
Five Conversions At The Same Time
73
|
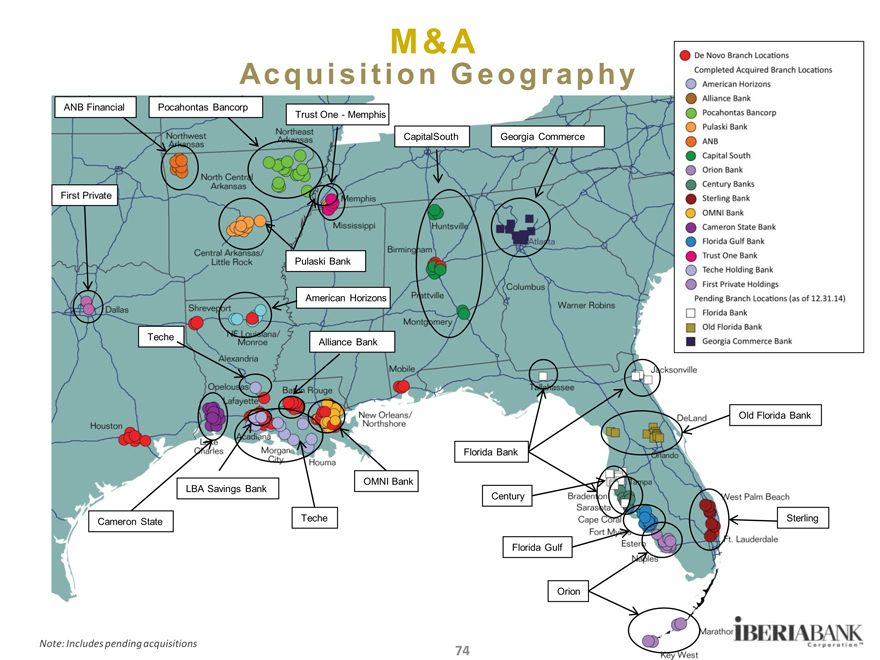
M &A
Ac q u i s i t i o n G e o g r a p hy
ANB Financial Pocahontas Bancorp
Trust One—Memphis
CapitalSouth Georgia Commerce
First Private
Pulaski Bank
American Horizons
Teche Alliance Bank
Old Florida Bank
Florida Bank
OMNI Bank
LBA Savings Bank
Century
Cameron State Teche Sterling
Florida Gulf
Orion
Note: Includes pending acquisitions 74
|
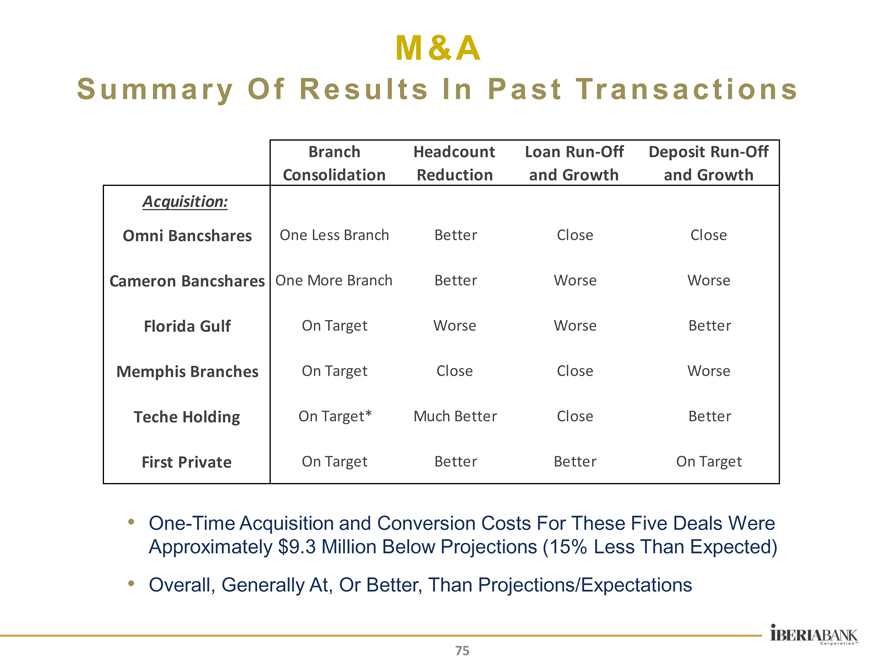
M &A
S u m m a r y O f R e s u l t s I n P a s t Tr a n s a c t i on s
Branch Headcount Loan Run-Off Deposit Run-Off
Consolidation Reduction and Growth and Growth
Acquisition:
Omni Bancshares One Less Branch Better Close Close
Cameron Bancshares One More Branch Better Worse Worse
Florida Gulf On Target Worse Worse Better
Memphis Branches On Target Close Close Worse
Teche Holding On Target* Much Better Close Better
First Private On Target Better Better On Target
One-Time Acquisition and Conversion Costs For These Five Deals Were Approximately $9.3 Million Below Projections (15% Less Than Expected) Overall, Generally At, Or Better, Than Projections/Expectations
75
|
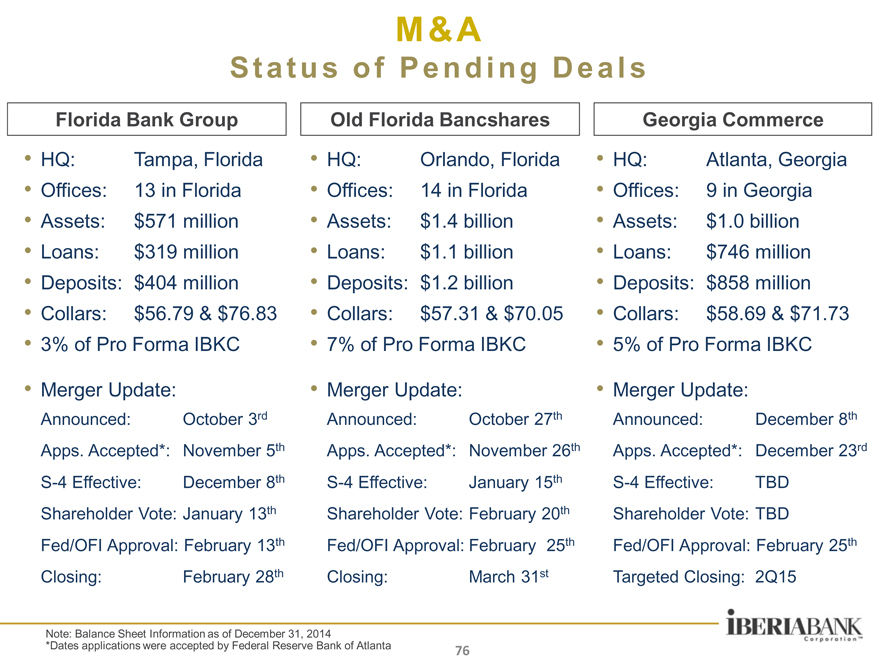
M &A
S t a t u s o f P e n d i ng D e a l s
Florida Bank Group Old Florida Bancshares Georgia Commerce
HQ: Tampa, Florida HQ: Orlando, Florida HQ: Atlanta, Georgia
Offices: 13 in Florida Offices: 14 in Florida Offices: 9 in Georgia
Assets: $571 million Assets: $1.4 billion Assets: $ 1.0 billion
Loans: $319 million Loans: $1.1 billion Loans: $ 746 million
Deposits: $404 million Deposits: $1.2 billion Deposits: $ 858 million
Collars: $56.79 & $76.83 Collars: $57.31 & $70.05 Collars: $ 58.69 & $71.73
3% of Pro Forma IBKC 7% of Pro Forma IBKC 5% of Pro Forma IBKC
Merger Update: Merger Update: Merger Update:
Announced: October 3rd Announced: October 27th Announced: December 8th
Apps. Accepted*: November 5th Apps. Accepted*: November 26th Apps. Accepted*: December 23rd
S-4 Effective: December 8th S-4 Effective: January 15th S-4 Effective: TBD
Shareholder Vote: January 13th Shareholder Vote: February 20th Shareholder Vote: TBD
Fed/OFI Approval: February 13th Fed/OFI Approval: February 25th Fed/OFI Approval: February 25th
Closing: February 28th Closing: March 31st Targeted Closing: 2Q15
Note: Balance Sheet Information as of December 31, 2014
*Dates applications were accepted by Federal Reserve Bank of Atlanta
76
|
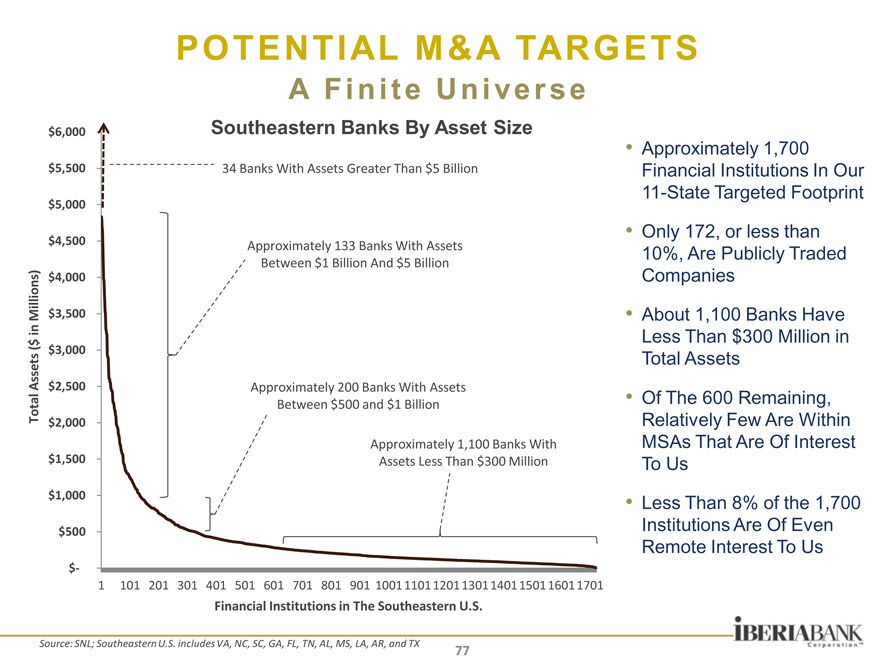
POTENTIAL M &A TARGETS
A F i n i t e U n i ve r s e
$6,000 Southeastern Banks By Asset Size
$5,500 34 Banks With Assets Greater Than $5 Billion
$5,000
$4,500 Approximately 133 Banks With Assets
Between $1 Billion And $5 Billion
ions) $4,000
Mill $3,500
in
$
( $3,000
s
sset
A $2,500 Approximately 200 Banks With Assets
l
ta Between $500 and $1 Billion
To $2,000
Approximately 1,100 Banks With
$1,500 Assets Less Than $300 Million
$1,000
$500
$-
1 101 201 301 401 501 601 701 801 901 10011101120113011401150116011701
Financial Institutions in The Southeastern U.S.
Approximately 1,700
Financial Institutions In Our
11-State Targeted Footprint
Only 172, or less than
10%, Are Publicly Traded Companies
About 1,100 Banks Have Less Than $300 Million in
Total Assets
Of The 600 Remaining,
Relatively Few Are Within
MSAs That Are Of Interest To Us
Less Than 8% of the 1,700
Institutions Are Of Even Remote Interest To Us
Source: SNL; Southeastern U.S. includes VA, NC, SC, GA, FL, TN, AL, MS, LA, AR, and TX
77
|

I NTEREST RATE RI SK
We cannot direct the wind, “but we can adjust the sails.
—Bertha “
Calloway
78
|
INTEREST RATE RISK
C u r r e n t I R R P o s i t i on
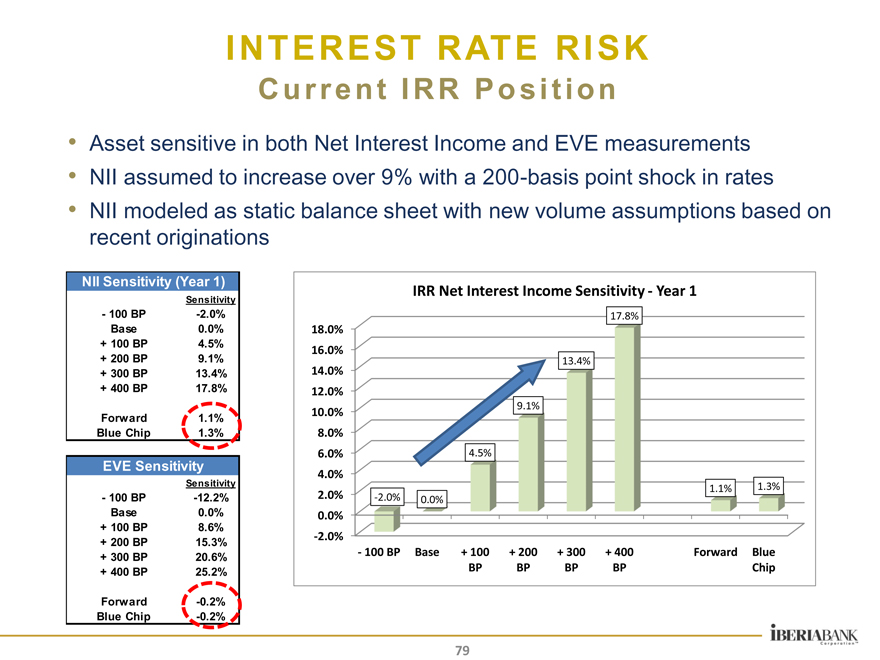
Asset sensitive in both Net Interest Income and EVE measurements NII assumed to increase over 9% with a 200-basis point shock in rates NII modeled as static balance sheet with new volume assumptions based on recent originations
NII Sensitivity (Year 1)
Sensitivity
- 100 BP -2.0%
Base 0.0%
+ 100 BP 4.5%
+ 200 BP 9.1%
+ 300 BP 13.4%
+ 400 BP 17.8%
Forward 1.1%
Blue Chip 1.3%
EVE Sensitivity
Sensitivity
- 100 BP -12.2%
Base 0.0%
+ 100 BP 8.6%
+ 200 BP 15.3%
+ 300 BP 20.6%
+ 400 BP 25.2%
Forward -0.2%
Blue Chip -0.2%
IRR Net Interest Income Sensitivity—Year 1
17.8%
18.0%
16.0%
13.4%
14.0%
12.0%
10.0% 9.1%
8.0%
6.0% 4.5%
4.0%
1.1% 1.3%
2.0% -2.0% 0.0%
0.0%
-2.0%
—100 BP Base + 100 + 200 + 300 + 400 Forward Blue
BP BP BP BP Chip
79
|
INTEREST RATE RISK
C u r r e n t I R R P o s i t i on
Projected NII By Month—Flat Rates and Impact of
Forward Rates
$44,000,000
$43,000,000
$42,000,000
$41,000,000
$40,000,000
$39,000,000
$38,000,000
$37,000,000
NII By Month—Flat Rates NII By Month—Impact of Fwd Curve
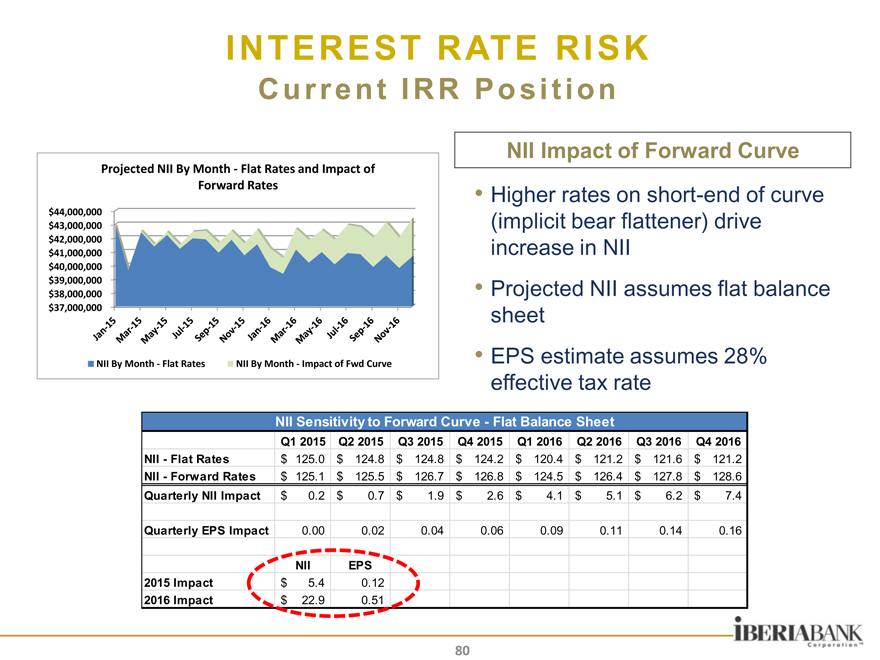
NII Impact of Forward Curve
Higher rates on short-end of curve (implicit bear flattener) drive increase in NII
Projected NII assumes flat balance sheet
EPS estimate assumes 28% effective tax rate
NII Sensitivity to Forward Curve—Flat Balance Sheet
015 Q1 2016 Q2 2016 Q3 2016 Q4 2016
4.2 $ 120.4 $ 121.2 $ 121.6 $ 121.2
6.8 $ 124.5 $ 126.4 $ 127.8 $ 128.6
2.6 $ 4.1 $ 5.1 $ 6.2 $ 7.4
.06 0.09 0.11 0.14 0.16
2015 Impact $ 5.4 0.12
2016 Impact $ 22.9 0.51
80
|
INTEREST RATE RISK
W h y Ar e We As s e t S e n s i t i ve ?
Investment Portfolio
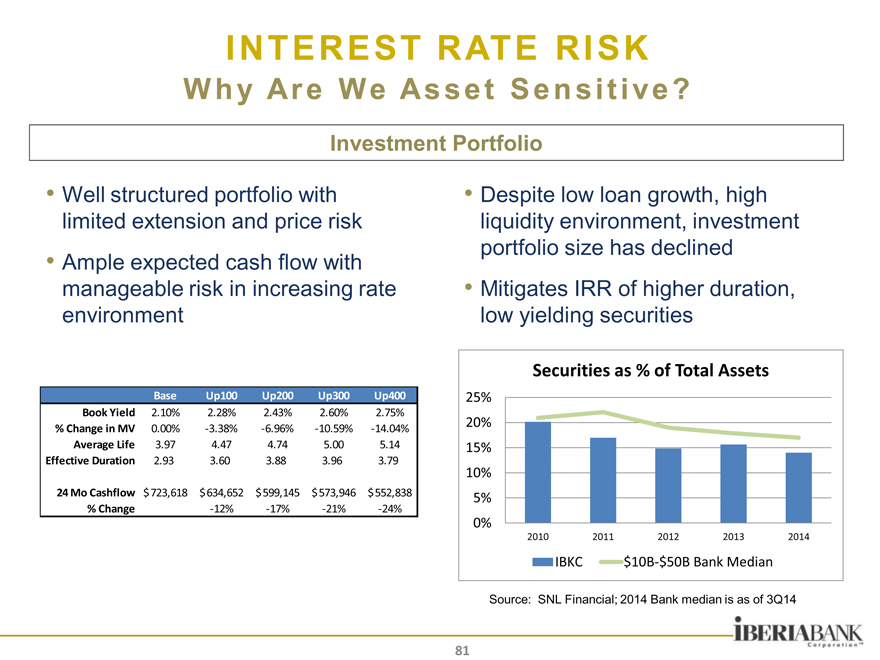
Well structured portfolio with limited extension and price risk Ample expected cash flow with manageable risk in increasing rate environment
Despite low loan growth, high liquidity environment, investment portfolio size has declined
Mitigates IRR of higher duration, low yielding securities
Base Up100 Up200 Up300 Up400
Book Yield 2.10% 2.28% 2.43% 2.60% 2.75%
% Change in MV 0.00% -3.38% -6.96% -10.59% -14.04%
Average Life 3.97 4.47 4.74 5.00 5.14
Effective Duration 2.93 3.60 3.88 3.96 3.79
24 Mo Cashfl ow $ 723,618 $ 634,652 $ 599,145 $ 573,946 $ 552,838
% Change -12% -17% -21% -24%
Securities as % of Total Assets
25%
20%
15%
10%
5%
0%
2010 2011 2012 2013 2014
IBKC $10B-$50B Bank Median
Source: SNL Financial; 2014 Bank median is as of 3Q14
81
|
INTEREST RATE RISK
W h y Ar e We As s e t S e n s i t i ve ?
Loan Portfolio
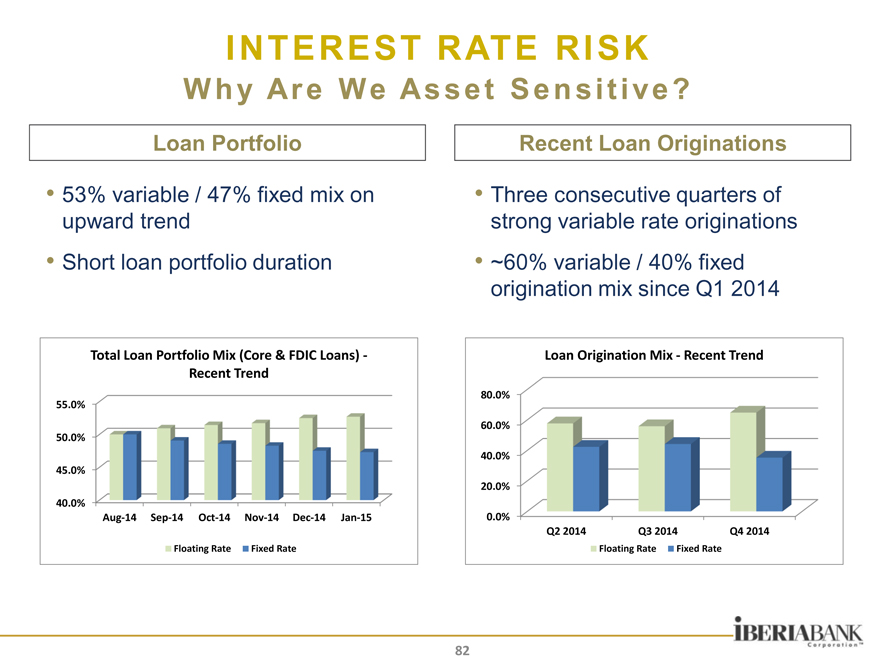
53% variable / 47% fixed mix on upward trend
Short loan portfolio duration
Recent Loan Originations
Three consecutive quarters of strong variable rate originations
~60% variable / 40% fixed origination mix since Q1 2014
Total Loan Portfolio Mix (Core & FDIC Loans) -
Recent Trend
55.0%
50.0%
4
4
Loan Origination Mix—Recent Trend
80.0%
60.0%
40.0%
20.0%
0.0%
Q2 2014 Q3 2014 Q4 2014
Floating Rate Fixed Rate
82
|
INTEREST RATE RISK
W h y Ar e We As s e t S e n s i t i ve ?
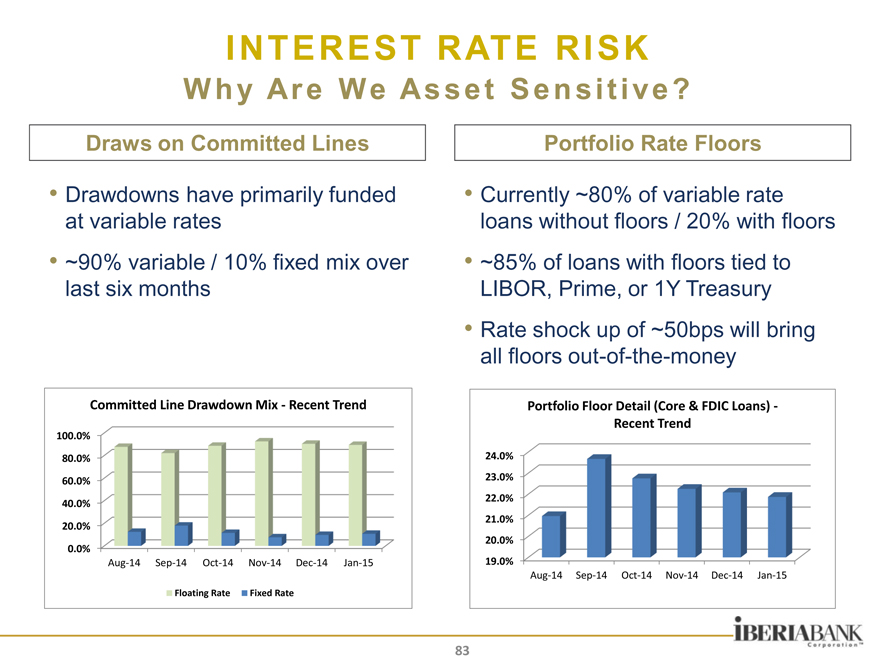
Draws on Committed Lines
Drawdowns have primarily funded at variable rates ~90% variable / 10% fixed mix over last six months
Currently ~80% of variable rate loans without floors / 20% with floors ~85% of loans with floors tied to
LIBOR, Prime, or 1Y Treasury
Rate shock up of ~50bps will bring all floors out-of-the-money
Committed Line Drawdown Mix—Recent Trend
100.0%
80.0%
Portfolio Floor Detail (Core & FDIC Loans) -
Recent Trend
24.0%
23.0%
22.0%
21.0%
20.0%
19.0%
Aug-14 Sep-14 Oct-14 Nov-14 Dec-14 Jan-15
83
|
INTEREST RATE RISK
D e p o s i t E x p o s ur e
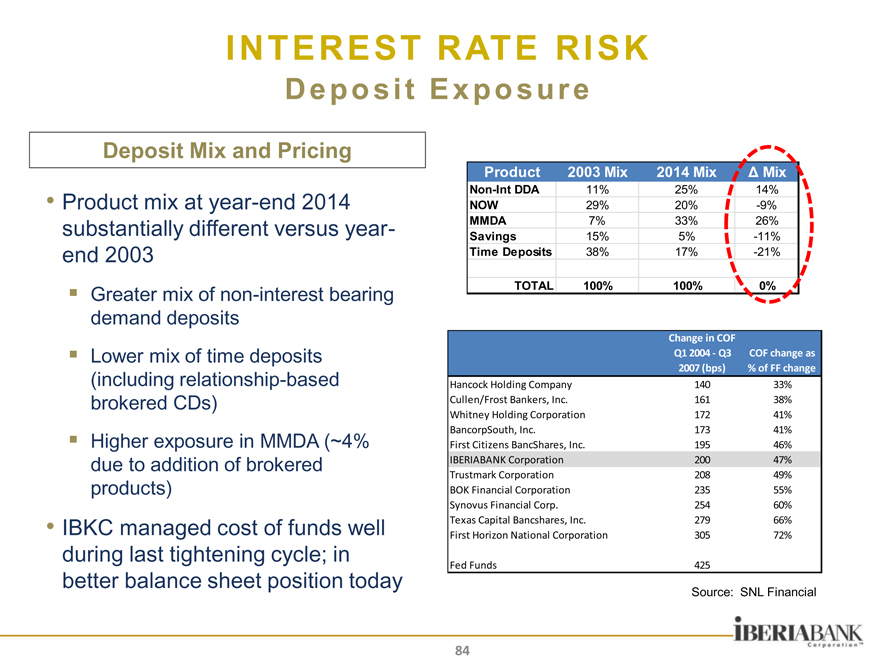
Deposit Mix and Pricing
Product mix at year-end 2014 substantially different versus year-end 2003
Greater mix of non-interest bearing demand deposits Lower mix of time deposits (including relationship-based brokered CDs) Higher exposure in MMDA (~4% due to addition of brokered products)
IBKC managed cost of funds well during last tightening cycle; in better balance sheet position today
Product 2003 Mix 2014 Mix Ä Mix
Non-Int DDA 11% 25% 14%
NOW 29% 20% -9%
MMDA 7% 33% 26%
Savings 15% 5% -11%
Time Deposits 38% 17% -21%
TOTAL 100% 100% 0%
Change in COF
Q1 2004—Q3 COF change as
2007 (bps)% of FF change
Hancock Holding Company 140 33%
Cullen/Frost Bankers, Inc. 161 38%
Whitney Holding Corporation 172 41%
BancorpSouth, Inc. 173 41%
First Citizens BancShares, Inc. 195 46%
IBERIABANK Corporation 200 47%
Trustmark Corporation 208 49%
BOK Financial Corporation 235 55%
Synovus Financial Corp. 254 60%
Texas Capital Bancshares, Inc. 279 66%
First Horizon National Corporation 305 72%
Fed Funds 425
Source: SNL Financial
84
|
INTEREST RATE RISK
M a i n t a i ni n g As s e t S e n s i t i vi t y
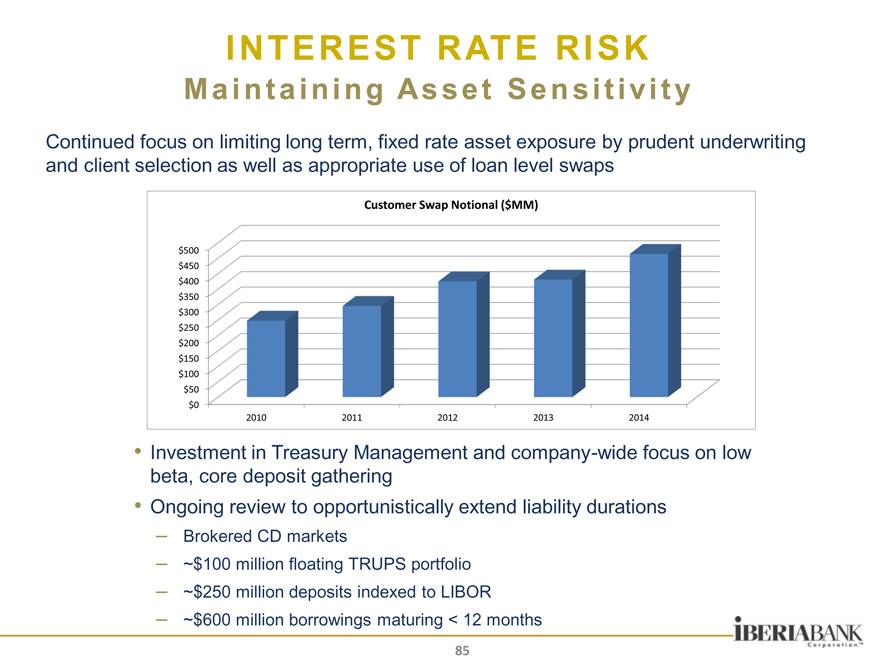
Continued focus on limiting long term, fixed rate asset exposure by prudent underwriting and client selection as well as appropriate use of loan level swaps
Customer Swap Notional ($MM)
$500
$450
$400
$350
$300
$250
$200
$150
$100
$50
$0
2010 2011 2012 2013 2014
Investment in Treasury Management and company-wide focus on low beta, core deposit gathering
Ongoing review to opportunistically extend liability durations
Brokered CD markets
~$100 million floating TRUPS portfolio
~$250 million deposits indexed to LIBOR
~$600 million borrowings maturing < 12 months
85
|

LONG—TERM STRATEGIC GOALS
“Our favorite holding period is forever.”
—Warren
Buffett
86
|

LONG-TERM STRATEGIC GOALS
S t r a t e gi c G o a l s An d E x e c ut i ve C o m p e n s a t i o n
STRATEGIC GOALS
Key long-term financial goals through 2016 are as follows:
Return on average tangible equity of 13% To 17% Tangible efficiency ratio of 60% or less Asset quality in the top 10% of our peers Double-digit percentage growth in fully-diluted operating EPS
Company continues to focus on improving operating efficiency and profitability
EXECUTIVE COMP CHANGES
Executive compensation programs were redesigned to align with strategic goals, profitability focus, and shareholder value creation
Short-term incentive programs place greater emphasis on pre-established performance objectives (as opposed to discretionary objectives)
Long-term incentive programs place greater emphasis on performance-based metrics (as opposed to time-based metrics)
87
|
LONG-TERM STRATEGIC GOALS
H o w D o e s I B K C G e t T h e r e ?
Assuming The Following:
Stable Net Interest Margin
Stable Credit Metrics
No Significant Change in Effective Tax Rate
No Significant Change in Equity Leverage
The Answer:
Improvement in Balance Sheet Efficiency
Balance Sheet Growth
Growth in Non-Interest Income
Expense Containment
88
|
LONG-TERM STRATEGIC GOALS
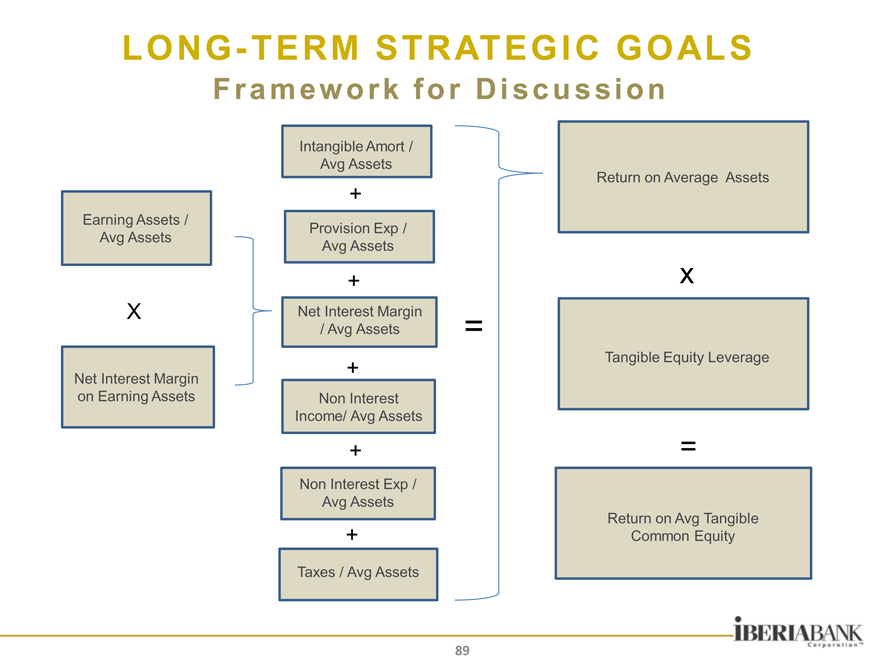
F r a m e w o rk f o r D i s c u s s i on
Intangible Amort /
Avg Assets
Return on Average Assets
+
Earning Assets / Provision Exp /
Avg Assets Avg Assets
+ x
X Net Interest Margin
/ Avg Assets =
+ Tangible Equity Leverage
Net Interest Margin
on Earning Assets Non Interest
Income/ Avg Assets
+ =
Non Interest Exp /
Avg Assets
Return on Avg Tangible
+ Common Equity
Taxes / Avg Assets
89
|
LONG-TERM STRATEGIC GOALS
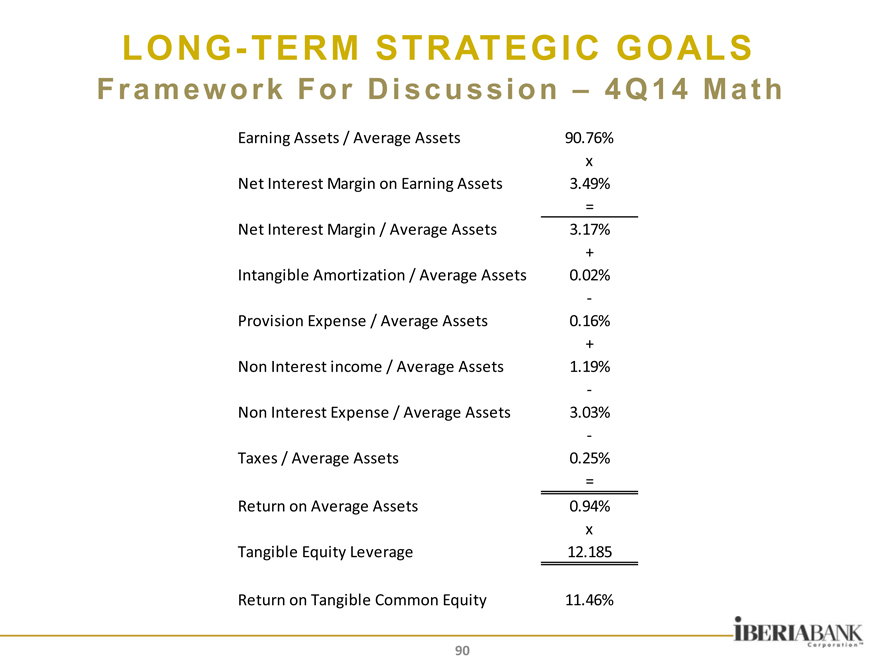
F r a m e w o rk F o r D i s c u s s i o n – 4 Q 1 4 M a t h
Earning Assets / Average Assets 90.76%
x
Net Interest Margin on Earning Assets 3.49%
=
Net Interest Margin / Average Assets 3.17%
+
Intangible Amortization / Average Assets 0.02%
-
Provision Expense / Average Assets 0.16%
+
Non Interest income / Average Assets 1.19%
-
Non Interest Expense / Average Assets 3.03%
-
Taxes / Average Assets 0.25%
=
Return on Average Assets 0.94%
x
Tangible Equity Leverage 12.185
Return on Tangible Common Equity 11.46%
90
|
LONG-TERM STRATEGIC GOALS
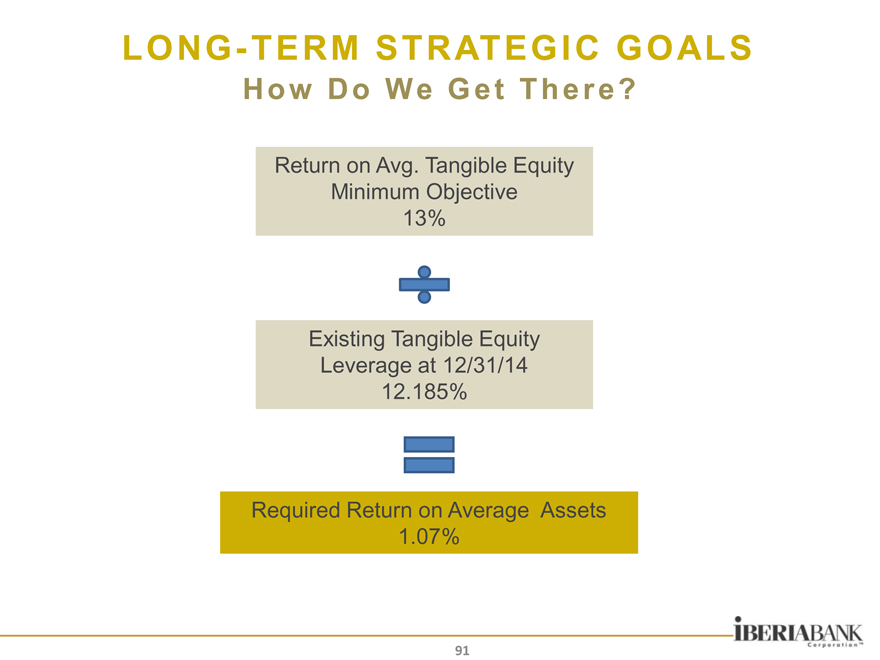
H o w D o We G e t T h e r e ?
Return on Avg. Tangible Equity
Minimum Objective
13%
Existing Tangible Equity
Leverage at 12/31/14
12.185%
Required Return on Average Assets
1.07%
91
|
LONG-TERM STRATEGIC GOALS
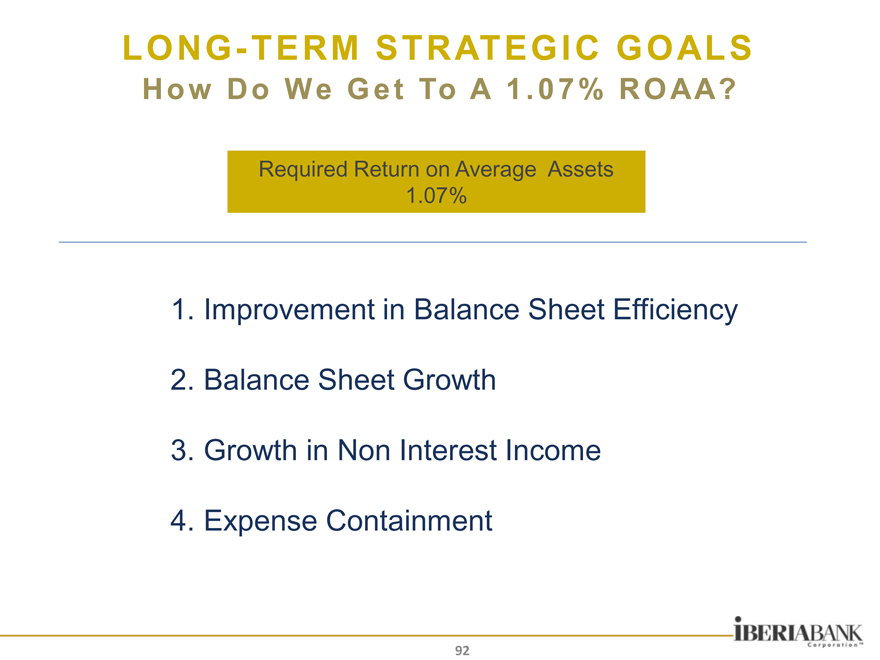
H o w D o We G e t To A 1 . 0 7 % R O AA?
Required Return on Average Assets 1.07%
1. Improvement in Balance Sheet Efficiency
2. Balance Sheet Growth
3. Growth in Non Interest Income
4. Expense Containment
92
|
LONG-TERM STRATEGIC GOALS
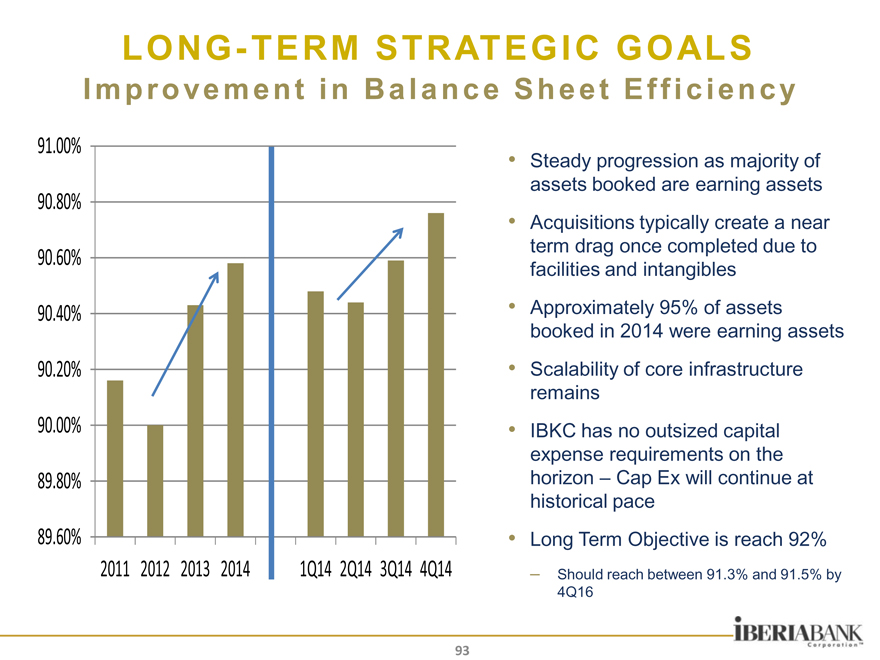
I m p r o ve m e n t i n B a l a n c e S h e e t E f f i c i e n c y
91.00%
90.80%
90.60%
90.40%
90.20%
90.00%
89.80%
89.60%
2011 2012 2013 2014 1Q14 2Q14 3Q14 4Q14
Steady progression as majority of assets booked are earning assets Acquisitions typically create a near term drag once completed due to facilities and intangibles Approximately 95% of assets booked in 2014 were earning assets Scalability of core infrastructure remains IBKC has no outsized capital expense requirements on the horizon – Cap Ex will continue at historical pace Long Term Objective is reach 92%
– Should reach between 91.3% and 91.5% by 4Q16
93
|
LONG-TERM STRATEGIC GOALS
B a l a n c e S h e e t G r o w t h
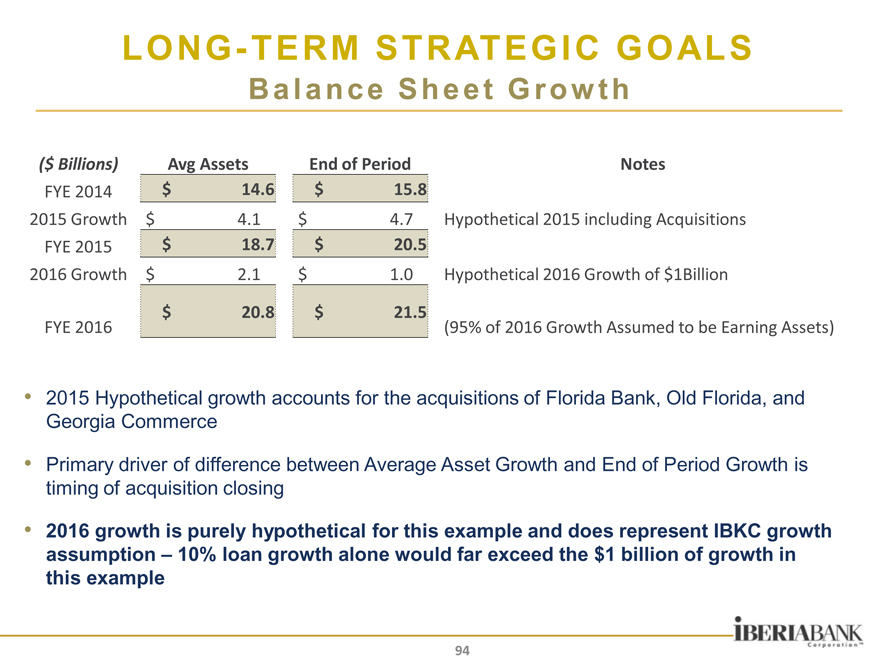
($ Billions) Avg Assets End of Period
FYE 2014 $ 14.6 $ 15.8
2015 Growth $ 4.1 $ 4.7
FYE 2015 $ 18.7 $ 20.5
2016 Growth $ 2.1 $ 1.0
$ 20.8 $ 21.5
FYE 2016
Notes
Hypothetical 2015 including Acquisitions
Hypothetical 2016 Growth of $1Billion
(95% of 2016 Growth Assumed to be Earning Assets)
2015 Hypothetical growth accounts for the acquisitions of Florida Bank, Old Florida, and Georgia Commerce
Primary driver of difference between Average Asset Growth and End of Period Growth is timing of acquisition closing
2016 growth is purely hypothetical for this example and does represent IBKC growth assumption – 10% loan growth alone would far exceed the $1 billion of growth in this example
94
|
LONG-TERM STRATEGIC GOALS
F r a m e w o rk f o r D i s c u s s i on – P r o g r e s s i o n
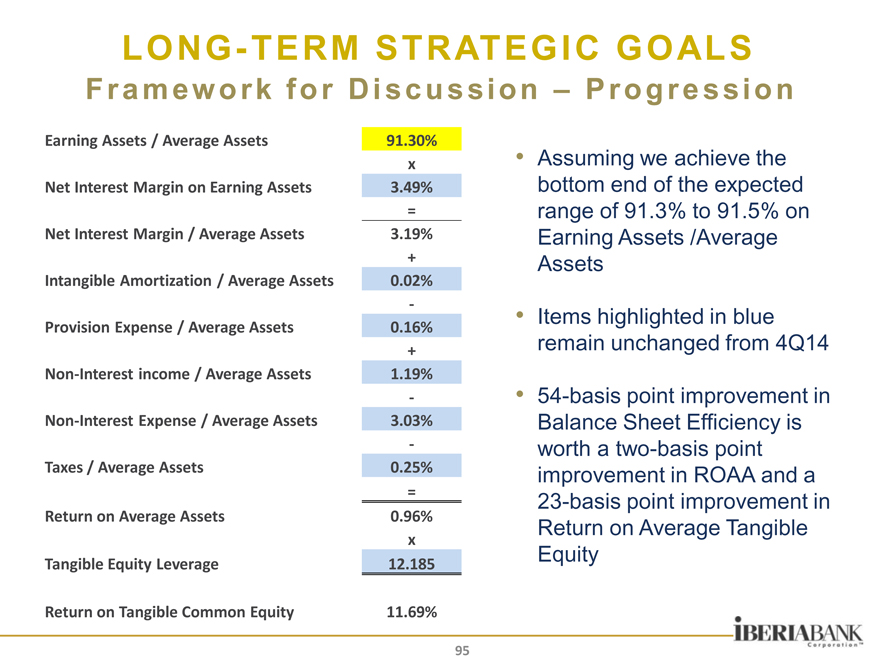
Earning Assets / Average Assets 91.30%
x
Net Interest Margin on Earning Assets 3.49%
=
Net Interest Margin / Average Assets 3.19%
+
Intangible Amortization / Average Assets 0.02%
-
Provision Expense / Average Assets 0.16%
+
Non-Interest income / Average Assets 1.19%
-
Non-Interest Expense / Average Assets 3.03%
-
Taxes / Average Assets 0.25%
=
Return on Average Assets 0.96%
x
Tangible Equity Leverage 12.185
Return on Tangible Common Equity 11.69%
Assuming we achieve the bottom end of the expected range of 91.3% to 91.5% on
Earning Assets /Average
Assets
Items highlighted in blue remain unchanged from 4Q14
54-basis point improvement in
Balance Sheet Efficiency is worth a two-basis point improvement in ROAA and a
23-basis point improvement in
Return on Average Tangible
Equity
95
|
LONG-TERM STRATEGIC GOALS
G r ow t h i n N o n—I n t e r e s t I n c o m e & E x p e ns e s
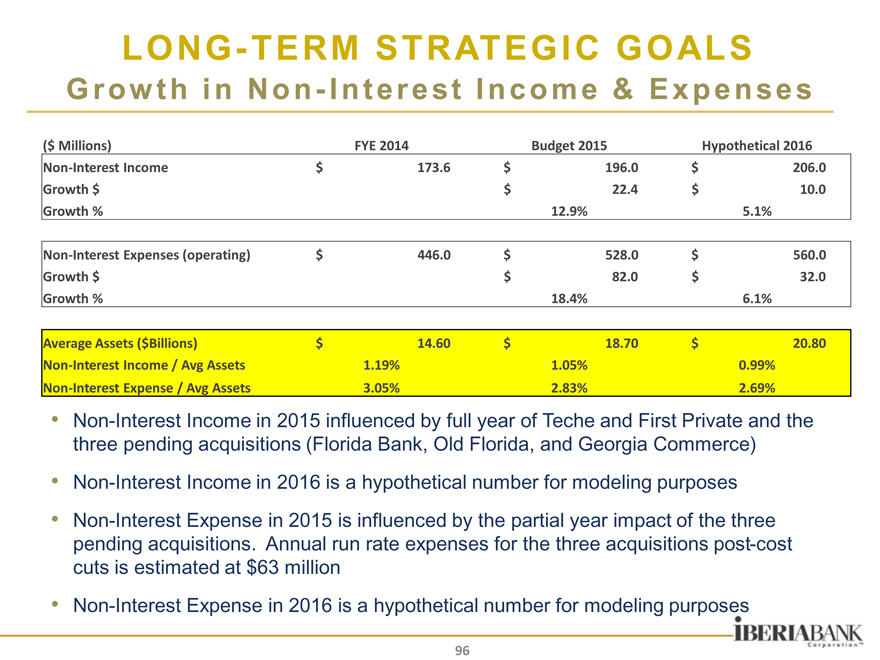
($ Millions) FYE 2014 Budget 2015 Hypothetical 2016
Non-Interest Income $ 173.6 $ 196.0 $ 206.0
Growth $ $ 22.4 $ 10.0
Growth % 12.9% 5.1%
Non-Interest Expenses (operating) $ 446.0 $ 528.0 $ 560.0
Growth $ $ 82.0 $ 32.0
Growth % 18.4% 6.1%
Average Assets ($Billions) $ 14.60 $ 18.70 $ 20.80
Non-Interest Income / Avg Assets 1.19% 1.05% 0.99%
Non-Interest Expense / Avg Assets 3.05% 2.83% 2.69%
Non-Interest Income in 2015 influenced by full year of Teche and First Private and the three pending acquisitions (Florida Bank, Old Florida, and Georgia Commerce) Non-Interest Income in 2016 is a hypothetical number for modeling purposes Non-Interest Expense in 2015 is influenced by the partial year impact of the three pending acquisitions. Annual run rate expenses for the three acquisitions post-cost cuts is estimated at $63 million Non-Interest Expense in 2016 is a hypothetical number for modeling purposes
96
|
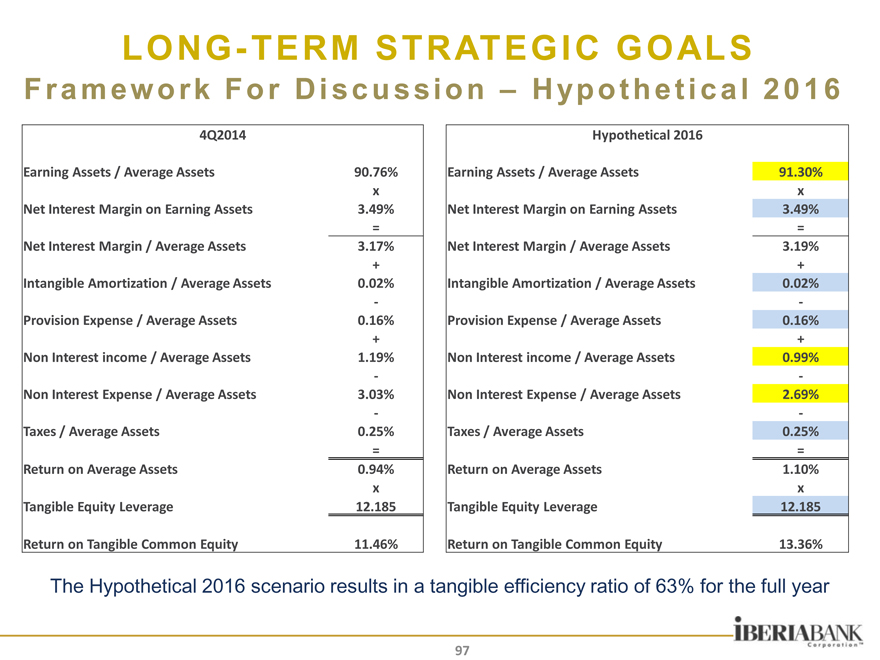
LONG-TERM STRATEGIC GOALS
F r a m e w o rk F o r D i s c u s s i o n – H yp o t h e t i c a l 2 0 1 6
4Q2014
Earning Assets / Average Assets 90.76%
x
Net Interest Margin on Earning Assets 3.49%
=
Net Interest Margin / Average Assets 3.17%
+
Intangible Amortization / Average Assets 0.02%
-
Provision Expense / Average Assets 0.16%
+
Non Interest income / Average Assets 1.19%
-
Non Interest Expense / Average Assets 3.03%
-
Taxes / Average Assets 0.25%
=
Return on Average Assets 0.94%
x
Tangible Equity Leverage 12.185
Return on Tangible Common Equity 11.46%
Hypothetical 2016
Earning Assets / Average Assets 91.30%
x
Net Interest Margin on Earning Assets 3.49%
=
Net Interest Margin / Average Assets 3.19%
+
Intangible Amortization / Average Assets 0.02%
-
Provision Expense / Average Assets 0.16%
+
Non Interest income / Average Assets 0.99%
-
Non Interest Expense / Average Assets 2.69%
-
Taxes / Average Assets 0.25%
=
Return on Average Assets 1.10%
x
Tangible Equity Leverage 12.185
Return on Tangible Common Equity 13.36%
The Hypothetical 2016 scenario results in a tangible efficiency ratio of 63% for the full year
97
|
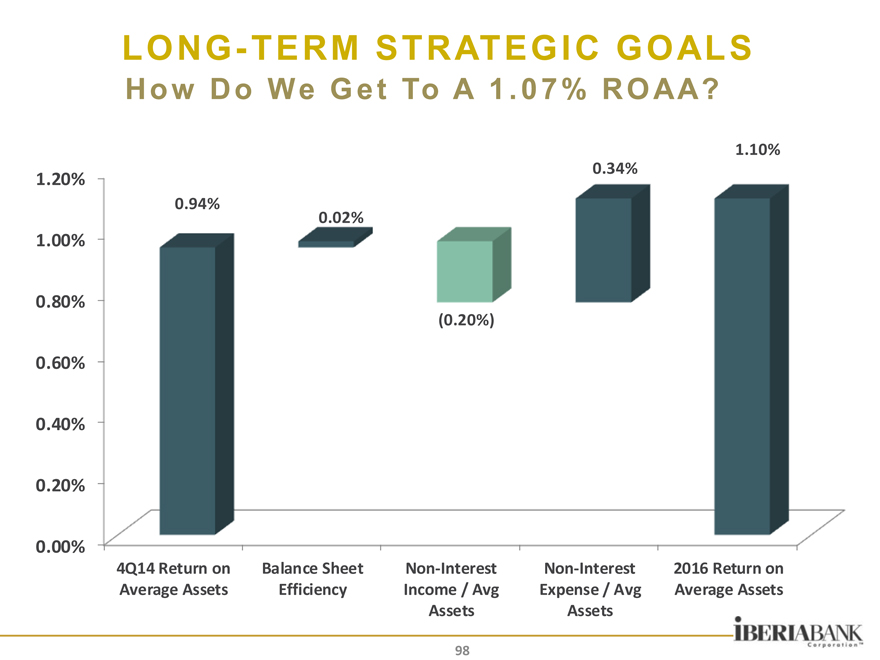
LONG-TERM STRATEGIC GOALS
H o w D o We G e t To A 1 . 0 7 % R O AA?
1.10%
0.34%
1.20%
0.94%
0.02%
1.00%
0.80%
(0.20%)
0.60%
0.40%
0.20%
0.00%
4Q14 Return on Balance Sheet Non-Interest Non-Interest 2016 Return on
Average Assets Efficiency Income / Avg Expense / Avg Average Assets
Assets Assets
98
|

IBERIABANK
CorporationTM
|
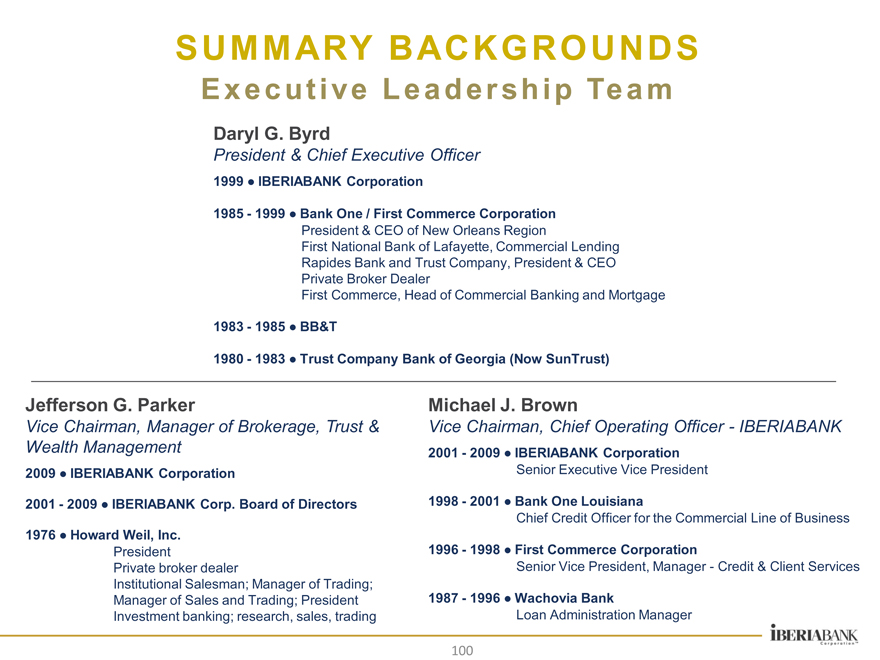
SUMMARY BACKGROUNDS
E x e c ut i ve L e a d e r s h i p Te a m
Daryl G. Byrd
President & Chief Executive Officer
1999 • IBERIABANK Corporation
1985—1999 • Bank One / First Commerce Corporation
President & CEO of New Orleans Region
First National Bank of Lafayette, Commercial Lending
Rapides Bank and Trust Company, President & CEO
Private Broker Dealer
First Commerce, Head of Commercial Banking and Mortgage
1983—1985 • BB&T
1980—1983 • Trust Company Bank of Georgia (Now SunTrust)
Jefferson G. Parker
Vice Chairman, Manager of Brokerage, Trust & Wealth Management
2009 • IBERIABANK Corporation
2001—2009 • IBERIABANK Corp. Board of Directors
1976 • Howard Weil, Inc. President Private broker dealer
Institutional Salesman; Manager of Trading; Manager of Sales and Trading; President Investment banking; research, sales, trading
Michael J. Brown
Vice Chairman, Chief Operating Officer—IBERIABANK
2001—2009 • IBERIABANK Corporation
Senior Executive Vice President
1998—2001 • Bank One Louisiana
Chief Credit Officer for the Commercial Line of Business
1996—1998 • First Commerce Corporation
Senior Vice President, Manager—Credit & Client Services
1987—1996 • Wachovia Bank
Loan Administration Manager
100
|
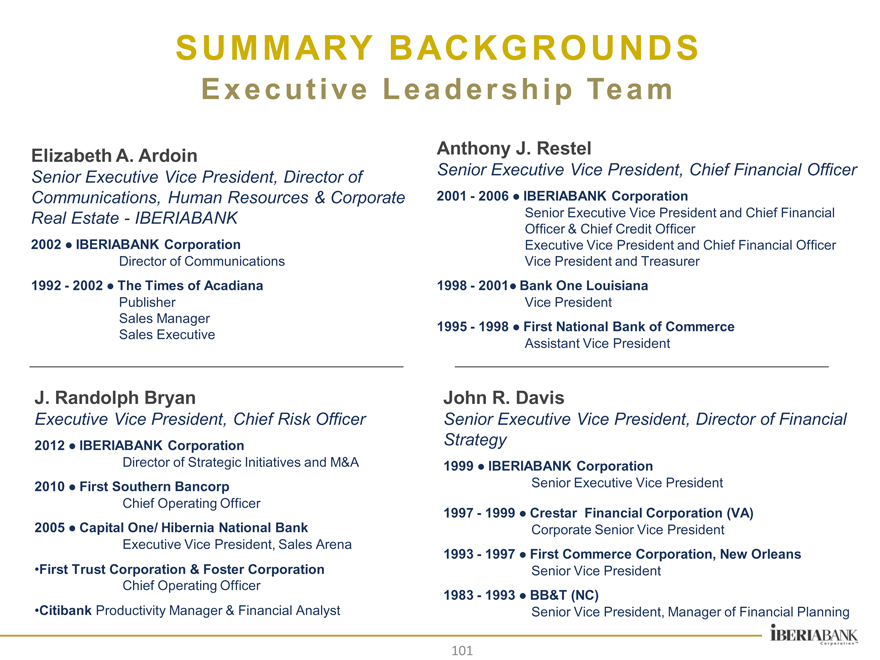
SUMMARY BACKGROUNDS
E x e c ut i ve L e a d e r s h i p Te a m
Elizabeth A. Ardoin
Senior Executive Vice President, Director of Communications, Human Resources & Corporate Real Estate—IBERIABANK
2002 • IBERIABANK Corporation
Director of Communications
1992—2002 • The Times of Acadiana Publisher Sales Manager Sales Executive
Anthony J. Restel
Senior Executive Vice President, Chief Financial Officer
2001—2006 • IBERIABANK Corporation
Senior Executive Vice President and Chief Financial Officer & Chief Credit Officer Executive Vice President and Chief Financial Officer Vice President and Treasurer
1998—2001• Bank One Louisiana Vice President
1995—1998 • First National Bank of Commerce Assistant Vice President
J. Randolph Bryan
Executive Vice President, Chief Risk Officer
2012 • IBERIABANK Corporation
Director of Strategic Initiatives and M&A
2010 • First Southern Bancorp Chief Operating Officer
2005 • Capital One/ Hibernia National Bank
Executive Vice President, Sales Arena
First Trust Corporation & Foster Corporation Chief Operating Officer Citibank Productivity Manager & Financial Analyst
John R. Davis
Senior Executive Vice President, Director of Financial Strategy
1999 • IBERIABANK Corporation
Senior Executive Vice President
1997—1999 • Crestar Financial Corporation (VA)
Corporate Senior Vice President
1993—1997 • First Commerce Corporation, New Orleans Senior Vice President
1983—1993 • BB&T (NC)
Senior Vice President, Manager of Financial Planning
101
|
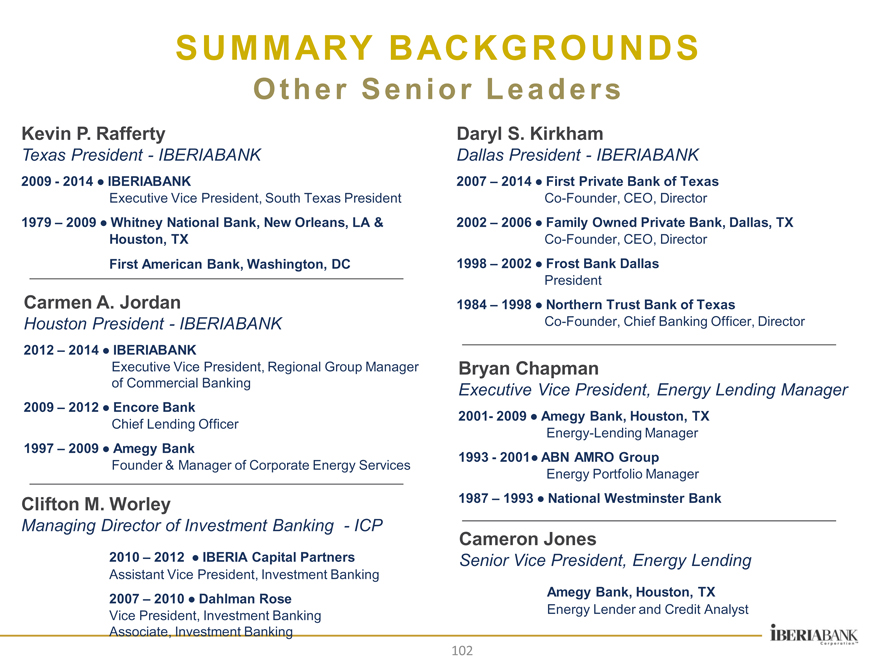
SUMMARY BACKGROUNDS
O t h e r S e n i o r L e a d e rs
Kevin P. Rafferty
Texas President—IBERIABANK
2009—2014 • IBERIABANK
Executive Vice President, South Texas President
1979 – 2009 • Whitney National Bank, New Orleans, LA &
Houston, TX
First American Bank, Washington, DC
Carmen A. Jordan
Houston President—IBERIABANK
2012 –
2014 • IBERIABANK
Executive Vice President, Regional Group Manager
of Commercial Banking
2009 –
2012 • Encore Bank
Chief Lending Officer
1997 –
2009 • Amegy Bank
Founder & Manager of Corporate Energy Services
Clifton M. Worley
Managing Director of Investment Banking—ICP
2010 – 2012 • IBERIA Capital Partners
Assistant Vice President, Investment Banking
2007 – 2010 • Dahlman Rose
Vice President, Investment Banking
Associate, Investment Banking
Daryl S. Kirkham
Dallas President—IBERIABANK
2007 – 2014 • First Private Bank of Texas
Co-Founder, CEO, Director
2002 – 2006 • Family Owned Private Bank, Dallas, TX
Co-Founder, CEO, Director
1998 – 2002 • Frost Bank Dallas
President
1984 – 1998 • Northern Trust Bank of Texas
Co-Founder, Chief Banking Officer, Director
Bryan Chapman
Executive Vice President, Energy Lending Manager
2001- 2009 • Amegy Bank, Houston, TX
Energy-Lending Manager
1993—2001• ABN AMRO Group
Energy Portfolio Manager
1987 – 1993 • National Westminster Bank
Cameron Jones
Senior Vice President, Energy Lending
Amegy Bank, Houston, TX
Energy Lender and Credit Analyst
102
|
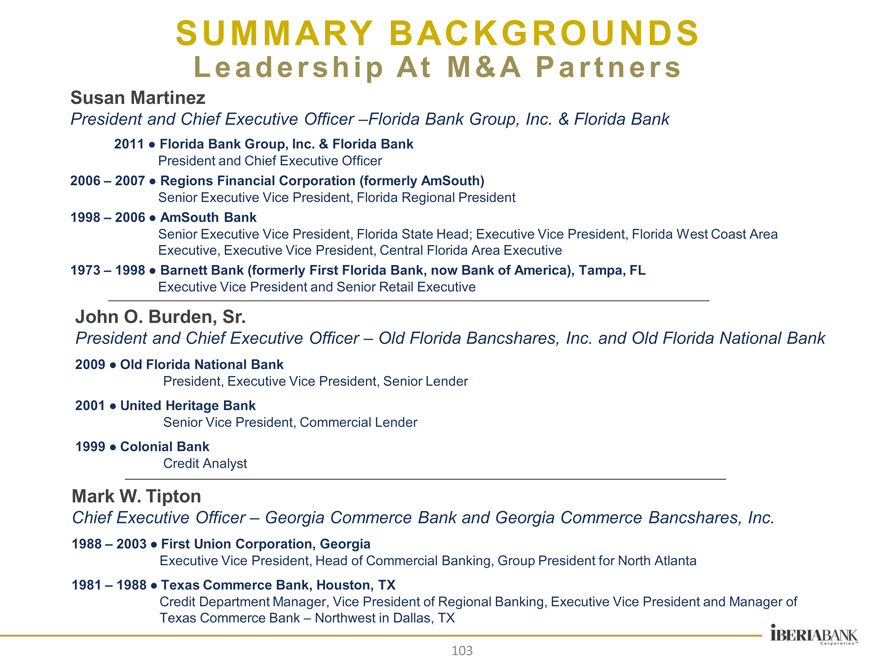
SUMMARY BACKGROUNDS
L e a d e rs h i p At M & A P a r t n e r s
Susan Martinez
President and Chief Executive Officer –Florida Bank Group, Inc. & Florida Bank
2011 • Florida Bank Group, Inc. & Florida Bank
President and Chief Executive Officer
2006 – 2007 • Regions Financial Corporation (formerly AmSouth)
Senior Executive Vice President, Florida Regional President
1998 – 2006 • AmSouth Bank
Senior Executive Vice President, Florida State Head; Executive Vice President, Florida West Coast Area
Executive, Executive Vice President, Central Florida Area Executive
1973 – 1998 • Barnett Bank (formerly First Florida Bank, now Bank of America), Tampa, FL
Executive Vice President and Senior Retail Executive
John O. Burden, Sr.
President and Chief Executive Officer – Old Florida Bancshares, Inc. and Old Florida National Bank
2009 • Old Florida National Bank
President, Executive Vice President, Senior Lender
2001 • United Heritage Bank
Senior Vice President, Commercial Lender
1999 • Colonial Bank
Credit Analyst
Mark W. Tipton
Chief Executive Officer – Georgia Commerce Bank and Georgia Commerce Bancshares, Inc.
1988 – 2003 • First Union Corporation, Georgia
Executive Vice President, Head of Commercial Banking, Group President for North Atlanta
1981 – 1988 • Texas Commerce Bank, Houston, TX
Credit Department Manager, Vice President of Regional Banking, Executive Vice President and Manager of
Texas Commerce Bank – Northwest in Dallas, TX
103
|
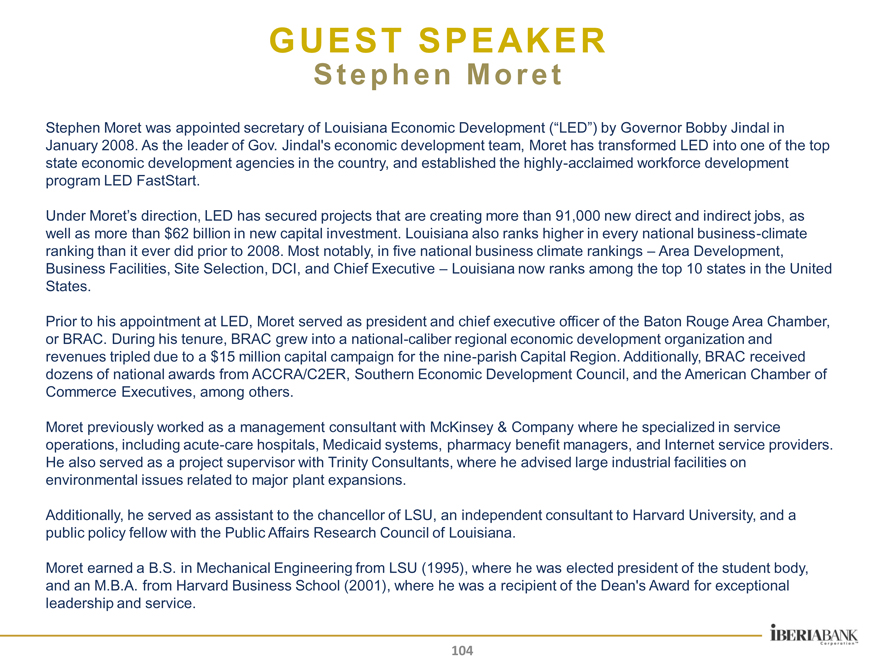
GUEST SPEAKER
S t e p h e n M o r e t
Stephen Moret was appointed secretary of Louisiana Economic Development (“LED”) by Governor Bobby Jindal in
January 2008. As the leader of Gov. Jindal’s economic development team, Moret has transformed LED into one of the top state economic development agencies in the country, and established the highly-acclaimed workforce development program LED FastStart.
Under Moret’s direction, LED has secured projects that are creating more than 91,000 new direct and indirect jobs, as well as more than $62 billion in new capital investment. Louisiana also ranks higher in every national business-climate ranking than it ever did prior to 2008. Most notably, in five national business climate rankings – Area Development, Business Facilities, Site Selection, DCI, and Chief Executive – Louisiana now ranks among the top 10 states in the United States.
Prior to his appointment at LED, Moret served as president and chief executive officer of the Baton Rouge Area Chamber, or BRAC. During his tenure, BRAC grew into a national-caliber regional economic development organization and revenues tripled due to a $15 million capital campaign for the nine-parish Capital Region. Additionally, BRAC received dozens of national awards from ACCRA/C2ER, Southern Economic Development Council, and the American Chamber of Commerce Executives, among others.
Moret previously worked as a management consultant with McKinsey & Company where he specialized in service operations, including acute-care hospitals, Medicaid systems, pharmacy benefit managers, and Internet service providers. He also served as a project supervisor with Trinity Consultants, where he advised large industrial facilities on environmental issues related to major plant expansions.
Additionally, he served as assistant to the chancellor of LSU, an independent consultant to Harvard University, and a public policy fellow with the Public Affairs Research Council of Louisiana.
Moret earned a B.S. in Mechanical Engineering from LSU (1995), where he was elected president of the student body, and an M.B.A. from Harvard Business School (2001), where he was a recipient of the Dean’s Award for exceptional leadership and service.
104