|
Exhibit 99.1 
|
Gulf South Banking Conference May 2015
Safe Harbor And Legend
To the extent that statements in this PowerPoint presentation relate to future plans, objectives, financial results or performance of IBERIABANK Corporation, these statements are deemed to be forward-looking statements within the meaning of the Private Securities Litigation Reform Act of 1995. Such statements, which are based on management’s current information, estimates and assumptions and the current economic environment, are generally identified by the use of the words “plan”, “believe”, “expect”, “intend”, “anticipate”, “estimate”, “project” or similar expressions. The Company’s actual strategies, results and financial condition in future periods may differ materially from those currently expected due to various risks and uncertainties. Forward-looking statements are subject to numerous assumptions, risks and uncertainties that change over time and could cause actual results or financial condition to differ materially from those expressed in or implied by such statements. Consequently, no forward-looking statement can be guaranteed.
In connection with the proposed merger with Georgia Commerce Bancshares, Inc., IBERIABANK Corporation has filed a Registration Statement on Form S-4 that contains a proxy statement/prospectus. INVESTORS AND SECURITY HOLDERS ARE URGED TO CAREFULLY READ THE PROXY STATEMENT/ PROSPECTUS REGARDING THE PROPOSED TRANSACTION BECAUSE SUCH DOCUMENTS CONTAIN IMPORTANT INFORMATION. Investors and security holders may obtain a free copy of the proxy statement/prospectus and other documents containing information about the pending transaction with
Georgia Commerce Bancshares, Inc., without charge, at the SEC’s website at www.sec.gov. Copies of the proxy statement /prospectus and the SEC filings that are incorporated by reference in the proxy statement/prospectus may also be obtained for free from the IBERIABANK Corporation website, www.iberiabank.com, under the heading “Investor Information”.
This communication is not a solicitation of any vote or approval, is not an offer to purchase shares of common stock of Georgia Commerce Bancshares, Inc., nor is it an offer to sell shares of IBERIABANK Corporation common stock which may be issued in the proposed merger. The issuance of IBERIABANK Corporation common stock in any proposed merger would have to be registered under the Securities Act of 1933, as amended, and such IBERIABANK Corporation common stock would be offered only by means of a prospectus complying with that Act.
2
INTRODUCTION
Summary
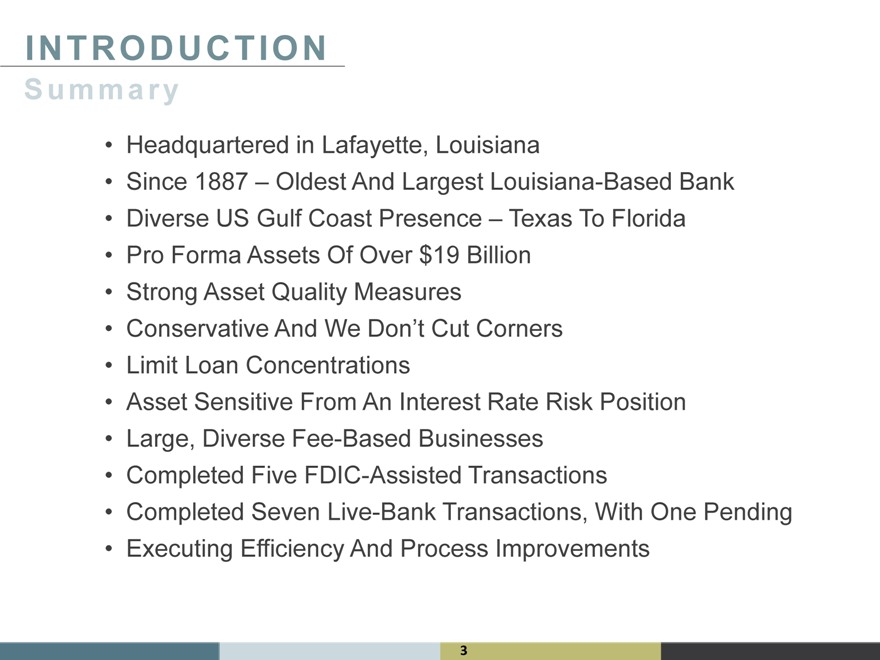
“ Headquartered in Lafayette, Louisiana
“ Since 1887 Oldest And Largest Louisiana-Based Bank
“ Diverse US Gulf Coast Presence “ Texas To Florida
“ Pro Forma Assets Of Over $19 Billion
“ Strong Asset Quality Measures
“ Conservative And We Don“t Cut Corners
“ Limit Loan Concentrations
“ Asset Sensitive From An Interest Rate Risk Position
“ Large, Diverse Fee-Based Businesses
“ Completed Five FDIC-Assisted Transactions
“ Completed Seven Live-Bank Transactions, With One Pending
“ Executing Efficiency And Process Improvements
3
2014 Accomplishments
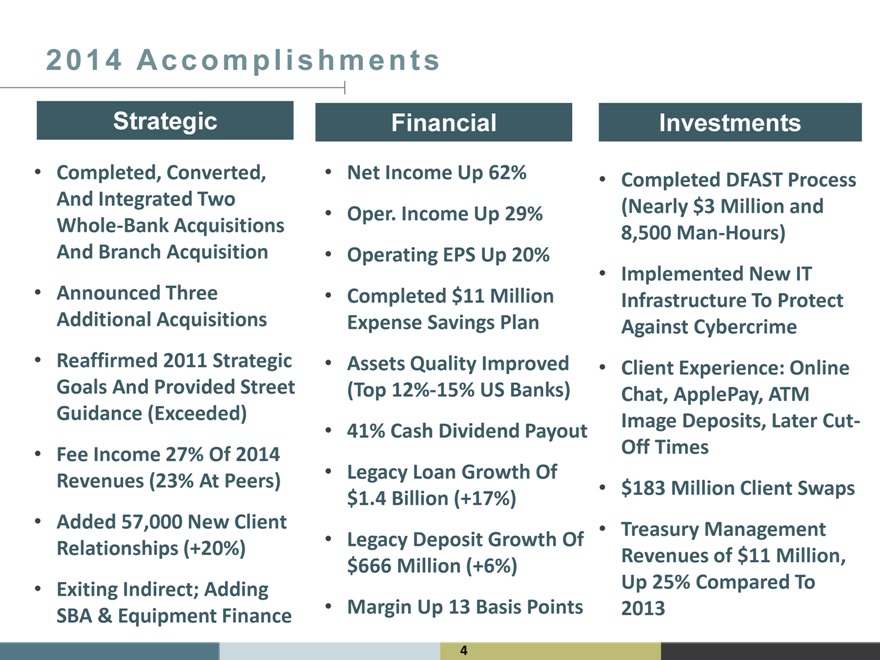
Strategic
“ Completed, Converted, And Integrated Two Whole-Bank Acquisitions And Branch Acquisition
“ Announced Three Additional Acquisitions
“ Reaffirmed 2011 Strategic Goals And Provided Street
Guidance (Exceeded)
“ Fee Income 27% Of 2014 Revenues (23% At Peers)
“ Added 57,000 New Client Relationships (+20%)
“ Exiting Indirect; Adding SBA & Equipment Finance
Financial
“ Net Income Up 62%
“ Oper. Income Up 29%
“ Operating EPS Up 20%
“ Completed $11 Million Expense Savings Plan
“ Assets Quality Improved (Top 12%-15% US Banks)
“ 41% Cash Dividend Payout
“ Legacy Loan Growth Of $1.4 Billion (+17%)
“ Legacy Deposit Growth Of $666 Million (+6%)
“ Margin Up 13 Basis Points
Investments
“ Completed DFAST Process
(Nearly $3 Million and 8,500 Man-Hours)
“ Implemented New IT
Infrastructure To Protect
Against Cybercrime
“ Client Experience: Online Chat, ApplePay, ATM
Image Deposits, Later Cut-
Off Times
“ $183 Million Client Swaps
“ Treasury Management Revenues of $11 Million, Up 25% Compared To 2013
4
A Few Statistics
Distribution
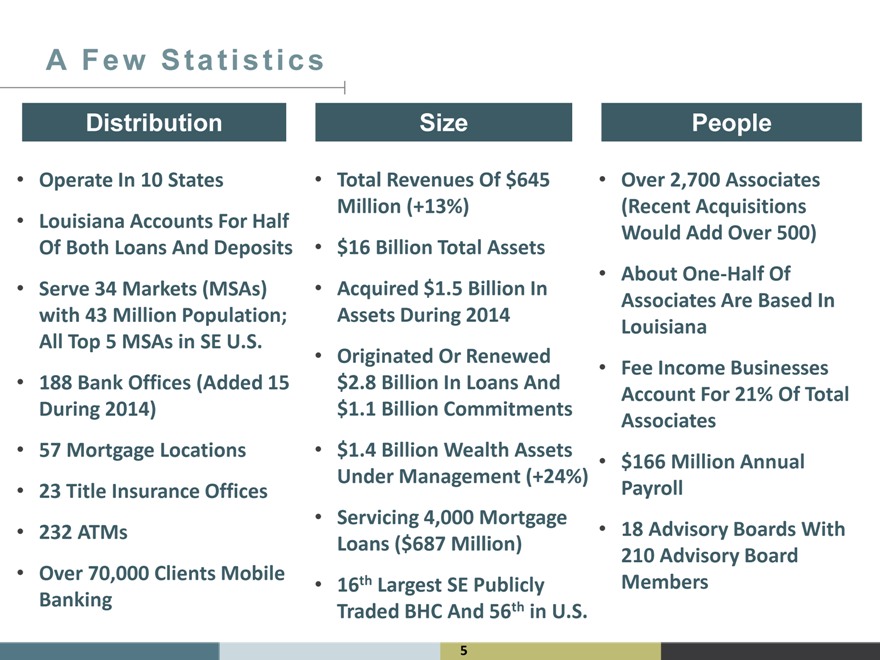
“ Operate In 10 States
“ Louisiana Accounts For Half Of Both Loans And Deposits
“ Serve 34 Markets (MSAs) with 43 Million Population; All Top 5 MSAs in SE U.S.
“ 188 Bank Offices (Added 15 During 2014)
“ 57 Mortgage Locations
“ 23 Title Insurance Offices
“ 232 ATMs
“ Over 70,000 Clients Mobile Banking
Size
“ Total Revenues Of $645
Million (+13%)
“ $16 Billion Total Assets
“ Acquired $1.5 Billion In Assets During 2014
“ Originated Or Renewed $2.8 Billion In Loans And $1.1 Billion Commitments
“ $1.4 Billion Wealth Assets Under Management (+24%)
“ Servicing 4,000 Mortgage
Loans ($687 Million)
“ 16th Largest SE Publicly Traded BHC And 56th in U.S.
People
“ Over 2,700 Associates
(Recent Acquisitions Would Add Over 500)
“ About One-Half Of
Associates Are Based In
Louisiana
“ Fee Income Businesses Account For 21% Of Total
Associates
“ $166 Million Annual Payroll
“ 18 Advisory Boards With 210 Advisory Board Members
5
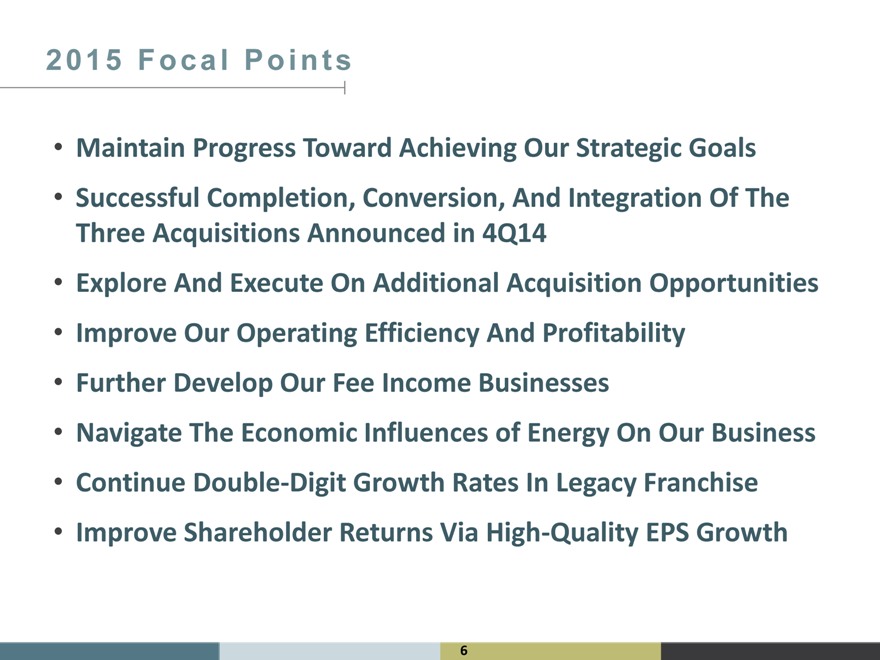
2015 Focal Points
“ Maintain Progress Toward Achieving Our Strategic Goals
“ Successful Completion, Conversion, And Integration Of The
Three Acquisitions Announced in 4Q14
“ Explore And Execute On Additional Acquisition Opportunities
“ Improve Our Operating Efficiency And Profitability
“ Further Develop Our Fee Income Businesses
“ Navigate The Economic Influences of Energy On Our Business
“ Continue Double-Digit Growth Rates In Legacy Franchise
“ Improve Shareholder Returns Via High-Quality EPS Growth
6
7
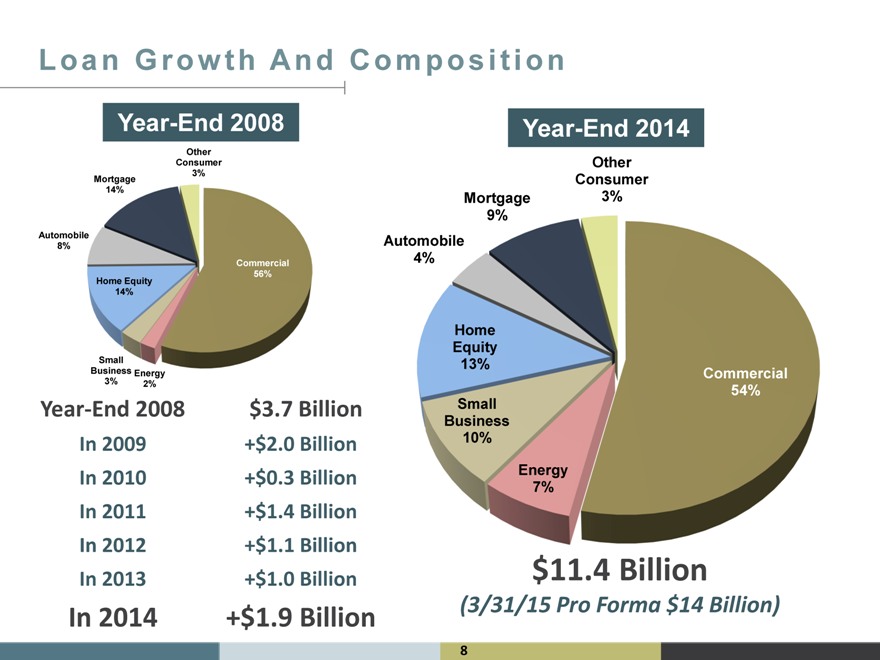
Loan Growth And Composition
Year-End 2008
Other
Consumer
3% Mortgage 14%
Automobile
Year-End 2008 $3.7 Billion
In 2009 +$2.0 Billion
In 2010 +$0.3 Billion
In 2011 +$1.4 Billion
In 2012 +$1.1 Billion
In 2013 +$1.0 Billion
In 2014 +$1.9 Billion
Year-End 2014
Other Consumer Mortgage 3% 9% Automobile 4%
Home Equity 13%
Commercial 54% Small Business 10%
Energy
7%
$11.4 Billion
(3/31/15 Pro Forma $14 Billion)
8
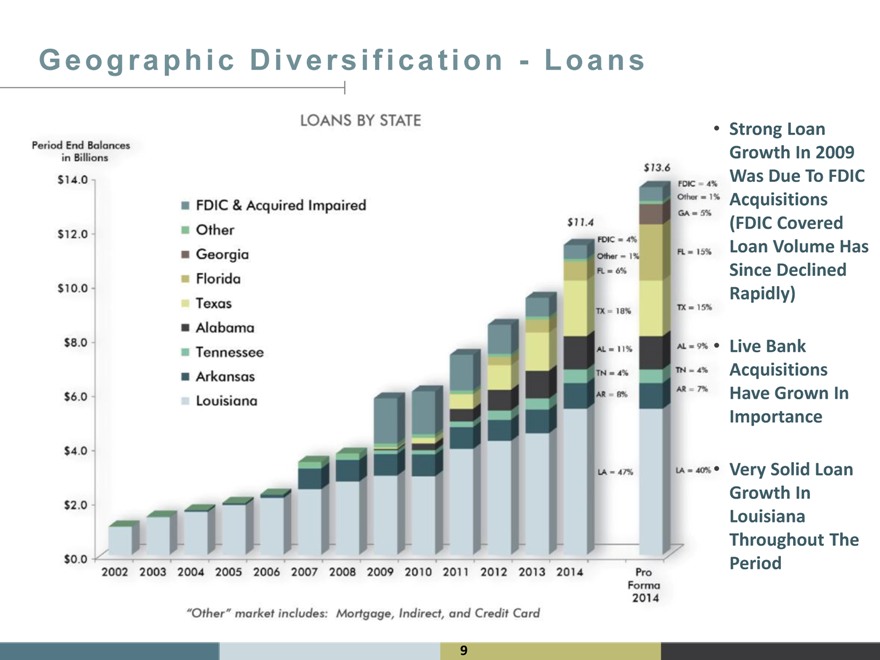
Geographic Diversification—Loans
“ Strong Loan Growth In 2009 Was Due To FDIC Acquisitions (FDIC Covered Loan Volume Has Since Declined Rapidly)
“ Live Bank Acquisitions Have Grown In Importance
“ Very Solid Loan Growth In Louisiana Throughout The Period
9
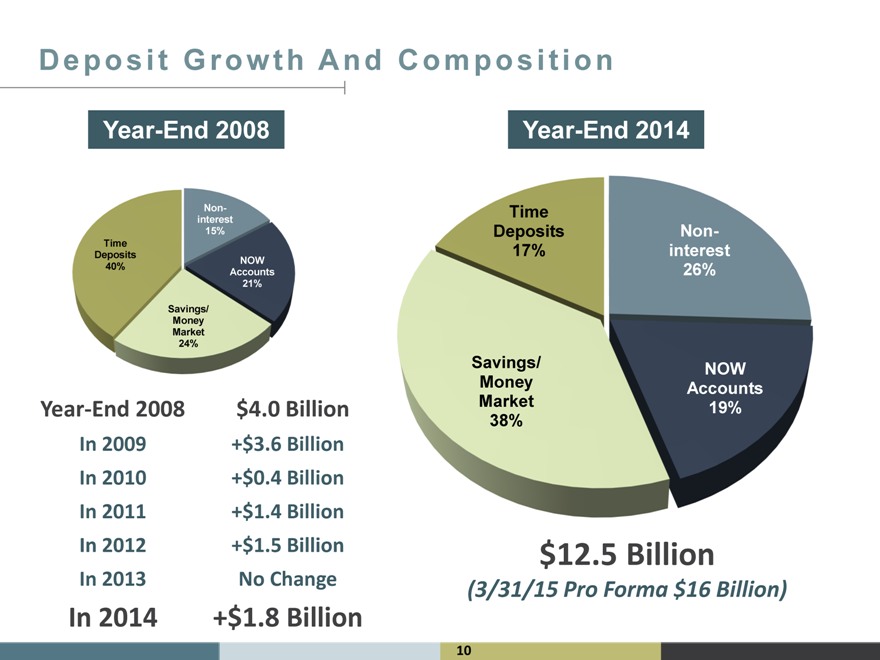
Deposit Growth And
Year-End 2008
Non-
interest
15%
Time
Deposits NOW
40% Accounts
21%
Savings/
Money
Market
24%
Year-End 2008 $4.0 Billion
In 2009 +$3.6 Billion
In 2010 +$0.4 Billion
In 2011 +$1.4 Billion
In 2012 +$1.5 Billion
In 2013 No Change
In 2014 +$1.8 Billion
Composition
Year-End 2014
Time
Deposits Non-
17% interest
26%
Savings/ NOW
Money Accounts
Market 19%
38%
$12.5 Billion
(3/31/15 Pro Forma $16 Billion)
10
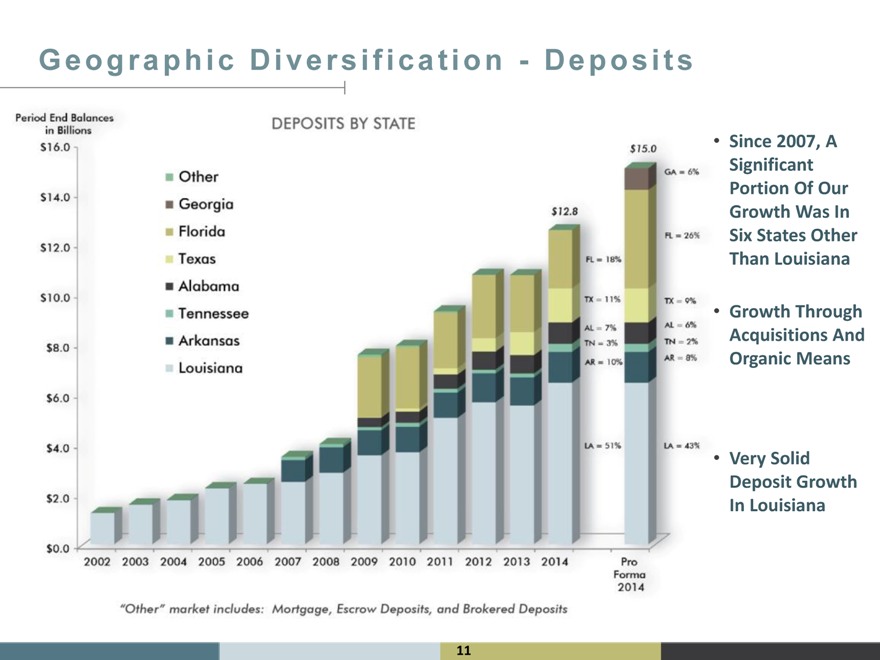
Geographic Diversification—Deposits
Since 2007, A Significant Portion Of Our Growth Was In Six States Other Than Louisiana
Growth Through Acquisitions And Organic Means
Very Solid Deposit Growth In Louisiana
11
12
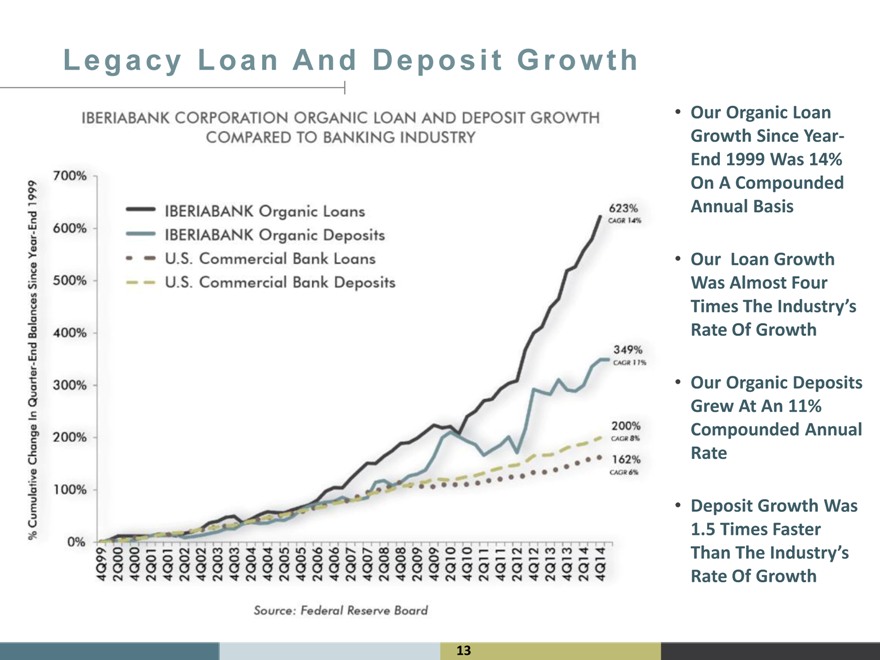
Legacy Loan And Deposit Growth
“ Our Organic Loan Growth Since Year-End 1999 Was 14% On A Compounded Annual Basis
“ Our Loan Growth Was Almost Four
Times The Industry’s
Rate Of Growth
“ Our Organic Deposits Grew At An 11% Compounded Annual Rate
“ Deposit Growth Was 1.5 Times Faster
Than The Industry’s
13
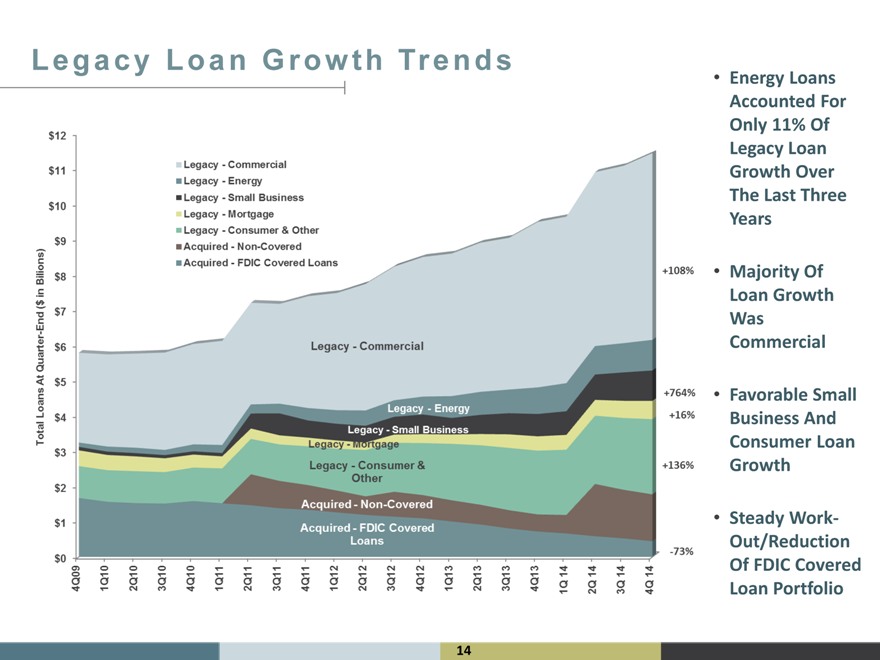
Legacy Loan Growth Trends
“ Energy Loans Accounted For Only 11% Of Legacy Loan Growth Over The Last Three Years
“ Majority Of Loan Growth Was Commercial
“ Favorable Small Business And Consumer Loan Growth
“ Steady Work-Out/Reduction
14
Legacy Core Deposit Growth Trends
$ in Billions
$13
$12
$11
$10
$ 9
$ 8
$ 7
$ 6
$ 5
$ 4
T otal Deposits A t Q uar t er—En d ( $ i n Billi o n s) $ 3
$ 2
$ 1
Legacy—Non-Interest Bearing
Legacy—NOW Accounts
Legacy—Money Market/Savings
Acquired Core Deposits +322%
All Time Deposits (Acquired And Legacy)
Legacy—Non-Interest
Bearing
+50%
Legacy—NOW Accounts
+110%
Legacy—Money
Market/Savings
Acquired Core Deposits
+146%
All Time Deposits
(Acquired And Legacy)
-31%
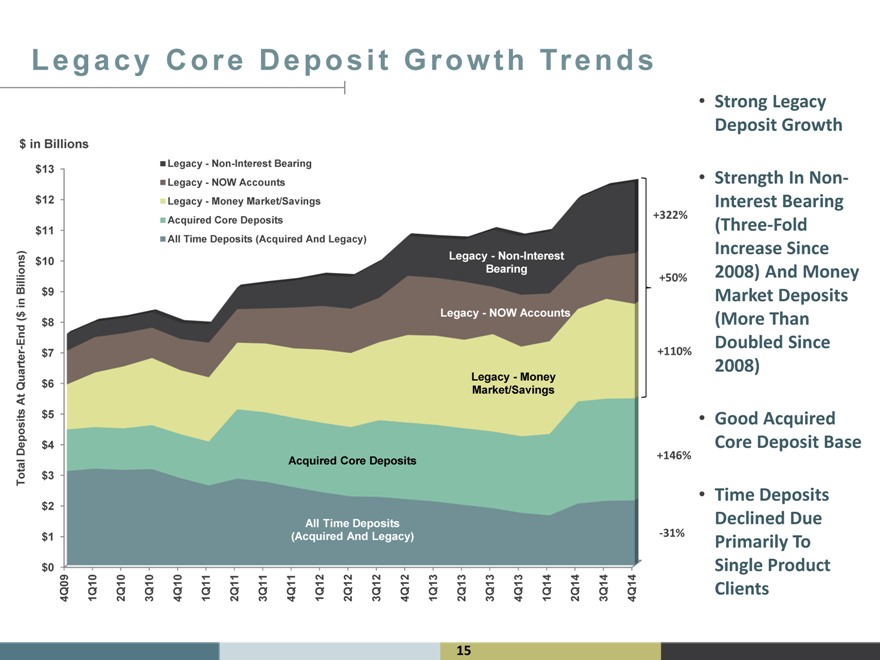
“ Strong Legacy Deposit Growth
“ Strength In Non-Interest Bearing (Three-Fold Increase Since 2008) And Money Market Deposits (More Than Doubled Since 2008)
“ Good Acquired Core Deposit Base
“ Time Deposits Declined Due Primarily To
15
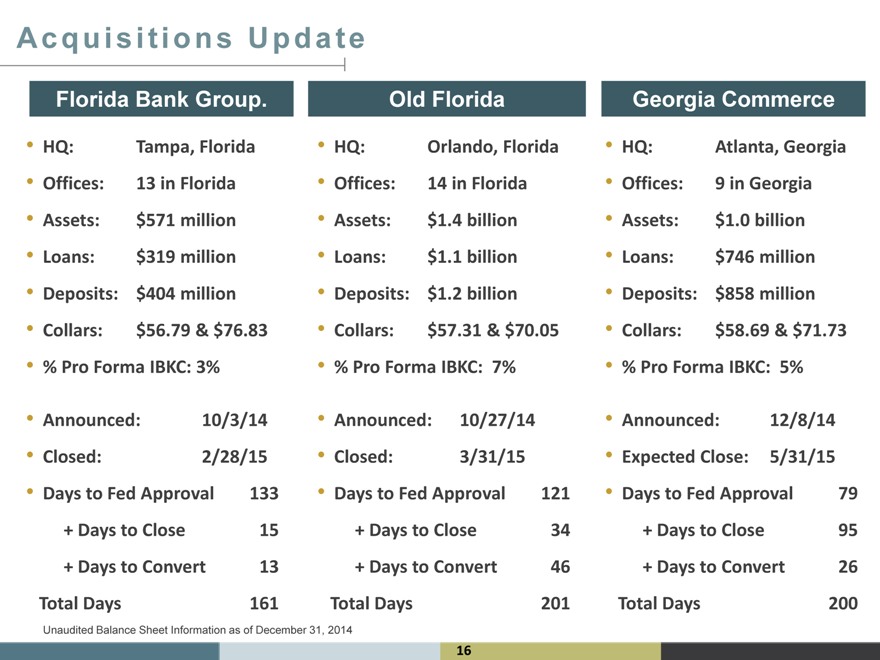
A c q u i s i t i o n s U p d a t e
Florida Bank Group. Old Florida Georgia Commerce
“ HQ: Tampa, Florida “ HQ: Orlando, Florida “ HQ: Atlanta, Georgia
“ Offices: 13 in Florida “ Offices: 14 in Florida “ Offices: 9 in Georgia
“ Assets: $571 million “ Assets: $1.4 billion “ Assets: $1.0 billion
“ Loans: $319 million “ Loans: $1.1 billion “ Loans: $746 million
“ Deposits: $404 million “ Deposits: $1.2 billion “ Deposits: $858 million
“ Collars: $56.79 & $ 76.83 “ Collars: $57.31 & $ 70.05 “ Collars: $58.69 & $ 71.73
“% Pro Forma IBKC: 3% “% Pro Forma IBKC: 7% “ % Pro Forma IBKC: 5%
“ Announced: 10/3/14 “ Announced: 10/27/14 “ Announced: 12/8/14
“ Closed: 2/28/15 “ Closed: 3/31/15 “ Expected Close: 5/31/15
“ Days to Fed Approval 133 “ Days to Fed Approval 121 “ Days to Fed Approval 79
+ Days to Close 15 + Days to Close 34 + Days to Close 95
+ Days to Convert 13 + Days to Convert 46 + Days to Convert 26
Total Days 161 Total Days 201 Total Days 200
Unaudited Balance Sheet Information as of December 31, 2014
16
PRIMARY FOCUS
17
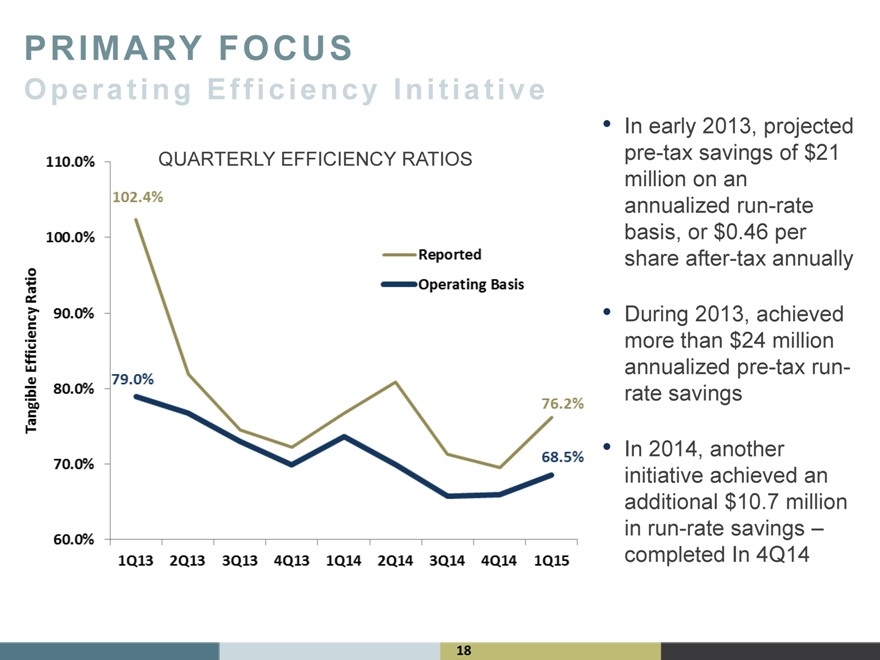
PRIMARY FOCUS
O p e r a t i n g E f f i c i e n c y I n i t i a t i v e
“ In early 2013, projected
QUARTERLY EFFICIENCY RATIOS pre-tax savings of $21
million on an
annualized run-rate
basis, or $0.46 per
share after-tax annually
“ During 2013, achieved
more than $24 million
annualized pre-tax run-
rate savings
“ In 2014, another
initiative achieved an
additional $10.7 million
in run-rate savings “
completed In 4Q14
18
PRIMARY FOCUS
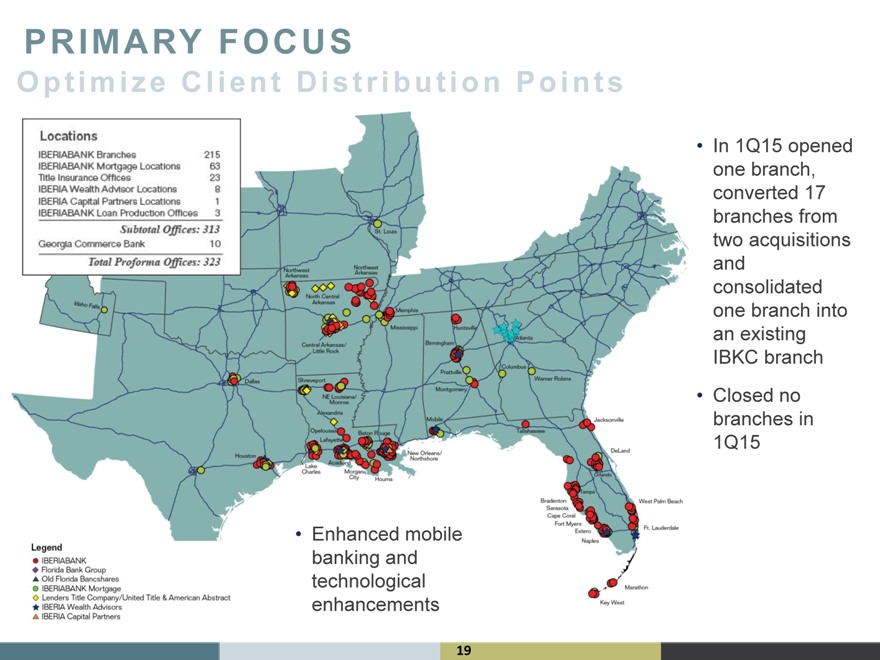
Optimize Client Distribution Points
“ In 1Q15 opened one branch, converted 17 branches from two acquisitions and consolidated one branch into an existing IBKC branch
“ Closed no branches in 1Q15
“ Enhanced mobile banking and technological enhancements
19
PRIMARY FOCUS
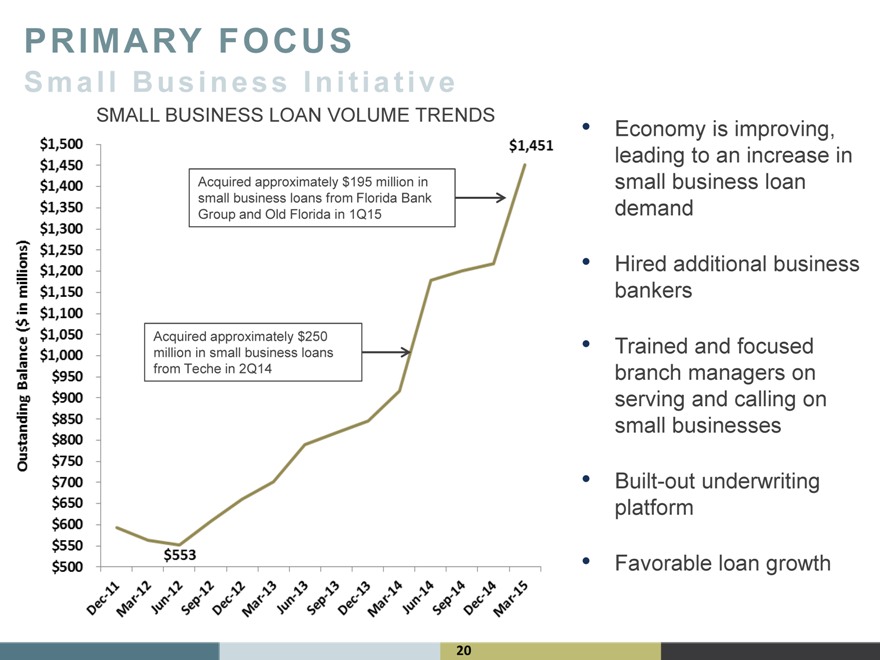
Small Business Initiative
SMALL BUSINESS LOAN VOLUME TRENDS
Acquired approximately $195 million in small business loans from Florida Bank Group and Old Florida in 1Q15
Acquired approximately $250 million in small business loans from Teche in 2Q14
“ Economy is improving, leading to an increase in small business loan demand
“ Hired additional business bankers
“ Trained and focused branch managers on serving and calling on small businesses
“ Built-out underwriting platform
“ Favorable loan growth
20
PRIMARY FOCUS
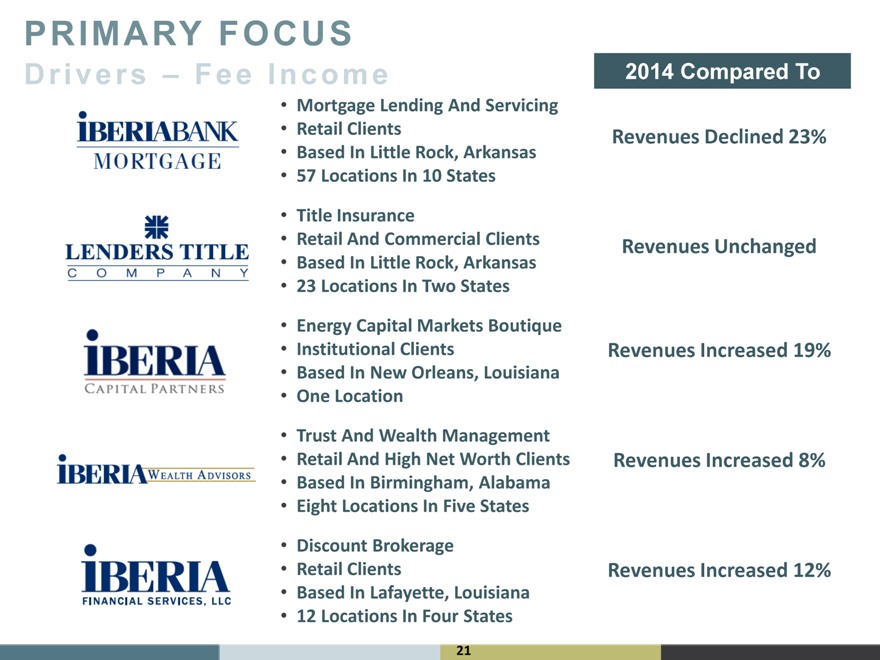
Drivers “ Fee Income
“ Mortgage Lending And Servicing
“ Retail Clients
“ Based In Little Rock, Arkansas
“ 57 Locations In 10 States
“ Title Insurance
“ Retail And Commercial Clients
“ Based In Little Rock, Arkansas
“ 23 Locations In Two States
“ Energy Capital Markets Boutique
“ Institutional Clients
“ Based In New Orleans, Louisiana
“ One Location
“ Trust And Wealth Management
“ Retail And High Net Worth Clients
“ Based In Birmingham, Alabama
“ Eight Locations In Five States
“ Discount Brokerage
“ Retail Clients
“ Based In Lafayette, Louisiana
“ 12 Locations In Four States
2014 Compared To 2013
Revenues Declined 23%
Revenues Unchanged
Revenues Increased 19%
Revenues Increased 8%
Revenues Increased 12%
21
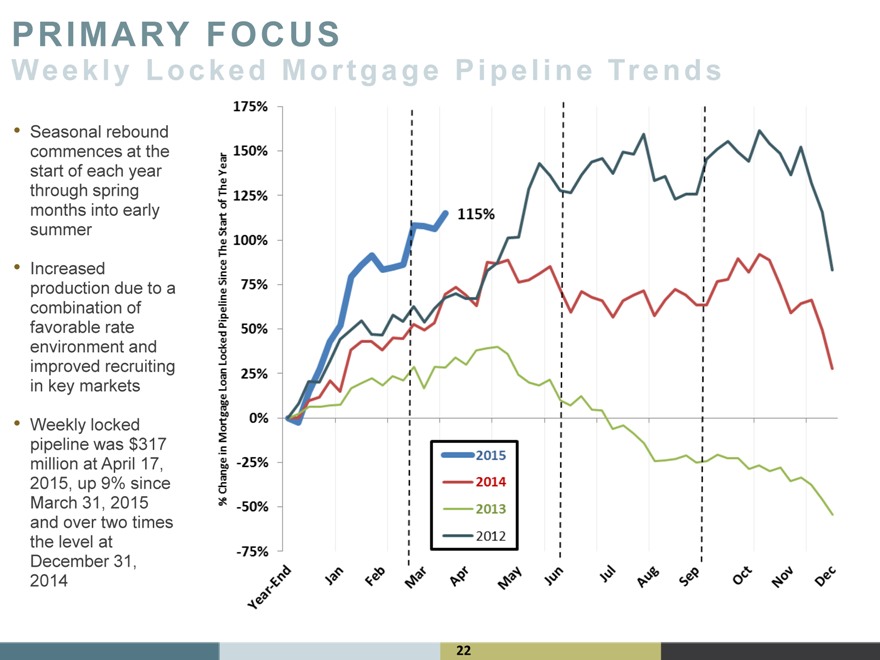
PRIMARY FOCUS
Weekly Locked Mortgage Pipeline Trends
“ Seasonal rebound commences at the start of each year through spring months into early summer
“ Increased production due to a combination of favorable rate environment and improved recruiting in key markets
“ Weekly locked pipeline was $317 million at April 17, 2015, up 9% since March 31, 2015 and over two times the level at December 31, 2014
22
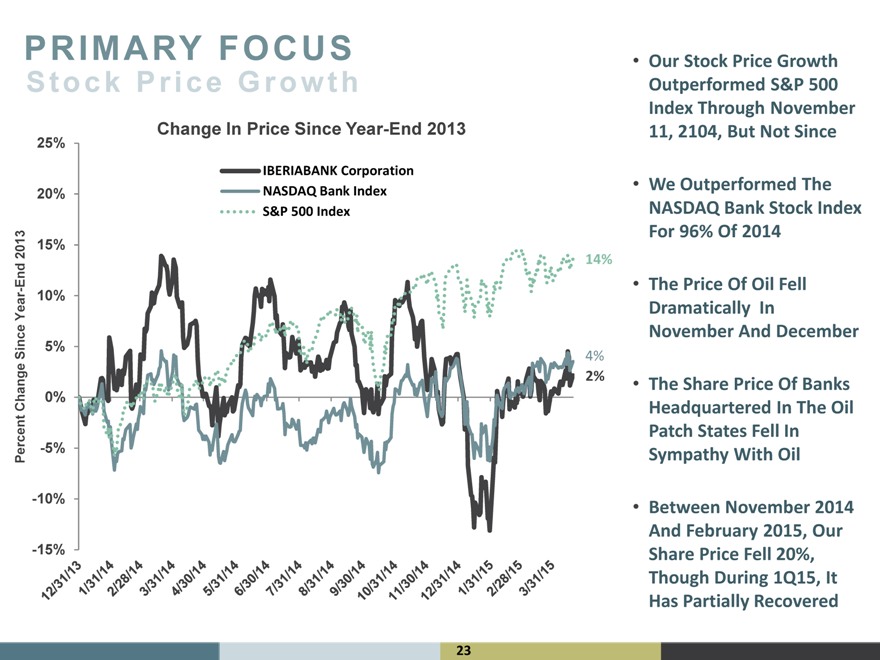
PRIMARY FOCUS
Stock Price Growth
25% Change In Price Since Year-End 2013
IBERIABANK Corporation 20% NASDAQ Bank Index S&P 500 Index
2013 15%
14%
Year-End 10% Since 5%
4%
2%
0%
Percent Change -5% -10%
-15%
“ Our Stock Price Growth Outperformed S&P 500 Index Through November 11, 2104, But Not Since
“ We Outperformed The NASDAQ Bank Stock Index For 96% Of 2014
“ The Price Of Oil Fell Dramatically In November And December
“ The Share Price Of Banks Headquartered In The Oil Patch States Fell In Sympathy With Oil
“ Between November 2014 And February 2015, Our Share Price Fell 20%, Though During 1Q15, It Has Partially Recovered
23
FIRST QUARTER 2015
Financial Summary
“ Reported EPS of $0.75 (down $0.32 from 4Q14) and non-GAAP operating EPS of $0.95 (down $0.10 from 4Q14)
“ Tax equivalent net interest income increased $1.1 million, or 1% from 4Q14, while average earning assets increased $312 million, or 2%
“ Completed the acquisitions of Florida Bank Group and Old Florida during the quarter. Converted Florida Bank Group over the weekend of March 13th. Anticipate conversions of Old Florida Bank and New Traditions Bank during 2Q15
“ Pending shareholder approval, anticipate closing of Georgia Commerce Bancshares, Inc. acquisition on May 31, 2015 and converting and integrating within the next 70 days
“ Legacy loan growth:
“ Legacy deposit growth:
§ $181 million since December 31, 2014 (+7% annualized), including $69 million of commercial and $112 million of small business and consumer § Energy-related loans down $61 million or 7% and indirect loans down $30 million or 8% § Growth in the legacy loan portfolio was commercial 38%, small business 22%, consumer 25%, and mortgage 14%
§ $351 million since December 31, 2014 (+11% annualized)
§ $212 million increase in legacy non-interest bearing deposits (+27% annualized)
“ Net interest margin increased one basis point to 3.54%, slightly above management’s expectations
“ Significant operating influences:
“ Seasonality
“ Timing
“ Non-recurring expense
“ Energy-related provisions
24
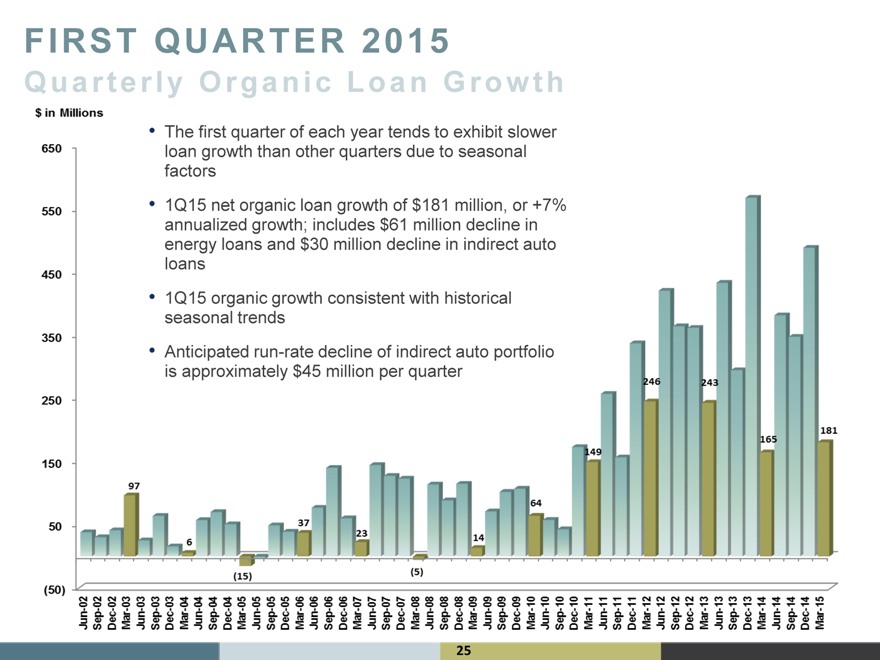
FIRST QUARTER 2015
Quarterly Organic Loan Growth
“ The first quarter of each year tends to exhibit slower loan growth than other quarters due to seasonal factors
“ 1Q15 net organic loan growth of $181 million, or +7% annualized growth; includes $61 million decline in energy loans and $30 million decline in indirect auto loans
“ 1Q15 organic growth consistent with historical seasonal trends
“ Anticipated run-rate decline of indirect auto portfolio is approximately $45 million per quarter
25
FIRST QUARTER 2015
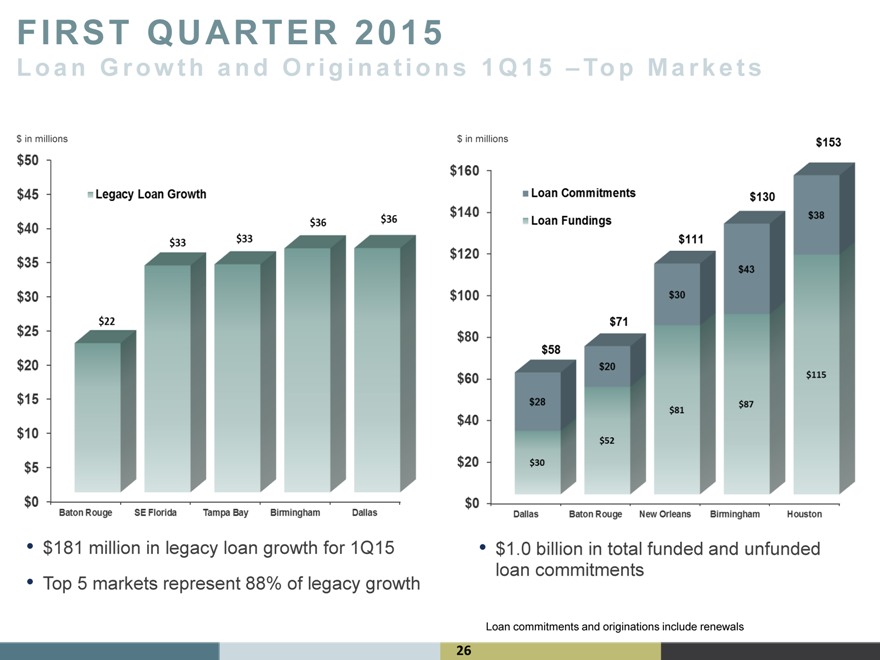
Loan Growth and Originations
“ $181 million in legacy loan growth for 1Q15
“ Top 5 markets represent 88% of legacy growth
1Q15 “ Top Markets
“ $1.0 billion in total funded and unfunded loan commitments
Loan commitments and originations include renewals
26
FIRST QUARTER 2015
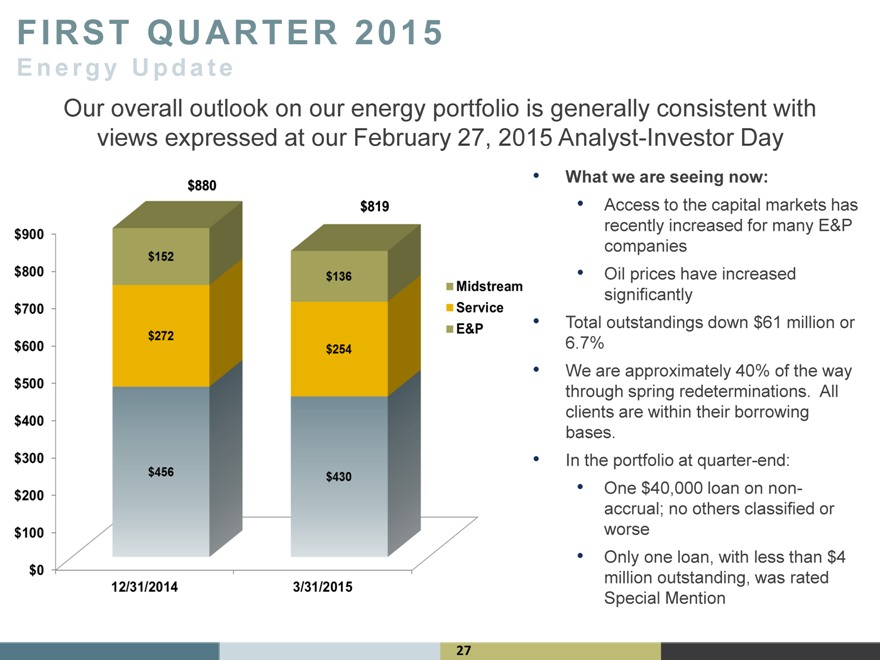
Energy Update
Our overall outlook on our energy portfolio is generally consistent with views expressed at our February 27, 2015 Analyst-Investor Day
“ What we are seeing now:
“ Access to the capital markets has recently increased for many E&P companies
“ Oil prices have increased significantly
“ Total outstandings down $61 million or 6.7%
“ We are approximately 40% of the way through spring redeterminations. All clients are within their borrowing bases.
“ In the portfolio at quarter-end:
“ One $40,000 loan on non-accrual; no others classified or worse
“ Only one loan, with less than $4 million outstanding, was rated Special Mention
27
FIRST QUARTER 2015
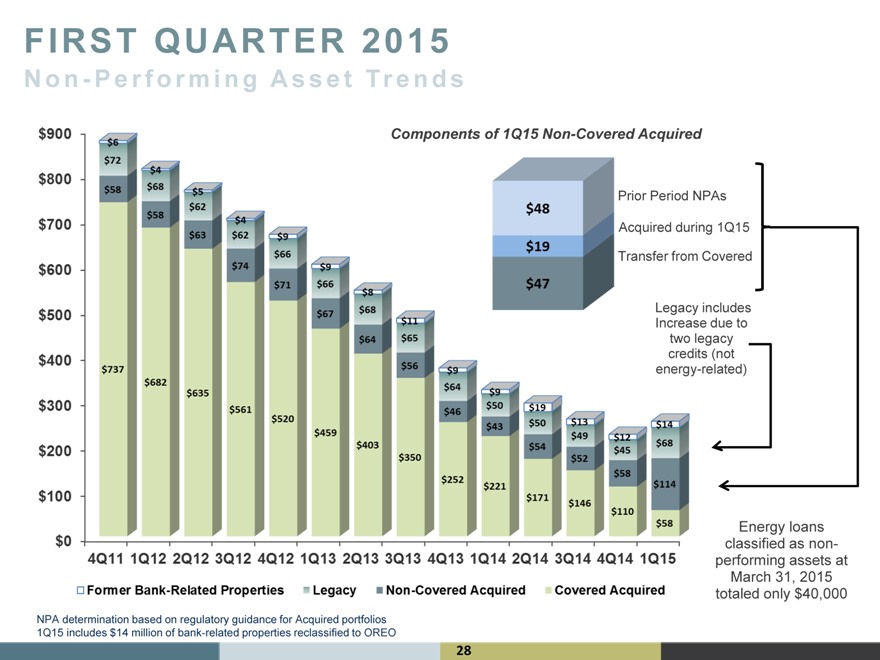
Non-Performing Asset Trends
Components of 1Q15 Non-Covered Acquired
Prior Period NPAs Acquired during 1Q15 Transfer from Covered
Legacy includes Increase due to two legacy credits (not energy-related)
Energy loans classified as non-performing assets at March 31, 2015 totaled only $40,000
1Q15 includes $14 million of bank-related properties reclassified to OREO
28
FIRST QUARTER 2015
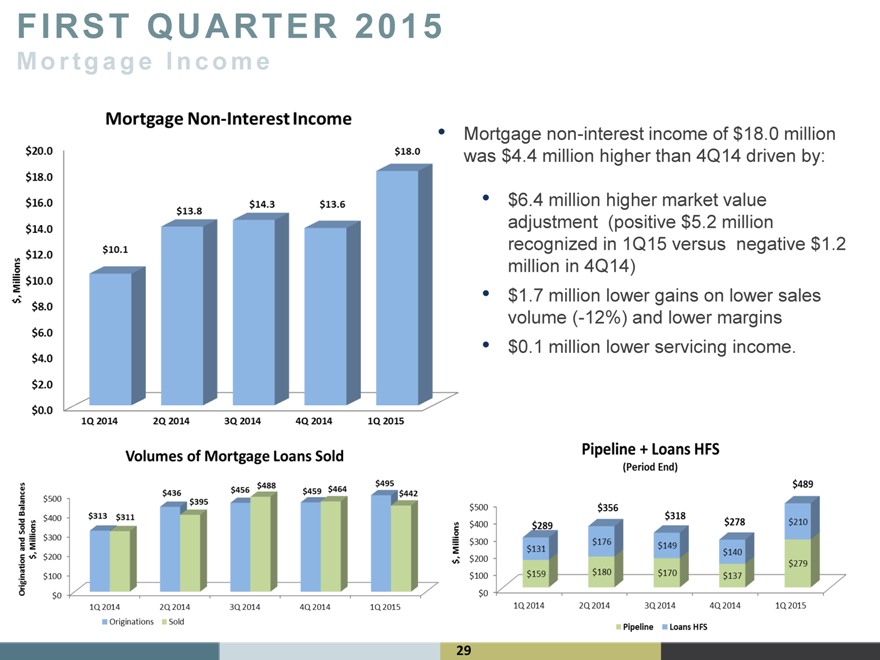
Mortgage Income
“ Mortgage non-interest income of $18.0 million was $4.4 million higher than 4Q14 driven by:
“ $6.4 million higher market value adjustment (positive $5.2 million
recognized in 1Q15 versus negative $1.2 million in 4Q14)
“ $1.7 million lower gains on lower sales volume (-12%) and lower margins “ $0.1 million lower servicing income.
29
FIRST QUARTER 2015
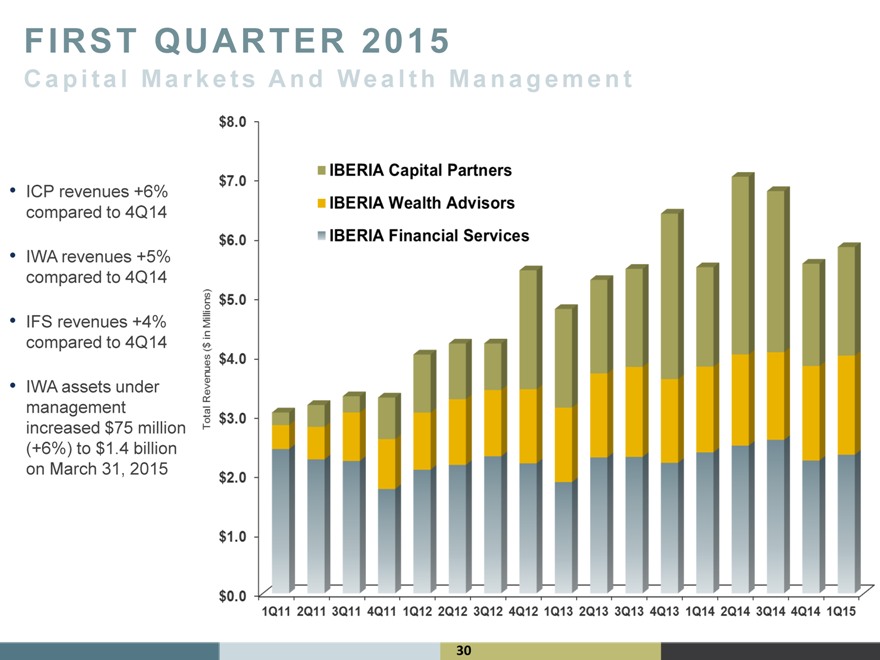
Capital Markets And Wealth Management
“ ICP revenues +6% compared to 4Q14
“ IWA revenues +5% compared to 4Q14
“ IFS revenues +4% compared to 4Q14
“ IWA assets under management increased $75 million (+6%) to $1.4 billion on March 31, 2015
30
Summary
IBERIABANK Corporation
“ Longevity and Experience
“ Economically Vibrant Legacy Markets
“ Diversified Markets and Revenues
“ Multiple Growth Engines (Organic and M&A)
“ Disciplined, Yet Opportunistic
“ Exceptional Asset Quality
“ Outsized FDIC Loss Share Protection
“ Tremendous Capital Strength
“ Funded By Stable Core Deposits
“ Asset-Sensitive (Interest Rate Risk Position)
“ Unique Business Model
“ Favorable Risk/Return Trade-Off
31
Appendix
32
APPENDIX
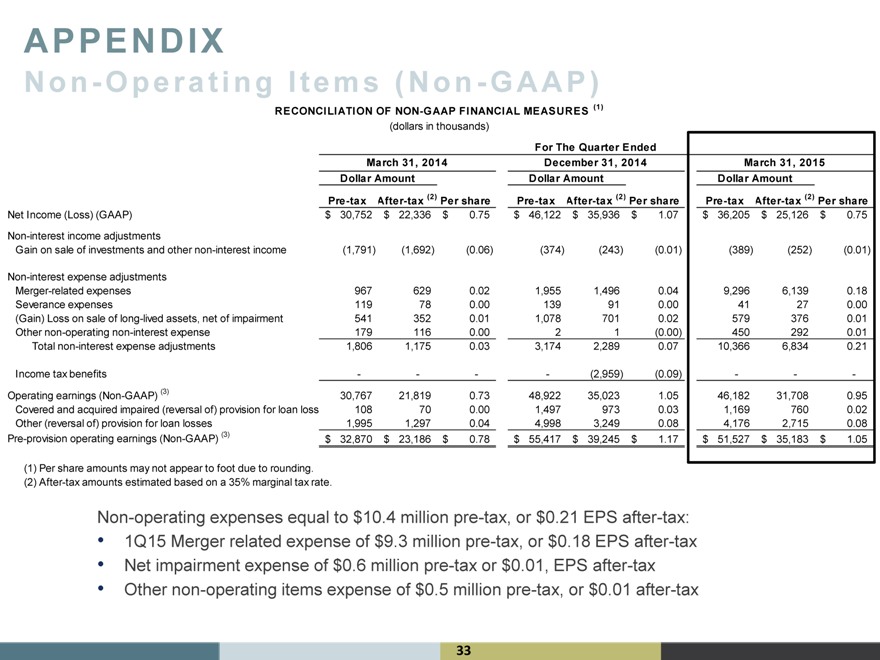
N o n—O p e r a t i n g I t e m s( N o n—G A A P )
RECONCILIATION OF NON-GAAP FINANCIAL MEASURES (1)
(dollars in thousands)
For The Quarter Ended
March 31, 2014 December 31, 2014 March 31, 2015
Dollar Amount Dollar Amount Dollar Amount
Pre-tax After-tax (2) Per share Pre-tax After-tax (2) Per share Pre-tax After-tax (2) Per share
Net Income (Loss) (GAAP) $ 30,752 $ 22,336 $ 0.75 $ 46,122 $ 35,936 $ 1.07 $ 36,205 $ 25,126 $ 0.75
Non-interest income adjustments
Gain on sale of investments and other non-interest income(1,791)(1,692)(0.06)(374)(243)(0.01)(389)(252)(0.01)
Non-interest expense adjustments
Merger-related expenses 967 629 0.02 1,955 1,496 0.04 9,296 6,139 0.18
Severance expenses 119 78 0.00 139 91 0.00 41 27 0.00
(Gain) Loss on sale of long-lived assets, net of impairment 541 352 0.01 1,078 701 0.02 579 376 0.01
Other non-operating non-interest expense 179 116 0.00 2 1(0.00) 450 292 0.01
Total non-interest expense adjustments 1,806 1,175 0.03 3,174 2,289 0.07 10,366 6,834 0.21
Income tax benefits — —(2,959)(0.09) — -
Operating earnings (Non-GAAP) (3) 30,767 21,819 0.73 48,922 35,023 1.05 46,182 31,708 0.95
Covered and acquired impaired (reversal of) provision for loan losse 108 70 0.00 1,497 973 0.03 1,169 760 0.02
Other (reversal of) provision for loan losses 1,995 1,297 0.04 4,998 3,249 0.08 4,176 2,715 0.08
Pre-provision operating earnings (Non-GAAP) (3) $ 32,870 $ 23,186 $ 0.78 $ 55,417 $ 39,245 $ 1.17 $ 51,527 $ 35,183 $ 1.05
(1) Per share amounts may not appear to foot due to rounding. (2) After-tax amounts estimated based on a 35% marginal tax rate.
Non-operating expenses equal to $10.4 million pre-tax, or $0.21 EPS after-tax:
“ 1Q15 Merger related expense of $9.3 million pre-tax, or $0.18 EPS after-tax
“ Net impairment expense of $0.6 million pre-tax or $0.01, EPS after-tax
“ Other non-operating items expense of $0.5 million pre-tax, or $0.01 after-tax
33
APPENDIX
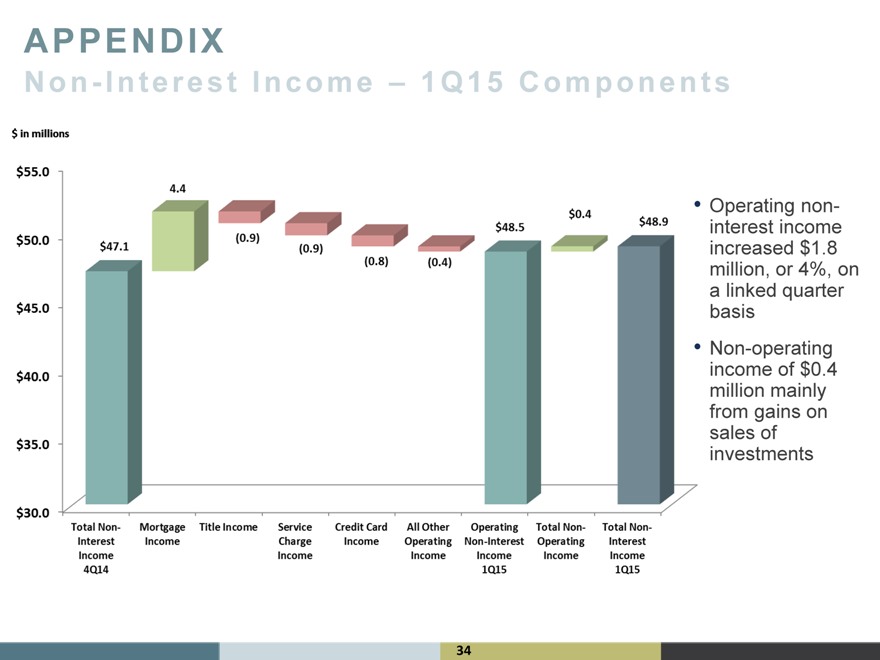
Non-Interest Income “ 1Q15 Components
“ Operating non-interest income increased $1.8 million, or 4%, on a linked quarter basis
“ Non-operating income of $0.4 million mainly from gains on sales of investments
34
APPENDIX
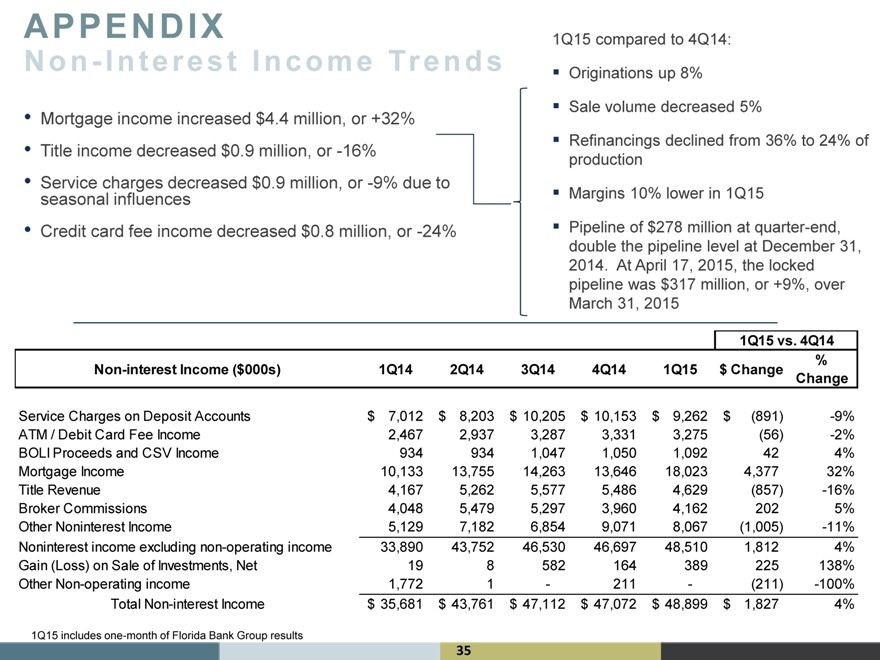
Non-Interest Income Trends
“ Mortgage income increased $4.4 million, or +32%
“ Title income decreased $0.9 million, or -16%
“ Service charges decreased $0.9 million, or -9% due to seasonal influences
“ Credit card fee income decreased $0.8 million, or -24%
1Q15 compared to 4Q14:
§ Originations up 8%
§ Sale volume decreased 5%
§ Refinancings declined from 36% to 24% of production
§ Margins 10% lower in 1Q15
§ Pipeline of $278 million at quarter-end, double the pipeline level at December 31, 2014. At April 17, 2015, the locked pipeline was $317 million, or +9%, over March 31, 2015
1Q15 vs. 4Q14
%
Non-interest Income ($000s) 1Q14 2Q14 3Q14 4Q14 1Q15 $ Change Change
Service Charges on Deposit Accounts $ 7,012 $ 8,203 $ 10,205 $ 10,153 $ 9,262 $(891) -9%
ATM / Debit Card Fee Income 2,467 2,937 3,287 3,331 3,275(56) -2%
BOLI Proceeds and CSV Income 934 934 1,047 1,050 1,092 42 4%
Mortgage Income 10,133 13,755 14,263 13,646 18,023 4,377 32%
Title Revenue 4,167 5,262 5,577 5,486 4,629(857) -16%
Broker Commissions 4,048 5,479 5,297 3,960 4,162 202 5%
Other Noninterest Income 5,129 7,182 6,854 9,071 8,067(1,005) -11%
Noninterest income excluding non-operating income 33,890 43,752 46,530 46,697 48,510 1,812 4%
Gain (Loss) on Sale of Investments, Net 19 8 582 164 389 225 138%
Other Non-operating income 1,772 1—211 -(211) -100%
Total Non-interest Income $ 35,681 $ 43,761 $ 47,112 $ 47,072 $ 48,899 $ 1,827 4%
1Q15 includes one-month of Florida Bank Group results
35
APPENDIX
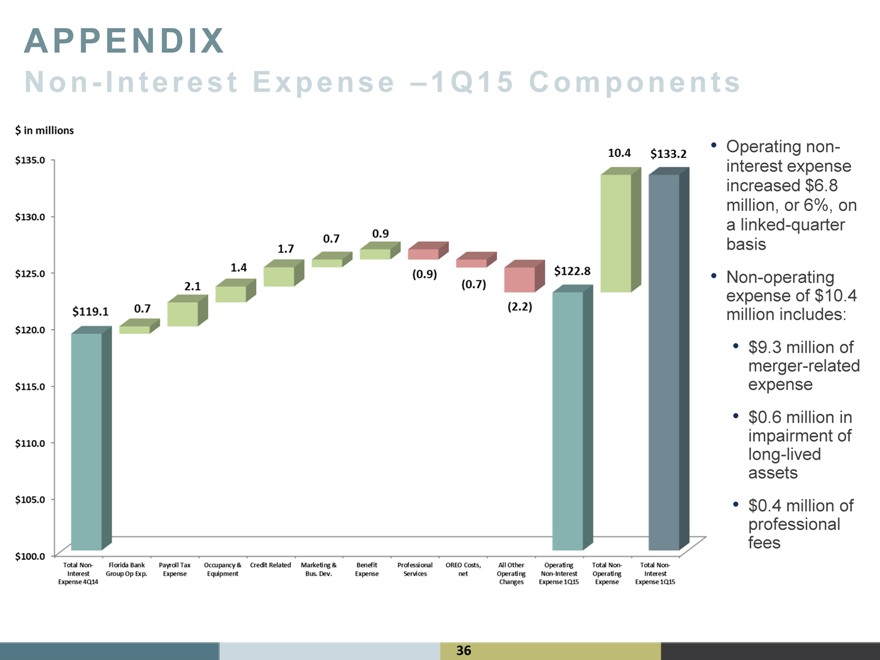
Non-Interest Expense “ 1Q15 Components
“ Operating non-interest expense increased $6.8 million, or 6%, on a linked-quarter basis
“ Non-operating expense of $10.4 million includes:
“ $9.3 million of merger-related expense “ $0.6 million in impairment of long-lived assets “ $0.4 million of professional fees
36
APPENDIX
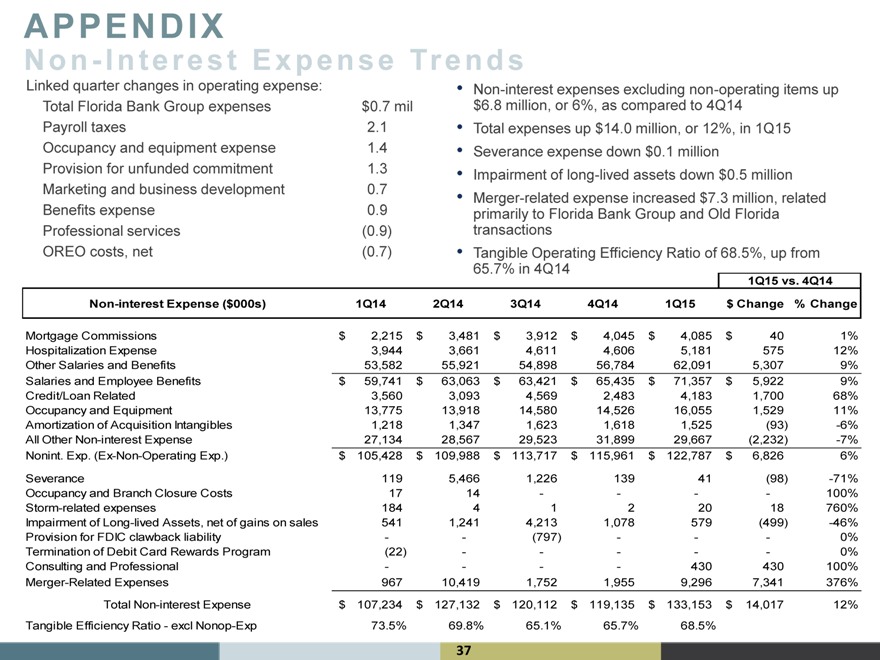
Non-Interest Expense Trends
Linked quarter changes in operating expense: “ Non-interest expenses excluding non-operating items up
Total Florida Bank Group expenses $0.7 mil $6.8 million, or 6%, as compared to 4Q14
Payroll taxes 2.1 “ Total expenses up $14.0 million, or 12%, in 1Q15
Occupancy and equipment expense 1.4 “ Severance expense down $0.1 million
Provision for unfunded commitment 1.3 “ Impairment of long-lived assets down $0.5 million
Marketing and business development 0.7 “ Merger-related expense increased $ 7.3 million, related
Benefits expense 0.9 primarily to Florida Bank Group and Old Florida
Professional services(0.9) transactions
OREO costs, net(0.7) “ Tangible Operating Efficiency Ratio of 68.5%, up from
65.7% in 4Q14
1Q15 vs. 4Q14
Non-interest Expense ($000s) 1Q14 2Q14 3Q14 4Q14 1Q15 $ Change% Change
Mortgage Commissions $ 2,215 $ 3,481 $ 3,912 $ 4,045 $ 4,085 $ 40 1%
Hospitalization Expense 3,944 3,661 4,611 4,606 5,181 575 12%
Other Salaries and Benefits 53,582 55,921 54,898 56,784 62,091 5,307 9%
Salaries and Employee Benefits $ 59,741 $ 63,063 $ 63,421 $ 65,435 $ 71,357 $ 5,922 9%
Credit/Loan Related 3,560 3,093 4,569 2,483 4,183 1,700 68%
Occupancy and Equipment 13,775 13,918 14,580 14,526 16,055 1,529 11%
Amortization of Acquisition Intangibles 1,218 1,347 1,623 1,618 1,525(93) -6%
All Other Non-interest Expense 27,134 28,567 29,523 31,899 29,667(2,232) -7%
Nonint. Exp. (Ex-Non-Operating Exp.) $ 105,428 $ 109,988 $ 113,717 $ 115,961 $ 122,787 $ 6,826 6%
Severance 119 5,466 1,226 139 41(98) -71%
Occupancy and Branch Closure Costs 17 14 — — 100%
Storm-related expenses 184 4 1 2 20 18 760%
Impairment of Long-lived Assets, net of gains on sales 541 1,241 4,213 1,078 579(499) -46%
Provision for FDIC clawback liability —(797) ——0%
Termination of Debit Card Rewards Program(22) — ——0%
Consulting and Professional — — 430 430 100%
Merger-Related Expenses 967 10,419 1,752 1,955 9,296 7,341 376%
Total Non-interest Expense $ 107,234 $ 127,132 $ 120,112 $ 119,135 $ 133,153 $ 14,017 12%
Tangible Efficiency Ratio—excl Nonop-Exp 73.5% 69.8% 65.1% 65.7% 68.5%
37
APPENDIX
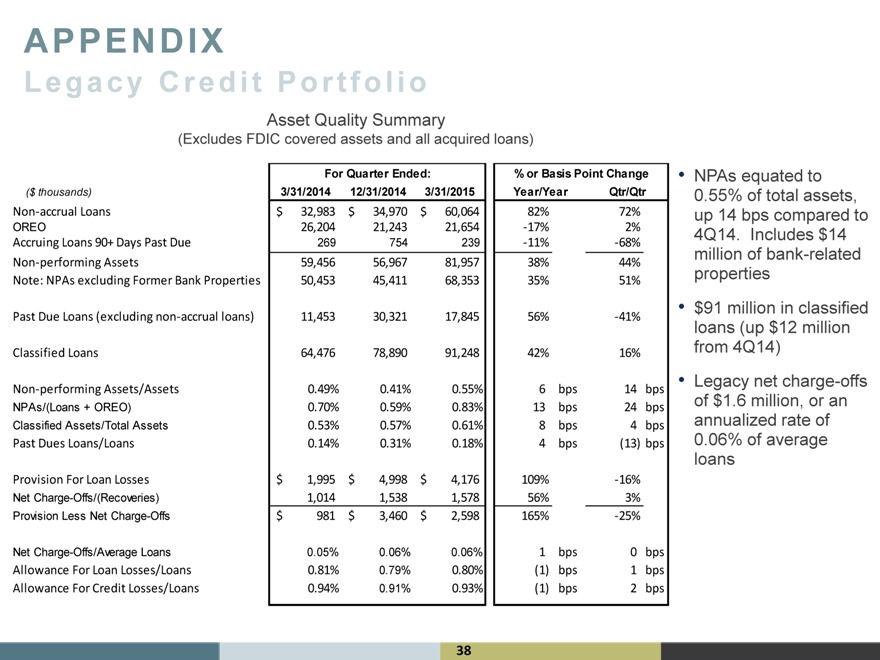
Legacy Credit Portfolio
Asset Quality Summary
(Excludes FDIC covered assets and all acquired loans)
For Quarter Ended:% or Basis Point Change
($ thousands) 3/31/2014 12/31/2014 3/31/2015 Year/Year Qtr/Qtr
Non-accrual Loans $ 32,983 $ 34,970 $ 60,064 82% 72%
OREO 26,204 21,243 21,654 -17% 2%
Accruing Loans 90+ Days Past Due 269 754 239 -11% -68%
Non-performing Assets 59,456 56,967 81,957 38% 44%
Note: NPAs excluding Former Bank Properties 50,453 45,411 68,353 35% 51%
Past Due Loans (excluding non-accrual loans) 11,453 30,321 17,845 56% -41%
Classified Loans 64,476 78,890 91,248 42% 16%
Non-performing Assets/Assets 0.49% 0.41% 0.55% 6 bps 14 bps
NPAs/(Loans + OREO) 0.70% 0.59% 0.83% 13 bps 24 bps
Classified Assets/Total Assets 0.53% 0.57% 0.61% 8 bps 4 bps
Past Dues Loans/Loans 0.14% 0.31% 0.18% 4 bps(13) bps
Provision For Loan Losses $ 1,995 $ 4,998 $ 4,176 109% -16%
Net Charge-Offs/(Recoveries) 1,014 1,538 1,578 56% 3%
Provision Less Net Charge-Offs $ 981 $ 3,460 $ 2,598 165% -25%
Net Charge-Offs/Average Loans 0.05% 0.06% 0.06% 1 bps 0 bps
Allowance For Loan Losses/Loans 0.81% 0.79% 0.80%(1) bps 1 bps
Allowance For Credit Losses/Loans 0.94% 0.91% 0.93%(1) bps 2 bps
“ NPAs equated to 0.55% of total assets, up 14 bps compared to 4Q14. Includes $14 million of bank-related properties “ $91 million in classified loans (up $12 million from 4Q14)
“ Legacy net charge-offs of $1.6 million, or an annualized rate of 0.06% of average loans
38
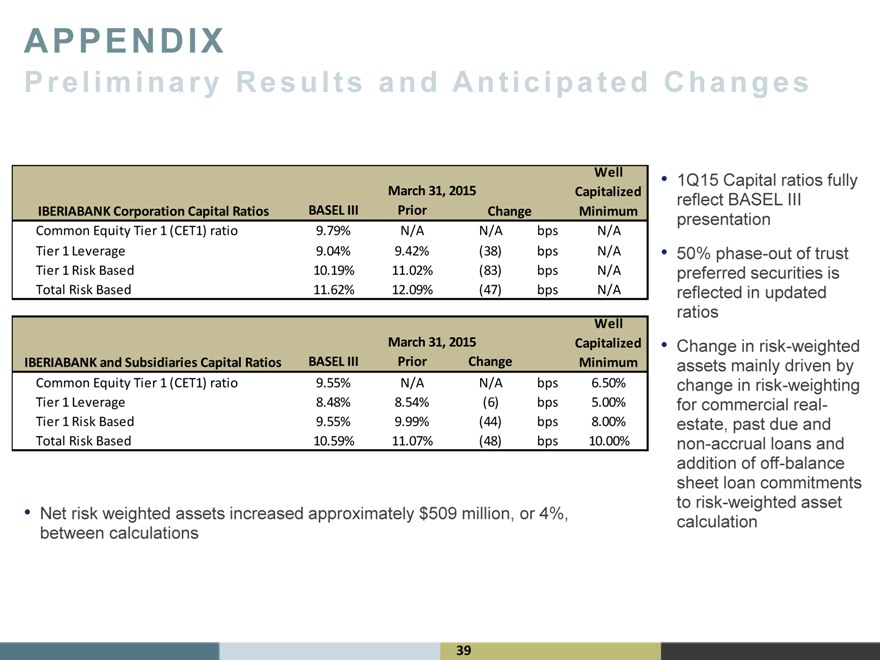
APPENDIX
Preliminary Results and Anticipated
Well
March 31, 2015 Capitalized
IBERIABANK Corporation Capital Ratios BASEL III Prior Change Minimum
Common Equity Tier 1 (CET1) ratio 9.79% N/A N/A bps N/A
Tier 1 Leverage 9.04% 9.42%(38) bps N/A
Tier 1 Risk Based 10.19% 11.02%(83) bps N/A
Total Risk Based 11.62% 12.09%(47) bps N/A
Well
March 31, 2015 Capitalized
IBERIABANK and Subsidiaries Capital Ratios BASEL III Prior Change Minimum
Common Equity Tier 1 (CET1) ratio 9.55% N/A N/A bps 6.50%
Tier 1 Leverage 8.48% 8.54%(6) bps 5.00%
Tier 1 Risk Based 9.55% 9.99%(44) bps 8.00%
Total Risk Based 10.59% 11.07%(48) bps 10.00%
“ Net risk weighted assets increased approximately $509 million, or 4%, between calculations
Changes
“ 1Q15 Capital ratios fully reflect BASEL III presentation
“ 50% phase-out of trust preferred securities is reflected in updated ratios
“ Change in risk-weighted assets mainly driven by change in risk-weighting for commercial real-estate, past due and non-accrual loans and addition of off-balance sheet loan commitments to risk-weighted asset calculation
39
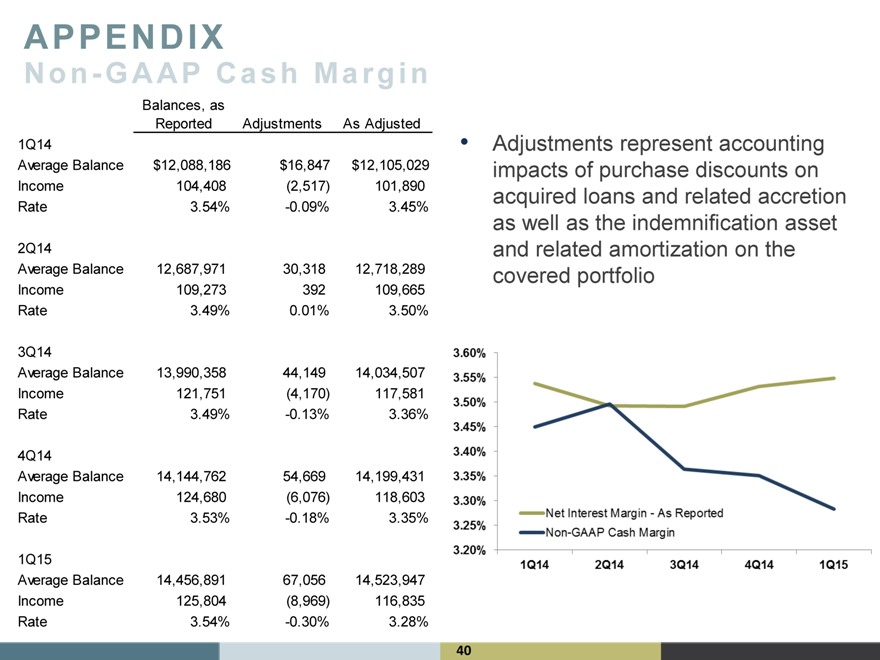
APPENDIX
Non-GAAP Cash Margin
Balances, as
Reported Adjustments As Adjusted
1Q14
Average Balance $12,088,186 $16,847 $12,105,029
Income 104,408(2,517) 101,890
Rate 3.54% -0.09% 3.45%
2Q14
Average Balance 12,687,971 30,318 12,718,289
Income 109,273 392 109,665
Rate 3.49% 0.01% 3.50%
3Q14
Average Balance 13,990,358 44,149 14,034,507
Income 121,751(4,170) 117,581
Rate 3.49% -0.13% 3.36%
4Q14
Average Balance 14,144,762 54,669 14,199,431
Income 124,680(6,076) 118,603
Rate 3.53% -0.18% 3.35%
1Q15
Average Balance 14,456,891 67,056 14,523,947
Income 125,804(8,969) 116,835
Rate 3.54% -0.30% 3.28%
“ Adjustments represent accounting impacts of purchase discounts on acquired loans and related accretion as well as the indemnification asset and related amortization on the covered portfolio
40
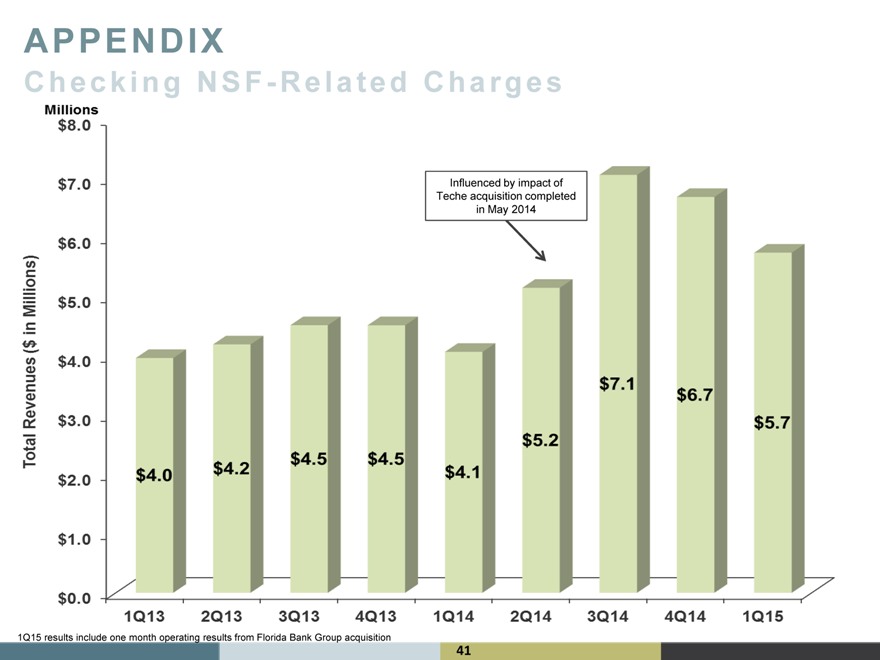
APPENDIX
Checking NSF-Related Charges
Influenced by impact of
Teche acquisition completed
in May 2014
1Q15 results include one month operating results from Florida Bank Group acquisition
41
APPENDIX
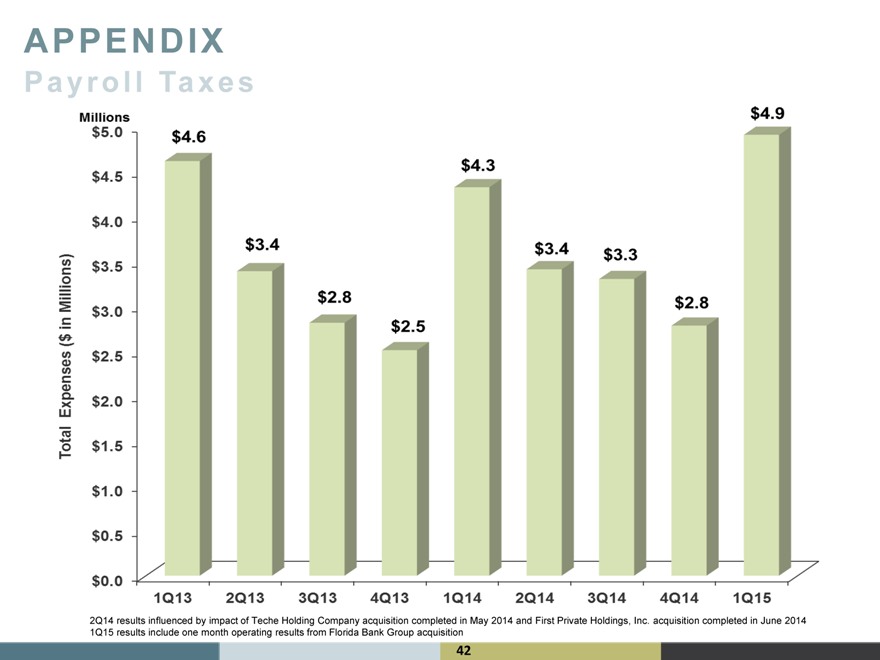
Payroll Taxes
2Q14 results influenced by impact of Teche Holding Company acquisition completed in May 2014 and First Private Holdings, Inc. acquisition completed in June 2014 1Q15 results include one month operating results from Florida Bank Group acquisition
42
APPENDIX
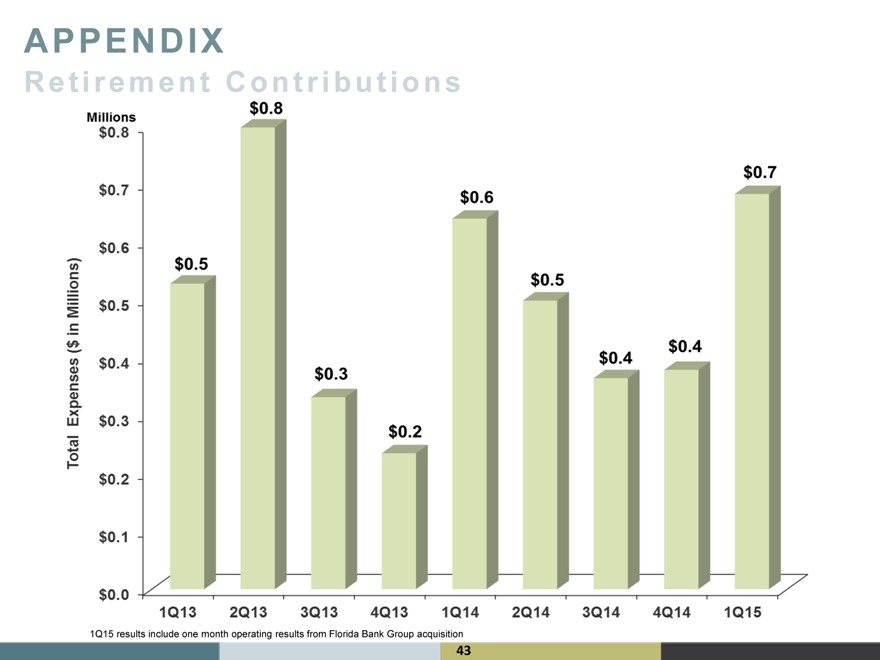
Retirement Contributions
1Q15 results include one month operating results from Florida Bank Group acquisition
43
APPENDIX
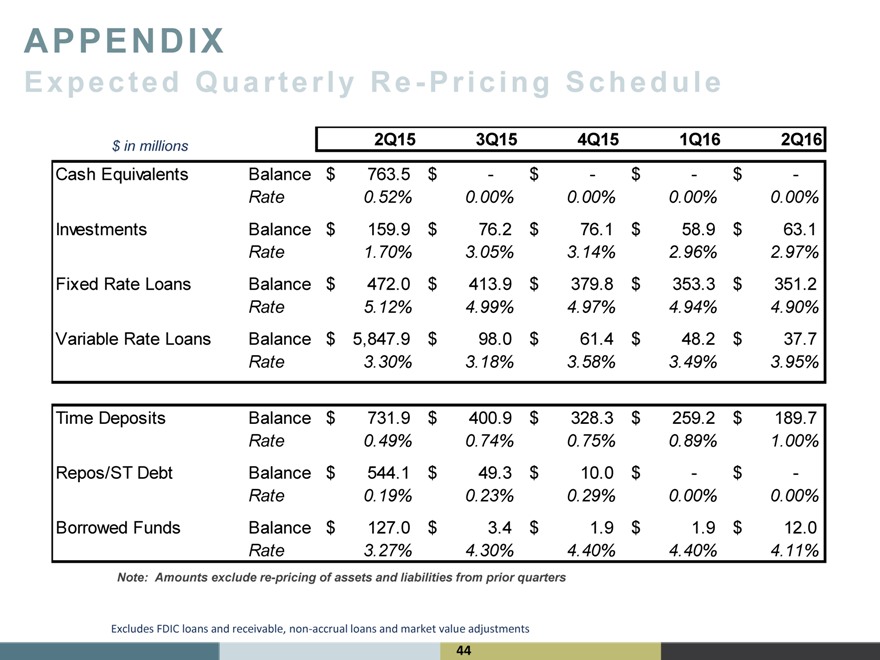
E x p e c t e d Q u a r t e r l y R e—P r i c i n g S c h e d u l e
$ in millions 2Q15 3Q15 4Q15 1Q16 2Q16
Cash Equivalents Balance $ 763.5 $—$—$—$ -
Rate 0.52% 0.00% 0.00% 0.00% 0.00%
Investments Balance $ 159.9 $ 76.2 $ 76.1 $ 58.9 $ 63.1
Rate 1.70% 3.05% 3.14% 2.96% 2.97%
Fixed Rate Loans Balance $ 472.0 $ 413.9 $ 379.8 $ 353.3 $ 351.2
Rate 5.12% 4.99% 4.97% 4.94% 4.90%
Variable Rate Loans Balance $ 5,847.9 $ 98.0 $ 61.4 $ 48.2 $ 37.7
Rate 3.30% 3.18% 3.58% 3.49% 3.95%
Time Deposits Balance $ 731.9 $ 400.9 $ 328.3 $ 259.2 $ 189.7
Rate 0.49% 0.74% 0.75% 0.89% 1.00%
Repos/ST Debt Balance $ 544.1 $ 49.3 $ 10.0 $—$ -
Rate 0.19% 0.23% 0.29% 0.00% 0.00%
Borrowed Funds Balance $ 127.0 $ 3.4 $ 1.9 $ 1.9 $ 12.0
Rate 3.27% 4.30% 4.40% 4.40% 4.11%
Note: Amounts exclude re-pricing of assets and liabilities from prior quarters
Excludes FDIC loans and receivable, non-accrual loans and market value adjustments
44
APPENDIX
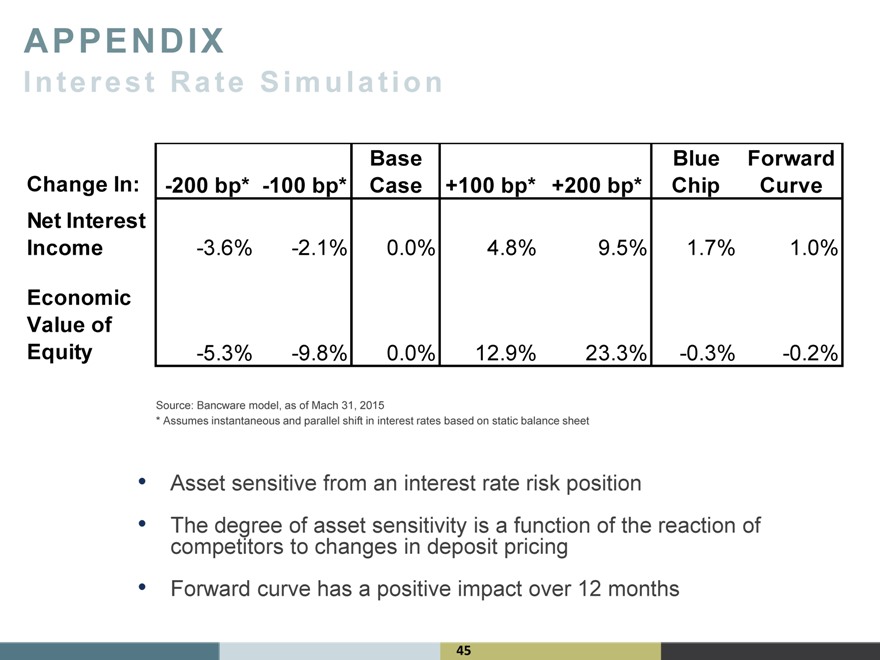
Interest Rate Simulation
Base Blue Forward
Change In: -200 bp* -100 bp* Case +100 bp* +200 bp* Chip Curve
Net Interest
Income -3.6% -2.1% 0.0% 4.8% 9.5% 1.7% 1.0%
Economic
Value of
Equity -5.3% -9.8% 0.0% 12.9% 23.3% -0.3% -0.2%
Source: Bancware model, as of Mach 31, 2015
* Assumes instantaneous and parallel shift in interest rates based on static balance sheet
“ Asset sensitive from an interest rate risk position
“ The degree of asset sensitivity is a function of the reaction of competitors to changes in deposit pricing
“ Forward curve has a positive impact over 12 months
45
APPENDIX
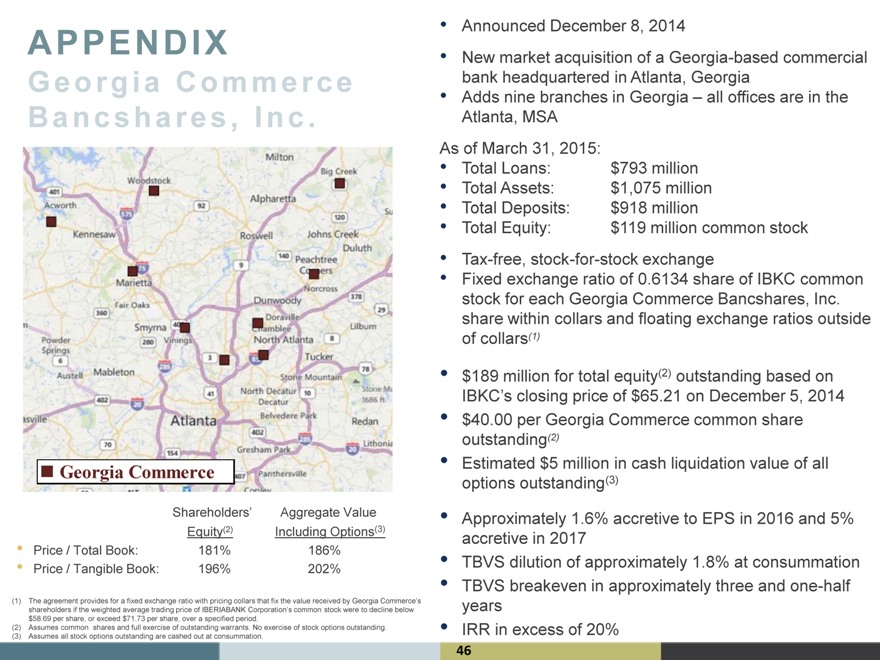
Georgia Commerce Bancshares, Inc.
n Georgia Commerce
Shareholders” Aggregate Value
Equity(2) Including Options(3)
“ Price / Total Book: 181% 186%
“ Price / Tangible Book: 196% 202%
(1) The agreement provides for a fixed exchange ratio with pricing collars that fix the value received by Georgia Commerce’s shareholders if the weighted average trading price of IBERIABANK Corporation’s common stock were to decline below $58.69 per share, or exceed $71.73 per share, over a specified period.
(2) Assumes common shares and full exercise of outstanding warrants. No exercise of stock options outstanding. (3) Assumes all stock options outstanding are cashed out at consummation.
“ Announced December 8, 2014
“
New market acquisition of a Georgia-based commercial bank headquartered in Atlanta, Georgia
“ Adds nine branches in Georgia “ all offices are in the Atlanta, MSA
As of March 31, 2015:
“ Total Loans: $ 793 million
“ Total Assets: $ 1,075 million
“ Total Deposits: $ 918 million
“ Total Equity: $ 119 million common stock
“ Tax-free, stock-for-stock exchange
“ Fixed exchange ratio of 0.6134 share of IBKC common stock for each Georgia Commerce Bancshares, Inc. share within collars and floating exchange ratios outside of collars(1) “ $189 million for total equity(2) outstanding based on
IBKC’s closing price of $65.21 on December 5, 2014
“ $40.00 per Georgia Commerce common share outstanding(2)
“ Estimated $5 million in cash liquidation value of all options outstanding(3)
“ Approximately 1.6% accretive to EPS in 2016 and 5% accretive in 2017
“ TBVS dilution of approximately 1.8% at consummation
“ TBVS breakeven in approximately three and one-half years
“ IRR in excess of 20%
46