
4Q15 Earnings Conference Call Supplemental Presentation January 27, 2016 Exhibit 99.2
2 To the extent that statements in this PowerPoint presentation relate to future plans, objectives, financial results or performance of IBERIABANK Corporation, these statements are deemed to be forward-looking statements within the meaning of the Private Securities Litigation Reform Act of 1995. Such statements, which are based on management’s current information, estimates and assumptions and the current economic environment, are generally identified by the use of the words “plan”, “believe”, “expect”, “intend”, “anticipate”, “estimate”, “project” or similar expressions. The Company’s actual strategies, results and financial condition in future periods may differ materially from those currently expected due to various risks and uncertainties. Forward-looking statements are subject to numerous assumptions, risks and uncertainties that change over time and could cause actual results or financial condition to differ materially from those expressed in or implied by such statements. Consequently, no forward-looking statement can be guaranteed. Except to the extent required by applicable law or regulation, the Company undertakes no obligation to revise or update publicly any forward-looking statement for any reason. S a f e H a r b o r A n d L e g e n d
• Good legacy loan growth • Net loan growth tempered by “risk-off” loans and resolution of covered loans • Seasonally slower deposit trends; held deposit costs stable • Very strong improvements in the reported net interest margin and cash margin • Good revenue growth despite seasonal slowness in mortgage and title • Excellent expense reduction; achieved bulk of previously announced expense initiative • Two previously disclosed branches and 17 additional branches will close 1Q16 • Some economic weakness beginning to show in certain markets/clients • Asset quality remains stellar; continuing to work potential energy-related concerns • Type of energy credits matter; as well as size, diversification, and guarantor support • We reduced energy and market exposure; enhanced energy-related loan loss reserves • Achieved record operating EPS for quarter (beat consensus) and full-year • Recent Fed rate increase had limited impact on 4Q15 results (will benefit 1Q16) • Progress toward strategic goals with one year remaining: • Double-digit operating EPS growth (12% in 2015); • Tangible operating efficiency ratio less than 60% (61.1% in 4Q15); • Top 10% asset quality among peers (top 14% in 3Q15); and • Return on tangible common equity of 13% to 17% (11.2% in 4Q15; biggest challenge) 3 C E O O ve r v i e w
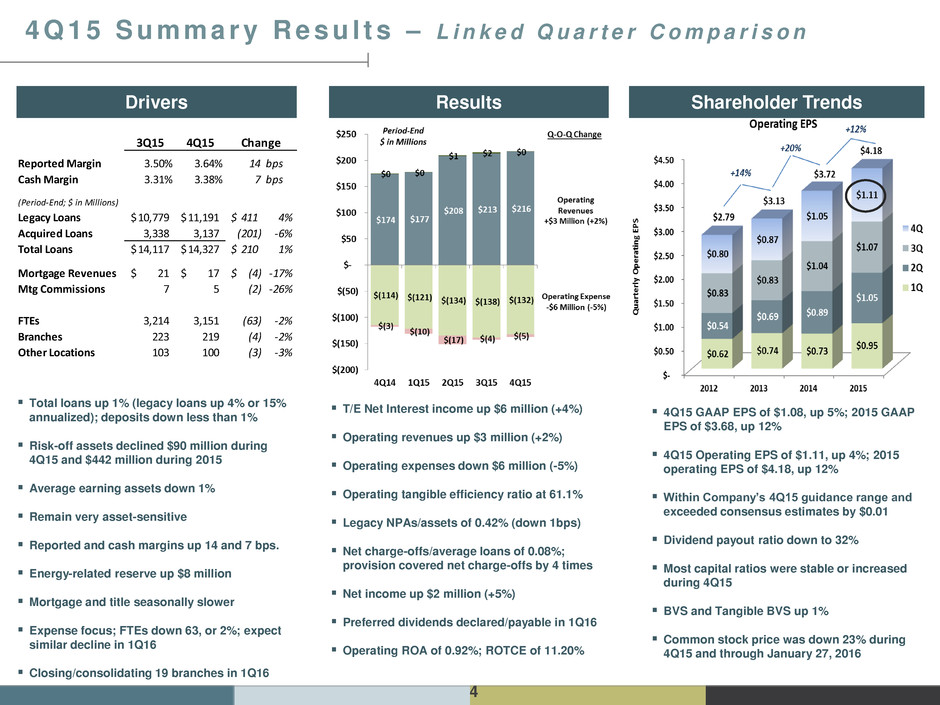
4 Shareholder Trends Drivers Results 4 Q 1 5 S u m m a r y R e s u l t s – L i n k e d Q u a r t e r C o m p a r i s o n 4Q15 GAAP EPS of $1.08, up 5%; 2015 GAAP EPS of $3.68, up 12% 4Q15 Operating EPS of $1.11, up 4%; 2015 operating EPS of $4.18, up 12% Within Company’s 4Q15 guidance range and exceeded consensus estimates by $0.01 Dividend payout ratio down to 32% Most capital ratios were stable or increased during 4Q15 BVS and Tangible BVS up 1% Common stock price was down 23% during 4Q15 and through January 27, 2016 Total loans up 1% (legacy loans up 4% or 15% annualized); deposits down less than 1% Risk-off assets declined $90 million during 4Q15 and $442 million during 2015 Average earning assets down 1% Remain very asset-sensitive Reported and cash margins up 14 and 7 bps. Energy-related reserve up $8 million Mortgage and title seasonally slower Expense focus; FTEs down 63, or 2%; expect similar decline in 1Q16 Closing/consolidating 19 branches in 1Q16 T/E Net Interest income up $6 million (+4%) Operating revenues up $3 million (+2%) Operating expenses down $6 million (-5%) Operating tangible efficiency ratio at 61.1% Legacy NPAs/assets of 0.42% (down 1bps) Net charge-offs/average loans of 0.08%; provision covered net charge-offs by 4 times Net income up $2 million (+5%) Preferred dividends declared/payable in 1Q16 Operating ROA of 0.92%; ROTCE of 11.20% 3Q15 4Q15 Reported Margin 3.50% 3.64% 14 bps Cash Margin 3.31% 3.38% 7 bps (Period-End; $ in Millions) Legacy Loans 10,779$ 11,191$ 411$ 4% Acquired Loans 3,338 3,137 (201) -6% Total Loans 14,117$ 14,327$ 210$ 1% Mortgage Revenues 21$ 17$ (4)$ -17% Mtg Commissions 7 5 (2) -26% FTEs 3,214 3,151 (63) -2% Branches 223 219 (4) -2% Other Locations 103 100 (3) -3% Change
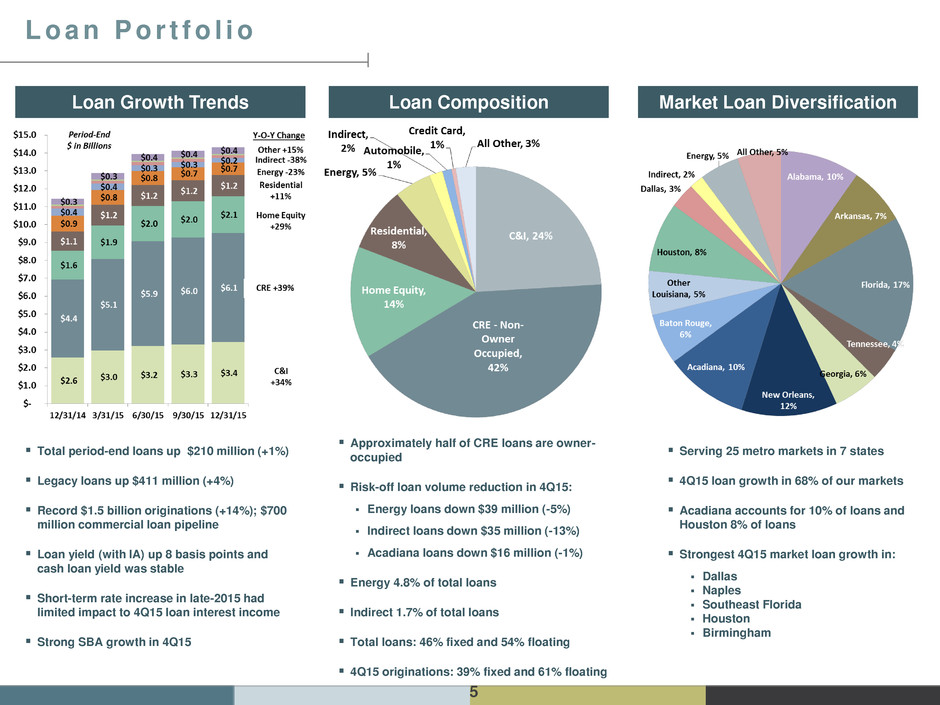
5 Loan Growth Trends Loan Composition Market Loan Diversification L o a n P o r t f o l i o Total period-end loans up $210 million (+1%) Legacy loans up $411 million (+4%) Record $1.5 billion originations (+14%); $700 million commercial loan pipeline Loan yield (with IA) up 8 basis points and cash loan yield was stable Short-term rate increase in late-2015 had limited impact to 4Q15 loan interest income Strong SBA growth in 4Q15 Approximately half of CRE loans are owner- occupied Risk-off loan volume reduction in 4Q15: Energy loans down $39 million (-5%) Indirect loans down $35 million (-13%) Acadiana loans down $16 million (-1%) Energy 4.8% of total loans Indirect 1.7% of total loans Total loans: 46% fixed and 54% floating 4Q15 originations: 39% fixed and 61% floating Serving 25 metro markets in 7 states 4Q15 loan growth in 68% of our markets Acadiana accounts for 10% of loans and Houston 8% of loans Strongest 4Q15 market loan growth in: Dallas Naples Southeast Florida Houston Birmingham
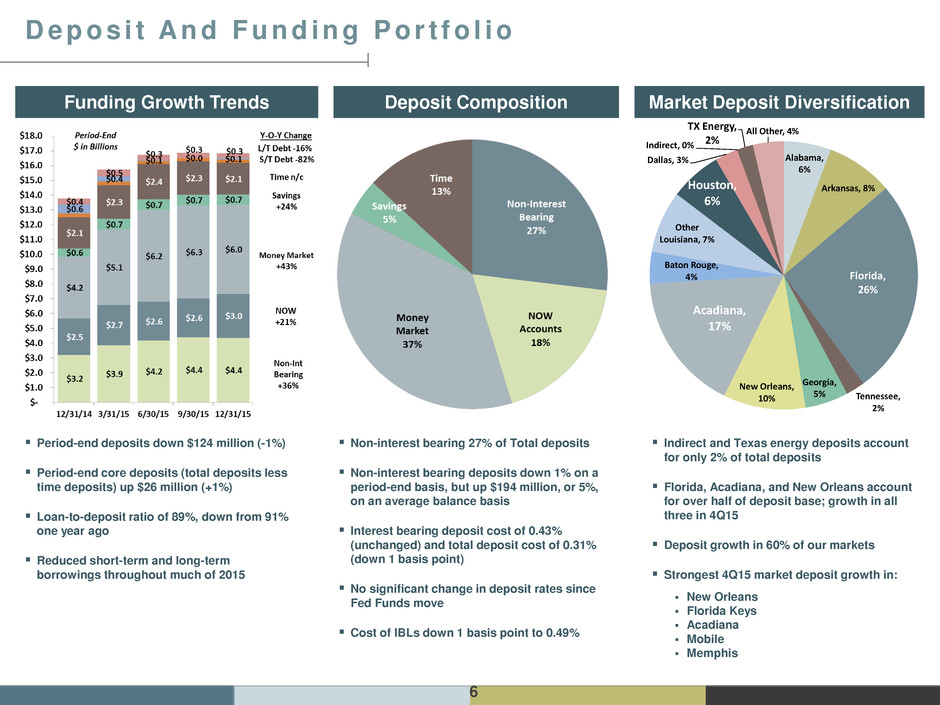
6 Funding Growth Trends Deposit Composition Market Deposit Diversification D e p o s i t A n d F u n d i n g P o r t f o l i o Period-end deposits down $124 million (-1%) Period-end core deposits (total deposits less time deposits) up $26 million (+1%) Loan-to-deposit ratio of 89%, down from 91% one year ago Reduced short-term and long-term borrowings throughout much of 2015 Non-interest bearing 27% of Total deposits Non-interest bearing deposits down 1% on a period-end basis, but up $194 million, or 5%, on an average balance basis Interest bearing deposit cost of 0.43% (unchanged) and total deposit cost of 0.31% (down 1 basis point) No significant change in deposit rates since Fed Funds move Cost of IBLs down 1 basis point to 0.49% Indirect and Texas energy deposits account for only 2% of total deposits Florida, Acadiana, and New Orleans account for over half of deposit base; growth in all three in 4Q15 Deposit growth in 60% of our markets Strongest 4Q15 market deposit growth in: New Orleans Florida Keys Acadiana Mobile Memphis Alabama, 6% Arkansas, 8% Florida, 26% Tennessee, 2% Georgia, 5% New Orleans, 10% Acadiana, 17% Baton Rouge, 4% Other Louisiana, 7% Houston, 6% Dallas, 3% Indirect, 0% TX Energy, 2% All Other, 4%
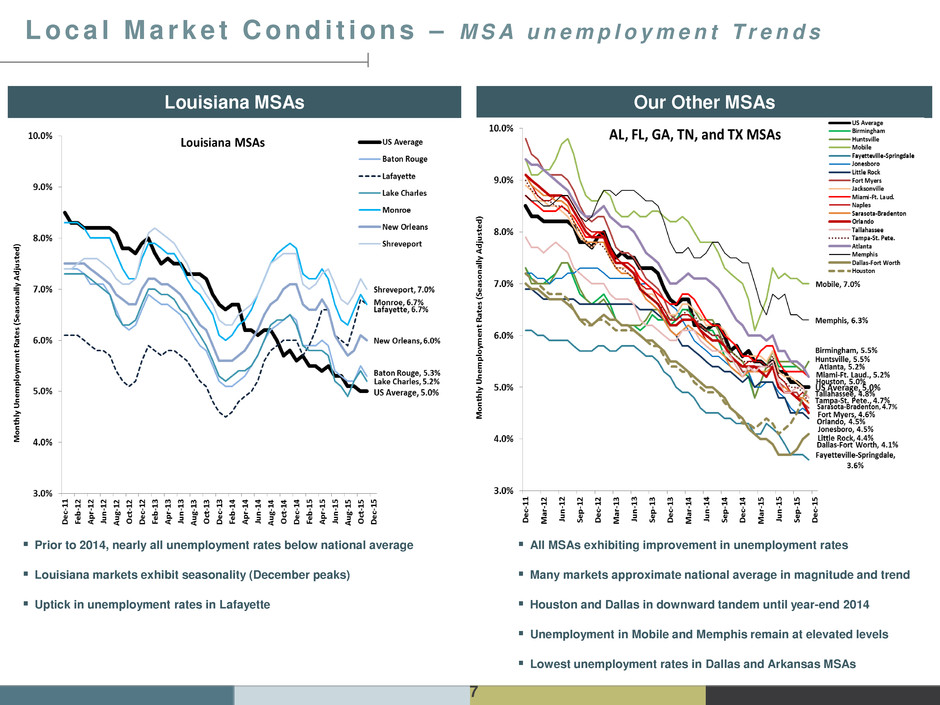
7 Louisiana MSAs Our Other MSAs L o c a l M a r k e t C o n d i t i o n s – M S A u n e m p l o y m e n t T r e n d s Prior to 2014, nearly all unemployment rates below national average Louisiana markets exhibit seasonality (December peaks) Uptick in unemployment rates in Lafayette All MSAs exhibiting improvement in unemployment rates Many markets approximate national average in magnitude and trend Houston and Dallas in downward tandem until year-end 2014 Unemployment in Mobile and Memphis remain at elevated levels Lowest unemployment rates in Dallas and Arkansas MSAs

Topics Of Interest

9 Legacy Loan Growth Noninterest Income And Expense Items S e a s o n a l I n f l u e n c e s Loan growth is softer in first quarter and stronger in fourth quarter Mortgage and title income are softer in fourth and first quarters and stronger in second and third quarters Payroll taxes and retirement contributions decrease ratably throughout the year The net result is first quarter tends to have softer profitability $0.0 $1.0 $2.0 $3.0 $4.0 $5.0 $6.0 1Q13 2Q13 3Q13 4Q13 1Q14 2Q14 3Q14 4Q14 1Q15 2Q15 3Q15 4Q15 $4.6 $3.4 $2.8 $2.5 $4.3 $3.4 $3.3 $2.8 $4.9 $4.3 $4.1 $3.4 $0.5 $0.8 $0.3 $0.2 $0.6 $0.5 $0.4 $0.4 $0.7 $0.4 $0.5 $0.4 Ex pe nses ($ in M ill io ns ) Millions Retirement Contributions Payroll Taxes $ $2 $4 $6 $8 $10 $12 $14 $16 $18 $20 $22 $24 $26 $28 $30 $32 1Q13 2Q13 3Q13 4Q13 1Q14 2Q14 3Q14 4Q14 1Q15 2Q15 3Q15 4Q15 $19 $18 $15 $12 $10 $14 $14 $14 $18 $25 $21 $17 $5 $6 $5 $4 $4 $5 $6 $5 $5 $6 $7 $5 N on -In te rest In co me ($ in M ill io ns ) $ in Millions Title Revenues Mortgage Revenues -$50 $0 $50 $100 $150 $200 $250 $300 $350 $400 $450 $500 $550 $600 M ar -0 4 Ju n- 04 S ep -0 4 D ec -0 4 M ar -0 5 Ju n- 05 S ep -0 5 D ec-0 5 M ar -0 6 Ju n- 06 S ep -0 6 D ec-0 6 M ar -0 7 Ju n- 07 S ep -0 7 D ec-0 7 M ar -0 8 Ju n- 08 Se p- 08 D ec-0 8 M ar -0 9 Ju n- 09 S ep -0 9 D ec-0 9 M ar -1 0 Ju n- 10 S ep -1 0 D ec-1 0 M ar -1 1 Ju n- 11 S ep -1 1 D ec-1 1 M ar -1 2 Ju n- 12 S ep -1 2 D ec-1 2 M ar -1 3 Ju n- 13 S ep -1 3 D ec-1 3 M ar -1 4 Ju n- 14 S ep -1 4 D ec-1 4 M ar -1 5 Ju n- 15 S ep -1 5 D ec-1 5 6 51 (15) 39 37 61 23 123 (5) 115 14 107 64 173 149 338 246 362 243 568 165 489 181 411 Pe rio d- En d Q ua rt er ly Le ga cy Loan Gro w th $ in Millions First Quarter Growth Other Quarter Growth
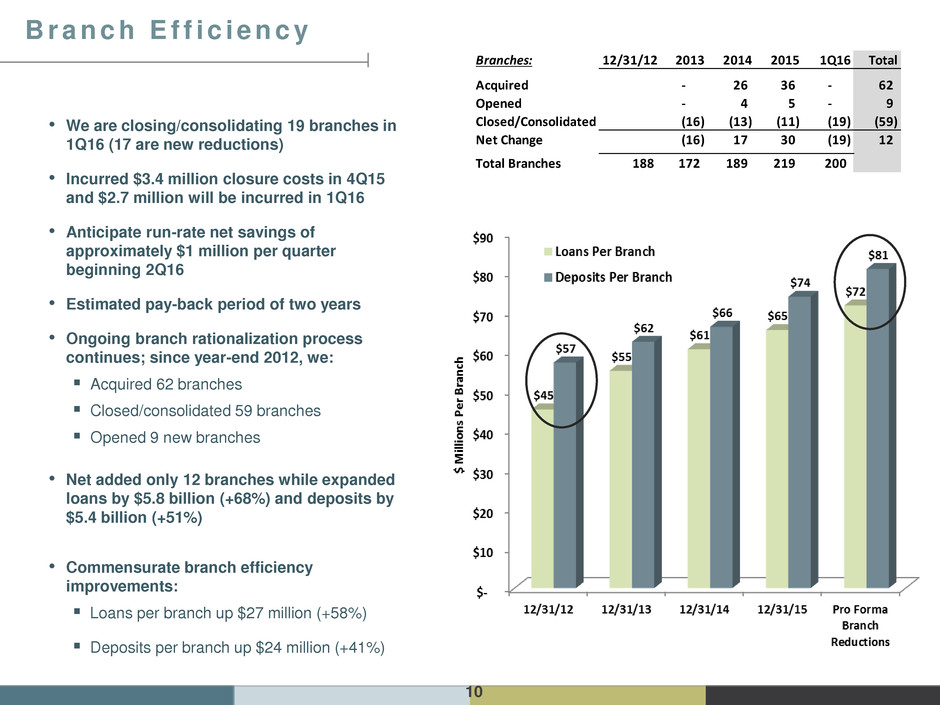
10 • We are closing/consolidating 19 branches in 1Q16 (17 are new reductions) • Incurred $3.4 million closure costs in 4Q15 and $2.7 million will be incurred in 1Q16 • Anticipate run-rate net savings of approximately $1 million per quarter beginning 2Q16 • Estimated pay-back period of two years • Ongoing branch rationalization process continues; since year-end 2012, we: Acquired 62 branches Closed/consolidated 59 branches Opened 9 new branches • Net added only 12 branches while expanded loans by $5.8 billion (+68%) and deposits by $5.4 billion (+51%) • Commensurate branch efficiency improvements: Loans per branch up $27 million (+58%) Deposits per branch up $24 million (+41%) B r a n c h E f f i c i e n c y Branches: 12/31/12 2013 2014 2015 1Q16 Total Acquired - 26 36 - 62 Opened - 4 5 - 9 Closed/Consolidated (16) (13) (11) (19) (59) Net Change (16) 17 30 (19) 12 Total Branches 188 172 189 219 200

11 • In 2013, Achieved More Than $24 Million Annualized Pre-Tax Run- Rate Savings • In 2014, A Second Initiative Achieved An Additional $11 Million In Run-Rate Savings; This Initiative Was Completed In 4Q14 • In 2Q15, Announced A Third Efficiency Initiative Targeting $15 Million In Additional Potential Improvements • Initiative Was Completed In 4Q15 • Additional 17 Branch Closures Announced To Occur in 1Q16 • Anticipate Run Rate Savings For 19 Branch Closures To Be Approximately $1 Million Per Quarter Beginning in 2Q16 O ve r a l l E f f i c i e n c y I m p r o ve m e n t Tr e n d s
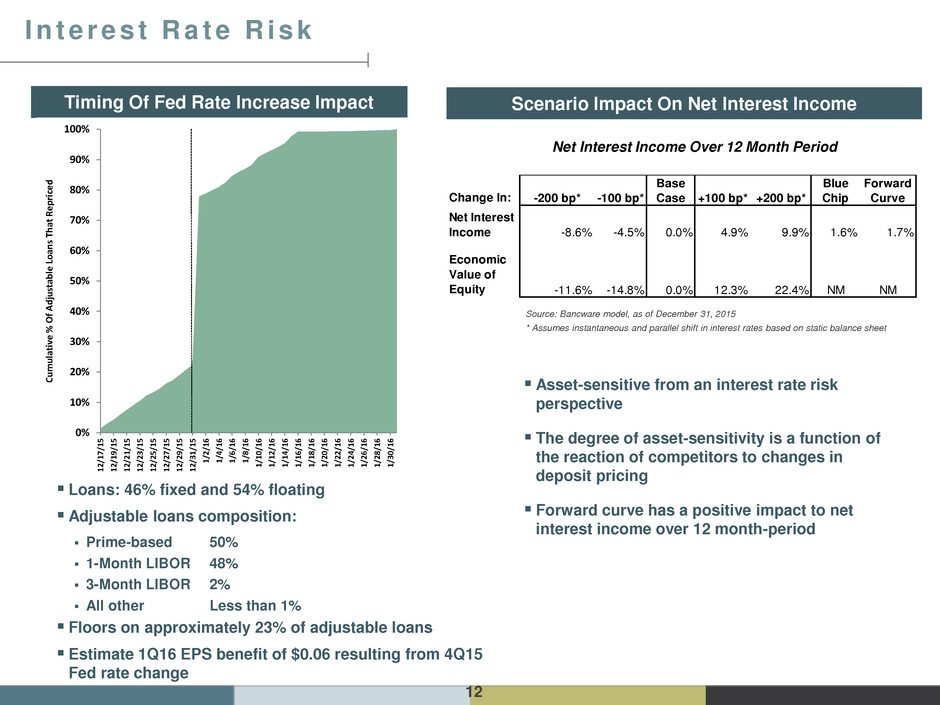
12 Timing Of Fed Rate Increase Impact Scenario Impact On Net Interest Income I n t e r e s t R a t e R i s k Loans: 46% fixed and 54% floating Adjustable loans composition: Prime-based 50% 1-Month LIBOR 48% 3-Month LIBOR 2% All other Less than 1% Floors on approximately 23% of adjustable loans Estimate 1Q16 EPS benefit of $0.06 resulting from 4Q15 Fed rate change 0% 10% 20% 30% 40% 50% 60% 70% 80% 90% 100% 12 /17 /1 5 12 /19 /1 5 12 /2 1/ 15 12 /23 /1 5 12 /25 /1 5 12 /27 /1 5 12 /29 /1 5 12 /31 /1 5 1/ 2/ 16 1/ 4/ 16 1/ 6/ 16 1/ 8/ 16 1/ 10 /1 6 1/ 12 /1 6 1/ 14 /1 6 1/ 16 /1 6 1/ 18 /1 6 1/ 20 /1 6 1/ 22 /1 6 1/ 24 /1 6 1/ 26 /1 6 1/ 28 /1 6 1/ 30 /1 6 C umu la ti ve % O f A d ju st able L o an s Th at R ep ri ce d Base Blue Forward Change In: -200 bp* -100 bp* Case +100 bp* +200 bp* Chip Curve Net Interest Income -8.6% -4.5% 0.0% 4.9% 9.9% 1.6% 1.7% Economic Value of Equity -11. % -14.8% 0.0% 12.3% 22.4% NM NM Asset-sensitive from an interest rate risk perspective The degree of asset-sensitivity is a function of the reaction of competitors to changes in deposit pricing Forward curve has a positive impact to net interest income over 12 month-period Source: Bancware model, as of December 31, 2015 * Assumes instantaneous and parallel shift in interest rates based on static balance sheet Net Interest Income Over 12 Month Period

Credit Quality And Energy
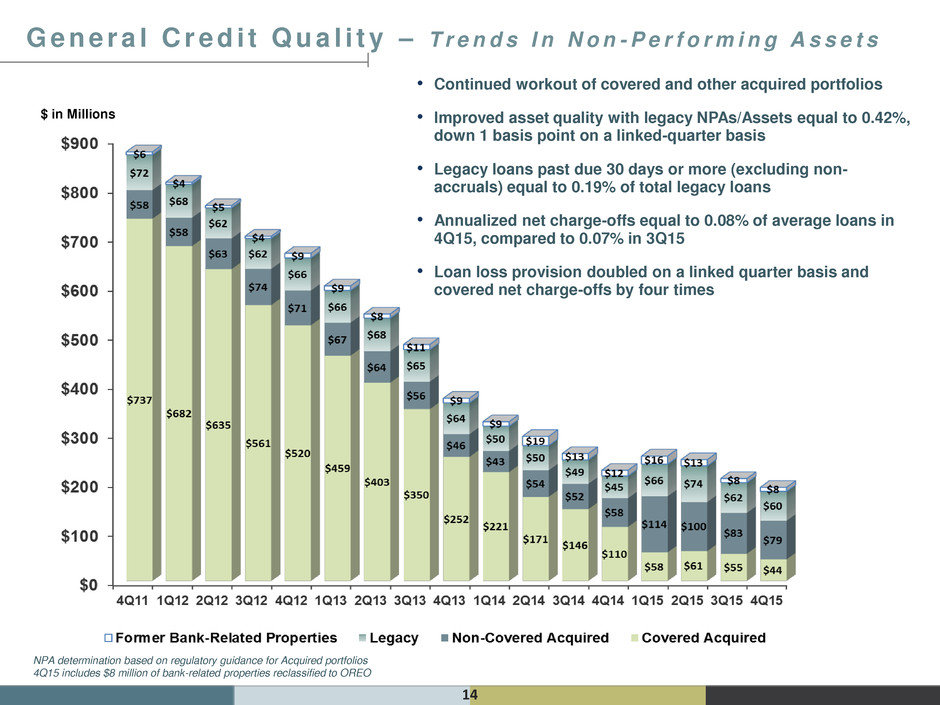
G e n e r a l C r e d i t Q u a l i t y – T r e n d s I n N o n - P e r f o r m i n g A s s e t s $ in Millions NPA determination based on regulatory guidance for Acquired portfolios 4Q15 includes $8 million of bank-related properties reclassified to OREO • Continued workout of covered and other acquired portfolios • Improved asset quality with legacy NPAs/Assets equal to 0.42%, down 1 basis point on a linked-quarter basis • Legacy loans past due 30 days or more (excluding non- accruals) equal to 0.19% of total legacy loans • Annualized net charge-offs equal to 0.08% of average loans in 4Q15, compared to 0.07% in 3Q15 • Loan loss provision doubled on a linked quarter basis and covered net charge-offs by four times 14
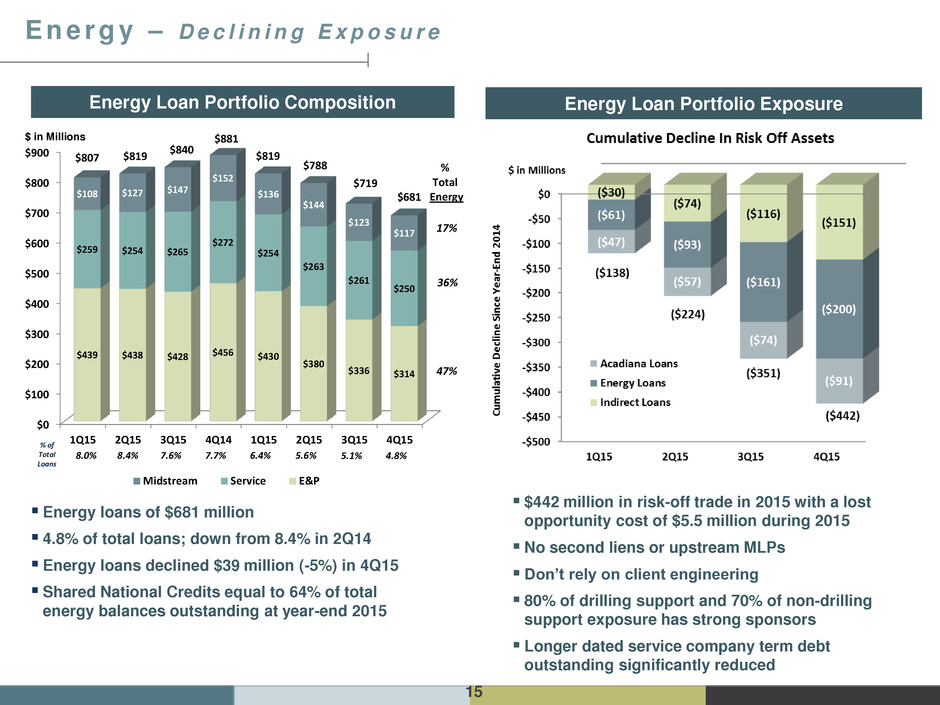
15 Energy Loan Portfolio Composition Energy Loan Portfolio Exposure E n e r g y – D e c l i n i n g E x p o s u r e $442 million in risk-off trade in 2015 with a lost opportunity cost of $5.5 million during 2015 No second liens or upstream MLPs Don’t rely on client engineering 80% of drilling support and 70% of non-drilling support exposure has strong sponsors Longer dated service company term debt outstanding significantly reduced Energy loans of $681 million 4.8% of total loans; down from 8.4% in 2Q14 Energy loans declined $39 million (-5%) in 4Q15 Shared National Credits equal to 64% of total energy balances outstanding at year-end 2015 $0 $100 $200 $300 $400 $500 $600 $700 $800 $900 1Q15 2Q15 3Q15 4Q14 1Q15 2Q15 3Q15 4Q15 $439 $438 $428 $456 $430 $380 $336 $314 $259 $254 $265 $272 $254 $263 $261 $250 $108 $127 $147 $152 $136 $144 $123 $117 Midstream Service E&P $881 $819 $788 $719 $840 $819$807 8.0% 8.4% 7.6% 7.7% 6.4% 5.6% 5.1% % Total Energy 17% 36% 47% $681 4.8% % of Total Loans $ in Millions
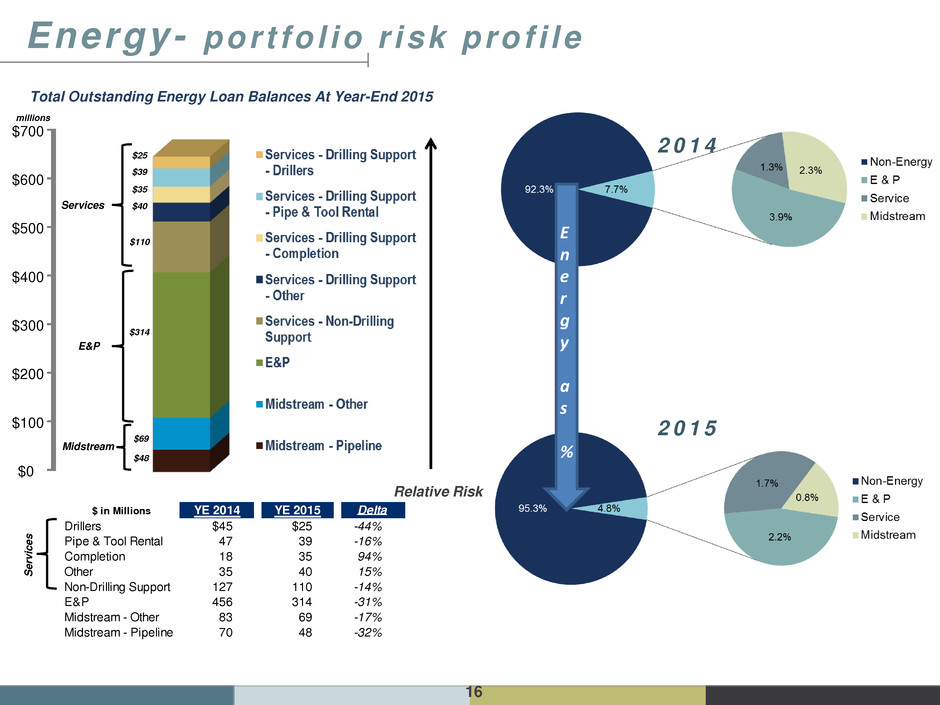
16 $300 $200 $100 $0 $700 $600 $500 $400 Midstream E&P Services Relative Risk Total Outstanding Energy Loan Balances At Year-End 2015 2 0 1 4 E n e r g y a s % millions $25 $39 $35 $40 $110 $314 $69 $48 2 0 1 5 S e rv ic e s Energy- por t fo l io r isk prof i le $ in Millions YE 2014 YE 2015 Delta Drillers $45 $25 -44% Pipe & Tool Rental 47 39 -16% Completion 18 35 94% Other 35 40 15% Non-Drilling Support 127 110 -14% E&P 456 314 -31% Midstream - Other 83 69 -17% Midstream - Pipeline 70 48 -32%
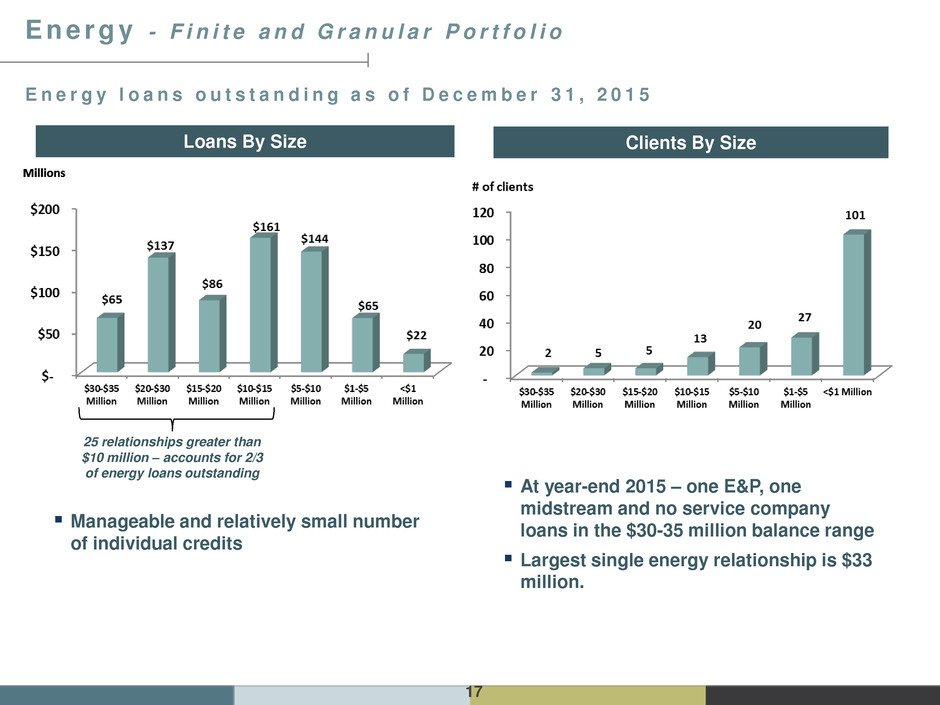
17 E n e r g y - F i n i t e a n d G r a n u l a r P o r t f o l i o Manageable and relatively small number of individual credits E n e r g y l o a n s o u t s t a n d i n g a s o f D e c e m b e r 3 1 , 2 0 1 5 At year-end 2015 – one E&P, one midstream and no service company loans in the $30-35 million balance range Largest single energy relationship is $33 million. 25 relationships greater than $10 million – accounts for 2/3 of energy loans outstanding Clients By Size Loans By Size
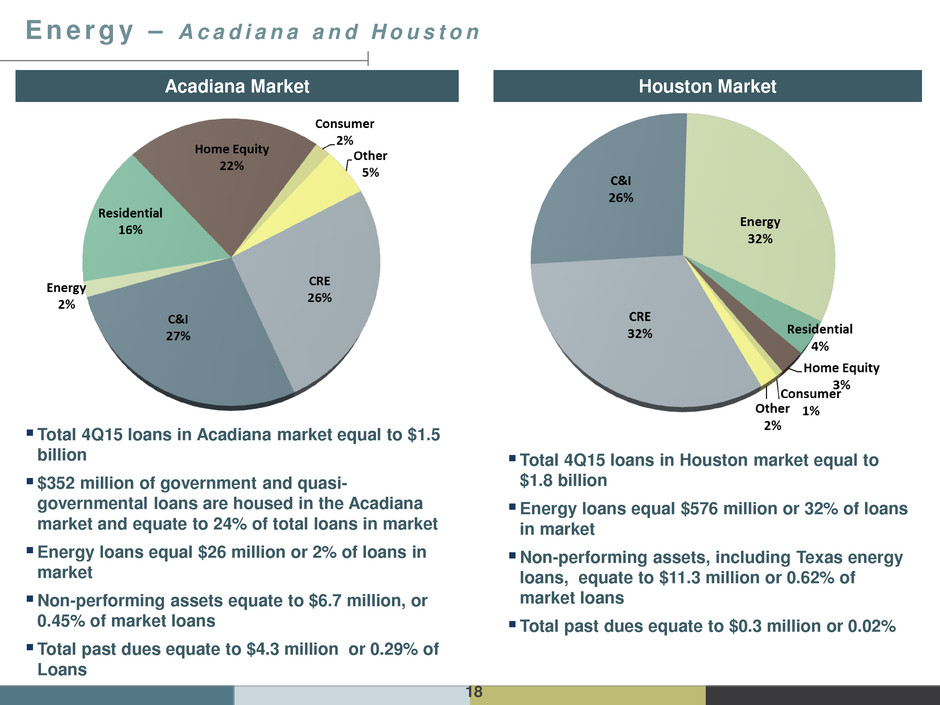
18 E n e r g y – A c a d i a n a a n d H o u s t o n Total 4Q15 loans in Acadiana market equal to $1.5 billion $352 million of government and quasi- governmental loans are housed in the Acadiana market and equate to 24% of total loans in market Energy loans equal $26 million or 2% of loans in market Non-performing assets equate to $6.7 million, or 0.45% of market loans Total past dues equate to $4.3 million or 0.29% of Loans Total 4Q15 loans in Houston market equal to $1.8 billion Energy loans equal $576 million or 32% of loans in market Non-performing assets, including Texas energy loans, equate to $11.3 million or 0.62% of market loans Total past dues equate to $0.3 million or 0.02% Acadiana Market Houston Market
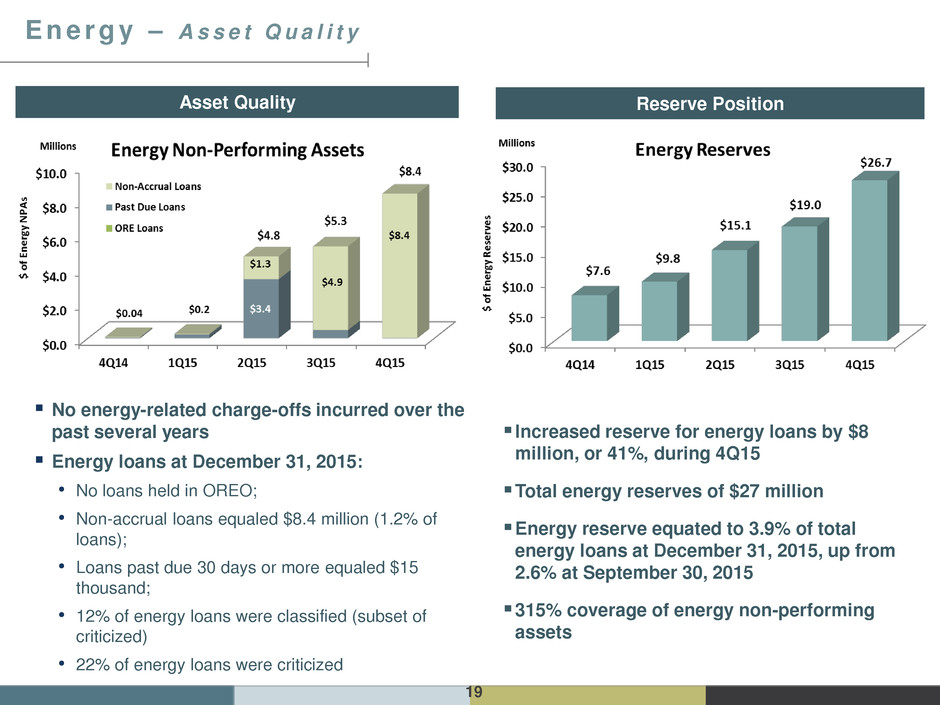
19 Asset Quality Reserve Position E n e r g y – A s s e t Q u a l i t y Increased reserve for energy loans by $8 million, or 41%, during 4Q15 Total energy reserves of $27 million Energy reserve equated to 3.9% of total energy loans at December 31, 2015, up from 2.6% at September 30, 2015 315% coverage of energy non-performing assets No energy-related charge-offs incurred over the past several years Energy loans at December 31, 2015: • No loans held in OREO; • Non-accrual loans equaled $8.4 million (1.2% of loans); • Loans past due 30 days or more equaled $15 thousand; • 12% of energy loans were classified (subset of criticized) • 22% of energy loans were criticized

Addit ional Energy Detai ls 20
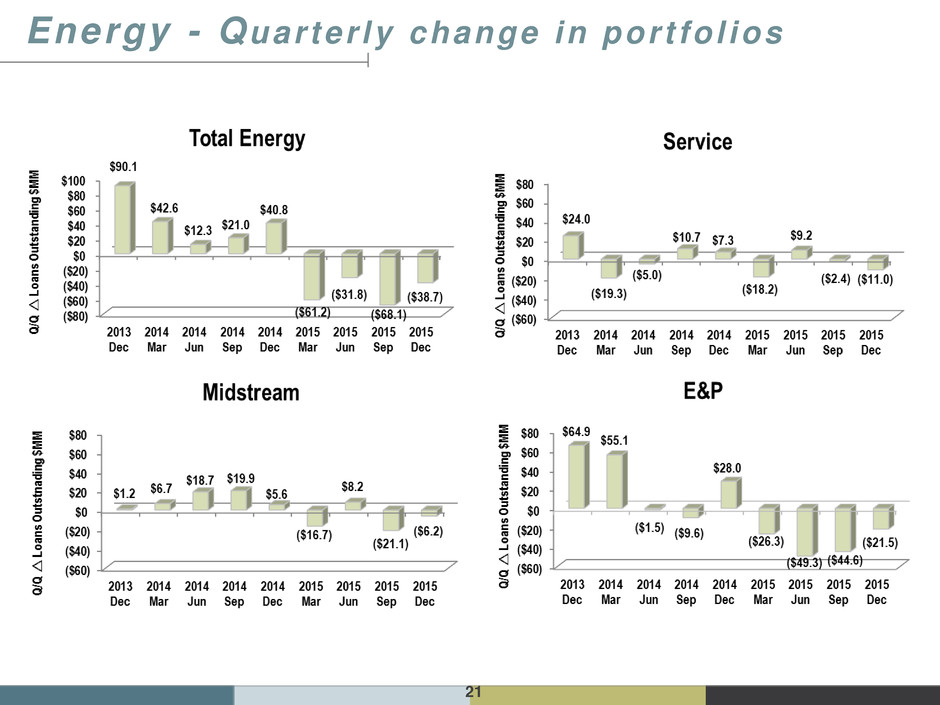
21 Energy - Quar ter ly change in por t fo l ios
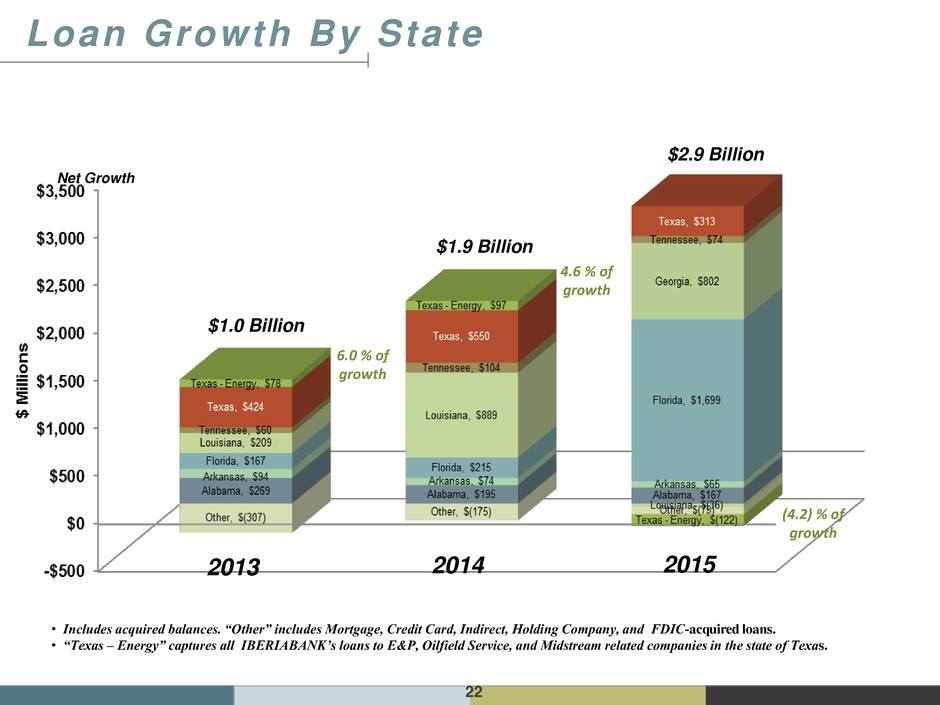
22 2013 2014 2015 • Includes acquired balances. “Other” includes Mortgage, Credit Card, Indirect, Holding Company, and FDIC-acquired loans. • “Texas – Energy” captures all IBERIABANK’s loans to E&P, Oilfield Service, and Midstream related companies in the state of Texas. (4.2) % of growth 6.0 % of growth 4.6 % of growth $1.0 Billion $1.9 Billion $2.9 Billion Net Growth Loan Growth By State
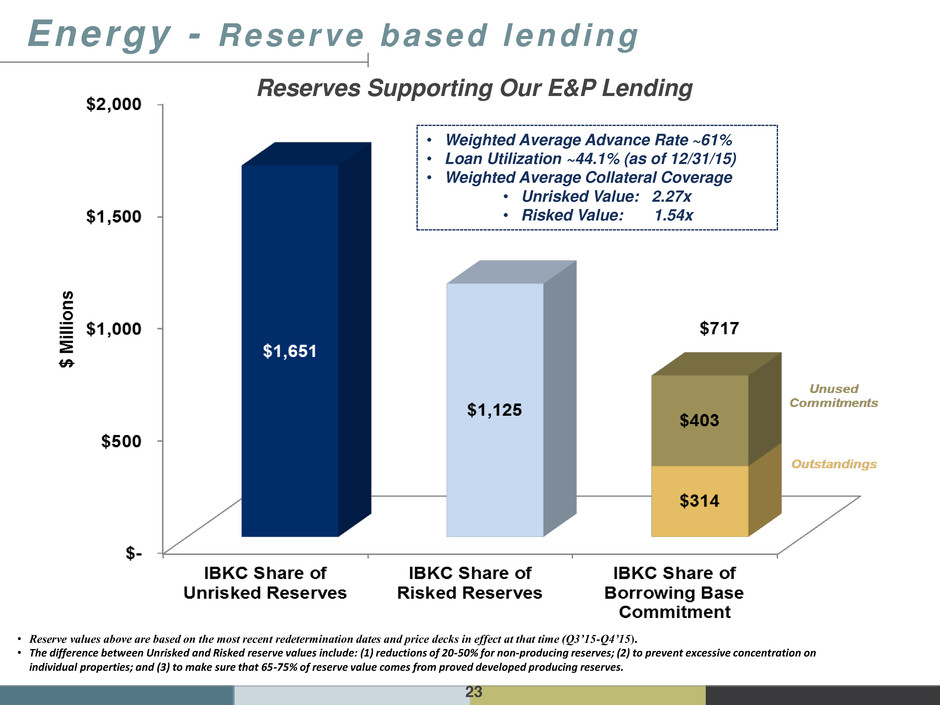
23 • Reserve values above are based on the most recent redetermination dates and price decks in effect at that time (Q3’15-Q4’15). • The difference between Unrisked and Risked reserve values include: (1) reductions of 20-50% for non-producing reserves; (2) to prevent excessive concentration on individual properties; and (3) to make sure that 65-75% of reserve value comes from proved developed producing reserves. • Weighted Average Advance Rate ~61% • Loan Utilization ~44.1% (as of 12/31/15) • Weighted Average Collateral Coverage • Unrisked Value: 2.27x • Risked Value: 1.54x Reserves Supporting Our E&P Lending Energy - Reserve based lending
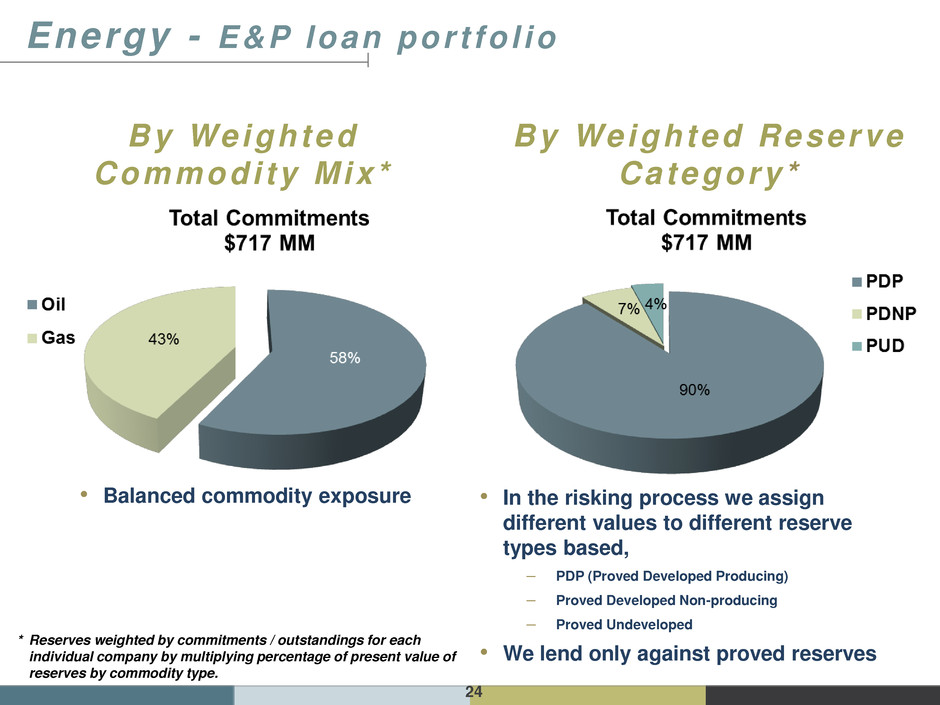
24 By Weighted Commodi ty Mix* * Reserves weighted by commitments / outstandings for each individual company by multiplying percentage of present value of reserves by commodity type. By Weighted Reserve Category* • In the risking process we assign different values to different reserve types based, – PDP (Proved Developed Producing) – Proved Developed Non-producing – Proved Undeveloped • We lend only against proved reserves • Balanced commodity exposure Energy - E&P loan por t fo l io
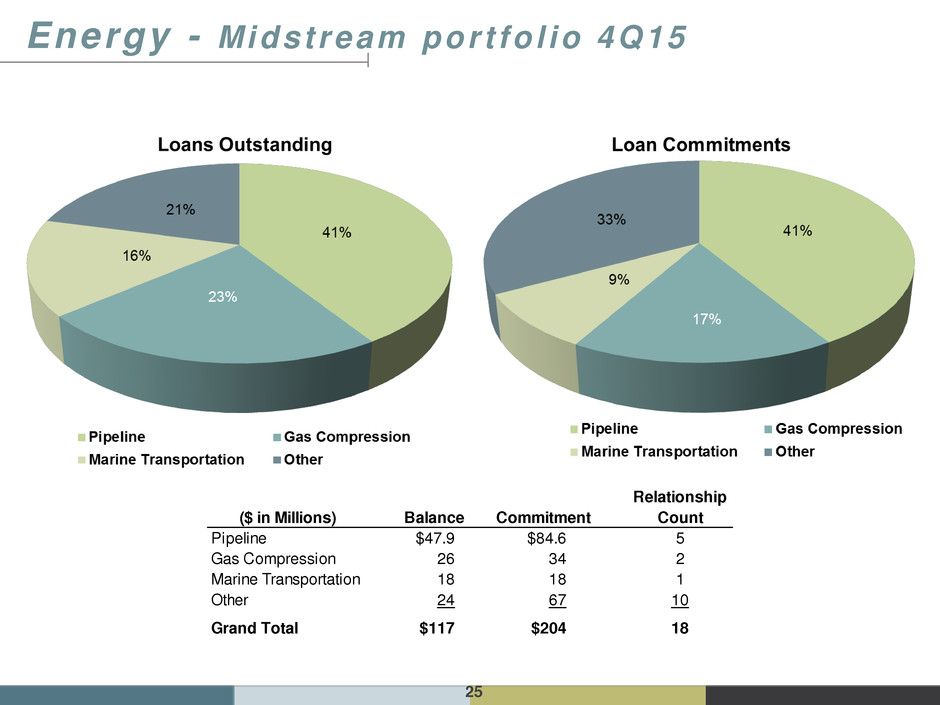
25 Energy - Midstream por t fo l io 4Q15 ($ in Millions) Balance Commitment Relationship Count Pipeline $47.9 $84.6 5 Gas Compression 26 34 2 Marine Transportation 18 18 1 Other 24 67 10 Grand Total $117 $204 18
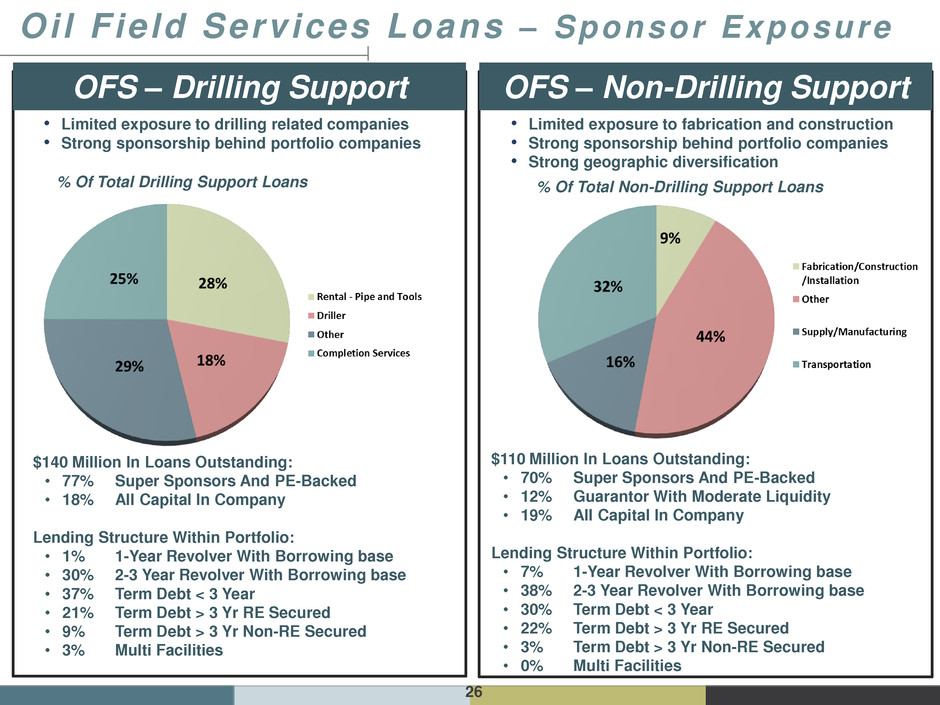
26 Oil F ie ld Services Loans – Sponsor Exposure % Of Total Drilling Support Loans % Of Total Non-Drilling Support Loans $140 Million In Loans Outstanding: • 77% Super Sponsors And PE-Backed • 18% All Capital In Company Lending Structure Within Portfolio: • 1% 1-Year Revolver With Borrowing base • 30% 2-3 Year Revolver With Borrowing base • 37% Term Debt < 3 Year • 21% Term Debt > 3 Yr RE Secured • 9% Term Debt > 3 Yr Non-RE Secured • 3% Multi Facilities $110 Million In Loans Outstanding: • 70% Super Sponsors And PE-Backed • 12% Guarantor With Moderate Liquidity • 19% All Capital In Company Lending Structure Within Portfolio: • 7% 1-Year Revolver With Borrowing base • 38% 2-3 Year Revolver With Borrowing base • 30% Term Debt < 3 Year • 22% Term Debt > 3 Yr RE Secured • 3% Term Debt > 3 Yr Non-RE Secured • 0% Multi Facilities • Limited exposure to drilling related companies • Strong sponsorship behind portfolio companies • Limited exposure to fabrication and construction • Strong sponsorship behind portfolio companies • Strong geographic diversification OFS – Drilling Support OFS – Non-Drilling Support

27 Energy – OFS st ructure of suppor t • $250 million in drilling support • Sponsorship at year-end 2015 • 76% have super sponsor and private equity backing • 18% have substantially all capital in company • 6% have guarantors support with moderate liquidity • Structures have changed from 2014 • Generally shorter maturities • Significantly less term debt with maturities beyond three years not secured by real estate

Appendix 28

29 N o n - I n t e r e s t I n c o m e Non-interest Income ($000s) 4Q14 1Q15 2Q15 3Q15 4Q15 $ Change % Change Service Charges on Deposit Accounts 10,153$ 9,262$ 10,162$ 11,342$ 11,432$ 90$ 1% ATM / Debit Card Fee Income 3,331 3,275 3,583 3,562 3,568 6 0% BOLI Proceeds and CSV Income 1,050 1,092 1,075 1,093 1,096 3 0% Mortgage Income 13,646 18,023 25,246 20,730 17,123 (3,607) -17% Title Revenue 5,486 4,629 6,146 6,627 5,436 (1,191) -18% Broker Commissions 3,960 4,162 5,461 3,839 4,130 291 8% Other Noninterest Income 9,071 8,067 8,574 8,064 9,561 1,497 19% Noninterest income excluding non-operating income 46,697 48,510 60,247 55,257 52,346 (2,911) -5% Gain (Loss) on Sale of Investments, Net 164 389 904 280 7 (273) -97% Other Non-operating income 211 - 362 1,941 150 (1,791) -92% Total Non-interest Income 47,072$ 48,899$ 61,513$ 57,478$ 52,503$ (4,975)$ -9% 4Q15 vs. 3Q15 Operating non-interest income decreased $2.9 million, or -5%, from 3Q15: Mortgage income decreased $3.6 million, or -17% Decreased title revenues of $1.2 million, or -18% Increased COLI income of $1.4 million (partially offset by COLI expense of $1.2 million) Total non-operating items in 4Q15 of $0.2 million • Gain on sale of investments decreased $0.3 million • Other non-operating income down $1.8 million

30 • Mortgage non-interest income of $17.1 million is $3.6 million lower than 3Q15 driven by: • Market value adjustments increased $0.1 million in 4Q15 as compared to 3Q15 • $5.2 million lower gains on lower sales volume (-20%) in 4Q15 • Hedging costs decreased $1.7 million in 4Q15 vs 3Q15 • Volumes sold were $597 million (18% lower than in 3Q15) M o r t g a g e – I n c o m e D r i v e r s
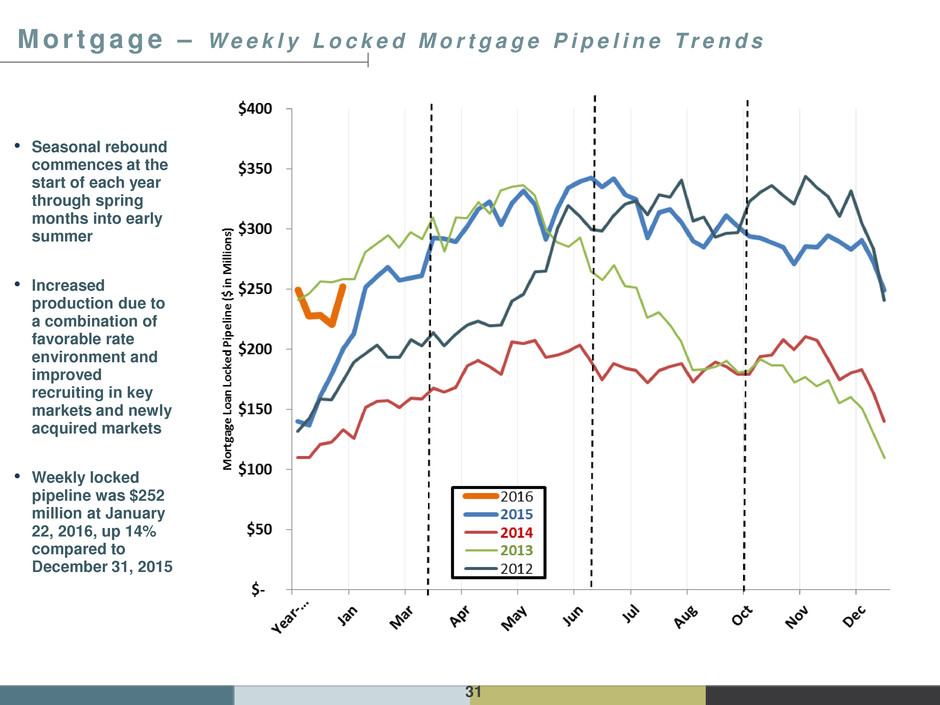
31 M o r t g a g e – W e e k l y L o c k e d M o r t g a g e P i p e l i n e T r e n d s • Seasonal rebound commences at the start of each year through spring months into early summer • Increased production due to a combination of favorable rate environment and improved recruiting in key markets and newly acquired markets • Weekly locked pipeline was $252 million at January 22, 2016, up 14% compared to December 31, 2015
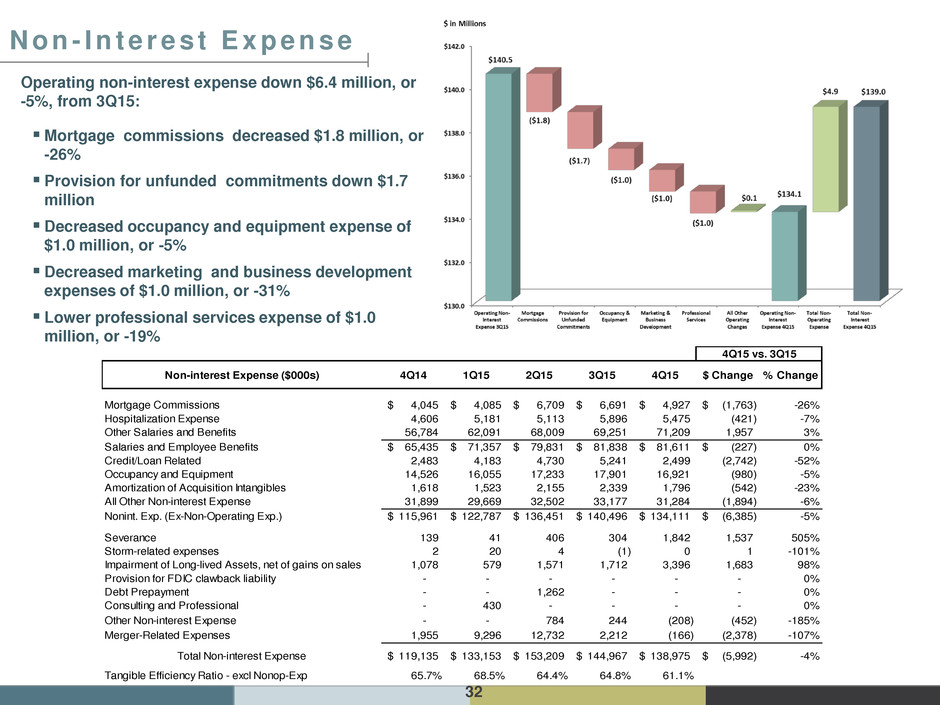
32 N o n - I n t e r e s t E x p e n s e Non-interest Expense ($000s) 4Q14 1Q15 2Q15 3Q15 4Q15 $ Change % Change Mortgage Commissions 4,045$ 4,085$ 6,709$ 6,691$ 4,927$ (1,763)$ -26% Hospitalization Expense 4,606 5,181 5,113 5,896 5,475 (421) -7% Other Salaries and Benefits 56,784 62,091 68,009 69,251 71,209 1,957 3% Salaries and Employee Benefits 65,435$ 71,357$ 79,831$ 81,838$ 81,611$ (227)$ 0% Credit/Loan Related 2,483 4,183 4,730 5,241 2,499 (2,742) -52% Occupancy and Equipment 14,526 16,055 17,233 17,901 16,921 (980) -5% Amortization of Acquisition Intangibles 1,618 1,523 2,155 2,339 1,796 (542) -23% All Other Non-interest Expense 31,899 29,669 32,502 33,177 31,284 (1,894) -6% Nonint. Exp. (Ex-Non-Operating Exp.) 115,961$ 122,787$ 136,451$ 140,496$ 134,111$ (6,385)$ -5% Severance 139 41 406 304 1,842 1,537 505% Storm-related expenses 2 20 4 (1) 0 1 -101% Im airment of Long-lived Assets, net of gains on sales 1,078 579 1,571 1,712 3,396 1,683 98% Provision for FDIC clawback liability - - - - - - 0% Debt Prepayment - - 1,262 - - - 0% Consulting and Professional - 430 - - - - 0% Other Non-interest Expense - - 784 244 (208) (452) -185% Merger-Related Expenses 1,955 9,296 12,732 2,212 (166) (2,378) -107% Total Non-interest Expense 119,135$ 133,153$ 153,209$ 144,967$ 138,975$ (5,992)$ -4% Tangible Efficiency Ratio - excl Nonop-Exp 65.7% 68.5% 64.4% 64.8% 61.1% 4Q15 vs. 3Q15 Operating non-interest expense down $6.4 million, or -5%, from 3Q15: Mortgage commissions decreased $1.8 million, or -26% Provision for unfunded commitments down $1.7 million Decreased occupancy and equipment expense of $1.0 million, or -5% Decreased marketing and business development expenses of $1.0 million, or -31% Lower professional services expense of $1.0 million, or -19%
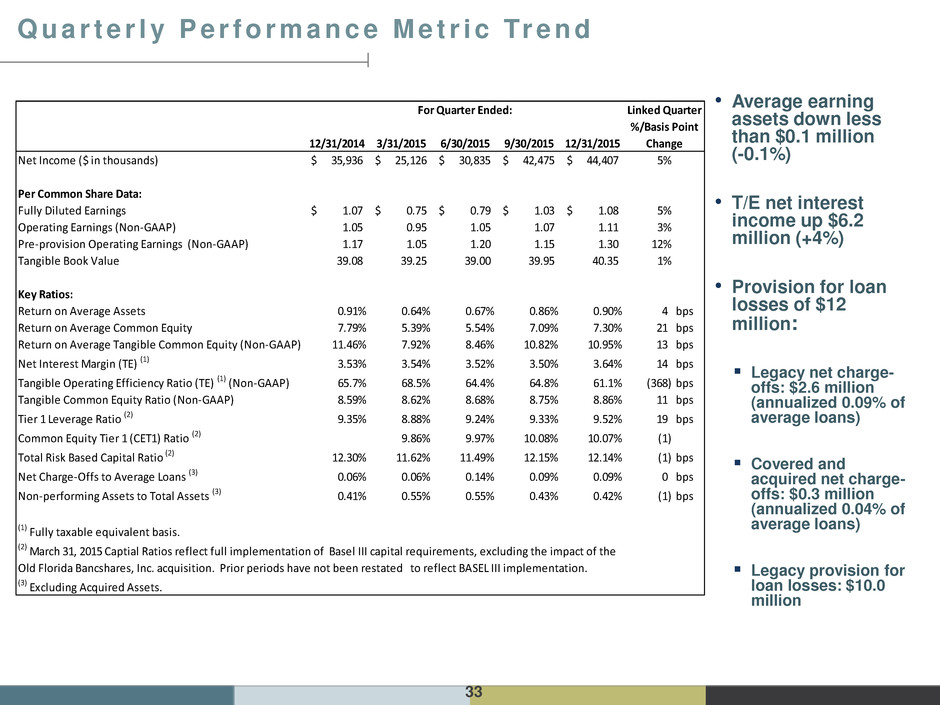
33 Q u a r t e r l y P e r f o r m a n c e M e t r i c Tr e n d • Average earning assets down less than $0.1 million (-0.1%) • T/E net interest income up $6.2 million (+4%) • Provision for loan losses of $12 million: Legacy net charge- offs: $2.6 million (annualized 0.09% of average loans) Covered and acquired net charge- offs: $0.3 million (annualized 0.04% of average loans) Legacy provision for loan losses: $10.0 million 12/31/2014 3/31/2015 6/30/2015 9/30/2015 12/31/2015 Net Income ($ in thousands) 35,936$ 25,126$ 30,835$ 42,475$ 44,407$ 5% Per Common Share Data: Fully Diluted Earnings 1.07$ 0.75$ 0.79$ 1.03$ 1.08$ 5% Operating Earnings (Non-GAAP) 1.05 0.95 1.05 1.07 1.11 3% Pre-provision Operating Earnings (Non-GAAP) 1.17 1.05 1.20 1.15 1.30 12% Tangible Book Value 39.08 39.25 39.00 39.95 40.35 1% Key Ratios: Return on Average Assets 0.91% 0.64% 0.67% 0.86% 0.90% 4 bps Return on Average Common Equity 7.79% 5.39% 5.54% 7.09% 7.30% 21 bps Return on Average Tangible Common Equity (Non-GAAP) 11.46% 7.92% 8.46% 10.82% 10.95% 13 bps Net Interest Margin (TE) (1) 3.53% 3.54% 3.52% 3.50% 3.64% 14 bps Tangible Operating Efficiency Ratio (TE) (1) (Non-GAAP) 65.7% 68.5% 64.4% 64.8% 61.1% (368) bps Tangible Common Equity Ratio (Non-GAAP) 8.59% 8.62% 8.68% 8.75% 8.86% 11 bps Tier 1 Leverage Ratio (2) 9.35% 8.88% 9.24% 9.33% 9.52% 19 bps Common Equity Tier 1 (CET1) Ratio (2) 9.86% 9.97% 10.08% 10.07% (1) Total Risk Based Capital Ratio (2) 12.30% 11.62% 11.49% 12.15% 12.14% (1) bps Net Charge-Offs to Average Loans (3) 0.06% 0.06% 0.14% 0.09% 0.09% 0 bps Non-performing Assets to Total Assets (3) 0.41% 0.55% 0.55% 0.43% 0.42% (1) bps (1) Fully taxable equivalent basis. (2) March 31, 2015 Captial Ratios reflect full implementation of Basel III capital requirements, excluding the impact of the Old Florida Bancshares, Inc. acquisition. Prior periods have not been restated to reflect BASEL III implementation. (3) Excluding Acquired Assets. Linked Quarter %/Basis Point Change For Quarter Ended:

34 Q u a r t e r l y P e r f o r m a n c e M e t r i c s – Y i e l d s A n d C o s t s 12/31/2015 9/30/2015 Investment Securities 2.21 % 2.16 % 5 bps Legacy Loans, net 3.92 3.90 2 bps Acquired Loans, net 5.97 5.59 38 bps Loans & Loss Share Receivable 4.44 4.36 8 bps Mortgage Loans Held For Sale 3.35 3.68 (33) bps Other Earning Assets 1.06 0.62 44 bps Total Earning Assets 3.99 3.86 13 bps Interest-bearing Deposits 0.43 0.43 0 bps Short-Term Borrowings 0.16 0.17 (1) bps Long-Term Borrowings 3.02 2.99 3 bps Total Interest-bearing Liabilities 0.49 0.50 (1) bps Net Interest Spread 3.50 3.36 14 bps Net Interest Margin (TE) 3.64 3.50 14 bps (1) Earning asset yields are shown on a fully taxable-equivalent basis. For Quarter Ended: Linked Quarter Basis Point Change
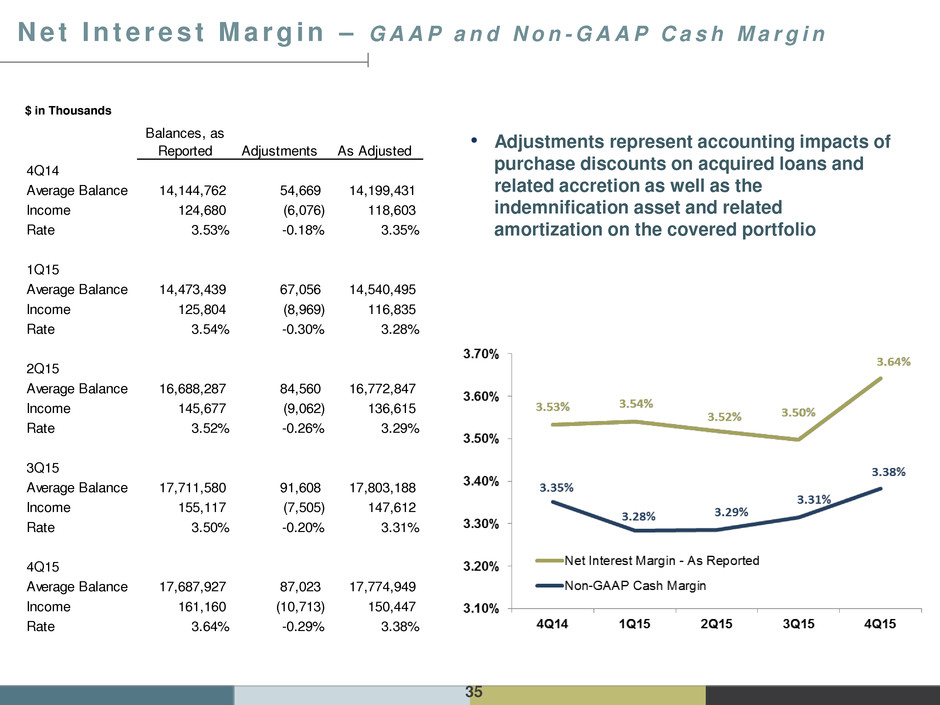
35 N e t I n t e r e s t M a r g i n – G A A P a n d N o n - G A A P C a s h M a r g i n • Adjustments represent accounting impacts of purchase discounts on acquired loans and related accretion as well as the indemnification asset and related amortization on the covered portfolio $ in Thousands Balances, as Reported Adjustments As Adjusted 4Q14 Average Balance 14,144,762 54,669 14,199,431 Income 124,680 (6,076) 118,603 Rate 3.53% -0.18% 3.35% 1Q15 Average Balance 14,473,439 67,056 14,540,495 Income 125,804 (8,969) 116,835 Rate 3.54% -0.30% 3.28% 2Q15 Average Balance 16,688,287 84,560 16,772,847 Income 145,677 (9,062) 136,615 Rate 3.52% -0.26% 3.29% 3Q15 Average Balance 17,711,580 91,608 17,803,188 Income 155,117 (7,505) 147,612 Rate 3.50% -0.20% 3.31% 4Q15 Average Balance 17,687,927 87,023 17,774,949 Income 161,160 (10,713) 150,447 Rate 3.64% -0.29% 3.38%
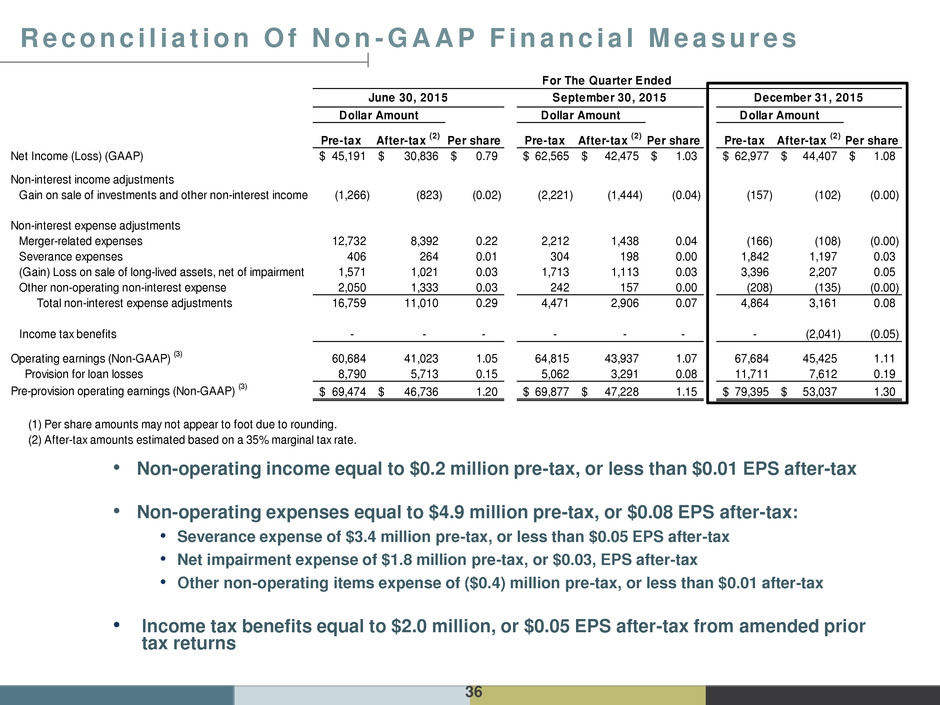
36 Pre-tax After-tax (2) Per share Pre-tax After-tax (2) Per share Pre-tax After-tax (2) Per share Net Income (Loss) (GAAP) 45,191$ 30,836$ 0.79$ 62,565$ 42,475$ 1.03$ 62,977$ 44,407$ 1.08$ Non-interest income adjustments Gain on sale of investments and other non-interest income (1,266) (823) (0.02) (2,221) (1,444) (0.04) (157) (102) (0.00) Non-interest expense adjustments Merger-related expenses 12,732 8,392 0.22 2,212 1,438 0.04 (166) (108) (0.00) Severance expenses 406 264 0.01 304 198 0.00 1,842 1,197 0.03 (Gain) Loss on sale of long-lived assets, net of impairment 1,571 1,021 0.03 1,713 1,113 0.03 3,396 2,207 0.05 Other non-operating non-interest expense 2,050 1,333 0.03 242 157 0.00 (208) (135) (0.00) Total non-interest expense adjustments 16,759 11,010 0.29 4,471 2,906 0.07 4,864 3,161 0.08 Income tax benefits - - - - - - - (2,041) (0.05) Operating earnings (Non-GAAP) (3) 60,684 41,023 1.05 64,815 43,937 1.07 67,684 45,425 1.11 Provision for loan losses 8,790 5,713 0.15 5,062 3,291 0.08 11,711 7,612 0.19 Pre-provision operating earnings (Non-GAAP) (3) 69,474$ 46,736$ 1.20 69,877$ 47,228$ 1.15 79,395$ 53,037$ 1.30 (1) Per share amounts may not appear to foot due to rounding. (2) After-tax amounts estimated based on a 35% marginal tax rate. For The Quarter Ended June 30, 2015 September 30, 2015 December 31, 2015 Dollar Amount Dollar Amount Dollar Amount R e c o n c i l i a t i o n O f N o n - G A A P F i n a n c i a l M e a s u r e s • Non-operating income equal to $0.2 million pre-tax, or less than $0.01 EPS after-tax • Non-operating expenses equal to $4.9 million pre-tax, or $0.08 EPS after-tax: • Severance expense of $3.4 million pre-tax, or less than $0.05 EPS after-tax • Net impairment expense of $1.8 million pre-tax, or $0.03, EPS after-tax • Other non-operating items expense of ($0.4) million pre-tax, or less than $0.01 after-tax • Income tax benefits equal to $2.0 million, or $0.05 EPS after-tax from amended prior tax returns
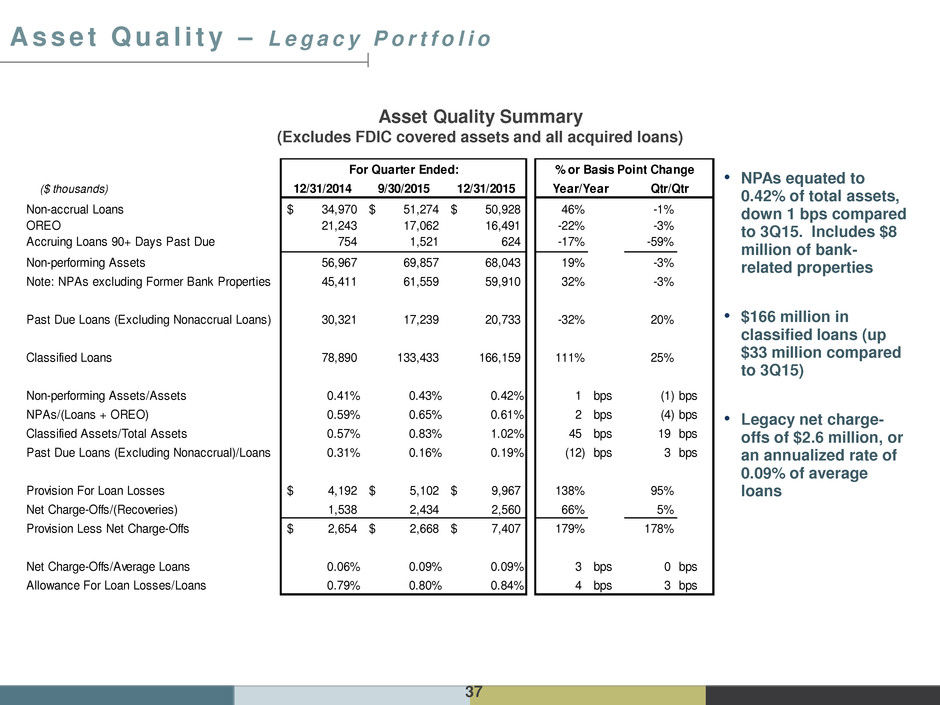
37 A s s e t Q u a l i t y – L e g a c y P o r t f o l i o Asset Quality Summary (Excludes FDIC covered assets and all acquired loans) • NPAs equated to 0.42% of total assets, down 1 bps compared to 3Q15. Includes $8 million of bank- related properties • $166 million in classified loans (up $33 million compared to 3Q15) • Legacy net charge- offs of $2.6 million, or an annualized rate of 0.09% of average loans ($ thousands) 12/31/2014 9/30/2015 12/31/2015 Non-accrual Loans 34,970$ 51,274$ 50,928$ 46% -1% OREO 21,243 17,062 16,491 -22% -3% Accruing Loans 90+ Days Past Due 754 1,521 624 -17% -59% Non-performing Assets 56,967 69,857 68,043 19% -3% Note: NPAs excluding Former Bank Properties 45,411 61,559 59,910 32% -3% Past Due Loans (Excluding Nonaccrual Loans) 30,321 17,239 20,733 -32% 20% Classified Loans 78,890 133,433 166,159 111% 25% Non-performing Assets/Assets 0.41% 0.43% 0.42% 1 bps (1) bps NPAs/(Loans + OREO) 0.59% 0.65% 0.61% 2 bps (4) bps Classified Assets/Total Assets 0.57% 0.83% 1.02% 45 bps 19 bps Past Due Loans (Excluding Nonaccrual)/Loans 0.31% 0.16% 0.19% (12) bps 3 bps Provision For Loan Losses 4,192$ 5,102$ 9,967$ 138% 95% Net Charge-Offs/(Recoveries) 1,538 2,434 2,560 66% 5% Provision Less Net Charge-Offs 2,654$ 2,668$ 7,407$ 179% 178% Net Charge-Offs/Av rage Loans 0.06% 0.09% 0.09% 3 bps 0 bps Allowance For Loan Losses/Loans 0.79% 0.80% 0.84% 4 bps 3 bps For Quarter Ended: % or Basis Point Change Year/Year Qtr/Qtr
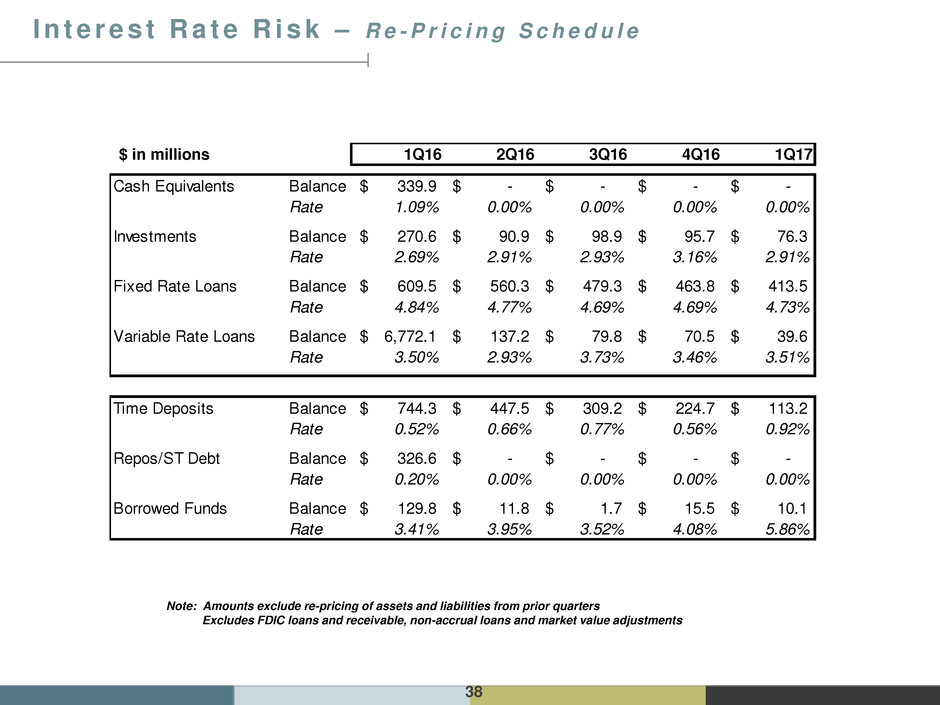
38 I n t e r e s t R a t e R i s k – R e - P r i c i n g S c h e d u l e $ in millions Note: Amounts exclude re-pricing of assets and liabilities from prior quarters Excludes FDIC loans and receivable, non-accrual loans and market value adjustments 1Q16 2Q16 3Q16 4Q16 1Q17 Cash Equivalents Balance 339.9$ -$ -$ -$ -$ Rate 1.09% 0.00% 0.00% 0.00% 0.00% Investments Balance 270.6$ 90.9$ 98.9$ 95.7$ 76.3$ Rate 2.69% 2.91% 2.93% 3.16% 2.91% Fixed Rate Loans Balance 609.5$ 560.3$ 479.3$ 463.8$ 413.5$ Rate 4.84% 4.77% 4.69% 4.69% 4.73% Variable Rate Loans Balance 6,772.1$ 137.2$ 79.8$ 70.5$ 39.6$ Rate 3.50% 2.93% 3.73% 3.46% 3.51% Time Deposits Balance 744.3$ 447.5$ 309.2$ 224.7$ 113.2$ Rate 0.52% 0.66% 0.77% 0.56% 0.92% Repos/ST Debt Balance 326.6$ -$ -$ -$ -$ Rate 0.20% 0.00% 0.00% 0.00% 0.00% Borrowed Funds Balance 129.8$ 11.8$ 1.7$ 15.5$ 10.1$ Rate 3.41% 3.95% 3.52% 4.08% 5.86%
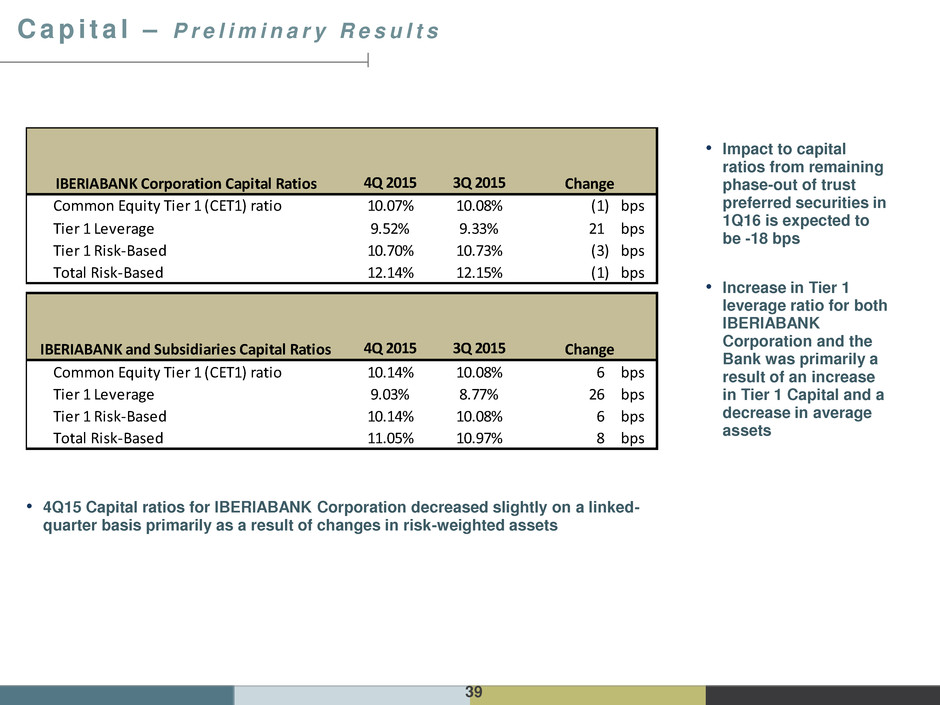
39 C a p i t a l – P r e l i m i n a r y R e s u l t s • Impact to capital ratios from remaining phase-out of trust preferred securities in 1Q16 is expected to be -18 bps • Increase in Tier 1 leverage ratio for both IBERIABANK Corporation and the Bank was primarily a result of an increase in Tier 1 Capital and a decrease in average assets • 4Q15 Capital ratios for IBERIABANK Corporation decreased slightly on a linked- quarter basis primarily as a result of changes in risk-weighted assets 4Q 2015 3Q 2015 Common Equity Tier 1 (CET1) ratio 10.07% 10.08% (1) bps Tier 1 Leverage 9.52% 9.33% 21 bps Tier 1 Risk-Based 10.70% 10.73% (3) bps Total Risk-Based 12.14% 12.15% (1) bps 4Q 2015 3Q 2015 Common Equity Tier 1 (CET1) ratio 10.14% 10.08% 6 bps Tier 1 Leverag 9.03% 8.77% 26 bps Tier 1 Risk-Based 10.14% 10.08% 6 bps Total Risk-Bas d 11.05% 10.97% 8 bps IBERIABANK Corporation Capital Ratios IBERIABANK and Subsidiaries Capital Ratios Change Change


