Sabadell United Bank, N.A. Consolidated Interim Financial Statements Six months ended June 30, 2017 and 2016 (unaudited)
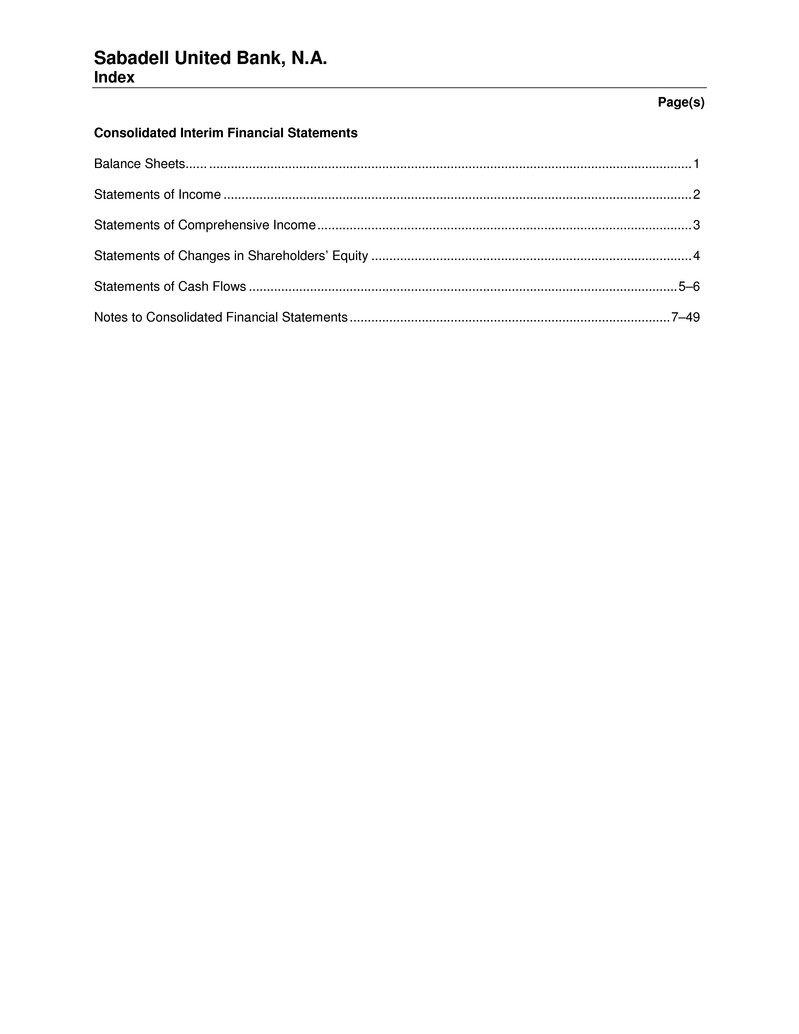
Sabadell United Bank, N.A. Index Page(s) Consolidated Interim Financial Statements Balance Sheets...... ...................................................................................................................................... 1 Statements of Income .................................................................................................................................. 2 Statements of Comprehensive Income ........................................................................................................ 3 Statements of Changes in Shareholders’ Equity ......................................................................................... 4 Statements of Cash Flows ....................................................................................................................... 5–6 Notes to Consolidated Financial Statements ......................................................................................... 7–49
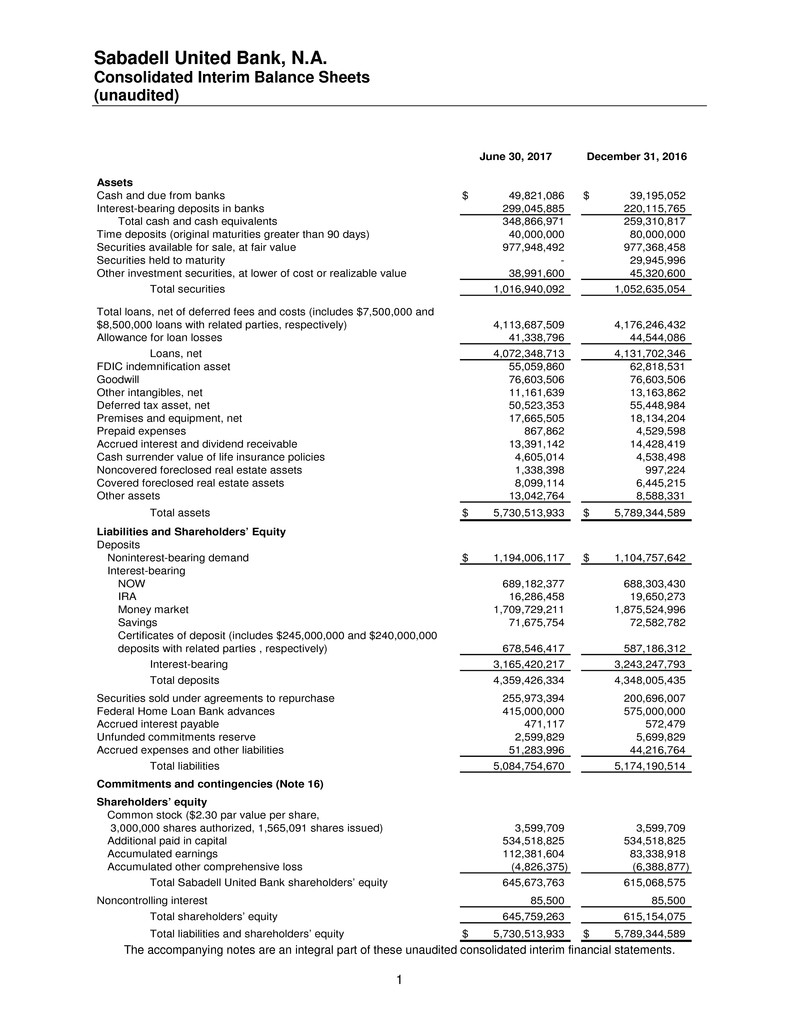
Sabadell United Bank, N.A. Consolidated Interim Balance Sheets (unaudited) The accompanying notes are an integral part of these unaudited consolidated interim financial statements. 1 June 30, 2017 December 31, 2016 Assets Cash and due from banks 49,821,086$ 39,195,052$ Interest-bearing deposits in banks 299,045,885 220,115,765 Total cash and cash equivalents 348,866,971 259,310,817 Time deposits (original maturities greater than 90 days) 40,000,000 80,000,000 Securities available for sale, at fair value 977,948,492 977,368,458 Securities held to maturity - 29,945,996 Other investment securities, at lower of cost or realizable value 38,991,600 45,320,600 Total securities 1,016,940,092 1,052,635,054 4,113,687,509 4,176,246,432 Allowance for loan losses 41,338,796 44,544,086 Loans, net 4,072,348,713 4,131,702,346 FDIC indemnification asset 55,059,860 62,818,531 Goodwill 76,603,506 76,603,506 Other intangibles, net 11,161,639 13,163,862 Deferred tax asset, net 50,523,353 55,448,984 Premises and equipment, net 17,665,505 18,134,204 Prepaid expenses 867,862 4,529,598 Accrued interest and dividend receivable 13,391,142 14,428,419 Cash surrender value of life insurance policies 4,605,014 4,538,498 Noncovered foreclosed real estate assets 1,338,398 997,224 Covered foreclosed real estate assets 8,099,114 6,445,215 Other assets 13,042,764 8,588,331 Total assets 5,730,513,933$ 5,789,344,589$ Liabilities and Shareholders’ Equity Deposits Noninterest-bearing demand 1,194,006,117$ 1,104,757,642$ Interest-bearing NOW 689,182,377 688,303,430 IRA 16,286,458 19,650,273 Money market 1,709,729,211 1,875,524,996 Savings 71,675,754 72,582,782 678,546,417 587,186,312 Interest-bearing 3,165,420,217 3,243,247,793 Total deposits 4,359,426,334 4,348,005,435 Securities sold under agreements to repurchase 255,973,394 200,696,007 Federal Home Loan Bank advances 415,000,000 575,000,000 Accrued interest payable 471,117 572,479 Unfunded commitments reserve 2,599,829 5,699,829 Accrued expenses and other liabilities 51,283,996 44,216,764 Total liabilities 5,084,754,670 5,174,190,514 Commitments and contingencies (Note 16) Shareholders’ equity Common stock ($2.30 par value per share, 3,000,000 shares authorized, 1,565,091 shares issued) 3,599,709 3,599,709 Additional paid in capital 534,518,825 534,518,825 Accumulated earnings 112,381,604 83,338,918 Accumulated other comprehensive loss (4,826,375) (6,388,877) Total Sabadell United Bank shareholders’ equity 645,673,763 615,068,575 Noncontrolling interest 85,500 85,500 Total shareholders’ equity 645,759,263 615,154,075 Total liabilities and shareholders’ equity 5,730,513,933$ 5,789,344,589$ Total loans, net of deferred fees and costs (includes $7,500,000 and $8,500,000 loans with related parties, respectively) Certificates of deposit (includes $245,000,000 and $240,000,000 deposits with related parties , respectively)
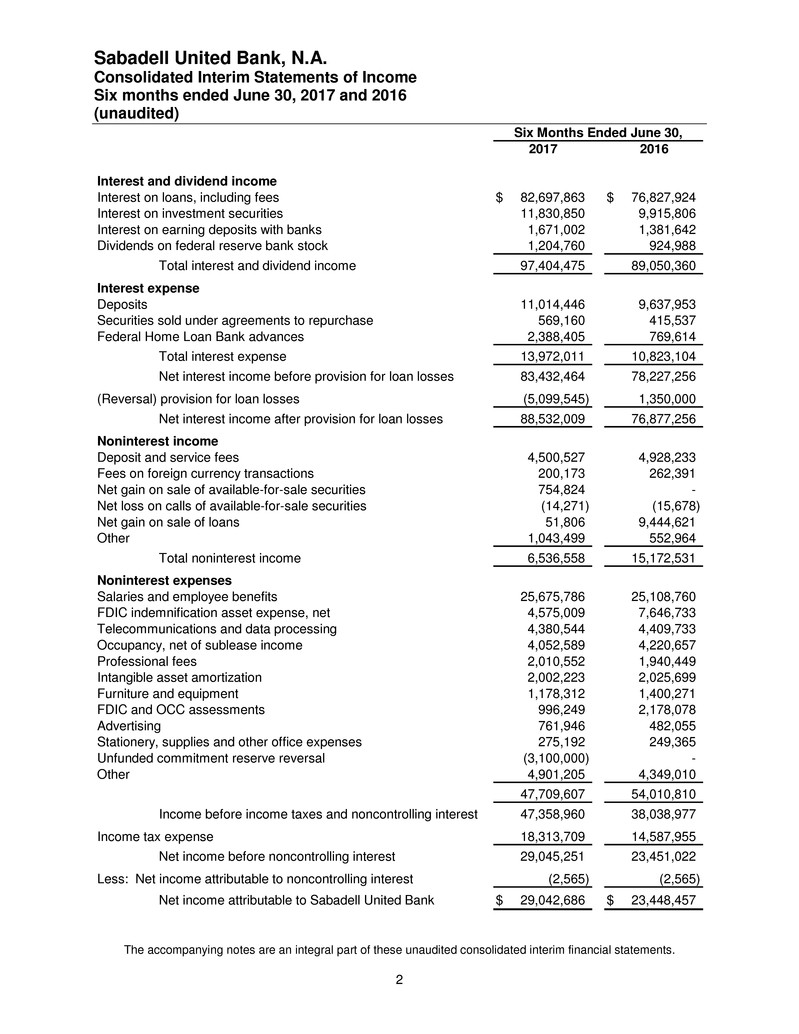
Sabadell United Bank, N.A. Consolidated Interim Statements of Income Six months ended June 30, 2017 and 2016 (unaudited) The accompanying notes are an integral part of these unaudited consolidated interim financial statements. 2 2017 2016 Interest and dividend income Interest on loans, including fees 82,697,863$ 76,827,924$ Interest on investment securities 11,830,850 9,915,806 Interest on earning deposits with banks 1,671,002 1,381,642 Dividends on federal reserve bank stock 1,204,760 924,988 Total interest and dividend income 97,404,475 89,050,360 Interest expense Deposits 11,014,446 9,637,953 Securities sold under agreements to repurchase 569,160 415,537 Federal Home Loan Bank advances 2,388,405 769,614 Total interest expense 13,972,011 10,823,104 Net interest income before provision for loan losses 83,432,464 78,227,256 (Reversal) provision for loan losses (5,099,545) 1,350,000 Net interest income after provision for loan losses 88,532,009 76,877,256 Noninterest income Deposit and service fees 4,500,527 4,928,233 Fees on foreign currency transactions 200,173 262,391 Net gain on sale of available-for-sale securities 754,824 - Net loss on calls of available-for-sale securities (14,271) (15,678) Net gain on sale of loans 51,806 9,444,621 Other 1,043,499 552,964 Total noninterest income 6,536,558 15,172,531 Noninterest expenses Salaries and employee benefits 25,675,786 25,108,760 FDIC indemnification asset expense, net 4,575,009 7,646,733 Telecommunications and data processing 4,380,544 4,409,733 Occupancy, net of sublease income 4,052,589 4,220,657 Professional fees 2,010,552 1,940,449 Intangible asset amortization 2,002,223 2,025,699 Furniture and equipment 1,178,312 1,400,271 FDIC and OCC assessments 996,249 2,178,078 Advertising 761,946 482,055 Stationery, supplies and other office expenses 275,192 249,365 Unfunded commitment reserve reversal (3,100,000) - Other 4,901,205 4,349,010 47,709,607 54,010,810 Income before income taxes and noncontrolling interest 47,358,960 38,038,977 Income tax expense 18,313,709 14,587,955 Net income before noncontrolling interest 29,045,251 23,451,022 Less: Net income attributable to noncontrolling interest (2,565) (2,565) Net income attributable to Sabadell United Bank 29,042,686$ 23,448,457$ Six Months Ended June 30,
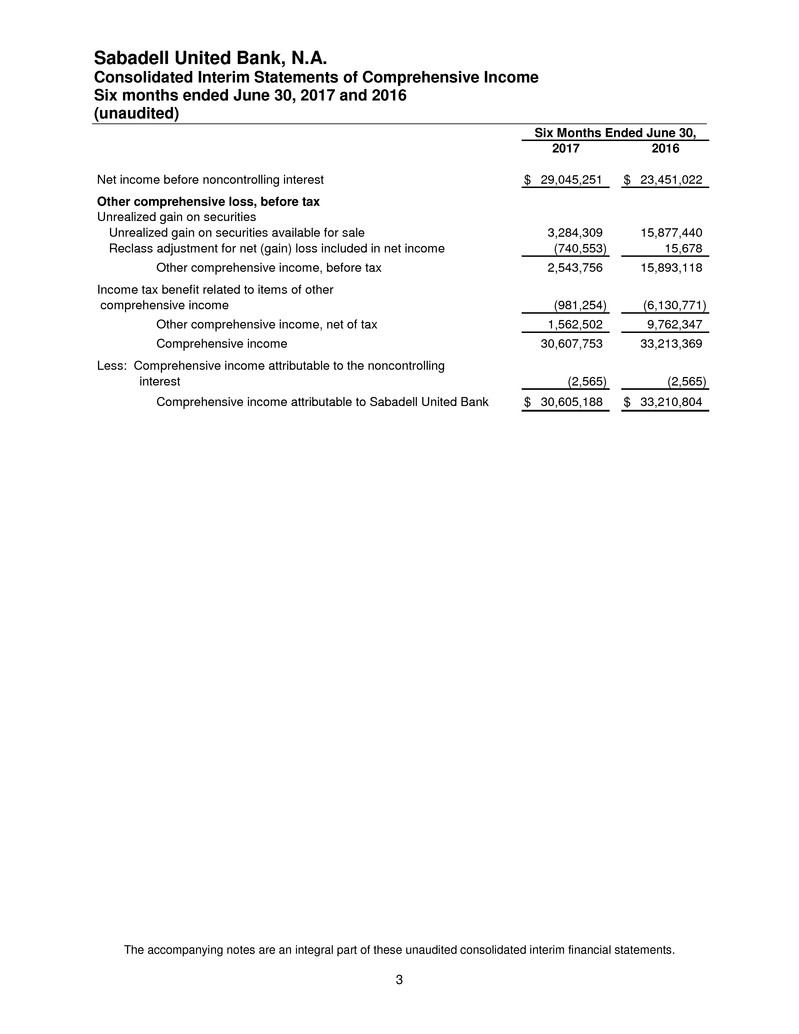
Sabadell United Bank, N.A. Consolidated Interim Statements of Comprehensive Income Six months ended June 30, 2017 and 2016 (unaudited) The accompanying notes are an integral part of these unaudited consolidated interim financial statements. 3 2017 2016 Net income before noncontrolling interest 29,045,251$ 23,451,022$ Other comprehensive loss, before tax Unrealized gain on securities Unrealized gain on securities available for sale 3,284,309 15,877,440 Reclass adjustment for net (gain) loss included in net income (740,553) 15,678 Other comprehensive income, before tax 2,543,756 15,893,118 Income tax benefit related to items of other comprehensive income (981,254) (6,130,771) Other comprehensive income, net of tax 1,562,502 9,762,347 Comprehensive income 30,607,753 33,213,369 Less: Comprehensive income attributable to the noncontrolling interest (2,565) (2,565) Comprehensive income attributable to Sabadell United Bank 30,605,188$ 33,210,804$ Six Months Ended June 30,

Sabadell United Bank, N.A. Consolidated Interim Statements of Changes in Shareholders’ Equity Six months ended June 30, 2017 and 2016 (unaudited) The accompanying notes are an integral part of these unaudited consolidated interim financial statements. 4 Accumulated Total Capital in Accumulated Other Sabadell Total Number of Par Excess of Earnings Comprehensive Shareholders’ Noncontrolling Shareholders’ Shares Value Par Value Income (Loss) Equity Interest Equity Balances at December 31, 2015 1,565,091 3,599,709$ 534,518,825$ 34,832,584$ (1,970,900)$ 570,980,218$ 93,000$ 571,073,218$ Net income - - - 23,448,457 - 23,448,457 2,565 23,451,022 REIT preferred stock dividend - - - - - - (2,565) (2,565) Net change in other comprehensive loss - - - 9,762,347 9,762,347 - 9,762,347 Balances at June 30, 2016 1,565,091 3,599,709$ 534,518,825$ 58,281,041$ 7,791,447$ 604,191,022$ 93,000$ 604,284,022$ Balances at December 31, 2016 1,565,091 3,599,709$ 534,518,825$ 83,338,918$ (6,388,877)$ 615,068,575$ 85,500$ 615,154,075$ Net income - - - 29,042,686 - 29,042,686 2,565 29,045,251 REIT preferred stock dividend - - - - - - (2,565) (2,565) Net change in other comprehensive loss - - - - 1,562,502 1,562,502 - 1,562,502 Balances at June 30, 2017 1,565,091 3,599,709$ 534,518,825$ 112,381,604$ (4,826,375)$ 645,673,763$ 85,500$ 645,759,263$ Common Stock
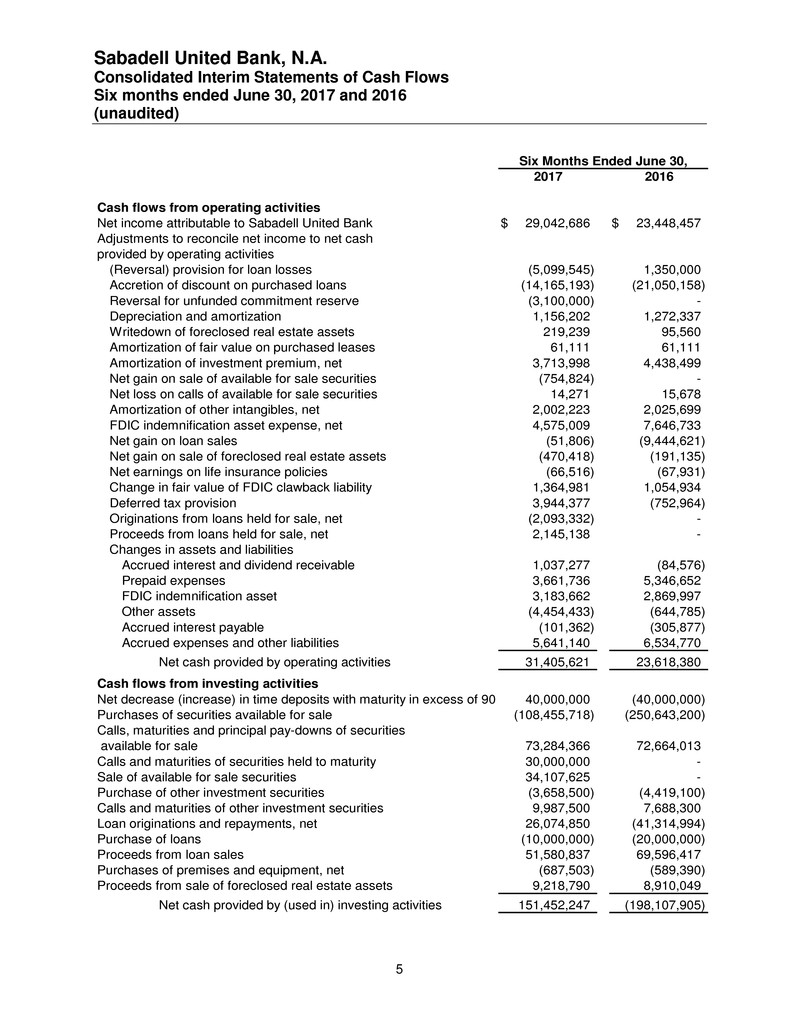
Sabadell United Bank, N.A. Consolidated Interim Statements of Cash Flows Six months ended June 30, 2017 and 2016 (unaudited) 5 2017 2016 Cash flows from operating activities Net income attributable to Sabadell United Bank 29,042,686$ 23,448,457$ Adjustments to reconcile net income to net cash provided by operating activities (Reversal) provision for loan losses (5,099,545) 1,350,000 Accretion of discount on purchased loans (14,165,193) (21,050,158) Reversal for unfunded commitment reserve (3,100,000) - Depreciation and amortization 1,156,202 1,272,337 Writedown of foreclosed real estate assets 219,239 95,560 Amortization of fair value on purchased leases 61,111 61,111 Amortization of investment premium, net 3,713,998 4,438,499 Net gain on sale of available for sale securities (754,824) - Net loss on calls of available for sale securities 14,271 15,678 Amortization of other intangibles, net 2,002,223 2,025,699 FDIC indemnification asset expense, net 4,575,009 7,646,733 Net gain on loan sales (51,806) (9,444,621) Net gain on sale of foreclosed real estate assets (470,418) (191,135) Net earnings on life insurance policies (66,516) (67,931) Change in fair value of FDIC clawback liability 1,364,981 1,054,934 Deferred tax provision 3,944,377 (752,964) Originations from loans held for sale, net (2,093,332) - Proceeds from loans held for sale, net 2,145,138 - Changes in assets and liabilities Accrued interest and dividend receivable 1,037,277 (84,576) Prepaid expenses 3,661,736 5,346,652 FDIC indemnification asset 3,183,662 2,869,997 Other assets (4,454,433) (644,785) Accrued interest payable (101,362) (305,877) Accrued expenses and other liabilities 5,641,140 6,534,770 Net cash provided by operating activities 31,405,621 23,618,380 Cash flows from investing activities Net decrease (increase) in time deposits with maturity in excess of 90 days40,000,000 (40,000,000) Purchases of securities available for sale (108,455,718) (250,643,200) Calls, maturities and principal pay-downs of securities available for sale 73,284,366 72,664,013 Calls and maturities of securities held to maturity 30,000,000 - Sale of available for sale securities 34,107,625 - Purchase of other investment securities (3,658,500) (4,419,100) Calls and maturities of other investment securities 9,987,500 7,688,300 Loan originations and repayments, net 26,074,850 (41,314,994) Purchase of loans (10,000,000) (20,000,000) Proceeds from loan sales 51,580,837 69,596,417 Purchases of premises and equipment, net (687,503) (589,390) Proceeds from sale of foreclosed real estate assets 9,218,790 8,910,049 Net cash provided by (used in) investing activities 151,452,247 (198,107,905) Six Months Ended June 30,
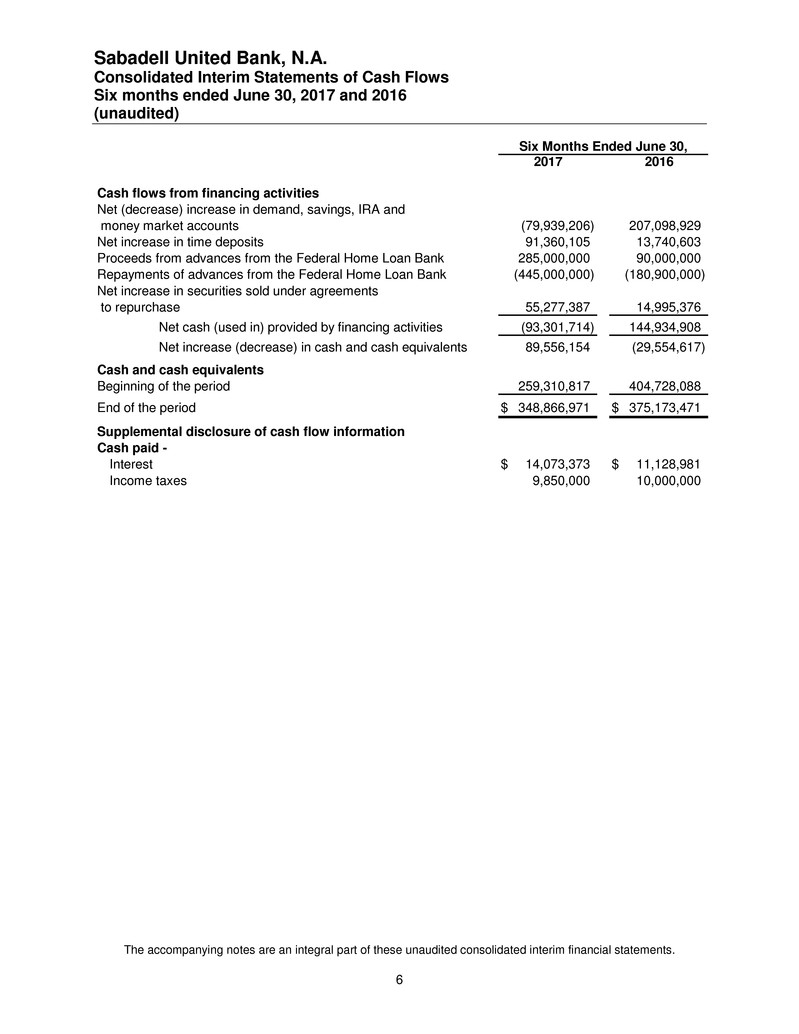
Sabadell United Bank, N.A. Consolidated Interim Statements of Cash Flows Six months ended June 30, 2017 and 2016 (unaudited) The accompanying notes are an integral part of these unaudited consolidated interim financial statements. 6 2017 2016 Cash flows from financing activities Net (decrease) increase in demand, savings, IRA and money market accounts (79,939,206) 207,098,929 Net increase in time deposits 91,360,105 13,740,603 Proceeds from advances from the Federal Home Loan Bank 285,000,000 90,000,000 Repayments of advances from the Federal Home Loan Bank (445,000,000) (180,900,000) Net increase in securities sold under agreements to repurchase 55,277,387 14,995,376 Net cash (used in) provided by financing activities (93,301,714) 144,934,908 Net increase (decrease) in cash and cash equivalents 89,556,154 (29,554,617) Cash and cash equivalents Beginning of the period 259,310,817 404,728,088 End of the period 348,866,971$ 375,173,471$ Supplemental disclosure of cash flow information Cash paid - Interest 14,073,373$ 11,128,981$ Income taxes 9,850,000 10,000,000 Six Months Ended June 30,
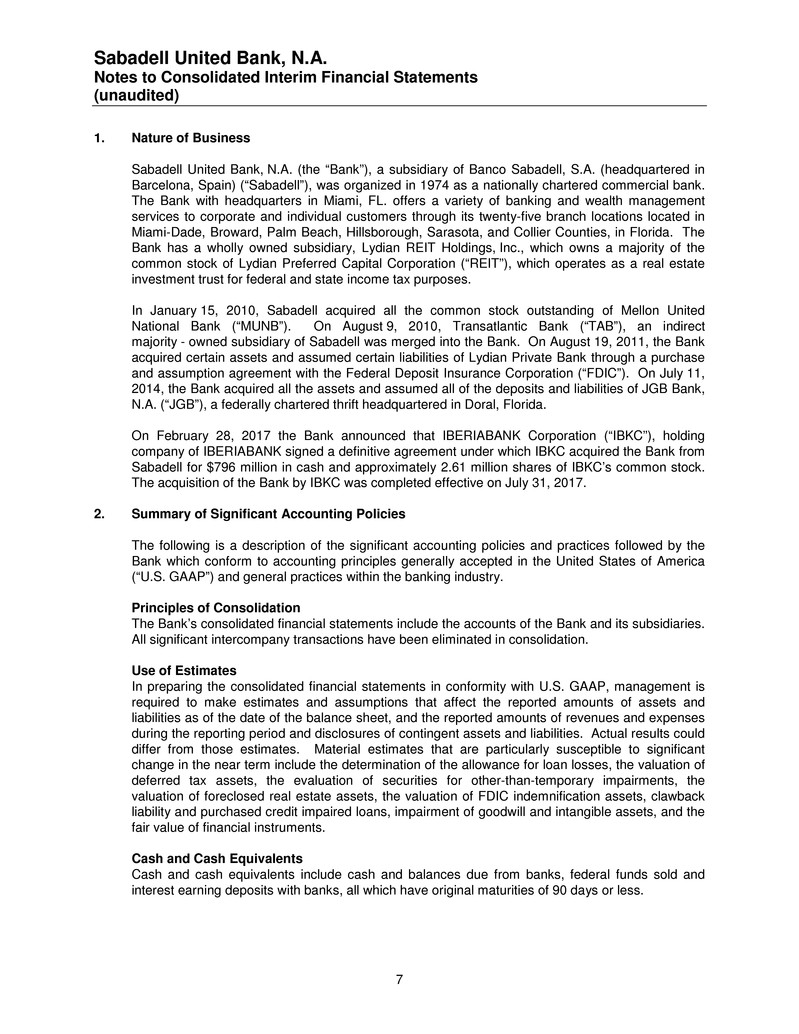
Sabadell United Bank, N.A. Notes to Consolidated Interim Financial Statements (unaudited) 7 1. Nature of Business Sabadell United Bank, N.A. (the “Bank”), a subsidiary of Banco Sabadell, S.A. (headquartered in Barcelona, Spain) (“Sabadell”), was organized in 1974 as a nationally chartered commercial bank. The Bank with headquarters in Miami, FL. offers a variety of banking and wealth management services to corporate and individual customers through its twenty-five branch locations located in Miami-Dade, Broward, Palm Beach, Hillsborough, Sarasota, and Collier Counties, in Florida. The Bank has a wholly owned subsidiary, Lydian REIT Holdings, Inc., which owns a majority of the common stock of Lydian Preferred Capital Corporation (“REIT”), which operates as a real estate investment trust for federal and state income tax purposes. In January 15, 2010, Sabadell acquired all the common stock outstanding of Mellon United National Bank (“MUNB”). On August 9, 2010, Transatlantic Bank (“TAB”), an indirect majority - owned subsidiary of Sabadell was merged into the Bank. On August 19, 2011, the Bank acquired certain assets and assumed certain liabilities of Lydian Private Bank through a purchase and assumption agreement with the Federal Deposit Insurance Corporation (“FDIC”). On July 11, 2014, the Bank acquired all the assets and assumed all of the deposits and liabilities of JGB Bank, N.A. (“JGB”), a federally chartered thrift headquartered in Doral, Florida. On February 28, 2017 the Bank announced that IBERIABANK Corporation (“IBKC”), holding company of IBERIABANK signed a definitive agreement under which IBKC acquired the Bank from Sabadell for $796 million in cash and approximately 2.61 million shares of IBKC’s common stock. The acquisition of the Bank by IBKC was completed effective on July 31, 2017. 2. Summary of Significant Accounting Policies The following is a description of the significant accounting policies and practices followed by the Bank which conform to accounting principles generally accepted in the United States of America (“U.S. GAAP”) and general practices within the banking industry. Principles of Consolidation The Bank’s consolidated financial statements include the accounts of the Bank and its subsidiaries. All significant intercompany transactions have been eliminated in consolidation. Use of Estimates In preparing the consolidated financial statements in conformity with U.S. GAAP, management is required to make estimates and assumptions that affect the reported amounts of assets and liabilities as of the date of the balance sheet, and the reported amounts of revenues and expenses during the reporting period and disclosures of contingent assets and liabilities. Actual results could differ from those estimates. Material estimates that are particularly susceptible to significant change in the near term include the determination of the allowance for loan losses, the valuation of deferred tax assets, the evaluation of securities for other-than-temporary impairments, the valuation of foreclosed real estate assets, the valuation of FDIC indemnification assets, clawback liability and purchased credit impaired loans, impairment of goodwill and intangible assets, and the fair value of financial instruments. Cash and Cash Equivalents Cash and cash equivalents include cash and balances due from banks, federal funds sold and interest earning deposits with banks, all which have original maturities of 90 days or less.
Sabadell United Bank, N.A. Notes to Consolidated Interim Financial Statements (unaudited) 8 The Bank must comply with Federal Reserve Bank regulations requiring the maintenance of reserves against its net transaction accounts. At June 30, 2017 and December 31, 2016, these reserve balances amounted to approximately $36,174,000 and $29,667,000, respectively. Securities Certain debt securities that management has the positive intent and ability to hold to maturity are classified as “held to maturity” and recorded at amortized cost. Trading securities are recorded at fair value. Changes in fair value are included in earnings. Debt securities not classified as held to maturity or trading, and equity securities with readily determinable fair values not classified as trading, are classified as “available for sale” and recorded at fair value, with unrealized gains and losses excluded from earnings and reported in other comprehensive income (“OCI”). Purchased premiums and discounts are recognized in interest income using the interest method over the terms of the securities. Gains and losses on the sale of securities are recorded on the trade date and are determined using the specific identification method. The Bank reviews securities available for sale and held to maturity for impairment on a quarterly basis or more frequently if events and circumstances indicate that a potential impairment may have occurred. A security is impaired if its fair value is lower than its amortized cost basis. The Bank considers many factors in determining whether a decline in fair value below amortized cost represents other-than-temporary impairment (“OTTI”), including, but not limited to, the Bank’s intent to hold the security until maturity or for a period of time sufficient for a recovery in value, whether it is more likely than not that the Bank will be required to sell the security prior to recovery of its amortized cost basis, the length of time and extent to which fair value has been less than amortized cost, adverse changes in expected cash flows, collateral values and levels of subordination or over-collateralization, collateral performance, changes in the economic or regulatory environment, the general market condition of the geographic area or industry of the issuer and other issuer specific factors such as the issuer’s financial condition and performance, compliance with statutory capital requirements or debt covenants, business prospects and credit rating. The Bank recognizes OTTI of a debt security for which there has been a decline in fair value below amortized cost if (i) management intends to sell the security, (ii) it is more likely than not that the Bank will be required to sell the security before recovery of its amortized cost basis, or (iii) the Bank does not expect to recover the entire amortized cost basis of the security. The amount by which amortized cost exceeds the fair value of a debt security that is considered to be OTTI is segregated into a component representing the credit loss, which is recognized in earnings, and a component related to all other factors, which is recognized in OCI. The measurement of the credit loss component is equal to the difference between the debt security’s amortized cost basis and the present value of its expected future cash flows discounted at the security’s effective yield. If the Bank intends to sell the security, or if it is more likely than not it will be required to sell the security before recovery, an OTTI write-down is recognized in earnings equal to the entire difference between the amortized cost basis and fair value of the security. The Bank estimates the portion of loss attributable to credit using a discounted cash flow model. The Bank estimates the expected cash flows of the underlying security using third party vendor models that incorporate management’s best estimate of current assumptions, such as default rates, loss severity and prepayment rates.
Sabadell United Bank, N.A. Notes to Consolidated Interim Financial Statements (unaudited) 9 Other Investment Securities Equity or other securities that do not have readily available fair values are classified as other investment securities in the consolidated balance sheets. These securities are stated at the lower of cost or realizable value and periodically evaluated for impairment. Stock that is owned by the Bank to comply with regulatory requirements such as Federal Reserve Bank stock, Federal Home Loan Bank stock and Independent Bankers Bank are included in this category. Their realizable value equals their cost. Mortgage Loans Held for Sale Mortgage loans originated and intended for sale in the secondary market are carried at the lower of aggregate cost or fair value, as determined by outstanding commitments from investors. Net unrealized losses, if any, are recorded as a valuation allowance and charged to earnings. Gains and losses on sales of mortgage loans are based on the difference between the selling price and the carrying value of the related loan sold. Loans The Bank grants real estate, commercial, mortgage, and consumer loans to customers. The ability of the Bank’s debtors to honor their contracts is dependent, in part, upon the real estate and general economic conditions. Originated loans and nonpurchase credit impaired (“nonPCI”) loans that management has the intent and ability to hold for the foreseeable future or until maturity or pay-off generally are reported at their outstanding unpaid principal balances net of unearned income, an allowance for loan losses, and any unamortized deferred fees or costs on originated loans, and premiums or discounts on purchased loans. Loan origination fees, net of certain direct origination costs, as well as premiums and discounts, are deferred and amortized as a level yield adjustment over the respective term of the loan. Interest income on originated and nonPCI loans is accrued based on the unpaid principal balance. The accrual of interest on loans is discontinued and all interest accrued but not collected is reversed against interest income at the time the loan is 90 days past due unless the credit is well-secured and in process of collection. Past due status is based on contractual terms of the loan. In all cases, loans are placed on nonaccrual or charged off at an earlier date if collection of principal or interest is considered doubtful. Interest received on nonaccrual loans is accounted for on the cash-basis or cost-recovery method, until qualifying for return to accrual. Loans are restored to accrual status when all the principal and interest amounts contractually due are brought current and future payments are reasonably assured. Purchased credit impaired (“PCI”) loans are those which, at acquisition, management determined it probable that the Bank would be unable to collect all contractual payments due. These loans are recorded at their estimated fair value at the time of acquisition, measured as the present value of all cash flows expected to be received, including estimated prepayments, discounted at an appropriate risk-weighted discount rate. PCI loans may be aggregated into pools of loans based on common risk characteristics such as credit score, loan type and date of origination. The fair value estimates associated with these pools of loans include estimates related to expected prepayments and the amount and timing of undiscounted expected principal, interest and other cash flows. The difference between total contractually required payments on purchased impaired loans and the cash flows expected to be received is recorded as nonaccretable difference. The
Sabadell United Bank, N.A. Notes to Consolidated Interim Financial Statements (unaudited) 10 excess of all cash flows expected to be received over the Bank’s recorded investment in the loans is recorded as accretable yield and is recognized as interest income on a level-yield basis over the expected life of the loans. PCI loans have an accretable yield as long as there is reasonable expectation about the timing and amount of cash flows to be collected. Loans acquired that are not deemed to be credit impaired are recorded at their fair value at acquisition date. Purchase discounts are included in the determination of fair value. In determining the acquisition date fair value of purchase loans, the Bank generally aggregates purchased loans into pools of loans with common risk characteristics. Purchase discounts are subsequently recognized as yield adjustments over the contractual life of the related loans. Acquired loans not deemed credit impaired at date of acquisition are referred to as nonPCI loans. The Bank is required to develop reasonable expectations about the timing and amount of cash flows expected to be collected related to PCI loans and to update these over the lives of the loans. PCI loans are reviewed quarterly to determine whether any significant changes have occurred in expected cash flows. Subsequently, if probable that the Bank will be unable to collect all the cash flows expected from a loan or pool at acquisition or purchase, plus additional cash flows expected to be collected arising from changes in estimates after acquisition or purchase, the loan or pool is considered impaired and an allowance is established by a charge to the provision for loan losses. If, based on current information, there is a significant increase in cash flows expected to be collected with respect to a loan or pool or if actual cash flows significantly exceed cash flows previously expected, the Bank first reduces any allowance previously established by the increase in the present value of cash flows expected to be collected, then recalculates the amount of accretable yield for the loan. In calculating the present value of expected cash flows for this purpose, changes in cash flow estimates pursuant to credit factors are isolated from those related to changes in interest rate indices. Estimates of expected cash flows incorporate assumptions of expected prepayments, probability of default and loss severity given default. Probability of default assumptions are derived from incurred and expected loss data published in third party research reports for commercial, commercial real estate and residential loans. Probability of default assumptions for residential loans are adjusted to incorporate increased risk for historical delinquency occurrence and high loan to collateral value (“LTV”) ratios, and updated borrower credit information. For commercial and commercial real estate loans, probability of default assumptions are based upon loan risks of the Bank. Loss severity given default assumptions are developed by using third party market data research reports or estimates of current LTV ratios which use real estate price index values for the applicable state or metropolitan Statistical Area (“MSA”) where available. The adjustment of accretable yield due to an increase in expected cash flows is accounted for prospectively as a change in estimate. The additional cash flows expected to be collected are transferred from nonaccretable difference to accretable yield and the amount of periodic accretion is adjusted accordingly over the remaining life of the loan or pool. Allowance for Loan Losses The allowance for loan losses is maintained at the level considered adequate by management to provide for losses that are probable. The allowance for loan losses is established through provisions for loan losses charged against income. Loans deemed to be uncollectible are charged against the allowance for loan losses, and subsequent recoveries, if any, are credited to the allowance.

Sabadell United Bank, N.A. Notes to Consolidated Interim Financial Statements (unaudited) 11 Management’s determination of the adequacy of the allowance is based on an evaluation of individual loans, past loan loss experience, current economic conditions, balance and composition of the loan portfolio, and other relevant factors. This evaluation is inherently subjective as it requires estimates that are susceptible to significant revision as more information becomes available. When establishing the allowance for loan losses, management categorizes loans into risk categories generally based on the nature of the collateral and the source of repayment. These categories and the relevant risk characteristics are as follows: Commercial Loans Loans for commercial, corporate and business purposes, including issuing letters of credit are presented as Commercial. The Bank’s commercial business loan portfolio is comprised of loans for a variety of purposes and is generally secured by equipment, machinery and other business assets. Commercial business loans generally have terms of five years or less and interest rates that float in accordance with a designated published index. Substantially all of such loans are secured and backed by the personal guarantees of the owners of the business. Commercial Real Estate Loans Commercial real estate loans are primarily secured by office and industrial buildings, warehouses, small retail shopping centers and various special purpose properties, including hotels, restaurants, multifamily and nursing homes. Although terms vary, commercial real estate loans generally have amortizations of 15 to 25 years, as well as balloon payments from two to five years, and terms which provide that the interest rates thereon may be adjusted annually at the Bank’s discretion, based on a designated index. Land and Construction Loans Construction real estate loans consist of vacant land and property that is in the process of improvement. Repayment of these loans can be dependent on the sale of the property to third parties or the successful completion of the improvements by the builder for the end user. In the event a loan is made on property that is not yet improved for the planned development, there is the risk that approvals will not be granted or will be delayed. Construction loans also run the risk that improvements will not be completed on time or in accordance with specifications and projected costs. Construction real estate loans generally have terms of one year to eighteen months during the construction period and interest rates that fluctuate based on a designated index. Residential Real Estate Loans Residential real estate loans include closed-end and revolving loans secured by first liens and home equity lines of credits secured by junior liens on 1-4 family residential properties extended to individuals for household, family or other personal expenditures and second mortgage and home equity loans. Loans are underwritten by evaluating the credit history of the borrower, the ability of the borrower to meet the debt service requirements of the loan and total debt obligations, as well as the underlying collateral and the loan to collateral value. Consumer Consumer loans generally have higher interest rates than mortgage loans. The risk involved in consumer loans is the type and nature of the collateral and, in certain cases, the absence of collateral. Consumer loans include education loans, vehicle loans and other secured and unsecured loans that have been made for a variety of consumer purposes.
Sabadell United Bank, N.A. Notes to Consolidated Interim Financial Statements (unaudited) 12 Other Loans These loans are for the purpose of purchasing or carrying securities, unplanned overdrafts to deposit accounts or loans to individuals for investment. For originated and nonPCI loans the allowance consists of allocated and general components. The allocated component relates to loans that are classified as impaired. For those loans that are classified as impaired, an allowance is established when the expected future cash flows, discounted at the loans effective interest rate of the impaired loan is lower than the carrying value of that loan. Where foreclosure is imminent or the loan is collateral dependent, the Bank will use the collateral value, less cost to sell, as a practical expedient to determine impairment. A loan is considered impaired when, based on current information and events, it is probable that the Bank will be unable to collect the scheduled payments of principal or interest when due according to the contractual and original terms of the loan agreement. Factors considered by management in determining impairment include payment status, collateral value, and the probability of collecting scheduled principal and interest payments when due. Loans that experience insignificant payment delays and payment shortfalls generally are not classified as impaired. Management determines the significance of payment delays and payment shortfalls on a case-by-case basis, taking into consideration all of the circumstances surrounding the loan and the borrower, including the length of the delay, the reasons for the delay, the borrower’s prior payment record, and the amount of the shortfall in relation to the principal and interest owed. Loans that do not meet the criteria of an individually impaired loan, usually large groups of smaller balance homogenous loans below $250,000, are collectively evaluated for impairment. Accordingly, the Bank does not separately identify individual consumer and residential loans for impairment disclosures, unless such loans are subject to a troubled debt restructuring arrangement. The general component consists of quantitative and qualitative factors and covers nonimpaired loans. The quantitative factors are based on historical charge-off experience. The qualitative factors are determined based on an assessment of internal and/or external influences on credit quality that are not fully reflected in the historical losses. To calculate the allowance required for smaller-balance impaired loans and nonimpaired loans, historical loss ratios are determined by analyzing historical net charge off ratios. Loss estimates and historical net charge offs are analyzed by loan segment. Historical ratios are updated to incorporate the most recent data reflecting current economic conditions, industry performance trends, geographic or obligor concentrations within each portfolio segment, and any other pertinent information that might affect the estimation of the allowance for loan losses. The above methodology is also used to assign reserves to off-balance sheet credit risk such as unfunded loan commitments and letters of credit. These reserves are presented in the liabilities section in the consolidated financial statements. As of June 30, 2017 and December 31, 2016, the reserve for unfunded loan commitments was $2,599,829 and $5,699,829, respectively. Reversal for unfunded loan commitments for the six month period ended June 30, 2017, amounted to 3,100,000, which are included in noninterest expenses. There are no provisions for unfunded loan commitments for the six month period ended June 30, 2016.
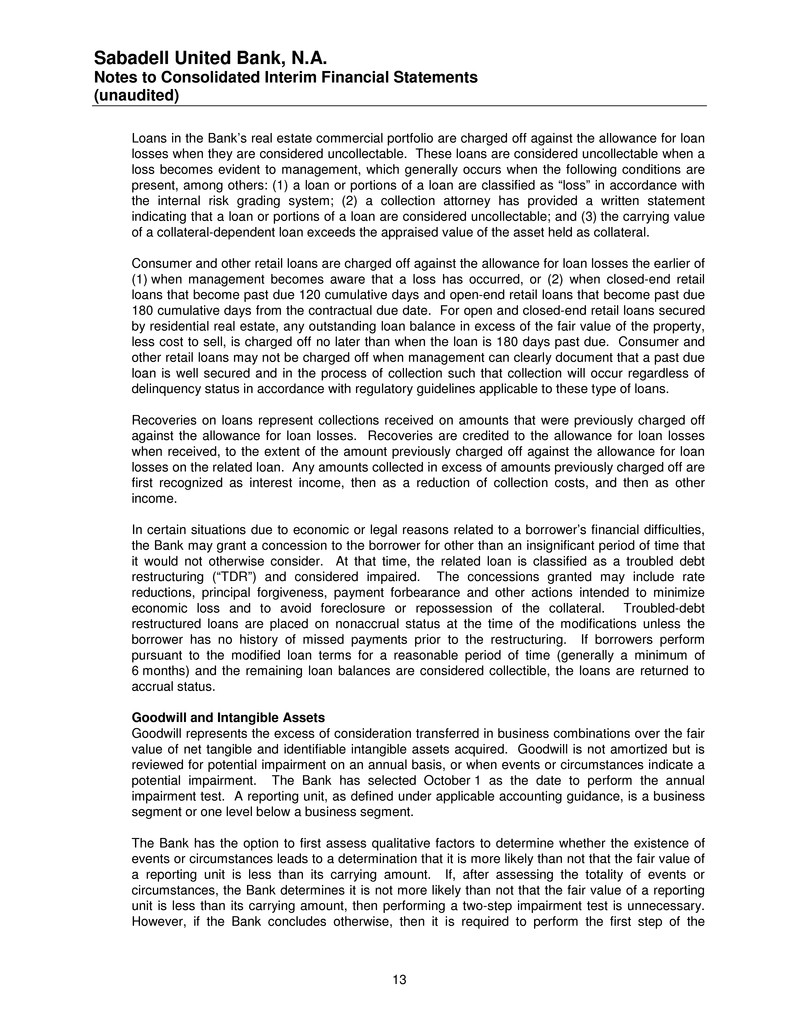
Sabadell United Bank, N.A. Notes to Consolidated Interim Financial Statements (unaudited) 13 Loans in the Bank’s real estate commercial portfolio are charged off against the allowance for loan losses when they are considered uncollectable. These loans are considered uncollectable when a loss becomes evident to management, which generally occurs when the following conditions are present, among others: (1) a loan or portions of a loan are classified as “loss” in accordance with the internal risk grading system; (2) a collection attorney has provided a written statement indicating that a loan or portions of a loan are considered uncollectable; and (3) the carrying value of a collateral-dependent loan exceeds the appraised value of the asset held as collateral. Consumer and other retail loans are charged off against the allowance for loan losses the earlier of (1) when management becomes aware that a loss has occurred, or (2) when closed-end retail loans that become past due 120 cumulative days and open-end retail loans that become past due 180 cumulative days from the contractual due date. For open and closed-end retail loans secured by residential real estate, any outstanding loan balance in excess of the fair value of the property, less cost to sell, is charged off no later than when the loan is 180 days past due. Consumer and other retail loans may not be charged off when management can clearly document that a past due loan is well secured and in the process of collection such that collection will occur regardless of delinquency status in accordance with regulatory guidelines applicable to these type of loans. Recoveries on loans represent collections received on amounts that were previously charged off against the allowance for loan losses. Recoveries are credited to the allowance for loan losses when received, to the extent of the amount previously charged off against the allowance for loan losses on the related loan. Any amounts collected in excess of amounts previously charged off are first recognized as interest income, then as a reduction of collection costs, and then as other income. In certain situations due to economic or legal reasons related to a borrower’s financial difficulties, the Bank may grant a concession to the borrower for other than an insignificant period of time that it would not otherwise consider. At that time, the related loan is classified as a troubled debt restructuring (“TDR”) and considered impaired. The concessions granted may include rate reductions, principal forgiveness, payment forbearance and other actions intended to minimize economic loss and to avoid foreclosure or repossession of the collateral. Troubled-debt restructured loans are placed on nonaccrual status at the time of the modifications unless the borrower has no history of missed payments prior to the restructuring. If borrowers perform pursuant to the modified loan terms for a reasonable period of time (generally a minimum of 6 months) and the remaining loan balances are considered collectible, the loans are returned to accrual status. Goodwill and Intangible Assets Goodwill represents the excess of consideration transferred in business combinations over the fair value of net tangible and identifiable intangible assets acquired. Goodwill is not amortized but is reviewed for potential impairment on an annual basis, or when events or circumstances indicate a potential impairment. The Bank has selected October 1 as the date to perform the annual impairment test. A reporting unit, as defined under applicable accounting guidance, is a business segment or one level below a business segment. The Bank has the option to first assess qualitative factors to determine whether the existence of events or circumstances leads to a determination that it is more likely than not that the fair value of a reporting unit is less than its carrying amount. If, after assessing the totality of events or circumstances, the Bank determines it is not more likely than not that the fair value of a reporting unit is less than its carrying amount, then performing a two-step impairment test is unnecessary. However, if the Bank concludes otherwise, then it is required to perform the first step of the
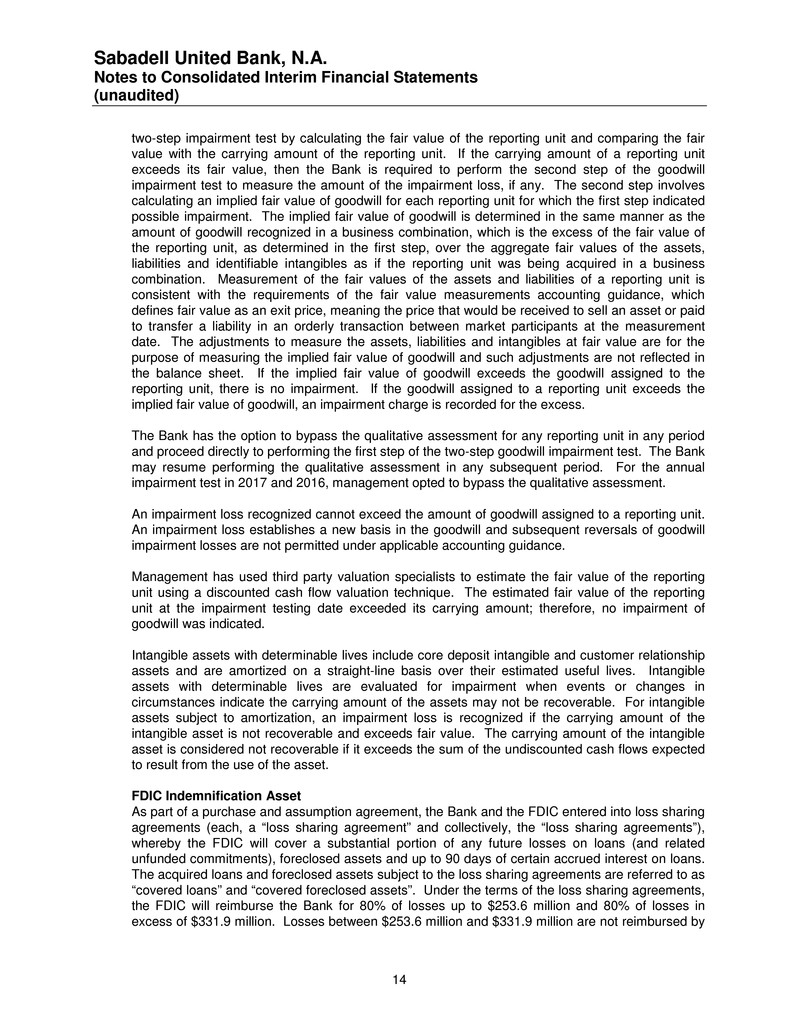
Sabadell United Bank, N.A. Notes to Consolidated Interim Financial Statements (unaudited) 14 two-step impairment test by calculating the fair value of the reporting unit and comparing the fair value with the carrying amount of the reporting unit. If the carrying amount of a reporting unit exceeds its fair value, then the Bank is required to perform the second step of the goodwill impairment test to measure the amount of the impairment loss, if any. The second step involves calculating an implied fair value of goodwill for each reporting unit for which the first step indicated possible impairment. The implied fair value of goodwill is determined in the same manner as the amount of goodwill recognized in a business combination, which is the excess of the fair value of the reporting unit, as determined in the first step, over the aggregate fair values of the assets, liabilities and identifiable intangibles as if the reporting unit was being acquired in a business combination. Measurement of the fair values of the assets and liabilities of a reporting unit is consistent with the requirements of the fair value measurements accounting guidance, which defines fair value as an exit price, meaning the price that would be received to sell an asset or paid to transfer a liability in an orderly transaction between market participants at the measurement date. The adjustments to measure the assets, liabilities and intangibles at fair value are for the purpose of measuring the implied fair value of goodwill and such adjustments are not reflected in the balance sheet. If the implied fair value of goodwill exceeds the goodwill assigned to the reporting unit, there is no impairment. If the goodwill assigned to a reporting unit exceeds the implied fair value of goodwill, an impairment charge is recorded for the excess. The Bank has the option to bypass the qualitative assessment for any reporting unit in any period and proceed directly to performing the first step of the two-step goodwill impairment test. The Bank may resume performing the qualitative assessment in any subsequent period. For the annual impairment test in 2017 and 2016, management opted to bypass the qualitative assessment. An impairment loss recognized cannot exceed the amount of goodwill assigned to a reporting unit. An impairment loss establishes a new basis in the goodwill and subsequent reversals of goodwill impairment losses are not permitted under applicable accounting guidance. Management has used third party valuation specialists to estimate the fair value of the reporting unit using a discounted cash flow valuation technique. The estimated fair value of the reporting unit at the impairment testing date exceeded its carrying amount; therefore, no impairment of goodwill was indicated. Intangible assets with determinable lives include core deposit intangible and customer relationship assets and are amortized on a straight-line basis over their estimated useful lives. Intangible assets with determinable lives are evaluated for impairment when events or changes in circumstances indicate the carrying amount of the assets may not be recoverable. For intangible assets subject to amortization, an impairment loss is recognized if the carrying amount of the intangible asset is not recoverable and exceeds fair value. The carrying amount of the intangible asset is considered not recoverable if it exceeds the sum of the undiscounted cash flows expected to result from the use of the asset. FDIC Indemnification Asset As part of a purchase and assumption agreement, the Bank and the FDIC entered into loss sharing agreements (each, a “loss sharing agreement” and collectively, the “loss sharing agreements”), whereby the FDIC will cover a substantial portion of any future losses on loans (and related unfunded commitments), foreclosed assets and up to 90 days of certain accrued interest on loans. The acquired loans and foreclosed assets subject to the loss sharing agreements are referred to as “covered loans” and “covered foreclosed assets”. Under the terms of the loss sharing agreements, the FDIC will reimburse the Bank for 80% of losses up to $253.6 million and 80% of losses in excess of $331.9 million. Losses between $253.6 million and $331.9 million are not reimbursed by
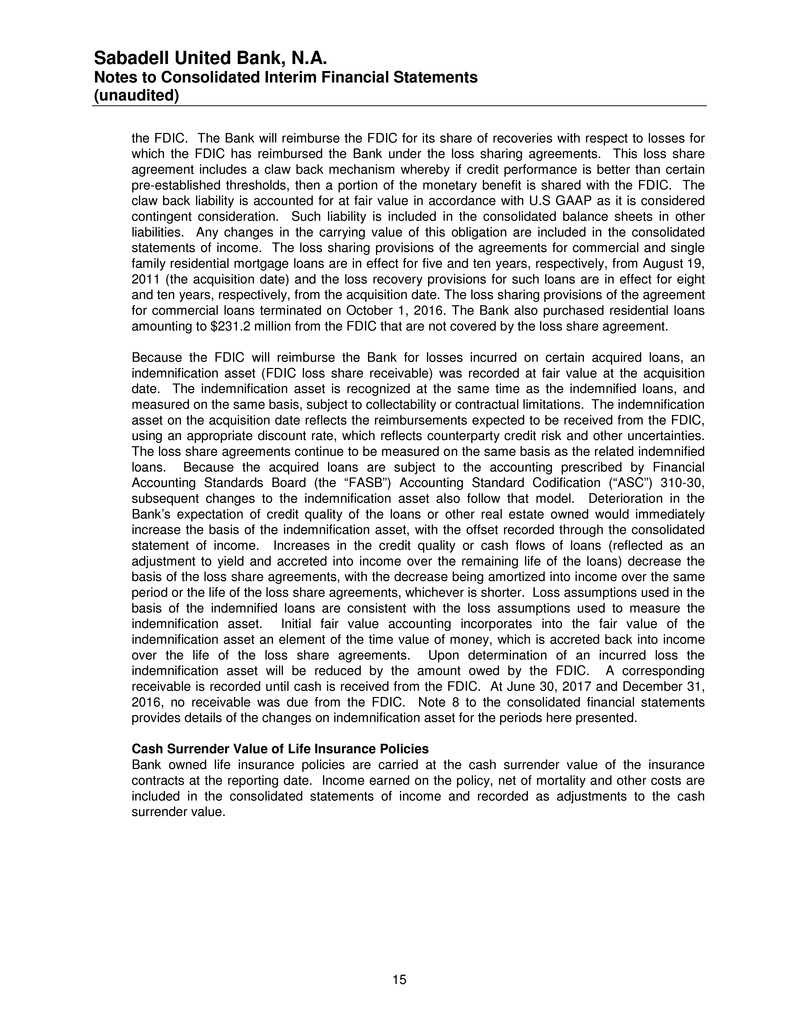
Sabadell United Bank, N.A. Notes to Consolidated Interim Financial Statements (unaudited) 15 the FDIC. The Bank will reimburse the FDIC for its share of recoveries with respect to losses for which the FDIC has reimbursed the Bank under the loss sharing agreements. This loss share agreement includes a claw back mechanism whereby if credit performance is better than certain pre-established thresholds, then a portion of the monetary benefit is shared with the FDIC. The claw back liability is accounted for at fair value in accordance with U.S GAAP as it is considered contingent consideration. Such liability is included in the consolidated balance sheets in other liabilities. Any changes in the carrying value of this obligation are included in the consolidated statements of income. The loss sharing provisions of the agreements for commercial and single family residential mortgage loans are in effect for five and ten years, respectively, from August 19, 2011 (the acquisition date) and the loss recovery provisions for such loans are in effect for eight and ten years, respectively, from the acquisition date. The loss sharing provisions of the agreement for commercial loans terminated on October 1, 2016. The Bank also purchased residential loans amounting to $231.2 million from the FDIC that are not covered by the loss share agreement. Because the FDIC will reimburse the Bank for losses incurred on certain acquired loans, an indemnification asset (FDIC loss share receivable) was recorded at fair value at the acquisition date. The indemnification asset is recognized at the same time as the indemnified loans, and measured on the same basis, subject to collectability or contractual limitations. The indemnification asset on the acquisition date reflects the reimbursements expected to be received from the FDIC, using an appropriate discount rate, which reflects counterparty credit risk and other uncertainties. The loss share agreements continue to be measured on the same basis as the related indemnified loans. Because the acquired loans are subject to the accounting prescribed by Financial Accounting Standards Board (the “FASB”) Accounting Standard Codification (“ASC”) 310-30, subsequent changes to the indemnification asset also follow that model. Deterioration in the Bank’s expectation of credit quality of the loans or other real estate owned would immediately increase the basis of the indemnification asset, with the offset recorded through the consolidated statement of income. Increases in the credit quality or cash flows of loans (reflected as an adjustment to yield and accreted into income over the remaining life of the loans) decrease the basis of the loss share agreements, with the decrease being amortized into income over the same period or the life of the loss share agreements, whichever is shorter. Loss assumptions used in the basis of the indemnified loans are consistent with the loss assumptions used to measure the indemnification asset. Initial fair value accounting incorporates into the fair value of the indemnification asset an element of the time value of money, which is accreted back into income over the life of the loss share agreements. Upon determination of an incurred loss the indemnification asset will be reduced by the amount owed by the FDIC. A corresponding receivable is recorded until cash is received from the FDIC. At June 30, 2017 and December 31, 2016, no receivable was due from the FDIC. Note 8 to the consolidated financial statements provides details of the changes on indemnification asset for the periods here presented. Cash Surrender Value of Life Insurance Policies Bank owned life insurance policies are carried at the cash surrender value of the insurance contracts at the reporting date. Income earned on the policy, net of mortality and other costs are included in the consolidated statements of income and recorded as adjustments to the cash surrender value.
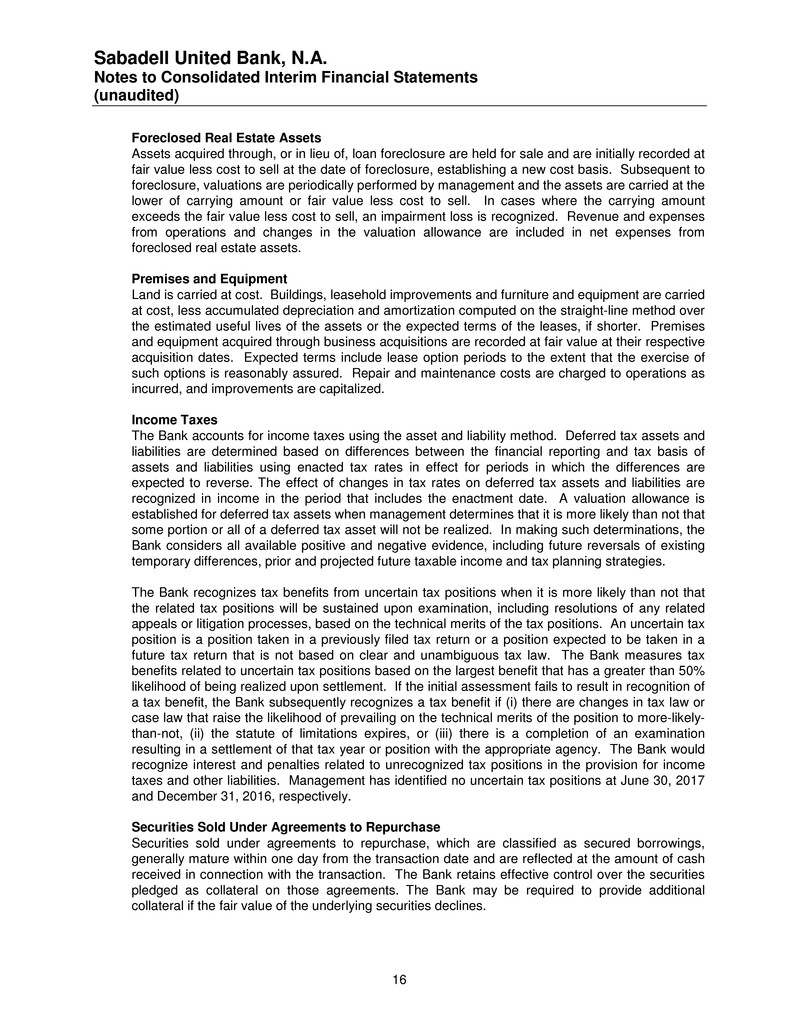
Sabadell United Bank, N.A. Notes to Consolidated Interim Financial Statements (unaudited) 16 Foreclosed Real Estate Assets Assets acquired through, or in lieu of, loan foreclosure are held for sale and are initially recorded at fair value less cost to sell at the date of foreclosure, establishing a new cost basis. Subsequent to foreclosure, valuations are periodically performed by management and the assets are carried at the lower of carrying amount or fair value less cost to sell. In cases where the carrying amount exceeds the fair value less cost to sell, an impairment loss is recognized. Revenue and expenses from operations and changes in the valuation allowance are included in net expenses from foreclosed real estate assets. Premises and Equipment Land is carried at cost. Buildings, leasehold improvements and furniture and equipment are carried at cost, less accumulated depreciation and amortization computed on the straight-line method over the estimated useful lives of the assets or the expected terms of the leases, if shorter. Premises and equipment acquired through business acquisitions are recorded at fair value at their respective acquisition dates. Expected terms include lease option periods to the extent that the exercise of such options is reasonably assured. Repair and maintenance costs are charged to operations as incurred, and improvements are capitalized. Income Taxes The Bank accounts for income taxes using the asset and liability method. Deferred tax assets and liabilities are determined based on differences between the financial reporting and tax basis of assets and liabilities using enacted tax rates in effect for periods in which the differences are expected to reverse. The effect of changes in tax rates on deferred tax assets and liabilities are recognized in income in the period that includes the enactment date. A valuation allowance is established for deferred tax assets when management determines that it is more likely than not that some portion or all of a deferred tax asset will not be realized. In making such determinations, the Bank considers all available positive and negative evidence, including future reversals of existing temporary differences, prior and projected future taxable income and tax planning strategies. The Bank recognizes tax benefits from uncertain tax positions when it is more likely than not that the related tax positions will be sustained upon examination, including resolutions of any related appeals or litigation processes, based on the technical merits of the tax positions. An uncertain tax position is a position taken in a previously filed tax return or a position expected to be taken in a future tax return that is not based on clear and unambiguous tax law. The Bank measures tax benefits related to uncertain tax positions based on the largest benefit that has a greater than 50% likelihood of being realized upon settlement. If the initial assessment fails to result in recognition of a tax benefit, the Bank subsequently recognizes a tax benefit if (i) there are changes in tax law or case law that raise the likelihood of prevailing on the technical merits of the position to more-likely- than-not, (ii) the statute of limitations expires, or (iii) there is a completion of an examination resulting in a settlement of that tax year or position with the appropriate agency. The Bank would recognize interest and penalties related to unrecognized tax positions in the provision for income taxes and other liabilities. Management has identified no uncertain tax positions at June 30, 2017 and December 31, 2016, respectively. Securities Sold Under Agreements to Repurchase Securities sold under agreements to repurchase, which are classified as secured borrowings, generally mature within one day from the transaction date and are reflected at the amount of cash received in connection with the transaction. The Bank retains effective control over the securities pledged as collateral on those agreements. The Bank may be required to provide additional collateral if the fair value of the underlying securities declines.
Sabadell United Bank, N.A. Notes to Consolidated Interim Financial Statements (unaudited) 17 Transfers of Financial Assets Transfers of financial assets are accounted for as sales when control over the assets has been surrendered. A gain or loss is recognized in earnings upon completion of the sale based on the difference between the sales proceeds and the carrying value of the assets. Control over the transferred assets is deemed to have been surrendered when: (i) the assets have been legally isolated from the Bank, (ii) the transferee obtains the right (free of conditions that constrain it from taking advantage of that right) to pledge or exchange the transferred assets, and (iii) the Bank does not maintain effective control over the transferred assets through an agreement to repurchase them before their maturity or the ability to unilaterally cause the holder to return specific assets. Deferred Compensation Plan The cost of the Bank’s performance based deferred compensation program is measured based on a formula established in the agreement which considers the appreciation in value over the original base units’ value on an annual basis. The cost of those benefits is accrued over the employee’s service period in a systematic and rational manner. Fair Value of Financial Instruments Certain of the Bank’s assets and liabilities are reflected in the consolidated financial statements at fair value on either a recurring or nonrecurring basis. Securities available for sale are measured at fair value on a recurring basis. Assets measured at fair value on a nonrecurring basis may include collateral dependent impaired loans, foreclosed real estate assets, goodwill and other intangible assets. These nonrecurring fair value measurements typically involve acquisition accounting, the application of lower-of-cost-or-market accounting or the measurement of impairment of certain assets. Fair value is defined as the exchange price that would be received for an asset or paid to transfer a liability in the principal or most advantageous market for the asset or liability in an orderly transaction between market participants at the measurement date. U.S. GAAP establishes a hierarchy that prioritizes inputs used to determine fair value measurements into three levels based on the observability and transparency of the inputs: Level 1 Unadjusted quoted prices in active markets that are accessible at the measurement date for identical assets or liabilities; estimated fair values of U.S. Government Treasury debt securities are generally based on Level 1 inputs. Level 2 Observable inputs other than Level 1 inputs, including quoted prices for similar assets and liabilities, quoted prices for identical assets and liabilities in less active markets and other inputs that can be corroborated by observable market data; estimated fair values of U.S. Government sponsored entity mortgaged-backed securities and collateralized mortgage obligations securities, foreign debt securities, mutual funds and municipal obligations are generally based on Level 2 inputs. Level 3 Unobservable inputs supported by little or no market activity or data and inputs requiring significant management judgment or estimation; estimated fair values of goodwill, core deposit intangibles, clawback liability and collateral dependent loans are generally based on Level 3 inputs.
Sabadell United Bank, N.A. Notes to Consolidated Interim Financial Statements (unaudited) 18 The fair value hierarchy requires the Bank to maximize the use of observable inputs and minimize the use of unobservable inputs in estimating fair value. Unobservable inputs are utilized in determining fair value measurements only to the extent that observable inputs are unavailable. The need to use unobservable inputs generally results from a lack of market liquidity and diminished observability of actual trades or assumptions that would otherwise be available to value a particular asset or liability. The Bank’s policy is to recognize transfers between levels as of the end of a reporting period. New Accounting Pronouncements The Bank does not anticipate to implement the new accounting pronouncements listed below due to the sale of the Bank as discussed in note 1. Revenue In May 2014, the FASB issued new guidance related to revenue from contracts with customers. This guidance supersedes the revenue recognition requirements in Accounting Standards Codification Topic 605, Revenue Recognition, and most industry-specific guidance throughout the Accounting Standards Codification. The guidance requires an entity to recognize revenue to depict the transfer of promised goods or services to customers in an amount that reflects the consideration to which the Company expects to be entitled in exchange for those goods or services. The FASB continues to issue additional ASUs clarifying the revenue recognition guidance for certain implementation issues without changing its core principles. This guidance, which does not apply to financial instruments, is effective for annual reporting periods beginning after December 15, 2018. Leases In February 2016, the FASB issued new guidance related to accounting for leases. This new guidance requires lessees to recognize assets and liabilities related to certain operating leases on the balance sheet. The guidance also requires additional disclosures by lessees and contains targeted changes to accounting by lessors. This guidance is effective for fiscal years beginning after December 15, 2019. Stock Compensation In March 2016, the FASB issued new guidance related to stock compensation. The new guidance eliminates the concept of additional paid-in capital pools for stock-based awards and requires that the related excess tax benefits and tax deficiencies be classified as an operating activity in the statement of cash flows. The new guidance also allows entities to make a one-time policy election to account for forfeitures when they occur, instead of accruing compensation cost based on the number of awards expected to vest. Additionally, the new guidance changes the requirement for an award to qualify for equity classification by permitting tax withholding up to the maximum statutory tax rate instead of the minimum statutory tax rate. Cash paid by an employer when directly withholding shares for tax withholding purposes should be classified as a financing activity in the Statement of Cash Flows. This guidance is effective for fiscal years beginning after December 15, 2017. Statements of Cash Flows In August 2016, the FASB issued new guidance related to the statement of cash flows. The new guidance clarifies the classification within the statement of cash flows for certain transactions, including debt extinguishment costs, zero-coupon debt, contingent consideration related to business combinations, insurance proceeds, equity method distributions and beneficial interests in
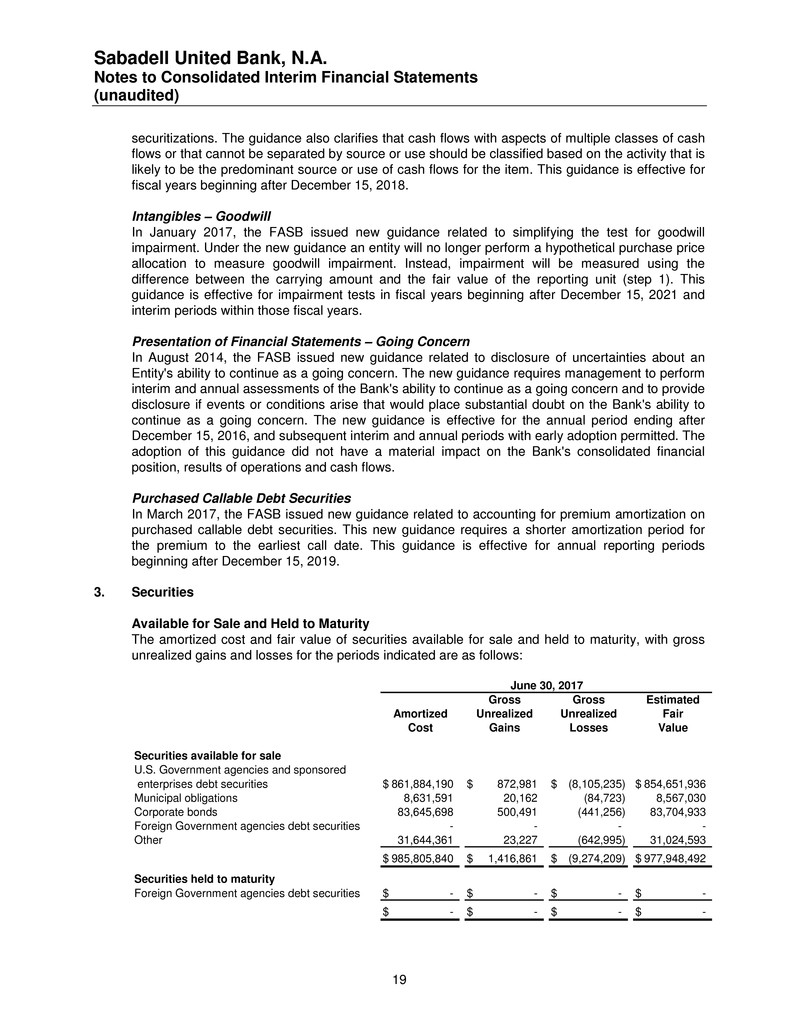
Sabadell United Bank, N.A. Notes to Consolidated Interim Financial Statements (unaudited) 19 securitizations. The guidance also clarifies that cash flows with aspects of multiple classes of cash flows or that cannot be separated by source or use should be classified based on the activity that is likely to be the predominant source or use of cash flows for the item. This guidance is effective for fiscal years beginning after December 15, 2018. Intangibles – Goodwill In January 2017, the FASB issued new guidance related to simplifying the test for goodwill impairment. Under the new guidance an entity will no longer perform a hypothetical purchase price allocation to measure goodwill impairment. Instead, impairment will be measured using the difference between the carrying amount and the fair value of the reporting unit (step 1). This guidance is effective for impairment tests in fiscal years beginning after December 15, 2021 and interim periods within those fiscal years. Presentation of Financial Statements – Going Concern In August 2014, the FASB issued new guidance related to disclosure of uncertainties about an Entity's ability to continue as a going concern. The new guidance requires management to perform interim and annual assessments of the Bank's ability to continue as a going concern and to provide disclosure if events or conditions arise that would place substantial doubt on the Bank's ability to continue as a going concern. The new guidance is effective for the annual period ending after December 15, 2016, and subsequent interim and annual periods with early adoption permitted. The adoption of this guidance did not have a material impact on the Bank's consolidated financial position, results of operations and cash flows. Purchased Callable Debt Securities In March 2017, the FASB issued new guidance related to accounting for premium amortization on purchased callable debt securities. This new guidance requires a shorter amortization period for the premium to the earliest call date. This guidance is effective for annual reporting periods beginning after December 15, 2019. 3. Securities Available for Sale and Held to Maturity The amortized cost and fair value of securities available for sale and held to maturity, with gross unrealized gains and losses for the periods indicated are as follows: Gross Gross Estimated Amortized Unrealized Unrealized Fair Cost Gains Losses Value Securities available for sale U.S. Government agencies and sponsored enterprises debt securities 861,884,190$ 872,981$ (8,105,235)$ 854,651,936$ Municipal obligations 8,631,591 20,162 (84,723) 8,567,030 Corporate bonds 83,645,698 500,491 (441,256) 83,704,933 Foreign Government agencies debt securities - - - - Other 31,644,361 23,227 (642,995) 31,024,593 985,805,840$ 1,416,861$ (9,274,209)$ 977,948,492$ Securities held to maturity Foreign Government agencies debt securities -$ -$ -$ -$ -$ -$ -$ -$ June 30, 2017
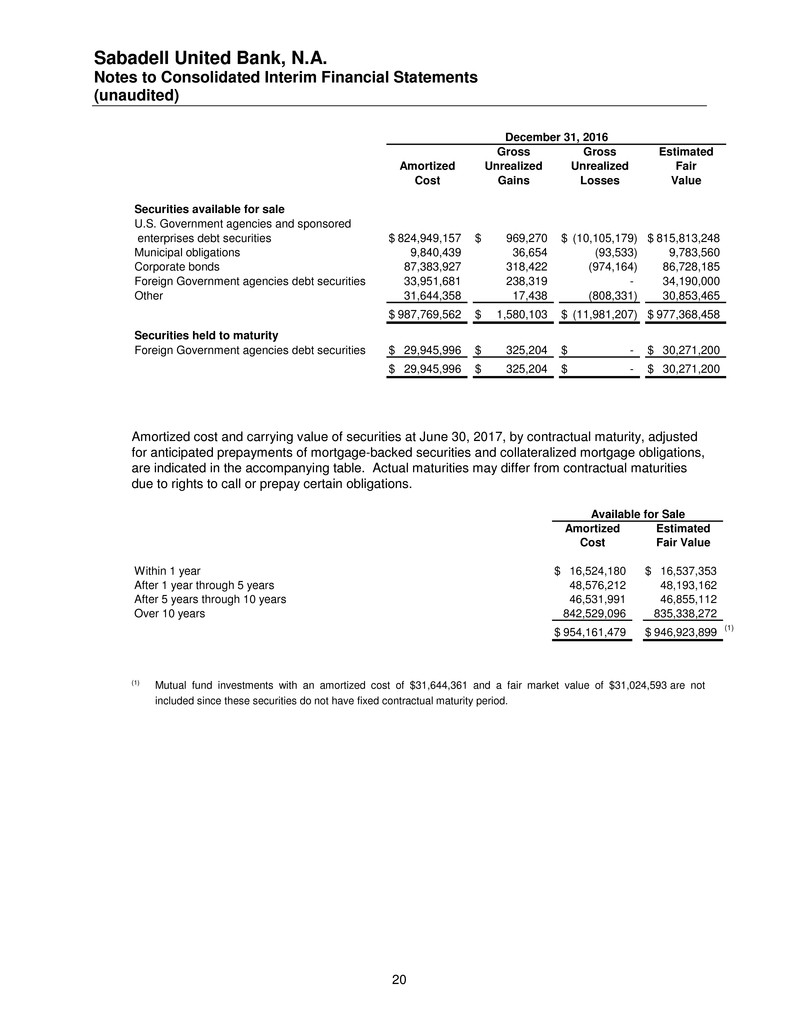
Sabadell United Bank, N.A. Notes to Consolidated Interim Financial Statements (unaudited) 20 Gross Gross Estimated Amortized Unrealized Unrealized Fair Cost Gains Losses Value Securities available for sale U.S. Government agencies and sponsored enterprises debt securities 824,949,157$ 969,270$ (10,105,179)$ 815,813,248$ Municipal obligations 9,840,439 36,654 (93,533) 9,783,560 Corporate bonds 87,383,927 318,422 (974,164) 86,728,185 Foreign Government agencies debt securities 33,951,681 238,319 - 34,190,000 Other 31,644,358 17,438 (808,331) 30,853,465 987,769,562$ 1,580,103$ (11,981,207)$ 977,368,458$ Securities held to maturity Foreign Government agencies debt securities 29,945,996$ 325,204$ -$ 30,271,200$ 29,945,996$ 325,204$ -$ 30,271,200$ December 31, 2016 Amortized cost and carrying value of securities at June 30, 2017, by contractual maturity, adjusted for anticipated prepayments of mortgage-backed securities and collateralized mortgage obligations, are indicated in the accompanying table. Actual maturities may differ from contractual maturities due to rights to call or prepay certain obligations. Amortized Estimated Cost Fair Value Within 1 year 16,524,180$ 16,537,353$ After 1 year through 5 years 48,576,212 48,193,162 After 5 years through 10 years 46,531,991 46,855,112 Over 10 years 842,529,096 835,338,272 954,161,479$ 946,923,899$ (1) Available for Sale (1) Mutual fund investments with an amortized cost of $31,644,361 and a fair market value of $31,024,593 are not included since these securities do not have fixed contractual maturity period.
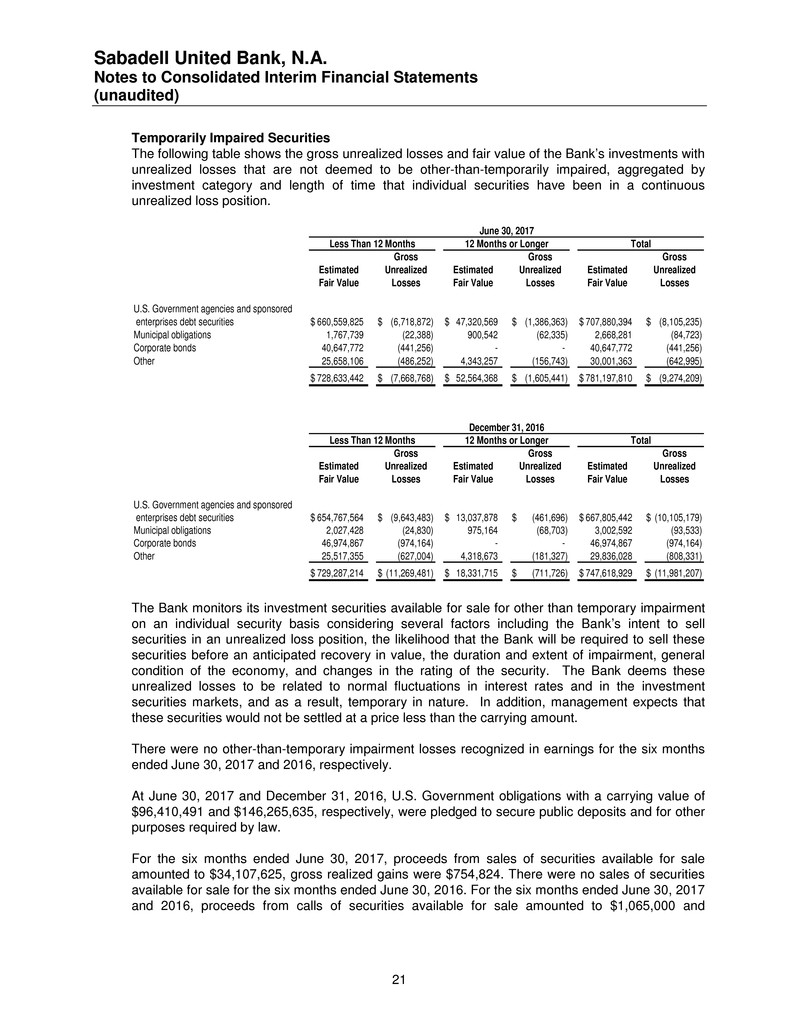
Sabadell United Bank, N.A. Notes to Consolidated Interim Financial Statements (unaudited) 21 Temporarily Impaired Securities The following table shows the gross unrealized losses and fair value of the Bank’s investments with unrealized losses that are not deemed to be other-than-temporarily impaired, aggregated by investment category and length of time that individual securities have been in a continuous unrealized loss position. Gross Gross Gross Estimated Unrealized Estimated Unrealized Estimated Unrealized Fair Value Losses Fair Value Losses Fair Value Losses U.S. Government agencies and sponsored enterprises debt securities 660,559,825$ (6,718,872)$ 47,320,569$ (1,386,363)$ 707,880,394$ (8,105,235)$ Municipal obligations 1,767,739 (22,388) 900,542 (62,335) 2,668,281 (84,723) Corporate bonds 40,647,772 (441,256) - - 40,647,772 (441,256) Other 25,658,106 (486,252) 4,343,257 (156,743) 30,001,363 (642,995) 728,633,442$ (7,668,768)$ 52,564,368$ (1,605,441)$ 781,197,810$ (9,274,209)$ June 30, 2017 Less Than 12 Months 12 Months or Longer Total Gross Gross Gross Estimated Unrealized Estimated Unrealized Estimated Unrealized Fair Value Losses Fair Value Losses Fair Value Losses U.S. Government agencies and sponsored enterprises debt securities 654,767,564$ (9,643,483)$ 13,037,878$ (461,696)$ 667,805,442$ (10,105,179)$ Municipal obligations 2,027,428 (24,830) 975,164 (68,703) 3,002,592 (93,533) Corporate bonds 46,974,867 (974,164) - - 46,974,867 (974,164) Other 25,517,355 (627,004) 4,318,673 (181,327) 29,836,028 (808,331) 729,287,214$ (11,269,481)$ 18,331,715$ (711,726)$ 747,618,929$ (11,981,207)$ December 31, 2016 Less Than 12 Months 12 Months or Longer Total The Bank monitors its investment securities available for sale for other than temporary impairment on an individual security basis considering several factors including the Bank’s intent to sell securities in an unrealized loss position, the likelihood that the Bank will be required to sell these securities before an anticipated recovery in value, the duration and extent of impairment, general condition of the economy, and changes in the rating of the security. The Bank deems these unrealized losses to be related to normal fluctuations in interest rates and in the investment securities markets, and as a result, temporary in nature. In addition, management expects that these securities would not be settled at a price less than the carrying amount. There were no other-than-temporary impairment losses recognized in earnings for the six months ended June 30, 2017 and 2016, respectively. At June 30, 2017 and December 31, 2016, U.S. Government obligations with a carrying value of $96,410,491 and $146,265,635, respectively, were pledged to secure public deposits and for other purposes required by law. For the six months ended June 30, 2017, proceeds from sales of securities available for sale amounted to $34,107,625, gross realized gains were $754,824. There were no sales of securities available for sale for the six months ended June 30, 2016. For the six months ended June 30, 2017 and 2016, proceeds from calls of securities available for sale amounted to $1,065,000 and
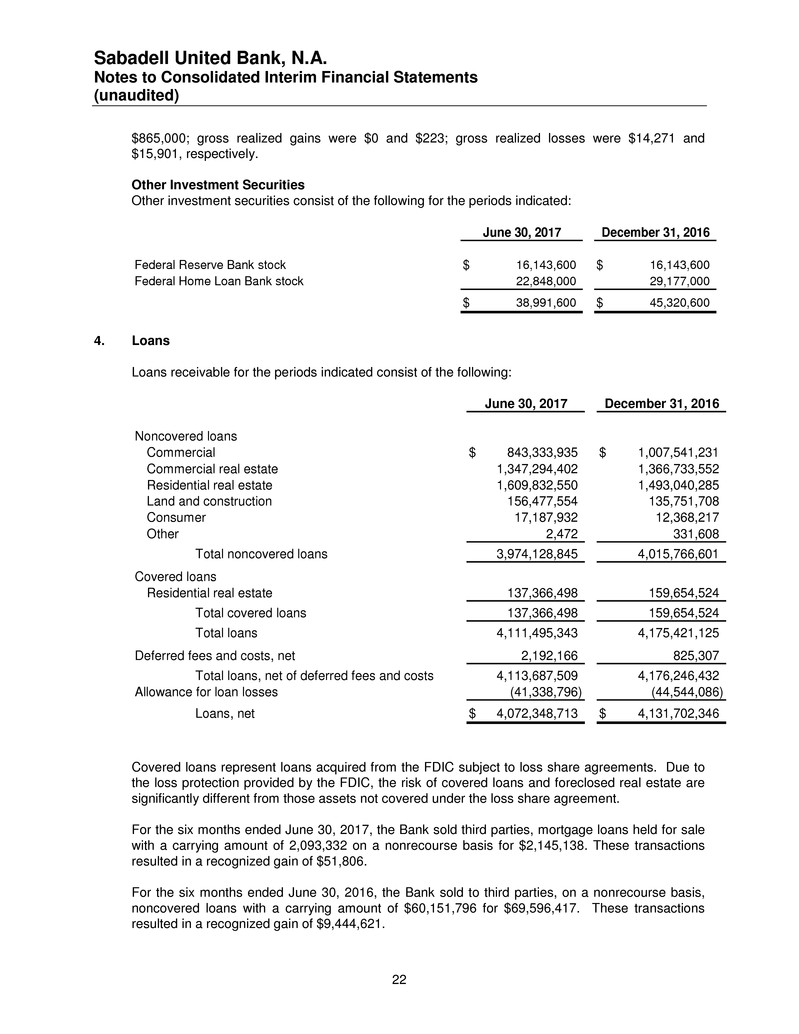
Sabadell United Bank, N.A. Notes to Consolidated Interim Financial Statements (unaudited) 22 $865,000; gross realized gains were $0 and $223; gross realized losses were $14,271 and $15,901, respectively. Other Investment Securities Other investment securities consist of the following for the periods indicated: June 30, 2017 December 31, 2016 Federal Reserve Bank stock 16,143,600$ 16,143,600$ Federal Home Loan Bank stock 22,848,000 29,177,000 38,991,600$ 45,320,600$ 4. Loans Loans receivable for the periods indicated consist of the following: June 30, 2017 December 31, 2016 Noncovered loans Commercial 843,333,935$ 1,007,541,231$ Commercial real estate 1,347,294,402 1,366,733,552 Residential real estate 1,609,832,550 1,493,040,285 Land and construction 156,477,554 135,751,708 Consumer 17,187,932 12,368,217 Other 2,472 331,608 Total noncovered loans 3,974,128,845 4,015,766,601 Covered loans Residential real estate 137,366,498 159,654,524 Total covered loans 137,366,498 159,654,524 Total loans 4,111,495,343 4,175,421,125 Deferred fees and costs, net 2,192,166 825,307 Total loans, net of deferred fees and costs 4,113,687,509 4,176,246,432 Allowance for loan losses (41,338,796) (44,544,086) Loans, net 4,072,348,713$ 4,131,702,346$ Covered loans represent loans acquired from the FDIC subject to loss share agreements. Due to the loss protection provided by the FDIC, the risk of covered loans and foreclosed real estate are significantly different from those assets not covered under the loss share agreement. For the six months ended June 30, 2017, the Bank sold third parties, mortgage loans held for sale with a carrying amount of 2,093,332 on a nonrecourse basis for $2,145,138. These transactions resulted in a recognized gain of $51,806. For the six months ended June 30, 2016, the Bank sold to third parties, on a nonrecourse basis, noncovered loans with a carrying amount of $60,151,796 for $69,596,417. These transactions resulted in a recognized gain of $9,444,621.
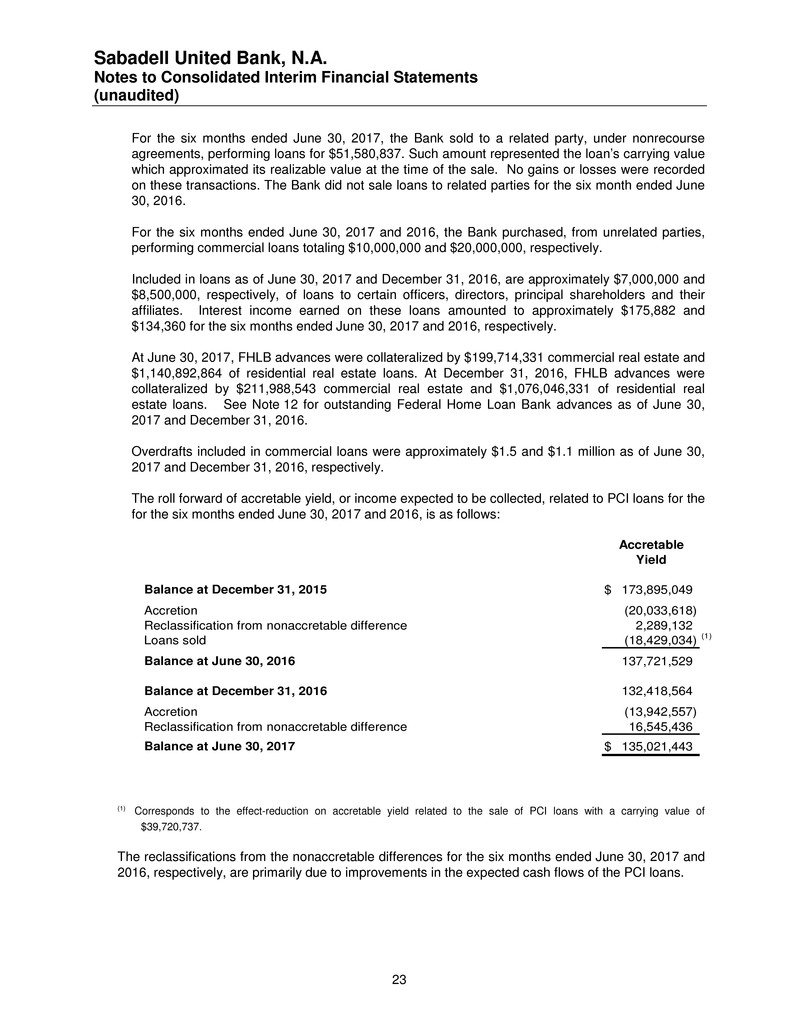
Sabadell United Bank, N.A. Notes to Consolidated Interim Financial Statements (unaudited) 23 For the six months ended June 30, 2017, the Bank sold to a related party, under nonrecourse agreements, performing loans for $51,580,837. Such amount represented the loan’s carrying value which approximated its realizable value at the time of the sale. No gains or losses were recorded on these transactions. The Bank did not sale loans to related parties for the six month ended June 30, 2016. For the six months ended June 30, 2017 and 2016, the Bank purchased, from unrelated parties, performing commercial loans totaling $10,000,000 and $20,000,000, respectively. Included in loans as of June 30, 2017 and December 31, 2016, are approximately $7,000,000 and $8,500,000, respectively, of loans to certain officers, directors, principal shareholders and their affiliates. Interest income earned on these loans amounted to approximately $175,882 and $134,360 for the six months ended June 30, 2017 and 2016, respectively. At June 30, 2017, FHLB advances were collateralized by $199,714,331 commercial real estate and $1,140,892,864 of residential real estate loans. At December 31, 2016, FHLB advances were collateralized by $211,988,543 commercial real estate and $1,076,046,331 of residential real estate loans. See Note 12 for outstanding Federal Home Loan Bank advances as of June 30, 2017 and December 31, 2016. Overdrafts included in commercial loans were approximately $1.5 and $1.1 million as of June 30, 2017 and December 31, 2016, respectively. The roll forward of accretable yield, or income expected to be collected, related to PCI loans for the for the six months ended June 30, 2017 and 2016, is as follows: Accretable Yield Balance at December 31, 2015 173,895,049$ Accretion (20,033,618) Reclassification from nonaccretable difference 2,289,132 Loans sold (18,429,034) (1) Balance at June 30, 2016 137,721,529 Balance at December 31, 2016 132,418,564 Accretion (13,942,557) Reclassification from nonaccretable difference 16,545,436 Balance at June 30, 2017 135,021,443$ (1) Corresponds to the effect-reduction on accretable yield related to the sale of PCI loans with a carrying value of $39,720,737. The reclassifications from the nonaccretable differences for the six months ended June 30, 2017 and 2016, respectively, are primarily due to improvements in the expected cash flows of the PCI loans.
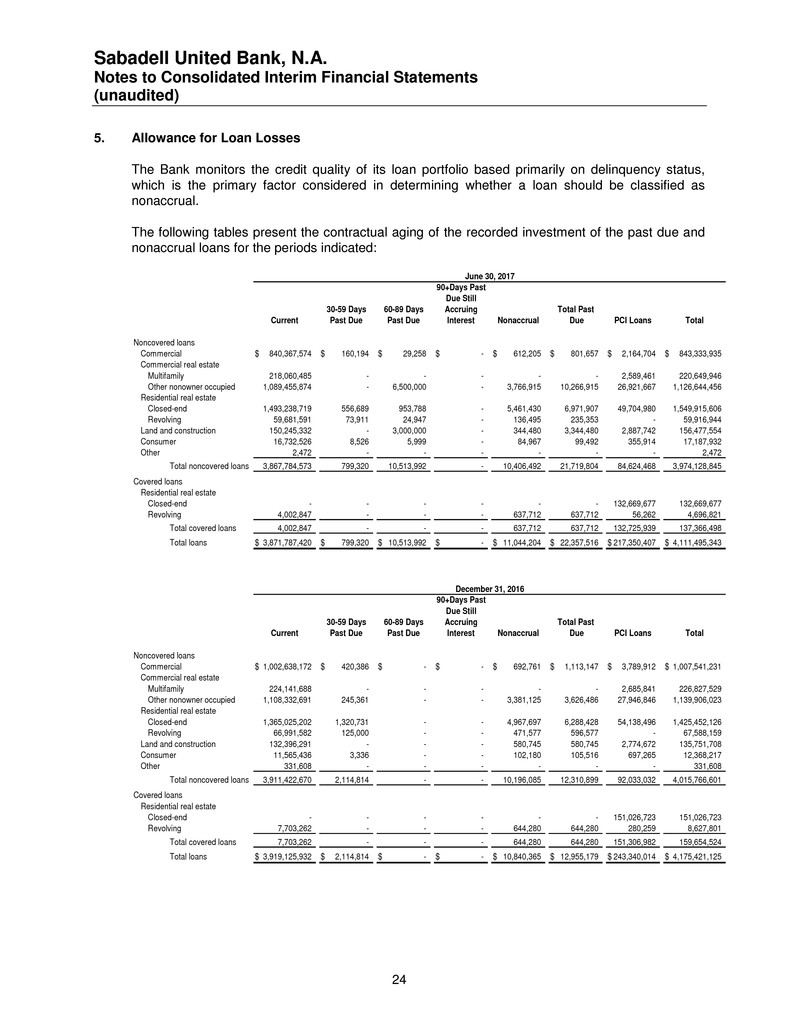
Sabadell United Bank, N.A. Notes to Consolidated Interim Financial Statements (unaudited) 24 5. Allowance for Loan Losses The Bank monitors the credit quality of its loan portfolio based primarily on delinquency status, which is the primary factor considered in determining whether a loan should be classified as nonaccrual. The following tables present the contractual aging of the recorded investment of the past due and nonaccrual loans for the periods indicated: 90+Days Past Due Still 30-59 Days 60-89 Days Accruing Total Past Current Past Due Past Due Interest Nonaccrual Due PCI Loans Total Noncovered loans Commercial 840,367,574$ 160,194$ 29,258$ -$ 612,205$ 801,657$ 2,164,704$ 843,333,935$ Commercial real estate Multifamily 218,060,485 - - - - - 2,589,461 220,649,946 Other nonowner occupied 1,089,455,874 - 6,500,000 - 3,766,915 10,266,915 26,921,667 1,126,644,456 Residential real estate Closed-end 1,493,238,719 556,689 953,788 - 5,461,430 6,971,907 49,704,980 1,549,915,606 Revolving 59,681,591 73,911 24,947 - 136,495 235,353 - 59,916,944 Land and construction 150,245,332 - 3,000,000 - 344,480 3,344,480 2,887,742 156,477,554 Consumer 16,732,526 8,526 5,999 - 84,967 99,492 355,914 17,187,932 Other 2,472 - - - - - - 2,472 Total noncovered loans 3,867,784,573 799,320 10,513,992 - 10,406,492 21,719,804 84,624,468 3,974,128,845 Covered loans Residential real estate Closed-end - - - - - - 132,669,677 132,669,677 Revolving 4,002,847 - - - 637,712 637,712 56,262 4,696,821 Total covered loans 4,002,847 - - - 637,712 637,712 132,725,939 137,366,498 Total loans 3,871,787,420$ 799,320$ 10,513,992$ -$ 11,044,204$ 22,357,516$ 217,350,407$ 4,111,495,343$ June 30, 2017 90+Days Past Due Still 30-59 Days 60-89 Days Accruing Total Past Current Past Due Past Due Interest Nonaccrual Due PCI Loans Total Noncovered loans Commercial 1,002,638,172$ 420,386$ -$ -$ 692,761$ 1,113,147$ 3,789,912$ 1,007,541,231$ Commercial real estate Multifamily 224,141,688 - - - - - 2,685,841 226,827,529 Other nonowner occupied 1,108,332,691 245,361 - - 3,381,125 3,626,486 27,946,846 1,139,906,023 Residential real estate Closed-end 1,365,025,202 1,320,731 - - 4,967,697 6,288,428 54,138,496 1,425,452,126 Revolving 66,991,582 125,000 - - 471,577 596,577 - 67,588,159 Land and construction 132,396,291 - - - 580,745 580,745 2,774,672 135,751,708 Consumer 11,565,436 3,336 - - 102,180 105,516 697,265 12,368,217 Other 331,608 - - - - - - 331,608 Total noncovered loans 3,911,422,670 2,114,814 - - 10,196,085 12,310,899 92,033,032 4,015,766,601 Covered loans Residential real estate Closed-end - - - - - - 151,026,723 151,026,723 Revolving 7,703,262 - - - 644,280 644,280 280,259 8,627,801 Total covered loans 7,703,262 - - - 644,280 644,280 151,306,982 159,654,524 Total loans 3,919,125,932$ 2,114,814$ -$ -$ 10,840,365$ 12,955,179$ 243,340,014$ 4,175,421,125$ December 31, 2016
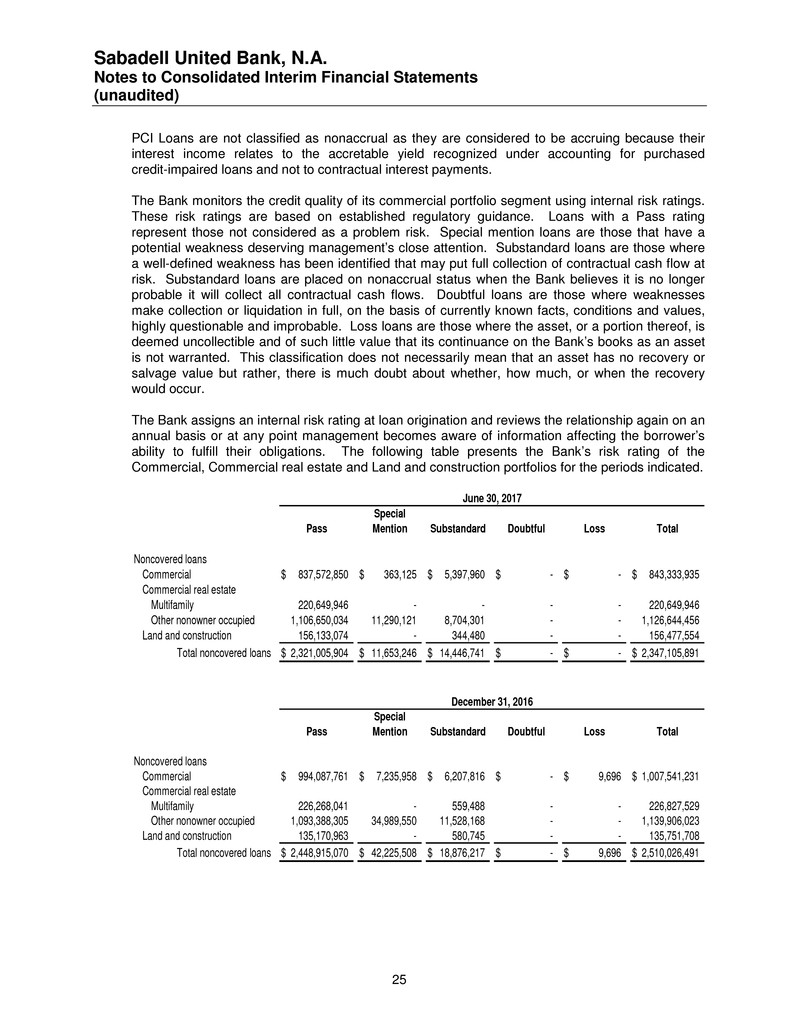
Sabadell United Bank, N.A. Notes to Consolidated Interim Financial Statements (unaudited) 25 PCI Loans are not classified as nonaccrual as they are considered to be accruing because their interest income relates to the accretable yield recognized under accounting for purchased credit-impaired loans and not to contractual interest payments. The Bank monitors the credit quality of its commercial portfolio segment using internal risk ratings. These risk ratings are based on established regulatory guidance. Loans with a Pass rating represent those not considered as a problem risk. Special mention loans are those that have a potential weakness deserving management’s close attention. Substandard loans are those where a well-defined weakness has been identified that may put full collection of contractual cash flow at risk. Substandard loans are placed on nonaccrual status when the Bank believes it is no longer probable it will collect all contractual cash flows. Doubtful loans are those where weaknesses make collection or liquidation in full, on the basis of currently known facts, conditions and values, highly questionable and improbable. Loss loans are those where the asset, or a portion thereof, is deemed uncollectible and of such little value that its continuance on the Bank’s books as an asset is not warranted. This classification does not necessarily mean that an asset has no recovery or salvage value but rather, there is much doubt about whether, how much, or when the recovery would occur. The Bank assigns an internal risk rating at loan origination and reviews the relationship again on an annual basis or at any point management becomes aware of information affecting the borrower’s ability to fulfill their obligations. The following table presents the Bank’s risk rating of the Commercial, Commercial real estate and Land and construction portfolios for the periods indicated. Special Pass Mention Substandard Doubtful Loss Total Noncovered loans Commercial 837,572,850$ 363,125$ 5,397,960$ -$ -$ 843,333,935$ Commercial real estate Multifamily 220,649,946 - - - - 220,649,946 Other nonowner occupied 1,106,650,034 11,290,121 8,704,301 - - 1,126,644,456 Land and construction 156,133,074 - 344,480 - - 156,477,554 Total noncovered loans 2,321,005,904$ 11,653,246$ 14,446,741$ -$ -$ 2,347,105,891$ June 30, 2017 Special Pass Mention Substandard Doubtful Loss Total Noncovered loans Commercial 994,087,761$ 7,235,958$ 6,207,816$ -$ 9,696$ 1,007,541,231$ Commercial real estate Multifamily 226,268,041 - 559,488 - - 226,827,529 Other nonowner occupied 1,093,388,305 34,989,550 11,528,168 - - 1,139,906,023 Land and construction 135,170,963 - 580,745 - - 135,751,708 Total noncovered loans 2,448,915,070$ 42,225,508$ 18,876,217$ -$ 9,696$ 2,510,026,491$ December 31, 2016
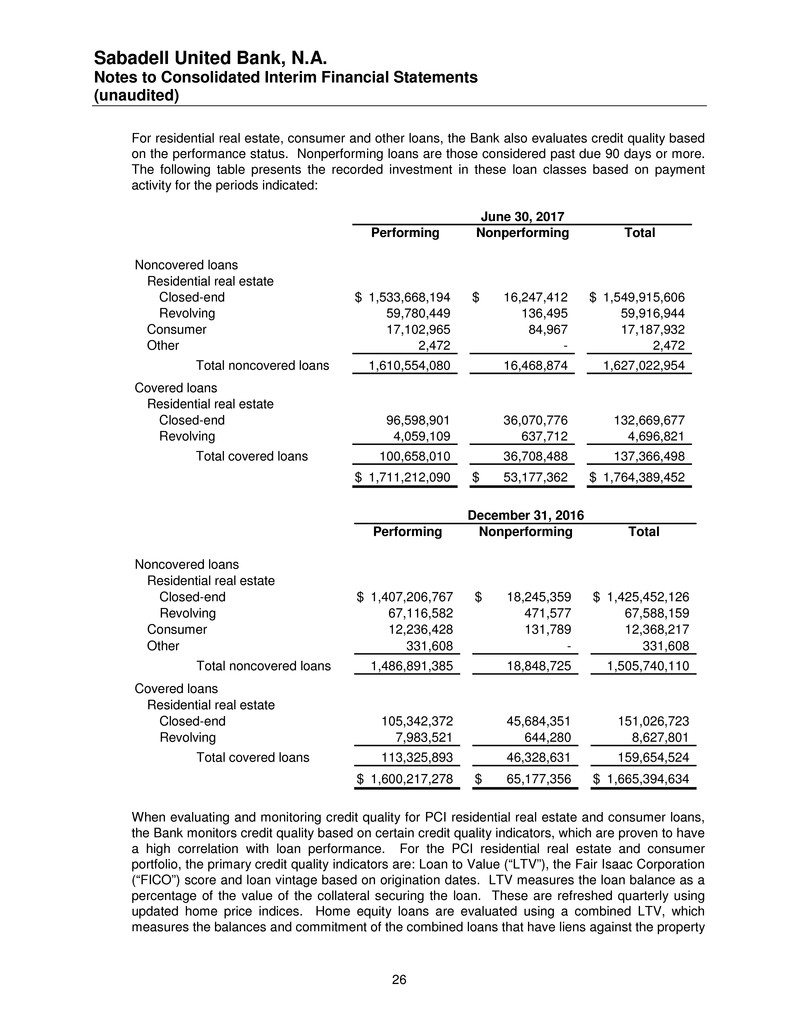
Sabadell United Bank, N.A. Notes to Consolidated Interim Financial Statements (unaudited) 26 For residential real estate, consumer and other loans, the Bank also evaluates credit quality based on the performance status. Nonperforming loans are those considered past due 90 days or more. The following table presents the recorded investment in these loan classes based on payment activity for the periods indicated: Performing Nonperforming Total Noncovered loans Residential real estate Closed-end 1,533,668,194$ 16,247,412$ 1,549,915,606$ Revolving 59,780,449 136,495 59,916,944 Consumer 17,102,965 84,967 17,187,932 Other 2,472 - 2,472 Total noncovered loans 1,610,554,080 16,468,874 1,627,022,954 Covered loans Residential real estate Closed-end 96,598,901 36,070,776 132,669,677 Revolving 4,059,109 637,712 4,696,821 Total covered loans 100,658,010 36,708,488 137,366,498 1,711,212,090$ 53,177,362$ 1,764,389,452$ June 30, 2017 Performing Nonperforming Total Noncovered loans Residential real estate Closed-end 1,407,206,767$ 18,245,359$ 1,425,452,126$ Revolving 67,116,582 471,577 67,588,159 Consumer 12,236,428 131,789 12,368,217 Other 331,608 - 331,608 Total noncovered loans 1,486,891,385 18,848,725 1,505,740,110 Covered loans Residential real estate Closed-end 105,342,372 45,684,351 151,026,723 Revolving 7,983,521 644,280 8,627,801 Total covered loans 113,325,893 46,328,631 159,654,524 1,600,217,278$ 65,177,356$ 1,665,394,634$ December 31, 2016 When evaluating and monitoring credit quality for PCI residential real estate and consumer loans, the Bank monitors credit quality based on certain credit quality indicators, which are proven to have a high correlation with loan performance. For the PCI residential real estate and consumer portfolio, the primary credit quality indicators are: Loan to Value (“LTV”), the Fair Isaac Corporation (“FICO”) score and loan vintage based on origination dates. LTV measures the loan balance as a percentage of the value of the collateral securing the loan. These are refreshed quarterly using updated home price indices. Home equity loans are evaluated using a combined LTV, which measures the balances and commitment of the combined loans that have liens against the property
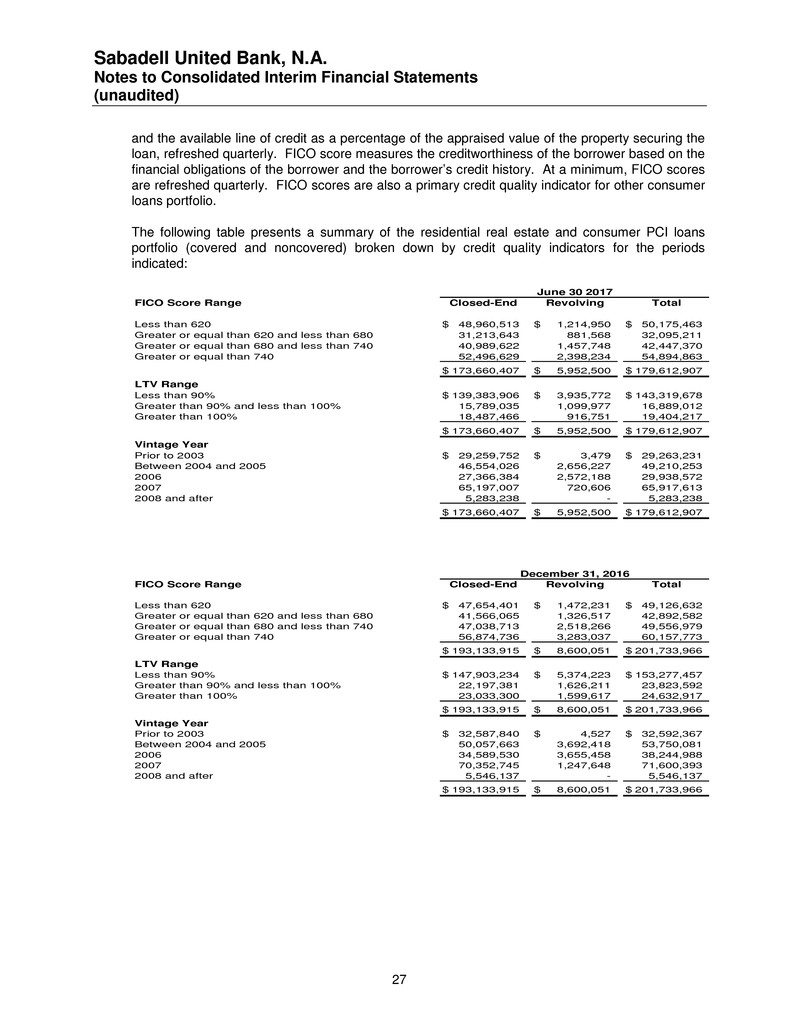
Sabadell United Bank, N.A. Notes to Consolidated Interim Financial Statements (unaudited) 27 and the available line of credit as a percentage of the appraised value of the property securing the loan, refreshed quarterly. FICO score measures the creditworthiness of the borrower based on the financial obligations of the borrower and the borrower’s credit history. At a minimum, FICO scores are refreshed quarterly. FICO scores are also a primary credit quality indicator for other consumer loans portfolio. The following table presents a summary of the residential real estate and consumer PCI loans portfolio (covered and noncovered) broken down by credit quality indicators for the periods indicated: FICO Score Range Closed-End Revolving Total Less than 620 48,960,513$ 1,214,950$ 50,175,463$ Greater or equal than 620 and less than 680 31,213,643 881,568 32,095,211 Greater or equal than 680 and less than 740 40,989,622 1,457,748 42,447,370 Greater or equal than 740 52,496,629 2,398,234 54,894,863 173,660,407$ 5,952,500$ 179,612,907$ LTV Range Less than 90% 139,383,906$ 3,935,772$ 143,319,678$ Greater than 90% and less than 100% 15,789,035 1,099,977 16,889,012 Greater than 100% 18,487,466 916,751 19,404,217 173,660,407$ 5,952,500$ 179,612,907$ Vintage Year Prior to 2003 29,259,752$ 3,479$ 29,263,231$ Between 2004 and 2005 46,554,026 2,656,227 49,210,253 2006 27,366,384 2,572,188 29,938,572 2007 65,197,007 720,606 65,917,613 2008 and after 5,283,238 - 5,283,238 173,660,407$ 5,952,500$ 179,612,907$ June 30 2017 FICO Score Range Closed-End Revolving Total Less than 620 47,654,401$ 1,472,231$ 49,126,632$ Greater or equal than 620 and less than 680 41,566,065 1,326,517 42,892,582 Greater or equal than 680 and less than 740 47,038,713 2,518,266 49,556,979 Greater or equal than 740 56,874,736 3,283,037 60,157,773 193,133,915$ 8,600,051$ 201,733,966$ LTV Range Less than 90% 147,903,234$ 5,374,223$ 153,277,457$ Greater than 90% and less than 100% 22,197,381 1,626,211 23,823,592 Greater than 100% 23,033,300 1,599,617 24,632,917 193,133,915$ 8,600,051$ 201,733,966$ Vintage Year Prior to 2003 32,587,840$ 4,527$ 32,592,367$ Between 2004 and 2005 50,057,663 3,692,418 53,750,081 2006 34,589,530 3,655,458 38,244,988 2007 70,352,745 1,247,648 71,600,393 2008 and after 5,546,137 - 5,546,137 193,133,915$ 8,600,051$ 201,733,966$ December 31, 2016
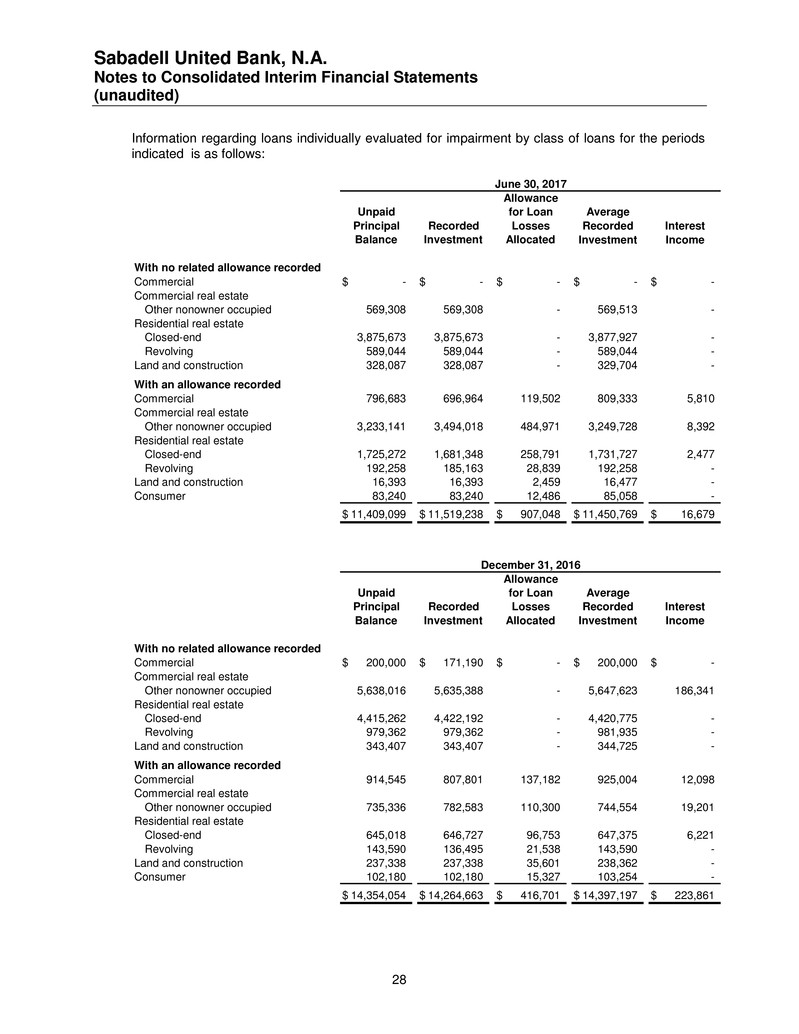
Sabadell United Bank, N.A. Notes to Consolidated Interim Financial Statements (unaudited) 28 Information regarding loans individually evaluated for impairment by class of loans for the periods indicated is as follows: Allowance Unpaid for Loan Average Principal Recorded Losses Recorded Interest Balance Investment Allocated Investment Income With no related allowance recorded Commercial -$ -$ -$ -$ -$ Commercial real estate Other nonowner occupied 569,308 569,308 - 569,513 - Residential real estate Closed-end 3,875,673 3,875,673 - 3,877,927 - Revolving 589,044 589,044 - 589,044 - Land and construction 328,087 328,087 - 329,704 - With an allowance recorded Commercial 796,683 696,964 119,502 809,333 5,810 Commercial real estate Other nonowner occupied 3,233,141 3,494,018 484,971 3,249,728 8,392 Residential real estate Closed-end 1,725,272 1,681,348 258,791 1,731,727 2,477 Revolving 192,258 185,163 28,839 192,258 - Land and construction 16,393 16,393 2,459 16,477 - Consumer 83,240 83,240 12,486 85,058 - 11,409,099$ 11,519,238$ 907,048$ 11,450,769$ 16,679$ June 30, 2017 Allowance Unpaid for Loan Average Principal Recorded Losses Recorded Interest Balance Investment Allocated Investment Income With no related allowance recorded Commercial 200,000$ 171,190$ -$ 200,000$ -$ Commercial real estate Other nonowner occupied 5,638,016 5,635,388 - 5,647,623 186,341 Residential real estate Closed-end 4,415,262 4,422,192 - 4,420,775 - Revolving 979,362 979,362 - 981,935 - Land and construction 343,407 343,407 - 344,725 - With an allowance recorded Commercial 914,545 807,801 137,182 925,004 12,098 Commercial real estate Other nonowner occupied 735,336 782,583 110,300 744,554 19,201 Residential real estate Closed-end 645,018 646,727 96,753 647,375 6,221 Revolving 143,590 136,495 21,538 143,590 - Land and construction 237,338 237,338 35,601 238,362 - Consumer 102,180 102,180 15,327 103,254 - 14,354,054$ 14,264,663$ 416,701$ 14,397,197$ 223,861$ December 31, 2016
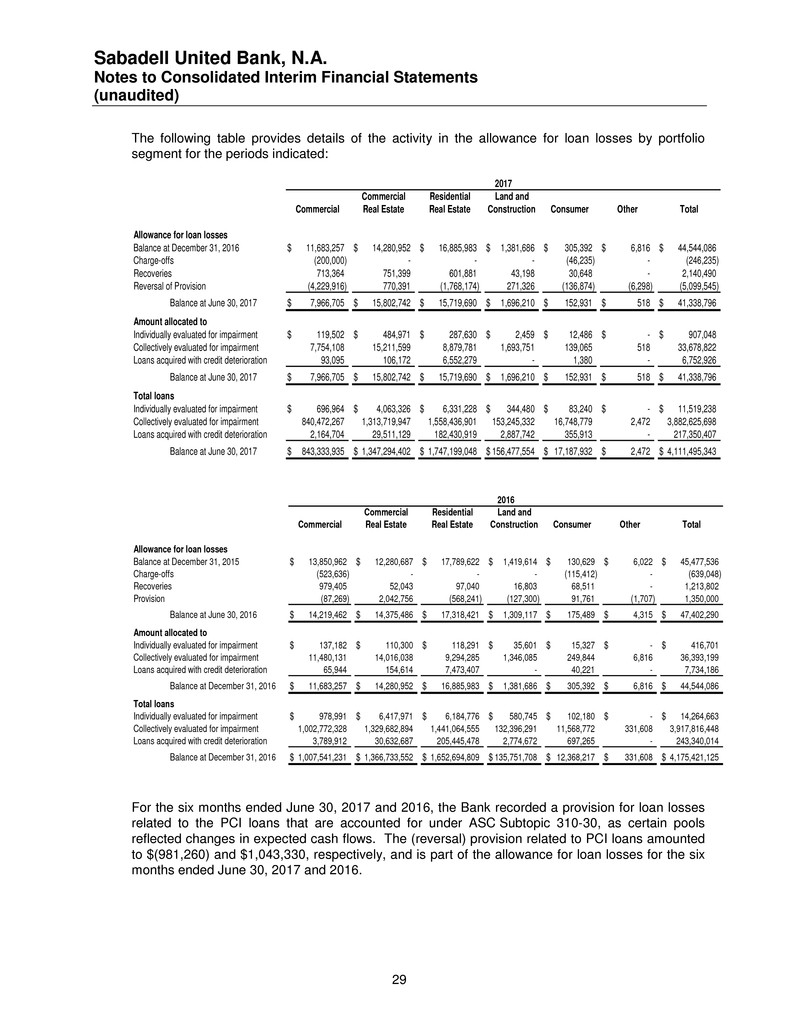
Sabadell United Bank, N.A. Notes to Consolidated Interim Financial Statements (unaudited) 29 The following table provides details of the activity in the allowance for loan losses by portfolio segment for the periods indicated: Commercial Residential Land and Commercial Real Estate Real Estate Construction Consumer Other Total Allowance for loan losses Balance at December 31, 2016 11,683,257$ 14,280,952$ 16,885,983$ 1,381,686$ 305,392$ 6,816$ 44,544,086$ Charge-offs (200,000) - - - (46,235) - (246,235) Recoveries 713,364 751,399 601,881 43,198 30,648 - 2,140,490 Reversal of Provision (4,229,916) 770,391 (1,768,174) 271,326 (136,874) (6,298) (5,099,545) Balance at June 30, 2017 7,966,705$ 15,802,742$ 15,719,690$ 1,696,210$ 152,931$ 518$ 41,338,796$ Amount allocated to Individually evaluated for impairment 119,502$ 484,971$ 287,630$ 2,459$ 12,486$ -$ 907,048$ Collectively evaluated for impairment 7,754,108 15,211,599 8,879,781 1,693,751 139,065 518 33,678,822 Loans acquired with credit deterioration 93,095 106,172 6,552,279 - 1,380 - 6,752,926 Balance at June 30, 2017 7,966,705$ 15,802,742$ 15,719,690$ 1,696,210$ 152,931$ 518$ 41,338,796$ Total loans Individually evaluated for impairment 696,964$ 4,063,326$ 6,331,228$ 344,480$ 83,240$ -$ 11,519,238$ Collectively evaluated for impairment 840,472,267 1,313,719,947 1,558,436,901 153,245,332 16,748,779 2,472 3,882,625,698 Loans acquired with credit deterioration 2,164,704 29,511,129 182,430,919 2,887,742 355,913 - 217,350,407 Balance at June 30, 2017 843,333,935$ 1,347,294,402$ 1,747,199,048$ 156,477,554$ 17,187,932$ 2,472$ 4,111,495,343$ 2017 Commercial Residential Land and Commercial Real Estate Real Estate Construction Consumer Other Total Allowance for loan losses Balance at December 31, 2015 13,850,962$ 12,280,687$ 17,789,622$ 1,419,614$ 130,629$ 6,022$ 45,477,536$ Charge-offs (523,636) - - - (115,412) - (639,048) Recoveries 979,405 52,043 97,040 16,803 68,511 - 1,213,802 Provision (87,269) 2,042,756 (568,241) (127,300) 91,761 (1,707) 1,350,000 Balance at June 30, 2016 14,219,462$ 14,375,486$ 17,318,421$ 1,309,117$ 175,489$ 4,315$ 47,402,290$ Amount allocated to Individually evaluated for impairment 137,182$ 110,300$ 118,291$ 35,601$ 15,327$ -$ 416,701$ Collectively evaluated for impairment 11,480,131 14,016,038 9,294,285 1,346,085 249,844 6,816 36,393,199 Loans acquired with credit deterioration 65,944 154,614 7,473,407 - 40,221 - 7,734,186 Balance at December 31, 2016 11,683,257$ 14,280,952$ 16,885,983$ 1,381,686$ 305,392$ 6,816$ 44,544,086$ Total loans Individually evaluated for impairment 978,991$ 6,417,971$ 6,184,776$ 580,745$ 102,180$ -$ 14,264,663$ Collectively evaluated for impairment 1,002,772,328 1,329,682,894 1,441,064,555 132,396,291 11,568,772 331,608 3,917,816,448 Loans acquired with credit deterioration 3,789,912 30,632,687 205,445,478 2,774,672 697,265 - 243,340,014 Balance at December 31, 2016 1,007,541,231$ 1,366,733,552$ 1,652,694,809$ 135,751,708$ 12,368,217$ 331,608$ 4,175,421,125$ 2016 For the six months ended June 30, 2017 and 2016, the Bank recorded a provision for loan losses related to the PCI loans that are accounted for under ASC Subtopic 310-30, as certain pools reflected changes in expected cash flows. The (reversal) provision related to PCI loans amounted to $(981,260) and $1,043,330, respectively, and is part of the allowance for loan losses for the six months ended June 30, 2017 and 2016.
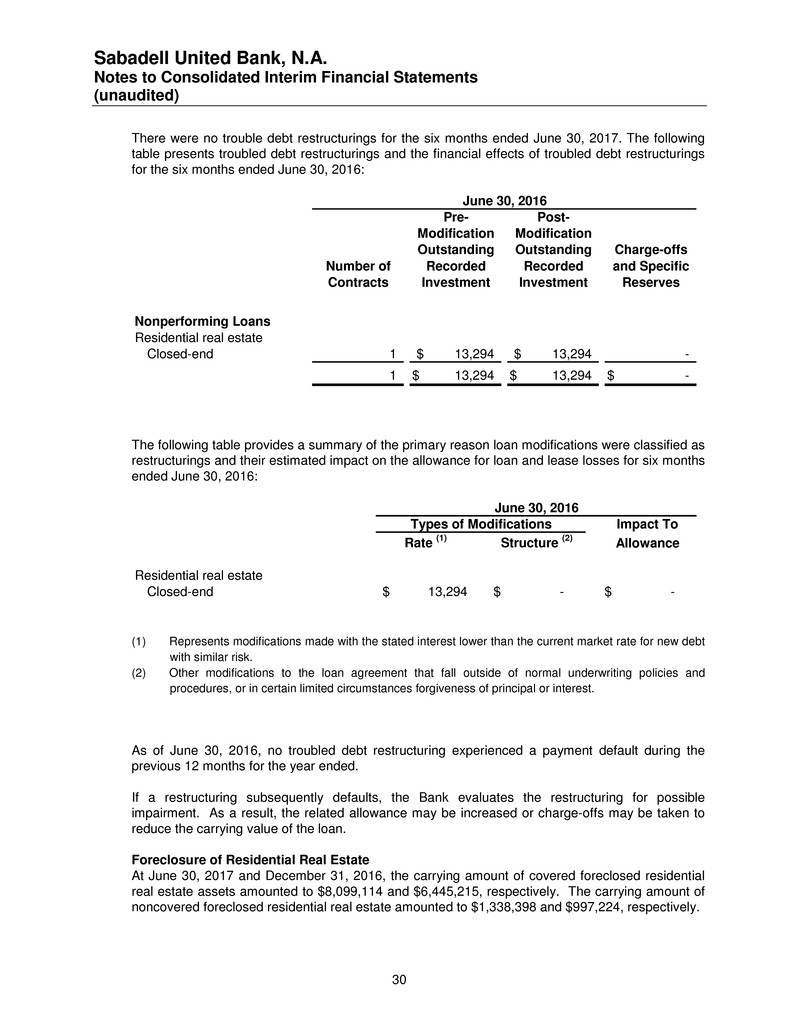
Sabadell United Bank, N.A. Notes to Consolidated Interim Financial Statements (unaudited) 30 There were no trouble debt restructurings for the six months ended June 30, 2017. The following table presents troubled debt restructurings and the financial effects of troubled debt restructurings for the six months ended June 30, 2016: Pre- Post- Modification Modification Outstanding Outstanding Charge-offs Number of Recorded Recorded and Specific Contracts Investment Investment Reserves Nonperforming Loans Residential real estate Closed-end 1 13,294$ 13,294$ - 1 13,294$ 13,294$ -$ June 30, 2016 The following table provides a summary of the primary reason loan modifications were classified as restructurings and their estimated impact on the allowance for loan and lease losses for six months ended June 30, 2016: Impact To Rate (1) Structure (2) Allowance Residential real estate Closed-end 13,294$ -$ -$ Types of Modifications June 30, 2016 (1) Represents modifications made with the stated interest lower than the current market rate for new debt with similar risk. (2) Other modifications to the loan agreement that fall outside of normal underwriting policies and procedures, or in certain limited circumstances forgiveness of principal or interest. As of June 30, 2016, no troubled debt restructuring experienced a payment default during the previous 12 months for the year ended. If a restructuring subsequently defaults, the Bank evaluates the restructuring for possible impairment. As a result, the related allowance may be increased or charge-offs may be taken to reduce the carrying value of the loan. Foreclosure of Residential Real Estate At June 30, 2017 and December 31, 2016, the carrying amount of covered foreclosed residential real estate assets amounted to $8,099,114 and $6,445,215, respectively. The carrying amount of noncovered foreclosed residential real estate amounted to $1,338,398 and $997,224, respectively.
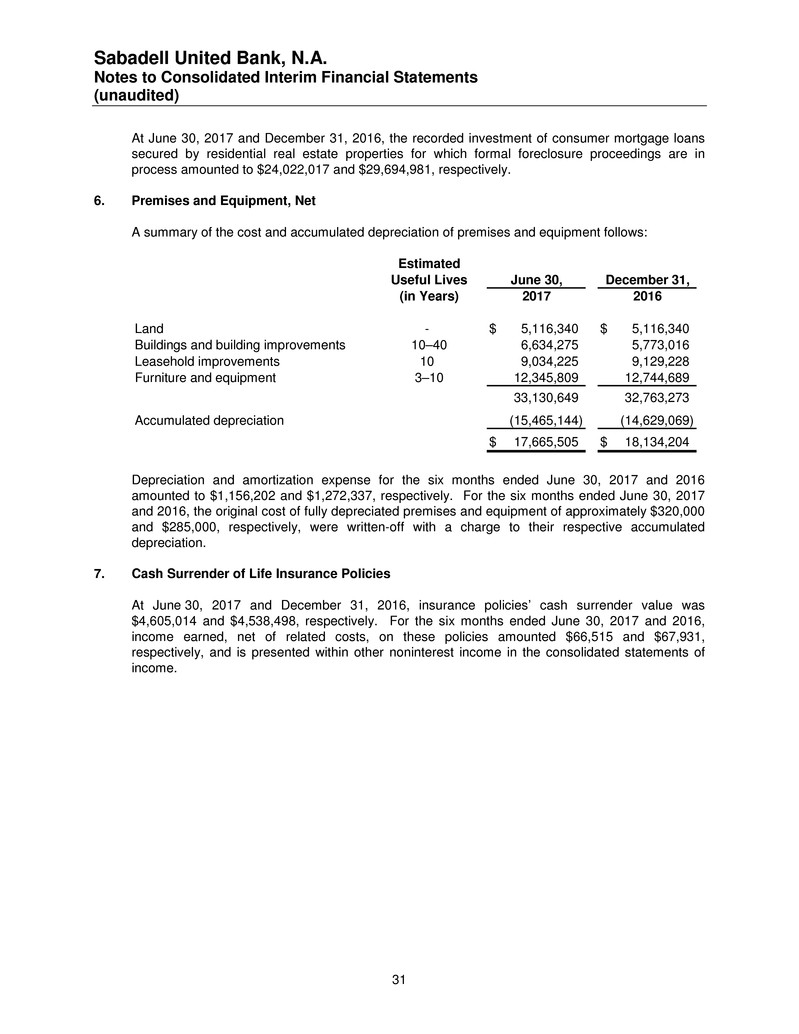
Sabadell United Bank, N.A. Notes to Consolidated Interim Financial Statements (unaudited) 31 At June 30, 2017 and December 31, 2016, the recorded investment of consumer mortgage loans secured by residential real estate properties for which formal foreclosure proceedings are in process amounted to $24,022,017 and $29,694,981, respectively. 6. Premises and Equipment, Net A summary of the cost and accumulated depreciation of premises and equipment follows: Estimated Useful Lives June 30, December 31, (in Years) 2017 2016 Land - 5,116,340$ 5,116,340$ Buildings and building improvements 10–40 6,634,275 5,773,016 Leasehold improvements 10 9,034,225 9,129,228 Furniture and equipment 3–10 12,345,809 12,744,689 33,130,649 32,763,273 Accumulated depreciation (15,465,144) (14,629,069) 17,665,505$ 18,134,204$ Depreciation and amortization expense for the six months ended June 30, 2017 and 2016 amounted to $1,156,202 and $1,272,337, respectively. For the six months ended June 30, 2017 and 2016, the original cost of fully depreciated premises and equipment of approximately $320,000 and $285,000, respectively, were written-off with a charge to their respective accumulated depreciation. 7. Cash Surrender of Life Insurance Policies At June 30, 2017 and December 31, 2016, insurance policies’ cash surrender value was $4,605,014 and $4,538,498, respectively. For the six months ended June 30, 2017 and 2016, income earned, net of related costs, on these policies amounted $66,515 and $67,931, respectively, and is presented within other noninterest income in the consolidated statements of income.
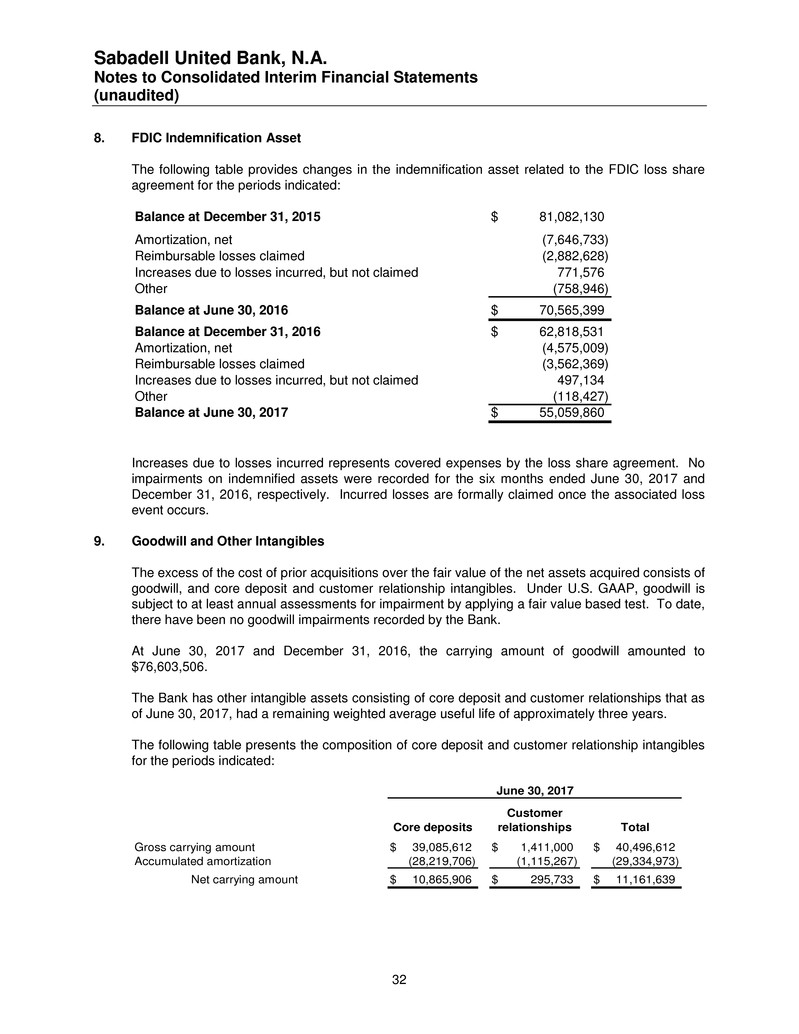
Sabadell United Bank, N.A. Notes to Consolidated Interim Financial Statements (unaudited) 32 8. FDIC Indemnification Asset The following table provides changes in the indemnification asset related to the FDIC loss share agreement for the periods indicated: Balance at December 31, 2015 81,082,130$ Amortization, net (7,646,733) Reimbursable losses claimed (2,882,628) Increases due to losses incurred, but not claimed 771,576 Other (758,946) Balance at June 30, 2016 70,565,399$ Balance at December 31, 2016 62,818,531$ Amortization, net (4,575,009) Reimbursable losses claimed (3,562,369) Increases due to losses incurred, but not claimed 497,134 Other (118,427) Balance at June 30, 2017 55,059,860$ Increases due to losses incurred represents covered expenses by the loss share agreement. No impairments on indemnified assets were recorded for the six months ended June 30, 2017 and December 31, 2016, respectively. Incurred losses are formally claimed once the associated loss event occurs. 9. Goodwill and Other Intangibles The excess of the cost of prior acquisitions over the fair value of the net assets acquired consists of goodwill, and core deposit and customer relationship intangibles. Under U.S. GAAP, goodwill is subject to at least annual assessments for impairment by applying a fair value based test. To date, there have been no goodwill impairments recorded by the Bank. At June 30, 2017 and December 31, 2016, the carrying amount of goodwill amounted to $76,603,506. The Bank has other intangible assets consisting of core deposit and customer relationships that as of June 30, 2017, had a remaining weighted average useful life of approximately three years. The following table presents the composition of core deposit and customer relationship intangibles for the periods indicated: Core deposits Customer relationships Total Gross carrying amount 39,085,612$ 1,411,000$ 40,496,612$ Accumulated amortization (28,219,706) (1,115,267) (29,334,973) Net carrying amount 10,865,906$ 295,733$ 11,161,639$ June 30, 2017
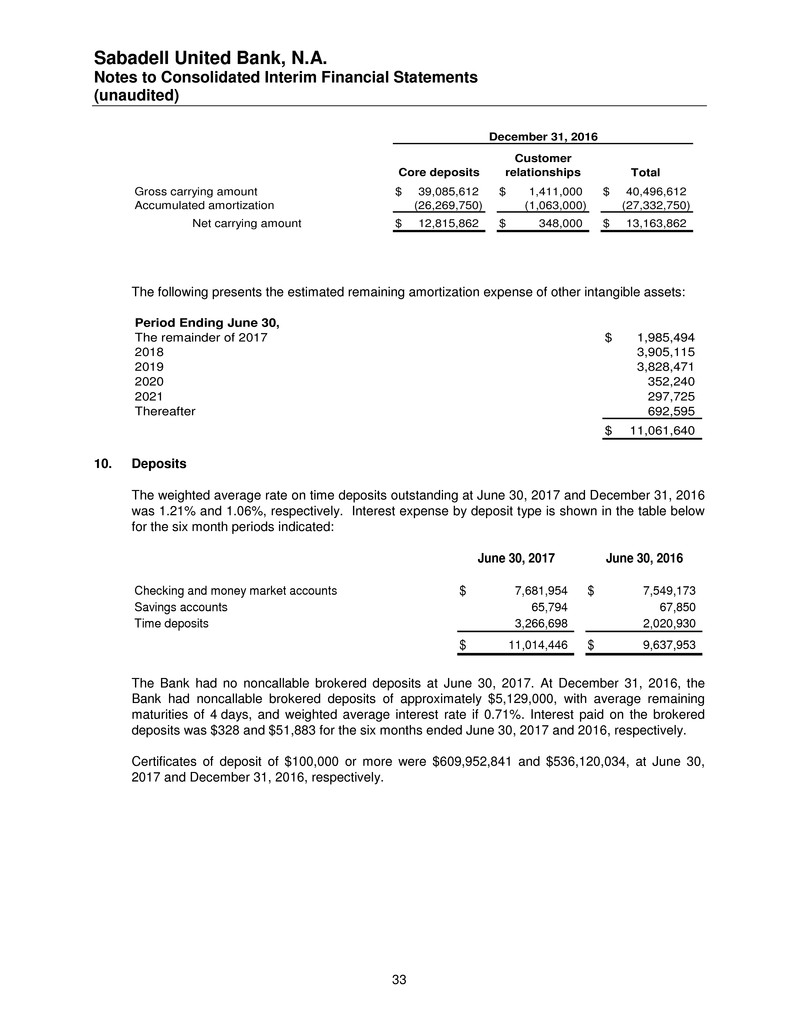
Sabadell United Bank, N.A. Notes to Consolidated Interim Financial Statements (unaudited) 33 Core deposits Customer relationships Total Gross carrying amount 39,085,612$ 1,411,000$ 40,496,612$ Accumulated amortization (26,269,750) (1,063,000) (27,332,750) Net carrying amount 12,815,862$ 348,000$ 13,163,862$ December 31, 2016 The following presents the estimated remaining amortization expense of other intangible assets: Period Ending June 30, The remainder of 2017 1,985,494$ 2018 3,905,115 2019 3,828,471 2020 352,240 2021 297,725 Thereafter 692,595 11,061,640$ 10. Deposits The weighted average rate on time deposits outstanding at June 30, 2017 and December 31, 2016 was 1.21% and 1.06%, respectively. Interest expense by deposit type is shown in the table below for the six month periods indicated: June 30, 2017 June 30, 2016 Checking and money market accounts 7,681,954$ 7,549,173$ Savings accounts 65,794 67,850 Time deposits 3,266,698 2,020,930 11,014,446$ 9,637,953$ The Bank had no noncallable brokered deposits at June 30, 2017. At December 31, 2016, the Bank had noncallable brokered deposits of approximately $5,129,000, with average remaining maturities of 4 days, and weighted average interest rate if 0.71%. Interest paid on the brokered deposits was $328 and $51,883 for the six months ended June 30, 2017 and 2016, respectively. Certificates of deposit of $100,000 or more were $609,952,841 and $536,120,034, at June 30, 2017 and December 31, 2016, respectively.
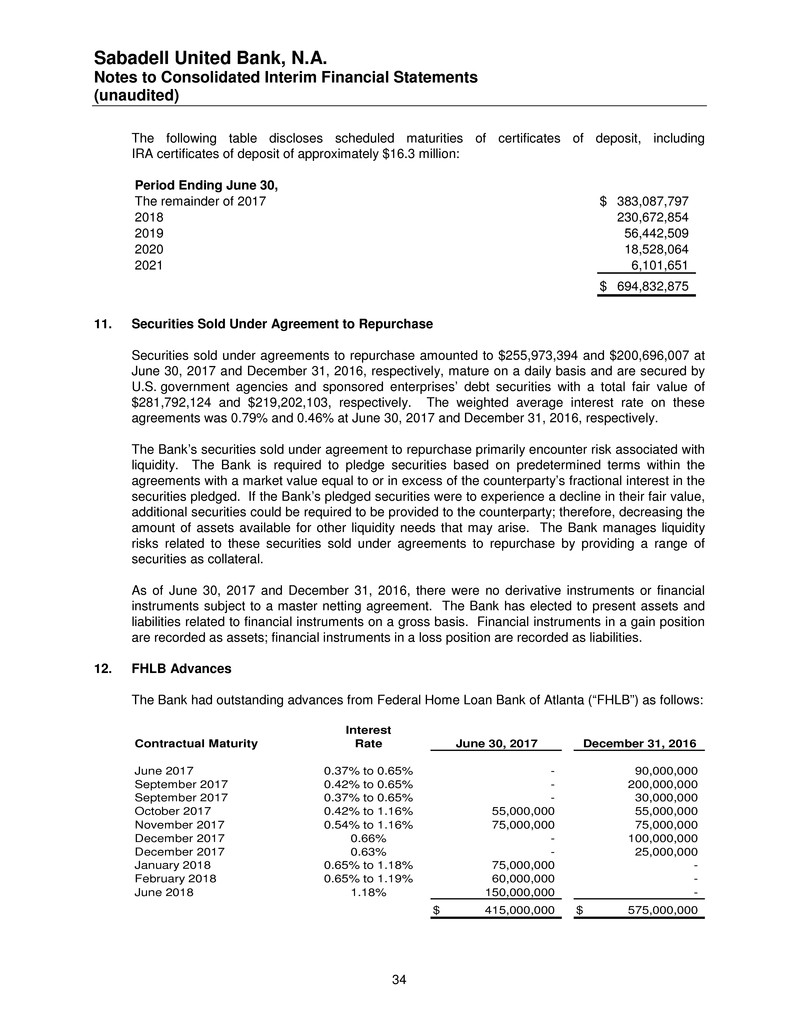
Sabadell United Bank, N.A. Notes to Consolidated Interim Financial Statements (unaudited) 34 The following table discloses scheduled maturities of certificates of deposit, including IRA certificates of deposit of approximately $16.3 million: Period Ending June 30, The remainder of 2017 383,087,797$ 2018 230,672,854 2019 56,442,509 2020 18,528,064 2021 6,101,651 694,832,875$ 11. Securities Sold Under Agreement to Repurchase Securities sold under agreements to repurchase amounted to $255,973,394 and $200,696,007 at June 30, 2017 and December 31, 2016, respectively, mature on a daily basis and are secured by U.S. government agencies and sponsored enterprises’ debt securities with a total fair value of $281,792,124 and $219,202,103, respectively. The weighted average interest rate on these agreements was 0.79% and 0.46% at June 30, 2017 and December 31, 2016, respectively. The Bank’s securities sold under agreement to repurchase primarily encounter risk associated with liquidity. The Bank is required to pledge securities based on predetermined terms within the agreements with a market value equal to or in excess of the counterparty’s fractional interest in the securities pledged. If the Bank’s pledged securities were to experience a decline in their fair value, additional securities could be required to be provided to the counterparty; therefore, decreasing the amount of assets available for other liquidity needs that may arise. The Bank manages liquidity risks related to these securities sold under agreements to repurchase by providing a range of securities as collateral. As of June 30, 2017 and December 31, 2016, there were no derivative instruments or financial instruments subject to a master netting agreement. The Bank has elected to present assets and liabilities related to financial instruments on a gross basis. Financial instruments in a gain position are recorded as assets; financial instruments in a loss position are recorded as liabilities. 12. FHLB Advances The Bank had outstanding advances from Federal Home Loan Bank of Atlanta (“FHLB”) as follows: Interest Contractual Maturity Rate June 30, 2017 December 31, 2016 June 2017 0.37% to 0.65% - 90,000,000 September 2017 0.42% to 0.65% - 200,000,000 September 2017 0.37% to 0.65% - 30,000,000 October 2017 0.42% to 1.16% 55,000,000 55,000,000 November 2017 0.54% to 1.16% 75,000,000 75,000,000 December 2017 0.66% - 100,000,000 December 2017 0.63% - 25,000,000 January 2018 0.65% to 1.18% 75,000,000 - February 2018 0.65% to 1.19% 60,000,000 - June 2018 1.18% 150,000,000 - 415,000,000$ 575,000,000$
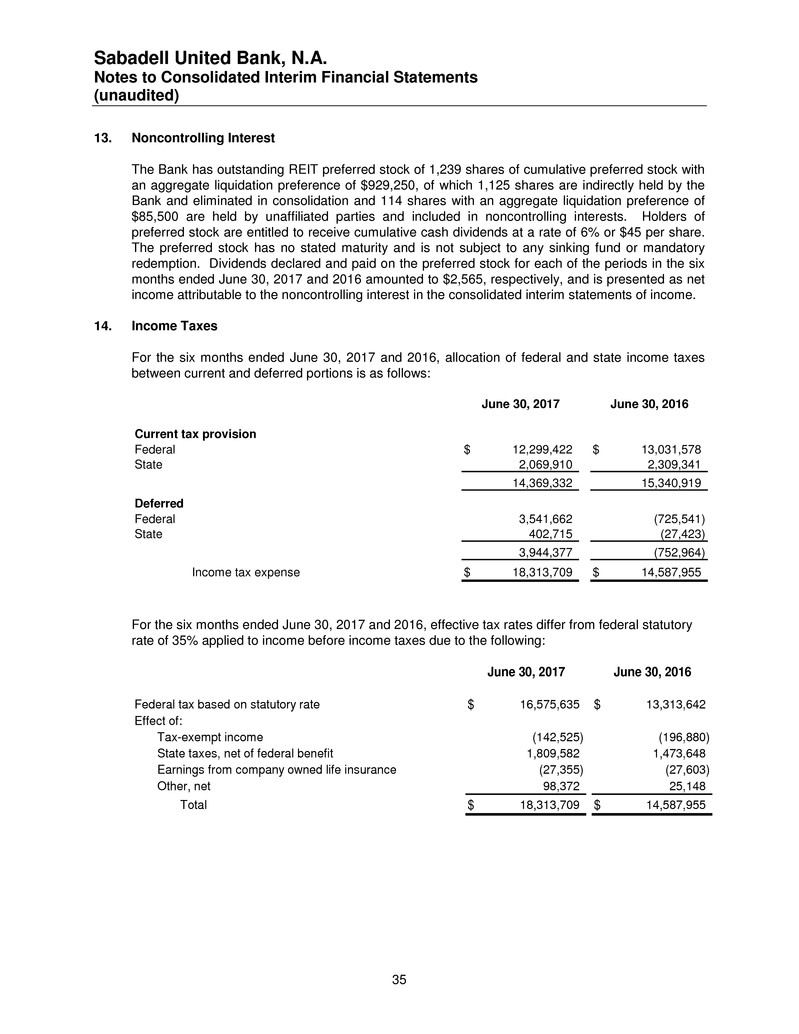
Sabadell United Bank, N.A. Notes to Consolidated Interim Financial Statements (unaudited) 35 13. Noncontrolling Interest The Bank has outstanding REIT preferred stock of 1,239 shares of cumulative preferred stock with an aggregate liquidation preference of $929,250, of which 1,125 shares are indirectly held by the Bank and eliminated in consolidation and 114 shares with an aggregate liquidation preference of $85,500 are held by unaffiliated parties and included in noncontrolling interests. Holders of preferred stock are entitled to receive cumulative cash dividends at a rate of 6% or $45 per share. The preferred stock has no stated maturity and is not subject to any sinking fund or mandatory redemption. Dividends declared and paid on the preferred stock for each of the periods in the six months ended June 30, 2017 and 2016 amounted to $2,565, respectively, and is presented as net income attributable to the noncontrolling interest in the consolidated interim statements of income. 14. Income Taxes For the six months ended June 30, 2017 and 2016, allocation of federal and state income taxes between current and deferred portions is as follows: June 30, 2017 June 30, 2016 Current tax provision Federal 12,299,422$ 13,031,578$ State 2,069,910 2,309,341 14,369,332 15,340,919 Deferred Federal 3,541,662 (725,541) State 402,715 (27,423) 3,944,377 (752,964) Income tax expense 18,313,709$ 14,587,955$ For the six months ended June 30, 2017 and 2016, effective tax rates differ from federal statutory rate of 35% applied to income before income taxes due to the following: June 30, 2017 June 30, 2016 Federal tax based on statutory rate 16,575,635$ 13,313,642$ Effect of: Tax-exempt income (142,525) (196,880) State taxes, net of federal benefit 1,809,582 1,473,648 Earnings from company owned life insurance (27,355) (27,603) Other, net 98,372 25,148 Total 18,313,709$ 14,587,955$
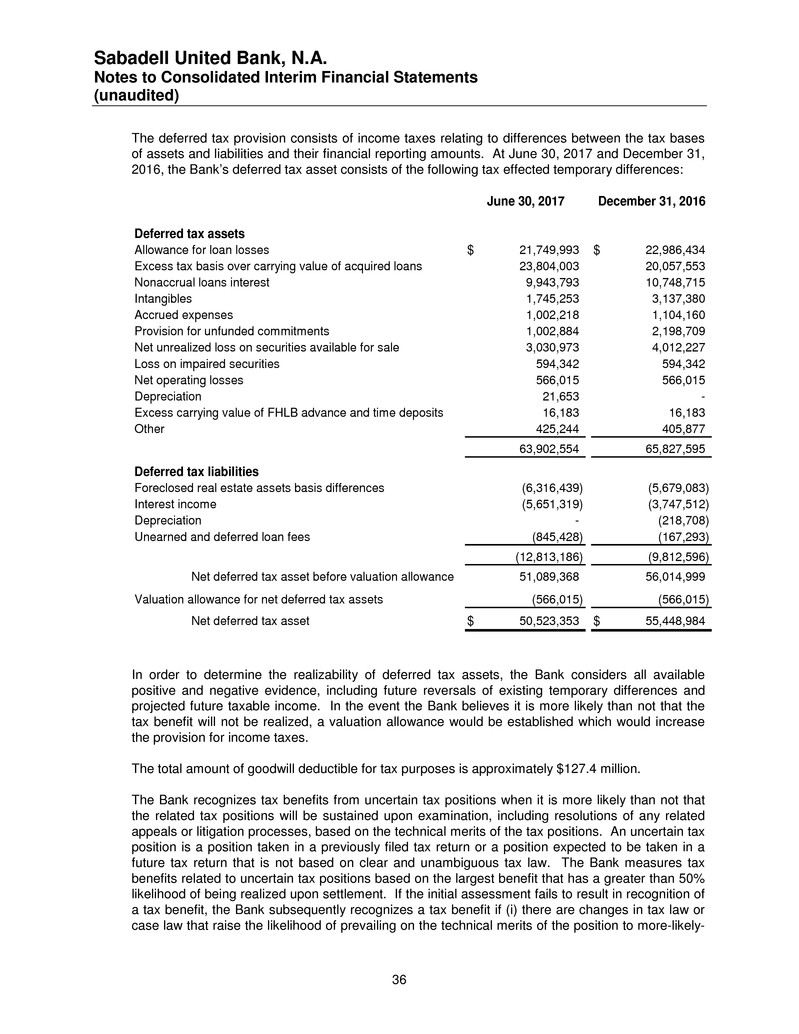
Sabadell United Bank, N.A. Notes to Consolidated Interim Financial Statements (unaudited) 36 The deferred tax provision consists of income taxes relating to differences between the tax bases of assets and liabilities and their financial reporting amounts. At June 30, 2017 and December 31, 2016, the Bank’s deferred tax asset consists of the following tax effected temporary differences: June 30, 2017 December 31, 2016 Deferred tax assets Allowance for loan losses 21,749,993$ 22,986,434$ Excess tax basis over carrying value of acquired loans 23,804,003 20,057,553 Nonaccrual loans interest 9,943,793 10,748,715 Intangibles 1,745,253 3,137,380 Accrued expenses 1,002,218 1,104,160 Provision for unfunded commitments 1,002,884 2,198,709 Net unrealized loss on securities available for sale 3,030,973 4,012,227 Loss on impaired securities 594,342 594,342 Net operating losses 566,015 566,015 Depreciation 21,653 - Excess carrying value of FHLB advance and time deposits 16,183 16,183 Other 425,244 405,877 63,902,554 65,827,595 Deferred tax liabilities Foreclosed real estate assets basis differences (6,316,439) (5,679,083) Interest income (5,651,319) (3,747,512) Depreciation - (218,708) Unearned and deferred loan fees (845,428) (167,293) (12,813,186) (9,812,596) Net deferred tax asset before valuation allowance 51,089,368 56,014,999 Valuation allowance for net deferred tax assets (566,015) (566,015) Net deferred tax asset 50,523,353$ 55,448,984$ In order to determine the realizability of deferred tax assets, the Bank considers all available positive and negative evidence, including future reversals of existing temporary differences and projected future taxable income. In the event the Bank believes it is more likely than not that the tax benefit will not be realized, a valuation allowance would be established which would increase the provision for income taxes. The total amount of goodwill deductible for tax purposes is approximately $127.4 million. The Bank recognizes tax benefits from uncertain tax positions when it is more likely than not that the related tax positions will be sustained upon examination, including resolutions of any related appeals or litigation processes, based on the technical merits of the tax positions. An uncertain tax position is a position taken in a previously filed tax return or a position expected to be taken in a future tax return that is not based on clear and unambiguous tax law. The Bank measures tax benefits related to uncertain tax positions based on the largest benefit that has a greater than 50% likelihood of being realized upon settlement. If the initial assessment fails to result in recognition of a tax benefit, the Bank subsequently recognizes a tax benefit if (i) there are changes in tax law or case law that raise the likelihood of prevailing on the technical merits of the position to more-likely-
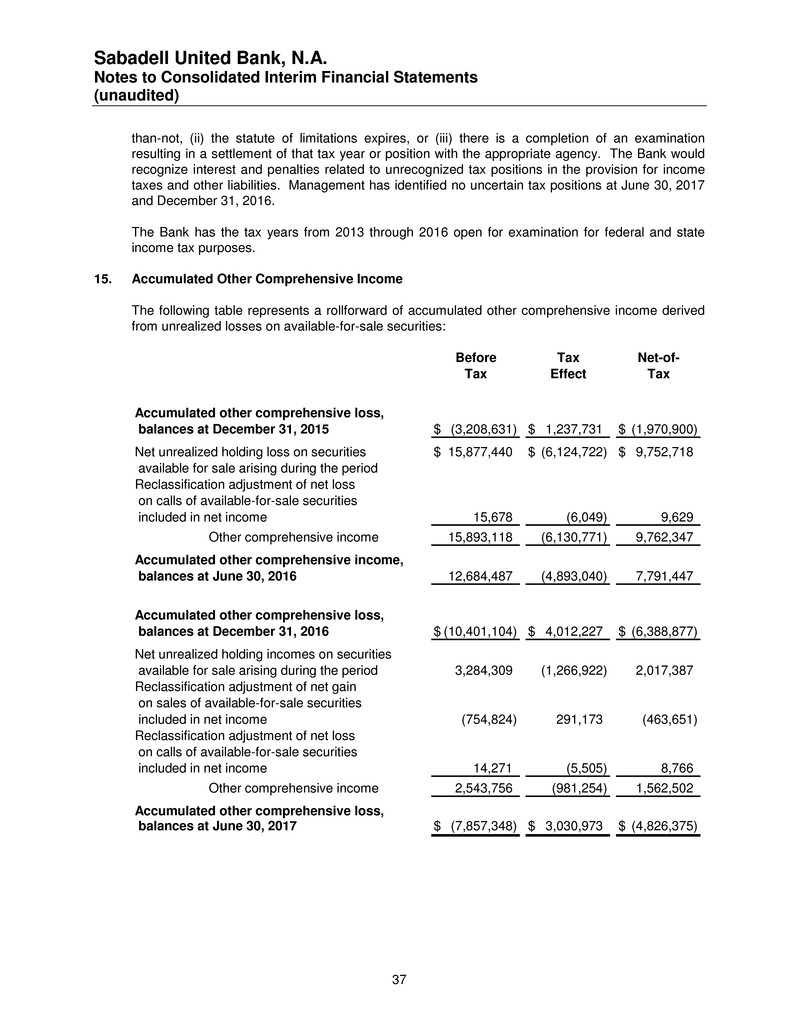
Sabadell United Bank, N.A. Notes to Consolidated Interim Financial Statements (unaudited) 37 than-not, (ii) the statute of limitations expires, or (iii) there is a completion of an examination resulting in a settlement of that tax year or position with the appropriate agency. The Bank would recognize interest and penalties related to unrecognized tax positions in the provision for income taxes and other liabilities. Management has identified no uncertain tax positions at June 30, 2017 and December 31, 2016. The Bank has the tax years from 2013 through 2016 open for examination for federal and state income tax purposes. 15. Accumulated Other Comprehensive Income The following table represents a rollforward of accumulated other comprehensive income derived from unrealized losses on available-for-sale securities: Before Tax Net-of- Tax Effect Tax Accumulated other comprehensive loss, balances at December 31, 2015 (3,208,631)$ 1,237,731$ (1,970,900)$ Net unrealized holding loss on securities 15,877,440$ (6,124,722)$ 9,752,718$ available for sale arising during the period Reclassification adjustment of net loss on calls of available-for-sale securities included in net income 15,678 (6,049) 9,629 Other comprehensive income 15,893,118 (6,130,771) 9,762,347 Accumulated other comprehensive income, balances at June 30, 2016 12,684,487 (4,893,040) 7,791,447 Accumulated other comprehensive loss, balances at December 31, 2016 (10,401,104)$ 4,012,227$ (6,388,877)$ Net unrealized holding incomes on securities available for sale arising during the period 3,284,309 (1,266,922) 2,017,387 Reclassification adjustment of net gain on sales of available-for-sale securities included in net income (754,824) 291,173 (463,651) Reclassification adjustment of net loss on calls of available-for-sale securities included in net income 14,271 (5,505) 8,766 Other comprehensive income 2,543,756 (981,254) 1,562,502 Accumulated other comprehensive loss, balances at June 30, 2017 (7,857,348)$ 3,030,973$ (4,826,375)$
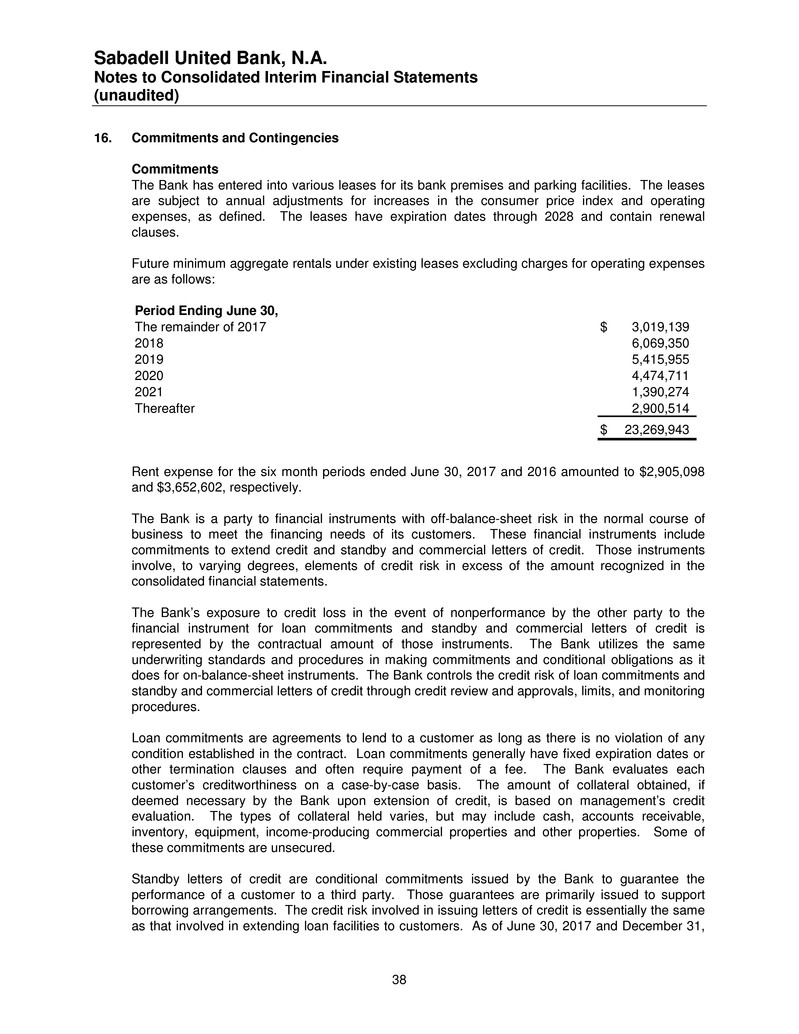
Sabadell United Bank, N.A. Notes to Consolidated Interim Financial Statements (unaudited) 38 16. Commitments and Contingencies Commitments The Bank has entered into various leases for its bank premises and parking facilities. The leases are subject to annual adjustments for increases in the consumer price index and operating expenses, as defined. The leases have expiration dates through 2028 and contain renewal clauses. Future minimum aggregate rentals under existing leases excluding charges for operating expenses are as follows: Period Ending June 30, The remainder of 2017 3,019,139$ 2018 6,069,350 2019 5,415,955 2020 4,474,711 2021 1,390,274 Thereafter 2,900,514 23,269,943$ Rent expense for the six month periods ended June 30, 2017 and 2016 amounted to $2,905,098 and $3,652,602, respectively. The Bank is a party to financial instruments with off-balance-sheet risk in the normal course of business to meet the financing needs of its customers. These financial instruments include commitments to extend credit and standby and commercial letters of credit. Those instruments involve, to varying degrees, elements of credit risk in excess of the amount recognized in the consolidated financial statements. The Bank’s exposure to credit loss in the event of nonperformance by the other party to the financial instrument for loan commitments and standby and commercial letters of credit is represented by the contractual amount of those instruments. The Bank utilizes the same underwriting standards and procedures in making commitments and conditional obligations as it does for on-balance-sheet instruments. The Bank controls the credit risk of loan commitments and standby and commercial letters of credit through credit review and approvals, limits, and monitoring procedures. Loan commitments are agreements to lend to a customer as long as there is no violation of any condition established in the contract. Loan commitments generally have fixed expiration dates or other termination clauses and often require payment of a fee. The Bank evaluates each customer’s creditworthiness on a case-by-case basis. The amount of collateral obtained, if deemed necessary by the Bank upon extension of credit, is based on management’s credit evaluation. The types of collateral held varies, but may include cash, accounts receivable, inventory, equipment, income-producing commercial properties and other properties. Some of these commitments are unsecured. Standby letters of credit are conditional commitments issued by the Bank to guarantee the performance of a customer to a third party. Those guarantees are primarily issued to support borrowing arrangements. The credit risk involved in issuing letters of credit is essentially the same as that involved in extending loan facilities to customers. As of June 30, 2017 and December 31,

Sabadell United Bank, N.A. Notes to Consolidated Interim Financial Statements (unaudited) 39 2016, the Bank’s standby letters of credit have remaining terms ranging from 7 days to 3 years, and 17 days to 3 years, respectively. The Bank’s exposure to credit loss is represented by the contractual amount of these commitments. The Bank holds deposits and mortgages as collateral supporting some of the standby letters of credit commitments. The extent of collateral held for those commitments as of June 30, 2017 and December 31, 2016, respectively, ranges from unsecured commitments to commitments fully collateralized. Off-balance sheet financial instruments whose contract amount represents credit risk, most of which are short term, are as follows: June 30, 2017 December 31, 2016 Commitments to extend credit (unused lines of credit and unfunded loans available to borrowers) 501,629,711$ 524,710,916$ Standby letters of credit 19,551,765 33,471,144 Commercial letters of credit 138,139 139,008 521,319,615$ 558,321,068$ Contract Amount Contingencies The Bank is involved as plaintiff or defendant in various legal actions arising in the normal course of business. While the ultimate outcome of any such proceedings cannot be predicted with certainty, it is the opinion of management, based upon advice of legal counsel, that no proceedings exist, either individually or in the aggregate, which, if resolved adversely to the Bank, would have a material effect on the Bank’s financial position, results of operations or cash flows. 17. Fair Value Measurement The following is a description of the methodologies used to estimate the fair values of assets and liabilities measured at fair value on a recurring basis, and the level within the fair value hierarchy in which those measurements are typically classified. Level 1 Valuation Techniques The valuation of U.S. Government Treasury debt securities is based on quoted prices for identical assets or liabilities in actives market that can be accessed as of measurement date. Level 2 Valuation Techniques The valuation of securities available for sale is performed through a monthly pricing process using data provided by third parties considered leading global providers of independent data pricing services (“the Pricing Providers”). These pricing providers collect, use and incorporate descriptive market data from various sources, quotes and indicators from leading broker dealers to generate independent and objective valuations.
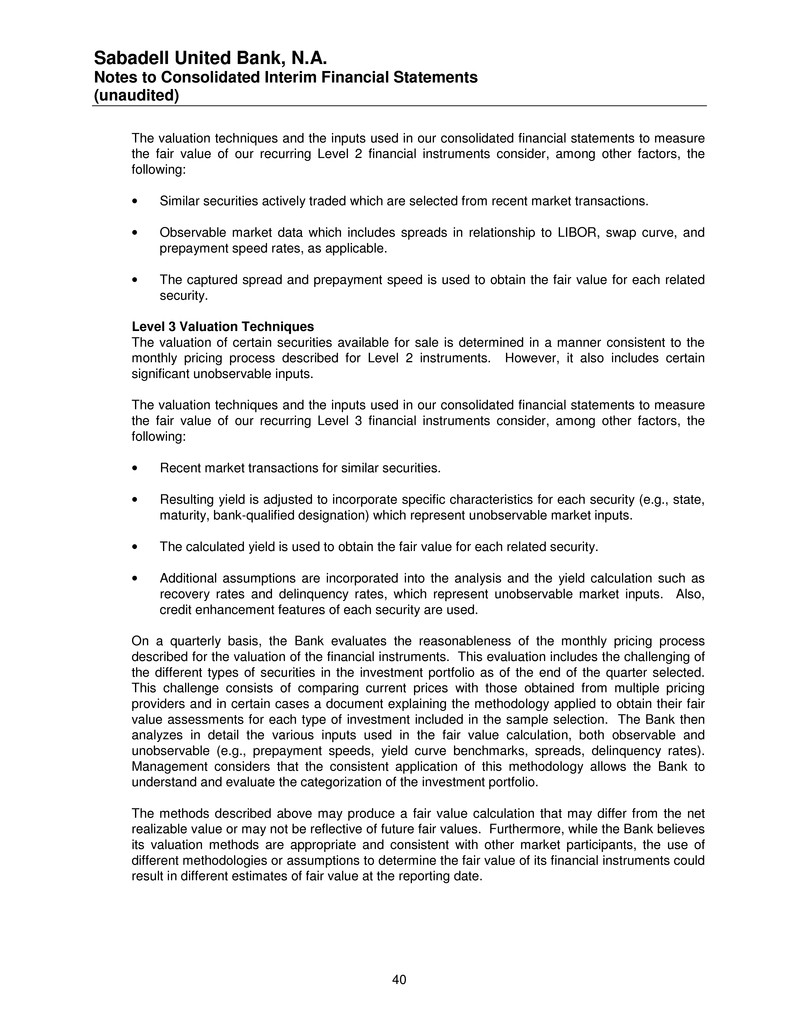
Sabadell United Bank, N.A. Notes to Consolidated Interim Financial Statements (unaudited) 40 The valuation techniques and the inputs used in our consolidated financial statements to measure the fair value of our recurring Level 2 financial instruments consider, among other factors, the following: • Similar securities actively traded which are selected from recent market transactions. • Observable market data which includes spreads in relationship to LIBOR, swap curve, and prepayment speed rates, as applicable. • The captured spread and prepayment speed is used to obtain the fair value for each related security. Level 3 Valuation Techniques The valuation of certain securities available for sale is determined in a manner consistent to the monthly pricing process described for Level 2 instruments. However, it also includes certain significant unobservable inputs. The valuation techniques and the inputs used in our consolidated financial statements to measure the fair value of our recurring Level 3 financial instruments consider, among other factors, the following: • Recent market transactions for similar securities. • Resulting yield is adjusted to incorporate specific characteristics for each security (e.g., state, maturity, bank-qualified designation) which represent unobservable market inputs. • The calculated yield is used to obtain the fair value for each related security. • Additional assumptions are incorporated into the analysis and the yield calculation such as recovery rates and delinquency rates, which represent unobservable market inputs. Also, credit enhancement features of each security are used. On a quarterly basis, the Bank evaluates the reasonableness of the monthly pricing process described for the valuation of the financial instruments. This evaluation includes the challenging of the different types of securities in the investment portfolio as of the end of the quarter selected. This challenge consists of comparing current prices with those obtained from multiple pricing providers and in certain cases a document explaining the methodology applied to obtain their fair value assessments for each type of investment included in the sample selection. The Bank then analyzes in detail the various inputs used in the fair value calculation, both observable and unobservable (e.g., prepayment speeds, yield curve benchmarks, spreads, delinquency rates). Management considers that the consistent application of this methodology allows the Bank to understand and evaluate the categorization of the investment portfolio. The methods described above may produce a fair value calculation that may differ from the net realizable value or may not be reflective of future fair values. Furthermore, while the Bank believes its valuation methods are appropriate and consistent with other market participants, the use of different methodologies or assumptions to determine the fair value of its financial instruments could result in different estimates of fair value at the reporting date.
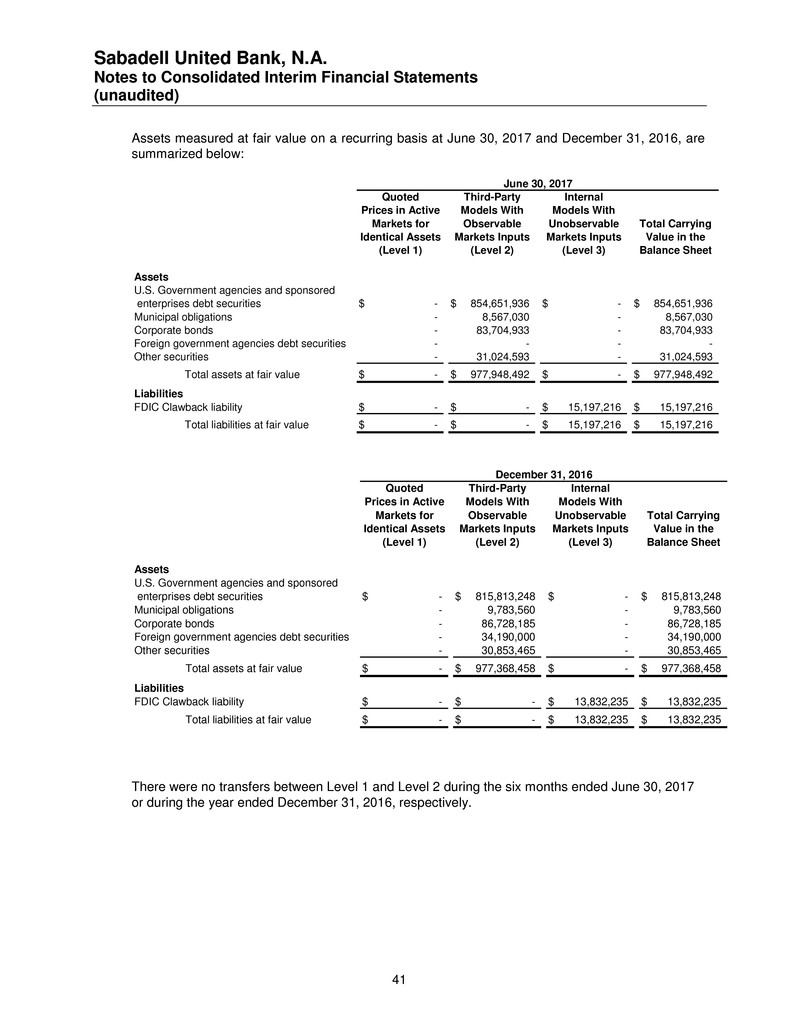
Sabadell United Bank, N.A. Notes to Consolidated Interim Financial Statements (unaudited) 41 Assets measured at fair value on a recurring basis at June 30, 2017 and December 31, 2016, are summarized below: Quoted Third-Party Internal Prices in Active Models With Models With Markets for Observable Unobservable Total Carrying Identical Assets Markets Inputs Markets Inputs Value in the (Level 1) (Level 2) (Level 3) Balance Sheet Assets U.S. Government agencies and sponsored enterprises debt securities -$ 854,651,936$ -$ 854,651,936$ Municipal obligations - 8,567,030 - 8,567,030 Corporate bonds - 83,704,933 - 83,704,933 Foreign government agencies debt securities - - - - Other securities - 31,024,593 - 31,024,593 Total assets at fair value -$ 977,948,492$ -$ 977,948,492$ Liabilities FDIC Clawback liability -$ -$ 15,197,216$ 15,197,216$ Total liabilities at fair value -$ -$ 15,197,216$ 15,197,216$ June 30, 2017 Quoted Third-Party Internal Prices in Active Models With Models With Markets for Observable Unobservable Total Carrying Identical Assets Markets Inputs Markets Inputs Value in the (Level 1) (Level 2) (Level 3) Balance Sheet Assets U.S. Government agencies and sponsored enterprises debt securities -$ 815,813,248$ -$ 815,813,248$ Municipal obligations - 9,783,560 - 9,783,560 Corporate bonds - 86,728,185 - 86,728,185 Foreign government agencies debt securities - 34,190,000 - 34,190,000 Other securities - 30,853,465 - 30,853,465 Total assets at fair value -$ 977,368,458$ -$ 977,368,458$ Liabilities FDIC Clawback liability -$ -$ 13,832,235$ 13,832,235$ Total liabilities at fair value -$ -$ 13,832,235$ 13,832,235$ December 31, 2016 There were no transfers between Level 1 and Level 2 during the six months ended June 30, 2017 or during the year ended December 31, 2016, respectively.
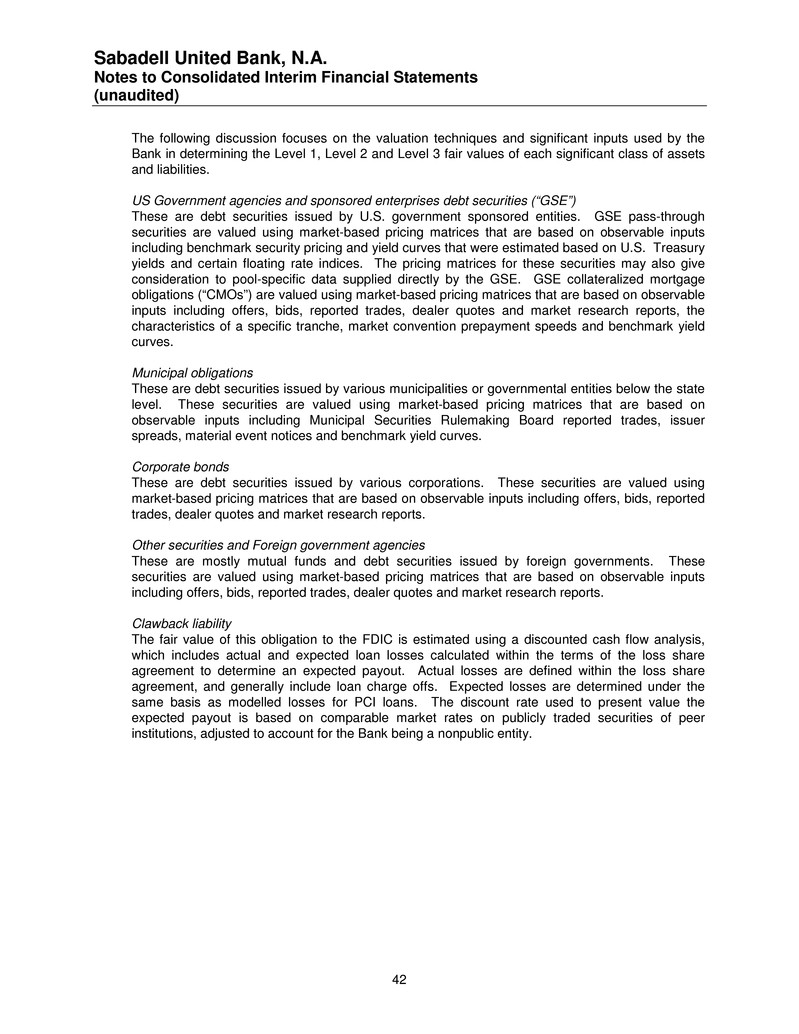
Sabadell United Bank, N.A. Notes to Consolidated Interim Financial Statements (unaudited) 42 The following discussion focuses on the valuation techniques and significant inputs used by the Bank in determining the Level 1, Level 2 and Level 3 fair values of each significant class of assets and liabilities. US Government agencies and sponsored enterprises debt securities (“GSE”) These are debt securities issued by U.S. government sponsored entities. GSE pass-through securities are valued using market-based pricing matrices that are based on observable inputs including benchmark security pricing and yield curves that were estimated based on U.S. Treasury yields and certain floating rate indices. The pricing matrices for these securities may also give consideration to pool-specific data supplied directly by the GSE. GSE collateralized mortgage obligations (“CMOs”) are valued using market-based pricing matrices that are based on observable inputs including offers, bids, reported trades, dealer quotes and market research reports, the characteristics of a specific tranche, market convention prepayment speeds and benchmark yield curves. Municipal obligations These are debt securities issued by various municipalities or governmental entities below the state level. These securities are valued using market-based pricing matrices that are based on observable inputs including Municipal Securities Rulemaking Board reported trades, issuer spreads, material event notices and benchmark yield curves. Corporate bonds These are debt securities issued by various corporations. These securities are valued using market-based pricing matrices that are based on observable inputs including offers, bids, reported trades, dealer quotes and market research reports. Other securities and Foreign government agencies These are mostly mutual funds and debt securities issued by foreign governments. These securities are valued using market-based pricing matrices that are based on observable inputs including offers, bids, reported trades, dealer quotes and market research reports. Clawback liability The fair value of this obligation to the FDIC is estimated using a discounted cash flow analysis, which includes actual and expected loan losses calculated within the terms of the loss share agreement to determine an expected payout. Actual losses are defined within the loss share agreement, and generally include loan charge offs. Expected losses are determined under the same basis as modelled losses for PCI loans. The discount rate used to present value the expected payout is based on comparable market rates on publicly traded securities of peer institutions, adjusted to account for the Bank being a nonpublic entity.
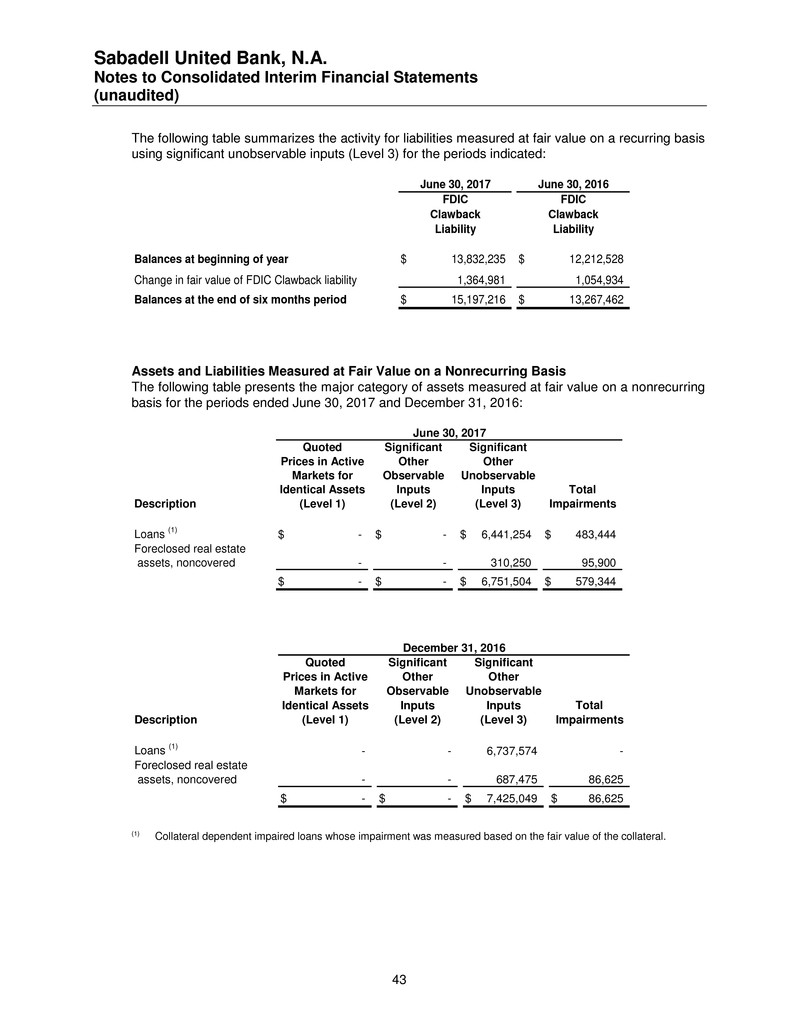
Sabadell United Bank, N.A. Notes to Consolidated Interim Financial Statements (unaudited) 43 The following table summarizes the activity for liabilities measured at fair value on a recurring basis using significant unobservable inputs (Level 3) for the periods indicated: June 30, 2017 June 30, 2016 FDIC FDIC Clawback Clawback Liability Liability Balances at beginning of year 13,832,235$ 12,212,528$ Change in fair value of FDIC Clawback liability 1,364,981 1,054,934 Balances at the end of six months period 15,197,216$ 13,267,462$ Assets and Liabilities Measured at Fair Value on a Nonrecurring Basis The following table presents the major category of assets measured at fair value on a nonrecurring basis for the periods ended June 30, 2017 and December 31, 2016: Quoted Significant Significant Prices in Active Other Other Markets for Observable Unobservable Identical Assets Inputs Inputs Total Description (Level 1) (Level 2) (Level 3) Impairments Loans (1) -$ -$ 6,441,254$ 483,444$ Foreclosed real estate assets, noncovered - - 310,250 95,900 -$ -$ 6,751,504$ 579,344$ June 30, 2017 Quoted Significant Significant Prices in Active Other Other Markets for Observable Unobservable Identical Assets Inputs Inputs Total Description (Level 1) (Level 2) (Level 3) Impairments Loans (1) - - 6,737,574 - Foreclosed real estate assets, noncovered - - 687,475 86,625 -$ -$ 7,425,049$ 86,625$ December 31, 2016 (1) Collateral dependent impaired loans whose impairment was measured based on the fair value of the collateral.
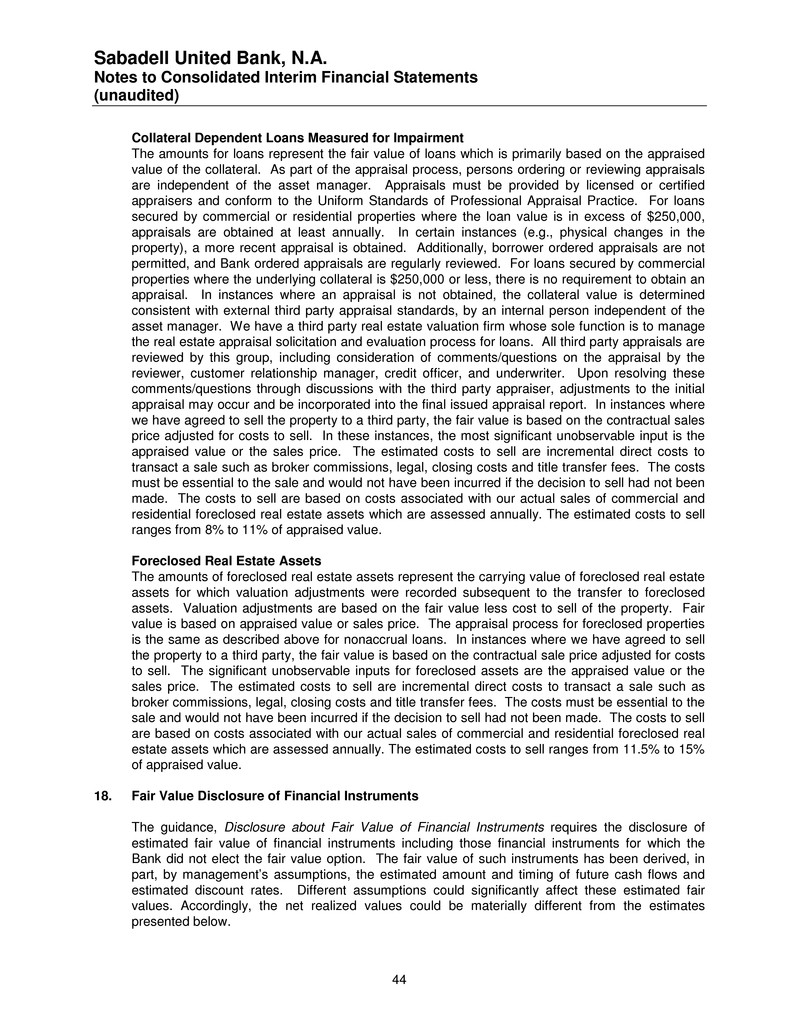
Sabadell United Bank, N.A. Notes to Consolidated Interim Financial Statements (unaudited) 44 Collateral Dependent Loans Measured for Impairment The amounts for loans represent the fair value of loans which is primarily based on the appraised value of the collateral. As part of the appraisal process, persons ordering or reviewing appraisals are independent of the asset manager. Appraisals must be provided by licensed or certified appraisers and conform to the Uniform Standards of Professional Appraisal Practice. For loans secured by commercial or residential properties where the loan value is in excess of $250,000, appraisals are obtained at least annually. In certain instances (e.g., physical changes in the property), a more recent appraisal is obtained. Additionally, borrower ordered appraisals are not permitted, and Bank ordered appraisals are regularly reviewed. For loans secured by commercial properties where the underlying collateral is $250,000 or less, there is no requirement to obtain an appraisal. In instances where an appraisal is not obtained, the collateral value is determined consistent with external third party appraisal standards, by an internal person independent of the asset manager. We have a third party real estate valuation firm whose sole function is to manage the real estate appraisal solicitation and evaluation process for loans. All third party appraisals are reviewed by this group, including consideration of comments/questions on the appraisal by the reviewer, customer relationship manager, credit officer, and underwriter. Upon resolving these comments/questions through discussions with the third party appraiser, adjustments to the initial appraisal may occur and be incorporated into the final issued appraisal report. In instances where we have agreed to sell the property to a third party, the fair value is based on the contractual sales price adjusted for costs to sell. In these instances, the most significant unobservable input is the appraised value or the sales price. The estimated costs to sell are incremental direct costs to transact a sale such as broker commissions, legal, closing costs and title transfer fees. The costs must be essential to the sale and would not have been incurred if the decision to sell had not been made. The costs to sell are based on costs associated with our actual sales of commercial and residential foreclosed real estate assets which are assessed annually. The estimated costs to sell ranges from 8% to 11% of appraised value. Foreclosed Real Estate Assets The amounts of foreclosed real estate assets represent the carrying value of foreclosed real estate assets for which valuation adjustments were recorded subsequent to the transfer to foreclosed assets. Valuation adjustments are based on the fair value less cost to sell of the property. Fair value is based on appraised value or sales price. The appraisal process for foreclosed properties is the same as described above for nonaccrual loans. In instances where we have agreed to sell the property to a third party, the fair value is based on the contractual sale price adjusted for costs to sell. The significant unobservable inputs for foreclosed assets are the appraised value or the sales price. The estimated costs to sell are incremental direct costs to transact a sale such as broker commissions, legal, closing costs and title transfer fees. The costs must be essential to the sale and would not have been incurred if the decision to sell had not been made. The costs to sell are based on costs associated with our actual sales of commercial and residential foreclosed real estate assets which are assessed annually. The estimated costs to sell ranges from 11.5% to 15% of appraised value. 18. Fair Value Disclosure of Financial Instruments The guidance, Disclosure about Fair Value of Financial Instruments requires the disclosure of estimated fair value of financial instruments including those financial instruments for which the Bank did not elect the fair value option. The fair value of such instruments has been derived, in part, by management’s assumptions, the estimated amount and timing of future cash flows and estimated discount rates. Different assumptions could significantly affect these estimated fair values. Accordingly, the net realized values could be materially different from the estimates presented below.
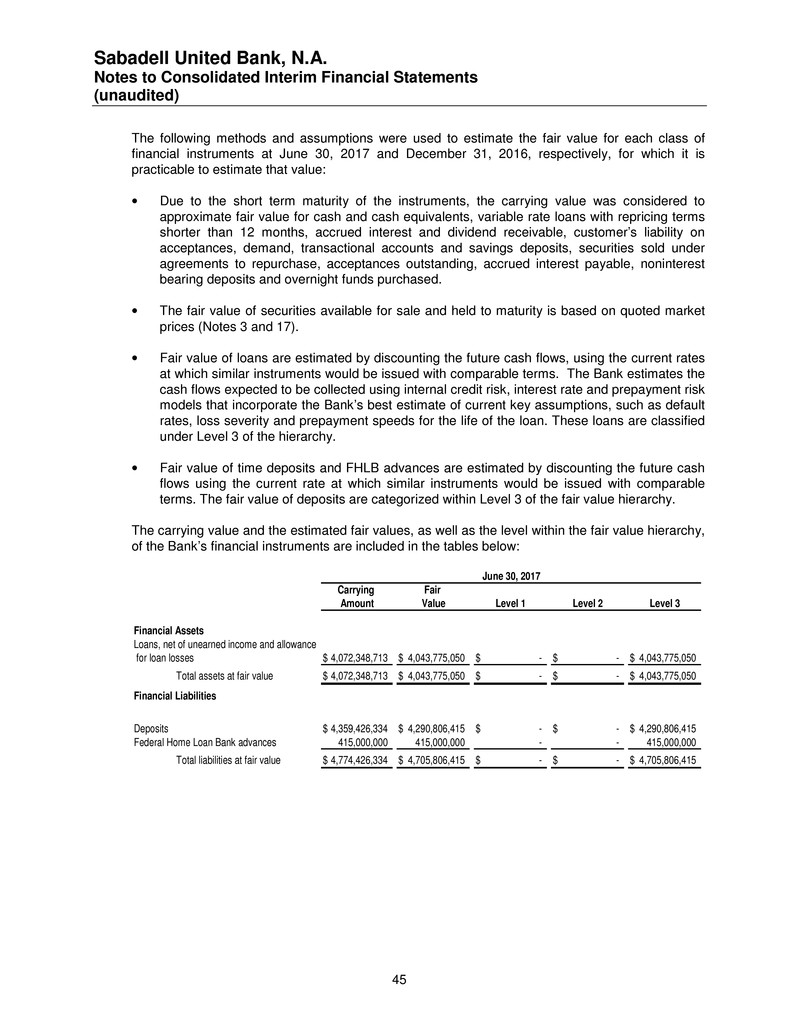
Sabadell United Bank, N.A. Notes to Consolidated Interim Financial Statements (unaudited) 45 The following methods and assumptions were used to estimate the fair value for each class of financial instruments at June 30, 2017 and December 31, 2016, respectively, for which it is practicable to estimate that value: • Due to the short term maturity of the instruments, the carrying value was considered to approximate fair value for cash and cash equivalents, variable rate loans with repricing terms shorter than 12 months, accrued interest and dividend receivable, customer’s liability on acceptances, demand, transactional accounts and savings deposits, securities sold under agreements to repurchase, acceptances outstanding, accrued interest payable, noninterest bearing deposits and overnight funds purchased. • The fair value of securities available for sale and held to maturity is based on quoted market prices (Notes 3 and 17). • Fair value of loans are estimated by discounting the future cash flows, using the current rates at which similar instruments would be issued with comparable terms. The Bank estimates the cash flows expected to be collected using internal credit risk, interest rate and prepayment risk models that incorporate the Bank’s best estimate of current key assumptions, such as default rates, loss severity and prepayment speeds for the life of the loan. These loans are classified under Level 3 of the hierarchy. • Fair value of time deposits and FHLB advances are estimated by discounting the future cash flows using the current rate at which similar instruments would be issued with comparable terms. The fair value of deposits are categorized within Level 3 of the fair value hierarchy. The carrying value and the estimated fair values, as well as the level within the fair value hierarchy, of the Bank’s financial instruments are included in the tables below: Carrying Fair Amount Value Level 1 Level 2 Level 3 Financial Assets Loans, net of unearned income and allowance for loan losses 4,072,348,713$ 4,043,775,050$ -$ -$ 4,043,775,050$ Total assets at fair value 4,072,348,713$ 4,043,775,050$ -$ -$ 4,043,775,050$ Financial Liabilities Deposits 4,359,426,334$ 4,290,806,415$ -$ -$ 4,290,806,415$ Federal Home Loan Bank advances 415,000,000 415,000,000 - - 415,000,000 Total liabilities at fair value 4,774,426,334$ 4,705,806,415$ -$ -$ 4,705,806,415$ June 30, 2017
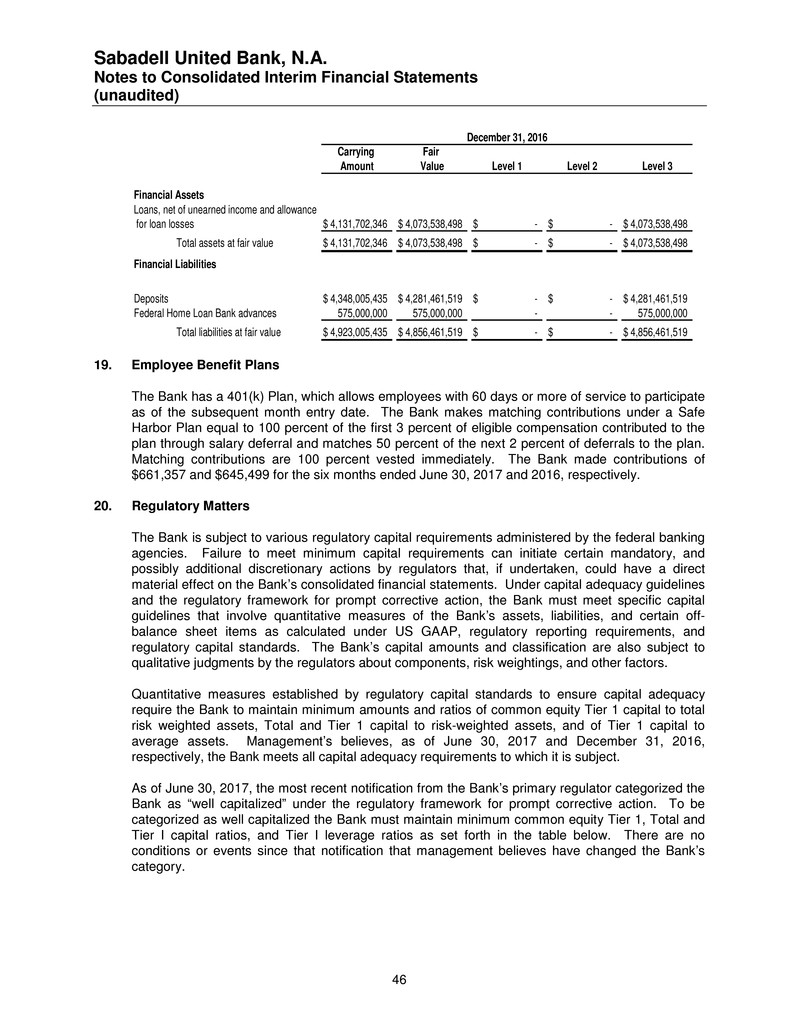
Sabadell United Bank, N.A. Notes to Consolidated Interim Financial Statements (unaudited) 46 Carrying Fair Amount Value Level 1 Level 2 Level 3 Financial Assets Loans, net of unearned income and allowance for loan losses 4,131,702,346$ 4,073,538,498$ -$ -$ 4,073,538,498$ Total assets at fair value 4,131,702,346$ 4,073,538,498$ -$ -$ 4,073,538,498$ Financial Liabilities Deposits 4,348,005,435$ 4,281,461,519$ -$ -$ 4,281,461,519$ Federal Home Loan Bank advances 575,000,000 575,000,000 - - 575,000,000 Total liabilities at fair value 4,923,005,435$ 4,856,461,519$ -$ -$ 4,856,461,519$ December 31, 2016 19. Employee Benefit Plans The Bank has a 401(k) Plan, which allows employees with 60 days or more of service to participate as of the subsequent month entry date. The Bank makes matching contributions under a Safe Harbor Plan equal to 100 percent of the first 3 percent of eligible compensation contributed to the plan through salary deferral and matches 50 percent of the next 2 percent of deferrals to the plan. Matching contributions are 100 percent vested immediately. The Bank made contributions of $661,357 and $645,499 for the six months ended June 30, 2017 and 2016, respectively. 20. Regulatory Matters The Bank is subject to various regulatory capital requirements administered by the federal banking agencies. Failure to meet minimum capital requirements can initiate certain mandatory, and possibly additional discretionary actions by regulators that, if undertaken, could have a direct material effect on the Bank’s consolidated financial statements. Under capital adequacy guidelines and the regulatory framework for prompt corrective action, the Bank must meet specific capital guidelines that involve quantitative measures of the Bank’s assets, liabilities, and certain off- balance sheet items as calculated under US GAAP, regulatory reporting requirements, and regulatory capital standards. The Bank’s capital amounts and classification are also subject to qualitative judgments by the regulators about components, risk weightings, and other factors. Quantitative measures established by regulatory capital standards to ensure capital adequacy require the Bank to maintain minimum amounts and ratios of common equity Tier 1 capital to total risk weighted assets, Total and Tier 1 capital to risk-weighted assets, and of Tier 1 capital to average assets. Management’s believes, as of June 30, 2017 and December 31, 2016, respectively, the Bank meets all capital adequacy requirements to which it is subject. As of June 30, 2017, the most recent notification from the Bank’s primary regulator categorized the Bank as “well capitalized” under the regulatory framework for prompt corrective action. To be categorized as well capitalized the Bank must maintain minimum common equity Tier 1, Total and Tier I capital ratios, and Tier I leverage ratios as set forth in the table below. There are no conditions or events since that notification that management believes have changed the Bank’s category.
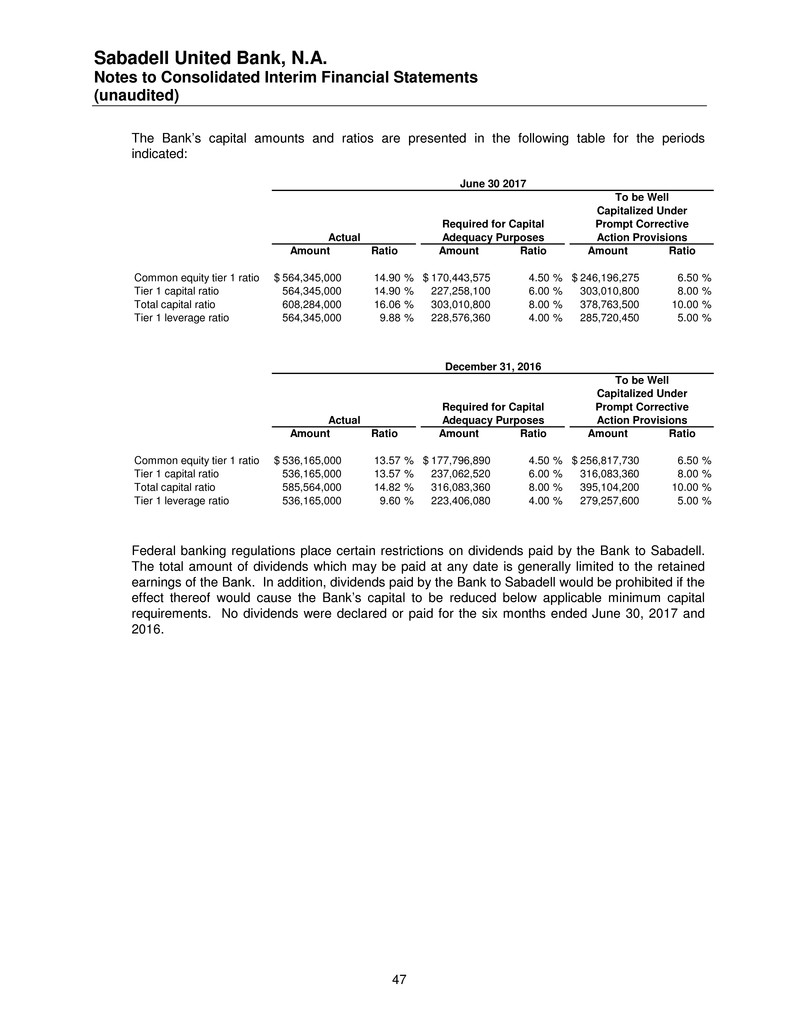
Sabadell United Bank, N.A. Notes to Consolidated Interim Financial Statements (unaudited) 47 The Bank’s capital amounts and ratios are presented in the following table for the periods indicated: Amount Ratio Amount Ratio Amount Ratio Common equity tier 1 ratio 564,345,000$ 14.90 % 170,443,575$ 4.50 % 246,196,275$ 6.50 % Tier 1 capital ratio 564,345,000 14.90 % 227,258,100 6.00 % 303,010,800 8.00 % Total capital ratio 608,284,000 16.06 % 303,010,800 8.00 % 378,763,500 10.00 % Tier 1 leverage ratio 564,345,000 9.88 % 228,576,360 4.00 % 285,720,450 5.00 % Actual Adequacy Purposes Action Provisions June 30 2017 To be Well Capitalized Under Required for Capital Prompt Corrective Amount Ratio Amount Ratio Amount Ratio Common equity tier 1 ratio 536,165,000$ 13.57 % 177,796,890$ 4.50 % 256,817,730$ 6.50 % Tier 1 capital ratio 536,165,000 13.57 % 237,062,520 6.00 % 316,083,360 8.00 % Total capital ratio 585,564,000 14.82 % 316,083,360 8.00 % 395,104,200 10.00 % Tier 1 leverage ratio 536,165,000 9.60 % 223,406,080 4.00 % 279,257,600 5.00 % Actual Adequacy Purposes Action Provisions December 31, 2016 To be Well Capitalized Under Required for Capital Prompt Corrective Federal banking regulations place certain restrictions on dividends paid by the Bank to Sabadell. The total amount of dividends which may be paid at any date is generally limited to the retained earnings of the Bank. In addition, dividends paid by the Bank to Sabadell would be prohibited if the effect thereof would cause the Bank’s capital to be reduced below applicable minimum capital requirements. No dividends were declared or paid for the six months ended June 30, 2017 and 2016.
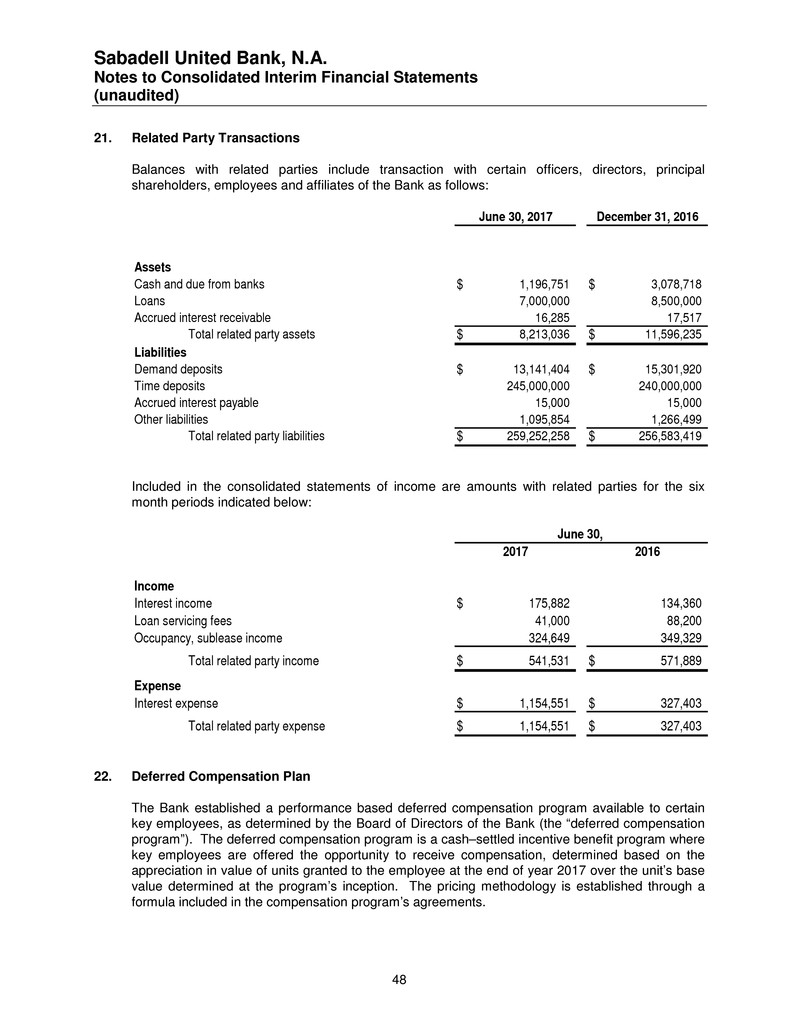
Sabadell United Bank, N.A. Notes to Consolidated Interim Financial Statements (unaudited) 48 21. Related Party Transactions Balances with related parties include transaction with certain officers, directors, principal shareholders, employees and affiliates of the Bank as follows: June 30, 2017 December 31, 2016 Assets Cash and due from banks 1,196,751$ 3,078,718$ Loans 7,000,000 8,500,000 Accrued interest receivable 16,285 17,517 Total related party assets 8,213,036$ 11,596,235$ Liabilities Demand deposits 13,141,404$ 15,301,920$ Time deposits 245,000,000 240,000,000 Accrued interest payable 15,000 15,000 Other liabilities 1,095,854 1,266,499 Total related party liabilities 259,252,258$ 256,583,419$ Included in the consolidated statements of income are amounts with related parties for the six month periods indicated below: 2017 2016 Income Interest income 175,882$ 134,360 Loan servicing fees 41,000 88,200 Occupancy, sublease income 324,649 349,329 Total related party income 541,531$ 571,889$ Expense Interest expense 1,154,551$ 327,403$ Total related party expense 1,154,551$ 327,403$ June 30, 22. Deferred Compensation Plan The Bank established a performance based deferred compensation program available to certain key employees, as determined by the Board of Directors of the Bank (the “deferred compensation program”). The deferred compensation program is a cash–settled incentive benefit program where key employees are offered the opportunity to receive compensation, determined based on the appreciation in value of units granted to the employee at the end of year 2017 over the unit’s base value determined at the program’s inception. The pricing methodology is established through a formula included in the compensation program’s agreements.
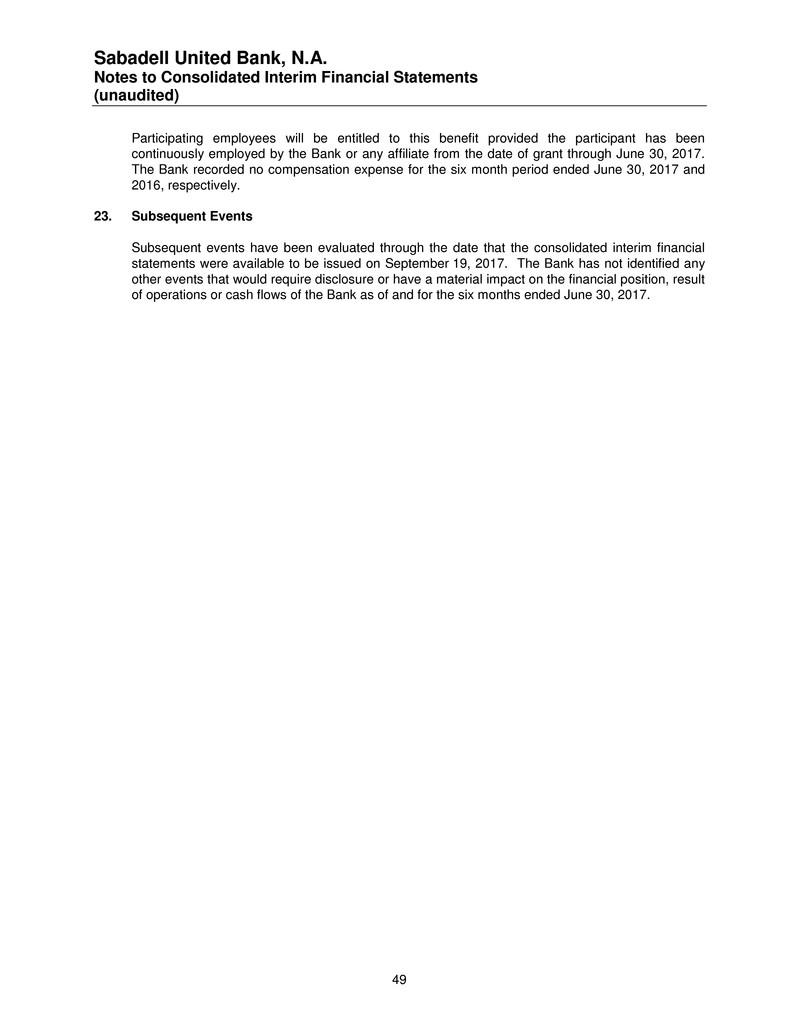
Sabadell United Bank, N.A. Notes to Consolidated Interim Financial Statements (unaudited) 49 Participating employees will be entitled to this benefit provided the participant has been continuously employed by the Bank or any affiliate from the date of grant through June 30, 2017. The Bank recorded no compensation expense for the six month period ended June 30, 2017 and 2016, respectively. 23. Subsequent Events Subsequent events have been evaluated through the date that the consolidated interim financial statements were available to be issued on September 19, 2017. The Bank has not identified any other events that would require disclosure or have a material impact on the financial position, result of operations or cash flows of the Bank as of and for the six months ended June 30, 2017.


