Stock Symbol: CDNR
Exchange: OTCBB
Basic Shares Outstanding: 59.4m
http://www.auroraogc.com
Investor Relations Contact:
Lori King: (231) 941-0073

Disclaimer
In this slide presentation, statements regarding our goals and objectives, our
expected methods of operation and development strategies, our expected and
potential production volumes, anticipated oil and gas prices, potential drilling
locations, the timing of drilling activities, when wells will begin producing, how many
wells will be drilled, potential new development theatres, the spacing of wells, drilling
and operating costs, and other statements that are not historical facts, contain
predictions, estimates and other Forward-Looking Statements within the meaning of
Section 27A of the Securities Act of 1933 and Section 21E of the Securities Exchange
Act of 1934. Although we believe that our expectations are based on reasonable
assumptions, we can give no assurance that our goals will be achieved. Important
factors that could cause our actual results to differ materially from those included in
the Forward-Looking Statements include the timing and extent of changes in
commodity prices for oil and gas, drilling and operating risks, the availability of
drilling rigs, uncertainties about the estimates of reserves, the availability of
transportation pipelines, changes in laws or government regulations, unforeseen
engineering and mechanical or technological difficulties in drilling the wells,
operating hazards, weather related delays, the loss of existing credit facilities,
availability of capital, and other risks more fully described in our filings with the
Securities and Exchange Commission, including an amended Form SB-2 Registration
Statement filed on November 10, 2005. We may also change our business focus as
new opportunities arise. All Forward-Looking Statements contained in this
presentation, including any forecasts and estimates, are based on management’s
outlook only as of the date of this presentation and we undertake no obligation to
update or revise these Forward-Looking Statements, whether as a result of
subsequent developments or otherwise.

Executive Summary
Low-risk development of unconventional gas
reserves in the Antrim and New Albany Shale
Over 290,000 net acres with ~2,000 potential drilling
locations and ~1.7 Tcf in potential reserves
Rapidly growing proved reserves and production
~150 gross wells drilled in 2005 with ~95% success
2006 Outlook:
200 well drilling program
Proved reserves expected to reach 100bcf by mid-year
Net production expected to reach 10mm cf/d in Q1’06 and
15mm cf/d by year end 2006
AMEX listing targeted in 1H’06

The Company
Aurora completed a merger with publicly traded
Cadence Resources Corporation in October 2005
~$250m pro forma market capitalization (1)
Aurora has been actively acquiring acreage in the
Antrim Shale (Michigan) and New Albany Shale
(Indiana / Kentucky) for ~10 years
Net acreage position has grown 120% since March
Rapidly accelerated drilling program with infusion of
$18.5m from equity private placement in early 2005 (2)
$30m TCW Mezzanine facility in place
(1)
Fully diluted using Treasury Stock Method.
(2)
Reflects proceeds raised by both Aurora Energy and Cadence Resources, which had not yet completed their merger.
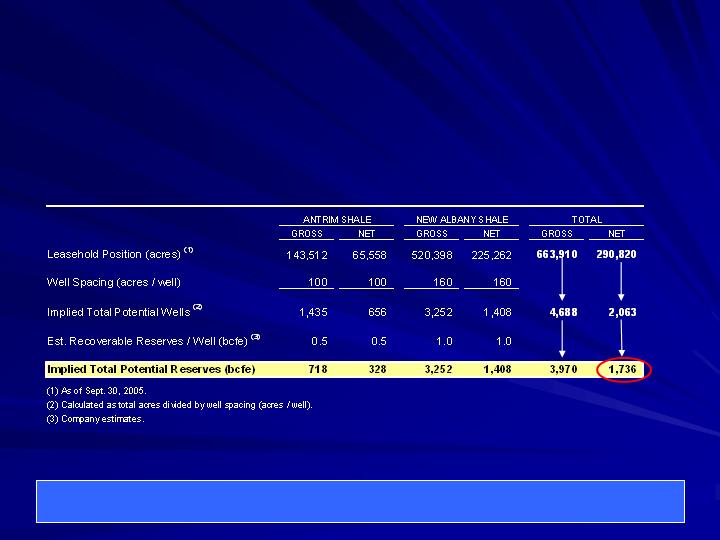
Summary Acreage Position
The Company has ~2,000 potential drilling locations
with ~1.7 Tcf in estimated total potential reserves.
Acreage potential does not currently translate into Proved Reserves.
Generating Proved Reserves will require successful drilling.

Antrim and New Albany Shale Plays
Relatively shallow
blanket shale formations
High-upside, lower-risk
development potential

Antrim and New Albany Shale Plays
Antrim Shale (~25 % of net acreage)
Well-developed, low-risk “resource play”
~8,000 wells drilled to date in the play w/ ~95%
historical drilling success rate
Focus of 2005 / 2006 drilling program to provide low-
risk source of production / cash flow
New Albany Shale (~75% of net acreage)
Emerging shale play with significant upside potential
Horizontal drilling key to unlocking potential of NAS
15-well pilot program yielding encouraging results
Schlumberger Holditch reservoir engineering indicates
1bcf+ horizontal wells on 160-acre spacing

Antrim Shale Well Economics
Vertical Well Cost: ~ $300,000
Well Depth: 250 – 1,500 ft.
Reserves / Well: ~0.5 bcf (avg.)
Peak Production: ~ 150 mcf / day avg.
Time to Peak: 6-12 mo. (de-watering period)
Decline Rate: ~ 7% / yr.
Productive Life: ~ 40 years
Avg. W.I.: 46%
IRR: ~30%+ @ $5.00 gas
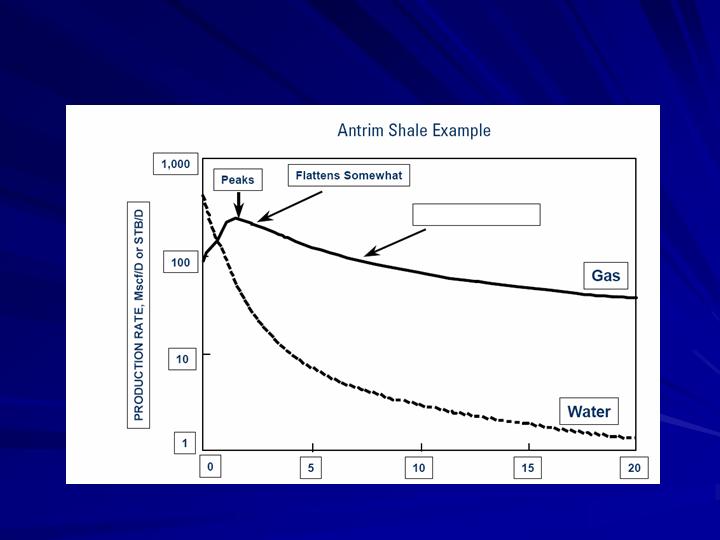
Antrim Shale Production Profile
~ 7% / yr.
Source: Schlumberger Holditch.

New Albany Shale Well Economics
Horizontal Well Cost: ~ $750,000
Well Depth: 500 – 2,500 ft.
Reserves / Well: ~0.7 – 1.2 bcf
Peak Production: ~ 200-300 mcf / day
Time to Peak: 6-12 mo. (de-watering period)
Decline Rate: ~ 5% / yr.
Productive Life: ~ 30 years
Average W.I.: 43%
IRR: ~45% @ $5.00 gas
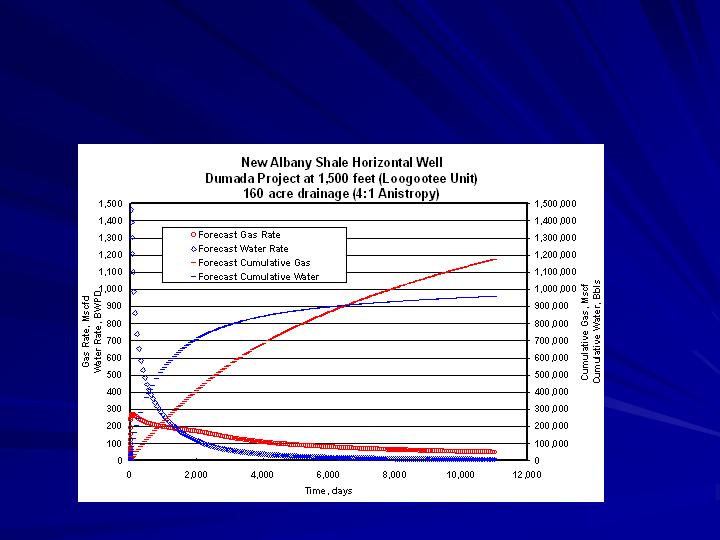
New Albany Shale Production Profile
Source: Schlumberger Holditch.
1bcf+ wells, drilled and completed for $750,000.
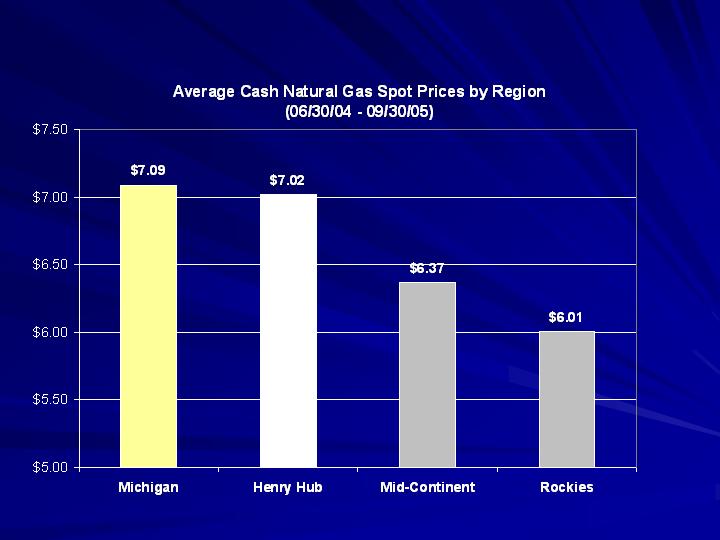
Natural Gas Price Differentials
Source: Bloomberg.

Proved Reserves
Current Schlumberger Holditch reserve reports
only ascribe proved reserves to the Antrim Shale
48bcf proved reserves as of 8/1/05
By 1H’06, a number of factors are expected to
increase proved reserves to ~100bcf:
Continued drilling activity in both the Antrim and
New Albany Shale (200 gross wells targeted for 2006)
Increased average working interests in new properties,
with 100% W.I. targeted where possible
Addition of developed / PUD New Albany Shale locations
to proved reserve category

Production Profile
Q4’05 estimated net production of 4mm cf/d
This represents 45% production growth vs. Q3’05
(2.8mm) and 260% growth vs. Q2’05 (1.1mm)
As new wells are drilled and existing wells de-water,
net production is expected to grow by ~150% by mid-
2006 to ~10mm cf/d
By the end of ’06, net production is expected to
approach15mm cf/d as New Albany Shale wells begin
to contribute meaningfully to production
A large inventory of drilling prospects and an
aggressive development program have the potential to
provide for years of strong production growth

Management Team
The 4 key members of Aurora’s management team each
have between 13 – 23 years of experience in oil & gas.
William Deneau (Chief Executive Officer)
21 yrs. experience in oil & gas industry
18 yrs. experience in Antrim shale
CEO of Aurora since 1997
John Miller (VP, Exploration & Production)
17 yrs. experience in oil & gas industry
Focused on Michigan / Indiana shale E&P since 1994
Current role at Aurora since 1997
Thomas Tucker (VP, Land & Development)
23 yrs. experience in oil & gas industry
Current role at Aurora since 1997
Lori King (Chief Financial Officer)
Joined Aurora in 2001 after serving as CFO of an independent E&P
company for 8 yrs
Trained as CPA to oil & gas clients

Partners
Forest Oil
Samson Resources
El Paso Production Company
Aurora has a number of drilling joint ventures with
industry leaders that allow it to more effectively leverage
its asset base and spread development risks and cost:

Key Operating Statistics
Total Net Acres: 290,820
Total Net Wells (9/30/05): 106
Proved Reserves (8/1/05): 48 bcf
Avg. Operating Cost (Q4’05E): $2.25 / mcf
Average F&D Cost
$0.60 / mcf (Antrim)
$0.75 / mcf (New Albany)
Daily Production (Q4’05E): 4,076 mcf/d

Key Financial Statistics
Current Stock Price (11/11/05): $3.48
Common Shares (11/1/05): 59,373,693 (1)
Warrants: 22,032,500 ($1.72 exercise price) (2)
Pro Forma Net Debt: ~$28m
(1)
Excludes approximately 6.8m shares pursuant to outstanding options.
(2)
Warrants issued in conjunction with equity private placements in early 2005.

Summary
Aurora is a Resource Play Developer
Gas Manufacturer
ROR expected to be exceptional
Growth Oriented Company