C. K. Cooper 2nd Annual Small-Cap Oil & Gas Conference
Stock Symbol: CDNR
Exchange: OTCBB
Basic Shares Outstanding: 81.3 million
http://www.auroraogc.com

Disclaimer
In this slide presentation, statements regarding our goals and objectives, our
expected methods of operation and development strategies, our expected and
potential production volumes, anticipated oil and gas prices, potential drilling
locations, the timing of drilling activities, when wells will begin producing, how many
wells will be drilled, potential new development theatres, the spacing of wells, drilling
and operating costs, and other statements that are not historical facts, contain
predictions, estimates and other Forward-Looking Statements within the meaning of
Section 27A of the Securities Act of 1933 and Section 21E of the Securities Exchange
Act of 1934. Although we believe that our expectations are based on reasonable
assumptions, we can give no assurance that our goals will be achieved. Important
factors that could cause our actual results to differ materially from those included in
the Forward-Looking Statements include the timing and extent of changes in
commodity prices for oil and gas, drilling and operating risks, the availability of
drilling rigs, uncertainties about the estimates of reserves, the availability of
transportation pipelines, changes in laws or government regulations, unforeseen
engineering and mechanical or technological difficulties in drilling the wells,
operating hazards, weather related delays, the loss of existing credit facilities,
availability of capital, and other risks more fully described in our filings with the
Securities and Exchange Commission, including an amended Form 10-KSB filed on
February 7, 2006. We may also change our business focus as new opportunities
arise. All Forward-Looking Statements contained in this presentation, including any
forecasts and estimates, are based on management’s outlook only as of the date of
this presentation and we undertake no obligation to update or revise these Forward-
Looking Statements, whether as a result of subsequent developments or otherwise.

Executive Summary
Low-risk development of unconventional gas
reserves in the Antrim and New Albany Shale
Over 350,000 net acres with ~2,400 potential drilling
locations and ~2.1 Tcf in potential reserves
Rapidly growing proved reserves and production
~150 gross wells drilled in 2005 with ~95% success
2006 Outlook:
200 well drilling program
Proved reserves expected to reach 100 bcf by mid-year
Net production expected to reach 10 million cf/d in Q1’06
and 15 million cf/d in Q4’06
AMEX listing targeted in 1H’06

The Company
Cadence/Aurora - reverse merger October 31, 2005
~$524.4 million pro forma market capitalization (1)
Aurora has been actively acquiring acreage in the
Antrim Shale (Michigan) and New Albany Shale
(Indiana / Kentucky) for ~10 years
$100 million BNP Paribas senior credit facility with $40
million borrowing base
$50 million TCW Mezzanine drilling facility in place
(1)
Fully diluted using Treasury Stock Method.

Summary Acreage Position
The Company has ~2,400 potential drilling locations
with ~2.1 Tcf in estimated total potential reserves.
Acreage potential does not currently translate into Proved Reserves.
Generating Proved Reserves will require successful drilling.
GROSS
NET
GROSS
NET
GROSS
NET
Leasehold Position (acres)
(1)
202,854
78,163
594,022
271,891
796,876
350,054
Well Spacing (acres/well)
100
100
160
160
Implied Total Potential Wells
(2)
2,028
781
3,712
1,699
5,740
2,480
Est. Recoverable Reserves / Well (bcfe)
(3)
0.5
0.5
1.0
1.0
Implied Total Potential Reserves (bcfe)
1,014
390
3,712
1,699
4,726
2,089
(1)
As of Dec. 31, 2005.
(2)
Calculated as total acres divided by well spacing (acres/well).
(3)
Company estimates.
ANTRIM SHALE
NEW ALBANY SHALE
TOTAL
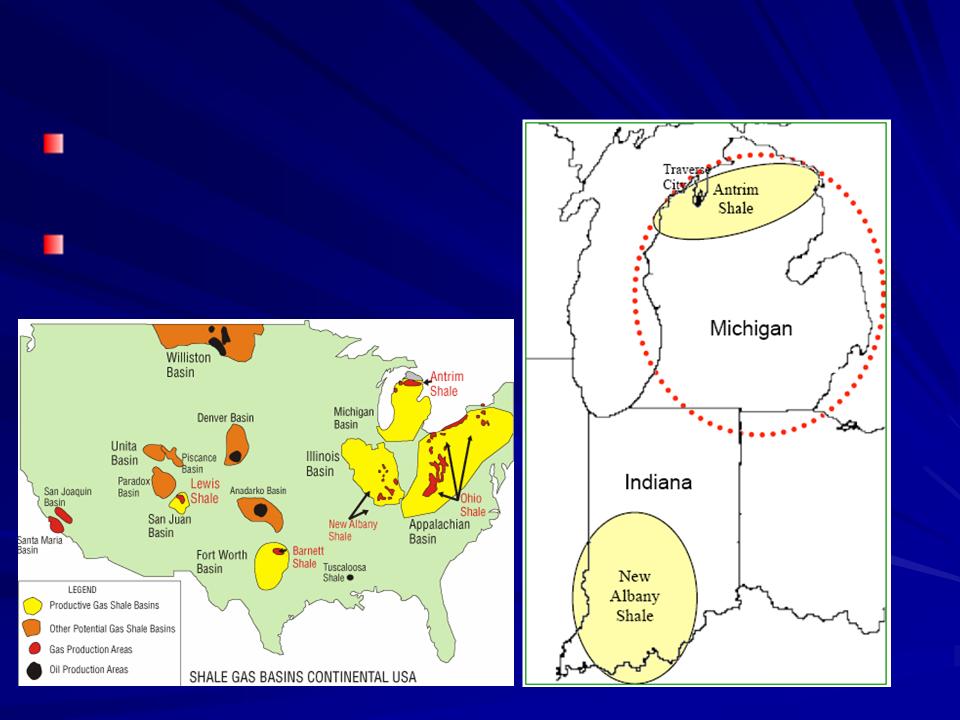
Antrim and New Albany Shale Plays
Relatively shallow
blanket shale formations
High-upside, lower-risk
development potential

Antrim and New Albany Shale Plays
Antrim Shale (~23% of net acreage)
Well-developed, low-risk “resource play”
~8,000 wells drilled to date in the play w/ ~95%
historical drilling success rate
Focus of 2005 / 2006 drilling program to provide low-
risk source of production / cash flow
New Albany Shale (~77% of net acreage)
Emerging shale play with significant upside potential
Horizontal drilling key to unlocking potential of NAS
5-well pilot program yielding encouraging results
Schlumberger Holditch reservoir engineering indicates
1bcf+ horizontal wells on 160-acre spacing

Antrim Shale Well Economics
Vertical Well Cost: ~ $300,000
Well Depth: 250 – 1,500 ft.
Reserves / Well: ~0.5 bcf (avg.)
Peak Production: ~ 150 mcf / day avg.
Time to Peak: 6-12 mo. (de-watering period)
Decline Rate: ~ 7% / yr.
Productive Life: ~ 40 years
Avg. W.I.: 46%
IRR: ~30%+ @ $5.00 gas

Antrim Shale Production Profile
~ 7% / yr.
Source: Schlumberger Holditch.

New Albany Shale Well Economics
Horizontal Well Cost: ~ $750,000
Well Depth: 500 – 2,500 ft.
Reserves / Well: ~0.7 – 1.2 bcf
Peak Production: ~ 200-300 mcf / day
Time to Peak: 6-12 mo. (de-watering period)
Decline Rate: ~ 5% / yr.
Productive Life: ~ 30 years
Average W.I.: 43%
IRR: ~45% @ $5.00 gas
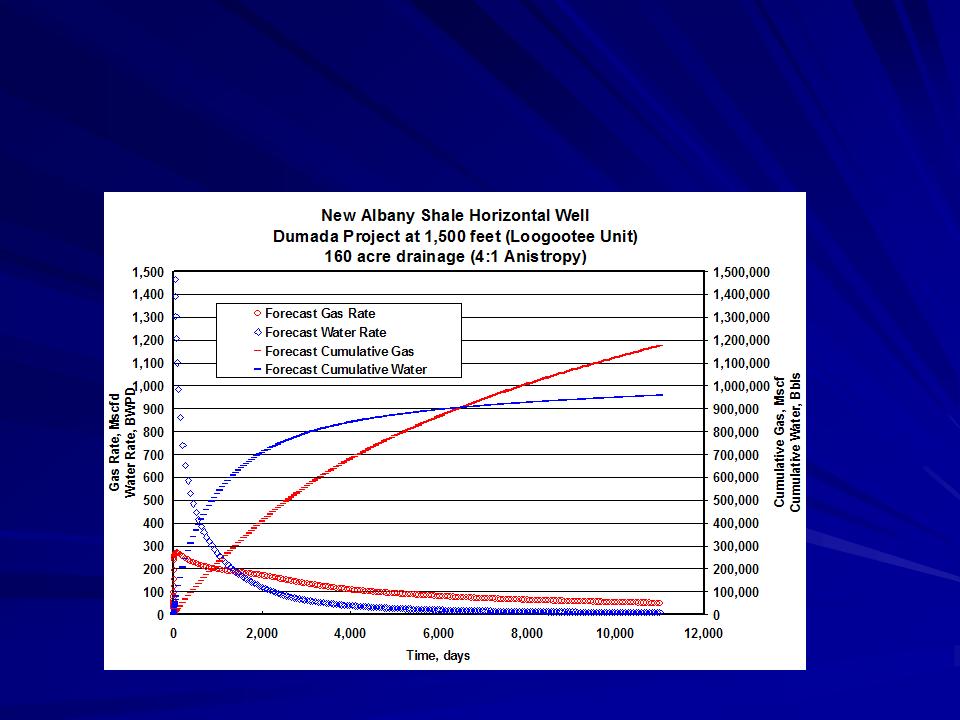
New Albany Shale Production Profile
Source: Schlumberger Holditch.
1bcf+ wells, drilled and completed for $750,000.

Natural Gas Price Differentials
Source: Bloomberg.
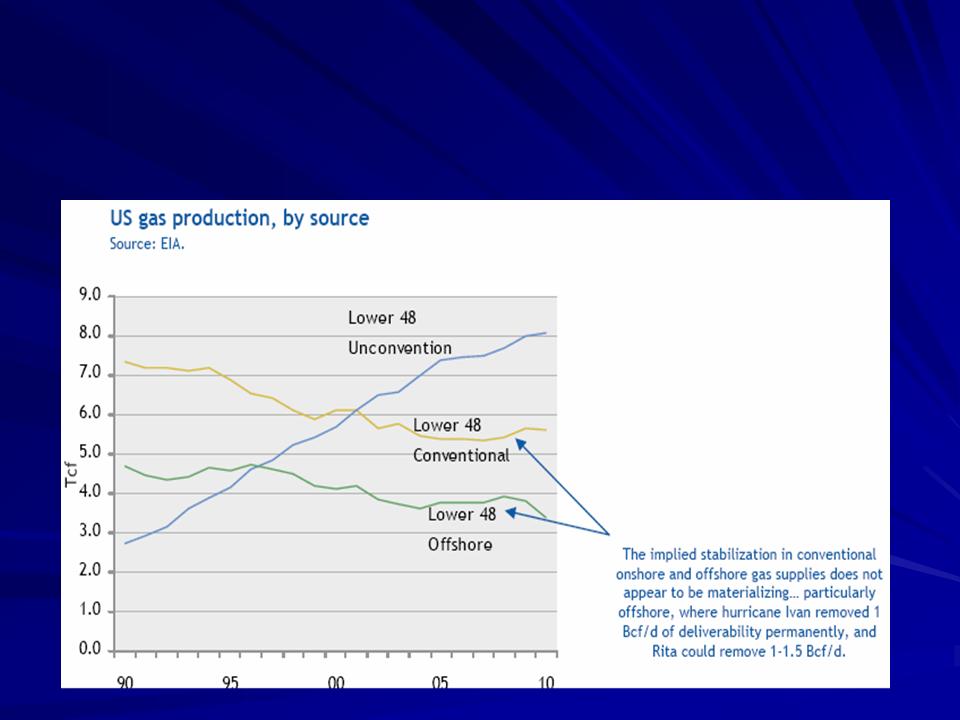
Unconventional Gas Growth
Unconventional gas sources are expected to be the key
source of domestic production growth.
Source: JP Morgan.

Proved Reserves
Proved reserves 12/31/05 88 bcf
Reserve reports prepared by:
Schlumberger: Data & Consulting Services
Netherland, Sewell & Associates, Inc.
Ralph E. Davis Associates, Inc.
Note: Reserve reports do not include New Albany Shale
By 1H’06, a number of factors are expected to increase
proved reserves to ~100 bcf:
Continued drilling activity (200 gross wells targeted for 2006)
Increased average working interests in new properties
Proved reserves in New Albany Shale added
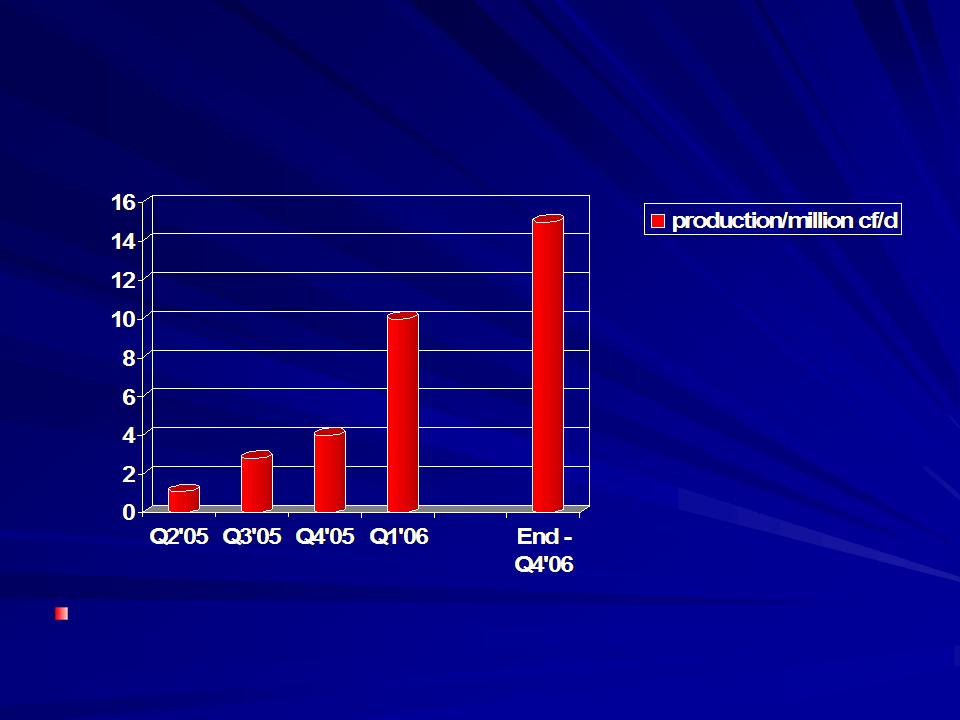
Production Profile
A large inventory of drilling prospects and an aggressive development
program have the potential to provide for years of strong production growth

Aurora’s Low Impact Natural
Gas Production System
Low Pressure and Safe
Small modular style compression facilities
100% Electrified and Quiet
Stainless steel pumps
Fiberglass tubing
Poly pipeline systems (no decay or leaking)
Improved production of shale natural gas
Properly designed flow systems (oversized pipelines to
guarantee maximum gas flow)
Closed system of disposing water (no tanks)

Cost-Efficient Production
Technology is Key
Advantages of Aurora’s low pressure
system of producing wells
reduces development costs
increases production rates
extends commercial life of wells
facility capacity maximized over life of wells
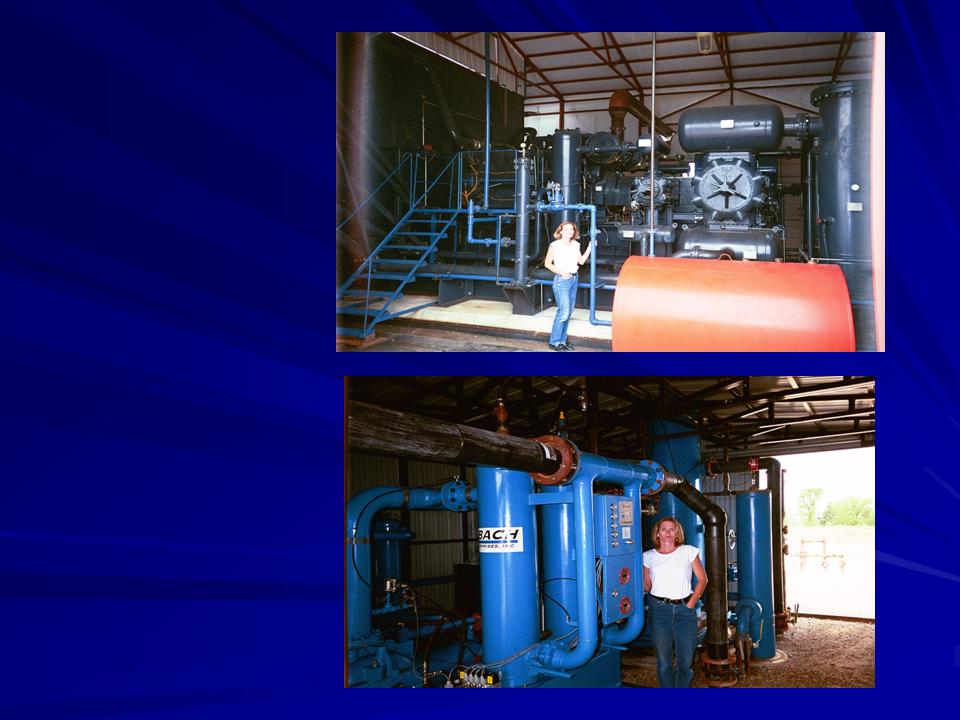
Traditional
Large
Central
Compressor
Unit
Aurora’s
Skid-
mounted
Compressor
and
Separator
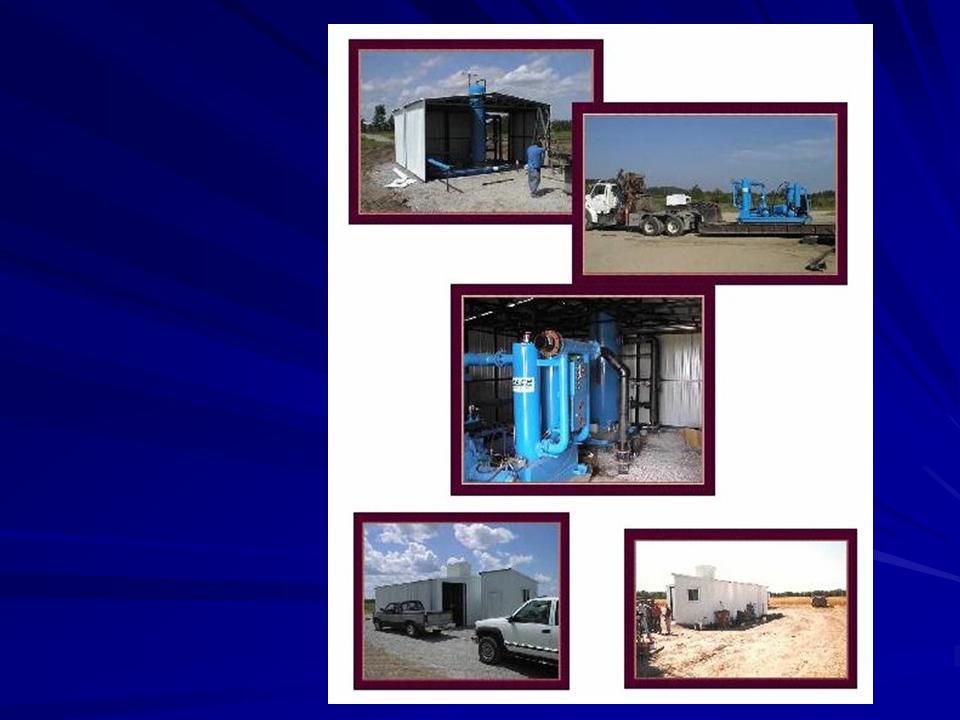
Aurora’s
Antrim
Facility

Management Team
The 4 key members of Aurora’s management team each
have between 15 - 23 years of experience in oil & gas.
William Deneau (Chief Executive Officer)
21 yrs. experience in oil & gas industry
18 yrs. experience in Antrim shale
CEO of Aurora since 1997
John Miller (VP, Exploration & Production)
17 yrs. experience in oil & gas industry
Focused on Michigan / Indiana shale E&P since 1994
Current role at Aurora since 1997
Thomas Tucker (VP, Land & Development)
23 yrs. experience in oil & gas industry
Focused on Land Acquisition and Drilling
Current role at Aurora since 1997
Lori King (Chief Financial Officer)
Trained as CPA to oil & gas clients
15 years experience in the oil and gas industry
Current role at Aurora since 2001

Partners
Samson Resources - Tulsa, OK
El Paso Production Company –
Houston, TX
Rex Energy – College Park, PA
Aurora has a number of drilling joint ventures with
industry leaders that allow it to more effectively leverage
its asset base, spread development risks and cost:

Key Operating Statistics
Total Net Acres: 350,000
Total Net Wells (12/31/05): 187
Proved Reserves: 88 bcf
Avg. Operating Cost (Q4’05): $2.25 / mcf
Average F&D Cost
$0.60 / mcf (Antrim)
$0.75 / mcf (New Albany)
Daily Production (Q4’05): 4076E mcf/d

Key Financial Statistics
Current Stock Price (02/08/06): $6.12
Common Shares (2/07/06): 81,298,683
Warrants: 2,249,500 ($1.71 exercise price)
Options: 3,165,776 ($0.75 exercise price)
Pro Forma Net Debt: ~$77 million

Summary
Company Focus:
Develop Significant Acreage in Shales
Multi-year Drilling Inventory:
2 TCF potential
Proved Reserves Expected to Grow:
To 100 BCF in 2006
Rapid Production Growth:
15 million cf/d target by year end
C. K. Cooper 2nd Annual Small-Cap Oil & Gas Conference
Stock Symbol: CDNR
Exchange: OTCBB
Basic Shares Outstanding: 81.3 million
http://www.auroraogc.com
Investor Relations Contact:
Lori King: (231) 941-0073