UNITED STATES
SECURITIES AND EXCHANGE COMMISSION
Washington, D.C. 20549
Form N-CSR
CERTIFIED SHAREHOLDER REPORT OF REGISTERED
MANAGEMENT INVESTMENT COMPANIES
Investment Company Act File Number: 811-08876
Senior Debt Portfolio
(Exact Name of Registrant as Specified in Charter)
One Post Office Square, Boston, Massachusetts 02109
(Address of Principal Executive Offices)
Deidre E. Walsh
One Post Office Square, Boston, Massachusetts 02109
(Name and Address of Agent for Services)
(617) 482-8260
(Registrant’s Telephone Number)
October 31
Date of Fiscal Year End
October 31, 2024
Date of Reporting Period
Item 1. Reports to Stockholders
Annual Shareholder Report October 31, 2024
This annual shareholder report contains important information about the Senior Debt Portfolio (the "Fund") for the period of November 1, 2023 to October 31, 2024. You can find additional information about the Fund at www.eatonvance.com/open-end-mutual-fund-documents.php and selecting Eaton Vance Floating-Rate Advantage Fund. You can also request this information by contacting us at 1-800-262-1122.
What were the Fund costs for the last year?
(based on a hypothetical $10,000 investment)
| Fund Name | Costs of a $10,000 investment | Costs paid as a percentage of a $10,000 investment |
|---|
| Senior Debt Portfolio | $236 | 2.23% |
How did the Fund perform last year and what affected its performance?
Key contributors to (↑) and detractors from (↓) performance, relative to the Morningstar® LSTA® US Leveraged Loan Index℠ (the Index):
↑ The Fund’s use of leverage ― not employed by the Index ― amplified the price appreciation and interest income of loans held in the Fund’s underlying portfolio
↑ An out-of-Index allocation to collateralized loan obligation debt investments, which performed strongly during the period, contributed to Index-relative returns
↑ An out-of-Index allocation to secured high yield bonds, which generally outperformed floating-rate loans during the period, helped Index-relative performance
↑ Loan selections in the diversified telecommunication services industry contributed to Index-relative returns during the period
↓ Loan selections in the health care providers & services, household durables, and energy equipment & services industries detracted from Index-relative returns
↓ An underweight exposure to CCC-rated loans hampered Index relative performance as lower-rated loans generally outperformed higher-rated loans during the period
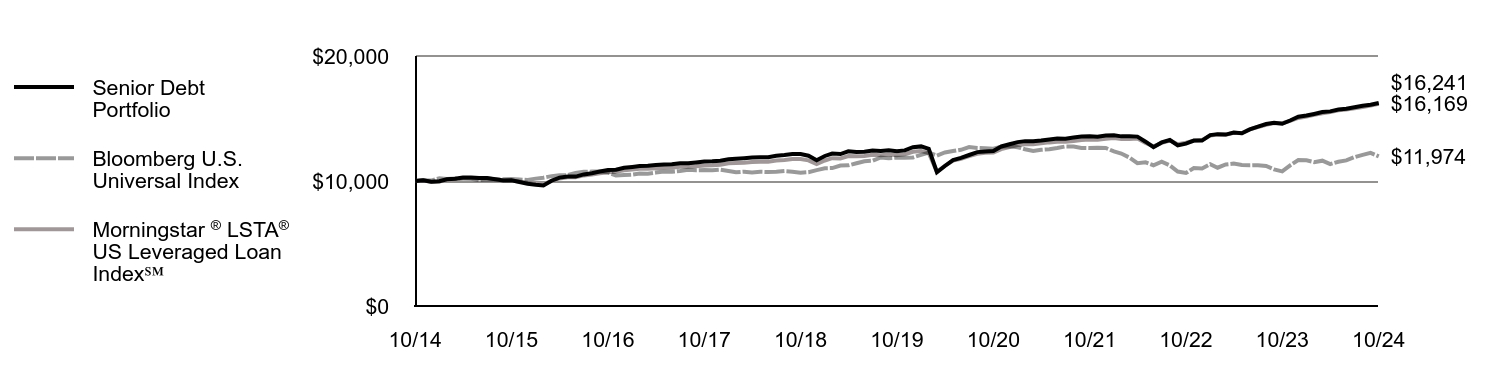
Comparison of the change in value of a $10,000 investment for the period indicated.
| Senior Debt Portfolio | Bloomberg U.S. Universal Index | Morningstar ® LSTA® US Leveraged Loan Index℠ |
|---|
| 10/14 | $10,000 | $10,000 | $10,000 |
| 11/14 | $10,050 | $10,054 | $10,050 |
| 12/14 | $9,946 | $10,036 | $9,924 |
| 1/15 | $9,978 | $10,227 | $9,956 |
| 2/15 | $10,144 | $10,167 | $10,097 |
| 3/15 | $10,186 | $10,209 | $10,134 |
| 4/15 | $10,282 | $10,197 | $10,228 |
| 5/15 | $10,286 | $10,180 | $10,247 |
| 6/15 | $10,231 | $10,066 | $10,204 |
| 7/15 | $10,245 | $10,125 | $10,203 |
| 8/15 | $10,146 | $10,095 | $10,132 |
| 9/15 | $10,046 | $10,134 | $10,066 |
| 10/15 | $10,053 | $10,167 | $10,048 |
| 11/15 | $9,923 | $10,130 | $9,960 |
| 12/15 | $9,787 | $10,079 | $9,855 |
| 1/16 | $9,697 | $10,190 | $9,791 |
| 2/16 | $9,641 | $10,263 | $9,739 |
| 3/16 | $10,021 | $10,388 | $10,008 |
| 4/16 | $10,272 | $10,459 | $10,206 |
| 5/16 | $10,366 | $10,467 | $10,297 |
| 6/16 | $10,351 | $10,652 | $10,300 |
| 7/16 | $10,527 | $10,739 | $10,447 |
| 8/16 | $10,625 | $10,751 | $10,525 |
| 9/16 | $10,760 | $10,753 | $10,616 |
| 10/16 | $10,876 | $10,682 | $10,704 |
| 11/16 | $10,896 | $10,442 | $10,732 |
| 12/16 | $11,055 | $10,473 | $10,856 |
| 1/17 | $11,127 | $10,510 | $10,917 |
| 2/17 | $11,194 | $10,591 | $10,972 |
| 3/17 | $11,225 | $10,588 | $10,981 |
| 4/17 | $11,276 | $10,675 | $11,029 |
| 5/17 | $11,329 | $10,758 | $11,069 |
| 6/17 | $11,340 | $10,749 | $11,064 |
| 7/17 | $11,415 | $10,802 | $11,140 |
| 8/17 | $11,416 | $10,895 | $11,135 |
| 9/17 | $11,479 | $10,857 | $11,179 |
| 10/17 | $11,557 | $10,870 | $11,246 |
| 11/17 | $11,578 | $10,854 | $11,259 |
| 12/17 | $11,622 | $10,901 | $11,303 |
| 1/18 | $11,743 | $10,797 | $11,412 |
| 2/18 | $11,774 | $10,694 | $11,435 |
| 3/18 | $11,821 | $10,748 | $11,467 |
| 4/18 | $11,878 | $10,676 | $11,514 |
| 5/18 | $11,894 | $10,735 | $11,534 |
| 6/18 | $11,909 | $10,719 | $11,547 |
| 7/18 | $12,013 | $10,741 | $11,633 |
| 8/18 | $12,074 | $10,794 | $11,679 |
| 9/18 | $12,155 | $10,748 | $11,760 |
| 10/18 | $12,151 | $10,658 | $11,756 |
| 11/18 | $12,024 | $10,706 | $11,650 |
| 12/18 | $11,654 | $10,874 | $11,353 |
| 1/19 | $12,002 | $11,024 | $11,642 |
| 2/19 | $12,200 | $11,036 | $11,828 |
| 3/19 | $12,156 | $11,235 | $11,807 |
| 4/19 | $12,371 | $11,251 | $12,002 |
| 5/19 | $12,314 | $11,423 | $11,976 |
| 6/19 | $12,335 | $11,585 | $12,005 |
| 7/19 | $12,432 | $11,619 | $12,101 |
| 8/19 | $12,396 | $11,882 | $12,068 |
| 9/19 | $12,450 | $11,830 | $12,124 |
| 10/19 | $12,375 | $11,869 | $12,070 |
| 11/19 | $12,450 | $11,866 | $12,141 |
| 12/19 | $12,703 | $11,884 | $12,334 |
| 1/20 | $12,768 | $12,097 | $12,403 |
| 2/20 | $12,578 | $12,278 | $12,239 |
| 3/20 | $10,704 | $12,039 | $10,725 |
| 4/20 | $11,201 | $12,280 | $11,208 |
| 5/20 | $11,667 | $12,394 | $11,634 |
| 6/20 | $11,855 | $12,498 | $11,766 |
| 7/20 | $12,081 | $12,717 | $11,996 |
| 8/20 | $12,310 | $12,644 | $12,176 |
| 9/20 | $12,366 | $12,621 | $12,253 |
| 10/20 | $12,399 | $12,576 | $12,278 |
| 11/20 | $12,763 | $12,740 | $12,551 |
| 12/20 | $12,942 | $12,784 | $12,720 |
| 1/21 | $13,110 | $12,704 | $12,871 |
| 2/21 | $13,189 | $12,540 | $12,947 |
| 3/21 | $13,185 | $12,394 | $12,946 |
| 4/21 | $13,245 | $12,498 | $13,013 |
| 5/21 | $13,326 | $12,546 | $13,089 |
| 6/21 | $13,395 | $12,637 | $13,137 |
| 7/21 | $13,389 | $12,764 | $13,135 |
| 8/21 | $13,486 | $12,756 | $13,198 |
| 9/21 | $13,567 | $12,647 | $13,282 |
| 10/21 | $13,585 | $12,636 | $13,318 |
| 11/21 | $13,539 | $12,652 | $13,297 |
| 12/21 | $13,641 | $12,643 | $13,382 |
| 1/22 | $13,660 | $12,366 | $13,430 |
| 2/22 | $13,571 | $12,197 | $13,361 |
| 3/22 | $13,580 | $11,870 | $13,368 |
| 4/22 | $13,552 | $11,427 | $13,397 |
| 5/22 | $13,144 | $11,490 | $13,054 |
| 6/22 | $12,701 | $11,261 | $12,771 |
| 7/22 | $13,084 | $11,544 | $13,044 |
| 8/22 | $13,277 | $11,244 | $13,241 |
| 9/22 | $12,843 | $10,759 | $12,939 |
| 10/22 | $12,990 | $10,641 | $13,068 |
| 11/22 | $13,234 | $11,038 | $13,224 |
| 12/22 | $13,231 | $11,001 | $13,278 |
| 1/23 | $13,671 | $11,342 | $13,633 |
| 2/23 | $13,749 | $11,063 | $13,711 |
| 3/23 | $13,712 | $11,323 | $13,707 |
| 4/23 | $13,870 | $11,392 | $13,851 |
| 5/23 | $13,819 | $11,274 | $13,826 |
| 6/23 | $14,124 | $11,256 | $14,139 |
| 7/23 | $14,353 | $11,267 | $14,320 |
| 8/23 | $14,560 | $11,200 | $14,488 |
| 9/23 | $14,653 | $10,932 | $14,628 |
| 10/23 | $14,574 | $10,768 | $14,625 |
| 11/23 | $14,841 | $11,253 | $14,803 |
| 12/23 | $15,142 | $11,680 | $15,047 |
| 1/24 | $15,234 | $11,652 | $15,149 |
| 2/24 | $15,364 | $11,512 | $15,287 |
| 3/24 | $15,514 | $11,625 | $15,417 |
| 4/24 | $15,570 | $11,353 | $15,510 |
| 5/24 | $15,720 | $11,542 | $15,655 |
| 6/24 | $15,773 | $11,647 | $15,710 |
| 7/24 | $15,893 | $11,911 | $15,817 |
| 8/24 | $16,013 | $12,087 | $15,917 |
| 9/24 | $16,095 | $12,253 | $16,031 |
| 10/24 | $16,241 | $11,974 | $16,169 |
Average Annual Total Returns (%)
| Fund | 1 Year | 5 Years | 10 Years |
|---|
| Senior Debt Portfolio | 11.64% | 5.58% | 4.97% |
Bloomberg U.S. Universal IndexFootnote Reference1 | 11.20% | 0.18% | 1.82% |
Morningstar®LSTA® US Leveraged Loan Index℠ | 10.56% | 6.02% | 4.92% |
| Footnote | Description |
Footnote1 | In accordance with regulatory changes requiring the Fund’s primary benchmark to represent the overall applicable market, the Fund’s primary prospectus benchmark changed to the indicated benchmark effective May 1, 2024. |
Performance does not reflect the deduction of taxes that an investor would pay on distributions or redemptions. Performance assumes that all dividends and distributions, if any, were reinvested. For more recent performance information, visit www.eatonvance.com/performance.php.
THE FUND'S PAST PERFORMANCE IS NO GUARANTEE OF FUTURE RESULTS.
| Total Net Assets | $5,855,695,948 |
| # of Portfolio Holdings | 687 |
| Portfolio Turnover Rate | 35% |
| Total Advisory Fees Paid | $30,948,747 |
What did the Fund invest in?
The following tables reflect what the Fund invested in as of the report date.
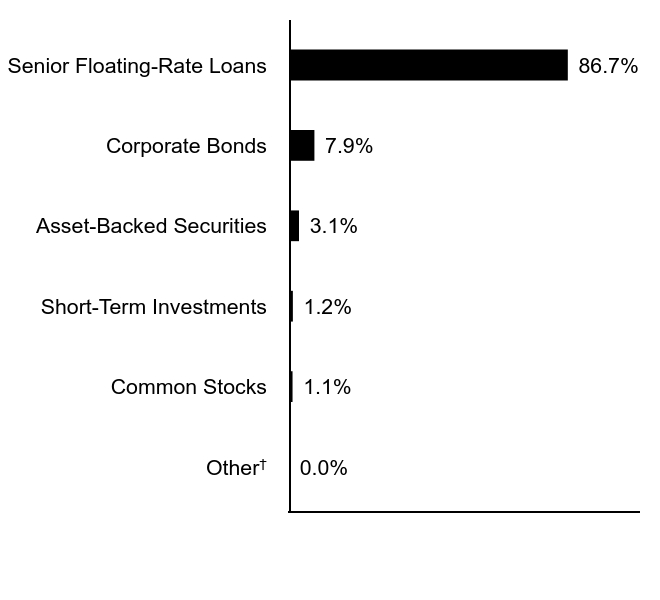
Asset Allocation (% of total investments)
| Value | Value |
|---|
OtherFootnote Reference† | 0.0% |
| Common Stocks | 1.1% |
| Short-Term Investments | 1.2% |
| Asset-Backed Securities | 3.1% |
| Corporate Bonds | 7.9% |
| Senior Floating-Rate Loans | 86.7% |
| Footnote | Description |
Footnote† | Investment types less than 1% each |
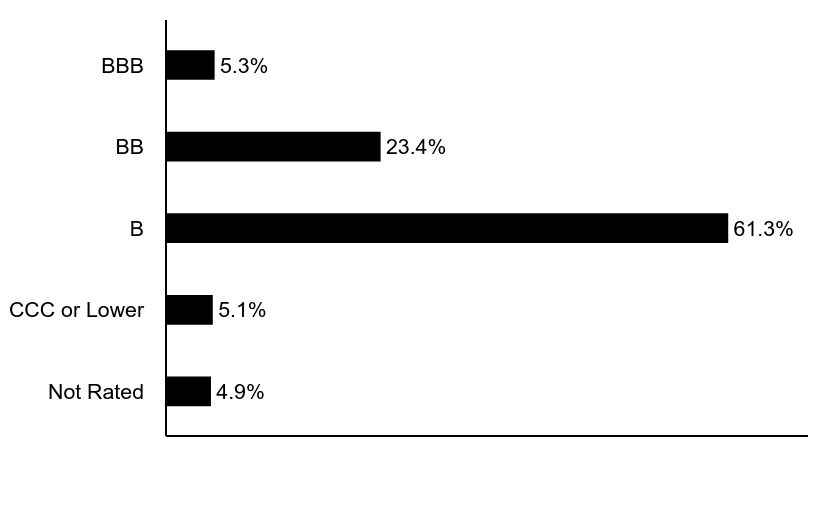
Credit Quality (% of total investments)Footnote Referencea
| Value | Value |
|---|
| Not Rated | 4.9% |
| CCC or Lower | 5.1% |
| B | 61.3% |
| BB | 23.4% |
| BBB | 5.3% |
| Footnote | Description |
Footnotea | Excludes Short-Term investments and Equities. Ratings are categorized using S&P Global Ratings (“S&P”), with ratings ranging from AAA, being the highest, to D, being the lowest. Ratings of BBB or higher are considered to be investment-grade quality. Holdings designated as “Not Rated” (if any) are not rated by S&P. |
If you wish to view additional information about the Fund, including the prospectus, statement of additional information, financial statements and holdings, please scan the QR code or visit www.eatonvance.com/open-end-mutual-fund-documents.php and select Eaton Vance Floating-Rate Advantage Fund. For proxy information, please visit www.eatonvance.com/proxyvoting.
The Funds may deliver a single copy of certain required shareholder documents (including prospectuses, shareholder reports, and proxy materials) to investors with the same last name and the same address. Your participation will continue indefinitely unless you instruct otherwise by calling 1-800-262-1122 or by contacting your financial intermediary. Your instruction will typically be effective within 30 days of receipt.
Not FDIC Insured | May Lose Value | No Bank Guarantee
Annual Shareholder Report October 31, 2024
Item 2. Code of Ethics
The registrant (sometimes referred to as the “Fund”) has adopted a code of ethics applicable to its Principal Executive Officer, Principal Financial Officer and Principal Accounting Officer. The registrant undertakes to provide a copy of such code of ethics to any person upon request, without charge, by calling 1-800-262-1122. The registrant has not amended the code of ethics as described in Form N-CSR during the period covered by this report. The registrant has not granted any waiver, including an implicit waiver, from a provision of the code of ethics as described in Form N-CSR during the period covered by this report.
Item 3. Audit Committee Financial Expert
The registrant’s Board of Trustees (the “Board”) has designated George J. Gorman and Scott E. Wennerholm, each an independent trustee, as audit committee financial experts. Mr. Gorman is a certified public accountant who is the Principal at George J. Gorman LLC (a consulting firm). Previously, Mr. Gorman served in various capacities at Ernst & Young LLP (a registered public accounting firm), including as Senior Partner. Mr. Gorman also has experience serving as an independent trustee and audit committee financial expert of other mutual fund complexes. Mr. Wennerholm is a private investor. Previously, Mr. Wennerholm served as a Trustee at Wheelock College (postsecondary institution), as a Consultant at GF Parish Group (executive recruiting firm), Chief Operating Officer and Executive Vice President at BNY Mellon Asset Management (investment management firm), Chief Operating Officer and Chief Financial Officer at Natixis Global Asset Management (investment management firm), and Vice President at Fidelity Investments Institutional Services (investment management firm).
Item 4. Principal Accountant Fees and Services
(a)-(d)
The following table presents the aggregate fees billed to the registrant for the registrant’s fiscal years ended October 31, 2023 and October 31, 2024 by the registrant’s principal accountant, Deloitte & Touche LLP (“D&T”), for professional services rendered for the audit of the registrant’s annual financial statements and fees billed for other services rendered by D&T during such periods.
| | | | | | | | |
Fiscal Years Ended | | 10/31/23 | | | 10/31/24 | |
Audit Fees | | $ | 124,400 | | | $ | 129,400 | |
Audit-Related Fees(1) | | $ | 0 | | | $ | 0 | |
Tax Fees(2) | | $ | 0 | | | $ | 0 | |
All Other Fees(3) | | $ | 0 | | | $ | 0 | |
| | | | | | | | |
Total | | $ | 124,400 | | | $ | 129,400 | |
| | | | | | | | |
| (1) | Audit-related fees consist of the aggregate fees billed for assurance and related services that are reasonably related to the performance of the audit of the registrant’s financial statements and are not reported under the category of audit fees. |
| (2) | Tax fees consist of the aggregate fees billed for professional services rendered by the principal accountant relating to tax compliance, tax advice, and tax planning and specifically include fees for tax return preparation and other related tax compliance/planning matters. |
| (3) | All other fees consist of the aggregate fees billed for products and services provided by the principal accountant other than audit, audit-related, and tax services. |
(e)(1) The registrant’s audit committee has adopted policies and procedures relating to the pre-approval of services provided by the registrant’s principal accountant (the “Pre-Approval Policies”). The Pre-Approval Policies establish a framework intended to assist the audit committee in the proper discharge of its pre-approval responsibilities. As a general matter, the Pre-Approval Policies (i) specify certain types of audit, audit-related, tax, and other services determined to be pre-approved by the audit committee; and (ii) delineate specific procedures governing the mechanics of the pre-approval process, including the approval and monitoring of audit and non-audit service fees. Unless a service is specifically pre-approved under the Pre-Approval Policies, it must be separately pre-approved by the audit committee.
The Pre-Approval Policies and the types of audit and non-audit services pre-approved therein must be reviewed and ratified by the registrant’s audit committee at least annually. The registrant’s audit committee maintains full responsibility for the appointment, compensation, and oversight of the work of the registrant’s principal accountant.
(e)(2) No services described in paragraphs (b)-(d) above were approved by the registrant’s audit committee pursuant to the “de minimis exception” set forth in Rule 2-01(c)(7)(i)(C) of Regulation S-X.
(f) Not applicable.
(g) The following table presents (i) the aggregate non-audit fees (i.e., fees for audit-related, tax, and other services) billed to the registrant by D&T for the registrant’s fiscal years ended October 31, 2023 and October 31, 2024; and (ii) the aggregate non-audit fees (i.e., fees for audit-related, tax, and other services) billed to the Eaton Vance organization by D&T for the same time periods.
| | | | | | | | |
Fiscal Years Ended | | 10/31/23 | | | 10/31/24 | |
Registrant | | $ | 0 | | | $ | 0 | |
Eaton Vance(1) | | $ | 0 | | | $ | 18,490 | |
| (1) | The investment adviser to the registrant, as well as any of its affiliates that provide ongoing services to the registrant, are subsidiaries of Morgan Stanley. |
(h) The registrant’s audit committee has considered whether the provision by the registrant’s principal accountant of non-audit services to the registrant’s investment adviser and any entity controlling, controlled by, or under common control with the adviser that provides ongoing services to the registrant that were not pre-approved pursuant to Rule 2-01(c)(7)(ii) of Regulation S-X is compatible with maintaining the principal accountant’s independence.
(i) Not applicable.
(j) Not applicable.
Item 5. Audit Committee of Listed Registrants
Not applicable.
Item 6. Schedule of Investments
| (a) | Please see schedule of investments contained in the Financial Statements and Financial Highlights included under Item 7 of this Form N-CSR. |
Item 7. Financial Statements and Financial Highlights for Open-End Management Investment Companies
Senior Debt Portfolio
October 31, 2024
| Asset-Backed Securities — 3.8% |
| Security | Principal
Amount
(000's omitted) | Value |
| Alinea CLO Ltd.: | | | |
| Series 2018-1A, Class D, 7.979%, (3 mo. SOFR + 3.362%), 7/20/31(1)(2) | $ | 2,500 | $ 2,523,717 |
| Series 2018-1A, Class E, 10.879%, (3 mo. SOFR + 6.262%), 7/20/31(1)(2) | | 3,000 | 3,014,940 |
| AMMC CLO XII Ltd., Series 2013-12A, Class ER, 11.544%, (3 mo. SOFR + 6.442%), 11/10/30(1)(2) | | 3,525 | 3,477,571 |
| AMMC CLO XV Ltd., Series 2014-15A, Class ERR, 11.828%, (3 mo. SOFR + 7.172%), 1/15/32(1)(2) | | 2,500 | 2,506,502 |
| ARES Loan Funding II Ltd., Series 2022-ALF2A, Class ER, 12.857%, (3 mo. SOFR + 8.24%), 10/20/36(1)(2) | | 1,675 | 1,746,720 |
| ARES LVIII CLO Ltd., Series 2020-58A, Class ER, 11.356%, (3 mo. SOFR + 6.70%), 1/15/35(1)(2) | | 3,000 | 3,019,863 |
| ARES XXXIIR CLO Ltd.: | | | |
| Series 2014-32RA, Class C, 8.28%, (3 mo. SOFR + 3.162%), 5/15/30(1)(2) | | 5,000 | 5,013,805 |
| Series 2014-32RA, Class D, 11.23%, (3 mo. SOFR + 6.112%), 5/15/30(1)(2) | | 1,000 | 1,003,960 |
| ARES XXXVR CLO Ltd., Series 2015-35RA, Class E, 10.618%, (3 mo. SOFR + 5.962%), 7/15/30(1)(2) | | 4,000 | 4,020,516 |
| Barings CLO Ltd.: | | | |
| Series 2015-1A, Class DR, 7.479%, (3 mo. SOFR + 2.862%), 1/20/31(1)(2) | | 2,500 | 2,518,375 |
| Series 2018-1A, Class C, 7.518%, (3 mo. SOFR + 2.862%), 4/15/31(1)(2) | | 3,500 | 3,502,236 |
| Battalion CLO XXII Ltd., Series 2021-22A, Class E, 11.829%, (3 mo. SOFR + 7.212%), 1/20/35(1)(2) | | 1,750 | 1,504,337 |
| Benefit Street Partners CLO VIII Ltd., Series 2015-8A, Class DR, 10.479%, (3 mo. SOFR + 5.862%), 1/20/31(1)(2) | | 5,401 | 5,284,797 |
| Benefit Street Partners CLO XVI Ltd., Series 2018-16A, Class E, 11.609%, (3 mo. SOFR + 6.962%), 1/17/32(1)(2) | | 2,250 | 2,267,681 |
| Benefit Street Partners CLO XXII Ltd., Series 2020-22A, Class ER, 11.547%, (3 mo. SOFR + 6.93%), 4/20/35(1)(2) | | 1,000 | 1,014,548 |
| Benefit Street Partners CLO XXV Ltd., Series 2021-25A, Class E, 11.768%, (3 mo. SOFR + 7.112%), 1/15/35(1)(2) | | 3,000 | 3,044,676 |
| Betony CLO 2 Ltd.: | | | |
| Series 2018-1A, Class C, 7.751%, (3 mo. SOFR + 3.162%), 4/30/31(1)(2) | | 2,500 | 2,516,250 |
| Series 2018-1A, Class D, 10.501%, (3 mo. SOFR + 5.912%), 4/30/31(1)(2) | | 2,525 | 2,504,300 |
| Security | Principal
Amount
(000's omitted) | Value |
| BlueMountain CLO Ltd.: | | | |
| Series 2015-3A, Class CR, 7.479%, (3 mo. SOFR + 2.862%), 4/20/31(1)(2) | $ | 5,000 | $ 5,006,550 |
| Series 2015-3A, Class DR, 10.279%, (3 mo. SOFR + 5.662%), 4/20/31(1)(2) | | 3,000 | 2,823,816 |
| Series 2016-3A, Class DR, 8.48%, (3 mo. SOFR + 3.362%), 11/15/30(1)(2) | | 1,500 | 1,503,465 |
| Series 2016-3A, Class ER, 11.33%, (3 mo. SOFR + 6.212%), 11/15/30(1)(2) | | 1,500 | 1,485,059 |
| Series 2018-1A, Class D, 7.901%, (3 mo. SOFR + 3.312%), 7/30/30(1)(2) | | 2,500 | 2,502,633 |
| Series 2018-1A, Class E, 10.801%, (3 mo. SOFR + 6.212%), 7/30/30(1)(2) | | 2,000 | 1,883,592 |
| BlueMountain CLO XXIV Ltd., Series 2019-24A, Class ER, 11.719%, (3 mo. SOFR + 7.102%), 4/20/34(1)(2) | | 1,250 | 1,221,439 |
| BlueMountain CLO XXVI Ltd., Series 2019-26A, Class ER, 12.009%, (3 mo. SOFR + 7.392%), 10/20/34(1)(2) | | 3,000 | 2,996,007 |
| BlueMountain CLO XXX Ltd., Series 2020-30A, Class ER, 11.356%, (3 mo. SOFR + 6.70%), 4/15/35(1)(2) | | 2,000 | 1,969,420 |
| BlueMountain CLO XXXIII Ltd., Series 2021-33A, Class E, 12.22%, (3 mo. SOFR + 7.092%), 11/20/34(1)(2) | | 2,500 | 2,456,318 |
| Bryant Park Funding Ltd.: | | | |
| Series 2023-20A, Class D, 10.746%, (3 mo. SOFR + 6.09%), 7/15/36(1)(2) | | 5,250 | 5,360,161 |
| Series 2023-21A, Class D, 10.082%, (3 mo. SOFR + 5.45%), 10/18/36(1)(2) | | 4,475 | 4,576,927 |
| Canyon Capital CLO Ltd.: | | | |
| Series 2012-1RA, Class E, 10.618%, (3 mo. SOFR + 5.962%), 7/15/30(1)(2) | | 4,875 | 4,704,862 |
| Series 2016-1A, Class ER, 10.668%, (3 mo. SOFR + 6.012%), 7/15/31(1)(2) | | 4,000 | 3,880,936 |
| Series 2016-2A, Class ER, 10.918%, (3 mo. SOFR + 6.262%), 10/15/31(1)(2) | | 4,500 | 4,436,748 |
| Series 2018-1A, Class D, 7.818%, (3 mo. SOFR + 3.162%), 7/15/31(1)(2) | | 3,000 | 3,005,553 |
| Series 2018-1A, Class E, 10.668%, (3 mo. SOFR + 6.012%), 7/15/31(1)(2) | | 2,750 | 2,683,117 |
| Series 2019-2A, Class ER, 11.668%, (3 mo. SOFR + 7.012%), 10/15/34(1)(2) | | 1,500 | 1,478,550 |
| Carlyle C17 CLO Ltd.: | | | |
| Series C17A, Class CR, 7.651%, (3 mo. SOFR + 3.062%), 4/30/31(1)(2) | | 5,000 | 5,040,655 |
| Series C17A, Class DR, 10.851%, (3 mo. SOFR + 6.262%), 4/30/31(1)(2) | | 3,500 | 3,508,750 |
| Carlyle Global Market Strategies CLO Ltd.: | | | |
| Series 2012-3A, Class CR2, 8.418%, (3 mo. SOFR + 3.762%), 1/14/32(1)(2) | | 2,500 | 2,510,410 |
| Series 2012-3A, Class DR2, 11.418%, (3 mo. SOFR + 6.762%), 1/14/32(1)(2) | | 1,500 | 1,506,639 |
16
See Notes to Financial Statements.
Senior Debt Portfolio
October 31, 2024
Portfolio of Investments — continued
| Security | Principal
Amount
(000's omitted) | Value |
Carlyle Global Market Strategies CLO Ltd.:
(continued) | | | |
| Series 2014-3RA, Class C, 7.829%, (3 mo. SOFR + 3.212%), 7/27/31(1)(2) | $ | 1,000 | $ 1,002,448 |
| Series 2014-3RA, Class D, 10.279%, (3 mo. SOFR + 5.662%), 7/27/31(1)(2) | | 2,150 | 2,151,127 |
| Series 2014-4RA, Class C, 7.818%, (3 mo. SOFR + 3.162%), 7/15/30(1)(2) | | 2,750 | 2,759,927 |
| Series 2014-4RA, Class D, 10.568%, (3 mo. SOFR + 5.912%), 7/15/30(1)(2) | | 1,500 | 1,488,839 |
| Carlyle U.S. CLO Ltd.: | | | |
| Series 2019-4A, Class DR, 11.256%, (3 mo. SOFR + 6.60%), 4/15/35(1)(2) | | 3,000 | 3,020,814 |
| Series 2021-7A, Class D, 11.168%, (3 mo. SOFR + 6.512%), 10/15/35(1)(2) | | 250 | 251,580 |
| Series 2022-6A, Class DR, 9.376%, (3 mo. SOFR + 4.75%), 10/25/36(1)(2) | | 2,800 | 2,860,794 |
| CarVal CLO IV Ltd., Series 2021-1A, Class E, 11.479%, (3 mo. SOFR + 6.862%), 7/20/34(1)(2) | | 1,000 | 1,008,534 |
| CIFC Funding Ltd.: | | | |
| Series 2022-1A, Class E, 11.048%, (3 mo. SOFR + 6.40%), 4/17/35(1)(2) | | 750 | 755,495 |
| Series 2022-4A, Class D, 8.197%, (3 mo. SOFR + 3.55%), 7/16/35(1)(2) | | 1,750 | 1,758,692 |
| Crown City CLO I, Series 2020-1A, Class DR, 11.879%, (3 mo. SOFR + 7.262%), 7/20/34(1)(2) | | 250 | 248,707 |
| Dryden CLO Ltd.: | | | |
| Series 2018-55A, Class D, 7.768%, (3 mo. SOFR + 3.112%), 4/15/31(1)(2) | | 1,500 | 1,502,036 |
| Series 2018-55A, Class E, 10.318%, (3 mo. SOFR + 5.662%), 4/15/31(1)(2) | | 2,000 | 1,986,478 |
| Dryden Senior Loan Fund: | | | |
| Series 2015-41A, Class DR, 7.518%, (3 mo. SOFR + 2.862%), 4/15/31(1)(2) | | 7,000 | 6,987,750 |
| Series 2015-41A, Class ER, 10.218%, (3 mo. SOFR + 5.562%), 4/15/31(1)(2) | | 1,268 | 1,190,082 |
| Series 2016-42A, Class D1AR, 7.956%, (3 mo. SOFR + 3.30%), 7/15/37(1)(2) | | 2,500 | 2,518,077 |
| Series 2016-42A, Class ERR, 11.156%, (3 mo. SOFR + 6.50%), 7/15/37(1)(2) | | 3,500 | 3,455,550 |
| Empower CLO Ltd., Series 2023-2A, Class D, 10.056%, (3 mo. SOFR + 5.40%), 7/15/36(1)(2) | | 2,000 | 2,056,716 |
| Galaxy XIX CLO Ltd., Series 2015-19A, Class D1R, 11.426%, (3 mo. SOFR + 6.792%), 7/24/30(1)(2) | | 2,000 | 2,006,702 |
| Golub Capital Partners 48 LP, Series 2020-48A, Class D, 8.709%, (3 mo. SOFR + 4.062%), 4/17/33(1)(2) | | 2,000 | 2,008,074 |
| Golub Capital Partners CLO 53B Ltd., Series 2021-53A, Class E, 11.579%, (3 mo. SOFR + 6.962%), 7/20/34(1)(2) | | 1,250 | 1,256,294 |
| Security | Principal
Amount
(000's omitted) | Value |
| Golub Capital Partners CLO 58B Ltd., Series 2021-58A, Class E, 11.698%, (3 mo. SOFR + 7.072%), 1/25/35(1)(2) | $ | 2,500 | $ 2,515,125 |
| HalseyPoint CLO 5 Ltd., Series 2021-5A, Class E, 11.791%, (3 mo. SOFR + 7.202%), 1/30/35(1)(2) | | 2,000 | 1,964,728 |
| Harriman Park CLO Ltd., Series 2020-1A, Class ER, 11.279%, (3 mo. SOFR + 6.662%), 4/20/34(1)(2) | | 1,000 | 1,007,803 |
| ICG U.S. CLO Ltd.: | | | |
| Series 2018-2A, Class D, 7.993%, (3 mo. SOFR + 3.362%), 7/22/31(1)(2) | | 2,000 | 2,004,846 |
| Series 2018-2A, Class E, 10.643%, (3 mo. SOFR + 6.012%), 7/22/31(1)(2) | | 3,000 | 2,825,418 |
| Madison Park Funding LIX Ltd., Series 2021-59A, Class ER, 11.032%, (3 mo. SOFR + 6.40%), 4/18/37(1)(2) | | 1,550 | 1,557,598 |
| Madison Park Funding XXXVI Ltd., Series 2019-36A, Class ER, 11.706%, (3 mo. SOFR + 7.05%), 4/15/35(1)(2) | | 2,500 | 2,510,610 |
| Madison Park Funding XXXVII Ltd., Series 2019-37A, Class ER2, 11.256%, (3 mo. SOFR + 6.60%), 4/15/37(1)(2) | | 750 | 758,138 |
| Marble Point CLO XXIV Ltd., Series 2022-1A, Class D1, 8.857%, (3 mo. SOFR + 4.24%), 4/20/35(1)(2) | | 2,000 | 2,003,656 |
| Neuberger Berman CLO XVIII Ltd., Series 2014-18A, Class DR2, 10.799%, (3 mo. SOFR + 6.182%), 10/21/30(1)(2) | | 2,000 | 2,012,184 |
| Neuberger Berman Loan Advisers CLO Ltd., Series 2022-48A, Class E, 11.126%, (3 mo. SOFR + 6.50%), 4/25/36(1)(2) | | 2,600 | 2,617,969 |
| Palmer Square CLO Ltd.: | | | |
| Series 2013-2A, Class DRR, 10.759%, (3 mo. SOFR + 6.112%), 10/17/31(1)(2) | | 1,425 | 1,433,524 |
| Series 2015-1A, Class DR4, 11.888%, (3 mo. SOFR + 6.762%), 5/21/34(1)(2) | | 2,000 | 2,006,830 |
| Series 2021-2A, Class E, 11.268%, (3 mo. SOFR + 6.612%), 7/15/34(1)(2) | | 1,000 | 1,008,784 |
| RAD CLO 5 Ltd., Series 2019-5A, Class E, 11.596%, (3 mo. SOFR + 6.962%), 7/24/32(1)(2) | | 1,250 | 1,257,333 |
| RAD CLO 11 Ltd., Series 2021-11A, Class E, 11.168%, (3 mo. SOFR + 6.512%), 4/15/34(1)(2) | | 750 | 755,178 |
| RAD CLO 14 Ltd., Series 2021-14A, Class E, 11.418%, (3 mo. SOFR + 6.762%), 1/15/35(1)(2) | | 1,050 | 1,056,676 |
| Regatta XIII Funding Ltd., Series 2018-2A, Class D, 10.868%, (3 mo. SOFR + 6.212%), 7/15/31(1)(2) | | 5,000 | 4,904,900 |
| Regatta XV Funding Ltd., Series 2018-4A, Class D, 11.388%, (3 mo. SOFR + 6.762%), 10/25/31(1)(2) | | 2,875 | 2,886,322 |
17
See Notes to Financial Statements.
Senior Debt Portfolio
October 31, 2024
Portfolio of Investments — continued
| Security | Principal
Amount
(000's omitted) | Value |
| Upland CLO Ltd.: | | | |
| Series 2016-1A, Class CR, 7.779%, (3 mo. SOFR + 3.162%), 4/20/31(1)(2) | $ | 4,500 | $ 4,511,250 |
| Series 2016-1A, Class DR, 10.779%, (3 mo. SOFR + 6.162%), 4/20/31(1)(2) | | 2,125 | 2,134,871 |
| Vibrant CLO IX, Ltd.: | | | |
| Series 2018-9A, Class C, 8.079%, (3 mo. SOFR + 3.462%), 7/20/31(1)(2) | | 2,500 | 2,511,342 |
| Series 2018-9A, Class D, 11.129%, (3 mo. SOFR + 6.512%), 7/20/31(1)(2) | | 3,500 | 3,366,923 |
| Voya CLO Ltd.: | | | |
| Series 2014-1A, Class DR2, 10.894%, (3 mo. SOFR + 6.262%), 4/18/31(1)(2) | | 3,250 | 3,201,578 |
| Series 2015-3A, Class CR, 8.029%, (3 mo. SOFR + 3.412%), 10/20/31(1)(2) | | 2,500 | 2,503,923 |
| Series 2015-3A, Class DR, 11.079%, (3 mo. SOFR + 6.462%), 10/20/31(1)(2) | | 5,500 | 5,245,927 |
| Series 2016-3A, Class CR, 8.144%, (3 mo. SOFR + 3.512%), 10/18/31(1)(2) | | 2,000 | 2,002,730 |
| Series 2016-3A, Class DR, 10.974%, (3 mo. SOFR + 6.342%), 10/18/31(1)(2) | | 2,375 | 2,245,330 |
| Wellfleet CLO Ltd., Series 2021-3A, Class E, 12.018%, (3 mo. SOFR + 7.362%), 1/15/35(1)(2) | | 1,050 | 988,857 |
Total Asset-Backed Securities
(identified cost $225,833,251) | | | $ 225,101,470 |
| Security | Shares | Value |
| Aerospace and Defense — 0.0% |
| IAP Worldwide Services LLC(3)(4)(5) | | 168 | $ 0 |
| | | | $ 0 |
| Commercial Services & Supplies — 0.1% |
| Monitronics International, Inc.(4)(5) | | 199,603 | $ 4,191,663 |
| Phoenix Services International LLC(4)(5) | | 291,132 | 1,200,920 |
| Phoenix Services International LLC(4)(5) | | 26,562 | 109,568 |
| | | | $ 5,502,151 |
| Containers and Glass Products — 0.0%(6) |
| LG Parent Holding Co.(4)(5) | | 342,076 | $ 1,539,342 |
| | | | $ 1,539,342 |
| Electronic Equipment, Instruments & Components — 0.4% |
| Range Red Acquisitions LLC, Class A1(3)(4)(5) | | 10,660 | $ 23,631,941 |
| | | | $ 23,631,941 |
| Security | Shares | Value |
| Electronics/Electrical — 0.0%(6) |
| Skillsoft Corp.(4)(5) | | 50,519 | $ 771,425 |
| | | | $ 771,425 |
| Entertainment — 0.0%(6) |
| New Cineworld Ltd.(4)(5) | | 113,548 | $ 2,583,217 |
| | | | $ 2,583,217 |
| Health Care — 0.3% |
| Akorn Holding Co. LLC(3)(4)(5) | | 792,089 | $ 0 |
| Cano Health, Inc.(4)(5) | | 380,806 | 4,379,269 |
| Envision Parent, Inc.(4)(5) | | 953,838 | 10,134,529 |
| | | | $ 14,513,798 |
| Household Durables — 0.2% |
| Serta Simmons Bedding, Inc.(4)(5) | | 1,401,999 | $ 9,930,779 |
| Serta SSB Equipment Co.(3)(4)(5) | | 1,401,999 | 0 |
| | | | $ 9,930,779 |
| Investment Companies — 0.0%(6) |
| Aegletes BV(4)(5) | | 138,671 | $ 90,136 |
| | | | $ 90,136 |
| Nonferrous Metals/Minerals — 0.2% |
| ACNR Holdings, Inc., Class A(5) | | 116,152 | $ 8,914,666 |
| | | | $ 8,914,666 |
| Oil and Gas — 0.0% |
| AFG Holdings, Inc.(3)(4)(5) | | 281,241 | $ 0 |
| | | | $ 0 |
| Pharmaceuticals — 0.1% |
| Covis Midco 1 SARL, Class A(4)(5) | | 8,349 | $ 4,258 |
| Covis Midco 1 SARL, Class B(4)(5) | | 8,349 | 4,258 |
| Covis Midco 1 SARL, Class C(4)(5) | | 8,349 | 4,258 |
| Covis Midco 1 SARL, Class D(4)(5) | | 8,349 | 4,258 |
| Covis Midco 1 SARL, Class E(4)(5) | | 8,349 | 4,258 |
| Mallinckrodt International Finance SA(4)(5) | | 107,065 | 8,123,554 |
| | | | $ 8,144,844 |
| Retail — 0.0% |
| Jubilee Enterprise PCL, Class A1(3)(4)(5) | | 2,563 | $ 0 |
| Jubilee Enterprise PCL, Class A2(3)(4)(5) | | 2,048,265 | 0 |
| | | | $ 0 |
18
See Notes to Financial Statements.
Senior Debt Portfolio
October 31, 2024
Portfolio of Investments — continued
| Security | Shares | Value |
| Retailers (Except Food and Drug) — 0.0% |
| Phillips Feed Service, Inc.(3)(4)(5) | | 2,960 | $ 0 |
| | | | $ 0 |
| Telecommunications — 0.0% |
| GEE Acquisition Holdings Corp.(3)(4)(5) | | 390,679 | $ 0 |
| | | | $ 0 |
Total Common Stocks
(identified cost $111,484,313) | | | $ 75,622,299 |
| Security | Principal
Amount*
(000's omitted) | Value |
| Aerospace and Defense — 0.3% |
| TransDigm, Inc.: | | | |
| 6.75%, 8/15/28(1) | | 3,825 | $ 3,911,870 |
| 6.875%, 12/15/30(1) | | 15,000 | 15,389,460 |
| | | | $ 19,301,330 |
| Air Transport — 0.6% |
| American Airlines, Inc./AAdvantage Loyalty IP Ltd.: | | | |
| 5.50%, 4/20/26(1) | | 9,650 | $ 9,628,046 |
| 5.75%, 4/20/29(1) | | 14,475 | 14,345,556 |
| United Airlines, Inc.: | | | |
| 4.375%, 4/15/26(1) | | 5,050 | 4,965,944 |
| 4.625%, 4/15/29(1) | | 5,050 | 4,836,910 |
| | | | $ 33,776,456 |
| Automotive — 0.1% |
| Adient Global Holdings Ltd., 7.00%, 4/15/28(1) | | 650 | $ 661,365 |
| Clarios Global LP/Clarios U.S. Finance Co., 6.25%, 5/15/26(1) | | 4,478 | 4,489,781 |
| | | | $ 5,151,146 |
| Building and Development — 0.2% |
| Miter Brands Acquisition Holdco, Inc./MIWD Borrower LLC, 6.75%, 4/1/32(1) | | 5,425 | $ 5,521,967 |
| Smyrna Ready Mix Concrete LLC, 8.875%, 11/15/31(1) | | 2,500 | 2,628,364 |
| Winnebago Industries, Inc., 6.25%, 7/15/28(1) | | 1,100 | 1,094,543 |
| | | | $ 9,244,874 |
| Security | Principal
Amount*
(000's omitted) | Value |
| Business Equipment and Services — 0.7% |
| Allied Universal Holdco LLC/Allied Universal Finance Corp./Atlas Luxco 4 SARL: | | | |
| 4.625%, 6/1/28(1) | | 18,725 | $ 17,551,417 |
| 4.625%, 6/1/28(1) | | 20,575 | 19,316,397 |
| Prime Security Services Borrower LLC/Prime Finance, Inc., 5.75%, 4/15/26(1) | | 4,175 | 4,180,010 |
| | | | $ 41,047,824 |
| Capital Markets — 0.2% |
| Focus Financial Partners LLC, 6.75%, 9/15/31(1) | | 14,500 | $ 14,415,032 |
| | | | $ 14,415,032 |
| Chemicals — 0.6% |
| INEOS Finance PLC: | | | |
| 3.375%, 3/31/26(1) | EUR | 2,000 | $ 2,179,941 |
| 7.50%, 4/15/29(1) | | 9,075 | 9,374,012 |
| Olympus Water U.S. Holding Corp.: | | | |
| 4.25%, 10/1/28(1) | | 10,050 | 9,469,307 |
| 7.125%, 10/1/27(1) | | 1,075 | 1,092,558 |
| 9.75%, 11/15/28(1) | | 11,400 | 12,108,613 |
| | | | $ 34,224,431 |
| Commercial Services — 0.3% |
| Neptune Bidco U.S., Inc., 9.29%, 4/15/29(1) | | 13,600 | $ 12,719,179 |
| Wand NewCo 3, Inc., 7.625%, 1/30/32(1) | | 6,525 | 6,749,059 |
| | | | $ 19,468,238 |
| Containers & Packaging — 0.2% |
| Pactiv Evergreen Group Issuer, Inc./Pactiv Evergreen Group Issuer LLC: | | | |
| 4.00%, 10/15/27(1) | | 6,325 | $ 6,046,547 |
| 4.375%, 10/15/28(1) | | 6,350 | 5,978,308 |
| | | | $ 12,024,855 |
| Diversified Financial Services — 0.2% |
| AG TTMT Escrow Issuer LLC, 8.625%, 9/30/27(1) | | 3,350 | $ 3,464,064 |
| Aretec Group, Inc., 10.00%, 8/15/30(1) | | 5,375 | 5,863,346 |
| | | | $ 9,327,410 |
| Diversified Telecommunication Services — 0.9% |
| Altice France SA: | | | |
| 5.125%, 1/15/29(1) | | 1,600 | $ 1,200,033 |
| 5.125%, 7/15/29(1) | | 20,275 | 15,187,764 |
| 8.125%, 2/1/27(1) | | 22,500 | 18,652,383 |
19
See Notes to Financial Statements.
Senior Debt Portfolio
October 31, 2024
Portfolio of Investments — continued
| Security | Principal
Amount*
(000's omitted) | Value |
| Diversified Telecommunication Services (continued) |
| Level 3 Financing, Inc., 10.75%, 12/15/30(1) | | 11,175 | $ 12,542,453 |
| Virgin Media Secured Finance PLC, 4.50%, 8/15/30(1) | | 7,625 | 6,684,959 |
| | | | $ 54,267,592 |
| Drugs — 0.2% |
| Jazz Securities DAC, 4.375%, 1/15/29(1) | | 10,050 | $ 9,519,290 |
| | | | $ 9,519,290 |
| Electronics/Electrical — 0.3% |
| Imola Merger Corp., 4.75%, 5/15/29(1) | | 15,700 | $ 15,191,998 |
| | | | $ 15,191,998 |
| Engineering & Construction — 0.1% |
| Artera Services LLC, 8.50%, 2/15/31(1) | | 6,375 | $ 6,324,190 |
| | | | $ 6,324,190 |
| Entertainment — 0.1% |
| Caesars Entertainment, Inc., 6.50%, 2/15/32(1) | | 5,275 | $ 5,352,754 |
| Six Flags Theme Parks, Inc., 7.00%, 7/1/25(1) | | 662 | 661,947 |
| | | | $ 6,014,701 |
| Health Care — 0.7% |
| Medline Borrower LP, 3.875%, 4/1/29(1) | | 21,150 | $ 19,802,538 |
| Tenet Healthcare Corp., 4.25%, 6/1/29 | | 22,375 | 21,184,058 |
| | | | $ 40,986,596 |
| Hotels, Restaurants & Leisure — 0.5% |
| Carnival Corp., 4.00%, 8/1/28(1) | | 31,975 | $ 30,505,208 |
| | | | $ 30,505,208 |
| Household Products — 0.1% |
| Kronos Acquisition Holdings, Inc., 8.25%, 6/30/31(1) | | 5,000 | $ 4,957,283 |
| | | | $ 4,957,283 |
| Insurance — 0.6% |
| Alliant Holdings Intermediate LLC/Alliant Holdings Co-Issuer: | | | |
| 4.25%, 10/15/27(1) | | 700 | $ 664,558 |
| 7.00%, 1/15/31(1) | | 5,250 | 5,289,706 |
| AmWINS Group, Inc., 6.375%, 2/15/29(1) | | 12,350 | 12,418,666 |
| Panther Escrow Issuer LLC, 7.125%, 6/1/31(1) | | 14,525 | 14,884,210 |
| | | | $ 33,257,140 |
| Security | Principal
Amount*
(000's omitted) | Value |
| Internet Software & Services — 0.3% |
| Central Parent, Inc./CDK Global, Inc., 7.25%, 6/15/29(1) | | 15,225 | $ 15,297,030 |
| | | | $ 15,297,030 |
| Leisure Goods/Activities/Movies — 0.4% |
| Lindblad Expeditions LLC, 6.75%, 2/15/27(1) | | 3,475 | $ 3,494,210 |
| NCL Corp. Ltd., 5.875%, 2/15/27(1) | | 20,375 | 20,367,626 |
| | | | $ 23,861,836 |
| Machinery — 0.3% |
| Madison IAQ LLC, 4.125%, 6/30/28(1) | | 12,300 | $ 11,727,447 |
| TK Elevator U.S. Newco, Inc., 5.25%, 7/15/27(1) | | 4,950 | 4,872,889 |
| | | | $ 16,600,336 |
| Media — 0.0%(6) |
| iHeartCommunications, Inc., 6.375%, 5/1/26 | | 1,159 | $ 982,276 |
| | | | $ 982,276 |
| Oil, Gas & Consumable Fuels — 0.2% |
| CITGO Petroleum Corp., 7.00%, 6/15/25(1) | | 12,175 | $ 12,198,267 |
| | | | $ 12,198,267 |
| Professional Services — 0.0%(6) |
| CoreLogic, Inc., 4.50%, 5/1/28(1) | | 3,500 | $ 3,289,978 |
| | | | $ 3,289,978 |
| Real Estate Investment Trusts (REITs) — 0.2% |
| Cushman & Wakefield U.S. Borrower LLC, 6.75%, 5/15/28(1) | | 7,493 | $ 7,539,770 |
| Park Intermediate Holdings LLC/PK Domestic Property LLC/PK Finance Co-Issuer, 5.875%, 10/1/28(1) | | 5,925 | 5,869,157 |
| | | | $ 13,408,927 |
| Retail — 0.1% |
| Fertitta Entertainment LLC/Fertitta Entertainment Finance Co., Inc., 4.625%, 1/15/29(1) | | 6,790 | $ 6,344,465 |
| | | | $ 6,344,465 |
| Software — 0.8% |
| Cloud Software Group, Inc.: | | | |
| 8.25%, 6/30/32(1) | | 19,590 | $ 20,149,151 |
| 9.00%, 9/30/29(1) | | 5,100 | 5,103,464 |
| GoTo Group, Inc., 5.50%, 5/1/28(1) | | 5,405 | 4,180,110 |
20
See Notes to Financial Statements.
Senior Debt Portfolio
October 31, 2024
Portfolio of Investments — continued
| Security | Principal
Amount*
(000's omitted) | Value |
| Software (continued) |
| UKG, Inc., 6.875%, 2/1/31(1) | | 10,525 | $ 10,791,559 |
| Veritas U.S., Inc./Veritas Bermuda Ltd., 7.50%, 9/1/25(1) | | 6,850 | 6,526,099 |
| | | | $ 46,750,383 |
| Technology — 0.3% |
| Clarivate Science Holdings Corp., 3.875%, 7/1/28(1) | | 10,575 | $ 9,990,435 |
| NCR Atleos Corp., 9.50%, 4/1/29(1) | | 8,700 | 9,582,665 |
| | | | $ 19,573,100 |
| Telecommunications — 0.1% |
| VMED O2 U.K. Financing I PLC, 4.25%, 1/31/31(1) | | 4,375 | $ 3,778,667 |
| | | | $ 3,778,667 |
| Wireless Telecommunication Services — 0.1% |
| Digicel Intermediate Holdings Ltd./Digicel International Finance Ltd./DIFL U.S., 12.00%, (9.00% cash and 3.00% PIK), 5/25/27 | | 7,284 | $ 7,325,366 |
| | | | $ 7,325,366 |
Total Corporate Bonds
(identified cost $580,292,514) | | | $ 568,416,225 |
| Senior Floating-Rate Loans — 107.0%(7) |
| Borrower/Description | Principal
Amount*
(000's omitted) | Value |
| Aerospace and Defense — 1.3% |
| Aernnova Aerospace SAU, Term Loan, 7.25%, (3 mo. EURIBOR + 4.00%), 2/27/30 | EUR | 7,550 | $ 8,217,644 |
| Dynasty Acquisition Co., Inc., Term Loan, 8/24/28(8) | | 793 | 794,329 |
| HDI Aerospace Intermediate Holding III Corp., Term Loan, 9/19/31(8) | | 8,325 | 8,309,391 |
| IAP Worldwide Services, Inc., Term Loan - Second Lien, 0.00%, 7/18/23(3)(9) | | 1,184 | 941,309 |
| Novaria Holdings LLC, Term Loan, 9.035%, (SOFR + 4.25%), 6/6/31 | | 2,600 | 2,606,500 |
| TransDigm, Inc.: | | | |
| Term Loan, 7.104%, (SOFR + 2.50%), 2/28/31 | | 26,825 | 26,878,633 |
| Term Loan, 7.354%, (SOFR + 2.75%), 3/22/30 | | 29,224 | 29,324,159 |
| | | | $ 77,071,965 |
| Borrower/Description | Principal
Amount*
(000's omitted) | Value |
| Air Freight & Logistics — 0.1% |
| AIT Worldwide Logistics, Inc., Term Loan, 4/5/30(8) | | 8,025 | $ 7,984,875 |
| | | | $ 7,984,875 |
| Airlines — 0.4% |
| American Airlines, Inc., Term Loan, 9.629%, (SOFR + 4.75%), 4/20/28 | | 22,400 | $ 23,073,277 |
| | | | $ 23,073,277 |
| Apparel & Luxury Goods — 0.8% |
| ABG Intermediate Holdings 2 LLC, Term Loan, 7.447%, (SOFR + 2.75%), 12/21/28 | | 9,282 | $ 9,313,252 |
| Gloves Buyer, Inc., Term Loan, 8.80%, (SOFR + 4.00%), 12/29/27 | | 29,962 | 29,886,744 |
| Hanesbrands, Inc., Term Loan, 8.435%, (SOFR + 3.75%), 3/8/30 | | 2,593 | 2,601,364 |
| Varsity Brands, Inc., Term Loan, 8/26/31(8) | | 6,000 | 5,986,608 |
| | | | $ 47,787,968 |
| Auto Components — 1.9% |
| Adient U.S. LLC, Term Loan, 7.435%, (SOFR + 2.75%), 1/31/31 | | 19,141 | $ 19,216,613 |
| Autokiniton U.S. Holdings, Inc., Term Loan, 8.80%, (SOFR + 4.00%), 4/6/28 | | 22,662 | 22,706,356 |
| Clarios Global LP: | | | |
| Term Loan, 6.102%, (EURIBOR + 3.00%), 7/16/31(10) | EUR | 8,186 | 8,902,375 |
| Term Loan, 7.185%, (SOFR + 2.50%), 5/6/30 | | 499 | 499,893 |
| DexKo Global, Inc.: | | | |
| Term Loan, 7.345%, (3 mo. EURIBOR + 4.00%), 10/4/28 | EUR | 4,719 | 4,952,165 |
| Term Loan, 7.345%, (3 mo. EURIBOR + 4.00%), 10/4/28 | EUR | 6,931 | 7,272,637 |
| Term Loan, 8.615%, (SOFR + 3.75%), 10/4/28 | | 10,123 | 9,715,890 |
| Garrett LX I SARL, Term Loan, 7.335%, (SOFR + 2.75%), 4/30/28 | | 6,208 | 6,231,280 |
| LSF12 Badger Bidco LLC, Term Loan, 10.685%, (SOFR + 6.00%), 8/30/30 | | 3,970 | 3,915,413 |
| LTI Holdings, Inc., Term Loan, 9.435%, (SOFR + 4.75%), 7/19/29 | | 10,500 | 10,464,563 |
| RealTruck Group, Inc.: | | | |
| Term Loan, 8.30%, (SOFR + 3.50%), 1/31/28 | | 11,256 | 11,133,165 |
| Term Loan, 9.80%, (SOFR + 5.00%), 1/31/28 | | 8,905 | 8,820,650 |
| | | | $ 113,831,000 |
| Automobiles — 1.0% |
| Bombardier Recreational Products, Inc., Term Loan, 7.435%, (SOFR + 2.75%), 1/22/31 | | 34,833 | $ 34,838,611 |
21
See Notes to Financial Statements.
Senior Debt Portfolio
October 31, 2024
Portfolio of Investments — continued
| Borrower/Description | Principal
Amount*
(000's omitted) | Value |
| Automobiles (continued) |
| MajorDrive Holdings IV LLC: | | | |
| Term Loan, 8.865%, (SOFR + 4.00%), 6/1/28 | | 22,276 | $ 22,373,532 |
| Term Loan, 10.254%, (SOFR + 5.50%), 6/1/29 | | 1,481 | 1,490,731 |
| | | | $ 58,702,874 |
| Beverages — 1.1% |
| Arterra Wines Canada, Inc., Term Loan, 8.365%, (SOFR + 3.50%), 11/24/27 | | 3,369 | $ 3,315,310 |
| City Brewing Co. LLC: | | | |
| Term Loan, 8.418%, (SOFR + 3.50%), 4/5/28 | | 12,846 | 10,019,787 |
| Term Loan, 10.906%, (SOFR + 6.25%), 4/5/28 | | 7,155 | 6,009,806 |
| Term Loan - Second Lien, 9.676%, (SOFR + 5.00%), 4/5/28 | | 14,502 | 6,888,599 |
| Triton Water Holdings, Inc., Term Loan, 8.115%, (SOFR + 3.25%), 3/31/28 | | 35,203 | 35,275,398 |
| | | | $ 61,508,900 |
| Biotechnology — 0.5% |
| Alkermes, Inc., Term Loan, 7.332%, (SOFR + 2.50%), 3/12/26 | | 12,572 | $ 12,587,633 |
| Alltech, Inc., Term Loan, 8.80%, (SOFR + 4.00%), 10/13/28 | | 13,222 | 13,205,854 |
| Grifols Worldwide Operations USA, Inc., Term Loan, 6.735%, (SOFR + 2.00%), 11/15/27 | | 6,310 | 6,143,335 |
| | | | $ 31,936,822 |
| Building Products — 1.5% |
| Cornerstone Building Brands, Inc., Term Loan, 8.154%, (SOFR + 3.25%), 4/12/28 | | 17,783 | $ 17,516,340 |
| CPG International, Inc., Term Loan, 9/19/31(8) | | 9,175 | 9,204,626 |
| LHS Borrower LLC, Term Loan, 9.535%, (SOFR + 4.75%), 2/16/29 | | 6,628 | 6,362,679 |
| LSF12 Crown U.S. Commercial Bidco LLC, Term Loan, 10/10/31(8) | | 25,575 | 25,511,062 |
| MI Windows and Doors LLC, Term Loan, 7.685%, (SOFR + 3.00%), 3/28/31 | | 11,621 | 11,676,562 |
| Oscar AcquisitionCo LLC, Term Loan, 8.495%, (SOFR + 4.25%), 4/29/29 | | 4,982 | 4,952,944 |
| Sport Group Holding GmbH, Term Loan, 7.50%, (3 mo. EURIBOR + 4.25%), 7/8/31 | EUR | 1,700 | 1,858,421 |
| Standard Industries, Inc., Term Loan, 6.759%, (SOFR + 2.00%), 9/22/28 | | 8,635 | 8,662,396 |
| | | | $ 85,745,030 |
| Capital Markets — 4.8% |
| Advisor Group, Inc., Term Loan, 8.685%, (SOFR + 4.00%), 8/17/28 | | 25,181 | $ 25,212,568 |
| Borrower/Description | Principal
Amount*
(000's omitted) | Value |
| Capital Markets (continued) |
| AllSpring Buyer LLC, Term Loan, 8.137%, (SOFR + 3.25%), 11/1/28 | | 8,146 | $ 8,152,330 |
| Aretec Group, Inc., Term Loan, 8.685%, (SOFR + 4.00%), 8/9/30 | | 28,031 | 27,880,082 |
| Brookfield Property REIT, Inc., Term Loan, 7.285%, (SOFR + 2.50%), 8/27/25 | | 4,449 | 4,447,491 |
| CeramTec AcquiCo GmbH, Term Loan, 7.005%, (3 mo. EURIBOR + 3.50%), 3/16/29 | EUR | 14,461 | 15,760,827 |
| Citco Funding LLC, Term Loan, 7.308%, (SOFR + 2.75%), 4/27/28 | | 10,321 | 10,368,745 |
| Clipper Acquisitions Corp., Term Loan, 6.715%, (SOFR + 1.75%), 3/3/28 | | 6,767 | 6,750,399 |
| Edelman Financial Center LLC, Term Loan, 7.935%, (SOFR + 3.25%), 4/7/28 | | 18,113 | 18,139,544 |
| EIG Management Co. LLC, Term Loan, 9.759%, (SOFR + 5.00%), 5/17/29 | | 5,555 | 5,582,461 |
| FinCo I LLC, Term Loan, 6.935%, (SOFR + 2.25%), 6/27/29 | | 16,121 | 16,181,391 |
| Focus Financial Partners LLC: | | | |
| Term Loan, 0.00%, 9/15/31(11) | | 1,455 | 1,458,527 |
| Term Loan, 7.935%, (SOFR + 3.25%), 9/15/31 | | 13,545 | 13,580,008 |
| Franklin Square Holdings LP, Term Loan, 6.935%, (SOFR + 2.25%), 4/25/31 | | 13,167 | 13,167,000 |
| Guggenheim Partners LLC, Term Loan, 7.854%, (SOFR + 3.25%), 12/12/29 | | 32,027 | 32,139,113 |
| HighTower Holdings LLC, Term Loan, 8.748%, (SOFR + 3.50%), 4/21/28 | | 12,659 | 12,696,533 |
| Kestra Advisor Services Holdings A, Inc., Term Loan, 9.057%, (SOFR + 4.00%), 3/22/31 | | 8,379 | 8,419,152 |
| LPL Holdings, Inc., Term Loan, 6.694%, (SOFR + 1.75%), 11/12/26 | | 17,526 | 17,523,108 |
| Mariner Wealth Advisors LLC, Term Loan, 7.604%, (SOFR + 3.00%), 8/18/28 | | 17,317 | 17,349,162 |
| Press Ganey Holdings, Inc., Term Loan, 8.185%, (SOFR + 3.50%), 4/30/31 | | 8,325 | 8,336,056 |
| Victory Capital Holdings, Inc.: | | | |
| Term Loan, 6.934%, (SOFR + 2.25%), 7/1/26 | | 12,800 | 12,806,086 |
| Term Loan, 6.934%, (SOFR + 2.25%), 12/29/28 | | 5,963 | 5,962,507 |
| | | | $ 281,913,090 |
| Chemicals — 5.4% |
| Axalta Coating Systems U.S. Holdings, Inc., Term Loan, 6.604%, (SOFR + 2.00%), 12/20/29 | | 19,614 | $ 19,696,013 |
| CPC Acquisition Corp., Term Loan, 8.615%, (SOFR + 3.75%), 12/29/27 | | 17,474 | 15,442,724 |
| Discovery Purchaser Corp., Term Loan, 10/4/29(8) | | 7,675 | 7,676,596 |
| ECO Services Operations Corp., Term Loan, 6.835%, (SOFR + 2.25%), 6/12/31 | | 30,413 | 30,346,050 |
22
See Notes to Financial Statements.
Senior Debt Portfolio
October 31, 2024
Portfolio of Investments — continued
| Borrower/Description | Principal
Amount*
(000's omitted) | Value |
| Chemicals (continued) |
| Flint Group Topco Ltd., Term Loan - Second Lien, 11.888%, (SOFR + 7.26%), 4.988% cash, 6.90% PIK, 12/30/27 | | 325 | $ 65,755 |
| Gemini HDPE LLC, Term Loan, 7.847%, (SOFR + 3.00%), 12/31/27 | | 5,400 | 5,413,680 |
| GEON Performance Solutions LLC, Term Loan, 9.115%, (SOFR + 4.25%), 8/18/28 | | 7,545 | 7,585,412 |
| Groupe Solmax, Inc., Term Loan, 9.585%, (SOFR + 4.75%), 5/29/28(10) | | 15,303 | 14,227,377 |
| INEOS Enterprises Holdings II Ltd., Term Loan, 7.505%, (3 mo. EURIBOR + 4.00%), 7/7/30 | EUR | 2,325 | 2,542,296 |
| INEOS Enterprises Holdings U.S. Finco LLC, Term Loan, 8.907%, (SOFR + 3.75%), 7/8/30 | | 13,895 | 13,981,843 |
| INEOS Finance PLC, Term Loan, 6.646%, (1 mo. EURIBOR + 3.50%), 6/23/31 | EUR | 7,846 | 8,517,862 |
| INEOS Quattro Holdings U.K. Ltd.: | | | |
| Term Loan, 7.146%, (1 mo. EURIBOR + 4.00%), 3/14/30 | EUR | 4,075 | 4,424,270 |
| Term Loan, 8.535%, (SOFR + 3.75%), 3/14/30 | | 6,048 | 6,018,195 |
| INEOS U.S. Finance LLC: | | | |
| Term Loan, 7.285%, (SOFR + 2.50%), 11/8/28 | | 6,699 | 6,704,429 |
| Term Loan, 7.935%, (SOFR + 3.25%), 2/18/30 | | 14,472 | 14,482,918 |
| Term Loan, 8.435%, (SOFR + 3.75%), 2/7/31 | | 7,082 | 7,106,599 |
| Lonza Group AG: | | | |
| Term Loan, 7.27%, (3 mo. EURIBOR + 3.93%), 7/3/28 | EUR | 7,575 | 8,028,563 |
| Term Loan, 8.629%, (SOFR + 3.93%), 7/3/28 | | 9,321 | 9,094,429 |
| Momentive Performance Materials, Inc., Term Loan, 8.75%, (SOFR + 4.00%), 3/29/28 | | 15,960 | 16,019,438 |
| Nobian Finance BV, Term Loan, 7/2/29(8) | EUR | 500 | 545,099 |
| Olympus Water U.S. Holding Corp., Term Loan, 8.104%, (SOFR + 3.50%), 6/20/31 | | 9,455 | 9,485,989 |
| Orion Engineered Carbons GmbH, Term Loan, 5.745%, (3 mo. EURIBOR + 2.40%), 9/24/28 | EUR | 1,250 | 1,349,490 |
| Paint Intermediate III LLC, Term Loan, 10.00%, (USD Prime + 2.00%), 9/11/31 | | 6,600 | 6,583,500 |
| Rohm Holding GmbH: | | | |
| Term Loan, 8.84%, (6 mo. EURIBOR + 5.25%), 8.59% cash, 0.25% PIK, 1/31/29 | EUR | 14,706 | 14,944,603 |
| Term Loan, 10.588%, (SOFR + 5.50%), 1/31/29 | | 17,173 | 16,214,460 |
| SCUR-Alpha 1503 GmbH, Term Loan, 10.085%, (SOFR + 5.50%), 3/29/30 | | 15,548 | 14,861,056 |
| Tronox Finance LLC: | | | |
| Term Loan, 7.14%, (SOFR + 2.50%), 9/18/31(10) | | 12,836 | 12,833,856 |
| Term Loan, 7.354%, (SOFR + 2.75%), 4/4/29 | | 21,663 | 21,667,733 |
| Borrower/Description | Principal
Amount*
(000's omitted) | Value |
| Chemicals (continued) |
| W.R. Grace & Co.-Conn., Term Loan, 7.854%, (SOFR + 3.25%), 9/22/28 | | 22,837 | $ 22,917,396 |
| | | | $ 318,777,631 |
| Commercial Services & Supplies — 2.2% |
| Albion Financing 3 SARL, Term Loan, 9.096%, (SOFR + 4.25%), 8/16/29 | | 24,003 | $ 24,152,672 |
| Belfor Holdings, Inc., Term Loan, 8.435%, (SOFR + 3.75%), 11/1/30 | | 7,871 | 7,930,269 |
| EnergySolutions LLC, Term Loan, 8.104%, (SOFR + 3.50%), 9/20/30 | | 16,267 | 16,304,124 |
| Flame Newco LLC, Term Loan, 10.785%, (SOFR + 6.10%), 6/30/28 | | 3,610 | 3,520,172 |
| Foundever Group, Term Loan, 6.90%, (1 mo. EURIBOR + 3.75%), 8/28/28 | EUR | 4,575 | 3,224,330 |
| Foundever Worldwide Corp., Term Loan, 8.55%, (SOFR + 3.75%), 8/28/28 | | 15,753 | 10,112,869 |
| GFL Environmental, Inc., Term Loan, 6.61%, (SOFR + 2.00%), 7/3/31 | | 12,125 | 12,125,000 |
| Harsco Corp., Term Loan, 7.05%, (SOFR + 2.25%), 3/10/28 | | 1,287 | 1,285,354 |
| Heritage-Crystal Clean, Inc., Term Loan, 9.259%, (SOFR + 4.50%), 10/17/30 | | 9,305 | 9,369,820 |
| Monitronics International, Inc., Term Loan, 12.447%, (SOFR + 7.50%), 6/30/28 | | 10,890 | 10,944,913 |
| Prime Security Services Borrower LLC, Term Loan, 7.107%, (SOFR + 2.25%), 10/13/30 | | 11,945 | 11,963,040 |
| Tempo Acquisition LLC, Term Loan, 6.935%, (SOFR + 2.25%), 8/31/28 | | 3,418 | 3,424,024 |
| TMF Group Holding BV, Term Loan, 8.092%, (SOFR + 3.50%), 5/3/28 | | 5,136 | 5,165,144 |
| TruGreen LP, Term Loan, 8.797%, (SOFR + 4.00%), 11/2/27 | | 9,237 | 8,994,922 |
| | | | $ 128,516,653 |
| Construction Materials — 0.9% |
| Construction Partners, Inc., Term Loan, 10/29/31(8) | | 6,525 | $ 6,508,688 |
| Quikrete Holdings, Inc.: | | | |
| Term Loan, 6.935%, (SOFR + 2.25%), 3/19/29 | | 13,318 | 13,333,037 |
| Term Loan, 7.185%, (SOFR + 2.50%), 4/14/31 | | 20,207 | 20,229,539 |
| Star Holding LLC, Term Loan, 9.185%, (SOFR + 4.50%), 7/31/31 | | 10,900 | 10,720,924 |
| | | | $ 50,792,188 |
| Consumer Staples Distribution & Retail — 0.8% |
| Cardenas Markets, Inc., Term Loan, 11.454%, (SOFR + 6.75%), 8/1/29 | | 5,319 | $ 5,209,562 |
23
See Notes to Financial Statements.
Senior Debt Portfolio
October 31, 2024
Portfolio of Investments — continued
| Borrower/Description | Principal
Amount*
(000's omitted) | Value |
| Consumer Staples Distribution & Retail (continued) |
| Peer Holding III BV: | | | |
| Term Loan, 7.095%, (3 mo. EURIBOR + 3.75%), 9/29/28 | EUR | 7,550 | $ 8,251,439 |
| Term Loan, 7.604%, (SOFR + 3.00%), 7/1/31 | | 18,075 | 18,123,947 |
| Term Loan, 7.854%, (SOFR + 3.25%), 10/28/30 | | 14,552 | 14,610,984 |
| | | | $ 46,195,932 |
| Containers & Packaging — 1.3% |
| Altium Packaging LLC, Term Loan, 7.185%, (SOFR + 2.50%), 6/11/31 | | 6,334 | $ 6,306,413 |
| Berlin Packaging LLC, Term Loan, 8.57%, (SOFR + 3.75%), 6/9/31(10) | | 18,534 | 18,598,075 |
| Clydesdale Acquisition Holdings, Inc., Term Loan, 7.86%, (SOFR + 3.18%), 4/13/29 | | 26,957 | 26,921,443 |
| Pregis TopCo Corp.: | | | |
| Term Loan, 8.685%, (SOFR + 4.00%), 7/31/26 | | 2,310 | 2,320,158 |
| Term Loan, 8.80%, (SOFR + 4.00%), 7/31/26 | | 1,601 | 1,608,503 |
| Pretium Packaging LLC, Term Loan - Second Lien, 9.848%, (SOFR + 4.60%), 10/2/28 | | 1,714 | 1,405,120 |
| Pretium PKG Holdings, Inc., Term Loan - Second Lien, 12.068%, (SOFR + 6.75%), 10/1/29 | | 7,100 | 2,669,600 |
| Proampac PG Borrower LLC, Term Loan, 8.839%, (SOFR + 4.00%), 9/15/28 | | 16,503 | 16,582,948 |
| | | | $ 76,412,260 |
| Distributors — 0.8% |
| CD&R Hydra Buyer, Inc., Term Loan, 8.785%, (SOFR + 4.00%), 3/25/31 | | 12,919 | $ 12,906,325 |
| Parts Europe SA, Term Loan, 6.701%, (3 mo. EURIBOR + 3.50%), 2/3/31 | EUR | 19,225 | 20,964,271 |
| Phillips Feed Service, Inc., Term Loan, 11.785%, (SOFR + 7.00%), 11/13/24(3) | | 532 | 324,130 |
| Rubix Group Midco 3 Ltd.: | | | |
| Term Loan, 7.302%, (3 mo. EURIBOR + 4.25%), 9/30/26 | EUR | 2,000 | 2,180,031 |
| Term Loan, 7.712%, (6 mo. EURIBOR + 4.25%), 9/30/26 | EUR | 6,000 | 6,540,094 |
| Winterfell Financing SARL, Term Loan, 8.557%, (3 mo. EURIBOR + 5.00%), 5/4/28 | EUR | 2,500 | 2,701,813 |
| | | | $ 45,616,664 |
| Diversified Consumer Services — 1.7% |
| Ascend Learning LLC: | | | |
| Term Loan, 8.285%, (SOFR + 3.50%), 12/11/28 | | 9,857 | $ 9,866,461 |
| Term Loan - Second Lien, 10.535%, (SOFR + 5.75%), 12/10/29 | | 7,743 | 7,638,786 |
| Borrower/Description | Principal
Amount*
(000's omitted) | Value |
| Diversified Consumer Services (continued) |
| Chrysaor Bidco SARL: | | | |
| Term Loan, 5/14/31(8) | | 1,791 | $ 1,799,690 |
| Term Loan, 7/17/31(8) | | 24,220 | 24,334,942 |
| FrontDoor, Inc., Term Loan, 7.05%, (SOFR + 2.25%), 6/17/28 | | 943 | 946,260 |
| KUEHG Corp., Term Loan, 7.839%, (SOFR + 3.25%), 6/12/30 | | 18,114 | 18,187,966 |
| Project Boost Purchaser LLC: | | | |
| Term Loan, 8.147%, (SOFR + 3.50%), 7/16/31 | | 10,875 | 10,900,915 |
| Term Loan - Second Lien, 9.897%, (SOFR + 5.25%), 7/16/32 | | 4,800 | 4,833,998 |
| Spring Education Group, Inc., Term Loan, 8.604%, (SOFR + 4.00%), 10/4/30 | | 4,690 | 4,724,148 |
| Wand NewCo 3, Inc., Term Loan, 7.905%, (SOFR + 3.25%), 1/30/31(10) | | 16,459 | 16,479,324 |
| | | | $ 99,712,490 |
| Diversified Financial Services — 0.1% |
| Concorde Midco Ltd., Term Loan, 7.092%, (6 mo. EURIBOR + 4.00%), 3/1/28 | EUR | 7,480 | $ 8,124,506 |
| | | | $ 8,124,506 |
| Diversified Telecommunication Services — 1.1% |
| Altice France SA, Term Loan, 8/14/26(8) | | 6,455 | $ 5,496,432 |
| Anuvu Holdings 2 LLC: | | | |
| Term Loan, 8.963%, (SOFR + 4.00%), 9/27/27(3) | | 9,869 | 7,895,074 |
| Term Loan, 13.213%, (SOFR + 8.25%), 3/23/26(3) | | 8,545 | 3,411,164 |
| Level 3 Financing, Inc.: | | | |
| Term Loan, 11.278%, (SOFR + 6.56%), 4/15/29 | | 5,750 | 5,879,375 |
| Term Loan, 11.278%, (SOFR + 6.56%), 4/15/30 | | 11,900 | 12,162,443 |
| Lumen Technologies, Inc.: | | | |
| Term Loan, 7.182%, (SOFR + 2.35%), 4/15/29 | | 11,999 | 10,919,007 |
| Term Loan, 7.182%, (SOFR + 2.35%), 4/15/30 | | 11,999 | 10,780,275 |
| Virgin Media Bristol LLC, Term Loan, 7.418%, (SOFR + 2.50%), 1/31/28 | | 4,843 | 4,708,861 |
| | | | $ 61,252,631 |
| Electrical Equipment — 0.6% |
| AZZ, Inc., Term Loan, 7.185%, (SOFR + 2.50%), 5/13/29 | | 1,844 | $ 1,852,046 |
| Dynamo Newco II GmbH, Term Loan, 10/1/31(8) | | 2,875 | 2,883,984 |
| WEC U.S. Holdings Ltd., Term Loan, 7.595%, (SOFR + 2.75%), 1/27/31 | | 29,340 | 29,407,385 |
| | | | $ 34,143,415 |
24
See Notes to Financial Statements.
Senior Debt Portfolio
October 31, 2024
Portfolio of Investments — continued
| Borrower/Description | Principal
Amount*
(000's omitted) | Value |
| Electronic Equipment, Instruments & Components — 1.3% |
| Chamberlain Group, Inc., Term Loan, 8.185%, (SOFR + 3.50%), 11/3/28 | | 9,588 | $ 9,608,677 |
| Creation Technologies, Inc., Term Loan, 10.351%, (SOFR + 5.50%), 10/5/28 | | 15,356 | 15,010,454 |
| II-VI, Inc., Term Loan, 7.185%, (SOFR + 2.50%), 7/2/29 | | 1,312 | 1,314,929 |
| Ingram Micro, Inc., Term Loan, 7.564%, (SOFR + 2.75%), 9/22/31 | | 2,838 | 2,844,959 |
| Mirion Technologies, Inc., Term Loan, 6.854%, (SOFR + 2.25%), 10/20/28 | | 2,350 | 2,351,621 |
| MX Holdings U.S., Inc., Term Loan, 7.561%, (SOFR + 2.75%), 7/31/28 | | 3,317 | 3,330,320 |
| Range Red Operating, Inc.: | | | |
| Term Loan, 12.693%, (SOFR + 8.00%), 10/1/29 | | 4,296 | 4,285,699 |
| Term Loan - Second Lien, 12.693%, (SOFR + 8.00%), 10/1/29 | | 16,279 | 16,239,679 |
| Sector Alarm Holding AS, Term Loan, 7.755%, (3 mo. EURIBOR + 4.25%), 6/14/29 | EUR | 500 | 546,561 |
| Verifone Systems, Inc., Term Loan, 9.333%, (SOFR + 4.00%), 8/20/25 | | 20,192 | 18,839,953 |
| | | | $ 74,372,852 |
| Energy Equipment & Services — 0.6% |
| Ameriforge Group, Inc.: | | | |
| Term Loan, 15.811%, (SOFR + 11.00%), 4.811% cash, 11.00% PIK, 12/31/25(3) | | 2,375 | $ 1,093,438 |
| Term Loan, 15.811%, (SOFR + 11.00%), 4.811% cash, 11.00% PIK, 12/31/25(3) | | 20,566 | 9,468,587 |
| GIP Pilot Acquisition Partners LP, Term Loan, 7.09%, (SOFR + 2.50%), 10/4/30 | | 6,209 | 6,216,367 |
| PG Investment Co. 59 SARL, Term Loan, 7.604%, (SOFR + 3.00%), 3/26/31 | | 18,015 | 18,063,036 |
| | | | $ 34,841,428 |
| Engineering & Construction — 1.3% |
| American Residential Services LLC, Term Loan, 8.365%, (SOFR + 3.50%), 10/15/27 | | 8,359 | $ 8,389,904 |
| APi Group DE, Inc., Term Loan, 6.685%, (SOFR + 2.00%), 1/3/29 | | 17,095 | 17,118,509 |
| Arcosa, Inc., Term Loan, 6.935%, (SOFR + 2.25%), 8/12/31 | | 4,750 | 4,776,719 |
| Artera Services LLC, Term Loan, 9.104%, (SOFR + 4.50%), 2/15/31 | | 5,597 | 5,539,507 |
| Azuria Water Solutions, Inc., Term Loan, 8.435%, (SOFR + 3.75%), 5/17/28 | | 17,509 | 17,654,451 |
| Borrower/Description | Principal
Amount*
(000's omitted) | Value |
| Engineering & Construction (continued) |
| Centuri Group, Inc., Term Loan, 7.311%, (SOFR + 2.50%), 8/27/28 | | 6,707 | $ 6,720,903 |
| Northstar Group Services, Inc., Term Loan, 10.014%, (SOFR + 4.75%), 5/8/30 | | 17,656 | 17,739,615 |
| | | | $ 77,939,608 |
| Entertainment — 1.0% |
| Crown Finance U.S., Inc., Term Loan, 13.30%, (SOFR + 8.50%), 6.30% cash, 7.00% PIK, 7/31/28 | | 2,689 | $ 2,712,528 |
| Playtika Holding Corp., Term Loan, 7.55%, (SOFR + 2.75%), 3/13/28 | | 23,022 | 23,022,034 |
| Renaissance Holding Corp., Term Loan, 8.935%, (SOFR + 4.25%), 4/5/30 | | 13,613 | 13,661,491 |
| UFC Holdings LLC, Term Loan, 7.638%, (SOFR + 2.75%), 4/29/26 | | 14,534 | 14,565,917 |
| Vue Entertainment International Ltd., Term Loan, 11.446%, (6 mo. EURIBOR + 8.40%), 3.046% cash, 8.40% PIK, 12/31/27 | EUR | 1,524 | 1,023,890 |
| Vue International Bidco PLC, Term Loan, 11.046%, (6 mo. EURIBOR + 8.00%), 6/30/27 | EUR | 385 | 418,525 |
| | | | $ 55,404,385 |
| Equity Real Estate Investment Trusts (REITs) — 0.1% |
| Iron Mountain, Inc., Term Loan, 6.685%, (SOFR + 2.00%), 1/31/31 | | 7,889 | $ 7,859,454 |
| | | | $ 7,859,454 |
| Financial Services — 2.0% |
| Boost Newco Borrower LLC, Term Loan, 7.104%, (SOFR + 2.50%), 1/31/31 | | 31,850 | $ 31,879,875 |
| CPI Holdco B LLC, Term Loan, 6.685%, (SOFR + 2.00%), 5/19/31 | | 15,625 | 15,475,266 |
| Ditech Holding Corp., Term Loan, 0.00%, 6/30/25(9) | | 14,624 | 2,888,319 |
| Grant Thornton Advisors LLC, Term Loan, 7.935%, (SOFR + 3.25%), 6/2/31 | | 27,925 | 27,965,156 |
| NCR Atleos LLC, Term Loan, 8.398%, (SOFR + 3.75%), 3/27/29 | | 12,110 | 12,129,168 |
| Nuvei Technologies Corp., Term Loan, 7.785%, (SOFR + 3.00%), 12/19/30 | | 10,809 | 10,816,123 |
| Walker & Dunlop, Inc., Term Loan, 7.035%, (SOFR + 2.25%), 12/16/28 | | 13,834 | 13,902,982 |
| WEX, Inc., Term Loan, 6.685%, (SOFR + 2.00%), 3/31/28 | | 4,295 | 4,306,980 |
| | | | $ 119,363,869 |
25
See Notes to Financial Statements.
Senior Debt Portfolio
October 31, 2024
Portfolio of Investments — continued
| Borrower/Description | Principal
Amount*
(000's omitted) | Value |
| Food Products — 1.1% |
| Artisan Newco BV, Term Loan, 7.827%, (3 mo. EURIBOR + 3.75%), 2/12/29 | EUR | 500 | $ 545,982 |
| Badger Buyer Corp., Term Loan, 10.30%, (SOFR + 3.50%), 12/27/24 | | 9,652 | 9,242,117 |
| CHG PPC Parent LLC, Term Loan, 7.55%, (SOFR + 2.75%), 12/8/28 | | 6,166 | 6,154,075 |
| Del Monte Foods, Inc.: | | | |
| Term Loan, 13.166%, (SOFR + 8.00%), 8/2/28 | | 4,565 | 4,371,373 |
| Term Loan - Second Lien, 9.427%, (SOFR + 4.25%), 8/2/28(10) | | 6,493 | 3,708,841 |
| Froneri International Ltd., Term Loan, 6.685%, (SOFR + 2.00%), 9/17/31 | | 8,616 | 8,587,186 |
| Monogram Food Solutions LLC, Term Loan, 8.80%, (SOFR + 4.00%), 8/28/28 | | 1,752 | 1,745,004 |
| Nomad Foods U.S. LLC, Term Loan, 6.968%, (SOFR + 2.50%), 11/12/29 | | 14,032 | 14,056,210 |
| Simply Good Foods USA, Inc., Term Loan, 7.318%, (SOFR + 2.50%), 3/17/27 | | 1,875 | 1,885,547 |
| United Petfood Group BV, Term Loan, 5.822%, (3 mo. EURIBOR + 2.75%), 4/24/28 | EUR | 7,600 | 8,260,013 |
| Valeo F1 Co. Ltd. (Ireland), Term Loan, 9.70%, (SONIA + 4.75%), 6/28/28 | GBP | 5,500 | 6,902,489 |
| | | | $ 65,458,837 |
| Gas Utilities — 0.4% |
| CQP Holdco LP, Term Loan, 6.854%, (SOFR + 2.25%), 12/31/30 | | 21,933 | $ 21,944,317 |
| | | | $ 21,944,317 |
| Health Care Equipment & Supplies — 1.1% |
| Bayou Intermediate II LLC, Term Loan, 9.347%, (SOFR + 4.50%), 8/2/28 | | 11,985 | $ 11,745,247 |
| Journey Personal Care Corp., Term Loan, 9.05%, (SOFR + 4.25%), 3/1/28 | | 25,880 | 25,868,774 |
| Medline Borrower LP, Term Loan, 7.435%, (SOFR + 2.75%), 10/23/28 | | 24,302 | 24,355,333 |
| | | | $ 61,969,354 |
| Health Care Providers & Services — 5.8% |
| AEA International Holdings (Lux) SARL, Term Loan, 7.354%, (SOFR + 2.75%), 9/7/28 | | 14,711 | $ 14,747,989 |
| BW NHHC Holdco, Inc., Term Loan - Second Lien, 12.604%, (SOFR + 8.00%), 10.354% cash, 2.25% PIK, 1/15/26 | | 23,083 | 19,967,037 |
| Cano Health LLC: | | | |
| Term Loan, 4.00%, 6/28/28(11) | | 3,440 | 3,448,987 |
| Term Loan, 12.604%, (SOFR + 8.00%), 6/28/29 | | 1,547 | 1,550,374 |
| Borrower/Description | Principal
Amount*
(000's omitted) | Value |
| Health Care Providers & Services (continued) |
| CCRR Parent, Inc., Term Loan, 9.05%, (SOFR + 4.25%), 3/6/28 | | 5,181 | $ 3,986,481 |
| Cerba Healthcare SAS: | | | |
| Term Loan, 6.846%, (1 mo. EURIBOR + 3.70%), 6/30/28 | EUR | 15,825 | 14,960,221 |
| Term Loan, 7.096%, (1 mo. EURIBOR + 3.95%), 2/16/29 | EUR | 8,600 | 8,126,851 |
| CHG Healthcare Services, Inc.: | | | |
| Term Loan, 8.30%, (SOFR + 3.50%), 9/29/28 | | 2,565 | 2,574,590 |
| Term Loan, 8.30%, (SOFR + 3.50%), 9/29/28 | | 5,235 | 5,260,798 |
| Concentra Health Services, Inc., Term Loan, 6.935%, (SOFR + 2.25%), 7/28/31 | | 4,775 | 4,786,938 |
| Covis Finco SARL: | | | |
| Term Loan, 0.00%, 2/18/27(9) | | 10,270 | 4,159,516 |
| Term Loan, 0.00%, 2/18/27(9) | | 4,368 | 4,193,458 |
| Ensemble RCM LLC, Term Loan, 7.585%, (SOFR + 3.00%), 8/1/29 | | 22,359 | 22,411,180 |
| Hanger, Inc.: | | | |
| Term Loan, 10/23/31(8) | | 14,330 | 14,352,326 |
| Term Loan, 10/23/31(8) | | 1,845 | 1,847,939 |
| IVC Acquisition Ltd.: | | | |
| Term Loan, 8.795%, (6 mo. EURIBOR + 5.00%), 12/12/28 | EUR | 20,825 | 22,716,656 |
| Term Loan, 9.393%, (SOFR + 4.75%), 12/12/28 | | 13,647 | 13,718,121 |
| Medical Solutions Holdings, Inc.: | | | |
| Term Loan, 8.185%, (SOFR + 3.50%), 11/1/28 | | 15,021 | 11,284,282 |
| Term Loan - Second Lien, 11.685%, (SOFR + 7.00%), 11/1/29 | | 9,500 | 6,365,000 |
| Mehilainen Yhtiot Oy: | | | |
| Term Loan, 4.00%, 8/5/31(11) | EUR | 1,218 | 1,330,850 |
| Term Loan, 7.345%, (3 mo. EURIBOR + 4.00%), 8/5/31 | EUR | 6,475 | 7,074,875 |
| Term Loan, 7.345%, (3 mo. EURIBOR + 4.00%), 8/5/31 | EUR | 6,807 | 7,437,624 |
| Midwest Physician Administrative Services LLC, Term Loan, 7.865%, (SOFR + 3.00%), 3/12/28 | | 9,927 | 9,039,886 |
| National Mentor Holdings, Inc.: | | | |
| Term Loan, 8.454%, (SOFR + 3.75%), 3/2/28 | | 572 | 563,003 |
| Term Loan, 8.52%, (SOFR + 3.75%), 3/2/28(10) | | 20,223 | 19,903,387 |
| Term Loan - Second Lien, 11.954%, (SOFR + 7.25%), 3/2/29 | | 6,475 | 6,199,813 |
| Pacific Dental Services LLC, Term Loan, 7.536%, (SOFR + 2.75%), 3/15/31 | | 11,094 | 11,113,898 |
| Phoenix Guarantor, Inc., Term Loan, 7.935%, (SOFR + 3.25%), 2/21/31 | | 21,974 | 22,009,766 |
| R1 RCM, Inc., Term Loan, 7.685%, (SOFR + 3.00%), 6/21/29 | | 3,002 | 2,992,332 |
26
See Notes to Financial Statements.
Senior Debt Portfolio
October 31, 2024
Portfolio of Investments — continued
| Borrower/Description | Principal
Amount*
(000's omitted) | Value |
| Health Care Providers & Services (continued) |
| Radnet Management, Inc., Term Loan, 7.132%, (SOFR + 2.50%), 4/18/31 | | 9,277 | $ 9,304,775 |
| Raven Acquisition Holdings LLC: | | | |
| Term Loan, 10/24/31(8) | | 18,480 | 18,406,080 |
| Term Loan, 10/24/31(8) | | 1,320 | 1,314,720 |
| Select Medical Corp., Term Loan, 7.685%, (SOFR + 3.00%), 3/6/27 | | 10,013 | 10,069,541 |
| Sound Inpatient Physicians, Term Loan - Second Lien, 11.365%, (SOFR + 5.00%), 9.865% cash, 1.50% PIK, 6/28/28 | | 2,227 | 2,009,592 |
| Synlab Bondco PLC, Term Loan, 6.178%, (6 mo. EURIBOR + 2.50%), 7/1/27 | EUR | 2,600 | 2,829,032 |
| TTF Holdings LLC, Term Loan, 8.435%, (SOFR + 3.75%), 7/18/31 | | 18,150 | 18,274,781 |
| U.S. Anesthesia Partners, Inc., Term Loan, 9.209%, (SOFR + 4.25%), 10/1/28 | | 8,394 | 8,292,306 |
| | | | $ 338,625,005 |
| Health Care Technology — 1.6% |
| Certara LP, Term Loan, 7.685%, (SOFR + 3.00%), 6/26/31 | | 9,212 | $ 9,223,839 |
| Cotiviti Corp., Term Loan, 8.094%, (SOFR + 3.25%), 5/1/31 | | 11,495 | 11,516,146 |
| eResearchTechnology, Inc., Term Loan, 8.685%, (SOFR + 4.00%), 2/4/27 | | 9,463 | 9,504,787 |
| Imprivata, Inc., Term Loan, 8.085%, (SOFR + 3.50%), 12/1/27 | | 22,178 | 22,302,321 |
| PointClickCare Technologies, Inc.: | | | |
| Term Loan, 7.604%, (SOFR + 3.00%), 12/29/27 | | 4,245 | 4,257,955 |
| Term Loan, 10/10/31(8) | | 7,950 | 7,974,844 |
| Project Ruby Ultimate Parent Corp., Term Loan, 8.30%, (SOFR + 3.50%), 3/10/28 | | 4,652 | 4,673,139 |
| Symplr Software, Inc., Term Loan, 9.185%, (SOFR + 4.50%), 12/22/27 | | 11,328 | 10,417,880 |
| Waystar Technologies, Inc., Term Loan, 7.435%, (SOFR + 2.75%), 10/22/29 | | 12,678 | 12,745,021 |
| | | | $ 92,615,932 |
| Hotels, Restaurants & Leisure — 5.7% |
| 1011778 BC Unlimited Liability Co., Term Loan, 6.435%, (SOFR + 1.75%), 9/20/30 | | 42,295 | $ 41,969,935 |
| Caesars Entertainment, Inc., Term Loan, 7.435%, (SOFR + 2.75%), 2/6/31 | | 30,074 | 30,144,368 |
| Carnival Corp., Term Loan, 7.435%, (SOFR + 2.75%), 10/18/28 | | 30,936 | 31,037,926 |
| ClubCorp Holdings, Inc., Term Loan, 9.865%, (SOFR + 5.00%), 9/18/26 | | 19,928 | 19,984,468 |
| Borrower/Description | Principal
Amount*
(000's omitted) | Value |
| Hotels, Restaurants & Leisure (continued) |
| Fertitta Entertainment LLC, Term Loan, 8.185%, (SOFR + 3.50%), 1/27/29 | | 37,286 | $ 37,336,841 |
| Flutter Financing BV, Term Loan, 6.604%, (SOFR + 2.00%), 11/29/30 | | 41,015 | 41,079,128 |
| GVC Holdings (Gibraltar) Ltd., Term Loan, 6.922%, (6 mo. EURIBOR + 3.25%), 6/30/28 | EUR | 17,325 | 18,916,030 |
| Hilton Domestic Operating Co., Inc., Term Loan, 6.488%, (SOFR + 1.75%), 11/8/30 | | 8,750 | 8,743,753 |
| Light & Wonder International, Inc., Term Loan, 7.034%, (SOFR + 2.25%), 4/14/29 | | 7,845 | 7,848,289 |
| Ontario Gaming GTA LP, Term Loan, 8.893%, (SOFR + 4.25%), 8/1/30 | | 23,686 | 23,724,177 |
| Oravel Stays Singapore Pte. Ltd., Term Loan, 13.325%, (SOFR + 8.25%), 6/23/26 | | 3,800 | 3,830,593 |
| Playa Resorts Holding BV, Term Loan, 7.435%, (SOFR + 2.75%), 1/5/29 | | 43,850 | 43,827,251 |
| SeaWorld Parks & Entertainment, Inc., Term Loan, 7.185%, (SOFR + 2.50%), 8/25/28 | | 19,281 | 19,297,097 |
| Station Casinos LLC, Term Loan, 6.935%, (SOFR + 2.25%), 3/14/31 | | 5,846 | 5,844,959 |
| | | | $ 333,584,815 |
| Household Durables — 1.8% |
| ACProducts, Inc., Term Loan, 9.115%, (SOFR + 4.25%), 5/17/28 | | 22,997 | $ 19,266,812 |
| Libbey Glass, Inc., Term Loan, 11.267%, (SOFR + 6.50%), 11/22/27 | | 19,249 | 19,104,841 |
| Madison Safety & Flow LLC, Term Loan, 7.968%, (SOFR + 3.25%), 9/26/31 | | 8,050 | 8,091,924 |
| Serta Simmons Bedding LLC: | | | |
| Term Loan, 12.218%, (SOFR + 7.50%), 6/29/28 | | 20,679 | 17,473,426 |
| Term Loan, 12.232%, (SOFR + 7.50%), 6/29/28 | | 2,245 | 2,233,718 |
| Solis IV BV, Term Loan, 8.571%, (SOFR + 3.50%), 2/26/29 | | 17,785 | 17,766,307 |
| Tempur Sealy International, Inc., Term Loan, 10/3/31(8) | | 20,900 | 20,913,063 |
| | | | $ 104,850,091 |
| Household Products — 0.6% |
| Energizer Holdings, Inc., Term Loan, 6.759%, (SOFR + 2.00%), 12/22/27 | | 6,883 | $ 6,902,612 |
| Kronos Acquisition Holdings, Inc., Term Loan, 9.314%, (SOFR + 4.00%), 7/8/31 | | 26,700 | 25,157,327 |
| | | | $ 32,059,939 |
27
See Notes to Financial Statements.
Senior Debt Portfolio
October 31, 2024
Portfolio of Investments — continued
| Borrower/Description | Principal
Amount*
(000's omitted) | Value |
| Independent Power and Renewable Electricity Producers — 0.9% |
| Alpha Generation LLC, Term Loan, 7.447%, (SOFR + 2.75%), 9/30/31 | | 4,625 | $ 4,629,953 |
| Calpine Construction Finance Co. LP, Term Loan, 6.685%, (SOFR + 2.00%), 7/31/30 | | 10,466 | 10,422,254 |
| Calpine Corp.: | | | |
| Term Loan, 6.685%, (SOFR + 2.00%), 1/31/31 | | 3,030 | 3,025,869 |
| Term Loan, 6.685%, (SOFR + 2.00%), 1/31/31 | | 18,123 | 18,095,506 |
| Thunder Generation Funding LLC, Term Loan, 7.61%, (SOFR + 3.00%), 10/3/31 | | 13,625 | 13,659,063 |
| | | | $ 49,832,645 |
| Industrial Conglomerates — 1.5% |
| AAG U.S. GSI Bidco, Inc., Term Loan, 10/8/31(8) | | 6,325 | $ 6,325,000 |
| Ammeraal Beltech Holding BV, Term Loan, 8.345%, (3 mo. EURIBOR + 5.00%), 12/30/28 | EUR | 9,528 | 10,397,699 |
| Crown Equipment Corp., Term Loan, 7.324%, (SOFR + 2.50%), 10/10/31 | | 13,200 | 13,222,004 |
| Kohler Energy Co. LLC, Term Loan, 9.354%, (SOFR + 4.75%), 5/1/31 | | 30,224 | 30,413,152 |
| nVent Electric PLC, Term Loan, 9/12/31(8) | | 14,300 | 14,344,687 |
| Rain Carbon GmbH, Term Loan, 8.56%, (3 mo. EURIBOR + 5.00%), 10/31/28 | EUR | 13,948 | 15,067,917 |
| | | | $ 89,770,459 |
| Insurance — 3.3% |
| Acrisure LLC, Term Loan, 8.009%, (SOFR + 3.25%), 11/6/30 | | 6,983 | $ 6,973,772 |
| Alliant Holdings Intermediate LLC, Term Loan, 7.759%, (SOFR + 3.00%), 9/19/31 | | 21,946 | 21,887,615 |
| AmWINS Group, Inc., Term Loan, 7.05%, (SOFR + 2.25%), 2/19/28 | | 23,396 | 23,407,639 |
| AssuredPartners, Inc., Term Loan, 8.185%, (SOFR + 3.50%), 2/14/31 | | 28,592 | 28,668,494 |
| Broadstreet Partners, Inc., Term Loan, 7.935%, (SOFR + 3.25%), 6/13/31 | | 31,870 | 31,895,462 |
| Financiere CEP SAS, Term Loan, 7.146%, (1 mo. EURIBOR + 4.00%), 6/18/27 | EUR | 6,242 | 6,807,626 |
| HUB International Ltd., Term Loan, 7.367%, (SOFR + 2.75%), 6/20/30 | | 17,625 | 17,683,946 |
| Ryan Specialty Group LLC, Term Loan, 6.935%, (SOFR + 2.25%), 9/15/31 | | 15,725 | 15,744,656 |
| Truist Insurance Holdings LLC: | | | |
| Term Loan, 7.854%, (SOFR + 3.25%), 5/6/31 | | 13,745 | 13,770,772 |
| Term Loan - Second Lien, 9.354%, (SOFR + 4.75%), 5/6/32 | | 4,500 | 4,573,125 |
| USI, Inc.: | | | |
| Term Loan, 7.354%, (SOFR + 2.75%), 11/22/29 | | 8,955 | 8,964,376 |
| Borrower/Description | Principal
Amount*
(000's omitted) | Value |
| Insurance (continued) |
| USI, Inc.: (continued) | | | |
| Term Loan, 7.354%, (SOFR + 2.75%), 9/27/30 | | 10,950 | $ 10,963,413 |
| | | | $ 191,340,896 |
| Interactive Media & Services — 0.3% |
| Buzz Finco LLC, Term Loan, 8.035%, (SOFR + 3.25%), 1/29/27 | | 549 | $ 548,155 |
| Foundational Education Group, Inc., Term Loan, 8.597%, (SOFR + 3.75%), 8/31/28 | | 3,522 | 3,451,408 |
| Getty Images, Inc., Term Loan, 8.845%, (SOFR + 4.50%), 2/19/26 | | 11,430 | 11,386,680 |
| Match Group, Inc., Term Loan, 6.714%, (SOFR + 1.75%), 2/13/27 | | 3,100 | 3,100,000 |
| | | | $ 18,486,243 |
| IT Services — 4.6% |
| Asurion LLC: | | | |
| Term Loan, 8.785%, (SOFR + 4.00%), 8/19/28 | | 21,326 | $ 21,155,685 |
| Term Loan, 9.035%, (SOFR + 4.25%), 8/19/28 | | 7,264 | 7,232,049 |
| Term Loan - Second Lien, 10.05%, (SOFR + 5.25%), 1/31/28 | | 18,610 | 17,991,217 |
| Term Loan - Second Lien, 10.05%, (SOFR + 5.25%), 1/20/29 | | 4,375 | 4,189,972 |
| Endure Digital, Inc., Term Loan, 8.471%, (SOFR + 3.50%), 2/10/28 | | 33,399 | 30,359,914 |
| Gainwell Acquisition Corp., Term Loan, 8.704%, (SOFR + 4.00%), 10/1/27 | | 25,222 | 24,323,917 |
| Go Daddy Operating Co. LLC, Term Loan, 6.685%, (SOFR + 2.00%), 11/9/29 | | 45,628 | 45,654,664 |
| Informatica LLC, Term Loan, 6.935%, (SOFR + 2.25%), 10/27/28 | | 33,979 | 34,042,460 |
| NAB Holdings LLC, Term Loan, 7.354%, (SOFR + 2.75%), 11/23/28 | | 13,757 | 13,757,177 |
| Plano HoldCo, Inc., Term Loan, 8.092%, (SOFR + 3.50%), 10/2/31 | | 7,550 | 7,606,625 |
| Rackspace Finance LLC: | | | |
| Term Loan, 11.183%, (SOFR + 6.25%), 5/15/28 | | 13,581 | 13,844,198 |
| Term Loan - Second Lien, 7.683%, (SOFR + 2.75%), 5/15/28 | | 27,543 | 16,548,904 |
| Sedgwick Claims Management Services, Inc., Term Loan, 7.585%, (SOFR + 3.00%), 7/31/31 | | 14,887 | 14,910,779 |
| Synechron, Inc., Term Loan, 8.36%, (SOFR + 3.75%), 10/3/31 | | 10,950 | 10,908,937 |
| team.blue Finco SARL, Term Loan, 7.045%, (3 mo. EURIBOR + 3.70%), 9/30/29 | EUR | 4,350 | 4,685,871 |
| Virtusa Corp., Term Loan, 7.935%, (SOFR + 3.25%), 2/15/29 | | 1,990 | 1,992,488 |
| | | | $ 269,204,857 |
28
See Notes to Financial Statements.
Senior Debt Portfolio
October 31, 2024
Portfolio of Investments — continued
| Borrower/Description | Principal
Amount*
(000's omitted) | Value |
| Leisure Products — 0.9% |
| Accell Group NV, Term Loan, 8.648%, (6 mo. EURIBOR + 4.90%), 6/14/29 | EUR | 3,500 | $ 575,828 |
| Fender Musical Instruments Corp., Term Loan, 8.785%, (SOFR + 4.00%), 12/1/28 | | 1,222 | 1,172,985 |
| GSM Holdings, Inc., Term Loan, 9/29/31(8) | | 9,250 | 8,868,437 |
| Hayward Industries, Inc., Term Loan, 7.30%, (SOFR + 2.50%), 5/30/28 | | 9,163 | 9,174,105 |
| Recess Holdings, Inc., Term Loan, 9.085%, (SOFR + 4.50%), 2/20/30 | | 22,643 | 22,787,657 |
| Tait LLC, Term Loan, 9.197%, (SOFR + 4.50%), 10/1/31 | | 12,675 | 12,754,219 |
| | | | $ 55,333,231 |
| Life Sciences Tools & Services — 1.0% |
| Cambrex Corp., Term Loan, 8.285%, (SOFR + 3.50%), 12/4/26 | | 5,910 | $ 5,896,844 |
| Catalent Pharma Solutions, Inc.: | | | |
| Term Loan, 6.859%, (SOFR + 2.00%), 2/22/28 | | 774 | 774,301 |
| Term Loan, 7.745%, (SOFR + 3.00%), 2/22/28 | | 3,532 | 3,538,873 |
| Curia Global, Inc., Term Loan, 8.336%, (SOFR + 3.75%), 8/30/26(10) | | 19,220 | 18,342,914 |
| LGC Group Holdings Ltd., Term Loan, 6.396%, (1 mo. EURIBOR + 3.25%), 4/21/27 | EUR | 4,025 | 4,353,018 |
| Loire Finco Luxembourg SARL, Term Loan, 8.285%, (SOFR + 3.50%), 4/21/27 | | 3,450 | 3,439,887 |
| Packaging Coordinators Midco, Inc., Term Loan, 7.835%, (SOFR + 3.25%), 11/30/27 | | 14,563 | 14,607,453 |
| Sotera Health Holdings LLC, Term Loan, 7.835%, (SOFR + 3.25%), 5/30/31 | | 10,000 | 10,034,380 |
| | | | $ 60,987,670 |
| Machinery — 6.0% |
| AI Aqua Merger Sub, Inc., Term Loan, 8.357%, (SOFR + 3.50%), 7/31/28 | | 24,449 | $ 24,515,477 |
| Ali Group North America Corp., Term Loan, 6.80%, (SOFR + 2.00%), 7/30/29 | | 14,471 | 14,534,422 |
| Apex Tool Group LLC: | | | |
| Term Loan, 14.872%, (SOFR + 10.10%), 7.418% cash, 7.454% PIK, 2/8/30 | | 13,686 | 13,036,036 |
| Term Loan - Second Lien, 12.068%, (SOFR + 7.35%), 4.718% cash, 7.35% PIK, 2/8/29 | | 5,860 | 5,596,723 |
| Barnes Group, Inc., Term Loan, 7.185%, (SOFR + 2.50%), 9/3/30 | | 14,644 | 14,681,331 |
| Clark Equipment Co., Term Loan, 6.604%, (SOFR + 2.00%), 4/20/29 | | 12,438 | 12,439,935 |
| Conair Holdings LLC, Term Loan, 8.55%, (SOFR + 3.75%), 5/17/28 | | 25,778 | 23,688,670 |
| Borrower/Description | Principal
Amount*
(000's omitted) | Value |
| Machinery (continued) |
| CPM Holdings, Inc., Term Loan, 9.344%, (SOFR + 4.50%), 9/28/28 | | 14,938 | $ 14,690,130 |
| Cube Industrials Buyer, Inc., Term Loan, 8.132%, (SOFR + 3.50%), 10/9/31 | | 5,200 | 5,209,750 |
| Delachaux Group SA, Term Loan, 6.556%, (3 mo. EURIBOR + 3.50%), 4/16/29 | EUR | 4,945 | 5,409,677 |
| EMRLD Borrower LP: | | | |
| Term Loan, 7.557%, (SOFR + 2.50%), 5/31/30 | | 9,803 | 9,811,247 |
| Term Loan, 7.557%, (SOFR + 2.50%), 8/4/31 | | 13,200 | 13,206,877 |
| Engineered Machinery Holdings, Inc.: | | | |
| Term Loan, 7.095%, (3 mo. EURIBOR + 3.75%), 5/21/28 | EUR | 11,761 | 12,867,921 |
| Term Loan, 8.615%, (SOFR + 3.75%), 5/19/28 | | 26,422 | 26,534,960 |
| Term Loan - Second Lien, 10.865%, (SOFR + 6.00%), 5/21/29 | | 3,700 | 3,710,048 |
| Term Loan - Second Lien, 11.365%, (SOFR + 6.50%), 5/21/29 | | 1,621 | 1,629,229 |
| Filtration Group Corp., Term Loan, 8.30%, (SOFR + 3.50%), 10/21/28 | | 3,185 | 3,193,559 |
| Gates Global LLC, Term Loan, 6.935%, (SOFR + 2.25%), 6/4/31 | | 17,000 | 17,061,098 |
| Icebox Holdco III, Inc., Term Loan, 8.615%, (SOFR + 3.75%), 12/22/28 | | 12,493 | 12,555,181 |
| INNIO Group Holding GmbH, Term Loan, 6.955%, (3 mo. EURIBOR + 3.75%), 11/2/28 | EUR | 4,722 | 5,160,887 |
| Madison IAQ LLC, Term Loan, 7.889%, (SOFR + 2.75%), 6/21/28 | | 22,790 | 22,806,424 |
| Pro Mach Group, Inc., Term Loan, 8.185%, (SOFR + 3.50%), 8/31/28 | | 4,749 | 4,774,528 |
| Roper Industrial Products Investment Co. LLC, Term Loan, 7.854%, (SOFR + 3.25%), 11/22/29 | | 11,163 | 11,180,376 |
| SPX Flow, Inc., Term Loan, 8.185%, (SOFR + 3.50%), 4/5/29 | | 15,705 | 15,762,690 |
| TK Elevator Midco GmbH, Term Loan, 7.59%, (6 mo. EURIBOR + 4.00%), 4/30/30 | EUR | 11,450 | 12,510,334 |
| TK Elevator Topco GmbH, Term Loan, 7.215%, (6 mo. EURIBOR + 3.63%), 7/30/27 | EUR | 12,100 | 13,198,784 |
| TK Elevator U.S. Newco, Inc., Term Loan, 8.588%, (SOFR + 3.50%), 4/30/30 | | 21,085 | 21,166,462 |
| Zephyr German BidCo GmbH, Term Loan, 6.865%, (3 mo. EURIBOR + 3.60%), 3/10/28 | EUR | 8,850 | 9,587,483 |
| | | | $ 350,520,239 |
| Media — 0.5% |
| Aragorn Parent Corp., Term Loan, 8.745%, (SOFR + 4.00%), 12/15/28 | | 11,265 | $ 11,321,741 |
| Hubbard Radio LLC, Term Loan, 9.185%, (SOFR + 4.50%), 9/30/27 | | 6,646 | 5,084,323 |
29
See Notes to Financial Statements.
Senior Debt Portfolio
October 31, 2024
Portfolio of Investments — continued
| Borrower/Description | Principal
Amount*
(000's omitted) | Value |
| Media (continued) |
| iHeartCommunications, Inc.: | | | |
| Term Loan, 7.80%, (SOFR + 3.00%), 5/1/26 | | 1,127 | $ 949,153 |
| Term Loan, 8.05%, (SOFR + 3.25%), 5/1/26 | | 3,165 | 2,650,839 |
| MJH Healthcare Holdings LLC, Term Loan, 8.035%, (SOFR + 3.25%), 1/28/29 | | 3,042 | 3,047,127 |
| Sinclair Television Group, Inc., Term Loan, 7.30%, (SOFR + 2.50%), 9/30/26 | | 5,248 | 5,100,572 |
| | | | $ 28,153,755 |
| Metals/Mining — 1.5% |
| AAP Buyer, Inc., Term Loan, 7.854%, (SOFR + 3.25%), 9/9/31 | | 6,025 | $ 6,058,891 |
| Arsenal AIC Parent LLC, Term Loan, 7.935%, (SOFR + 3.25%), 8/18/30 | | 18,241 | 18,307,450 |
| Dynacast International LLC, Term Loan, 14.407%, (SOFR + 9.25%), 10/22/25 | | 2,896 | 2,711,225 |
| PMHC II, Inc., Term Loan, 9.058%, (SOFR + 4.25%), 4/23/29 | | 24,392 | 24,109,789 |
| WireCo WorldGroup, Inc., Term Loan, 8.382%, (SOFR + 3.75%), 11/13/28 | | 6,277 | 6,151,223 |
| Zekelman Industries, Inc., Term Loan, 6.995%, (SOFR + 2.25%), 1/24/31 | | 28,595 | 28,717,626 |
| | | | $ 86,056,204 |
| Oil, Gas & Consumable Fuels — 1.5% |
| Epic Crude Services LP, Term Loan, 7.656%, (SOFR + 3.00%), 10/10/31 | | 7,875 | $ 7,877,953 |
| Freeport LNG Investments LLLP, Term Loan, 8.379%, (SOFR + 3.50%), 12/21/28 | | 17,619 | 17,556,869 |
| GIP II Blue Holding LP, Term Loan, 8.435%, (SOFR + 3.75%), 9/29/28 | | 7,171 | 7,205,289 |
| ITT Holdings LLC, Term Loan, 7.535%, (SOFR + 2.75%), 10/11/30 | | 12,732 | 12,741,320 |
| Matador Bidco SARL, Term Loan, 9.035%, (SOFR + 4.25%), 7/30/29 | | 32,746 | 32,914,143 |
| Oxbow Carbon LLC, Term Loan, 8.185%, (SOFR + 3.50%), 5/10/30 | | 7,431 | 7,468,092 |
| | | | $ 85,763,666 |
| Passenger Airlines — 0.0%(6) |
| WestJet Loyalty LP, Term Loan, 8.354%, (SOFR + 3.75%), 2/14/31 | | 1,244 | $ 1,245,638 |
| | | | $ 1,245,638 |
| Pharmaceuticals — 1.3% |
| Aenova Holding GmbH, Term Loan, 7.135%, (6 mo. EURIBOR + 3.75%), 8/22/31 | EUR | 3,450 | $ 3,771,501 |
| Borrower/Description | Principal
Amount*
(000's omitted) | Value |
| Pharmaceuticals (continued) |
| AI Sirona (Luxembourg) Acquisition SARL, Term Loan, 6.646%, (1 mo. EURIBOR + 3.50%), 9/30/28 | EUR | 5,175 | $ 5,653,733 |
| Ceva Sante Animale: | | | |
| Term Loan, 6.845%, (3 mo. EURIBOR + 3.50%), 11/8/30 | EUR | 4,775 | 5,212,403 |
| Term Loan, 8.354%, (SOFR + 3.25%), 11/8/30 | | 5,348 | 5,387,123 |
| Jazz Financing Lux SARL, Term Loan, 6.935%, (SOFR + 2.25%), 5/5/28 | | 12,632 | 12,645,814 |
| Mallinckrodt International Finance SA: | | | |
| Term Loan, 12.245%, (SOFR + 7.50%), 11/14/28 | | 4,192 | 4,460,595 |
| Term Loan - Second Lien, 14.245%, (SOFR + 9.50%), 11/14/28 | | 23,755 | 25,640,298 |
| Nidda Healthcare Holding AG, Term Loan, 7.427%, (3 mo. EURIBOR + 4.00%), 2/21/30 | EUR | 11,050 | 12,057,943 |
| Recipharm AB, Term Loan, 6.499%, (3 mo. EURIBOR + 2.95%), 2/17/28 | EUR | 3,275 | 3,506,473 |
| | | | $ 78,335,883 |
| Professional Services — 4.6% |
| AAL Delaware Holdco, Inc., Term Loan, 8.185%, (SOFR + 3.50%), 7/30/31 | | 8,975 | $ 9,025,484 |
| APFS Staffing Holdings, Inc., Term Loan, 8.628%, (SOFR + 4.00%), 12/29/28(10) | | 3,835 | 3,828,047 |
| Apleona Holding GmbH, Term Loan, 5.756%, (3 mo. EURIBOR + 2.70%), 4/28/28 | EUR | 5,325 | 5,775,250 |
| Camelot U.S. Acquisition LLC, Term Loan, 7.435%, (SOFR + 2.75%), 1/31/31 | | 17,910 | 17,945,820 |
| CoreLogic, Inc.: | | | |
| Term Loan, 8.30%, (SOFR + 3.50%), 6/2/28 | | 17,157 | 17,106,906 |
| Term Loan - Second Lien, 11.30%, (SOFR + 6.50%), 6/4/29 | | 1,524 | 1,502,055 |
| Corporation Service Co., Term Loan, 7.185%, (SOFR + 2.50%), 11/2/29 | | 4,392 | 4,402,665 |
| Crisis Prevention Institute, Inc., Term Loan, 9.354%, (SOFR + 4.75%), 4/9/31 | | 4,050 | 4,073,624 |
| EAB Global, Inc., Term Loan, 7.935%, (SOFR + 3.25%), 8/16/28 | | 18,572 | 18,535,480 |
| Employbridge Holding Co., Term Loan, 9.623%, (SOFR + 4.75%), 7/19/28(10) | | 23,558 | 16,910,359 |
| First Advantage Holdings LLC, Term Loan, (SOFR + 3.25%), 9/19/31(8) | | 23,831 | 23,756,246 |
| Fleet Midco I Ltd., Term Loan, 7.578%, (SOFR + 2.75%), 2/21/31 | | 8,913 | 8,913,125 |
| Genuine Financial Holdings LLC, Term Loan, 8.685%, (SOFR + 4.00%), 9/27/30 | | 5,123 | 5,122,184 |
| Lernen Bidco Ltd., Term Loan, 11.00%, (USD Prime + 3.00%), 9/30/31 | | 6,800 | 6,851,000 |
30
See Notes to Financial Statements.
Senior Debt Portfolio
October 31, 2024
Portfolio of Investments — continued
| Borrower/Description | Principal
Amount*
(000's omitted) | Value |
| Professional Services (continued) |
| Mermaid Bidco, Inc., Term Loan, 8.492%, (SOFR + 3.25%), 7/3/31 | | 10,610 | $ 10,629,831 |
| Neptune Bidco U.S., Inc., Term Loan, 9.758%, (SOFR + 5.00%), 4/11/29 | | 9,037 | 8,359,572 |
| PHM Group Holding Oy, Term Loan, 7.848%, (3 mo. EURIBOR + 4.75%), 6/24/31 | EUR | 6,600 | 7,183,636 |
| Planet U.S. Buyer LLC, Term Loan, 8.604%, (SOFR + 3.50%), 2/7/31 | | 15,711 | 15,779,359 |
| Techem Verwaltungsgesellschaft 675 GmbH, Term Loan, 7.018%, (3 mo. EURIBOR + 3.75%), 7/15/29 | EUR | 20,375 | 22,241,759 |
| Teneo Holdings LLC, Term Loan, 9.435%, (SOFR + 4.75%), 3/13/31 | | 16,132 | 16,174,345 |
| Tidal Waste & Recycling Holdings LLC, Term Loan, 10/3/31(8) | | 8,125 | 8,140,234 |
| Trans Union LLC, Term Loan, 6.685%, (SOFR + 2.00%), 12/1/28 | | 33,349 | 33,390,642 |
| Vaco Holdings LLC, Term Loan, 9.785%, (SOFR + 5.00%), 1/21/29 | | 5,398 | 5,285,242 |
| | | | $ 270,932,865 |
| Real Estate Management & Development — 0.9% |
| Cushman & Wakefield U.S. Borrower LLC: | | | |
| Term Loan, 7.685%, (SOFR + 3.00%), 1/31/30 | | 10,554 | $ 10,606,979 |
| Term Loan, 7.935%, (SOFR + 3.25%), 1/31/30 | | 7,989 | 8,019,346 |
| Greystar Real Estate Partners LLC, Term Loan, 7.495%, (SOFR + 2.75%), 8/21/30 | | 10,550 | 10,575,913 |
| Homeserve USA Holding Corp., Term Loan, 7.009%, (SOFR + 2.25%), 10/21/30 | | 23,955 | 23,909,710 |
| | | | $ 53,111,948 |
| Road & Rail — 1.2% |
| Avis Budget Car Rental LLC, Term Loan, 6.55%, (SOFR + 1.75%), 8/6/27 | | 28,459 | $ 28,348,481 |
| Hertz Corp.: | | | |
| Term Loan, 8.30%, (SOFR + 3.50%), 6/30/28 | | 16,324 | 14,565,363 |
| Term Loan, 8.30%, (SOFR + 3.50%), 6/30/28 | | 3,180 | 2,837,220 |
| Term Loan, 8.493%, (SOFR + 3.75%), 6/30/28 | | 9,776 | 8,738,292 |
| Kenan Advantage Group, Inc., Term Loan, 7.935%, (SOFR + 3.25%), 1/25/29 | | 16,693 | 16,714,059 |
| | | | $ 71,203,415 |
| Semiconductors & Semiconductor Equipment — 1.0% |
| Altar Bidco, Inc.: | | | |
| Term Loan, 7.247%, (SOFR + 3.10%), 2/1/29 | | 20,607 | $ 20,641,197 |
| Term Loan - Second Lien, 9.747%, (SOFR + 5.60%), 2/1/30 | | 7,300 | 7,159,701 |
| Borrower/Description | Principal
Amount*
(000's omitted) | Value |
| Semiconductors & Semiconductor Equipment (continued) |
| Bright Bidco BV, Term Loan, 12.585%, (SOFR + 8.00%), 4.585% cash, 8.00% PIK, 10/31/27 | | 4,384 | $ 2,164,623 |
| MaxLinear, Inc., Term Loan, 7.082%, (SOFR + 2.25%), 6/23/28 | | 3,250 | 3,148,437 |
| MKS Instruments, Inc., Term Loan, 6.995%, (SOFR + 2.25%), 8/17/29 | | 24,809 | 24,877,329 |
| Synaptics, Inc., Term Loan, 7.215%, (SOFR + 2.25%), 12/2/28 | | 3,140 | 3,142,930 |
| | | | $ 61,134,217 |
| Software — 15.2% |
| Applied Systems, Inc., Term Loan, 7.604%, (SOFR + 3.00%), 2/24/31 | | 67,442 | $ 67,698,883 |
| Astra Acquisition Corp.: | | | |
| Term Loan, 9.854%, (SOFR + 5.25%), 10/25/28 | | 14,888 | 1,191,008 |
| Term Loan, 12.085%, (SOFR + 6.75%), 2/25/28 | | 10,191 | 8,356,364 |
| Term Loan, 17.998%, (SOFR + 13.33%), 10/25/29 | | 16,697 | 2,921,891 |
| Boxer Parent Co., Inc., Term Loan, 8.335%, (SOFR + 3.75%), 7/30/31 | | 18,697 | 18,661,698 |
| Cegid Group SAS: | | | |
| Term Loan, 6.586%, (3 mo. EURIBOR + 3.50%), 7/10/28 | EUR | 4,475 | 4,880,862 |
| Term Loan, 6.586%, (3 mo. EURIBOR + 3.50%), 7/10/28 | EUR | 5,150 | 5,612,029 |
| Central Parent, Inc., Term Loan, 7.854%, (SOFR + 3.25%), 7/6/29 | | 41,487 | 41,260,170 |
| Cloud Software Group, Inc., Term Loan, 8.604%, (SOFR + 4.00%), 3/30/29(10) | | 32,264 | 32,288,479 |
| Cloudera, Inc.: | | | |
| Term Loan, 8.535%, (SOFR + 3.75%), 10/8/28 | | 36,390 | 35,828,748 |
| Term Loan - Second Lien, 10.785%, (SOFR + 6.00%), 10/8/29 | | 4,450 | 4,216,375 |
| Constant Contact, Inc., Term Loan, 8.918%, (SOFR + 4.00%), 2/10/28 | | 12,868 | 12,431,541 |
| Cornerstone OnDemand, Inc., Term Loan, 8.55%, (SOFR + 3.75%), 10/16/28 | | 8,064 | 7,573,112 |
| Dragon Buyer, Inc., Term Loan, 7.908%, (SOFR + 3.25%), 9/30/31 | | 17,650 | 17,572,781 |
| Drake Software LLC, Term Loan, 8.935%, (SOFR + 4.25%), 6/26/31 | | 26,050 | 25,659,250 |
| E2open LLC, Term Loan, 8.30%, (SOFR + 3.50%), 2/4/28 | | 19,858 | 19,846,018 |
| ECI Macola Max Holding LLC, Term Loan, 7.842%, (SOFR + 3.25%), 5/9/30 | | 28,587 | 28,682,435 |
| Epicor Software Corp., Term Loan, 7.935%, (SOFR + 3.25%), 5/30/31 | | 79,890 | 80,266,029 |
| Fiserv Investment Solutions, Inc., Term Loan, 9.128%, (SOFR + 4.00%), 2/18/27 | | 11,911 | 11,478,839 |
31
See Notes to Financial Statements.
Senior Debt Portfolio
October 31, 2024
Portfolio of Investments — continued
| Borrower/Description | Principal
Amount*
(000's omitted) | Value |
| Software (continued) |
| Gen Digital, Inc., Term Loan, 6.435%, (SOFR + 1.75%), 9/12/29 | | 2,856 | $ 2,848,301 |
| GoTo Group, Inc.: | | | |
| Term Loan, 9.668%, (SOFR + 4.75%), 4/28/28 | | 15,096 | 12,831,921 |
| Term Loan - Second Lien, 9.668%, (SOFR + 4.75%), 4/28/28 | | 9,551 | 3,342,976 |
| IGT Holding IV AB: | | | |
| Term Loan, 6.245%, (3 mo. EURIBOR + 2.90%), 3/31/28 | EUR | 3,205 | 3,473,790 |
| Term Loan, 8.742%, (SOFR + 3.65%), 3/31/28 | | 1,640 | 1,649,238 |
| iSolved, Inc., Term Loan, 8.185%, (SOFR + 3.50%), 10/15/30 | | 8,263 | 8,299,066 |
| Ivanti Software, Inc., Term Loan, 9.121%, (SOFR + 4.25%), 12/1/27 | | 10,170 | 8,688,580 |
| Marcel LUX IV SARL: | | | |
| Term Loan, 7.631%, (1 mo. EURIBOR + 4.00%), 11/9/30 | EUR | 9,150 | 10,002,676 |
| Term Loan, 8.84%, (SOFR + 4.00%), 11/11/30 | | 32,028 | 32,268,103 |
| McAfee LLC, Term Loan, 8.10%, (SOFR + 3.25%), 3/1/29 | | 34,765 | 34,775,804 |
| Mosel Bidco SE: | | | |
| Term Loan, 7.845%, (3 mo. EURIBOR + 4.50%), 9/16/30 | EUR | 1,825 | 1,995,566 |
| Term Loan, 9.104%, (SOFR + 4.50%), 9/16/30 | | 3,275 | 3,291,375 |
| N-Able International Holdings II LLC, Term Loan, 8.069%, (SOFR + 2.75%), 7/19/28 | | 1,615 | 1,620,941 |
| Open Text Corp., Term Loan, 6.935%, (SOFR + 2.25%), 1/31/30 | | 18,065 | 18,148,260 |
| Orion Advisor Solutions, Inc., Term Loan, 9/24/30(8) | | 7,875 | 7,865,156 |
| Polaris Newco LLC: | | | |
| Term Loan, 7.345%, (3 mo. EURIBOR + 4.00%), 6/2/28 | EUR | 9,070 | 9,562,540 |
| Term Loan, 8.847%, (SOFR + 4.00%), 6/2/28 | | 7,691 | 7,644,645 |
| Project Alpha Intermediate Holding, Inc., Term Loan, 8.335%, (SOFR + 3.75%), 10/28/30 | | 15,423 | 15,496,728 |
| Proofpoint, Inc., Term Loan, 7.685%, (SOFR + 3.00%), 8/31/28 | | 12,225 | 12,248,707 |
| Quartz Acquireco LLC, Term Loan, 7.354%, (SOFR + 2.75%), 6/28/30 | | 7,123 | 7,136,660 |
| Quest Software U.S. Holdings, Inc., Term Loan, 8.985%, (SOFR + 4.25%), 2/1/29 | | 23,876 | 17,190,875 |
| RealPage, Inc., Term Loan, 7.80%, (SOFR + 3.00%), 4/24/28 | | 10,869 | 10,730,316 |
| Redstone Holdco 2 LP, Term Loan, 9.597%, (SOFR + 4.75%), 4/27/28 | | 12,915 | 9,686,163 |
| Sabre GLBL, Inc.: | | | |
| Term Loan, 8.30%, (SOFR + 3.50%), 12/17/27 | | 8,392 | 7,789,894 |
| Term Loan, 8.30%, (SOFR + 3.50%), 12/17/27 | | 5,341 | 4,957,799 |
| Borrower/Description | Principal
Amount*
(000's omitted) | Value |
| Software (continued) |
| Sabre GLBL, Inc.: (continued) | | | |
| Term Loan, 9.035%, (SOFR + 4.25%), 6/30/28 | | 7,345 | $ 6,894,814 |
| Term Loan, 9.785%, (SOFR + 5.00%), 6/30/28 | | 11,000 | 10,453,432 |
| Skillsoft Corp., Term Loan, 10.082%, (SOFR + 5.25%), 7/14/28 | | 14,755 | 12,029,589 |
| SolarWinds Holdings, Inc., Term Loan, 7.435%, (SOFR + 2.75%), 2/5/30 | | 28,230 | 28,306,760 |
| Sophia LP, Term Loan, 8.285%, (SOFR + 3.50%), 10/9/29 | | 32,482 | 32,656,263 |
| UKG, Inc., Term Loan, 7.617%, (SOFR + 3.00%), 2/10/31 | | 42,163 | 42,252,879 |
| Veritas U.S., Inc., Term Loan, 9.80%, (SOFR + 5.00%), 9/1/25 | | 39,040 | 37,390,874 |
| Vision Solutions, Inc.: | | | |
| Term Loan, 8.847%, (SOFR + 4.00%), 4/24/28 | | 38,856 | 38,406,939 |
| Term Loan - Second Lien, 12.097%, (SOFR + 7.25%), 4/23/29 | | 1,500 | 1,444,688 |
| | | | $ 889,808,830 |
| Specialty Retail — 3.2% |
| Apro LLC, Term Loan, 8.574%, (SOFR + 3.75%), 7/9/31 | | 7,725 | $ 7,766,035 |
| Boels Topholding BV, Term Loan, 6.557%, (3 mo. EURIBOR + 3.00%), 5/23/31 | EUR | 3,861 | 4,222,338 |
| Etraveli Holding AB, Term Loan, 7.845%, (3 mo. EURIBOR + 4.50%), 11/2/28 | EUR | 14,622 | 15,944,885 |
| Great Outdoors Group LLC, Term Loan, 8.55%, (SOFR + 3.75%), 3/6/28 | | 34,915 | 35,049,513 |
| Harbor Freight Tools USA, Inc., Term Loan, 7.192%, (SOFR + 2.50%), 6/11/31(10) | | 24,414 | 23,851,148 |
| Hoya Midco LLC, Term Loan, 7.585%, (SOFR + 3.00%), 2/3/29 | | 4,808 | 4,835,345 |
| Les Schwab Tire Centers, Term Loan, 7.685%, (SOFR + 3.00%), 4/23/31 | | 39,139 | 39,207,096 |
| LIDS Holdings, Inc., Term Loan, 10.381%, (SOFR + 5.50%), 12/14/26 | | 9,114 | 9,057,393 |
| Mattress Firm, Inc., Term Loan, 8.924%, (SOFR + 4.25%), 9/25/28 | | 17,264 | 17,287,543 |
| Mavis Tire Express Services Corp., Term Loan, 8.185%, (SOFR + 3.50%), 5/4/28 | | 2,168 | 2,176,418 |
| PetSmart, Inc., Term Loan, 8.535%, (SOFR + 3.75%), 2/11/28 | | 6,755 | 6,721,413 |
| Speedster Bidco GmbH: | | | |
| Term Loan, 10/17/31(8) | EUR | 11,075 | 12,051,853 |
| Term Loan, 10/17/31(8) | | 10,650 | 10,646,677 |
| | | | $ 188,817,657 |
32
See Notes to Financial Statements.
Senior Debt Portfolio
October 31, 2024
Portfolio of Investments — continued
| Borrower/Description | Principal
Amount*
(000's omitted) | Value |
| Technology Hardware, Storage & Peripherals — 0.2% |
| Poseidon Bidco SASU, Term Loan, 8.345%, (3 mo. EURIBOR + 5.00%), 3/13/30 | EUR | 11,050 | $ 8,964,641 |
| | | | $ 8,964,641 |
| Trading Companies & Distributors — 3.6% |
| Avolon TLB Borrower 1 (U.S.) LLC, Term Loan, 6.509%, (SOFR + 1.75%), 6/24/30 | | 40,853 | $ 40,836,230 |
| Beacon Roofing Supply, Inc., Term Loan, 6.685%, (SOFR + 2.00%), 5/19/28 | | 7,196 | 7,222,609 |
| Core & Main LP: | | | |
| Term Loan, 6.718%, (SOFR + 2.00%), 7/27/28 | | 9,449 | 9,443,184 |
| Term Loan, 6.968%, (SOFR + 2.25%), 2/9/31 | | 9,938 | 9,974,954 |
| DXP Enterprises, Inc., Term Loan, 8.435%, (SOFR + 3.75%), 10/11/30 | | 9,059 | 9,107,570 |
| Foundation Building Materials Holding Co. LLC, Term Loan, 8.585%, (SOFR + 4.00%), 1/29/31 | | 16,592 | 16,373,860 |
| Park River Holdings, Inc., Term Loan, 8.105%, (SOFR + 3.25%), 12/28/27 | | 3,688 | 3,620,794 |
| Patagonia Bidco Ltd., Term Loan, 10.45%, (SONIA + 5.25%), 11/1/28 | GBP | 20,050 | 23,416,796 |
| PEARLS (Netherlands) Bidco BV, Term Loan, 7.056%, (3 mo. EURIBOR + 4.00%), 2/26/29 | EUR | 6,000 | 6,552,194 |
| Spin Holdco, Inc., Term Loan, 9.256%, (SOFR + 4.00%), 3/4/28 | | 44,638 | 38,946,633 |
| White Cap Buyer LLC, Term Loan, 7.935%, (SOFR + 3.25%), 10/19/29 | | 30,041 | 30,015,054 |
| Windsor Holdings III LLC, Term Loan, 8.259%, (SOFR + 3.50%), 8/1/30 | | 15,374 | 15,451,138 |
| | | | $ 210,961,016 |
| Transportation Infrastructure — 0.3% |
| Brown Group Holding LLC, Term Loan, 7.435%, (SOFR + 2.75%), 7/1/31 | | 17,364 | $ 17,384,176 |
| | | | $ 17,384,176 |
| Wireless Telecommunication Services — 0.8% |
| CCI Buyer, Inc., Term Loan, 8.604%, (SOFR + 4.00%), 12/17/27 | | 25,747 | $ 25,801,529 |
| Digicel International Finance Ltd., Term Loan, 11.335%, (SOFR + 6.75%), 5/25/27 | | 20,226 | 20,219,991 |
| | | | $ 46,021,520 |
Total Senior Floating-Rate Loans
(identified cost $6,403,844,427) | | | $ 6,263,361,728 |
| Security | Shares | Value |
| Health Care — 0.0% |
| Cano Health, Inc., Exp. 6/28/29(3)(4) | | 10,441 | $ 0 |
Total Warrants
(identified cost $0) | | | $ 0 |
| Short-Term Investments — 1.5% |
| Security | Shares | Value |
| Morgan Stanley Institutional Liquidity Funds - Government Portfolio, Institutional Class, 4.78%(12) | | 90,192,805 | $ 90,192,805 |
Total Short-Term Investments
(identified cost $90,192,804) | | | $ 90,192,805 |
Total Investments — 123.3%
(identified cost $7,411,647,309) | | | $ 7,222,694,527 |
| Less Unfunded Loan Commitments — (0.1)% | | | $ (7,276,274) |
Net Investments — 123.2%
(identified cost $7,404,371,035) | | | $ 7,215,418,253 |
| Other Assets, Less Liabilities — (23.2)% | | | $(1,359,722,305) |
| Net Assets — 100.0% | | | $ 5,855,695,948 |
| The percentage shown for each investment category in the Portfolio of Investments is based on net assets. |
| * | In U.S. dollars unless otherwise indicated. |
| (1) | Security exempt from registration under Rule 144A of the Securities Act of 1933, as amended. These securities may be sold in certain transactions in reliance on an exemption from registration (normally to qualified institutional buyers). At October 31, 2024, the aggregate value of these securities is $764,025,995 or 13.0% of the Portfolio's net assets. |
| (2) | Variable rate security. The stated interest rate represents the rate in effect at October 31, 2024. |
| (3) | For fair value measurement disclosure purposes, security is categorized as Level 3 (see Note 8). |
| (4) | Non-income producing security. |
| (5) | Security was acquired in connection with a restructuring of a Senior Loan and may be subject to restrictions on resale. |
| (6) | Amount is less than 0.05%. |
33
See Notes to Financial Statements.
Senior Debt Portfolio
October 31, 2024
Portfolio of Investments — continued
| (7) | Senior floating-rate loans (Senior Loans) often require prepayments from excess cash flows or permit the borrowers to repay at their election. The degree to which borrowers repay, whether as a contractual requirement or at their election, cannot be predicted with accuracy. As a result, the actual remaining maturity may be substantially less than the stated maturities shown. However, Senior Loans will typically have an expected average life of approximately two to four years. Senior Loans typically have rates of interest which are redetermined periodically by reference to a base lending rate, plus a spread. These base lending rates are primarily the Secured Overnight Financing Rate (“SOFR”) and secondarily, the prime rate offered by one or more major United States banks (the “Prime Rate”). Base lending rates may be subject to a floor, or minimum rate. Rates for SOFR are generally 1 or 3-month tenors and may also be subject to a credit spread adjustment. Senior Loans are generally subject to contractual restrictions that must be satisfied before they can be bought or sold. |
| (8) | This Senior Loan will settle after October 31, 2024, at which time the interest rate will be determined. |
| (9) | Issuer is in default with respect to interest and/or principal payments or has declared bankruptcy and is non-income producing. For a variable rate security, interest rate has been adjusted to reflect non-accrual status. |
| (10) | The stated interest rate represents the weighted average interest rate at October 31, 2024 of contracts within the senior loan facility. Interest rates on contracts are primarily redetermined either monthly or quarterly by reference to the indicated base lending rate and spread and the reset period. |
| (11) | Unfunded or partially unfunded loan commitments. The stated interest rate reflects the weighted average of the reference rate and spread for the funded portion, if any, and the commitment fees on the portion of the loan that is unfunded. At October 31, 2024, the total value of unfunded loan commitments is $7,278,143. See Note 1F for description. |
| (12) | May be deemed to be an affiliated investment company (see Note 7). The rate shown is the annualized seven-day yield as of October 31, 2024. |
| Forward Foreign Currency Exchange Contracts (OTC) |
| Currency Purchased | Currency Sold | Counterparty | Settlement
Date | Unrealized
Appreciation | Unrealized
(Depreciation) |
| USD | 332,371,783 | EUR | 297,407,318 | Standard Chartered Bank | 11/4/24 | $ 8,867,012 | $ — |
| USD | 38,962,425 | EUR | 34,885,000 | Australia and New Zealand Banking Group Limited | 11/29/24 | 977,528 | — |
| USD | 38,958,696 | EUR | 34,885,000 | Bank of America, N.A. | 11/29/24 | 973,799 | — |
| USD | 38,943,179 | EUR | 34,885,000 | Bank of America, N.A. | 11/29/24 | 958,282 | — |
| USD | 38,967,790 | EUR | 34,885,000 | State Street Bank and Trust Company | 11/29/24 | 982,894 | — |
| USD | 38,949,920 | EUR | 34,886,794 | State Street Bank and Trust Company | 11/29/24 | 963,069 | — |
| USD | 31,440,645 | GBP | 23,806,209 | Goldman Sachs International | 11/29/24 | 744,836 | — |
| USD | 323,255,993 | EUR | 297,407,318 | Standard Chartered Bank | 12/3/24 | — | (630,800) |
| EUR | 40,000,000 | USD | 43,582,840 | State Street Bank and Trust Company | 12/31/24 | 34,718 | — |
| USD | 41,698,212 | EUR | 37,312,000 | Goldman Sachs International | 12/31/24 | 1,011,754 | — |
| USD | 41,699,660 | EUR | 37,312,000 | State Street Bank and Trust Company | 12/31/24 | 1,013,202 | — |
| USD | 41,691,444 | EUR | 37,312,000 | State Street Bank and Trust Company | 12/31/24 | 1,004,986 | — |
| USD | 40,841,455 | EUR | 36,543,474 | State Street Bank and Trust Company | 12/31/24 | 993,027 | — |
| | | | | | | $18,525,107 | $(630,800) |
| Abbreviations: |
| EURIBOR | – Euro Interbank Offered Rate |
| OTC | – Over-the-counter |
| PCL | – Public Company Limited |
| PIK | – Payment In Kind |
| SOFR | – Secured Overnight Financing Rate |
| SONIA | – Sterling Overnight Interbank Average |
| Currency Abbreviations: |
| EUR | – Euro |
| GBP | – British Pound Sterling |
| USD | – United States Dollar |
34
See Notes to Financial Statements.
Senior Debt Portfolio
October 31, 2024
Statement of Assets and Liabilities
| | October 31, 2024 |
| Assets | |
| Unaffiliated investments, at value (identified cost $7,314,178,230) | $7,125,225,448 |
| Affiliated investments, at value (identified cost $90,192,805) | 90,192,805 |
| Cash | 93,066,844 |
| Deposits for derivatives collateral — forward foreign currency exchange contracts | 10,300,000 |
| Foreign currency, at value (identified cost $59,412,095) | 59,850,251 |
| Interest receivable | 40,314,057 |
| Dividends receivable from affiliated investments | 566,536 |
| Receivable for investments sold | 188,441,502 |
| Receivable for open forward foreign currency exchange contracts | 18,525,107 |
| Trustees' deferred compensation plan | 306,766 |
| Prepaid upfront and agency fees on notes payable | 1,856,984 |
| Total assets | $7,628,646,300 |
| Liabilities | |
| Notes payable | $1,400,000,000 |
| Cash collateral due to broker | 10,300,000 |
| Payable for investments purchased | 352,674,234 |
| Payable for open forward foreign currency exchange contracts | 630,800 |
| Payable to affiliates: | |
| Investment adviser fee | 2,581,140 |
| Trustees' fees | 9,042 |
| Trustees' deferred compensation plan | 306,766 |
| Accrued expenses | 6,448,370 |
| Total liabilities | $1,772,950,352 |
| Net Assets applicable to investors' interest in Portfolio | $5,855,695,948 |
35
See Notes to Financial Statements.
Senior Debt Portfolio
October 31, 2024
| | Year Ended |
| | October 31, 2024 |
| Investment Income | |
| Dividend income | $1,428,425 |
| Dividend income from affiliated investments | 5,282,536 |
| Interest income | 671,307,794 |
| Other income | 7,635,015 |
| Total investment income | $685,653,770 |
| Expenses | |
| Investment adviser fee | $31,100,086 |
| Trustees’ fees and expenses | 108,500 |
| Custodian fee | 1,231,246 |
| Legal and accounting services | 525,634 |
| Interest expense and fees | 98,956,803 |
| Miscellaneous | 720,587 |
| Total expenses | $132,642,856 |
| Deduct: | |
| Waiver and/or reimbursement of expenses by affiliates | $151,339 |
| Total expense reductions | $151,339 |
| Net expenses | $132,491,517 |
| Net investment income | $553,162,253 |
| Realized and Unrealized Gain (Loss) | |
| Net realized gain (loss): | |
| Investment transactions | $(201,747,266) |
| Foreign currency transactions | (8,508,558) |
| Forward foreign currency exchange contracts | (13,409,639) |
| Net realized loss | $(223,665,463) |
| Change in unrealized appreciation (depreciation): | |
| Investments | $312,685,471 |
| Foreign currency | 701,100 |
| Forward foreign currency exchange contracts | 9,945,291 |
| Net change in unrealized appreciation (depreciation) | $323,331,862 |
| Net realized and unrealized gain | $99,666,399 |
| Net increase in net assets from operations | $652,828,652 |
36
See Notes to Financial Statements.
Senior Debt Portfolio
October 31, 2024
Statements of Changes in Net Assets
| | Year Ended October 31, |
| | 2024 | 2023 |
| Increase (Decrease) in Net Assets | | |
| From operations: | | |
| Net investment income | $553,162,253 | $570,952,434 |
| Net realized loss | (223,665,463) | (321,860,745) |
| Net change in unrealized appreciation (depreciation) | 323,331,862 | 496,644,025 |
| Net increase in net assets from operations | $652,828,652 | $745,735,714 |
| Capital transactions: | | |
| Contributions | $398,168,678 | $365,123,130 |
| Withdrawals | (1,070,766,769) | (2,604,898,648) |
| Net decrease in net assets from capital transactions | $(672,598,091) | $(2,239,775,518) |
| Net decrease in net assets | $(19,769,439) | $(1,494,039,804) |
| Net Assets | | |
| At beginning of year | $5,875,465,387 | $7,369,505,191 |
| At end of year | $5,855,695,948 | $5,875,465,387 |
37
See Notes to Financial Statements.
Senior Debt Portfolio
October 31, 2024
| | Year Ended |
| | October 31, 2024 |
| Cash Flows From Operating Activities | |
| Net increase in net assets from operations | $652,828,652 |
| Adjustments to reconcile net increase in net assets from operations to net cash provided by operating activities: | |
| Investments purchased | (2,380,628,125) |
| Investments sold and principal repayments | 2,770,437,749 |
| Increase in short-term investments, net | (6,620,227) |
| Net amortization/accretion of premium (discount) | (23,869,020) |
| Amortization of prepaid upfront and agency fees on notes payable | 3,143,273 |
| Decrease in interest receivable | 7,807,234 |
| Increase in dividends receivable from affiliated investments | (168,879) |
| Increase in Trustees’ deferred compensation plan | (33,619) |
| Decrease in prepaid expenses | 91,621 |
| Increase in cash collateral due to brokers | 10,300,000 |
| Decrease in payable to affiliates for investment adviser fee | (53,060) |
| Increase in payable to affiliates for Trustees' deferred compensation plan | 33,619 |
| Decrease in accrued expenses | (545,267) |
| Decrease in unfunded loan commitments | (2,933,557) |
| Net change in unrealized (appreciation) depreciation from investments | (312,685,471) |
| Net change in unrealized (appreciation) depreciation from forward foreign currency exchange contracts | (9,945,291) |
| Net realized loss from investments | 201,747,266 |
| Net cash provided by operating activities | $908,906,898 |
| Cash Flows From Financing Activities | |
| Proceeds from capital contributions | $398,168,678 |
| Payments for capital withdrawals | (1,070,766,769) |
| Proceeds from notes payable | 575,000,000 |
| Repayments of notes payable | (700,000,000) |
| Payment of prepaid upfront and agency fees on notes payable | (3,692,877) |
| Net cash used in financing activities | $(801,290,968) |
| Net increase in cash and restricted cash* | $107,615,930 |
| Cash and restricted cash at beginning of year (including foreign currency) | $55,601,165 |
| Cash and restricted cash at end of year (including foreign currency) | $163,217,095 |
| Supplemental disclosure of cash flow information: | |
| Cash paid for interest and fees on borrowings | $100,428,130 |
| * | Includes net change in unrealized (appreciation) depreciation on foreign currency of $(414,208). |
The following table provides a reconciliation of cash and restricted cash reported within the Statement of Assets and Liabilities that sum to the total of such amounts shown on the Statement of Cash Flows.
| | |
| | October 31, 2024 |
| Cash | $93,066,844 |
| Deposits for derivatives collateral — forward foreign currency exchange contracts | 10,300,000 |
| Foreign currency | 59,850,251 |
| Total cash and restricted cash as shown on the Statement of Cash Flows | $163,217,095 |
38
See Notes to Financial Statements.
Senior Debt Portfolio
October 31, 2024
| | Year Ended October 31, |
| | 2024 | 2023 | 2022 | 2021 | 2020 |
| Ratios/Supplemental Data | | | | | |
| Ratios (as a percentage of average daily net assets):(1) | | | | | |
| Expenses excluding interest and fees | 0.57% | 0.56% | 0.52% | 0.53% | 0.56% |
| Interest and fee expense | 1.66% | 1.81% | 0.47% | 0.32% | 0.60% |
| Total expenses | 2.23% | 2.37% | 0.99% | 0.85% | 1.16% |
| Net expenses | 2.23%(2) | 2.37%(2) | 0.99%(2) | 0.85% | 1.16% |
| Net investment income | 9.30% | 9.01% | 5.16% | 4.19% | 4.86% |
| Portfolio Turnover | 35% | 18% | 27% | 28% | 30% |
| Total Return | 11.64% | 12.42% | (4.22)% | 9.75% | 0.39% |
| Net assets, end of year (000’s omitted) | $5,855,696 | $5,875,465 | $7,369,505 | $8,423,553 | $5,449,434 |
| (1) | Total expenses do not reflect amounts reimbursed and/or waived by the adviser and certain of its affiliates, if applicable. Net expenses are net of all reductions and represent the net expenses paid by the Portfolio. |
| (2) | Includes a reduction by the investment adviser of a portion of the Portfolio’s adviser fee due to the Portfolio's investment in the Liquidity Fund (equal to less than 0.005% of average daily net assets for the years ended October 31, 2024, 2023 and 2022). |
39
See Notes to Financial Statements.
Senior Debt Portfolio
October 31, 2024
Notes to Financial Statements
1 Significant Accounting Policies
Senior Debt Portfolio (the Portfolio) is a Massachusetts business trust registered under the Investment Company Act of 1940, as amended (the 1940 Act), as an open-end management investment company. The Portfolio’s investment objective is to provide a high level of current income. The Declaration of Trust permits the Trustees to issue interests in the Portfolio. At October 31, 2024, Eaton Vance Floating-Rate Advantage Fund, Eaton Vance Strategic Income Fund (formerly, Eaton Vance Short Duration Strategic Income Fund) and Eaton Vance Short Duration Inflation-Protected Income Fund held an interest of 96.0%, 2.5% and 1.5%, respectively, in the Portfolio.
The following is a summary of significant accounting policies of the Portfolio. The policies are in conformity with accounting principles generally accepted in the United States of America (U.S. GAAP). The Portfolio is an investment company and follows accounting and reporting guidance in the Financial Accounting Standards Board (FASB) Accounting Standards Codification Topic 946.
A Investment Valuation—The following methodologies are used to determine the market value or fair value of investments.
Senior Floating-Rate Loans. Interests in senior floating-rate loans (Senior Loans) are valued generally at the average mean of bid and ask quotations obtained from a third party pricing service. Senior Loans, for which a valuation is not available or deemed unreliable, are fair valued by the investment adviser utilizing one or more of the valuation techniques described below to assess the likelihood that the borrower will make a full repayment of the loan underlying such Senior Loan. If the investment adviser believes that there is a reasonable likelihood of full repayment, the investment adviser will determine fair value using a matrix pricing approach that considers the yield on the Senior Loan relative to yields on other Senior Loans issued by companies of comparable credit quality. If the investment adviser believes there is not a reasonable likelihood of full repayment, the investment adviser will determine fair value using analyses that include, but are not limited to: (i) a comparison of the value of the borrower’s outstanding equity and debt to that of comparable public companies; (ii) a discounted cash flow analysis; or (iii) when the investment adviser believes it is likely that a borrower will be liquidated or sold, an analysis of the terms of such liquidation or sale. In certain cases, the investment adviser will use a combination of analytical methods to determine fair value, such as when only a portion of a borrower’s assets are likely to be sold. In conducting its assessment and analyses for purposes of determining fair value of a Senior Loan, the investment adviser will use its discretion and judgment in considering and appraising relevant factors. Junior Loans (i.e., subordinated loans and second lien loans) are valued in the same manner as Senior Loans.
Debt Obligations. Debt obligations are generally valued on the basis of valuations provided by third party pricing services, as derived from such services’ pricing models. Inputs to the models may include, but are not limited to, reported trades, executable bid and ask prices, broker/dealer quotations, prices or yields of securities with similar characteristics, interest rates, anticipated prepayments, benchmark curves or information pertaining to the issuer, as well as industry and economic events. The pricing services may use a matrix approach, which considers information regarding securities with similar characteristics to determine the valuation for a security. Short-term debt obligations purchased with a remaining maturity of sixty days or less for which a valuation from a third party pricing service is not readily available may be valued at amortized cost, which approximates fair value.
Equity Securities. Equity securities listed on a U.S. securities exchange generally are valued at the last sale or closing price on the day of valuation or, if no sales took place on such date, at the mean between the closing bid and ask prices on the exchange where such securities are principally traded. Equity securities listed on the NASDAQ National Market System are valued at the NASDAQ official closing price. Unlisted or listed securities for which closing sales prices or closing quotations are not available are valued at the mean between the latest available bid and ask prices or, in the case of preferred equity securities that are not listed or traded in the over-the-counter market, by a third party pricing service that uses various techniques that consider factors including, but not limited to, prices or yields of securities with similar characteristics, benchmark yields, broker/dealer quotes, quotes of underlying common stock, issuer spreads, as well as industry and economic events.
Derivatives. Forward foreign currency exchange contracts are generally valued at the mean of the average bid and average ask prices that are reported by currency dealers to a third party pricing service at the valuation time. Such third party pricing service valuations are supplied for specific settlement periods and the Portfolio’s forward foreign currency exchange contracts are valued at an interpolated rate between the closest preceding and subsequent settlement period reported by the third party pricing service.
Foreign Securities and Currencies. Foreign securities and currencies are valued in U.S. dollars, based on foreign currency exchange rate quotations supplied by a third party pricing service. The pricing service uses a proprietary model to determine the exchange rate. Inputs to the model include reported trades and implied bid/ask spreads.
Other. Investments in management investment companies (including money market funds) that do not trade on an exchange are valued at the net asset value as of the close of each business day.
Fair Valuation. In connection with Rule 2a-5 of the 1940 Act, the Trustees have designated the Portfolio’s investment adviser as its valuation designee. Investments for which valuations or market quotations are not readily available or are deemed unreliable are valued by the investment adviser, as valuation designee, at fair value using methods that most fairly reflect the security’s “fair value”, which is the amount that the Portfolio might reasonably expect to receive for the security upon its current sale in the ordinary course. Each such determination is based on a consideration of relevant factors, which are likely to vary from one pricing context to another. These factors may include, but are not limited to, the type of security, the existence of any contractual restrictions on the security’s disposition, the price and extent of public trading in similar securities of the issuer or of comparable companies or entities,
Senior Debt Portfolio
October 31, 2024
Notes to Financial Statements — continued
quotations or relevant information obtained from broker/dealers or other market participants, information obtained from the issuer, analysts, and/or the appropriate stock exchange (for exchange-traded securities), an analysis of the company’s or entity’s financial statements, and an evaluation of the forces that influence the issuer and the market(s) in which the security is purchased and sold.
B Investment Transactions—Investment transactions for financial statement purposes are accounted for on a trade date basis. Realized gains and losses on investments sold are determined on the basis of identified cost.
C Income—Interest income is recorded on the basis of interest accrued, adjusted for amortization of premium or accretion of discount. Fees in connection with investments in senior floating-rate loans may include amendment fees, consent fees and prepayment fees, which are recorded to income as earned and included in Other income on the Statement of Operations. Dividend income is recorded on the ex-dividend date for dividends received in cash and/or securities. Withholding taxes on foreign dividends have been provided for in accordance with the Portfolio’s understanding of the applicable countries’ tax rules and rates. Distributions from investment companies are recorded as dividend income, capital gains or return of capital based on the nature of the distribution.
D Federal Taxes—The Portfolio has elected to be treated as a partnership for federal tax purposes. No provision is made by the Portfolio for federal or state taxes on any taxable income of the Portfolio because each investor in the Portfolio is ultimately responsible for the payment of any taxes on its share of taxable income. Since at least one of the Portfolio's investors is a regulated investment company that invests all or substantially all of its assets in the Portfolio, the Portfolio normally must satisfy the applicable source of income and diversification requirements (under the Internal Revenue Code) in order for its investors to satisfy them. The Portfolio will allocate, at least annually among its investors, each investor's distributive share of the Portfolio's net investment income, net realized capital gains and losses and any other items of income, gain, loss, deduction or credit.
As of October 31, 2024, the Portfolio had no uncertain tax positions that would require financial statement recognition, de-recognition, or disclosure. The Portfolio files a U.S. federal income tax return annually after its fiscal year-end, which is subject to examination by the Internal Revenue Service for a period of three years from the date of filing.
E Foreign Currency Translation—Investment valuations, other assets, and liabilities initially expressed in foreign currencies are translated each business day into U.S. dollars based upon current exchange rates. Purchases and sales of foreign investment securities and income and expenses denominated in foreign currencies are translated into U.S. dollars based upon currency exchange rates in effect on the respective dates of such transactions. Recognized gains or losses on investment transactions attributable to changes in foreign currency exchange rates are recorded for financial statement purposes as net realized gains and losses on investments. That portion of unrealized gains and losses on investments that results from fluctuations in foreign currency exchange rates is not separately disclosed.
F Unfunded Loan Commitments—The Portfolio may enter into certain loan agreements all or a portion of which may be unfunded. The Portfolio is obligated to fund these commitments at the borrower's discretion. These commitments are disclosed in the accompanying Portfolio of Investments. At October 31, 2024, the Portfolio had sufficient cash and/or securities to cover these commitments.
G Use of Estimates—The preparation of the financial statements in conformity with U.S. GAAP requires management to make estimates and assumptions that affect the reported amounts of assets and liabilities at the date of the financial statements and the reported amounts of income and expense during the reporting period. Actual results could differ from those estimates.
H Indemnifications—Under the Portfolio’s organizational documents, its officers and Trustees may be indemnified against certain liabilities and expenses arising out of the performance of their duties to the Portfolio. Under Massachusetts law, if certain conditions prevail, interestholders in the Portfolio could be deemed to have personal liability for the obligations of the Portfolio. However, the Portfolio’s Declaration of Trust contains an express disclaimer of liability on the part of Portfolio interestholders. Additionally, in the normal course of business, the Portfolio enters into agreements with service providers that may contain indemnification clauses. The Portfolio’s maximum exposure under these arrangements is unknown as this would involve future claims that may be made against the Portfolio that have not yet occurred.
I Forward Foreign Currency Exchange Contracts—The Portfolio may enter into forward foreign currency exchange contracts for the purchase or sale of a specific foreign currency at a fixed price on a future date. The forward foreign currency exchange contracts are adjusted by the daily exchange rate of the underlying currency and any gains or losses are recorded as unrealized until such time as the contracts have been closed. Risks may arise upon entering these contracts from the potential inability of counterparties to meet the terms of their contracts and from movements in the value of a foreign currency relative to the U.S. dollar.
J When-Issued Securities and Delayed Delivery Transactions—The Portfolio may purchase securities on a delayed delivery or when-issued basis. Payment and delivery may take place after the customary settlement period for that security. At the time the transaction is negotiated, the price of the security that will be delivered is fixed. The Portfolio maintains cash and/or security positions for these commitments such that sufficient liquid assets will be available to make payments upon settlement. Securities purchased on a delayed delivery or when-issued basis are marked-to-market daily and begin earning interest on settlement date. Such security purchases are subject to the risk that when delivered they will be worth less than the agreed upon payment price. Losses may also arise if the counterparty does not perform under the contract.
Senior Debt Portfolio
October 31, 2024
Notes to Financial Statements — continued
2 Investment Adviser Fee and Other Transactions with Affiliates
The investment adviser fee is earned by Boston Management and Research (BMR), an indirect, wholly-owned subsidiary of Morgan Stanley, as compensation for investment advisory services rendered to the Portfolio. The fee is computed at an annual rate as a percentage of average daily gross assets as follows and is payable monthly:
| Average Daily Gross Assets | Annual Fee Rate |
| Up to and including $1 billion | 0.5000% |
| In excess of $1 billion up to and including $2 billion | 0.4500% |
| In excess of $2 billion up to and including $7 billion | 0.4000% |
| In excess of $7 billion up to and including $10 billion | 0.3875% |
| In excess of $10 billion up to and including $15 billion | 0.3750% |
| In excess of $15 billion | 0.3625% |
Gross assets are calculated by deducting all liabilities of the Portfolio except the principal amount of any indebtedness for money borrowed. For the year ended October 31, 2024, the Portfolio’s investment adviser fee amounted to $31,100,086 or 0.52% of the Portfolio's average daily net assets. The Portfolio may invest in a money market fund, the Institutional Class of the Morgan Stanley Institutional Liquidity Funds - Government Portfolio (the “Liquidity Fund”), an open-end management investment company managed by Morgan Stanley Investment Management Inc., a wholly-owned subsidiary of Morgan Stanley. The investment adviser fee paid by the Portfolio is reduced by an amount equal to its pro rata share of the advisory and administration fees paid by the Portfolio due to its investment in the Liquidity Fund. For the year ended October 31, 2024, the investment adviser fee paid was reduced by $151,339 relating to the Portfolio's investment in the Liquidity Fund.
During the year ended October 31, 2024, EVM reimbursed the Portfolio $7,603 for a net realized loss due to a trading error. The amount of the
reimbursement had an impact on total return of less than 0.01%.
Trustees and officers of the Portfolio who are members of BMR’s organization receive remuneration for their services to the Portfolio out of the investment adviser fee. Trustees of the Portfolio who are not affiliated with the investment adviser may elect to defer receipt of all or a percentage of their annual fees in accordance with the terms of the Trustees Deferred Compensation Plan. Certain officers and Trustees of the Portfolio are officers of the above organization.
3 Purchases and Sales of Investments
Purchases and sales of investments, other than short-term obligations and including maturities, paydowns and principal repayments on Senior Loans, aggregated $2,549,677,151 and $2,891,447,073, respectively, for the year ended October 31, 2024.
4 Federal Income Tax Basis of Investments
The cost and unrealized appreciation (depreciation) of investments, including open derivative contracts, of the Portfolio at October 31, 2024, as determined on a federal income tax basis, were as follows:
| Aggregate cost | $7,395,976,962 |
| Gross unrealized appreciation | $60,269,244 |
| Gross unrealized depreciation | (240,827,953) |
| Net unrealized depreciation | $(180,558,709) |
Senior Debt Portfolio
October 31, 2024
Notes to Financial Statements — continued
5 Financial Instruments
The Portfolio may trade in financial instruments with off-balance sheet risk in the normal course of its investing activities. These financial instruments may include forward foreign currency exchange contracts and may involve, to a varying degree, elements of risk in excess of the amounts recognized for financial statement purposes. The notional or contractual amounts of these instruments represent the investment the Portfolio has in particular classes of financial instruments and do not necessarily represent the amounts potentially subject to risk. The measurement of the risks associated with these instruments is meaningful only when all related and offsetting transactions are considered. A summary of obligations under these financial instruments at October 31, 2024 is included in the Portfolio of Investments. At October 31, 2024, the Portfolio had sufficient cash and/or securities to cover commitments under these contracts.
The Portfolio is subject to foreign exchange risk in the normal course of pursuing its investment objective. Because the Portfolio holds foreign currency denominated investments, the value of these investments and related receivables and payables may change due to future changes in foreign currency exchange rates. To hedge against this risk, the Portfolio enters into forward foreign currency exchange contracts.
The Portfolio enters into forward foreign currency exchange contracts that may contain provisions whereby the counterparty may terminate the contract under certain conditions, including but not limited to a decline in the Portfolio's net assets below a certain level over a certain period of time, which would trigger a payment by the Portfolio for those derivatives in a liability position. At October 31, 2024, the fair value of derivatives with credit related contingent features in a net liability position was $630,800. At October 31, 2024, there were no assets pledged by the Portfolio for such liability.
The over-the-counter (OTC) derivatives in which the Portfolio invests are subject to the risk that the counterparty to the contract fails to perform its obligations under the contract. To mitigate this risk, the Portfolio has entered into an International Swaps and Derivatives Association, Inc. Master Agreement (“ISDA Master Agreement”) or similar agreement with substantially all its derivative counterparties. An ISDA Master Agreement is a bilateral agreement between the Portfolio and a counterparty that governs certain OTC derivatives and typically contains, among other things, set-off provisions in the event of a default and/or termination event as defined under the relevant ISDA Master Agreement. Under an ISDA Master Agreement, the Portfolio may, under certain circumstances, offset with the counterparty certain derivative financial instruments’ payables and/or receivables with collateral held and/or posted and create one single net payment. The provisions of the ISDA Master Agreement typically permit a single net payment in the event of default including the bankruptcy or insolvency of the counterparty. However, bankruptcy or insolvency laws of a particular jurisdiction may impose restrictions on or prohibitions against the right of offset in bankruptcy or insolvency. Certain ISDA Master Agreements allow counterparties to OTC derivatives to terminate derivative contracts prior to maturity in the event the Portfolio’s net assets decline by a stated percentage or the Portfolio fails to meet the terms of its ISDA Master Agreements, which would cause the counterparty to accelerate payment by the Portfolio of any net liability owed to it.
The collateral requirements for derivatives traded under an ISDA Master Agreement are governed by a Credit Support Annex to the ISDA Master Agreement. Collateral requirements are determined at the close of business each day and are typically based on changes in market values for each transaction under an ISDA Master Agreement and netted into one amount for such agreement. Generally, the amount of collateral due from or to a counterparty is subject to a minimum transfer threshold amount before a transfer is required, which may vary by counterparty. Collateral pledged for the benefit of the Portfolio and/or counterparty is held in segregated accounts by the Portfolio’s custodian and cannot be sold, re-pledged, assigned or otherwise used while pledged. The portion of such collateral representing cash, if any, is reflected as deposits for derivatives collateral and, in the case of cash pledged by a counterparty for the benefit of the Portfolio, a corresponding liability on the Statement of Assets and Liabilities. Securities pledged by the Portfolio as collateral, if any, are identified as such in the Portfolio of Investments. The carrying amount of the liability for cash collateral due to broker at October 31, 2024 approximated its fair value. If measured at fair value, such liability would have been considered as Level 2 in the fair value hierarchy (see Note 8) at October 31, 2024.
The fair value of open derivative instruments (not considered to be hedging instruments for accounting disclosure purposes) and whose primary underlying risk exposure is foreign exchange risk at October 31, 2024 was as follows:
| | Fair Value |
| Derivative | Asset Derivative(1) | Liability Derivative(2) |
| Forward foreign currency exchange contracts | $18,525,107 | $(630,800) |
| (1) | Statement of Assets and Liabilities location: Receivable for open forward foreign currency exchange contracts. |
| (2) | Statement of Assets and Liabilities location: Payable for open forward foreign currency exchange contracts. |
Senior Debt Portfolio
October 31, 2024
Notes to Financial Statements — continued
The Portfolio's derivative assets and liabilities at fair value by type, which are reported gross in the Statement of Assets and Liabilities, are presented in the table above.The following tables present the Portfolio’s derivative assets and liabilities by counterparty, net of amounts available for offset under a master netting agreement and net of the related collateral received by the Portfolio for such assets and pledged by the Portfolio for such liabilities as of October 31, 2024.
| Counterparty | Derivative
Assets Subject to
Master Netting
Agreement | Derivatives
Available
for Offset | Non-cash
Collateral
Received(a) | Cash
Collateral
Received(a) | Net Amount
of Derivative
Assets(b) |
| Australia and New Zealand Banking Group Limited | $977,528 | $ — | $(977,528) | $ — | $ — |
| Bank of America, N.A. | 1,932,081 | — | — | (1,932,081) | — |
| Goldman Sachs International | 1,756,590 | — | — | (1,640,000) | 116,590 |
| Standard Chartered Bank | 8,867,012 | (630,800) | (3,346,692) | (4,889,520) | — |
| State Street Bank and Trust Company | 4,991,896 | — | (4,752,818) | (239,078) | — |
| | $18,525,107 | $(630,800) | $(9,077,038) | $(8,700,679) | $116,590 |
| Counterparty | Derivative
Liabilities Subject to
Master Netting
Agreement | Derivatives
Available
for Offset | Non-cash
Collateral
Pledged(a) | Cash
Collateral
Pledged(a) | Net Amount
of Derivative
Liabilities(c) |
| Standard Chartered Bank | $(630,800) | $630,800 | $ — | $ — | $ — |
| (a) | In some instances, the total collateral received and/or pledged may be more than the amount shown due to overcollateralization. |
| (b) | Net amount represents the net amount due from the counterparty in the event of default. |
| (c) | Net amount represents the net amount payable to the counterparty in the event of default. |
The effect of derivative instruments (not considered to be hedging instruments for accounting disclosure purposes) on the Statement of Operations and whose primary underlying risk exposure is foreign exchange risk for the year ended October 31, 2024 was as follows:
| Derivative | Realized Gain (Loss)
on Derivatives Recognized
in Income(1) | Change in Unrealized
Appreciation (Depreciation) on
Derivatives Recognized in Income(2) |
| Forward foreign currency exchange contracts | $(13,409,639) | $9,945,291 |
| (1) | Statement of Operations location: Net realized gain (loss): Forward foreign currency exchange contracts. |
| (2) | Statement of Operations location: Change in unrealized appreciation (depreciation): Forward foreign currency exchange contracts. |
The average notional amount of forward foreign currency exchange contracts (based on the absolute value of notional amounts of currency purchased and currency sold) outstanding during the year ended October 31, 2024, which is indicative of the volume of this derivative type, was approximately $1,101,804,000.
Senior Debt Portfolio
October 31, 2024
Notes to Financial Statements — continued
6 Revolving Credit and Security Agreement
The Portfolio has entered into a Revolving Credit and Security Agreement, as amended (the “Loan Facility”), with Toronto Dominion Bank as direct lender and agent and certain other banks as direct lenders that allows it to borrow up to $2 billion and to invest the borrowings in accordance with its investment practices. Borrowings under the Loan Facility are secured by the assets of the Portfolio. The Loan Facility is in effect through May 1, 2025. Prior to May 2, 2024, the direct lender and agent was The Bank of Nova Scotia and the borrowing limit was $2.525 billion. Interest is generally charged at a rate equal to the 1-Month Term Secured Overnight Financing Rate (SOFR) plus 0.11448% credit spread adjustment. On May 2, 2024, the Portfolio paid upfront fees equal to 0.15% of the total commitment amount under the Loan Facility and agency fees of $600,000, which are being amortized to interest expense through May 1, 2025. The Portfolio also pays (1) a drawn fee equal to 0.95% per annual on outstanding borrowings, and (2) a liquidity fee equal to 0.25% per annum of the undrawn amount under the Loan Facility. For periods prior to March 4, 2024, the drawn fee was equal to 0.90% per annum on outstanding borrowings and the liquidity fee was equal to 0.15% or 0.25% per annum of the undrawn amount under the Loan Facility depending on the amount borrowed by the Portfolio thereunder. The Portfolio also incurred upfront fees that were being amortized to May 3, 2024, of which $92,877 is included in interest expense for the year ended October 31, 2024.
Drawn and liquidity fees for the year ended October 31, 2024 totaled $15,436,354 and are included in interest expense and fees on the Statement of Operations. Unamortized upfront and agency fees at October 31, 2024 are approximately $1,857,000 and are included in prepaid upfront and agency fees on notes payable on the Statement of Assets and Liabilities. At October 31, 2024, the Portfolio had borrowings outstanding under the Loan Facility of $1.4 billion at an annual interest rate of 5.22%. Based on the short-term nature of borrowings under the Loan Facility and the variable interest rate, the carrying amount of the borrowings at October 31, 2024 approximated its fair value. If measured at fair value, borrowings under the Loan Facility would have been considered as Level 2 in the fair value hierarchy (see Note 8) at October 31, 2024. For the year ended October 31, 2024, the average borrowings under the Loan Facility and the average annual interest rate (excluding fees) were $1,463,046,000 and 5.36%, respectively.
7 Affiliated Investments
At October 31, 2024, the value of the Portfolio's investment in funds that may be deemed to be affiliated was $90,192,805, which represents 1.5% of the Portfolio's net assets. Transactions in such investments by the Portfolio for the year ended October 31, 2024 were as follows:
| Name | Value,
beginning
of period | Purchases | Sales
proceeds | Net realized
gain (loss) | Change in
unrealized
appreciation
(depreciation) | Value, end
of period | Dividend
income | Shares,
end of period |
| Short-Term Investments |
| Liquidity Fund | $83,572,578 | $2,708,620,231 | $(2,702,000,004) | $ — | $ — | $90,192,805 | $5,282,536 | 90,192,805 |
8 Fair Value Measurements
Under generally accepted accounting principles for fair value measurements, a three-tier hierarchy to prioritize the assumptions, referred to as inputs, is used in valuation techniques to measure fair value. The three-tier hierarchy of inputs is summarized in the three broad levels listed below.
| • | Level 1 – quoted prices in active markets for identical investments |
| • | Level 2 – other significant observable inputs (including quoted prices for similar investments, interest rates, prepayment speeds, credit risk, etc.) |
| • | Level 3 – significant unobservable inputs (including a fund's own assumptions in determining the fair value of investments) |
In cases where the inputs used to measure fair value fall in different levels of the fair value hierarchy, the level disclosed is determined based on the lowest level input that is significant to the fair value measurement in its entirety. The inputs or methodology used for valuing securities are not necessarily an indication of the risk associated with investing in those securities.
Senior Debt Portfolio
October 31, 2024
Notes to Financial Statements — continued
At October 31, 2024, the hierarchy of inputs used in valuing the Portfolio's investments and open derivative instruments, which are carried at fair value, were as follows:
| Asset Description | Level 1 | Level 2 | Level 3* | Total |
| Asset-Backed Securities | $ — | $ 225,101,470 | $ — | $ 225,101,470 |
| Common Stocks | 771,425 | 51,218,933 | 23,631,941 | 75,622,299 |
| Corporate Bonds | — | 568,416,225 | — | 568,416,225 |
| Senior Floating-Rate Loans (Less Unfunded Loan Commitments) | — | 6,232,951,752 | 23,133,702 | 6,256,085,454 |
| Warrants | — | — | 0 | — |
| Short-Term Investments | 90,192,805 | — | — | 90,192,805 |
| Total Investments | $90,964,230 | $7,077,688,380 | $46,765,643 | $7,215,418,253 |
| Forward Foreign Currency Exchange Contracts | $ — | $ 18,525,107 | $ — | $ 18,525,107 |
| Total | $90,964,230 | $7,096,213,487 | $46,765,643 | $7,233,943,360 |
| Liability Description | | | | |
| Forward Foreign Currency Exchange Contracts | $ — | $ (630,800) | $ — | $ (630,800) |
| Total | $ — | $ (630,800) | $ — | $ (630,800) |
| * | None of the unobservable inputs for Level 3 assets, individually or collectively, had a material impact on the Portfolio. |
Level 3 investments at the beginning and/or end of the period in relation to net assets were not significant and accordingly, a reconciliation of Level 3 assets for the year ended October 31, 2024 is not presented.
9 Risks and Uncertainties
Risks Associated with Foreign Investments
Foreign investments can be adversely affected by political, economic and market developments abroad, including the imposition of economic and other sanctions by the United States or another country, and by acts of terrorism and war. There may be less publicly available information about foreign issuers because they may not be subject to reporting practices, requirements or regulations comparable to those to which United States companies are subject. Foreign markets may be smaller, less liquid and more volatile than the major markets in the United States. Trading in foreign markets typically involves higher expense than trading in the United States. The Portfolio may have difficulties enforcing its legal or contractual rights in a foreign country. Securities that trade or are denominated in currencies other than the U.S. dollar may be adversely affected by fluctuations in currency exchange rates.
Credit Risk
The Portfolio invests primarily in below investment grade floating-rate loans, which are considered speculative because of the credit risk of their issuers. Changes in economic conditions or other circumstances are more likely to reduce the capacity of issuers of these securities to make principal and interest payments. Such companies are more likely to default on their payments of interest and principal owed than issuers of investment grade bonds. An economic downturn generally leads to a higher non-payment rate, and a loan or other debt obligation may lose significant value before a default occurs. Lower rated investments also may be subject to greater price volatility than higher rated investments. Moreover, the specific collateral used to secure a loan may decline in value or become illiquid, which would adversely affect the loan’s value.
Senior Debt Portfolio
October 31, 2024
Report of Independent Registered Public Accounting Firm
To the Trustees and Investors of Senior Debt Portfolio:
Opinion on the Financial Statements and Financial Highlights
We have audited the accompanying statement of assets and liabilities of Senior Debt Portfolio (the “Portfolio”), including the portfolio of investments, as of October 31, 2024, the related statements of operations and cash flows for the year then ended, the statements of changes in net assets for each of the two years in the period then ended, the financial highlights for each of the five years in the period then ended, and the related notes. In our opinion, the financial statements and financial highlights present fairly, in all material respects, the financial position of the Portfolio as of October 31, 2024, and the results of its operations and its cash flows for the year then ended, the changes in its net assets for each of the two years in the period then ended, and the financial highlights for each of the five years in the period then ended, in conformity with accounting principles generally accepted in the United States of America.
Basis for Opinion
These financial statements and financial highlights are the responsibility of the Portfolio’s management. Our responsibility is to express an opinion on the Portfolio’s financial statements and financial highlights based on our audits. We are a public accounting firm registered with the Public Company Accounting Oversight Board (United States) (PCAOB) and are required to be independent with respect to the Portfolio in accordance with the U.S. federal securities laws and the applicable rules and regulations of the Securities and Exchange Commission and the PCAOB.
We conducted our audits in accordance with the standards of the PCAOB. Those standards require that we plan and perform the audit to obtain reasonable assurance about whether the financial statements and financial highlights are free of material misstatement, whether due to error or fraud. The Portfolio is not required to have, nor were we engaged to perform, an audit of its internal control over financial reporting. As part of our audits, we are required to obtain an understanding of internal control over financial reporting but not for the purpose of expressing an opinion on the effectiveness of the Portfolio’s internal control over financial reporting. Accordingly, we express no such opinion.
Our audits included performing procedures to assess the risks of material misstatement of the financial statements and financial highlights, whether due to error or fraud, and performing procedures that respond to those risks. Such procedures included examining, on a test basis, evidence regarding the amounts and disclosures in the financial statements and financial highlights. Our audits also included evaluating the accounting principles used and significant estimates made by management, as well as evaluating the overall presentation of the financial statements and financial highlights. Our procedures included confirmation of securities and senior loans owned as of October 31, 2024, by correspondence with the custodian, brokers and agent banks; when replies were not received from brokers and agent banks, we performed other auditing procedures. We believe that our audits provide a reasonable basis for our opinion.
/s/ Deloitte & Touche LLP
Boston, Massachusetts
December 18, 2024
We have served as the auditor of one or more Eaton Vance investment companies since 1959.
Eaton Vance
Floating-Rate Advantage Fund
October 31, 2024
Board of Trustees’ Contract Approval
Overview of the Contract Review Process
The Investment Company Act of 1940, as amended (the “1940 Act”), provides, in substance, that the investment advisory agreement between a fund and its investment adviser will continue in effect from year-to-year only if its continuation is approved on an annual basis by a vote of the fund’s board of trustees, including a majority of the trustees who are not “interested persons” of the fund (“independent trustees”), cast in person at a meeting called for the purpose of considering such approval.
At a meeting held on June 6, 2024, the Boards of Trustees/Directors (collectively, the “Board”) that oversee the registered investment companies advised by Eaton Vance Management or its affiliate, Boston Management and Research (the “Eaton Vance Funds”), including a majority of the independent trustees (the “Independent Trustees”), voted to approve the continuation of existing investment advisory agreements and sub-advisory agreements1 for each of the Eaton Vance Funds for an additional one-year period. The Board relied upon the affirmative recommendation of its Contract Review Committee, which is a committee comprised of all of the Independent Trustees. Prior to making its recommendation, the Contract Review Committee reviewed information furnished by the adviser and sub-adviser to each of the Eaton Vance Funds (including information specifically requested by the Board) for a series of meetings held between April and June 2024, as well as certain additional information provided in response to specific requests from the Independent Trustees as members of the Contract Review Committee. Members of the Contract Review Committee also considered information received at prior meetings of the Board and its committees, to the extent such information was relevant to the Contract Review Committee’s annual evaluation of the investment advisory agreements and sub-advisory agreements.
In connection with its evaluation of the investment advisory agreements and sub-advisory agreements, the Board considered various information relating to the Eaton Vance Funds. This included information applicable to all or groups of Eaton Vance Funds, which is referenced immediately below, and information applicable to the particular Eaton Vance Fund covered by this report (each “Eaton Vance Fund” is referred to below as a “fund”). (For funds that invest through one or more underlying portfolios, references to “each fund” in this section may include information that was considered at the portfolio-level.)
Information about Fees, Performance and Expenses
• A report from an independent data provider comparing advisory and other fees paid by each fund to such fees paid by comparable funds, as identified by the independent data provider (“comparable funds”);
• A report from an independent data provider comparing each fund’s total expense ratio (and its components) to those of comparable funds;
• A report from an independent data provider comparing the investment performance of each fund (including, as relevant, total return data, income data, Sharpe ratios, and information ratios) to the investment performance of comparable funds and, as applicable, benchmark indices, over various time periods;
• In certain instances, data regarding investment performance relative to customized groups of peer funds and blended indices identified by the adviser in consultation with the Portfolio Management Committee of the Board (a committee exclusively comprised of Independent Trustees);
• Comparative information concerning the fees charged and services provided by the adviser and sub-adviser to each fund in managing other accounts (which may include other funds, collective investment trusts and institutional accounts) with the same or substantially similar investment objective as the fund and with a significant overlap in holdings based on criteria set by the Board, if any;
• Profitability analyses with respect to the adviser and sub-adviser to each of the funds;
Information about Portfolio Management and Trading
• Descriptions of the investment management services provided to each fund, as well as each of the funds’ investment strategies and policies;
• The procedures and processes used by the adviser to determine the value of fund assets, including, when necessary, the determination of “fair value” by the adviser in its role as each funds’ valuation designee and actions taken to monitor and test the effectiveness of such procedures and processes;
• Information about the policies and practices of each fund’s adviser and sub-adviser with respect to trading, including their processes for seeking best execution of portfolio transactions;
• Information about the allocation of brokerage transactions and the benefits, if any, received by the adviser and sub-adviser to each fund as a result of brokerage allocation, including, as applicable, information concerning the acquisition of research through client commission arrangements and policies with respect to “soft dollars”;
• Data relating to the portfolio turnover rate of each fund and related information regarding active management in the context of particular strategies;
Information about each Adviser and Sub-adviser
• Reports detailing the financial results and condition of the adviser and sub-adviser to each fund;
1 Not all Eaton Vance Funds have entered into a sub-advisory agreement with a sub-adviser. Accordingly, references to “sub-adviser” or “sub-advisory agreement” in this “Overview” section may not be applicable to the particular Eaton Vance Fund covered by this report. Eaton Vance Management and Boston Management and Research are referred to collectively as the “adviser.”
Eaton Vance
Floating-Rate Advantage Fund
October 31, 2024
Board of Trustees’ Contract Approval — continued
• Information regarding the individual investment professionals whose responsibilities include portfolio management and investment research for the funds, and, for portfolio managers and certain other investment professionals, information relating to their responsibilities with respect to managing other funds and investment accounts, as applicable;
• Information regarding the adviser’s and its parent company’s (Morgan Stanley’s) efforts to retain and attract talented investment professionals, including in the context of a competitive marketplace for talent;
• Information regarding the adviser’s compensation methodology for its investment professionals and the incentives and accountability it creates, along with investment professionals’ investments in the fund(s) they manage;
• The personal trading codes of ethics of the adviser and its affiliates and the sub-adviser of each fund, together with information relating to compliance with, and the administration of, such codes;
• Policies and procedures relating to proxy voting, including regular reporting with respect to fund proxy voting activities;
• Information regarding the handling of corporate actions and class actions, as well as information regarding litigation and other regulatory matters;
• Information concerning the resources devoted to compliance efforts undertaken by the adviser and its affiliates and the sub-adviser of each fund, including descriptions of their various compliance programs and their record of compliance and remediation;
• Information concerning the business continuity and disaster recovery plans of the adviser and its affiliates and the sub-adviser of each fund;
• A description of the adviser’s oversight of sub-advisers, including with respect to regulatory and compliance issues, investment management and other matters;
Other Relevant Information
• Information regarding ongoing initiatives to further integrate and harmonize, where applicable, the investment management and other departments of the adviser and its affiliates with the overall investment management infrastructure of Morgan Stanley, in light of Morgan Stanley’s acquisition of Eaton Vance Corp. on March 1, 2021;
• Information concerning the nature, cost, and character of the administrative and other non-investment advisory services provided by the adviser and its affiliates;
• Information concerning oversight of the relationship with the custodian, subcustodians, fund accountants, and other third-party service providers by the adviser and/or administrator to each of the funds;
• Information concerning efforts to implement policies and procedures with respect to various regulations applicable to the funds, including Rule 12d1-4 (the Fund-of-Funds Rule), Rule 18f-4 (the Derivatives Rule), and Rule 2a-5 (the Fair Valuation Rule);
• For an Eaton Vance Fund structured as an exchange-listed closed-end fund, information concerning the benefits of the closed-end fund structure, as well as, where relevant, the closed-end fund’s market prices (including as compared to the closed-end fund’s net asset value (NAV)), trading volume data, continued use of auction preferred shares (where applicable), distribution rates, and other relevant matters;
• The risks that the adviser and/or its affiliates incur in connection with the management and operation of the funds, including, among others, litigation, regulatory, entrepreneurial, and other business risks (and the associated costs of such risks); and
• The terms of each investment advisory agreement and sub-advisory agreement.
During the various meetings of the Board and its committees over the course of the year leading up to the June 6, 2024 meeting, the Board and its committees received information from portfolio managers and other investment professionals of the adviser and sub-advisers of the funds regarding investment and performance matters, and considered various investment and trading strategies used in pursuing the funds’ investment objectives. The Board and its committees also received information regarding risk management techniques employed in connection with the management of the funds. The Board and its committees evaluated issues pertaining to industry and regulatory developments, compliance procedures, fund governance, and other issues with respect to the funds, and received and participated in reports and presentations provided by the adviser and sub-advisers, with respect to such matters. In addition to the formal meetings of the Board and its committees, the Independent Trustees held regular video or telephone conferences to discuss, among other topics, matters relating to the continuation of investment advisory agreements and sub-advisory agreements.
The Contract Review Committee was advised throughout the contract review process by Kirkland & Ellis LLP, independent legal counsel for the Independent Trustees. The members of the Contract Review Committee, with the advice of such counsel, exercised their own business judgment in determining the material factors to be considered in evaluating each investment advisory agreement and sub-advisory agreement and the weight to be given to each such factor. The conclusions reached with respect to each investment advisory agreement and sub-advisory agreement were based on a comprehensive evaluation of all the information provided and not any single factor. Moreover, each member of the Contract Review Committee may have placed varying emphasis on particular factors in reaching conclusions with respect to each investment advisory agreement and sub-advisory agreement. In evaluating each investment advisory agreement and sub-advisory agreement, including the fee structures and other terms contained in such agreements, the members of the Contract Review Committee were also informed by multiple years of analysis and discussion with the adviser and sub-adviser to each of the Eaton Vance Funds.
Results of the Contract Review Process
Based on its consideration of the foregoing, and such other information it deemed relevant, including the factors and conclusions described below, the Contract Review Committee concluded that the continuation of the investment advisory agreement between Eaton Vance Floating-Rate Advantage Fund (the “Fund”) and Eaton Vance Management (“EVM”), as well as the investment advisory agreement between Senior Debt Portfolio (the “Portfolio”), the
Eaton Vance
Floating-Rate Advantage Fund
October 31, 2024
Board of Trustees’ Contract Approval — continued
portfolio in which the Fund invests, and Boston Management and Research (“BMR”) (EVM, with respect to the Fund, and BMR, with respect to the Portfolio, are each referred to herein as the “Adviser”), including their respective fee structures, are in the interests of shareholders and, therefore, recommended to the Board approval of each agreement. Based on the recommendation of the Contract Review Committee, the Board, including a majority of the Independent Trustees, voted to approve continuation of the investment advisory agreements for the Fund and the Portfolio (together, the “investment advisory agreements”).
Nature, Extent and Quality of Services
In considering whether to approve the investment advisory agreements for the Fund and the Portfolio, the Board evaluated the nature, extent and quality of services provided to the Fund and to the Portfolio by the applicable Adviser.
The Board considered each Adviser’s management capabilities and investment processes in light of the types of investments held by the Fund and the Portfolio, including the education and experience of the investment professionals who provide services to the Portfolio. In particular, the Board considered the abilities and experience of each Adviser’s investment professionals in analyzing special considerations relevant to investing in senior floating rate loans. The Board considered each Adviser’s large group of bank loan investment professionals and other personnel who provide services to the Fund and to the Portfolio, including portfolio managers and analysts. The Board also took into account the resources dedicated to portfolio management and other services, the compensation methods of each Adviser and other factors, including the reputation and resources of the Adviser to recruit and retain highly qualified research, advisory and supervisory investment professionals. In addition, the Board considered the time and attention devoted to the Eaton Vance Funds, including the Fund and the Portfolio, by senior management, as well as the infrastructure, operational capabilities and support staff in place to assist in the portfolio management and operations of the Fund and the Portfolio, including the provision of administrative services. The Board also considered the business-related and other risks to which each Adviser or its affiliates may be subject in managing the Fund and the Portfolio.
The Board noted that, under the terms of the investment advisory agreement of the Fund, EVM may invest assets of the Fund directly in securities, for which it would receive a fee, or in the Portfolio, for which it receives no separate fee but for which BMR receives an advisory fee from the Portfolio.
The Board considered the compliance programs of each Adviser and relevant affiliates thereof. The Board considered compliance and reporting matters regarding, among other things, personal trading by investment professionals, disclosure of portfolio holdings, compliance with policies and procedures, portfolio valuation, business continuity and the allocation of investment opportunities. The Board also considered relevant examinations of each Adviser and its affiliates by regulatory authorities, such as the Securities and Exchange Commission and the Financial Industry Regulatory Authority.
The Board considered other administrative services provided or overseen by EVM and its affiliates, including transfer agency and accounting services. The Board evaluated the benefits to shareholders of investing in a fund that is a part of a large fund complex offering exposure to a variety of asset classes and investment disciplines, as well as the ability, in many cases, to exchange an investment among different funds without incurring additional sales charges.
After consideration of the foregoing factors, among others, the Board concluded that the nature, extent and quality of services provided by each Adviser, taken as a whole, are appropriate and consistent with the terms of the applicable investment advisory agreement.
Fund Performance
The Board compared the Fund’s investment performance to that of comparable funds identified by an independent data provider (the peer group), as well as an appropriate benchmark index. The Board’s review included comparative performance data with respect to the Fund for the one-, three-, five- and ten-year periods ended December 31, 2023. In this regard, the Board noted that the performance of the Fund was higher than the median performance of the Fund’s peer group for the three-year period. The Board also noted that the performance of the Fund was lower than its benchmark index for the three-year period. The Board concluded that the performance of the Fund was satisfactory.
Management Fees and Expenses
The Board considered contractual fee rates payable by the Portfolio and by the Fund for advisory and administrative services (referred to collectively as “management fees”). As part of its review, the Board considered the Fund’s management fees and total expense ratio for the one-year period ended December 31, 2023, as compared to those of comparable funds, before and after giving effect to any undertaking to waive fees or reimburse expenses. The Board also considered certain factors identified by management in response to inquiries from the Contract Review Committee regarding the Fund’s total expense ratio relative to comparable funds.
After considering the foregoing information, and in light of the nature, extent and quality of the services provided by each Adviser, the Board concluded that the management fees charged for advisory and related services are reasonable.
Profitability and “Fall-Out” Benefits
The Board considered the level of profits realized by each Adviser and relevant affiliates thereof in providing investment advisory and administrative services to the Fund, to the Portfolio and to all Eaton Vance Funds as a group. The Board considered the level of profits realized without regard to marketing support or other payments by each Adviser and its affiliates to third parties in respect of distribution or other services.
Eaton Vance
Floating-Rate Advantage Fund
October 31, 2024
Board of Trustees’ Contract Approval — continued
The Board concluded that, in light of the foregoing factors and the nature, extent and quality of the services rendered, the profits realized by each Adviser and its affiliates are not excessive.
The Board also considered direct or indirect fall-out benefits received by each Adviser and its affiliates in connection with their respective relationships with the Fund and the Portfolio, including the benefits of research services that may be available to each Adviser as a result of securities transactions effected for the Fund and the Portfolio and other investment advisory clients.
Economies of Scale
In reviewing management fees and profitability, the Board also considered the extent to which the applicable Adviser and its affiliates, on the one hand, and the Fund and the Portfolio, on the other hand, can expect to realize benefits from economies of scale as the assets of the Fund and the Portfolio increase. The Board acknowledged the difficulty in accurately measuring the benefits resulting from economies of scale, if any, with respect to the management of any specific fund or group of funds. To assist in the evaluation of the sharing of any economies of scale, the Board received data showing for recent years, asset levels, Adviser profitability and total expense ratios. Based upon the foregoing, the Board concluded that the Fund currently shares in the benefits from economies of scale, if any, when they are realized by the Adviser. The Board also concluded that the structure of the advisory fees, which include breakpoints at several asset levels will allow the Fund and the Portfolio to continue to benefit from any economies of scale in the future.
Item 8. Changes in and Disagreements with Accountants for Open-End Management Investment Companies
Not applicable.
Item 9. Proxy Disclosures for Open-End Management Investment Companies
Not applicable.
Item 10. Remuneration Paid to Directors, Officers, and Others of Open-End Management Investment Companies
The information is disclosed as part of the Financial Statements included in Item 7 of this Form N-CSR.
Item 11. Statement Regarding Basis for Approval of Investment Advisory Contract
The information is included in Item 7 of this Form N-CSR.
Item 12. Disclosure of Proxy Voting Policies and Procedures for Closed-End Management Investment Companies
Not applicable.
Item 13. Portfolio Managers of Closed-End Management Investment Companies
Not applicable.
Item 14. Purchases of Equity Securities by Closed-End Management Investment Company and Affiliated Purchasers
Not applicable.
Item 15. Submission of Matters to a Vote of Security Holders
There have been no material changes to the procedures by which shareholders may recommend nominee to the Portfolio’s Board of Trustees since the Portfolio last provided disclosure in response to this item.
Item 16. Controls and Procedures
| (a) | It is the conclusion of the registrant’s principal executive officer and principal financial officer that the effectiveness of the registrant’s current disclosure controls and procedures (such disclosure controls and procedures having been evaluated within 90 days of the date of this filing) provide reasonable assurance that the information required to be disclosed by the registrant has been recorded, processed, summarized and reported within the time period specified in the Commission’s rules and forms and that the information required to be disclosed by the registrant has been accumulated and communicated to the registrant’s principal executive officer and principal financial officer in order to allow timely decisions regarding required disclosure. |
| (b) | There have been no changes in the registrant’s internal control over financial reporting during the period covered by this report that has materially affected, or is reasonably likely to materially affect, the registrant’s internal control over financial reporting. |
Item 17. Disclosure of Securities Lending Activities for Closed-End Management Investment Companies
Not applicable.
Item 18. Recovery of Erroneously Awarded Compensation
Not applicable.
Item 19. Exhibits
Signatures
Pursuant to the requirements of the Securities Exchange Act of 1934 and the Investment Company Act of 1940, the registrant has duly caused this report to be signed on its behalf by the undersigned, thereunto duly authorized.
| | |
| Senior Debt Portfolio |
| |
| By: | | /s/ Kenneth A. Topping |
| | Kenneth A. Topping |
| | Principal Executive Officer |
|
| Date: December 23, 2024 |
Pursuant to the requirements of the Securities Exchange Act of 1934 and the Investment Company Act of 1940, this report has been signed below by the following persons on behalf of the registrant and in the capacities and on the dates indicated.
| | |
| By: | | /s/ James F. Kirchner |
| | James F. Kirchner |
| | Principal Financial Officer |
|
| Date: December 23, 2024 |
| |
| By: | | /s/ Kenneth A. Topping |
| | Kenneth A. Topping |
| | Principal Executive Officer |
|
| Date: December 23, 2024 |