UNITED STATES
SECURITIES AND EXCHANGE COMMISSION
Washington, D.C. 20549
FORMN-CSR
CERTIFIED SHAREHOLDER REPORT OF REGISTERED
MANAGEMENT INVESTMENT COMPANIES
Investment Company Act File number:811-08894
JNL Series Trust
(Exact name of registrant as specified in charter)
1 Corporate Way, Lansing, Michigan 48951
(Address of principal executive offices)
225 West Wacker Drive, Suite 1200, Chicago, Illinois 60606
(Mailing address)
Daniel W. Koors
Jackson National Asset Management, LLC
225 West Wacker Drive, Suite 1200
Chicago, Illinois 60606
(Name and address of agent for service)
Registrant’s telephone number, including area code: (312)338-5800
Date of Fiscal Year End: December 31
Date of Reporting Period: December 31, 2018
FormN-CSR is to be used by management investment companies to file reports with the Commission not later than 10 days after the transmission to stockholders of any report that is required to be transmitted to stockholders under Rule30e-1 under the Investment Company Act of 1940 (17 CFR270.30e-1). The Commission may use the information provided on FormN-CSR in its regulatory, disclosure review, inspection, and policymaking roles.
A registrant is required to disclose the information specified by FormN-CSR, and the Commission will make this information public. A registrant is not required to respond to the collection of information contained in FormN-CSR unless the Form displays a currently valid Office of Management and Budget (“OMB”) control number. Please direct comments concerning the accuracy of the information collection burden estimate and any suggestions for reducing the burden to Secretary, Securities and Exchange Commission, 450 Fifth Street, NW, Washington, DC 20549-0609. The OMB has reviewed this collection of information under the clearance requirements of 44 U.S.C. §3507.
Item 1. Report to Shareholders.

CHOOSE THE INBOX. NOT THE MAILBOX. Less waste. More convenience. Your choice. Three easy ways to go paperless: 1. Mail this postage-paid card 2. Call1-866-349-4564 3. Visit jackson.com I consent to receive by electronic delivery: ALL DOCUMENTS Periodic and immediate confirmation statements Annual and semi-annual reports Annual statements (Variable Products and Fixed Index Annuities only)(Variable Products only) (Fixed, Fixed Index and Target Select Annuities only)Other contract-related correspondence Prospectuses and prospectus supplements (Variable Products only) This consent will continue until revoked and will cover delivery to you in the form of ane-mail or by notice to you of a document’s availability on Jackson National Life Insurance Company®‘s (also referred to as Jackson®) website. For jointly owned contracts, all Joint Owners are consenting to electronic delivery and use of the singlee-mail address below. Please contact the appropriate Jackson Service Center or go to www.jackson.com to update youre-mail address, revoke your consent to electronic delivery, or request paper copies. Certain types of correspondence may continue to be delivered by the United States Postal Service for compliance reasons. Registration on Jackson’s website (www.jackson.com) is required for electronic delivery of contract-related correspondence Please write legibly. Fold Here Signature: Date: Signature: Date:E-mail address:I (We) will notify Jackson of any change to thise-mail address. Name: Address: City: State: ZIP: Policy Number Owner’s State of Residence Phone Number – – The computer hardware and software requirements that are necessary to receive, process and retain electronic communications that are subject to this consent are as follows: To view and download material electronically, you must have a computer with Internet access, an activee-mail account and Adobe Acrobat Reader. If you don’t already have Adobe Acrobat Reader, you can download it free from www.adobe.com. There is no charge for electronic delivery of electronic communications, although you may incur the costs of Internet access and of such computer and related hardware and software as may be necessary for you to receive, process and retain electronic communications from Jackson. Please make certain you have given Jackson a currente-mail address. Also let Jackson know if thate-mail address changes. We may need to notify you of a document’s availability throughe-mail. You may request paper copies, whether or not you consent or revoke your consent to electronic delivery, at any time and for no charge. Even if you have given us consent, we are not required to make electronic delivery and we have the right to deliver any communications in paper form. Tape Here VADV7339 01/19 ANNUAL REPORT December 31, 2018 JNL® Series Trust • Master Feeder Funds and Funds of Funds Beginning on January 1, 2021, as permitted by regulations adopted by the Securities and Exchange Commission, paper copies of the Funds’ annual and semi annual shareholder reports will no longer be sent by mail, unless you specifically request paper copies of the reports from Jackson. Instead, the reports will be made available on Jackson’s website (www.jackson.com), and you will be notified by mail each time a report is posted and provided with a website link to access the report. If you already elected to receive shareholder reports electronically, you will not be affected by this change and you need not take any action. You may elect to receive shareholder reports and other communications from Jackson electronically by doing one of the following: • Mailing in the postage-paid card on the cover of this report; • Calling1-866-349-4564; or • Signing up on www.jackson.com Beginning on January 1, 2019, you may elect to receive all future reports in paper free of charge. You can inform Jackson that you wish to continue receiving paper copies of your shareholder reports by contacting the appropriate Jackson Service Center. Your election to receive reports in paper will apply to all Funds held in each variable contract you purchased from Jackson. Please note that if you own more than one variable contract with Jackson, your delivery preferences must be set up for each variable contract separately. Issued by Jackson National Life Insurance Company 1 Corporate Way, Lansing, MI 48951
NO POSTAGE NECESSARY IF MAILED IN THE UNITED STATES BUSINESS REPLY MAIL FIR TS-CLA SS M IA L PERMIT NO. 600 L NA IS NG MI POSTAGE WILL BE PAID BY ADDRESSEE JACKSON PO BOX 24068 LANSING MI48909-4068 Fold Here This report is for the general information of qualified plan participants, as well as contract/policy owners of the Perspective SM, Perspective II®, Perspective Advisors SM, Perspective Advisory, Perspective Advisors IISM, Perspective Advisory IISM, Perspective L Series, Perspective Rewards®, Curiangard SM, Perspective Advantage SM, Perspective Focus®, Fifth Third Perspective, Jackson Private WealthSM, Retirement Latitudes®, Elite Access®, Elite Access Advisory SM, Elite Access Advisory II, Perspective (New York), Perspective II (New York), Perspective Advisors II (New York), Perspective L Series (New York), Curiangard (New York), Perspective Advisors (New York), Perspective Focus (New York), Perspective Rewards (New York) and Elite Access (New York). Not all the portfolios are available in all of the products. Jackson is the marketing name for Jackson National Life Insurance Company (Home Office: Lansing, Michigan) and Jackson National Life Insurance Company of New York® (Home Office: Purchase, New York).

1 Corporate Way
Lansing, MI 48951
Toll Free: 1-800-873-5654
IMPORTANT NOTICE REGARDING DELIVERY OF SHAREHOLDER DOCUMENTS
Dear Client:
If you are a current member of a household with multiple variable products, and have not instructed Jackson otherwise, you currently receive only one copy of the following general documents: Prospectus, Annual and Semi-Annual Report, and other documents as permitted under applicable federal laws relating to Jackson’s variable products and their underlying investment options.
We will continue to send one such copy of these general documents unless and until we receive contrary instructions from you. This delivery policy does not apply to account statements, confirmation statements, or other documents reflecting transaction activity, which you will continue to receive individually.
You may choose to receive a separate copy of these general documents at any time by contacting us toll-free at 1-800-873-5654. Once we receive your request, we will start sending you separate copies within 30 days of receipt of your request.
If you would rather receive your prospectus and other documents via e-mail, please register for Jackson’s Green Delivery Program by visiting the www.Jackson.com. Our Go Paperless process is quick and easy for policyholders – just have your policy number available when you register.
Jackson appreciates your cooperation as we do our part to aid the environment by reducing the amount of paper we distribute. While we’re committed to providing you with the information you need in the format you prefer, we are always looking for new ways to operate more efficiently.
Variable Products issued by Jackson National Life Insurance Company® and distributed by Jackson National Life Distributors LLC, member FINRA. 800/873-5654
JNL Series Trust Master Feeder Funds and Funds of Funds
December 31, 2018
JNL Series Trust Master Feeder Funds and Funds of Funds including: JNL/American Funds® Balanced Fund, JNL/American Funds Blue Chip Income and Growth Fund, JNL/American Funds Capital Income Builder Fund, JNL/American Funds Global Bond Fund, JNL/American Funds Global Small Capitalization Fund, JNL/American Funds Growth-Income Fund, JNL/American Funds International Fund, JNL/American Funds New World Fund, JNL/Vanguard Capital Growth Fund, JNL/Vanguard Equity Income Fund, JNL/Vanguard International Fund, JNL/Vanguard Small Company Growth Fund, JNL Institutional Alt 25 Fund, JNL Institutional Alt 50 Fund, JNL/American Funds Moderate Growth Allocation Fund, JNL/American Funds Growth Allocation Fund, JNL Moderate Growth Allocation Fund, JNL Growth Allocation Fund, JNL Aggressive Growth Allocation Fund, JNL/Franklin Templeton Founding Strategy Fund, JNL/Mellon Capital 10 x 10 Fund, JNL/Mellon Capital Index 5 Fund, JNL/S&P 4 Fund, JNL/S&P Managed Conservative Fund, JNL/S&P Managed Moderate Fund, JNL/S&P Managed Moderate Growth Fund, JNL/S&P Managed Growth Fund, JNL/S&P Managed Aggressive Growth Fund, JNL/Vanguard US Stock Market Index Fund, JNL/Vanguard International Stock Market Index Fund, JNL/Vanguard Global Bond Market Index Fund
JNL Series Trust Approval of the Trust’s Investment Advisory and Sub-Advisory Agreements |
JNL Series Trust Supplements to Prospectus
Variable Products issued by Jackson National Life Insurance Company® and distributed by Jackson National Life Distributors LLC, member FINRA. 800/873-5654
JNL Series Trust Master Feeder Funds and Funds of Funds
December 31, 2018
Dear Investor,
 Enclosed is the annual report for the JNL Series Trust Master Feeder Funds and Funds of Funds for the year ended December 31, 2018, together with Management’s Discussion of Fund Performance for each of the Funds.
Securities markets saw the abrupt return of volatility in 2018 after a placid and profitable 2017. The S&P 500 Index finished down more than -4% as it suffered several sharp and sudden downswings throughout the year, including a nearly 20% drop from its September highs through the last week of December. Small and mid-cap stocks fared worse. Foreign markets diverged from the U.S. by selling off before the summer in suffering the most. International developed equity markets fell double digits, with emerging markets dropping 14.6%. Global fixed income spent most of the year in negative territory before a flight to safety during the fourth quarter fueled by buying government and investment grade bonds that helped the Bloomberg Barclays U.S. Aggregate Bond Index to finish the year virtually flat (up 0.01%). Non-core fixed income segments, especially high yield bonds and emerging market debt, posted notable losses.
The return of volatility was not necessarily unwarranted. The initial bout in February was likely sparked by a steady uptick in long term bond yields that raised concerns of higher borrowing costs for companies and governments, exacerbated by a violent unwinding of low volatility trades that bet on the continuation of a docile market environment. That chain reaction served as a wake up call to investors and quickly passed, but concerns about the impact of higher interest rates on business profitability and stock valuations after a long period of extremely low rates persisted. Debt market turmoil in Italy, Turkey and Argentina, along with slowing economic growth, soured investors on markets overseas mid-year as U.S. equities regained their footing. That, however, only served as a prelude to further concerns about global growth that hit stocks during the fourth quarter as U.S. China trade tensions and continued U.S. Federal Reserve rate hikes added to negative expectations for future earnings.
While not entirely unexpected, the suddenness and magnitude of downward volatility always serves as a jolt to investors. In last year’s letter we noted that the calmness of the market in 2017 (an entire year without a 5% or more correction) was unusual and likely unsustainable. A history of market declines tells us that a 10% drop in equities is a roughly once a year experience, while 20% drops happen about once every three and a half years on average. By the end of 2017, the last broad based 20% drop in large cap U.S. equities had concluded in March 2009—more than eight and half years before the start of 2018! This is not to say that such volatility is predictable, merely to put things in perspective as a reminder that post financial crisis market activity has been unusually moderate on the heels of unprecedentedly easy monetary policy. Moderation may have lulled a new generation of investors into a false sense of confidence, though history has shown that there has yet to be a solution to the cyclicality of markets.
The best that we can do as investors is to build diversified portfolios to withstand downswings such that long term plans remain intact and investment goals are still achievable. Although there were few places to hide in the market that offered positive returns during 2018, studies have shown that investors do better mixing their investment choices among a wide variety of asset classes and strategies instead of trying to guess or time exposure into a select few. As sentiment waned and volatility increased in 2018, market leadership shifted between sectors, styles and asset classes. As mentioned earlier, domestic fixed income was under water for most of the year before recovering in the fourth quarter to become the best absolute performing asset class. Utilities, among the bottom performing areas of the S&P 500 in June, finished the year up 4.1% behind only health care among top performers. Indeed, the dispersion of returns between sectors within the S&P 500 Index ranged from -18.10% (energy) to 6.47% (health care).
At Jackson, we seek to offer investors the building blocks for creating well diversified portfolios, and the freedom to do so however they see fit. We offer a wide array of Funds across asset classes and investment styles that allows investors to build portfolios that suit their individual risk tolerance and goals. We seek best of breed Sub-Advisors that we think represent not only the finest organizations in the industry but also offer unique investment approaches able to persistently meet our expectations. We offer both passive and actively managed options as we recognize the strengths and weaknesses of each approach can complement the other. These many traits all support and benefit from diversification to allow for the creation of a portfolio suited to any kind of investor.
No one knows what markets have in store for investors in 2019. A number of economic and geopolitical risks remain in the forefront, including slowing global growth, trade tensions, Brexit, excessive government and company debt and rising interest rates. No one can predict when and how these forces will act on markets, what other unknown issues may be lurking, or what the long term consequences will be on markets and investors. Against this uncertainty it is best to have a steady asset allocation plan to provide constancy amid a sea of market ambiguity. That, we think, is how successful investors achieve their goals.
Thank you for choosing Jackson for your investment needs.

Mark D. Nerud
President and Chief Executive Officer
JNL Series Trust
1
| JNL Series Trust Master Feeder Funds and Funds of Funds Market Summary (Unaudited) |

Major Indices Returns for the Year Ended December 31, 2018
Domestic Equity | Developed International Equity | ||||||||||
S&P 500 Index | -4.38 | % | MSCI All Country World ex-USA Index (Net) | -9.42 | % | ||||||
S&P MidCap 400 Index | -11.08 | MSCI EAFE Index (Net) | -13.79 | ||||||||
MSCI USA Index | -4.50 | ||||||||||
MSCI USA Mid Cap Index | -9.37 | Emerging Markets | |||||||||
MSCI USA Small Cap Index | -13.35 | MSCI Emerging Markets Index (Net) | -14.58 | % | |||||||
Fixed Income | Alternative Assets | ||||||||||
Bloomberg Barclays Global Aggregate Bond Index | -1.20 | % | Bloomberg Commodity Index | -11.25 | % | ||||||
Bloomberg Barclays U.S. Aggregate Bond Index | 0.01 | FTSE EPRA/NAREIT Developed Index | -4.74 | ||||||||
Bloomberg Barclays U.S. Corporate High Yield Bond Index | -9.37 | ||||||||||
Alternative Strategy | |||||||||||
Wilshire Liquid Alternative Index | -4.26 | % | |||||||||
Domestic Equity: Volatility returned to the markets in 2018, after a calm and profitable 2017. All the major broad stock market indices lost ground during a turbulent year that saw a major selloff in stocks to finish the year. Steady gains midyear were bracketed by highly volatile trading during the first and fourth quarters that at times saw huge daily swings in prices that eventually led to losses. Volatility was even more severe among small- and mid-cap stocks, especially during the fourth quarter, resulting in even sharper losses by year end. While the heightened volatility favored value and traditionally defensive sectors of the market at times, growth stocks outperformed across the market cap spectrum overall, driven by information technology and ecommerce names. Still, it was health care and utilities that ultimately finished the year as the top performing sectors. Rising interest rates and a violent unwinding of low volatility trades following a docile 2017 market environment set the tone during the first quarter. The fourth quarter selloff was sparked by increased fears of slowing economic growth amid continued tightening of monetary policy by the U.S. Federal Reserve (“Fed”), which was also unwinding its massive balance sheet built up after the global financial crisis. Volatility is likely to continue in the first half of the year amid U.S. China trade negotiations and potential continued quantitative tightening on the part of the Fed.
Fixed Income: Concerns regarding a slowdown in growth and Fed monetary policy led to a rocky path for bonds. Bonds seemingly entered into a game of seesaw with the stock market in 2018. When bonds sold off to start the year, the resulting increase in interest rates sparked turmoil among stocks. As investors fled back to bonds, lower interest rates fueled a midyear rise in stocks, which ultimately ended in another reverse to end the year. All told, the investment grade U.S. bond market ended the year virtually flat, while global bonds posted modest losses. Government and investment grade bonds seesawed the most, but ultimately benefitted from lower rates by year end. High yield and credit sensitive bonds generally lost ground on valuation concerns, uncertainty about corporate credit ratings amid continued Fed rate hikes and slowing economic growth. Global bonds were hurt by a stronger U.S. Dollar for most of the year, with emerging markets (“EM”) debt hit especially hard by the Dollar and turmoil in select countries.
Developed International Equity: Slowing growth in Europe starting in the second quarter weighed heavily on foreign developed markets in 2018. Stock performance sharply diverged from the U.S. in the beginning of June, driven in part by a blowup in Italian politics that fueled fears of further Euro disruption. Weaker growth in Europe took the bloom off the global synchronized growth story, with U.S. economic strength and higher interest rates making it a more attractive option. Signals from the European Central Bank that it would be ending its quantitative easing program kept a lid on returns during the fourth quarter, though results were more in line with the U.S. Despite more encouraging economic news out of Japan, stocks were down double digits there as well.
Emerging Markets: After a standout 2017, EM bonds and equities were the laggards in their respective asset classes in 2018. EM equities finished the year down more than 14% despite holding up relatively better during the fourth quarter global sell off. A strong U.S. Dollar for most of the year, slowing economic growth in China and Europe and weaker commodity prices all contributed to a midyear downswing that diverged sharply from U.S. performance. EM debt followed equities lower midyear troubled by the stronger Dollar and debt market turmoil in Turkey and Argentina from which it didn’t really recover.
Alternative Assets: It was a mixed year for alternative assets as oil prices first soared then plummeted, throwing the commodities and natural resources categories into turmoil. Both segments posted double digit losses for the year in significantly lagging equities. Global infrastructure related assets also delivered losses, mostly in line with global equities. U.S. real estate was the relative bright spot in the category as it kept pace with U.S. equities, while global real estate investment trusts outperformed the lackluster global equity marketplace.
Alternative Strategies: Alternative investment strategies posted negative returns overall as measured by the Wilshire Liquid Alternative Index in slightly outperforming equities and trailing fixed income. Alternative strategies lagged stocks for most of the year but held up considerably better during the fourth quarter equity selloff. The event driven segment of the Index, which includes merger arbitrage strategies, stood out with positive returns for the year. The global macro and hedged equity segments underperformed the broader Index given their tilt towards equity and international exposure.
2
| JNL/American Funds Master Feeder Funds Capital Research and Management Company (Unaudited) |

JNL/American Funds Balanced Fund
Composition as of December 31, 2018: | ||
Domestic Equity | 100.0 | % |
Total Investments | 100.0 | % |
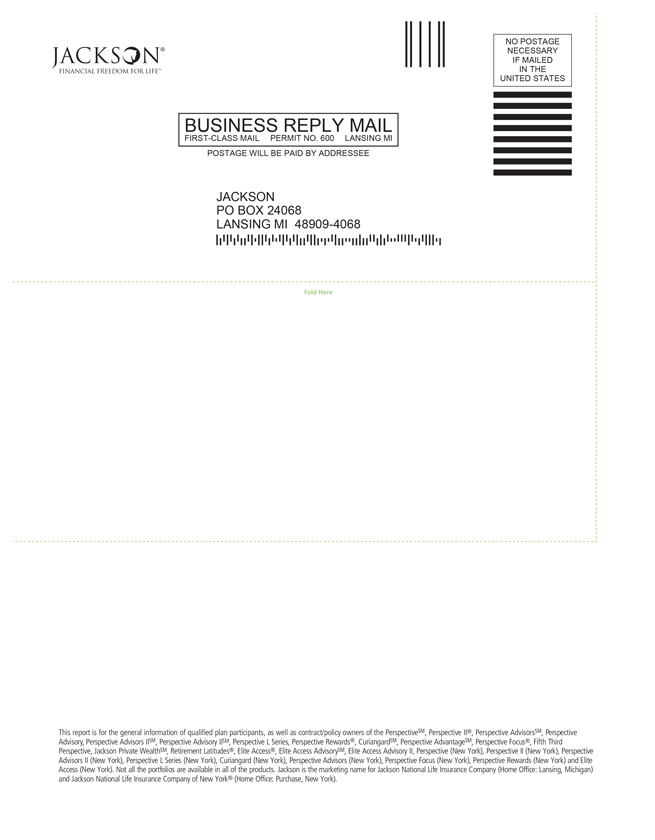
For the year ended December 31, 2018, JNL/American Funds Balanced Fund outperformed its primary benchmark by posting a return of -4.89% for Class A shares compared to -9.42% for the MSCI All Country World Index (Net). The Fund outperformed its secondary benchmark which posted a return of -6.42% for the 65% MSCI All Country World Index (Net), 35% Bloomberg Barclays Global Aggregate Bond Index.
The Fund seeks high total return (including income and capital gains) consistent with preservation of capital over the long term through exclusive investment in the Class 1 shares of the American Funds Insurance Series® - Asset Allocation FundSM (“Master Fund”). The performance of the Fund is directly related to the performance of the Master Fund. The financial statements of the Master Fund, including the Schedule of Investments and portfolio manager commentary, are provided separately and should be read in conjunction with the Fund’s financial statements.
JNL/American Funds Blue Chip Income and Growth Fund
Composition as of December 31, 2018: | ||
Domestic Equity | 100.0 | % |
Total Investments | 100.0 | % |
For the year ended December 31, 2018, JNL/American Funds Blue Chip Income and Growth Fund underperformed its benchmark by posting a return of -9.00% for Class A shares compared to -4.38% for the S&P 500 Index.
The Fund seeks both income exceeding the average yield on U.S. stocks generally and to provide an opportunity for growth of principal consistent with sound common stock investing through exclusive investment in the Class 1 shares of the American Funds Insurance Series® - Blue Chip Income and Growth FundSM (“Master Fund”). The performance of the Fund is directly related to the performance of the Master Fund. The financial statements of the Master Fund, including the Schedule of Investments and portfolio manager commentary, are provided separately and should be read in conjunction with the Fund’s financial statements.
JNL/American Funds Capital Income Builder Fund
Composition as of December 31, 2018: | ||
Global Balanced | 100.0 | % |
Total Investments | 100.0 | % |
Total Return |
| |||||
Class A‡ |
|
|
| Class I† |
|
|
Since Inception | -5.90 | % | Since Inception | -5.70 | % | |
‡Inception date August 13, 2018 |
| |||||
†Inception date August 13, 2018 |
| |||||
For the period from August 13, 2018 to December 31, 2018, JNL/American Funds Capital Income Builder Fund outperformed its primary benchmark by posting a return of -5.90% for Class A shares compared to -11.04% for the MSCI All Country World Index (Net). The Fund outperformed its secondary benchmark which posted a return of -7.80% for the 70% MSCI All Country World Index NR USD, 30% Bloomberg Barclays US Aggregate Bond Index.
The Fund seeks both to provide a level of current income that exceeds the average yield on U.S. stocks generally and to provide a growing stream of income over the years by investing through exclusive investment in the Class 1 shares of the American Funds Insurance Series® - Capital Income Builder FundSM (“Master Fund”). The performance of the Fund is directly related to the performance of the Master Fund. The financial statements of the Master Fund, including the Schedule of Investments and portfolio manager commentary, are provided separately and should be read in conjunction with the Fund’s financial statements.
JNL/American Funds Global Bond Fund
Composition as of December 31, 2018: | ||
Global Fixed Income | 100.0 | % |
Total Investments | 100.0 | % |
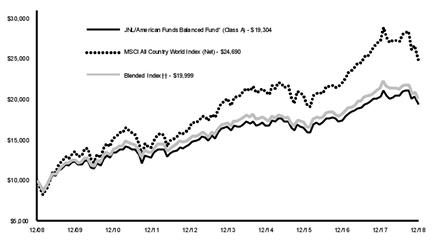
For the year ended December 31, 2018, JNL/American Funds Global Bond Fund underperformed its benchmark by posting a return of -1.62% for Class A shares compared to -1.20% for the Bloomberg Barclays Global Aggregate Index.
The Fund seeks, over the long term, a high level of total return consistent with prudent investment management through exclusive investment in the Class 1 shares of the American Funds Insurance Series® – Global Bond FundSM (“Master Fund”). The performance of the Fund is directly related to the performance of the Master Fund. The financial statements of the Master Fund, including the Schedule of Investments and portfolio manager commentary, are provided separately and should be read in conjunction with the Fund’s financial statements.
JNL/American Funds Global Small Capitalization Fund
Composition as of December 31, 2018: | ||
Global Equity | 100.0 | % |
Total Investments | 100.0 | % |
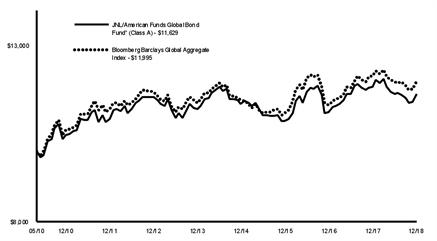
For the year ended December 31, 2018, the JNL/American Funds Global Small Capitalization Fund outperformed its benchmark by posting a return of -10.77% for Class A shares compared to -14.39% for the MSCI All Country World Small Cap Index (Net).
The Fund seeks growth of capital over time through exclusive investment in the Class 1 shares of the American Funds Insurance Series® – Global Small Capitalization FundSM (“Master Fund”). The performance of the Fund is directly related to the performance of the Master Fund. The financial statements of the Master Fund, including the Schedule of Investments and portfolio manager commentary, are provided separately and should be read in conjunction with the Fund’s financial statements.
JNL/American Funds Growth-Income Fund
Composition as of December 31, 2018: | ||
Domestic Equity | 100.0 | % |
Total Investments | 100.0 | % |
For the year ended December 31, 2018, JNL/American Funds Growth-Income Fund outperformed its benchmark by posting a return of -2.16% for Class A shares compared to -4.38% for the S&P 500 Index.
The Fund seeks long term growth of capital and income through exclusive investment in the Class 1 shares of the American Funds Insurance Series® – Growth Income FundSM (“Master Fund”). The performance of the Fund is directly related to the performance of the Master Fund. The financial statements of the Master Fund, including the Schedule of Investments and portfolio manager commentary, are provided separately and should be read in conjunction with the Fund’s financial statements.
JNL/American Funds International Fund
Composition as of December 31, 2018: | ||
International Equity | 100.0 | % |
Total Investments | 100.0 | % |
For the year ended December 31, 2018, JNL/American Funds International Fund outperformed its benchmark by posting a return of -13.53% for Class A shares compared to -14.20% for the MSCI All Country World ex USA Index (Net).
The Fund seeks long term growth of capital through exclusive investment in the Class 1 shares of the American Funds Insurance Series® – International FundSM (“Master Fund”). The performance of the Fund is directly related to the performance of the Master Fund. The financial statements of the
3
| JNL/American Funds Master Feeder Funds Capital Research and Management Company (Unaudited) |

Master Fund, including the Schedule of Investments and portfolio manager commentary, are provided separately and should be read in conjunction with the Fund’s financial statements.
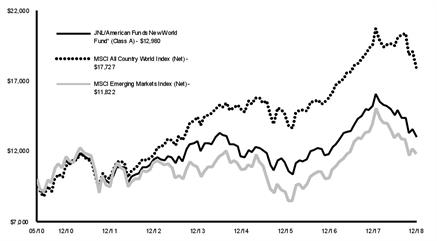
JNL/American Funds New World Fund
Composition as of December 31, 2018: | ||
Emerging Markets Equity | 100.0 | % |
Total Investments | 100.0 | % |
For the year ended December 31, 2018, JNL/American Funds New World Fund underperformed one of its benchmarks by posting a return of -14.41% for Class A shares compared to -9.42% for the MSCI All Country World Index and outperformed its other benchmark, the MSCI Emerging Markets Index (Net), which returned -14.58%.
The Fund seeks long term capital appreciation through exclusive investment in the Class 1 shares of the American Funds Insurance Series® – New World FundSM (“Master Fund”). The performance of the Fund is directly related to the performance of the Master Fund. The financial statements of the Master Fund, including the Schedule of Investments and portfolio manager commentary, are provided separately and should be read in conjunction with the Fund’s financial statements.
4
| JNL/American Funds Master Feeder Funds Capital Research and Management Company (Unaudited) |

JNL/American Funds Balanced Fund
††65% MSCI All Country World Index (Net), 35% Bloomberg Barclays Global Aggregate Bond Index
Average Annual Total Returns* |
| |||||
Class A |
|
|
| Class I |
|
|
1 Year | -4.89 | % | 1 Year | -4.56 | % | |
5 Year | 3.05 |
|
| 5 Year | 3.29 |
|
10 Year | 6.80 |
|
| 10 Year | 7.04 |
|
*The Fund's investment adviser waived/reimbursed certain expenses of the Fund. Performance results shown reflect the waiver, without which performance results would have been lower. |
| |||||
The graph shows the change in value of an assumed $10,000 investment in the Fund's Class A shares over 10 years, or since inception if the inception is less than 10 years, as well as the Fund's benchmark(s) performance for the same period.
Past performance is not predictive of future performance. Investment return and principal value will fluctuate so that an investor’s shares, when redeemed, may be worth more or less than their original cost. Performance numbers are net of all Fund operating expenses, but do not reflect the deduction of insurance charges.
JNL/American Funds Blue Chip Income and Growth Fund

Average Annual Total Returns* |
| |||||
Class A‡ |
|
|
| Class I† |
|
|
1 Year | -9.00 | % | 1 Year | -8.72 | % | |
5 Year | 6.90 |
|
| 5 Year | 7.16 |
|
Since Inception | 9.25 |
|
| Since Inception | 9.49 |
|
‡Inception date May 03, 2010 |
| |||||
†Inception date May 03, 2010 |
| |||||
*The Fund's investment adviser waived/reimbursed certain expenses of the Fund. Performance results shown reflect the waiver, without which performance results would have been lower. |
| |||||
The graph shows the change in value of an assumed $10,000 investment in the Fund's Class A shares over 10 years, or since inception if the inception is less than 10 years, as well as the Fund's benchmark(s) performance for the same period.
Past performance is not predictive of future performance. Investment return and principal value will fluctuate so that an investor’s shares, when redeemed, may be worth more or less than their original cost. Performance numbers are net of all Fund operating expenses, but do not reflect the deduction of insurance charges.
JNL/American Funds Global Bond Fund
Average Annual Total Returns* |
| |||||
Class A‡ |
|
|
| Class I† |
|
|
1 Year | -1.62 | % | 1 Year | -1.39 | % | |
5 Year | 0.77 |
|
| 5 Year | 0.99 |
|
Since Inception | 1.76 |
|
| Since Inception | 2.00 |
|
‡Inception date May 03, 2010 |
| |||||
†Inception date May 03, 2010 |
| |||||
*The Fund's investment adviser waived/reimbursed certain expenses of the Fund. Performance results shown reflect the waiver, without which performance results would have been lower. |
| |||||
The graph shows the change in value of an assumed $10,000 investment in the Fund's Class A shares over 10 years, or since inception if the inception is less than 10 years, as well as the Fund's benchmark(s) performance for the same period.
Past performance is not predictive of future performance. Investment return and principal value will fluctuate so that an investor’s shares, when redeemed, may be worth more or less than their original cost. Performance numbers are net of all Fund operating expenses, but do not reflect the deduction of insurance charges.
5
| JNL/American Funds Master Feeder Funds Capital Research and Management Company (Unaudited) |

JNL/American Funds Global Small Capitalization Fund
Average Annual Total Returns* |
| |||||
Class A‡ |
|
|
| Class I† |
|
|
1 Year | -10.77 | % | 1 Year | -10.48 | % | |
5 Year | 3.01 |
|
| 5 Year | 3.26 |
|
Since Inception | 5.35 |
|
| Since Inception | 5.59 |
|
‡Inception date May 03, 2010 |
| |||||
†Inception date May 03, 2010 |
| |||||
*The Fund's investment adviser waived/reimbursed certain expenses of the Fund. Performance results shown reflect the waiver, without which performance results would have been lower. |
| |||||
The graph shows the change in value of an assumed $10,000 investment in the Fund's Class A shares over 10 years, or since inception if the inception is less than 10 years, as well as the Fund's benchmark(s) performance for the same period.
Past performance is not predictive of future performance. Investment return and principal value will fluctuate so that an investor’s shares, when redeemed, may be worth more or less than their original cost. Performance numbers are net of all Fund operating expenses, but do not reflect the deduction of insurance charges.
JNL/American Funds Growth-Income Fund

Average Annual Total Returns* |
| |||||
Class A‡ |
|
|
| Class I† |
|
|
1 Year | -2.16 | % | 1 Year | -1.87 | % | |
5 Year | 8.07 |
|
| 5 Year | 8.33 |
|
Since Inception | 10.31 |
|
| Since Inception | 10.54 |
|
‡Inception date May 03, 2010 |
| |||||
†Inception date May 03, 2010 |
| |||||
*The Fund's investment adviser waived/reimbursed certain expenses of the Fund. Performance results shown reflect the waiver, without which performance results would have been lower. |
| |||||
The graph shows the change in value of an assumed $10,000 investment in the Fund's Class A shares over 10 years, or since inception if the inception is less than 10 years, as well as the Fund's benchmark(s) performance for the same period.
Past performance is not predictive of future performance. Investment return and principal value will fluctuate so that an investor’s shares, when redeemed, may be worth more or less than their original cost. Performance numbers are net of all Fund operating expenses, but do not reflect the deduction of insurance charges.
JNL/American Funds International Fund

Average Annual Total Returns* |
| |||||
Class A‡ |
|
|
| Class I† |
|
|
1 Year | -13.53 | % | 1 Year | -13.22 | % | |
5 Year | 1.60 |
|
| 5 Year | 1.84 |
|
Since Inception | 4.22 |
|
| Since Inception | 4.46 |
|
‡Inception date May 03, 2010 |
| |||||
†Inception date May 03, 2010 |
| |||||
*The Fund's investment adviser waived/reimbursed certain expenses of the Fund. Performance results shown reflect the waiver, without which performance results would have been lower. |
| |||||
The graph shows the change in value of an assumed $10,000 investment in the Fund's Class A shares over 10 years, or since inception if the inception is less than 10 years, as well as the Fund's benchmark(s) performance for the same period.
Past performance is not predictive of future performance. Investment return and principal value will fluctuate so that an investor’s shares, when redeemed, may be worth more or less than their original cost. Performance numbers are net of all Fund operating expenses, but do not reflect the deduction of insurance charges.
6
| JNL/American Funds Master Feeder Funds Capital Research and Management Company (Unaudited) |

JNL/American Funds New World Fund
Average Annual Total Returns* |
| |||||
Class A‡ |
|
|
| Class I† |
|
|
1 Year | -14.41 | % | 1 Year | -14.10 | % | |
5 Year | 0.48 |
|
| 5 Year | 0.74 |
|
Since Inception | 3.06 |
|
| Since Inception | 3.30 |
|
‡Inception date May 03, 2010 |
| |||||
†Inception date May 03, 2010 |
| |||||
*The Fund's investment adviser waived/reimbursed certain expenses of the Fund. Performance results shown reflect the waiver, without which performance results would have been lower. |
| |||||
The graph shows the change in value of an assumed $10,000 investment in the Fund's Class A shares over 10 years, or since inception if the inception is less than 10 years, as well as the Fund's benchmark(s) performance for the same period.
Past performance is not predictive of future performance. Investment return and principal value will fluctuate so that an investor’s shares, when redeemed, may be worth more or less than their original cost. Performance numbers are net of all Fund operating expenses, but do not reflect the deduction of insurance charges.
7
| JNL/Vanguard Master Feeder Funds Jackson National Asset Management, LLC (Unaudited) |

JNL/Vanguard Capital Growth Fund
Composition as of December 31, 2018: | ||
Domestic Equity | 100.0 | % |
Total Investments | 100.0 | % |
For the year ended December 31, 2018, JNL/Vanguard Capital Growth Fund outperformed its primary benchmark by posting a return of -1.76% for Class A shares compared to -4.38% for the S&P 500 Index.
The Fund seeks long-term capital appreciation through exclusive investment in the shares of the Vanguard Variable Insurance Fund - Capital Growth Portfolio (“Master Fund”). The performance of the Fund is directly related to the performance of the Master Fund. The financial statements of the Master Fund, including the Schedule of Investments and portfolio manager commentary, are provided separately and should be read in conjunction with the Fund’s financial statements.
JNL/Vanguard Equity Income Fund
Composition as of December 31, 2018: | ||
Domestic Equity | 100.0 | % |
Total Investments | 100.0 | % |
For the year ended December 31, 2018, JNL/Vanguard Equity Income Fund underperformed its primary benchmark by posting a return of -6.47% for Class A shares compared to -2.32% for the MSCI USA High Dividend Yield Index (Gross).
The Fund seeks to provide an above average level of current income and reasonable long term capital appreciation through exclusive investment in the shares of the Vanguard Variable Insurance Fund - Equity Income Portfolio (“Master Fund”). The performance of the Fund is directly related to the performance of the Master Fund. The financial statements of the Master Fund, including the Schedule of Investments and portfolio manager commentary, are provided separately and should be read in conjunction with the Fund’s financial statements.
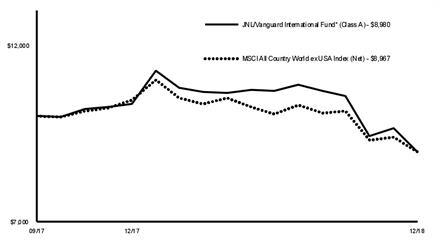
JNL/Vanguard International Fund
Composition as of December 31, 2018: | ||
International Equity | 100.0 | % |
Total Investments | 100.0 | % |
For the year ended December 31, 2018, JNL/Vanguard International Fund outperformed its primary benchmark by posting a return of -13.15% for Class A shares compared to -14.20% for the MSCI All Country World ex USA Index (Net).
The Fund seeks to provide long-term capital appreciation through exclusive investment in the shares of the Vanguard Variable Insurance Fund - International Portfolio (“Master Fund”). The performance of the Fund is directly related to the performance of the Master Fund. The financial statements of the Master Fund, including the Schedule of Investments and portfolio manager commentary, are provided separately and should be read in conjunction with the Fund’s financial statements.
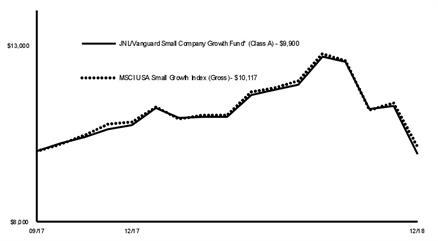
JNL/Vanguard Small Company Growth Fund
Composition as of December 31, 2018: | ||
Domestic Equity | 100.0 | % |
Total Investments | 100.0 | % |
For the year ended December 31, 2018, JNL/Vanguard Small Company Growth Fund underperformed its primary benchmark by posting a return of -7.82% for Class A shares compared to -6.58% for the MSCI USA Small Growth Index (Gross).
The Fund seeks to provide long-term capital appreciation through exclusive investment in the shares of the Vanguard Variable Insurance Fund - Small Company Growth Portfolio (“Master Fund”). The performance of the Fund is directly related to the performance of the Master Fund. The financial statements of the Master Fund, including the Schedule of Investments and portfolio manager commentary, are provided separately and should be read in conjunction with the Fund’s financial statements.
8
| JNL/Vanguard Master Feeder Funds Jackson National Asset Management, LLC (Unaudited) |

JNL/Vanguard Capital Growth Fund

Average Annual Total Returns* |
| |||||
Class A‡ |
|
|
| Class I† |
|
|
1 Year | -1.76 | % | 1 Year | -1.48 | % | |
Since Inception | 4.78 |
|
| Since Inception | 5.17 |
|
‡Inception date September 25, 2017 |
| |||||
†Inception date September 25, 2017 |
| |||||
*The Fund's investment adviser waived/reimbursed certain expenses of the Fund. Performance results shown reflect the waiver, without which performance results would have been lower. |
| |||||
The graph shows the change in value of an assumed $10,000 investment in the Fund's Class A shares over 10 years, or since inception if the inception is less than 10 years, as well as the Fund's benchmark(s) performance for the same period.
Past performance is not predictive of future performance. Investment return and principal value will fluctuate so that an investor’s shares, when redeemed, may be worth more or less than their original cost. Performance numbers are net of all Fund operating expenses, but do not reflect the deduction of insurance charges.
JNL/Vanguard Equity Income Fund

Average Annual Total Returns* |
| |||||
Class A‡ |
|
|
| Class I† |
|
|
1 Year | -6.47 | % | 1 Year | -6.17 | % | |
Since Inception | -0.16 |
|
| Since Inception | 0.24 |
|
‡Inception date September 25, 2017 |
| |||||
†Inception date September 25, 2017 |
| |||||
*The Fund's investment adviser waived/reimbursed certain expenses of the Fund. Performance results shown reflect the waiver, without which performance results would have been lower. |
| |||||
The graph shows the change in value of an assumed $10,000 investment in the Fund's Class A shares over 10 years, or since inception if the inception is less than 10 years, as well as the Fund's benchmark(s) performance for the same period.
Past performance is not predictive of future performance. Investment return and principal value will fluctuate so that an investor’s shares, when redeemed, may be worth more or less than their original cost. Performance numbers are net of all Fund operating expenses, but do not reflect the deduction of insurance charges.
JNL/Vanguard International Fund
Average Annual Total Returns* |
| |||||
Class A‡ |
|
|
| Class I† |
|
|
1 Year | -13.15 | % | 1 Year | -12.86 | % | |
Since Inception | -8.13 |
|
| Since Inception | -7.89 |
|
‡Inception date September 25, 2017 |
| |||||
†Inception date September 25, 2017 |
| |||||
*The Fund's investment adviser waived/reimbursed certain expenses of the Fund. Performance results shown reflect the waiver, without which performance results would have been lower. |
| |||||
The graph shows the change in value of an assumed $10,000 investment in the Fund's Class A shares over 10 years, or since inception if the inception is less than 10 years, as well as the Fund's benchmark(s) performance for the same period.
Past performance is not predictive of future performance. Investment return and principal value will fluctuate so that an investor’s shares, when redeemed, may be worth more or less than their original cost. Performance numbers are net of all Fund operating expenses, but do not reflect the deduction of insurance charges.
9
| JNL/Vanguard Master Feeder Funds Jackson National Asset Management, LLC (Unaudited) |

JNL/Vanguard Small Company Growth Fund
Average Annual Total Returns* |
| |||||
Class A‡ |
|
|
| Class I† |
|
|
1 Year | -7.82 | % | 1 Year | -7.53 | % | |
Since Inception | -0.79 |
|
| Since Inception | -0.47 |
|
‡Inception date September 25, 2017 |
| |||||
†Inception date September 25, 2017 |
| |||||
*The Fund's investment adviser waived/reimbursed certain expenses of the Fund. Performance results shown reflect the waiver, without which performance results would have been lower. |
| |||||
The graph shows the change in value of an assumed $10,000 investment in the Fund's Class A shares over 10 years, or since inception if the inception is less than 10 years, as well as the Fund's benchmark(s) performance for the same period.
Past performance is not predictive of future performance. Investment return and principal value will fluctuate so that an investor’s shares, when redeemed, may be worth more or less than their original cost. Performance numbers are net of all Fund operating expenses, but do not reflect the deduction of insurance charges.
10
| JNL Alt Funds Jackson National Asset Management, LLC (Unaudited) |

The JNL Institutional Alt 25 Fund and JNL Institutional Alt 50 Fund (collectively “JNL Alt Funds”). Each Fund seeks to achieve its objective by investing in Class I shares of a diversified group of affiliated Underlying Funds (“Underlying Funds”). Each JNL Alt Fund has a target percentage allocation among the Underlying Funds that are categorized as investing in traditional asset classes and non-traditional asset classes. The Schedules of Investments and Financial Statements for the Underlying Funds are available at www.jackson.com or on the SEC’s website at www.sec.gov.
JNL Institutional Alt 25 Fund
Composition as of December 31, 2018: | ||
Domestic Equity | 26.3 | % |
Alternative | 25.1 | |
Domestic Fixed Income | 17.9 | |
International Equity | 13.9 | |
Emerging Markets Equity | 5.6 | |
Global Equity | 5.6 | |
International Fixed Income | 3.1 | |
Global Fixed Income | 2.5 | |
Total Investments | 100.0 | % |
For the year ended December 31, 2018, JNL Institutional Alt 25 Fund underperformed its primary benchmark by posting a return of -6.97% for Class A shares compared to -5.21% for the Dow Jones Moderate Index. The Fund underperformed its blended benchmark return of -5.66% for the 25% Wilshire Liquid Alternative Index, 50% MSCI All Country World Index (Net) and 25% Bloomberg Barclays U.S. Aggregate Bond Index.
The investment objective of the Fund is long term growth of capital and income through investment in other Funds.
The Fund allocates approximately 75% of its assets to the traditional investment categories creating a “core” component of its portfolio. The Fund then allocates approximately 25% of its assets to non-traditional investment categories creating an “alt” component of its portfolio. The Fund considers the Alternative Assets, Alternative Strategies and Risk Management investment categories to be non-traditional and all others to be traditional. Among the traditional investment categories, the Fund typically allocates approximately 5% to 45% of its assets in Underlying Funds investing in fixed income securities and 30% to 70% of its assets in Underlying Funds investing in equity securities.
The Fund underperformed its blended benchmark due to weak relative returns in the alternatives and equity sleeves plus a slight underweight allocation to fixed income. In the alternatives sleeve, strategies with higher equity net exposure, such as JNL/AQR Large Cap Relaxed Constraint Equity Fund (-13.10%) and JNL/Boston Partners Global Long Short Equity Fund (-9.22%) detracted significantly. Commodities failed to gain traction during the year due in part to a strong U.S. Dollar, leading to poor returns from JNL/Neuberger Berman Risk Balanced Commodity Strategy Fund (-10.22%). Allocations to infrastructure and real estate also failed to beat the alternatives benchmark.
JNL/Harris Oakmark Global Equity Fund (-20.97%) and JNL/Causeway International Value Select Fund (-17.26%), two value oriented managers, detracted most from results among international stocks. JNL/Oppenheimer Emerging Markets Innovator Fund (-22.25%) and JNL/Lazard Emerging Markets Fund (-18.13%) also lagged as emerging markets suffered in 2018. Underperformance by small and mid-cap strategies in the U.S. was partially offset by manager selection in those areas and JNL/T. Rowe Price Established Growth Fund (-1.13%). In the fixed income sleeve, positive manager selection helped offset some of the relative weakness from an underweight position and weakness from the credit and emerging markets sectors.
JNL Institutional Alt 50 Fund
Composition as of December 31, 2018: | ||
Alternative | 50.2 | % |
Domestic Equity | 15.8 | |
Domestic Fixed Income | 14.0 | |
International Equity | 8.7 | |
Emerging Markets Equity | 3.6 | |
Global Equity | 3.4 | |
International Fixed Income | 2.3 | |
Global Fixed Income | 2.0 | |
Total Investments | 100.0 | % |
For the year ended December 31, 2018, JNL Institutional Alt 50 Fund underperformed its primary benchmark by posting a return of -6.19% for Class A shares compared to -5.21% for the Dow Jones Moderate Index. The Fund underperformed its blended benchmark return of -4.86% for the 50% Wilshire Liquid Alternative Index, 30% MSCI All Country World Index (Net), 20% Bloomberg Barclays U.S. Aggregate Bond Index.
The investment objective of the Fund is long term growth of capital and income through investment in other Funds.
The Fund allocates approximately 50% of its assets to the traditional investment categories creating a “core” component of its portfolio. The Fund then allocates approximately 50% of its assets to non-traditional investment categories creating an “alt” component of its portfolio. The Adviser considers the Alternative Assets, Alternative Strategies and Risk Management investment categories to be non-traditional and all others to be traditional. Among the traditional investment categories, the Fund typically allocates approximately 0% to 40% of its assets in Underlying Funds investing in fixed-income securities and 10% to 50% of its assets in Underlying Funds investing in equity securities.
The Fund underperformed its blended benchmark due to weak relative returns in the alternatives and equity sleeves plus a slight underweight allocation to fixed income. In the alternatives sleeve, strategies with higher equity net exposure, such as JNL/AQR Large Cap Relaxed Constraint Equity Fund (-13.10%) and JNL/Boston Partners Global Long Short Equity Fund (-9.22%) detracted significantly. Commodities failed to gain traction during the year due in part to a strong U.S. Dollar, leading to poor returns from JNL/Neuberger Berman Risk Balanced Commodity Strategy Fund (-10.22%). Allocations to infrastructure and real estate also failed to beat the alternatives benchmark.
JNL/Harris Oakmark Global Equity Fund (-20.97%) and JNL/Causeway International Value Select Fund (-17.26%), two value oriented managers, detracted most from results among international stocks. JNL/Oppenheimer Emerging Markets Innovator Fund (-22.25%) and JNL/Lazard Emerging Markets Fund (-18.13%) also lagged as emerging markets suffered in 2018. Underperformance by small and mid-cap strategies in the U.S. was partially offset by manager selection in those areas and JNL/T. Rowe Price Established Growth Fund (-1.13%). In the fixed income sleeve, positive manager selection helped offset some of the relative weakness from an underweight position and weakness from the credit and emerging markets sectors.
11
| JNL Alt Funds Jackson National Asset Management, LLC (Unaudited) |

JNL Institutional Alt 25 Fund
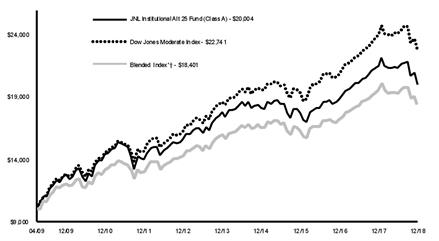
†25% Wilshire Liquid Alternative Index, 50% MSCI All Country World Index (Net) and 25% Bloomberg Barclays U.S. Aggregate Bond Index
Average Annual Total Returns |
| |||||
Class A‡ |
|
|
| Class I† |
|
|
1 Year | -6.97 | % | 1 Year | -6.62 | % | |
5 Year | 2.42 |
|
| 5 Year | N/A |
|
Since Inception | 7.38 |
|
| Since Inception | -2.54 |
|
‡Inception date April 06, 2009 |
| |||||
†Inception date September 25, 2017 |
| |||||
The graph shows the change in value of an assumed $10,000 investment in the Fund's Class A shares over 10 years, or since inception if the inception is less than 10 years, as well as the Fund's benchmark(s) performance for the same period.
Past performance is not predictive of future performance. Investment return and principal value will fluctuate so that an investor’s shares, when redeemed, may be worth more or less than their original cost. Performance numbers are net of all Fund operating expenses, but do not reflect the deduction of insurance charges.
JNL Institutional Alt 50 Fund
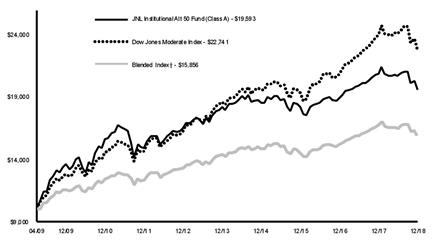
†50% Wilshire Liquid Alternative Index, 30% MSCI All Country World Index (Net) and 20% Bloomberg Barclays U.S. Aggregate Bond Index
Average Annual Total Returns |
| |||||
Class A‡ |
|
|
| Class I† |
|
|
1 Year | -6.19 | % | 1 Year | -5.95 | % | |
5 Year | 1.49 |
|
| 5 Year | N/A |
|
Since Inception | 7.15 |
|
| Since Inception | -2.38 |
|
‡Inception date April 06, 2009 |
| |||||
†Inception date September 25, 2017 |
| |||||
The graph shows the change in value of an assumed $10,000 investment in the Fund's Class A shares over 10 years, or since inception if the inception is less than 10 years, as well as the Fund's benchmark(s) performance for the same period.
Past performance is not predictive of future performance. Investment return and principal value will fluctuate so that an investor’s shares, when redeemed, may be worth more or less than their original cost. Performance numbers are net of all Fund operating expenses, but do not reflect the deduction of insurance charges.
12
| JNL/American Funds Funds of Funds Jackson National Asset Management, LLC (Unaudited) |

Each Fund seeks to achieve its objective by investing in shares of a diversified group of other Underlying Funds (“Underlying Funds”). The Underlying Funds in which each Fund may invest are a separate series of American Funds Insurance Series® or the American Funds R6 mutual fund share class. The Schedules of Investments and Financial Statements for the Underlying Funds are available on the SEC’s website at www.sec.gov.
JNL/American Funds Moderate Growth Allocation Fund
Composition as of December 31, 2018: | ||
Domestic Fixed Income | 37.1 | % |
Domestic Equity | 29.9 | |
Global Equity | 19.1 | |
International Equity | 5.1 | |
International Fixed Income | 4.8 | |
Emerging Markets Equity | 4.0 | |
Total Investments | 100.0 | % |
For the year ended December 31, 2018, JNL/American Funds Moderate Growth Allocation Fund outperformed its primary benchmark by posting a return of -4.57% for Class A shares compared to -5.21% for the Dow Jones Moderate Index. The Fund outperformed its blended benchmark return of -5.52% for the 60% MSCI All Country World Index (Net) and 40% Bloomberg Barclays U.S. Aggregate Bond Index.
The investment objective of the Fund is to seek a balance between current income and growth of capital.
Under normal circumstances, the Fund allocates approximately 40% to 80% of its assets to Underlying Funds that invest primarily in equity securities and 20% to 60% of its assets to Underlying Funds that invest primarily fixed-income securities. The equity and fixed-income allocation may fall outside of the above limits in a volatile market environment where investment outcomes are expected to remain beyond normal range.
The Fund outperformed its blended benchmark in 2018 thanks to significant outperformance from the equity sleeve. Equity returns were driven by their growth bias, both in the U.S. and internationally, as more than a third of the Fund’s equity exposure came from American Funds Insurance Series Growth Fund (-0.01%) and American Funds Insurance Series Growth - Income Fund (-1.55%) which both bested global equities by a wide margin. Strategy outperformance helped offset some of the weakness from international equity exposure as American Funds Insurance Series International Fund (-12.94%) was the worst absolute performer but did outperform MSCI ACWI Ex-US Index.
The fixed income sleeve performed slightly behind the benchmark, mainly due to an allocation to emerging markets bonds through the American Funds Emerging Markets Bond Fund (-5.88%). A core position in American Funds Bond Fund of America (0.22%) helped offset the emerging markets weakness. A new position in American Funds Intermediate Bond Fund of America (1.96%) was a positive addition as well.
JNL/American Funds Growth Allocation Fund
Composition as of December 31, 2018: | ||
Domestic Equity | 38.3 | % |
Global Equity | 29.0 | |
Domestic Fixed Income | 18.2 | |
Emerging Markets Equity | 6.1 | |
International Equity | 6.0 | |
International Fixed Income | 2.4 | |
Total Investments | 100.0 | % |
For the year ended December 31, 2018, JNL/American Funds Growth Allocation Fund outperformed its primary benchmark by posting a return of -5.39% for Class A shares compared to -7.33% for the Dow Jones Moderately Aggressive Index. The Fund outperformed its blended benchmark return of -7.45% for the 80% MSCI All Country World Index (Net) and 20% Bloomberg Barclays Capital U.S. Aggregate Bond Index.
The investment objective of the Fund is to seek capital growth with secondary emphasis on current income.
Under normal circumstances, the Fund allocates approximately 60% to 100% of its assets to Underlying Funds that invest primarily in equity securities and 0% to 40% of its assets to Underlying Funds that invest primarily fixed-income securities, and 0% to 20% of its assets to Underlying Funds that invest primarily in money market securities. The equity and fixed-income allocation may fall outside of the above limits in a volatile market environment where investment outcomes are expected to remain beyond normal range.
The Fund outperformed its blended benchmark in 2018 thanks to significant outperformance from the equity sleeve. Equity returns were driven by its growth bias, both in the U.S. and internationally, as more than a third of the Fund’s equity exposure came from American Funds Insurance Series Growth Fund (-0.01%) and American Funds Insurance Series Growth – Income Fund (-1.55%) which both bested global equities by a wide margin. Strategy outperformance helped offset some of the weakness from international equity exposure as American Funds Insurance Series International Fund (-12.94%) was the worst absolute performer but did outperform MSCI ACWI Ex-US benchmark.
The fixed income sleeve slightly outperformed its benchmark as a new position in American Funds Intermediate Bond Fund of America (1.96%) helped to offset weakness in emerging market debt that weighed on returns through the addition of American Funds Emerging Markets Bond Fund (-5.88%). A core position in American Funds Bond Fund of America (0.22%) outperformed the broader bond market to aid relative returns as well.
13
| JNL/American Funds Funds of Funds Jackson National Asset Management, LLC (Unaudited) |

JNL/American Funds Moderate Growth Allocation Fund

†60% MSCI All Country World Index (Net), 40% Bloomberg Barclays U.S. Aggregate Bond Index
Average Annual Total Returns |
| |||||
Class A‡ |
|
|
| Class I† |
|
|
1 Year | -4.57 | % | 1 Year | -4.29 | % | |
5 Year | 4.29 |
|
| 5 Year | N/A |
|
Since Inception | 6.07 |
|
| Since Inception | -0.77 |
|
‡Inception date April 30, 2012 |
| |||||
†Inception date September 25, 2017 |
| |||||
The graph shows the change in value of an assumed $10,000 investment in the Fund's Class A shares over 10 years, or since inception if the inception is less than 10 years, as well as the Fund's benchmark(s) performance for the same period.
Past performance is not predictive of future performance. Investment return and principal value will fluctuate so that an investor’s shares, when redeemed, may be worth more or less than their original cost. Performance numbers are net of all Fund operating expenses, but do not reflect the deduction of insurance charges.
JNL/American Funds Growth Allocation Fund
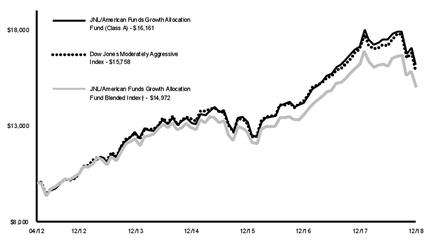
†80% MSCI All Country World Index (Net), 20% Bloomberg Barclays U.S. Aggregate Bond Index
Average Annual Total Returns |
| |||||
Class A‡ |
|
|
| Class I† |
|
|
1 Year | -5.39 | % | 1 Year | -5.08 | % | |
5 Year | 5.07 |
|
| 5 Year | N/A |
|
Since Inception | 7.46 |
|
| Since Inception | -0.56 |
|
‡Inception date April 30, 2012 |
| |||||
†Inception date September 25, 2017 |
| |||||
The graph shows the change in value of an assumed $10,000 investment in the Fund's Class A shares over 10 years, or since inception if the inception is less than 10 years, as well as the Fund's benchmark(s) performance for the same period.
Past performance is not predictive of future performance. Investment return and principal value will fluctuate so that an investor’s shares, when redeemed, may be worth more or less than their original cost. Performance numbers are net of all Fund operating expenses, but do not reflect the deduction of insurance charges.
14
| JNL/DFA Funds Jackson National Asset Management, LLC (Unaudited) |

Each Fund seeks to achieve its objective by investing in shares of a diversified group of other Underlying Funds (“Underlying Funds”). The Underlying Funds in which each Fund may invest are a separate series of Dimensional Fund Advisors (“DFA”) Investment Dimensions Group Inc. and Dimensional Investment Group Inc. (collectively, “DFA Fund Groups”). The Schedules of Investments and Financial Statements for the Underlying Funds are available on the SEC’s website at www.sec.gov.
JNL/DFA Growth Allocation Fund
Composition as of December 31, 2018: | ||
Domestic Equity | 42.5 | % |
International Equity | 27.7 | |
Domestic Fixed Income | 17.8 | |
Emerging Markets Equity | 8.0 | |
Alternative | 4.0 | |
Total Investments | 100.0 | % |
For the year ended December 31, 2018, JNL/DFA Growth Allocation Fund underperformed its primary benchmark by posting a return of -10.65% for Class A shares compared to -7.33% for the Dow Jones Moderately Aggressive Index. The Fund underperformed its blended benchmark of -7.45% for the 80% MSCI All Country World Index (Net), 20% Bloomberg Barclays U.S. Aggregate Bond Index.
The investment objective of the Fund is to seek total return consisting of capital appreciation and current income.
To achieve its investment objective, the Fund under normal market circumstances, allocates its assets to Underlying Funds that invest in equity and fixed income securities. Generally, the Fund invests its assets in domestic and international equity Underlying Funds and fixed income Underlying Funds to achieve an allocation of approximately 60% to 100% (with a target allocation of approximately 80%) of the Fund’s assets to domestic and international equity Underlying Funds and 0% to 40% (with a target allocation of approximately 20%) of its assets to fixed-income Underlying Funds. The equity and fixed-income allocation may fall outside of the above limits in a volatile market environment where investment outcomes are expected to remain beyond normal range.
The Fund underperformed its blended benchmark owing to its bias towards smaller companies and value within the equity sleeve, plus an underweight allocation to the fixed income. Within international equities, DFA International Small Cap Value Portfolio (-23.31%) and a large position in DFA International Core Equity Portfolio (-17.40%) were the top detractors, while a value bias served as a minor tailwind in emerging markets leading to the relative outperformance of DFA Emerging Markets Portfolio (-13.62%). In the U.S., a core position in DFA U.S. Large Company Portfolio (-4.43%) provided ballast but was offset by weakness from DFA U.S. Targeted Value Portfolio (-15.78%), DFA U.S. Large Cap Value Portfolio (-11.65%), and DFA U.S. Small Cap Fund (-13.37%).
A fixed income bias toward short term and higher quality bonds helped offset weakness elsewhere as the sleeve slightly outperformed the broader bond market. DFA Short-Term Extended Quality Portfolio (1.34%) and DFA Short-Duration Real Return Portfolio (0.11%) were the sleeve’s top performers.
JNL/DFA Moderate Growth Allocation Fund
Composition as of December 31, 2018: | ||
Domestic Fixed Income | 38.5 | % |
Domestic Equity | 33.0 | |
International Equity | 19.5 | |
Emerging Markets Equity | 6.1 | |
Alternative | 2.9 | |
Total Investments | 100.0 | % |
For the year ended December 31, 2018, JNL/DFA Moderate Growth Allocation Fund underperformed its primary benchmark by posting a return of -7.93% for Class A shares compared to -5.21% for the Dow Jones Moderate Index. The Fund underperformed its blended benchmark return of -5.52% for the 60% MSCI All Country World Index (Net), 40% Bloomberg Barclays U.S. Aggregate Bond Index.
The investment objective of the Fund is to seek total return consisting of capital appreciation and current income.
To achieve its investment objective, the Fund under normal market circumstances, allocates its assets to Underlying Funds that invest in equity and fixed-income securities. Generally, the Fund invests its assets in domestic and international equity Underlying Funds and fixed income Underlying Funds to achieve an allocation of approximately 40% to 80% (with a target allocation of approximately 60%) of the Fund’s assets to domestic and international equity Underlying Funds and 20% to 60% (with a target allocation of approximately 40%) of its assets to fixed income Underlying Funds. The equity and fixed income allocation may fall outside of the above limits in a volatile market environment where investment outcomes are expected to remain beyond normal range.
The Fund underperformed its blended benchmark owing to its bias towards smaller companies and value within the equity sleeve, plus a slight underweight allocation to the fixed income. Within international equities, DFA International Small Cap Value Portfolio (-23.31%) and a large position in DFA International Core Equity Portfolio (-17.40%) were the top detractors, while a value bias served as a minor tailwind in emerging markets leading to the relative outperformance of DFA Emerging Markets Portfolio (-13.62%). In the U.S., a core position in DFA U.S. Large Company Portfolio (-4.43%) provided ballast but was offset by weakness from DFA U.S. Targeted Value Portfolio (-15.78%), DFA U.S. Large Cap Value Portfolio (-11.65%) and DFA U.S. Small Cap Fund (-13.37%).
A fixed income bias toward short term and higher quality bonds helped offset weakness elsewhere as the sleeve finished the year even with the broader market. DFA Short-Term Extended Quality Portfolio (1.34%) and DFA Short-Duration Real Return Portfolio (0.11%) were the sleeve’s top performers.
15
| JNL/DFA Funds Jackson National Asset Management, LLC (Unaudited) |

JNL/DFA Growth Allocation Fund
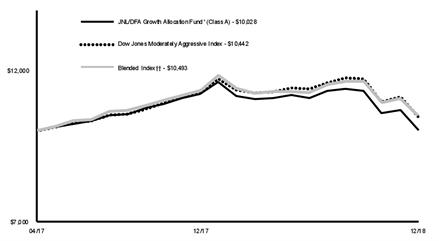
††80% MSCI All Country World Index (Net), 20% Bloomberg Barclays U.S. Aggregate Bond Index
Average Annual Total Returns* |
| |||||
Class A‡ |
|
|
| Class I† |
|
|
1 Year | -10.65 | % | 1 Year | -10.37 | % | |
Since Inception | 0.17 |
|
| Since Inception | -4.63 |
|
‡Inception date April 24, 2017 |
| |||||
†Inception date September 25, 2017 |
| |||||
*The Fund's investment adviser waived/reimbursed certain expenses of the Fund. Performance results shown reflect the waiver, without which performance results would have been lower. |
| |||||
The graph shows the change in value of an assumed $10,000 investment in the Fund's Class A shares over 10 years, or since inception if the inception is less than 10 years, as well as the Fund's benchmark(s) performance for the same period.
Past performance is not predictive of future performance. Investment return and principal value will fluctuate so that an investor’s shares, when redeemed, may be worth more or less than their original cost. Performance numbers are net of all Fund operating expenses, but do not reflect the deduction of insurance charges.
JNL/DFA Moderate Growth Allocation Fund

††60% MSCI All Country World Index (Net), 40% Bloomberg Barclays U.S. Aggregate Bond Index
Average Annual Total Returns* |
| |||||
Class A‡ |
|
|
| Class I† |
|
|
1 Year | -7.93 | % | 1 Year | -7.55 | % | |
Since Inception | 0.64 |
|
| Since Inception | -3.02 |
|
‡Inception date April 24, 2017 |
| |||||
†Inception date September 25, 2017 |
| |||||
*The Fund's investment adviser waived/reimbursed certain expenses of the Fund. Performance results shown reflect the waiver, without which performance results would have been lower. |
| |||||
The graph shows the change in value of an assumed $10,000 investment in the Fund's Class A shares over 10 years, or since inception if the inception is less than 10 years, as well as the Fund's benchmark(s) performance for the same period.
Past performance is not predictive of future performance. Investment return and principal value will fluctuate so that an investor’s shares, when redeemed, may be worth more or less than their original cost. Performance numbers are net of all Fund operating expenses, but do not reflect the deduction of insurance charges.
16
| JNL Allocation Funds Jackson National Asset Management, LLC (Unaudited) |

Each Fund seeks to achieve its investment objective by investing in shares of a diversified group of affiliated Underlying Funds (“Underlying Funds”). The Schedules of Investments and Financial Statements for the Underlying Funds are available at www.jackson.com or on the SEC’s website at www.sec.gov.
JNL Moderate Growth Allocation Fund
Composition as of December 31, 2018: | ||
Domestic Fixed Income | 26.7 | % |
Domestic Equity | 23.0 | |
International Equity | 15.6 | |
Domestic Balanced | 11.3 | |
Emerging Markets Equity | 6.6 | |
Alternative | 5.5 | |
Global Equity | 4.7 | |
International Fixed Income | 3.3 | |
Global Fixed Income | 3.3 | |
Total Investments | 100.0 | % |
For the year ended December 31, 2018, JNL Moderate Growth Allocation Fund underperformed its primary benchmark by posting a return of -6.64% for Class A shares compared to -5.21% for the Dow Jones Moderate Index. The Fund underperformed its blended benchmark of -5.52% for the 60% MSCI All Country World Index (Net), 40% Bloomberg Barclays U.S. Aggregate Bond Index.
The investment objective of the Fund is to seek capital growth and current income.
Under normal circumstances, the Fund allocates approximately 40% to 80% of its assets to Underlying Funds that invest primarily in equity securities, 20% to 60% to Underlying Funds that invest primarily in fixed-income securities and 0% to 20% of its assets to Underlying Funds that invest primarily in money market securities.
The Fund underperformed its blended benchmark mainly due to an underweight allocation to fixed income and underlying manager selection in the international equity sleeve. JNL/Harris Oakmark Global Equity Fund (-20.97%), and JNL/Causeway International Value Select Fund (-17.26%), two value oriented managers, detracted the most from relative results. Despite better relative performance in the fourth quarter, emerging market equity Funds also detracted for the year. JNL/Oppenheimer Emerging Markets Innovator Fund (-22.25%), JNL/Lazard Emerging Markets Fund (-18.13%), and JNL/GQG Emerging Markets Equity Fund (-14.64) all underperformed in 2018. Manager selection helped to offset some of the relative weakness from the underweight to fixed income as JNL/DoubleLine Total Return Fund (2.11%) and JNL/Franklin Templeton Global Multisector Bond Fund (0.93%) added positively to results.
In the U.S., underperformance from small cap and value oriented strategies was offset by positive relative results from growth strategies, particularly JNL/T. Rowe Price Established Growth Fund (-1.13%) and a sizeable allocation to JNL/T. Rowe Price Capital Appreciation Fund (0.67%).
The alternatives sleeve detracted relative to fixed income due to underlying strategy and manager selection, with the JNL/Neuberger Berman Risk Balanced Commodity Strategy Fund (-10.22%) and JNL/Boston Partners Global Long Short Equity Fund (-9.22%) weighing on returns.
JNL Growth Allocation Fund
Composition as of December 31, 2018: | ||
Domestic Equity | 34.8 | % |
International Equity | 22.0 | |
Domestic Fixed Income | 13.4 | |
Emerging Markets Equity | 9.0 | |
Global Equity | 7.9 | |
Alternative | 5.2 | |
Domestic Balanced | 4.1 | |
International Fixed Income | 2.1 | |
Global Fixed Income | 1.5 | |
Total Investments | 100.0 | % |
For the year ended December 31, 2018, JNL Growth Allocation Fund underperformed its primary benchmark by posting a return of -9.07% for Class A shares compared to -7.33% for the Dow Jones Moderately Aggressive Index. The Fund underperformed its blended benchmark return of -7.45% for the 80% MSCI All Country World Index (Net), 20% Bloomberg Barclays U.S. Aggregate Bond Index.
The investment objective of the Fund is to seek capital growth and current income.
Under normal circumstances, the Fund allocates approximately 60% to 100% of its assets to Underlying Funds that invest primarily in equity securities, 0% to 40% to Underlying Funds that invest primarily in fixed income securities and 0% to 20% of its assets to Underlying Funds that invest primarily in money market securities.
The Fund underperformed its blended benchmark due to underlying manager selection in the international equity sleeve and an underweight position in fixed income. JNL/Harris Oakmark Global Equity Fund (-20.97%) and JNL/Causeway International Value Select Fund (-17.26%), two value oriented managers, detracted the most from relative results. Despite better relative performance in the fourth quarter, emerging market equity Funds also detracted for the year. JNL/Oppenheimer Emerging Markets Innovator Fund (-22.25%), JNL/Lazard Emerging Markets Fund (-18.13%) and JNL/GQG Emerging Markets Equity Fund (-14.64) all underperformed in 2018. Manager selection helped to offset some of the relative weakness from the underweight to fixed income as JNL/DoubleLine Total Return Fund (2.11%) and JNL/Franklin Templeton Global Multisector Bond Fund (0.93%) added positively to results.
In the U.S., underperformance from small cap and value oriented strategies was offset by positive relative results from growth strategies, particularly JNL/T. Rowe Price Established Growth Fund (-1.13%) and a sizeable allocation to JNL/T. Rowe Price Capital Appreciation Fund (0.67%).
The alternatives sleeve detracted relative to domestic equities and fixed income due to underlying strategy and manager selection, with JNL/Neuberger Berman Risk Balanced Commodity Strategy Fund (-10.22%) and JNL/Boston Partners Global Long Short Equity Fund (-9.22%) weighing on returns.
JNL Aggressive Growth Allocation Fund
Composition as of December 31, 2018: | ||
Domestic Equity | 41.0 | % |
International Equity | 24.1 | |
Global Equity | 11.2 | |
Emerging Markets Equity | 10.1 | |
Domestic Fixed Income | 7.6 | |
Alternative | 5.0 | |
International Fixed Income | 1.0 | |
Total Investments | 100.0 | % |
For the year ended December 31, 2018, JNL Aggressive Growth Allocation Fund underperformed its primary benchmark by posting a return of -10.47% for Class A shares compared to -7.33% for the Dow Jones Moderately Aggressive Index. The Fund underperformed its blended benchmark return of -8.43% for the 90% MSCI All Country World Index (Net), 10% Bloomberg Barclays U.S. Aggregate Bond Index.
The investment objective of the Fund is capital growth.
Under normal circumstances, the Fund allocates approximately 70% to 100% of its assets to Underlying Funds that invest primarily in equity securities, 0% to 30% to Underlying Funds that invest primarily in fixed-income securities and 0% to 20% of its assets to Underlying Funds that invest primarily in money market securities.
The Fund underperformed its blended benchmark due to an overweight allocation and manager selection in the international equity sleeve and underweight to U.S. equities. JNL/Harris Oakmark Global Equity Fund (-20.97%) and JNL/Causeway International Value Select Fund (-17.26%), two value oriented managers, detracted from relative results. The mid-year addition of JNL Multi-Manager International Small Cap Fund (-19.10%) was also a key detractor. Despite
17
| JNL Allocation Funds Jackson National Asset Management, LLC (Unaudited) |

better relative performance in the fourth quarter, emerging market equities also detracted for the year. JNL/Oppenheimer Emerging Markets Innovator Fund (-22.25%), JNL/Lazard Emerging Markets Fund (-18.13%) and JNL/GQG Emerging Markets Equity Fund (-14.64) all underperformed in 2018.
In the U.S., underperformance from small cap and value oriented strategies was somewhat offset by JNL/T. Rowe Price Established Growth Fund (-1.13%). JNL/DoubleLine Total Return Fund (2.11%) and JNL/Franklin Templeton Global Multisector Bond Fund (0.93%) were positive contributors within fixed income.
The alternatives sleeve detracted relative to domestic equities, with JNL/Neuberger Berman Risk Balanced Commodity Strategy Fund (-10.22%) and JNL/Boston Partners Global Long Short Equity Fund (-9.22%) weighing on returns.
18
| JNL Allocation Funds Jackson National Asset Management, LLC (Unaudited) |

JNL Moderate Growth Allocation Fund
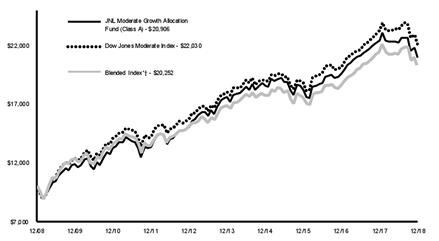
†60% MSCI All Country World Index (Net), 40% Bloomberg Barclays U.S. Aggregate Bond Index
Average Annual Total Returns |
| |||||
Class A |
|
|
| Class I† |
|
|
1 Year | -6.64 | % | 1 Year | -6.34 | % | |
5 Year | 3.48 |
|
| 5 Year | N/A |
|
10 Year | 7.65 |
|
| 10 Year | N/A |
|
Since Inception | N/A |
|
| Since Inception | -2.56 |
|
†Inception date September 25, 2017 |
| |||||
The graph shows the change in value of an assumed $10,000 investment in the Fund's Class A shares over 10 years, or since inception if the inception is less than 10 years, as well as the Fund's benchmark(s) performance for the same period.
Past performance is not predictive of future performance. Investment return and principal value will fluctuate so that an investor’s shares, when redeemed, may be worth more or less than their original cost. Performance numbers are net of all Fund operating expenses, but do not reflect the deduction of insurance charges.
Jackson National Asset Management, LLC assumed portfolio management responsibility on August 29, 2011.
JNL Growth Allocation Fund
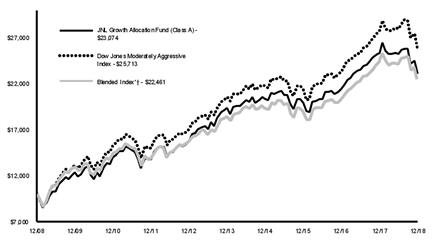
†80% MSCI All Country World Index (Net), 20% Bloomberg Barclays U.S. Aggregate Bond Index
Average Annual Total Returns |
| |||||
Class A |
|
|
| Class I† |
|
|
1 Year | -9.07 | % | 1 Year | -8.84 | % | |
5 Year | 3.61 |
|
| 5 Year | N/A |
|
10 Year | 8.72 |
|
| 10 Year | N/A |
|
Since Inception | N/A |
|
| Since Inception | -3.90 |
|
†Inception date September 25, 2017 |
| |||||
The graph shows the change in value of an assumed $10,000 investment in the Fund's Class A shares over 10 years, or since inception if the inception is less than 10 years, as well as the Fund's benchmark(s) performance for the same period.
Past performance is not predictive of future performance. Investment return and principal value will fluctuate so that an investor’s shares, when redeemed, may be worth more or less than their original cost. Performance numbers are net of all Fund operating expenses, but do not reflect the deduction of insurance charges.
Jackson National Asset Management, LLC assumed portfolio management responsibility on August 29, 2011.
JNL Aggressive Growth Allocation Fund

†90% MSCI All Country World Index (Net), 10% Bloomberg Barclays U.S. Aggregate Bond Index
Average Annual Total Returns |
| |||||
Class A |
|
|
| Class I† |
|
|
1 Year | -10.47 | % | 1 Year | -10.15 | % | |
5 Year | 3.73 |
|
| 5 Year | N/A |
|
10 Year | 8.86 |
|
| 10 Year | N/A |
|
Since Inception | N/A |
|
| Since Inception | -4.61 |
|
†Inception date September 25, 2017 |
| |||||
The graph shows the change in value of an assumed $10,000 investment in the Fund's Class A shares over 10 years, or since inception if the inception is less than 10 years, as well as the Fund's benchmark(s) performance for the same period.
Past performance is not predictive of future performance. Investment return and principal value will fluctuate so that an investor’s shares, when redeemed, may be worth more or less than their original cost. Performance numbers are net of all Fund operating expenses, but do not reflect the deduction of insurance charges.
Jackson National Asset Management, LLC assumed portfolio management responsibility on August 29, 2011.
19
| Funds of Funds Jackson National Asset Management, LLC (Unaudited) |

JNL/Franklin Templeton Founding Strategy Fund
Composition as of December 31, 2018: | ||
Global Equity | 66.2 | % |
Domestic Balanced | 33.8 | |
Total Investments | 100.0 | % |
For the year ended December 31, 2018, JNL/Franklin Templeton Founding Strategy Fund underperformed its primary benchmark by posting a return of -9.45% for Class A shares compared to -7.33% for the Dow Jones Moderately Aggressive Index. The Fund underperformed its blended benchmark return of -7.45% for the 80% MSCI All Country World Index (Net) and 20% Bloomberg Barclays U.S. Aggregate Bond Index.
The investment objective of the Fund is capital appreciation.
The Fund seeks to achieve its objective by making approximately equal allocations of its assets and cash flows among the following Underlying Funds (“Underlying Funds”): JNL/Franklin Templeton Income Fund, JNL/Franklin Templeton Global Fund and JNL/Franklin Templeton Mutual Shares Fund. The Underlying Funds are a separate series of JNL Series Trust. The Schedules of Investments and Financial Statements for the Underlying Funds are available at www.jackson.com or on the SEC’s website at www.sec.gov.
The Fund underperformed its blended benchmark as the two underlying equity Funds significantly underperformed their benchmarks. JNL/Franklin Templeton Global Fund (-14.57%) was the primary detractor in trailing its MSCI ACWI benchmark by 586 basis points (“bps”). JNL/Franklin Templeton Mutual Shares Fund (-8.76%) also lagged its S&P 500 Index by 438 bps owing mainly to its value bias. JNL/Franklin Templeton Income Fund (-3.95%) underperformed the Bloomberg Barclays U.S. Aggregate Bond Index because of its equity allocation and focus on high yield bonds that underperformed throughout the year.
JNL/Mellon Capital 10 x 10 Fund
Composition as of December 31, 2018: | ||
Domestic Equity | 79.3 | % |
Domestic Fixed Income | 10.5 | |
International Equity | 10.2 | |
Total Investments | 100.0 | % |
For the year ended December 31, 2018, JNL/Mellon Capital 10 x 10 Fund outperformed its primary benchmark by posting a return of -8.82% for Class A shares compared to -9.45% for the Dow Jones Aggressive Index. The Fund underperformed its blended benchmark return of -5.84% for the 60% S&P 500 Index, 10% S&P Midcap 400 Index, 10% S&P SmallCap 600 Index, 10% MSCI EAFE Index (Net) and 10% Bloomberg Barclays U.S. Aggregate Bond Index.
The investment objective of the Fund is capital appreciation and income.
The Fund seeks to achieve its objective by investing in Class I shares of the following Funds: 50% in the JNL/Mellon Capital JNL 5 Fund, 10% in the JNL/Mellon Capital S&P 500 Index Fund, 10% in the JNL/Mellon Capital S&P 400 MidCap Index Fund, 10% in the JNL/Mellon Capital Small Cap Index Fund, 10% in the JNL/Mellon Capital International Index Fund and 10% in the JNL/Mellon Capital Bond Index Fund. The Underlying Funds are a separate series of JNL Series Trust and JNL Variable Fund LLC. The Schedules of Investments and Financial Statements for the Underlying Funds are available at www.jackson.com or on the SEC’s website at www.sec.gov.
The Fund underperformed its blended benchmark for the year primarily owing to the underperformance of JNL/Mellon Capital JNL 5 Fund (-9.46%) relative to the broader equity market. Consisting of half the Fund’s assets, JNL/Mellon Capital JNL 5 Fund is comprised of five rules based sub strategies that tilt towards value oriented, small-cap and global stocks. In 2018, all three components served as headwinds to performance. The rest of the Fund employs Index funds that mostly underperformed their respective benchmarks by small margins due to fees.
JNL/Mellon Capital Index 5 Fund
Composition as of December 31, 2018: | ||
Domestic Equity | 58.0 | % |
Domestic Fixed Income | 21.6 | |
International Equity | 20.4 | |
Total Investments | 100.0 | % |
For the year ended December 31, 2018, JNL/Mellon Capital Index 5 Fund underperformed its primary benchmark by posting a return of -7.80% for Class A shares compared to -7.33% for the Dow Jones Moderately Aggressive Index. The Fund underperformed its blended benchmark return of -7.33% for the 20% S&P 500 Index, 20% S&P Midcap 400 Index, 20% S&P SmallCap 600 Index, 20% MSCI EAFE Index (Net) and 20% Bloomberg Barclays U.S. Aggregate Bond Index.
The investment objective of the Fund is capital appreciation.
The Fund seeks to achieve its objective by investing in approximately equal allocations in the following Underlying Funds: JNL/Mellon Capital S&P 500 Index Fund, JNL/Mellon Capital S&P 400 MidCap Index Fund, JNL/Mellon Capital Small Cap Index Fund, JNL/Mellon Capital International Index Fund and JNL/Mellon Capital Bond Index Fund. The Underlying Funds are a separate series of JNL Series Trust. The Schedules of Investments and Financial Statements for the Underlying Funds are available at www.jackson.com or on the SEC’s website at www.sec.gov.
The Fund modestly underperformed its blended benchmark during the year. The primary detractor from relative performance was the performance of the Underlying Funds relative to their respective benchmarks due to fees. These included JNL/Mellon Capital Bond Index Fund (-0.28%, 29 bps of underperformance), JNL/Mellon Capital S&P 500 Index Fund (-4.61%, 23 bps underperformance), JNL/Mellon Capital S&P 400 MidCap Index Fund (-11.27%, 19 bps underperformance) and JNL/Mellon Capital Small Cap Index Fund (-8.66%, 18 bps underperformance). The only Fund to outperform was JNL/Mellon Capital International Index Fund (-13.66%, 13 bps outperformance).
JNL/S&P 4 Fund
Composition as of December 31, 2018: | ||
Domestic Equity | 100.0 | % |
Total Investments | 100.0 | % |
For the year ended December 31, 2018, JNL/S&P 4 Fund underperformed its primary benchmark by posting a return of -6.27% for Class A shares compared to -4.38% for the S&P 500 Index.
The investment objective of the Fund is capital appreciation.
The Fund seeks to achieve its objective by investing approximately equal allocations in the following Underlying Funds: JNL/S&P Competitive Advantage Fund, JNL/S&P Dividend Income & Growth Fund, JNL/S&P Intrinsic Value Fund and JNL/S&P Total Yield Fund. The Underlying Funds are a separate series of JNL Series Trust. The Schedules of Investments and Financial Statements for the Underlying Funds are available at www.jackson.com or on the SEC’s website at www.sec.gov.
The Fund underperformed its primary benchmark in 2018 as three out of four of its underlying component Funds underperformed the benchmark. JNL/S&P Total Yield Fund (-10.93%) was the biggest laggard as value oriented stocks were out of favor for most of the year. JNL/S&P Intrinsic Value Fund (-5.53%) and JNL/S&P Dividend Income and Growth Fund (-5.04%) fared slightly better but still trailed the benchmark. JNL/S&P Competitive Advantage Fund (-2.36%) was the only Fund to outperform the benchmark as a meaningful overweight to retail stocks and underweight to financials contributed positively to relative performance.
20
| Funds of Funds Jackson National Asset Management, LLC (Unaudited) |

JNL/Franklin Templeton Founding Strategy Fund

†80% MSCI All Country World Index (Net), 20% Bloomberg Barclays U.S. Aggregate Bond Index
Average Annual Total Returns |
| |||||
Class A |
|
|
| Class I† |
|
|
1 Year | -9.45 | % | 1 Year | -9.16 | % | |
5 Year | 2.03 |
|
| 5 Year | N/A |
|
10 Year | 8.46 |
|
| 10 Year | N/A |
|
Since Inception | N/A |
|
| Since Inception | -5.36 |
|
†Inception date September 25, 2017 |
| |||||
The graph shows the change in value of an assumed $10,000 investment in the Fund's Class A shares over 10 years, or since inception if the inception is less than 10 years, as well as the Fund's benchmark(s) performance for the same period.
Past performance is not predictive of future performance. Investment return and principal value will fluctuate so that an investor’s shares, when redeemed, may be worth more or less than their original cost. Performance numbers are net of all Fund operating expenses, but do not reflect the deduction of insurance charges.
JNL/Mellon Capital 10 x 10 Fund

†60% S&P 500 Index, 10% S&P Midcap 400 Index, 10% S&P SmallCap 600 Index, 10% MSCI EAFE Index (Net), 10% Bloomberg Barclays U.S. Aggregate Bond Index
Average Annual Total Returns |
| |||||
Class A |
|
|
| Class I† |
|
|
1 Year | -8.82 | % | 1 Year | -8.45 | % | |
5 Year | 4.67 |
|
| 5 Year | N/A |
|
10 Year | 10.20 |
|
| 10 Year | N/A |
|
Since Inception | N/A |
|
| Since Inception | -2.18 |
|
†Inception date September 25, 2017 |
| |||||
The graph shows the change in value of an assumed $10,000 investment in the Fund's Class A shares over 10 years, or since inception if the inception is less than 10 years, as well as the Fund's benchmark(s) performance for the same period.
Past performance is not predictive of future performance. Investment return and principal value will fluctuate so that an investor’s shares, when redeemed, may be worth more or less than their original cost. Performance numbers are net of all Fund operating expenses, but do not reflect the deduction of insurance charges.
JNL/Mellon Capital Index 5 Fund
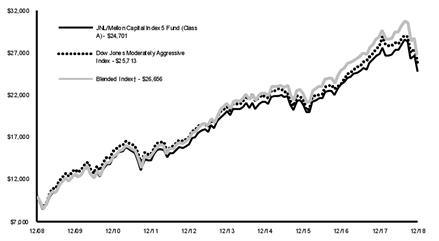
†20% S&P 500 Index, 20% S&P Midcap 400 Index, 20% S&P SmallCap 600 Index, 20% MSCI EAFE Index (Net), 20% Bloomberg Barclays U.S. Aggregate Bond Index
Average Annual Total Returns |
| |||||
Class A |
|
|
| Class I† |
|
|
1 Year | -7.80 | % | 1 Year | -7.45 | % | |
5 Year | 4.30 |
|
| 5 Year | N/A |
|
10 Year | 9.46 |
|
| 10 Year | N/A |
|
Since Inception | N/A |
|
| Since Inception | -1.94 |
|
†Inception date September 25, 2017 |
| |||||
The graph shows the change in value of an assumed $10,000 investment in the Fund's Class A shares over 10 years, or since inception if the inception is less than 10 years, as well as the Fund's benchmark(s) performance for the same period.
Past performance is not predictive of future performance. Investment return and principal value will fluctuate so that an investor’s shares, when redeemed, may be worth more or less than their original cost. Performance numbers are net of all Fund operating expenses, but do not reflect the deduction of insurance charges.
21
| Funds of Funds Jackson National Asset Management, LLC (Unaudited) |

JNL/S&P 4 Fund
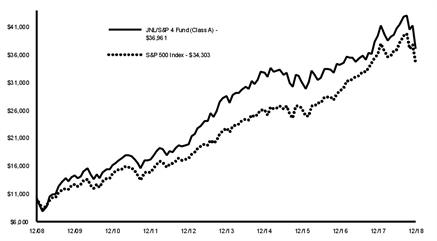
Average Annual Total Returns |
| |||||
Class A |
|
|
| Class I† |
|
|
1 Year | -6.27 | % | 1 Year | -5.97 | % | |
5 Year | 5.32 |
|
| 5 Year | N/A |
|
10 Year | 13.97 |
|
| 10 Year | N/A |
|
Since Inception | N/A |
|
| Since Inception | 2.40 |
|
†Inception date September 25, 2017 |
| |||||
The graph shows the change in value of an assumed $10,000 investment in the Fund's Class A shares over 10 years, or since inception if the inception is less than 10 years, as well as the Fund's benchmark(s) performance for the same period.
Past performance is not predictive of future performance. Investment return and principal value will fluctuate so that an investor’s shares, when redeemed, may be worth more or less than their original cost. Performance numbers are net of all Fund operating expenses, but do not reflect the deduction of insurance charges.
22
| JNL/S&P Funds Standard & Poor’s Investment Advisory Services LLC (Unaudited) |

The JNL/S&P Managed Conservative Fund, JNL/S&P Managed Moderate Fund, JNL/S&P Managed Moderate Growth Fund, JNL/S&P Managed Growth Fund and JNL/S&P Managed Aggressive Growth Fund (collectively “JNL/S&P Funds”). Each Fund seeks to achieve its objective by investing in shares of a diversified group of affiliated Underlying Funds (“Underlying Funds”). The Schedules of Investments and Financial Statements for the Underlying Funds are available at www.jackson.com or on the SEC’s website at www.sec.gov.
JNL/S&P Managed Conservative Fund
Composition as of December 31, 2018: | ||
Domestic Fixed Income | 67.4 | % |
Domestic Equity | 14.6 | |
Global Fixed Income | 9.0 | |
Alternative | 3.0 | |
International Equity | 3.0 | |
International Fixed Income | 2.0 | |
Global Equity | 1.0 | |
Total Investments | 100.0 | % |
For the year ended December 31, 2018, JNL/S&P Managed Conservative Fund underperformed its primary benchmark by posting a return of -2.31% for Class A shares compared to -0.62% for the Dow Jones Conservative Index. The Fund underperformed its blended benchmark return of -1.20% for the 80% Bloomberg Barclays U.S. Aggregate Bond Index, 15% S&P 500 Index and 5% MSCI EAFE Index (Net).
The investment objective for the Fund is to seek current income. Capital growth is a secondary objective.
Under normal circumstances, the Fund allocates approximately 10% to 30% of its assets to Underlying Funds that invest primarily in equity securities, 70% to 90% to Underlying Funds that invest primarily in fixed income securities and 0% to 30% to Underlying Funds that invest primarily in money market securities.
For the year, attribution effects from asset allocation positioning were positive due to an underweight to international equities, but an underweight to domestic equities and a slight overweight to fixed income securities partially reduced the impact.
In the fixed income asset class relative to the Bloomberg Barclays U.S. Aggregate Bond Index, overall manager selection effects were negative, headlined by JNL/PPM America High Yield Bond Fund, JNL/PIMCO Real Return Fund and JNL/Goldman Sachs Emerging Markets Debt Fund. These were partially offset by positive attribution effects from JNL/DoubleLine Total Return Fund and short term fixed income funds – JNL/T. Rowe Price Short-Term Bond Fund and JNL/PPM America Low Duration Bond Fund.
In the domestic equity asset class relative to S&P 500 Index, overall manager selections were negative, headlined by JNL/T. Rowe Price Value Fund, JNL Multi-Manager Small Cap Value Fund and JNL/DFA U.S. Core Equity Fund. The leading positive attributors were JNL/T. Rowe Price Established Growth Fund and JNL Multi-Manager Small Cap Growth Fund.
In the international equity asset class relative to MSCI EAFE Index, overall manager selections detracted due to negative performance attribution from JNL/Causeway International Value Select Fund and JNL/Oppenheimer Global Growth Fund but partially offset by positive attribution from JNL/WCM Focused International Equity Fund.
JNL/S&P Managed Moderate Fund
Composition as of December 31, 2018: | ||
Domestic Fixed Income | 48.8 | % |
Domestic Equity | 29.0 | |
Global Fixed Income | 9.1 | |
International Equity | 5.0 | |
Alternative | 3.5 | |
International Fixed Income | 2.1 | |
Emerging Markets Equity | 1.4 | |
Global Equity | 1.1 | |
Total Investments | 100.0 | % |
For the year ended December 31, 2018, JNL/S&P Managed Moderate Fund underperformed its primary benchmark by posting a return of -3.43% for Class A shares compared to -3.15% for the Dow Jones Moderately Conservative Fund. The Fund underperformed its blended benchmark return of -2.49% for the 60% Bloomberg Barclays U.S. Aggregate Bond Index, 30% S&P 500 Index and 10% MSCI EAFE Index (Net).
The investment objective of the Fund is current income and capital growth.
Under normal circumstances, the Fund allocates approximately 30% to 50% of its assets to Underlying Funds that invest primarily in equity securities, 50% to 70% to Underlying Funds that invest primarily in fixed-income securities and 0% to 25% to Underlying Funds that invest primarily in money market securities.
For the year, attribution effects from asset allocation positioning were positive due to an underweight to international equities, but a slight overweight to fixed income asset class partially reduced these results.
In the fixed income asset class relative to Bloomberg Barclays U.S. Aggregate Bond Index, overall manager selection effects were negative, headlined by JNL/PPM America High Yield Bond Fund, JNL/PIMCO Real Return Fund and JNL/Goldman Sachs Emerging Markets Debt Fund. JNL/DoubleLine Total Return Fund and short-term fixed income funds – JNL/T. Rowe Price Short-Term Bond Fund and JNL/PPM America Low Duration Bond Fund generated positive manager selection effects.
In the domestic equity asset class relative to S&P 500 Index, overall manager selections were negative led by JNL/T. Rowe Price Value Fund, JNL Multi-Manager Small Cap Value Fund and JNL/Invesco Diversified Dividend Fund. The leading positive attributors were the large-cap growth managers - JNL/T. Rowe Price Established Growth Fund, JNL/BlackRock Large Cap Select Growth Fund and JNL/ClearBridge Large Cap Growth Fund.
In the international equity asset class relative to MSCI EAFE Index, overall manager selections detracted due to negative performance attribution from emerging markets managers – JNL/Oppenheimer Emerging Markets Innovator Fund, JNL/Lazard Emerging Markets Fund and JNL/Invesco International Growth Fund. JNL/WCM Focused International Equity Fund was the leading positive attributor during the year.
JNL/S&P Managed Moderate Growth Fund
Composition as of December 31, 2018: | ||
Domestic Equity | 43.5 | % |
Domestic Fixed Income | 32.7 | |
International Equity | 6.1 | |
Global Fixed Income | 5.5 | |
Alternative | 4.1 | |
Global Equity | 3.2 | |
Emerging Markets Equity | 2.8 | |
International Fixed Income | 2.1 | |
Total Investments | 100.0 | % |
For the year ended December 31, 2018, JNL/S&P Managed Moderate Growth Fund outperformed its primary benchmark by posting a return of -4.90% for Class A shares compared to -5.21% for the Dow Jones Moderate Index. The Fund underperformed its blended benchmark return of -3.84% for the 45% S&P 500 Index, 40% Bloomberg Barclays U.S. Aggregate Bond Index and 15% MSCI EAFE Index (Net).
The investment objective of the Fund is capital growth and current income.
Under normal circumstances, the Fund allocates approximately 50% to 70% of its assets to Underlying Funds that invest primarily in equity securities, 30% to 50% to Underlying Funds that invest primarily in fixed-income securities and 0% to 20% to Underlying Funds that invest primarily in money market securities.
For the year, attribution effects from asset allocation positioning were positive due to an underweight to international equities, but a slight overweight to fixed income asset class somewhat reduced the results.
23
| JNL/S&P Funds Standard & Poor’s Investment Advisory Services LLC (Unaudited) |

In the domestic equity asset class relative to S&P 500 Index, overall manager selections were negative led by JNL/T. Rowe Price Value Fund, JNL Multi-Manager Small Cap Value Fund and JNL/WMC Value Fund. The leading positive attributors were the large-cap growth managers - JNL/T. Rowe Price Established Growth Fund, JNL/BlackRock Large Cap Select Growth Fund and JNL/ClearBridge Large Cap Growth Fund.
In the international equity asset class relative to MSCI EAFE Index, overall manager selections detracted due to negative attribution effects from emerging markets managers – JNL/Oppenheimer Emerging Markets Innovator Fund, JNL/Lazard Emerging Markets Fund and JNL/Causeway International Value Select Fund. JNL/WCM Focused International Equity Fund was the leading positive attributor during the year.
In the fixed income asset class relative to Bloomberg Barclays U.S. Aggregate Bond Index, overall manager selection effects were negative headlined by JNL/PPM America High Yield Bond Fund, JNL/Goldman Sachs Emerging Markets Debt Fund and JNL/PIMCO Real Return Fund. JNL/DoubleLine Total Return Fund and short-term fixed income funds – JNL/T. Rowe Price Short-Term Bond Fund and JNL/PPM America Low Duration Bond Fund generated positive manager selection effects.
JNL/S&P Managed Growth Fund
Composition as of December 31, 2018: | ||
Domestic Equity | 59.7 | % |
Domestic Fixed Income | 17.4 | |
International Equity | 7.2 | |
Global Equity | 5.6 | |
Emerging Markets Equity | 4.0 | |
Alternative | 4.0 | |
International Fixed Income | 2.1 | |
Total Investments | 100.0 | % |
For the year ended December 31, 2018, JNL/S&P Managed Growth Fund outperformed its primary benchmark by posting a return of -5.94% for Class A shares compared to -7.33% for the Dow Jones Moderately Aggressive Index. The Fund underperformed its blended benchmark return of -5.27% for the 60% S&P 500 Index, 20% Bloomberg Barclays U.S. Aggregate Bond Index and 20% MSCI EAFE Index (Net).
The investment objective of the Fund is to seek capital growth. Current income is secondary objective.
Under normal circumstances, the Fund allocates approximately 70% to 90% of its assets to Underlying Funds that invest primarily in equity securities, 10% to 30% to Underlying Funds that invest primarily in fixed-income securities and 0% to 15% to Underlying Funds that invest primarily in money market securities.
For the year, attribution effects from asset allocation positioning were positive due to an underweight to international equities, but a slight underweight to fixed income asset class somewhat reduced the results.
In the domestic equity asset class relative to S&P 500 Index, overall manager selections were negative led by JNL/T. Rowe Price Value Fund, JNL/WMC Value Fund and JNL Multi-Manager Small Cap Value Fund. The leading positive attributors were the large-cap growth managers - JNL/BlackRock Large Cap Select Growth Fund, JNL/T. Rowe Price Established Growth Fund and JNL/ClearBridge Large Cap Growth Fund.
In the international equity asset class relative to MSCI EAFE Index, overall manager selections detracted due to negative attribution effects from emerging markets managers – JNL/Oppenheimer Emerging Markets Innovator Fund, JNL/Lazard Emerging Markets Fund and JNL/Causeway International Value Select Fund. JNL/WCM Focused International Equity Fund was the leading positive attributor during the year.
In the fixed income asset class relative to Bloomberg Barclays U.S. Aggregate Bond Index, overall manager selection effects were negative, headlined by JNL/PPM America High Yield Bond Fund, JNL/Goldman Sachs Emerging Markets Debt Fund and JNL/Crescent High Income Fund. JNL/DoubleLine Total Return Fund and short-term fixed income funds – JNL/T. Rowe Price Short-Term Bond Fund and JNL/PPM America Low Duration Bond Fund generated positive manager selection effects.
JNL/S&P Managed Aggressive Growth Fund
Composition as of December 31, 2018: | ||
Domestic Equity | 67.5 | % |
International Equity | 9.2 | |
Domestic Fixed Income | 7.2 | |
Global Equity | 6.0 | |
Emerging Markets Equity | 5.2 | |
Alternative | 3.9 | |
International Fixed Income | 1.0 | |
Total Investments | 100.0 | % |
For the year ended December 31, 2018, JNL/S&P Managed Aggressive Growth Fund outperformed its primary benchmark by posting a return of -6.71% for Class A shares compared to -9.45% for the Dow Jones Aggressive Index. The Fund underperformed its blended benchmark return of -6.24% for the 65% S&P 500 Index, 25% MSCI EAFE Index (Net) and 10% Bloomberg Barclays U.S. Aggregate Bond Index.
The investment objective of the Fund is capital growth.
Under normal circumstances, the Fund allocates up to 80% to 100% of its assets to Underlying Funds that invest primarily in equity securities, 0% to 20% to Underlying Funds that invest primarily in fixed-income securities and 0% to 10% to Underlying Funds that invest primarily in money market securities.
For the year, attribution effects from asset allocation positioning were positive due to an underweight to international equities, but an underweight to fixed income asset class reduced the results.
In the domestic equity asset class relative to S&P 500 Index, overall manager selections were negative led by JNL/T. Rowe Price Value Fund, JNL/WMC Value Fund and JNL Multi-Manager Small Cap Value Fund. The leading positive attributors were the large-cap growth managers - JNL/BlackRock Large Cap Select Growth Fund, JNL/T. Rowe Price Established Growth Fund and JNL/ClearBridge Large Cap Growth Fund.
In the international equity asset class relative to MSCI EAFE Index, overall manager selections detracted due to negative attribution effects from emerging markets managers – JNL/Oppenheimer Emerging Markets Innovator Fund, JNL/Lazard Emerging Markets Fund and JNL/Causeway International Value Select Fund. JNL/WCM Focused International Equity Fund was the leading positive attributor during the year.
In the fixed income asset class relative to Bloomberg Barclays U.S. Aggregate Bond Index, overall manager selection effects were negative, headlined by JNL/PPM America High Yield Bond Fund and JNL/DoubleLine Emerging Markets Fixed Income Fund. JNL/DoubleLine Total Return Fund and JNL/T. Rowe Price Short-Term Bond Fund generated positive manager selection effects.
24
| JNL/S&P Funds Standard & Poor’s Investment Advisory Services LLC (Unaudited) |

JNL/S&P Managed Conservative Fund
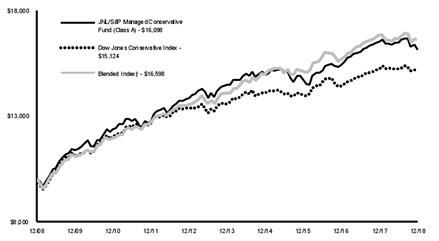
†80% Bloomberg Barclays U.S. Aggregate Bond Index, 15% S&P 500 Index, 5% MSCI EAFE Index (Net)
Average Annual Total Returns |
| |||||
Class A |
|
|
| Class I† |
|
|
1 Year | -2.31 | % | 1 Year | -2.31 | % | |
5 Year | 2.16 |
|
| 5 Year | N/A |
|
10 Year | 4.88 |
|
| 10 Year | N/A |
|
Since Inception | N/A |
|
| Since Inception | -0.77 |
|
†Inception date September 25, 2017 |
| |||||
The graph shows the change in value of an assumed $10,000 investment in the Fund's Class A shares over 10 years, or since inception if the inception is less than 10 years, as well as the Fund's benchmark(s) performance for the same period.
Past performance is not predictive of future performance. Investment return and principal value will fluctuate so that an investor’s shares, when redeemed, may be worth more or less than their original cost. Performance numbers are net of all Fund operating expenses, but do not reflect the deduction of insurance charges.
JNL/S&P Managed Moderate Fund

†60% Bloomberg Barclays U.S. Aggregate Bond Index, 30% S&P 500 Index, 10% MSCI EAFE Index (Net)
Average Annual Total Returns |
| |||||
Class A |
|
|
| Class I† |
|
|
1 Year | -3.43 | % | 1 Year | -3.17 | % | |
5 Year | 3.10 |
|
| 5 Year | N/A |
|
10 Year | 6.63 |
|
| 10 Year | N/A |
|
Since Inception | N/A |
|
| Since Inception | -0.58 |
|
†Inception date September 25, 2017 |
| |||||
The graph shows the change in value of an assumed $10,000 investment in the Fund's Class A shares over 10 years, or since inception if the inception is less than 10 years, as well as the Fund's benchmark(s) performance for the same period.
Past performance is not predictive of future performance. Investment return and principal value will fluctuate so that an investor’s shares, when redeemed, may be worth more or less than their original cost. Performance numbers are net of all Fund operating expenses, but do not reflect the deduction of insurance charges.
JNL/S&P Managed Moderate Growth Fund
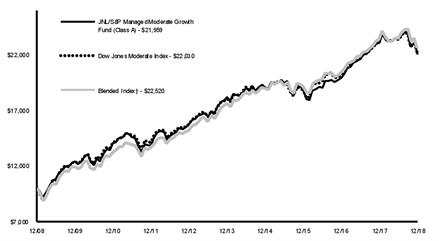
†45% S&P 500 Index, 40% Bloomberg Barclays U.S. Aggregate Bond Index, 15% MSCI EAFE Index (Net)
Average Annual Total Returns |
| |||||
Class A |
|
|
| Class I† |
|
|
1 Year | -4.90 | % | 1 Year | -4.67 | % | |
5 Year | 3.85 |
|
| 5 Year | N/A |
|
10 Year | 8.18 |
|
| 10 Year | N/A |
|
Since Inception | N/A |
|
| Since Inception | -0.75 |
|
†Inception date September 25, 2017 |
| |||||
The graph shows the change in value of an assumed $10,000 investment in the Fund's Class A shares over 10 years, or since inception if the inception is less than 10 years, as well as the Fund's benchmark(s) performance for the same period.
Past performance is not predictive of future performance. Investment return and principal value will fluctuate so that an investor’s shares, when redeemed, may be worth more or less than their original cost. Performance numbers are net of all Fund operating expenses, but do not reflect the deduction of insurance charges.
25
| JNL/S&P Funds Standard & Poor’s Investment Advisory Services LLC (Unaudited) |

JNL/S&P Managed Growth Fund

†60% S&P 500 Index, 20% Bloomberg Barclays U.S. Aggregate Bond Index, 20% MSCI EAFE Index (Net)
Average Annual Total Returns |
| |||||
Class A |
|
|
| Class I† |
|
|
1 Year | -5.94 | % | 1 Year | -5.62 | % | |
5 Year | 4.92 |
|
| 5 Year | N/A |
|
10 Year | 9.98 |
|
| 10 Year | N/A |
|
Since Inception | N/A |
|
| Since Inception | -0.44 |
|
†Inception date September 25, 2017 |
| |||||
The graph shows the change in value of an assumed $10,000 investment in the Fund's Class A shares over 10 years, or since inception if the inception is less than 10 years, as well as the Fund's benchmark(s) performance for the same period.
Past performance is not predictive of future performance. Investment return and principal value will fluctuate so that an investor’s shares, when redeemed, may be worth more or less than their original cost. Performance numbers are net of all Fund operating expenses, but do not reflect the deduction of insurance charges.
JNL/S&P Managed Aggressive Growth Fund
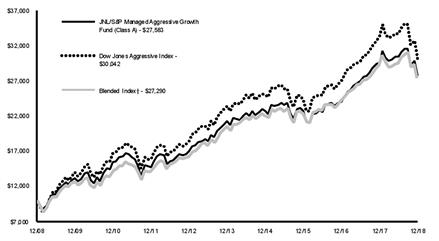
†65% S&P 500 Index, 10% Bloomberg Barclays U.S. Aggregate Bond Index, 25% MSCI EAFE Index (Net)
Average Annual Total Returns |
| |||||
Class A |
|
|
| Class I† |
|
|
1 Year | -6.71 | % | 1 Year | -6.43 | % | |
5 Year | 5.32 |
|
| 5 Year | N/A |
|
10 Year | 10.68 |
|
| 10 Year | N/A |
|
Since Inception | N/A |
|
| Since Inception | -0.71 |
|
†Inception date September 25, 2017 |
| |||||
The graph shows the change in value of an assumed $10,000 investment in the Fund's Class A shares over 10 years, or since inception if the inception is less than 10 years, as well as the Fund's benchmark(s) performance for the same period.
Past performance is not predictive of future performance. Investment return and principal value will fluctuate so that an investor’s shares, when redeemed, may be worth more or less than their original cost. Performance numbers are net of all Fund operating expenses, but do not reflect the deduction of insurance charges.
26
| JNL/Vanguard Funds Funds of Funds Jackson National Asset Management, LLC (Unaudited) |

Each Fund seeks to achieve its objective by investing in shares of a diversified group of other Underlying Funds (“Underlying Funds”). The Underlying Funds in which each Fund may invest are a separate series of Vanguard index mutual funds. The Schedules of Investments and Financial Statements for the Underlying Funds are available on the SEC’s website at www.sec.gov.
JNL/Vanguard Global Bond Market Index Fund
Composition as of December 31, 2018: | ||
Domestic Fixed Income | 50.1 | % |
International Fixed Income | 49.9 | |
Total Investments | 100.0 | % |
For the year ended December 31, 2018, JNL/Vanguard Global Bond Market Index Fund outperformed its primary benchmark by posting a return of 0.90% for Class A shares compared to -0.08% for the Bloomberg Barclays Global Aggregate Float - Adjusted Index. The Fund underperformed its blended benchmark of 1.54% for the 50% Bloomberg Barclays Global Aggregate ex-USD Float Adjusted RIC Capped Index, 50% Bloomberg Barclays U.S. Aggregate Float Adjusted Index. Fund performance tends to differ from that of its benchmark due primarily to the Fund’s operating and management expenses.
The investment objective of the Fund is to seek a balance between current income and growth of capital. The Fund seeks to achieve its objective by investing in shares of a diversified group of other Underlying Funds.
Under normal circumstances, the Fund will allocate its assets to the following Underlying Funds: Vanguard Total International Bond Index Fund Admiral Shares, Vanguard Total Bond Market Index Fund Admiral Shares, Vanguard Short-Term Bond Index Fund Admiral Shares, Vanguard Mortgage-Backed Securities Index Fund Admiral Shares, Vanguard Intermediate-Term Bond Index Fund Admiral Shares and Vanguard Long-Term Bond Index Fund Investor Shares.
The Fund is constructed of underlying Vanguard index mutual funds and is designed to passively track the performance and risk of its blended benchmark. As such, we expect the Fund’s performance and risk to closely mirror that of the blended benchmark index.
JNL/Vanguard International Stock Market Index Fund
Composition as of December 31, 2018: | ||
International Equity | 100.0 | % |
Total Investments | 100.0 | % |
For the year ended December 31, 2018, JNL/Vanguard International Stock Market Index Fund underperformed its primary benchmark by posting a return of -15.02% for Class A shares compared to -14.36% for the FTSE Global All Cap ex-US Index. Fund performance tends to differ from that of its benchmark due primarily to the Fund’s operating and management expenses.
The investment objective of the Fund is to seek long-term capital appreciation. The Fund seeks to achieve its objective by investing in shares of a diversified group of other Underlying Funds.
Under normal circumstances, the Fund will allocate its assets to the following Underlying Funds: Vanguard Developed Markets Index Fund Admiral Shares, Vanguard FTSE All-World ex-US Index Fund Admiral Shares, Vanguard European Stock Index Fund Admiral Shares, Vanguard Pacific Stock Index Fund Admiral Shares, Vanguard Emerging Markets Stock Index Fund Admiral Shares, Vanguard FTSE All-World ex-US Small-Cap Index Fund Investor Shares and Vanguard Total International Stock Index Fund Admiral Shares.
The Fund is constructed of underlying Vanguard index mutual funds and is designed to passively track the performance and risk of the FTSE Global All Cap ex-US Index. As such, we expect the Fund’s performance and risk to closely mirror that of the index.
JNL/Vanguard U.S. Stock Market Index Fund
Composition as of December 31, 2018: | ||
Domestic Equity | 100.0 | % |
Total Investments | 100.0 | % |
For the year ended December 31, 2018, JNL/Vanguard U.S. Stock Market Index Fund underperformed its primary benchmark by posting a return of -5.79% for Class A shares compared to -5.17% for the CRSP U.S. Total Market Index. Fund performance tends to differ from that of its benchmark due primarily to the Fund’s operating and management expenses.
The investment objective of the Fund is to seek long-term capital appreciation. The Fund seeks to achieve its objective by investing in shares of a diversified group of Underlying Funds.
Under normal circumstances, the Fund will allocate its assets to the following Underlying Funds: Vanguard Value Index Fund Admiral Shares, Vanguard Growth Index Fund Admiral Shares, Vanguard Large-Cap Index Fund Admiral Shares, Vanguard Total Stock Market Index Fund Admiral Shares, Vanguard Small-Cap Index Fund Admiral Shares and Vanguard Mid-Cap Index Fund Admiral Shares.
The Fund is constructed of underlying Vanguard index mutual funds and is designed to passively track the performance and risk of the CRSP U.S. Total Market Index. As such, we expect the Fund’s performance and risk to closely mirror that of the index.
27
| JNL/Vanguard Funds Funds of Funds Jackson National Asset Management, LLC (Unaudited) |

JNL/Vanguard Global Bond Market Index Fund
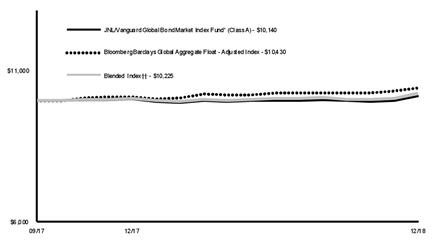
††50% Bloomberg Barclays Global Aggregate ex-USD Float Adjusted RIC Capped Index, 50% Bloomberg Barclays U.S. Aggregate Float Adjusted Index
Average Annual Total Returns* |
| |||||
Class A‡ |
|
|
| Class I† |
|
|
1 Year | 0.90 | % | 1 Year | 1.19 | % | |
Since Inception | 1.10 |
|
| Since Inception | 1.42 |
|
‡Inception date September 25, 2017 |
| |||||
†Inception date September 25, 2017 |
| |||||
*The Fund's investment adviser waived/reimbursed certain expenses of the Fund. Performance results shown reflect the waiver, without which performance results would have been lower. |
| |||||
The graph shows the change in value of an assumed $10,000 investment in the Fund's Class A shares over 10 years, or since inception if the inception is less than 10 years, as well as the Fund's benchmark(s) performance for the same period.
Past performance is not predictive of future performance. Investment return and principal value will fluctuate so that an investor’s shares, when redeemed, may be worth more or less than their original cost. Performance numbers are net of all Fund operating expenses, but do not reflect the deduction of insurance charges.
JNL/Vanguard International Stock Market Index Fund

Average Annual Total Returns* |
| |||||
Class A‡ |
|
|
| Class I† |
|
|
1 Year | -15.02 | % | 1 Year | -14.74 | % | |
Since Inception | -8.94 |
|
| Since Inception | -8.70 |
|
‡Inception date September 25, 2017 |
| |||||
†Inception date September 25, 2017 |
| |||||
*The Fund's investment adviser waived/reimbursed certain expenses of the Fund. Performance results shown reflect the waiver, without which performance results would have been lower. |
| |||||
The graph shows the change in value of an assumed $10,000 investment in the Fund's Class A shares over 10 years, or since inception if the inception is less than 10 years, as well as the Fund's benchmark(s) performance for the same period.
Past performance is not predictive of future performance. Investment return and principal value will fluctuate so that an investor’s shares, when redeemed, may be worth more or less than their original cost. Performance numbers are net of all Fund operating expenses, but do not reflect the deduction of insurance charges.
JNL/Vanguard U.S. Stock Market Index Fund
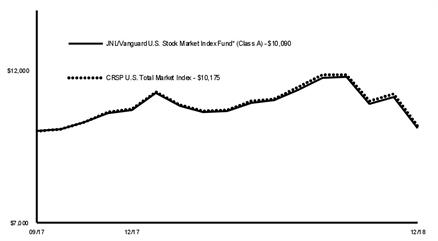
Average Annual Total Returns* |
| |||||
Class A‡ |
|
|
| Class I† |
|
|
1 Year | -5.79 | % | 1 Year | -5.41 | % | |
Since Inception | 0.71 |
|
| Since Inception | 1.10 |
|
‡Inception date September 25, 2017 |
| |||||
†Inception date September 25, 2017 |
| |||||
*The Fund's investment adviser waived/reimbursed certain expenses of the Fund. Performance results shown reflect the waiver, without which performance results would have been lower. |
| |||||
The graph shows the change in value of an assumed $10,000 investment in the Fund's Class A shares over 10 years, or since inception if the inception is less than 10 years, as well as the Fund's benchmark(s) performance for the same period.
Past performance is not predictive of future performance. Investment return and principal value will fluctuate so that an investor’s shares, when redeemed, may be worth more or less than their original cost. Performance numbers are net of all Fund operating expenses, but do not reflect the deduction of insurance charges.
28
JNL Series Trust Master Feeder Funds and Funds of Funds
Schedules of Investments (in thousands)
December 31, 2018
Shares | Value ($) | ||||||
JNL/American Funds Balanced Fund | |||||||
INVESTMENT COMPANIES 100.0% | |||||||
Global Balanced 100.0% | |||||||
American Funds Insurance Series - Asset Allocation Fund - Class 1 | 49,131 | 1,046,003 | |||||
Total Investment Companies (cost $1,135,544) | 1,046,003 | ||||||
Total Investments 100.0% (cost $1,135,544) | 1,046,003 | ||||||
Other Assets and Liabilities, Net (0.0)% | (220) | ||||||
Total Net Assets 100.0% | 1,045,783 | ||||||
JNL/American Funds Blue Chip Income and Growth Fund | |||||||
INVESTMENT COMPANIES 100.0% | |||||||
Domestic Equity 100.0% | |||||||
American Funds Insurance Series - Blue Chip Income and Growth Fund - Class 1 (a) | 236,434 | 2,927,048 | |||||
Total Investment Companies (cost $3,081,264) | 2,927,048 | ||||||
Total Investments 100.0% (cost $3,081,264) | 2,927,048 | ||||||
Other Assets and Liabilities, Net (0.0)% | (997) | ||||||
Total Net Assets 100.0% | 2,926,051 | ||||||
(a) Investment in affiliate.
JNL/American Funds Capital Income Builder Fund | |||||||
INVESTMENT COMPANIES 100.0% | |||||||
Global Balanced 100.0% | |||||||
American Funds Insurance Series - Capital Income Builder Fund - Class 1 | 2,615 | 24,500 | |||||
Total Investment Companies (cost $25,534) | 24,500 | ||||||
Total Investments 100.0% (cost $25,534) | 24,500 | ||||||
Other Assets and Liabilities, Net (0.0)% | (7) | ||||||
Total Net Assets 100.0% | 24,493 | ||||||
JNL/American Funds Global Bond Fund | |||||||
INVESTMENT COMPANIES 100.0% | |||||||
Global Fixed Income 100.0% | |||||||
American Funds Insurance Series - Global Bond Fund - Class 1 (a) | 43,984 | 502,296 | |||||
Total Investment Companies (cost $526,037) | 502,296 | ||||||
Total Investments 100.0% (cost $526,037) | 502,296 | ||||||
Other Assets and Liabilities, Net (0.0)% | (147) | ||||||
Total Net Assets 100.0% | 502,149 | ||||||
(a) Investment in affiliate.
JNL/American Funds Global Small Capitalization Fund | |||||||
INVESTMENT COMPANIES 100.0% | |||||||
Global Equity 100.0% | |||||||
American Funds Insurance Series - Global Small Capitalization Fund - Class 1 (a) | 28,554 | 621,042 | |||||
Total Investment Companies (cost $688,625) | 621,042 | ||||||
Total Investments 100.0% (cost $688,625) | 621,042 | ||||||
Other Assets and Liabilities, Net (0.0)% | (191) | ||||||
Total Net Assets 100.0% | 620,851 | ||||||
(a) Investment in affiliate.
JNL/American Funds Growth-Income Fund | |||||||
INVESTMENT COMPANIES 100.0% | |||||||
Domestic Equity 100.0% | |||||||
American Funds Insurance Series - Growth-Income Fund - Class 1 (a) | 135,334 | 6,142,818 | |||||
Total Investment Companies (cost $6,218,992) | 6,142,818 | ||||||
Total Investments 100.0% (cost $6,218,992) | 6,142,818 | ||||||
Other Assets and Liabilities, Net (0.0)% | (2,348) | ||||||
Total Net Assets 100.0% | 6,140,470 | ||||||
(a) Investment in affiliate.
Shares | Value ($) | ||||||
JNL/American Funds International Fund | |||||||
INVESTMENT COMPANIES 100.0% | |||||||
International Equity 100.0% | |||||||
American Funds Insurance Series - International Fund - Class 1 (a) | 98,174 | 1,733,746 | |||||
Total Investment Companies (cost $1,921,504) | 1,733,746 | ||||||
Total Investments 100.0% (cost $1,921,504) | 1,733,746 | ||||||
Other Assets and Liabilities, Net (0.0)% | (641) | ||||||
Total Net Assets 100.0% | 1,733,105 | ||||||
(a) Investment in affiliate.
JNL/American Funds New World Fund | |||||||
INVESTMENT COMPANIES 100.0% | |||||||
Emerging Markets Equity 100.0% | |||||||
American Funds Insurance Series - New World Fund - Class 1 (a) | 57,980 | 1,216,429 | |||||
Total Investment Companies (cost $1,299,673) | 1,216,429 | ||||||
Total Investments 100.0% (cost $1,299,673) | 1,216,429 | ||||||
Other Assets and Liabilities, Net (0.0)% | (466) | ||||||
Total Net Assets 100.0% | 1,215,963 | ||||||
(a) Investment in affiliate.
JNL/Vanguard Capital Growth Fund | |||||||
INVESTMENT COMPANIES 100.0% | |||||||
Domestic Equity 100.0% | |||||||
Vanguard Variable Insurance Fund - Capital Growth Portfolio (a) | 8,485 | 284,172 | |||||
Total Investment Companies (cost $305,901) | 284,172 | ||||||
Total Investments 100.0% (cost $305,901) | 284,172 | ||||||
Other Assets and Liabilities, Net (0.0)% | (86) | ||||||
Total Net Assets 100.0% | 284,086 | ||||||
(a) Investment in affiliate.
JNL/Vanguard Equity Income Fund | |||||||
INVESTMENT COMPANIES 100.0% | |||||||
Domestic Equity 100.0% | |||||||
Vanguard Variable Insurance Fund - Equity Income Portfolio (a) | 7,502 | 159,338 | |||||
Total Investment Companies (cost $174,170) | 159,338 | ||||||
Total Investments 100.0% (cost $174,170) | 159,338 | ||||||
Other Assets and Liabilities, Net (0.0)% | (47) | ||||||
Total Net Assets 100.0% | 159,291 | ||||||
(a) Investment in affiliate.
JNL/Vanguard International Fund | |||||||
INVESTMENT COMPANIES 100.0% | |||||||
International Equity 100.0% | |||||||
Vanguard Variable Insurance Fund - International Portfolio (a) | 19,470 | 450,535 | |||||
Total Investment Companies (cost $541,637) | 450,535 | ||||||
Total Investments 100.0% (cost $541,637) | 450,535 | ||||||
Other Assets and Liabilities, Net (0.0)% | (142) | ||||||
Total Net Assets 100.0% | 450,393 | ||||||
(a) Investment in affiliate.
JNL/Vanguard Small Company Growth Fund | |||||||
INVESTMENT COMPANIES 100.0% | |||||||
Domestic Equity 100.0% | |||||||
Vanguard Variable Insurance Fund - Small Company Growth Portfolio (a) | 13,363 | 271,142 | |||||
Total Investment Companies (cost $325,557) | 271,142 | ||||||
Total Investments 100.0% (cost $325,557) | 271,142 | ||||||
Other Assets and Liabilities, Net (0.0)% | (86) | ||||||
Total Net Assets 100.0% | 271,056 | ||||||
(a) Investment in affiliate.
See accompanying Notes to Financial Statements.
Abbreviations, counterparties and additional footnotes are defined on page 39
29
JNL Series Trust Master Feeder Funds and Funds of Funds
Schedules of Investments (in thousands)
December 31, 2018
Shares | Value ($) | ||||||
JNL Institutional Alt 25 Fund | |||||||
INVESTMENT COMPANIES 100.0% | |||||||
Alternative 25.1% | |||||||
JNL Multi-Manager Alternative Fund - Class I (12.4%) (a) | 13,642 | 133,968 | |||||
JNL/AQR Large Cap Relaxed Constraint Equity Fund - Class I (8.0%) (a) | 3,004 | 32,559 | |||||
JNL/AQR Managed Futures Strategy Fund - Class I (14.7%) (a) | 4,287 | 32,835 | |||||
JNL/BlackRock Global Long Short Credit Fund - Class I (15.6%) (a) | 1,400 | 13,339 | |||||
JNL/Boston Partners Global Long Short Equity Fund - Class I (25.3%) (a) | 11,490 | 112,142 | |||||
JNL/Eaton Vance Global Macro Absolute Return Advantage Fund - Class I (24.0%) (a) | 6,611 | 60,230 | |||||
JNL/First State Global Infrastructure Fund - Class I (3.8%) (a) | 2,578 | 32,745 | |||||
JNL/Heitman U.S. Focused Real Estate Fund - Class I (22.1%) (a) | 3,364 | 31,622 | |||||
JNL/Invesco Global Real Estate Fund - Class I (1.0%) (a) | 1,450 | 13,081 | |||||
JNL/JPMorgan Hedged Equity Fund - Class I (26.0%) (a) | 2,814 | 26,762 | |||||
JNL/Neuberger Berman Currency Fund - Class I (27.7%) (a) | 2,733 | 26,870 | |||||
JNL/Neuberger Berman Risk Balanced Commodity Strategy Fund - Class I (18.8%) (a) | 3,072 | 30,843 | |||||
JNL/Nicholas Convertible Arbitrage Fund - Class I (17.3%) (a) | 2,701 | 26,820 | |||||
JNL/PPM America Long Short Credit Fund - Class I (25.3%) (a) | 2,361 | 19,766 | |||||
JNL/Westchester Capital Event Driven Fund - Class I (28.5%) (a) | 6,828 | 67,397 | |||||
660,979 | |||||||
Domestic Equity 26.3% | |||||||
JNL Multi-Manager Mid Cap Fund - Class I (12.7%) (a) | 10,392 | 114,621 | |||||
JNL Multi-Manager Small Cap Growth Fund - Class I (1.6%) (a) | 1,256 | 31,173 | |||||
JNL Multi-Manager Small Cap Value Fund - Class I (4.0%) (a) | 3,805 | 43,267 | |||||
JNL/DFA U.S. Small Cap Fund - Class I (12.9%) (a) | 1,630 | 12,109 | |||||
JNL/DoubleLine Shiller Enhanced CAPE Fund - Class I (7.9%) (a) | 8,711 | 108,364 | |||||
JNL/Morningstar Wide Moat Index Fund - Class I (21.4%) (a) | 11,028 | 102,449 | |||||
JNL/T. Rowe Price Established Growth Fund - Class I (1.3%) (a) | 2,784 | 109,434 | |||||
JNL/T. Rowe Price Value Fund - Class I (2.7%) (a) | 7,597 | 109,391 | |||||
JNL/The London Company Focused U.S. Equity Fund - Class I (72.5%) (a) | 5,260 | 63,799 | |||||
694,607 | |||||||
Domestic Fixed Income 17.9% | |||||||
JNL/Crescent High Income Fund - Class I (6.5%) (a) | 4,009 | 39,725 | |||||
JNL/DoubleLine Core Fixed Income Fund - Class I (2.4%) (a) | 6,482 | 87,709 | |||||
JNL/DoubleLine Total Return Fund - Class I (6.9%) (a) | 14,616 | 155,809 | |||||
JNL/PIMCO Income Fund - Class I (5.7%) (a) | 6,036 | 60,720 | |||||
JNL/PIMCO Real Return Fund - Class I (1.5%) (a) | 2,761 | 26,946 | |||||
JNL/PPM America Total Return Fund - Class I (6.0%) (a) | 5,869 | 67,489 | |||||
JNL/Scout Unconstrained Bond Fund - Class I (8.7%) (a) | 3,533 | 33,887 | |||||
472,285 | |||||||
Emerging Markets Equity 5.6% | |||||||
JNL/GQG Emerging Markets Equity Fund - Class I (16.2%) (a) | 8,317 | 74,688 | |||||
JNL/Lazard Emerging Markets Fund - Class I (4.5%) (a) | 3,618 | 33,323 | |||||
JNL/Oppenheimer Emerging Markets Innovator Fund - Class I (8.5%) (a) | 4,495 | 40,049 | |||||
148,060 | |||||||
Global Equity 5.6% | |||||||
JNL/Harris Oakmark Global Equity Fund - Class I (11.8%) (a) | 10,379 | 96,005 | |||||
Shares | Value ($) | ||||||
JNL/Loomis Sayles Global Growth Fund - Class I (20.6%) (a) | 5,854 | 51,808 | |||||
147,813 | |||||||
Global Fixed Income 2.5% | |||||||
JNL/Franklin Templeton Global Multisector Bond Fund - Class I (4.3%) (a) | 6,147 | 67,003 | |||||
International Equity 13.9% | |||||||
JNL Multi-Manager International Small Cap Fund - Class I (20.1%) (a) | 6,267 | 50,697 | |||||
JNL/Causeway International Value Select Fund - Class I (10.4%) (a) | 10,859 | 155,068 | |||||
JNL/WCM Focused International Equity Fund - Class I (12.0%) (a) | 12,330 | 159,422 | |||||
365,187 | |||||||
International Fixed Income 3.1% | |||||||
JNL/DoubleLine Emerging Markets Fixed Income Fund - Class I (16.1%) (a) | 7,721 | 80,683 | |||||
Total Investment Companies (cost $2,863,167) | 2,636,617 | ||||||
Total Investments 100.0% (cost $2,863,167) | 2,636,617 | ||||||
Other Assets and Liabilities, Net (0.0)% | (672) | ||||||
Total Net Assets 100.0% | 2,635,945 | ||||||
(a) The Fund's percentage ownership of the underlying affiliated fund at December 31, 2018 is presented parenthetically. The Fund does not invest in the underlying affiliated funds for the purpose of exercising management or control.
JNL Institutional Alt 50 Fund | ||||||
INVESTMENT COMPANIES 100.0% | ||||||
Alternative 50.2% | ||||||
JNL Multi-Manager Alternative Fund - Class I (21.0%) (a) | 23,033 | 226,183 | ||||
JNL/AQR Large Cap Relaxed Constraint Equity Fund - Class I (13.8%) (a) | 5,193 | 56,291 | ||||
JNL/AQR Managed Futures Strategy Fund - Class I (28.2%) (a) | 8,228 | 63,026 | ||||
JNL/BlackRock Global Long Short Credit Fund - Class I (27.1%) (a) | 2,430 | 23,154 | ||||
JNL/Boston Partners Global Long Short Equity Fund - Class I (44.0%) (a) | 19,975 | 194,958 | ||||
JNL/Eaton Vance Global Macro Absolute Return Advantage Fund - Class I (46.2%) (a) | 12,727 | 115,947 | ||||
JNL/First State Global Infrastructure Fund - Class I (6.5%) (a) | 4,468 | 56,747 | ||||
JNL/Heitman U.S. Focused Real Estate Fund - Class I (30.5%) (a) | 4,635 | 43,568 | ||||
JNL/Invesco Global Real Estate Fund - Class I (1.7%) (a) | 2,510 | 22,644 | ||||
JNL/JPMorgan Hedged Equity Fund - Class I (44.9%) (a) | 4,869 | 46,308 | ||||
JNL/Neuberger Berman Currency Fund - Class I (48.1%) (a) | 4,739 | 46,582 | ||||
JNL/Neuberger Berman Risk Balanced Commodity Strategy Fund - Class I (32.9%) (a) | 5,370 | 53,919 | ||||
JNL/Nicholas Convertible Arbitrage Fund - Class I (30.0%) (a) | 4,679 | 46,457 | ||||
JNL/PPM America Long Short Credit Fund - Class I (44.0%) (a) | 4,112 | 34,421 | ||||
JNL/Westchester Capital Event Driven Fund - Class I (49.3%) (a) | 11,806 | 116,526 | ||||
1,146,731 | ||||||
Domestic Equity 15.8% | ||||||
JNL Multi-Manager Mid Cap Fund - Class I (6.7%) (a) | 5,483 | 60,474 | ||||
JNL Multi-Manager Small Cap Growth Fund - Class I (0.9%) (a) | 651 | 16,157 | ||||
JNL Multi-Manager Small Cap Value Fund - Class I (2.0%) (a) | 1,880 | 21,381 | ||||
JNL/DFA U.S. Small Cap Fund - Class I (1.7%) (a) | 213 | 1,585 | ||||
JNL/DoubleLine Shiller Enhanced CAPE Fund - Class I (4.8%) (a) | 5,321 | 66,189 | ||||
JNL/Morningstar Wide Moat Index Fund - Class I (12.7%) (a) | 6,554 | 60,885 | ||||
JNL/T. Rowe Price Established Growth Fund - Class I (0.8%) (a) | 1,699 | 66,770 | ||||
JNL/T. Rowe Price Value Fund - Class I (1.6%) (a) | 4,631 | 66,690 | ||||
360,131 | ||||||
See accompanying Notes to Financial Statements.
Abbreviations, counterparties and additional footnotes are defined on page 39
30
JNL Series Trust Master Feeder Funds and Funds of Funds
Schedules of Investments (in thousands)
December 31, 2018
Shares | Value ($) | ||||||
Domestic Fixed Income 14.0% | |||||||
JNL/Crescent High Income Fund - Class I (3.8%) (a) | 2,320 | 22,991 | |||||
JNL/DoubleLine Core Fixed Income Fund - Class I (1.6%) (a) | 4,313 | 58,356 | |||||
JNL/DoubleLine Total Return Fund - Class I (4.9%) (a) | 10,434 | 111,230 | |||||
JNL/PIMCO Income Fund - Class I (3.9%) (a) | 4,063 | 40,870 | |||||
JNL/PIMCO Real Return Fund - Class I (1.0%) (a) | 1,791 | 17,483 | |||||
JNL/PPM America Total Return Fund - Class I (4.2%) (a) | 4,061 | 46,703 | |||||
JNL/Scout Unconstrained Bond Fund - Class I (6.0%) (a) | 2,444 | 23,437 | |||||
321,070 | |||||||
Emerging Markets Equity 3.6% | |||||||
JNL/GQG Emerging Markets Equity Fund - Class I (8.9%) (a) | 4,573 | 41,062 | |||||
JNL/Lazard Emerging Markets Fund - Class I (2.4%) (a) | 1,883 | 17,337 | |||||
JNL/Oppenheimer Emerging Markets Innovator Fund - Class I (4.9%) (a) | 2,598 | 23,148 | |||||
81,547 | |||||||
Global Equity 3.4% | |||||||
JNL/Harris Oakmark Global Equity Fund - Class I (6.1%) (a) | 5,389 | 49,845 | |||||
JNL/Loomis Sayles Global Growth Fund - Class I (11.1%) (a) | 3,165 | 28,009 | |||||
77,854 | |||||||
Global Fixed Income 2.0% | |||||||
JNL/Franklin Templeton Global Multisector Bond Fund - Class I (3.0%) (a) | 4,260 | 46,438 | |||||
International Equity 8.7% | |||||||
JNL Multi-Manager International Small Cap Fund - Class I (10.9%) (a) | 3,394 | 27,460 | |||||
JNL/Causeway International Value Select Fund - Class I (5.7%) (a) | 5,893 | 84,146 | |||||
JNL/WCM Focused International Equity Fund - Class I (6.5%) (a) | 6,678 | 86,349 | |||||
197,955 | |||||||
International Fixed Income 2.3% | |||||||
JNL/DoubleLine Emerging Markets Fixed Income Fund - Class I (10.5%) (a) | 5,016 | 52,411 | |||||
Total Investment Companies (cost $2,450,840) | 2,284,137 | ||||||
Total Investments 100.0% (cost $2,450,840) | 2,284,137 | ||||||
Other Assets and Liabilities, Net (0.0)% | (609) | ||||||
Total Net Assets 100.0% | 2,283,528 | ||||||
(a) The Fund's percentage ownership of the underlying affiliated fund at December 31, 2018 is presented parenthetically. The Fund does not invest in the underlying affiliated funds for the purpose of exercising management or control.
JNL/American Funds Moderate Growth Allocation Fund | |||||||
INVESTMENT COMPANIES 100.0% | |||||||
Domestic Equity 29.9% | |||||||
American Funds Insurance Series - Blue Chip Income and Growth Fund - Class 1 | 16,835 | 208,422 | |||||
American Funds Insurance Series - Growth Fund - Class 1 | 2,777 | 194,257 | |||||
American Funds Insurance Series - Growth-Income Fund - Class 1 | 5,229 | 237,371 | |||||
640,050 | |||||||
Domestic Fixed Income 37.2% | |||||||
American Funds American High-Income Trust - Class R-6 | 9,028 | 86,576 | |||||
American Funds Bond Fund of America - Class R-6 | 35,297 | 443,679 | |||||
American Funds Inflation Linked Bond Fund - Class R-6 | 6,002 | 56,242 | |||||
American Funds Intermediate Bond Fund of America - Class R-6 | 15,861 | 209,689 | |||||
796,186 | |||||||
Emerging Markets Equity 4.0% | |||||||
American Funds New World Fund - Class R-6 | 1,489 | 85,304 | |||||
Shares | Value ($) | ||||||
Global Equity 19.0% | |||||||
American Funds Capital World Growth and Income Fund - Class R-6 | 1,093 | 46,767 | |||||
American Funds Insurance Series - Global Growth Fund - Class 1 | 6,343 | 163,260 | |||||
American Funds Insurance Series - International Growth and Income Fund - Class 1 (a) | 7,616 | 116,903 | |||||
American Funds SMALLCAP World Fund - Class R-6 | 1,676 | 80,267 | |||||
407,197 | |||||||
International Equity 5.1% | |||||||
American Funds Insurance Series - International Fund - Class 1 | 6,195 | 109,402 | |||||
International Fixed Income 4.8% | |||||||
American Funds Emerging Markets Bond Fund - Class R-6 (a) | 10,927 | 102,166 | |||||
Total Investment Companies (cost $2,246,573) | 2,140,305 | ||||||
Total Investments 100.0% (cost $2,246,573) | 2,140,305 | ||||||
Other Assets and Liabilities, Net (0.0)% | (798) | ||||||
Total Net Assets 100.0% | 2,139,507 | ||||||
(a) Investment in affiliate.
JNL/American Funds Growth Allocation Fund | |||||||
INVESTMENT COMPANIES 100.0% | |||||||
Domestic Equity 38.3% | |||||||
American Funds Insurance Series - Growth Fund - Class 1 | 3,917 | 274,071 | |||||
American Funds Insurance Series - Growth-Income Fund - Class 1 | 7,055 | 320,217 | |||||
American Washington Mutual Investors Fund - Class R-6 | 6,839 | 281,014 | |||||
875,302 | |||||||
Domestic Fixed Income 18.2% | |||||||
American Funds American High-Income Trust - Class R-6 | 4,827 | 46,293 | |||||
American Funds Bond Fund of America - Class R-6 | 19,064 | 239,640 | |||||
American Funds Intermediate Bond Fund of America - Class R-6 | 9,935 | 131,339 | |||||
417,272 | |||||||
Emerging Markets Equity 6.1% | |||||||
American Funds New World Fund - Class R-6 | 2,432 | 139,283 | |||||
Global Equity 29.0% | |||||||
American Funds Capital World Growth and Income Fund - Class R-6 | 3,066 | 131,219 | |||||
American Funds Insurance Series - Global Growth Fund - Class 1 | 10,093 | 259,796 | |||||
American Funds Insurance Series - International Growth and Income Fund - Class 1 (a) | 9,049 | 138,900 | |||||
American Funds SMALLCAP World Fund - Class R-6 | 2,798 | 134,013 | |||||
663,928 | |||||||
International Equity 6.0% | |||||||
American Funds Insurance Series - International Fund - Class 1 | 7,796 | 137,675 | |||||
International Fixed Income 2.4% | |||||||
American Funds Emerging Markets Bond Fund - Class R-6 (a) | 5,777 | 54,014 | |||||
Total Investment Companies (cost $2,441,877) | 2,287,474 | ||||||
Total Investments 100.0% (cost $2,441,877) | 2,287,474 | ||||||
Other Assets and Liabilities, Net (0.0)% | (847) | ||||||
Total Net Assets 100.0% | 2,286,627 | ||||||
(a) Investment in affiliate.
JNL/DFA Growth Allocation Fund | ||||||
INVESTMENT COMPANIES 100.0% | ||||||
Alternative 4.0% | ||||||
DFA International Real Estate Securities Portfolio - Institutional Class | 345 | 1,578 | ||||
DFA Real Estate Securities Portfolio - Institutional Class | 145 | 4,732 | ||||
6,310 | ||||||
See accompanying Notes to Financial Statements.
Abbreviations, counterparties and additional footnotes are defined on page 39
31
JNL Series Trust Master Feeder Funds and Funds of Funds
Schedules of Investments (in thousands)
December 31, 2018
Shares | Value ($) | ||||||
Domestic Equity 42.5% | |||||||
DFA Enhanced U.S. Large Company Portfolio - Institutional Class | 918 | 10,438 | |||||
DFA U.S. Large Cap Value Portfolio - Institutional Class | 323 | 10,370 | |||||
DFA U.S. Large Company Portfolio - Institutional Class | 1,637 | 31,610 | |||||
DFA U.S. Small Cap Portfolio - Institutional Class | 256 | 7,607 | |||||
DFA U.S. Targeted Value Portfolio - Institutional Class | 384 | 7,607 | |||||
67,632 | |||||||
Domestic Fixed Income 17.8% | |||||||
DFA Investment Grade Portfolio - Institutional Class | 1,501 | 15,762 | |||||
DFA Short-Duration Real Return Portfolio - Institutional Class | 245 | 2,358 | |||||
DFA Short-Term Extended Quality Portfolio - Institutional Class | 968 | 10,229 | |||||
28,349 | |||||||
Emerging Markets Equity 8.0% | |||||||
DFA Emerging Markets Portfolio - Institutional Class | 245 | 6,327 | |||||
DFA Emerging Markets Small Cap Portfolio - Institutional Class | 339 | 6,346 | |||||
12,673 | |||||||
International Equity 27.7% | |||||||
DFA International Core Equity Portfolio - Institutional Class | 2,849 | 33,336 | |||||
DFA International Small Cap Value Portfolio - Institutional Class | 646 | 10,759 | |||||
44,095 | |||||||
Total Investment Companies (cost $177,799) | 159,059 | ||||||
Total Investments 100.0% (cost $177,799) | 159,059 | ||||||
Other Assets and Liabilities, Net (0.0)% | (49) | ||||||
Total Net Assets 100.0% | 159,010 | ||||||
JNL/DFA Moderate Growth Allocation Fund | |||||||
INVESTMENT COMPANIES 100.0% | |||||||
Alternative 2.9% | |||||||
DFA International Real Estate Securities Portfolio - Institutional Class | 282 | 1,289 | |||||
DFA Real Estate Securities Portfolio - Institutional Class | 75 | 2,458 | |||||
3,747 | |||||||
Domestic Equity 33.0% | |||||||
DFA Enhanced U.S. Large Company Portfolio - Institutional Class | 547 | 6,223 | |||||
DFA U.S. Large Cap Value Portfolio - Institutional Class | 201 | 6,465 | |||||
DFA U.S. Large Company Portfolio - Institutional Class | 1,023 | 19,756 | |||||
DFA U.S. Small Cap Portfolio - Institutional Class | 154 | 4,579 | |||||
DFA U.S. Targeted Value Portfolio - Institutional Class | 247 | 4,901 | |||||
41,924 | |||||||
Domestic Fixed Income 38.5% | |||||||
DFA Intermediate Term Extended Quality Portfolio - Institutional Class | 515 | 5,260 | |||||
DFA Investment Grade Portfolio - Institutional Class | 2,193 | 23,027 | |||||
DFA Short-Duration Real Return Portfolio - Institutional Class | 405 | 3,895 | |||||
DFA Short-Term Extended Quality Portfolio - Institutional Class | 1,578 | 16,676 | |||||
48,858 | |||||||
Emerging Markets Equity 6.1% | |||||||
DFA Emerging Markets Portfolio - Institutional Class | 149 | 3,832 | |||||
DFA Emerging Markets Small Cap Portfolio - Institutional Class | 207 | 3,867 | |||||
7,699 | |||||||
International Equity 19.5% | |||||||
DFA International Core Equity Portfolio - Institutional Class | 1,634 | 19,118 | |||||
Shares | Value ($) | ||||||
DFA International Small Cap Value Portfolio - Institutional Class | 340 | 5,660 | |||||
24,778 | |||||||
Total Investment Companies (cost $140,180) | 127,006 | ||||||
Total Investments 100.0% (cost $140,180) | 127,006 | ||||||
Other Assets and Liabilities, Net (0.0)% | (41) | ||||||
Total Net Assets 100.0% | 126,965 | ||||||
JNL Moderate Growth Allocation Fund | ||||||
INVESTMENT COMPANIES 100.0% | ||||||
Alternative 5.5% | ||||||
JNL Multi-Manager Alternative Fund - Class I (5.1%) (a) | 5,569 | 54,690 | ||||
JNL/Boston Partners Global Long Short Equity Fund - Class I (4.9%) (a) | 2,217 | 21,636 | ||||
JNL/First State Global Infrastructure Fund - Class I (1.2%) (a) | 846 | 10,749 | ||||
JNL/Heitman U.S. Focused Real Estate Fund - Class I (11.0%) (a) | 1,667 | 15,666 | ||||
JNL/Neuberger Berman Risk Balanced Commodity Strategy Fund - Class I (9.5%) (a) | 1,548 | 15,537 | ||||
118,278 | ||||||
Domestic Balanced 11.3% | ||||||
JNL/FPA + DoubleLine Flexible Allocation Fund - Class I (5.0%) (a) | 7,332 | 81,096 | ||||
JNL/T. Rowe Price Capital Appreciation Fund - Class I (4.6%) (a) | 11,720 | 163,018 | ||||
244,114 | ||||||
Domestic Equity 23.0% | ||||||
JNL Multi-Manager Mid Cap Fund - Class I (10.5%) (a) | 8,622 | 95,103 | ||||
JNL Multi-Manager Small Cap Growth Fund - Class I (1.7%) (a) | 1,267 | 31,427 | ||||
JNL Multi-Manager Small Cap Value Fund - Class I (3.4%) (a) | 3,185 | 36,216 | ||||
JNL/DoubleLine Shiller Enhanced CAPE Fund - Class I (6.5%) (a) | 7,230 | 89,940 | ||||
JNL/Morningstar Wide Moat Index Fund - Class I (13.3%) (a) | 6,856 | 63,688 | ||||
JNL/T. Rowe Price Established Growth Fund - Class I (1.0%) (a) | 2,311 | 90,833 | ||||
JNL/T. Rowe Price Value Fund - Class I (2.2%) (a) | 6,286 | 90,513 | ||||
497,720 | ||||||
Domestic Fixed Income 26.7% | ||||||
JNL/Crescent High Income Fund - Class I (7.1%) (a) | 4,383 | 43,439 | ||||
JNL/DoubleLine Core Fixed Income Fund - Class I (2.9%) (a) | 7,723 | 104,496 | ||||
JNL/DoubleLine Total Return Fund - Class I (7.8%) (a) | 16,550 | 176,425 | ||||
JNL/PIMCO Income Fund - Class I (6.2%) (a) | 6,561 | 66,006 | ||||
JNL/PIMCO Investment Grade Corporate Bond Fund - Class I (14.4%) (a) | 5,518 | 60,584 | ||||
JNL/PIMCO Real Return Fund - Class I (1.2%) (a) | 2,252 | 21,983 | ||||
JNL/PPM America Total Return Fund - Class I (6.4%) (a) | 6,217 | 71,499 | ||||
JNL/Scout Unconstrained Bond Fund - Class I (8.5%) (a) | 3,451 | 33,097 | ||||
577,529 | ||||||
Emerging Markets Equity 6.6% | ||||||
JNL/GQG Emerging Markets Equity Fund - Class I (14.4%) (a) | 7,369 | 66,175 | ||||
JNL/Lazard Emerging Markets Fund - Class I (4.4%) (a) | 3,552 | 32,716 | ||||
JNL/Oppenheimer Emerging Markets Innovator Fund - Class I (9.3%) (a) | 4,898 | 43,644 | ||||
142,535 | ||||||
Global Equity 4.7% | ||||||
JNL/Harris Oakmark Global Equity Fund - Class I (7.2%) (a) | 6,308 | 58,351 | ||||
JNL/Loomis Sayles Global Growth Fund - Class I (17.0%) (a) | 4,832 | 42,762 | ||||
101,113 | ||||||
See accompanying Notes to Financial Statements.
Abbreviations, counterparties and additional footnotes are defined on page 39
32
JNL Series Trust Master Feeder Funds and Funds of Funds
Schedules of Investments (in thousands)
December 31, 2018
Shares | Value ($) | ||||||
Global Fixed Income 3.3% | |||||||
JNL/Franklin Templeton Global Multisector Bond Fund - Class I (4.6%) (a) | 6,527 | 71,146 | |||||
International Equity 15.6% | |||||||
JNL Multi-Manager International Small Cap Fund - Class I (16.7%) (a) | 5,200 | 42,069 | |||||
JNL/Causeway International Value Select Fund - Class I (9.7%) (a) | 10,058 | 143,623 | |||||
JNL/WCM Focused International Equity Fund - Class I (11.5%) (a) | 11,793 | 152,483 | |||||
338,175 | |||||||
International Fixed Income 3.3% | |||||||
JNL/DoubleLine Emerging Markets Fixed Income Fund - Class I (14.2%) (a) | 6,830 | 71,369 | |||||
Total Investment Companies (cost $2,338,031) | 2,161,979 | ||||||
Total Investments 100.0% (cost $2,338,031) | 2,161,979 | ||||||
Other Assets and Liabilities, Net (0.0)% | (500) | ||||||
Total Net Assets 100.0% | 2,161,479 | ||||||
(a) The Fund's percentage ownership of the underlying affiliated fund at December 31, 2018 is presented parenthetically. The Fund does not invest in the underlying affiliated funds for the purpose of exercising management or control.
JNL Growth Allocation Fund | |||||||
INVESTMENT COMPANIES 100.0% | |||||||
Alternative 5.2% | |||||||
JNL Multi-Manager Alternative Fund - Class I (4.1%) (a) | 4,490 | 44,088 | |||||
JNL/Boston Partners Global Long Short Equity Fund - Class I (3.7%) (a) | 1,666 | 16,260 | |||||
JNL/First State Global Infrastructure Fund - Class I (1.2%) (a) | 851 | 10,811 | |||||
JNL/Heitman U.S. Focused Real Estate Fund - Class I (14.7%) (a) | 2,235 | 21,008 | |||||
JNL/Neuberger Berman Risk Balanced Commodity Strategy Fund - Class I (12.4%) (a) | 2,020 | 20,277 | |||||
112,444 | |||||||
Domestic Balanced 4.1% | |||||||
JNL/T. Rowe Price Capital Appreciation Fund - Class I (2.5%) (a) | 6,292 | 87,526 | |||||
Domestic Equity 34.8% | |||||||
JNL Multi-Manager Mid Cap Fund - Class I (15.8%) (a) | 12,938 | 142,702 | |||||
JNL Multi-Manager Small Cap Growth Fund - Class I (2.2%) (a) | 1,669 | 41,401 | |||||
JNL Multi-Manager Small Cap Value Fund - Class I (4.7%) (a) | 4,507 | 51,246 | |||||
JNL/DoubleLine Shiller Enhanced CAPE Fund - Class I (9.6%) (a) | 10,598 | 131,845 | |||||
JNL/Morningstar Wide Moat Index Fund - Class I (15.5%) (a) | 8,000 | 74,323 | |||||
JNL/T. Rowe Price Established Growth Fund - Class I (1.5%) (a) | 3,259 | 128,121 | |||||
JNL/T. Rowe Price Value Fund - Class I (3.3%) (a) | 9,270 | 133,496 | |||||
JNL/The Boston Company Equity Income Fund - Class I (18.2%) (a) | 3,271 | 46,870 | |||||
750,004 | |||||||
Domestic Fixed Income 13.4% | |||||||
JNL/Crescent High Income Fund - Class I (4.5%) (a) | 2,743 | 27,182 | |||||
JNL/DoubleLine Core Fixed Income Fund - Class I (1.5%) (a) | 4,101 | 55,493 | |||||
JNL/DoubleLine Total Return Fund - Class I (5.0%) (a) | 10,458 | 111,486 | |||||
JNL/PIMCO Income Fund - Class I (3.7%) (a) | 3,861 | 38,838 | |||||
JNL/PIMCO Investment Grade Corporate Bond Fund - Class I (9.2%) (a) | 3,544 | 38,915 | |||||
JNL/PIMCO Real Return Fund - Class I (0.9%) (a) | 1,702 | 16,607 | |||||
288,521 | |||||||
Emerging Markets Equity 9.0% | |||||||
JNL/GQG Emerging Markets Equity Fund - Class I (20.7%) (a) | 10,641 | 95,559 | |||||
JNL/Lazard Emerging Markets Fund - Class I (5.2%) (a) | 4,186 | 38,554 | |||||
Shares | Value ($) | ||||||
JNL/Oppenheimer Emerging Markets Innovator Fund - Class I (13.0%) (a) | 6,826 | 60,819 | |||||
194,932 | |||||||
Global Equity 7.9% | |||||||
JNL/Harris Oakmark Global Equity Fund - Class I (11.7%) (a) | 10,300 | 95,274 | |||||
JNL/Loomis Sayles Global Growth Fund - Class I (29.9%) (a) | 8,498 | 75,206 | |||||
170,480 | |||||||
Global Fixed Income 1.5% | |||||||
JNL/Franklin Templeton Global Multisector Bond Fund - Class I (2.1%) (a) | 3,030 | 33,025 | |||||
International Equity 22.0% | |||||||
JNL Multi-Manager International Small Cap Fund - Class I (29.0%) (a) | 9,048 | 73,196 | |||||
JNL/Causeway International Value Select Fund - Class I (12.9%) (a) | 13,401 | 191,362 | |||||
JNL/WCM Focused International Equity Fund - Class I (15.7%) (a) | 16,130 | 208,565 | |||||
473,123 | |||||||
International Fixed Income 2.1% | |||||||
JNL/DoubleLine Emerging Markets Fixed Income Fund - Class I (8.8%) (a) | 4,230 | 44,206 | |||||
Total Investment Companies (cost $2,390,606) | 2,154,261 | ||||||
Total Investments 100.0% (cost $2,390,606) | 2,154,261 | ||||||
Other Assets and Liabilities, Net (0.0)% | (476) | ||||||
Total Net Assets 100.0% | 2,153,785 | ||||||
(a) The Fund's percentage ownership of the underlying affiliated fund at December 31, 2018 is presented parenthetically. The Fund does not invest in the underlying affiliated funds for the purpose of exercising management or control.
JNL Aggressive Growth Allocation Fund | ||||||
INVESTMENT COMPANIES 100.0% | ||||||
Alternative 5.0% | ||||||
JNL Multi-Manager Alternative Fund - Class I (1.3%) (a) | 1,406 | 13,812 | ||||
JNL/Boston Partners Global Long Short Equity Fund - Class I (3.1%) (a) | 1,388 | 13,547 | ||||
JNL/First State Global Infrastructure Fund - Class I (1.6%) (a) | 1,066 | 13,537 | ||||
JNL/Heitman U.S. Focused Real Estate Fund - Class I (9.2%) (a) | 1,402 | 13,179 | ||||
JNL/Neuberger Berman Risk Balanced Commodity Strategy Fund - Class I (8.0%) (a) | 1,310 | 13,150 | ||||
67,225 | ||||||
Domestic Equity 41.0% | ||||||
JNL Multi-Manager Mid Cap Fund - Class I (10.1%) (a) | 8,313 | 91,691 | ||||
JNL Multi-Manager Small Cap Growth Fund - Class I (1.5%) (a) | 1,158 | 28,720 | ||||
JNL Multi-Manager Small Cap Value Fund - Class I (3.3%) (a) | 3,091 | 35,149 | ||||
JNL/DoubleLine Shiller Enhanced CAPE Fund - Class I (7.1%) (a) | 7,915 | 98,459 | ||||
JNL/Morningstar Wide Moat Index Fund - Class I (12.4%) (a) | 6,387 | 59,332 | ||||
JNL/T. Rowe Price Established Growth Fund - Class I (1.1%) (a) | 2,525 | 99,274 | ||||
JNL/T. Rowe Price Value Fund - Class I (2.5%) (a) | 6,902 | 99,384 | ||||
JNL/The Boston Company Equity Income Fund - Class I (13.8%) (a) | 2,490 | 35,678 | ||||
547,687 | ||||||
Domestic Fixed Income 7.6% | ||||||
JNL/Crescent High Income Fund - Class I (2.2%) (a) | 1,378 | 13,658 | ||||
JNL/DoubleLine Core Fixed Income Fund - Class I (1.1%) (a) | 3,093 | 41,854 | ||||
JNL/DoubleLine Total Return Fund - Class I (2.0%) (a) | 4,273 | 45,550 | ||||
101,062 | ||||||
Emerging Markets Equity 10.1% | ||||||
JNL/GQG Emerging Markets Equity Fund - Class I (14.5%) (a) | 7,436 | 66,780 | ||||
JNL/Lazard Emerging Markets Fund - Class I (3.7%) (a) | 2,976 | 27,411 | ||||
See accompanying Notes to Financial Statements.
Abbreviations, counterparties and additional footnotes are defined on page 39
33
JNL Series Trust Master Feeder Funds and Funds of Funds
Schedules of Investments (in thousands)
December 31, 2018
Shares | Value ($) | ||||||
JNL/Oppenheimer Emerging Markets Innovator Fund - Class I (8.8%) (a) | 4,629 | 41,247 | |||||
135,438 | |||||||
Global Equity 11.2% | |||||||
JNL/Harris Oakmark Global Equity Fund - Class I (11.8%) (a) | 10,356 | 95,792 | |||||
JNL/Loomis Sayles Global Growth Fund - Class I (21.3%) (a) | 6,050 | 53,543 | |||||
149,335 | |||||||
International Equity 24.1% | |||||||
JNL Multi-Manager International Small Cap Fund - Class I (20.7%) (a) | 6,438 | 52,080 | |||||
JNL/Causeway International Value Select Fund - Class I (9.0%) (a) | 9,356 | 133,601 | |||||
JNL/WCM Focused International Equity Fund - Class I (10.3%) (a) | 10,561 | 136,550 | |||||
322,231 | |||||||
International Fixed Income 1.0% | |||||||
JNL/DoubleLine Emerging Markets Fixed Income Fund - Class I (2.8%) (a) | 1,329 | 13,889 | |||||
Total Investment Companies (cost $1,511,220) | 1,336,867 | ||||||
Total Investments 100.0% (cost $1,511,220) | 1,336,867 | ||||||
Other Assets and Liabilities, Net (0.0)% | (305) | ||||||
Total Net Assets 100.0% | 1,336,562 | ||||||
(a) The Fund's percentage ownership of the underlying affiliated fund at December 31, 2018 is presented parenthetically. The Fund does not invest in the underlying affiliated funds for the purpose of exercising management or control.
JNL/Franklin Templeton Founding Strategy Fund | |||||||
INVESTMENT COMPANIES 100.0% | |||||||
Domestic Balanced 33.8% | |||||||
JNL/Franklin Templeton Income Fund - Class I (19.1%) (a) | 37,966 | 397,130 | |||||
Global Equity 66.2% | |||||||
JNL/Franklin Templeton Global Fund - Class I (47.3%) (a) | 41,631 | 388,415 | |||||
JNL/Franklin Templeton Mutual Shares Fund - Class I (40.3%) (a) | 38,334 | 391,005 | |||||
779,420 | |||||||
Total Investment Companies (cost $1,335,176) | 1,176,550 | ||||||
Total Investments 100.0% (cost $1,335,176) | 1,176,550 | ||||||
Other Assets and Liabilities, Net (0.0)% | (202) | ||||||
Total Net Assets 100.0% | 1,176,348 | ||||||
(a) The Fund's percentage ownership of the underlying affiliated fund at December 31, 2018 is presented parenthetically. The Fund does not invest in the underlying affiliated funds for the purpose of exercising management or control.
JNL/Mellon Capital 10 x 10 Fund | |||||||
INVESTMENT COMPANIES 100.0% | |||||||
Domestic Equity 79.3% | |||||||
JNL/Mellon Capital JNL 5 Fund - Class I (6.9%) (a) | 14,704 | 202,912 | |||||
JNL/Mellon Capital S&P 400 MidCap Index Fund - Class I (1.5%) (a) | 2,166 | 39,588 | |||||
JNL/Mellon Capital S&P 500 Index Fund - Class I (0.6%) (a) | 2,025 | 40,483 | |||||
JNL/Mellon Capital Small Cap Index Fund - Class I (1.8%) (a) | 2,406 | 39,216 | |||||
322,199 | |||||||
Domestic Fixed Income 10.5% | |||||||
JNL/Mellon Capital Bond Index Fund - Class I (3.8%) (a) | 3,607 | 42,741 | |||||
International Equity 10.2% | |||||||
JNL/Mellon Capital International Index Fund - Class I (2.5%) (a) | 3,312 | 41,341 | |||||
Total Investment Companies (cost $440,896) | 406,281 | ||||||
Total Investments 100.0% (cost $440,896) | 406,281 | ||||||
Other Assets and Liabilities, Net (0.0)% | (63) | ||||||
Total Net Assets 100.0% | 406,218 | ||||||
(a) The Fund's percentage ownership of the underlying affiliated fund at December 31, 2018 is presented parenthetically. The Fund does not invest in the underlying affiliated funds for the purpose of exercising management or control.
Shares | Value ($) | ||||||
JNL/Mellon Capital Index 5 Fund | |||||||
INVESTMENT COMPANIES 100.0% | |||||||
Domestic Equity 58.0% | |||||||
JNL/Mellon Capital S&P 400 MidCap Index Fund - Class I (6.2%) (a) | 9,092 | 166,193 | |||||
JNL/Mellon Capital S&P 500 Index Fund - Class I (2.3%) (a) | 8,540 | 170,722 | |||||
JNL/Mellon Capital Small Cap Index Fund - Class I (7.4%) (a) | 9,924 | 161,754 | |||||
498,669 | |||||||
Domestic Fixed Income 21.6% | |||||||
JNL/Mellon Capital Bond Index Fund - Class I (16.6%) (a) | 15,631 | 185,233 | |||||
International Equity 20.4% | |||||||
JNL/Mellon Capital International Index Fund - Class I (10.7%) (a) | 14,030 | 175,100 | |||||
Total Investment Companies (cost $953,371) | 859,002 | ||||||
Total Investments 100.0% (cost $953,371) | 859,002 | ||||||
Other Assets and Liabilities, Net (0.0)% | (126) | ||||||
Total Net Assets 100.0% | 858,876 | ||||||
(a) The Fund's percentage ownership of the underlying affiliated fund at December 31, 2018 is presented parenthetically. The Fund does not invest in the underlying affiliated funds for the purpose of exercising management or control.
JNL/S&P 4 Fund | |||||||
INVESTMENT COMPANIES 100.0% | |||||||
Domestic Equity 100.0% | |||||||
JNL/S&P Competitive Advantage Fund - Class I (62.0%) (a) | 95,452 | 1,486,184 | |||||
JNL/S&P Dividend Income & Growth Fund - Class I (32.5%) (a) | 109,071 | 1,482,277 | |||||
JNL/S&P Intrinsic Value Fund - Class I (66.4%) (a) | 108,936 | 1,457,565 | |||||
JNL/S&P Total Yield Fund - Class I (78.2%) (a) | 124,048 | 1,458,803 | |||||
Total Investment Companies (cost $6,202,214) | 5,884,829 | ||||||
Total Investments 100.0% (cost $6,202,214) | 5,884,829 | ||||||
Other Assets and Liabilities, Net (0.0)% | (852) | ||||||
Total Net Assets 100.0% | 5,883,977 | ||||||
(a) The Fund's percentage ownership of the underlying affiliated fund at December 31, 2018 is presented parenthetically. The Fund does not invest in the underlying affiliated funds for the purpose of exercising management or control.
JNL/S&P Managed Conservative Fund | ||||||
INVESTMENT COMPANIES 100.0% | ||||||
Alternative 3.0% | ||||||
JNL Multi-Manager Alternative Fund - Class I (3.4%) (a) | 3,737 | 36,693 | ||||
JNL/Invesco Global Real Estate Fund - Class I (0.0%) (a) | 4 | 37 | ||||
36,730 | ||||||
Domestic Equity 14.6% | ||||||
JNL Multi-Manager Mid Cap Fund - Class I (1.3%) (a) | 1,064 | 11,737 | ||||
JNL Multi-Manager Small Cap Growth Fund - Class I (0.6%) (a) | 469 | 11,640 | ||||
JNL Multi-Manager Small Cap Value Fund - Class I (1.1%) (a) | 1,026 | 11,663 | ||||
JNL/ClearBridge Large Cap Growth Fund - Class I (2.1%) (a) | 1,079 | 11,725 | ||||
JNL/DFA U.S. Core Equity Fund - Class I (2.2%) (a) | 1,790 | 23,398 | ||||
JNL/Invesco Diversified Dividend Fund - Class I (2.5%) (a) | 1,239 | 11,873 | ||||
JNL/JPMorgan MidCap Growth Fund - Class I (1.3%) (a) | 776 | 23,616 | ||||
JNL/MFS Mid Cap Value Fund - Class I (1.0%) (a) | 1,134 | 11,504 | ||||
JNL/T. Rowe Price Established Growth Fund - Class I (0.3%) (a) | 596 | 23,425 | ||||
JNL/T. Rowe Price Value Fund - Class I (0.9%) (a) | 2,462 | 35,450 | ||||
JNL/WMC Value Fund - Class I (0.2%) (a) | 126 | 2,411 | ||||
178,442 | ||||||
Domestic Fixed Income 67.4% | ||||||
JNL/Crescent High Income Fund - Class I (6.0%) (a) | 3,670 | 36,365 | ||||
JNL/DoubleLine Core Fixed Income Fund - Class I (1.7%) (a) | 4,555 | 61,631 | ||||
See accompanying Notes to Financial Statements.
Abbreviations, counterparties and additional footnotes are defined on page 39
34
JNL Series Trust Master Feeder Funds and Funds of Funds
Schedules of Investments (in thousands)
December 31, 2018
Shares | Value ($) | ||||||
JNL/DoubleLine Total Return Fund - Class I (4.9%) (a) | 10,429 | 111,170 | |||||
JNL/Goldman Sachs Core Plus Bond Fund - Class I (3.8%) (a) | 3,248 | 37,032 | |||||
JNL/JPMorgan U.S. Government & Quality Bond Fund - Class I (4.4%) (a) | 3,705 | 49,496 | |||||
JNL/PIMCO Income Fund - Class I (5.8%) (a) | 6,124 | 61,604 | |||||
JNL/PIMCO Real Return Fund - Class I (5.6%) (a) | 10,112 | 98,695 | |||||
JNL/PPM America Floating Rate Income Fund - Class I (1.5%) (a) | 2,402 | 24,311 | |||||
JNL/PPM America High Yield Bond Fund - Class I (2.7%) (a) | 4,232 | 60,131 | |||||
JNL/PPM America Low Duration Bond Fund - Class I (12.5%) (a) | 8,579 | 86,216 | |||||
JNL/PPM America Total Return Fund - Class I (7.7%) (a) | 7,495 | 86,192 | |||||
JNL/Scout Unconstrained Bond Fund - Class I (6.3%) (a) | 2,579 | 24,735 | |||||
JNL/T. Rowe Price Short-Term Bond Fund - Class I (5.0%) (a) | 8,735 | 86,215 | |||||
823,793 | |||||||
Global Equity 1.0% | |||||||
JNL/Oppenheimer Global Growth Fund - Class I (0.5%) (a) | 745 | 11,836 | |||||
Global Fixed Income 9.0% | |||||||
JNL/Franklin Templeton Global Multisector Bond Fund - Class I (5.6%) (a) | 7,868 | 85,763 | |||||
JNL/Neuberger Berman Strategic Income Fund - Class I (3.6%) (a) | 2,299 | 24,532 | |||||
110,295 | |||||||
International Equity 3.0% | |||||||
JNL/Causeway International Value Select Fund - Class I (0.8%) (a) | 842 | 12,027 | |||||
JNL/Invesco International Growth Fund - Class I (1.1%) (a) | 978 | 12,088 | |||||
JNL/WCM Focused International Equity Fund - Class I (0.9%) (a) | 932 | 12,051 | |||||
36,166 | |||||||
International Fixed Income 2.0% | |||||||
JNL/DoubleLine Emerging Markets Fixed Income Fund - Class I (2.5%) (a) | 1,178 | 12,309 | |||||
JNL/Goldman Sachs Emerging Markets Debt Fund - Class I (4.5%) (a) | 1,165 | 12,398 | |||||
24,707 | |||||||
Total Investment Companies (cost $1,270,793) | 1,221,969 | ||||||
Total Investments 100.0% (cost $1,270,793) | 1,221,969 | ||||||
Other Assets and Liabilities, Net (0.0)% | (314) | ||||||
Total Net Assets 100.0% | 1,221,655 | ||||||
(a) The Fund's percentage ownership of the underlying affiliated fund at December 31, 2018 is presented parenthetically. The Fund does not invest in the underlying affiliated funds for the purpose of exercising management or control.
JNL/S&P Managed Moderate Fund | |||||||
INVESTMENT COMPANIES 100.0% | |||||||
Alternative 3.5% | |||||||
JNL Multi-Manager Alternative Fund - Class I (8.5%) (a) | 9,338 | 91,697 | |||||
JNL/Invesco Global Real Estate Fund - Class I (0.6%) (a) | 913 | 8,233 | |||||
99,930 | |||||||
Domestic Equity 29.0% | |||||||
JNL Multi-Manager Mid Cap Fund - Class I (3.3%) (a) | 2,727 | 30,075 | |||||
JNL Multi-Manager Small Cap Growth Fund - Class I (1.5%) (a) | 1,146 | 28,433 | |||||
JNL Multi-Manager Small Cap Value Fund - Class I (2.9%) (a) | 2,727 | 31,012 | |||||
JNL/BlackRock Large Cap Select Growth Fund - Class I (0.9%) (a) | 835 | 29,607 | |||||
JNL/ClearBridge Large Cap Growth Fund - Class I (7.9%) (a) | 4,142 | 45,021 | |||||
JNL/DFA U.S. Core Equity Fund - Class I (2.6%) (a) | 2,193 | 28,661 | |||||
JNL/Invesco Diversified Dividend Fund - Class I (18.4%) (a) | 9,228 | 88,402 | |||||
JNL/Invesco Small Cap Growth Fund - Class I (1.5%) (a) | 1,231 | 27,622 | |||||
Shares | Value ($) | ||||||
JNL/JPMorgan MidCap Growth Fund - Class I (3.2%) (a) | 1,954 | 59,471 | |||||
JNL/MFS Mid Cap Value Fund - Class I (1.7%) (a) | 2,038 | 20,671 | |||||
JNL/T. Rowe Price Established Growth Fund - Class I (2.7%) (a) | 5,965 | 234,505 | |||||
JNL/T. Rowe Price Value Fund - Class I (4.4%) (a) | 12,242 | 176,286 | |||||
JNL/WMC Value Fund - Class I (2.4%) (a) | 1,586 | 30,410 | |||||
830,176 | |||||||
Domestic Fixed Income 48.8% | |||||||
JNL/Crescent High Income Fund - Class I (15.1%) (a) | 9,269 | 91,854 | |||||
JNL/DoubleLine Core Fixed Income Fund - Class I (2.1%) (a) | 5,546 | 75,035 | |||||
JNL/DoubleLine Total Return Fund - Class I (9.9%) (a) | 20,886 | 222,649 | |||||
JNL/JPMorgan U.S. Government & Quality Bond Fund - Class I (7.9%) (a) | 6,616 | 88,387 | |||||
JNL/PIMCO Income Fund - Class I (8.0%) (a) | 8,447 | 84,983 | |||||
JNL/PIMCO Real Return Fund - Class I (10.5%) (a) | 18,968 | 185,129 | |||||
JNL/PPM America High Yield Bond Fund - Class I (5.5%) (a) | 8,433 | 119,835 | |||||
JNL/PPM America Low Duration Bond Fund - Class I (25.2%) (a) | 17,310 | 173,963 | |||||
JNL/PPM America Total Return Fund - Class I (14.0%) (a) | 13,621 | 156,642 | |||||
JNL/Scout Unconstrained Bond Fund - Class I (14.1%) (a) | 5,733 | 54,981 | |||||
JNL/T. Rowe Price Short-Term Bond Fund - Class I (8.3%) (a) | 14,392 | 142,050 | |||||
1,395,508 | |||||||
Emerging Markets Equity 1.4% | |||||||
JNL/Lazard Emerging Markets Fund - Class I (3.8%) (a) | 3,064 | 28,217 | |||||
JNL/Oppenheimer Emerging Markets Innovator Fund - Class I (2.6%) (a) | 1,364 | 12,150 | |||||
40,367 | |||||||
Global Equity 1.1% | |||||||
JNL/Oppenheimer Global Growth Fund - Class I (1.5%) (a) | 2,029 | 32,250 | |||||
Global Fixed Income 9.1% | |||||||
JNL/Franklin Templeton Global Multisector Bond Fund - Class I (14.2%) (a) | 20,156 | 219,705 | |||||
JNL/Neuberger Berman Strategic Income Fund - Class I (5.8%) (a) | 3,730 | 39,796 | |||||
259,501 | |||||||
International Equity 5.0% | |||||||
JNL/Causeway International Value Select Fund - Class I (1.9%) (a) | 1,950 | 27,842 | |||||
JNL/Invesco International Growth Fund - Class I (3.0%) (a) | 2,638 | 32,605 | |||||
JNL/Lazard International Strategic Equity Fund - Class I (14.6%) (a) | 1,849 | 22,092 | |||||
JNL/WCM Focused International Equity Fund - Class I (4.5%) (a) | 4,657 | 60,220 | |||||
142,759 | |||||||
International Fixed Income 2.1% | |||||||
JNL/DoubleLine Emerging Markets Fixed Income Fund - Class I (6.2%) (a) | 2,978 | 31,120 | |||||
JNL/Goldman Sachs Emerging Markets Debt Fund - Class I (10.9%) (a) | 2,848 | 30,300 | |||||
61,420 | |||||||
Total Investment Companies (cost $3,017,356) | 2,861,911 | ||||||
Total Investments 100.0% (cost $3,017,356) | 2,861,911 | ||||||
Other Assets and Liabilities, Net (0.0)% | (674) | ||||||
Total Net Assets 100.0% | 2,861,237 | ||||||
(a) The Fund's percentage ownership of the underlying affiliated fund at December 31, 2018 is presented parenthetically. The Fund does not invest in the underlying affiliated funds for the purpose of exercising management or control.
JNL/S&P Managed Moderate Growth Fund | ||||||
INVESTMENT COMPANIES 100.0% | ||||||
Alternative 4.1% | ||||||
JNL Multi-Manager Alternative Fund - Class I (16.3%) (a) | 17,966 | 176,429 | ||||
See accompanying Notes to Financial Statements.
Abbreviations, counterparties and additional footnotes are defined on page 39
35
JNL Series Trust Master Feeder Funds and Funds of Funds
Schedules of Investments (in thousands)
December 31, 2018
Shares | Value ($) | ||||||
JNL/Invesco Global Real Estate Fund - Class I (3.6%) (a) | 5,156 | 46,508 | |||||
222,937 | |||||||
Domestic Equity 43.5% | |||||||
JNL Multi-Manager Mid Cap Fund - Class I (11.4%) (a) | 9,319 | 102,784 | |||||
JNL Multi-Manager Small Cap Growth Fund - Class I (3.3%) (a) | 2,530 | 62,783 | |||||
JNL Multi-Manager Small Cap Value Fund - Class I (10.0%) (a) | 9,465 | 107,612 | |||||
JNL/BlackRock Large Cap Select Growth Fund - Class I (6.3%) (a) | 5,738 | 203,521 | |||||
JNL/ClearBridge Large Cap Growth Fund - Class I (20.1%) (a) | 10,531 | 114,468 | |||||
JNL/Invesco Diversified Dividend Fund - Class I (25.3%) (a) | 12,680 | 121,474 | |||||
JNL/Invesco Small Cap Growth Fund - Class I (3.1%) (a) | 2,466 | 55,340 | |||||
JNL/JPMorgan MidCap Growth Fund - Class I (7.2%) (a) | 4,429 | 134,821 | |||||
JNL/MFS Mid Cap Value Fund - Class I (3.5%) (a) | 4,213 | 42,719 | |||||
JNL/PPM America Mid Cap Value Fund - Class I (4.8%) (a) | 2,223 | 25,140 | |||||
JNL/T. Rowe Price Established Growth Fund - Class I (7.9%) (a) | 17,349 | 681,973 | |||||
JNL/T. Rowe Price Value Fund - Class I (13.5%) (a) | 38,071 | 548,218 | |||||
JNL/WMC Value Fund - Class I (14.3%) (a) | 9,430 | 180,779 | |||||
2,381,632 | |||||||
Domestic Fixed Income 32.7% | |||||||
JNL/Crescent High Income Fund - Class I (20.0%) (a) | 12,297 | 121,861 | |||||
JNL/DoubleLine Core Fixed Income Fund - Class I (1.9%) (a) | 5,044 | 68,241 | |||||
JNL/DoubleLine Total Return Fund - Class I (8.1%) (a) | 17,001 | 181,230 | |||||
JNL/Goldman Sachs Core Plus Bond Fund - Class I (5.5%) (a) | 4,632 | 52,805 | |||||
JNL/JPMorgan U.S. Government & Quality Bond Fund - Class I (7.9%) (a) | 6,589 | 88,031 | |||||
JNL/PIMCO Income Fund - Class I (13.1%) (a) | 13,830 | 139,135 | |||||
JNL/PIMCO Real Return Fund - Class I (12.3%) (a) | 22,325 | 217,889 | |||||
JNL/PPM America High Yield Bond Fund - Class I (7.9%) (a) | 12,207 | 173,460 | |||||
JNL/PPM America Low Duration Bond Fund - Class I (39.4%) (a) | 27,064 | 271,998 | |||||
JNL/PPM America Total Return Fund - Class I (16.1%) (a) | 15,642 | 179,881 | |||||
JNL/Scout Unconstrained Bond Fund - Class I (21.3%) (a) | 8,655 | 83,006 | |||||
JNL/T. Rowe Price Short-Term Bond Fund - Class I (12.4%) (a) | 21,503 | 212,234 | |||||
1,789,771 | |||||||
Emerging Markets Equity 2.8% | |||||||
JNL/GQG Emerging Markets Equity Fund - Class I (4.6%) (a) | 2,374 | 21,323 | |||||
JNL/Lazard Emerging Markets Fund - Class I (7.4%) (a) | 5,921 | 54,529 | |||||
JNL/Oppenheimer Emerging Markets Innovator Fund - Class I (16.9%) (a) | 8,892 | 79,226 | |||||
155,078 | |||||||
Global Equity 3.2% | |||||||
JNL/Oppenheimer Global Growth Fund - Class I (7.9%) (a) | 11,093 | 176,266 | |||||
Global Fixed Income 5.5% | |||||||
JNL/Franklin Templeton Global Multisector Bond Fund - Class I (19.4%) (a) | 27,515 | 299,911 | |||||
International Equity 6.1% | |||||||
JNL/Causeway International Value Select Fund - Class I (5.8%) (a) | 6,000 | 85,683 | |||||
JNL/Invesco International Growth Fund - Class I (6.9%) (a) | 5,991 | 74,055 | |||||
JNL/Lazard International Strategic Equity Fund - Class I (18.3%) (a) | 2,311 | 27,613 | |||||
JNL/WCM Focused International Equity Fund - Class I (11.0%) (a) | 11,266 | 145,672 | |||||
333,023 | |||||||
Shares | Value ($) | ||||||
International Fixed Income 2.1% | |||||||
JNL/DoubleLine Emerging Markets Fixed Income Fund - Class I (11.9%) (a) | 5,687 | 59,431 | |||||
JNL/Goldman Sachs Emerging Markets Debt Fund - Class I (20.7%) (a) | 5,421 | 57,679 | |||||
117,110 | |||||||
Total Investment Companies (cost $5,880,277) | 5,475,728 | ||||||
Total Investments 100.0% (cost $5,880,277) | 5,475,728 | ||||||
Other Assets and Liabilities, Net (0.0)% | (1,237) | ||||||
Total Net Assets 100.0% | 5,474,491 | ||||||
(a) The Fund's percentage ownership of the underlying affiliated fund at December 31, 2018 is presented parenthetically. The Fund does not invest in the underlying affiliated funds for the purpose of exercising management or control.
JNL/S&P Managed Growth Fund | ||||||
INVESTMENT COMPANIES 100.0% | ||||||
Alternative 4.0% | ||||||
JNL Multi-Manager Alternative Fund - Class I (13.9%) (a) | 15,308 | 150,327 | ||||
JNL/Invesco Global Real Estate Fund - Class I (3.4%) (a) | 4,931 | 44,478 | ||||
194,805 | ||||||
Domestic Equity 59.7% | ||||||
JNL Multi-Manager Mid Cap Fund - Class I (10.0%) (a) | 8,230 | 90,777 | ||||
JNL Multi-Manager Small Cap Growth Fund - Class I (5.5%) (a) | 4,239 | 105,160 | ||||
JNL Multi-Manager Small Cap Value Fund - Class I (9.1%) (a) | 8,608 | 97,876 | ||||
JNL/BlackRock Large Cap Select Growth Fund - Class I (11.4%) (a) | 10,396 | 368,752 | ||||
JNL/ClearBridge Large Cap Growth Fund - Class I (30.9%) (a) | 16,205 | 176,154 | ||||
JNL/Invesco Diversified Dividend Fund - Class I (24.6%) (a) | 12,342 | 118,239 | ||||
JNL/Invesco Small Cap Growth Fund - Class I (2.7%) (a) | 2,204 | 49,455 | ||||
JNL/JPMorgan MidCap Growth Fund - Class I (5.8%) (a) | 3,535 | 107,595 | ||||
JNL/MFS Mid Cap Value Fund - Class I (5.1%) (a) | 6,092 | 61,771 | ||||
JNL/PPM America Mid Cap Value Fund - Class I (2.8%) (a) | 1,275 | 14,424 | ||||
JNL/T. Rowe Price Established Growth Fund - Class I (8.1%) (a) | 17,973 | 706,509 | ||||
JNL/T. Rowe Price Mid-Cap Growth Fund - Class I (3.7%) (a) | 4,364 | 195,405 | ||||
JNL/T. Rowe Price Value Fund - Class I (15.8%) (a) | 44,447 | 640,043 | ||||
JNL/WMC Value Fund - Class I (16.6%) (a) | 10,926 | 209,448 | ||||
2,941,608 | ||||||
Domestic Fixed Income 17.4% | ||||||
JNL/Crescent High Income Fund - Class I (17.1%) (a) | 10,517 | 104,219 | ||||
JNL/DoubleLine Core Fixed Income Fund - Class I (0.2%) (a) | 431 | 5,830 | ||||
JNL/DoubleLine Total Return Fund - Class I (2.4%) (a) | 5,009 | 53,397 | ||||
JNL/PIMCO Income Fund - Class I (10.4%) (a) | 10,913 | 109,788 | ||||
JNL/PIMCO Real Return Fund - Class I (6.5%) (a) | 11,709 | 114,283 | ||||
JNL/PPM America High Yield Bond Fund - Class I (4.6%) (a) | 7,028 | 99,861 | ||||
JNL/PPM America Low Duration Bond Fund - Class I (15.6%) (a) | 10,725 | 107,783 | ||||
JNL/PPM America Total Return Fund - Class I (8.9%) (a) | 8,638 | 99,342 | ||||
JNL/Scout Unconstrained Bond Fund - Class I (13.5%) (a) | 5,495 | 52,699 | ||||
JNL/T. Rowe Price Short-Term Bond Fund - Class I (6.3%) (a) | 10,935 | 107,931 | ||||
855,133 | ||||||
Emerging Markets Equity 4.0% | ||||||
JNL/GQG Emerging Markets Equity Fund - Class I (7.3%) (a) | 3,729 | 33,483 | ||||
JNL/Lazard Emerging Markets Fund - Class I (11.6%) (a) | 9,270 | 85,381 | ||||
See accompanying Notes to Financial Statements.
Abbreviations, counterparties and additional footnotes are defined on page 39
36
JNL Series Trust Master Feeder Funds and Funds of Funds
Schedules of Investments (in thousands)
December 31, 2018
Shares | Value ($) | ||||||
JNL/Oppenheimer Emerging Markets Innovator Fund - Class I (16.9%) (a) | 8,874 | 79,064 | |||||
197,928 | |||||||
Global Equity 5.6% | |||||||
JNL/Oppenheimer Global Growth Fund - Class I (12.5%) (a) | 17,485 | 277,833 | |||||
International Equity 7.2% | |||||||
JNL/Causeway International Value Select Fund - Class I (6.4%) (a) | 6,607 | 94,344 | |||||
JNL/Invesco International Growth Fund - Class I (5.8%) (a) | 5,097 | 62,993 | |||||
JNL/Lazard International Strategic Equity Fund - Class I (17.6%) (a) | 2,229 | 26,635 | |||||
JNL/WCM Focused International Equity Fund - Class I (12.9%) (a) | 13,234 | 171,120 | |||||
355,092 | |||||||
International Fixed Income 2.1% | |||||||
JNL/DoubleLine Emerging Markets Fixed Income Fund - Class I (10.6%) (a) | 5,093 | 53,222 | |||||
JNL/Goldman Sachs Emerging Markets Debt Fund - Class I (17.8%) (a) | 4,643 | 49,399 | |||||
102,621 | |||||||
Total Investment Companies (cost $5,346,686) | 4,925,020 | ||||||
Total Investments 100.0% (cost $5,346,686) | 4,925,020 | ||||||
Other Assets and Liabilities, Net (0.0)% | (1,099) | ||||||
Total Net Assets 100.0% | 4,923,921 | ||||||
(a) The Fund's percentage ownership of the underlying affiliated fund at December 31, 2018 is presented parenthetically. The Fund does not invest in the underlying affiliated funds for the purpose of exercising management or control.
JNL/S&P Managed Aggressive Growth Fund | |||||||
INVESTMENT COMPANIES 100.0% | |||||||
Alternative 3.9% | |||||||
JNL Multi-Manager Alternative Fund - Class I (5.5%) (a) | 6,071 | 59,613 | |||||
JNL/Invesco Global Real Estate Fund - Class I (1.5%) (a) | 2,133 | 19,243 | |||||
78,856 | |||||||
Domestic Equity 67.6% | |||||||
JNL Multi-Manager Mid Cap Fund - Class I (3.7%) (a) | 3,051 | 33,650 | |||||
JNL Multi-Manager Small Cap Growth Fund - Class I (2.2%) (a) | 1,696 | 42,075 | |||||
JNL Multi-Manager Small Cap Value Fund - Class I (4.6%) (a) | 4,341 | 49,355 | |||||
JNL/BlackRock Large Cap Select Growth Fund - Class I (5.3%) (a) | 4,853 | 172,123 | |||||
JNL/ClearBridge Large Cap Growth Fund - Class I (17.7%) (a) | 9,302 | 101,116 | |||||
JNL/Invesco Diversified Dividend Fund - Class I (18.5%) (a) | 9,291 | 89,007 | |||||
JNL/Invesco Small Cap Growth Fund - Class I (1.4%) (a) | 1,094 | 24,558 | |||||
JNL/JPMorgan MidCap Growth Fund - Class I (3.3%) (a) | 1,999 | 60,842 | |||||
JNL/MFS Mid Cap Value Fund - Class I (1.9%) (a) | 2,272 | 23,042 | |||||
JNL/T. Rowe Price Established Growth Fund - Class I (3.2%) (a) | 7,137 | 280,579 | |||||
JNL/T. Rowe Price Mid-Cap Growth Fund - Class I (1.9%) (a) | 2,305 | 103,213 | |||||
JNL/T. Rowe Price Value Fund - Class I (7.0%) (a) | 19,620 | 282,532 | |||||
JNL/WMC Value Fund - Class I (7.2%) (a) | 4,762 | 91,296 | |||||
1,353,388 | |||||||
Domestic Fixed Income 7.1% | |||||||
JNL/DoubleLine Total Return Fund - Class I (0.9%) (a) | 1,936 | 20,635 | |||||
JNL/PIMCO Income Fund - Class I (1.3%) (a) | 1,399 | 14,074 | |||||
JNL/PPM America High Yield Bond Fund - Class I (1.8%) (a) | 2,755 | 39,144 | |||||
JNL/PPM America Total Return Fund - Class I (1.8%) (a) | 1,761 | 20,254 | |||||
JNL/Scout Unconstrained Bond Fund - Class I (2.1%) (a) | 846 | 8,109 | |||||
Shares | Value ($) | ||||||
JNL/T. Rowe Price Short-Term Bond Fund - Class I (2.4%) (a) | 4,137 | 40,834 | |||||
143,050 | |||||||
Emerging Markets Equity 5.2% | |||||||
JNL/GQG Emerging Markets Equity Fund - Class I (4.7%) (a) | 2,404 | 21,587 | |||||
JNL/Lazard Emerging Markets Fund - Class I (5.5%) (a) | 4,400 | 40,527 | |||||
JNL/Oppenheimer Emerging Markets Innovator Fund - Class I (8.7%) (a) | 4,599 | 40,978 | |||||
103,092 | |||||||
Global Equity 6.0% | |||||||
JNL/Oppenheimer Global Growth Fund - Class I (5.4%) (a) | 7,569 | 120,267 | |||||
International Equity 9.2% | |||||||
JNL/Causeway International Value Select Fund - Class I (3.7%) (a) | 3,829 | 54,676 | |||||
JNL/Invesco International Growth Fund - Class I (2.0%) (a) | 1,762 | 21,774 | |||||
JNL/Lazard International Strategic Equity Fund - Class I (9.1%) (a) | 1,149 | 13,730 | |||||
JNL/WCM Focused International Equity Fund - Class I (7.2%) (a) | 7,341 | 94,917 | |||||
185,097 | |||||||
International Fixed Income 1.0% | |||||||
JNL/DoubleLine Emerging Markets Fixed Income Fund - Class I (4.0%) (a) | 1,910 | 19,964 | |||||
JNL/Goldman Sachs Emerging Markets Debt Fund - Class I (0.2%) (a) | 58 | 617 | |||||
20,581 | |||||||
Total Investment Companies (cost $2,185,259) | 2,004,331 | ||||||
Total Investments 100.0% (cost $2,185,259) | 2,004,331 | ||||||
Other Assets and Liabilities, Net (0.0)% | (462) | ||||||
Total Net Assets 100.0% | 2,003,869 | ||||||
(a) The Fund's percentage ownership of the underlying affiliated fund at December 31, 2018 is presented parenthetically. The Fund does not invest in the underlying affiliated funds for the purpose of exercising management or control.
JNL/Vanguard Global Bond Market Index Fund | |||||||
INVESTMENT COMPANIES 100.0% | |||||||
Domestic Fixed Income 50.1% | |||||||
Vanguard Intermediate-Term Bond Index Fund - Admiral Shares | 468 | 5,160 | |||||
Vanguard Long-Term Bond Index Fund - Investor Shares | 333 | 4,409 | |||||
Vanguard Mortgage-Backed Securities Index Fund - Admiral Shares | 275 | 5,664 | |||||
Vanguard Short-Term Bond Index Fund - Admiral Shares | 958 | 9,871 | |||||
Vanguard Total Bond Market Index Fund - Admiral Shares | 1,030 | 10,762 | |||||
35,866 | |||||||
International Fixed Income 49.9% | |||||||
Vanguard Total International Bond Index Fund - Admiral Shares | 1,644 | 35,655 | |||||
Total Investment Companies (cost $71,741) | 71,521 | ||||||
Total Investments 100.0% (cost $71,741) | 71,521 | ||||||
Other Assets and Liabilities, Net (0.0)% | (15) | ||||||
Total Net Assets 100.0% | 71,506 | ||||||
JNL/Vanguard International Stock Market Index Fund | ||||||
INVESTMENT COMPANIES 100.0% | ||||||
International Equity 100.0% | ||||||
Vanguard Developed Markets Index Fund - Admiral Shares | 7,029 | 84,074 | ||||
Vanguard Emerging Markets Stock Index Fund - Admiral Shares | 1,284 | 40,773 | ||||
Vanguard European Stock Index Fund - Admiral Shares | 534 | 32,512 | ||||
Vanguard FTSE All-World ex-US Index Fund - Admiral Shares | 718 | 20,365 | ||||
Vanguard FTSE All-World ex-US Small-Cap Index Fund - Investor Shares | 62 | 2,249 | ||||
See accompanying Notes to Financial Statements.
Abbreviations, counterparties and additional footnotes are defined on page 39
37
JNL Series Trust Master Feeder Funds and Funds of Funds
Schedules of Investments (in thousands)
December 31, 2018
Shares | Value ($) | ||||||
Vanguard Pacific Stock Index Fund - Admiral Shares | 313 | 23,548 | |||||
Vanguard Total International Stock Index Fund - Admiral Shares | 891 | 22,612 | |||||
Total Investment Companies (cost $266,766) | 226,133 | ||||||
Total Investments 100.0% (cost $266,766) | 226,133 | ||||||
Other Assets and Liabilities, Net (0.0)% | (70) | ||||||
Total Net Assets 100.0% | 226,063 | ||||||
JNL/Vanguard U.S. Stock Market Index Fund | |||||||
INVESTMENT COMPANIES 100.0% | |||||||
Domestic Equity 100.0% | |||||||
Vanguard Growth Index Fund - Admiral Shares | 700 | 48,369 | |||||
Vanguard Large-Cap Index Fund - Admiral Shares | 1,005 | 58,274 | |||||
Vanguard Mid-Cap Index Fund - Admiral Shares | 49 | 8,306 | |||||
Vanguard Small-Cap Index Fund - Admiral Shares | 366 | 23,127 | |||||
Vanguard Total Stock Market Index Fund - Admiral Shares | 1,309 | 81,288 | |||||
Vanguard Value Index Fund - Admiral Shares | 1,351 | 51,575 | |||||
Total Investment Companies (cost $297,596) | 270,939 | ||||||
Total Investments 100.0% (cost $297,596) | 270,939 | ||||||
Other Assets and Liabilities, Net (0.0)% | (74) | ||||||
Total Net Assets 100.0% | 270,865 | ||||||
See accompanying Notes to Financial Statements.
Abbreviations, counterparties and additional footnotes are defined on page 39
38
JNL Series Trust Master Feeder Funds and Funds of Funds
Schedules of Investments (in thousands)
December 31, 2018
Abbreviations:
CAPE - Cyclically Adjusted Price Earnings |
FTSE - Financial Times and the London Stock Exchange |
S&P - Standard & Poor's |
Long Term Investments in Affiliates
The Funds of Funds, except for JNL/American Funds Funds of Funds, JNL DFA/Funds and JNL/Vanguard Funds Funds of Funds, invested solely in shares of other affiliated Funds advised by Jackson National Asset Management, LLC. The JNL/American Funds Funds of Funds, JNL DFA Funds and JNL Vanguard Funds Funds of Funds may invest in underlying funds that are considered affiliated companies. As defined by the 1940 Act, as amended, an affiliated company is one in which the Fund owns 5% or more of the outstanding voting securities. Based on each Fund’s relative ownership for all or some portion of the year ended December 31, 2018, certain Funds of Funds may be deemed an affiliated person thereof under the 1940 Act. JNL/American Funds Master Feeder Funds and JNL/Vanguard Funds Master Feeder Funds invest primarily all of their investable assets in the respective Master Fund. Due to their ownership of more than 5% of the shares of the Master Fund, certain Master Feeder Funds may be deemed an affiliated person thereof under the 1940 Act. The following table details each Fund's long term investments in affiliates held during the year ended December 31, 2018.
Affiliate | Value Beginning of Period($) | Purchases($) | Sales Proceeds($) | Distributions from Funds($) | Realized Gain/Loss from Sales($) | Change in Unrealized Appreciation (Depreciation)($) | Value End of Period($) | Percentage of Net Assets(%) | |||||||||||||||||
JNL/American Funds Blue Chip Income and Growth Fund | |||||||||||||||||||||||||
American Funds Insurance Series - Blue Chip Income and Growth Fund - Class 1 | 3,451,583 | 349,187 | 277,590 | 326,045 | 102,200 | (698,332 | ) | 2,927,048 | 100.0 | ||||||||||||||||
3,451,583 | 349,187 | 277,590 | 326,045 | 102,200 | (698,332 | ) | 2,927,048 | 100.0 | |||||||||||||||||
JNL/American Funds Global Bond Fund | |||||||||||||||||||||||||
American Funds Insurance Series - Global Bond Fund - Class 1 | 520,376 | 79,078 | 75,330 | 14,163 | (3,950 | ) | (17,878 | ) | 502,296 | 100.0 | |||||||||||||||
520,376 | 79,078 | 75,330 | 14,163 | (3,950 | ) | (17,878 | ) | 502,296 | 100.0 | ||||||||||||||||
JNL/American Funds Global Small Capitalization Fund | |||||||||||||||||||||||||
American Funds Insurance Series - Global Small Capitalization Fund - Class 1 | 682,363 | 85,956 | 40,003 | 34,070 | 9,116 | (116,390 | ) | 621,042 | 100.0 | ||||||||||||||||
682,363 | 85,956 | 40,003 | 34,070 | 9,116 | (116,390 | ) | 621,042 | 100.0 | |||||||||||||||||
JNL/American Funds Growth-Income Fund | |||||||||||||||||||||||||
American Funds Insurance Series - Growth-Income Fund - Class 1 | 5,854,309 | 1,068,186 | 113,653 | 541,755 | 34,285 | (700,309 | ) | 6,142,818 | 100.0 | ||||||||||||||||
5,854,309 | 1,068,186 | 113,653 | 541,755 | 34,285 | (700,309 | ) | 6,142,818 | 100.0 | |||||||||||||||||
JNL/American Funds International Fund | |||||||||||||||||||||||||
American Funds Insurance Series - International Fund - Class 1 | 2,024,311 | 259,803 | 150,356 | 136,162 | 20,108 | (420,120 | ) | 1,733,746 | 100.0 | ||||||||||||||||
2,024,311 | 259,803 | 150,356 | 136,162 | 20,108 | (420,120 | ) | 1,733,746 | 100.0 | |||||||||||||||||
JNL/American Funds New World Fund | |||||||||||||||||||||||||
American Funds Insurance Series - New World Fund - Class 1 | 1,409,466 | 161,605 | 104,037 | 52,813 | 5,208 | (255,813 | ) | 1,216,429 | 100.0 | ||||||||||||||||
1,409,466 | 161,605 | 104,037 | 52,813 | 5,208 | (255,813 | ) | 1,216,429 | 100.0 | |||||||||||||||||
JNL/Vanguard Capital Growth Fund | |||||||||||||||||||||||||
Vanguard Variable Insurance Fund - Capital Growth Portfolio | 71,748 | 257,440 | 22,171 | 4,676 | 1,488 | (24,333 | ) | 284,172 | 100.0 | ||||||||||||||||
71,748 | 257,440 | 22,171 | 4,676 | 1,488 | (24,333 | ) | 284,172 | 100.0 | |||||||||||||||||
JNL/Vanguard Equity Income Fund | |||||||||||||||||||||||||
Vanguard Variable Insurance Fund - Equity Income Portfolio | 29,469 | 152,090 | 6,490 | 5,402 | (111 | ) | (15,620 | ) | 159,338 | 100.0 | |||||||||||||||
29,469 | 152,090 | 6,490 | 5,402 | (111 | ) | (15,620 | ) | 159,338 | 100.0 | ||||||||||||||||
JNL/Vanguard International Fund | |||||||||||||||||||||||||
Vanguard Variable Insurance Fund - International Portfolio | 78,659 | 516,861 | 50,551 | 8,772 | (2,069 | ) | (92,365 | ) | 450,535 | 100.0 | |||||||||||||||
78,659 | 516,861 | 50,551 | 8,772 | (2,069 | ) | (92,365 | ) | 450,535 | 100.0 | ||||||||||||||||
JNL/Vanguard Small Company Growth Fund | |||||||||||||||||||||||||
Vanguard Variable Insurance Fund - Small Company Growth Portfolio | 55,919 | 304,018 | 31,968 | 7,545 | (611 | ) | (56,216 | ) | 271,142 | 100.0 | |||||||||||||||
55,919 | 304,018 | 31,968 | 7,545 | (611 | ) | (56,216 | ) | 271,142 | 100.0 | ||||||||||||||||
JNL Institutional Alt 25 Fund | |||||||||||||||||||||||||
JNL Multi-Manager Alternative Fund - Class I | 90,128 | 63,187 | 14,705 | 238 | (18 | ) | (4,624 | ) | 133,968 | 5.1 | |||||||||||||||
JNL Multi-Manager International Small Cap Fund - Class I | — | 61,968 | 1,053 | — | (84 | ) | (10,134 | ) | 50,697 | 1.9 | |||||||||||||||
JNL Multi-Manager Mid Cap Fund - Class I | 132,355 | 41,067 | 45,588 | 8,067 | 3,132 | (16,345 | ) | 114,621 | 4.3 | ||||||||||||||||
See accompanying Notes to Financial Statements.
39
JNL Series Trust Master Feeder Funds and Funds of Funds
Schedules of Investments (in thousands)
December 31, 2018
Affiliate | Value Beginning of Period($) | Purchases($) | Sales Proceeds($) | Distributions from Funds($) | Realized Gain/Loss from Sales($) | Change in Unrealized Appreciation (Depreciation)($) | Value End of Period($) | Percentage of Net Assets(%) | |||||||||||||||||
JNL Multi-Manager Small Cap Growth Fund - Class I | 24,656 | 16,561 | 8,077 | 1,303 | 1,419 | (3,386 | ) | 31,173 | 1.2 | ||||||||||||||||
JNL Multi-Manager Small Cap Value Fund - Class I | 24,695 | 33,157 | 5,279 | 3,564 | 276 | (9,582 | ) | 43,267 | 1.6 | ||||||||||||||||
JNL/AQR Large Cap Relaxed Constraint Equity Fund - Class I | 57,533 | 16,766 | 33,329 | 1,890 | 258 | (8,669 | ) | 32,559 | 1.2 | ||||||||||||||||
JNL/AQR Managed Futures Strategy Fund - Class I | 82,017 | — | 44,085 | — | (40 | ) | (5,057 | ) | 32,835 | 1.2 | |||||||||||||||
JNL/BlackRock Global Long Short Credit Fund - Class I | 32,607 | — | 19,096 | — | 182 | (354 | ) | 13,339 | 0.5 | ||||||||||||||||
JNL/Boston Partners Global Long Short Equity Fund - Class I | 147,682 | 3,642 | 23,742 | 3,642 | 374 | (15,814 | ) | 112,142 | 4.3 | ||||||||||||||||
JNL/Causeway International Value Select Fund - Class I | 224,310 | 9,491 | 42,047 | 3,458 | 1,087 | (37,773 | ) | 155,068 | 5.9 | ||||||||||||||||
JNL/Crescent High Income Fund - Class I | 53,912 | 14,620 | 26,051 | 1,889 | 69 | (2,825 | ) | 39,725 | 1.5 | ||||||||||||||||
JNL/DFA U.S. Small Cap Fund - Class I | 43,011 | 2,310 | 29,067 | 2,310 | 1,858 | (6,003 | ) | 12,109 | 0.5 | ||||||||||||||||
JNL/DoubleLine Core Fixed Income Fund - Class I | — | 102,127 | 13,178 | 2,410 | (70 | ) | (1,170 | ) | 87,709 | 3.3 | |||||||||||||||
JNL/DoubleLine Emerging Markets Fixed Income Fund - Class I | 97,143 | 18,723 | 28,925 | 3,723 | (1,493 | ) | (4,765 | ) | 80,683 | 3.1 | |||||||||||||||
JNL/DoubleLine Shiller Enhanced CAPE Fund - Class I | 178,982 | 28,877 | 77,747 | 20,427 | 2,628 | (24,376 | ) | 108,364 | 4.1 | ||||||||||||||||
JNL/DoubleLine Total Return Fund - Class I | 236,000 | 33,207 | 110,009 | 5,468 | (892 | ) | (2,497 | ) | 155,809 | 5.9 | |||||||||||||||
JNL/Eaton Vance Global Macro Absolute Return Advantage Fund - Class I | 81,490 | — | 15,676 | — | (488 | ) | (5,096 | ) | 60,230 | 2.3 | |||||||||||||||
JNL/First State Global Infrastructure Fund - Class I | 23,941 | 14,491 | 2,739 | 1,014 | (131 | ) | (2,817 | ) | 32,745 | 1.2 | |||||||||||||||
JNL/Franklin Templeton Global Multisector Bond Fund - Class I | 96,560 | 1,400 | 31,916 | — | (232 | ) | 1,191 | 67,003 | 2.5 | ||||||||||||||||
JNL/GQG Emerging Markets Equity Fund - Class I | 73,774 | 23,641 | 9,753 | — | (218 | ) | (12,756 | ) | 74,688 | 2.8 | |||||||||||||||
JNL/Harris Oakmark Global Equity Fund - Class I | 131,885 | 27,213 | 39,089 | 2,662 | 453 | (24,457 | ) | 96,005 | 3.6 | ||||||||||||||||
JNL/Heitman U.S. Focused Real Estate Fund - Class I | — | 36,968 | 3,494 | — | 63 | (1,915 | ) | 31,622 | 1.2 | ||||||||||||||||
JNL/Invesco Global Real Estate Fund - Class I | 82,379 | 1,088 | 66,585 | 1,088 | 612 | (4,413 | ) | 13,081 | 0.5 | ||||||||||||||||
JNL/JPMorgan Hedged Equity Fund - Class I | — | 27,806 | 733 | 133 | (2 | ) | (309 | ) | 26,762 | 1.0 | |||||||||||||||
JNL/Lazard Emerging Markets Fund - Class I | 58,504 | 1,116 | 16,417 | 776 | (928 | ) | (8,952 | ) | 33,323 | 1.3 | |||||||||||||||
JNL/Loomis Sayles Global Growth Fund - Class I | — | 59,591 | 3,085 | — | (105 | ) | (4,593 | ) | 51,808 | 2.0 | |||||||||||||||
JNL/Mellon Capital International Index Fund - Class I | 33,141 | — | 33,275 | — | 1,483 | (1,349 | ) | — | — | ||||||||||||||||
JNL/Mellon Capital Real Estate Sector Fund - Class I | 40,569 | — | 40,304 | — | 686 | (951 | ) | — | — | ||||||||||||||||
JNL/Mellon Capital S&P 500 Index Fund - Class I | 74,234 | 462 | 79,648 | — | 10,044 | (5,092 | ) | — | — | ||||||||||||||||
JNL/Morningstar Wide Moat Index Fund - Class I | — | 119,369 | 9,619 | — | 165 | (7,466 | ) | 102,449 | 3.9 | ||||||||||||||||
JNL/Neuberger Berman Currency Fund - Class I | 32,051 | 1,005 | 5,772 | 1,005 | 51 | (465 | ) | 26,870 | 1.0 | ||||||||||||||||
JNL/Neuberger Berman Risk Balanced Commodity Strategy Fund - Class I | — | 39,428 | 4,084 | 178 | (29 | ) | (4,472 | ) | 30,843 | 1.2 | |||||||||||||||
JNL/Nicholas Convertible Arbitrage Fund - Class I | 31,319 | 807 | 4,806 | 806 | 54 | (554 | ) | 26,820 | 1.0 | ||||||||||||||||
JNL/Oppenheimer Emerging Markets Innovator Fund - Class I | 42,232 | 16,860 | 7,157 | 1,505 | (243 | ) | (11,643 | ) | 40,049 | 1.5 | |||||||||||||||
JNL/PIMCO Income Fund - Class I | 64,526 | 16,258 | 20,014 | 258 | 52 | (102 | ) | 60,720 | 2.3 | ||||||||||||||||
JNL/PIMCO Real Return Fund - Class I | 48,976 | 6,206 | 27,229 | 226 | (203 | ) | (804 | ) | 26,946 | 1.0 | |||||||||||||||
JNL/PPM America Long Short Credit Fund - Class I | 40,823 | 1,125 | 20,794 | 1,125 | 134 | (1,522 | ) | 19,766 | 0.8 | ||||||||||||||||
JNL/PPM America Total Return Fund - Class I | 97,932 | 2,093 | 29,265 | 2,093 | (449 | ) | (2,822 | ) | 67,489 | 2.6 | |||||||||||||||
JNL/Scout Unconstrained Bond Fund - Class I | 73,026 | 1,934 | 38,738 | 1,934 | (1,179 | ) | (1,156 | ) | 33,887 | 1.3 | |||||||||||||||
JNL/T. Rowe Price Established Growth Fund - Class I | 154,982 | 22,392 | 57,221 | 14,479 | 7,858 | (18,577 | ) | 109,434 | 4.2 | ||||||||||||||||
JNL/T. Rowe Price Value Fund - Class I | 188,755 | 26,226 | 75,864 | 17,751 | 773 | (30,499 | ) | 109,391 | 4.2 | ||||||||||||||||
JNL/The London Company Focused U.S. Equity Fund - Class I | 108,224 | 10,211 | 39,378 | 10,211 | 1,840 | (17,098 | ) | 63,799 | 2.4 | ||||||||||||||||
JNL/WCM Focused International Equity Fund - Class I | 230,894 | 11,719 | 67,572 | 5,190 | 5,039 | (20,658 | ) | 159,422 | 6.0 | ||||||||||||||||
JNL/Westchester Capital Event Driven Fund - Class I | 73,382 | 9,413 | 15,157 | 4,077 | 610 | (851 | ) | 67,397 | 2.6 | ||||||||||||||||
3,308,630 | 924,525 | 1,287,362 | 124,900 | 34,396 | (343,572 | ) | 2,636,617 | 100.0 | |||||||||||||||||
JNL Institutional Alt 50 Fund | |||||||||||||||||||||||||
JNL Multi-Manager Alternative Fund - Class I | 173,413 | 91,930 | 31,057 | 412 | (12 | ) | (8,091 | ) | 226,183 | 9.9 | |||||||||||||||
JNL Multi-Manager International Small Cap Fund - Class I | — | 33,703 | 560 | — | (71 | ) | (5,612 | ) | 27,460 | 1.2 | |||||||||||||||
JNL Multi-Manager Mid Cap Fund - Class I | 65,253 | 19,406 | 17,037 | 3,644 | 1,583 | (8,731 | ) | 60,474 | 2.6 | ||||||||||||||||
JNL Multi-Manager Small Cap Growth Fund - Class I | 14,426 | 7,774 | 5,099 | 748 | 865 | (1,809 | ) | 16,157 | 0.7 | ||||||||||||||||
JNL Multi-Manager Small Cap Value Fund - Class I | 14,447 | 16,515 | 4,338 | 2,294 | 205 | (5,448 | ) | 21,381 | 0.9 | ||||||||||||||||
JNL/AQR Large Cap Relaxed Constraint Equity Fund - Class I | 144,131 | 3,484 | 76,723 | 3,480 | 1,269 | (15,870 | ) | 56,291 | 2.5 | ||||||||||||||||
JNL/AQR Managed Futures Strategy Fund - Class I | 144,540 | 1,746 | 74,179 | — | 168 | (9,249 | ) | 63,026 | 2.8 | ||||||||||||||||
JNL/BlackRock Global Long Short Credit Fund - Class I | 57,618 | — | 34,172 | — | 331 | (623 | ) | 23,154 | 1.0 | ||||||||||||||||
JNL/Boston Partners Global Long Short Equity Fund - Class I | 296,135 | 6,368 | 79,966 | 6,310 | 1,298 | (28,877 | ) | 194,958 | 8.5 | ||||||||||||||||
JNL/Causeway International Value Select Fund - Class I | 109,521 | 18,402 | 25,759 | 1,618 | 677 | (18,695 | ) | 84,146 | 3.7 | ||||||||||||||||
JNL/Crescent High Income Fund - Class I | 44,921 | 6,694 | 26,876 | 1,227 | 51 | (1,799 | ) | 22,991 | 1.0 | ||||||||||||||||
JNL/DFA U.S. Small Cap Fund - Class I | 19,191 | 302 | 17,351 | 302 | 1,081 | (1,638 | ) | 1,585 | 0.1 | ||||||||||||||||
JNL/DoubleLine Core Fixed Income Fund - Class I | — | 69,097 | 9,971 | 1,605 | (39 | ) | (731 | ) | 58,356 | 2.6 | |||||||||||||||
JNL/DoubleLine Emerging Markets Fixed Income Fund - Class I | 72,111 | 8,306 | 23,969 | 2,304 | (906 | ) | (3,131 | ) | 52,411 | 2.3 | |||||||||||||||
JNL/DoubleLine Shiller Enhanced CAPE Fund - Class I | 108,240 | 27,170 | 56,491 | 12,304 | 2,884 | (15,614 | ) | 66,189 | 2.9 | ||||||||||||||||
JNL/DoubleLine Total Return Fund - Class I | 158,296 | 28,916 | 73,719 | 3,787 | (636 | ) | (1,627 | ) | 111,230 | 4.9 | |||||||||||||||
See accompanying Notes to Financial Statements.
40
JNL Series Trust Master Feeder Funds and Funds of Funds
Schedules of Investments (in thousands)
December 31, 2018
Affiliate | Value Beginning of Period($) | Purchases($) | Sales Proceeds($) | Distributions from Funds($) | Realized Gain/Loss from Sales($) | Change in Unrealized Appreciation (Depreciation)($) | Value End of Period($) | Percentage of Net Assets(%) | |||||||||||||||||
JNL/Eaton Vance Global Macro Absolute Return Advantage Fund - Class I | 158,452 | 18 | 32,148 | — | (534 | ) | (9,841 | ) | 115,947 | 5.1 | |||||||||||||||
JNL/First State Global Infrastructure Fund - Class I | 28,652 | 38,332 | 5,199 | 1,744 | (253 | ) | (4,785 | ) | 56,747 | 2.5 | |||||||||||||||
JNL/Franklin Templeton Global Multisector Bond Fund - Class I | 56,507 | 6,193 | 16,818 | — | (110 | ) | 666 | 46,438 | 2.0 | ||||||||||||||||
JNL/GQG Emerging Markets Equity Fund - Class I | 36,029 | 19,347 | 6,773 | — | (70 | ) | (7,471 | ) | 41,062 | 1.8 | |||||||||||||||
JNL/Harris Oakmark Global Equity Fund - Class I | 72,627 | 21,548 | 33,381 | 1,141 | 376 | (11,325 | ) | 49,845 | 2.2 | ||||||||||||||||
JNL/Heitman U.S. Focused Real Estate Fund - Class I | — | 51,128 | 4,479 | — | 71 | (3,152 | ) | 43,568 | 1.9 | ||||||||||||||||
JNL/Invesco Global Real Estate Fund - Class I | 87,115 | 1,874 | 61,447 | 1,874 | 388 | (5,286 | ) | 22,644 | 1.0 | ||||||||||||||||
JNL/JPMorgan Hedged Equity Fund - Class I | — | 48,537 | 1,696 | 231 | 1 | (534 | ) | 46,308 | 2.0 | ||||||||||||||||
JNL/Lazard Emerging Markets Fund - Class I | 29,406 | 561 | 7,666 | 407 | (351 | ) | (4,613 | ) | 17,337 | 0.8 | |||||||||||||||
JNL/Loomis Sayles Global Growth Fund - Class I | — | 32,416 | 1,414 | — | (77 | ) | (2,916 | ) | 28,009 | 1.2 | |||||||||||||||
JNL/Mellon Capital Real Estate Sector Fund - Class I | 50,158 | — | 50,423 | — | 1,440 | (1,175 | ) | — | — | ||||||||||||||||
JNL/Mellon Capital S&P 500 Index Fund - Class I | 36,149 | 19,000 | 58,660 | — | 5,990 | (2,479 | ) | — | — | ||||||||||||||||
JNL/Morningstar Wide Moat Index Fund - Class I | — | 72,153 | 7,050 | — | 115 | (4,333 | ) | 60,885 | 2.7 | ||||||||||||||||
JNL/Neuberger Berman Currency Fund - Class I | 28,415 | 27,741 | 8,443 | 1,741 | 56 | (1,187 | ) | 46,582 | 2.0 | ||||||||||||||||
JNL/Neuberger Berman Risk Balanced Commodity Strategy Fund - Class I | — | 69,354 | 7,636 | 308 | 20 | (7,819 | ) | 53,919 | 2.4 | ||||||||||||||||
JNL/Nicholas Convertible Arbitrage Fund - Class I | 57,519 | 1,397 | 11,607 | 1,397 | 123 | (975 | ) | 46,457 | 2.0 | ||||||||||||||||
JNL/Oppenheimer Emerging Markets Innovator Fund - Class I | 22,212 | 12,523 | 4,979 | 819 | (99 | ) | (6,509 | ) | 23,148 | 1.0 | |||||||||||||||
JNL/PIMCO Income Fund - Class I | 57,567 | 175 | 16,696 | 174 | 37 | (213 | ) | 40,870 | 1.8 | ||||||||||||||||
JNL/PIMCO Real Return Fund - Class I | 28,817 | 196 | 10,921 | 196 | (1 | ) | (608 | ) | 17,483 | 0.8 | |||||||||||||||
JNL/PPM America Long Short Credit Fund - Class I | 79,299 | 1,705 | 44,438 | 1,705 | 613 | (2,758 | ) | 34,421 | 1.5 | ||||||||||||||||
JNL/PPM America Total Return Fund - Class I | 93,697 | 1,450 | 45,661 | 1,450 | (635 | ) | (2,148 | ) | 46,703 | 2.0 | |||||||||||||||
JNL/Scout Unconstrained Bond Fund - Class I | 79,136 | 1,435 | 55,177 | 1,435 | (1,191 | ) | (766 | ) | 23,437 | 1.0 | |||||||||||||||
JNL/T. Rowe Price Established Growth Fund - Class I | 100,496 | 31,054 | 57,026 | 10,441 | 5,641 | (13,395 | ) | 66,770 | 2.9 | ||||||||||||||||
JNL/T. Rowe Price Value Fund - Class I | 115,266 | 34,758 | 62,259 | 13,048 | (1,644 | ) | (19,431 | ) | 66,690 | 2.9 | |||||||||||||||
JNL/WCM Focused International Equity Fund - Class I | 116,165 | 19,283 | 41,212 | 2,616 | 3,045 | (10,932 | ) | 86,349 | 3.8 | ||||||||||||||||
JNL/Westchester Capital Event Driven Fund - Class I | 137,133 | 17,199 | 37,543 | 7,067 | 1,316 | (1,579 | ) | 116,526 | 5.1 | ||||||||||||||||
2,893,060 | 869,190 | 1,248,019 | 87,829 | 23,015 | (253,109 | ) | 2,284,137 | 100.0 | |||||||||||||||||
JNL/American Funds Moderate Growth Allocation Fund | |||||||||||||||||||||||||
American Funds Emerging Markets Bond Fund - Class R-6 | — | 116,534 | 3,553 | 5,066 | (426 | ) | (10,389 | ) | 102,166 | 4.8 | |||||||||||||||
American Funds Insurance Series - International Growth and Income Fund - Class 1 | 89,326 | 46,125 | 1,208 | 3,194 | 95 | (17,435 | ) | 116,903 | 5.4 | ||||||||||||||||
89,326 | 162,659 | 4,761 | 8,260 | (331 | ) | (27,824 | ) | 219,069 | 10.2 | ||||||||||||||||
JNL/American Funds Growth Allocation Fund | |||||||||||||||||||||||||
American Funds Emerging Markets Bond Fund - Class R-6 | — | 63,211 | 3,496 | 2,701 | (416 | ) | (5,285 | ) | 54,014 | 2.3 | |||||||||||||||
American Funds Insurance Series - International Growth and Income Fund - Class 1 | 104,751 | 56,833 | 1,955 | 3,784 | (24 | ) | (20,705 | ) | 138,900 | 6.1 | |||||||||||||||
104,751 | 120,044 | 5,451 | 6,485 | (440 | ) | (25,990 | ) | 192,914 | 8.4 | ||||||||||||||||
JNL Moderate Growth Allocation Fund | |||||||||||||||||||||||||
JNL Multi-Manager Alternative Fund - Class I | 62,142 | 12,116 | 16,913 | 129 | (390 | ) | (2,265 | ) | 54,690 | 2.5 | |||||||||||||||
JNL Multi-Manager International Small Cap Fund - Class I | — | 52,155 | 354 | — | (30 | ) | (9,702 | ) | 42,069 | 1.9 | |||||||||||||||
JNL Multi-Manager Mid Cap Fund - Class I | 102,560 | 20,277 | 17,506 | 5,296 | 1,637 | (11,865 | ) | 95,103 | 4.4 | ||||||||||||||||
JNL Multi-Manager Small Cap Growth Fund - Class I | 25,104 | 15,910 | 5,714 | 2,104 | 986 | (4,859 | ) | 31,427 | 1.5 | ||||||||||||||||
JNL Multi-Manager Small Cap Value Fund - Class I | 25,325 | 24,540 | 3,798 | 4,295 | 177 | (10,028 | ) | 36,216 | 1.7 | ||||||||||||||||
JNL/Boston Partners Global Long Short Equity Fund - Class I | 24,989 | 1,076 | 1,503 | 700 | (1 | ) | (2,925 | ) | 21,636 | 1.0 | |||||||||||||||
JNL/Causeway International Value Select Fund - Class I | 189,549 | 12,529 | 25,225 | 3,155 | 546 | (33,776 | ) | 143,623 | 6.6 | ||||||||||||||||
JNL/Crescent High Income Fund - Class I | 59,240 | 7,108 | 19,331 | 2,707 | 23 | (3,601 | ) | 43,439 | 2.0 | ||||||||||||||||
JNL/DoubleLine Core Fixed Income Fund - Class I | — | 114,120 | 8,153 | 2,726 | (31 | ) | (1,440 | ) | 104,496 | 4.8 | |||||||||||||||
JNL/DoubleLine Emerging Markets Fixed Income Fund - Class I | 92,585 | 10,066 | 26,196 | 2,834 | (752 | ) | (4,334 | ) | 71,369 | 3.3 | |||||||||||||||
JNL/DoubleLine Shiller Enhanced CAPE Fund - Class I | 100,578 | 20,671 | 15,743 | 12,353 | 1,725 | (17,291 | ) | 89,940 | 4.2 | ||||||||||||||||
JNL/DoubleLine Total Return Fund - Class I | 195,281 | 48,433 | 64,535 | 5,812 | (588 | ) | (2,166 | ) | 176,425 | 8.2 | |||||||||||||||
JNL/Eaton Vance Global Macro Absolute Return Advantage Fund - Class I | 23,809 | 7,247 | 29,520 | — | (1,063 | ) | (473 | ) | — | — | |||||||||||||||
JNL/First State Global Infrastructure Fund - Class I | — | 12,260 | 749 | 412 | (17 | ) | (745 | ) | 10,749 | 0.5 | |||||||||||||||
JNL/FPA + DoubleLine Flexible Allocation Fund - Class I | 118,373 | 5,384 | 30,913 | 4,439 | 1,338 | (13,086 | ) | 81,096 | 3.8 | ||||||||||||||||
JNL/Franklin Templeton Global Multisector Bond Fund - Class I | 72,390 | 15,652 | 17,589 | — | (126 | ) | 819 | 71,146 | 3.3 | ||||||||||||||||
JNL/GQG Emerging Markets Equity Fund - Class I | 62,461 | 22,520 | 7,400 | — | (384 | ) | (11,022 | ) | 66,175 | 3.1 | |||||||||||||||
JNL/Harris Oakmark Global Equity Fund - Class I | 74,235 | 9,133 | 8,180 | 1,963 | (160 | ) | (16,677 | ) | 58,351 | 2.7 | |||||||||||||||
JNL/Heitman U.S. Focused Real Estate Fund - Class I | — | 17,790 | 876 | — | (11 | ) | (1,237 | ) | 15,666 | 0.7 | |||||||||||||||
JNL/Invesco Diversified Dividend Fund - Class I | 98,995 | 2,651 | 99,554 | 293 | 1,158 | (3,250 | ) | — | — | ||||||||||||||||
See accompanying Notes to Financial Statements.
41
JNL Series Trust Master Feeder Funds and Funds of Funds
Schedules of Investments (in thousands)
December 31, 2018
Affiliate | Value Beginning of Period($) | Purchases($) | Sales Proceeds($) | Distributions from Funds($) | Realized Gain/Loss from Sales($) | Change in Unrealized Appreciation (Depreciation)($) | Value End of Period($) | Percentage of Net Assets(%) | |||||||||||||||||
JNL/Invesco Global Real Estate Fund - Class I | 18,733 | 1,430 | 18,945 | 587 | (423 | ) | (795 | ) | — | — | |||||||||||||||
JNL/Lazard Emerging Markets Fund - Class I | 44,198 | 8,270 | 10,143 | 763 | (965 | ) | (8,644 | ) | 32,716 | 1.5 | |||||||||||||||
JNL/Loomis Sayles Global Growth Fund - Class I | — | 50,499 | 2,305 | — | (63 | ) | (5,369 | ) | 42,762 | 2.0 | |||||||||||||||
JNL/Mellon Capital International Index Fund - Class I | 25,215 | 165 | 24,577 | — | 224 | (1,027 | ) | — | — | ||||||||||||||||
JNL/Mellon Capital Real Estate Sector Fund - Class I | 11,721 | 1,821 | 14,194 | — | 918 | (266 | ) | — | — | ||||||||||||||||
JNL/Mellon Capital S&P 500 Index Fund - Class I | 63,522 | 233 | 67,384 | — | 7,986 | (4,357 | ) | — | — | ||||||||||||||||
JNL/Morningstar Wide Moat Index Fund - Class I | — | 69,247 | 2,455 | — | 75 | (3,179 | ) | 63,688 | 2.9 | ||||||||||||||||
JNL/Neuberger Berman Risk Balanced Commodity Strategy Fund - Class I | — | 19,310 | 1,714 | 88 | (21 | ) | (2,038 | ) | 15,537 | 0.7 | |||||||||||||||
JNL/Oppenheimer Emerging Markets Innovator Fund - Class I | 44,581 | 17,937 | 6,252 | 1,606 | (384 | ) | (12,238 | ) | 43,644 | 2.0 | |||||||||||||||
JNL/PIMCO Income Fund - Class I | 67,260 | 14,398 | 15,590 | 282 | 43 | (105 | ) | 66,006 | 3.1 | ||||||||||||||||
JNL/PIMCO Investment Grade Corporate Bond Fund - Class I | 91,947 | 5,521 | 32,081 | 2,679 | (827 | ) | (3,976 | ) | 60,584 | 2.8 | |||||||||||||||
JNL/PIMCO Real Return Fund - Class I | 36,376 | 6,334 | 19,965 | 185 | (148 | ) | (614 | ) | 21,983 | 1.0 | |||||||||||||||
JNL/PPM America Total Return Fund - Class I | 92,103 | 4,608 | 21,944 | 2,222 | (411 | ) | (2,857 | ) | 71,499 | 3.3 | |||||||||||||||
JNL/Scout Unconstrained Bond Fund - Class I | 73,131 | 4,310 | 41,600 | 2,256 | (1,675 | ) | (1,069 | ) | 33,097 | 1.5 | |||||||||||||||
JNL/T. Rowe Price Capital Appreciation Fund - Class I | 198,620 | 6,787 | 38,510 | 6,036 | 2,051 | (5,930 | ) | 163,018 | 7.5 | ||||||||||||||||
JNL/T. Rowe Price Established Growth Fund - Class I | 99,856 | 20,162 | 18,414 | 11,172 | 2,493 | (13,264 | ) | 90,833 | 4.2 | ||||||||||||||||
JNL/T. Rowe Price Value Fund - Class I | 101,117 | 19,615 | 8,857 | 12,279 | 273 | (21,635 | ) | 90,513 | 4.2 | ||||||||||||||||
JNL/WCM Focused International Equity Fund - Class I | 187,691 | 19,440 | 38,953 | 4,922 | 2,965 | (18,660 | ) | 152,483 | 7.1 | ||||||||||||||||
2,483,687 | 701,725 | 783,635 | 94,295 | 16,148 | (255,946 | ) | 2,161,979 | 100.0 | |||||||||||||||||
JNL Growth Allocation Fund | |||||||||||||||||||||||||
JNL Multi-Manager Alternative Fund - Class I | 49,446 | 13,622 | 16,725 | 109 | (396 | ) | (1,859 | ) | 44,088 | 2.0 | |||||||||||||||
JNL Multi-Manager International Small Cap Fund - Class I | — | 91,146 | 450 | — | (42 | ) | (17,458 | ) | 73,196 | 3.4 | |||||||||||||||
JNL Multi-Manager Mid Cap Fund - Class I | 152,129 | 23,341 | 16,543 | 8,337 | 1,499 | (17,724 | ) | 142,702 | 6.6 | ||||||||||||||||
JNL Multi-Manager Small Cap Growth Fund - Class I | 31,814 | 21,801 | 6,509 | 2,904 | 1,189 | (6,894 | ) | 41,401 | 1.9 | ||||||||||||||||
JNL Multi-Manager Small Cap Value Fund - Class I | 31,941 | 38,838 | 4,011 | 6,652 | 182 | (15,704 | ) | 51,246 | 2.4 | ||||||||||||||||
JNL/Boston Partners Global Long Short Equity Fund - Class I | 24,883 | 7,871 | 13,609 | 710 | (264 | ) | (2,621 | ) | 16,260 | 0.8 | |||||||||||||||
JNL/Causeway International Value Select Fund - Class I | 254,527 | 13,293 | 31,197 | 4,334 | 460 | (45,721 | ) | 191,362 | 8.9 | ||||||||||||||||
JNL/Crescent High Income Fund - Class I | 41,376 | 6,185 | 18,247 | 1,561 | 39 | (2,171 | ) | 27,182 | 1.3 | ||||||||||||||||
JNL/DoubleLine Core Fixed Income Fund - Class I | — | 63,998 | 7,660 | 1,529 | (61 | ) | (784 | ) | 55,493 | 2.6 | |||||||||||||||
JNL/DoubleLine Emerging Markets Fixed Income Fund - Class I | 45,776 | 7,522 | 6,115 | 1,757 | (283 | ) | (2,694 | ) | 44,206 | 2.1 | |||||||||||||||
JNL/DoubleLine Shiller Enhanced CAPE Fund - Class I | 177,946 | 21,196 | 42,613 | 20,862 | 2,052 | (26,736 | ) | 131,845 | 6.1 | ||||||||||||||||
JNL/DoubleLine Total Return Fund - Class I | 126,919 | 44,518 | 58,208 | 3,382 | (491 | ) | (1,252 | ) | 111,486 | 5.2 | |||||||||||||||
JNL/Eaton Vance Global Macro Absolute Return Advantage Fund - Class I | 24,605 | 795 | 23,996 | — | (908 | ) | (496 | ) | — | — | |||||||||||||||
JNL/First State Global Infrastructure Fund - Class I | — | 12,607 | 985 | 417 | (22 | ) | (789 | ) | 10,811 | 0.5 | |||||||||||||||
JNL/FPA + DoubleLine Flexible Allocation Fund - Class I | 100,036 | 716 | 101,823 | — | 4,672 | (3,601 | ) | — | — | ||||||||||||||||
JNL/Franklin Templeton Global Multisector Bond Fund - Class I | 48,212 | 2,728 | 18,406 | — | (132 | ) | 623 | 33,025 | 1.5 | ||||||||||||||||
JNL/GQG Emerging Markets Equity Fund - Class I | 88,247 | 32,338 | 7,990 | — | (530 | ) | (16,506 | ) | 95,559 | 4.4 | |||||||||||||||
JNL/Harris Oakmark Global Equity Fund - Class I | 126,151 | 10,905 | 13,276 | 3,331 | (304 | ) | (28,202 | ) | 95,274 | 4.4 | |||||||||||||||
JNL/Heitman U.S. Focused Real Estate Fund - Class I | — | 24,120 | 1,318 | — | (22 | ) | (1,772 | ) | 21,008 | 1.0 | |||||||||||||||
JNL/Invesco Global Real Estate Fund - Class I | 37,013 | 2,478 | 37,382 | 599 | (556 | ) | (1,553 | ) | — | — | |||||||||||||||
JNL/Lazard Emerging Markets Fund - Class I | 63,824 | 9,641 | 21,996 | 909 | (2,337 | ) | (10,578 | ) | 38,554 | 1.8 | |||||||||||||||
JNL/Loomis Sayles Global Growth Fund - Class I | — | 88,313 | 3,278 | — | (118 | ) | (9,711 | ) | 75,206 | 3.5 | |||||||||||||||
JNL/Mellon Capital International Index Fund - Class I | 50,687 | 390 | 49,871 | — | 857 | (2,063 | ) | — | — | ||||||||||||||||
JNL/Mellon Capital Real Estate Sector Fund - Class I | 25,110 | 1,421 | 26,788 | — | 845 | (588 | ) | — | — | ||||||||||||||||
JNL/Mellon Capital S&P 500 Index Fund - Class I | 89,312 | 58 | 95,158 | — | 11,914 | (6,126 | ) | — | — | ||||||||||||||||
JNL/Morningstar Wide Moat Index Fund - Class I | — | 83,331 | 3,920 | — | 37 | (5,125 | ) | 74,323 | 3.4 | ||||||||||||||||
JNL/Neuberger Berman Risk Balanced Commodity Strategy Fund - Class I | — | 25,737 | 2,846 | 118 | (41 | ) | (2,573 | ) | 20,277 | 0.9 | |||||||||||||||
JNL/Oppenheimer Emerging Markets Innovator Fund - Class I | 51,809 | 34,584 | 6,857 | 2,321 | (595 | ) | (18,122 | ) | 60,819 | 2.8 | |||||||||||||||
JNL/PIMCO Income Fund - Class I | 24,962 | 16,538 | 2,737 | 142 | 8 | 67 | 38,838 | 1.8 | |||||||||||||||||
JNL/PIMCO Investment Grade Corporate Bond Fund - Class I | 61,406 | 4,408 | 23,749 | 1,722 | (558 | ) | (2,592 | ) | 38,915 | 1.8 | |||||||||||||||
JNL/PIMCO Real Return Fund - Class I | 36,836 | 1,364 | 20,778 | 187 | (174 | ) | (641 | ) | 16,607 | 0.8 | |||||||||||||||
JNL/Scout Unconstrained Bond Fund - Class I | 36,646 | 2,542 | 37,490 | 1,139 | (1,734 | ) | 36 | — | — | ||||||||||||||||
JNL/T. Rowe Price Capital Appreciation Fund - Class I | 99,754 | 4,020 | 14,122 | 3,272 | 865 | (2,991 | ) | 87,526 | 4.1 | ||||||||||||||||
JNL/T. Rowe Price Established Growth Fund - Class I | 150,256 | 31,847 | 35,567 | 17,587 | 2,783 | (21,198 | ) | 128,121 | 5.9 | ||||||||||||||||
JNL/T. Rowe Price Value Fund - Class I | 202,867 | 21,421 | 55,731 | 20,630 | (122 | ) | (34,939 | ) | 133,496 | 6.2 | |||||||||||||||
JNL/The Boston Company Equity Income Fund - Class I | — | 51,029 | 342 | — | 10 | (3,827 | ) | 46,870 | 2.2 | ||||||||||||||||
JNL/WCM Focused International Equity Fund - Class I | 258,454 | 12,661 | 40,309 | 6,897 | 3,182 | (25,423 | ) | 208,565 | 9.7 | ||||||||||||||||
2,512,944 | 829,323 | 868,602 | 111,408 | 20,904 | (340,308 | ) | 2,154,261 | 100.0 | |||||||||||||||||
JNL Aggressive Growth Allocation Fund | |||||||||||||||||||||||||
JNL Multi-Manager Alternative Fund - Class I | 18,906 | 18,024 | 21,691 | 62 | (587 | ) | (840 | ) | 13,812 | 1.0 | |||||||||||||||
See accompanying Notes to Financial Statements.
42
JNL Series Trust Master Feeder Funds and Funds of Funds
Schedules of Investments (in thousands)
December 31, 2018
Affiliate | Value Beginning of Period($) | Purchases($) | Sales Proceeds($) | Distributions from Funds($) | Realized Gain/Loss from Sales($) | Change in Unrealized Appreciation (Depreciation)($) | Value End of Period($) | Percentage of Net Assets(%) | |||||||||||||||||
JNL Multi-Manager International Small Cap Fund - Class I | — | 66,460 | 1,831 | — | (177 | ) | (12,372 | ) | 52,080 | 3.9 | |||||||||||||||
JNL Multi-Manager Mid Cap Fund - Class I | 99,750 | 16,571 | 14,511 | 5,512 | 1,221 | (11,340 | ) | 91,691 | 6.9 | ||||||||||||||||
JNL Multi-Manager Small Cap Growth Fund - Class I | 22,947 | 16,259 | 6,843 | 2,070 | 1,230 | (4,873 | ) | 28,720 | 2.2 | ||||||||||||||||
JNL Multi-Manager Small Cap Value Fund - Class I | 22,931 | 27,027 | 4,117 | 4,700 | 71 | (10,763 | ) | 35,149 | 2.6 | ||||||||||||||||
JNL/Boston Partners Global Long Short Equity Fund - Class I | 22,787 | 2,546 | 9,764 | 449 | 117 | (2,139 | ) | 13,547 | 1.0 | ||||||||||||||||
JNL/Causeway International Value Select Fund - Class I | 169,196 | 21,785 | 25,784 | 3,062 | 203 | (31,799 | ) | 133,601 | 10.0 | ||||||||||||||||
JNL/Crescent High Income Fund - Class I | 15,060 | 5,356 | 5,729 | 741 | (5 | ) | (1,024 | ) | 13,658 | 1.0 | |||||||||||||||
JNL/DoubleLine Core Fixed Income Fund - Class I | — | 59,043 | 16,533 | 1,356 | (184 | ) | (472 | ) | 41,854 | 3.1 | |||||||||||||||
JNL/DoubleLine Emerging Markets Fixed Income Fund - Class I | 15,018 | 2,498 | 2,673 | 557 | (113 | ) | (841 | ) | 13,889 | 1.0 | |||||||||||||||
JNL/DoubleLine Shiller Enhanced CAPE Fund - Class I | 137,663 | 23,164 | 45,414 | 15,146 | 3,834 | (20,788 | ) | 98,459 | 7.4 | ||||||||||||||||
JNL/DoubleLine Total Return Fund - Class I | 63,956 | 20,851 | 38,553 | 1,285 | (337 | ) | (367 | ) | 45,550 | 3.4 | |||||||||||||||
JNL/Eaton Vance Global Macro Absolute Return Advantage Fund - Class I | 22,623 | 2,197 | 24,179 | — | (191 | ) | (450 | ) | — | — | |||||||||||||||
JNL/First State Global Infrastructure Fund - Class I | — | 15,503 | 1,007 | 398 | (18 | ) | (941 | ) | 13,537 | 1.0 | |||||||||||||||
JNL/Franklin Templeton Global Multisector Bond Fund - Class I | 18,631 | 2,366 | 21,192 | — | (122 | ) | 317 | — | — | ||||||||||||||||
JNL/GQG Emerging Markets Equity Fund - Class I | 61,012 | 24,946 | 6,790 | — | (498 | ) | (11,890 | ) | 66,780 | 5.0 | |||||||||||||||
JNL/Harris Oakmark Global Equity Fund - Class I | 137,281 | 19,574 | 31,153 | 3,418 | (1,022 | ) | (28,888 | ) | 95,792 | 7.2 | |||||||||||||||
JNL/Heitman U.S. Focused Real Estate Fund - Class I | — | 16,029 | 1,539 | — | (51 | ) | (1,260 | ) | 13,179 | 1.0 | |||||||||||||||
JNL/Invesco Global Real Estate Fund - Class I | 22,847 | 3,607 | 25,041 | 573 | (472 | ) | (941 | ) | — | — | |||||||||||||||
JNL/Lazard Emerging Markets Fund - Class I | 46,308 | 10,727 | 19,812 | 661 | (2,150 | ) | (7,662 | ) | 27,411 | 2.1 | |||||||||||||||
JNL/Loomis Sayles Global Growth Fund - Class I | — | 64,683 | 4,062 | — | (122 | ) | (6,956 | ) | 53,543 | 4.0 | |||||||||||||||
JNL/Mellon Capital International Index Fund - Class I | 30,644 | 2,551 | 32,284 | — | 329 | (1,240 | ) | — | — | ||||||||||||||||
JNL/Mellon Capital Real Estate Sector Fund - Class I | 18,780 | 3,270 | 22,472 | — | 850 | (428 | ) | — | — | ||||||||||||||||
JNL/Mellon Capital S&P 500 Index Fund - Class I | 68,989 | 4,124 | 77,451 | — | 9,068 | (4,730 | ) | — | — | ||||||||||||||||
JNL/Morningstar Wide Moat Index Fund - Class I | — | 67,487 | 4,177 | — | 33 | (4,011 | ) | 59,332 | 4.4 | ||||||||||||||||
JNL/Neuberger Berman Risk Balanced Commodity Strategy Fund - Class I | — | 16,934 | 1,996 | 75 | (19 | ) | (1,769 | ) | 13,150 | 1.0 | |||||||||||||||
JNL/Oppenheimer Emerging Markets Innovator Fund - Class I | 31,201 | 29,420 | 5,461 | 1,650 | (599 | ) | (13,314 | ) | 41,247 | 3.1 | |||||||||||||||
JNL/PIMCO Investment Grade Corporate Bond Fund - Class I | 15,071 | 1,652 | 16,319 | — | (315 | ) | (89 | ) | — | — | |||||||||||||||
JNL/PIMCO Real Return Fund - Class I | 15,106 | 1,563 | 16,341 | — | (223 | ) | (105 | ) | — | — | |||||||||||||||
JNL/T. Rowe Price Established Growth Fund - Class I | 136,149 | 19,880 | 45,703 | 13,762 | 5,244 | (16,296 | ) | 99,274 | 7.4 | ||||||||||||||||
JNL/T. Rowe Price Value Fund - Class I | 137,331 | 25,100 | 36,928 | 15,429 | (448 | ) | (25,671 | ) | 99,384 | 7.4 | |||||||||||||||
JNL/The Boston Company Equity Income Fund - Class I | — | 39,715 | 1,170 | — | 42 | (2,909 | ) | 35,678 | 2.7 | ||||||||||||||||
JNL/WCM Focused International Equity Fund - Class I | 175,820 | 15,289 | 39,603 | 4,748 | 2,468 | (17,424 | ) | 136,550 | 10.2 | ||||||||||||||||
1,526,007 | 666,201 | 628,123 | 75,654 | 17,057 | (244,275 | ) | 1,336,867 | 100.0 | |||||||||||||||||
JNL/Franklin Templeton Founding Strategy Fund | |||||||||||||||||||||||||
JNL/Franklin Templeton Global Fund - Class I | 494,726 | 31,665 | 41,309 | 30,937 | 1,688 | (98,355 | ) | 388,415 | 33.0 | ||||||||||||||||
JNL/Franklin Templeton Income Fund - Class I | 491,840 | 22,145 | 78,478 | 21,794 | 241 | (38,618 | ) | 397,130 | 33.8 | ||||||||||||||||
JNL/Franklin Templeton Mutual Shares Fund - Class I | 493,965 | 21,675 | 66,464 | 21,607 | 2,276 | (60,447 | ) | 391,005 | 33.2 | ||||||||||||||||
1,480,531 | 75,485 | 186,251 | 74,338 | 4,205 | (197,420 | ) | 1,176,550 | 100.0 | |||||||||||||||||
JNL/Mellon Capital 10 x 10 Fund | |||||||||||||||||||||||||
JNL/Mellon Capital Bond Index Fund - Class I | 48,993 | 4,966 | 9,928 | 1,056 | (271 | ) | (1,019 | ) | 42,741 | 10.5 | |||||||||||||||
JNL/Mellon Capital International Index Fund - Class I | 49,979 | 7,227 | 4,631 | 4,708 | (33 | ) | (11,201 | ) | 41,341 | 10.2 | |||||||||||||||
JNL/Mellon Capital JNL 5 Fund - Class I | 250,318 | 6,362 | 27,271 | 5,830 | 2,207 | (28,704 | ) | 202,912 | 49.9 | ||||||||||||||||
JNL/Mellon Capital S&P 400 MidCap Index Fund - Class I | 49,607 | 3,399 | 5,654 | 2,877 | 495 | (8,259 | ) | 39,588 | 9.7 | ||||||||||||||||
JNL/Mellon Capital S&P 500 Index Fund - Class I | 49,532 | 3,645 | 8,221 | 2,913 | 885 | (5,358 | ) | 40,483 | 10.0 | ||||||||||||||||
JNL/Mellon Capital Small Cap Index Fund - Class I | 49,426 | 6,410 | 8,663 | 4,774 | 1,135 | (9,092 | ) | 39,216 | 9.7 | ||||||||||||||||
497,855 | 32,009 | 64,368 | 22,158 | 4,418 | (63,633 | ) | 406,281 | 100.0 | |||||||||||||||||
JNL/Mellon Capital Index 5 Fund | |||||||||||||||||||||||||
JNL/Mellon Capital Bond Index Fund - Class I | 199,549 | 12,495 | 21,468 | 4,565 | (680 | ) | (4,663 | ) | 185,233 | 21.6 | |||||||||||||||
JNL/Mellon Capital International Index Fund - Class I | 205,945 | 26,962 | 10,491 | 19,760 | 251 | (47,567 | ) | 175,100 | 20.4 | ||||||||||||||||
JNL/Mellon Capital S&P 400 MidCap Index Fund - Class I | 206,849 | 13,581 | 21,865 | 11,957 | 2,212 | (34,584 | ) | 166,193 | 19.3 | ||||||||||||||||
JNL/Mellon Capital S&P 500 Index Fund - Class I | 206,611 | 12,754 | 29,542 | 12,252 | 3,179 | (22,280 | ) | 170,722 | 19.9 | ||||||||||||||||
JNL/Mellon Capital Small Cap Index Fund - Class I | 206,510 | 24,513 | 36,492 | 19,777 | 4,876 | (37,653 | ) | 161,754 | 18.8 | ||||||||||||||||
1,025,464 | 90,305 | 119,858 | 68,311 | 9,838 | (146,747 | ) | 859,002 | 100.0 | |||||||||||||||||
JNL/S&P 4 Fund | |||||||||||||||||||||||||
JNL/S&P Competitive Advantage Fund - Class I | 1,790,555 | 98,789 | 282,764 | 98,044 | 45,377 | (165,773 | ) | 1,486,184 | 25.2 | ||||||||||||||||
JNL/S&P Dividend Income & Growth Fund - Class I | 1,763,076 | 192,022 | 203,629 | 191,890 | 6,862 | (276,054 | ) | 1,482,277 | 25.2 | ||||||||||||||||
JNL/S&P Intrinsic Value Fund - Class I | 1,787,630 | 86,162 | 261,354 | 84,768 | 37,351 | (192,224 | ) | 1,457,565 | 24.8 | ||||||||||||||||
JNL/S&P Total Yield Fund - Class I | 1,786,225 | 120,338 | 152,685 | 117,989 | 10,738 | (305,813 | ) | 1,458,803 | 24.8 | ||||||||||||||||
7,127,486 | 497,311 | 900,432 | 492,691 | 100,328 | (939,864 | ) | 5,884,829 | 100.0 | |||||||||||||||||
See accompanying Notes to Financial Statements.
43
JNL Series Trust Master Feeder Funds and Funds of Funds
Schedules of Investments (in thousands)
December 31, 2018
Affiliate | Value Beginning of Period($) | Purchases($) | Sales Proceeds($) | Distributions from Funds($) | Realized Gain/Loss from Sales($) | Change in Unrealized Appreciation (Depreciation)($) | Value End of Period($) | Percentage of Net Assets(%) |
JNL/S&P Managed Conservative Fund | |||||||||||||||||||||||||
JNL Multi-Manager Alternative Fund - Class I | 45,722 | 317 | 7,873 | 72 | 23 | (1,496 | ) | 36,693 | 3.0 | ||||||||||||||||
JNL Multi-Manager Mid Cap Fund - Class I | 15,675 | 1,066 | 3,806 | 695 | 380 | (1,578 | ) | 11,737 | 1.0 | ||||||||||||||||
JNL Multi-Manager Small Cap Growth Fund - Class I | 15,660 | 1,849 | 5,466 | 788 | 978 | (1,381 | ) | 11,640 | 0.9 | ||||||||||||||||
JNL Multi-Manager Small Cap Value Fund - Class I | 15,630 | 2,510 | 3,065 | 1,601 | 275 | (3,687 | ) | 11,663 | 1.0 | ||||||||||||||||
JNL/Causeway International Value Select Fund - Class I | 15,696 | 850 | 1,827 | 261 | 88 | (2,780 | ) | 12,027 | 1.0 | ||||||||||||||||
JNL/ClearBridge Large Cap Growth Fund - Class I | 11,044 | 1,561 | 950 | — | 164 | (94 | ) | 11,725 | 1.0 | ||||||||||||||||
JNL/Crescent High Income Fund - Class I | 53,744 | 2,921 | 17,082 | 2,600 | (19 | ) | (3,199 | ) | 36,365 | 3.0 | |||||||||||||||
JNL/DFA U.S. Core Equity Fund - Class I | 31,582 | 1,727 | 7,727 | 674 | 914 | (3,098 | ) | 23,398 | 1.9 | ||||||||||||||||
JNL/DoubleLine Core Fixed Income Fund - Class I | 61,535 | 6,583 | 4,716 | 1,678 | (140 | ) | (1,631 | ) | 61,631 | 5.0 | |||||||||||||||
JNL/DoubleLine Emerging Markets Fixed Income Fund - Class I | 15,096 | 541 | 2,467 | 488 | (95 | ) | (766 | ) | 12,309 | 1.0 | |||||||||||||||
JNL/DoubleLine Total Return Fund - Class I | 136,109 | 4,503 | 27,300 | 4,503 | (243 | ) | (1,899 | ) | 111,170 | 9.1 | |||||||||||||||
JNL/Franklin Templeton Global Multisector Bond Fund - Class I | 104,728 | 348 | 20,324 | — | (130 | ) | 1,141 | 85,763 | 7.0 | ||||||||||||||||
JNL/Goldman Sachs Core Plus Bond Fund - Class I | 45,330 | 1,131 | 7,652 | 1,131 | (261 | ) | (1,516 | ) | 37,032 | 3.0 | |||||||||||||||
JNL/Goldman Sachs Emerging Markets Debt Fund - Class I | 15,284 | 310 | 1,986 | 89 | (50 | ) | (1,160 | ) | 12,398 | 1.0 | |||||||||||||||
JNL/Invesco Diversified Dividend Fund - Class I | 10,540 | 2,416 | 192 | 52 | — | (891 | ) | 11,873 | 1.0 | ||||||||||||||||
JNL/Invesco Global Real Estate Fund - Class I | 15,471 | 37 | 14,799 | 2 | (14 | ) | (658 | ) | 37 | — | |||||||||||||||
JNL/Invesco International Growth Fund - Class I | 15,451 | 667 | 1,657 | 294 | 21 | (2,394 | ) | 12,088 | 1.0 | ||||||||||||||||
JNL/Invesco Mid Cap Value Fund - Class I | 2,767 | 6 | 2,880 | 6 | 307 | (200 | ) | — | — | ||||||||||||||||
JNL/JPMorgan MidCap Growth Fund - Class I | 31,294 | 3,742 | 8,597 | 2,292 | 1,126 | (3,949 | ) | 23,616 | 1.9 | ||||||||||||||||
JNL/JPMorgan U.S. Government & Quality Bond Fund - Class I | 120,866 | 2,137 | 70,786 | 2,137 | (1,390 | ) | (1,331 | ) | 49,496 | 4.0 | |||||||||||||||
JNL/MFS Mid Cap Value Fund - Class I | 5,707 | 7,730 | — | 597 | — | (1,933 | ) | 11,504 | 0.9 | ||||||||||||||||
JNL/Neuberger Berman Strategic Income Fund - Class I | — | 26,930 | 1,298 | 573 | (53 | ) | (1,047 | ) | 24,532 | 2.0 | |||||||||||||||
JNL/Oppenheimer Global Growth Fund - Class I | — | 13,849 | — | 353 | — | (2,013 | ) | 11,836 | 1.0 | ||||||||||||||||
JNL/PIMCO Income Fund - Class I | 46,332 | 17,490 | 2,207 | 235 | 3 | (14 | ) | 61,604 | 5.0 | ||||||||||||||||
JNL/PIMCO Real Return Fund - Class I | 94,984 | 19,094 | 12,339 | 1,096 | (203 | ) | (2,841 | ) | 98,695 | 8.1 | |||||||||||||||
JNL/PPM America Floating Rate Income Fund - Class I | 30,362 | 1,107 | 6,188 | 869 | 113 | (1,083 | ) | 24,311 | 2.0 | ||||||||||||||||
JNL/PPM America High Yield Bond Fund - Class I | 76,347 | 4,570 | 13,993 | 3,569 | 3 | (6,796 | ) | 60,131 | 4.9 | ||||||||||||||||
JNL/PPM America Low Duration Bond Fund - Class I | 90,675 | 9,459 | 13,297 | 1,750 | 33 | (654 | ) | 86,216 | 7.1 | ||||||||||||||||
JNL/PPM America Total Return Fund - Class I | 106,245 | 2,737 | 19,009 | 2,677 | (320 | ) | (3,461 | ) | 86,192 | 7.1 | |||||||||||||||
JNL/Scout Unconstrained Bond Fund - Class I | 64,229 | 1,275 | 39,105 | 1,275 | (823 | ) | (841 | ) | 24,735 | 2.0 | |||||||||||||||
JNL/T. Rowe Price Established Growth Fund - Class I | 32,360 | 3,790 | 10,351 | 2,935 | 1,350 | (3,724 | ) | 23,425 | 1.9 | ||||||||||||||||
JNL/T. Rowe Price Short-Term Bond Fund - Class I | 90,733 | 9,012 | 13,327 | 1,364 | (14 | ) | (189 | ) | 86,215 | 7.1 | |||||||||||||||
JNL/T. Rowe Price Value Fund - Class I | 46,856 | 5,458 | 8,509 | 4,833 | 471 | (8,826 | ) | 35,450 | 2.9 | ||||||||||||||||
JNL/WCM Focused International Equity Fund - Class I | 15,551 | 813 | 3,038 | 393 | 214 | (1,489 | ) | 12,051 | 1.0 | ||||||||||||||||
JNL/WMC Value Fund - Class I | 2,680 | 393 | — | 392 | — | (662 | ) | 2,411 | 0.2 | ||||||||||||||||
1,482,285 | 158,929 | 353,813 | 42,274 | 2,708 | (68,140 | ) | 1,221,969 | 100.0 | |||||||||||||||||
JNL/S&P Managed Moderate Fund | |||||||||||||||||||||||||
JNL Multi-Manager Alternative Fund - Class I | 101,698 | 174 | 6,553 | 174 | (8 | ) | (3,614 | ) | 91,697 | 3.2 | |||||||||||||||
JNL Multi-Manager Mid Cap Fund - Class I | 42,719 | 1,852 | 11,353 | 1,852 | 1,043 | (4,186 | ) | 30,075 | 1.0 | ||||||||||||||||
JNL Multi-Manager Small Cap Growth Fund - Class I | 36,497 | 2,114 | 8,644 | 2,114 | 1,579 | (3,113 | ) | 28,433 | 1.0 | ||||||||||||||||
JNL Multi-Manager Small Cap Value Fund - Class I | 71,337 | 4,783 | 34,820 | 4,783 | 1,580 | (11,868 | ) | 31,012 | 1.1 | ||||||||||||||||
JNL/BlackRock Large Cap Select Growth Fund - Class I | 36,494 | 2,554 | 8,512 | 2,554 | 1,500 | (2,429 | ) | 29,607 | 1.0 | ||||||||||||||||
JNL/Causeway International Value Select Fund - Class I | 36,019 | 627 | 2,336 | 627 | 93 | (6,561 | ) | 27,842 | 1.0 | ||||||||||||||||
JNL/ClearBridge Large Cap Growth Fund - Class I | 43,469 | 1,563 | — | — | — | (11 | ) | 45,021 | 1.6 | ||||||||||||||||
JNL/Crescent High Income Fund - Class I | 101,943 | 6,383 | 8,403 | 6,383 | (82 | ) | (7,987 | ) | 91,854 | 3.2 | |||||||||||||||
JNL/DFA U.S. Core Equity Fund - Class I | 36,357 | 861 | 5,645 | 861 | 654 | (3,566 | ) | 28,661 | 1.0 | ||||||||||||||||
JNL/DoubleLine Core Fixed Income Fund - Class I | 69,772 | 7,213 | — | 1,877 | — | (1,950 | ) | 75,035 | 2.6 | ||||||||||||||||
JNL/DoubleLine Emerging Markets Fixed Income Fund - Class I | 33,713 | 1,178 | 1,748 | 1,178 | (73 | ) | (1,950 | ) | 31,120 | 1.1 | |||||||||||||||
JNL/DoubleLine Total Return Fund - Class I | 234,469 | 8,516 | 16,492 | 8,515 | (130 | ) | (3,714 | ) | 222,649 | 7.8 | |||||||||||||||
JNL/Franklin Templeton Global Multisector Bond Fund - Class I | 232,171 | — | 14,618 | — | (118 | ) | 2,270 | 219,705 | 7.7 | ||||||||||||||||
JNL/Goldman Sachs Emerging Markets Debt Fund - Class I | 34,386 | 234 | 1,412 | 208 | (8 | ) | (2,900 | ) | 30,300 | 1.0 | |||||||||||||||
JNL/Invesco Diversified Dividend Fund - Class I | 102,649 | 403 | 7,640 | 402 | 245 | (7,255 | ) | 88,402 | 3.1 | ||||||||||||||||
JNL/Invesco Global Real Estate Fund - Class I | 34,612 | 430 | 25,063 | 425 | 316 | (2,062 | ) | 8,233 | 0.3 | ||||||||||||||||
JNL/Invesco International Growth Fund - Class I | 70,392 | 838 | 30,871 | 838 | (244 | ) | (7,510 | ) | 32,605 | 1.1 | |||||||||||||||
JNL/Invesco Mid Cap Value Fund - Class I | 12,632 | 468 | 13,255 | 468 | 1,070 | (915 | ) | — | — | ||||||||||||||||
JNL/Invesco Small Cap Growth Fund - Class I | 36,654 | 1,419 | 6,936 | 1,419 | 1,045 | (4,560 | ) | 27,622 | 1.0 | ||||||||||||||||
JNL/JPMorgan MidCap Growth Fund - Class I | 84,138 | 6,174 | 23,317 | 6,174 | 2,835 | (10,359 | ) | 59,471 | 2.1 | ||||||||||||||||
JNL/JPMorgan U.S. Government & Quality Bond Fund - Class I | 166,181 | 3,530 | 77,523 | 3,501 | (1,409 | ) | (2,392 | ) | 88,387 | 3.1 | |||||||||||||||
JNL/Lazard Emerging Markets Fund - Class I | 36,217 | 717 | 1,904 | 631 | 148 | (6,961 | ) | 28,217 | 1.0 | ||||||||||||||||
JNL/Lazard International Strategic Equity Fund - Class I | — | 25,311 | — | 94 | — | (3,219 | ) | 22,092 | 0.8 | ||||||||||||||||
JNL/MFS Mid Cap Value Fund - Class I | 17,631 | 7,202 | — | 1,349 | — | (4,162 | ) | 20,671 | 0.7 | ||||||||||||||||
See accompanying Notes to Financial Statements.
44
JNL Series Trust Master Feeder Funds and Funds of Funds
Schedules of Investments (in thousands)
December 31, 2018
Affiliate | Value Beginning of Period($) | Purchases($) | Sales Proceeds($) | Distributions from Funds($) | Realized Gain/Loss from Sales($) | Change in Unrealized Appreciation (Depreciation)($) | Value End of Period($) | Percentage of Net Assets(%) | |||||||||||||||||
JNL/Neuberger Berman Strategic Income Fund - Class I | — | 41,497 | — | 883 | — | (1,701 | ) | 39,796 | 1.4 | ||||||||||||||||
JNL/Oppenheimer Emerging Markets Innovator Fund - Class I | — | 16,620 | — | 462 | — | (4,470 | ) | 12,150 | 0.4 | ||||||||||||||||
JNL/Oppenheimer Global Growth Fund - Class I | 36,882 | 2,798 | 1,610 | 1,111 | 178 | (5,998 | ) | 32,250 | 1.1 | ||||||||||||||||
JNL/PIMCO Income Fund - Class I | 80,455 | 4,660 | — | 332 | — | (132 | ) | 84,983 | 3.0 | ||||||||||||||||
JNL/PIMCO Real Return Fund - Class I | 188,671 | 16,980 | 14,876 | 1,980 | (131 | ) | (5,515 | ) | 185,129 | 6.5 | |||||||||||||||
JNL/PPM America High Yield Bond Fund - Class I | 136,625 | 6,997 | 10,346 | 6,997 | (18 | ) | (13,423 | ) | 119,835 | 4.2 | |||||||||||||||
JNL/PPM America Low Duration Bond Fund - Class I | 168,314 | 13,718 | 6,833 | 3,522 | 16 | (1,252 | ) | 173,963 | 6.1 | ||||||||||||||||
JNL/PPM America Total Return Fund - Class I | 168,253 | 4,629 | 9,940 | 4,629 | (185 | ) | (6,115 | ) | 156,642 | 5.5 | |||||||||||||||
JNL/Scout Unconstrained Bond Fund - Class I | 117,002 | 2,458 | 61,500 | 2,459 | (1,060 | ) | (1,919 | ) | 54,981 | 1.9 | |||||||||||||||
JNL/T. Rowe Price Established Growth Fund - Class I | 284,184 | 30,052 | 51,570 | 30,052 | 6,905 | (35,066 | ) | 234,505 | 8.2 | ||||||||||||||||
JNL/T. Rowe Price Short-Term Bond Fund - Class I | 136,110 | 12,637 | 6,239 | 2,372 | 7 | (465 | ) | 142,050 | 5.0 | ||||||||||||||||
JNL/T. Rowe Price Value Fund - Class I | 227,303 | 24,191 | 32,982 | 24,191 | 1,652 | (43,878 | ) | 176,286 | 6.1 | ||||||||||||||||
JNL/WCM Focused International Equity Fund - Class I | 51,893 | 15,367 | — | 1,966 | — | (7,040 | ) | 60,220 | 2.1 | ||||||||||||||||
JNL/WMC Value Fund - Class I | 48,418 | 5,116 | 14,731 | 5,116 | 838 | (9,231 | ) | 30,410 | 1.0 | ||||||||||||||||
3,316,260 | 282,264 | 517,672 | 132,499 | 18,238 | (237,179 | ) | 2,861,911 | 100.0 | |||||||||||||||||
JNL/S&P Managed Moderate Growth Fund | |||||||||||||||||||||||||
JNL Multi-Manager Alternative Fund - Class I | 191,143 | 336 | 8,059 | 336 | (88 | ) | (6,903 | ) | 176,429 | 3.2 | |||||||||||||||
JNL Multi-Manager Mid Cap Fund - Class I | 133,652 | 31,259 | 49,138 | 6,142 | 4,140 | (17,129 | ) | 102,784 | 1.9 | ||||||||||||||||
JNL Multi-Manager Small Cap Growth Fund - Class I | 71,163 | 6,690 | 10,713 | 4,450 | 1,971 | (6,328 | ) | 62,783 | 1.1 | ||||||||||||||||
JNL Multi-Manager Small Cap Value Fund - Class I | 139,007 | 16,083 | 13,302 | 16,083 | 721 | (34,897 | ) | 107,612 | 2.0 | ||||||||||||||||
JNL/BlackRock Large Cap Select Growth Fund - Class I | 295,463 | 18,511 | 107,335 | 18,511 | 16,913 | (20,031 | ) | 203,521 | 3.7 | ||||||||||||||||
JNL/Causeway International Value Select Fund - Class I | 100,945 | 4,289 | — | 1,902 | — | (19,551 | ) | 85,683 | 1.6 | ||||||||||||||||
JNL/ClearBridge Large Cap Growth Fund - Class I | 108,716 | 5,797 | — | — | — | (45 | ) | 114,468 | 2.1 | ||||||||||||||||
JNL/Crescent High Income Fund - Class I | 140,348 | 8,581 | 16,252 | 8,581 | (204 | ) | (10,612 | ) | 121,861 | 2.2 | |||||||||||||||
JNL/DoubleLine Core Fixed Income Fund - Class I | 63,183 | 6,799 | — | 1,683 | — | (1,741 | ) | 68,241 | 1.2 | ||||||||||||||||
JNL/DoubleLine Emerging Markets Fixed Income Fund - Class I | 62,884 | 2,300 | 1,922 | 2,251 | (108 | ) | (3,723 | ) | 59,431 | 1.1 | |||||||||||||||
JNL/DoubleLine Total Return Fund - Class I | 183,241 | 7,253 | 6,150 | 6,914 | (113 | ) | (3,001 | ) | 181,230 | 3.3 | |||||||||||||||
JNL/Franklin Templeton Global Multisector Bond Fund - Class I | 309,226 | 162 | 12,377 | — | (65 | ) | 2,965 | 299,911 | 5.5 | ||||||||||||||||
JNL/Goldman Sachs Core Plus Bond Fund - Class I | 53,496 | 1,488 | — | 1,488 | — | (2,179 | ) | 52,805 | 1.0 | ||||||||||||||||
JNL/Goldman Sachs Emerging Markets Debt Fund - Class I | 64,575 | 399 | 1,721 | 396 | (46 | ) | (5,528 | ) | 57,679 | 1.0 | |||||||||||||||
JNL/GQG Emerging Markets Equity Fund - Class I | 21,146 | 3,616 | — | — | — | (3,439 | ) | 21,323 | 0.4 | ||||||||||||||||
JNL/Invesco Diversified Dividend Fund - Class I | 119,255 | 11,561 | — | 522 | — | (9,342 | ) | 121,474 | 2.2 | ||||||||||||||||
JNL/Invesco Global Real Estate Fund - Class I | 129,626 | 2,572 | 77,471 | 2,402 | 635 | (8,854 | ) | 46,508 | 0.8 | ||||||||||||||||
JNL/Invesco International Growth Fund - Class I | 133,858 | 1,986 | 44,442 | 1,986 | (1,160 | ) | (16,187 | ) | 74,055 | 1.3 | |||||||||||||||
JNL/Invesco Mid Cap Value Fund - Class I | 33,265 | 1,813 | 35,019 | 1,813 | 2,349 | (2,408 | ) | — | — | ||||||||||||||||
JNL/Invesco Small Cap Growth Fund - Class I | 70,792 | 2,879 | 10,891 | 2,879 | 1,499 | (8,939 | ) | 55,340 | 1.0 | ||||||||||||||||
JNL/JPMorgan MidCap Growth Fund - Class I | 211,911 | 14,709 | 74,769 | 14,709 | 7,785 | (24,815 | ) | 134,821 | 2.5 | ||||||||||||||||
JNL/JPMorgan U.S. Government & Quality Bond Fund - Class I | 176,950 | 4,109 | 89,177 | 3,467 | (1,480 | ) | (2,371 | ) | 88,031 | 1.6 | |||||||||||||||
JNL/Lazard Emerging Markets Fund - Class I | 69,150 | 1,233 | 2,589 | 1,224 | 162 | (13,427 | ) | 54,529 | 1.0 | ||||||||||||||||
JNL/Lazard International Strategic Equity Fund - Class I | — | 31,502 | — | 113 | — | (3,889 | ) | 27,613 | 0.5 | ||||||||||||||||
JNL/MFS Mid Cap Value Fund - Class I | 28,032 | 23,511 | — | 2,782 | — | (8,824 | ) | 42,719 | 0.8 | ||||||||||||||||
JNL/Oppenheimer Emerging Markets Innovator Fund - Class I | 103,976 | 28,520 | 22,815 | 3,493 | (1,968 | ) | (28,487 | ) | 79,226 | 1.4 | |||||||||||||||
JNL/Oppenheimer Global Growth Fund - Class I | 204,489 | 8,280 | 4,447 | 6,142 | 479 | (32,535 | ) | 176,266 | 3.2 | ||||||||||||||||
JNL/PIMCO Income Fund - Class I | 50,740 | 88,088 | — | 544 | — | 307 | 139,135 | 2.5 | |||||||||||||||||
JNL/PIMCO Real Return Fund - Class I | 230,509 | 2,687 | 8,604 | 2,286 | (37 | ) | (6,666 | ) | 217,889 | 4.0 | |||||||||||||||
JNL/PPM America High Yield Bond Fund - Class I | 192,700 | 10,177 | 9,878 | 10,177 | (197 | ) | (19,342 | ) | 173,460 | 3.2 | |||||||||||||||
JNL/PPM America Low Duration Bond Fund - Class I | 243,511 | 31,245 | 740 | 5,507 | 6 | (2,024 | ) | 271,998 | 5.0 | ||||||||||||||||
JNL/PPM America Mid Cap Value Fund - Class I | 31,362 | 3,182 | — | 3,182 | — | (9,404 | ) | 25,140 | 0.5 | ||||||||||||||||
JNL/PPM America Total Return Fund - Class I | 188,111 | 5,508 | 6,566 | 5,320 | (190 | ) | (6,982 | ) | 179,881 | 3.3 | |||||||||||||||
JNL/Scout Unconstrained Bond Fund - Class I | 162,449 | 3,483 | 78,818 | 3,483 | (1,186 | ) | (2,922 | ) | 83,006 | 1.5 | |||||||||||||||
JNL/T. Rowe Price Established Growth Fund - Class I | 808,970 | 87,882 | 131,357 | 87,882 | 17,383 | (100,905 | ) | 681,973 | 12.5 | ||||||||||||||||
JNL/T. Rowe Price Short-Term Bond Fund - Class I | 184,070 | 29,343 | 426 | 3,542 | 1 | (754 | ) | 212,234 | 3.9 | ||||||||||||||||
JNL/T. Rowe Price Value Fund - Class I | 680,038 | 77,261 | 74,340 | 77,261 | (244 | ) | (134,497 | ) | 548,218 | 10.0 | |||||||||||||||
JNL/WCM Focused International Equity Fund - Class I | 136,464 | 25,895 | — | 4,700 | — | (16,687 | ) | 145,672 | 2.7 | ||||||||||||||||
JNL/WMC Value Fund - Class I | 253,096 | 30,729 | 52,178 | 30,729 | 1,765 | (52,633 | ) | 180,779 | 3.3 | ||||||||||||||||
6,381,512 | 641,718 | 951,496 | 344,882 | 48,723 | (644,729 | ) | 5,475,728 | 100.0 | |||||||||||||||||
JNL/S&P Managed Growth Fund | |||||||||||||||||||||||||
JNL Multi-Manager Alternative Fund - Class I | 157,412 | 774 | 1,980 | 283 | (53 | ) | (5,826 | ) | 150,327 | 3.1 | |||||||||||||||
JNL Multi-Manager Mid Cap Fund - Class I | 99,891 | 35,689 | 32,193 | 5,428 | 2,570 | (15,180 | ) | 90,777 | 1.8 | ||||||||||||||||
JNL Multi-Manager Small Cap Growth Fund - Class I | 117,727 | 8,233 | 12,808 | 7,673 | 2,388 | (10,380 | ) | 105,160 | 2.1 | ||||||||||||||||
JNL Multi-Manager Small Cap Value Fund - Class I | 121,200 | 15,049 | 7,623 | 14,333 | 618 | (31,368 | ) | 97,876 | 2.0 | ||||||||||||||||
JNL/BlackRock Large Cap Select Growth Fund - Class I | 508,806 | 32,272 | 169,316 | 32,272 | 31,265 | (34,275 | ) | 368,752 | 7.5 | ||||||||||||||||
JNL/Causeway International Value Select Fund - Class I | 117,222 | 2,129 | 3,113 | 2,127 | 79 | (21,973 | ) | 94,344 | 1.9 | ||||||||||||||||
JNL/ClearBridge Large Cap Growth Fund - Class I | 166,101 | 10,267 | — | — | — | (214 | ) | 176,154 | 3.6 | ||||||||||||||||
JNL/Crescent High Income Fund - Class I | 93,961 | 23,590 | 3,822 | 7,254 | (177 | ) | (9,333 | ) | 104,219 | 2.1 | |||||||||||||||
See accompanying Notes to Financial Statements.
45
JNL Series Trust Master Feeder Funds and Funds of Funds
Schedules of Investments (in thousands)
December 31, 2018
Affiliate | Value Beginning of Period($) | Purchases($) | Sales Proceeds($) | Distributions from Funds($) | Realized Gain/Loss from Sales($) | Change in Unrealized Appreciation (Depreciation)($) | Value End of Period($) | Percentage of Net Assets(%) | |||||||||||||||||
JNL/DoubleLine Core Fixed Income Fund - Class I | 5,840 | 148 | — | 149 | — | (158 | ) | 5,830 | 0.1 | ||||||||||||||||
JNL/DoubleLine Emerging Markets Fixed Income Fund - Class I | 36,430 | 22,457 | 2,618 | 2,021 | (125 | ) | (2,922 | ) | 53,222 | 1.1 | |||||||||||||||
JNL/DoubleLine Total Return Fund - Class I | 54,064 | 2,062 | 1,814 | 2,035 | (31 | ) | (884 | ) | 53,397 | 1.1 | |||||||||||||||
JNL/Goldman Sachs Emerging Markets Debt Fund - Class I | 54,217 | 547 | 622 | 338 | (24 | ) | (4,719 | ) | 49,399 | 1.0 | |||||||||||||||
JNL/GQG Emerging Markets Equity Fund - Class I | 32,243 | 6,650 | — | — | — | (5,410 | ) | 33,483 | 0.7 | ||||||||||||||||
JNL/Invesco Diversified Dividend Fund - Class I | 108,189 | 18,905 | — | 520 | — | (8,855 | ) | 118,239 | 2.4 | ||||||||||||||||
JNL/Invesco Global Real Estate Fund - Class I | 105,494 | 2,499 | 56,443 | 2,297 | 609 | (7,681 | ) | 44,478 | 0.9 | ||||||||||||||||
JNL/Invesco International Growth Fund - Class I | 115,830 | 1,671 | 39,818 | 1,661 | (852 | ) | (13,838 | ) | 62,993 | 1.3 | |||||||||||||||
JNL/Invesco Mid Cap Value Fund - Class I | 67,094 | 5,497 | 70,925 | 5,498 | 3,192 | (4,858 | ) | — | — | ||||||||||||||||
JNL/Invesco Small Cap Growth Fund - Class I | 62,950 | 2,576 | 9,324 | 2,576 | 1,218 | (7,965 | ) | 49,455 | 1.0 | ||||||||||||||||
JNL/JPMorgan MidCap Growth Fund - Class I | 181,455 | 11,454 | 73,028 | 10,877 | 8,322 | (20,608 | ) | 107,595 | 2.2 | ||||||||||||||||
JNL/Lazard Emerging Markets Fund - Class I | 136,113 | 2,194 | 28,218 | 2,174 | (2,332 | ) | (22,376 | ) | 85,381 | 1.7 | |||||||||||||||
JNL/Lazard International Strategic Equity Fund - Class I | — | 30,500 | — | 113 | — | (3,865 | ) | 26,635 | 0.5 | ||||||||||||||||
JNL/MFS Mid Cap Value Fund - Class I | 22,167 | 66,169 | 12,243 | 4,391 | 167 | (14,489 | ) | 61,771 | 1.3 | ||||||||||||||||
JNL/Oppenheimer Emerging Markets Innovator Fund - Class I | 100,300 | 4,356 | — | 3,130 | — | (25,592 | ) | 79,064 | 1.6 | ||||||||||||||||
JNL/Oppenheimer Global Growth Fund - Class I | 297,369 | 39,804 | 8,363 | 9,784 | 908 | (51,885 | ) | 277,833 | 5.6 | ||||||||||||||||
JNL/PIMCO Income Fund - Class I | 61,800 | 53,111 | 5,173 | 449 | 8 | 42 | 109,788 | 2.2 | |||||||||||||||||
JNL/PIMCO Real Return Fund - Class I | 139,337 | 1,254 | 22,495 | 1,254 | (184 | ) | (3,629 | ) | 114,283 | 2.3 | |||||||||||||||
JNL/PPM America High Yield Bond Fund - Class I | 107,365 | 5,943 | 2,252 | 5,813 | (114 | ) | (11,081 | ) | 99,861 | 2.0 | |||||||||||||||
JNL/PPM America Low Duration Bond Fund - Class I | 88,833 | 24,035 | 4,251 | 2,183 | 36 | (870 | ) | 107,783 | 2.2 | ||||||||||||||||
JNL/PPM America Mid Cap Value Fund - Class I | 17,995 | 1,826 | — | 1,826 | — | (5,397 | ) | 14,424 | 0.3 | ||||||||||||||||
JNL/PPM America Total Return Fund - Class I | 100,157 | 3,813 | 778 | 2,886 | (27 | ) | (3,823 | ) | 99,342 | 2.0 | |||||||||||||||
JNL/Scout Unconstrained Bond Fund - Class I | 54,056 | 2,070 | 1,451 | 2,028 | (61 | ) | (1,915 | ) | 52,699 | 1.1 | |||||||||||||||
JNL/T. Rowe Price Established Growth Fund - Class I | 786,164 | 91,091 | 77,565 | 91,091 | 8,233 | (101,414 | ) | 706,509 | 14.3 | ||||||||||||||||
JNL/T. Rowe Price Mid-Cap Growth Fund - Class I | 199,691 | 14,718 | — | 14,719 | — | (19,004 | ) | 195,405 | 4.0 | ||||||||||||||||
JNL/T. Rowe Price Short-Term Bond Fund - Class I | 100,011 | 12,605 | 4,299 | 1,860 | (17 | ) | (369 | ) | 107,931 | 2.2 | |||||||||||||||
JNL/T. Rowe Price Value Fund - Class I | 833,545 | 89,652 | 127,003 | 89,652 | 3,464 | (159,615 | ) | 640,043 | 13.0 | ||||||||||||||||
JNL/WCM Focused International Equity Fund - Class I | 156,107 | 35,014 | — | 5,620 | — | (20,001 | ) | 171,120 | 3.5 | ||||||||||||||||
JNL/WMC Value Fund - Class I | 276,490 | 35,307 | 43,536 | 35,307 | 1,151 | (59,964 | ) | 209,448 | 4.3 | ||||||||||||||||
5,683,626 | 715,931 | 823,074 | 371,622 | 60,231 | (711,694 | ) | 4,925,020 | 100.0 | |||||||||||||||||
JNL/S&P Managed Aggressive Growth Fund | |||||||||||||||||||||||||
JNL Multi-Manager Alternative Fund - Class I | 61,485 | 1,053 | 594 | 112 | (17 | ) | (2,314 | ) | 59,613 | 3.0 | |||||||||||||||
JNL Multi-Manager Mid Cap Fund - Class I | 42,957 | 2,486 | 8,223 | 2,006 | 853 | (4,423 | ) | 33,650 | 1.7 | ||||||||||||||||
JNL Multi-Manager Small Cap Growth Fund - Class I | 44,028 | 4,486 | 2,898 | 3,054 | 572 | (4,113 | ) | 42,075 | 2.1 | ||||||||||||||||
JNL Multi-Manager Small Cap Value Fund - Class I | 64,880 | 8,044 | 8,145 | 7,251 | 650 | (16,074 | ) | 49,355 | 2.5 | ||||||||||||||||
JNL/BlackRock Large Cap Select Growth Fund - Class I | 201,356 | 15,287 | 36,787 | 15,287 | 5,609 | (13,342 | ) | 172,123 | 8.6 | ||||||||||||||||
JNL/Causeway International Value Select Fund - Class I | 65,612 | 1,762 | 101 | 1,228 | 6 | (12,603 | ) | 54,676 | 2.7 | ||||||||||||||||
JNL/ClearBridge Large Cap Growth Fund - Class I | 108,358 | — | 8,028 | — | 1,182 | (396 | ) | 101,116 | 5.0 | ||||||||||||||||
JNL/DoubleLine Emerging Markets Fixed Income Fund - Class I | 20,174 | 1,243 | 198 | 745 | (13 | ) | (1,242 | ) | 19,964 | 1.0 | |||||||||||||||
JNL/DoubleLine Total Return Fund - Class I | 20,157 | 1,211 | 386 | 780 | (8 | ) | (339 | ) | 20,635 | 1.0 | |||||||||||||||
JNL/Goldman Sachs Emerging Markets Debt Fund - Class I | 672 | 4 | — | 4 | — | (59 | ) | 617 | — | ||||||||||||||||
JNL/GQG Emerging Markets Equity Fund - Class I | 28,992 | — | 3,554 | — | 34 | (3,885 | ) | 21,587 | 1.1 | ||||||||||||||||
JNL/Invesco Diversified Dividend Fund - Class I | 80,421 | 15,469 | — | 394 | — | (6,883 | ) | 89,007 | 4.4 | ||||||||||||||||
JNL/Invesco Global Real Estate Fund - Class I | 41,627 | 1,492 | 20,893 | 994 | 171 | (3,154 | ) | 19,243 | 1.0 | ||||||||||||||||
JNL/Invesco International Growth Fund - Class I | 42,476 | 983 | 16,610 | 559 | (207 | ) | (4,868 | ) | 21,774 | 1.1 | |||||||||||||||
JNL/Invesco Mid Cap Value Fund - Class I | 24,486 | 1,610 | 25,838 | 1,610 | 1,515 | (1,773 | ) | — | — | ||||||||||||||||
JNL/Invesco Small Cap Growth Fund - Class I | 39,279 | 1,378 | 13,085 | 1,378 | 1,544 | (4,558 | ) | 24,558 | 1.2 | ||||||||||||||||
JNL/JPMorgan MidCap Growth Fund - Class I | 106,449 | 7,732 | 46,586 | 6,133 | 5,243 | (11,996 | ) | 60,842 | 3.0 | ||||||||||||||||
JNL/Lazard Emerging Markets Fund - Class I | 45,345 | 5,992 | 875 | 925 | (152 | ) | (9,783 | ) | 40,527 | 2.0 | |||||||||||||||
JNL/Lazard International Strategic Equity Fund - Class I | — | 15,684 | — | 58 | — | (1,954 | ) | 13,730 | 0.7 | ||||||||||||||||
JNL/MFS Mid Cap Value Fund - Class I | 11,225 | 21,215 | 4,185 | 1,639 | 54 | (5,267 | ) | 23,042 | 1.2 | ||||||||||||||||
JNL/Oppenheimer Emerging Markets Innovator Fund - Class I | 53,602 | 3,425 | 2,482 | 1,666 | (126 | ) | (13,441 | ) | 40,978 | 2.0 | |||||||||||||||
JNL/Oppenheimer Global Growth Fund - Class I | 111,222 | 31,836 | 602 | 4,222 | 65 | (22,254 | ) | 120,267 | 6.0 | ||||||||||||||||
JNL/PIMCO Income Fund - Class I | 10,711 | 3,370 | — | 55 | — | (7 | ) | 14,074 | 0.7 | ||||||||||||||||
JNL/PPM America High Yield Bond Fund - Class I | 41,078 | 2,924 | 491 | 2,266 | (31 | ) | (4,336 | ) | 39,144 | 2.0 | |||||||||||||||
JNL/PPM America Total Return Fund - Class I | 20,264 | 1,042 | 266 | 591 | (9 | ) | (777 | ) | 20,254 | 1.0 | |||||||||||||||
JNL/Scout Unconstrained Bond Fund - Class I | 8,099 | 305 | — | 305 | — | (295 | ) | 8,109 | 0.4 | ||||||||||||||||
JNL/T. Rowe Price Established Growth Fund - Class I | 278,212 | 41,586 | 252 | 35,407 | 4 | (38,971 | ) | 280,579 | 14.0 | ||||||||||||||||
JNL/T. Rowe Price Mid-Cap Growth Fund - Class I | 105,477 | 7,775 | — | 7,774 | — | (10,039 | ) | 103,213 | 5.2 | ||||||||||||||||
JNL/T. Rowe Price Short-Term Bond Fund - Class I | 40,070 | 1,574 | 690 | 694 | (4 | ) | (116 | ) | 40,834 | 2.0 | |||||||||||||||
JNL/T. Rowe Price Value Fund - Class I | 316,767 | 46,684 | 12,277 | 39,179 | (885 | ) | (67,757 | ) | 282,532 | 14.1 | |||||||||||||||
JNL/WCM Focused International Equity Fund - Class I | 66,517 | 39,762 | — | 3,116 | — | (11,362 | ) | 94,917 | 4.7 | ||||||||||||||||
JNL/WMC Value Fund - Class I | 131,993 | 15,960 | 30,331 | 15,959 | 453 | (26,779 | ) | 91,296 | 4.6 | ||||||||||||||||
2,233,991 | 303,374 | 244,377 | 155,391 | 16,503 | (305,160 | ) | 2,004,331 | 100.0 | |||||||||||||||||
See accompanying Notes to Financial Statements.
46
JNL Series Trust Master Feeder Funds and Funds of Funds
Statements of Assets and Liabilities (in thousands, except net asset value per share)
December 31, 2018
| JNL/American Funds Balanced Fund(a) |
| JNL/American Funds Blue Chip Income and Growth Fund(a) |
| JNL/American Funds Capital Income Builder Fund(a) |
| JNL/American Funds Global Bond Fund(a) |
| JNL/American Funds Global Small Capitalization Fund(a) |
| JNL/American Funds Growth-Income Fund(a) |
| JNL/American Funds International Fund(a) |
| ||||||||
Assets |
|
|
|
|
|
|
|
|
|
|
|
|
|
|
|
|
|
|
|
|
| |
Investments - unaffiliated, at value | $ | 1,046,003 |
| $ | — |
| $ | 24,500 |
| $ | — |
| $ | — |
| $ | — |
| $ | — |
| |
Investments - affiliated, at value |
| — |
|
| 2,927,048 |
|
| — |
|
| 502,296 |
|
| 621,042 |
|
| 6,142,818 |
|
| 1,733,746 |
| |
Receivable from: |
|
|
|
|
|
|
|
|
|
|
|
|
|
|
|
|
|
|
|
|
| |
| Investment securities sold |
| — |
|
| 2,486 |
|
| — |
|
| 550 |
|
| — |
|
| — |
|
| 649 |
|
| Fund shares sold |
| 2,572 |
|
| 2,299 |
|
| 310 |
|
| 228 |
|
| 539 |
|
| 8,562 |
|
| 1,732 |
|
| Dividends |
| 120 |
|
| — |
|
| — |
|
| — |
|
| — |
|
| — |
|
| — |
|
| Adviser |
| 356 |
|
| 1,102 |
|
| 8 |
|
| 223 |
|
| 296 |
|
| 1,867 |
|
| 823 |
|
Other assets |
| — |
|
| 1 |
|
| — |
|
| — |
|
| — |
|
| — |
|
| — |
| |
Total assets |
| 1,049,051 |
|
| 2,932,936 |
|
| 24,818 |
|
| 503,297 |
|
| 621,877 |
|
| 6,153,247 |
|
| 1,736,950 |
| |
Liabilities |
|
|
|
|
|
|
|
|
|
|
|
|
|
|
|
|
|
|
|
|
| |
Payable for: |
|
|
|
|
|
|
|
|
|
|
|
|
|
|
|
|
|
|
|
|
| |
| Investment securities purchased |
| 1,920 |
|
| — |
|
| 298 |
|
| — |
|
| 165 |
|
| 2,734 |
|
| — |
|
| Fund shares redeemed |
| 652 |
|
| 4,786 |
|
| 12 |
|
| 777 |
|
| 374 |
|
| 5,828 |
|
| 2,381 |
|
| Advisory fees |
| 466 |
|
| 1,451 |
|
| 10 |
|
| 255 |
|
| 350 |
|
| 2,938 |
|
| 1,090 |
|
| Administrative fees |
| 134 |
|
| 383 |
|
| 3 |
|
| 64 |
|
| 81 |
|
| 744 |
|
| 224 |
|
| 12b-1 fees (Class A) |
| 67 |
|
| 188 |
|
| 2 |
|
| 33 |
|
| 39 |
|
| 393 |
|
| 112 |
|
| Board of trustee fees |
| 26 |
|
| 68 |
|
| — |
|
| 17 |
|
| 15 |
|
| 105 |
|
| 34 |
|
| Chief compliance officer fees |
| 1 |
|
| 4 |
|
| — |
|
| — |
|
| 1 |
|
| 7 |
|
| 2 |
|
| Other expenses |
| 2 |
|
| 5 |
|
| — |
|
| 2 |
|
| 1 |
|
| 28 |
|
| 2 |
|
Total liabilities |
| 3,268 |
|
| 6,885 |
|
| 325 |
|
| 1,148 |
|
| 1,026 |
|
| 12,777 |
|
| 3,845 |
| |
Net assets | $ | 1,045,783 |
| $ | 2,926,051 |
| $ | 24,493 |
| $ | 502,149 |
| $ | 620,851 |
| $ | 6,140,470 |
| $ | 1,733,105 |
| |
Net assets consist of: |
|
|
|
|
|
|
|
|
|
|
|
|
|
|
|
|
|
|
|
|
| |
Paid-in capital(b) | $ | 1,129,148 |
| $ | 3,080,267 |
| $ | 25,527 |
| $ | 538,406 |
| $ | 684,670 |
| $ | 6,216,643 |
| $ | 1,913,964 |
| |
Total distributable earnings (loss)(b) |
| (83,365 | ) |
| (154,216 | ) |
| (1,034 | ) |
| (36,257 | ) |
| (63,819 | ) |
| (76,173 | ) |
| (180,859 | ) | |
Net assets | $ | 1,045,783 |
| $ | 2,926,051 |
| $ | 24,493 |
| $ | 502,149 |
| $ | 620,851 |
| $ | 6,140,470 |
| $ | 1,733,105 |
| |
Net assets - Class A | $ | 1,035,023 |
| $ | 2,919,769 |
| $ | 23,271 |
| $ | 500,836 |
| $ | 618,162 |
| $ | 6,115,179 |
| $ | 1,726,176 |
| |
Shares outstanding - Class A |
| 100,506 |
|
| 145,014 |
|
| 2,473 |
|
| 47,623 |
|
| 48,805 |
|
| 281,168 |
|
| 136,434 |
| |
Net asset value per share - Class A | $ | 10.30 |
| $ | 20.13 |
| $ | 9.41 |
| $ | 10.52 |
| $ | 12.67 |
| $ | 21.75 |
| $ | 12.65 |
| |
Net assets - Class I | $ | 10,760 |
| $ | 6,282 |
| $ | 1,222 |
| $ | 1,313 |
| $ | 2,689 |
| $ | 25,291 |
| $ | 6,929 |
| |
Shares outstanding - Class I |
| 1,009 |
|
| 308 |
|
| 130 |
|
| 124 |
|
| 209 |
|
| 1,147 |
|
| 541 |
| |
Net asset value per share - Class I | $ | 10.67 |
| $ | 20.41 |
| $ | 9.43 |
| $ | 10.61 |
| $ | 12.85 |
| $ | 22.05 |
| $ | 12.80 |
| |
Investments - unaffiliated, at cost | $ | 1,135,544 |
| $ | — |
| $ | 25,534 |
| $ | — |
| $ | — |
| $ | — |
| $ | — |
| |
Investments - affiliated, at cost |
| — |
|
| 3,081,264 |
|
| — |
|
| 526,037 |
|
| 688,625 |
|
| 6,218,992 |
|
| 1,921,504 |
| |
(a) | The Master Funds for the JNL/American Funds Master Feeder Funds are the Class 1 shares of the corresponding American Fund Insurance Series Fund. The Master Funds for the JNL/Vanguard Master Feeder Funds are the shares of the corresponding Vanguard Variable Insurance Fund. These financial statements should be read in conjunction with each Master Fund's respective shareholder report. |
(b) | For funds structured as partnerships, Paid-in capital represents partners' capital and Total distributable earnings (loss) represents net unrealized appreciation (depreciation) on investments and foreign currency. |
See accompanying Notes to Financial Statements.
47
JNL Series Trust Master Feeder Funds and Funds of Funds
Statements of Assets and Liabilities (in thousands, except net asset value per share)
December 31, 2018
|
| JNL/American Funds New World Fund(a) |
| JNL/Vanguard Capital Growth Fund(a) |
| JNL/Vanguard Equity Income Fund(a) |
| JNL/Vanguard International Fund(a) |
| JNL/Vanguard Small Company Growth Fund(a) |
| JNL Institutional Alt 25 Fund |
| JNL Institutional Alt 50 Fund |
| |||||||
Assets |
|
|
|
|
|
|
|
|
|
|
|
|
|
|
|
|
|
|
|
|
| |
Investments - affiliated, at value |
| 1,216,429 |
|
| 284,172 |
|
| 159,338 |
|
| 450,535 |
|
| 271,142 |
|
| 2,636,617 |
|
| 2,284,137 |
| |
Receivable from: |
|
|
|
|
|
|
|
|
|
|
|
|
|
|
|
|
|
|
|
|
| |
| Investment securities sold |
| — |
|
| — |
|
| — |
|
| — |
|
| 156 |
|
| 1,057 |
|
| 1,695 |
|
| Fund shares sold |
| 1,360 |
|
| 1,884 |
|
| 902 |
|
| 1,024 |
|
| 703 |
|
| 1,198 |
|
| 967 |
|
| Adviser |
| 784 |
|
| 96 |
|
| 53 |
|
| 218 |
|
| 121 |
|
| — |
|
| — |
|
Total assets |
| 1,218,573 |
|
| 286,152 |
|
| 160,293 |
|
| 451,777 |
|
| 272,122 |
|
| 2,638,872 |
|
| 2,286,799 |
| |
Liabilities |
|
|
|
|
|
|
|
|
|
|
|
|
|
|
|
|
|
|
|
|
| |
Payable for: |
|
|
|
|
|
|
|
|
|
|
|
|
|
|
|
|
|
|
|
|
| |
| Investment securities purchased |
| 178 |
|
| 976 |
|
| 522 |
|
| 295 |
|
| — |
|
| — |
|
| — |
|
| Fund shares redeemed |
| 1,182 |
|
| 908 |
|
| 380 |
|
| 729 |
|
| 859 |
|
| 2,255 |
|
| 2,662 |
|
| Advisory fees |
| 984 |
|
| 126 |
|
| 70 |
|
| 267 |
|
| 151 |
|
| 249 |
|
| 219 |
|
| Administrative fees |
| 157 |
|
| 36 |
|
| 20 |
|
| 59 |
|
| 36 |
|
| 114 |
|
| 99 |
|
| 12b-1 fees (Class A) |
| 78 |
|
| 18 |
|
| 10 |
|
| 29 |
|
| 17 |
|
| 171 |
|
| 149 |
|
| Board of trustee fees |
| 28 |
|
| 2 |
|
| — |
|
| 2 |
|
| 2 |
|
| 126 |
|
| 132 |
|
| Chief compliance officer fees |
| 1 |
|
| — |
|
| — |
|
| 1 |
|
| — |
|
| 3 |
|
| 3 |
|
| Other expenses |
| 2 |
|
| — |
|
| — |
|
| 2 |
|
| 1 |
|
| 9 |
|
| 7 |
|
Total liabilities |
| 2,610 |
|
| 2,066 |
|
| 1,002 |
|
| 1,384 |
|
| 1,066 |
|
| 2,927 |
|
| 3,271 |
| |
Net assets | $ | 1,215,963 |
| $ | 284,086 |
| $ | 159,291 |
| $ | 450,393 |
| $ | 271,056 |
| $ | 2,635,945 |
| $ | 2,283,528 |
| |
Net assets consist of: |
|
|
|
|
|
|
|
|
|
|
|
|
|
|
|
|
|
|
|
|
| |
Paid-in capital(b) | $ | 1,306,305 |
| $ | 305,815 |
| $ | 174,122 |
| $ | 541,496 |
| $ | 325,471 |
| $ | 2,862,495 |
| $ | 2,450,231 |
| |
Total distributable earnings (loss)(b) |
| (90,342 | ) |
| (21,729 | ) |
| (14,831 | ) |
| (91,103 | ) |
| (54,415 | ) |
| (226,550 | ) |
| (166,703 | ) | |
Net assets | $ | 1,215,963 |
| $ | 284,086 |
| $ | 159,291 |
| $ | 450,393 |
| $ | 271,056 |
| $ | 2,635,945 |
| $ | 2,283,528 |
| |
Net assets - Class A | $ | 1,209,431 |
| $ | 278,980 |
| $ | 155,905 |
| $ | 444,504 |
| $ | 267,736 |
| $ | 2,635,440 |
| $ | 2,282,504 |
| |
Shares outstanding - Class A |
| 108,076 |
|
| 26,288 |
|
| 15,622 |
|
| 49,484 |
|
| 27,042 |
|
| 165,911 |
|
| 142,103 |
| |
Net asset value per share - Class A | $ | 11.19 |
| $ | 10.61 |
| $ | 9.98 |
| $ | 8.98 |
| $ | 9.90 |
| $ | 15.88 |
| $ | 16.06 |
| |
Net assets - Class I | $ | 6,532 |
| $ | 5,106 |
| $ | 3,386 |
| $ | 5,889 |
| $ | 3,320 |
| $ | 505 |
| $ | 1,024 |
| |
Shares outstanding - Class I |
| 578 |
|
| 479 |
|
| 338 |
|
| 653 |
|
| 334 |
|
| 32 |
|
| 63 |
| |
Net asset value per share - Class I | $ | 11.31 |
| $ | 10.66 |
| $ | 10.03 |
| $ | 9.01 |
| $ | 9.94 |
| $ | 15.95 |
| $ | 16.13 |
| |
Investments - affiliated, at cost | $ | 1,299,673 |
| $ | 305,901 |
| $ | 174,170 |
| $ | 541,637 |
| $ | 325,557 |
| $ | 2,863,167 |
| $ | 2,450,840 |
| |
(a) | The Master Funds for the JNL/American Funds Master Feeder Funds are the Class 1 shares of the corresponding American Fund Insurance Series Fund. The Master Funds for the JNL/Vanguard Master Feeder Funds are the shares of the corresponding Vanguard Variable Insurance Fund. These financial statements should be read in conjunction with each Master Fund's respective shareholder report. |
(b) | For funds structured as partnerships, Paid-in capital represents partners' capital and Total distributable earnings (loss) represents net unrealized appreciation (depreciation) on investments and foreign currency. |
See accompanying Notes to Financial Statements.
48
JNL Series Trust Master Feeder Funds and Funds of Funds
Statements of Assets and Liabilities (in thousands, except net asset value per share)
December 31, 2018
|
| JNL/American Funds Moderate Growth Allocation Fund |
| JNL/American Funds Growth Allocation Fund |
| JNL/DFA Growth Allocation Fund |
| JNL/DFA Moderate Growth Allocation Fund |
| JNL Moderate Growth Allocation Fund |
| JNL Growth Allocation Fund |
| JNL Aggressive Growth Allocation Fund |
| |||||||
Assets |
|
|
|
|
|
|
|
|
|
|
|
|
|
|
|
|
|
|
|
|
| |
Investments - unaffiliated, at value | $ | 1,921,236 |
| $ | 2,094,560 |
| $ | 159,059 |
| $ | 127,006 |
| $ | — |
| $ | — |
| $ | — |
| |
Investments - affiliated, at value |
| 219,069 |
|
| 192,914 |
|
| — |
|
| — |
|
| 2,161,979 |
|
| 2,154,261 |
|
| 1,336,867 |
| |
Receivable from: |
|
|
|
|
|
|
|
|
|
|
|
|
|
|
|
|
|
|
|
|
| |
| Investment securities sold |
| 115 |
|
| — |
|
| — |
|
| — |
|
| 8,630 |
|
| 871 |
|
| 687 |
|
| Fund shares sold |
| 2,518 |
|
| 1,756 |
|
| 133 |
|
| 124 |
|
| 924 |
|
| 1,977 |
|
| 1,175 |
|
| Adviser |
| — |
|
| — |
|
| 6 |
|
| 5 |
|
| — |
|
| — |
|
| — |
|
Other assets |
| 1 |
|
| — |
|
| — |
|
| — |
|
| — |
|
| — |
|
| — |
| |
Total assets |
| 2,142,939 |
|
| 2,289,230 |
|
| 159,198 |
|
| 127,135 |
|
| 2,171,533 |
|
| 2,157,109 |
|
| 1,338,729 |
| |
Liabilities |
|
|
|
|
|
|
|
|
|
|
|
|
|
|
|
|
|
|
|
|
| |
Payable for: |
|
|
|
|
|
|
|
|
|
|
|
|
|
|
|
|
|
|
|
|
| |
| Investment securities purchased |
| — |
|
| 177 |
|
| 105 |
|
| 97 |
|
| — |
|
| — |
|
| — |
|
| Fund shares redeemed |
| 2,633 |
|
| 1,579 |
|
| 28 |
|
| 27 |
|
| 9,553 |
|
| 2,848 |
|
| 1,862 |
|
| Advisory fees |
| 342 |
|
| 365 |
|
| 25 |
|
| 22 |
|
| 171 |
|
| 171 |
|
| 114 |
|
| Administrative fees |
| 275 |
|
| 295 |
|
| 19 |
|
| 16 |
|
| 93 |
|
| 93 |
|
| 58 |
|
| 12b-1 fees (Class A) |
| 138 |
|
| 147 |
|
| 10 |
|
| 8 |
|
| 141 |
|
| 139 |
|
| 86 |
|
| Board of trustee fees |
| 38 |
|
| 33 |
|
| 1 |
|
| — |
|
| 86 |
|
| 64 |
|
| 41 |
|
| Chief compliance officer fees |
| 2 |
|
| 3 |
|
| — |
|
| — |
|
| 3 |
|
| 2 |
|
| 2 |
|
| Other expenses |
| 4 |
|
| 4 |
|
| — |
|
| — |
|
| 7 |
|
| 7 |
|
| 4 |
|
Total liabilities |
| 3,432 |
|
| 2,603 |
|
| 188 |
|
| 170 |
|
| 10,054 |
|
| 3,324 |
|
| 2,167 |
| |
Net assets | $ | 2,139,507 |
| $ | 2,286,627 |
| $ | 159,010 |
| $ | 126,965 |
| $ | 2,161,479 |
| $ | 2,153,785 |
| $ | 1,336,562 |
| |
Net assets consist of: |
|
|
|
|
|
|
|
|
|
|
|
|
|
|
|
|
|
|
|
|
| |
Paid-in capital(a) | $ | 2,245,775 |
| $ | 2,441,030 |
| $ | 173,114 |
| $ | 136,273 |
| $ | 2,337,531 |
| $ | 2,390,130 |
| $ | 1,510,915 |
| |
Total distributable earnings (loss)(a) |
| (106,268 | ) |
| (154,403 | ) |
| (14,104 | ) |
| (9,308 | ) |
| (176,052 | ) |
| (236,345 | ) |
| (174,353 | ) | |
Net assets | $ | 2,139,507 |
| $ | 2,286,627 |
| $ | 159,010 |
| $ | 126,965 |
| $ | 2,161,479 |
| $ | 2,153,785 |
| $ | 1,336,562 |
| |
Net assets - Class A | $ | 2,131,575 |
| $ | 2,277,300 |
| $ | 156,272 |
| $ | 123,206 |
| $ | 2,159,584 |
| $ | 2,147,880 |
| $ | 1,332,619 |
| |
Shares outstanding - Class A |
| 150,032 |
|
| 147,363 |
|
| 16,070 |
|
| 12,492 |
|
| 168,768 |
|
| 174,173 |
|
| 114,543 |
| |
Net asset value per share - Class A | $ | 14.21 |
| $ | 15.45 |
| $ | 9.72 |
| $ | 9.86 |
| $ | 12.80 |
| $ | 12.33 |
| $ | 11.63 |
| |
Net assets - Class I | $ | 7,932 |
| $ | 9,327 |
| $ | 2,738 |
| $ | 3,759 |
| $ | 1,895 |
| $ | 5,905 |
| $ | 3,943 |
| |
Shares outstanding - Class I |
| 556 |
|
| 601 |
|
| 281 |
|
| 379 |
|
| 148 |
|
| 477 |
|
| 338 |
| |
Net asset value per share - Class I | $ | 14.27 |
| $ | 15.52 |
| $ | 9.75 |
| $ | 9.91 |
| $ | 12.85 |
| $ | 12.38 |
| $ | 11.68 |
| |
Investments - unaffiliated, at cost | $ | 2,004,552 |
| $ | 2,228,318 |
| $ | 177,799 |
| $ | 140,180 |
| $ | — |
| $ | — |
| $ | — |
| |
Investments - affiliated, at cost |
| 242,021 |
|
| 213,559 |
|
| — |
|
| — |
|
| 2,338,031 |
|
| 2,390,606 |
|
| 1,511,220 |
| |
(a) | For funds structured as partnerships, Paid-in capital represents partners' capital and Total distributable earnings (loss) represents net unrealized appreciation (depreciation) on investments and foreign currency. |
See accompanying Notes to Financial Statements.
49
JNL Series Trust Master Feeder Funds and Funds of Funds
Statements of Assets and Liabilities (in thousands, except net asset value per share)
December 31, 2018
|
| JNL/Franklin Templeton Founding Strategy Fund |
| JNL/Mellon Capital 10 x 10 Fund |
| JNL/Mellon Capital Index 5 Fund |
| JNL/S&P 4 Fund |
| JNL/S&P Managed Conservative Fund |
| JNL/S&P Managed Moderate Fund |
| JNL/S&P Managed Moderate Growth Fund |
| |||||||
Assets |
|
|
|
|
|
|
|
|
|
|
|
|
|
|
|
|
|
|
|
|
| |
Investments - affiliated, at value |
| 1,176,550 |
|
| 406,281 |
|
| 859,002 |
|
| 5,884,829 |
|
| 1,221,969 |
|
| 2,861,911 |
|
| 5,475,728 |
| |
Receivable from: |
|
|
|
|
|
|
|
|
|
|
|
|
|
|
|
|
|
|
|
|
| |
| Investment securities sold |
| — |
|
| 91 |
|
| 722 |
|
| 2,160 |
|
| 1,759 |
|
| 81 |
|
| 1,689 |
|
| Fund shares sold |
| 1,260 |
|
| 308 |
|
| 62 |
|
| 3,367 |
|
| 419 |
|
| 2,240 |
|
| 4,348 |
|
Total assets |
| 1,177,810 |
|
| 406,680 |
|
| 859,786 |
|
| 5,890,356 |
|
| 1,224,147 |
|
| 2,864,232 |
|
| 5,481,765 |
| |
Liabilities |
|
|
|
|
|
|
|
|
|
|
|
|
|
|
|
|
|
|
|
|
| |
Payable for: |
|
|
|
|
|
|
|
|
|
|
|
|
|
|
|
|
|
|
|
|
| |
| Investment securities purchased |
| 281 |
|
| — |
|
| — |
|
| — |
|
| — |
|
| — |
|
| — |
|
| Fund shares redeemed |
| 979 |
|
| 399 |
|
| 784 |
|
| 5,526 |
|
| 2,178 |
|
| 2,321 |
|
| 6,037 |
|
| Advisory fees |
| — |
|
| — |
|
| — |
|
| — |
|
| 105 |
|
| 219 |
|
| 386 |
|
| Administrative fees |
| 52 |
|
| 18 |
|
| 37 |
|
| 246 |
|
| 53 |
|
| 123 |
|
| 226 |
|
| 12b-1 fees (Class A) |
| 76 |
|
| 26 |
|
| 55 |
|
| 378 |
|
| 80 |
|
| 186 |
|
| 354 |
|
| Board of trustee fees |
| 70 |
|
| 18 |
|
| 30 |
|
| 203 |
|
| 70 |
|
| 134 |
|
| 246 |
|
| Chief compliance officer fees |
| 1 |
|
| — |
|
| 1 |
|
| 7 |
|
| 1 |
|
| 4 |
|
| 7 |
|
| Other expenses |
| 3 |
|
| 1 |
|
| 3 |
|
| 19 |
|
| 5 |
|
| 8 |
|
| 18 |
|
Total liabilities |
| 1,462 |
|
| 462 |
|
| 910 |
|
| 6,379 |
|
| 2,492 |
|
| 2,995 |
|
| 7,274 |
| |
Net assets | $ | 1,176,348 |
| $ | 406,218 |
| $ | 858,876 |
| $ | 5,883,977 |
| $ | 1,221,655 |
| $ | 2,861,237 |
| $ | 5,474,491 |
| |
Net assets consist of: |
|
|
|
|
|
|
|
|
|
|
|
|
|
|
|
|
|
|
|
|
| |
Paid-in capital(a) | $ | 1,334,974 |
| $ | 440,833 |
| $ | 953,245 |
| $ | 6,201,363 |
| $ | 1,270,479 |
| $ | 3,016,682 |
| $ | 5,879,040 |
| |
Total distributable earnings (loss)(a) |
| (158,626 | ) |
| (34,615 | ) |
| (94,369 | ) |
| (317,386 | ) |
| (48,824 | ) |
| (155,445 | ) |
| (404,549 | ) | |
Net assets | $ | 1,176,348 |
| $ | 406,218 |
| $ | 858,876 |
| $ | 5,883,977 |
| $ | 1,221,655 |
| $ | 2,861,237 |
| $ | 5,474,491 |
| |
Net assets - Class A | $ | 1,175,318 |
| $ | 406,208 |
| $ | 857,993 |
| $ | 5,878,323 |
| $ | 1,221,090 |
| $ | 2,858,779 |
| $ | 5,467,006 |
| |
Shares outstanding - Class A |
| 92,911 |
|
| 32,207 |
|
| 63,655 |
|
| 307,319 |
|
| 93,138 |
|
| 191,902 |
|
| 327,804 |
| |
Net asset value per share - Class A | $ | 12.65 |
| $ | 12.61 |
| $ | 13.48 |
| $ | 19.13 |
| $ | 13.11 |
| $ | 14.90 |
| $ | 16.68 |
| |
Net assets - Class I | $ | 1,030 |
| $ | 10 |
| $ | 883 |
| $ | 5,654 |
| $ | 565 |
| $ | 2,458 |
| $ | 7,485 |
| |
Shares outstanding - Class I |
| 81 |
|
| 1 |
|
| 65 |
|
| 294 |
|
| 43 |
|
| 164 |
|
| 447 |
| |
Net asset value per share - Class I | $ | 12.70 |
| $ | 12.67 |
| $ | 13.54 |
| $ | 19.20 |
| $ | 13.13 |
| $ | 14.95 |
| $ | 16.74 |
| |
Investments - affiliated, at cost | $ | 1,335,176 |
| $ | 440,896 |
| $ | 953,371 |
| $ | 6,202,214 |
| $ | 1,270,793 |
| $ | 3,017,356 |
| $ | 5,880,277 |
| |
(a) | For funds structured as partnerships, Paid-in capital represents partners' capital and Total distributable earnings (loss) represents net unrealized appreciation (depreciation) on investments and foreign currency. |
See accompanying Notes to Financial Statements.
50
JNL Series Trust Master Feeder Funds and Funds of Funds
Statements of Assets and Liabilities (in thousands, except net asset value per share)
December 31, 2018
|
| JNL/S&P Managed Growth Fund |
| JNL/S&P Managed Aggressive Growth Fund |
| JNL/Vanguard Global Bond Market Index Fund |
| JNL/Vanguard International Stock Market Index Fund |
| JNL/Vanguard U.S. Stock Market Index Fund |
|
| |||||
Assets |
|
|
|
|
|
|
|
|
|
|
|
|
|
|
|
| |
Investments - unaffiliated, at value | $ | — |
| $ | — |
| $ | 71,521 |
| $ | 226,133 |
| $ | 270,939 |
|
| |
Investments - affiliated, at value |
| 4,925,020 |
|
| 2,004,331 |
|
| — |
|
| — |
|
| — |
|
| |
Receivable from: |
|
|
|
|
|
|
|
|
|
|
|
|
|
|
|
| |
| Investment securities sold |
| 1,486 |
|
| 1,216 |
|
| — |
|
| — |
|
| — |
|
|
| Fund shares sold |
| 4,046 |
|
| 938 |
|
| 744 |
|
| 366 |
|
| 1,524 |
|
|
| Dividends |
| — |
|
| — |
|
| 4 |
|
| — |
|
| — |
|
|
| Adviser |
| — |
|
| — |
|
| 5 |
|
| 14 |
|
| 14 |
|
|
Total assets |
| 4,930,552 |
|
| 2,006,485 |
|
| 72,274 |
|
| 226,513 |
|
| 272,477 |
|
| |
Liabilities |
|
|
|
|
|
|
|
|
|
|
|
|
|
|
|
| |
Payable for: |
|
|
|
|
|
|
|
|
|
|
|
|
|
|
|
| |
| Investment securities purchased |
| — |
|
| — |
|
| 545 |
|
| 242 |
|
| 1,351 |
|
|
| Fund shares redeemed |
| 5,531 |
|
| 2,154 |
|
| 199 |
|
| 124 |
|
| 173 |
|
|
| Advisory fees |
| 355 |
|
| 161 |
|
| 11 |
|
| 39 |
|
| 46 |
|
|
| Administrative fees |
| 205 |
|
| 87 |
|
| 8 |
|
| 29 |
|
| 23 |
|
|
| 12b-1 fees (Class A) |
| 317 |
|
| 129 |
|
| 5 |
|
| 14 |
|
| 17 |
|
|
| Board of trustee fees |
| 201 |
|
| 76 |
|
| — |
|
| 1 |
|
| 1 |
|
|
| Chief compliance officer fees |
| 6 |
|
| 2 |
|
| — |
|
| — |
|
| — |
|
|
| Other expenses |
| 16 |
|
| 7 |
|
| — |
|
| 1 |
|
| 1 |
|
|
Total liabilities |
| 6,631 |
|
| 2,616 |
|
| 768 |
|
| 450 |
|
| 1,612 |
|
| |
Net assets | $ | 4,923,921 |
| $ | 2,003,869 |
| $ | 71,506 |
| $ | 226,063 |
| $ | 270,865 |
|
| |
Net assets consist of: |
|
|
|
|
|
|
|
|
|
|
|
|
|
|
|
| |
Paid-in capital(a) | $ | 5,345,587 |
| $ | 2,184,797 |
| $ | 71,726 |
| $ | 266,696 |
| $ | 297,522 |
|
| |
Total distributable earnings (loss)(a) |
| (421,666 | ) |
| (180,928 | ) |
| (220 | ) |
| (40,633 | ) |
| (26,657 | ) |
| |
Net assets | $ | 4,923,921 |
| $ | 2,003,869 |
| $ | 71,506 |
| $ | 226,063 |
| $ | 270,865 |
|
| |
Net assets - Class A | $ | 4,919,498 |
| $ | 1,998,398 |
| $ | 70,213 |
| $ | 221,452 |
| $ | 265,605 |
|
| |
Shares outstanding - Class A |
| 277,300 |
|
| 96,461 |
|
| 6,927 |
|
| 24,925 |
|
| 26,335 |
|
| |
Net asset value per share - Class A | $ | 17.74 |
| $ | 20.72 |
| $ | 10.14 |
| $ | 8.88 |
| $ | 10.09 |
|
| |
Net assets - Class I | $ | 4,423 |
| $ | 5,471 |
| $ | 1,293 |
| $ | 4,611 |
| $ | 5,260 |
|
| |
Shares outstanding - Class I |
| 248 |
|
| 263 |
|
| 127 |
|
| 517 |
|
| 519 |
|
| |
Net asset value per share - Class I | $ | 17.81 |
| $ | 20.80 |
| $ | 10.18 |
| $ | 8.91 |
| $ | 10.14 |
|
| |
Investments - unaffiliated, at cost | $ | — |
| $ | — |
| $ | 71,741 |
| $ | 266,766 |
| $ | 297,596 |
|
| |
Investments - affiliated, at cost |
| 5,346,686 |
|
| 2,185,259 |
|
| — |
|
| — |
|
| — |
|
| |
(a) | For funds structured as partnerships, Paid-in capital represents partners' capital and Total distributable earnings (loss) represents net unrealized appreciation (depreciation) on investments and foreign currency. |
See accompanying Notes to Financial Statements.
51
JNL Series Trust Master Feeder Funds and Funds of Funds
Statements of Operations (in thousands)
For the Year Ended December 31, 2018
|
| JNL/American Funds Balanced Fund(b) |
| JNL/American Funds Blue Chip Income and Growth Fund(b) |
| JNL/American Funds Capital Income Builder Fund(b)(c) |
| JNL/American Funds Global Bond Fund(b) |
| JNL/American Funds Global Small Capitalization Fund(b) |
| JNL/American Funds Growth-Income Fund(b) |
| JNL/American Funds International Fund(b) |
| ||||||||
Investment income |
|
|
|
|
|
|
|
|
|
|
|
|
|
|
|
|
|
|
|
|
| ||
Dividends (a) | $ | — |
| $ | — |
| $ | — |
| $ | — |
| $ | — |
| $ | — |
| $ | — |
| ||
Dividends received from master fund (a) |
| 20,514 |
|
| 71,069 |
|
| 210 |
|
| 12,266 |
|
| 2,411 |
|
| 110,366 |
|
| 38,590 |
| ||
Total investment income |
| 20,514 |
|
| 71,069 |
|
| 210 |
|
| 12,266 |
|
| 2,411 |
|
| 110,366 |
|
| 38,590 |
| ||
|
|
|
|
|
|
|
|
|
|
|
|
|
|
|
|
|
|
|
|
|
|
|
|
Expenses |
|
|
|
|
|
|
|
|
|
|
|
|
|
|
|
|
|
|
|
|
| ||
Advisory fees |
| 5,072 |
|
| 18,851 |
|
| 23 |
|
| 3,196 |
|
| 4,615 |
|
| 35,364 |
|
| 14,606 |
| ||
Administrative fees |
| 1,446 |
|
| 4,945 |
|
| 7 |
|
| 799 |
|
| 1,065 |
|
| 8,955 |
|
| 3,023 |
| ||
12b-1 fees (Class A) |
| 2,874 |
|
| 10,018 |
|
| 13 |
|
| 1,596 |
|
| 2,126 |
|
| 19,242 |
|
| 6,032 |
| ||
Legal fees |
| 5 |
|
| 17 |
|
| — |
|
| 3 |
|
| 4 |
|
| 32 |
|
| 10 |
| ||
Board of trustee fees |
| 13 |
|
| 42 |
|
| — |
|
| 7 |
|
| 9 |
|
| 83 |
|
| 25 |
| ||
Chief compliance officer fees |
| 2 |
|
| 5 |
|
| — |
|
| 1 |
|
| 1 |
|
| 11 |
|
| 3 |
| ||
Other expenses |
| 13 |
|
| 23 |
|
| — |
|
| 3 |
|
| 5 |
|
| 60 |
|
| 14 |
| ||
Total expenses |
| 9,425 |
|
| 33,901 |
|
| 43 |
|
| 5,605 |
|
| 7,825 |
|
| 63,747 |
|
| 23,713 |
| ||
Expense waiver |
| (3,857 | ) |
| (14,374 | ) |
| (16 | ) |
| (2,797 | ) |
| (3,905 | ) |
| (22,495 | ) |
| (11,083 | ) | ||
Net expenses |
| 5,568 |
|
| 19,527 |
|
| 27 |
|
| 2,808 |
|
| 3,920 |
|
| 41,252 |
|
| 12,630 |
| ||
Net investment income (loss) |
| 14,946 |
|
| 51,542 |
|
| 183 |
|
| 9,458 |
|
| (1,509 | ) |
| 69,114 |
|
| 25,960 |
| ||
|
|
|
|
|
|
|
|
|
|
|
|
|
|
|
|
|
|
|
|
|
|
|
|
Realized and unrealized gain (loss) |
|
|
|
|
|
|
|
|
|
|
|
|
|
|
|
|
|
|
|
|
| ||
Net realized gain (loss) on: |
|
|
|
|
|
|
|
|
|
|
|
|
|
|
|
|
|
|
|
|
| ||
| Investments - unaffiliated |
| 37 |
|
| — |
|
| — |
|
| — |
|
| — |
|
| — |
|
| — |
| |
| Investments - affiliated |
| — |
|
| 102,200 |
|
| — |
|
| (3,950 | ) |
| 9,116 |
|
| 34,285 |
|
| 20,108 |
| |
| Distributions from unaffiliated |
|
|
|
|
|
|
|
|
|
|
|
|
|
|
|
|
|
|
|
|
| |
|
| investment companies |
| 41,203 |
|
| — |
|
| — |
|
| — |
|
| — |
|
| — |
|
| — |
|
| Distributions from affiliated investment |
|
|
|
|
|
|
|
|
|
|
|
|
|
|
|
|
|
|
|
|
| |
|
| companies |
| — |
|
| 254,976 |
|
| — |
|
| 1,897 |
|
| 31,659 |
|
| 431,389 |
|
| 97,572 |
|
Net change in unrealized appreciation |
|
|
|
|
|
|
|
|
|
|
|
|
|
|
|
|
|
|
|
|
| ||
| (depreciation) on: |
|
|
|
|
|
|
|
|
|
|
|
|
|
|
|
|
|
|
|
|
| |
| Investments - unaffiliated |
| (113,136 | ) |
| — |
|
| (1,034 | ) |
| — |
|
| — |
|
| — |
|
| — |
| |
| Investments - affiliated |
| — |
|
| (698,332 | ) |
| — |
|
| (17,878 | ) |
| (116,390 | ) |
| (700,309 | ) |
| (420,120 | ) | |
Net realized and unrealized gain (loss) |
| (71,896 | ) |
| (341,156 | ) |
| (1,034 | ) |
| (19,931 | ) |
| (75,615 | ) |
| (234,635 | ) |
| (302,440 | ) | ||
Change in net assets from operations | $ | (56,950 | ) | $ | (289,614 | ) | $ | (851 | ) | $ | (10,473 | ) | $ | (77,124 | ) | $ | (165,521 | ) | $ | (276,480 | ) | ||
(a) | Affiliated income | $ | — |
| $ | 71,069 |
| $ | — |
| $ | 12,266 |
| $ | 2,411 |
| $ | 110,366 |
| $ | 38,590 |
| |
(b) | The Master Funds for the JNL/American Funds Master Feeder Funds are the Class 1 shares of the corresponding American Fund Insurance Series Fund. The Master Funds for the JNL/Vanguard Master Feeder Funds are the shares of the corresponding Vanguard Variable Insurance Fund. These financial statements should be read in conjunction with each Master Fund's respective shareholder report. |
(c) | Period from commencement of operations August 13, 2018. |
See accompanying Notes to Financial Statements.
52
JNL Series Trust Master Feeder Funds and Funds of Funds
Statements of Operations (in thousands)
For the Year Ended December 31, 2018
|
|
| JNL/American Funds New World Fund(b) |
| JNL/Vanguard Capital Growth Fund(b) |
| JNL/Vanguard Equity Income Fund(b) |
| JNL/Vanguard International Fund(b) |
| JNL/Vanguard Small Company Growth Fund(b) |
| JNL Institutional Alt 25 Fund |
| JNL Institutional Alt 50 Fund |
| |||||||
Investment income |
|
|
|
|
|
|
|
|
|
|
|
|
|
|
|
|
|
|
|
|
| ||
Dividends (a) | $ | — |
| $ | — |
| $ | — |
| $ | — |
| $ | — |
| $ | 32,124 |
| $ | 26,474 |
| ||
Dividends received from master fund (a) |
| 15,285 |
|
| 1,130 |
|
| 1,485 |
|
| 2,018 |
|
| 269 |
|
| — |
|
| — |
| ||
Total investment income |
| 15,285 |
|
| 1,130 |
|
| 1,485 |
|
| 2,018 |
|
| 269 |
|
| 32,124 |
|
| 26,474 |
| ||
|
|
|
|
|
|
|
|
|
|
|
|
|
|
|
|
|
|
|
|
|
|
|
|
Expenses |
|
|
|
|
|
|
|
|
|
|
|
|
|
|
|
|
|
|
|
|
| ||
Advisory fees |
| 12,820 |
|
| 1,021 |
|
| 529 |
|
| 2,573 |
|
| 1,104 |
|
| 3,308 |
|
| 2,893 |
| ||
Administrative fees |
| 2,054 |
|
| 292 |
|
| 151 |
|
| 572 |
|
| 265 |
|
| 1,526 |
|
| 1,322 |
| ||
12b-1 fees (Class A) |
| 4,095 |
|
| 577 |
|
| 298 |
|
| 1,133 |
|
| 525 |
|
| 9,190 |
|
| 7,928 |
| ||
Legal fees |
| 7 |
|
| 1 |
|
| 1 |
|
| 2 |
|
| 1 |
|
| 14 |
|
| 13 |
| ||
Board of trustee fees |
| 17 |
|
| 2 |
|
| 1 |
|
| 6 |
|
| 2 |
|
| 37 |
|
| 33 |
| ||
Chief compliance officer fees |
| 2 |
|
| 1 |
|
| 1 |
|
| 1 |
|
| 1 |
|
| 5 |
|
| 4 |
| ||
Other expenses |
| 10 |
|
| 1 |
|
| — |
|
| 2 |
|
| — |
|
| 29 |
|
| 25 |
| ||
Total expenses |
| 19,005 |
|
| 1,895 |
|
| 981 |
|
| 4,289 |
|
| 1,898 |
|
| 14,109 |
|
| 12,218 |
| ||
Expense waiver |
| (10,267 | ) |
| (778 | ) |
| (403 | ) |
| (2,097 | ) |
| (883 | ) |
| — |
|
| — |
| ||
Net expenses |
| 8,738 |
|
| 1,117 |
|
| 578 |
|
| 2,192 |
|
| 1,015 |
|
| 14,109 |
|
| 12,218 |
| ||
Net investment income (loss) |
| 6,547 |
|
| 13 |
|
| 907 |
|
| (174 | ) |
| (746 | ) |
| 18,015 |
|
| 14,256 |
| ||
|
|
|
|
|
|
|
|
|
|
|
|
|
|
|
|
|
|
|
|
|
|
|
|
Realized and unrealized gain (loss) |
|
|
|
|
|
|
|
|
|
|
|
|
|
|
|
|
|
|
|
|
| ||
Net realized gain (loss) on: |
|
|
|
|
|
|
|
|
|
|
|
|
|
|
|
|
|
|
|
|
| ||
| Investments - affiliated |
| 5,208 |
|
| 1,488 |
|
| (111 | ) |
| (2,069 | ) |
| (611 | ) |
| 34,396 |
|
| 23,015 |
| |
| Distributions from affiliated investment |
|
|
|
|
|
|
|
|
|
|
|
|
|
|
|
|
|
|
|
|
| |
|
| companies |
| 37,528 |
|
| 3,546 |
|
| 3,917 |
|
| 6,754 |
|
| 7,276 |
|
| 92,776 |
|
| 61,355 |
|
Net change in unrealized appreciation |
|
|
|
|
|
|
|
|
|
|
|
|
|
|
|
|
|
|
|
|
| ||
| (depreciation) on: |
|
|
|
|
|
|
|
|
|
|
|
|
|
|
|
|
|
|
|
|
| |
| Investments - affiliated |
| (255,813 | ) |
| (24,333 | ) |
| (15,620 | ) |
| (92,365 | ) |
| (56,216 | ) |
| (343,572 | ) |
| (253,109 | ) | |
Net realized and unrealized gain (loss) |
| (213,077 | ) |
| (19,299 | ) |
| (11,814 | ) |
| (87,680 | ) |
| (49,551 | ) |
| (216,400 | ) |
| (168,739 | ) | ||
Change in net assets from operations | $ | (206,530 | ) | $ | (19,286 | ) | $ | (10,907 | ) | $ | (87,854 | ) | $ | (50,297 | ) | $ | (198,385 | ) | $ | (154,483 | ) | ||
(a) | Affiliated income | $ | 15,285 |
| $ | 1,130 |
| $ | 1,485 |
| $ | 2,018 |
| $ | 269 |
| $ | 32,124 |
| $ | 26,474 |
| |
(b) | The Master Funds for the JNL/American Funds Master Feeder Funds are the Class 1 shares of the corresponding American Fund Insurance Series Fund. The Master Funds for the JNL/Vanguard Master Feeder Funds are the shares of the corresponding Vanguard Variable Insurance Fund. These financial statements should be read in conjunction with each Master Fund's respective shareholder report. |
See accompanying Notes to Financial Statements.
53
JNL Series Trust Master Feeder Funds and Funds of Funds
Statements of Operations (in thousands)
For the Year Ended December 31, 2018
|
|
| JNL/American Funds Moderate Growth Allocation Fund |
| JNL/American Funds Growth Allocation Fund |
| JNL/DFA Growth Allocation Fund |
| JNL/DFA Moderate Growth Allocation Fund |
| JNL Moderate Growth Allocation Fund |
| JNL Growth Allocation Fund |
| JNL Aggressive Growth Allocation Fund |
| |||||||
Investment income |
|
|
|
|
|
|
|
|
|
|
|
|
|
|
|
|
|
|
|
|
| ||
Dividends (a) | $ | 49,512 |
| $ | 42,830 |
| $ | 3,183 |
| $ | 2,880 |
| $ | 29,857 |
| $ | 23,434 |
| $ | 13,497 |
| ||
Total investment income |
| 49,512 |
|
| 42,830 |
|
| 3,183 |
|
| 2,880 |
|
| 29,857 |
|
| 23,434 |
|
| 13,497 |
| ||
|
|
|
|
|
|
|
|
|
|
|
|
|
|
|
|
|
|
|
|
|
|
|
|
Expenses |
|
|
|
|
|
|
|
|
|
|
|
|
|
|
|
|
|
|
|
|
| ||
Advisory fees |
| 4,204 |
|
| 4,341 |
|
| 252 |
|
| 213 |
|
| 2,183 |
|
| 2,221 |
|
| 1,500 |
| ||
Administrative fees |
| 3,390 |
|
| 3,507 |
|
| 189 |
|
| 159 |
|
| 1,208 |
|
| 1,232 |
|
| 782 |
| ||
12b-1 fees (Class A) |
| 6,766 |
|
| 7,001 |
|
| 374 |
|
| 312 |
|
| 7,244 |
|
| 7,380 |
|
| 4,683 |
| ||
Legal fees |
| 11 |
|
| 12 |
|
| 1 |
|
| 1 |
|
| — |
|
| 6 |
|
| 1 |
| ||
Board of trustee fees |
| 29 |
|
| 30 |
|
| 2 |
|
| 1 |
|
| 33 |
|
| 32 |
|
| 20 |
| ||
Chief compliance officer fees |
| 4 |
|
| 4 |
|
| — |
|
| — |
|
| 2 |
|
| 3 |
|
| 2 |
| ||
Other expenses |
| 15 |
|
| 15 |
|
| — |
|
| — |
|
| 19 |
|
| 24 |
|
| 15 |
| ||
Total expenses |
| 14,419 |
|
| 14,910 |
|
| 818 |
|
| 686 |
|
| 10,689 |
|
| 10,898 |
|
| 7,003 |
| ||
Expense waiver |
| — |
|
| — |
|
| (64 | ) |
| (54 | ) |
| — |
|
| — |
|
| — |
| ||
Net expenses |
| 14,419 |
|
| 14,910 |
|
| 754 |
|
| 632 |
|
| 10,689 |
|
| 10,898 |
|
| 7,003 |
| ||
Net investment income (loss) |
| 35,093 |
|
| 27,920 |
|
| 2,429 |
|
| 2,248 |
|
| 19,168 |
|
| 12,536 |
|
| 6,494 |
| ||
|
|
|
|
|
|
|
|
|
|
|
|
|
|
|
|
|
|
|
|
|
|
|
|
Realized and unrealized gain (loss) |
|
|
|
|
|
|
|
|
|
|
|
|
|
|
|
|
|
|
|
|
| ||
Net realized gain (loss) on: |
|
|
|
|
|
|
|
|
|
|
|
|
|
|
|
|
|
|
|
|
| ||
| Investments - unaffiliated |
| 8,727 |
|
| 6,304 |
|
| 61 |
|
| 175 |
|
| — |
|
| — |
|
| — |
| |
| Investments - affiliated |
| (331 | ) |
| (440 | ) |
| — |
|
| — |
|
| 16,148 |
|
| 20,904 |
|
| 17,057 |
| |
| Distributions from unaffiliated |
|
|
|
|
|
|
|
|
|
|
|
|
|
|
|
|
|
|
|
|
| |
|
| investment companies |
| 84,042 |
|
| 108,960 |
|
| 2,148 |
|
| 1,442 |
|
| — |
|
| — |
|
| — |
|
| Distributions from affiliated investment |
|
|
|
|
|
|
|
|
|
|
|
|
|
|
|
|
|
|
|
|
| |
|
| companies |
| — |
|
| — |
|
| — |
|
| — |
|
| 64,438 |
|
| 87,974 |
|
| 62,157 |
|
Net change in unrealized appreciation |
|
|
|
|
|
|
|
|
|
|
|
|
|
|
|
|
|
|
|
|
| ||
| (depreciation) on: |
|
|
|
|
|
|
|
|
|
|
|
|
|
|
|
|
|
|
|
|
| |
| Investments - unaffiliated |
| (203,593 | ) |
| (255,781 | ) |
| (20,981 | ) |
| (14,414 | ) |
| — |
|
| — |
|
| — |
| |
| Investments - affiliated |
| (27,824 | ) |
| (25,990 | ) |
| — |
|
| — |
|
| (255,946 | ) |
| (340,308 | ) |
| (244,275 | ) | |
Net realized and unrealized gain (loss) |
| (138,979 | ) |
| (166,947 | ) |
| (18,772 | ) |
| (12,797 | ) |
| (175,360 | ) |
| (231,430 | ) |
| (165,061 | ) | ||
Change in net assets from operations | $ | (103,886 | ) | $ | (139,027 | ) | $ | (16,343 | ) | $ | (10,549 | ) | $ | (156,192 | ) | $ | (218,894 | ) | $ | (158,567 | ) | ||
(a) | Affiliated income | $ | 8,260 |
| $ | 6,485 |
| $ | — |
| $ | — |
| $ | 29,857 |
| $ | 23,434 |
| $ | 13,497 |
| |
See accompanying Notes to Financial Statements.
54
JNL Series Trust Master Feeder Funds and Funds of Funds
Statements of Operations (in thousands)
For the Year Ended December 31, 2018
|
|
| JNL/Franklin Templeton Founding Strategy Fund |
| JNL/Mellon Capital 10 x 10 Fund |
| JNL/Mellon Capital Index 5 Fund |
| JNL/S&P 4 Fund |
| JNL/S&P Managed Conservative Fund |
| JNL/S&P Managed Moderate Fund |
| JNL/S&P Managed Moderate Growth Fund |
| |||||||
Investment income |
|
|
|
|
|
|
|
|
|
|
|
|
|
|
|
|
|
|
|
|
| ||
Dividends (a) | $ | 38,674 |
| $ | 10,202 |
| $ | 18,443 |
| $ | 144,412 |
| $ | 25,875 |
| $ | 50,214 |
| $ | 79,761 |
| ||
Total investment income |
| 38,674 |
|
| 10,202 |
|
| 18,443 |
|
| 144,412 |
|
| 25,875 |
|
| 50,214 |
|
| 79,761 |
| ||
|
|
|
|
|
|
|
|
|
|
|
|
|
|
|
|
|
|
|
|
|
|
|
|
Expenses |
|
|
|
|
|
|
|
|
|
|
|
|
|
|
|
|
|
|
|
|
| ||
Advisory fees |
| — |
|
| — |
|
| — |
|
| — |
|
| 1,344 |
|
| 2,774 |
|
| 4,968 |
| ||
Administrative fees |
| 691 |
|
| 236 |
|
| 493 |
|
| 3,229 |
|
| 684 |
|
| 1,574 |
|
| 2,926 |
| ||
12b-1 fees (Class A) |
| 4,142 |
|
| 1,414 |
|
| 2,955 |
|
| 20,519 |
|
| 4,102 |
|
| 9,495 |
|
| 18,493 |
| ||
Legal fees |
| 7 |
|
| 2 |
|
| 5 |
|
| 34 |
|
| 7 |
|
| 16 |
|
| 31 |
| ||
Board of trustee fees |
| 17 |
|
| 6 |
|
| 13 |
|
| 86 |
|
| 17 |
|
| 40 |
|
| 78 |
| ||
Chief compliance officer fees |
| 2 |
|
| 1 |
|
| 1 |
|
| 10 |
|
| 2 |
|
| 4 |
|
| 9 |
| ||
Other expenses |
| 13 |
|
| 4 |
|
| 10 |
|
| 66 |
|
| 13 |
|
| 31 |
|
| 59 |
| ||
Total expenses |
| 4,872 |
|
| 1,663 |
|
| 3,477 |
|
| 23,944 |
|
| 6,169 |
|
| 13,934 |
|
| 26,564 |
| ||
Net investment income (loss) |
| 33,802 |
|
| 8,539 |
|
| 14,966 |
|
| 120,468 |
|
| 19,706 |
|
| 36,280 |
|
| 53,197 |
| ||
|
|
|
|
|
|
|
|
|
|
|
|
|
|
|
|
|
|
|
|
|
|
|
|
Realized and unrealized gain (loss) |
|
|
|
|
|
|
|
|
|
|
|
|
|
|
|
|
|
|
|
|
| ||
Net realized gain (loss) on: |
|
|
|
|
|
|
|
|
|
|
|
|
|
|
|
|
|
|
|
|
| ||
| Investments - affiliated |
| 4,205 |
|
| 4,418 |
|
| 9,838 |
|
| 100,328 |
|
| 2,708 |
|
| 18,238 |
|
| 48,723 |
| |
| Distributions from affiliated investment |
|
|
|
|
|
|
|
|
|
|
|
|
|
|
|
|
|
|
|
|
| |
|
| companies |
| 35,664 |
|
| 11,956 |
|
| 49,868 |
|
| 348,279 |
|
| 16,399 |
|
| 82,285 |
|
| 265,121 |
|
Net change in unrealized appreciation |
|
|
|
|
|
|
|
|
|
|
|
|
|
|
|
|
|
|
|
|
| ||
| (depreciation) on: |
|
|
|
|
|
|
|
|
|
|
|
|
|
|
|
|
|
|
|
|
| |
| Investments - affiliated |
| (197,420 | ) |
| (63,633 | ) |
| (146,747 | ) |
| (939,864 | ) |
| (68,140 | ) |
| (237,179 | ) |
| (644,729 | ) | |
Net realized and unrealized gain (loss) |
| (157,551 | ) |
| (47,259 | ) |
| (87,041 | ) |
| (491,257 | ) |
| (49,033 | ) |
| (136,656 | ) |
| (330,885 | ) | ||
Change in net assets from operations | $ | (123,749 | ) | $ | (38,720 | ) | $ | (72,075 | ) | $ | (370,789 | ) | $ | (29,327 | ) | $ | (100,376 | ) | $ | (277,688 | ) | ||
(a) | Affiliated income | $ | 38,674 |
| $ | 10,202 |
| $ | 18,443 |
| $ | 144,412 |
| $ | 25,875 |
| $ | 50,214 |
| $ | 79,761 |
| |
See accompanying Notes to Financial Statements.
55
JNL Series Trust Master Feeder Funds and Funds of Funds
Statements of Operations (in thousands)
For the Year Ended December 31, 2018
|
|
| JNL/S&P Managed Growth Fund |
| JNL/S&P Managed Aggressive Growth Fund |
| JNL/Vanguard Global Bond Market Index Fund |
| JNL/Vanguard International Stock Market Index Fund |
| JNL/Vanguard U.S. Stock Market Index Fund |
|
| |||||
Investment income |
|
|
|
|
|
|
|
|
|
|
|
|
|
|
|
| ||
Dividends (a) | $ | 58,770 |
| $ | 19,738 |
| $ | 1,566 |
| $ | 6,811 |
| $ | 3,922 |
|
| ||
Total investment income |
| 58,770 |
|
| 19,738 |
|
| 1,566 |
|
| 6,811 |
|
| 3,922 |
|
| ||
|
|
|
|
|
|
|
|
|
|
|
|
|
|
|
|
|
|
|
Expenses |
|
|
|
|
|
|
|
|
|
|
|
|
|
|
|
| ||
Advisory fees |
| 4,572 |
|
| 2,059 |
|
| 93 |
|
| 434 |
|
| 369 |
|
| ||
Administrative fees |
| 2,672 |
|
| 1,131 |
|
| 70 |
|
| 325 |
|
| 184 |
|
| ||
12b-1 fees (Class A) |
| 16,802 |
|
| 6,775 |
|
| 138 |
|
| 642 |
|
| 545 |
|
| ||
Legal fees |
| 28 |
|
| 11 |
|
| — |
|
| 1 |
|
| 1 |
|
| ||
Board of trustee fees |
| 71 |
|
| 29 |
|
| 1 |
|
| 2 |
|
| 2 |
|
| ||
Chief compliance officer fees |
| 8 |
|
| 3 |
|
| — |
|
| 1 |
|
| 1 |
|
| ||
Other expenses |
| 54 |
|
| 22 |
|
| — |
|
| 2 |
|
| 1 |
|
| ||
Total expenses |
| 24,207 |
|
| 10,030 |
|
| 302 |
|
| 1,407 |
|
| 1,103 |
|
| ||
Expense waiver |
| — |
|
| — |
|
| (46 | ) |
| (152 | ) |
| (111 | ) |
| ||
Net expenses |
| 24,207 |
|
| 10,030 |
|
| 256 |
|
| 1,255 |
|
| 992 |
|
| ||
Net investment income (loss) |
| 34,563 |
|
| 9,708 |
|
| 1,310 |
|
| 5,556 |
|
| 2,930 |
|
| ||
|
|
|
|
|
|
|
|
|
|
|
|
|
|
|
|
|
|
|
Realized and unrealized gain (loss) |
|
|
|
|
|
|
|
|
|
|
|
|
|
|
|
| ||
Net realized gain (loss) on: |
|
|
|
|
|
|
|
|
|
|
|
|
|
|
|
| ||
| Investments - unaffiliated |
| — |
|
| — |
|
| (158 | ) |
| (3,419 | ) |
| 451 |
|
| |
| Investments - affiliated |
| 60,231 |
|
| 16,503 |
|
| — |
|
| — |
|
| — |
|
| |
| Distributions from affiliated investment |
|
|
|
|
|
|
|
|
|
|
|
|
|
|
|
| |
|
| companies |
| 312,852 |
|
| 135,653 |
|
| — |
|
| — |
|
| — |
|
|
Net change in unrealized appreciation |
|
|
|
|
|
|
|
|
|
|
|
|
|
|
|
| ||
| (depreciation) on: |
|
|
|
|
|
|
|
|
|
|
|
|
|
|
|
| |
| Investments - unaffiliated |
| — |
|
| — |
|
| (148 | ) |
| (42,727 | ) |
| (27,376 | ) |
| |
| Investments - affiliated |
| (711,694 | ) |
| (305,160 | ) |
| — |
|
| — |
|
| — |
|
| |
Net realized and unrealized gain (loss) |
| (338,611 | ) |
| (153,004 | ) |
| (306 | ) |
| (46,146 | ) |
| (26,925 | ) |
| ||
Change in net assets from operations | $ | (304,048 | ) | $ | (143,296 | ) | $ | 1,004 |
| $ | (40,590 | ) | $ | (23,995 | ) |
| ||
(a) | Affiliated income | $ | 58,770 |
| $ | 19,738 |
| $ | — |
| $ | — |
| $ | — |
|
| |
See accompanying Notes to Financial Statements.
56
JNL Series Trust Master Feeder Funds and Funds of Funds
Statements of Changes in Net Assets (in thousands)
For the Year Ended December 31, 2018
| JNL/American Funds Balanced Fund(a) |
| JNL/American Funds Blue Chip Income and Growth Fund(a) |
| JNL/American Funds Capital Income Builder Fund(a)(b) |
| JNL/American Funds Global Bond Fund(a) |
| JNL/American Funds Global Small Capitalization Fund(a) |
| JNL/American Funds Growth-Income Fund(a) |
| JNL/American Funds International Fund(a) |
| ||||||||
Operations |
|
|
|
|
|
|
|
|
|
|
|
|
|
|
|
|
|
|
|
|
| |
Net investment income (loss) | $ | 14,946 |
| $ | 51,542 |
| $ | 183 |
| $ | 9,458 |
| $ | (1,509 | ) | $ | 69,114 |
| $ | 25,960 |
| |
Net realized gain (loss) |
| 41,240 |
|
| 357,176 |
|
| — |
|
| (2,053 | ) |
| 40,775 |
|
| 465,674 |
|
| 117,680 |
| |
Net change in unrealized appreciation |
|
|
|
|
|
|
|
|
|
|
|
|
|
|
|
|
|
|
|
|
| |
| (depreciation) |
| (113,136 | ) |
| (698,332 | ) |
| (1,034 | ) |
| (17,878 | ) |
| (116,390 | ) |
| (700,309 | ) |
| (420,120 | ) |
Change in net assets from operations |
| (56,950 | ) |
| (289,614 | ) |
| (851 | ) |
| (10,473 | ) |
| (77,124 | ) |
| (165,521 | ) |
| (276,480 | ) | |
Distributions to shareholders |
|
|
|
|
|
|
|
|
|
|
|
|
|
|
|
|
|
|
|
|
| |
From distributable earnings |
|
|
|
|
|
|
|
|
|
|
|
|
|
|
|
|
|
|
|
|
| |
| Class A |
| (64,486 | ) |
| — |
|
| — |
|
| (3,157 | ) |
| (5,106 | ) |
| — |
|
| (34,715 | ) |
| Class I |
| (624 | ) |
| — |
|
| — |
|
| (10 | ) |
| (20 | ) |
| — |
|
| (136 | ) |
Total distributions to shareholders |
| (65,110 | ) |
| — |
|
| — |
|
| (3,167 | ) |
| (5,126 | ) |
| — |
|
| (34,851 | ) | |
Share transactions1 |
|
|
|
|
|
|
|
|
|
|
|
|
|
|
|
|
|
|
|
|
| |
Proceeds from the sale of shares |
|
|
|
|
|
|
|
|
|
|
|
|
|
|
|
|
|
|
|
|
| |
| Class A |
| 493,916 |
|
| 458,079 |
|
| 25,490 |
|
| 149,351 |
|
| 160,386 |
|
| 1,516,094 |
|
| 432,699 |
|
| Class I |
| 11,241 |
|
| 7,417 |
|
| 1,576 |
|
| 1,265 |
|
| 3,135 |
|
| 30,671 |
|
| 8,907 |
|
Reinvestment of distributions |
|
|
|
|
|
|
|
|
|
|
|
|
|
|
|
|
|
|
|
|
| |
| Class A |
| 64,486 |
|
| — |
|
| — |
|
| 3,157 |
|
| 5,106 |
|
| — |
|
| 34,715 |
|
| Class I |
| 624 |
|
| — |
|
| — |
|
| 10 |
|
| 20 |
|
| — |
|
| 136 |
|
Cost of shares redeemed |
|
|
|
|
|
|
|
|
|
|
|
|
|
|
|
|
|
|
|
|
| |
| Class A |
| (176,215 | ) |
| (699,270 | ) |
| (1,401 | ) |
| (157,927 | ) |
| (147,244 | ) |
| (1,088,071 | ) |
| (453,957 | ) |
| Class I |
| (807 | ) |
| (1,033 | ) |
| (321 | ) |
| (293 | ) |
| (463 | ) |
| (4,844 | ) |
| (1,663 | ) |
Change in net assets from |
|
|
|
|
|
|
|
|
|
|
|
|
|
|
|
|
|
|
|
|
| |
| share transactions |
| 393,245 |
|
| (234,807 | ) |
| 25,344 |
|
| (4,437 | ) |
| 20,940 |
|
| 453,850 |
|
| 20,837 |
|
Change in net assets |
| 271,185 |
|
| (524,421 | ) |
| 24,493 |
|
| (18,077 | ) |
| (61,310 | ) |
| 288,329 |
|
| (290,494 | ) | |
Net assets beginning of year |
| 774,598 |
|
| 3,450,472 |
|
| — |
|
| 520,226 |
|
| 682,161 |
|
| 5,852,141 |
|
| 2,023,599 |
| |
Net assets end of year | $ | 1,045,783 |
| $ | 2,926,051 |
| $ | 24,493 |
| $ | 502,149 |
| $ | 620,851 |
| $ | 6,140,470 |
| $ | 1,733,105 |
| |
|
|
|
|
|
|
|
|
|
|
|
|
|
|
|
|
|
|
|
|
|
|
|
1Share transactions |
|
|
|
|
|
|
|
|
|
|
|
|
|
|
|
|
|
|
|
|
| |
Shares sold |
|
|
|
|
|
|
|
|
|
|
|
|
|
|
|
|
|
|
|
|
| |
| Class A |
| 42,885 |
|
| 20,681 |
|
| 2,619 |
|
| 13,921 |
|
| 10,950 |
|
| 64,727 |
|
| 29,422 |
|
| Class I |
| 935 |
|
| 331 |
|
| 163 |
|
| 117 |
|
| 214 |
|
| 1,277 |
|
| 597 |
|
Reinvestment of distributions |
|
|
|
|
|
|
|
|
|
|
|
|
|
|
|
|
|
|
|
|
| |
| Class A |
| 6,078 |
|
| — |
|
| — |
|
| 307 |
|
| 381 |
|
| — |
|
| 2,695 |
|
| Class I |
| 57 |
|
| — |
|
| — |
|
| 1 |
|
| 1 |
|
| — |
|
| 11 |
|
Shares redeemed |
|
|
|
|
|
|
|
|
|
|
|
|
|
|
|
|
|
|
|
|
| |
| Class A |
| (15,375 | ) |
| (31,608 | ) |
| (146 | ) |
| (14,915 | ) |
| (10,170 | ) |
| (46,699 | ) |
| (31,305 | ) |
| Class I |
| (68 | ) |
| (48 | ) |
| (33 | ) |
| (27 | ) |
| (32 | ) |
| (198 | ) |
| (114 | ) |
Change in shares |
|
|
|
|
|
|
|
|
|
|
|
|
|
|
|
|
|
|
|
|
| |
| Class A |
| 33,588 |
|
| (10,927 | ) |
| 2,473 |
|
| (687 | ) |
| 1,161 |
|
| 18,028 |
|
| 812 |
|
| Class I |
| 924 |
|
| 283 |
|
| 130 |
|
| 91 |
|
| 183 |
|
| 1,079 |
|
| 494 |
|
Purchases and sales of long term |
|
|
|
|
|
|
|
|
|
|
|
|
|
|
|
|
|
|
|
|
| |
| investments |
|
|
|
|
|
|
|
|
|
|
|
|
|
|
|
|
|
|
|
|
|
Purchase of securities | $ | 389,399 |
| $ | 349,187 |
| $ | 25,534 |
| $ | 79,078 |
| $ | 85,956 |
| $ | 1,068,186 |
| $ | 259,803 |
| |
Proceeds from sales of securities | $ | 5,015 |
| $ | 277,590 |
| $ | — |
| $ | 75,330 |
| $ | 40,003 |
| $ | 113,653 |
| $ | 150,356 |
| |
(a) | The Master Funds for the JNL/American Funds Master Feeder Funds are the Class 1 shares of the corresponding American Fund Insurance Series Fund. The Master Funds for the JNL/Vanguard Master Feeder Funds are the shares of the corresponding Vanguard Variable Insurance Fund. These financial statements should be read in conjunction with each Master Fund's respective shareholder report. |
(b) | Period from commencement of operations August 13, 2018. |
See accompanying Notes to Financial Statements.
57
JNL Series Trust Master Feeder Funds and Funds of Funds
Statements of Changes in Net Assets (in thousands)
For the Year Ended December 31, 2018
|
| JNL/American Funds New World Fund(a) |
| JNL/Vanguard Capital Growth Fund(a) |
| JNL/Vanguard Equity Income Fund(a) |
| JNL/Vanguard International Fund(a) |
| JNL/Vanguard Small Company Growth Fund(a) |
| JNL Institutional Alt 25 Fund |
| JNL Institutional Alt 50 Fund |
| |||||||
Operations |
|
|
|
|
|
|
|
|
|
|
|
|
|
|
|
|
|
|
|
|
| |
Net investment income (loss) | $ | 6,547 |
| $ | 13 |
| $ | 907 |
| $ | (174 | ) | $ | (746 | ) | $ | 18,015 |
| $ | 14,256 |
| |
Net realized gain (loss) |
| 42,736 |
|
| 5,034 |
|
| 3,806 |
|
| 4,685 |
|
| 6,665 |
|
| 127,172 |
|
| 84,370 |
| |
Net change in unrealized appreciation |
|
|
|
|
|
|
|
|
|
|
|
|
|
|
|
|
|
|
|
|
| |
| (depreciation) |
| (255,813 | ) |
| (24,333 | ) |
| (15,620 | ) |
| (92,365 | ) |
| (56,216 | ) |
| (343,572 | ) |
| (253,109 | ) |
Change in net assets from operations |
| (206,530 | ) |
| (19,286 | ) |
| (10,907 | ) |
| (87,854 | ) |
| (50,297 | ) |
| (198,385 | ) |
| (154,483 | ) | |
Distributions to shareholders |
|
|
|
|
|
|
|
|
|
|
|
|
|
|
|
|
|
|
|
|
| |
From distributable earnings |
|
|
|
|
|
|
|
|
|
|
|
|
|
|
|
|
|
|
|
|
| |
| Class A |
| (7,970 | ) |
| — |
|
| — |
|
| — |
|
| — |
|
| — |
|
| — |
|
| Class I |
| (48 | ) |
| — |
|
| — |
|
| — |
|
| — |
|
| — |
|
| — |
|
Total distributions to shareholders |
| (8,018 | ) |
| — |
|
| — |
|
| — |
|
| — |
|
| — |
|
| — |
| |
Share transactions1 |
|
|
|
|
|
|
|
|
|
|
|
|
|
|
|
|
|
|
|
|
| |
Proceeds from the sale of shares |
|
|
|
|
|
|
|
|
|
|
|
|
|
|
|
|
|
|
|
|
| |
| Class A |
| 315,500 |
|
| 305,833 |
|
| 166,955 |
|
| 614,522 |
|
| 341,698 |
|
| 160,920 |
|
| 189,885 |
|
| Class I |
| 7,910 |
|
| 6,089 |
|
| 3,451 |
|
| 8,260 |
|
| 4,404 |
|
| 434 |
|
| 1,327 |
|
Reinvestment of distributions |
|
|
|
|
|
|
|
|
|
|
|
|
|
|
|
|
|
|
|
|
| |
| Class A |
| 7,970 |
|
| — |
|
| — |
|
| — |
|
| — |
|
| — |
|
| — |
|
| Class I |
| 48 |
|
| — |
|
| — |
|
| — |
|
| — |
|
| — |
|
| — |
|
Cost of shares redeemed |
|
|
|
|
|
|
|
|
|
|
|
|
|
|
|
|
|
|
|
|
| |
| Class A |
| (308,727 | ) |
| (79,595 | ) |
| (29,528 | ) |
| (161,565 | ) |
| (80,049 | ) |
| (634,859 | ) |
| (645,187 | ) |
| Class I |
| (1,142 | ) |
| (684 | ) |
| (142 | ) |
| (1,608 | ) |
| (603 | ) |
| (8 | ) |
| (357 | ) |
Change in net assets from |
|
|
|
|
|
|
|
|
|
|
|
|
|
|
|
|
|
|
|
|
| |
| share transactions |
| 21,559 |
|
| 231,643 |
|
| 140,736 |
|
| 459,609 |
|
| 265,450 |
|
| (473,513 | ) |
| (454,332 | ) |
Change in net assets |
| (192,989 | ) |
| 212,357 |
|
| 129,829 |
|
| 371,755 |
|
| 215,153 |
|
| (671,898 | ) |
| (608,815 | ) | |
Net assets beginning of year |
| 1,408,952 |
|
| 71,729 |
|
| 29,462 |
|
| 78,638 |
|
| 55,903 |
|
| 3,307,843 |
|
| 2,892,343 |
| |
Net assets end of year | $ | 1,215,963 |
| $ | 284,086 |
| $ | 159,291 |
| $ | 450,393 |
| $ | 271,056 |
| $ | 2,635,945 |
| $ | 2,283,528 |
| |
|
|
|
|
|
|
|
|
|
|
|
|
|
|
|
|
|
|
|
|
|
|
|
1Share transactions |
|
|
|
|
|
|
|
|
|
|
|
|
|
|
|
|
|
|
|
|
| |
Shares sold |
|
|
|
|
|
|
|
|
|
|
|
|
|
|
|
|
|
|
|
|
| |
| Class A |
| 24,719 |
|
| 26,718 |
|
| 15,665 |
|
| 57,699 |
|
| 29,128 |
|
| 9,481 |
|
| 11,182 |
|
| Class I |
| 619 |
|
| 529 |
|
| 326 |
|
| 789 |
|
| 377 |
|
| 25 |
|
| 78 |
|
Reinvestment of distributions |
|
|
|
|
|
|
|
|
|
|
|
|
|
|
|
|
|
|
|
|
| |
| Class A |
| 707 |
|
| — |
|
| — |
|
| — |
|
| — |
|
| — |
|
| — |
|
| Class I |
| 4 |
|
| — |
|
| — |
|
| — |
|
| — |
|
| — |
|
| — |
|
Shares redeemed |
|
|
|
|
|
|
|
|
|
|
|
|
|
|
|
|
|
|
|
|
| |
| Class A |
| (24,400 | ) |
| (7,060 | ) |
| (2,777 | ) |
| (15,801 | ) |
| (7,283 | ) |
| (37,362 | ) |
| (37,979 | ) |
| Class I |
| (91 | ) |
| (60 | ) |
| (14 | ) |
| (156 | ) |
| (52 | ) |
| — |
|
| (22 | ) |
Change in shares |
|
|
|
|
|
|
|
|
|
|
|
|
|
|
|
|
|
|
|
|
| |
| Class A |
| 1,026 |
|
| 19,658 |
|
| 12,888 |
|
| 41,898 |
|
| 21,845 |
|
| (27,881 | ) |
| (26,797 | ) |
| Class I |
| 532 |
|
| 469 |
|
| 312 |
|
| 633 |
|
| 325 |
|
| 25 |
|
| 56 |
|
Purchases and sales of long term |
|
|
|
|
|
|
|
|
|
|
|
|
|
|
|
|
|
|
|
|
| |
| investments |
|
|
|
|
|
|
|
|
|
|
|
|
|
|
|
|
|
|
|
|
|
Purchase of securities | $ | 161,605 |
| $ | 257,440 |
| $ | 152,090 |
| $ | 516,861 |
| $ | 304,018 |
| $ | 924,525 |
| $ | 869,190 |
| |
Proceeds from sales of securities | $ | 104,037 |
| $ | 22,171 |
| $ | 6,490 |
| $ | 50,551 |
| $ | 31,968 |
| $ | 1,287,362 |
| $ | 1,248,019 |
| |
(a) | The Master Funds for the JNL/American Funds Master Feeder Funds are the Class 1 shares of the corresponding American Fund Insurance Series Fund. The Master Funds for the JNL/Vanguard Master Feeder Funds are the shares of the corresponding Vanguard Variable Insurance Fund. These financial statements should be read in conjunction with each Master Fund's respective shareholder report. |
See accompanying Notes to Financial Statements.
58
JNL Series Trust Master Feeder Funds and Funds of Funds
Statements of Changes in Net Assets (in thousands)
For the Year Ended December 31, 2018
|
| JNL/American Funds Moderate Growth Allocation Fund |
| JNL/American Funds Growth Allocation Fund |
| JNL/DFA Growth Allocation Fund |
| JNL/DFA Moderate Growth Allocation Fund |
| JNL Moderate Growth Allocation Fund |
| JNL Growth Allocation Fund |
| JNL Aggressive Growth Allocation Fund |
| |||||||
Operations |
|
|
|
|
|
|
|
|
|
|
|
|
|
|
|
|
|
|
|
|
| |
Net investment income (loss) | $ | 35,093 |
| $ | 27,920 |
| $ | 2,429 |
| $ | 2,248 |
| $ | 19,168 |
| $ | 12,536 |
| $ | 6,494 |
| |
Net realized gain (loss) |
| 92,438 |
|
| 114,824 |
|
| 2,209 |
|
| 1,617 |
|
| 80,586 |
|
| 108,878 |
|
| 79,214 |
| |
Net change in unrealized appreciation |
|
|
|
|
|
|
|
|
|
|
|
|
|
|
|
|
|
|
|
|
| |
| (depreciation) |
| (231,417 | ) |
| (281,771 | ) |
| (20,981 | ) |
| (14,414 | ) |
| (255,946 | ) |
| (340,308 | ) |
| (244,275 | ) |
Change in net assets from operations |
| (103,886 | ) |
| (139,027 | ) |
| (16,343 | ) |
| (10,549 | ) |
| (156,192 | ) |
| (218,894 | ) |
| (158,567 | ) | |
Distributions to shareholders |
|
|
|
|
|
|
|
|
|
|
|
|
|
|
|
|
|
|
|
|
| |
From distributable earnings |
|
|
|
|
|
|
|
|
|
|
|
|
|
|
|
|
|
|
|
|
| |
| Class A |
| — |
|
| — |
|
| (22 | ) |
| (12 | ) |
| — |
|
| — |
|
| — |
|
Total distributions to shareholders |
| — |
|
| — |
|
| (22 | ) |
| (12 | ) |
| — |
|
| — |
|
| — |
| |
Share transactions1 |
|
|
|
|
|
|
|
|
|
|
|
|
|
|
|
|
|
|
|
|
| |
Proceeds from the sale of shares |
|
|
|
|
|
|
|
|
|
|
|
|
|
|
|
|
|
|
|
|
| |
| Class A |
| 420,476 |
|
| 717,218 |
|
| 118,865 |
|
| 87,453 |
|
| 307,874 |
|
| 309,638 |
|
| 319,826 |
|
| Class I |
| 9,178 |
|
| 11,895 |
|
| 3,265 |
|
| 4,383 |
|
| 2,243 |
|
| 6,956 |
|
| 5,003 |
|
Reinvestment of distributions |
|
|
|
|
|
|
|
|
|
|
|
|
|
|
|
|
|
|
|
|
| |
| Class A |
| — |
|
| — |
|
| 22 |
|
| 12 |
|
| — |
|
| — |
|
| — |
|
Cost of shares redeemed |
|
|
|
|
|
|
|
|
|
|
|
|
|
|
|
|
|
|
|
|
| |
| Class A |
| (403,844 | ) |
| (391,937 | ) |
| (26,729 | ) |
| (17,943 | ) |
| (475,327 | ) |
| (455,234 | ) |
| (354,447 | ) |
| Class I |
| (1,363 | ) |
| (2,119 | ) |
| (329 | ) |
| (513 | ) |
| (244 | ) |
| (1,093 | ) |
| (924 | ) |
Change in net assets from |
|
|
|
|
|
|
|
|
|
|
|
|
|
|
|
|
|
|
|
|
| |
| share transactions |
| 24,447 |
|
| 335,057 |
|
| 95,094 |
|
| 73,392 |
|
| (165,454 | ) |
| (139,733 | ) |
| (30,542 | ) |
Change in net assets |
| (79,439 | ) |
| 196,030 |
|
| 78,729 |
|
| 62,831 |
|
| (321,646 | ) |
| (358,627 | ) |
| (189,109 | ) | |
Net assets beginning of year |
| 2,218,946 |
|
| 2,090,597 |
|
| 80,281 |
|
| 64,134 |
|
| 2,483,125 |
|
| 2,512,412 |
|
| 1,525,671 |
| |
Net assets end of year | $ | 2,139,507 |
| $ | 2,286,627 |
| $ | 159,010 |
| $ | 126,965 |
| $ | 2,161,479 |
| $ | 2,153,785 |
| $ | 1,336,562 |
| |
|
|
|
|
|
|
|
|
|
|
|
|
|
|
|
|
|
|
|
|
|
|
|
1Share transactions |
|
|
|
|
|
|
|
|
|
|
|
|
|
|
|
|
|
|
|
|
| |
Shares sold |
|
|
|
|
|
|
|
|
|
|
|
|
|
|
|
|
|
|
|
|
| |
| Class A |
| 27,994 |
|
| 43,134 |
|
| 11,210 |
|
| 8,227 |
|
| 22,661 |
|
| 22,919 |
|
| 24,722 |
|
| Class I |
| 607 |
|
| 716 |
|
| 305 |
|
| 411 |
|
| 166 |
|
| 513 |
|
| 388 |
|
Reinvestment of distributions |
|
|
|
|
|
|
|
|
|
|
|
|
|
|
|
|
|
|
|
|
| |
| Class A |
| — |
|
| — |
|
| 2 |
|
| 1 |
|
| — |
|
| — |
|
| — |
|
Shares redeemed |
|
|
|
|
|
|
|
|
|
|
|
|
|
|
|
|
|
|
|
|
| |
| Class A |
| (26,930 | ) |
| (23,758 | ) |
| (2,511 | ) |
| (1,708 | ) |
| (35,008 | ) |
| (33,916 | ) |
| (27,643 | ) |
| Class I |
| (89 | ) |
| (131 | ) |
| (31 | ) |
| (48 | ) |
| (18 | ) |
| (82 | ) |
| (70 | ) |
Change in shares |
|
|
|
|
|
|
|
|
|
|
|
|
|
|
|
|
|
|
|
|
| |
| Class A |
| 1,064 |
|
| 19,376 |
|
| 8,701 |
|
| 6,520 |
|
| (12,347 | ) |
| (10,997 | ) |
| (2,921 | ) |
| Class I |
| 518 |
|
| 585 |
|
| 274 |
|
| 363 |
|
| 148 |
|
| 431 |
|
| 318 |
|
Purchases and sales of long term |
|
|
|
|
|
|
|
|
|
|
|
|
|
|
|
|
|
|
|
|
| |
| investments |
|
|
|
|
|
|
|
|
|
|
|
|
|
|
|
|
|
|
|
|
|
Purchase of securities | $ | 710,316 |
| $ | 793,941 |
| $ | 114,063 |
| $ | 87,509 |
| $ | 701,725 |
| $ | 829,323 |
| $ | 666,201 |
| |
Proceeds from sales of securities | $ | 567,964 |
| $ | 322,756 |
| $ | 14,390 |
| $ | 10,416 |
| $ | 783,635 |
| $ | 868,602 |
| $ | 628,123 |
| |
See accompanying Notes to Financial Statements.
59
JNL Series Trust Master Feeder Funds and Funds of Funds
Statements of Changes in Net Assets (in thousands)
For the Year Ended December 31, 2018
|
| JNL/Franklin Templeton Founding Strategy Fund |
| JNL/Mellon Capital 10 x 10 Fund |
| JNL/Mellon Capital Index 5 Fund |
| JNL/S&P 4 Fund |
| JNL/S&P Managed Conservative Fund |
| JNL/S&P Managed Moderate Fund |
| JNL/S&P Managed Moderate Growth Fund |
| |||||||
Operations |
|
|
|
|
|
|
|
|
|
|
|
|
|
|
|
|
|
|
|
|
| |
Net investment income (loss) | $ | 33,802 |
| $ | 8,539 |
| $ | 14,966 |
| $ | 120,468 |
| $ | 19,706 |
| $ | 36,280 |
| $ | 53,197 |
| |
Net realized gain (loss) |
| 39,869 |
|
| 16,374 |
|
| 59,706 |
|
| 448,607 |
|
| 19,107 |
|
| 100,523 |
|
| 313,844 |
| |
Net change in unrealized appreciation |
|
|
|
|
|
|
|
|
|
|
|
|
|
|
|
|
|
|
|
|
| |
| (depreciation) |
| (197,420 | ) |
| (63,633 | ) |
| (146,747 | ) |
| (939,864 | ) |
| (68,140 | ) |
| (237,179 | ) |
| (644,729 | ) |
Change in net assets from operations |
| (123,749 | ) |
| (38,720 | ) |
| (72,075 | ) |
| (370,789 | ) |
| (29,327 | ) |
| (100,376 | ) |
| (277,688 | ) | |
Share transactions1 |
|
|
|
|
|
|
|
|
|
|
|
|
|
|
|
|
|
|
|
|
| |
Proceeds from the sale of shares |
|
|
|
|
|
|
|
|
|
|
|
|
|
|
|
|
|
|
|
|
| |
| Class A |
| 103,345 |
|
| 58,221 |
|
| 126,911 |
|
| 602,749 |
|
| 205,372 |
|
| 258,872 |
|
| 532,083 |
|
| Class I |
| 1,840 |
|
| 10 |
|
| 989 |
|
| 6,118 |
|
| 3,517 |
|
| 2,586 |
|
| 7,020 |
|
Cost of shares redeemed |
|
|
|
|
|
|
|
|
|
|
|
|
|
|
|
|
|
|
|
|
| |
| Class A |
| (284,680 | ) |
| (111,076 | ) |
| (222,260 | ) |
| (1,479,840 | ) |
| (436,904 | ) |
| (615,182 | ) |
| (1,167,015 | ) |
| Class I |
| (707 | ) |
| — |
|
| (12 | ) |
| (785 | ) |
| (2,933 | ) |
| (183 | ) |
| (59 | ) |
Change in net assets from |
|
|
|
|
|
|
|
|
|
|
|
|
|
|
|
|
|
|
|
|
| |
| share transactions |
| (180,202 | ) |
| (52,845 | ) |
| (94,372 | ) |
| (871,758 | ) |
| (230,948 | ) |
| (353,907 | ) |
| (627,971 | ) |
Change in net assets |
| (303,951 | ) |
| (91,565 | ) |
| (166,447 | ) |
| (1,242,547 | ) |
| (260,275 | ) |
| (454,283 | ) |
| (905,659 | ) | |
Net assets beginning of year |
| 1,480,299 |
|
| 497,783 |
|
| 1,025,323 |
|
| 7,126,524 |
|
| 1,481,930 |
|
| 3,315,520 |
|
| 6,380,150 |
| |
Net assets end of year | $ | 1,176,348 |
| $ | 406,218 |
| $ | 858,876 |
| $ | 5,883,977 |
| $ | 1,221,655 |
| $ | 2,861,237 |
| $ | 5,474,491 |
| |
|
|
|
|
|
|
|
|
|
|
|
|
|
|
|
|
|
|
|
|
|
|
|
1Share transactions |
|
|
|
|
|
|
|
|
|
|
|
|
|
|
|
|
|
|
|
|
| |
Shares sold |
|
|
|
|
|
|
|
|
|
|
|
|
|
|
|
|
|
|
|
|
| |
| Class A |
| 7,463 |
|
| 4,190 |
|
| 8,607 |
|
| 28,922 |
|
| 15,369 |
|
| 16,720 |
|
| 30,065 |
|
| Class I |
| 131 |
|
| 1 |
|
| 66 |
|
| 291 |
|
| 264 |
|
| 169 |
|
| 402 |
|
Shares redeemed |
|
|
|
|
|
|
|
|
|
|
|
|
|
|
|
|
|
|
|
|
| |
| Class A |
| (20,499 | ) |
| (7,981 | ) |
| (15,069 | ) |
| (70,755 | ) |
| (32,645 | ) |
| (39,706 | ) |
| (65,919 | ) |
| Class I |
| (50 | ) |
| — |
|
| (1 | ) |
| (37 | ) |
| (221 | ) |
| (12 | ) |
| (3 | ) |
Change in shares |
|
|
|
|
|
|
|
|
|
|
|
|
|
|
|
|
|
|
|
|
| |
| Class A |
| (13,036 | ) |
| (3,791 | ) |
| (6,462 | ) |
| (41,833 | ) |
| (17,276 | ) |
| (22,986 | ) |
| (35,854 | ) |
| Class I |
| 81 |
|
| 1 |
|
| 65 |
|
| 254 |
|
| 43 |
|
| 157 |
|
| 399 |
|
Purchases and sales of long term |
|
|
|
|
|
|
|
|
|
|
|
|
|
|
|
|
|
|
|
|
| |
| investments |
|
|
|
|
|
|
|
|
|
|
|
|
|
|
|
|
|
|
|
|
|
Purchase of securities | $ | 75,485 |
| $ | 32,009 |
| $ | 90,305 |
| $ | 497,311 |
| $ | 158,929 |
| $ | 282,264 |
| $ | 641,718 |
| |
Proceeds from sales of securities | $ | 186,251 |
| $ | 64,368 |
| $ | 119,858 |
| $ | 900,432 |
| $ | 353,813 |
| $ | 517,672 |
| $ | 951,496 |
| |
See accompanying Notes to Financial Statements.
60
JNL Series Trust Master Feeder Funds and Funds of Funds
Statements of Changes in Net Assets (in thousands)
For the Year Ended December 31, 2018
|
| JNL/S&P Managed Growth Fund |
| JNL/S&P Managed Aggressive Growth Fund |
| JNL/Vanguard Global Bond Market Index Fund |
| JNL/Vanguard International Stock Market Index Fund |
| JNL/Vanguard U.S. Stock Market Index Fund |
|
| |||||
Operations |
|
|
|
|
|
|
|
|
|
|
|
|
|
|
|
| |
Net investment income (loss) | $ | 34,563 |
| $ | 9,708 |
| $ | 1,310 |
| $ | 5,556 |
| $ | 2,930 |
|
| |
Net realized gain (loss) |
| 373,083 |
|
| 152,156 |
|
| (158 | ) |
| (3,419 | ) |
| 451 |
|
| |
Net change in unrealized appreciation |
|
|
|
|
|
|
|
|
|
|
|
|
|
|
|
| |
| (depreciation) |
| (711,694 | ) |
| (305,160 | ) |
| (148 | ) |
| (42,727 | ) |
| (27,376 | ) |
|
Change in net assets from operations |
| (304,048 | ) |
| (143,296 | ) |
| 1,004 |
|
| (40,590 | ) |
| (23,995 | ) |
| |
Share transactions1 |
|
|
|
|
|
|
|
|
|
|
|
|
|
|
|
| |
Proceeds from the sale of shares |
|
|
|
|
|
|
|
|
|
|
|
|
|
|
|
| |
| Class A |
| 582,376 |
|
| 325,234 |
|
| 77,609 |
|
| 223,370 |
|
| 287,360 |
|
|
| Class I |
| 5,621 |
|
| 6,253 |
|
| 1,467 |
|
| 6,300 |
|
| 6,965 |
|
|
Cost of shares redeemed |
|
|
|
|
|
|
|
|
|
|
|
|
|
|
|
| |
| Class A |
| (1,041,392 | ) |
| (417,575 | ) |
| (22,166 | ) |
| (80,268 | ) |
| (50,859 | ) |
|
| Class I |
| (1,063 | ) |
| (248 | ) |
| (215 | ) |
| (1,211 | ) |
| (1,250 | ) |
|
Change in net assets from |
|
|
|
|
|
|
|
|
|
|
|
|
|
|
|
| |
| share transactions |
| (454,458 | ) |
| (86,336 | ) |
| 56,695 |
|
| 148,191 |
|
| 242,216 |
|
|
Change in net assets |
| (758,506 | ) |
| (229,632 | ) |
| 57,699 |
|
| 107,601 |
|
| 218,221 |
|
| |
Net assets beginning of year |
| 5,682,427 |
|
| 2,233,501 |
|
| 13,807 |
|
| 118,462 |
|
| 52,644 |
|
| |
Net assets end of year | $ | 4,923,921 |
| $ | 2,003,869 |
| $ | 71,506 |
| $ | 226,063 |
| $ | 270,865 |
|
| |
|
|
|
|
|
|
|
|
|
|
|
|
|
|
|
|
|
|
1Share transactions |
|
|
|
|
|
|
|
|
|
|
|
|
|
|
|
| |
Shares sold |
|
|
|
|
|
|
|
|
|
|
|
|
|
|
|
| |
| Class A |
| 30,328 |
|
| 14,328 |
|
| 7,774 |
|
| 21,824 |
|
| 26,082 |
|
|
| Class I |
| 292 |
|
| 272 |
|
| 147 |
|
| 621 |
|
| 619 |
|
|
Shares redeemed |
|
|
|
|
|
|
|
|
|
|
|
|
|
|
|
| |
| Class A |
| (54,292 | ) |
| (18,439 | ) |
| (2,220 | ) |
| (8,220 | ) |
| (4,653 | ) |
|
| Class I |
| (57 | ) |
| (11 | ) |
| (22 | ) |
| (122 | ) |
| (110 | ) |
|
Change in shares |
|
|
|
|
|
|
|
|
|
|
|
|
|
|
|
| |
| Class A |
| (23,964 | ) |
| (4,111 | ) |
| 5,554 |
|
| 13,604 |
|
| 21,429 |
|
|
| Class I |
| 235 |
|
| 261 |
|
| 125 |
|
| 499 |
|
| 509 |
|
|
Purchases and sales of long term |
|
|
|
|
|
|
|
|
|
|
|
|
|
|
|
| |
| investments |
|
|
|
|
|
|
|
|
|
|
|
|
|
|
|
|
Purchase of securities | $ | 715,931 |
| $ | 303,374 |
| $ | 66,654 |
| $ | 192,992 |
| $ | 258,067 |
|
| |
Proceeds from sales of securities | $ | 823,074 |
| $ | 244,377 |
| $ | 8,692 |
| $ | 39,209 |
| $ | 12,860 |
|
| |
See accompanying Notes to Financial Statements.
61
JNL Series Trust Master Feeder Funds and Funds of Funds
Statements of Changes in Net Assets (in thousands)
For the Year Ended December 31, 2017
|
| JNL/American Funds Balanced Fund(a)(b) |
| JNL/American Funds Blue Chip Income and Growth Fund(a)(b) |
| JNL/American Funds Global Bond Fund(a)(b) |
| JNL/American Funds Global Small Capitalization Fund(a)(b) |
| JNL/American Funds Growth-Income Fund(a)(b) |
| JNL/American Funds International Fund(a)(b) |
| JNL/American Funds New World Fund(a)(b) |
| |||||||
Operations |
|
|
|
|
|
|
|
|
|
|
|
|
|
|
|
|
|
|
|
|
| |
Net investment income (loss) | $ | 11,571 |
| $ | 53,246 |
| $ | 252 |
| $ | 760 |
| $ | 54,944 |
| $ | 16,769 |
| $ | 7,374 |
| |
Net realized gain (loss) |
| 55,743 |
|
| 178,420 |
|
| 1,499 |
|
| 4,388 |
|
| 317,864 |
|
| 18,023 |
|
| 107 |
| |
Net change in unrealized appreciation |
|
|
|
|
|
|
|
|
|
|
|
|
|
|
|
|
|
|
|
|
| |
| (depreciation) |
| 16,113 |
|
| 262,104 |
|
| 28,920 |
|
| 127,576 |
|
| 603,611 |
|
| 369,439 |
|
| 274,629 |
|
Change in net assets from operations |
| 83,427 |
|
| 493,770 |
|
| 30,671 |
|
| 132,724 |
|
| 976,419 |
|
| 404,231 |
|
| 282,110 |
| |
Distributions to shareholders |
|
|
|
|
|
|
|
|
|
|
|
|
|
|
|
|
|
|
|
|
| |
From net investment income |
|
|
|
|
|
|
|
|
|
|
|
|
|
|
|
|
|
|
|
|
| |
| Class A |
| (6,580 | ) |
| — |
|
| (1,642 | ) |
| (1,106 | ) |
| — |
|
| (11,165 | ) |
| (3,706 | ) |
| Class I |
| (8 | ) |
| — |
|
| (1 | ) |
| — |
|
| — |
|
| (3 | ) |
| (1 | ) |
From net realized gains |
|
|
|
|
|
|
|
|
|
|
|
|
|
|
|
|
|
|
|
|
| |
| Class A |
| (9,578 | ) |
| — |
|
| — |
|
| (89,542 | ) |
| — |
|
| (86,494 | ) |
| — |
|
| Class I |
| (11 | ) |
| — |
|
| — |
|
| (21 | ) |
| — |
|
| (23 | ) |
| — |
|
Total distributions to shareholders |
| (16,177 | ) |
| — |
|
| (1,643 | ) |
| (90,669 | ) |
| — |
|
| (97,685 | ) |
| (3,707 | ) | |
Share transactions1 |
|
|
|
|
|
|
|
|
|
|
|
|
|
|
|
|
|
|
|
|
| |
Proceeds from the sale of shares |
|
|
|
|
|
|
|
|
|
|
|
|
|
|
|
|
|
|
|
|
| |
| Class A |
| 344,215 |
|
| 661,439 |
|
| 128,233 |
|
| 154,110 |
|
| 1,501,351 |
|
| 748,236 |
|
| 399,232 |
|
| Class I |
| 581 |
|
| 339 |
|
| 215 |
|
| 292 |
|
| 1,102 |
|
| 464 |
|
| 467 |
|
Reinvestment of distributions |
|
|
|
|
|
|
|
|
|
|
|
|
|
|
|
|
|
|
|
|
| |
| Class A |
| 16,158 |
|
| — |
|
| 1,642 |
|
| 90,648 |
|
| — |
|
| 97,659 |
|
| 3,706 |
|
| Class I |
| 19 |
|
| — |
|
| 1 |
|
| 21 |
|
| — |
|
| 26 |
|
| 1 |
|
Cost of shares redeemed |
|
|
|
|
|
|
|
|
|
|
|
|
|
|
|
|
|
|
|
|
| |
| Class A |
| (110,633 | ) |
| (612,963 | ) |
| (110,268 | ) |
| (100,001 | ) |
| (665,948 | ) |
| (229,155 | ) |
| (176,961 | ) |
| Class I |
| (144 | ) |
| (180 | ) |
| (34 | ) |
| (48 | ) |
| (108 | ) |
| (183 | ) |
| (126 | ) |
Change in net assets from |
|
|
|
|
|
|
|
|
|
|
|
|
|
|
|
|
|
|
|
|
| |
| share transactions |
| 250,196 |
|
| 48,635 |
|
| 19,789 |
|
| 145,022 |
|
| 836,397 |
|
| 617,047 |
|
| 226,319 |
|
Change in net assets |
| 317,446 |
|
| 542,405 |
|
| 48,817 |
|
| 187,077 |
|
| 1,812,816 |
|
| 923,593 |
|
| 504,722 |
| |
Net assets beginning of year |
| 457,152 |
|
| 2,908,067 |
|
| 471,409 |
|
| 495,084 |
|
| 4,039,325 |
|
| 1,100,006 |
|
| 904,230 |
| |
Net assets end of year | $ | 774,598 |
| $ | 3,450,472 |
| $ | 520,226 |
| $ | 682,161 |
| $ | 5,852,141 |
| $ | 2,023,599 |
| $ | 1,408,952 |
| |
Undistributed (excess of distributions |
|
|
|
|
|
|
|
|
|
|
|
|
|
|
|
|
|
|
|
|
| |
| over) net investment income (loss) | $ | 6,685 |
| $ | — |
| $ | 3,152 |
| $ | 751 |
| $ | — |
| $ | 17,291 |
| $ | 7,358 |
|
|
|
|
|
|
|
|
|
|
|
|
|
|
|
|
|
|
|
|
|
|
|
|
1Share transactions |
|
|
|
|
|
|
|
|
|
|
|
|
|
|
|
|
|
|
|
|
| |
Shares sold |
|
|
|
|
|
|
|
|
|
|
|
|
|
|
|
|
|
|
|
|
| |
| Class A |
| 30,986 |
|
| 33,021 |
|
| 12,110 |
|
| 10,696 |
|
| 74,487 |
|
| 53,344 |
|
| 33,261 |
|
| Class I |
| 50 |
|
| 17 |
|
| 20 |
|
| 20 |
|
| 51 |
|
| 32 |
|
| 38 |
|
Reinvestment of distributions |
|
|
|
|
|
|
|
|
|
|
|
|
|
|
|
|
|
|
|
|
| |
| Class A |
| 1,533 |
|
| — |
|
| 151 |
|
| 6,685 |
|
| — |
|
| 6,820 |
|
| 292 |
|
| Class I |
| 2 |
|
| — |
|
| — |
|
| 1 |
|
| — |
|
| 2 |
|
| — |
|
Shares redeemed |
|
|
|
|
|
|
|
|
|
|
|
|
|
|
|
|
|
|
|
|
| |
| Class A |
| (10,126 | ) |
| (30,350 | ) |
| (10,463 | ) |
| (6,956 | ) |
| (32,782 | ) |
| (16,364 | ) |
| (14,828 | ) |
| Class I |
| (13 | ) |
| (9 | ) |
| (3 | ) |
| (3 | ) |
| (5 | ) |
| (13 | ) |
| (11 | ) |
Change in shares |
|
|
|
|
|
|
|
|
|
|
|
|
|
|
|
|
|
|
|
|
| |
| Class A |
| 22,393 |
|
| 2,671 |
|
| 1,798 |
|
| 10,425 |
|
| 41,705 |
|
| 43,800 |
|
| 18,725 |
|
| Class I |
| 39 |
|
| 8 |
|
| 17 |
|
| 18 |
|
| 46 |
|
| 21 |
|
| 27 |
|
(a) | Effective September 25, 2017, Class B shares were renamed to Class I shares. |
(b) | The Master Funds for the JNL/American Funds Master Feeder Funds are the Class 1 shares of the corresponding American Fund Insurance Series Fund. The Master Funds for the JNL/Vanguard Master Feeder Funds are the shares of the corresponding Vanguard Variable Insurance Fund. These financial statements should be read in conjunction with each Master Fund's respective shareholder report. |
See accompanying Notes to Financial Statements.
62
JNL Series Trust Master Feeder Funds and Funds of Funds
Statements of Changes in Net Assets (in thousands)
For the Year Ended December 31, 2017
|
| JNL/Vanguard Capital Growth Fund(a)(b) |
| JNL/Vanguard Equity Income Fund(a)(b) |
| JNL/Vanguard International Fund(a)(b) |
| JNL/Vanguard Small Company Growth Fund(a)(b) |
| JNL Institutional Alt 25 Fund(c) |
| JNL Institutional Alt 50 Fund(c) |
| JNL/American Funds Moderate Growth Allocation Fund(c) |
| |||||||
Operations |
|
|
|
|
|
|
|
|
|
|
|
|
|
|
|
|
|
|
|
|
| |
Net investment income (loss) | $ | (65 | ) | $ | (19 | ) | $ | (61 | ) | $ | (62 | ) | $ | 10,517 |
| $ | 24,839 |
| $ | 17,018 |
| |
Net realized gain (loss) |
| — |
|
| — |
|
| — |
|
| (54 | ) |
| 234,335 |
|
| 116,264 |
|
| 105,707 |
| |
Net change in unrealized appreciation |
|
|
|
|
|
|
|
|
|
|
|
|
|
|
|
|
|
|
|
|
| |
| (depreciation) |
| 2,604 |
|
| 788 |
|
| 1,263 |
|
| 1,801 |
|
| 19,685 |
|
| 122,284 |
|
| 164,316 |
|
Change in net assets from operations |
| 2,539 |
|
| 769 |
|
| 1,202 |
|
| 1,685 |
|
| 264,537 |
|
| 263,387 |
|
| 287,041 |
| |
Share transactions1 |
|
|
|
|
|
|
|
|
|
|
|
|
|
|
|
|
|
|
|
|
| |
Proceeds from the sale of shares |
|
|
|
|
|
|
|
|
|
|
|
|
|
|
|
|
|
|
|
|
| |
| Class A |
| 72,663 |
|
| 29,446 |
|
| 79,711 |
|
| 66,638 |
|
| 97,079 |
|
| 154,207 |
|
| 542,545 |
|
| Class I |
| 111 |
|
| 385 |
|
| 207 |
|
| 98 |
|
| 113 |
|
| 115 |
|
| 566 |
|
Proceeds in connection with acquisition |
|
|
|
|
|
|
|
|
|
|
|
|
|
|
|
|
|
|
|
|
| |
| Class A |
| — |
|
| — |
|
| — |
|
| — |
|
| 1,790,144 |
|
| 506,396 |
|
| — |
|
Cost of shares redeemed |
|
|
|
|
|
|
|
|
|
|
|
|
|
|
|
|
|
|
|
|
| |
| Class A |
| (3,584 | ) |
| (1,032 | ) |
| (2,482 | ) |
| (12,518 | ) |
| (351,785 | ) |
| (602,488 | ) |
| (319,647 | ) |
| Class I |
| — |
|
| (106 | ) |
| — |
|
| — |
|
| — |
|
| — |
|
| — |
|
Change in net assets from |
|
|
|
|
|
|
|
|
|
|
|
|
|
|
|
|
|
|
|
|
| |
| share transactions |
| 69,190 |
|
| 28,693 |
|
| 77,436 |
|
| 54,218 |
|
| 1,535,551 |
|
| 58,230 |
|
| 223,464 |
|
Change in net assets |
| 71,729 |
|
| 29,462 |
|
| 78,638 |
|
| 55,903 |
|
| 1,800,088 |
|
| 321,617 |
|
| 510,505 |
| |
Net assets beginning of year |
| — |
|
| — |
|
| — |
|
| — |
|
| 1,507,755 |
|
| 2,570,726 |
|
| 1,708,441 |
| |
Net assets end of year | $ | 71,729 |
| $ | 29,462 |
| $ | 78,638 |
| $ | 55,903 |
| $ | 3,307,843 |
| $ | 2,892,343 |
| $ | 2,218,946 |
| |
Undistributed (excess of distributions |
|
|
|
|
|
|
|
|
|
|
|
|
|
|
|
|
|
|
|
|
| |
| over) net investment income (loss) | $ | — |
| $ | — |
| $ | — |
| $ | — |
| $ | — |
| $ | — |
| $ | — |
|
|
|
|
|
|
|
|
|
|
|
|
|
|
|
|
|
|
|
|
|
|
|
|
1Share transactions |
|
|
|
|
|
|
|
|
|
|
|
|
|
|
|
|
|
|
|
|
| |
Shares sold |
|
|
|
|
|
|
|
|
|
|
|
|
|
|
|
|
|
|
|
|
| |
| Class A |
| 6,971 |
|
| 2,831 |
|
| 7,829 |
|
| 6,412 |
|
| 5,989 |
|
| 9,432 |
|
| 39,065 |
|
| Class I |
| 10 |
|
| 36 |
|
| 20 |
|
| 9 |
|
| 7 |
|
| 7 |
|
| 38 |
|
Shares issued in connection with acquisition |
|
|
|
|
|
|
|
|
|
|
|
|
|
|
|
|
|
|
|
|
| |
| Class A |
| — |
|
| — |
|
| — |
|
| — |
|
| 108,635 |
|
| 30,448 |
|
| — |
|
Shares redeemed |
|
|
|
|
|
|
|
|
|
|
|
|
|
|
|
|
|
|
|
|
| |
| Class A |
| (341 | ) |
| (97 | ) |
| (243 | ) |
| (1,215 | ) |
| (21,787 | ) |
| (36,892 | ) |
| (22,869 | ) |
| Class I |
| — |
|
| (10 | ) |
| — |
|
| — |
|
| — |
|
| — |
|
| — |
|
Change in shares |
|
|
|
|
|
|
|
|
|
|
|
|
|
|
|
|
|
|
|
|
| |
| Class A |
| 6,630 |
|
| 2,734 |
|
| 7,586 |
|
| 5,197 |
|
| 92,837 |
|
| 2,988 |
|
| 16,196 |
|
| Class I |
| 10 |
|
| 26 |
|
| 20 |
|
| 9 |
|
| 7 |
|
| 7 |
|
| 38 |
|
(a) | Period from commencement of operations September 25, 2017. |
(b) | The Master Funds for the JNL/American Funds Master Feeder Funds are the Class 1 shares of the corresponding American Fund Insurance Series Fund. The Master Funds for the JNL/Vanguard Master Feeder Funds are the shares of the corresponding Vanguard Variable Insurance Fund. These financial statements should be read in conjunction with each Master Fund's respective shareholder report. |
(c) | Effective September 25, 2017, Class I shares were offered by the Fund. |
See accompanying Notes to Financial Statements.
63
JNL Series Trust Master Feeder Funds and Funds of Funds
Statements of Changes in Net Assets (in thousands)
For the Year Ended December 31, 2017
|
| JNL/American Funds Growth Allocation Fund(a) |
| JNL/DFA Growth Allocation Fund(a)(b) |
| JNL/DFA Moderate Growth Allocation Fund(a)(b) |
| JNL Moderate Growth Allocation Fund(a) |
| JNL Growth Allocation Fund(a) |
| JNL Aggressive Growth Allocation Fund(a) |
| JNL/Franklin Templeton Founding Strategy Fund(a) |
| |||||||
Operations |
|
|
|
|
|
|
|
|
|
|
|
|
|
|
|
|
|
|
|
|
| |
Net investment income (loss) | $ | 13,596 |
| $ | 743 |
| $ | 542 |
| $ | 11,561 |
| $ | 13,388 |
| $ | 5,109 |
| $ | 39,099 |
| |
Net realized gain (loss) |
| 126,533 |
|
| 1,610 |
|
| 924 |
|
| 236,871 |
|
| 310,655 |
|
| 202,141 |
|
| 296,033 |
| |
Net change in unrealized appreciation |
|
|
|
|
|
|
|
|
|
|
|
|
|
|
|
|
|
|
|
|
| |
| (depreciation) |
| 174,211 |
|
| 2,241 |
|
| 1,240 |
|
| (16,948 | ) |
| 31,820 |
|
| 6,216 |
|
| (170,937 | ) |
Change in net assets from operations |
| 314,340 |
|
| 4,594 |
|
| 2,706 |
|
| 231,484 |
|
| 355,863 |
|
| 213,466 |
|
| 164,195 |
| |
Distributions to shareholders |
|
|
|
|
|
|
|
|
|
|
|
|
|
|
|
|
|
|
|
|
| |
From net investment income |
|
|
|
|
|
|
|
|
|
|
|
|
|
|
|
|
|
|
|
|
| |
| Class A |
| — |
|
| (2,298 | ) |
| (1,410 | ) |
| — |
|
| — |
|
| — |
|
| — |
|
| Class I |
| — |
|
| (2 | ) |
| (2 | ) |
| — |
|
| — |
|
| — |
|
| — |
|
From net realized gains |
|
|
|
|
|
|
|
|
|
|
|
|
|
|
|
|
|
|
|
|
| |
| Class A |
| — |
|
| (39 | ) |
| (45 | ) |
| — |
|
| — |
|
| — |
|
| — |
|
Total distributions to shareholders |
| — |
|
| (2,339 | ) |
| (1,457 | ) |
| — |
|
| — |
|
| — |
|
| — |
| |
Share transactions1 |
|
|
|
|
|
|
|
|
|
|
|
|
|
|
|
|
|
|
|
|
| |
Proceeds from the sale of shares |
|
|
|
|
|
|
|
|
|
|
|
|
|
|
|
|
|
|
|
|
| |
| Class A |
| 650,074 |
|
| 80,844 |
|
| 65,226 |
|
| 222,291 |
|
| 335,822 |
|
| 261,947 |
|
| 136,792 |
|
| Class I |
| 266 |
|
| 76 |
|
| 173 |
|
| — |
|
| 612 |
|
| 261 |
|
| 6 |
|
Proceeds in connection with acquisition |
|
|
|
|
|
|
|
|
|
|
|
|
|
|
|
|
|
|
|
|
| |
| Class A |
| — |
|
| — |
|
| — |
|
| 879,911 |
|
| 318,270 |
|
| 348,477 |
|
| — |
|
Reinvestment of distributions |
|
|
|
|
|
|
|
|
|
|
|
|
|
|
|
|
|
|
|
|
| |
| Class A |
| — |
|
| 2,337 |
|
| 1,455 |
|
| — |
|
| — |
|
| — |
|
| — |
|
| Class I |
| — |
|
| 2 |
|
| 2 |
|
| — |
|
| — |
|
| — |
|
| — |
|
Cost of shares redeemed |
|
|
|
|
|
|
|
|
|
|
|
|
|
|
|
|
|
|
|
|
| |
| Class A |
| (233,930 | ) |
| (5,233 | ) |
| (3,971 | ) |
| (268,404 | ) |
| (343,020 | ) |
| (182,590 | ) |
| (275,055 | ) |
Change in net assets from |
|
|
|
|
|
|
|
|
|
|
|
|
|
|
|
|
|
|
|
|
| |
| share transactions |
| 416,410 |
|
| 78,026 |
|
| 62,885 |
|
| 833,798 |
|
| 311,684 |
|
| 428,095 |
|
| (138,257 | ) |
Change in net assets |
| 730,750 |
|
| 80,281 |
|
| 64,134 |
|
| 1,065,282 |
|
| 667,547 |
|
| 641,561 |
|
| 25,938 |
| |
Net assets beginning of year |
| 1,359,847 |
|
| — |
|
| — |
|
| 1,417,843 |
|
| 1,844,865 |
|
| 884,110 |
|
| 1,454,361 |
| |
Net assets end of year | $ | 2,090,597 |
| $ | 80,281 |
| $ | 64,134 |
| $ | 2,483,125 |
| $ | 2,512,412 |
| $ | 1,525,671 |
| $ | 1,480,299 |
| |
Undistributed (excess of distributions |
|
|
|
|
|
|
|
|
|
|
|
|
|
|
|
|
|
|
|
|
| |
| over) net investment income (loss) | $ | — |
| $ | — |
| $ | — |
| $ | — |
| $ | — |
| $ | — |
| $ | — |
|
|
|
|
|
|
|
|
|
|
|
|
|
|
|
|
|
|
|
|
|
|
|
|
1Share transactions |
|
|
|
|
|
|
|
|
|
|
|
|
|
|
|
|
|
|
|
|
| |
Shares sold |
|
|
|
|
|
|
|
|
|
|
|
|
|
|
|
|
|
|
|
|
| |
| Class A |
| 43,124 |
|
| 7,643 |
|
| 6,213 |
|
| 17,121 |
|
| 26,624 |
|
| 21,975 |
|
| 10,314 |
|
| Class I |
| 16 |
|
| 7 |
|
| 16 |
|
| — |
|
| 46 |
|
| 20 |
|
| — |
|
Shares issued in connection with acquisition |
|
|
|
|
|
|
|
|
|
|
|
|
|
|
|
|
|
|
|
|
| |
| Class A |
| — |
|
| — |
|
| — |
|
| 66,254 |
|
| 24,454 |
|
| 28,107 |
|
| — |
|
Reinvestment of distributions |
|
|
|
|
|
|
|
|
|
|
|
|
|
|
|
|
|
|
|
|
| |
| Class A |
| — |
|
| 216 |
|
| 137 |
|
| — |
|
| — |
|
| — |
|
| — |
|
Shares redeemed |
|
|
|
|
|
|
|
|
|
|
|
|
|
|
|
|
|
|
|
|
| |
| Class A |
| (15,544 | ) |
| (490 | ) |
| (378 | ) |
| (20,756 | ) |
| (27,352 | ) |
| (15,227 | ) |
| (20,693 | ) |
Change in shares |
|
|
|
|
|
|
|
|
|
|
|
|
|
|
|
|
|
|
|
|
| |
| Class A |
| 27,580 |
|
| 7,369 |
|
| 5,972 |
|
| 62,619 |
|
| 23,726 |
|
| 34,855 |
|
| (10,379 | ) |
| Class I |
| 16 |
|
| 7 |
|
| 16 |
|
| — |
|
| 46 |
|
| 20 |
|
| — |
|
(a) | Effective September 25, 2017, Class I shares were offered by the Fund. |
(b) | Period from commencement of operations April 24, 2017. |
See accompanying Notes to Financial Statements.
64
JNL Series Trust Master Feeder Funds and Funds of Funds
Statements of Changes in Net Assets (in thousands)
For the Year Ended December 31, 2017
|
| JNL/Mellon Capital 10 x 10 Fund(a) |
| JNL/Mellon Capital Index 5 Fund(a) |
| JNL/S&P 4 Fund(a) |
| JNL/S&P Managed Conservative Fund(a) |
| JNL/S&P Managed Moderate Fund(a) |
| JNL/S&P Managed Moderate Growth Fund(a) |
| JNL/S&P Managed Growth Fund(a) |
| |||||||
Operations |
|
|
|
|
|
|
|
|
|
|
|
|
|
|
|
|
|
|
|
|
| |
Net investment income (loss) | $ | 8,003 |
| $ | 13,950 |
| $ | 143,034 |
| $ | 18,472 |
| $ | 31,886 |
| $ | 48,839 |
| $ | 34,538 |
| |
Net realized gain (loss) |
| 140,258 |
|
| 229,984 |
|
| (13,487 | ) |
| 39,801 |
|
| 292,637 |
|
| 922,784 |
|
| 1,088,661 |
| |
Net change in unrealized appreciation |
|
|
|
|
|
|
|
|
|
|
|
|
|
|
|
|
|
|
|
|
| |
| (depreciation) |
| (77,296 | ) |
| (108,148 | ) |
| 867,595 |
|
| 44,118 |
|
| 27,091 |
|
| (43,116 | ) |
| (94,776 | ) |
Change in net assets from operations |
| 70,965 |
|
| 135,786 |
|
| 997,142 |
|
| 102,391 |
|
| 351,614 |
|
| 928,507 |
|
| 1,028,423 |
| |
Share transactions1 |
|
|
|
|
|
|
|
|
|
|
|
|
|
|
|
|
|
|
|
|
| |
Proceeds from the sale of shares |
|
|
|
|
|
|
|
|
|
|
|
|
|
|
|
|
|
|
|
|
| |
| Class A |
| 77,966 |
|
| 203,635 |
|
| 816,398 |
|
| 199,102 |
|
| 300,067 |
|
| 519,590 |
|
| 551,904 |
|
| Class I |
| — |
|
| 1 |
|
| 791 |
|
| 1 |
|
| 111 |
|
| 832 |
|
| 243 |
|
Cost of shares redeemed |
|
|
|
|
|
|
|
|
|
|
|
|
|
|
|
|
|
|
|
|
| |
| Class A |
| (86,458 | ) |
| (160,737 | ) |
| (1,810,283 | ) |
| (406,132 | ) |
| (612,629 | ) |
| (1,118,981 | ) |
| (947,851 | ) |
Change in net assets from |
|
|
|
|
|
|
|
|
|
|
|
|
|
|
|
|
|
|
|
|
| |
| share transactions |
| (8,492 | ) |
| 42,899 |
|
| (993,094 | ) |
| (207,029 | ) |
| (312,451 | ) |
| (598,559 | ) |
| (395,704 | ) |
Change in net assets |
| 62,473 |
|
| 178,685 |
|
| 4,048 |
|
| (104,638 | ) |
| 39,163 |
|
| 329,948 |
|
| 632,719 |
| |
Net assets beginning of year |
| 435,310 |
|
| 846,638 |
|
| 7,122,476 |
|
| 1,586,568 |
|
| 3,276,357 |
|
| 6,050,202 |
|
| 5,049,708 |
| |
Net assets end of year | $ | 497,783 |
| $ | 1,025,323 |
| $ | 7,126,524 |
| $ | 1,481,930 |
| $ | 3,315,520 |
| $ | 6,380,150 |
| $ | 5,682,427 |
| |
|
|
|
|
|
|
|
|
|
|
|
|
|
|
|
|
|
|
|
|
|
|
|
1Share transactions |
|
|
|
|
|
|
|
|
|
|
|
|
|
|
|
|
|
|
|
|
| |
Shares sold |
|
|
|
|
|
|
|
|
|
|
|
|
|
|
|
|
|
|
|
|
| |
| Class A |
| 6,224 |
|
| 15,122 |
|
| 44,436 |
|
| 15,283 |
|
| 20,444 |
|
| 31,613 |
|
| 31,946 |
|
| Class I |
| — |
|
| — |
|
| 40 |
|
| — |
|
| 7 |
|
| 48 |
|
| 13 |
|
Shares redeemed |
|
|
|
|
|
|
|
|
|
|
|
|
|
|
|
|
|
|
|
|
| |
| Class A |
| (6,794 | ) |
| (11,797 | ) |
| (97,907 | ) |
| (31,154 | ) |
| (41,663 | ) |
| (68,214 | ) |
| (54,790 | ) |
Change in shares |
|
|
|
|
|
|
|
|
|
|
|
|
|
|
|
|
|
|
|
|
| |
| Class A |
| (570 | ) |
| 3,325 |
|
| (53,471 | ) |
| (15,871 | ) |
| (21,219 | ) |
| (36,601 | ) |
| (22,844 | ) |
| Class I |
| — |
|
| — |
|
| 40 |
|
| — |
|
| 7 |
|
| 48 |
|
| 13 |
|
(a) | Effective September 25, 2017, Class I shares were offered by the Fund. |
See accompanying Notes to Financial Statements.
65
JNL Series Trust Master Feeder Funds and Funds of Funds
Statements of Changes in Net Assets (in thousands)
For the Year Ended December 31, 2017
|
| JNL/S&P Managed Aggressive Growth Fund(a) |
| JNL/Vanguard Global Bond Market Index Fund(b) |
| JNL/Vanguard International Stock Market Index Fund(b) |
| JNL/Vanguard U.S. Stock Market Index Fund(b) |
|
| ||||
Operations |
|
|
|
|
|
|
|
|
|
|
|
|
| |
Net investment income (loss) | $ | 13,023 |
| $ | 102 |
| $ | 825 |
| $ | 197 |
|
| |
Net realized gain (loss) |
| 406,314 |
|
| (2 | ) |
| 361 |
|
| 387 |
|
| |
Net change in unrealized appreciation |
|
|
|
|
|
|
|
|
|
|
|
|
| |
| (depreciation) |
| 6,841 |
|
| (72 | ) |
| 2,094 |
|
| 719 |
|
|
Change in net assets from operations |
| 426,178 |
|
| 28 |
|
| 3,280 |
|
| 1,303 |
|
| |
Share transactions1 |
|
|
|
|
|
|
|
|
|
|
|
|
| |
Proceeds from the sale of shares |
|
|
|
|
|
|
|
|
|
|
|
|
| |
| Class A |
| 324,429 |
|
| 14,926 |
|
| 118,442 |
|
| 52,571 |
|
|
| Class I |
| 54 |
|
| 16 |
|
| 183 |
|
| 101 |
|
|
Cost of shares redeemed |
|
|
|
|
|
|
|
|
|
|
|
|
| |
| Class A |
| (358,562 | ) |
| (1,163 | ) |
| (3,443 | ) |
| (1,331 | ) |
|
Change in net assets from |
|
|
|
|
|
|
|
|
|
|
|
|
| |
| share transactions |
| (34,079 | ) |
| 13,779 |
|
| 115,182 |
|
| 51,341 |
|
|
Change in net assets |
| 392,099 |
|
| 13,807 |
|
| 118,462 |
|
| 52,644 |
|
| |
Net assets beginning of year |
| 1,841,402 |
|
| — |
|
| — |
|
| — |
|
| |
Net assets end of year | $ | 2,233,501 |
| $ | 13,807 |
| $ | 118,462 |
| $ | 52,644 |
|
| |
|
|
|
|
|
|
|
|
|
|
|
|
|
|
|
1Share transactions |
|
|
|
|
|
|
|
|
|
|
|
|
| |
Shares sold |
|
|
|
|
|
|
|
|
|
|
|
|
| |
| Class A |
| 16,114 |
|
| 1,489 |
|
| 11,658 |
|
| 5,033 |
|
|
| Class I |
| 2 |
|
| 2 |
|
| 18 |
|
| 10 |
|
|
Shares redeemed |
|
|
|
|
|
|
|
|
|
|
|
|
| |
| Class A |
| (17,721 | ) |
| (116 | ) |
| (337 | ) |
| (127 | ) |
|
Change in shares |
|
|
|
|
|
|
|
|
|
|
|
|
| |
| Class A |
| (1,607 | ) |
| 1,373 |
|
| 11,321 |
|
| 4,906 |
|
|
| Class I |
| 2 |
|
| 2 |
|
| 18 |
|
| 10 |
|
|
(a) | Effective September 25, 2017, Class I shares were offered by the Fund. |
(b) | Period from commencement of operations September 25, 2017. |
See accompanying Notes to Financial Statements.
66
JNL Series Trust Master Feeder Funds and Funds of Funds
Financial Highlights
For a Share Outstanding
|
|
| Increase (decrease) from |
| Distributions from |
|
|
|
| Supplemental data |
|
|
| Ratios(a)(b) |
|
| |||||||||||||
Period ended | Net asset value, beginning of period($) | Net investment income (loss)($)(c) | Net realized & unrealized gains (losses)($) | Total from investment operations($) |
| Net investment income($) | Net realized gains on investment transactions($) | Net asset value, end of period($) | Total return(%)(d) | Net assets,end of period (in thousands)($) | Portfolio turnover (%)(e) |
| Net expenses to average net assets(%)(f) | Total expenses to average net assets(%)(f) | Net investment income (loss) to average net assets(%) | ||||||||||||||
| |||||||||||||||||||||||||||||
JNL/American Funds Balanced Fund(g)(h) |
|
|
|
|
|
|
|
|
|
|
|
|
|
| |||||||||||||||
Class A |
|
|
|
|
|
|
|
|
|
|
|
|
|
|
|
|
|
|
|
|
| ||||||||
12/31/18 |
| 11.56 |
| 0.18 |
| (0.73) |
| (0.55) |
|
| (0.07) |
| (0.64) |
| 10.30 |
| (4.89) |
| 1,035,023 |
| 34 | (i) |
| 0.58 |
| 0.98 |
| 1.54 |
|
12/31/17 | (j) | 10.26 |
| 0.23 |
| 1.44 |
| 1.67 |
|
| (0.15) |
| (0.22) |
| 11.56 |
| 16.71 |
| 773,584 |
| 39 | (i) |
| 0.69 |
| 1.00 |
| 2.07 |
|
12/31/16 |
| 10.36 |
| 0.16 |
| 0.44 |
| 0.60 |
|
| (0.00) | (k) | (0.70) |
| 10.26 |
| 5.73 |
| 456,663 |
| 57 | (i) |
| 0.98 |
| 1.01 |
| 1.53 |
|
12/31/15 |
| 11.26 |
| 0.14 |
| (0.30) |
| (0.16) |
|
| (0.09) |
| (0.65) |
| 10.36 |
| (1.52) |
| 456,687 |
| 72 | (i) |
| 1.00 |
| 1.01 |
| 1.27 |
|
12/31/14 |
| 11.30 |
| 0.15 |
| (0.09) |
| 0.06 |
|
| (0.10) |
| — |
| 11.26 |
| 0.54 |
| 472,427 |
| 62 | (i) |
| 1.01 |
| 1.01 |
| 1.30 |
|
|
|
|
|
|
|
|
|
|
|
|
|
|
|
|
|
|
|
|
|
|
|
|
|
|
|
|
|
|
|
Class I |
|
|
|
|
|
|
|
|
|
|
|
|
|
|
|
|
|
|
|
|
| ||||||||
12/31/18 |
| 11.92 |
| 0.34 |
| (0.86) |
| (0.52) |
|
| (0.09) |
| (0.64) |
| 10.67 |
| (4.56) |
| 10,760 |
| 34 | (i) |
| 0.28 |
| 0.68 |
| 2.88 |
|
12/31/17 | ‡(j) | 10.56 |
| 0.26 |
| 1.50 |
| 1.76 |
|
| (0.18) |
| (0.22) |
| 11.92 |
| 17.03 |
| 1,014 |
| 39 | (i) |
| 0.47 |
| 0.77 |
| 2.30 |
|
12/31/16 |
| 10.65 |
| 0.19 |
| 0.44 |
| 0.63 |
|
| (0.02) |
| (0.70) |
| 10.56 |
| 5.87 |
| 489 |
| 57 | (i) |
| 0.78 |
| 0.81 |
| 1.73 |
|
12/31/15 |
| 11.55 |
| 0.17 |
| (0.31) |
| (0.14) |
|
| (0.11) |
| (0.65) |
| 10.65 |
| (1.28) |
| 465 |
| 72 | (i) |
| 0.80 |
| 0.81 |
| 1.46 |
|
12/31/14 |
| 11.59 |
| 0.18 |
| (0.10) |
| 0.08 |
|
| (0.12) |
| — |
| 11.55 |
| 0.71 |
| 559 |
| 62 | (i) |
| 0.81 |
| 0.81 |
| 1.50 |
|
| |||||||||||||||||||||||||||||
JNL/American Funds Blue Chip Income and Growth Fund(g)(h) |
|
|
|
|
|
|
|
|
|
|
|
|
|
| |||||||||||||||
Class A |
|
|
|
|
|
|
|
|
|
|
|
|
|
|
|
|
|
|
|
|
| ||||||||
12/31/18 |
| 22.12 |
| 0.34 |
| (2.33) |
| (1.99) |
|
| — |
| — |
| 20.13 |
| (9.00) |
| 2,919,769 |
| 49 |
|
| 0.58 |
| 1.01 |
| 1.54 |
|
12/31/17 |
| 18.97 |
| 0.34 |
| 2.81 |
| 3.15 |
|
| — |
| — |
| 22.12 |
| 16.61 |
| 3,449,917 |
| 34 |
|
| 0.59 |
| 1.02 |
| 1.67 |
|
12/31/16 |
| 16.03 |
| 0.33 |
| 2.61 |
| 2.94 |
|
| — |
| — |
| 18.97 |
| 18.34 |
| 2,907,733 |
| 30 |
|
| 0.59 |
| 1.02 |
| 1.90 |
|
12/31/15 |
| 17.04 |
| 0.28 |
| (0.84) |
| (0.56) |
|
| (0.41) |
| (0.04) |
| 16.03 |
| (3.32) |
| 1,960,998 |
| 26 |
|
| 0.60 |
| 1.05 |
| 1.65 |
|
12/31/14 |
| 14.98 |
| 0.52 |
| 1.73 |
| 2.25 |
|
| (0.16) |
| (0.03) |
| 17.04 |
| 14.99 |
| 1,874,780 |
| 37 |
|
| 0.61 |
| 1.09 |
| 3.25 |
|
|
|
|
|
|
|
|
|
|
|
|
|
|
|
|
|
|
|
|
|
|
|
|
|
|
|
|
|
|
|
Class I |
|
|
|
|
|
|
|
|
|
|
|
|
|
|
|
|
|
|
|
|
| ||||||||
12/31/18 |
| 22.36 |
| 0.80 |
| (2.75) |
| (1.95) |
|
| — |
| — |
| 20.41 |
| (8.72) |
| 6,282 |
| 49 |
|
| 0.28 |
| 0.71 |
| 3.58 |
|
12/31/17 | ‡ | 19.13 |
| 0.44 |
| 2.79 |
| 3.23 |
|
| — |
| — |
| 22.36 |
| 16.88 |
| 555 |
| 34 |
|
| 0.36 |
| 0.79 |
| 2.17 |
|
12/31/16 |
| 16.13 |
| 0.39 |
| 2.61 |
| 3.00 |
|
| — |
| — |
| 19.13 |
| 18.60 |
| 334 |
| 30 |
|
| 0.39 |
| 0.82 |
| 2.23 |
|
12/31/15 |
| 17.14 |
| 0.29 |
| (0.82) |
| (0.53) |
|
| (0.44) |
| (0.04) |
| 16.13 |
| (3.11) |
| 195 |
| 26 |
|
| 0.38 |
| 0.83 |
| 1.71 |
|
12/31/14 |
| 15.05 |
| 0.60 |
| 1.70 |
| 2.30 |
|
| (0.18) |
| (0.03) |
| 17.14 |
| 15.27 |
| 224 |
| 37 |
|
| 0.36 |
| 0.84 |
| 3.70 |
|
| |||||||||||||||||||||||||||||
JNL/American Funds Capital Income Builder Fund |
|
|
|
|
|
|
|
|
|
|
|
|
|
| |||||||||||||||
Class A |
|
|
|
|
|
|
|
|
|
|
|
|
|
|
|
|
|
|
|
|
| ||||||||
12/31/18 | * | 10.00 |
| 0.15 |
| (0.74) |
| (0.59) |
|
| — |
| — |
| 9.41 |
| (5.90) |
| 23,271 |
| 42 | (l) |
| 0.61 |
| 0.98 |
| 4.09 |
|
|
|
|
|
|
|
|
|
|
|
|
|
|
|
|
|
|
|
|
|
|
|
|
|
|
|
|
|
|
|
Class I |
|
|
|
|
|
|
|
|
|
|
|
|
|
|
|
|
|
|
|
|
| ||||||||
12/31/18 | * | 10.00 |
| 0.21 |
| (0.78) |
| (0.57) |
|
| — |
| — |
| 9.43 |
| (5.70) |
| 1,222 |
| 42 | (l) |
| 0.25 |
| 0.68 |
| 5.70 |
|
| |||||||||||||||||||||||||||||
JNL/American Funds Global Bond Fund(g)(h) |
|
|
|
|
|
|
|
|
|
|
|
|
|
| |||||||||||||||
Class A |
|
|
|
|
|
|
|
|
|
|
|
|
|
|
|
|
|
|
|
|
| ||||||||
12/31/18 |
| 10.76 |
| 0.19 |
| (0.37) |
| (0.18) |
|
| (0.06) |
| — |
| 10.52 |
| (1.62) |
| 500,836 |
| 78 | (m) |
| 0.53 |
| 1.05 |
| 1.77 |
|
12/31/17 |
| 10.13 |
| 0.01 |
| 0.65 |
| 0.66 |
|
| (0.03) |
| — |
| 10.76 |
| 6.56 |
| 519,871 |
| 74 | (m) |
| 0.53 |
| 1.05 |
| 0.05 |
|
12/31/16 |
| 9.90 |
| 0.02 |
| 0.21 |
| 0.23 |
|
| — |
| — |
| 10.13 |
| 2.32 |
| 471,248 |
| 70 | (m) |
| 0.55 |
| 1.05 |
| 0.23 |
|
12/31/15 |
| 10.58 |
| (0.05) |
| (0.40) |
| (0.45) |
|
| (0.14) |
| (0.09) |
| 9.90 |
| (4.24) |
| 442,844 |
| 88 | (m) |
| 0.55 |
| 1.07 |
| (0.46) |
|
12/31/14 |
| 10.54 |
| 0.13 |
| (0.01) |
| 0.12 |
|
| (0.00) | (k) | (0.08) |
| 10.58 |
| 1.17 |
| 493,988 |
| 134 | (m) |
| 0.55 |
| 1.10 |
| 1.18 |
|
|
|
|
|
|
|
|
|
|
|
|
|
|
|
|
|
|
|
|
|
|
|
|
|
|
|
|
|
|
|
Class I |
|
|
|
|
|
|
|
|
|
|
|
|
|
|
|
|
|
|
|
|
| ||||||||
12/31/18 |
| 10.85 |
| 0.32 |
| (0.47) |
| (0.15) |
|
| (0.09) |
| — |
| 10.61 |
| (1.39) |
| 1,313 |
| 78 | (m) |
| 0.23 |
| 0.75 |
| 3.01 |
|
12/31/17 | ‡ | 10.21 |
| 0.05 |
| 0.65 |
| 0.70 |
|
| (0.06) |
| — |
| 10.85 |
| 6.81 |
| 355 |
| 74 | (m) |
| 0.30 |
| 0.82 |
| 0.49 |
|
12/31/16 |
| 9.95 |
| 0.04 |
| 0.22 |
| 0.26 |
|
| — |
| — |
| 10.21 |
| 2.61 |
| 161 |
| 70 | (m) |
| 0.35 |
| 0.85 |
| 0.42 |
|
12/31/15 |
| 10.65 |
| (0.02) |
| (0.42) |
| (0.44) |
|
| (0.17) |
| (0.09) |
| 9.95 |
| (4.12) |
| 152 |
| 88 | (m) |
| 0.33 |
| 0.85 |
| (0.24) |
|
12/31/14 |
| 10.61 |
| 0.14 |
| 0.01 |
| 0.15 |
|
| (0.03) |
| (0.08) |
| 10.65 |
| 1.40 |
| 163 |
| 134 | (m) |
| 0.30 |
| 0.85 |
| 1.31 |
|
| |||||||||||||||||||||||||||||
JNL/American Funds Global Small Capitalization Fund(g)(h) |
|
|
|
|
|
|
|
|
|
|
|
|
|
| |||||||||||||||
Class A |
|
|
|
|
|
|
|
|
|
|
|
|
|
|
|
|
|
|
|
|
| ||||||||
12/31/18 |
| 14.31 |
| (0.03) |
| (1.50) |
| (1.53) |
|
| (0.02) |
| (0.09) |
| 12.67 |
| (10.77) |
| 618,162 |
| 43 |
|
| 0.55 |
| 1.10 |
| (0.21) |
|
12/31/17 |
| 13.30 |
| 0.02 |
| 3.25 |
| 3.27 |
|
| (0.03) |
| (2.23) |
| 14.31 |
| 25.52 |
| 681,782 |
| 33 |
|
| 0.55 |
| 1.10 |
| 0.13 |
|
12/31/16 |
| 13.07 |
| 0.00 |
| 0.23 |
| 0.23 |
|
| — |
| — |
| 13.30 |
| 1.76 |
| 494,981 |
| 40 |
|
| 0.55 |
| 1.10 |
| (0.04) |
|
12/31/15 |
| 13.32 |
| (0.08) |
| 0.08 |
| 0.00 |
|
| — |
| (0.25) |
| 13.07 |
| (0.05) |
| 515,018 |
| 36 |
|
| 0.55 |
| 1.12 |
| (0.55) |
|
12/31/14 |
| 13.20 |
| (0.03) |
| 0.27 |
| 0.24 |
|
| (0.03) |
| (0.09) |
| 13.32 |
| 1.80 |
| 394,604 |
| 28 |
|
| 0.55 |
| 1.15 |
| (0.20) |
|
|
|
|
|
|
|
|
|
|
|
|
|
|
|
|
|
|
|
|
|
|
|
|
|
|
|
|
|
|
|
Class I |
|
|
|
|
|
|
|
|
|
|
|
|
|
|
|
|
|
|
|
|
| ||||||||
12/31/18 |
| 14.48 |
| 0.04 |
| (1.55) |
| (1.51) |
|
| (0.03) |
| (0.09) |
| 12.85 |
| (10.48) |
| 2,689 |
| 43 |
|
| 0.25 |
| 0.80 |
| 0.30 |
|
12/31/17 | ‡ | 13.43 |
| 0.09 |
| 3.24 |
| 3.33 |
|
| (0.05) |
| (2.23) |
| 14.48 |
| 25.78 |
| 379 |
| 33 |
|
| 0.31 |
| 0.86 |
| 0.61 |
|
12/31/16 |
| 13.17 |
| 0.02 |
| 0.24 |
| 0.26 |
|
| — |
| — |
| 13.43 |
| 1.97 |
| 103 |
| 40 |
|
| 0.35 |
| 0.90 |
| 0.16 |
|
12/31/15 |
| 13.39 |
| (0.05) |
| 0.08 |
| 0.03 |
|
| — |
| (0.25) |
| 13.17 |
| 0.18 |
| 110 |
| 36 |
|
| 0.34 |
| 0.91 |
| (0.34) |
|
12/31/14 |
| 13.26 |
| 0.01 |
| 0.26 |
| 0.27 |
|
| (0.05) |
| (0.09) |
| 13.39 |
| 2.05 |
| 137 |
| 28 |
|
| 0.30 |
| 0.90 |
| 0.04 |
|
| |||||||||||||||||||||||||||||
See accompanying Notes to Financial Statements.
67
JNL Series Trust Master Feeder Funds and Funds of Funds
Financial Highlights
For a Share Outstanding
|
|
| Increase (decrease) from |
| Distributions from |
|
|
|
| Supplemental data |
|
|
| Ratios(a)(b) |
|
| |||||||||||||
Period ended | Net asset value, beginning of period($) | Net investment income (loss)($)(c) | Net realized & unrealized gains (losses)($) | Total from investment operations($) |
| Net investment income($) | Net realized gains on investment transactions($) | Net asset value, end of period($) | Total return(%)(d) | Net assets,end of period (in thousands)($) | Portfolio turnover (%)(e) |
| Net expenses to average net assets(%)(f) | Total expenses to average net assets(%)(f) | Net investment income (loss) to average net assets(%) | ||||||||||||||
JNL/American Funds Growth-Income Fund(g)(h) |
|
|
|
|
|
|
|
|
|
|
|
|
|
| |||||||||||||||
Class A |
|
|
|
|
|
|
|
|
|
|
|
|
|
|
|
|
|
|
|
|
| ||||||||
12/31/18 |
| 22.23 |
| 0.25 |
| (0.73) |
| (0.48) |
|
| — |
| — |
| 21.75 |
| (2.16) |
| 6,115,179 |
| 39 |
|
| 0.64 |
| 0.99 |
| 1.07 |
|
12/31/17 |
| 18.24 |
| 0.22 |
| 3.77 |
| 3.99 |
|
| — |
| — |
| 22.23 |
| 21.88 |
| 5,850,613 |
| 27 |
|
| 0.65 |
| 1.00 |
| 1.10 |
|
12/31/16 |
| 16.42 |
| 0.20 |
| 1.62 |
| 1.82 |
|
| — |
| — |
| 18.24 |
| 11.08 |
| 4,038,917 |
| 27 |
|
| 0.67 |
| 1.02 |
| 1.20 |
|
12/31/15 |
| 16.94 |
| 0.18 |
| 0.00 |
| 0.18 |
|
| (0.12) |
| (0.58) |
| 16.42 |
| 1.02 |
| 3,067,743 |
| 25 |
|
| 0.67 |
| 1.04 |
| 1.03 |
|
12/31/14 |
| 15.57 |
| 0.17 |
| 1.42 |
| 1.59 |
|
| (0.10) |
| (0.12) |
| 16.94 |
| 10.19 |
| 2,444,608 |
| 25 |
|
| 0.68 |
| 1.08 |
| 1.05 |
|
|
|
|
|
|
|
|
|
|
|
|
|
|
|
|
|
|
|
|
|
|
|
|
|
|
|
|
|
|
|
Class I |
|
|
|
|
|
|
|
|
|
|
|
|
|
|
|
|
|
|
|
|
| ||||||||
12/31/18 |
| 22.47 |
| 0.64 |
| (1.06) |
| (0.42) |
|
| — |
| — |
| 22.05 |
| (1.87) |
| 25,291 |
| 39 |
|
| 0.34 |
| 0.69 |
| 2.69 |
|
12/31/17 | ‡ | 18.39 |
| 0.50 |
| 3.58 |
| 4.08 |
|
| — |
| — |
| 22.47 |
| 22.19 |
| 1,528 |
| 27 |
|
| 0.41 |
| 0.76 |
| 2.41 |
|
12/31/16 |
| 16.53 |
| 0.22 |
| 1.64 |
| 1.86 |
|
| — |
| — |
| 18.39 |
| 11.25 |
| 408 |
| 27 |
|
| 0.47 |
| 0.82 |
| 1.29 |
|
12/31/15 |
| 17.03 |
| 0.18 |
| 0.05 |
| 0.23 |
|
| (0.15) |
| (0.58) |
| 16.53 |
| 1.30 |
| 352 |
| 25 |
|
| 0.45 |
| 0.82 |
| 1.02 |
|
12/31/14 |
| 15.64 |
| 0.20 |
| 1.43 |
| 1.63 |
|
| (0.12) |
| (0.12) |
| 17.03 |
| 10.41 |
| 395 |
| 25 |
|
| 0.43 |
| 0.83 |
| 1.23 |
|
| |||||||||||||||||||||||||||||
JNL/American Funds International Fund(g)(h) |
|
|
|
|
|
|
|
|
|
|
|
|
|
| |||||||||||||||
Class A |
|
|
|
|
|
|
|
|
|
|
|
|
|
|
|
|
|
|
|
|
| ||||||||
12/31/18 |
| 14.92 |
| 0.19 |
| (2.20) |
| (2.01) |
|
| (0.13) |
| (0.13) |
| 12.65 |
| (13.53) |
| 1,726,176 |
| 29 |
|
| 0.63 |
| 1.18 |
| 1.28 |
|
12/31/17 |
| 11.98 |
| 0.15 |
| 3.60 |
| 3.75 |
|
| (0.09) |
| (0.72) |
| 14.92 |
| 31.63 |
| 2,022,884 |
| 29 |
|
| 0.63 |
| 1.18 |
| 1.07 |
|
12/31/16 |
| 11.62 |
| 0.13 |
| 0.23 |
| 0.36 |
|
| — |
| — |
| 11.98 |
| 3.10 |
| 1,099,688 |
| 31 |
|
| 0.65 |
| 1.20 |
| 1.09 |
|
12/31/15 |
| 12.33 |
| 0.16 |
| (0.75) |
| (0.59) |
|
| (0.10) |
| (0.02) |
| 11.62 |
| (4.84) |
| 979,733 |
| 37 |
|
| 0.65 |
| 1.22 |
| 1.30 |
|
12/31/14 |
| 12.86 |
| 0.15 |
| (0.53) |
| (0.38) |
|
| (0.09) |
| (0.06) |
| 12.33 |
| (3.04) |
| 717,227 |
| 18 |
|
| 0.65 |
| 1.25 |
| 1.19 |
|
|
|
|
|
|
|
|
|
|
|
|
|
|
|
|
|
|
|
|
|
|
|
|
|
|
|
|
|
|
|
Class I |
|
|
|
|
|
|
|
|
|
|
|
|
|
|
|
|
|
|
|
|
| ||||||||
12/31/18 |
| 15.07 |
| 0.41 |
| (2.40) |
| (1.99) |
|
| (0.15) |
| (0.13) |
| 12.80 |
| (13.22) |
| 6,929 |
| 29 |
|
| 0.33 |
| 0.88 |
| 2.88 |
|
12/31/17 | ‡ | 12.08 |
| 0.22 |
| 3.60 |
| 3.82 |
|
| (0.11) |
| (0.72) |
| 15.07 |
| 31.94 |
| 715 |
| 29 |
|
| 0.40 |
| 0.95 |
| 1.56 |
|
12/31/16 |
| 11.69 |
| 0.15 |
| 0.24 |
| 0.39 |
|
| — |
| — |
| 12.08 |
| 3.34 |
| 318 |
| 31 |
|
| 0.45 |
| 1.00 |
| 1.25 |
|
12/31/15 |
| 12.41 |
| 0.14 |
| (0.72) |
| (0.58) |
|
| (0.12) |
| (0.02) |
| 11.69 |
| (4.74) |
| 301 |
| 37 |
|
| 0.43 |
| 1.00 |
| 1.13 |
|
12/31/14 |
| 12.93 |
| 0.19 |
| (0.54) |
| (0.35) |
|
| (0.11) |
| (0.06) |
| 12.41 |
| (2.80) |
| 402 |
| 18 |
|
| 0.40 |
| 1.00 |
| 1.49 |
|
| |||||||||||||||||||||||||||||
JNL/American Funds New World Fund(g)(h) |
|
|
|
|
|
|
|
|
|
|
|
|
|
| |||||||||||||||
Class A |
|
|
|
|
|
|
|
|
|
|
|
|
|
|
|
|
|
|
|
|
| ||||||||
12/31/18 |
| 13.16 |
| 0.06 |
| (1.95) |
| (1.89) |
|
| (0.07) |
| (0.01) |
| 11.19 |
| (14.41) |
| 1,209,431 |
| 58 |
|
| 0.64 |
| 1.39 |
| 0.48 |
|
12/31/17 |
| 10.24 |
| 0.08 |
| 2.88 |
| 2.96 |
|
| (0.04) |
| — |
| 13.16 |
| 28.89 |
| 1,408,340 |
| 56 |
|
| 0.65 |
| 1.40 |
| 0.64 |
|
12/31/16 |
| 9.76 |
| 0.04 |
| 0.44 |
| 0.48 |
|
| — |
| — |
| 10.24 |
| 4.92 |
| 904,033 |
| 32 |
|
| 0.65 |
| 1.40 |
| 0.44 |
|
12/31/15 |
| 11.19 |
| 0.02 |
| (0.40) |
| (0.38) |
|
| (0.09) |
| (0.96) |
| 9.76 |
| (3.57) |
| 797,251 |
| 39 |
|
| 0.65 |
| 1.42 |
| 0.20 |
|
12/31/14 |
| 12.37 |
| 0.09 |
| (1.10) |
| (1.01) |
|
| (0.09) |
| (0.08) |
| 11.19 |
| (8.21) |
| 735,706 |
| 36 |
|
| 0.65 |
| 1.45 |
| 0.70 |
|
|
|
|
|
|
|
|
|
|
|
|
|
|
|
|
|
|
|
|
|
|
|
|
|
|
|
|
|
|
|
Class I |
|
|
|
|
|
|
|
|
|
|
|
|
|
|
|
|
|
|
|
|
| ||||||||
12/31/18 |
| 13.28 |
| 0.18 |
| (2.05) |
| (1.87) |
|
| (0.09) |
| (0.01) |
| 11.31 |
| (14.10) |
| 6,532 |
| 58 |
|
| 0.34 |
| 1.09 |
| 1.49 |
|
12/31/17 | ‡ | 10.32 |
| 0.15 |
| 2.86 |
| 3.01 |
|
| (0.05) |
| — |
| 13.28 |
| 29.23 |
| 612 |
| 56 |
|
| 0.41 |
| 1.16 |
| 1.22 |
|
12/31/16 |
| 9.82 |
| 0.06 |
| 0.44 |
| 0.50 |
|
| — |
| — |
| 10.32 |
| 5.09 |
| 197 |
| 32 |
|
| 0.45 |
| 1.20 |
| 0.55 |
|
12/31/15 |
| 11.25 |
| 0.05 |
| (0.40) |
| (0.35) |
|
| (0.12) |
| (0.96) |
| 9.82 |
| (3.33) |
| 185 |
| 39 |
|
| 0.43 |
| 1.20 |
| 0.42 |
|
12/31/14 |
| 12.43 |
| 0.10 |
| (1.08) |
| (0.98) |
|
| (0.12) |
| (0.08) |
| 11.25 |
| (8.01) |
| 151 |
| 36 |
|
| 0.40 |
| 1.20 |
| 0.83 |
|
| |||||||||||||||||||||||||||||
JNL/Vanguard Capital Growth Fund(h) |
|
|
|
|
|
|
|
|
|
|
|
|
|
| |||||||||||||||
Class A |
|
|
|
|
|
|
|
|
|
|
|
|
|
|
|
|
|
|
|
|
| ||||||||
12/31/18 |
| 10.80 |
| 0.00 |
| (0.19) |
| (0.19) |
|
| — |
| — |
| 10.61 |
| (1.76) |
| 278,980 |
| 6 |
|
| 0.58 |
| 0.98 |
| 0.01 |
|
12/31/17 | * | 10.00 |
| (0.02) |
| 0.82 |
| 0.80 |
|
| — |
| — |
| 10.80 |
| 8.00 |
| 71,616 |
| 7 |
|
| 0.58 |
| 0.98 |
| (0.58) |
|
|
|
|
|
|
|
|
|
|
|
|
|
|
|
|
|
|
|
|
|
|
|
|
|
|
|
|
|
|
|
Class I |
|
|
|
|
|
|
|
|
|
|
|
|
|
|
|
|
|
|
|
|
| ||||||||
12/31/18 |
| 10.82 |
| 0.00 |
| (0.16) |
| (0.16) |
|
| — |
| — |
| 10.66 |
| (1.48) |
| 5,106 |
| 6 |
|
| 0.28 |
| 0.68 |
| (0.02) |
|
12/31/17 | * | 10.00 |
| (0.01) |
| 0.83 |
| 0.82 |
|
| — |
| — |
| 10.82 |
| 8.20 |
| 113 |
| 7 |
|
| 0.28 |
| 0.68 |
| (0.28) |
|
| |||||||||||||||||||||||||||||
JNL/Vanguard Equity Income Fund(h) |
|
|
|
|
|
|
|
|
|
|
|
|
|
| |||||||||||||||
Class A |
|
|
|
|
|
|
|
|
|
|
|
|
|
|
|
|
|
|
|
|
| ||||||||
12/31/18 |
| 10.67 |
| 0.10 |
| (0.79) |
| (0.69) |
|
| — |
| — |
| 9.98 |
| (6.47) |
| 155,905 |
| 36 |
|
| 0.58 |
| 0.98 |
| 0.90 |
|
12/31/17 | * | 10.00 |
| (0.02) |
| 0.69 |
| 0.67 |
|
| — |
| — |
| 10.67 |
| 6.70 |
| 29,181 |
| 38 |
|
| 0.58 |
| 0.98 |
| (0.58) |
|
|
|
|
|
|
|
|
|
|
|
|
|
|
|
|
|
|
|
|
|
|
|
|
|
|
|
|
|
|
|
Class I |
|
|
|
|
|
|
|
|
|
|
|
|
|
|
|
|
|
|
|
|
| ||||||||
12/31/18 |
| 10.69 |
| 0.08 |
| (0.74) |
| (0.66) |
|
| — |
| — |
| 10.03 |
| (6.17) |
| 3,386 |
| 36 |
|
| 0.28 |
| 0.68 |
| 0.74 |
|
12/31/17 | * | 10.00 |
| (0.01) |
| 0.70 |
| 0.69 |
|
| — |
| — |
| 10.69 |
| 6.90 |
| 281 |
| 38 |
|
| 0.28 |
| 0.68 |
| (0.28) |
|
| |||||||||||||||||||||||||||||
JNL/Vanguard International Fund(h) |
|
|
|
|
|
|
|
|
|
|
|
|
|
| |||||||||||||||
Class A |
|
|
|
|
|
|
|
|
|
|
|
|
|
|
|
|
|
|
|
|
| ||||||||
12/31/18 |
| 10.34 |
| (0.00) | (k) | (1.36) |
| (1.36) |
|
| — |
| — |
| 8.98 |
| (13.15) |
| 444,504 |
| 16 |
|
| 0.58 |
| 1.13 |
| (0.05) |
|
12/31/17 | * | 10.00 |
| (0.02) |
| 0.36 |
| 0.34 |
|
| — |
| — |
| 10.34 |
| 3.40 |
| 78,429 |
| 16 |
|
| 0.58 |
| 1.13 |
| (0.58) |
|
|
|
|
|
|
|
|
|
|
|
|
|
|
|
|
|
|
|
|
|
|
|
|
|
|
|
|
|
|
|
Class I |
|
|
|
|
|
|
|
|
|
|
|
|
|
|
|
|
|
|
|
|
| ||||||||
12/31/18 |
| 10.34 |
| 0.00 |
| (1.33) |
| (1.33) |
|
| — |
| — |
| 9.01 |
| (12.86) |
| 5,889 |
| 16 |
|
| 0.28 |
| 0.83 |
| (0.01) |
|
12/31/17 | * | 10.00 |
| (0.01) |
| 0.35 |
| 0.34 |
|
| — |
| — |
| 10.34 |
| 3.40 |
| 209 |
| 16 |
|
| 0.28 |
| 0.83 |
| (0.28) |
|
| |||||||||||||||||||||||||||||
See accompanying Notes to Financial Statements.
68
JNL Series Trust Master Feeder Funds and Funds of Funds
Financial Highlights
For a Share Outstanding
|
|
| Increase (decrease) from |
| Distributions from |
|
|
|
| Supplemental data |
|
|
| Ratios(a)(b) |
|
| |||||||||||||
Period ended | Net asset value, beginning of period($) | Net investment income (loss)($)(c) | Net realized & unrealized gains (losses)($) | Total from investment operations($) |
| Net investment income($) | Net realized gains on investment transactions($) | Net asset value, end of period($) | Total return(%)(d) | Net assets,end of period (in thousands)($) | Portfolio turnover (%)(e) |
| Net expenses to average net assets(%)(f) | Total expenses to average net assets(%)(f) | Net investment income (loss) to average net assets(%) | ||||||||||||||
JNL/Vanguard Small Company Growth Fund(h) |
|
|
|
|
|
|
|
|
|
|
|
|
|
| |||||||||||||||
Class A |
|
|
|
|
|
|
|
|
|
|
|
|
|
|
|
|
|
|
|
|
| ||||||||
12/31/18 |
| 10.74 |
| (0.05) |
| (0.79) |
| (0.84) |
|
| — |
| — |
| 9.90 |
| (7.82) |
| 267,736 |
| 66 |
|
| 0.58 |
| 1.08 |
| (0.42) |
|
12/31/17 | * | 10.00 |
| (0.02) |
| 0.76 |
| 0.74 |
|
| — |
| — |
| 10.74 |
| 7.40 |
| 55,805 |
| 93 |
|
| 0.58 |
| 1.08 |
| (0.58) |
|
|
|
|
|
|
|
|
|
|
|
|
|
|
|
|
|
|
|
|
|
|
|
|
|
|
|
|
|
|
|
Class I |
|
|
|
|
|
|
|
|
|
|
|
|
|
|
|
|
|
|
|
|
| ||||||||
12/31/18 |
| 10.75 |
| (0.02) |
| (0.79) |
| (0.81) |
|
| — |
| — |
| 9.94 |
| (7.53) |
| 3,320 |
| 66 |
|
| 0.28 |
| 0.78 |
| (0.18) |
|
12/31/17 | * | 10.00 |
| (0.01) |
| 0.76 |
| 0.75 |
|
| — |
| — |
| 10.75 |
| 7.50 |
| 98 |
| 93 |
|
| 0.28 |
| 0.78 |
| (0.28) |
|
| |||||||||||||||||||||||||||||
JNL Institutional Alt 25 Fund(n) |
|
|
|
|
|
|
|
|
|
|
|
|
|
| |||||||||||||||
Class A |
|
|
|
|
|
|
|
|
|
|
|
|
|
|
|
|
|
|
|
|
| ||||||||
12/31/18 |
| 17.07 |
| 0.10 |
| (1.29) |
| (1.19) |
|
| — |
| — |
| 15.88 |
| (6.97) |
| 2,635,440 |
| 30 |
|
| 0.46 |
| 0.46 |
| 0.59 |
|
12/31/17 |
| 14.93 |
| 0.09 |
| 2.05 |
| 2.14 |
|
| — |
| — |
| 17.07 |
| 14.33 |
| 3,307,729 |
| 188 | (o) |
| 0.30 |
| 0.30 |
| 0.53 |
|
12/31/16 |
| 14.08 |
| 0.12 |
| 0.73 |
| 0.85 |
|
| — |
| — |
| 14.93 |
| 6.04 |
| 1,507,755 |
| 26 |
|
| 0.17 |
| 0.17 |
| 0.83 |
|
12/31/15 |
| 16.19 |
| 0.31 |
| (0.66) |
| (0.35) |
|
| (0.38) |
| (1.38) |
| 14.08 |
| (2.23) |
| 1,613,267 |
| 31 |
|
| 0.17 |
| 0.17 |
| 1.94 |
|
12/31/14 |
| 16.29 |
| 0.21 |
| 0.16 |
| 0.37 |
|
| (0.29) |
| (0.18) |
| 16.19 |
| 2.21 |
| 1,771,391 |
| 50 |
|
| 0.17 |
| 0.17 |
| 1.27 |
|
|
|
|
|
|
|
|
|
|
|
|
|
|
|
|
|
|
|
|
|
|
|
|
|
|
|
|
|
|
|
Class I |
|
|
|
|
|
|
|
|
|
|
|
|
|
|
|
|
|
|
|
|
| ||||||||
12/31/18 |
| 17.08 |
| 0.22 |
| (1.35) |
| (1.13) |
|
| — |
| — |
| 15.95 |
| (6.62) |
| 505 |
| 30 |
|
| 0.16 |
| 0.16 |
| 1.31 |
|
12/31/17 | ‡‡ | 16.48 |
| (0.01) |
| 0.61 |
| 0.60 |
|
| — |
| — |
| 17.08 |
| 3.64 |
| 114 |
| 188 | (o) |
| 0.17 |
| 0.17 |
| (0.17) |
|
| |||||||||||||||||||||||||||||
JNL Institutional Alt 50 Fund(n) |
|
|
|
|
|
|
|
|
|
|
|
|
|
| |||||||||||||||
Class A |
|
|
|
|
|
|
|
|
|
|
|
|
|
|
|
|
|
|
|
|
| ||||||||
12/31/18 |
| 17.12 |
| 0.09 |
| (1.15) |
| (1.06) |
|
| — |
| — |
| 16.06 |
| (6.19) |
| 2,282,504 |
| 33 |
|
| 0.46 |
| 0.46 |
| 0.54 |
|
12/31/17 |
| 15.49 |
| 0.16 |
| 1.47 |
| 1.63 |
|
| — |
| — |
| 17.12 |
| 10.52 |
| 2,892,228 |
| 153 | (o) |
| 0.26 |
| 0.26 |
| 0.95 |
|
12/31/16 |
| 14.88 |
| 0.20 |
| 0.41 |
| 0.61 |
|
| — |
| — |
| 15.49 |
| 4.10 |
| 2,570,726 |
| 22 |
|
| 0.16 |
| 0.16 |
| 1.33 |
|
12/31/15 |
| 16.65 |
| 0.40 |
| (0.73) |
| (0.33) |
|
| (0.40) |
| (1.04) |
| 14.88 |
| (2.05) |
| 2,860,651 |
| 25 |
|
| 0.16 |
| 0.16 |
| 2.43 |
|
12/31/14 |
| 16.79 |
| 0.21 |
| 0.11 |
| 0.32 |
|
| (0.26) |
| (0.20) |
| 16.65 |
| 1.86 |
| 3,292,344 |
| 45 |
|
| 0.16 |
| 0.16 |
| 1.21 |
|
|
|
|
|
|
|
|
|
|
|
|
|
|
|
|
|
|
|
|
|
|
|
|
|
|
|
|
|
|
|
Class I |
|
|
|
|
|
|
|
|
|
|
|
|
|
|
|
|
|
|
|
|
| ||||||||
12/31/18 |
| 17.15 |
| 0.25 |
| (1.27) |
| (1.02) |
|
| — |
| — |
| 16.13 |
| (5.95) |
| 1,024 |
| 33 |
|
| 0.16 |
| 0.16 |
| 1.46 |
|
12/31/17 | ‡‡ | 16.63 |
| (0.01) |
| 0.53 |
| 0.52 |
|
| — |
| — |
| 17.15 |
| 3.13 |
| 115 |
| 153 | (o) |
| 0.17 |
| 0.17 |
| (0.17) |
|
| |||||||||||||||||||||||||||||
JNL/American Funds Moderate Growth Allocation Fund(g) |
|
|
|
|
|
|
|
|
|
|
|
|
|
| |||||||||||||||
Class A |
|
|
|
|
|
|
|
|
|
|
|
|
|
|
|
|
|
|
|
|
| ||||||||
12/31/18 |
| 14.89 |
| 0.23 |
| (0.91) |
| (0.68) |
|
| — |
| — |
| 14.21 |
| (4.57) |
| 2,131,575 |
| 25 |
|
| 0.64 |
| 0.64 |
| 1.55 |
|
12/31/17 |
| 12.87 |
| 0.12 |
| 1.90 |
| 2.02 |
|
| — |
| — |
| 14.89 |
| 15.70 |
| 2,218,378 |
| 57 |
|
| 0.64 |
| 0.64 |
| 0.85 |
|
12/31/16 |
| 11.99 |
| 0.19 |
| 0.69 |
| 0.88 |
|
| — |
| — |
| 12.87 |
| 7.34 |
| 1,708,441 |
| 15 |
|
| 0.65 |
| 0.65 |
| 1.54 |
|
12/31/15 |
| 12.33 |
| 0.18 |
| (0.20) |
| (0.02) |
|
| (0.13) |
| (0.19) |
| 11.99 |
| (0.15) |
| 1,184,420 |
| 2 |
|
| 0.65 |
| 0.67 |
| 1.40 |
|
12/31/14 |
| 11.94 |
| 0.24 |
| 0.27 |
| 0.51 |
|
| (0.10) |
| (0.02) |
| 12.33 |
| 4.26 |
| 790,122 |
| 1 |
|
| 0.65 |
| 0.70 |
| 1.96 |
|
|
|
|
|
|
|
|
|
|
|
|
|
|
|
|
|
|
|
|
|
|
|
|
|
|
|
|
|
|
|
Class I |
|
|
|
|
|
|
|
|
|
|
|
|
|
|
|
|
|
|
|
|
| ||||||||
12/31/18 |
| 14.91 |
| 0.39 |
| (1.03) |
| (0.64) |
|
| — |
| — |
| 14.27 |
| (4.29) |
| 7,932 |
| 25 |
|
| 0.34 |
| 0.34 |
| 2.57 |
|
12/31/17 | ‡‡ | 14.41 |
| 0.24 |
| 0.26 |
| 0.50 |
|
| — |
| — |
| 14.91 |
| 3.47 |
| 568 |
| 57 |
|
| 0.35 |
| 0.35 |
| 6.09 |
|
| |||||||||||||||||||||||||||||
JNL/American Funds Growth Allocation Fund(g) |
|
|
|
|
|
|
|
|
|
|
|
|
|
| |||||||||||||||
Class A |
|
|
|
|
|
|
|
|
|
|
|
|
|
|
|
|
|
|
|
|
| ||||||||
12/31/18 |
| 16.33 |
| 0.20 |
| (1.08) |
| (0.88) |
|
| — |
| — |
| 15.45 |
| (5.39) |
| 2,277,300 |
| 14 |
|
| 0.64 |
| 0.64 |
| 1.19 |
|
12/31/17 |
| 13.54 |
| 0.12 |
| 2.67 |
| 2.79 |
|
| — |
| — |
| 16.33 |
| 20.61 |
| 2,090,329 |
| 55 |
|
| 0.64 |
| 0.64 |
| 0.79 |
|
12/31/16 |
| 12.60 |
| 0.16 |
| 0.78 |
| 0.94 |
|
| — |
| — |
| 13.54 |
| 7.46 |
| 1,359,847 |
| 19 |
|
| 0.65 |
| 0.65 |
| 1.23 |
|
12/31/15 |
| 12.95 |
| 0.14 |
| (0.09) |
| 0.05 |
|
| (0.12) |
| (0.28) |
| 12.60 |
| 0.37 |
| 984,397 |
| 2 |
|
| 0.65 |
| 0.67 |
| 1.08 |
|
12/31/14 |
| 12.56 |
| 0.22 |
| 0.29 |
| 0.51 |
|
| (0.08) |
| (0.04) |
| 12.95 |
| 4.07 |
| 670,434 |
| 2 |
|
| 0.65 |
| 0.70 |
| 1.68 |
|
|
|
|
|
|
|
|
|
|
|
|
|
|
|
|
|
|
|
|
|
|
|
|
|
|
|
|
|
|
|
Class I |
|
|
|
|
|
|
|
|
|
|
|
|
|
|
|
|
|
|
|
|
| ||||||||
12/31/18 |
| 16.35 |
| 0.40 |
| (1.23) |
| (0.83) |
|
| — |
| — |
| 15.52 |
| (5.08) |
| 9,327 |
| 14 |
|
| 0.34 |
| 0.34 |
| 2.44 |
|
12/31/17 | ‡‡ | 15.63 |
| 0.22 |
| 0.50 |
| 0.72 |
|
| — |
| — |
| 16.35 |
| 4.61 |
| 268 |
| 55 |
|
| 0.35 |
| 0.35 |
| 5.07 |
|
| |||||||||||||||||||||||||||||
JNL/DFA Growth Allocation Fund(g) |
|
|
|
|
|
|
|
|
|
|
|
|
|
| |||||||||||||||
Class A |
|
|
|
|
|
|
|
|
|
|
|
|
|
|
|
|
|
|
|
|
| ||||||||
12/31/18 |
| 10.88 |
| 0.20 |
| (1.36) |
| (1.16) |
|
| — |
| — |
| 9.72 |
| (10.65) |
| 156,272 |
| 11 |
|
| 0.60 |
| 0.65 |
| 1.91 |
|
12/31/17 | * | 10.00 |
| 0.20 |
| 1.03 |
| 1.23 |
|
| (0.34) |
| (0.01) |
| 10.88 |
| 12.23 |
| 80,204 |
| 3 |
|
| 0.60 |
| 0.65 |
| 2.72 |
|
|
|
|
|
|
|
|
|
|
|
|
|
|
|
|
|
|
|
|
|
|
|
|
|
|
|
|
|
|
|
Class I |
|
|
|
|
|
|
|
|
|
|
|
|
|
|
|
|
|
|
|
|
| ||||||||
12/31/18 |
| 10.88 |
| 0.31 |
| (1.44) |
| (1.13) |
|
| — |
| — |
| 9.75 |
| (10.37) |
| 2,738 |
| 11 |
|
| 0.25 |
| 0.35 |
| 2.93 |
|
12/31/17 | *‡‡ | 10.69 |
| 0.09 |
| 0.45 |
| 0.54 |
|
| (0.34) |
| (0.01) |
| 10.88 |
| 5.07 |
| 77 |
| 3 |
|
| 0.25 |
| 0.35 |
| 3.18 |
|
| |||||||||||||||||||||||||||||
JNL/DFA Moderate Growth Allocation Fund(g) |
|
|
|
|
|
|
|
|
|
|
|
|
|
| |||||||||||||||
Class A |
|
|
|
|
|
|
|
|
|
|
|
|
|
|
|
|
|
|
|
|
| ||||||||
12/31/18 |
| 10.71 |
| 0.22 |
| (1.07) |
| (0.85) |
|
| — |
| — |
| 9.86 |
| (7.93) |
| 123,206 |
| 10 |
|
| 0.60 |
| 0.65 |
| 2.10 |
|
12/31/17 | * | 10.00 |
| 0.20 |
| 0.78 |
| 0.98 |
|
| (0.26) |
| (0.01) |
| 10.71 |
| 9.79 |
| 63,960 |
| 5 |
|
| 0.61 |
| 0.65 |
| 2.68 |
|
|
|
|
|
|
|
|
|
|
|
|
|
|
|
|
|
|
|
|
|
|
|
|
|
|
|
|
|
|
|
Class I |
|
|
|
|
|
|
|
|
|
|
|
|
|
|
|
|
|
|
|
|
| ||||||||
12/31/18 |
| 10.72 |
| 0.32 |
| (1.13) |
| (0.81) |
|
| — |
| — |
| 9.91 |
| (7.55) |
| 3,759 |
| 10 |
|
| 0.25 |
| 0.35 |
| 3.08 |
|
12/31/17 | *‡‡ | 10.57 |
| 0.12 |
| 0.31 |
| 0.43 |
|
| (0.27) |
| (0.01) |
| 10.72 |
| 4.03 |
| 174 |
| 5 |
|
| 0.26 |
| 0.35 |
| 4.28 |
|
| |||||||||||||||||||||||||||||
See accompanying Notes to Financial Statements.
69
JNL Series Trust Master Feeder Funds and Funds of Funds
Financial Highlights
For a Share Outstanding
|
|
| Increase (decrease) from |
| Distributions from |
|
|
|
| Supplemental data |
|
|
| Ratios(a)(b) |
|
| |||||||||||||
Period ended | Net asset value, beginning of period($) | Net investment income (loss)($)(c) | Net realized & unrealized gains (losses)($) | Total from investment operations($) |
| Net investment income($) | Net realized gains on investment transactions($) | Net asset value, end of period($) | Total return(%)(d) | Net assets,end of period (in thousands)($) | Portfolio turnover (%)(e) |
| Net expenses to average net assets(%)(f) | Total expenses to average net assets(%)(f) | Net investment income (loss) to average net assets(%) | ||||||||||||||
JNL Moderate Growth Allocation Fund(n) |
|
|
|
|
|
|
|
|
|
|
|
|
|
| |||||||||||||||
Class A |
|
|
|
|
|
|
|
|
|
|
|
|
|
|
|
|
|
|
|
|
| ||||||||
12/31/18 |
| 13.71 |
| 0.11 |
| (1.02) |
| (0.91) |
|
| — |
| — |
| 12.80 |
| (6.64) |
| 2,159,584 |
| 29 |
|
| 0.44 |
| 0.44 |
| 0.79 |
|
12/31/17 |
| 11.97 |
| 0.09 |
| 1.65 |
| 1.74 |
|
| — |
| — |
| 13.71 |
| 14.54 |
| 2,483,124 |
| 168 | (o) |
| 0.26 |
| 0.26 |
| 0.66 |
|
12/31/16 |
| 11.16 |
| 0.08 |
| 0.73 |
| 0.81 |
|
| — |
| — |
| 11.97 |
| 7.26 |
| 1,417,843 |
| 44 |
|
| 0.15 |
| 0.15 |
| 0.67 |
|
12/31/15 |
| 11.93 |
| 0.21 |
| (0.42) |
| (0.21) |
|
| (0.29) |
| (0.27) |
| 11.16 |
| (1.81) |
| 1,312,128 |
| 57 |
|
| 0.15 |
| 0.15 |
| 1.78 |
|
12/31/14 |
| 12.08 |
| 0.18 |
| 0.48 |
| 0.66 |
|
| (0.27) |
| (0.54) |
| 11.93 |
| 5.35 |
| 1,279,991 |
| 18 |
|
| 0.15 |
| 0.15 |
| 1.43 |
|
|
|
|
|
|
|
|
|
|
|
|
|
|
|
|
|
|
|
|
|
|
|
|
|
|
|
|
|
|
|
Class I |
|
|
|
|
|
|
|
|
|
|
|
|
|
|
|
|
|
|
|
|
| ||||||||
12/31/18 |
| 13.72 |
| 0.25 |
| (1.12) |
| (0.87) |
|
| — |
| — |
| 12.85 |
| (6.34) |
| 1,895 |
| 29 |
|
| 0.14 |
| 0.14 |
| 1.88 |
|
12/31/17 | ‡‡ | 13.28 |
| 0.00 |
| 0.44 |
| 0.44 |
|
| — |
| — |
| 13.72 |
| 3.31 |
| 1 |
| 168 | (o) |
| — |
| — |
| 0.00 |
|
| |||||||||||||||||||||||||||||
JNL Growth Allocation Fund(n) |
|
|
|
|
|
|
|
|
|
|
|
|
|
| |||||||||||||||
Class A |
|
|
|
|
|
|
|
|
|
|
|
|
|
|
|
|
|
|
|
|
| ||||||||
12/31/18 |
| 13.56 |
| 0.07 |
| (1.30) |
| (1.23) |
|
| — |
| — |
| 12.33 |
| (9.07) |
| 2,147,880 |
| 34 |
|
| 0.44 |
| 0.44 |
| 0.51 |
|
12/31/17 |
| 11.43 |
| 0.08 |
| 2.05 |
| 2.13 |
|
| — |
| — |
| 13.56 |
| 18.64 |
| 2,511,790 |
| 156 | (o) |
| 0.24 |
| 0.24 |
| 0.64 |
|
12/31/16 |
| 10.63 |
| 0.07 |
| 0.73 |
| 0.80 |
|
| — |
| — |
| 11.43 |
| 7.53 |
| 1,844,865 |
| 41 |
|
| 0.15 |
| 0.15 |
| 0.63 |
|
12/31/15 |
| 11.51 |
| 0.18 |
| (0.40) |
| (0.22) |
|
| (0.28) |
| (0.38) |
| 10.63 |
| (2.00) |
| 1,704,657 |
| 57 |
|
| 0.15 |
| 0.15 |
| 1.53 |
|
12/31/14 |
| 11.63 |
| 0.16 |
| 0.43 |
| 0.59 |
|
| (0.21) |
| (0.50) |
| 11.51 |
| 5.06 |
| 1,566,607 |
| 20 |
|
| 0.15 |
| 0.15 |
| 1.33 |
|
|
|
|
|
|
|
|
|
|
|
|
|
|
|
|
|
|
|
|
|
|
|
|
|
|
|
|
|
|
|
Class I |
|
|
|
|
|
|
|
|
|
|
|
|
|
|
|
|
|
|
|
|
| ||||||||
12/31/18 |
| 13.58 |
| 0.19 |
| (1.39) |
| (1.20) |
|
| — |
| — |
| 12.38 |
| (8.84) |
| 5,905 |
| 34 |
|
| 0.14 |
| 0.14 |
| 1.38 |
|
12/31/17 | ‡‡ | 13.02 |
| (0.01) |
| 0.57 |
| 0.56 |
|
| — |
| — |
| 13.58 |
| 4.30 |
| 622 |
| 156 | (o) |
| 0.15 |
| 0.15 |
| (0.15) |
|
| |||||||||||||||||||||||||||||
JNL Aggressive Growth Allocation Fund(n) |
|
|
|
|
|
|
|
|
|
|
|
|
|
| |||||||||||||||
Class A |
|
|
|
|
|
|
|
|
|
|
|
|
|
|
|
|
|
|
|
|
| ||||||||
12/31/18 |
| 12.99 |
| 0.05 |
| (1.41) |
| (1.36) |
|
| — |
| — |
| 11.63 |
| (10.47) |
| 1,332,619 |
| 40 |
|
| 0.45 |
| 0.45 |
| 0.41 |
|
12/31/17 |
| 10.70 |
| 0.05 |
| 2.24 |
| 2.29 |
|
| — |
| — |
| 12.99 |
| 21.40 |
| 1,525,405 |
| 172 | (o) |
| 0.26 |
| 0.26 |
| 0.45 |
|
12/31/16 |
| 9.90 |
| 0.06 |
| 0.74 |
| 0.80 |
|
| — |
| — |
| 10.70 |
| 8.08 |
| 884,110 |
| 38 |
|
| 0.16 |
| 0.16 |
| 0.56 |
|
12/31/15 |
| 10.89 |
| 0.15 |
| (0.43) |
| (0.28) |
|
| (0.26) |
| (0.45) |
| 9.90 |
| (2.63) |
| 761,368 |
| 58 |
|
| 0.17 |
| 0.17 |
| 1.36 |
|
12/31/14 |
| 10.88 |
| 0.14 |
| 0.40 |
| 0.54 |
|
| (0.17) |
| (0.36) |
| 10.89 |
| 4.98 |
| 697,755 |
| 23 |
|
| 0.17 |
| 0.17 |
| 1.22 |
|
|
|
|
|
|
|
|
|
|
|
|
|
|
|
|
|
|
|
|
|
|
|
|
|
|
|
|
|
|
|
Class I |
|
|
|
|
|
|
|
|
|
|
|
|
|
|
|
|
|
|
|
|
| ||||||||
12/31/18 |
| 13.00 |
| 0.13 |
| (1.45) |
| (1.32) |
|
| — |
| — |
| 11.68 |
| (10.15) |
| 3,943 |
| 40 |
|
| 0.15 |
| 0.15 |
| 1.05 |
|
12/31/17 | ‡‡ | 12.40 |
| (0.01) |
| 0.61 |
| 0.60 |
|
| — |
| — |
| 13.00 |
| 4.84 |
| 266 |
| 172 | (o) |
| 0.15 |
| 0.15 |
| (0.15) |
|
| |||||||||||||||||||||||||||||
JNL/Franklin Templeton Founding Strategy Fund(n) |
|
|
|
|
|
|
|
|
|
|
|
|
|
| |||||||||||||||
Class A |
|
|
|
|
|
|
|
|
|
|
|
|
|
|
|
|
|
|
|
|
| ||||||||
12/31/18 |
| 13.97 |
| 0.34 |
| (1.66) |
| (1.32) |
|
| — |
| — |
| 12.65 |
| (9.45) |
| 1,175,318 |
| 5 |
|
| 0.35 |
| 0.35 |
| 2.45 |
|
12/31/17 |
| 12.50 |
| 0.35 |
| 1.12 |
| 1.47 |
|
| — |
| — |
| 13.97 |
| 11.76 |
| 1,480,293 |
| 104 | (o) |
| 0.14 |
| 0.14 |
| 2.65 |
|
12/31/16 |
| 11.02 |
| 0.34 |
| 1.14 |
| 1.48 |
|
| — |
| — |
| 12.50 |
| 13.43 |
| 1,454,361 |
| 8 |
|
| 0.05 |
| 0.05 |
| 2.99 |
|
12/31/15 |
| 11.97 |
| 0.37 |
| (1.11) |
| (0.74) |
|
| (0.19) |
| (0.02) |
| 11.02 |
| (6.19) |
| 1,426,476 |
| 6 |
|
| 0.05 |
| 0.05 |
| 3.12 |
|
12/31/14 |
| 11.85 |
| 0.18 |
| 0.14 |
| 0.32 |
|
| (0.20) |
| — |
| 11.97 |
| 2.67 |
| 1,655,658 |
| 4 |
|
| 0.05 |
| 0.05 |
| 1.49 |
|
|
|
|
|
|
|
|
|
|
|
|
|
|
|
|
|
|
|
|
|
|
|
|
|
|
|
|
|
|
|
Class I |
|
|
|
|
|
|
|
|
|
|
|
|
|
|
|
|
|
|
|
|
| ||||||||
12/31/18 |
| 13.98 |
| 0.82 |
| (2.10) |
| (1.28) |
|
| — |
| — |
| 12.70 |
| (9.16) |
| 1,030 |
| 5 |
|
| 0.05 |
| 0.05 |
| 5.95 |
|
12/31/17 | ‡‡ | 13.62 |
| 0.00 |
| 0.36 |
| 0.36 |
|
| — |
| — |
| 13.98 |
| 2.64 |
| 6 |
| 104 | (o) |
| 0.04 |
| 0.04 |
| (0.04) |
|
| |||||||||||||||||||||||||||||
JNL/Mellon Capital 10 x 10 Fund(n) |
|
|
|
|
|
|
|
|
|
|
|
|
|
| |||||||||||||||
Class A |
|
|
|
|
|
|
|
|
|
|
|
|
|
|
|
|
|
|
|
|
| ||||||||
12/31/18 |
| 13.83 |
| 0.25 |
| (1.47) |
| (1.22) |
|
| — |
| — |
| 12.61 |
| (8.82) |
| 406,208 |
| 7 |
|
| 0.35 |
| 0.35 |
| 1.81 |
|
12/31/17 |
| 11.90 |
| 0.22 |
| 1.71 |
| 1.93 |
|
| — |
| — |
| 13.83 |
| 16.22 |
| 497,782 |
| 111 | (o) |
| 0.14 |
| 0.14 |
| 1.70 |
|
12/31/16 |
| 10.62 |
| 0.15 |
| 1.13 |
| 1.28 |
|
| — |
| — |
| 11.90 |
| 12.05 |
| 435,310 |
| 12 |
|
| 0.05 |
| 0.05 |
| 1.40 |
|
12/31/15 |
| 11.39 |
| 0.22 |
| (0.48) |
| (0.26) |
|
| (0.23) |
| (0.28) |
| 10.62 |
| (2.26) |
| 409,603 |
| 9 |
|
| 0.05 |
| 0.05 |
| 1.93 |
|
12/31/14 |
| 11.07 |
| 0.23 |
| 0.68 |
| 0.91 |
|
| (0.20) |
| (0.39) |
| 11.39 |
| 8.26 |
| 436,823 |
| 7 |
|
| 0.05 |
| 0.05 |
| 1.99 |
|
|
|
|
|
|
|
|
|
|
|
|
|
|
|
|
|
|
|
|
|
|
|
|
|
|
|
|
|
|
|
Class I |
|
|
|
|
|
|
|
|
|
|
|
|
|
|
|
|
|
|
|
|
| ||||||||
12/31/18 |
| 13.84 |
| 0.15 |
| (1.32) |
| (1.17) |
|
| — |
| — |
| 12.67 |
| (8.45) |
| 10 |
| 7 |
|
| 0.01 |
| 0.01 |
| 1.12 |
|
12/31/17 | ‡‡ | 13.03 |
| 0.00 |
| 0.81 |
| 0.81 |
|
| — |
| — |
| 13.84 |
| 6.22 |
| 1 |
| 111 | (o) |
| — |
| — |
| 0.00 |
|
| |||||||||||||||||||||||||||||
JNL/Mellon Capital Index 5 Fund(n) |
|
|
|
|
|
|
|
|
|
|
|
|
|
| |||||||||||||||
Class A |
|
|
|
|
|
|
|
|
|
|
|
|
|
|
|
|
|
|
|
|
| ||||||||
12/31/18 |
| 14.62 |
| 0.22 |
| (1.36) |
| (1.14) |
|
| — |
| — |
| 13.48 |
| (7.80) |
| 857,993 |
| 9 |
|
| 0.35 |
| 0.35 |
| 1.52 |
|
12/31/17 |
| 12.68 |
| 0.20 |
| 1.74 |
| 1.94 |
|
| — |
| — |
| 14.62 |
| 15.30 |
| 1,025,322 |
| 109 | (o) |
| 0.14 |
| 0.14 |
| 1.47 |
|
12/31/16 |
| 11.33 |
| 0.04 |
| 1.31 |
| 1.35 |
|
| — |
| — |
| 12.68 |
| 11.92 |
| 846,638 |
| 6 |
|
| 0.05 |
| 0.05 |
| 0.31 |
|
12/31/15 |
| 12.16 |
| 0.17 |
| (0.34) |
| (0.17) |
|
| (0.22) |
| (0.44) |
| 11.33 |
| (1.47) |
| 757,495 |
| 5 |
|
| 0.05 |
| 0.05 |
| 1.35 |
|
12/31/14 |
| 12.20 |
| 0.22 |
| 0.43 |
| 0.65 |
|
| (0.18) |
| (0.51) |
| 12.16 |
| 5.30 |
| 751,361 |
| 7 |
|
| 0.05 |
| 0.05 |
| 1.79 |
|
|
|
|
|
|
|
|
|
|
|
|
|
|
|
|
|
|
|
|
|
|
|
|
|
|
|
|
|
|
|
Class I |
|
|
|
|
|
|
|
|
|
|
|
|
|
|
|
|
|
|
|
|
| ||||||||
12/31/18 |
| 14.63 |
| 0.74 |
| (1.83) |
| (1.09) |
|
| — |
| — |
| 13.54 |
| (7.45) |
| 883 |
| 9 |
|
| 0.05 |
| 0.05 |
| 5.15 |
|
12/31/17 | ‡‡ | 13.88 |
| 0.00 |
| 0.75 |
| 0.75 |
|
| — |
| — |
| 14.63 |
| 5.40 |
| 1 |
| 109 | (o) |
| — |
| — |
| 0.00 |
|
| |||||||||||||||||||||||||||||
See accompanying Notes to Financial Statements.
70
JNL Series Trust Master Feeder Funds and Funds of Funds
Financial Highlights
For a Share Outstanding
|
|
| Increase (decrease) from |
| Distributions from |
|
|
|
| Supplemental data |
|
|
| Ratios(a)(b) |
|
| |||||||||||||
Period ended | Net asset value, beginning of period($) | Net investment income (loss)($)(c) | Net realized & unrealized gains (losses)($) | Total from investment operations($) |
| Net investment income($) | Net realized gains on investment transactions($) | Net asset value, end of period($) | Total return(%)(d) | Net assets,end of period (in thousands)($) | Portfolio turnover (%)(e) |
| Net expenses to average net assets(%)(f) | Total expenses to average net assets(%)(f) | Net investment income (loss) to average net assets(%) | ||||||||||||||
JNL/S&P 4 Fund(n) |
|
|
|
|
|
|
|
|
|
|
|
|
|
| |||||||||||||||
Class A |
|
|
|
|
|
|
|
|
|
|
|
|
|
|
|
|
|
|
|
|
| ||||||||
12/31/18 |
| 20.41 |
| 0.37 |
| (1.65) |
| (1.28) |
|
| — |
| — |
| 19.13 |
| (6.27) |
| 5,878,323 |
| 7 |
|
| 0.35 |
| 0.35 |
| 1.76 |
|
12/31/17 |
| 17.69 |
| 0.37 |
| 2.35 |
| 2.72 |
|
| — |
| — |
| 20.41 |
| 15.38 |
| 7,125,698 |
| 102 | (o) |
| 0.13 |
| 0.13 |
| 2.02 |
|
12/31/16 |
| 16.04 |
| 0.32 |
| 1.33 |
| 1.65 |
|
| — |
| — |
| 17.69 |
| 10.29 |
| 7,122,476 |
| 7 |
|
| 0.05 |
| 0.05 |
| 1.91 |
|
12/31/15 |
| 18.47 |
| 0.28 |
| (1.19) |
| (0.91) |
|
| (0.85) |
| (0.67) |
| 16.04 |
| (5.04) |
| 6,370,591 |
| 3 |
|
| 0.05 |
| 0.05 |
| 1.56 |
|
12/31/14 |
| 16.76 |
| 0.15 |
| 2.26 |
| 2.41 |
|
| (0.36) |
| (0.34) |
| 18.47 |
| 14.40 |
| 4,983,650 |
| 4 |
|
| 0.05 |
| 0.05 |
| 0.84 |
|
|
|
|
|
|
|
|
|
|
|
|
|
|
|
|
|
|
|
|
|
|
|
|
|
|
|
|
|
|
|
Class I |
|
|
|
|
|
|
|
|
|
|
|
|
|
|
|
|
|
|
|
|
| ||||||||
12/31/18 |
| 20.42 |
| 0.71 |
| (1.93) |
| (1.22) |
|
| — |
| — |
| 19.20 |
| (5.97) |
| 5,654 |
| 7 |
|
| 0.05 |
| 0.05 |
| 3.37 |
|
12/31/17 | ‡‡ | 18.63 |
| 0.00 |
| 1.79 |
| 1.79 |
|
| — |
| — |
| 20.42 |
| 9.61 |
| 826 |
| 102 | (o) |
| 0.06 |
| 0.06 |
| (0.06) |
|
| |||||||||||||||||||||||||||||
JNL/S&P Managed Conservative Fund(n) |
|
|
|
|
|
|
|
|
|
|
|
|
|
| |||||||||||||||
Class A |
|
|
|
|
|
|
|
|
|
|
|
|
|
|
|
|
|
|
|
|
| ||||||||
12/31/18 |
| 13.42 |
| 0.19 |
| (0.50) |
| (0.31) |
|
| — |
| — |
| 13.11 |
| (2.31) |
| 1,221,090 |
| 12 |
|
| 0.45 |
| 0.45 |
| 1.44 |
|
12/31/17 |
| 12.56 |
| 0.16 |
| 0.70 |
| 0.86 |
|
| — |
| — |
| 13.42 |
| 6.85 |
| 1,481,929 |
| 109 | (o) |
| 0.23 |
| 0.23 |
| 1.20 |
|
12/31/16 |
| 11.96 |
| 0.15 |
| 0.45 |
| 0.60 |
|
| — |
| — |
| 12.56 |
| 5.02 |
| 1,586,568 |
| 16 |
|
| 0.15 |
| 0.15 |
| 1.19 |
|
12/31/15 |
| 12.15 |
| 0.25 |
| (0.44) |
| (0.19) |
|
| — |
| — |
| 11.96 |
| (1.56) |
| 1,535,310 |
| 14 |
|
| 0.15 |
| 0.15 |
| 2.03 |
|
12/31/14 |
| 11.95 |
| 0.20 |
| 0.18 |
| 0.38 |
|
| (0.04) |
| (0.14) |
| 12.15 |
| 3.12 |
| 1,660,356 |
| 17 |
|
| 0.15 |
| 0.15 |
| 1.66 |
|
|
|
|
|
|
|
|
|
|
|
|
|
|
|
|
|
|
|
|
|
|
|
|
|
|
|
|
|
|
|
Class I |
|
|
|
|
|
|
|
|
|
|
|
|
|
|
|
|
|
|
|
|
| ||||||||
12/31/18 |
| 13.44 |
| 0.53 |
| (0.84) |
| (0.31) |
|
| — |
| — |
| 13.13 |
| (2.31) |
| 565 |
| 12 |
|
| 0.15 |
| 0.15 |
| 4.00 |
|
12/31/17 | ‡‡ | 13.26 |
| 0.00 |
| 0.18 |
| 0.18 |
|
| — |
| — |
| 13.44 |
| 1.36 |
| 1 |
| 109 | (o) |
| — |
| — |
| 0.00 |
|
| |||||||||||||||||||||||||||||
JNL/S&P Managed Moderate Fund(n) |
|
|
|
|
|
|
|
|
|
|
|
|
|
| |||||||||||||||
Class A |
|
|
|
|
|
|
|
|
|
|
|
|
|
|
|
|
|
|
|
|
| ||||||||
12/31/18 |
| 15.43 |
| 0.18 |
| (0.71) |
| (0.53) |
|
| — |
| — |
| 14.90 |
| (3.43) |
| 2,858,779 |
| 9 |
|
| 0.44 |
| 0.44 |
| 1.15 |
|
12/31/17 |
| 13.88 |
| 0.14 |
| 1.41 |
| 1.55 |
|
| — |
| — |
| 15.43 |
| 11.17 |
| 3,315,407 |
| 108 | (o) |
| 0.22 |
| 0.22 |
| 0.96 |
|
12/31/16 |
| 13.15 |
| 0.13 |
| 0.60 |
| 0.73 |
|
| — |
| — |
| 13.88 |
| 5.55 |
| 3,276,357 |
| 9 |
|
| 0.14 |
| 0.14 |
| 0.97 |
|
12/31/15 |
| 13.30 |
| 0.24 |
| (0.39) |
| (0.15) |
|
| — |
| — |
| 13.15 |
| (1.13) |
| 3,256,103 |
| 11 |
|
| 0.14 |
| 0.14 |
| 1.80 |
|
12/31/14 |
| 12.99 |
| 0.18 |
| 0.34 |
| 0.52 |
|
| (0.03) |
| (0.18) |
| 13.30 |
| 3.98 |
| 3,449,330 |
| 16 |
|
| 0.14 |
| 0.14 |
| 1.36 |
|
|
|
|
|
|
|
|
|
|
|
|
|
|
|
|
|
|
|
|
|
|
|
|
|
|
|
|
|
|
|
Class I |
|
|
|
|
|
|
|
|
|
|
|
|
|
|
|
|
|
|
|
|
| ||||||||
12/31/18 |
| 15.44 |
| 0.27 |
| (0.76) |
| (0.49) |
|
| — |
| — |
| 14.95 |
| (3.17) |
| 2,458 |
| 9 |
|
| 0.14 |
| 0.14 |
| 1.77 |
|
12/31/17 | ‡‡ | 15.06 |
| (0.01) |
| 0.39 |
| 0.38 |
|
| — |
| — |
| 15.44 |
| 2.52 |
| 113 |
| 108 | (o) |
| 0.14 |
| 0.14 |
| (0.14) |
|
| |||||||||||||||||||||||||||||
JNL/S&P Managed Moderate Growth Fund(n) |
|
|
|
|
|
|
|
|
|
|
|
|
|
| |||||||||||||||
Class A |
|
|
|
|
|
|
|
|
|
|
|
|
|
|
|
|
|
|
|
|
| ||||||||
12/31/18 |
| 17.54 |
| 0.15 |
| (1.01) |
| (0.86) |
|
| — |
| — |
| 16.68 |
| (4.90) |
| 5,467,006 |
| 10 |
|
| 0.43 |
| 0.43 |
| 0.86 |
|
12/31/17 |
| 15.12 |
| 0.13 |
| 2.29 |
| 2.42 |
|
| — |
| — |
| 17.54 |
| 16.01 |
| 6,379,304 |
| 108 | (o) |
| 0.22 |
| 0.22 |
| 0.78 |
|
12/31/16 |
| 14.31 |
| 0.11 |
| 0.70 |
| 0.81 |
|
| — |
| — |
| 15.12 |
| 5.66 |
| 6,050,202 |
| 13 |
|
| 0.14 |
| 0.14 |
| 0.73 |
|
12/31/15 |
| 14.43 |
| 0.21 |
| (0.33) |
| (0.12) |
|
| — |
| — |
| 14.31 |
| (0.83) |
| 6,066,472 |
| 13 |
|
| 0.14 |
| 0.14 |
| 1.41 |
|
12/31/14 |
| 14.07 |
| 0.17 |
| 0.46 |
| 0.63 |
|
| (0.03) |
| (0.24) |
| 14.43 |
| 4.51 |
| 6,362,485 |
| 12 |
|
| 0.14 |
| 0.14 |
| 1.18 |
|
|
|
|
|
|
|
|
|
|
|
|
|
|
|
|
|
|
|
|
|
|
|
|
|
|
|
|
|
|
|
Class I |
|
|
|
|
|
|
|
|
|
|
|
|
|
|
|
|
|
|
|
|
| ||||||||
12/31/18 |
| 17.56 |
| 0.35 |
| (1.17) |
| (0.82) |
|
| — |
| — |
| 16.74 |
| (4.67) |
| 7,485 |
| 10 |
|
| 0.13 |
| 0.13 |
| 1.95 |
|
12/31/17 | ‡‡ | 16.90 |
| (0.01) |
| 0.67 |
| 0.66 |
|
| — |
| — |
| 17.56 |
| 3.91 |
| 846 |
| 108 | (o) |
| 0.14 |
| 0.14 |
| (0.14) |
|
| |||||||||||||||||||||||||||||
JNL/S&P Managed Growth Fund(n) |
|
|
|
|
|
|
|
|
|
|
|
|
|
| |||||||||||||||
Class A |
|
|
|
|
|
|
|
|
|
|
|
|
|
|
|
|
|
|
|
|
| ||||||||
12/31/18 |
| 18.86 |
| 0.12 |
| (1.24) |
| (1.12) |
|
| — |
| — |
| 17.74 |
| (5.94) |
| 4,919,498 |
| 13 |
|
| 0.43 |
| 0.43 |
| 0.62 |
|
12/31/17 |
| 15.58 |
| 0.11 |
| 3.17 |
| 3.28 |
|
| — |
| — |
| 18.86 |
| 21.05 |
| 5,682,182 |
| 111 | (o) |
| 0.22 |
| 0.22 |
| 0.64 |
|
12/31/16 |
| 14.71 |
| 0.09 |
| 0.78 |
| 0.87 |
|
| — |
| — |
| 15.58 |
| 5.91 |
| 5,049,708 |
| 15 |
|
| 0.14 |
| 0.14 |
| 0.63 |
|
12/31/15 |
| 14.74 |
| 0.11 |
| (0.14) |
| (0.03) |
|
| — |
| — |
| 14.71 |
| (0.20) |
| 4,958,666 |
| 11 |
|
| 0.14 |
| 0.14 |
| 0.77 |
|
12/31/14 |
| 14.33 |
| 0.11 |
| 0.70 |
| 0.81 |
|
| (0.08) |
| (0.32) |
| 14.74 |
| 5.63 |
| 4,980,868 |
| 11 |
|
| 0.14 |
| 0.14 |
| 0.75 |
|
|
|
|
|
|
|
|
|
|
|
|
|
|
|
|
|
|
|
|
|
|
|
|
|
|
|
|
|
|
|
Class I |
|
|
|
|
|
|
|
|
|
|
|
|
|
|
|
|
|
|
|
|
| ||||||||
12/31/18 |
| 18.87 |
| 0.32 |
| (1.38) |
| (1.06) |
|
| — |
| — |
| 17.81 |
| (5.62) |
| 4,423 |
| 13 |
|
| 0.13 |
| 0.13 |
| 1.66 |
|
12/31/17 | ‡‡ | 17.91 |
| (0.01) |
| 0.97 |
| 0.96 |
|
| — |
| — |
| 18.87 |
| 5.36 |
| 245 |
| 111 | (o) |
| 0.14 |
| 0.14 |
| (0.14) |
|
| |||||||||||||||||||||||||||||
JNL/S&P Managed Aggressive Growth Fund(n) |
|
|
|
|
|
|
|
|
|
|
|
|
|
| |||||||||||||||
Class A |
|
|
|
|
|
|
|
|
|
|
|
|
|
|
|
|
|
|
|
|
| ||||||||
12/31/18 |
| 22.21 |
| 0.10 |
| (1.59) |
| (1.49) |
|
| — |
| — |
| 20.72 |
| (6.71) |
| 1,998,398 |
| 11 |
|
| 0.44 |
| 0.44 |
| 0.43 |
|
12/31/17 |
| 18.02 |
| 0.13 |
| 4.06 |
| 4.19 |
|
| — |
| — |
| 22.21 |
| 23.25 |
| 2,233,446 |
| 112 | (o) |
| 0.23 |
| 0.23 |
| 0.63 |
|
12/31/16 |
| 17.00 |
| 0.09 |
| 0.93 |
| 1.02 |
|
| — |
| — |
| 18.02 |
| 6.00 |
| 1,841,402 |
| 16 |
|
| 0.15 |
| 0.15 |
| 0.52 |
|
12/31/15 |
| 17.04 |
| 0.12 |
| (0.16) |
| (0.04) |
|
| — |
| — |
| 17.00 |
| (0.23) |
| 1,824,889 |
| 14 |
|
| 0.15 |
| 0.15 |
| 0.66 |
|
12/31/14 |
| 16.48 |
| 0.10 |
| 0.99 |
| 1.09 |
|
| (0.08) |
| (0.45) |
| 17.04 |
| 6.58 |
| 1,764,932 |
| 18 |
|
| 0.15 |
| 0.15 |
| 0.61 |
|
|
|
|
|
|
|
|
|
|
|
|
|
|
|
|
|
|
|
|
|
|
|
|
|
|
|
|
|
|
|
Class I |
|
|
|
|
|
|
|
|
|
|
|
|
|
|
|
|
|
|
|
|
| ||||||||
12/31/18 |
| 22.23 |
| 0.32 |
| (1.75) |
| (1.43) |
|
| — |
| — |
| 20.80 |
| (6.43) |
| 5,471 |
| 11 |
|
| 0.14 |
| 0.14 |
| 1.41 |
|
12/31/17 | ‡‡ | 20.99 |
| (0.01) |
| 1.25 |
| 1.24 |
|
| — |
| — |
| 22.23 |
| 5.91 |
| 55 |
| 112 | (o) |
| 0.15 |
| 0.15 |
| (0.15) |
|
| |||||||||||||||||||||||||||||
See accompanying Notes to Financial Statements.
71
JNL Series Trust Master Feeder Funds and Funds of Funds
Financial Highlights
For a Share Outstanding
|
|
| Increase (decrease) from |
| Distributions from |
|
|
|
| Supplemental data |
|
|
| Ratios(a)(b) |
|
| |||||||||||||
Period ended | Net asset value, beginning of period($) | Net investment income (loss)($)(c) | Net realized & unrealized gains (losses)($) | Total from investment operations($) |
| Net investment income($) | Net realized gains on investment transactions($) | Net asset value, end of period($) | Total return(%)(d) | Net assets,end of period (in thousands)($) | Portfolio turnover (%)(e) |
| Net expenses to average net assets(%)(f) | Total expenses to average net assets(%)(f) | Net investment income (loss) to average net assets(%) | ||||||||||||||
JNL/Vanguard Global Bond Market Index Fund |
|
|
|
|
|
|
|
|
|
|
|
|
|
| |||||||||||||||
Class A |
|
|
|
|
|
|
|
|
|
|
|
|
|
|
|
|
|
|
|
|
| ||||||||
12/31/18 |
| 10.05 |
| 0.28 |
| (0.19) |
| 0.09 |
|
| — |
| — |
| 10.14 |
| 0.90 |
| 70,213 |
| 19 |
|
| 0.55 |
| 0.65 |
| 2.80 |
|
12/31/17 | * | 10.00 |
| 0.14 |
| (0.09) |
| 0.05 |
|
| — |
| — |
| 10.05 |
| 0.50 |
| 13,791 |
| 23 |
|
| 0.58 |
| 0.68 |
| 5.33 |
|
|
|
|
|
|
|
|
|
|
|
|
|
|
|
|
|
|
|
|
|
|
|
|
|
|
|
|
|
|
|
Class I |
|
|
|
|
|
|
|
|
|
|
|
|
|
|
|
|
|
|
|
|
| ||||||||
12/31/18 |
| 10.06 |
| 0.35 |
| (0.23) |
| 0.12 |
|
| — |
| — |
| 10.18 |
| 1.19 |
| 1,293 |
| 19 |
|
| 0.25 |
| 0.35 |
| 3.47 |
|
12/31/17 | * | 10.00 |
| 0.12 |
| (0.06) |
| 0.06 |
|
| — |
| — |
| 10.06 |
| 0.60 |
| 16 |
| 23 |
|
| 0.28 |
| 0.38 |
| 4.62 |
|
| |||||||||||||||||||||||||||||
JNL/Vanguard International Stock Market Index Fund |
|
|
|
|
|
|
|
|
|
|
|
|
|
| |||||||||||||||
Class A |
|
|
|
|
|
|
|
|
|
|
|
|
|
|
|
|
|
|
|
|
| ||||||||
12/31/18 |
| 10.45 |
| 0.25 |
| (1.82) |
| (1.57) |
|
| — |
| — |
| 8.88 |
| (15.02) |
| 221,452 |
| 18 |
|
| 0.58 |
| 0.65 |
| 2.55 |
|
12/31/17 | * | 10.00 |
| 0.11 |
| 0.34 |
| 0.45 |
|
| — |
| — |
| 10.45 |
| 4.50 |
| 118,273 |
| 65 |
|
| 0.58 |
| 0.65 |
| 3.95 |
|
|
|
|
|
|
|
|
|
|
|
|
|
|
|
|
|
|
|
|
|
|
|
|
|
|
|
|
|
|
|
Class I |
|
|
|
|
|
|
|
|
|
|
|
|
|
|
|
|
|
|
|
|
| ||||||||
12/31/18 |
| 10.45 |
| 0.34 |
| (1.88) |
| (1.54) |
|
| — |
| — |
| 8.91 |
| (14.74) |
| 4,611 |
| 18 |
|
| 0.28 |
| 0.35 |
| 3.47 |
|
12/31/17 | * | 10.00 |
| 0.13 |
| 0.32 |
| 0.45 |
|
| — |
| — |
| 10.45 |
| 4.50 |
| 189 |
| 65 |
|
| 0.28 |
| 0.35 |
| 4.58 |
|
| |||||||||||||||||||||||||||||
JNL/Vanguard U.S. Stock Market Index Fund |
|
|
|
|
|
|
|
|
|
|
|
|
|
| |||||||||||||||
Class A |
|
|
|
|
|
|
|
|
|
|
|
|
|
|
|
|
|
|
|
|
| ||||||||
12/31/18 |
| 10.71 |
| 0.17 |
| (0.79) |
| (0.62) |
|
| — |
| — |
| 10.09 |
| (5.79) |
| 265,605 |
| 7 |
|
| 0.54 |
| 0.60 |
| 1.58 |
|
12/31/17 | * | 10.00 |
| 0.09 |
| 0.62 |
| 0.71 |
|
| — |
| — |
| 10.71 |
| 7.10 |
| 52,541 |
| 67 |
|
| 0.54 |
| 0.60 |
| 3.33 |
|
|
|
|
|
|
|
|
|
|
|
|
|
|
|
|
|
|
|
|
|
|
|
|
|
|
|
|
|
|
|
Class I |
|
|
|
|
|
|
|
|
|
|
|
|
|
|
|
|
|
|
|
|
| ||||||||
12/31/18 |
| 10.72 |
| 0.23 |
| (0.81) |
| (0.58) |
|
| — |
| — |
| 10.14 |
| (5.41) |
| 5,260 |
| 7 |
|
| 0.24 |
| 0.30 |
| 2.07 |
|
12/31/17 | * | 10.00 |
| 0.20 |
| 0.52 |
| 0.72 |
|
| — |
| — |
| 10.72 |
| 7.20 |
| 103 |
| 67 |
|
| 0.24 |
| 0.30 |
| 7.15 |
|
* | Commencement of operations was as follows: August 13, 2018 - JNL/American Funds Capital Income Builder Fund; April 24, 2017 - JNL/DFA Growth Allocation Fund and JNL/DFA Moderate Growth Allocation Fund; September 25, 2017 - JNL/Vanguard Capital Growth Fund, JNL/Vanguard Equity Income Fund, JNL/Vanguard International Fund, JNL/Vanguard Small Company Growth Fund, JNL/Vanguard Global Bond Market Index Fund, JNL/Vanguard International Stock Market Index Fund and JNL/Vanguard US Stock Market Index Fund. |
‡ | Prior to September 25, 2017, the Fund offered Class B shares. Effective September 25, 2017, Class B shares were renamed to Class I shares. |
‡‡ | Effective September 25, 2017, Class I shares were offered by the Fund. |
(a) | Annualized for periods less than one year. |
(b) | Ratios of net investment income and expenses to average net assets do not include the impact of each Master Fund’s and Underlying Funds' expenses. The ratios of net investment income(loss) and expenses to average net assets for both the Master and Feeder Fund are as follows: |
Ratios (annualized for periods less than one year) | |||
Net expense to average net assets (%) | Total expense to average net assets (%) | Net investment income (loss) to average net assets (%) | |
JNL/American Funds Balanced Fund | |||
Class A | |||
12/31/18 | 0.86 | 1.26 | 1.26 |
12/31/17 | 0.89 | 1.20 | 1.87 |
Class I | |||
12/31/18 | 0.56 | 0.96 | 2.60 |
12/31/17 | 0.67 | 0.97 | 2.10 |
JNL/American Funds Blue Chip Income and Growth Fund | |||
Class A | |||
12/31/18 | 0.99 | 1.42 | 1.13 |
12/31/17 | 1.00 | 1.43 | 1.26 |
12/31/16 | 1.00 | 1.43 | 1.49 |
12/31/15 | 1.01 | 1.46 | 1.24 |
12/31/14 | 1.03 | 1.51 | 2.83 |
Class I | |||
12/31/18 | 0.69 | 1.12 | 3.17 |
12/31/17 | 0.77 | 1.20 | 1.76 |
12/31/16 | 0.80 | 1.23 | 1.82 |
12/31/15 | 0.79 | 1.24 | 1.30 |
12/31/14 | 0.78 | 1.26 | 3.28 |
JNL/American Funds Capital Income Builder Fund | |||
Class A | |||
12/31/18 | 1.15 | 1.52 | 3.55 |
Class I | |||
12/31/18 | 0.79 | 1.22 | 5.16 |
JNL/American Funds Global Bond Fund | |||
Class A | |||
12/31/18 | 1.10 | 1.62 | 1.20 |
12/31/17 | 1.09 | 1.61 | (0.51) |
12/31/16 | 1.12 | 1.62 | (0.34) |
See accompanying Notes to Financial Statements.
72
JNL Series Trust Master Feeder Funds and Funds of Funds
Financial Highlights
For a Share Outstanding
Ratios (annualized for periods less than one year) | |||
Net expense to average net assets (%) | Total expense to average net assets (%) | Net investment income (loss) to average net assets (%) | |
12/31/15 | 1.12 | 1.64 | (1.03) |
12/31/14 | 1.12 | 1.67 | 0.61 |
Class I | |||
12/31/18 | 0.80 | 1.32 | 2.44 |
12/31/17 | 0.86 | 1.38 | (0.07) |
12/31/16 | 0.92 | 1.42 | (0.15) |
12/31/15 | 0.90 | 1.42 | (0.81) |
12/31/14 | 0.87 | 1.42 | 0.74 |
JNL/American Funds Global Small Capitalization Fund | |||
Class A | |||
12/31/18 | 1.28 | 1.83 | (0.94) |
12/31/17 | 1.28 | 1.83 | (0.60) |
12/31/16 | 1.29 | 1.84 | (0.78) |
12/31/15 | 1.28 | 1.85 | (1.28) |
12/31/14 | 1.29 | 1.89 | (0.94) |
Class I | |||
12/31/18 | 0.98 | 1.53 | (0.43) |
12/31/17 | 1.04 | 1.59 | (0.12) |
12/31/16 | 1.09 | 1.64 | (0.58) |
12/31/15 | 1.07 | 1.64 | (1.07) |
12/31/14 | 1.04 | 1.64 | (0.70) |
JNL/American Funds Growth-Income Fund | |||
Class A | |||
12/31/18 | 0.92 | 1.27 | 0.79 |
12/31/17 | 0.93 | 1.28 | 0.82 |
12/31/16 | 0.96 | 1.31 | 0.91 |
12/31/15 | 0.96 | 1.33 | 0.74 |
12/31/14 | 0.97 | 1.37 | 0.76 |
Class I | |||
12/31/18 | 0.62 | 0.97 | 2.41 |
12/31/17 | 0.69 | 1.04 | 2.13 |
12/31/16 | 0.76 | 1.11 | 1.00 |
12/31/15 | 0.74 | 1.11 | 0.73 |
12/31/14 | 0.72 | 1.12 | 0.94 |
JNL/American Funds International Fund | |||
Class A | |||
12/31/18 | 1.16 | 1.71 | 0.75 |
12/31/17 | 1.16 | 1.71 | 0.54 |
12/31/16 | 1.19 | 1.74 | 0.55 |
12/31/15 | 1.19 | 1.76 | 0.76 |
12/31/14 | 1.19 | 1.79 | 0.65 |
Class I | |||
12/31/18 | 0.86 | 1.41 | 2.35 |
12/31/17 | 0.93 | 1.48 | 1.03 |
12/31/16 | 0.99 | 1.54 | 0.71 |
12/31/15 | 0.97 | 1.54 | 0.59 |
12/31/14 | 0.94 | 1.54 | 0.95 |
JNL/American Funds New World Fund | |||
Class A | |||
12/31/18 | 1.41 | 2.16 | (0.29) |
12/31/17 | 1.42 | 2.17 | (0.13) |
12/31/16 | 1.43 | 2.18 | (0.34) |
12/31/15 | 1.44 | 2.21 | (0.59) |
12/31/14 | 1.43 | 2.23 | (0.08) |
Class I | |||
12/31/18 | 1.11 | 1.86 | 0.72 |
12/31/17 | 1.18 | 1.93 | 0.45 |
12/31/16 | 1.23 | 1.98 | (0.23) |
12/31/15 | 1.22 | 1.99 | (0.37) |
12/31/14 | 1.18 | 1.98 | 0.05 |
JNL/Vanguard Capital Growth Fund | |||
Class A | |||
12/31/18 | 0.92 | 1.32 | (0.33) |
12/31/17 | 0.94 | 1.34 | (0.94) |
Class I | |||
12/31/18 | 0.62 | 1.02 | (0.36) |
12/31/17 | 0.64 | 1.04 | (0.64) |
JNL/Vanguard Equity Income Fund | |||
Class A | |||
12/31/18 | 0.87 | 1.27 | 0.61 |
See accompanying Notes to Financial Statements.
73
JNL Series Trust Master Feeder Funds and Funds of Funds
Financial Highlights
For a Share Outstanding
Ratios (annualized for periods less than one year) | |||
Net expense to average net assets (%) | Total expense to average net assets (%) | Net investment income (loss) to average net assets (%) | |
12/31/17 | 0.89 | 1.29 | (0.89) |
Class I | |||
12/31/18 | 0.57 | 0.97 | 0.45 |
12/31/17 | 0.59 | 0.99 | (0.59) |
JNL/Vanguard International Fund | |||
Class A | |||
12/31/18 | 0.95 | 1.50 | (0.42) |
12/31/17 | 0.97 | 1.52 | (0.97) |
Class I | |||
12/31/18 | 0.65 | 1.20 | (0.38) |
12/31/17 | 0.67 | 1.22 | (0.67) |
JNL/Vanguard Small Company Growth Fund | |||
Class A | |||
12/31/18 | 0.90 | 1.40 | (0.74) |
12/31/17 | 0.92 | 1.42 | (0.92) |
Class I | |||
12/31/18 | 0.60 | 1.10 | (0.50) |
12/31/17 | 0.62 | 1.12 | (0.62) |
(c) | Calculated using the average shares method. |
(d) | Total return assumes reinvestment of all distributions for the period. Total return is not annualized for periods less than one year and does not reflect payment of the expenses that apply to the variable accounts or any annuity charges and if it did performance would be lower. |
(e) | Portfolio turnover is not annualized for periods of less than one year. Portfolio turnover for the Funds of Funds is based on the Funds of Funds' purchases and sales of the Underlying Funds. Portfolio turnover for the Master Feeder Funds reflects each Master Fund’s portfolio purchases and sales. Portfolio turnover is calculated on the basis of the Fund as a whole, without distinguishing between the classes of shares issued. |
(f) | The expenses or expense waivers for certain Funds' Class I shares were $0.00 for one or more days during certain periods and this was a result of the net assets for the respective Class being below a level to generate an expense allocation greater than $0.005 for that day. Additionally, the expenses or expense waivers for certain Funds' Class I shares were $0.01 for one or more days during certain periods and this was a result of the net assets for the respective Class being at a level to generate an expense allocation between $0.005 and $0.01 for that day and rounded to $0.01. As a result, the ratios of net and total expenses to average net assets during the period for Class I shares can be less than or more than the anticipated ratios of net and total expenses to average net assets depending on the net assets that Class I shares acquired during the period. |
(g) | Prior to September 25, 2017, the Fund accrued the Rule 12b-1 fee at the maximum annual rate up to 0.20% of the average daily net assets of Class A shares of the Fund. Effective September 25, 2017, the maximum annual rate for Rule 12b-1 fees paid by the Fund changed from 0.20% to 0.30% of the average daily net assets of the Class A shares of the Fund. |
(h) | The Master Funds for the JNL/American Funds Master Feeder Funds are the Class 1 shares of the corresponding American Fund Insurance Series Fund. The Master Funds for the JNL/Vanguard Master Feeder Funds are the shares of the corresponding Vanguard Variable Insurance Fund. These financial statements should be read in conjunction with each Master Fund's shareholder report. |
(i) | Portfolio turnover including dollar roll transactions for JNL/American Funds Balanced Fund, formerly known as JNL/Capital Guardian Global Balanced Fund was 105%, 112%, 79% and 18% in 2014, 2015, 2016 and for the period January 1, 2017 to April 23, 2017, respectively. Portfolio turnover excluding dollar rolls was 14% for the period January 1, 2017 to April 23, 2017. Portfolio turnover including dollar roll transactions for JNL/American Funds Balanced Fund’s Master Fund was 85% and 86% in 2017 and 2018, respectively. |
(j) | Effective April 24, 2017, the JNL/American Funds Balanced Fund became a Feeder Fund. Prior to April 24, 2017, the Fund was a Sub-Advised Fund named JNL/Capital Guardian Global Balanced Fund. |
(k) | Amount represents less than $0.005. |
(l) | Portfolio turnover including dollar roll transactions for JNL/American Funds Capital Income Builder Fund's Master Fund was 98% in 2018. |
(m) | Portfolio turnover including dollar roll transactions for JNL/American Funds Global Bond Fund's Master Fund was 200%, 159%, 154%, 105% and 125% in 2014, 2015, 2016, 2017 and 2018, respectively. |
(n) | Prior to September 25, 2017, the Fund did not charge a 12b-1 fee. The shareholders investing in a Fund of Funds indirectly bore any 12b-1 fees incurred by the Class A shares or regular shares, as applicable of each Underlying Fund. Effective September 25, 2017, the Fund began to charge a Rule 12b-1 fee at a maximum annual rate of 0.30% of the average daily net assets of the Class A shares. At this time, the investment in each Underlying Fund was sold from Class A shares and purchased into Class I shares which do not charge a 12b-1 fee. |
(o) | Portfolio turnover includes the purchase and sale in each Underlying Fund which was sold from Class A shares and purchased into Class I shares effective September 25, 2017. Portfolio turnover not including the purchase and sale of each Underlying Fund was as follows: |
Portfolio Turnover (%) | |
JNL Institutional Alt 25 Fund | 37 |
JNL Institutional Alt 50 Fund | 47 |
JNL Moderate Growth Allocation Fund | 44 |
JNL Growth Allocation Fund | 49 |
JNL Aggressive Growth Allocation Fund | 51 |
JNL/Franklin Templeton Founding Strategy Fund | 4 |
JNL/Mellon Capital 10 x 10 Fund | 9 |
JNL/Mellon Capital Index 5 Fund | 5 |
JNL/S&P 4 Fund | 5 |
JNL/S&P Managed Conservative Fund | 12 |
JNL/S&P Managed Moderate Fund | 12 |
JNL/S&P Managed Moderate Growth Fund | 11 |
JNL/S&P Managed Growth Fund | 15 |
JNL/S&P Managed Aggressive Growth Fund | 18 |
See accompanying Notes to Financial Statements.
74
JNL Series Trust Master Feeder Funds and Funds of Funds
Notes to Financial Statements
December 31, 2018
NOTE 1. ORGANIZATION
JNL Series Trust (“Trust”) is an open-end management investment company organized under the laws of the Commonwealth of Massachusetts, by a Declaration of Trust, dated June 1, 1994, as amended and restated September 25, 2017. The Trust is registered with the U.S. Securities and Exchange Commission (“SEC”) under the Investment Company Act of 1940, as amended (“1940 Act”), and its shares are registered under the Securities Act of 1933, as amended (“1933 Act”). The Trust operates as a series trust, and at December 31, 2018 consisted of one-hundred and twenty-three (123) separate funds. Information in these financial statements pertains to thirty-three (33) Funds (each a “Fund”, and collectively, “Funds”) offered by the Trust listed in the table below. Each Fund represents shares of beneficial interest in a separate portfolio of securities and other assets, each with its own investment objective.
Jackson National Asset Management, LLC (“JNAM”, “Adviser” or “Administrator”), a wholly-owned subsidiary of Jackson National Life Insurance Company® (“Jackson”), serves as investment adviser and administrator to each of the Funds. Jackson is an indirect wholly owned subsidiary of Prudential plc, a publicly traded company incorporated in the United Kingdom. Prudential plc is not affiliated in any manner with Prudential Financial Inc., a company whose principal place of business is the United States of America. Shares of each Fund are sold to Jackson and its separate accounts to fund the benefits of variable annuity contracts and variable life insurance policies and to other affiliated registered investment companies. The Funds and each Fund's Adviser are:
Fund: | Adviser/Sub-Adviser: |
JNL/American Funds Balanced Fund, JNL/American Funds Blue Chip Income and Growth Fund, JNL/American Funds Capital Income Builder Fund, JNL/American Funds Global Bond Fund, JNL/American Funds Global Small Capitalization Fund, JNL/American Funds Growth-Income Fund, JNL/American Funds International Fund and JNL/American Funds New World Fund. These Funds are collectively known as "JNL/American Funds Master Feeder Funds". | JNAM (Adviser to each Master Feeder Fund) Capital Research and Management Company (Investment Adviser to each Master Fund) |
JNL/Vanguard Capital Growth Fund (PRIMECAP Management Company), JNL/Vanguard Equity Income Fund (The Vanguard Group, Inc. and Wellington Management Company LLP), JNL/Vanguard International Fund (Baillie Gifford Overseas Ltd., Schroder Investment Management North America Inc. and Schroder Investment Management North America Ltd.) and JNL/Vanguard Small Company Growth Fund (The Vanguard Group, Inc. and ArrowMark Colorado Holdings, LLC). These Funds are collectively known as “JNL/Vanguard Master Feeder Funds”.* | JNAM (Adviser to each Master Feeder Fund) PRIMECAP Management Company, The Vanguard Group, Inc., Wellington Management Company LLP, Baillie Gifford Overseas Ltd., Schroder Investment Management North America Inc., Schroder Investment Management North America Ltd. and ArrowMark Colorado Holdings, LLC. (Investment Advisers or Sub-Adviser to each Master Fund) |
JNL Institutional Alt 25 Fund and JNL Institutional Alt 50 Fund. These Funds are collectively known as "JNL Alt Funds". JNL/American Funds Moderate Growth Allocation Fund and JNL/American Funds Growth Allocation Fund. These Funds are collectively known as "JNL/American Funds Funds of Funds". JNL/DFA Growth Allocation Fund and JNL/DFA Moderate Growth Allocation Fund. These Funds are collectively known as “JNL/DFA Funds”. JNL Moderate Growth Allocation Fund, JNL Growth Allocation Fund and JNL Aggressive Growth Allocation Fund. These Funds are collectively known as "JNL Allocation Funds”. JNL/Franklin Templeton Founding Strategy Fund, JNL/Mellon Capital 10 x 10 Fund, JNL/Mellon Capital Index 5 Fund and JNL/S&P 4 Fund. JNL/Vanguard Global Bond Market Index Fund, JNL/Vanguard International Stock Market Index Fund and JNL/Vanguard U.S. Stock Market Index Fund. These Funds are collectively known as “JNL/Vanguard Funds Funds of Funds”. | JNAM |
JNL/S&P Managed Conservative Fund, JNL/S&P Managed Moderate Fund, JNL/S&P Managed Moderate Growth Fund, JNL/S&P Managed Growth Fund and JNL/S&P Managed Aggressive Growth Fund. These Funds are collectively known as "JNL/S&P Funds". | Standard & Poor’s Investment Advisory Services LLC |
* Investment Advisers or Sub-Adviser to each Fund’s Master Fund are identified in parentheses.
Each Fund, except the JNL/American Funds Master Feeder Funds and JNL/Vanguard Master Feeder Funds, operates under a “Fund of Funds” structure, investing all of its assets in other affiliated or unaffiliated funds (each, an “Underlying Fund”, and collectively, the “Underlying Funds”).
Each of the JNL/American Funds Master Feeder Funds and JNL/Vanguard Master Feeder Funds operates as a “Feeder Fund” and seeks to achieve its respective investment objective by investing all of its assets in a separate mutual fund (“Master Fund”). Each Master Fund is a series of the American Funds Insurance Series® or Vanguard Variable Insurance Fund, respectively, each a registered open-end management investment company that has the same investment objective as its corresponding Feeder Fund. Each Master Fund directly acquires securities and the Feeder Fund, by investing in the Master Fund, acquires an indirect interest in those securities. As of December 31, 2018, the JNL/American Funds Master Feeder Funds and JNL/Vanguard Master Feeder Funds owned the following percentage of its corresponding Master Fund: JNL/American Funds Balanced Fund - 4.57%, JNL/American Funds Blue Chip Income and Growth Fund - 36.26%, JNL/American Funds Capital Income Builder Fund - 3.96%, JNL/American Funds Global Bond Fund - 24.14%, JNL/American Funds Global Small Capitalization Fund - 16.74%, JNL/American Funds Growth-Income Fund - 20.52%,
75
JNL Series Trust Master Feeder Funds and Funds of Funds
Notes to Financial Statements
December 31, 2018
JNL/American Funds International Fund - 19.42%, JNL/American Funds New World Fund - 40.31%, JNL/Vanguard Capital Growth Fund - 17.81%, JNL/Vanguard Equity Income Fund - 11.60%, JNL/Vanguard International Fund - 14.49% and JNL/Vanguard Small Company Growth Fund - 14.84%. The Master Funds’ Schedules of Investments, Financial Statements and accounting policies are outlined in each Master Fund’s shareholder report, which accompanies this report. This report should be read in conjunction with the Master Funds’ shareholder reports. The Master Funds' shareholder reports are also available on the SEC’s website at www.sec.gov.
The Funds are diversified Funds for purposes of the 1940 Act, with the exception of the following non-diversified Funds: JNL/American Funds Global Bond Fund, JNL Alt Funds, JNL/American Funds Funds of Funds, JNL/DFA Funds, JNL Allocation Funds, JNL/Vanguard Funds Funds of Funds, JNL/S&P 4 Fund and JNL/S&P Funds.
Each Fund offers Class A shares and Class I shares. Class A shares and Class I shares differ principally in applicable 12b-1 fees. Shareholders bear the common expenses of each Fund and earn income and realized gains/losses from each Fund pro rata based on the average daily net assets of each class, without discrimination between share classes. From time to time, a Fund may have significant subscription and redemption activity which, when executed at the net asset value (“NAV”) rounded to two decimals, can impact the NAV per share of either class and cause a divergence in the NAV between each class. Each share class also has different voting rights on matters affecting a single class. No class has preferential dividend rights.
JNL/American Funds Capital Income Builder Fund commenced operations on August 13, 2018.
NOTE 2. SIGNIFICANT ACCOUNTING POLICIES
The Funds are investment companies and follow accounting and reporting guidance under Financial Accounting Standards Board (“FASB”) Accounting Standards Codification (“ASC”) Topic 946, “Financial Services-Investment Companies”. The following is a summary of significant accounting policies consistently followed by the Funds in the preparation of their financial statements in conformity with U.S. generally accepted accounting principles (“GAAP”).
Security Valuation and Fair Value Measurement. Under the Trust’s valuation policy and procedures, the Trust’s Board of Trustees ("Board" or "Trustees") has delegated the daily operational oversight of the securities valuation function to the JNAM Valuation Committee (“Valuation Committee”), which consists of certain officers of the Trust and JNAM management. The Valuation Committee is responsible for determining fair valuations for any security for which market quotations are not readily available. For those securities fair valued under procedures adopted by the Board, the Valuation Committee reviews and affirms the reasonableness of the fair valuation determinations after considering all relevant information that is reasonably available. The Valuation Committee’s fair valuation determinations are subject to review by the Board at its next regularly scheduled meeting covering the calendar quarter in which the fair valuation was determined.
The NAV of a Fund's shares is generally determined once each day the New York Stock Exchange (“NYSE”) is open, at the close of the regular trading session of the NYSE (normally, 4:00 PM Eastern Time, Monday through Friday). The Funds of Funds’ investments in the Underlying Funds are valued at the daily NAV of the applicable Underlying Fund determined as of the close of the NYSE on each valuation date. Valuation of investments by the Underlying Funds is discussed in the shareholder report of the Underlying Funds. Each Feeder Fund’s investment in its corresponding Master Fund is valued at the daily NAV per share of the applicable Master Fund determined as of the close of the NYSE on each valuation date. Valuation of the investments by the Master Fund is discussed in each Master Fund’s shareholder report, which accompanies this report. The Master Fund’s shareholder reports are also available on the SEC's website at www.sec.gov.
FASB ASC Topic 820, “Fair Value Measurement” establishes a single authoritative definition of fair value, sets out a framework for measuring fair value and requires additional disclosures about fair value measurements. Various inputs are used in determining the value of a Fund's investments under FASB ASC Topic 820 guidance and are summarized into three broad categories. Level 1 includes valuations based on quoted prices of identical securities in active markets, including valuations for investments in mutual funds. Investments in the Underlying Funds and Master Funds are categorized as Level 1 within FASB ASC Topic 820 fair value hierarchy. The Level 1 valuation assets for the Funds can be referenced in the Schedules of Investments. There were no Level 2 or Level 3 investments in these Funds.
Distributions to Shareholders. The amount and timing of distributions for the regulated investment company ("RIC") Funds are determined in accordance with federal income tax regulations, which may differ from GAAP. Dividends from net investment income are generally declared and paid annually by the RIC Funds, but may be paid more frequently to avoid excise tax. Distributions of net realized capital gains by the RIC Funds, if any, are distributed at least annually, to the extent they exceed available capital loss carryforwards. No distributions of net investment income or realized capital gains are required for Funds that are not RICs, therefore, undistributed net investment income and accumulated net realized gain/loss are reclassed to paid-in capital on a semi-annual basis. Capital gains distributions received from the Master Funds and Underlying Funds are recorded as net realized gain on distributions from affiliated or unaffiliated investment companies, as applicable, in the Statements of Operations.
Security Transactions and Investment Income. Security transactions are recorded on the trade date for financial reporting purposes. Realized gains and losses are determined on the specific identification basis. Dividend income, net of applicable withholding taxes, is recorded on the ex-dividend date.
Expenses. Expenses are recorded on an accrual basis. Expenses of the Trust that are directly attributable to a specific Fund are charged to that Fund. Expenses attributable to a specific class of shares are charged to that class. Other Trust level expenses are allocated to the Funds based on the average daily net assets of each Fund.
Expenses in Master Funds and Funds of Funds. Because each Feeder Fund invests all of its assets in its respective Master Fund, the Feeder Fund's shareholders bear the fees and expenses of each respective Master Fund in which the Feeder Fund invests. Such expenses are not included in the
76
JNL Series Trust Master Feeder Funds and Funds of Funds
Notes to Financial Statements
December 31, 2018
Statements of Operations, but are incurred indirectly in the calculation of the NAV of the respective Master Fund. As a result, the Feeder Funds’ actual expenses may be higher than those of other mutual funds that invest directly in securities. A similar situation exists for the Funds of Funds as it relates to the expenses associated with the investments in Underlying Funds.
Guarantees and Indemnifications. In the normal course of business, the Trust may enter into contracts that contain a variety of representations which provide general indemnifications for certain liabilities. Under the Trust’s organizational documents, its officers and Trustees are indemnified against certain liabilities arising out of the performance of their duties to the Funds. However, since their commencement of operations, the Funds have not had claims or losses pursuant to their contracts and expect the risk of loss to be remote. The Funds’ maximum exposure under these arrangements is unknown since the amount of any future claims that may be made against the Funds cannot be determined and the Funds have no historical basis for predicting the likelihood of any such claims.
Use of Estimates. The preparation of financial statements in conformity with GAAP requires management to make estimates and assumptions that affect the reported amounts of assets and liabilities and disclosure of contingent assets and liabilities at the date of the financial statements and the reported amounts of increases and decreases in net assets from operations during the reporting period. Actual results could differ from those estimates.
Recent Accounting Pronouncement. In August 2018, the SEC adopted Final Rule Release No. 33-10532, Disclosure Update and Simplification. The rule intends to simplify financial statement disclosures by removing duplicative, redundant or outdated disclosure requirements. The rule was effective November 5, 2018, and the Funds’ Statements of Assets and Liabilities and Statements of Changes in Net Assets for the year ended December 31, 2018 have been modified to conform to the rule.
NOTE 3. CERTAIN RISKS
Market and Volatility Risk. In the normal course of business, the Master Funds and Underlying Funds trade financial instruments and enter into financial transactions where the risk of potential loss exists due to changes in the market (“market risk”). Additionally, prices of financial instruments may fluctuate over short periods or extended periods of time in response to company, market, economic or political news (“volatility risk”). Equity securities generally have more price volatility than fixed-income securities, and long term fixed-income securities normally have more price volatility than short term fixed-income securities. Certain Master Funds and Underlying Funds may invest in derivatives to hedge the Fund’s portfolio as well as for investment purposes which may increase volatility. Volatility may cause the Master Fund’s and Underlying Fund’s net asset value per share to experience significant appreciation or depreciation in value over short periods of time.
Credit and Counterparty Risk. In the normal course of business, the Master Funds or Underlying Funds trade financial instruments and enter into financial transactions where the risk of potential loss exists due to failure of the other party to a transaction to perform (“credit risk”). Similar to credit risk, a Master Fund or Underlying Fund may be exposed to the risk that an institution or other entity with which the Master Fund or Underlying Fund has unsettled or open transactions will default (“counterparty risk”). Financial assets, which potentially expose a Master Fund or Underlying Fund to credit risk, consist principally of investments and cash due from counterparties. The potential loss could exceed the value of the financial assets and liabilities recorded in the Master Fund’s or Underlying Fund’s financial statements. A Master Fund or Underlying Fund manages credit and counterparty risk by entering into agreements only with counterparties that it believes have the financial resources to honor their obligations and by monitoring the financial stability of those counterparties. A Master Fund’s or Underlying Fund’s Adviser(s) and sub-advisers attempt to mitigate credit and counterparty risk by (i) periodically assessing the creditworthiness of its trading partners, (ii) monitoring and/or limiting the amount of its net exposure to each individual counterparty based on its assessment and (iii) requiring collateral from the counterparty for certain transactions. In order to preserve certain safeguards for non-standard settlement trades, the Master Fund and Underlying Fund restrict their exposure to credit and counterparty losses by entering into master netting agreements with counterparties with whom they undertake a significant volume of transactions. In the event of default, the total market value exposure would be offset against collateral exchanged to date, which would result in a net receivable/(payable) that would be due from/to the counterparty. The extent of a Master Fund’s or Underlying Fund’s exposure to credit and counterparty risks in respect to financial assets is incorporated within their carrying value as recorded in each Master Fund’s or Underlying Fund’s Statement of Assets and Liabilities. For certain derivative contracts held by a Master Fund or Underlying Fund, the potential loss could exceed the value of the financial assets recorded in their financial statements.
Underlying Fund Investment Risk. Each Fund’s prospectus includes a discussion of the principal investment risks of the Master Fund or Underlying Fund in which it invests. Additional risks associated with a Master Fund’s or Underlying Fund’s investments are described within the respective Master Fund’s or Underlying Fund’s annual shareholder report. The Master Funds’ shareholder reports are also available on the SEC’s website at www.sec.gov.
Feeder Funds and Funds of Funds Risks. The value of an investment in a Feeder Fund changes with the value of the corresponding Master Fund and its investments. The value of an investment in a Funds of Funds changes with the values of the corresponding Underlying Funds and their investments. The Master Fund’s and Underlying Fund’s shares may be purchased by other investment companies and shareholders. In some cases, the Master Fund or Underlying Fund may experience large subscriptions or redemptions due to allocation changes or rebalancing. While it is impossible to predict the overall impact of these transactions over time, there could be adverse effects on Fund performance.
Cybersecurity Risk. Cyber-attacks could disrupt daily operations related to trading and portfolio management. In addition, technology disruptions and cyber-attacks may impact the operations or securities prices of an issuer or a group of issuers, and thus may have an adverse impact on the value of a Fund’s investments. Cyber-attacks on a Fund’s sub-advisers and service providers could cause business failures or delays in daily processing and a Fund may not be able to issue a NAV per share. As a result, cyber-attacks could impact the performance of a Fund.
77
JNL Series Trust Master Feeder Funds and Funds of Funds
Notes to Financial Statements
December 31, 2018
NOTE 4. INVESTMENT ADVISORY FEES AND TRANSACTIONS WITH AFFILIATES
Advisory and Administrative Fees. The Trust has an investment advisory and management agreement with JNAM, whereby JNAM provides investment management services. Each Fund pays JNAM an annual fee, accrued daily and paid monthly, based on a specified percentage of the average daily net assets of each Fund.
JNAM also serves as the Administrator to the Funds. The Funds pay an administrative fee based on the average daily net assets of each Fund, accrued daily and paid monthly. In return for the administrative fee, JNAM provides or procures all necessary administrative functions and services for the operation of the Funds. In addition, JNAM, at its own expense, arranges for legal, audit, fund accounting, transfer agency, custody (except overdraft and interest expense), printing and mailing, a portion of the Chief Compliance Officer costs, and all other services necessary for the operation of each Fund. Each Fund is responsible for trading expenses including brokerage commissions, interest and taxes, other non-operating expenses, registration fees, licensing costs, directors and officers insurance, the fees and expenses of the disinterested Trustees ("Independent Trustees") and independent legal counsel to the Independent Trustees, and a portion of the costs associated with the Chief Compliance Officer.
The following schedules indicate the range of the advisory fee at various net assets levels and the administrative fee each Fund was obligated to pay JNAM. For the advisory fee ranges presented, refer to the Trust’s Prospectus for the specific percentage of average daily net assets and break points for each Fund.
Advisory Fee (m-millions) (b-billions) | Administrative Fee (b-billions) | ||||||||||
$0 to $500m % | $500m to $5b % | Over $5b % | $0 to $3b % | Over $3b % | |||||||
JNL/American Funds Balanced Fund | 0.55 | 0.50 – 0.49 | 0.48 | 0.15 | 0.13 | ||||||
JNL/American Funds Blue Chip Income and Growth Fund | 0.60 | 0.60 – 0.54 | 0.53 | 0.15 | 0.13 | ||||||
JNL/American Funds Capital Income Builder Fund | 0.525 | 0.525 – 0.49 | 0.48 | 0.15 | 0.13 | ||||||
JNL/American Funds Global Bond Fund | 0.60 | 0.60 – 0.54 | 0.53 | 0.15 | 0.13 | ||||||
JNL/American Funds Global Small Capitalization Fund | 0.65 | 0.65 – 0.59 | 0.58 | 0.15 | 0.13 | ||||||
JNL/American Funds Growth-Income Fund | 0.60 | 0.60 – 0.54 | 0.53 | 0.15 | 0.13 | ||||||
JNL/American Funds International Fund | 0.75 | 0.75 – 0.69 | 0.68 | 0.15 | 0.13 | ||||||
JNL/American Funds New World Fund | 0.95 | 0.95 – 0.89 | 0.88 | 0.15 | 0.13 | ||||||
JNL/Vanguard Capital Growth Fund | 0.525 | 0.525 – 0.49 | 0.48 | 0.15 | 0.13 | ||||||
JNL/Vanguard Equity Income Fund | 0.525 | 0.525 – 0.49 | 0.48 | 0.15 | 0.13 | ||||||
JNL/Vanguard International Fund | 0.675 | 0.675 – 0.64 | 0.63 | 0.15 | 0.13 | ||||||
JNL/Vanguard Small Company Growth Fund | 0.625 | 0.625 – 0.59 | 0.58 | 0.15 | 0.13 | ||||||
JNL Alt Funds | 0.15 | 0.10 – 0.095 | 0.09 | 0.05 | 0.045 | ||||||
JNL/American Funds Funds of Funds | 0.20 | 0.20 – 0.165 | 0.155 | 0.15 | 0.13 | ||||||
JNL/DFA Funds | 0.20 | 0.20 – 0.165 | 0.155 | 0.15 | 0.13 | ||||||
JNL Allocation Funds | 0.13 | 0.08 – 0.075 | 0.07 | 0.05 | 0.045 | ||||||
JNL/Franklin Templeton Founding Strategy Fund | 0.00 | 0.00 | 0.00 | 0.05 | 0.045 | ||||||
JNL/Mellon Capital 10 x 10 Fund | 0.00 | 0.00 | 0.00 | 0.05 | 0.045 | ||||||
JNL/Mellon Capital Index 5 Fund | 0.00 | 0.00 | 0.00 | 0.05 | 0.045 | ||||||
JNL/S&P 4 Fund | 0.00 | 0.00 | 0.00 | 0.05 | 0.045 | ||||||
JNL/S&P Funds | 0.13 | 0.08 – 0.075 | 0.07 | 0.05 | 0.045 | ||||||
JNL/Vanguard Global Bond Market Index Fund | 0.20 | 0.20 – 0.165 | 0.155 | 0.15 | 0.13 | ||||||
JNL/Vanguard International Stock Market Index Fund | 0.20 | 0.20 – 0.165 | 0.155 | 0.15 | 0.13 | ||||||
JNL/Vanguard U.S. Stock Market Index Fund | 0.20 | 0.20 – 0.165 | 0.155 | 0.10 | 0.09 | ||||||
Advisory Fee Waivers. Pursuant to contractual fee waiver agreements, JNAM agreed to waive a portion of its advisory fees for each of the following Funds. None of the waived advisory fees can be recaptured by JNAM. The amount of waived expenses for each Fund is recorded as expense waiver in each Fund’s Statement of Operations.
Contractual Advisory Fee Waiver as a Percentage of Average Daily Net Assets (%) | |||
JNL/American Funds Balanced Fund | 0.40 | ||
JNL/American Funds Blue Chip Income and Growth Fund | 0.43 | ||
JNL/American Funds Capital Income Builder Fund1 | 0.40 | ||
JNL/American Funds Global Bond Fund | 0.525 % for net assets between $0 - $1 billion and 0.50% for net assets over $1 billion | ||
JNL/American Funds Global Small Capitalization Fund | 0.55 | ||
JNL/American Funds Growth-Income Fund | 0.35 | ||
JNL/American Funds International Fund | 0.55 | ||
JNL/American Funds New World Fund | 0.75 | ||
JNL/DFA Funds | 0.05 | ||
JNL/Vanguard Capital Growth Fund | 0.40 | ||
JNL/Vanguard Equity Income Fund | 0.40 | ||
JNL/Vanguard International Fund | 0.55 | ||
JNL/Vanguard Small Company Growth Fund | 0.50 | ||
JNL/Vanguard Global Bond Market Index Fund | 0.10 | ||
JNL/Vanguard International Stock Market Index Fund | 0.07 | ||
JNL/Vanguard U.S. Stock Market Index Fund | 0.06 | ||
1 Effective October 1, 2018. | |||
78
JNL Series Trust Master Feeder Funds and Funds of Funds
Notes to Financial Statements
December 31, 2018
Administrative Fee Waivers. Pursuant to a contractual fee waiver agreement, JNAM agreed to waive 0.05% of the administrative fees of the Class I shares of the JNL/DFA Funds. None of the waived administrative fees can be recaptured by JNAM. The amount of waived expenses for each Fund is recorded as expense waiver in each Fund’s Statement of Operations.
Distribution Fees. The Trust has adopted a Distribution Plan (the “Plan”) pursuant to the provisions of Rule 12b-1 under the 1940 Act. Pursuant to the Plan, Class A shares of the Funds pay a distribution and/or service fee (“Rule 12b-1 fee”) to Jackson National Life Distributors LLC (“JNLD”), an affiliate of the Adviser, for the purpose of paying for certain distribution, administrative, or related service expenses from the sale and distribution of each Fund’s Class A shares. To the extent consistent with existing law and the Plan, JNLD may use the Rule 12b-1 fees to reimburse or compensate broker-dealers, administrators or others for providing distribution, administrative or other services. The Funds’ Plan is structured as a compensation plan. Under a compensation plan, the distributor may receive 12b-1 fees in excess of the allowable distribution and related shareholder servicing expenses, but not exceeding the maximum 12b-1 fee, which may be applied to future periods when distribution and related shareholder servicing expenses are less than the maximum 12b-1 fee set by the Plan. Under the Plan, the maximum annual rate for Rule 12b-1 fees paid by Class A shares of the Funds is 0.30% of the average daily net assets of the Class A shares of each Fund. Each Fund pays the fee monthly to JNLD. JNLD also is the principal underwriter of the variable insurance products issued by Jackson and its subsidiaries. Amounts charged pursuant to the Plan are reflected as 12b-1 fees (Class A) in each Fund's Statement of Operations.
Other Service Providers. JPMorgan Chase Bank, N.A. ("JPM Chase") and State Street Bank and Trust Company (“State Street”) act as custodians for the Funds.
Deferred Compensation Plan. The Funds adopted a Deferred Compensation Plan whereby an Independent Trustee may defer the receipt of all or a portion of their compensation. These deferred amounts, which remain as liabilities of the Funds, are treated as if invested and reinvested in shares of one or more funds at the discretion of the applicable Independent Trustee. These amounts represent general, unsecured liabilities of the Funds and vary according to the total returns of the selected funds. Liabilities related to deferred balances are included in payable for board of trustees fees in the Statements of Assets and Liabilities. Increases or decreases related to the changes in value of deferred balances are included in board of trustees fees set forth in the Statements of Operations.
NOTE 5. BORROWING ARRANGEMENTS
The Trust is party to a Syndicated Credit Agreement (“SCA”) with a group of lenders. The Funds, with the exception of JNL/American Funds Master Feeder Funds, JNL/American Funds Funds of Funds, JNL/DFA Funds, JNL/Vanguard Master Feeder Funds and JNL/Vanguard Funds Funds of Funds, participate in the SCA with other funds managed by JNAM (“Participating Funds”) in a credit facility which is available solely to finance shareholder redemptions or for other temporary or emergency purposes. Effective June 1, 2018, JNL/American Funds Master Feeder Funds, JNL/American Funds Funds of Funds, JNL/DFA Funds were removed from the SCA. Also effective June 1, 2018, the Participating Funds may borrow up to $675,000,000, the amount available under the facility; the limits set for borrowing by the Participating Funds’ prospectuses and the 1940 Act; or an amount prescribed within the SCA. Prior to June 1, 2018, the amount available under the facility was $600,000,000. JNL/PPM America Floating Rate Income Fund, a Participating Fund managed by JNAM, has priority to utilize $150,000,000 of the SCA under an InterFund Allocation Agreement. The Participating Funds pay an annual fee of 0.15% of the available commitments. Effective June 1, 2018, these fees are allocated 22.2% to the JNL/PPM America Floating Rate Income Fund, in accordance with the InterFund Allocation Agreement, and 77.8% to the other Participating Funds based on each fund’s net assets as a percentage of the Participating Funds’ total net assets. Prior to June 1, 2018, the fees were allocated 25% to the JNL/PPM America Floating Rate Income Fund, in accordance with the InterFund Allocation Agreement, and 75% to the other Participating Funds. During the year, the Participating Funds paid an annual administration fee to JPM Chase, which is allocated in the same manner as the commitment fee. The fees related to the SCA are included in other expenses in each Fund’s Statement of Operations. No amounts were borrowed by the Funds under the facility during the year.
Pursuant to an Exemptive Order issued by the SEC, the Funds, along with certain other funds advised by JNAM, may participate in an InterFund Lending Program (“Program”). The Program provides an alternative credit facility allowing a Fund to borrow from, or lend money to, other participating affiliated funds. Any open loans at year end are included in Receivable for interfund lending or Payable for interfund lending, as appropriate, in the respective Fund’s Statement of Assets and Liabilities. No amounts were borrowed through the Program during the year.
NOTE 6. INCOME TAX MATTERS
JNL/American Funds Blue Chip Income and Growth Fund, JNL/American Funds Capital Income Builder Fund, JNL/American Funds Growth-Income Fund, JNL/Vanguard Capital Growth Fund, JNL/Vanguard Equity Income Fund, JNL/Vanguard International Fund, JNL/Vanguard Small Company Growth Fund, JNL Institutional Alt 25 Fund, JNL Institutional Alt 50 Fund, JNL/American Funds Moderate Growth Allocation Fund, JNL/American Funds Growth Allocation Fund, JNL Moderate Growth Allocation Fund, JNL Growth Allocation Fund, JNL Aggressive Growth Allocation Fund, JNL/Franklin Templeton Founding Strategy Fund, JNL/Mellon Capital 10 x 10 Fund, JNL/Mellon Capital Index 5 Fund, JNL/S&P 4 Fund, JNL/S&P Managed Conservative Fund, JNL/S&P Managed Moderate Fund, JNL/S&P Managed Moderate Growth Fund, JNL/S&P Managed Growth Fund, JNL/S&P Managed Aggressive Growth Fund, JNL/Vanguard Global Bond Market Index Fund, JNL/Vanguard International Stock Market Index Fund and JNL/Vanguard U.S. Stock Market Index Fund are treated as partnerships for federal income tax purposes. These Funds are generally not subject to federal income tax, and therefore, there is no provision for federal income taxes. Each Fund is a separate entity for federal income tax purposes.
JNL/American Funds Balanced Fund, JNL/American Funds Global Bond Fund, JNL/American Funds Global Small Capitalization Fund, JNL/American Funds International Fund, JNL/American Funds New World Fund, JNL/DFA Growth Allocation Fund and JNL/DFA Moderate Growth Allocation Fund are each treated as a separate tax payer for federal income tax purposes. Each of these Funds intends to qualify as a RIC and to distribute substantially all net investment income and net capital gains, if any, to its shareholders and otherwise comply with Subchapter M of the Internal Revenue Code of 1986, as amended, applicable to RICs. Therefore, no federal income tax provision is required. The Funds may also fully or partially satisfy their distribution
79
JNL Series Trust Master Feeder Funds and Funds of Funds
Notes to Financial Statements
December 31, 2018
requirements by using consent dividends rather than cash dividends. Consent dividends are authorized by Jackson, and the distributions are treated as if they were paid in cash for tax purposes only. Under current tax law, interest, dividends and capital gains paid by these Funds are not currently taxable to shareholders when left to accumulate within a variable annuity contract or variable life insurance policies.
The following information for Funds treated as RICs is presented on an income tax basis (in thousands). Differences between amounts for financial statements and federal income tax purposes are primarily due to timing and character differences in recognizing certain gains and losses on investment transactions. Permanent differences between financial statement and federal income tax reporting are reclassified within the capital accounts based on their federal income tax treatment. Temporary differences do not require reclassification. Permanent differences may include but are not limited to the following: consent dividends, distribution adjustments, foreign currency reclassifications and reclassifications on the sale of real estate investment trust and passive foreign investment company securities. These reclassifications have no impact on net assets.
| Net Increase(Decrease) |
| ||
| Total Distributable Earnings (Loss)($) |
| Paid-in Capital($) |
|
JNL/American Funds Balanced Fund | (49,967 | ) | 49,967 |
|
JNL/American Funds Global Bond Fund | (9,440 | ) | 9,440 |
|
JNL/American Funds Global Small Capitalization Fund | (35,176 | ) | 35,176 |
|
JNL/American Funds International Fund | (134,070 | ) | 134,070 |
|
JNL/American Funds New World Fund | (44,826 | ) | 44,826 |
|
At December 31, 2018, the following Funds treated as RICs had capital loss carryforwards (in thousands) available for U.S. federal income tax purposes to offset future net realized capital gains. The amount and character of the capital loss carryforwards are listed in the table below.
|
| Capital Loss Carryforwards with No Expiration |
|
|
| ||
|
| Short Term ($) |
| Long Term ($) |
| Total ($) |
|
JNL/American Funds Global Bond Fund |
| 164 |
| 3,682 |
| 3,846 |
|
As of December 31, 2018, the cost of investments and the components of net unrealized appreciation (depreciation) (in thousands) for Funds treated as RICs for federal income tax purposes were as follows:
|
| Tax Cost of Investments($) |
| Gross Unrealized Appreciation($) |
| Gross Unrealized Depreciation($) |
| Net Unrealized Appreciation (Depreciation)($) |
|
JNL/American Funds Balanced Fund | 1,129,326 |
| 97 |
| (83,420 | ) | (83,323 | ) | |
JNL/American Funds Global Bond Fund | 534,691 |
| 1,196 |
| (33,591 | ) | (32,395 | ) | |
JNL/American Funds Global Small Capitalization Fund | 684,846 |
| 17,703 |
| (81,507 | ) | (63,804 | ) | |
JNL/American Funds International Fund | 1,914,577 |
| 22,377 |
| (203,208 | ) | (180,831 | ) | |
JNL/American Funds New World Fund | 1,306,745 |
| 19,126 |
| (109,442 | ) | (90,316 | ) | |
JNL/DFA Growth Allocation Fund | 177,916 |
| 581 |
| (19,438 | ) | (18,857 | ) | |
JNL/DFA Moderate Growth Allocation Fund | 140,313 |
| 99 |
| (13,406 | ) | (13,307 | ) | |
As of December 31, 2018, for Funds treated as RICs, the components of distributable taxable earnings for U.S. federal income tax purposes (in thousands) were as follows:
| Undistributed Net Ordinary Income*($) |
| Undistributed Net Long-Term Capital Gain($) |
| Unrealized Gains (Losses)**($) |
| Capital Loss Carryforward($) |
|
JNL/American Funds Balanced Fund | — |
| — |
| (83,365 | ) | — |
|
JNL/American Funds Global Bond Fund | — |
| — |
| (32,410 | ) | (3,847 | ) |
JNL/American Funds Global Small Capitalization Fund | — |
| — |
| (63,819 | ) | — |
|
JNL/American Funds International Fund | — |
| — |
| (180,859 | ) | — |
|
JNL/American Funds New World Fund | — |
| — |
| (90,342 | ) | — |
|
JNL/DFA Growth Allocation Fund | 2,627 |
| 2,125 |
| (18,856 | ) | — |
|
JNL/DFA Moderate Growth Allocation Fund | 2,564 |
| 1,432 |
| (13,304 | ) | — |
|
* Undistributed net ordinary income consists of net taxable income derived from dividends, interest and net short-term capital gains, if any.
** Unrealized gains (losses) are adjusted for open wash sale loss deferrals.
The tax character of distributions paid (in thousands) during the Funds’ fiscal year ended December 31, 2018 was as follows:
| Net Ordinary Income($) |
| Long-term Capital Gain($) |
| Return of Capital($) |
JNL/American Funds Balanced Fund | 16,485 |
| 48,625 |
| — |
JNL/American Funds Global Bond Fund | 3,167 |
| — |
| — |
JNL/American Funds Global Small Capitalization Fund | 765 |
| 4,361 |
| — |
JNL/American Funds International Fund | 17,316 |
| 17,535 |
| — |
JNL/American Funds New World Fund | 7,382 |
| 636 |
| — |
80
JNL Series Trust Master Feeder Funds and Funds of Funds
Notes to Financial Statements
December 31, 2018
| Net Ordinary Income($) |
| Long-term Capital Gain($) |
| Return of Capital($) |
JNL/DFA Growth Allocation Fund | — |
| 22 |
| — |
JNL/DFA Moderate Growth Allocation Fund | — |
| 12 |
| — |
* Net ordinary income consists of net taxable income derived from dividends, interest and net short-term capital gains, if any.
** The Funds designated as a long-term capital gain dividend, pursuant to the Internal Revenue Code section 852(b)(3), the amount necessary to reduce earnings and profits of the
Funds related to net capital gains to zero for the year ended December 31, 2018.
The tax character of distributions paid (in thousands) during the Funds' fiscal year ended December 31, 2017 was as follows:
| Net Ordinary Income*($) |
| Long-term Capital Gain($) |
| |
JNL/American Funds Balanced Fund | 9,782 |
| 6,395 |
| |
JNL/American Funds Global Bond Fund | 1,643 |
| — |
| |
JNL/American Funds Global Small Capitalization Fund | 1,107 |
| 89,562 |
| |
JNL/American Funds International Fund | 11,169 |
| 86,516 |
| |
JNL/American Funds New World Fund | 3,707 |
| — |
| |
JNL/DFA Growth Allocation Fund | 1,135 |
| 1,204 |
| |
JNL/DFA Moderate Growth Allocation Fund | 783 |
| 674 |
|
* Net ordinary income consists of net taxable income derived from dividends, interest and net short-term capital gains, if any.
FASB ASC Topic 740 “Income Taxes” provides guidance for how uncertain tax positions should be recognized, measured, presented and disclosed in the financial statements. FASB ASC Topic 740 requires the evaluation of tax positions taken or expected to be taken in the course of preparing each Fund’s tax return to determine whether the tax positions are “more-likely-than-not” of being sustained by the applicable tax authority. Tax positions not deemed to meet the “more-likely-than-not” threshold would result in the Funds recording a tax expense in the current year. FASB ASC Topic 740 requires that management evaluate the tax positions taken in returns for 2015, 2016, 2017 and 2018 which remain subject to examination by the Internal Revenue Service and certain other jurisdictions. Management completed an evaluation of the Funds’ tax positions and based on that evaluation, determined that no provision for federal income tax was required in the Funds’ financial statements during the year ended December 31, 2018.
NOTE 7. SUBSEQUENT EVENTS
Management has evaluated subsequent events for the Funds through the date the financial statements are issued and the following events occurred:
Fee Changes. Effective June 24, 2019, in connection with various changes to the JNL/Franklin Templeton Founding Strategy Fund, including the appointment of Franklin Advisers, Inc. as a sub-adviser to the Fund, the advisory fees for the Fund will change to 0.55% on net assets between $0 - $1 billion, 0.53% on net assets between $1 billion - $3 billion, 0.52% on net assets between $3 billion - $5 billion and 0.51% on net assets over $5 billion. Also effective June 24, 2019, the administrative fees for the Fund will change to 0.15% on net assets between $0 - $3 billion and 0.13% on net assets over $3 billion.
Advisory Fee Waivers. The Contractual Advisory Fee Waiver will change to the amounts indicated below for the following Funds:
Contractual Advisory Fee Waiver as a Percentage of Average Daily Net Assets (%) | |||
JNL/American Funds Balanced Fund1 | 0.35 | ||
JNL/Vanguard Small Company Growth Fund1 | 0.40 | ||
1 Effective April 29, 2019 | |||
Fund Name Changes. Effective June 24, 2019, the names will change for the following Funds.
Existing Fund Name | Effective June 24, 2019 Fund Name |
JNL/Franklin Templeton Founding Strategy Fund | JNL/Franklin Templeton Growth Allocation Fund |
JNL/Mellon Capital Index 5 Fund | JNL/Mellon Index 5 Fund |
Merger. The following merger will be effective after close of business on June 21, 2019 for the Funds indicated.
Acquired Fund | Acquiring Fund |
JNL/Mellon Capital 10 x 10 Fund | JNL/Mellon Capital Index 5 Fund |
Tax Status. At a meeting held on December 12, 2018, the Board approved changing the federal income tax status from a RIC to a partnership effective January 1, 2019 for the following Funds: JNL/American Funds Balanced Fund, JNL/American Funds Global Bond Fund, JNL/American Funds Global Small Capitalization Fund, JNL/American Funds International Fund and JNL/American Funds New World Fund. Effective January 1, 2019, each Fund’s income, gains, losses and credits will be allocated directly to its partners and will retain the same character for federal income tax purposes. In addition, each Fund will not be able to realize any future benefit from any unused capital loss carryforward and other losses deferred as a RIC, if any, after December 31, 2018. The investment objectives, policies, restrictions, net asset value per share, service providers, fiscal years, and investment portfolios
81
JNL Series Trust Master Feeder Funds and Funds of Funds
Notes to Financial Statements
December 31, 2018
of the Funds have not changed in connection with this tax status change. Such a conversion will not impact the contract holders of the separate accounts which own the Funds.
No other events were noted that required adjustments to the financial statements or disclosure in the notes to financial statements.
82
Report of Independent Registered Public Accounting Firm
To the Shareholders of the Funds and Board of Trustees
JNL Series Trust:
Opinion on the Financial Statements
We have audited the accompanying statements of assets and liabilities of each series within JNL Series Trust Master Feeder Funds and Funds of Funds including JNL/American Funds Balanced Fund, JNL/American Funds Blue Chip Income and Growth Fund, JNL/American Funds Capital Income Builder Fund (commenced operations August 13, 2018), JNL/American Funds Global Bond Fund, JNL/American Funds Global Small Capitalization Fund, JNL/American Funds Growth-Income Fund, JNL/American Funds International Fund, JNL/American Funds New World Fund, JNL/Vanguard Capital Growth Fund (commenced operations September 25, 2017), JNL/Vanguard Equity Income Fund (commenced operations September 25, 2017), JNL/Vanguard International Fund (commenced operations September 25, 2017), JNL/Vanguard Small Company Growth Fund (commenced operations September 25, 2017), JNL Institutional Alt 25 Fund, JNL Institutional Alt 50 Fund, JNL/American Funds Moderate Growth Allocation Fund, JNL/American Funds Growth Allocation Fund, JNL/DFA Growth Allocation Fund (commenced operations April 24, 2017), JNL/DFA Moderate Growth Allocation Fund (commenced operations April 24, 2017), JNL Moderate Growth Allocation Fund, JNL Growth Allocation Fund, JNL Aggressive Growth Allocation Fund, JNL/Franklin Templeton Founding Strategy Fund, JNL/Mellon Capital 10 x 10 Fund, JNL/Mellon Capital Index 5 Fund, JNL/S&P 4 Fund, JNL/Vanguard Global Bond Market Index Fund (commenced operations September 25, 2017), JNL/Vanguard International Stock Market Index Fund (commenced operations September 25, 2017), JNL/Vanguard U.S. Stock Market Index Fund (commenced operations September 25, 2017), JNL/S&P Managed Conservative Fund, JNL/S&P Managed Moderate Fund, JNL/S&P Managed Moderate Growth Fund, JNL/S&P Managed Growth Fund and JNL/S&P Managed Aggressive Growth Fund (the “Funds”) , including the schedules of investments, as of December 31, 2018, the related statements of operations for the year (or period since commencement of operations) then ended, the statements of changes in net assets for each of the years (or period since commencement of operations) in the two-year period then ended, and the related notes (collectively, the “financial statements”) and the financial highlights for each of the years or periods in the five-year period then ended. In our opinion, the financial statements and financial highlights present fairly, in all material respects, the financial position of the Funds as of December 31, 2018, the results of their operations for the year or period then ended, the changes in their net assets for each of the years or periods in the two-year period then ended, and the financial highlights for each of the years or periods in the five-year period then ended, in conformity with U.S. generally accepted accounting principles.
Emphasis of a Matter
As discussed in Note 7, Subsequent Events, a merger of JNL/Mellon Capital 10 x 10 Fund into JNL/Mellon Capital Index 5 Fund will be effective after the close of business on June 21, 2019.
Basis for Opinion
These financial statements and financial highlights are the responsibility of the Funds’ management. Our responsibility is to express an opinion on these financial statements and financial highlights based on our audits. We are a public accounting firm registered with the Public Company Accounting Oversight Board (United States) (“PCAOB”) and are required to be independent with respect to the Funds in accordance with the U.S. federal securities laws and the applicable rules and regulations of the Securities and Exchange Commission and the PCAOB.
We conducted our audits in accordance with the standards of the PCAOB. Those standards require that we plan and perform the audit to obtain reasonable assurance about whether the financial statements and financial highlights are free of material misstatement, whether due to error or fraud. Our audits included performing procedures to assess the risks of material misstatement of the financial statements and financial highlights, whether due to error or fraud, and performing procedures that respond to those risks. Such procedures included examining, on a test basis, evidence regarding the amounts and disclosures in the financial statements and financial highlights. Such procedures also included confirmation of securities owned as of December 31, 2018, by correspondence with the custodians, transfer agents and brokers or other appropriate auditing procedures. Our audits also included evaluating the accounting principles used and significant estimates made by management, as well as evaluating the overall presentation of the financial statements and financial highlights. We believe that our audits provide a reasonable basis for our opinion.
/s/ KPMG LLP
We have served as auditor of one or more JNL investment companies since 2001.
Chicago, Illinois
February 25, 2019
83
JNL Series Trust Master Feeder Funds and Funds of Funds
Additional Disclosures (Unaudited)
December 31, 2018
Disclosure of Fund Expenses. Shareholders incur ongoing costs, which include costs for portfolio management, administrative services, Rule 12b-1 fees and other operating expenses. Operating expenses such as these are deducted from each Fund’s gross income and directly reduce the final investment return. These expenses are expressed as a percentage of the Fund’s average net assets; this percentage is known as the Fund’s expense ratio. The examples below use the expense ratio and are intended to help the investor understand the ongoing costs (in dollars) of investing in a Fund and to compare these costs with the ongoing costs of investing in other mutual funds. The examples are based on an investment of $1,000 made at the beginning of the period shown and held for the entire period. The examples do not reflect the expenses of the variable insurance contracts or the separate account. Total expenses would be higher if these expenses were included.
Expenses Using Actual Fund Return. This section provides information about the actual account values and actual expenses incurred by the Fund. Use the information in this section, together with the amount invested, to estimate the expenses paid over the period. Simply divide the account value by $1,000 (for example, an $8,600 account value divided by $1,000 = 8.6), then multiply the result by the number in the first section under the heading entitled “Expenses Paid During Period” to estimate the expenses paid during this period.
Expenses Using Hypothetical 5% Return. This section provides information that can be used to compare each Fund’s costs with those of other mutual funds. It assumes that the Fund’s expense ratio for the period is unchanged and assumes an annual 5% return before expenses, which is not the Fund’s actual return. This example is useful in making comparisons because the SEC requires all mutual funds to make the 5% calculation.
|
|
|
| Expenses Using Actual Fund Return |
| Expenses Using Hypothetical 5% Return | ||||||||
|
| Annualized Expense Ratios(%) ‡^ |
| Beginning Account Value 07/01/18($) |
| Ending Account Value 12/31/18($) |
| Expenses Paid During Period($)† |
| Beginning Account Value 07/01/18($) |
| Ending Account Value 12/31/18($) |
| Expenses Paid During Period($)† |
JNL/American Funds Balanced Fund |
|
|
|
|
|
|
|
|
|
| ||||
| Class A | 0.57 |
| 1,000.00 |
| 943.00 |
| 2.79 |
| 1,000.00 |
| 1,022.33 |
| 2.91 |
| Class I | 0.27 |
| 1,000.00 |
| 944.90 |
| 1.32 |
| 1,000.00 |
| 1,023.84 |
| 1.38 |
JNL/American Funds Blue Chip Income and Growth Fund |
|
|
|
|
|
|
|
|
|
| ||||
| Class A | 0.58 |
| 1,000.00 |
| 908.40 |
| 2.79 |
| 1,000.00 |
| 1,022.28 |
| 2.96 |
| Class I | 0.28 |
| 1,000.00 |
| 909.50 |
| 1.35 |
| 1,000.00 |
| 1,023.79 |
| 1.43 |
JNL/American Funds Capital Income Builder Fund |
|
|
|
|
|
|
|
|
|
| ||||
| Class A* | 0.61 |
| 1,000.00 |
| 941.00 |
| 2.29 |
| 1,000.00 |
| 1,022.13 |
| 3.11 |
| Class I* | 0.25 |
| 1,000.00 |
| 943.00 |
| 0.94 |
| 1,000.00 |
| 1,023.95 |
| 1.28 |
JNL/American Funds Global Bond Fund |
|
|
|
|
|
|
|
|
|
| ||||
| Class A | 0.52 |
| 1,000.00 |
| 1,001.50 |
| 2.62 |
| 1,000.00 |
| 1,022.58 |
| 2.65 |
| Class I | 0.22 |
| 1,000.00 |
| 1,002.70 |
| 1.11 |
| 1,000.00 |
| 1,024.10 |
| 1.12 |
JNL/American Funds Global Small Capitalization Fund |
|
|
|
|
|
|
|
|
|
| ||||
| Class A | 0.55 |
| 1,000.00 |
| 855.80 |
| 2.57 |
| 1,000.00 |
| 1,022.43 |
| 2.80 |
| Class I | 0.25 |
| 1,000.00 |
| 856.80 |
| 1.17 |
| 1,000.00 |
| 1,023.95 |
| 1.28 |
JNL/American Funds Growth-Income Fund |
|
|
|
|
|
|
|
|
|
| ||||
| Class A | 0.64 |
| 1,000.00 |
| 920.80 |
| 3.10 |
| 1,000.00 |
| 1,021.98 |
| 3.26 |
| Class I | 0.34 |
| 1,000.00 |
| 922.20 |
| 1.65 |
| 1,000.00 |
| 1,023.49 |
| 1.73 |
JNL/American Funds International Fund |
|
|
|
|
|
|
|
|
|
| ||||
| Class A | 0.63 |
| 1,000.00 |
| 867.60 |
| 2.97 |
| 1,000.00 |
| 1,022.03 |
| 3.21 |
| Class I | 0.33 |
| 1,000.00 |
| 869.50 |
| 1.56 |
| 1,000.00 |
| 1,023.54 |
| 1.68 |
JNL/American Funds New World Fund |
|
|
|
|
|
|
|
|
|
| ||||
| Class A | 0.64 |
| 1,000.00 |
| 893.90 |
| 3.06 |
| 1,000.00 |
| 1,021.98 |
| 3.26 |
| Class I | 0.34 |
| 1,000.00 |
| 895.40 |
| 1.62 |
| 1,000.00 |
| 1,023.49 |
| 1.73 |
JNL/Vanguard Capital Growth Fund |
|
|
|
|
|
|
|
|
|
| ||||
| Class A | 0.58 |
| 1,000.00 |
| 941.40 |
| 2.84 |
| 1,000.00 |
| 1,022.28 |
| 2.96 |
| Class I | 0.28 |
| 1,000.00 |
| 943.40 |
| 1.37 |
| 1,000.00 |
| 1,023.79 |
| 1.43 |
JNL/Vanguard Equity Income Fund |
|
|
|
|
|
|
|
|
|
| ||||
| Class A | 0.58 |
| 1,000.00 |
| 950.50 |
| 2.85 |
| 1,000.00 |
| 1,022.28 |
| 2.96 |
| Class I | 0.28 |
| 1,000.00 |
| 952.50 |
| 1.38 |
| 1,000.00 |
| 1,023.79 |
| 1.43 |
JNL/Vanguard International Fund |
|
|
|
|
|
|
|
|
|
| ||||
| Class A | 0.58 |
| 1,000.00 |
| 838.50 |
| 2.69 |
| 1,000.00 |
| 1,022.28 |
| 2.96 |
| Class I | 0.28 |
| 1,000.00 |
| 839.70 |
| 1.30 |
| 1,000.00 |
| 1,023.79 |
| 1.43 |
JNL/Vanguard Small Company Growth Fund |
|
|
|
|
|
|
|
|
|
| ||||
| Class A | 0.58 |
| 1,000.00 |
| 844.70 |
| 2.70 |
| 1,000.00 |
| 1,022.28 |
| 2.96 |
| Class I | 0.28 |
| 1,000.00 |
| 846.00 |
| 1.30 |
| 1,000.00 |
| 1,023.79 |
| 1.43 |
JNL Institutional Alt 25 Fund |
|
|
|
|
|
|
|
|
|
| ||||
| Class A | 0.46 |
| 1,000.00 |
| 936.90 |
| 2.25 |
| 1,000.00 |
| 1,022.89 |
| 2.35 |
| Class I | 0.16 |
| 1,000.00 |
| 938.80 |
| 0.78 |
| 1,000.00 |
| 1,024.40 |
| 0.82 |
JNL Institutional Alt 50 Fund |
|
|
|
|
|
|
|
|
|
| ||||
| Class A | 0.46 |
| 1,000.00 |
| 947.50 |
| 2.26 |
| 1,000.00 |
| 1,022.89 |
| 2.35 |
| Class I | 0.16 |
| 1,000.00 |
| 949.40 |
| 0.79 |
| 1,000.00 |
| 1,024.40 |
| 0.82 |
JNL/American Funds Moderate Growth Allocation Fund |
|
|
|
|
|
|
|
|
|
| ||||
| Class A | 0.64 |
| 1,000.00 |
| 942.90 |
| 3.13 |
| 1,000.00 |
| 1,021.98 |
| 3.26 |
| Class I | 0.34 |
| 1,000.00 |
| 944.40 |
| 1.67 |
| 1,000.00 |
| 1,023.49 |
| 1.73 |
84
JNL Series Trust Master Feeder Funds and Funds of Funds
Additional Disclosures (Unaudited)
December 31, 2018
|
|
|
| Expenses Using Actual Fund Return |
| Expenses Using Hypothetical 5% Return | ||||||||
|
| Annualized Expense Ratios(%) ‡^ |
| Beginning Account Value 07/01/18($) |
| Ending Account Value 12/31/18($) |
| Expenses Paid During Period($)† |
| Beginning Account Value 07/01/18($) |
| Ending Account Value 12/31/18($) |
| Expenses Paid During Period($)† |
JNL/American Funds Growth Allocation Fund |
|
|
|
|
|
|
|
|
|
| ||||
| Class A | 0.64 |
| 1,000.00 |
| 925.70 |
| 3.11 |
| 1,000.00 |
| 1,021.98 |
| 3.26 |
| Class I | 0.34 |
| 1,000.00 |
| 927.70 |
| 1.65 |
| 1,000.00 |
| 1,023.49 |
| 1.73 |
JNL/DFA Growth Allocation Fund |
|
|
|
|
|
|
|
|
|
| ||||
| Class A | 0.60 |
| 1,000.00 |
| 905.20 |
| 2.88 |
| 1,000.00 |
| 1,022.18 |
| 3.06 |
| Class I | 0.25 |
| 1,000.00 |
| 907.10 |
| 1.20 |
| 1,000.00 |
| 1,023.95 |
| 1.28 |
JNL/DFA Moderate Growth Allocation Fund |
|
|
|
|
|
|
|
|
|
| ||||
| Class A | 0.60 |
| 1,000.00 |
| 930.30 |
| 2.92 |
| 1,000.00 |
| 1,022.18 |
| 3.06 |
| Class I | 0.25 |
| 1,000.00 |
| 932.40 |
| 1.22 |
| 1,000.00 |
| 1,023.95 |
| 1.28 |
JNL Moderate Growth Allocation Fund |
|
|
|
|
|
|
|
|
|
| ||||
| Class A | 0.44 |
| 1,000.00 |
| 941.20 |
| 2.15 |
| 1,000.00 |
| 1,022.99 |
| 2.24 |
| Class I | 0.14 |
| 1,000.00 |
| 942.10 |
| 0.69 |
| 1,000.00 |
| 1,024.50 |
| 0.71 |
JNL Growth Allocation Fund |
|
|
|
|
|
|
|
|
|
| ||||
| Class A | 0.44 |
| 1,000.00 |
| 916.00 |
| 2.12 |
| 1,000.00 |
| 1,022.99 |
| 2.24 |
| Class I | 0.14 |
| 1,000.00 |
| 917.70 |
| 0.68 |
| 1,000.00 |
| 1,024.50 |
| 0.71 |
JNL Aggressive Growth Allocation Fund |
|
|
|
|
|
|
|
|
|
| ||||
| Class A | 0.45 |
| 1,000.00 |
| 901.60 |
| 2.16 |
| 1,000.00 |
| 1,022.94 |
| 2.29 |
| Class I | 0.15 |
| 1,000.00 |
| 904.00 |
| 0.72 |
| 1,000.00 |
| 1,024.45 |
| 0.77 |
JNL/Franklin Templeton Founding Strategy Fund |
|
|
|
|
|
|
|
|
|
| ||||
| Class A | 0.35 |
| 1,000.00 |
| 915.30 |
| 1.69 |
| 1,000.00 |
| 1,023.44 |
| 1.79 |
| Class I | 0.05 |
| 1,000.00 |
| 917.00 |
| 0.24 |
| 1,000.00 |
| 1,024.95 |
| 0.26 |
JNL/Mellon Capital 10 x 10 Fund |
|
|
|
|
|
|
|
|
|
| ||||
| Class A | 0.35 |
| 1,000.00 |
| 898.10 |
| 1.67 |
| 1,000.00 |
| 1,023.44 |
| 1.79 |
| Class I | 0.01 |
| 1,000.00 |
| 899.90 |
| 0.05 |
| 1,000.00 |
| 1,025.16 |
| 0.05 |
JNL/Mellon Capital Index 5 Fund |
|
|
|
|
|
|
|
|
|
| ||||
| Class A | 0.35 |
| 1,000.00 |
| 904.70 |
| 1.68 |
| 1,000.00 |
| 1,023.44 |
| 1.79 |
| Class I | 0.05 |
| 1,000.00 |
| 906.30 |
| 0.24 |
| 1,000.00 |
| 1,024.95 |
| 0.26 |
JNL/S&P 4 Fund |
|
|
|
|
|
|
|
|
|
| ||||
| Class A | 0.35 |
| 1,000.00 |
| 911.00 |
| 1.69 |
| 1,000.00 |
| 1,023.44 |
| 1.79 |
| Class I | 0.05 |
| 1,000.00 |
| 912.10 |
| 0.24 |
| 1,000.00 |
| 1,024.95 |
| 0.26 |
JNL/S&P Managed Conservative Fund |
|
|
|
|
|
|
|
|
|
| ||||
| Class A | 0.45 |
| 1,000.00 |
| 979.80 |
| 2.25 |
| 1,000.00 |
| 1,022.94 |
| 2.29 |
| Class I | 0.15 |
| 1,000.00 |
| 982.00 |
| 0.75 |
| 1,000.00 |
| 1,024.45 |
| 0.77 |
JNL/S&P Managed Moderate Fund |
|
|
|
|
|
|
|
|
|
| ||||
| Class A | 0.44 |
| 1,000.00 |
| 961.90 |
| 2.18 |
| 1,000.00 |
| 1,022.99 |
| 2.24 |
| Class I | 0.14 |
| 1,000.00 |
| 962.70 |
| 0.69 |
| 1,000.00 |
| 1,024.50 |
| 0.71 |
JNL/S&P Managed Moderate Growth Fund |
|
|
|
|
|
|
|
|
|
| ||||
| Class A | 0.43 |
| 1,000.00 |
| 938.10 |
| 2.10 |
| 1,000.00 |
| 1,023.04 |
| 2.19 |
| Class I | 0.13 |
| 1,000.00 |
| 939.40 |
| 0.64 |
| 1,000.00 |
| 1,024.55 |
| 0.66 |
JNL/S&P Managed Growth Fund |
|
|
|
|
|
|
|
|
|
| ||||
| Class A | 0.43 |
| 1,000.00 |
| 917.70 |
| 2.08 |
| 1,000.00 |
| 1,023.04 |
| 2.19 |
| Class I | 0.13 |
| 1,000.00 |
| 919.50 |
| 0.63 |
| 1,000.00 |
| 1,024.55 |
| 0.66 |
JNL/S&P Managed Aggressive Growth Fund |
|
|
|
|
|
|
|
|
|
| ||||
| Class A | 0.44 |
| 1,000.00 |
| 908.00 |
| 2.12 |
| 1,000.00 |
| 1,022.99 |
| 2.24 |
| Class I | 0.14 |
| 1,000.00 |
| 909.50 |
| 0.67 |
| 1,000.00 |
| 1,024.50 |
| 0.71 |
JNL/Vanguard Global Bond Market Index Fund |
|
|
|
|
|
|
|
|
|
| ||||
| Class A | 0.55 |
| 1,000.00 |
| 1,014.00 |
| 2.79 |
| 1,000.00 |
| 1,022.43 |
| 2.80 |
| Class I | 0.25 |
| 1,000.00 |
| 1,015.00 |
| 1.27 |
| 1,000.00 |
| 1,023.95 |
| 1.28 |
JNL/Vanguard International Stock Market Index Fund |
|
|
|
|
|
|
|
|
|
| ||||
| Class A | 0.58 |
| 1,000.00 |
| 885.30 |
| 2.76 |
| 1,000.00 |
| 1,022.28 |
| 2.96 |
| Class I | 0.28 |
| 1,000.00 |
| 886.60 |
| 1.33 |
| 1,000.00 |
| 1,023.79 |
| 1.43 |
JNL/Vanguard U.S. Stock Market Index Fund |
|
|
|
|
|
|
|
|
|
| ||||
| Class A | 0.54 |
| 1,000.00 |
| 915.60 |
| 2.61 |
| 1,000.00 |
| 1,022.48 |
| 2.75 |
| Class I | 0.24 |
| 1,000.00 |
| 916.80 |
| 1.16 |
| 1,000.00 |
| 1,024.00 |
| 1.22 |
^ The annualized expense ratios for the Funds of Funds do not include expenses of the Funds of Funds’ Underlying Funds. The annualized expense ratios for the Master Funds include the expenses of both the Master and Feeder Fund.
‡ The expenses or expense waivers for certain Funds' Class I shares were $0.00 for one or more days during the period and this was a result of the net assets for the respective Class being below a level to generate an expense allocation greater than $0.005 for that day. Additionally, the expenses or expense waivers for certain Funds' Class I shares were $0.01 for one or more days during the period and this was a result of the net assets for the respective Class being at a level to generate an expense allocation between $0.005 and $0.01 for that day and rounded to $0.01. As a result, the ratios of net and total expenses to average net assets during the period for Class I shares can be less than or more than the anticipated ratios of net and total expenses to average net assets depending on the net assets of Class I shares during the period.
† Expenses paid during the period are equal to the annualized net expense ratio, multiplied by the average account value over the period, then multiplied by 184/365 (to reflect the most recent 6-month period).
85
JNL Series Trust Master Feeder Funds and Funds of Funds
Additional Disclosures (Unaudited)
December 31, 2018
Quarterly Portfolio Holdings. The Funds file a complete schedule of portfolio holdings with the SEC for the first and third quarters of each fiscal year on Form N-Q. The Funds’ Forms N-Q are available on the SEC’s website at www.sec.gov. The Forms N-Q may be reviewed and copied at the SEC’s Public Reference Room in Washington, DC, and information on the operation of the Public Reference Room may be obtained by calling 800-SEC-0330. It is also available upon request from the registrant by calling the Funds toll-free at 1-866-255-1935.
Proxy Voting Policies and Procedures and Proxy Voting Record. A description of the Policy that the Funds’ Adviser used to vote proxies relating to portfolio securities and additional information on how the Funds voted any proxies relating to portfolio securities during the 12-month period ended June 30, 2018, are available (1) without charge, upon request by calling 1-800-644-4565 (Jackson Service Center) or 1-800-599-5651 (Jackson NY Service Center), (2) by writing the JNL Series Trust, P.O. Box 30314, Lansing, Michigan 48909-7814, (3) by visiting www.jackson.com, and (4) by visiting the SEC’s website at www.sec.gov.
86
Trustees and Officers of JNL Series Trust (“Trust”)
Name, Address, and (Age) | Position(s) Held with the Trust (Length of Time Served) | Number of Portfolios in JNL Fund Complex Overseen by Manager | |
Interested Trustee | |||
Mark D. Nerud (52) 1 1 Corporate Way Lansing, MI 48951 | Trustee 2 (1/2007 to present) President and Chief Executive Officer (12/2006 to present) | 163 | |
Principal Occupation(s) During Past 5 Years: Chief Executive Officer of JNAM (1/2010 to present); President of JNAM (1/2007 to present); Managing Board Member of JNAM (5/2015 to present); President and Chief Executive Officer of other investment companies advised by JNAM (8/2014 to present, 12/2006 to present, and 8/2012 to 7/2018); Principal Executive Officer of an investment company advised by PPM America, Inc. (11/2017 to present); President and Chief Executive Officer of Curian Series Trust (8/2014 to 2/2016); Managing Board Member of Curian Capital, LLC (1/2011 to 4/2015); Managing Board Member of Curian Clearing LLC (1/2011 to 4/2015) | |||
Other Directorships Held by Trustee During Past 5 Years: None | |||
Independent Trustees | |||
Eric O. Anyah (51) 1 Corporate Way Lansing, MI 48951 | Trustee 2 (1/2018 to present) | 163 | |
Principal Occupation(s) During Past 5 Years: Chief Financial Officer, The Museum of Fine Arts, Houston (10/2013 to present) | |||
Other Directorships Held by Trustee During Past 5 Years: None | |||
Michael J. Bouchard (62) 1 Corporate Way Lansing, MI 48951 | Trustee 2 (12/2003 to present) | 163 | |
Principal Occupation(s) During Past 5 Years: Sheriff, Oakland County, Michigan (1/1999 to present) | |||
Other Directorships Held by Trustee During Past 5 Years: None | |||
Ellen Carnahan (63) 1 Corporate Way Lansing, MI 48951 | Trustee 2 (12/2013 to present) | 163 | |
Principal Occupation(s) During Past 5 Years: Principal, Machrie Enterprises LLC (venture capital firm) (7/2007 to present); Board Member of various corporate boards (see below) | |||
Other Directorships Held by Trustee During Past 5 Years: Director, Paylocity Holding Corporation (11/2016 to present); Director and Audit Committee Member, ENOVA International Inc. (5/2015 to present); Director and Audit Committee Member (5/2003 to 6/2015), Environmental Committee Member (5/2013 to 6/2015), Integrys Energy Group | |||
87
Trustees and Officers of JNL Series Trust (“Trust”)
Name, Address, and (Age) | Position(s) Held with the Trust (Length of Time Served) | Number of Portfolios in JNL Fund Complex Overseen by Manager |
William J. Crowley, Jr. (73) 1 Corporate Way Lansing, MI 48951 | Chair of the Board 3 (1/2014 to present) Trustee 2 (1/2007 to present) | 163 |
Principal Occupation(s) During Past 5 Years: Board Member of a corporate board (see below) | ||
Other Directorships Held by Trustee During Past 5 Years: Director (7/2009 to 7/2016), Massey Litigation Advisory Committee Chair (9/2013 to 7/2016), Safety, Health, Environmental and Sustainability Committee Member (5/2012 to 7/2016), and Capital Markets Committee Member (5/2010 to 7/2016), Alpha Natural Resources | ||
Michelle Engler (60) 1 Corporate Way Lansing, MI 48951 | Trustee 2 (12/2003 to present) | 163 |
Principal Occupation(s) During Past 5 Years: Partner, Engler LLC (consulting firm) (2013 to present); Attorney (1983 to present) | ||
Other Directorships Held by Trustee During Past 5 Years: None | ||
John W. Gillespie (65) 1 Corporate Way Lansing, MI 48951 | Trustee 2 (12/2013 to present) | 163 |
Principal Occupation(s) During Past 5 Years: Entrepreneur-in-Residence, UCLA Office of Intellectual Property (2/2013 to present); Investor, Business Writer, and Advisor (10/2006 to present); Chief Financial Advisor, Yosi, Inc. (healthcare services software company) (1/2017 to 6/2018) | ||
Other Directorships Held by Trustee During Past 5 Years: None | ||
William R. Rybak (67) 1 Corporate Way Lansing, MI 48951 | Trustee 2 (1/2007 to present) | 163 |
Principal Occupation(s) During Past 5 Years: Retired private investor (5/2000 to present); Board Member of various corporate boards (see below) | ||
Other Directorships Held by Trustee During Past 5 Years: Director (2/2010 to present), Board Chair (2/2016 to present), and Audit Committee Chair (2/2012 to 2/2016), Christian Brothers Investment Services, Inc.; Trustee (10/2012 to present) and Chair Emeritus (5/2009 to present), Lewis University; Director (2002 to present) and Governance Committee Chair (2004 to present), each of the Calamos Mutual Funds and Closed-End Funds; Director (12/2003 to 6/2017) and Audit Committee Chair (5/2013 to 6/2017), PrivateBancorp Inc. | ||
88
Trustees and Officers of JNL Series Trust (“Trust”)
Name, Address, and (Age) | Position(s) Held with the Trust (Length of Time Served) | Number of Portfolios in JNL Fund Complex Overseen by Manager | |
Mark S. Wehrle (61) 1 Corporate Way Lansing, MI 48951 | Trustee 2 (1/2018 to present) | 163 | |
Principal Occupation(s) During Past 5 Years: Real Estate Broker, Broker’s Guild (4/2011 to present); Adjunct Professor of Accounting, University of Denver School of Accountancy (1/2011 to 6/2014) | |||
Other Directorships Held by Trustee During Past 5 Years: Trustee, Delta Dental of Colorado (1/2012 to present); Trustee, Curian Series Trust (7/2013 to 2/2016) | |||
Edward C. Wood (62) 1 Corporate Way Lansing, MI 48951 | Trustee 2 (12/2013 to present) | 163 | |
Principal Occupation(s) During Past 5 Years: Chief Operating Officer, McDonnell Investment Management, LLC (8/2010 to 4/2015) | |||
Other Directorships Held by Trustee During Past 5 Years: None | |||
Patricia A. Woodworth (63) 1 Corporate Way Lansing, MI 48951 | Trustee 2 (1/2007 to present) | 163 | |
Principal Occupation(s) During Past 5 Years: Vice President, Chief Financial Officer, and Chief Operating Officer, The J. Paul Getty Trust (philanthropic organization) (12/2007 to 8/2018) | |||
Other Directorships Held by Trustee During Past 5 Years: None | |||
1 Mr. Nerud is an “interested person” of the Trust due to his position with JNAM, the Adviser. | |||
2 The Interested Trustee and the Independent Trustees are elected to serve for an indefinite term. | |||
3 The Board Chairperson may be reelected for a second three-year term. If the Board Chairperson has served two consecutive terms, he or she may not serve again as the Board Chairperson, unless at least one year has elapsed since the end of his or her second consecutive term as Board Chairperson. | |||
89
Trustees and Officers of JNL Series Trust (“Trust”)
Name, Address, and (Age) | Position(s) Held with the Trust (Length of Time Served) | |
Officers | ||
Emily J. Bennett (35) 1 Corporate Way Lansing, MI 48951 | Assistant Secretary (3/2016 to present) | |
Principal Occupation(s) During Past 5 Years: Assistant Vice President of JNAM (2/2018 to present); Associate General Counsel of JNAM (3/2016 to present); Senior Attorney of JNAM (10/2013 to 3/2016); Assistant Secretary of other investment companies advised by JNAM (3/2016 to present, 5/2012 to present, and 3/2016 to 7/2018); Vice President and Secretary of an investment company advised by PPM America, Inc. (11/2017 to present); Assistant Secretary of Curian Series Trust (5/2012 to 2/2016) | ||
Kelly L. Crosser (46) 1 Corporate Way Lansing, MI 48951 | Assistant Secretary (9/2007 to present) | |
Principal Occupation(s) During Past 5 Years: Manager, Legal Regulatory Filings and Print of JNAM (1/2018 to present); Manager, Legal Regulatory Filings and Print of Jackson National Life Insurance Company (“Jackson”) (12/2013 to 12/2017); Assistant Secretary of other investment companies advised by JNAM (10/2011 to present, 9/2007 to present, and 8/2012 to 7/2018); Assistant Secretary of Curian Series Trust (11/2010 to 2/2016) | ||
Richard J. Gorman (53) 1 Corporate Way Lansing, MI 48951 | Chief Compliance Officer (8/2018 to present) Anti-Money Laundering Officer (8/2018 to present) | |
Principal Occupation(s) During Past 5 Years: Senior Vice President and Chief Compliance Officer of JNAM (8/2018 to present); Chief Compliance Officer and Anti-Money Laundering Officer of other investment companies advised by JNAM (8/2018 to present), Chief Compliance Officer and Deputy General Counsel of Heitman LLC (2/2018 to 8/2018); Chief Compliance Officer of the Oakmark Funds (6/2006 to 1/2018) | ||
William P. Harding (44) 1 Corporate Way Lansing, MI 48951 | Vice President (11/2012 to present) | |
Principal Occupation(s) During Past 5 Years: Senior Vice President and Chief Investment Officer of JNAM (6/2014 to present); Vice President of Curian Series Trust (5/2014 to 2/2016); Vice President, Investment Management of JNAM (10/2012 to 6/2014); Vice President of Curian Capital, LLC (2/2013 to 4/2015); Vice President of other investment companies advised by JNAM (5/2014 to present, 11/2012 to present, and 11/2012 to 7/2018) | ||
Daniel W. Koors (48) 1 Corporate Way Lansing, MI 48951 | Vice President (12/2006 to present) Treasurer & Chief Financial Officer (9/2016 to present) | |
Principal Occupation(s) During Past 5 Years: Senior Vice President of JNAM (1/2009 to present); Chief Operating Officer of JNAM (4/2011 to present); Vice President of other investment companies advised by JNAM (1/2018 to present, 12/2006 to present, and 8/2012 to 7/2018); Treasurer and Chief Financial Officer of other investment companies advised by JNAM (9/2016 to present and 10/2011 to present); Principal Financial Officer, Treasurer, and Vice President of an investment company advised by PPM America, Inc. (11/2017 to present); Treasurer and Chief Financial Officer of Curian Series Trust (11/2010 to 2/2016) | ||
90
Trustees and Officers of JNL Series Trust (“Trust”)
Name, Address, and (Age) | Position(s) Held with the Trust (Length of Time Served) | |
Kristen K. Leeman (43) 1 Corporate Way Lansing, MI 48951 | Assistant Secretary (6/2012 to present) | |
Principal Occupation(s) During Past 5 Years: Regulatory Analyst of JNAM (1/2018 to present); Regulatory Analyst of Jackson (2/2014 to 12/2017); Senior Paralegal of Jackson (3/2006 to 2/2014); Assistant Secretary of other investment companies advised by JNAM (1/2018 to present, 6/2012 to present, and 8/2012 to 7/2018) | ||
Adam C. Lueck (36) 1 Corporate Way Lansing, MI 48951 | Assistant Secretary (3/2018 to present) | |
Principal Occupation(s) During Past 5 Years: Senior Attorney of JNAM (2/2018 to present); Attorney of JNAM (10/2015 to 2/2018); Assistant Secretary of other investment companies advised by JNAM (3/2018 to present, 12/2015 to present, and 3/2018 to 7/2018); Assistant Secretary of Curian Series Trust (12/2015 to 2/2016); Supervising Attorney, Johnson, Blumberg & Associates, LLC (10/2013 to 10/2015) | ||
Mia K. Nelson (36) 1 Corporate Way Lansing, MI 48951 | Assistant Vice President (8/2017 to present) | |
Principal Occupation(s) During Past 5 Years: Assistant Vice President, Tax of JNAM (3/2017 to present); Director – Tax of JNAM (3/2015 to 3/2017); Manager – Tax of JNAM (5/2013 to 3/2015); Assistant Vice President of other investment companies advised by JNAM (9/2017 to present, 8/2017 to present, and 8/2017 to 7/2018) | ||
Joseph B. O’Boyle (56) 1 Corporate Way Lansing, MI 48951 | Vice President (1/2018 to present) Acting Chief Compliance Officer (5/2018 to 8/2018) Acting Anti-Money Laundering Officer (5/2018 to 8/2018) | |
Principal Occupation(s) During Past 5 Years: Vice President of JNAM (8/2015 to present); Acting Chief Compliance Officer of JNAM (5/2018 to 8/2018); Vice President of other investment companies advised by JNAM (1/2018 to present and 1/2018 to 7/2018); Acting Chief Compliance Officer and Acting Anti-Money Laundering Officer of other investment companies advised by JNAM (5/2018 to 8/2018), Anti-Money Laundering Officer of another investment company advised by JNAM (12/2015 to 1/2018); Chief Compliance Officer of another investment company advised by JNAM (5/2012 to 1/2018); Chief Compliance Officer and Anti-Money Laundering Officer of an investment company advised by PPM America, Inc. (2/2018 to present); Chief Compliance Officer of Curian Series Trust (5/2012 to 2/2016) | ||
Susan S. Rhee (47) 1 Corporate Way Lansing, MI 48951 | Vice President, Chief Legal Officer, and Secretary (2/2004 to present) | |
Principal Occupation(s) During Past 5 Years: Senior Vice President and General Counsel of JNAM (1/2010 to present); Secretary of JNAM (11/2000 to present); Vice President, Chief Legal Officer, and Secretary of other investment companies advised by JNAM (10/2011 to present, 2/2004 to present, and 8/2012 to 7/2018); Vice President and Assistant Secretary of an investment company advised by PPM America, Inc. (11/2017 to present); Vice President, Chief Legal Officer and Secretary of Curian Series Trust (11/2010 to 2/2016) | ||
91
Trustees and Officers of JNL Series Trust (“Trust”)
The interested Trustee and the Officers of the Trust or the Adviser do not receive any compensation from the Trust for their services as Trustees or Officers. The following persons, who are Independent Trustees of the Trust, received from the Trust the compensation amounts indicated for their services as such for the 12-month period ended December 31, 2018:
Trustee | Aggregate Compensation from the Trust1 | Pension or Retirement Benefits Accrued As Part of Trust Expenses | Estimated Annual Benefits Upon Retirement | Total Compensation from the Trust and Fund Complex 1 |
Eric O. Anyah | $269,317 | $0 | $0 | $318,500 3 |
Michael Bouchard | $283,691 | $0 | $0 | $335,500 |
Ellen Carnahan | $277,772 | $0 | $0 | $328,500 4 |
William J. Crowley, Jr.2 | $331,044 | $0 | $0 | $391,500 5 |
Michelle Engler | $253,250 | $0 | $0 | $299,500 |
John Gillespie | $277,772 | $0 | $0 | $328,500 6 |
William R. Rybak | $292,147 | $0 | $0 | $345,500 |
Mark S. Wehrle | $269,317 | $0 | $0 | $318,500 7 |
Edward Wood | $277,772 | $0 | $0 | $328,500 8 |
Patricia Woodworth | $265,088 | $0 | $0 | $313,500 |
1 The fees paid to the Independent Trustees are paid for combined service on the Boards of the Trust, JNL Investors Series Trust, JNL Variable Fund LLC, and Jackson Variable Series Trust (the “Fund Complex”). The fees are allocated to the Fund Complex and affiliated investment companies on a pro-rata basis based on net assets. The total fees paid to all the Independent Trustees is $3,308,000.
2 Mr. Crowley is an ex-officio member of the Governance Committee and the Audit Committee. Therefore, he does not receive any compensation as a member of these Committees.
3 Amount includes $120,850 deferred by Mr. Anyah.
4 Amount includes $164,250 deferred by Ms. Carnahan.
5 Amount includes $195,750 deferred by Mr. Crowley.
6 Amount includes $164,250 deferred by Mr. Gillespie.
7 Amount includes $63,700 deferred by Mr. Wehrle.
8 Amount includes $164,250 deferred by Mr. Wood.
The Statement of Additional Information includes additional information about Fund Trustees and may be obtained at no charge by calling 1-800-644-4565 (Jackson Service Center) or 1-800-599-5651 (Jackson NY Service Center), by writing the JNL Series Trust, P.O. Box 30314, Lansing, Michigan 48909-7814, or by visiting www.jackson.com.
92
(the “Trust”)
APPROVAL OF THE TRUST’S
INVESTMENT ADVISORY AND SUB-ADVISORY AGREEMENTS
(Master-Feeder Funds and Funds-of-Funds)
The Board of Trustees of the Trust (“Board”) oversees the management of the Trust and its separate series (each a “Fund” and collectively the “Funds”) and, as required by law, determines annually whether to approve the Trust’s advisory agreement (“Advisory Agreement”) with Jackson National Asset Management, LLC (“JNAM”) and with the Sub-Adviser to certain Funds (“Sub-Advisory Agreement” and, collectively with the Advisory Agreement, the “Agreements”).
At in-person meetings held on June 4-6, 2018 and August 27-29, 2018, the Board, including all of the trustees who are not considered interested persons of the Funds (as defined in the Investment Company Act of 1940, as amended) (the “Independent Trustees”), considered information relating to the continuation of these Agreements. In advance of the meetings, independent legal counsel for the Independent Trustees requested that certain information be provided to the Board relating to the Agreements. The Board received, and had the opportunity to review, this and other materials, ask questions and request further information in connection with its consideration. At the conclusion of the Board’s discussions, the Board approved the Agreements through September 30, 2019.
In reviewing the Agreements and considering the information, the Board was advised by outside independent legal counsel. The Board considered the factors it deemed relevant, including: (1) the nature, quality and extent of the services provided, (2) the investment performance of each Fund, (3) cost of services for each Fund, (4) profitability data, (5) whether economies of scale may be realized and shared, in some measure, with investors as each Fund grows, and (6) other benefits that may accrue to JNAM or the Sub-Adviser through its relationship with the Trust. In its deliberations, the Board, in exercising its business judgment did not identify any single factor that alone was responsible for the Board’s decision to approve the Agreements.
Before approving the Agreements, the Independent Trustees met in executive session with their independent legal counsel to consider the materials provided by JNAM and the Sub-Adviser and the terms of the Agreements. Based on its evaluation of those materials and the information the Board received throughout the year at its regular meetings, the Board, including the interested and Independent Trustees, concluded that the Agreements are in the best interests of the shareholders of each applicable Fund. In reaching its conclusions, the Board considered numerous factors, including the following:
Nature, Quality and Extent of Services
The Board examined the nature, quality and extent of the services provided by JNAM and the Sub-Adviser.
For each Fund, the Board considered the services provided by JNAM, including but not limited to its oversight of the Sub-Adviser, where applicable, pursuant to the Advisory Agreement and its recommendations on an ongoing basis as to the hiring or removal of sub-advisers pursuant to the Trust’s “Manager of Managers” exemption, as well as the provision of recordkeeping and compliance services to the Funds. The Board also took into account that JNAM monitors the performance of the various organizations that provide services to the Funds, including the Funds’ distributor and custodian. With respect to JNAM’s oversight of the Sub-Adviser, the Board noted that JNAM is responsible for screening and recommending new sub-advisers when appropriate, as well as monitoring and reporting to the Board on a regular basis as to the performance and operations of the existing Sub-Adviser. The Board also considered the investment sub-advisory services provided by the Sub-Adviser. The Board noted JNAM’s evaluation of the Sub-Adviser, as well as JNAM’s recommendations, based on its review of the Sub-Adviser, to approve the Sub-Advisory Agreement. The Board also considered the various business-related risks JNAM faces as a result of managing the Funds, including entrepreneurial, legal and litigation risks, some of which may be significant.
The Board reviewed the qualifications, backgrounds and responsibilities of JNAM’s senior management that are responsible for oversight of the Funds and the Sub-Adviser, and also reviewed the qualifications, backgrounds and responsibilities of JNAM and the Sub-Adviser’s portfolio managers who are responsible for the day-to-day management of each Fund. The Board reviewed information pertaining to JNAM’s and the Sub-Adviser’s organizational structure, senior management, financial condition, investment operations, and other relevant information pertaining to both JNAM and the Sub-Adviser. The Board considered compliance reports about JNAM and the Sub-Adviser from the Funds’ Chief Compliance Officer.
Based on the foregoing, the Board concluded that (i) each Fund is likely to continue to benefit from the nature, extent and quality of the services provided by JNAM under the Advisory Agreement and (ii) each applicable Fund is likely to continue to benefit from the nature, extent and quality of the services provided by the Sub-Adviser under the Sub-Advisory Agreement.
Investment Performance of the Funds
The Board considered the investment performance of each Fund as described in quarterly reports prepared by management. The Board noted that JNAM reviews with the Board on a quarterly basis detailed information about each Fund’s performance results and investment strategies. The
93
Board also considered the performance of each Fund, including how the Fund’s gross performance (unless otherwise noted) compared to the average performance of a group of comparable funds (“peer group”) selected by an independent data service and how the Fund performed versus its primary benchmark (“benchmark”) index. For certain Funds, the Board considered the relevant custom benchmark, blended benchmark, or custom peer group. This consideration was based on JNAM’s assertion that the custom or blended benchmark or custom peer group is, in some circumstances, a more meaningful source of comparative information than a broad-based benchmark index or peer group for certain Funds that use a limited or unique investment focus or where the peer group may not be a good source of comparative information. With respect to these peer groups and custom peer groups, the Board further considered that comparison to these groups provides a helpful way to measure the Funds’ performance, but noted that peer universes are constantly evolving, and as such, the Funds’ peer groups and, where applicable, custom peer groups, may change from time to time. The performance reviewed by the Board was for periods ended on December 31, 2017 (unless otherwise noted). When available, the Board considered one-, three-, five- and ten-year performance.
JNL Aggressive Growth Allocation Fund. The Board considered that, after expenses, the Fund outperformed its custom peer group for the one- and three-year periods, though it underperformed for the other periods. The Board also considered that, after expenses, the Fund outperformed its blended benchmark for the five- and ten-year periods, though it underperformed for the other periods. The Board further took into account the Fund’s recent performance as of March 31, 2018, noting that, after expenses, the Fund outperformed the custom peer group for the year-to-date and one-year periods and blended benchmark for the year-to-date period. The Board concluded that it would be in the best interests of the Fund and its shareholders to renew the Agreement.
JNL/American Funds Balanced Fund. The Board noted that the Fund was restructured to operate as a “feeder fund” of the Master Fund effective April 24, 2017 and performance data reflecting its current structure encompassed less than one calendar year as of December 31, 2017. The Board considered that the Fund outperformed its blended benchmark and peer group for the year-to-date and one-year periods ended June 30, 2018, which represents performance under the Fund’s “feeder fund” structure. The Board noted that it would be prudent to allow the team more time to develop its performance record with the Fund in its current structure. The Board concluded that it would be in the best interests of the Fund and its shareholders to renew the Agreement.
JNL/American Funds Blue Chip Income and Growth Fund. The Board considered that the Fund outperformed its peer group for the one-, three- and five-year periods and benchmark for the five-year period, though it underperformed its benchmark for the other periods. The Board concluded that it would be in the best interests of the Fund and its shareholders to renew the Agreement.
JNL/American Funds Global Bond Fund. The Board considered that the Fund outperformed its benchmark for the five-year period and while it underperformed for the one- and three-year periods, the Fund lagged its benchmark by only one basis point for three-year period. The Board also considered that the Fund underperformed its peer group for all periods. The Board noted that, as of March 31, 2018, the Fund outperformed its benchmark and peer group for the three-month period, ranking in the 35th percentile of its peer group for the period. The Board concluded that it would be in the best interests of the Fund and its shareholders to renew the Agreement.
JNL/American Funds Global Small Capitalization Fund. The Board noted that the Fund outperformed its benchmark for the one-year period, though it underperformed its benchmark for the remaining periods and the peer group for all periods. The Board further considered that the Fund outperformed its benchmark for three of the past four calendar years. The Board took into account JNAM’s assertion that, while short periods of underperformance have impacted the Fund’s relative performance, it maintains conviction in the portfolio management team. The Board also observed the Fund’s recent performance, noting that the Fund outperformed its peer group and benchmark for the year-to-date and one-year periods ended June 30, 2018. The Board concluded that it would be in the best interests of the Fund and its shareholders to renew the Agreement.
JNL/American Funds Growth Allocation Fund. The Board considered that the Fund outperformed its blended benchmark and custom peer group for the one-, three- and five-year periods. The Board concluded that it would be in the best interests of the Fund and its shareholders to renew the Agreement.
JNL/American Funds Growth-Income Fund. The Board considered that the Fund outperformed its peer group for the one-, three- and five-year periods and its benchmark for the one- and three-year periods, though it underperformed its benchmark for five-year period. The Board concluded that it would be in the best interests of the Fund and its shareholders to renew the Agreement.
JNL/American Funds International Fund. The Board noted that the Fund outperformed its benchmark for the one-, three- and five-year periods, though it underperformed its peer group for the same periods (ranking in the 53rd and 50th percentile of its peer group for the one- and five-year periods). The Board concluded that it would be in the best interests of the Fund and its shareholders to renew the Agreement.
JNL/American Funds Moderate Growth Allocation Fund. The Board considered that the Fund outperformed, after expenses, its custom peer group and blended benchmark for the one-, three- and five-year periods. The Board concluded that it would be in the best interests of the Fund and its shareholders to renew the Agreement.
JNL/American Funds New World Fund. The Board considered that the Fund outperformed its benchmark for the one- and three-year periods, though it underperformed for the five-year period. The Board noted JNAM’s assertion that a custom peer group was more representative of the sub-adviser’s investment approach, which includes exposure to certain international securities held in developing markets. The Board considered that the Fund outperformed its custom peer group for the five-year period (ranking in the top third of the custom peer group for this period and in the 4th and 7th
94
percentiles for calendar years 2015 and 2013, respectively), though it underperformed for the other periods. The Board took into account the Fund’s recent performance noting that, as of June 30, 2018, it outperformed its custom peer group for the one-, three- and five-year periods. The Board concluded that it would be in the best interests of the Fund and its shareholders to renew the Agreement.
JNL/DFA Growth Allocation Fund and JNL/DFA Moderate Growth Allocation Fund. The Board noted that each Fund commenced operations in April 2017 and had less than one year of performance data as of December 31, 2017. The Board noted, therefore, that it would be prudent to allow the team more time to develop its performance record with each Fund. The Board concluded that it would be in the best interests of each Fund and its shareholders to renew each Fund’s Agreement.
JNL/Franklin Templeton Founding Strategy Fund. The Board considered that the Fund outperformed its blended benchmark for the five- and ten-year periods, though it underperformed for the other periods. The Board considered the Fund’s unique investment mandate as well as information from JNAM indicating that the Fund is managed in a manner consistent with that mandate and that, because of the Fund’s unique investment mandate, the blended benchmark is the appropriate comparative performance source. The Board noted that, as the Fund invests equally in only three underlying funds, its investment performance will depend on the performance of the underlying funds, each of whose performance is evaluated by the Board separately. The Board further considered JNAM’s assertion that it has long-term conviction in each of the three underlying funds. Given these considerations, the Board concluded that it would be in the best interests of the Fund and its shareholders to renew the Agreement.
JNL Growth Allocation Fund. The Board considered that, after expenses, the Fund outperformed its custom peer group for the one-, three- and five-year periods, though it underperformed for the ten-year period. The Board also considered that, after expenses, the Fund outperformed its blended benchmark for the five- and ten-year periods, though it underperformed for the other periods. The Board concluded that it would be in the best interests of the Fund and its shareholders to renew the Agreement.
JNL Institutional Alt 25 Fund. The Board noted the Fund’s unique investment mandate, with a 25% target allocation to alternative assets, and considered information from JNAM indicating that the Fund is managed in a manner consistent with that mandate. It also noted JNAM’s assertion that, due to the unique investment mandate, the blended benchmark provides the most meaningful performance comparison, followed by the Fund’s custom peer group. The Board therefore considered that, after expenses, the Fund outperformed its blended benchmark for the one-, three- and five-year periods. It also noted that, after expenses, the Fund outperformed its custom peer group for the one-year period, though it underperformed for the other periods. The Board further considered the recent steps JNAM has taken to enhance its management of the Fund, including its assumption of full managerial responsibility in April 2015 and its proposal of investment strategy changes effective on or about September 25, 2017, and noted JNAM’s assertion that over a full market cycle, it expects these steps to contribute to the Fund’s performance. The Board concluded that it would be in the best interests of the Fund and its shareholders to renew the Agreement.
JNL Institutional Alt 50 Fund. The Board noted the Fund’s unique investment mandate, with a 50% target allocation to alternative assets, and considered information from JNAM indicating that the Fund is managed in a manner consistent with that mandate. It also noted JNAM’s assertion that, due to the Fund’s unique investment mandate, the blended benchmark provides the most meaningful performance comparison, followed by the Fund’s custom peer group. The Board therefore considered that, after expenses, the Fund outperformed its blended benchmark for the one-, three- and five-year periods, though it underperformed its custom peer group for all periods. The Board further considered the Fund’s recent performance, as of March 31, 2018, noting that, after expenses, the Fund outperformed its blended benchmark for the one-, three- and five-year periods and custom peer group for the year-to-date period. The Board concluded that it would be in the best interests of the Fund and its shareholders to renew the Agreement.
JNL/Mellon Capital 10 x 10 Fund. The Board considered that the Fund underperformed its blended benchmark for all periods. The Board noted the Fund’s unique investment mandate and considered information from JNAM indicating that the Fund is managed in a manner consistent with that mandate and that, because it has no true “peers”, its blended benchmark is the appropriate comparative performance source. The Board also took into account that, since the Fund invests in six underlying funds, its investment performance will depend on the performance of those underlying funds, each of whose performance is evaluated by the Board separately. Given these considerations, the Board concluded that it would be in the best interests of the Fund and its shareholders to renew the Agreement.
JNL/Mellon Capital Index 5 Fund. The Board considered that the Fund surpassed its custom benchmark for all periods. The Board noted the Fund’s unique investment mandate and considered information from JNAM indicating that the Fund is managed in a manner consistent with that mandate and that, because it has no true “peers”, its custom benchmark is the appropriate comparative performance source. The Board also took into account that, since the Fund invests equally in five underlying funds, its investment performance will depend on the performance of those underlying funds, each of whose performance is evaluated by the Board separately. The Board considered JNAM’s assertion that it was comfortable with the performance of the Fund as the underlying funds had each performed in line with JNAM’s expectations. Given these considerations, the Board concluded that it would be in the best interests of the Fund and its shareholders to renew the Agreement.
JNL Moderate Growth Allocation Fund. The Board considered that, after expenses, the Fund outperformed its custom peer group for the one-, three-, five- and ten-year periods and outperformed its blended benchmark for the five- and ten-year periods, though it underperformed its blended benchmark for the other periods. The Board concluded that it would be in the best interests of the Fund and its shareholders to renew the Agreement.
JNL/S&P 4 Fund. The Board noted the Fund’s unique investment mandate and considered information from JNAM indicating that the Fund is managed in a manner consistent with that mandate and that, because it has no true “peers”, its benchmark is the appropriate comparative performance source. The Board considered that the Fund outperformed its benchmark for the ten-year period, though it underperformed for the other periods. The
95
Board also considered that, as of June 30, 2018, the Fund outperformed its benchmark for the year-to-date, one- and ten-year periods. The Board also took into account that, since the Fund invests in four underlying funds, its investment performance will depend on the performance of those underlying funds, each of whose performance is evaluated by the Board separately. The Board concluded that it would be in the best interests of the Fund and its shareholders to renew the Agreement.
JNL/S&P Managed Aggressive Growth Fund. The Board took into account that, after expenses, the Fund outperformed its custom peer group for the one-, three-, five- and ten-year periods, though the Fund underperformed its blended benchmark for all periods. The Board noted JNAM’s assertion that the custom peer group provides the more meaningful performance comparison for the Fund because the funds included in the peer group are more narrowly screened for similar investment allocations as selected by an independent third party. The Board concluded that it would be in the best interests of each Fund and its shareholders to renew the Agreements.
JNL/S&P Managed Conservative Fund. The Board considered that, after expenses, the Fund underperformed its custom peer group and blended benchmark for all periods. The Board further considered the Fund’s recent performance, noting that the Fund outperformed (after expenses) its custom peer group for the year-to-date period (ranking in the 30th percentile of its custom peer group) and blended benchmark for the year-to-date and one-year periods ended June 30, 2018. The Board concluded that it would be in the best interests of the Fund and its shareholders to renew the Agreements.
JNL/S&P Managed Growth Fund. The Board took into account that, after expenses, the Fund outperformed its custom peer group for the one-, three-, five- and ten-year periods. The Board also considered that, after expenses, the Fund outperformed its blended benchmark for the one-year period, though it underperformed for the other periods. The Board concluded that it would be in the best interests of each Fund and its shareholders to renew the Agreements.
JNL/S&P Managed Moderate Fund. The Board took into account that, after expenses, the Fund outperformed its custom peer group for the one- and three-year periods, though it underperformed by four basis points for the five-year period and underperformed for the ten-year period. The Board considered that the Fund outperformed its blended benchmark for the one-year period, though it underperformed for the other periods. The Board further considered the Fund’s recent performance, noting that, after expenses, the Fund outperformed its custom peer group and blended benchmark for the year-to-date and one-year periods ended March 31, 2018. The Board concluded that it would be in the best interests of the Fund and its shareholders to renew the Agreements.
JNL/S&P Managed Moderate Growth Fund. The Board took into account that, after expenses, the Fund outperformed its custom peer group for the one-, three-, five- and ten-year periods. The Board also considered that the Fund outperformed, after expenses, its blended benchmark for the one-year period, though it underperformed for the other periods. The Board further considered the Fund’s recent performance, noting that, after expenses, the Fund outperformed its custom peer group and blended benchmark for the year-to-date and one-year periods ended March 31, 2018. The Board concluded that it would be in the best interests of the Fund and its shareholders to renew the Agreements.
JNL/Vanguard Capital Growth Fund, JNL/Vanguard Equity Income Fund, JNL/Vanguard International Fund, JNL/Vanguard Small Company Growth Fund, JNL/Vanguard Global Bond Market Index Fund, JNL/Vanguard International Stock Market Index Fund and JNL/Vanguard U.S. Stock Market Index Fund. The Board noted that each Fund commenced operations in September 2017 and had less than one year of performance data. The Board noted, therefore, that it would be prudent to allow the team more time to develop its performance record with each Fund. The Board concluded that it would be in the best interests of each Fund and its shareholders to renew each Fund’s Agreement.
Costs of Services
The Board reviewed the fees paid to JNAM and the Sub-Adviser. For each Fund, the Board reviewed fee and expense information as compared to that of comparable funds managed by other advisers, as well as fees charged by the Sub-Adviser to similar clients, if any. The Board also noted that JNAM does not manage any institutional accounts with which the Funds’ fees could be compared. Using information provided by an independent data service, the Board evaluated each Fund’s advisory fees compared to the average advisory fees for other funds similar in size, character and investment strategy (the “peer group”). The Board considered each Fund’s total expense ratio and compared that to the average total expense ratio of the peer group. For certain Funds, the Board considered the total expense ratio without the inclusion of, where applicable, transfer agency and Rule 12b-1 fees. This consideration was based on JNAM’s assertion that, due to the composition of certain peer groups that contain both retail and variable annuity funds, the total expense ratio (excluding transfer agency and Rule 12b-1 fees) was a more meaningful source of comparative information. While the Board also considered, where applicable, each Fund’s sub-advisory fee and compared that to the average sub-advisory fee of the peer group, the Board noted that each Fund’s sub-advisory fee would be paid by JNAM (not the Fund) and, therefore, would be neither a direct shareholder expense nor a direct influence on a Fund’s total expense ratio. The Board noted that comparison to peer groups provides a helpful way to evaluate the Funds’ fees, but took into account that peer group universes are constantly evolving, and as such, the universe of comparable funds in the Funds’ peer groups may change from time to time.
The Board also took into account that various fee reductions and other fee changes were implemented for certain Funds on September 25, 2017. It noted that these reductions will serve to further reduce certain Funds’ advisory fees and/or total expense ratios.
Further detail considered by the Board regarding the advisory and sub-advisory fees of each Fund is set forth below:
96
JNL Aggressive Growth Allocation Fund and JNL Growth Allocation Fund. The Board took into account that each Fund’s advisory fee is lower than its peer group average. The Board considered that each Fund’s total expense ratio (excluding underlying fund expenses), though higher than its peer group average, is within five basis points of the peer group average. The Board noted that each of the Funds’ underlying funds is subject to individual oversight. The Board also considered that neither Fund has a sub-advisory fee. The Board concluded that the fees are in the best interests of each Fund and its shareholders in light of the services provided.
JNL/American Funds Balanced Fund. The Board considered that the Fund’s advisory fee is lower than the peer group average, though the Fund’s total expense ratio (including Master Fund expenses) is higher than the peer group average. The Board took into account JNAM’s representation that the Fund’s proforma total expense ratio (including Master Fund expenses), as of April 30, 2018, is lower than the peer group average as of December 31, 2017. The Board further considered that the Fund has no sub-advisory fee. The Board concluded that the fees are in the best interests of the Fund and its shareholders in light of the services provided.
JNL/American Funds Blue Chip Income and Growth Fund, JNL/American Funds Global Small Capitalization Fund and JNL/American Funds New World Fund. The Board noted that each Fund’s advisory fee and total expense ratio (including Master Fund expenses) are lower than the respective peer group averages. The Board considered that the Funds have no sub-advisory fees. The Board concluded that the fees are in the best interests of each Fund and its shareholders in light of the services provided.
JNL/American Funds Global Bond Fund. The Board noted that the Fund’s advisory fee is lower than the peer group average, though its total expense ratio (including Master Fund expenses) is higher than the peer group average. The Board took into account that the Fund’s total expense ratio (including Master Fund expenses) is within four basis points of the peer group average. The Board also noted that JNAM, in conversations with the Board, implemented additional advisory fee breakpoints on September 25, 2017, which will serve to reduce the Fund’s total expense ratio if the Fund’s assets grow. The Board considered that the Fund has no sub-advisory fee. The Board concluded that the fees are in the best interests of the Fund and its shareholders in light of the services provided.
JNL/American Funds Growth Allocation Fund. The Board considered that the Fund’s advisory fee and total expense ratio (including underlying fund expenses) are higher than the respective peer group averages. The Board considered that the Fund has no sub-advisory fee. It further considered JNAM’s assertions that additional underlying investment options for the Fund, approved by the Board in June 2017, have decreased the Fund’s total expense ratio (including underlying fund expenses) and that the Fund’s proforma total expense ratio (including underlying fund expenses), as of April 30, 2018, is within five basis points of the peer group average as of December 31, 2017. The Board concluded that the fees are in the best interests of the Fund and its shareholders in light of the services provided.
JNL/American Funds Growth-Income Fund. The Board noted that the Fund’s advisory fee is lower than the peer group average, though the Fund’s total expense ratio (including Master Fund expenses) is higher than the peer group average. The Board took into account that the Fund’s total expense ratio (including Master Fund expenses) is within five basis points of the peer group average. The Board considered that the Fund has no sub-advisory fee. The Board concluded that the fees are in the best interests of the Fund and its shareholders in light of the services provided.
JNL/American Funds International Fund. The Board noted that the Fund’s advisory fee is lower than the peer group average and the Fund’s total expense ratio (including Master Fund expenses) is equal to the peer group average. The Board considered that the Fund has no sub-advisory fee. The Board concluded that the fees are in the best interests of the Fund and its shareholders in light of the services provided.
JNL/American Funds Moderate Growth Allocation Fund. The Board noted that the Fund’s advisory fee and total expense ratio (including underlying fund expenses) are higher than the respective peer group averages, though the total expense ratio (including underlying fund expenses) is only three basis points above the peer group average. It further considered JNAM’s assertion that additional underlying investment options for the Fund, approved by the Board in June 2017 meeting, have lowered the Fund’s total expense ratio (including underlying fund expenses). The Board considered that the Fund has no sub-advisory fee. The Board concluded that the fees are in the best interests of the Fund and its shareholders in light of the services provided.
JNL/DFA Growth Allocation Fund and JNL/DFA Moderate Growth Allocation Fund. The Board considered that each Fund’s total expense ratio (including underlying fund expenses) is lower than its peer group average, though each Fund’s advisory fee is higher than its peer group average. The Board noted that neither Fund has a sub-advisory fee. The Board also took into account that JNAM, in conversations with the Board, entered into a contractual agreement to waive .05% of each Fund’s advisory fee effective July 1, 2017. The Board concluded that the fees are in the best interests of each Fund and its shareholders in light of the services provided.
JNL/Franklin Templeton Founding Strategy Fund, JNL/Mellon Capital 10 x 10 Fund, JNL/Mellon Capital Index 5 Fund and JNL/S&P 4 Fund. The Board considered that the Funds have no advisory or sub-advisory fees. The Board noted that each Fund’s total expense ratio (excluding underlying Fund expenses) is lower than its peer group average and each of the underlying funds is subject to individual oversight by the Board. The Board concluded that the fees are in the best interests of each Fund and its shareholders in light of the services provided.
JNL Institutional Alt 25 Fund. The Board noted that the Fund’s total expense ratio (excluding underlying fund expenses) is lower than the peer group average and the Fund’s advisory fee is one basis point higher than its peer group average. The Board considered that the Fund has no sub-advisory fee. The Board concluded that the fees are in the best interests of the Fund and its shareholders in light of the services provided.
97
JNL Institutional Alt 50 Fund. The Board noted that the Fund’s total expense ratio (excluding underlying fund expenses) is lower than the peer group average and the Fund’s advisory fee is only one basis point higher than its peer group average. The Board considered that the Fund has no sub-advisory fee. The Board concluded that the fees are in the best interests of the Fund and its shareholders in light of the services provided.
JNL Moderate Growth Allocation Fund. The Board took into account that the Fund’s advisory fee and total expense ratio (excluding underlying Fund expenses) are higher than their peer group averages. The Board noted that the Funds advisory fee is only one basis point higher than the peer group average and that each of the Fund’s underlying funds is subject to individual oversight. The Board also considered that the Fund has no sub-advisory fee. The Board concluded that the fees are in the best interests of the Fund and its shareholders in light of the services provided.
JNL/S&P Managed Aggressive Growth Fund and JNL/S&P Managed Growth Fund. The Board took into account that each Fund’s advisory and sub-advisory fees are lower than their respective peer group averages, though each Fund’s total expense ratio (excluding underlying fund expenses) is higher to its peer group average. The Board noted that each Fund’s total expense ratio (excluding underlying fund expenses) is within six basis points of its peer group average. The Board concluded that the fees are in the best interests of each Fund and its shareholders in light of the services provided.
JNL/S&P Managed Conservative Fund. The Board took into account that the Fund’s advisory and sub-advisory fees are lower than their peer group averages, though the total expense ratio (excluding underlying fund expenses) is higher than the peer group average. The Board also noted that JNAM, in conversations with the Board, implemented additional advisory fee breakpoints on September 25, 2017 that will serve to reduce the Fund’s advisory fee and total expense ratio if the Fund’s assets grow. The Board concluded that the fees are in the best interests of the Fund and its shareholders in light of the services provided.
JNL/S&P Managed Moderate Fund. The Board took into account that the Fund’s advisory and sub-advisory fees are lower their respective peer group averages. The Board also considered the Fund’s total expense ratio (excluding underlying fund expenses) is only five basis points higher than the peer group average. The Board concluded that the fees are in the best interests of the Fund and its shareholders in light of the services provided.
JNL/S&P Managed Moderate Growth Fund. The Board considered that the Fund’s advisory and sub-advisory fees are lower than their respective peer group averages. The Board also noted that the total expense ratio (excluding underlying fund expenses) is only two basis points higher than the peer group average. The Board concluded that the fees are in the best interests of the Fund and its shareholders in light of the services provided.
JNL/Vanguard Capital Growth Fund, JNL/Vanguard Equity Income Fund, JNL/Vanguard International Fund and JNL/Vanguard Small Company Growth Fund. The Board considered that each Fund’s advisory fee and total expense ratio (including Master Fund expenses) are lower than their respective peer group averages. The Board also considered that the Funds have no sub-advisory fees. The Board concluded that the fees are in the best interests of each Fund and its shareholders in light of the services provided.
JNL/Vanguard Global Bond Market Index Fund, JNL/Vanguard International Stock Market Index Fund and JNL/Vanguard U.S. Stock Market Index Fund. The Board considered that each Fund’s advisory fee and total expense ratio (including underlying fund expenses) are lower than their respective peer group averages. The Board also considered that the Funds have no sub-advisory fees. The Board concluded that the fees are in the best interests of each Fund and its shareholders in light of the services provided.
Economies of Scale
The Board considered whether each Fund’s advisory fee reflects the potential for economies of scale for the benefit of Fund shareholders. Based on information provided by JNAM, the Board noted that the fee arrangement for each Fund contains breakpoints that decrease the advisory fee rate as assets increase. Additionally, the Board considered JNAM’s assertion that it continually evaluates the advisory fee and breakpoint schedules for the Funds, and it considered the extent to which economies of scale are reflected for the benefit of shareholders. The Board concluded that the advisory fee structure in some measure, allows for adequate participation by shareholders in economies of scale across the Fund complex. The Board also considered that economies of scale can be shared with the Funds in other ways, including low management fees from inception, additional technological and personnel investments to enhance shareholder services, and maintaining existing expense structures in the face of a rising cost environment.
The Board also considered that the sub-advisory fee rates have been separately negotiated between JNAM and the Sub-Adviser at arm’s length. These sub-advisory fees are paid by JNAM to the Sub-Adviser. For this reason, JNAM, rather than shareholders, directly benefits from these breakpoints. Additionally, to the extent that JNAM is waiving its advisory fee with respect to a certain Fund, it may also be benefitting from the breakpoints in sub-advisory fees. The Board concluded that the sub-advisory fee schedules, where applicable, in some measure allow for adequate participation by shareholders in economies of scale.
Profitability
The Board considered information concerning the costs incurred and profits realized by JNAM and the Sub-Adviser. The Board also considered JNAM’s fee waivers for certain Funds, pursuant to which it has reduced its fees and reimburses other expenses of the Funds, as applicable, to reduce the total annual operating expenses of the Funds. The Board determined that profits realized by JNAM and the Sub-Adviser were not unreasonable.
98
Other Benefits to JNAM and the Sub-Adviser
In evaluating the benefits that may accrue to JNAM through its relationship with the Funds, the Board noted that JNAM and certain of its affiliates serve the Funds in various capacities, including as adviser, administrator, transfer agent and distributor, and receive compensation from the Funds in connection with providing services to the Funds. The Board noted that each service provided to the Funds by JNAM or one of its affiliates is provided pursuant to a written agreement, which the Board evaluates periodically as required by law. The Board also noted that the Sub-Adviser may from time to time pay for portions of meetings organized by the Funds’ distributor to educate wholesalers about the Funds that the Sub-Adviser manages. The Board considered JNAM’s assertion that those meetings do not yield a profit to the Funds’ distributor, that the Sub-Adviser is not required to participate in the meetings and that recommendations to hire or fire the Sub-Adviser are not influenced by the Sub-Adviser’s willingness to participate in the meetings. Lastly, the Board noted that certain affiliates of JNAM may receive benefits under the federal income tax laws with respect to tax deductions and credits.
In evaluating the benefits that may accrue to the Sub-Adviser through its relationship with the Funds, the Board noted that the Sub-Adviser may receive indirect benefits in the form of soft dollar arrangements for portfolio securities trades placed with the Funds’ assets and may also develop additional investment advisory business with JNAM, the Funds or other clients of the Sub-Adviser as a result of its relationship with the Funds.
99
JNL Series Trust
(the “Trust”)
APPROVAL OF THE TRUST’S
INVESTMENT ADVISORY AND SUB-ADVISORY AGREEMENTS
(Master-Feeder Funds and Funds-of-Funds)
The Board of Trustees of the Trust (“Board”) oversees the management of the Trust and its separate Funds and, as required by law, determines whether to approve the Trust’s advisory agreement (“Advisory Agreement”) with Jackson National Asset Management, LLC (“JNAM”) and each Fund’s Sub-Adviser(s) (“Sub-Advisory Agreement” or “Sub-Advisory Agreements,” as applicable, and, collectively with the Advisory Agreement, the “Agreements”).
At a meeting on December 10-12, 2018, the Board, including a majority of the independent trustees, who are not interested persons of the Funds (as defined in the Investment Company Act of 1940, as amended) (the “Independent Trustees”), considered information relating to the appointment of Franklin Advisers, Inc. (“Franklin” or the “Sub-Adviser”) as Sub-Adviser to the JNL/Franklin Templeton Founding Strategy Fund (an existing series of the Trust to be renamed the JNL/Franklin Templeton Growth Allocation Fund) (the “Fund”) and a corresponding amendment to the Trust’s existing Sub-Advisory Agreement with Franklin. The Board also considered an amendment to the Advisory Agreement that would increase the Fund’s advisory fee in connection with the Fund’s other proposed changes.
In advance of the meeting, independent legal counsel for the Independent Trustees requested that certain information be provided to the Board relating to the Agreements. The Board received, and had the opportunity to review, this and other materials, ask questions and request further information in connection with its consideration of the Agreements. With respect to its approval of an amendment to the Sub-Advisory Agreement with Franklin, the Board noted that the Sub-Advisory Agreement was with a Sub-Adviser that already provides services to existing funds in the Trust. Thus, with respect to the Sub-Adviser, the Board also considered relevant information provided at previous Board meetings. At the conclusion of the Board’s discussions, the Board approved the Agreements.
In reviewing the Agreements and considering the information, the Board was advised by outside independent legal counsel. The Board considered the factors it deemed relevant, as applicable, including: (1) the nature, quality and extent of the services to be provided; (2) the investment performance of the Fund; (3) cost of services of the Fund; (4) profitability data; (5) whether economies of scale may be realized and shared, in some measure, with investors as the Fund grows; and (6) other benefits that may accrue to JNAM or the Sub-Adviser through its relationship with the Trust. In its deliberations, the Board, in exercising its business judgment did not identify any single factor that alone was responsible for the Board’s decision to approve the Agreements.
Before approving the Agreements, the Independent Trustees met in executive session with their independent legal counsel to consider the materials provided by JNAM and the Sub-Adviser and to consider the terms of the Agreements. Based on its evaluation of those materials and the information the Board received throughout the year at its regular meetings, the Board, including the interested and Independent Trustees, concluded that the Agreements are in the best interests of the shareholders of the Fund. In reaching its conclusions, the Board considered numerous factors, including the following:
Nature, Quality and Extent of Services
The Board examined the nature, quality and extent of the services to be provided by JNAM and by the proposed Sub-Adviser.
The Board considered the services to be provided by JNAM, including but not limited to the oversight of the Sub-Adviser pursuant to the Trust’s “Manager of Managers” exemption, as well as the provision of recordkeeping and compliance services to the Fund. The Board also took into account that JNAM would monitor the performance of the various organizations that would provide services to the Fund, including the Fund’s distributor and custodian. With respect to JNAM’s oversight of the Sub-Adviser, the Board noted that JNAM would be responsible for screening and recommending new sub-advisers when appropriate, as well as monitoring and reporting to the Board on a regular basis as to the performance and operations of the Fund’s existing Sub-Adviser.
The Board also considered the investment sub-advisory services to be provided by the Sub-Adviser. The Board noted JNAM’s evaluation of the Sub-Adviser, as well as JNAM’s recommendations, based on its review of the Sub-Adviser, in connection with its approval of the Sub-Advisory Agreement. The Board also considered the various business-related risks JNAM faces as a result of managing the series of the Trust, including entrepreneurial, legal and litigation risks, some of which may be significant.
The Board reviewed the qualifications, backgrounds and responsibilities of JNAM’s senior management that would be responsible for oversight of the Fund and the Sub-Adviser, and also reviewed the qualifications, backgrounds and responsibilities of the Adviser’s or Sub-Adviser’s portfolio managers, as applicable, who would be responsible for the day-to-day management of the Fund. The Board reviewed information pertaining to JNAM’s and the Sub-Adviser’s organizational structure, senior management, financial condition, investment operations, and other relevant information pertaining to both JNAM and the Sub-Adviser. The Board considered compliance reports about JNAM and the Sub-Adviser from the Trust’s Chief Compliance Officer.
100
Based on the foregoing, the Board concluded that (i) the Fund is likely to benefit from the nature, extent and quality of the services to be provided by JNAM under the Advisory Agreement and (ii) the Fund is likely to benefit from the nature, extent and quality of the services to be provided by the Sub-Adviser under the Sub-Advisory Agreement.
Investment Performance of the Fund
Sub-Adviser Change for Existing Fund:
JNL/Franklin Templeton Founding Strategy Fund (to be renamed the JNL/Franklin Templeton Growth Allocation Fund). The Board reviewed the performance of the Sub-Adviser’s investment mandate with a similar investment strategy and composite performance, compared to the Fund, the Fund’s benchmark, proposed new benchmarks, and peer group. The Board concluded that it would be in the best interests of the Fund and its shareholders to approve the Agreements.
Costs of Services
The Board reviewed the fees to be paid to JNAM and the Sub-Adviser. The Board reviewed fee and expense information as compared to that of comparable funds managed by other advisers. The Board also noted that JNAM does not manage any institutional accounts with which the Fund’s fees could be compared. Using information provided by an independent data service, the Board evaluated, the Fund’s net advisory fees compared to the average advisory fees for other funds similar in size, character and investment strategy (the “peer group”). While the Board also considered the Fund’s sub-advisory fee(s) and compared that to the average sub-advisory fee of the peer group, the Board noted that the Fund’s sub-advisory fee(s) would be paid by JNAM (not the Fund) and, therefore, would be neither a direct shareholder expense nor a direct influence on the Fund’s total expense ratio.
Further detail considered by the Board regarding the advisory and sub-advisory fees of the Fund is set forth below:
Sub-Adviser Changes for Existing Fund:
JNL/Franklin Templeton Founding Strategy Fund (to be renamed the JNL/Franklin Templeton Growth Allocation Fund). The Board noted that the appointment of the Fund’s sub-adviser is being proposed in conjunction with various investment strategy and fee changes to the Fund, including a change from a fund-of-funds structure to an actively-managed fund structure. In this regard, the Board considered the proposed sub-advisory fee, noting that the Fund does not currently have a sub-advisory fee and that the proposed sub-advisory fee is lower than the peer group average. It further noted that the proposed advisory fee is higher than the current advisory fee but that the proposed total expense ratio is lower than the current total expense ratio. It also noted that the proposed advisory fee is lower and the proposed total expense ratio is higher than the respective peer group averages. The Board also considered that, in connection with the changes to this Fund, the Fund’s proposed total expense ratio is approximately five basis points lower than the current total expense ratio. The Board concluded that the advisory and sub-advisory fees are in the best interests of the Fund and its shareholders in light of the services to be provided.
Economies of Scale
The Board considered whether the Fund’s proposed fees reflect the potential for economies of scale for the benefit of Fund shareholders. Based on information provided by JNAM and the Sub-Adviser, the Board noted that the advisory and sub-advisory fee arrangement for the Fund contains breakpoints that decrease the fee rate as assets increase.
The Board further considered that the Sub-Adviser has agreed to a breakpoint in the sub-advisory fee rate. The Board noted that the sub-advisory fee for the Fund is paid by JNAM (not the Fund). It further noted that the existing sub-advisory fee relationship discount agreement between JNAM and Franklin would decrease the fee rates as Fund assets increase in the future.
The Board concluded that the fees in some measure share economies of scale with shareholders.
Other Benefits to JNAM and the Sub-Adviser
In evaluating the benefits that may accrue to JNAM through its relationship with the Fund, the Board noted that JNAM and certain of its affiliates would serve the Fund in various capacities, including as adviser, administrator, transfer agent, and distributor, and receive compensation from the Fund in connection with providing services to the Fund. The Board noted that each service to be provided to the Fund by JNAM or one of its affiliates would be pursuant to a written agreement, which the Board would evaluate periodically as required by law. The Board also noted that the Sub-Adviser may from time to time pay for portions of meetings organized by the Fund’s distributor to educate wholesalers about the Funds that the Sub-Adviser manages. The Board considered JNAM’s assertion that those meetings do not yield a profit to the distributor, that a sub-adviser is not required to participate in the meetings and that recommendations to hire or fire sub-advisers are not influenced by the sub-adviser’s willingness to participate in the meetings. Lastly, the Board noted that certain affiliates of JNAM may receive benefits under the federal income tax laws with respect to tax deductions and credits.
101
In evaluating the benefits that may accrue to the Sub-Adviser through its relationship with the Fund, the Board noted that the Sub-Adviser may receive indirect benefits in the form of soft dollar arrangements for portfolio securities trades placed with the Fund’s assets and may also develop additional investment advisory business with JNAM, the Fund or other clients of the Sub-Adviser as a result of its relationship with the Fund.
102
Supplement Dated December 18, 2018
To The Prospectus Dated April 30, 2018, as amended
JNL Series Trust
(The “Trust”)
Please note that the changes may impact your variable annuity and/or variable life product(s).
Proposed Reorganization of JNL/Mellon Capital 10 x 10 Fund
On December 10-12, 2018, the Board of Trustees (the “Board”) of the Trust approved the proposed reorganization of the JNL/Mellon Capital 10 x 10 Fund (the “10 x 10 Fund” or the “Acquired Fund”) into the JNL/Mellon Capital Index 5 Fund (the “Index 5 Fund” of the “Acquiring Fund”), each a series of the Trust (the “Reorganization”).
Because applicable legal requirements do not require shareholder approval of the Reorganization and because the Board has determined that the Reorganization is in the best interests of the 10 x 10 Fund and its shareholders, the 10 x 10 Fund shareholders are not being asked to vote on the Reorganization. It is expected that the Reorganization will be effective as of the close of business on or about April 26, 2019 (the “Closing Date”).
Under the terms of the proposed Plan of Reorganization, the 10 x 10 Fund’s assets and liabilities will be transferred to the Index 5 Fund in return for shares of the Index 5 Fund having an aggregate net asset value equal to the 10 x 10 Fund’s net assets as of the valuation date. These Index 5 Fund shares will be distributed pro rata to shareholders of the 10 x 10 Fund in exchange for their fund shares. Current 10 x 10 Fund shareholders will thus become shareholders of the Index 5 Fund and receive shares of the Index 5 Fund with a total net asset value equal to that of their shares of the 10 x 10 Fund at the time of Reorganization. Shareholders will not pay any sales charges in connection with the Reorganization.
The Reorganization is expected to be treated as a “partnership merger” under Treasury Regulations under Section 708 of the Internal Revenue Code of 1986, as amended. The Reorganization is not expected to be a taxable event for federal income tax purposes for shareholders and is not expected to result in any material adverse federal income tax consequences to shareholders of the 10 x 10 Fund.
The investment objectives of the 10 x 10 Fund and the Index 5 Fund are similar. The Funds also employ similar principal investment strategies in seeking to achieve those objectives. The Funds also have similar risk profiles. A full description of the Index 5 Fund and the terms of the Reorganization will be contained in a combined information statement/prospectus, which is expected to be mailed to shareholders of the 10 x 10 Fund on or about February 14, 2019.
The foregoing is not an offer to sell, nor a solicitation of an offer to buy, shares of the Index 5 Fund, nor is it a solicitation of any proxy. For more information regarding the Index 5 Fund or to receive a free copy of the combined proxy statement/prospectus relating to the Reorganization (once a registration statement relating to the Reorganization has been filed with the Securities and Exchange Commission (“SEC”) and has become effective) that contains important information about fees, expenses, and risk considerations, please contact us at contact us at prospectusrequest@jackson.com. The combined proxy statement/prospectus will also be available for free on the SEC’s web site (www.sec.gov). Please read the combined proxy statement/prospectus carefully before making any investment decisions.
Sub-Adviser Appointment and Name, Investment Objective, Investment Strategy, and Primary and Secondary Benchmark Changes for the JNL/Franklin Templeton Founding Strategy Fund
On December 10-12, 2018, the Board of Trustees (the “Board”) of the Trust approved the appointment of Franklin Advisers, Inc. (“Franklin”) as the sub-adviser (“Sub-Adviser Appointment”) for the JNL/Franklin Templeton Founding Strategy Fund (the “Fund”), as well as changes to the Fund’s name, investment objective, investment strategy, and primary and secondary benchmarks (the “Strategy Changes”).
In connection with the Sub-Adviser Appointment, the Board approved an amendment to the Amended and Restated Investment Sub-Advisory Agreement between JNAM and Franklin Advisers, Inc. (“Franklin”), appointing Franklin as a sub-adviser for the Fund and implementing a new sub-advisory fee structure (“Sub-Advisory Agreement Amendment”). Franklin currently serves as a sub-adviser to another fund of the Trust.
In connection with the Strategy Changes, the Board approved amendments to the following agreements revising the Fund’s advisory fee
and administrative fee structures: 1) Amended and Restated Investment Advisory and Management Agreement between the Trust and Jackson National Asset Management, LLC (“JNAM”) (“Advisory Agreement Amendment”); and 2) Amended and Restated Administration Agreement between the Trust and JNAM (“Administration Agreement Amendment,” and collectively with the Sub-Advisory Agreement Amendment and the Administration Agreement Amendment, the “Agreement Amendments”).
The Sub-Adviser Appointment and Strategy Changes that are being proposed will convert the Fund from a fund-of-funds that is designed to invest in a group of three underlying funds that are advised by JNAM and sub-advised by Franklin or its affiliates to an actively managed Fund. As a result of the structural change from a fund-of-funds to an actively managed Fund, the Fund’s advisory and administrative fees will increase. JNAM will continue to serve as its investment adviser and administrator, but Franklin will serve as the Fund’s new sub-adviser and provide the day-to-day management for the Fund. The name of the Fund will change to the JNL/Franklin Templeton Growth Allocation Fund.
A full description of the Sub-Adviser Appointment, Strategy Changes, and Agreement Amendments will be contained in a proxy statement, which is expected to be mailed to shareholders of the Fund on or about February 14, 2019. Shareholders will be asked to consider and vote on the Strategy Changes and Agreement Amendments at a special meeting of shareholders expected to be held on March 15, 2019. If approved by shareholders, the Sub-Adviser Appointment, Strategy Changes, and Agreement Amendments will become effective on or around April 29, 2019. No assurance can be given that the Strategy Changes and Agreement Amendments will be approved by shareholders.
This Supplement is dated December 18, 2018.
(To be used with JMV9476 04/18, JMV8798 04/18, VC4224 04/18, JMV9476ML 04/18, JMV5763ML 04/18, JMV9476WF 04/18, JMV5763WF 04/18, JMV8037 04/18, JMV8037BE 04/18, JMV17955 04/18, JMV21086 12/18, JMV16966 04/18, JMV18691 04/18, JMV18692 08/18, JMV7698 04/18, VC5869 04/18, JMV7697 04/18, VC5890 04/18, VC5890ML 04/18, VC5995 04/18, JMV5765 04/18, JMV2731 04/18, JMV17183 04/18, JMV17183NY 04/18, JMV18691NY 04/18, FVC4224FT 04/18, VC5526 04/18, VC3656 04/18, VC3657 04/18, VC3723 04/18, JMV7698NY 04/18, NV5869 04/18, JMV7697NY 04/18, NV5890 04/18, JMV9476NY 04/18, NV4224 04/18, JMV9476WFNY 04/18, JMV8037NY 04/18, JMV8037BENY 04/18, JMV17955NY 04/18, NV4224WF 04/18, JMV16966NY 04/18, NMV2731 04/18, NV5526 04/18, NV3174GW 04/18, NV3174CEGW 04/18, NV5825GW 04/18, VC5825GW 04/18, VC5884GW 04/18, VC5885GW 04/18, and NV3784 04/18.)
Supplement Dated January 9, 2019
To The Prospectus Dated April 30, 2018, as amended August 13, 2018
JNL® Series Trust
Please note that the changes may impact your variable annuity and/or variable life product(s).
Effective January 2, 2019, all references to BNY Mellon Asset Management North American Corporation are changed to Mellon Investments Corporation.
Effective January 2, 2019, all references to BNYM AMNA are changed to Mellon.
This supplement is dated January 9, 2019.
(To be used with JMV9476 04/18, JMV8798 04/18, VC4224 04/18, JMV9476ML 04/18, JMV5763ML 04/18, JMV9476WF 04/18, JMV5763WF 04/18, JMV8037 04/18, JMV8037BE 04/18, JMV17955 04/18, JMV21086 12/18, JMV16966 04/18, JMV18691 04/18, JMV18692 08/18, JMV7698 04/18, VC5869 04/18, JMV7697 04/18, VC5890 04/18, VC5890ML 04/18, VC5995 04/18, JMV5765 04/18, JMV2731 04/18, JMV17183 04/18, JMV17183NY 04/18, JMV18691NY 04/18, FVC4224FT 04/18, VC5526 04/18, VC3656 04/18, VC3657 04/18, VC3723 04/18, JMV7698NY 04/18, NV5869 04/18, JMV7697NY 04/18, NV5890 04/18, JMV9476NY 04/18, NV4224 04/18, JMV9476WFNY 04/18, JMV8037NY 04/18, JMV8037BENY 04/18, JMV17955NY 04/18, NV4224WF 04/18, JMV16966NY 04/18,
NMV2731 04/18, NV5526 04/18, NV3174GW 04/18, NV3174CEGW 04/18, NV5825GW 04/18, VC5825GW 04/18, VC5884GW 04/18, VC5885GW 04/18, VC3652 04/18, NV3784 04/18, HR105 04/18, and VC2440 04/18.)
Supplement Dated February 20, 2019
To The Prospectus Dated April 30, 2018, as amended August 13, 2018
JNL® Series Trust
Please note that the changes may impact your variable annuity and/or variable life product(s).
Effective January 1, 2019, for the JNL/American Funds Global Bond Fund, please delete all references to Mark A. Brett.
Effective January 1, 2019, for the JNL/American Funds New World Fund, please delete all references to Robert H. Neithart.
Effective January 1, 2019, in the section entitled, “Summary Overview of Each Fund,” under “Portfolio Management,” for the JNL/American Funds Blue Chip Income and Growth Fund please delete the Portfolio Managers table in the entirety and replace with the following:
Name: | Joined Fund Management Team In: | Title: |
Christopher D. Buchbinder | 2010 | Partner, Capital Research Global Investors (“CRGI”), CRMC |
James B. Lovelace | 2010 | Partner, CRGI, CRMC |
Alex Sheynkman | January 2019 | Partner, CRGI, CRMC |
Lawrence R. Solomon | July 2018 | Partner, CRGI, CRMC |
James Terrile | 2013 | Partner, CRGI, CRMC |
Effective January 1, 2019, in the section entitled, “Summary Overview of Each Fund,” under “Portfolio Management,” for the JNL/American Funds Global Bond Fund please delete the Portfolio Managers table in the entirety and replace with the following:
Name: | Joined Fund Management Team In: | Title: |
Andrew A. Cormack | January 2019 | Portfolio Manager, Capital Fixed Income Investors (“CFII”), CRMC |
David A. Daigle | November 2014 | Partner, CFII, CRMC |
Thomas H. Hogh | May 2010 | Partner, CFII, CRMC |
Robert H. Neithart | 2012 | Partner, CFII, CRMC |
Effective January 1, 2019, in the section entitled, “Summary Overview of Each Fund,” under “Portfolio Management,” for the JNL/American Funds International Fund please delete the Portfolio Managers table in the entirety and replace with the following:
Name: | Joined Fund Management Team In: | Title: |
Sung Lee | 2010 | Partner, Capital Research Global InvestorsSM (“CRGI”), CRMC |
Renaud H. Samyn | January 2019 | Partner, CRGI, CRMC |
L. Alfonso Barroso | 2010 | Partner, CRGI, CRMC |
Jesper Lyckeus | 2010 | Partner, CRGI, CRMC |
Christopher Thomsen | 2010 | Partner, CRGI, CRMC |
Effective January 1, 2019, in the section entitled, “Summary Overview of Each Fund,” under “Portfolio Management,” for the JNL/American Funds New World Fund please delete the Portfolio Managers table in the entirety and replace with the following:
Name: | Joined Fund Management Team In: | Title: |
Carl M. Kawaja | 2010 | Partner, Capital World Investors (“CWI”), CRMC |
Name: | Joined Fund Management Team In: | Title: |
Steven G. Backes | January 2019 | Partner, CFII, CRMC |
Bradford F. Freer | January 2017 | Partner, CRGI, CRMC |
Nicholas J. Grace | 2012 | Partner, CRGI, CRMC |
Tamonori Tani | July 2018 | Partner, CWI, CRMC |
This Supplement is dated February 20, 2019.
Supplement Dated February 20, 2019
To The Prospectus Dated April 30, 2018, as amended
JNL Series Trust
(The “Trust”)
Please note that the changes may impact your variable annuity and/or variable life product(s).
** NOTE: The effective dates for the changes set forth herein have been changed. Please read this supplement carefully.**
Proposed Reorganization of JNL/Mellon Capital 10 x 10 Fund
On December 10-12, 2018, the Board of Trustees (the “Board”) of the Trust approved the proposed reorganization of the JNL/Mellon Capital 10 x 10 Fund (the “10 x 10 Fund” or the “Acquired Fund”) into the JNL/Mellon Capital Index 5 Fund (the “Index 5 Fund” of the “Acquiring Fund”), each a series of the Trust (the “Reorganization”).
Because applicable legal requirements do not require shareholder approval of the Reorganization and because the Board has determined that the Reorganization is in the best interests of the 10 x 10 Fund and its shareholders, the 10 x 10 Fund shareholders are not being asked to vote on the Reorganization. It is expected that the Reorganization will be effective as of the close of business on or about June 21, 2019 (the “Closing Date”).
Under the terms of the proposed Plan of Reorganization, the 10 x 10 Fund’s assets and liabilities will be transferred to the Index 5 Fund in return for shares of the Index 5 Fund having an aggregate net asset value equal to the 10 x 10 Fund’s net assets as of the valuation date. These Index 5 Fund shares will be distributed pro rata to shareholders of the 10 x 10 Fund in exchange for their fund shares. Current 10 x 10 Fund shareholders will thus become shareholders of the Index 5 Fund and receive shares of the Index 5 Fund with a total net asset value equal to that of their shares of the 10 x 10 Fund at the time of Reorganization. Shareholders will not pay any sales charges in connection with the Reorganization.
The Reorganization is expected to be treated as a “partnership merger” under Treasury Regulations under Section 708 of the Internal Revenue Code of 1986, as amended. The Reorganization is not expected to be a taxable event for federal income tax purposes for shareholders and is not expected to result in any material adverse federal income tax consequences to shareholders of the 10 x 10 Fund.
The investment objectives of the 10 x 10 Fund and the Index 5 Fund are similar. The Funds also employ similar principal investment strategies in seeking to achieve those objectives. The Funds also have similar risk profiles. A full description of the Index 5 Fund and the terms of the Reorganization will be contained in a combined information statement/prospectus, which is expected to be mailed to shareholders of the 10 x 10 Fund on or about February 14, 2019.
The foregoing is not an offer to sell, nor a solicitation of an offer to buy, shares of the Index 5 Fund, nor is it a solicitation of any proxy. For more information regarding the Index 5 Fund or to receive a free copy of the combined proxy statement/prospectus relating to the Reorganization (once a registration statement relating to the Reorganization has been filed with the Securities and Exchange Commission (“SEC”) and has become effective) that contains important information about fees, expenses, and risk considerations, please contact us at contact us at prospectusrequest@jackson.com. The combined proxy statement/prospectus will also be available for free on the SEC’s web site (www.sec.gov). Please read the combined proxy statement/prospectus carefully before making any investment decisions.
Sub-Adviser Appointment and Name, Investment Objective, Investment Strategy, and Primary and Secondary Benchmark Changes for the JNL/Franklin Templeton Founding Strategy Fund
On December 10-12, 2018, the Board of Trustees (the “Board”) of the Trust approved the appointment of Franklin Advisers, Inc.
(“Franklin”) as the sub-adviser (“Sub-Adviser Appointment”) for the JNL/Franklin Templeton Founding Strategy Fund (the “Fund”), as well as changes to the Fund’s name, investment objective, investment strategy, and primary and secondary benchmarks (the “Strategy Changes”).
In connection with the Sub-Adviser Appointment, the Board approved an amendment to the Amended and Restated Investment Sub-Advisory Agreement between JNAM and Franklin Advisers, Inc. (“Franklin”), appointing Franklin as a sub-adviser for the Fund and implementing a new sub-advisory fee structure (“Sub-Advisory Agreement Amendment”). Franklin currently serves as a sub-adviser to another fund of the Trust.
In connection with the Strategy Changes, the Board approved amendments to the following agreements revising the Fund’s advisory fee and administrative fee structures: 1) Amended and Restated Investment Advisory and Management Agreement between the Trust and Jackson National Asset Management, LLC (“JNAM”) (“Advisory Agreement Amendment”); and 2) Amended and Restated Administration Agreement between the Trust and JNAM (“Administration Agreement Amendment,” and collectively with the Sub-Advisory Agreement Amendment and the Administration Agreement Amendment, the “Agreement Amendments”).
The Sub-Adviser Appointment and Strategy Changes that are being proposed will convert the Fund from a fund-of-funds that is designed to invest in a group of three underlying funds that are advised by JNAM and sub-advised by Franklin or its affiliates to an actively managed Fund. As a result of the structural change from a fund-of-funds to an actively managed Fund, the Fund’s advisory and administrative fees will increase. JNAM will continue to serve as its investment adviser and administrator, but Franklin will serve as the Fund’s new sub-adviser and provide the day-to-day management for the Fund. The name of the Fund will change to the JNL/Franklin Templeton Growth Allocation Fund.
A full description of the Sub-Adviser Appointment, Strategy Changes, and Agreement Amendments will be contained in a proxy statement, which is expected to be mailed to shareholders of the Fund on or about February 14, 2019. Shareholders will be asked to consider and vote on the Strategy Changes and Agreement Amendments at a special meeting of shareholders expected to be held on March 15, 2019. If approved by shareholders, the Sub-Adviser Appointment, Strategy Changes, and Agreement Amendments will become effective on or around June 24, 2019. No assurance can be given that the Strategy Changes and Agreement Amendments will be approved by shareholders.
This Supplement is dated February 20, 2019.
(To be used with JMV9476 04/18, JMV8798 04/18, VC4224 04/18, JMV9476ML 04/18, JMV5763ML 04/18, JMV9476WF 04/18, JMV5763WF 04/18, JMV8037 04/18, JMV8037BE 04/18, JMV17955 04/18, JMV21086 12/18, JMV16966 04/18, JMV18691 04/18, JMV18692 08/18, JMV7698 04/18, VC5869 04/18, JMV7697 04/18, VC5890 04/18, VC5890ML 04/18, VC5995 04/18, JMV5765 04/18, JMV2731 04/18, JMV17183 04/18, JMV17183NY 04/18, JMV18691NY 04/18, FVC4224FT 04/18, VC5526 04/18, VC3656 04/18, VC3657 04/18, VC3723 04/18, JMV7698NY 04/18, NV5869 04/18, JMV7697NY 04/18, NV5890 04/18, JMV9476NY 04/18, NV4224 04/18, JMV9476WFNY 04/18, JMV8037NY 04/18, JMV8037BENY 04/18, JMV17955NY 04/18, NV4224WF 04/18, JMV16966NY 04/18, NMV2731 04/18, NV5526 04/18, NV3174GW 04/18, NV3174CEGW 04/18, NV5825GW 04/18, VC5825GW 04/18, VC5884GW 04/18, VC5885GW 04/18, and NV3784 04/18.)
CMX21997 02/19

JNL Series Trust PRSRT STD U.S. POSTAGE One Corporate Way PAID Lansing, MI 48951 JACKSON NATIONAL ASSET MANAGEMENT L.L.C. Please note that recent changes to your delivery preferences may not be reflected with this mailing. For legal mailings of this nature, it can take up to 60 days for your delivery preferences to take effect. VADV7339 01/19

CHOOSE THE INBOX. NOT THE MAILBOX. Less waste. More convenience. Your choice. Three easy ways to go paperless:1. Mail this postage-paid card2. Call1-866-349-45643. Visit jackson.com I consent to receive by electronic delivery: ALL DOCUMENTS Periodic and immediate confirmation statementsAnnual and semi-annual reportsAnnual statements (Variable Products and Fixed Index Annuities only)(Variable Products only) (Fixed, Fixed Index and Target Select Annuities only)Other contract-related correspondenceProspectuses and prospectus supplements (Variable Products only) This consent will continue until revoked and will cover delivery to you in the form of ane-mail or by notice to you of a document’s availability on Jackson National Life Insurance Company®‘s (also referred to as Jackson®) website. For jointly owned contracts, all Joint Owners are consenting to electronic delivery and use of the singlee-mail address below. Please contact the appropriate Jackson Service Center or go to www.jackson.com to update youre-mail address, revoke your consent to electronic delivery, or request paper copies. Certain types of correspondence may continue to be delivered by the United States Postal Service for compliance reasons. Registration on Jackson’s website (www.jackson.com) is required for electronic delivery of contract-related correspondence.Please write legibly. Fold Here Signature: Date: Signature: Date:E-mail address:I (We) will notify Jackson of any change to thise-mail address. Name: Address:City:State:ZIP: Policy NumberOwner’s State of Residence Phone Number – – The computer hardware and software requirements that are necessary to receive, process and retain electronic communications that are subject to this consent are as follows: To view and download material electronically, you must have a computer with Internet access, an activee-mail account and Adobe Acrobat Reader. If you don’t already have Adobe Acrobat Reader, you can download it free from www.adobe.com. There is no charge for electronic delivery of electronic communications, although you may incur the costs ofInternet access and of such computer and related hardware and software as may be necessary for you to receive, process and retain electronic communications from Jackson. Please make certain you have given Jackson a currente-mail address. Also let Jackson know if thate-mail address changes. We may need to notify you of a document’s availability throughe-mail. You may request paper copies, whether or not you consent or revoke your consent to electronic delivery, at any time and for no charge. Even if you have given us consent, we are not required to make electronic delivery and we have the right to deliver any communications in paper form. Tape Here VADV7338 01/19 ANNUAL REPORT December 31, 2018 • JNL® Series Trust •Sub-Advised Funds • JNL Variable Fund LLC Beginning on January 1, 2021, as permitted by regulations adopted by the Securities and Exchange Commission, paper copies of the Funds’ annual and semi annual shareholder reports will no longer be sent by mail, unless you specifically request paper copies of the reports from Jackson. Instead, the reports will be made available on Jackson’s website (www.jackson.com), and you will be notified by mail each time a report is posted and provided with a website link to access the report. If you already elected to receive shareholder reports electronically, you will not be affected by this change and you need not take any action. You may elect to receive shareholder reports and other communications from Jackson electronically by doing one of the following: • Mailing in the postage-paid card on the cover of this report; • Calling1-866-349-4564; or • Signing up on www.jackson.com Beginning on January 1, 2019, you may elect to receive all future reports in paper free of charge. You can inform Jackson that you wish to continue receiving paper copies of your shareholder reports by contacting the appropriate Jackson Service Center. Your election to receive reports in paper will apply to all Funds held in each variable contract you purchased from Jackson.Please note that if you own more than one variable contract with Jackson, your delivery preferences must be set up for each variable contract separately. Issued by Jackson National Life Insurance Company 1 Corporate Way, Lansing, MI 48951
NO POSTAGE NECESSARY IF MAILED IN THE UNITED STATES BUSINESS REPLY MAIL FIR TS-CLA SS M IA L PERMIT NO. 600 L NA IS NG MI POSTAGE WILL BE PAID BY ADDRESSEE JACKSON PO BOX 24068 LANSING MI48909-4068 This report is for the general information of qualified plan participants, as well as contract/policy owners of the PerspectiveSM, Perspective II®, Perspective AdvisorsSM, Perspective Advisory, Perspective Advisors IISM, Perspective Advisory IISM, Perspective L Series, Perspective Rewards®, CuriangardSM, Perspective AdvantageSM, Perspective Focus®, Fifth Third Perspective, Jackson Private WealthSM, Retirement Latitudes®, Elite Access®, Elite Access AdvisorySM, Elite Access Advisory II, Perspective (New York), Perspective II (New York), Perspective Advisors II (New York), Perspective L Series (New York), Curiangard (New York), Perspective Advisors (New York), Perspective Focus (New York), Perspective Rewards (New York) and Elite Access (New York). Not all the portfolios are available in all of the products. Jackson is the marketing name for Jackson National Life Insurance Company (Home Office: Lansing, Michigan) and Jackson National Life Insurance Company of New York® (Home Office: Purchase, New York).

1 Corporate Way
Lansing, MI 48951
Toll Free: 1-800-873-5654
IMPORTANT NOTICE REGARDING DELIVERY OF SHAREHOLDER DOCUMENTS
Dear Client:
If you are a current member of a household with multiple variable products, and have not instructed Jackson otherwise, you currently receive only one copy of the following general documents: Prospectus, Annual and Semi-Annual Report, and other documents as permitted under applicable federal laws relating to Jackson’s variable products and their underlying investment options.
We will continue to send one such copy of these general documents unless and until we receive contrary instructions from you. This delivery policy does not apply to account statements, confirmation statements, or other documents reflecting transaction activity, which you will continue to receive individually.
You may choose to receive a separate copy of these general documents at any time by contacting us toll-free at 1-800-873-5654. Once we receive your request, we will start sending you separate copies within 30 days of receipt of your request.
If you would rather receive your prospectus and other documents via e-mail, please register for Jackson’s Green Delivery Program by visiting the www.Jackson.com. Our Go Paperless process is quick and easy for policyholders – just have your policy number available when you register.
Jackson appreciates your cooperation as we do our part to aid the environment by reducing the amount of paper we distribute. While we’re committed to providing you with the information you need in the format you prefer, we are always looking for new ways to operate more efficiently.
Variable Products issued by Jackson National Life Insurance Company® and distributed by Jackson National Life Distributors LLC, member FINRA. 800/873-5654
JNL Series Trust Sub-Advised Funds and JNL Variable Fund LLC
December 31, 2018
JNL Series Trust Sub-Advised Funds including: JNL/AB Dynamic Asset Allocation Fund, JNL/AQR Large Cap Relaxed Constraint Equity Fund, JNL/AQR Managed Futures Strategy Fund, JNL/BlackRock Global Allocation Fund, JNL/BlackRock Global Natural Resources Fund, JNL/BlackRock Large Cap Select Growth Fund, JNL/Boston Partners Global Long Short Equity Fund, JNL/Causeway International Value Select Fund, JNL/ClearBridge Large Cap Growth Fund, JNL/Crescent High Income Fund, JNL/DFA U.S. Core Equity Fund, JNL/DoubleLine Core Fixed Income Fund, JNL/DoubleLine® Emerging Markets Fixed Income Fund, JNL/DoubleLine® Shiller Enhanced CAPE Fund, JNL/First State Global Infrastructure Fund, JNL/FPA + DoubleLine® Flexible Allocation Fund, JNL/Franklin Templeton Global Fund, JNL/Franklin Templeton Global Multisector Bond Fund, JNL/Franklin Templeton Income Fund, JNL/Franklin Templeton International Small Cap Fund, JNL/Franklin Templeton Mutual Shares Fund, JNL/Goldman Sachs Core Plus Bond Fund, JNL/Goldman Sachs Emerging Markets Debt Fund, JNL/GQG Emerging Markets Equity Fund, JNL/Harris Oakmark Global Equity Fund, JNL/Heitman U.S. Focused Real Estate Fund, JNL/Invesco China-India Fund, JNL/Invesco Diversified Dividend Fund, JNL/Invesco Global Real Estate Fund, JNL/Invesco International Growth Fund, JNL/Invesco Small Cap Growth Fund, JNL/JPMorgan Hedged Equity Fund, JNL/JPMorgan MidCap Growth Fund, JNL/JPMorgan U.S. Government & Quality Bond Fund, JNL/Lazard Emerging Markets Fund, JNL/Loomis Sayles Global Growth Fund, JNL/Mellon Capital Consumer Staples Sector Fund, JNL/Mellon Capital Emerging Markets Index Fund, JNL/Mellon Capital European 30 Fund, JNL/Mellon Capital Industrials Sector Fund, JNL/Mellon Capital Materials Sector Fund, JNL/Mellon Capital Pacific Rim 30 Fund, JNL/Mellon Capital Real Estate Sector Fund, JNL/Mellon Capital S&P 500 Index Fund, JNL S&P 500 Index Fund, JNL/Mellon Capital S&P 400 MidCap Index Fund, JNL/Mellon Capital S&P 1500 Growth Index Fund, JNL/Mellon Capital S&P 1500 Value Index Fund, JNL/Mellon Capital Small Cap Index Fund, JNL/Mellon Capital International Index Fund, JNL/Mellon Capital MSCI KLD 400 Social Index Fund, JNL/Mellon Capital Bond Index Fund, JNL/Mellon Capital Utilities Sector Fund, JNL/MFS Mid Cap Value Fund, JNL/Morningstar Wide Moat Index Fund, JNL Multi-Manager Alternative Fund, JNL Multi-Manager International Small Cap Fund, JNL Multi-Manager Mid Cap Fund, JNL Multi-Manager Small Cap Growth Fund, JNL Multi-Manager Small Cap Value Fund, JNL/Neuberger Berman Strategic Income Fund, JNL/Oppenheimer Emerging Markets Innovator Fund, JNL/Oppenheimer Global Growth Fund, JNL/PIMCO Income Fund, JNL/PIMCO Real Return Fund, JNL/PPM America Floating Rate Income Fund, JNL/PPM America High Yield Bond Fund, JNL/PPM America Mid Cap Value Fund, JNL/PPM America Small Cap Value Fund, JNL/PPM America Total Return Fund, JNL/PPM America Value Equity Fund, JNL/S&P Competitive Advantage Fund, JNL/S&P Dividend Income & Growth Fund, JNL/S&P International 5 Fund, JNL/S&P Intrinsic Value Fund, JNL/S&P Mid 3 Fund, JNL/S&P Total Yield Fund, JNL/Scout Unconstrained Bond Fund, JNL/T. Rowe Price Established Growth Fund, JNL/T. Rowe Price Managed Volatility Balanced Fund, JNL/T. Rowe Price Mid-Cap Growth Fund, JNL/T. Rowe Price Short-Term Bond Fund, JNL/T. Rowe Price Value Fund, JNL/Vanguard Growth ETF Allocation Fund, JNL/Vanguard Moderate ETF Allocation Fund, JNL/Vanguard Moderate Growth ETF Allocation Fund, JNL/Westchester Capital Event Driven Fund, JNL/WMC Balanced Fund, JNL/WMC Government Money Market Fund, JNL/WMC Value Fund
JNL Series Trust Results of Special Meetings of Shareholders | |
JNL Series Trust Approval of the Trust’s Investment Advisory and Sub-Advisory Agreements |
JNL Series Trust Supplements to Prospectus
JNL Variable Fund LLC including: JNL/Mellon Capital Consumer Discretionary Sector Fund, JNL/Mellon Capital DowSM Index Fund, JNL/Mellon Capital Energy Sector Fund, JNL/Mellon Capital Financial Sector Fund, JNL/Mellon Capital Healthcare Sector Fund, JNL/Mellon Capital Information Technology Sector Fund, JNL/Mellon Capital JNL 5 Fund, JNL/Mellon Capital MSCI World Index Fund, JNL/Mellon Capital Nasdaq 100 Index Fund, JNL/Mellon Capital S&P® SMid 60 Fund, JNL/Mellon Capital Telecommunications Sector Fund
Market Summary 2
Management Discussion and Fund Performance 3
Schedules of Investments 10
Statements of Assets and Liabilities 26
Statements of Operations 28
Statements of Changes in Net Assets 30
Financial Highlights 34
Notes to Financial Statements 37
Report of Independent Registered Public Accounting Firm 50
Additional Disclosures 51
JNL Variable Fund LLC Manager’s and Officer’s Information 52
JNL Variable Fund LLC Approval of the Fund’s Investment Advisory and Sub-Advisory Agreements 58
JNL Variable Fund Supplements to Prospectus
Variable Products issued by Jackson National Life Insurance Company® and distributed by Jackson National Life Distributors LLC, member FINRA. 800/873-5654
JNL Series Trust Sub-Advised Funds and JNL Variable Fund LLC
December 31, 2018
Dear Investor,
 Enclosed is the annual report for the JNL Series Trust Sub-Advised Funds and JNL Variable Fund LLC for the year ended December 31, 2018, together with Management’s Discussion of Fund Performance for each of the Funds.
Securities markets saw the abrupt return of volatility in 2018 after a placid and profitable 2017. The S&P 500 Index finished down more than -4% as it suffered several sharp and sudden downswings throughout the year, including a nearly 20% drop from its September highs through the last week of December. Small and mid-cap stocks fared worse. Foreign markets diverged from the U.S. by selling off before the summer in suffering the most. International developed equity markets fell double digits, with emerging markets dropping 14.6%. Global fixed income spent most of the year in negative territory before a flight to safety during the fourth quarter fueled by buying government and investment grade bonds that helped the Bloomberg Barclays U.S. Aggregate Bond Index to finish the year virtually flat (up 0.01%). Non-core fixed income segments, especially high yield bonds and emerging market debt, posted notable losses.
The return of volatility was not necessarily unwarranted. The initial bout in February was likely sparked by a steady uptick in long term bond yields that raised concerns of higher borrowing costs for companies and governments, exacerbated by a violent unwinding of low volatility trades that bet on the continuation of a docile market environment. That chain reaction served as a wake up call to investors and quickly passed, but concerns about the impact of higher interest rates on business profitability and stock valuations after a long period of extremely low rates persisted. Debt market turmoil in Italy, Turkey and Argentina, along with slowing economic growth, soured investors on markets overseas mid-year as U.S. equities regained their footing. That, however, only served as a prelude to further concerns about global growth that hit stocks during the fourth quarter as U.S. China trade tensions and continued U.S. Federal Reserve rate hikes added to negative expectations for future earnings.
While not entirely unexpected, the suddenness and magnitude of downward volatility always serves as a jolt to investors. In last year’s letter we noted that the calmness of the market in 2017 (an entire year without a 5% or more correction) was unusual and likely unsustainable. A history of market declines tells us that a 10% drop in equities is a roughly once a year experience, while 20% drops happen about once every three and a half years on average. By the end of 2017, the last broad based 20% drop in large cap U.S. equities had concluded in March 2009—more than eight and half years before the start of 2018! This is not to say that such volatility is predictable, merely to put things in perspective as a reminder that post financial crisis market activity has been unusually moderate on the heels of unprecedentedly easy monetary policy. Moderation may have lulled a new generation of investors into a false sense of confidence, though history has shown that there has yet to be a solution to the cyclicality of markets.
The best that we can do as investors is to build diversified portfolios to withstand downswings such that long term plans remain intact and investment goals are still achievable. Although there were few places to hide in the market that offered positive returns during 2018, studies have shown that investors do better mixing their investment choices among a wide variety of asset classes and strategies instead of trying to guess or time exposure into a select few. As sentiment waned and volatility increased in 2018, market leadership shifted between sectors, styles and asset classes. As mentioned earlier, domestic fixed income was under water for most of the year before recovering in the fourth quarter to become the best absolute performing asset class. Utilities, among the bottom performing areas of the S&P 500 in June, finished the year up 4.1% behind only health care among top performers. Indeed, the dispersion of returns between sectors within the S&P 500 Index ranged from -18.10% (energy) to 6.47% (health care).
At Jackson, we seek to offer investors the building blocks for creating well diversified portfolios, and the freedom to do so however they see fit. We offer a wide array of Funds across asset classes and investment styles that allows investors to build portfolios that suit their individual risk tolerance and goals. We seek best of breed Sub-Advisors that we think represent not only the finest organizations in the industry but also offer unique investment approaches able to persistently meet our expectations. We offer both passive and actively managed options as we recognize the strengths and weaknesses of each approach can complement the other. These many traits all support and benefit from diversification to allow for the creation of a portfolio suited to any kind of investor.
No one knows what markets have in store for investors in 2019. A number of economic and geopolitical risks remain in the forefront, including slowing global growth, trade tensions, Brexit, excessive government and company debt and rising interest rates. No one can predict when and how these forces will act on markets, what other unknown issues may be lurking, or what the long term consequences will be on markets and investors. Against this uncertainty it is best to have a steady asset allocation plan to provide constancy amid a sea of market ambiguity. That, we think, is how successful investors achieve their goals.
Thank you for choosing Jackson for your investment needs.

Mark D. Nerud
President and Chief Executive Officer
JNL Series Trust
JNL Variable Fund LLC
1
| JNL Series Trust Sub-Advised Funds Market Summary (Unaudited) |

Major Indices Returns for the Year Ended December 31, 2018
Domestic Equity | Developed International Equity | ||||||||||
S&P 500 Index | -4.38 | % | MSCI All Country World ex-USA Index (Net) | -9.42 | % | ||||||
S&P MidCap 400 Index | -11.08 | MSCI EAFE Index (Net) | -13.79 | ||||||||
MSCI USA Index | -4.50 | ||||||||||
MSCI USA Mid Cap Index | -9.37 | Emerging Markets | |||||||||
MSCI USA Small Cap Index | -13.35 | MSCI Emerging Markets Index (Net) | -14.58 | % | |||||||
Fixed Income | Alternative Assets | ||||||||||
Bloomberg Barclays Global Aggregate Bond Index | -1.20 | % | Bloomberg Commodity Index | -11.25 | % | ||||||
Bloomberg Barclays U.S. Aggregate Bond Index | 0.01 | FTSE EPRA/NAREIT Developed Index | -4.74 | ||||||||
Bloomberg Barclays U.S. Corporate High Yield Bond Index | -9.37 | ||||||||||
Alternative Strategy | |||||||||||
Wilshire Liquid Alternative Index | -4.26 | % | |||||||||
Domestic Equity: Volatility returned to the markets in 2018, after a calm and profitable 2017. All the major broad stock market indices lost ground during a turbulent year that saw a major selloff in stocks to finish the year. Steady gains midyear were bracketed by highly volatile trading during the first and fourth quarters that at times saw huge daily swings in prices that eventually led to losses. Volatility was even more severe among small- and mid-cap stocks, especially during the fourth quarter, resulting in even sharper losses by year end. While the heightened volatility favored value and traditionally defensive sectors of the market at times, growth stocks outperformed across the market cap spectrum overall, driven by information technology and ecommerce names. Still, it was health care and utilities that ultimately finished the year as the top performing sectors. Rising interest rates and a violent unwinding of low volatility trades following a docile 2017 market environment set the tone during the first quarter. The fourth quarter selloff was sparked by increased fears of slowing economic growth amid continued tightening of monetary policy by the U.S. Federal Reserve (“Fed”), which was also unwinding its massive balance sheet built up after the global financial crisis. Volatility is likely to continue in the first half of the year amid U.S. China trade negotiations and potential continued quantitative tightening on the part of the Fed.
Fixed Income: Concerns regarding a slowdown in growth and Fed monetary policy led to a rocky path for bonds. Bonds seemingly entered into a game of seesaw with the stock market in 2018. When bonds sold off to start the year, the resulting increase in interest rates sparked turmoil among stocks. As investors fled back to bonds, lower interest rates fueled a midyear rise in stocks, which ultimately ended in another reverse to end the year. All told, the investment grade U.S. bond market ended the year virtually flat, while global bonds posted modest losses. Government and investment grade bonds seesawed the most, but ultimately benefitted from lower rates by year end. High yield and credit sensitive bonds generally lost ground on valuation concerns, uncertainty about corporate credit ratings amid continued Fed rate hikes and slowing economic growth. Global bonds were hurt by a stronger U.S. Dollar for most of the year, with emerging markets (“EM”) debt hit especially hard by the Dollar and turmoil in select countries.
Developed International Equity: Slowing growth in Europe starting in the second quarter weighed heavily on foreign developed markets in 2018. Stock performance sharply diverged from the U.S. in the beginning of June, driven in part by a blowup in Italian politics that fueled fears of further Euro disruption. Weaker growth in Europe took the bloom off the global synchronized growth story, with U.S. economic strength and higher interest rates making it a more attractive option. Signals from the European Central Bank that it would be ending its quantitative easing program kept a lid on returns during the fourth quarter, though results were more in line with the U.S. Despite more encouraging economic news out of Japan, stocks were down double digits there as well.
Emerging Markets: After a standout 2017, EM bonds and equities were the laggards in their respective asset classes in 2018. EM equities finished the year down more than 14% despite holding up relatively better during the fourth quarter global sell off. A strong U.S. Dollar for most of the year, slowing economic growth in China and Europe and weaker commodity prices all contributed to a midyear downswing that diverged sharply from U.S. performance. EM debt followed equities lower midyear troubled by the stronger Dollar and debt market turmoil in Turkey and Argentina from which it didn’t really recover.
Alternative Assets: It was a mixed year for alternative assets as oil prices first soared then plummeted, throwing the commodities and natural resources categories into turmoil. Both segments posted double digit losses for the year in significantly lagging equities. Global infrastructure related assets also delivered losses, mostly in line with global equities. U.S. real estate was the relative bright spot in the category as it kept pace with U.S. equities, while global real estate investment trusts outperformed the lackluster global equity marketplace.
Alternative Strategies: Alternative investment strategies posted negative returns overall as measured by the Wilshire Liquid Alternative Index in slightly outperforming equities and trailing fixed income. Alternative strategies lagged stocks for most of the year but held up considerably better during the fourth quarter equity selloff. The event driven segment of the Index, which includes merger arbitrage strategies, stood out with positive returns for the year. The global macro and hedged equity segments underperformed the broader Index given their tilt towards equity and international exposure.
2
| JNL/AB Dynamic Asset Allocation Fund AllianceBernstein L.P. (Unaudited) |

JNL/AB Dynamic Asset Allocation Fund
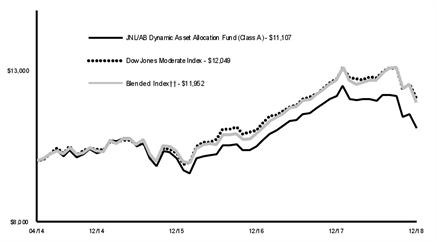
††70% MSCI World Index (Net), 30% Bloomberg Barclays U.S. Treasury Index
Average Annual Total Returns |
| |||||
Class A‡ |
|
|
| Class I† |
|
|
1 Year | -8.74 | % | 1 Year | -8.34 | % | |
Since Inception | 2.27 |
|
| Since Inception | -3.69 |
|
‡Inception date April 28, 2014 |
| |||||
†Inception date September 25, 2017 |
| |||||
The graph shows the change in value of an assumed $10,000 investment in the Fund's Class A shares over 10 years, or since inception if the inception is less than 10 years, as well as the Fund's benchmark(s) performance for the same period.
Past performance is not predictive of future performance. Investment return and principal value will fluctuate so that an investor’s shares, when redeemed, may be worth more or less than their original cost. Performance numbers are net of all Fund operating expenses, but do not reflect the deduction of insurance charges.
Composition as of December 31, 2018: | ||
Investment Companies | 70.9 | % |
Other Short Term Investments | 15.3 | |
Securities Lending Collateral | 13.8 | |
Total Investments | 100.0 | % |
For the year ended December 31, 2018, JNL/AB Dynamic Asset Allocation Fund underperformed its primary benchmark by posting a return of -8.74% for Class A shares compared to -5.21% for the Dow Jones Moderate Index. The Fund underperformed its blended benchmark return of -5.71% for the 70% MSCI World Index (Net) and 30% Bloomberg Barclays U.S. Treasury Index.
During the year, compared to the Dow Jones Moderate Index (“Index”), the Fund’s relative overweight to international equities and underweight to international bonds, mortgage income and U.S. corporate strategies were the main detractors from performance. Security selection within the U.S. government sleeve and real assets also hurt. The Fund’s underweight to U.S. small cap equities and overweight to U.S. government bonds contributed to performance.
Throughout most of the year, the Fund held a close to neutral position to risk assets. The Fund’s risk level was reduced in October to a modest underweight and further reduced early December to a significant underweight, with the proceeds added to cash as opposed to fixed income to maintain neutral duration. At the time, stock volatility elevated and was accompanied by both a widening and change in the trend of credit spreads as well as decelerating growth, signaling a protracted period of elevated risk in equity markets. The Fund’s equity position was characterized by a regional bias towards international large cap stocks. The Fund saw more pronounced headwinds for U.S. equity markets relative to non-U.S. developed markets driven by relative valuations, depreciating currencies, and expectations of further rate hikes by the U.S. Federal Reserve. Compared to the Index, both international and U.S. equities had a challenging year, with international equities underperforming the U.S. equities, which was a major drag on performance.
In fixed income, the Fund held an overweight to U.S. fixed income and a modest allocation to international bonds and ended the year with a close to neutral duration position.
The Fund utilizes a variety of derivative instruments as a component of its overall construction to effectively manage equity, interest rate, credit and currency risk to hedge positions and to provide efficient exposure. All derivatives performed in line with the manager’s expectations over the year.
3
| JNL/AQR Large Cap Relaxed Constraint Equity Fund AQR Capital Management, LLC (Unaudited) |

JNL/AQR Large Cap Relaxed Constraint Equity Fund
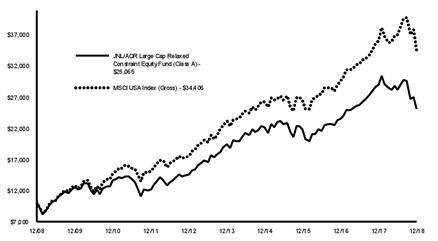
Average Annual Total Returns* |
| |||||
Class A |
|
|
| Class I |
|
|
1 Year | -13.36 | % | 1 Year | -13.10 | % | |
5 Year | 5.19 |
|
| 5 Year | 5.43 |
|
10 Year | 9.62 |
|
| 10 Year | 9.85 |
|
*The Fund's investment adviser waived/reimbursed certain expenses of the Fund. Performance results shown reflect the waiver, without which performance results would have been lower. |
| |||||
The graph shows the change in value of an assumed $10,000 investment in the Fund's Class A shares over 10 years, or since inception if the inception is less than 10 years, as well as the Fund's benchmark(s) performance for the same period.
Past performance is not predictive of future performance. Investment return and principal value will fluctuate so that an investor’s shares, when redeemed, may be worth more or less than their original cost. Performance numbers are net of all Fund operating expenses, but do not reflect the deduction of insurance charges.
AQR Capital Management, LLC assumed portfolio management responsibility on April 24, 2017.
Composition as of December 31, 2018: | ||
Information Technology | 23.1 | % |
Health Care | 20.9 | |
Consumer Discretionary | 14.1 | |
Communication Services | 11.3 | |
Financials | 8.1 | |
Industrials | 7.7 | |
Energy | 5.0 | |
Consumer Staples | 3.6 | |
Real Estate | 3.0 | |
Utilities | 1.1 | |
Materials | 0.3 | |
Other Short Term Investments | 1.8 | |
Net Long (Short) Investments | 100.0 | % |
For the year ended December 31, 2018, JNL/AQR Large Cap Relaxed Constraint Equity Fund underperformed its primary benchmark by posting a return of -13.36% for Class A shares compared to -4.50% for the MSCI USA Index (Gross).
As a reminder, the long term tracking error target of the Fund is 3-4%.
The Fund uses a systematic investment process to generate an excess return driven by value, momentum, quality, and other proprietary factors. The Fund invests 130% long and 30% short exposure, providing 100% net exposure to the market. Relaxing the long only constraint enables the Fund’s managers to express its model view more effectively by allowing it to short, and it also enables the Fund’s managers to take more active risk.
Valuation and investor sentiment were the worst performing investment themes during the year. Valuation evaluates a stock’s fundamental value versus its market price with the belief that relatively cheap stocks will outperform relatively expensive ones. Investor sentiment evaluates the actions of informed, high conviction, or highly influential investors to infer opportunities or threats that may not be captured by other themes. The momentum theme, which prefers securities that show signs of improvement over signs of deterioration, both through price and fundamental lenses, also modestly detracted. Conversely, quality themes, which capture the fundamental stability of a company and the quality of reported net income and other important financial metrics, favoring lower risk companies to higher risk companies, were the best performing themes during the year. Stock selection within sectors detracted from excess returns as information technology and consumer discretionary were the worst performing sectors. Consumer staples, on the other hand, contributed positively to returns. Sector selection also detracted slightly, driven by underweight positions to utilities and energy. As of December 31, 2018, the Fund was most overweight in health care and consumer discretionary relative to the benchmark. Conversely, the Fund was most underweight in financials and consumer staples.
4
| JNL/AQR Managed Futures Strategy Fund AQR Capital Management, LLC (Unaudited) |

JNL/AQR Managed Futures Strategy Fund
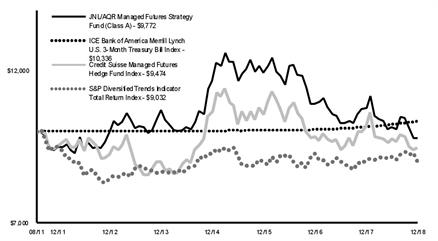
Average Annual Total Returns |
| |||||
Class A‡ |
|
|
| Class I† |
|
|
1 Year | -9.20 | % | 1 Year | -9.03 | % | |
5 Year | -1.79 |
|
| 5 Year | -1.59 |
|
Since Inception | -0.31 |
|
| Since Inception | -0.12 |
|
‡Inception date August 29, 2011 |
| |||||
†Inception date August 29, 2011 |
| |||||
The graph shows the change in value of an assumed $10,000 investment in the Fund's Class A shares over 10 years, or since inception if the inception is less than 10 years, as well as the Fund's benchmark(s) performance for the same period.
Past performance is not predictive of future performance. Investment return and principal value will fluctuate so that an investor’s shares, when redeemed, may be worth more or less than their original cost. Performance numbers are net of all Fund operating expenses, but do not reflect the deduction of insurance charges.
Composition as of December 31, 2018: | ||
Other Short Term Investments†† | 100.0 | % |
Total Investments | 100.0 | % |
††In general, the Fund uses derivatives as direct substitutes for investment in commodities, developed market stock indices, government bonds and currencies. Please refer to the Schedule of Investments for the Fund's derivative investments.
For the year ended December 31, 2018, JNL/AQR Managed Futures Strategy Fund underperformed its primary benchmark by posting a return of -9.20% for Class A shares compared to 1.87% for the ICE Bank of America Merrill Lynch 3-Month U.S. Treasury Bill Index. The Fund underperformed both of its other benchmarks’ return of -0.46% for the S&P Diversified Trends Indicator Total Return Index and -6.67% for the Credit Suisse Managed Futures Hedge Fund Index.
Separately, the SG Trend Index, a peer group index of the 10 largest trend following hedge funds, returned -8.10% for the year.
The Fund invests, both long and short, primarily in futures and currency forward contracts to gain economic exposure to global equity, fixed income, commodity, and currency markets. These derivative positions are responsible for substantially all the performance in the Fund. By asset class, currencies (-5.1%), commodities (-1.7%), fixed income (-1.3%) and equities (-0.0%) detracted, all gross of fees. By signal, long term and over extended signals detracted from performance, while short term signals were flat.
2018 was a difficult environment for trend following. Changing economic expectations, rising political and trade risks globally, shifting tones in monetary policy rhetoric and changing global energy dynamics caused reversals across asset classes. By asset class, trend following in currencies detracted most, as the U.S. Dollar and Euro sharply reversed their longer term trends in the second quarter due to relative U.S. economic strength versus Europe and a widening rate differential. Commodities also detracted over the year, driven by the sharp reversal and selloff in crude oil and related commodities towards the end of the year, which happened as the U.S. offered waivers for Iranian oil purchases, supplies remained ample and global growth concerns rose. Trend following in fixed income also detracted as the longer term bearish U.S. fixed income trend reversed late in the year, and the bullish trend in Italian 10 year bonds sharply reversed in the second quarter on rising political risks. Global equity markets exhibited large reversals of longer term bullish trends in February and more recently in October, causing losses within equities. However, trend following in equities produced meaningful offsetting gains in December across signals, as global equity markets declined.
5
| JNL/BlackRock Global Allocation Fund BlackRock Investment Management, LLC (Unaudited) |

JNL/BlackRock Global Allocation Fund

†36% S&P 500 Index, 24% FTSE World (ex-U.S.) Index, 24% Bank of America Merrill Lynch Current 5-Year U.S. Treasury Index, 16% FTSE Non-U.S. Dollar World Government Bond Index
Average Annual Total Returns |
| |||||
Class A‡ |
|
|
| Class I† |
|
|
1 Year | -7.62 | % | 1 Year | -7.33 | % | |
5 Year | 1.90 |
|
| 5 Year | 2.14 |
|
Since Inception | 3.90 |
|
| Since Inception | 4.12 |
|
‡Inception date October 11, 2010 |
| |||||
†Inception date October 11, 2010 |
| |||||
The graph shows the change in value of an assumed $10,000 investment in the Fund's Class A shares over 10 years, or since inception if the inception is less than 10 years, as well as the Fund's benchmark(s) performance for the same period.
Past performance is not predictive of future performance. Investment return and principal value will fluctuate so that an investor’s shares, when redeemed, may be worth more or less than their original cost. Performance numbers are net of all Fund operating expenses, but do not reflect the deduction of insurance charges.
Composition as of December 31, 2018: | ||
Government Securities | 25.3 | % |
Health Care | 9.4 | |
Communication Services | 9.3 | |
Financials | 8.5 | |
Energy | 6.2 | |
Information Technology | 6.0 | |
Industrials | 5.8 | |
Consumer Discretionary | 5.8 | |
Consumer Staples | 5.5 | |
Materials | 3.6 | |
Utilities | 2.2 | |
Real Estate | 1.8 | |
Investment Companies | 1.3 | |
Other Short Term Investments | 8.2 | |
Securities Lending Collateral | 1.1 | |
Net Long (Short) Investments | 100.0 | % |
For the year ended December 31, 2018, JNL/BlackRock Global Allocation Fund outperformed its primary benchmark by posting a return of -7.62% for Class A shares compared to -8.71% for the MSCI World Index (Net). The Fund underperformed its blended benchmark return of -4.67% for the 36% S&P 500 Index, 24% FTSE World (ex-U.S.) Index, 24% Bank of America Merrill Lynch Current 5-Year U.S. Treasury Index, 16% FTSE Non-U.S. Dollar World Government Bond Index.
Within equities, an overweight to India positively impacted returns. From a sector perspective, an overweight to health care and information technology (“IT”) and an underweight to consumer staples, financials and industrials contributed to performance. Stock selection within utilities and industrials was additive. The Fund also benefitted from an exposure to cash and cash equivalents. Currency management, notably an underweight to the Euro and an overweight to the U.S. Dollar contributed to performance.
Within equities, an overweight to Japan and underweight the United States detracted from performance. An exposure to European financials negatively influenced returns. From a sector perspective, an overweight and stock selection within energy weighed on returns, as did stock selection within IT, health care, consumer discretionary, materials, and real estate. Broadly speaking, an underweight to fixed income negatively impacted returns. Within fixed income, an overweight to U.S. duration and an overweight to select emerging market government bonds weighed on performance. Exposure to commodity related securities detracted. Currency management, notably an overweight to the Indian Rupee negatively impacted performance.
During the year, the Fund’s overall equity allocation decreased from 62% to 58% of net assets. Within equities, the Fund decreased exposure to Europe, and to Japan, and increased exposure to Canada and Brazil. From a sector perspective, the Fund decreased exposure to IT, financials, industrials and consumer discretionary, and increased exposure to health care, consumer staples and communication services. The Fund’s allocation to fixed income increased from 29% to 31% of net assets. The Fund’s allocation to commodity related securities decreased from 4% to 2% of net assets.
Reflecting the above changes, the Fund’s cash equivalents increased from 5% to 9% of net assets. Over the year period, the Fund’s cash position helped mitigate portfolio volatility and served as a source of funds for new investments and redemptions.
Relative to its Reference Benchmark, the Fund was underweight equities and fixed income and was overweight commodity related and cash equivalents. Within equities, the Fund was overweight Asia and underweight the United States and Europe. From a sector perspective, the Fund was overweight communication services, consumer discretionary, energy and health care and underweight financials, IT and industrials. Within fixed income, the Fund was underweight developed market government bonds and overweight corporate bonds.
Looking ahead, we believe slower growth, tighter financial conditions and margin pressure will likely continue to pose episodic headwinds for risk assets. While we still favor equities relative to fixed income, we have positioned the portfolio more defensively to reflect a less benign environment for risk assets longer term. Within equities, we are focused on stocks more defensive in nature that feature some combination of low economic cyclicality, pricing power, and low financial leverage as we believe companies with these characteristics will tend to be more resilient during periods of market volatility and less sensitive to a rise in interest rates. Within fixed income, we are also focused on quality, with the majority of exposure in U.S. Treasuries.
The Fund uses derivatives, which may include options, futures, swaps and forward contracts both to seek to enhance returns of the Fund and to hedge (or protect) against adverse movements in currency exchange rates, interest rates and movements in the securities markets. During the period, the Fund’s use of derivatives detracted from the Fund’s performance.
6
| JNL/BlackRock Global Natural Resources Fund BlackRock International Ltd. (Unaudited) |

JNL/BlackRock Global Natural Resources Fund
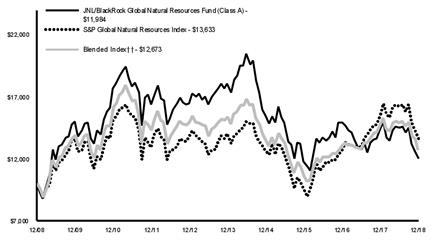
††75% MSCI Natural Resources Index (Net), 25% Bloomberg Commodity Index
Average Annual Total Returns |
| |||||
Class A |
|
|
| Class I |
|
|
1 Year | -17.27 | % | 1 Year | -17.11 | % | |
5 Year | -7.85 |
|
| 5 Year | -7.65 |
|
10 Year | 1.83 |
|
| 10 Year | 2.03 |
|
The graph shows the change in value of an assumed $10,000 investment in the Fund's Class A shares over 10 years, or since inception if the inception is less than 10 years, as well as the Fund's benchmark(s) performance for the same period.
Past performance is not predictive of future performance. Investment return and principal value will fluctuate so that an investor’s shares, when redeemed, may be worth more or less than their original cost. Performance numbers are net of all Fund operating expenses, but do not reflect the deduction of insurance charges.
BlackRock Investment Management LLC assumed portfolio management responsibility on October 11, 2010.
BlackRock International Limited assumed portfolio management responsibility on September 25, 2017.
Composition as of December 31, 2018: | ||
Materials | 53.6 | % |
Energy | 34.0 | |
Consumer Staples | 6.4 | |
Information Technology | 0.9 | |
Health Care | 0.6 | |
Industrials | 0.6 | |
Securities Lending Collateral | 2.0 | |
Other Short Term Investments | 1.9 | |
Total Investments | 100.0 | % |
For the year ended December 31, 2018, JNL/BlackRock Global Natural Resources Fund underperformed both its primary benchmark and its blended benchmark by posting a return of -17.27% for Class A shares compared to -12.57% for the S&P Global Natural Resources Index and -13.63% for the 75% MSCI Natural Resources Index (Net), 25% Bloomberg Commodity Index.
Energy equities and the oil price performed strongly through the first three quarters of 2018. By early October 2018, the Brent oil price had risen to $86/barrel (“bbl”), up 29.0% since the start of the year, whilst the MSCI World Energy Index had increased by 9.5%. The Organisation for Economic Co-operation and Development inventories fell below the five year average and market commentators started to question how long it would be until the oil price hit $100/bbl.
However, in anticipation of sanction related outages from Iran, the Organization of Petroleum Exporting Countries (“OPEC”) and Russia ramped production, seeking to avoid a price spike. U.S. President Donald Trump then announced unexpected waivers for customers of Iran and this tipped the market into modest oversupply. Meanwhile, global oil demand forecasts were lowered by the International Energy Agency and the Energy Information Administration. As a result, October marked a turning point as the oil price and energy equities fell sharply. Towards the end of the year, OPEC and other major oil producers announced an agreement to remove 1.2 million barrels per day from the market, but this wasn’t enough to halt oil’s decline, and the Brent oil price finished the year at $51/bbl. With this backdrop, the Fund’s overweight positions in EnCana Corp., Devon Energy Corp. and Cimarex Energy Co. detracted from relative returns as they came under pressure following the oil price decline.
Mining started 2018 strongly, up 8.2% in just the first half of January. This was short lived, however, as escalating trade tensions between China and the U.S. began to weigh on sentiment and commodity prices came under pressure. China is by far the most important economy for mining, consuming around half the world’s mined commodities. 2018 saw the U.S. impose tariffs on $250 billion of Chinese goods, China retaliate with tariffs on $110 billion of U.S. goods and the U.S. threatening tariffs on a further $257 billion of Chinese goods. However, in December, the two countries agreed to a 90 day truce in which they would refrain from increasing or imposing new tariffs as they work towards a new trade deal.
China announced a stimulus package towards the end of the year, however, the effects of which are yet to be seen. Mined commodity prices decreased almost across the board, albeit from relatively elevated levels. We saw an interesting trend, however, of more physically traded commodities (e.g. iron ore 62%, down just 2.4% over the year) outperforming those which are more financially traded (e.g. copper, down 17.5%). This suggests to us that underlying physical supply and demand conditions are still solid and that much of the weakness has been driven by speculation. An off benchmark position in copper producer First Quantum Ltd. (“First Quantum”) detracted from relative performance on the back of this copper price decline.
Like mining, agriculture was impacted by trade tensions during 2018 as agricultural commodities featured in the list of goods for new tariffs. China announced a 25% tariff on agricultural products including soybeans, corn, wheat, beef, pork and dairy products. Prior to the trade tensions, the U.S. exported 50% of its soybean crop, and 58% of those exports were to China, worth approximately U.S. $14 billion. In November 2018, however, China’s imports of U.S. soybeans fell to zero as it turned to Brazilian imports as a replacement.
In terms of agricultural company news, the year saw further mergers and acquisitions activity and consolidation. The Agrium and Potash merger was completed in January, forming a new company Nutrien Ltd. (“Nutrien”). Nutrien then announced the sale of its equity stake in ICL, Arab Potash and SQM for U.S. $5.8 billion and purchased a Brazilian liquid fertiliser business. In other news, Tyson Foods Inc. announced it had made an investment into Memphis Meats, an alternative or clean meat start up company.
Related to this, we saw excitement around the health and wellness theme continue to grow. We are seeing changes in terms of the food people are eating, how they are buying it and how it is being produced. More and more people are looking to move towards more protein rich and carbohydrate light diets. Demand for natural, organic and non genetically modified organism products is also growing rapidly, as is demand for clean labels with consumers increasingly wanting products with fewer unknown ingredients. A key beneficiary of these trends is the packaged foods business Hormel Foods Corp., and during the year our off benchmark contributed positively to performance.
7
| JNL/BlackRock Large Cap Select Growth Fund BlackRock Investment Management, LLC (Unaudited) |

JNL/BlackRock Large Cap Select Growth Fund
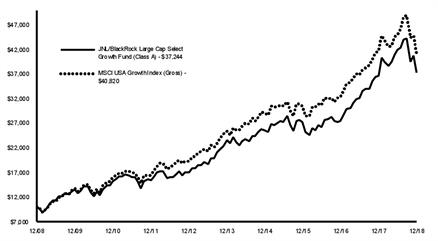
Average Annual Total Returns |
| |||||
Class A |
|
|
| Class I |
|
|
1 Year | 1.91 | % | 1 Year | 2.19 | % | |
5 Year | 9.60 |
|
| 5 Year | 9.85 |
|
10 Year | 14.05 |
|
| 10 Year | 14.40 |
|
The graph shows the change in value of an assumed $10,000 investment in the Fund's Class A shares over 10 years, or since inception if the inception is less than 10 years, as well as the Fund's benchmark(s) performance for the same period.
Past performance is not predictive of future performance. Investment return and principal value will fluctuate so that an investor’s shares, when redeemed, may be worth more or less than their original cost. Performance numbers are net of all Fund operating expenses, but do not reflect the deduction of insurance charges.
BlackRock Investment Management LLC assumed portfolio management responsibility on September 16, 2013.
Composition as of December 31, 2018: | ||
Information Technology | 32.0 | % |
Health Care | 19.0 | |
Consumer Discretionary | 16.1 | |
Communication Services | 14.8 | |
Industrials | 5.8 | |
Financials | 5.2 | |
Consumer Staples | 1.8 | |
Real Estate | 1.8 | |
Materials | 1.5 | |
Other Short Term Investments | 2.0 | |
Total Investments | 100.0 | % |
For the year ended December 31, 2018, JNL/BlackRock Large Cap Select Growth Fund outperformed its benchmark by posting a return of 1.91% for Class A shares compared to -2.02% for the MSCI USA Growth Index (Gross).
On a sector basis, the largest contributor to relative performance was consumer discretionary where internet and direct marketing retail holdings had the most positive impact. Selection to hotels, restaurants and leisure and a lack of exposure to media also added value within the sector. Health care and industrials were additional sources of strength. Equipment, supplies and life sciences tools and services holdings drove gains in health care, while positioning to machinery and zero exposure to air freight and logistics benefited in industrials. Conversely, communication services detracted from performance with entertainment holdings hindering results. Consumer staples and materials also weighed on performance. Selection to beverages was a drag in consumer staples, while an overweight to construction materials was a weakness in materials.
In stock specifics, the top individual contributors were Amazon.com Inc. (“Amazon”) and Netflix Inc. (“Netflix”). Amazon outperformed as the company delivered a series of strong earnings reports, with revenue acceleration in North America, International, Prime, Amazon Web Services (“AWS”) and advertising. In addition, especially notable has been Amazon’s operating margin expansion, driven by advertising, subscription services, AWS and shipping efficiencies. Our view remains that Amazon has many years of profitable growth ahead and, accordingly, we maintain our overweight position. Netflix continued to outperform after a series of strong earnings reports. The company exceeded 28 million global net subscriber additions in 2018. Overall, our thesis is playing out as the flywheel of content and subscriber additions is benefiting Netflix as it gains scale. We continue to believe the stock is far from pricing in the company’s long term growth and profitability potential.
The top detractors over the year were Tencent Holdings Ltd. (“Tencent”) and Constellation Brands Inc. (“Constellation”). Tencent underperformed amid U.S. and China trade tensions, weakness in the Chinese stock market, regulatory uncertainty and questions around timing of game launches and monetization. In addition, data showed a modest decline in Tencent’s share of mobile user time spent. Our view remains bullish as the company still dominates mobile time spent in China, enabling it to monetize along multiple channels, including gaming, advertising, payments and ecommerce among others. Constellation has underperformed as investors fear that Mexican import beer decelerates along with beer profit margin growth and reinvestment risk in Canopy Growth Corp. (“Canopy”). Constellation announced a $4 billion investment in Canopy during the second quarter. We expect Constellation’s core fundamentals to stay on track, including high single digit volume growth for beer and continued beer margin expansion and are positive on the Canopy investment.
At year end, the Fund’s largest sector overweight relative to the MSCI USA Growth Index was in health care. Industrials were the largest underweight.
8
| JNL/Boston Partners Global Long Short Equity Fund Boston Partners Global Investors, Inc. (Unaudited) |

JNL/Boston Partners Global Long Short Equity Fund
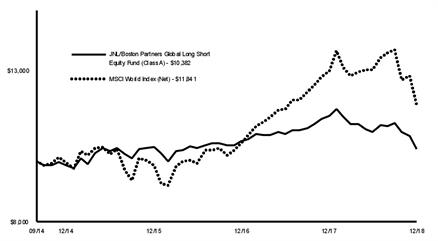
Average Annual Total Returns* |
| |||||
Class A‡ |
|
|
| Class I† |
|
|
1 Year | -9.51 | % | 1 Year | -9.22 | % | |
Since Inception | 0.88 |
|
| Since Inception | -4.69 |
|
‡Inception date September 15, 2014 |
| |||||
†Inception date September 25, 2017 |
| |||||
*The Fund's investment adviser waived/reimbursed certain expenses of the Fund. Performance results shown reflect the waiver, without which performance results would have been lower. |
| |||||
The graph shows the change in value of an assumed $10,000 investment in the Fund's Class A shares over 10 years, or since inception if the inception is less than 10 years, as well as the Fund's benchmark(s) performance for the same period.
Past performance is not predictive of future performance. Investment return and principal value will fluctuate so that an investor’s shares, when redeemed, may be worth more or less than their original cost. Performance numbers are net of all Fund operating expenses, but do not reflect the deduction of insurance charges.
Composition as of December 31, 2018: | ||
Long Investments | ||
Financials | 19.6 | % |
Health Care | 13.1 | |
Information Technology | 12.8 | |
Industrials | 10.7 | |
Consumer Staples | 10.0 | |
Consumer Discretionary | 9.2 | |
Communication Services | 9.0 | |
Materials | 7.4 | |
Energy | 6.6 | |
Utilities | 1.6 | |
Securities Lending Collateral | - | |
Total Long Investments† | 100.0 | % |
Short Investments | ||
Industrials | 20.0 | % |
Financials | 16.3 | |
Consumer Discretionary | 15.8 | |
Information Technology | 13.1 | |
Materials | 9.3 | |
Health Care | 6.7 | |
Consumer Staples | 6.6 | |
Energy | 6.3 | |
Communication Services | 3.8 | |
Utilities | 1.5 | |
Real Estate | 0.6 | |
Total Short Investments† | 100.0 | % |
.
†Total Long Investments represent 100.4% of net assets and Total Short Investments represent (37.5%) of net assets.
For the year ended December 31, 2018, JNL/Boston Partners Global Long Short Equity Fund underperformed its benchmark by posting a return of -9.51% for Class A shares compared to the -8.71% return for the MSCI World Index (Net). Most asset classes ended the year lower due to a culmination of concerns that threaten to curb global growth.
The Fund’s long portfolio underperformed its benchmark primarily due to a small cap and value tilt. From a sector standpoint, leading long detractors included financials, industrials, and materials. Financials holdings were the largest detractors while banks/insurance were broadly weaker amid a flattening yield curve during the year. We have maintained the position due to benign credit, significant capital return, and attractive valuation. Positive contributions came from communication services led by Verizon Communications Inc. which rose 20% during the year as competitive pricing pressures have abated and wireless subscribers and pricing rose throughout the year.
The Fund’s short portfolio fell in price 11.54% which contributed positively to Fund returns on the year. Energy, consumer discretionary, and industrials were the leading absolute contributors. Energy shorts were driven by U.S. exploration and production companies Matador Resources Co., Apache Corp., and Continental Resources Inc. that fell along with oil prices. These companies also suffered from higher cost basin positions and accelerating capex in the face of a weakening commodity. Consumer staples shorts were the top absolute detractor, with food and staples retailers and food products such as Yamazaki Baking Co. Ltd. and Family Mart UNY Holdings Co. Ltd. rising in price during the year. We have covered both positions.
During the year, we increased net exposure to consumer discretionary and communication services, the latter of which has largely increased due to the introduction of Alphabet Inc. from information technology. We increased exposure to North America and reduced exposure to emerging markets and the pacific region as a slowing Chinese economy and trade disputes developed over the year.
The Fund ended the year with 57% net long exposure, including derivatives, with net exposure highest in financials followed by health care. From a regional perspective, net exposure remains highest to North America followed by Europe. Derivatives did not materially impact performance during the year.
9
| JNL/Causeway International Value Select Fund Causeway Capital Management LLC (Unaudited) |

JNL/Causeway International Value Select Fund
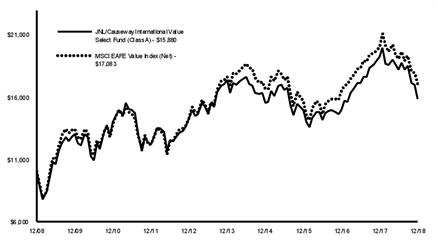
Average Annual Total Returns |
| |||||
Class A |
|
|
| Class I |
|
|
1 Year | -17.51 | % | 1 Year | -17.26 | % | |
5 Year | -1.77 |
|
| 5 Year | -1.53 |
|
10 Year | 4.73 |
|
| 10 Year | 4.97 |
|
The graph shows the change in value of an assumed $10,000 investment in the Fund's Class A shares over 10 years, or since inception if the inception is less than 10 years, as well as the Fund's benchmark(s) performance for the same period.
Past performance is not predictive of future performance. Investment return and principal value will fluctuate so that an investor’s shares, when redeemed, may be worth more or less than their original cost. Performance numbers are net of all Fund operating expenses, but do not reflect the deduction of insurance charges.
Composition as of December 31, 2018: | ||
Financials | 19.1 | % |
Industrials | 13.2 | |
Materials | 12.6 | |
Communication Services | 12.3 | |
Health Care | 11.3 | |
Consumer Discretionary | 9.7 | |
Energy | 6.9 | |
Information Technology | 4.9 | |
Utilities | 3.1 | |
Consumer Staples | 2.7 | |
Other Short Term Investments | 2.3 | |
Securities Lending Collateral | 1.9 | |
Total Investments | 100.0 | % |
For the year ended December 31, 2018, JNL/Causeway International Value Select Fund underperformed its benchmark by posting a return of -17.51% for Class A shares compared to -14.78% for the MSCI EAFE Value Index (Net).
The Fund’s holdings in energy, food beverage and tobacco, insurance, utilities and media and entertainment industry groups detracted from relative performance. Holdings in materials and communication services, as well as an overweight position in pharmaceuticals and biotechnology and transportation and an underweight position in diversified financials industry group, offset some of the underperformance. The largest detractor was British American Tobacco Plc (United Kingdom). Additional notable detractors included banking and financial services company UniCredit SpA (Italy), oil and natural gas producer EnCana Corp. (Canada), Takeda Pharmaceutical Co. Ltd. (Japan), and diversified chemicals manufacturer BASF SE (Germany). The top contributor to return was industrial gas company Linde Plc (Germany). Other notable contributors included pharmaceutical and consumer health care company GlaxoSmithKline Plc (United Kingdom), pharmaceutical company AstraZeneca Plc (United Kingdom), pharmaceutical and consumer health care products producer Novartis AG (Switzerland) and rail operator Canadian Pacific Railway Ltd. (Canada).
Rising U.S. interest rates, a slowdown in Eurozone business confidence, weaker Chinese growth and geopolitical tensions all contributed to a “risk off” investor sentiment, sending volatility higher in the final quarter of 2018. Equity markets punished higher risk, more cyclical stocks, and sent bank stocks – particularly in Europe – to near crisis level valuations. The Fund’s managers like the well capitalized, well managed companies in financials with the free cash to reward shareholders through generous dividend payouts. Despite the 40% fall in the West Texas Intermediate crude oil price from its fourth quarter high to year end, several energy stocks trade at valuations far too low for their growth potential. They believe the worst performing stocks in the fourth quarter demonstrate the most upside potential in the quarters ahead. These undervalued companies are integrating value accretive acquisitions (extracting revenue and cost synergies) or simply running their existing businesses more efficiently. Given the current macroeconomic headwinds, they believe that company level operational restructuring should provide both downside price protection and upside potential.
10
| JNL/ClearBridge Large Cap Growth Fund ClearBridge Investments, LLC (Unaudited) |

JNL/ClearBridge Large Cap Growth Fund
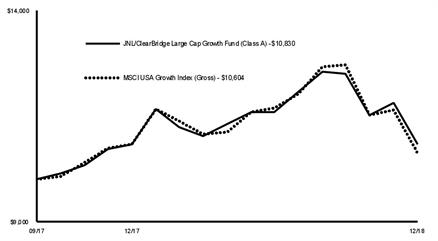
Average Annual Total Returns |
| |||||
Class A‡ |
|
|
| Class I† |
|
|
1 Year | -0.09 | % | 1 Year | 0.18 | % | |
Since Inception | 6.49 |
|
| Since Inception | 6.80 |
|
‡Inception date September 25, 2017 |
| |||||
†Inception date September 25, 2017 |
| |||||
The graph shows the change in value of an assumed $10,000 investment in the Fund's Class A shares over 10 years, or since inception if the inception is less than 10 years, as well as the Fund's benchmark(s) performance for the same period.
Past performance is not predictive of future performance. Investment return and principal value will fluctuate so that an investor’s shares, when redeemed, may be worth more or less than their original cost. Performance numbers are net of all Fund operating expenses, but do not reflect the deduction of insurance charges.
Composition as of December 31, 2018: | ||
Information Technology | 31.9 | % |
Health Care | 16.4 | |
Communication Services | 12.1 | |
Consumer Discretionary | 12.0 | |
Industrials | 6.9 | |
Consumer Staples | 5.7 | |
Financials | 5.2 | |
Materials | 3.6 | |
Energy | 1.7 | |
Real Estate | 1.6 | |
Other Short Term Investments | 2.1 | |
Securities Lending Collateral | 0.8 | |
Total Investments | 100.0 | % |
For the year ended December 31, 2018, JNL/ClearBridge Large Cap Growth Fund outperformed its benchmark by posting a return of -0.09% for Class A shares compared to -2.02% for the MSCI USA Growth Index (Gross).
The Fund outperformed due to stock selection in information technology (“IT”), materials, consumer discretionary and industrials sectors. Amazon.com Inc. remained the Fund’s top performer as it continues to execute across its core ecommerce and cloud businesses and is gaining traction in the online advertising market. The Fund has also received solid contributions from open source software maker Red Hat Inc. which received an acquisition offer from International Business Machines Corp. as well as enterprise software makers Adobe Inc. and Microsoft Corp. and information security provider Palo Alto Networks Inc. Corporate spending on IT offers a strong return on investment and drove performance for these stocks. Conversely, stock selection in health care and financials sectors detracted from results, due to weakness in dental supplier Dentsply Sirona Inc., biotechnology companies Celgene Corp. and Alexion Pharmaceuticals Inc. and asset manager BlackRock Inc.
Many of the tailwinds that have driven equities higher through the long running bull market are turning into headwinds. In this generally less advantageous environment, we believe it is essential to be much more selective in choosing companies to own for the long term. The Fund is pivoted toward companies and industries capable of generating visible and durable growth and that are more insulated from macro risks than the general market, which today include biotechnology, enterprise software, ecommerce and media.
11
| JNL/Crescent High Income Fund Crescent Capital Group LP (Unaudited) |

JNL/Crescent High Income Fund
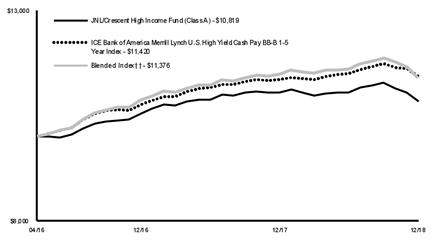
††50% ICE Bank of America Merrill Lynch U.S. High Yield Master II Index, 50% S&P/LSTA Leveraged Loan Index
Average Annual Total Returns |
| |||||
Class A‡ |
|
|
| Class I† |
|
|
1 Year | -2.09 | % | 1 Year | -1.84 | % | |
Since Inception | 2.97 |
|
| Since Inception | -1.10 |
|
‡Inception date April 25, 2016 |
| |||||
†Inception date September 25, 2017 |
| |||||
The graph shows the change in value of an assumed $10,000 investment in the Fund's Class A shares over 10 years, or since inception if the inception is less than 10 years, as well as the Fund's benchmark(s) performance for the same period.
Past performance is not predictive of future performance. Investment return and principal value will fluctuate so that an investor’s shares, when redeemed, may be worth more or less than their original cost. Performance numbers are net of all Fund operating expenses, but do not reflect the deduction of insurance charges.
Composition as of December 31, 2018: | ||
Financials | 15.3 | % |
Communication Services | 12.4 | |
Consumer Discretionary | 12.3 | |
Health Care | 11.1 | |
Industrials | 10.7 | |
Energy | 8.8 | |
Information Technology | 8.2 | |
Materials | 6.9 | |
Utilities | 2.2 | |
Real Estate | 1.9 | |
Consumer Staples | 1.3 | |
Other Equity Interests | - | |
Other Short Term Investments | 4.8 | |
Securities Lending Collateral | 4.1 | |
Total Investments | 100.0 | % |
For the year ended December 31, 2018, JNL/Crescent High Income Fund underperformed its primary benchmark by posting a return of -2.09% compared to 0.69% for the ICE Bank of America Merrill Lynch U.S. High Yield Cash Pay BB-B 1-5 Year Index. The Fund underperformed its blended benchmark return of -0.91% for the 50% ICE Bank of America Merrill Lynch U.S. High Yield Master II Index, 50% S&P/LSTA Leveraged Loan Index.
In 2018, the Fund rotated into floating rate assets, reduced duration and maintained a shorter duration profile versus the benchmark, as well as increased exposures to the BB and B rated credit tiers while reducing exposures to the CCC rated credit tier. The Fund also reduced exposure to energy, basic industries and retail sectors, while adding to the health care and services sectors.
The Fund lagged its benchmark during the first quarter in 2018 and quickly pivoted to reducing duration and adding floating rate assets given the Federal Open Market Committee’s tightening policy. This proved to be beneficial as the Fund’s performance rebounded and fared well for the next two quarters. However, in the fourth quarter, the market sold off materially, and the sentiment quickly shifted given significant volatility and sharp equity and oil price declines. As a result, the Fund’s return turned negative for year.
From a sector standpoint, the Fund benefitted from an underweight positioning in energy, which was the worst performing sector for the year; however, weak security selection within the sector detracted from relative performance. Additionally, weak security selection in basic industry, telecommunications, consumer goods and media also detracted from relative performance. From a credit quality perspective, the Fund’s allocation to out of benchmark CCC rated securities detracted from relative performance; lower quality credit sharply underperformed during the fourth quarter of 2018 despite having outperformed other credit tiers most of the year.
Current market conditions do not warrant any major fundamental concerns. We are cognizant of the policy making challenges in Washington, oil price volatility, and rising geopolitical risks. At the present time, a continuation of the status quo for the U.S. economy seems most likely. With gross domestic product growth of 2.5-3.0% per annum, there’s neither concern for recession nor overheating in the near term.
12
| JNL/DFA U.S. Core Equity Fund Dimensional Fund Advisors LP (Unaudited) |

JNL/DFA U.S. Core Equity Fund

Average Annual Total Returns* |
| |||||
Class A |
|
|
| Class I |
|
|
1 Year | -7.75 | % | 1 Year | -7.46 | % | |
5 Year | 6.34 |
|
| 5 Year | 6.59 |
|
10 Year | 11.98 |
|
| 10 Year | 12.24 |
|
*The Fund's investment adviser waived/reimbursed certain expenses of the Fund. Performance results shown reflect the waiver, without which performance results would have been lower. |
| |||||
The graph shows the change in value of an assumed $10,000 investment in the Fund's Class A shares over 10 years, or since inception if the inception is less than 10 years, as well as the Fund's benchmark(s) performance for the same period.
Past performance is not predictive of future performance. Investment return and principal value will fluctuate so that an investor’s shares, when redeemed, may be worth more or less than their original cost. Performance numbers are net of all Fund operating expenses, but do not reflect the deduction of insurance charges.
Dimensional Fund Advisors LP assumed portfolio responsibility on April 30, 2012.
Composition as of December 31, 2018: | ||
Information Technology | 19.5 | % |
Consumer Discretionary | 13.6 | |
Industrials | 13.3 | |
Financials | 13.0 | |
Health Care | 12.6 | |
Communication Services | 8.2 | |
Consumer Staples | 6.9 | |
Energy | 4.5 | |
Materials | 3.8 | |
Utilities | 3.1 | |
Real Estate | 0.3 | |
Rights | - | |
Securities Lending Collateral | 0.9 | |
Other Short Term Investments | 0.3 | |
Total Investments | 100.0 | % |
For the year ended December 31, 2018, JNL/DFA U.S. Core Equity Fund underperformed its benchmark by posting a return of -7.75% for Class A shares compared to -5.20% for the MSCI USA IMI Index (Gross).
The U.S. market had negative performance in 2018. Small caps underperformed large caps by 6.3% as measured by MSCI USA Small Cap Index (Gross) and MSCI USA Large Cap Index (Gross), respectively. Large cap value stocks underperformed large cap growth stocks by 5.6% as measured by MSCI USA Large Cap Value Index (Gross) and MSCI USA Large Cap Growth Index (Gross), respectively. Small cap value stocks underperformed small cap growth stocks by 6.8% as measured by MSCI USA Small Cap Value Index (Gross) and MSCI USA Small Cap Growth Index (Gross), respectively.
The Fund has a greater emphasis on small caps, as demonstrated by its weighted average total market capitalization of 135,754 million, as compared to the benchmark’s 168,445 million. With small caps underperforming large caps for the year, this greater emphasis on small caps was the primary driver of the Fund’s underperformance relative to the benchmark. Additionally, the Fund has a greater emphasis on value securities, as demonstrated by a lower aggregate price to book compared to the benchmark. This greater emphasis on value stocks also detracted from the Fund’s relative performance against the benchmark, as value stocks generally underperformed growth stocks for the year.
13
| JNL/DoubleLine Core Fixed Income Fund DoubleLine Capital LP (Unaudited) |

JNL/DoubleLine Core Fixed Income Fund
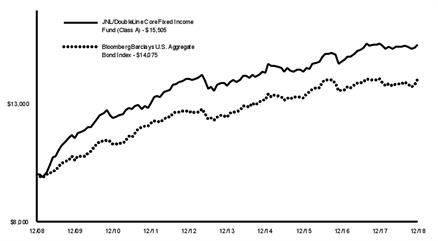
Average Annual Total Returns |
| |||||
Class A |
|
|
| Class I |
|
|
1 Year | -0.45 | % | 1 Year | -0.17 | % | |
5 Year | 2.39 |
|
| 5 Year | 2.61 |
|
10 Year | 4.48 |
|
| 10 Year | 4.70 |
|
The graph shows the change in value of an assumed $10,000 investment in the Fund's Class A shares over 10 years, or since inception if the inception is less than 10 years, as well as the Fund's benchmark(s) performance for the same period.
Past performance is not predictive of future performance. Investment return and principal value will fluctuate so that an investor’s shares, when redeemed, may be worth more or less than their original cost. Performance numbers are net of all Fund operating expenses, but do not reflect the deduction of insurance charges.
DoubleLine Capital LP assumed portfolio management responsibility on September 25, 2017.
Composition as of December 31, 2018: | ||
Government Securities | 30.5 | % |
Non-U.S. Government Agency ABS | 23.3 | |
U.S. Government Agency MBS | 15.8 | |
Financials | 9.1 | |
Utilities | 3.1 | |
Energy | 3.1 | |
Industrials | 2.2 | |
Health Care | 2.1 | |
Communication Services | 2.0 | |
Consumer Discretionary | 2.0 | |
Information Technology | 1.6 | |
Materials | 1.4 | |
Consumer Staples | 1.2 | |
Real Estate | 1.0 | |
Other Equity Interests | - | |
Other Short Term Investments | 1.0 | |
Securities Lending Collateral | 0.6 | |
Total Investments | 100.0 | % |
For the year ended December 31, 2018, JNL/DoubleLine Core Fixed Income Fund underperformed its primary benchmark by posting a return of -0.45% for Class A shares compared to 0.01% for the Bloomberg Barclays U.S. Aggregate Bond Index.
The Fund has a duration of approximately 4.4 years and a weighted average life of 6.7 years at year end. One of the primary contributing factors to performance was the Fund maintaining a duration that was materially shorter than the benchmark during a period of rising rates. This was achieved while maintaining a yield advantage over the benchmark, finishing the year with an estimated yield to maturity of 4.02%. This was a year with significant directional dispersion across sectors as volatility returned to the market and credit spreads widened. Top performing sectors for the year included structured products such as non-agency mortgage-backed securities, asset-backed securities, and commercial mortgage-backed securities. Positive performance was driven by a combination of low duration and strong carry profile versus the benchmark, alongside healthy fundamentals. On the contrary, corporate credit related sectors such as investment grade credit, high yield credit, and collateralized loan obligations were drags on performance as macro concerns and the return of volatility helped press spreads materially wider on the year. Throughout the year there were modest adjustments to targeted allocations primarily related to corporate credit. Heading into 2019, we believe that the emerging markets sector has become sufficiently cheap to merit an increased target allocation to a Fund that is still defensively positioned. We plan to continue to manage the Fund with a duration lower than the benchmark as we believe there is a bias towards higher rates over the medium term. We also continue to focus on developments emanating from the U.S. Federal Reserve (“Fed”), their pace of quantitative tightening via balance sheet reductions, and Fed funds rate adjustments.
14
| JNL/DoubleLine Emerging Markets Fixed Income Fund DoubleLine Capital LP (Unaudited) |

JNL/DoubleLine Emerging Markets Fixed Income Fund

Average Annual Total Returns |
| |||||
Class A‡ |
|
|
| Class I† |
|
|
1 Year | -2.81 | % | 1 Year | -2.51 | % | |
Since Inception | 3.40 |
|
| Since Inception | -1.98 |
|
‡Inception date April 25, 2016 |
| |||||
†Inception date September 25, 2017 |
| |||||
The graph shows the change in value of an assumed $10,000 investment in the Fund's Class A shares over 10 years, or since inception if the inception is less than 10 years, as well as the Fund's benchmark(s) performance for the same period.
Past performance is not predictive of future performance. Investment return and principal value will fluctuate so that an investor’s shares, when redeemed, may be worth more or less than their original cost. Performance numbers are net of all Fund operating expenses, but do not reflect the deduction of insurance charges.
Composition as of December 31, 2018: | ||
Financials | 34.7 | % |
Energy | 17.3 | |
Government Securities | 13.8 | |
Utilities | 7.9 | |
Consumer Staples | 7.2 | |
Communication Services | 6.5 | |
Materials | 5.0 | |
Consumer Discretionary | 3.0 | |
Industrials | 1.1 | |
Securities Lending Collateral | 3.5 | |
Total Investments | 100.0 | % |
For the year ended December 31, 2018, JNL/DoubleLine Emerging Markets Fixed Income Fund outperformed its primary benchmark by posting a return of -2.81% of Class A shares compared to -4.26% for the JPMorgan EMBI Global Diversified Index. The Fund underperformed its other benchmark’s return of -1.65% for the JPMorgan CEMBI Broad Diversified Index.
Emerging markets (“EM”) sovereign and corporate external bonds posted negative performance in 2018. The benchmark posted a negative return against a backdrop of deteriorating risk sentiment amid ongoing trade uncertainties and moderating global growth. The negative return during the year was driven by wider credit spreads and higher U.S. Treasury (“UST”) yields, partially offset by accrued interest. The spread over UST widened sharply by 130 basis points (“bps”) to 415 bps, while 2 year and 10 year UST yields rose 60 bps and 28 bps to 2.49% and 2.68%, respectively.
Over 2018, the Fund posted a negative gross return but outperformed its primary benchmark’s return of -4.26%. Negative performance within the account was driven by wider credit spreads and higher UST yields, partially offset by accrued interest. Outperformance relative to the benchmark was driven by the account’s shorter duration, larger weighting in investment grade credits and exposure to corporate issuers, relative to the index. Over the year, EM investment grade credits outperformed their high yield (“HY”) counterparts, while EM corporate credits outperformed sovereign credits. The Fund broadly maintained the duration of the overall Fund over the period, with a duration of 4.6 as of the end of December 2018 (versus the benchmark’s duration of 6.6). The Fund significantly increased the HY allocation from 5.4% to 36.9% as the of end of December 2018 as we saw opportunities in select HY credits that had corrected to attractive levels. The credit rotation was reflected in an increase in regional allocations to Latin American credits, especially in Brazil, Argentina, Mexico and Colombia, and reduced exposure across Asian credits. The Fund maintained an underweight position across Central and Eastern Europe, the Middle East and Africa credits. The cash balance decreased from 2.4% to 1.6% over the year.
Credit spreads on the EM asset class continued to widen over 2018 and closed the year at the widest level of 2018. Over 2019, we see the potential for elevated volatility to persist, perhaps driven by a slowdown in global growth or the withdrawal of developed market central bank liquidity which could cause a sell off in global rates. We also see the potential for geopolitical and policy risks across EM where negative surprises may drive credit spreads wider. We would likely view volatility as an opportunity to continue to selectively reposition the portfolio into credits that have strong credit metrics or a deleveraging story.
15
| JNL/DoubleLine Shiller Enhanced CAPE Fund DoubleLine Capital LP (Unaudited) |

JNL/DoubleLine Shiller Enhanced CAPE Fund

Average Annual Total Returns* |
| |||||
Class A‡ |
|
|
| Class I† |
|
|
1 Year | -4.51 | % | 1 Year | -4.23 | % | |
Since Inception | 13.63 |
|
| Since Inception | 1.38 |
|
‡Inception date September 28, 2015 |
| |||||
†Inception date September 25, 2017 |
| |||||
*The Fund's investment adviser waived/reimbursed certain expenses of the Fund. Performance results shown reflect the waiver, without which performance results would have been lower. |
| |||||
The graph shows the change in value of an assumed $10,000 investment in the Fund's Class A shares over 10 years, or since inception if the inception is less than 10 years, as well as the Fund's benchmark(s) performance for the same period.
Past performance is not predictive of future performance. Investment return and principal value will fluctuate so that an investor’s shares, when redeemed, may be worth more or less than their original cost. Performance numbers are net of all Fund operating expenses, but do not reflect the deduction of insurance charges.
Composition as of December 31, 2018: | ||
Non-U.S. Government Agency ABS | 48.8 | % |
Government Securities | 15.6 | |
Financials | 8.4 | |
U.S. Government Agency MBS | 8.0 | |
Health Care | 2.6 | |
Energy | 1.9 | |
Information Technology | 1.7 | |
Industrials | 1.7 | |
Communication Services | 1.6 | |
Consumer Discretionary | 1.6 | |
Consumer Staples | 1.4 | |
Materials | 1.2 | |
Utilities | 0.8 | |
Real Estate | - | |
Other Short Term Investments | 4.7 | |
Total Investments | 100.0 | % |
For the year ended December 31, 2018, JNL/DoubleLine Shiller Enhanced CAPE Fund underperformed its primary benchmark by posting a return of -4.51% of Class A shares compared to -4.38% for the S&P 500 Index.
The broad U.S. large cap equity market as measured by the S&P 500 Index lost 4.38%, and the large cap value segment of the market, as represented by the Russell 1000 Value Index, lost 8.28%. Over the course of the year, the Shiller Barclays CAPE U.S. Sector Index (“CAPE Index”) was allocated to six sectors: communication services, consumer discretionary, consumer staples, health care, industrials and information technology. Two of these sectors contributed positively to Fund returns while constituents of the CAPE Index: consumer discretionary and health care. Communication services, consumer staples and industrials were the greatest negative contributors. The fixed income collateral fund increased in value during 2018, with all sectors delivering positive returns. The sectors providing the largest gains were commercial mortgage-backed securities (“MBS”), asset-backed and residential MBS. The bank loan, emerging market fixed income and investment grade credit sectors provided the lowest returns.
Although equities began 2018 as they had ended 2017 – with record highs and low volatility – by late January concerns over higher interest rates saw the market quickly trade 10% lower. Accompanied by strong corporate earnings, by early April equities began to move higher again. In each of the first three quarters of 2018, the benchmark saw earnings growth of approximately 25% year over year. The corporate tax cuts signed into law at the end of 2017 provided one time boost in earnings. However, even removing the benefit of lower taxes, corporate earnings would likely have grown at an above average rate over this period, as evidenced by the strong revenue growth reported by the companies of the benchmark.
The nascent trade war between the U.S. and a large number of its global trading partners began to have an effect on capital markets in May. Initially the effect was not noticeable in U.S. equities – in fact, the benchmark continued to appreciate and by July would be again setting new all time highs. However, much of the global equity market began sharply diverging from the U.S. markets in May. In particular, by late summer the markets of export driven economies such as Korea, China and Germany had declined significantly from their January highs. At the same time, many of these economies were recording weaker leading economic indicators.
By the fourth quarter, attention turned to monetary policy. Despite signs of a slowing economy and flattening yield curve, the U.S. Federal Reserve (“Fed”) continued to signal its intention to raise Fed funds through 2019. At the same time, the Fed continued to shrink its balance sheet at an annual pace of $600 billion. By late December, the benchmark had lost nearly 20% of its value on concerns of a Fed policy error in the face of slowing global and corporate earnings growth. Even with a sharp rally at year end – following a concerted effort by senior Fed officials, including Chairman Powell, to reassure the markets they were not on “auto pilot” – the market ended 2018 with a loss, the first in a decade.
16
| JNL/First State Global Infrastructure Fund Colonial First State Asset Management (Australia) Limited (Unaudited) |

JNL/First State Global Infrastructure Fund
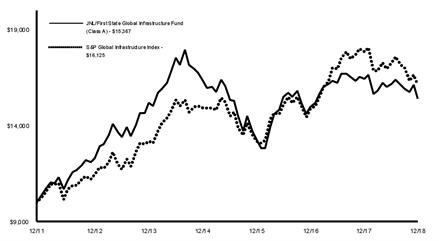
Average Annual Total Returns |
| |||||
Class A‡ |
|
|
| Class I† |
|
|
1 Year | -6.40 | % | 1 Year | -6.10 | % | |
5 Year | 0.25 |
|
| 5 Year | 0.48 |
|
Since Inception | 6.28 |
|
| Since Inception | 6.51 |
|
‡Inception date December 12, 2011 |
| |||||
†Inception date December 12, 2011 |
| |||||
The graph shows the change in value of an assumed $10,000 investment in the Fund's Class A shares over 10 years, or since inception if the inception is less than 10 years, as well as the Fund's benchmark(s) performance for the same period.
Past performance is not predictive of future performance. Investment return and principal value will fluctuate so that an investor’s shares, when redeemed, may be worth more or less than their original cost. Performance numbers are net of all Fund operating expenses, but do not reflect the deduction of insurance charges.
Colonial First State Asset Management (Australia) Limited assumed portfolio management responsibility on August 13, 2018.
Composition as of December 31, 2018: | ||
Utilities | 40.4 | % |
Industrials | 34.0 | |
Energy | 12.7 | |
Real Estate | 7.8 | |
Securities Lending Collateral | 5.0 | |
Other Short Term Investments | 0.1 | |
Total Investments | 100.0 | % |
For the year ended December 31, 2018, JNL/First State Global Infrastructure Fund outperformed its benchmark by posting a return of -6.40% for Class A shares compared to -9.50% for the S&P Global Infrastructure Index.
Effective August 13, 2018, JNL/Brookfield Global Infrastructure and MLP Fund’s name was changed to JNL/First State Global Infrastructure Fund.
For the period January 1, 2018 through August 12, 2018, the Fund was sub-advised by Brookfield Investment Management Inc. During the period, the Fund posted a return of -0.86% for Class A shares compared to -2.83% for the S&P Global Infrastructure Index.
The non benchmark master limited partnership sector was the leading contributor to relative performance for the year, primarily driven from gains in our position in Energy Transfer Operating LP (“Energy Transfer”). Toll roads and renewables/electric generation were also leading contributors. Conversely, airports with an underweight allocation was the leading detractor to relative performance for the year. Midstream with an underweight allocation and non benchmark communication services were also leading detractor.
By security, overweight exposure to Energy Transfer was the leading contributor to relative performance. Our underweight position in Dominion Energy Inc. and overweight allocation to Orsted A/S were also leading contributors. Conversely, zero exposure to ONEOK Inc. was the leading detractor to relative performance. An underweight allocation to Aeroports de Paris SA as well as an overweight position in Aena SME SA were also leading detractors.
The Fund uses a disciplined, bottom-up investment process with an equal emphasis on quality and valuation which aims to identify mispricing. As a result, the Fund’s relative performance tends to be driven primarily by stock selection. Effective August 13, 2018, Colonial First State Asset Management (Australia) Limited assumed management responsibility for the Fund. For the period August 13, 2018 through December 31, 2018, the Fund posted a return of -5.59% for Class A shares compared to -6.87% for the S&P Global Infrastructure Index.
Mounting concerns about slowing global growth rates weighed on financial markets during the period. The appeal of infrastructure’s stable, long life assets and predictable cashflows, combined with the positive effect of active management, helped to limit the Fund’s fall.
Holdings in real estate such as American Tower Corp. and SBA Communications Corp. contributed positively to Fund performance. Pleasing earnings numbers provided a reminder of the sector’s ability to benefit from ongoing growth in consumer demand for mobile data.
However, U.S. West Coast electric utility PG&E Corp. fell on concerns about potential liabilities for costs associated with California’s devastating wildfires. Pipelines including TransCanada Corp. and Williams Cos. Inc. underperformed as investors disregarded their appealing valuation multiples, focusing instead on lower energy prices and project delays.
Political and regulatory uncertainty remains a key risk for infrastructure investors. An unpredictable Trump administration, trade tariffs, Brexit, and increasingly populist political environment in Europe and Latin America could pose challenges for infrastructure investors.
Political initiatives and regulatory developments can also be supportive for infrastructure. Public policy support for infrastructure investment remains strong, especially relating to replacing aged infrastructure assets, reducing urban congestion, and decarbonizing electricity generation.
17
| JNL/FPA + DoubleLine Flexible Allocation Fund DoubleLine Capital LP First Pacific Advisors, LP. (Unaudited) |


JNL/FPA + DoubleLine Flexible Allocation Fund
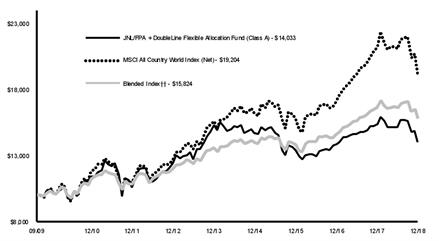
††60% MSCI All Country World Index (Net), 40% Bloomberg Barclays U.S. Aggregate 1-3 Year Index
Average Annual Total Returns |
| |||||
Class A‡ |
|
|
| Class I† |
|
|
1 Year | -8.81 | % | 1 Year | -8.58 | % | |
5 Year | -1.75 |
|
| 5 Year | -1.52 |
|
Since Inception | 3.73 |
|
| Since Inception | 3.94 |
|
‡Inception date September 28, 2009 |
| |||||
†Inception date September 28, 2009 |
| |||||
The graph shows the change in value of an assumed $10,000 investment in the Fund's Class A shares over 10 years, or since inception if the inception is less than 10 years, as well as the Fund's benchmark(s) performance for the same period.
Past performance is not predictive of future performance. Investment return and principal value will fluctuate so that an investor’s shares, when redeemed, may be worth more or less than their original cost. Performance numbers are net of all Fund operating expenses, but do not reflect the deduction of insurance charges.
DoubleLine Capital LP and First Pacific Advisors, LLC assumed portfolio management responsibility on April 25, 2016.
Composition as of December 31, 2018: | ||
Financials | 19.6 | % |
Communication Services | 15.6 | |
Information Technology | 12.3 | |
Non-U.S. Government Agency ABS | 12.2 | |
U.S. Government Agency MBS | 10.5 | |
Industrials | 6.3 | |
Consumer Discretionary | 5.8 | |
Materials | 5.8 | |
Energy | 2.6 | |
Health Care | 2.6 | |
Government Securities | 1.5 | |
Utilities | 1.0 | |
Consumer Staples | 0.5 | |
Real Estate | - | |
Investment Companies | - | |
Other Short Term Investments | 3.2 | |
Securities Lending Collateral | 0.5 | |
Net Long (Short) Investments | 100.0 | % |
For the year ended December 31, 2018, JNL/FPA + DoubleLine Flexible Allocation Fund outperformed its primary benchmark by posting a return of -8.81% compared to -9.42% for the MSCI All Country World Index (Net). The Fund underperformed its blended benchmark return of -4.94% for the 60% MSCI All Country World Index (Net), 40% Bloomberg Barclays U.S. Aggregate 1-3 Year Index.
The Fund slightly outperformed its all-equity primary benchmark owing entirely to the 34% allocation to fixed income, which provided a cushion in a down year for equities. Against the blended benchmark, the Fund fared worse due to its underweight position in fixed income and poor relative results from both sleeves. The FPA sleeve (-13.54%) underperformed its MSCI ACWI benchmark by more than 400 basis points (“bps”) while the DoubleLine sleeve (0.20%) underperformed by 140 bps.
Ivy Investment Management Company (“Ivy”)
The private equity investments managed by Ivy remained at less than 1% of net assets at December 31, 2018.
DoubleLine Capital LP (“DoubleLine”)
For the Fund’s allocation to the relative strategy, DoubleLine invests in a portfolio of debt instruments with the objective to provide additional long term total return. At December 31, 2018, the Fund’s allocation to this strategy was 34.2%.
The DoubleLine sleeve of the Fund underperformed the Bloomberg Barclays U.S. 1-3yr Aggregate Index during 2018. Asset-Backed securities, commercial mortgage-backed securities, and Non-Agency residential mortgage-backed securities were the top performing sectors in the strategy over the year and benefitted from a lower duration relative to the benchmark as well as strong performance on spread tightening throughout the year. Collateralized loan obligations and bank loans in the strategy produced positive performance in 2018. This was primarily due to the floating rate structure of the sectors that was supported by the U.S. Federal Reserve (“Fed”) raising rates 4 times over the year. Despite rates increasing and credit spreads widening out in 2018, emerging market and investment grade (“IG”) corporates in the strategy produced positive returns during the year due to their relatively lower duration and interest carry profiles. High yield (“HY”) corporates were a top performing sector during the first three quarters of 2018 but finished the year with the worst performance as spreads blew out on concerns related to trade, oil supply and the pace of the ongoing Fed tightening cycle. We hold the belief that the credit cycle is closer to its end than its beginning and as a result remain cautious with regards to U.S. IG and HY debt.
First Pacific Advisors, LP. (“First Pacific”)
For the Fund’s allocation to the relative strategy, First Pacific pursues a contrarian value strategy that identifies absolute value opportunities across the capital structure, and in a variety of market capitalizations, geographies and sectors with the long term objective of achieving equity rates of return with less risk than the market. At December 31, 2018, the Fund’s allocation to this strategy was 65.8%.
During the course of 2018, long positions in Microsoft Corp., Broadcom Corp., Cisco Systems Inc. and AON Corp., as well as a short position in the Standard & Poor’s Depositary Receipt S&P Regional Banking exchange traded fund, employed as a hedge for various other long equity positions in financials, contributed approximately 5.6% to gross performance in the strategy. Meanwhile, American International Group Inc. (“AIG”), Arconic Inc., Baidu.com, JD.com Inc. and Mylan NV detracted approximately 9.3% from gross performance in the strategy. As one of the largest equity holdings in the Fund, the strategy managers believe AIG shares represent good value based on current operations and are hopeful that new management will meaningfully improve the company’s return on equity.
18
| JNL/Franklin Templeton Global Fund Templeton Global Advisors Limited (Unaudited) |

JNL/Franklin Templeton Global Fund
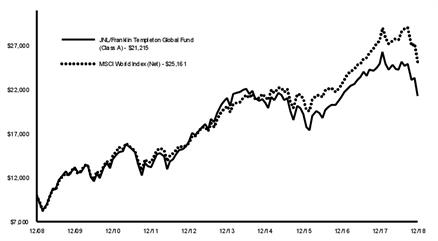
Average Annual Total Returns |
| |||||
Class A |
|
|
| Class I |
|
|
1 Year | -14.81 | % | 1 Year | -14.57 | % | |
5 Year | 0.24 |
|
| 5 Year | 0.45 |
|
10 Year | 7.81 |
|
| 10 Year | 8.02 |
|
The graph shows the change in value of an assumed $10,000 investment in the Fund's Class A shares over 10 years, or since inception if the inception is less than 10 years, as well as the Fund's benchmark(s) performance for the same period.
Past performance is not predictive of future performance. Investment return and principal value will fluctuate so that an investor’s shares, when redeemed, may be worth more or less than their original cost. Performance numbers are net of all Fund operating expenses, but do not reflect the deduction of insurance charges.
Composition as of December 31, 2018: | ||
Financials | 19.8 | % |
Health Care | 18.5 | |
Communication Services | 11.7 | |
Energy | 10.4 | |
Industrials | 7.8 | |
Consumer Discretionary | 7.1 | |
Consumer Staples | 6.9 | |
Information Technology | 5.1 | |
Materials | 3.2 | |
Utilities | 2.7 | |
Real Estate | 1.1 | |
Other Short Term Investments | 3.3 | |
Securities Lending Collateral | 2.4 | |
Total Investments | 100.0 | % |
For the year ended December 31, 2018, JNL/Franklin Templeton Global Fund underperformed its benchmark by posting a return of -14.81% for Class A shares compared to -8.71% for the MSCI World Index (Net).
From a sector standpoint, relative weakness was primarily attributable to stock specific issues in financials, where U.S. universal bank Citigroup Inc. and a handful of European lenders detracted. At year end, European banks traded at the same multiple relative to trailing earnings as they did in the depths of 2011’s sovereign debt crisis, despite taking significant measures to improve asset quality and returns.
Health care also detracted as stock specific weakness overshadowed a favorable overweight allocation. We believe select health care stocks offer growth uncorrelated to the economy and defensiveness uncorrelated to bond yields. Investors might expect to pay a premium for such attributes, but the sector recently traded at a discount to price to free cash flow while paying a dividend yield on par with 10-year Treasury bonds.
Information technology and consumer discretionary also hindered results, due to stock selection.
Turning to contributors, stock selection in communications services buoyed relative returns. Luxembourg based satellite specialist SES SA was a top contributor. Recent results highlight some of the progress achieved by a new management team working to stabilize the business, repair the balance sheet and seize long term growth opportunities.
Security selection in energy and materials also benefited relative performance. In the former sector, we continued rotating into more defensive, integrated stocks over the course of the year; however, with oil once again trading near cash costs, we are also searching for bargains in more cyclical parts of the sector. Materials holdings benefited from modest exposure to select precious metals related companies, which rebounded strongly at year end amid rising financial market stress.
From a regional standpoint, stock selection in the U.S. detracted significantly from relative results. In Europe, security selection and an overweight position in the UK hindered performance. Conversely, stock selection and an underweight in Japan benefited relative results in Asia.
During the year, the U.S. Dollar rose in value relative to many currencies in which the Fund’s investments were traded, which hurt the Fund’s performance because investments in securities with non-U.S. currency exposure lost value as the U.S. Dollar appreciated.
19
| JNL/Franklin Templeton Global Multisector Bond Fund Franklin Advisers, Inc. (Unaudited) |

JNL/Franklin Templeton Global Multisector Bond Fund

Average Annual Total Returns |
| |||||
Class A‡ |
|
|
| Class I† |
|
|
1 Year | 0.65 | % | 1 Year | 0.93 | % | |
5 Year | 0.65 |
|
| 5 Year | 0.87 |
|
Since Inception | 3.42 |
|
| Since Inception | 3.64 |
|
‡Inception date December 12, 2011 |
| |||||
†Inception date December 12, 2011 |
| |||||
The graph shows the change in value of an assumed $10,000 investment in the Fund's Class A shares over 10 years, or since inception if the inception is less than 10 years, as well as the Fund's benchmark(s) performance for the same period.
Past performance is not predictive of future performance. Investment return and principal value will fluctuate so that an investor’s shares, when redeemed, may be worth more or less than their original cost. Performance numbers are net of all Fund operating expenses, but do not reflect the deduction of insurance charges.
Composition as of December 31, 2018: | ||
Government Securities | 54.1 | % |
Financials | - | |
Industrials | - | |
Warrants | - | |
Other Short Term Investments | 45.9 | |
Total Investments | 100.0 | % |
For the year ended December 31, 2018, JNL/Franklin Templeton Global Multisector Bond Fund outperformed its benchmark by posting a return of 0.65% for Class A shares compared to -1.36% for the Bloomberg Barclays Multiverse Bond Index.
The Fund is not constrained by its benchmark and seeks total return through a combination of interest income, capital appreciation and currency gains by investing primarily in debt securities of governments, government related entities and corporate issuers around the world. The Fund also uses derivatives, including interest rate swaps and currency forwards. During the year the Fund was positioned for rising rates in the U.S. by maintaining low portfolio duration and using interest rate swaps to gain negative duration exposure to U.S. Treasuries. The Fund also continued to seek select duration exposures in emerging markets that offered positive real yields without taking undue interest rate risk, favoring countries that have solid underlying fundamentals and prudent fiscal and monetary policies.
During the year, the Fund’s positive absolute performance was primarily attributable to interest rate strategies, followed by currency positions. Overall credit exposures had a largely neutral effect on absolute results. Negative duration exposure to U.S. Treasuries contributed to absolute performance, as did duration exposure in Brazil. However, duration exposures in Argentina and Indonesia detracted. Among currencies, the Fund’s net negative positions in the Euro and the Australian Dollar, achieved through the use of currency forwards, contributed to absolute results, while its net negative position in the Japanese Yen, also through currency forwards, had a largely neutral effect. Currency positions in Latin America and Asia ex-Japan detracted from absolute performance (the Brazilian Real, Argentine Peso and Indian Rupee detracted, while the Mexican Peso contributed).
The Fund’s relative outperformance was primarily attributable to currency positions, followed by overall credit exposures. Interest rate strategies detracted from relative results. Among currencies, underweighted positions in the Euro and the Australian Dollar contributed to relative performance, while underweighted positioning in the Japanese Yen had a largely neutral effect. Overweighted currency positions in Latin America and Asia ex-Japan detracted from relative results (the Brazilian Real, Argentine Peso and Indian Rupee detracted, while the Mexican Peso contributed). Select underweighted duration exposures in Europe detracted from relative performance, as did overweighted duration exposures in Argentina and Indonesia. However, overweighted duration exposure in Brazil contributed to relative performance.
20
| JNL/Franklin Templeton Income Fund Franklin Advisers, Inc. (Unaudited) |

JNL/Franklin Templeton Income Fund
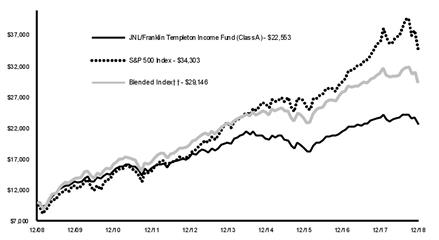
††50% S&P 500 Value Index, 50% ICE Bank of America Merrill Lynch U.S. High Yield Master II Index
Average Annual Total Returns |
| |||||
Class A |
|
|
| Class I |
|
|
1 Year | -4.22 | % | 1 Year | -3.95 | % | |
5 Year | 2.81 |
|
| 5 Year | 3.04 |
|
10 Year | 8.47 |
|
| 10 Year | 8.69 |
|
The graph shows the change in value of an assumed $10,000 investment in the Fund's Class A shares over 10 years, or since inception if the inception is less than 10 years, as well as the Fund's benchmark(s) performance for the same period.
Past performance is not predictive of future performance. Investment return and principal value will fluctuate so that an investor’s shares, when redeemed, may be worth more or less than their original cost. Performance numbers are net of all Fund operating expenses, but do not reflect the deduction of insurance charges.
Composition as of December 31, 2018: | ||
Health Care | 14.5 | % |
Financials | 13.2 | |
Energy | 11.1 | |
Utilities | 7.8 | |
Communication Services | 7.6 | |
Government Securities | 7.5 | |
Consumer Discretionary | 6.6 | |
Information Technology | 6.5 | |
Materials | 5.0 | |
Consumer Staples | 4.4 | |
Industrials | 3.2 | |
Real Estate | 1.0 | |
Other Equity Interests | - | |
Securities Lending Collateral | 6.2 | |
Other Short Term Investments | 5.4 | |
Total Investments | 100.0 | % |
For the year ended December 31, 2018, JNL/Franklin Templeton Income Fund outperformed its primary benchmark by posting a return of -4.22% for Class A shares compared to -4.38% for the S&P 500 Index. The Fund outperformed its blended benchmark return of -5.51% for the 50% S&P 500 Value Index, 50% ICE Bank of America Merrill Lynch U.S. High Yield Master II Index.
As a result of numerous factors, volatility increased during 2018 across a range of asset classes from the very low levels experienced in 2017. The Fund shifts were intended to help balance the Fund’s asset mix and reduce the expected risk of the Fund going forward. Key to this was the addition of short and intermediate maturity U.S. Treasury securities into the Fund. The rise in interest rates over the last 12 to 18 months also made these securities more attractive on a relative value basis compared to the fuller valuations across much of the equity and corporate credit markets.
At year end the Fund held 47.5% in fixed income securities (up from 37.1% at year end 2017), including 35.8% in corporate debt, 7.9% in U.S. Treasury securities, and 3.8% in floating rate corporate loans. We have maintained an emphasis on select opportunities within corporate debt securities, particularly within high yield bonds where we prefer to emphasize company specific factors rather than broad credit and interest rate risk. (High yield bonds have the added advantage of being a fairly short duration asset class.) Rising interest rates and select widening in corporate credit spreads presented an opportunity to more than double the weighting of investment grade corporate debt to 9.4% of assets.
Corporate fixed income sector exposures remain fairly diversified, with health care (9.8%), communication services (6.3%), energy (6.0%), and financials (5.6%) being the largest weightings.
Overall performance among fixed income holdings was positive for the year, with key contributions from health care, as well as U.S. Treasury and utilities holdings. Key detractors among fixed income positions were concentrated in energy and consumer discretionary.
During the year holdings of equity securities declined from 56.2% to 46.9%. While the overall performance from equity securities turned negative as equity markets came under significant pressure to end the year, performance was fairly mixed across sectors. Economically sensitive sectors came under the greatest pressure at year end, with energy, financials, industrials and materials among the leading detractors. Partially offsetting the detractors were contributions from equity holdings in health care, information technology and utilities.
The Fund made limited use of derivative instruments during the year, such as equity linked notes. The goal of these instruments is to enhance Fund returns and more efficiently exit stock positions at prices the Fund deems attractive. These positions did not have a material impact on performance.
21
| JNL/Franklin Templeton International Small Cap Fund Franklin Templeton Institutional, LLC Templeton Investment Counsel, LLC (Unaudited) |

JNL/Franklin Templeton International Small Cap Fund
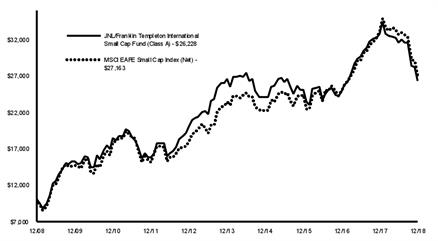
Average Annual Total Returns |
| |||||
Class A |
|
|
| Class I |
|
|
1 Year | -19.78 | % | 1 Year | -19.55 | % | |
5 Year | -0.28 |
|
| 5 Year | -0.06 |
|
10 Year | 10.12 |
|
| 10 Year | 10.34 |
|
The graph shows the change in value of an assumed $10,000 investment in the Fund's Class A shares over 10 years, or since inception if the inception is less than 10 years, as well as the Fund's benchmark(s) performance for the same period.
Past performance is not predictive of future performance. Investment return and principal value will fluctuate so that an investor’s shares, when redeemed, may be worth more or less than their original cost. Performance numbers are net of all Fund operating expenses, but do not reflect the deduction of insurance charges.
Franklin Templeton Institutional, LLC assumed portfolio management responsibility on May 3, 2010.
Composition as of December 31, 2018: | ||
Industrials | 25.1 | % |
Consumer Discretionary | 16.9 | |
Financials | 14.2 | |
Consumer Staples | 10.0 | |
Real Estate | 5.6 | |
Materials | 5.0 | |
Communication Services | 4.7 | |
Information Technology | 4.7 | |
Energy | 4.3 | |
Health Care | 3.0 | |
Other Short Term Investments | 3.9 | |
Securities Lending Collateral | 2.6 | |
Total Investments | 100.0 | % |
For the year ended December 31, 2018, JNL/Franklin Templeton International Small Cap Fund underperformed its benchmark by posting a return of -19.78% for Class A shares compared to -17.89% for the MSCI EAFE Small Cap Index (Net).
Effective August 13, 2018, JNL/Franklin Templeton International Small Cap Growth Fund’s name changed to JNL/Franklin Templeton International Small Cap Fund.
Relative to the benchmark, stock selection in consumer staples detracted from relative performance. Key detractors in the sector included Ireland based Total Produce Plc and Denmark based Scandinavian Tobacco Group A/S. Stock selection and an overweighting in industrials also hindered results, including integrated shipping services company Clarkson Plc, building and municipal infrastructure solutions provider Uponor Oyj and facility services company ISS A/S. In contrast, stock selection in consumer discretionary aided relative performance. Key contributors in the sector included entertainment related products and services company Bandai Namco Holdings Inc. Stock selection in financials also helped relative performance. Key contributors in the sector included U.S. listed reinsurance provider RenaissanceRe Holdings Ltd.
In regional terms, stock selection in Europe detracted from relative performance, notably holdings in Denmark, Ireland and the UK. In Latin America and the Caribbean, exposure to Chile hindered relative performance. In contrast, an overweighting in North America, particularly in the U.S., contributed to relative performance. In Asia, stock selection in Japan benefited relative results.
During the period, the U.S. Dollar rose in value against most foreign currencies, which hurt the Fund’s performance because investments in securities with non-U.S. currency exposure lost value as the U.S. Dollar rose.
As always, our strategy is to seek out what we consider attractively valued companies with durable competitive advantages that have the ability to create value over time. The greater economic uncertainty that arose in the second half of the year created challenges for more cyclically oriented stocks. Given our concerns about growth, we had been slowly reducing exposure to more economically sensitive companies as they reached our estimation of full value, in favor of companies with more stable business profiles that were trading at what we viewed as attractive levels. Sector and regional allocation changes were a result of this bottom-up stock selection process and not any top-down sector or regional view.
During the year, new additions to the Fund included France based contract caterer Elior Group SA, UK waste management firm Biffa Plc and UK plastic packaging company RPC Group Plc. Liquidations included a number of real estate stocks, including U.S. based Kennedy-Wilson Holdings Inc., as well as cyclical companies such as France based recreational boat manufacturer Beneteau SA.
22
| JNL/Franklin Templeton Mutual Shares Fund Franklin Mutual Advisers, LLC (Unaudited) |

JNL/Franklin Templeton Mutual Shares Fund

Average Annual Total Returns |
| |||||
Class A |
|
|
| Class I |
|
|
1 Year | -9.03 | % | 1 Year | -8.76 | % | |
5 Year | 3.08 |
|
| 5 Year | 3.30 |
|
10 Year | 9.06 |
|
| 10 Year | 9.30 |
|
The graph shows the change in value of an assumed $10,000 investment in the Fund's Class A shares over 10 years, or since inception if the inception is less than 10 years, as well as the Fund's benchmark(s) performance for the same period.
Past performance is not predictive of future performance. Investment return and principal value will fluctuate so that an investor’s shares, when redeemed, may be worth more or less than their original cost. Performance numbers are net of all Fund operating expenses, but do not reflect the deduction of insurance charges.
Composition as of December 31, 2018: | ||
Financials | 20.5 | % |
Health Care | 13.1 | |
Communication Services | 12.0 | |
Information Technology | 11.1 | |
Energy | 9.6 | |
Consumer Staples | 6.6 | |
Industrials | 5.7 | |
Consumer Discretionary | 4.9 | |
Materials | 1.9 | |
Real Estate | 1.3 | |
Utilities | 0.9 | |
Other Equity Interests | - | |
Warrants | - | |
Other Short Term Investments | 12.4 | |
Total Investments | 100.0 | % |
For the year ended December 31, 2018, JNL/Franklin Templeton Mutual Shares Fund underperformed its benchmark by posting a return of -9.03% for Class A shares compared to -4.38% for the S&P 500 Index.
The Fund follows our distinctive value investment approach, without regard to the benchmark index. Stock selection and an overweighting in financials hindered Fund performance relative to the S&P 500 Index, as did stock selection in consumer staples and stock selection and underweighting in information technology (“IT”). Stock selection in health care and energy benefited relative Fund performance.
Major contributors to absolute performance included U.S. based pharmaceutical company Eli Lilly & Co. (“Eli Lilly”), pharmaceutical company Merck & Co. Inc. (“Merck”) and multinational software company Microsoft Corp. (“Microsoft”). Eli Lilly benefited from strong quarterly results, attractive corporate fundamentals and fewer concerns regarding efforts to lower drug prices. Merck benefited after releasing favorable clinical trial results. Microsoft continued to be rewarded by its growing cloud computing business and efforts to move clients to a subscription based service.
In contrast, top detractors from performance included UK based British American Tobacco Plc (“British American Tobacco”), U.S. based insurer American International Group Inc. (“AIG”) and U.S. based industrials company General Electric Co. (“GE”). British American Tobacco suffered due to potential additional U.S. regulation and concerns regarding next generation products. AIG’s stock slipped as investors reacted negatively to the premium price paid to acquire insurer Validus Holdings Ltd. and larger than expected catastrophe related losses. GE suffered from a greater than expected charge for long term care policies in its insurance subsidiary, removal from the Dow Jones Industrial Average and power plant turbine issues, as well as other concerns.
During the year, the Fund held currency forwards to somewhat hedge the currency risk of the Fund’s non U.S. Dollar investments. The hedges had a positive impact on the Fund’s performance.
At year end, equities remained the core of the Fund. Sector weightings that declined included IT, materials and consumer staples, while sectors that increased included consumer discretionary, communication services and energy.
We maintain a disciplined bottom-up stock picking process driven by rigorous fundamental analysis that attempts to limit downside risk. We believe investing in underappreciated, misunderstood companies with catalysts for unlocking value can offer upside potential and a degree of downside protection in turbulent markets. As we enter 2019, the consensus view is for slower, but still positive, global economic growth led by the U.S., with modest corporate earnings growth. In our view, prudent stock pickers with a disciplined approach may fare well in 2019.
23
| JNL/Goldman Sachs Core Plus Bond Fund Goldman Sachs Asset Management, L.P. (Unaudited) |

JNL/Goldman Sachs Core Plus Bond Fund
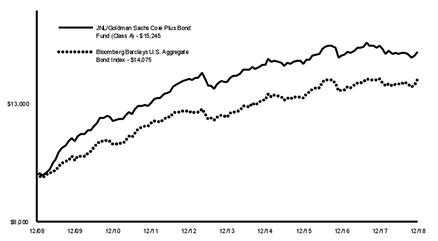
Average Annual Total Returns |
| |||||
Class A |
|
|
| Class I |
|
|
1 Year | -1.59 | % | 1 Year | -1.29 | % | |
5 Year | 1.83 |
|
| 5 Year | 2.07 |
|
10 Year | 4.31 |
|
| 10 Year | 4.53 |
|
The graph shows the change in value of an assumed $10,000 investment in the Fund's Class A shares over 10 years, or since inception if the inception is less than 10 years, as well as the Fund's benchmark(s) performance for the same period.
Past performance is not predictive of future performance. Investment return and principal value will fluctuate so that an investor’s shares, when redeemed, may be worth more or less than their original cost. Performance numbers are net of all Fund operating expenses, but do not reflect the deduction of insurance charges.
Composition as of December 31, 2018: | ||
U.S. Government Agency MBS | 27.2 | % |
Government Securities | 18.8 | |
Non-U.S. Government Agency ABS | 15.9 | |
Financials | 11.8 | |
Communication Services | 5.1 | |
Energy | 4.8 | |
Health Care | 3.2 | |
Information Technology | 2.2 | |
Consumer Staples | 1.6 | |
Utilities | 1.4 | |
Real Estate | 1.3 | |
Materials | 1.1 | |
Industrials | 0.9 | |
Consumer Discretionary | 0.9 | |
Other Equity Interests | - | |
Other Short Term Investments | 3.1 | |
Securities Lending Collateral | 0.7 | |
Net Long (Short) Investments | 100.0 | % |
For the year ended December 31, 2018, JNL/Goldman Sachs Core Plus Bond Fund underperformed its benchmark by posting a return of -1.59% for Class A shares compared to 0.01% for the Bloomberg Barclays U.S. Aggregate Bond Index.
The Fund’s duration and yield curve positioning contributed to returns over the year driven by a tactical U.S. duration position. Our country strategy was beneficial for results due to a long position in European rates versus short UK and Swedish rates. Currency strategies detracted from performance over the year driven by long exposures to the Argentine Peso, Swedish Krona and Australian Dollar.
Within cross sector positioning, allocations to corporate credit, collateralized loan obligations and Non-Agency mortgage-backed securities (“MBS”) detracted from performance. An overweight to emerging market (“EM”) debt, along with an underweight to commercial MBS further weighed from performance. These losses were partially offset by exposure to government/swaps and an underweight to agency MBS.
Security selection did not meaningfully impact performance over the year. Selections of external EM debt from Argentina, Venezuela and China detracted from performance. These losses were partially offset by selections of Puerto Rican municipal debt. Corporate credit curve positioning and a down in quality bias contributed to returns within corporate credit. The Fund closed 2018 with a tactical position in U.S. duration, overweight high quality securitized credit, overweight corporates and underweight agency MBS.
The Fund held derivatives during the year. We believe derivatives allow for managing interest rate, credit and currency risks more effectively as part of hedging activity and in applying active investment views. Derivatives can potentially offer greater versatility and efficiency, as well as allow for enhanced precision in risk management. Derivatives were used in several capacities over the year as part of the Fund’s overall investment strategy, including managing duration/yield curve and cross sector positioning.
24
| JNL/Goldman Sachs Emerging Markets Debt Fund Goldman Sachs Asset Management, L.P. (Unaudited) |

JNL/Goldman Sachs Emerging Markets Debt Fund
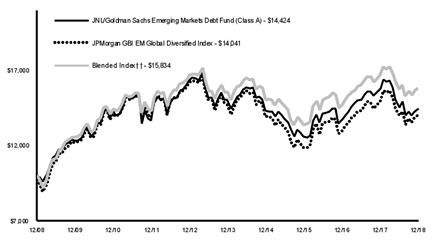
††75% JPMorgan GBI EM Global Diversified Index, 25% JPMorgan CEMBI Broad Diversified Index
Average Annual Total Returns |
| |||||
Class A |
|
|
| Class I |
|
|
1 Year | -8.46 | % | 1 Year | -8.18 | % | |
5 Year | -0.86 |
|
| 5 Year | -0.64 |
|
10 Year | 3.73 |
|
| 10 Year | 3.95 |
|
The graph shows the change in value of an assumed $10,000 investment in the Fund's Class A shares over 10 years, or since inception if the inception is less than 10 years, as well as the Fund's benchmark(s) performance for the same period.
Past performance is not predictive of future performance. Investment return and principal value will fluctuate so that an investor’s shares, when redeemed, may be worth more or less than their original cost. Performance numbers are net of all Fund operating expenses, but do not reflect the deduction of insurance charges.
Composition as of December 31, 2018: | ||
Government Securities | 60.1 | % |
Financials | 8.5 | |
Credit Linked Structured Notes | 6.6 | |
Energy | 3.5 | |
Communication Services | 2.8 | |
Consumer Staples | 2.4 | |
Industrials | 1.6 | |
Materials | 1.6 | |
Utilities | 1.3 | |
Real Estate | 1.0 | |
Health Care | 0.9 | |
Consumer Discretionary | 0.7 | |
Information Technology | - | |
Other Short Term Investments | 7.8 | |
Securities Lending Collateral | 1.2 | |
Total Investments | 100.0 | % |
For the year ended December 31, 2018, JNL/Goldman Sachs Emerging Markets Debt Fund underperformed its primary benchmark by posting a return of -8.46% for Class A shares compared to -6.21% for the JPMorgan GBI EM Global Diversified Index. The Fund underperformed its blended benchmark return of -5.01% for the 75% JPMorgan GBI EM Global Diversified Index and 25% JPMorgan CEMBI Broad Diversified Index.
The Fund underperformed its benchmark over 2018 amid a broad selloff in emerging markets (“EM”) assets, as global growth moderated, U.S.-China trade tensions persisted and global liquidity conditions tightened.
The underperformance was primarily driven by our active currency strategy, as EM foreign exchange (“FX”) came under immense pressure, especially during the second and third quarters of the year. In particular, our long Argentine Peso and South African Rand positions were the largest detractors. Argentine assets came under pressure due to ongoing concerns regarding the government’s ability to implement fiscal consolidation amid the still fragile monetary backdrop. Softening sentiment across the EM complex further eroded confidence in the sovereign, and the Argentine Peso depreciated 30% in the second quarter alone. In South Africa, the Rand was driven by positive regime change earlier in 2018, when Cyril Ramaphosa took over as President, showing intent towards fiscal consolidation, growing the economy and tackling corruption. But a lack of policy follow through and general EM FX weakness led to the Rand underperforming for the rest of the year. Offsetting some of this underperformance was our short Chinese Yuan, which underperformed over the year.
Our overweight positions to EM sovereign external debt and corporate debt sectors further detracted from performance, as risk assets broadly sold off. This was partially offset by our tactical U.S. duration and yield curve positioning strategies.
From a bottom-up security selection perspective, our selection of local sovereign debt contributed to performance, driven by our short Mexican and Brazilian rates exposure. However, our short Polish local rates and overweight to Argentine local rates dollar denominated sovereign debt detracted from performance.
The Fund invested in U.S. Treasury futures, forward foreign currency exchange contracts, interest rate swaps, credit default swaps and non-deliverable bond forward contracts. Derivatives may be used in combination with cash securities to implement our views, as well as managing interest rate, credit and currency risks more effectively as part of hedging activity. Derivatives were used in several capacities over the year as part of the Fund’s overall investment strategy.
25
| JNL/GQG Emerging Markets Equity Fund GQG Partners LLC (Unaudited) |

JNL/GQG Emerging Markets Equity Fund
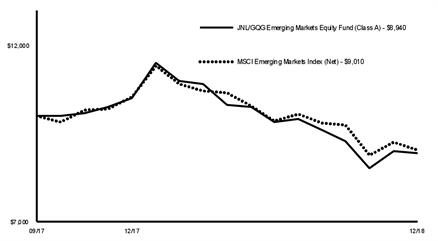
Average Annual Total Returns |
| |||||
Class A‡ |
|
|
| Class I† |
|
|
1 Year | -14.94 | % | 1 Year | -14.64 | % | |
Since Inception | -8.45 |
|
| Since Inception | -8.13 |
|
‡Inception date September 25, 2017 |
| |||||
†Inception date September 25, 2017 |
| |||||
The graph shows the change in value of an assumed $10,000 investment in the Fund's Class A shares over 10 years, or since inception if the inception is less than 10 years, as well as the Fund's benchmark(s) performance for the same period.
Past performance is not predictive of future performance. Investment return and principal value will fluctuate so that an investor’s shares, when redeemed, may be worth more or less than their original cost. Performance numbers are net of all Fund operating expenses, but do not reflect the deduction of insurance charges.
Composition as of December 31, 2018: | ||
Financials | 37.7 | % |
Consumer Staples | 15.8 | |
Information Technology | 10.9 | |
Utilities | 10.2 | |
Communication Services | 6.9 | |
Industrials | 6.2 | |
Energy | 5.3 | |
Real Estate | 3.3 | |
Health Care | 2.1 | |
Materials | 1.1 | |
Other Short Term Investments | 0.5 | |
Total Investments | 100.0 | % |
For the year ended December 31, 2018, JNL/GQG Emerging Markets Equity Fund underperformed its primary benchmark by posting a return of -14.94% for Class A shares compared to -14.58% for the MSCI Emerging Markets Index (Net).
For the year, the Fund slightly underperformed the MSCI Emerging Markets Index (“Net”). Given the increased volatility and highly uncertain market environment in 2018, stability of earnings became more important than absolute growth as the year progressed. This is highlighted in our current positioning. Entering 2018, the Fund was overweight consumer staples and financials while maintaining an underweight to more cyclical sectors such as energy, materials and industrials. As 2018 progressed, exposures to consumer staples and utilities were increased while exposures to sectors such as communication services and consumer discretionary were further decreased. Through the first three quarters of the year, more cyclical oriented sectors performed well; however, in the fourth quarter, the Fund posted strong relative performance as sectors with higher cyclical exposures underperformed.
From an individual company perspective, top performers to overall performance were Nvidia Corp. (“Nvidia”), PT Bank Central Asia Tbk (“BCA”) and China Tower Corp. Ltd. (“China Tower”). Nvidia delivered strong revenue growth and earnings during the first half of 2018 based on continued demand for Graphics Processing Units in both the gaming segment and in Artificial Intelligence uses. BCA, Indonesia’s largest bank, continued to show increased lending activity throughout the year while growing both interest and non-interest income. China Tower, the world’s largest telecommunications infrastructure operator, continues to benefit from improved tenancy rates and increased demand for mobile broadband use.
The top detractors to overall performance were Tencent Holdings Ltd. (“Tencent”), Samsung Electronics Co. Ltd. (“Samsung”) and Heineken NV (“Heineken”). Tencent, one of the world’s largest internet companies, sold off during the year, primarily driven by an increased regulatory environment in China. Samsung was a detractor to overall performance given waning demand for the company’s memory chips combined with increased competition in the smartphone space. Heineken, the world’s second largest brewer, underperformed given the company’s further expansion into Brazil which negatively impacted earnings due to negative currency translations and lower margin end markets.
From a country perspective, overall country allocation was a net contributor to excess return. An overweight to India, primarily Indian banks, drove the outperformance. However, this was slightly offset by the fund’s average underweight to Brazil, as Index performance in Brazil performed well on a relative basis.
26
| JNL/Harris Oakmark Global Equity Fund Harris Associates, L.P. (Unaudited) |

JNL/Harris Oakmark Global Equity Fund

Average Annual Total Returns |
| |||||
Class A‡ |
|
|
| Class I† |
|
|
1 Year | -21.22 | % | 1 Year | -20.97 | % | |
Since Inception | -0.98 |
|
| Since Inception | -15.50 |
|
‡Inception date April 27, 2015 |
| |||||
†Inception date September 25, 2017 |
| |||||
The graph shows the change in value of an assumed $10,000 investment in the Fund's Class A shares over 10 years, or since inception if the inception is less than 10 years, as well as the Fund's benchmark(s) performance for the same period.
Past performance is not predictive of future performance. Investment return and principal value will fluctuate so that an investor’s shares, when redeemed, may be worth more or less than their original cost. Performance numbers are net of all Fund operating expenses, but do not reflect the deduction of insurance charges.
Composition as of December 31, 2018: | ||
Financials | 26.9 | % |
Communication Services | 19.7 | |
Consumer Discretionary | 19.6 | |
Industrials | 9.9 | |
Health Care | 7.5 | |
Materials | 6.3 | |
Information Technology | 3.3 | |
Consumer Staples | 3.0 | |
Energy | 2.1 | |
Other Short Term Investments | 1.7 | |
Total Investments | 100.0 | % |
For the year ended December 31, 2018, JNL/Harris Oakmark Global Equity Fund underperformed its benchmark by posting a return of -21.22% for Class A shares compared to -8.71% for the MSCI World Index (Net).
The Fund underperformed its benchmark, the MSCI World Index, for the year due to both stock selection and weightings. On a geographic basis, holdings in Japan and a lack of exposure to Canada generated the top results, while investments in Switzerland and the U.S. were the worst relative performers. On a sector basis, stock selection in consumer staples sector and a less than benchmark weighting in energy delivered positive relative results. Stock selection in financials and communication services made these sectors the largest overall detractors for the year.
Generally, the Fund’s only derivative use is foreign currency forwards for hedging purposes. The Fund may implement currency hedging when it views that a currency is overvalued by more than 20% of its estimated value based on purchasing power parity. The Fund’s Swiss Franc hedges contributed 0.06% to performance for the year.
Top performing stock: HCA Healthcare Inc.’s share price rose in three of the past four quarters, as revenue, earnings and earnings per share for the first, second and third quarters of 2018 surpassed market expectations. Key operating metrics demonstrated strengthening trends over the course of the year.
Bottom performing stock: BNP Paribas SA (“BNP”) issued mixed results throughout 2018 owing to difficult end market conditions and restructuring cost investments. We met with chief executive officer Jean-Laurent Bonnafé who expressed confidence that BNP will reach its 2020 return on equity target of more than 10% under constant market conditions. Overall, we believe BNP’s management team is working to enhance shareholder value.
At year end, the Fund’s equities spanned twelve countries in seven regions. Weightings materially increased in the U.S. (5%) and South Africa (4%) and decreased in the UK (-4%) and Switzerland (-4%). The Fund was also invested in nine sectors. Communications services now holds a 23% weighting. Sector weightings materially decreased in financials (-4%) and materials (-3%).
27
| JNL/Heitman U.S. Focused Real Estate Fund Heitman Real Estate Securities, LLC (Unaudited) |

Composition as of December 31, 2018: | ||
Real Estate | 96.0 | % |
Information Technology | 2.6 | |
Other Short Term Investments | 1.4 | |
Total Investments | 100.0 | % |
Total Return |
| |||||
Class A‡ |
|
|
| Class I† |
|
|
Since Inception | -6.10 | % | Since Inception | -6.00 | % | |
‡Inception date August 13, 2018 |
| |||||
†Inception date August 13, 2018 |
| |||||
Past performance is not predictive of future performance. Investment return and principal value will fluctuate so that an investor’s shares, when redeemed, may be worth more or less than their original cost. Performance numbers are net of all Fund operating expenses, but do not reflect the deduction of insurance charges. | ||||||
For the period August 13, 2018 through December 31, 2018, JNL/Heitman U.S. Focused Real Estate Fund outperformed its benchmark by posting a return of -6.10% for Class A shares compared to -6.62% for the Wilshire US RESI TR USD Index.
The Fund’s investment objective is to seek to achieve a long term total return. The Fund’s outperformance versus Wilshire US Real Estate Securities Index during the period was led by strong selection in health care and data centers. Strong selection in health care was led by an underweight on Senior Housing Properties Trust and Sabra Health Care real estate investment trust. One of their largest tenants, Five Star Senior Living Inc., announced that they were having financial issues. Strong selection in data centers drove performance. Overweighting Digital Realty Trust Inc. added to performance, this was due to better than expected leasing.
Underweighting triple net lease detracted from performance. The net lease outperformed in the risk off environment. Also, weak security selection in industrials detracted from performance. An underweight on manufactured homes led to underperformance. Manufactured homes tends to outperform when the market shifts to risk off mode like it did to end the year.
As we look around the globe at real estate fundamentals, we see a continued positive environment with job growth driving demand and supply remaining at or below long run averages in most sectors and cities. We expect a slowdown in economic growth in 2019 compared to 2018, but it should remain at levels that we have seen during much of this cycle. This should support property values, but where stock prices are not rising in tandem, we expect to see management teams look to merger and acquisitions and other methods to create value to close the gap between public and private valuations.
28
| JNL/Invesco China-India Fund Invesco Hong Kong Limited (Unaudited) |

JNL/Invesco China-India Fund
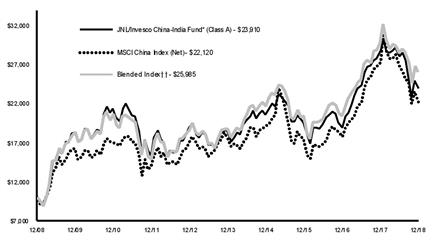
††50% MSCI China Index (Net), 50% MSCI India Index (Net)
Average Annual Total Returns* |
| |||||
Class A |
|
|
| Class I |
|
|
1 Year | -17.12 | % | 1 Year | -16.82 | % | |
5 Year | 5.23 |
|
| 5 Year | 5.49 |
|
10 Year | 9.11 |
|
| 10 Year | 9.35 |
|
*The Fund's investment adviser waived/reimbursed certain expenses of the Fund. Performance results shown reflect the waiver, without which performance results would have been lower. |
| |||||
The graph shows the change in value of an assumed $10,000 investment in the Fund's Class A shares over 10 years, or since inception if the inception is less than 10 years, as well as the Fund's benchmark(s) performance for the same period.
Past performance is not predictive of future performance. Investment return and principal value will fluctuate so that an investor’s shares, when redeemed, may be worth more or less than their original cost. Performance numbers are net of all Fund operating expenses, but do not reflect the deduction of insurance charges.
Invesco Hong Kong Limited assumed portfolio management responsibility on April 25, 2016.
Composition as of December 31, 2018: | ||
Consumer Discretionary | 25.8 | % |
Financials | 21.1 | |
Communication Services | 12.6 | |
Information Technology | 10.1 | |
Consumer Staples | 9.3 | |
Health Care | 6.5 | |
Materials | 6.0 | |
Industrials | 5.8 | |
Utilities | 1.6 | |
Securities Lending Collateral | 1.2 | |
Total Investments | 100.0 | % |
For the year ended December 31, 2018, JNL/Invesco China-India Fund outperformed its primary benchmark by posting a return of -17.12% for Class A shares compared to -18.88% for the MSCI China Index (Net). The Fund underperformed its blended benchmark return of -12.88% for the 50% MSCI China Index (Net), 50% MSCI India Index (Net).
Stock selection was highly favorable in China with broad based positive contributions across sectors such as health care, information technology, consumer staples and communication services. In particular, our selected holdings in health care were well rewarded. One of the major contributors was Shandong Weigao Group Medical Polymer Co. Ltd., a Chinese medical products manufacturer. Its share price rallied thanks to expectation on improving corporate governance and management incentives.
India was the main detractor. In particular, Indian financials were very volatile in the second half of the year with a liquidity crunch and resignation of the central bank governor. Our selected holdings detracted value during the liquidity crunch, though the positive allocation effect to the sector added value. Stock selection in consumer discretionary was mainly driven by our non-exposure to Tata Motors Ltd., as it was loss making for two quarters while facing negative earnings revision by analysts.
On Fund positioning, we maintained a balanced allocation to Chinese and Indian equities as we continued to find attractive stock opportunities in both markets. We believe current market conditions present attractive entry points for investors. Chinese equities are traded at attractive valuations below ten times forward price to earnings as of year end, with growth expected to bottom out in the first half this year. Indian equities are trading close to their long term historical average, while enjoying multiple year structural growth driven by favorable demographics and reforms.
29
| JNL/Invesco Diversified Dividend Fund Invesco Advisers, Inc. (Unaudited) |

JNL/Invesco Diversified Dividend Fund
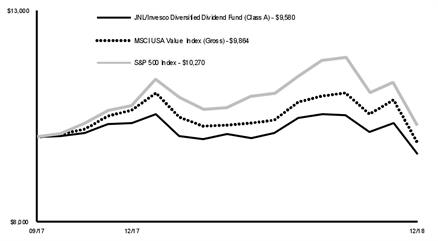
Average Annual Total Returns |
| |||||
Class A‡ |
|
|
| Class I† |
|
|
1 Year | -7.26 | % | 1 Year | -6.96 | % | |
Since Inception | -3.33 |
|
| Since Inception | -3.00 |
|
‡Inception date September 25, 2017 |
| |||||
†Inception date September 25, 2017 |
| |||||
The graph shows the change in value of an assumed $10,000 investment in the Fund's Class A shares over 10 years, or since inception if the inception is less than 10 years, as well as the Fund's benchmark(s) performance for the same period.
Past performance is not predictive of future performance. Investment return and principal value will fluctuate so that an investor’s shares, when redeemed, may be worth more or less than their original cost. Performance numbers are net of all Fund operating expenses, but do not reflect the deduction of insurance charges.
Composition as of December 31, 2018: | ||
Consumer Staples | 21.3 | % |
Utilities | 16.4 | |
Financials | 13.3 | |
Industrials | 8.4 | |
Health Care | 8.4 | |
Energy | 6.2 | |
Communication Services | 5.6 | |
Consumer Discretionary | 4.8 | |
Materials | 3.7 | |
Information Technology | 1.1 | |
Real Estate | 1.0 | |
Other Short Term Investments | 8.3 | |
Securities Lending Collateral | 1.5 | |
Total Investments | 100.0 | % |
For the year ended December 31, 2018, JNL/Invesco Diversified Dividend Fund underperformed its primary benchmark by posting a return of -7.26% for Class A shares compared to -7.18% for the MSCI USA Value Index (Gross). The Fund underperformed its other benchmark return of -4.38% for the S&P 500 Index.
On an absolute basis the Fund’s holdings in health care and utilities made positive contributions to overall returns with companies like Eli Lilly & Co., Merck & Co. Inc. and Exelon Corp. outperforming. Consumer staples and financial holdings were among the largest detractors from absolute performance with companies like General Mills Inc., Campbell Soup Co. and Hartford Financial Services Group Inc. underperforming during the year.
An underweight position in financials and an overweight position in utilities made the largest positive contributions to relative performance during the year. Stock selection in consumer discretionary and energy also helped performance versus the benchmark. The Fund’s underweight positions in health care and information technology (“IT”) detracted from relative performance during the year, as did stock selection in consumer staples and communication services.
The Fund used currency forward contracts for the purpose of hedging currency exposure of some of the non-U.S. based companies held in the Fund, and these were not used for speculative purposes or leverage. The use of currency forward contracts had a very small positive impact on the Fund’s performance during the year.
At the end of the year, the Fund’s largest overweight positions compared to the benchmark were in utilities and consumer staples, while the primary underweights were in IT, health care and financials. The Fund managers’ strategy focuses on three key elements over a full market cycle — appreciation, income and preservation. The goal of the strategy has always been to provide capital appreciation with better downside preservation. This full cycle mindset has been embedded in the investment process since the strategy’s inception. More recently, we have placed particular emphasis on managing downside risk through sensitivity analysis of the modeled assumptions, given the belief that the profit cycle appears to be waning, valuations are extended and narrow market conditions warrant attention.
30
| JNL/Invesco Global Real Estate Fund Invesco Advisers, Inc. (Unaudited) |

JNL/Invesco Global Real Estate Fund
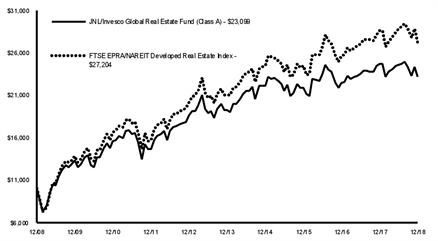
Average Annual Total Returns |
| |||||
Class A |
|
|
| Class I |
|
|
1 Year | -6.38 | % | 1 Year | -6.17 | % | |
5 Year | 3.78 |
|
| 5 Year | 4.01 |
|
10 Year | 8.73 |
|
| 10 Year | 8.97 |
|
The graph shows the change in value of an assumed $10,000 investment in the Fund's Class A shares over 10 years, or since inception if the inception is less than 10 years, as well as the Fund's benchmark(s) performance for the same period.
Past performance is not predictive of future performance. Investment return and principal value will fluctuate so that an investor’s shares, when redeemed, may be worth more or less than their original cost. Performance numbers are net of all Fund operating expenses, but do not reflect the deduction of insurance charges.
Composition as of December 31, 2018: | ||
Real Estate | 97.2 | % |
Consumer Discretionary | 0.9 | |
Financials | 0.4 | |
Information Technology | 0.1 | |
Other Short Term Investments | 1.2 | |
Securities Lending Collateral | 0.2 | |
Total Investments | 100.0 | % |
For the year ended December 31, 2018, JNL/Invesco Global Real Estate Fund underperformed its benchmark by posting a return of -6.38% for Class A shares compared to -4.74% for the FTSE EPRA/NAREIT Developed Real Estate Index.
Key relative detractors came from security selection in the United States and Japan, and an overweight to China also detracted. Key relative contributors included security selection and a slight underweight to the United Kingdom, along with security selection in Hong Kong and a slight underweight to France. Ancillary cash contributed.
Top contributors to the Fund’s absolute performance included Link REIT (“Link”) and Avalonbay Communities Inc. (“AvalonBay Communities”). Link is a retail and quality income focused real estate investment trust (“REIT”) that is listed in Hong Kong. AvalonBay Communities owns a high quality portfolio of multifamily assets, typically located in markets along the east and west coasts of the United States. Top detractors from the Fund’s absolute performance included Unibail-Rodamco SE (“Unibail-Rodamco”) and Country Garden Holdings Co. Ltd. (“Country Garden”). In the middle of the year, Unibail-Rodamco completed its combination with Westfield to form Unibail-Rodamco-Westfield, which owns a sizeable shopping center portfolio. Country Garden is a leading real estate developer that is focused on China.
New holdings during the year included new positions in Asia. This included Japanese REITs ORIX J-REIT Inc. and Japan Prime Realty Investment Corp., which were added due to improved relative value. Other new holdings included Workspace Group Plc and Empire State Realty Trust Inc.
Real estate markets around the world remain in reasonably good health. Economic growth is still supporting tenant demand in most markets, and new supply remains low enough to offer many landlords pricing power over rents. Demand for quality, long term, income does not appear to be diminishing and as such, asset values remain supported. However, the impact of interest rate normalization has yet to be meaningfully felt in real estate, and it would be remiss not to expect some impact on investor yield requirements were risk free rates to move higher. It seems that for the most part, investment yield compression has now run its near decade long course and as such, value creation in real estate will become more dependent on investment skill.
31
| JNL/Invesco International Growth Fund Invesco Advisers, Inc. (Unaudited) |

JNL/Invesco International Growth Fund
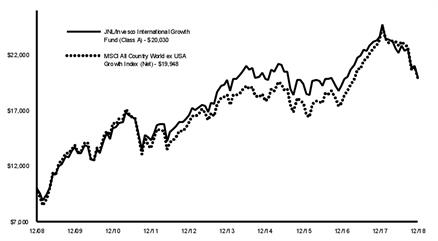
Average Annual Total Returns |
| |||||
Class A |
|
|
| Class I |
|
|
1 Year | -15.08 | % | 1 Year | -14.78 | % | |
5 Year | 0.30 |
|
| 5 Year | 0.54 |
|
10 Year | 7.19 |
|
| 10 Year | 7.63 |
|
The graph shows the change in value of an assumed $10,000 investment in the Fund's Class A shares over 10 years, or since inception if the inception is less than 10 years, as well as the Fund's benchmark(s) performance for the same period.
Past performance is not predictive of future performance. Investment return and principal value will fluctuate so that an investor’s shares, when redeemed, may be worth more or less than their original cost. Performance numbers are net of all Fund operating expenses, but do not reflect the deduction of insurance charges.
Composition as of December 31, 2018: | ||
Financials | 21.2 | % |
Information Technology | 18.0 | |
Consumer Staples | 17.9 | |
Industrials | 11.5 | |
Consumer Discretionary | 6.9 | |
Communication Services | 6.2 | |
Health Care | 6.1 | |
Energy | 4.6 | |
Materials | 2.8 | |
Other Short Term Investments | 3.4 | |
Securities Lending Collateral | 1.4 | |
Total Investments | 100.0 | % |
For the year ended December 31, 2018, JNL/Invesco International Growth Fund underperformed its benchmark by posting a return of -15.08% for Class A shares compared to -14.43% for the MSCI All Country World ex USA Growth Index (Net).
The Fund’s holdings in information technology (“IT”) and health care outperformed those of the benchmark and were the most significant contributors to relative performance. In IT, notable contributors included Canada based CGI Group Inc. and U.S. based Broadcom Inc. Germany based Novartis AG and Australia based CSL Ltd. were key contributors in health care. In contrast, holdings in consumer staples underperformed those of the benchmark and were among the most significant detractors from relative performance. Particular weakness was seen in the food, beverage and tobacco industry, including UK based British American Tobacco Plc and Japan based Asahi Breweries Ltd. Fund holdings in energy underperformed those of the benchmark and also dragged on relative performance.
On a geographic basis, stock selection in Germany and China were among the largest contributors to relative results. An underweight in the weak Chinese market added to relative return. Conversely, weak stock selection in the UK and Switzerland hampered relative performance.
The Fund’s cash position in a declining market environment added to relative results, as well. It is important to note that cash is a residual of our bottom-up investment process and not the result of any top-down tactical asset allocation or risk management allocation decision
The Fund ended the year overweight in financials, IT, energy, consumer staples and industrials while being underweight to health care, consumer discretionary, materials, communication services, real estate and utilities.
As always, regardless of the macroeconomic environment, we remain focused on a bottom-up investment approach of identifying attractive companies that fit our Earnings/Quality/Valuation (“EQV”) focused investment process. We continue to look for high quality growth companies that exhibit the following characteristics: strong organic revenue growth, high returns on capital, pricing power, strong balance sheets, cash generation, effective capital allocation and reasonable valuations. In addition, we continue to favor companies that are resilient in weak economic environments. Our balanced EQV focused approach aligns with our goal of delivering attractive returns over the long term.
32
| JNL/Invesco Small Cap Growth Fund Invesco Advisers, Inc. (Unaudited) |

JNL/Invesco Small Cap Growth Fund
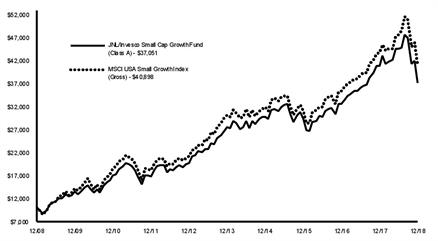
Average Annual Total Returns |
| |||||
Class A |
|
|
| Class I |
|
|
1 Year | -9.11 | % | 1 Year | -8.83 | % | |
5 Year | 6.08 |
|
| 5 Year | 6.31 |
|
10 Year | 13.99 |
|
| 10 Year | 14.23 |
|
The graph shows the change in value of an assumed $10,000 investment in the Fund's Class A shares over 10 years, or since inception if the inception is less than 10 years, as well as the Fund's benchmark(s) performance for the same period.
Past performance is not predictive of future performance. Investment return and principal value will fluctuate so that an investor’s shares, when redeemed, may be worth more or less than their original cost. Performance numbers are net of all Fund operating expenses, but do not reflect the deduction of insurance charges.
Composition as of December 31, 2018: | ||
Health Care | 25.0 | % |
Information Technology | 24.0 | |
Industrials | 13.6 | |
Consumer Discretionary | 11.9 | |
Financials | 9.2 | |
Materials | 3.9 | |
Energy | 2.3 | |
Communication Services | 2.2 | |
Consumer Staples | 1.8 | |
Real Estate | 0.6 | |
Securities Lending Collateral | 2.8 | |
Other Short Term Investments | 2.7 | |
Total Investments | 100.0 | % |
For the year ended December 31, 2018, JNL/Invesco Small Cap Growth Fund underperformed its primary benchmark by posting a return of -9.11% for Class A shares compared to -6.58% for the MSCI USA Small Growth Index (Gross).
An overweight exposure in information technology (“IT”), and a combination of stock selection and underweight exposure in materials, were key contributors to relative performance. Ancillary cash also helped given the volatility that ensued during the year. Key detractors from relative performance included an overweight exposure to and stock selection within energy, as well as stock selection in industrials and health care.
Within IT, stock selection in the semiconductors industry was a contributor to relative returns. Within industrials, a lack of exposure in the construction and engineering industry helped. Within materials, stock selection in chemicals helped relative returns. IT firm Zebra Technologies Corp. provides solutions which allows for sales tracking such as barcode scanners. It was sold during the year following attractive valuation.
While consumer discretionary was a net detractor from relative returns, results were mixed at the industry level: stock selection in specialty retail and an underweight exposure in household durables was beneficial while stock selection in auto components and textile, apparel and luxury goods hurt. Penn National Gaming Inc. was an individual detractor as regional gaming stocks in general have underperformed likely due to investor concern around the potential for industry trends to decelerate if the U.S. economy weakens.
Within health care, stock selection in health care equipment and supplies and biotechnology hurt relative returns. Adamas Pharmaceuticals Inc. was a key individual detractor given the unexpected departure of their chief operating officer who was in charge of leading the sales force for a recently launched drug.
Our view is that we are in a slowing growth environment, but not a decline, as the benefits of U.S. tax stimulus and deregulation are being offset by higher interest rates, rising labor costs and trade pressures. In such an environment, true growth will remain scarce, and we believe the market will favor companies that can produce sustainable, above average earnings and cash flow growth in spite of the economic cycle.
33
| JNL/JPMorgan Hedged Equity Fund J.P. Morgan Investment Management Inc. (Unaudited) |

Composition as of December 31, 2018: | ||
Information Technology | 16.8 | % |
Health Care | 13.0 | |
Financials | 11.1 | |
Consumer Discretionary | 9.2 | |
Communication Services | 8.7 | |
Industrials | 7.8 | |
Consumer Staples | 4.9 | |
Energy | 4.4 | |
Utilities | 2.8 | |
Materials | 2.2 | |
Real Estate | 1.8 | |
Other Short Term Investments | 17.3 | |
Total Investments | 100.0 | % |
Total Return |
| |||||
Class A‡ |
|
|
| Class I† |
|
|
Since Inception | -4.47 | % | Since Inception | -4.43 | % | |
‡Inception date August 13, 2018 |
| |||||
†Inception date August 13, 2018 |
| |||||
Past performance is not predictive of future performance. Investment return and principal value will fluctuate so that an investor’s shares, when redeemed, may be worth more or less than their original cost. Performance numbers are net of all Fund operating expenses, but do not reflect the deduction of insurance charges. | ||||||
For the period August 13, 2018 through December 31, 2018, JNL/JPMorgan Hedged Equity Fund outperformed its primary benchmark by posting a return of -4.47% for Class A shares compared to -9.57% for the CBOE S&P 500 BuyWrite Index. The Fund outperformed its other benchmark return of -10.82% for the S&P 500 Index.
True to its objective, the Fund participated in a portion of market upside while tempering the increased volatility seen in the second half of the year. In the third quarter, with the S&P 500 Index continually moving higher, the Fund joined in a portion of the market’s upside, returning 1.53% versus the market’s 3.54% (since the Fund’s inception on August 13, 2018). However, as volatility dramatically rose in the fourth quarter, the options overlay hedged the Fund against the market’s drawdown of 13.52%, with the Fund down only 5.45% (gross of fees) during the last three months of the year. Information technology and health services and systems sectors contributed to returns during the fourth quarter of 2018, while basic materials and financials detracted from performance. Among individual names, over weights in Analog Devices Inc. and AutoZone Inc. buoyed returns, while an overweight in Nvidia Corp. and an underweight in Intel Corp. hurt results. As the market experienced a more dramatic sell off and heightened volatility, the Fund took part in the upside while maintaining about half the volatility and beta during the fourth quarter’s corrections, ultimately hedging the Fund from the market being down 5% to down 20% (plus/minus alpha, minus fees).
While normalizing volatility is likely in the year ahead, we continue to see earnings strength and generally positive economic indicators through 2019, which should be largely supportive of our positioning. We remain confident in our approach to help investors participate in equity market gains, while hedging against intermittent volatility and market declines.
34
| JNL/JPMorgan MidCap Growth Fund J.P. Morgan Investment Management, Inc. (Unaudited) |

JNL/JPMorgan MidCap Growth Fund
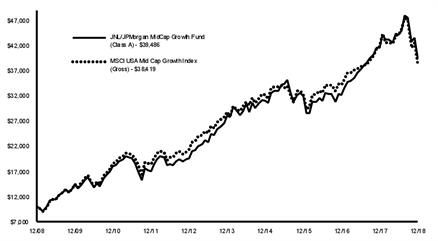
Average Annual Total Returns* |
| |||||
Class A |
|
|
| Class I |
|
|
1 Year | -5.00 | % | 1 Year | -4.71 | % | |
5 Year | 7.20 |
|
| 5 Year | 7.44 |
|
10 Year | 14.72 |
|
| 10 Year | 14.87 |
|
*The Fund's investment adviser waived/reimbursed certain expenses of the Fund. Performance results shown reflect the waiver, without which performance results would have been lower. |
| |||||
The graph shows the change in value of an assumed $10,000 investment in the Fund's Class A shares over 10 years, or since inception if the inception is less than 10 years, as well as the Fund's benchmark(s) performance for the same period.
Past performance is not predictive of future performance. Investment return and principal value will fluctuate so that an investor’s shares, when redeemed, may be worth more or less than their original cost. Performance numbers are net of all Fund operating expenses, but do not reflect the deduction of insurance charges.
Composition as of December 31, 2018: | ||
Information Technology | 30.8 | % |
Health Care | 17.9 | |
Consumer Discretionary | 16.6 | |
Industrials | 15.2 | |
Financials | 7.7 | |
Materials | 3.6 | |
Communication Services | 3.2 | |
Energy | 1.1 | |
Real Estate | 1.1 | |
Securities Lending Collateral | 2.2 | |
Other Short Term Investments | 0.6 | |
Total Investments | 100.0 | % |
For the year ended December 31, 2018, JNL/JPMorgan MidCap Growth Fund outperformed its benchmark by posting a return of -5.00% for Class A shares compared to -7.92% for the MSCI USA Mid Cap Growth Index (Gross).
Stock selection within information technology (“IT”) and consumer discretionary detracted from performance. Stock selection in producer durables and materials and processing contributed during the quarter. Overweight positions in Teladoc Inc. and Concho Resources Inc. were the top detractors from performance. Not owning Align Technology Inc. contributed most, followed by an overweight position Red Hat Inc.
Outperformance through the first three quarters of the year helped the Fund outpace the benchmark for the year, although a challenging fourth quarter pushed absolute returns into negative territory. Stock selection in health care was the primary driver of outperformance during the year, followed by IT. Stock selection in consumer discretionary and an underweight allocation to consumer staples detracted from performance. Overweight positions in DexCom Inc. and O’Reilly Automotive Inc. were top contributors to performance, while overweight positions in Mohawk Industries Inc. (“Mohawk Industries”) and LKQ Corp. were the top detractors during the year. The Fund no longer owns a position in Mohawk Industries.
We continue to find high conviction ideas in secular growth drivers as well as businesses with steadier growth characteristics. Health care, which started the year as a neutral position, is now the largest overweight. While IT remains the second largest overweight, we have reduced our relative exposure by eliminating select positions and pairing back others. We have notable underweights in consumer staples and consumer discretionary.
35
| JNL/JPMorgan U.S. Government & Quality Bond Fund J.P. Morgan Investment Management Inc. (Unaudited) |

JNL/JPMorgan U.S. Government & Quality Bond Fund
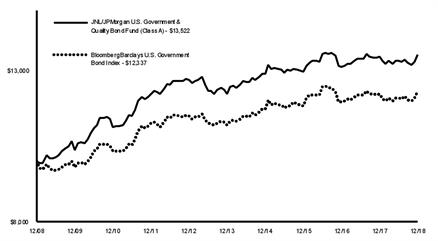
Average Annual Total Returns* |
| |||||
Class A |
|
|
| Class I |
|
|
1 Year | 0.45 | % | 1 Year | 0.77 | % | |
5 Year | 2.04 |
|
| 5 Year | 2.26 |
|
10 Year | 3.06 |
|
| 10 Year | 3.28 |
|
*The Fund's investment adviser waived/reimbursed certain expenses of the Fund. Performance results shown reflect the waiver, without which performance results would have been lower. |
| |||||
The graph shows the change in value of an assumed $10,000 investment in the Fund's Class A shares over 10 years, or since inception if the inception is less than 10 years, as well as the Fund's benchmark(s) performance for the same period.
Past performance is not predictive of future performance. Investment return and principal value will fluctuate so that an investor’s shares, when redeemed, may be worth more or less than their original cost. Performance numbers are net of all Fund operating expenses, but do not reflect the deduction of insurance charges.
Composition as of December 31, 2018: | ||
U.S. Government Agency MBS | 53.9 | % |
Government Securities | 27.2 | |
Non-U.S. Government Agency ABS | 6.5 | |
Financials | 1.0 | |
Energy | 0.7 | |
Consumer Staples | 0.6 | |
Industrials | 0.5 | |
Utilities | 0.4 | |
Communication Services | 0.4 | |
Real Estate | 0.4 | |
Health Care | 0.1 | |
Other Short Term Investments | 8.3 | |
Securities Lending Collateral | - | |
Total Investments | 100.0 | % |
For the year ended December 31, 2018, JNL/JPMorgan U.S. Government & Quality Bond Fund underperformed its benchmark by posting a return of 0.45% for Class A shares compared to 0.88% for the Bloomberg Barclays U.S. Government Bond Index.
Markets began and finished the year with increased volatility, as investor sentiment weighed the impacts of U.S. China trade disputes, threat of global economic slowdown, tightening of financial conditions by global central banks and a deterioration in energy prices by year end. During the year, equity markets finished in negative territory and investment grade credit spreads widened. Treasury yields finished higher across the curve during the year. Year over year, the two-year yield rose by 61 basis points (“bps”) to 2.49%, while the 10-year yield increased by 28 bps to 2.69%. The spread between the two- and 10-year Treasuries declined by 32 bps to finish the year at 20 bps. Within Treasuries, the 30-year bellwether was the worst performer, posting a return of -2.72% during the year. The Fund has maintained a shorter duration posture through the year, which was positive for performance. On the other hand, the Fund’s yield curve was a detractor, as the Fund’s preference for the “belly” (10-year key rate duration (“KRD”)) of the curve underperformed the short part of the curve. This was partially offset by our underweight to the long end of the curve (30-year KRD).
The Fund’s overweight allocation to U.S. agencies and agency mortgage-backed securities (“MBS”) relative to Treasuries contributed to performance as both sectors outperformed benchmark Treasuries year to date. An allocation to credit detracted from results as the sector was one of the worst performing spread sectors, underperforming duration like Treasuries by 280 bps during the period. The Fund’s security selection in Treasuries hurt returns, specifically an out of benchmark allocation to long duration U.S. Treasury inflation-protected securities. The Fund’s cash position was a slight detractor as longer term bonds had better than cash returns. The team uses cash to help manage Fund liquidity and duration.
The Fund’s overweight allocations to U.S. agencies and agency MBS and a shorter duration posture contributed to performance. The Fund’s detractors were an overweight to credit, yield curve positioning and a cash allocation.
Sector weightings for the Fund remained fairly in line throughout the year.
At year end, 54% of the Fund was invested in agency mortgages. Approximately 20% of the Fund was invested in Treasury securities. The Fund had approximately 8% in money markets. The remainder of the Fund was invested in agency securities (8%), commercial MBS (6%), and credit (4%).
36
| JNL/Lazard Emerging Markets Fund Lazard Asset Management LLC (Unaudited) |

JNL/Lazard Emerging Markets Fund
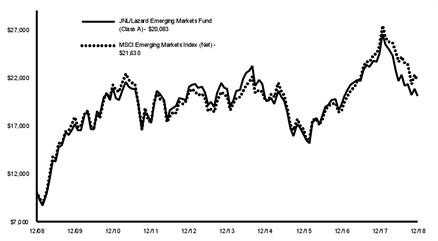
Average Annual Total Returns |
| |||||
Class A |
|
|
| Class I |
|
|
1 Year | -18.35 | % | 1 Year | -18.13 | % | |
5 Year | -0.71 |
|
| 5 Year | -0.50 |
|
10 Year | 7.22 |
|
| 10 Year | 7.45 |
|
The graph shows the change in value of an assumed $10,000 investment in the Fund's Class A shares over 10 years, or since inception if the inception is less than 10 years, as well as the Fund's benchmark(s) performance for the same period.
Past performance is not predictive of future performance. Investment return and principal value will fluctuate so that an investor’s shares, when redeemed, may be worth more or less than their original cost. Performance numbers are net of all Fund operating expenses, but do not reflect the deduction of insurance charges.
Composition as of December 31, 2018: | ||
Financials | 29.0 | % |
Information Technology | 21.2 | |
Communication Services | 11.7 | |
Energy | 9.0 | |
Consumer Discretionary | 7.8 | |
Consumer Staples | 6.3 | |
Materials | 5.3 | |
Industrials | 4.3 | |
Utilities | 0.9 | |
Health Care | 0.8 | |
Other Short Term Investments | 1.9 | |
Securities Lending Collateral | 1.8 | |
Total Investments | 100.0 | % |
For the year ended December 31, 2018, JNL/Lazard Emerging Markets Fund underperformed its benchmark by posting a return of -18.35% for Class A shares compared to -14.58% for the MSCI Emerging Markets Index (Net).
Banco do Brasil SA, a Brazilian bank, continued its recent strong performance with more positive data in Brazil for loan growth, non performing loans, net interest margins, and optimism for economic reforms under the Bolsonaro administration. Within Brazil, BB Seguridade Participacoes SA, an insurance company, and Petrobras Distribuidora SA, an operator of petrol stations, were both boosted by positive sentiment on the back of the election of market friendly candidate, Jair Bolsonaro. CCR SA, a Brazilian toll road operator, benefiting from the continued recovery in light vehicle traffic and from positive sentiment from the election results. Bank Mandiri Persero Tbk PT, an Indonesian bank, gained after the central bank governor vowed to maintain its preemptive policies focusing on economic and currency stability. Stock selection within financials and consumer discretionary sectors and within Brazil helped performance. A higher than index exposure to Indonesia added value.
In contrast, SK Hynix Inc. and Samsung Electronics Co. Ltd., a Korean semiconductor manufacturer and a Korean manufacturer of electronic goods, respectively, were both hurt by falling memory chip prices. Sentiment for AAC Technologies Holdings Inc., a Chinese manufacturer of smartphone components, was negatively affected by concerns over recent weakness in Apple Inc. smartphone sales. Shares of Taiwan Semiconductor Manufacturing Co. Ltd., a Taiwanese manufacturer of semiconductors, were hurt by concerns over a broader slowdown in semiconductor demand. Shares of Baidu Inc., a Chinese internet search engine, fell on concerns over slowing economic growth in China and increased regulatory scrutiny on the internet industry.
Although uncertainty and risks remain for emerging markets in 2019, we believe much of this is priced in equity valuations. Should these issues resolve favorably (a stable or declining U.S. Dollar, a workable trade scenario, accelerating growth outside the United States), then emerging markets will likely benefit. Additionally, it can be easy to overlook the sound fundamentals of the asset class, higher economic growth prospects, higher real interest rates, and relatively low debt levels compared to developed markets.
37
| JNL/Loomis Sayles Global Growth Fund Loomis, Sayles & Company, L.P. (Unaudited) |

Composition as of December 31, 2018: | ||
Consumer Discretionary | 25.7 | % |
Consumer Staples | 19.1 | |
Information Technology | 16.2 | |
Communication Services | 14.8 | |
Health Care | 10.3 | |
Industrials | 8.5 | |
Financials | 2.5 | |
Energy | 1.9 | |
Other Short Term Investments | 1.0 | |
Total Investments | 100.0 | % |
Total Return |
| |||||
Class A‡ |
|
|
| Class I† |
|
|
Since Inception | -11.60 | % | Since Inception | -11.50 | % | |
‡Inception date August 13, 2018 |
| |||||
†Inception date August 13, 2018 |
| |||||
Past performance is not predictive of future performance. Investment return and principal value will fluctuate so that an investor’s shares, when redeemed, may be worth more or less than their original cost. Performance numbers are net of all Fund operating expenses, but do not reflect the deduction of insurance charges. | ||||||
For the period August 13, 2018 through December 31, 2018, JNL/Loomis Sayles Global Growth Fund underperformed its benchmark by posting a return of -11.60% for Class A shares compared to -11.04% for the MSCI All Country World Index (Net).
Stock selection in industrials and consumer staples, as well as our allocation to consumer staples, contributed to relative performance.
Stock selection in energy, communication services and information technology detracted from relative performance.
Our investment process is characterized by bottom-up, fundamental research and a long term investment time horizon. The nature of the process leads to a lower turnover Fund where sector positioning is the result of stock selection.
Versus its benchmark, the Fund is currently overweight in consumer discretionary, consumer staples, communication services and information technology. The Fund is underweight in financials, energy, industrials and health care.
During the period, we purchased shares of Tencent Holdings Ltd. (“Tencent”), added to our existing positions in Roche Holding AG and AMBEV SA and sold our positions in Elekta AB, Shire Plc and Cielo SA. Deere & Co., Procter & Gamble Co. and Tencent were the top contributors to performance during the period. Amazon.com Inc., Facebook Inc. and Alibaba Group Holding Ltd. were the largest detractors from performance during the period.
The Fund’s overall strategy’s discount to intrinsic value was approximately 37.5% as of the most recent quarter end on December 31, 2018.
We are an active manager with a long term, private equity approach to investing. Through our proprietary bottom-up research framework, we look to invest in those few high quality businesses with sustainable competitive advantages and profitable growth when they trade at a significant discount to intrinsic value.
38
| JNL/Mellon Capital Funds BNY Mellon Asset Management North America Corporation (Unaudited) |

JNL/Mellon Capital Consumer Staples Sector Fund
Composition as of December 31, 2018: | ||
Consumer Staples | 97.8 | % |
Health Care | 0.4 | |
Other Short Term Investments | 1.4 | |
Securities Lending Collateral | 0.4 | |
Total Investments | 100.0 | % |
For the year ended December 31, 2018, JNL/Mellon Capital Consumer Staples Sector Fund underperformed its benchmark by posting a return of -8.95% for Class A shares compared to -8.21% for the MSCI USA IMI/Consumer Staples Index (Gross). Fund performance tends to differ from that of its benchmark due to the Fund’s operating and management expenses.
The investment objective of the Fund is total return through capital appreciation and dividend income.
The Fund invests under normal circumstances at least 80% of its assets (net assets plus the amount of any borrowings made for investment purposes) in the stocks included in the MSCI USA IMI Consumer Staples Index (Gross) (“Index”) in proportion to their market capitalization weighting in the Index. The Fund seeks to achieve its objective by utilizing a replication investment approach, called indexing, which attempts to replicate the investment performance of the Index. Indexing may eliminate the chance that the Fund will outperform the Index, but also may reduce some of the risk of active management, such as poor security selection. Indexing may offer a cost-effective investment approach to gaining sector exposure over the long term.
Derivatives did not have meaningful impact on the Fund’s performance during the year.
JNL/Mellon Capital Emerging Markets Index Fund
Composition as of December 31, 2018: | ||
Financials | 24.5 | % |
Information Technology | 15.2 | |
Communication Services | 12.4 | |
Consumer Discretionary | 10.1 | |
Energy | 8.2 | |
Materials | 7.2 | |
Consumer Staples | 6.6 | |
Industrials | 5.7 | |
Real Estate | 2.9 | |
Health Care | 2.7 | |
Utilities | 2.6 | |
Rights | - | |
Securities Lending Collateral | 1.1 | |
Other Short Term Investments | 0.8 | |
Total Investments | 100.0 | % |
For the year ended December 31, 2018, JNL/Mellon Capital Emerging Markets Index Fund underperformed its benchmark by posting a return of -15.24% for Class A shares compared to -14.58% for the MSCI Emerging Markets Index (Net). Fund performance tends to differ from that of its benchmark due to the Fund’s operating and management expenses.
The investment objective of the Fund is to track the performance of a benchmark index that measures the investment return of stocks issued by companies located in emerging market countries.
The Fund invests under normal circumstances at least 80% of its assets (net assets plus the amount of any borrowings made for investment purposes) in securities included in the MSCI Emerging Markets Index (Net) (“Index”), including depositary receipts representing securities of the Index; which may be in the form of American Depositary receipts (“ADRs”), Global Depositary receipts (“GDRs”) and European Depositary receipts (“EDRs”). The Fund attempts to replicate the performance of the Index by investing all or substantially all of its assets in the securities that comprise the Index. Indexing may offer a cost-effective investment approach to gaining diversified market exposure, over the long term.
Derivatives did not have a meaningful impact on the Fund’s performance during the year.
JNL/Mellon Capital European 30 Fund
Composition as of December 31, 2018: | ||
Utilities | 22.2 | % |
Financials | 19.6 | |
Consumer Discretionary | 18.7 | |
Consumer Staples | 11.9 | |
Communication Services | 10.2 | |
Industrials | 5.2 | |
Health Care | 4.1 | |
Energy | 3.8 | |
Materials | 2.3 | |
Securities Lending Collateral | 2.0 | |
Other Short Term Investments | - | |
Total Investments | 100.0 | % |
For the year ended December 31, 2018, JNL/Mellon Capital European 30 Fund outperformed its benchmark by posting a return of -14.80% for Class A shares compared to -14.86% for the MSCI Europe Index (Net).
The investment objective of the Fund is to provide capital appreciation.
The Fund seeks to achieve its objective by investing at least 80% of its assets (net assets plus the amount of any borrowings made for investment purposes) in the securities of 30 companies selected from the MSCI Europe Index (Net) (“Index”). The Fund selects 30 securities from the Index, based on screens evaluating volatility, efficiency of company management, and a valuation to price ratio.
Derivatives did not have meaningful impact on the Fund’s performance during the year.
JNL/Mellon Capital Industrials Sector Fund
Composition as of December 31, 2018: | ||
Industrials | 97.0 | % |
Information Technology | 0.9 | |
Investment Companies | 0.2 | |
Materials | 0.1 | |
Utilities | - | |
Securities Lending Collateral | 1.2 | |
Other Short Term Investments | 0.6 | |
Total Investments | 100.0 | % |
For the year ended December 31, 2018, JNL/Mellon Capital Industrials Sector Fund underperformed its benchmark by posting a return of -14.43% for Class A shares compared to -13.77% for the MSCI USA IMI/Industrials Index (Gross). Fund performance tends to differ from that of its benchmark due to the Fund’s operating and management expenses.
The objective of the Fund is total return through capital appreciation and dividend income.
The Fund invests under normal circumstances at least 80% of its assets (net assets plus the amount of any borrowings made for investment purposes) in the stocks included in the MSCI USA IMI Industrials Index (Gross) (“Index”) in proportion to their market capitalization weighting in the Index. The Fund seeks to achieve its objective by utilizing a replication investment approach, called indexing, which attempts to replicate the investment performance of the Index. Indexing may eliminate the chance that the Fund will outperform the Index, but also may reduce some of the risk of active management, such as poor security selection. Indexing may offer a cost-effective investment approach to gaining sector exposure over the long term.
Derivatives did not have meaningful impact on the Fund’s performance during the year.
JNL/Mellon Capital Materials Sector Fund
Composition as of December 31, 2018: | ||
Materials | 91.1 | % |
Investment Companies | 0.1 | |
Rights | - | |
Securities Lending Collateral | 8.4 | |
Other Short Term Investments | 0.4 | |
Total Investments | 100.0 | % |
For the year ended December 31, 2018, JNL/Mellon Capital Materials Sector Fund underperformed its benchmark by posting a return of -18.63% for Class A shares compared to -17.36% for the MSCI USA IMI/Materials Index (Gross). Fund performance tends to differ from that of its benchmark due to the Fund’s operating and management expenses.
39
| JNL/Mellon Capital Funds BNY Mellon Asset Management North America Corporation (Unaudited) |

The objective of the Fund is total return through capital appreciation and dividend income.
The Fund invests under normal circumstances at least 80% of its assets (net assets plus the amount of any borrowings made for investment purposes) in the stocks included in the MSCI USA IMI Materials Index (Gross) (“Index”) in proportion to their market capitalization weighting in the Index. The Fund seeks to achieve its objective by utilizing a replication investment approach, called indexing, which attempts to replicate the investment performance of the Index. Indexing may eliminate the chance that the Fund will outperform the Index, but also may reduce some of the risk of active management, such as poor security selection. Indexing may offer a cost-effective investment approach to gaining sector exposure over the long term.
Derivatives did not have meaningful impact on the Fund’s performance during the year.
JNL/Mellon Capital Pacific Rim 30 Fund
Composition as of December 31, 2018: | ||
Consumer Discretionary | 18.8 | % |
Financials | 15.3 | |
Materials | 14.9 | |
Real Estate | 13.0 | |
Utilities | 11.3 | |
Industrials | 11.2 | |
Communication Services | 6.9 | |
Consumer Staples | 3.5 | |
Health Care | 3.4 | |
Investment Companies | 0.5 | |
Securities Lending Collateral | 0.8 | |
Other Short Term Investments | 0.4 | |
Total Investments | 100.0 | % |
For the year ended December 31, 2018, JNL/Mellon Capital Pacific Rim 30 Fund underperformed its benchmark by posting a return of -13.86% for Class A shares compared to -12.02% for the MSCI Pacific Index (Net).
The investment objective of the Fund is to provide capital appreciation.
The Fund seeks to achieve its objective by investing under normal circumstances at least 80% of its assets (net assets plus the amount of any borrowings made for investment purposes) in the securities of 30 companies selected from the MSCI Pacific Index (Net) (“Index”). The Fund selects 30 securities from the Index, based on screens evaluating volatility, efficiency of company management, and a valuation to price ratio.
Derivatives did not have meaningful impact on the Fund’s performance during the year.
JNL/Mellon Capital Real Estate Sector Fund
Composition as of December 31, 2018: | ||
Real Estate | 95.3 | % |
Investment Companies | 0.2 | |
Securities Lending Collateral | 3.6 | |
Other Short Term Investments | 0.9 | |
Total Investments | 100.0 | % |
For the year ended December 31, 2018, JNL/Mellon Capital Real Estate Sector Fund underperformed its benchmark by posting a return of -5.28% for Class A shares compared to -4.54% for the MSCI USA IMI/Real Estate Index (Gross). Fund performance tends to differ from that of its benchmark due to the Fund’s operating and management expenses.
The investment objective of the Fund is total return through capital appreciation and dividend income.
The Fund invests under normal circumstances at least 80% of its assets (net assets plus the amount of any borrowings made for investment purposes) in the stocks included in the MSCI USA IMI Real Estate Index (Gross) (“Index”) in proportion to their market capitalization weighting in the Index. The Fund seeks to achieve its objective by utilizing a replication investment approach, called indexing, which attempts to replicate the investment performance of the Index. Indexing may eliminate the chance that the Fund will outperform the Index, but also may reduce some of the risk of active management, such as poor security selection. Indexing may offer a cost-effective investment approach to gaining sector exposure over the long term.
Derivatives did not have meaningful impact on the Fund’s performance during the year.
JNL/Mellon Capital S&P 500 Index Fund
Composition as of December 31, 2018: | ||
Information Technology | 18.4 | % |
Health Care | 14.2 | |
Financials | 12.3 | |
Communication Services | 9.3 | |
Consumer Discretionary | 9.1 | |
Industrials | 8.4 | |
Consumer Staples | 6.8 | |
Energy | 4.9 | |
Utilities | 3.0 | |
Real Estate | 2.7 | |
Materials | 2.5 | |
Securities Lending Collateral | 6.5 | |
Other Short Term Investments | 1.9 | |
Total Investments | 100.0 | % |
For the year ended December 31, 2018, JNL/Mellon Capital S&P 500 Index Fund underperformed its benchmark by posting a return of -4.88% for Class A shares compared to -4.38% for the S&P 500 Index. Fund performance tends to differ from that of its benchmark due to the Fund’s operating and management expenses.
The investment objective of the Fund is to match the performance of the S&P 500 Index. The Fund is constructed to mirror the S&P 500 Index to provide long term capital growth.
The Fund seeks to invest under normal circumstances at least 80% of its assets (net assets plus the amount of any borrowings made for investment purposes) in the stocks in the S&P 500 Index in proportion to their market capitalization weighting in the S&P 500 Index. The Fund does not employ traditional methods of active investment management, which involves the buying and selling of securities based upon security analysis. The Fund attempts to replicate the S&P 500 Index by investing all or substantially all of its assets in the stocks that make up the S&P 500 Index.
Derivatives did not have meaningful impact on the Fund’s performance during the year.
JNL S&P 500 Index Fund
Composition as of December 31, 2018: | ||
Information Technology | 19.4 | % |
Health Care | 15.0 | |
Financials | 12.9 | |
Communication Services | 9.8 | |
Consumer Discretionary | 9.6 | |
Industrials | 8.8 | |
Consumer Staples | 7.1 | |
Energy | 5.1 | |
Utilities | 3.2 | |
Real Estate | 2.8 | |
Materials | 2.7 | |
Investment Companies | 1.6 | |
Other Short Term Investments | 1.9 | |
Securities Lending Collateral | 0.1 | |
Total Investments | 100.0 | % |
For the year ended December 31, 2018, JNL S&P 500 Index Fund underperformed its benchmark by posting a return of -4.66% for Class I shares compared to -4.38% for the S&P 500 Index. Fund performance tends to differ from that of its benchmark due to the Fund’s operating and management expenses.
The investment objective of the Fund is to match the performance of the S&P 500 Index. The Fund is constructed to mirror the S&P 500 Index to provide long term capital growth.
The Fund seeks to invest under normal circumstances at least 80% of its assets (net assets plus the amount of any borrowings made for investment purposes) in the stocks in the S&P 500 Index in proportion to their market capitalization weighting in the S&P 500 Index. The Fund attempts to replicate the S&P 500 Index by investing all or substantially all of its assets in the stocks that make up the S&P 500 Index. Indexing may offer a cost-effective investment approach to gaining diversified market exposure over the long term.
40
| JNL/Mellon Capital Funds BNY Mellon Asset Management North America Corporation (Unaudited) |

Derivatives did not have meaningful impact on the Fund’s performance during the year.
JNL/Mellon Capital S&P 400 MidCap Index Fund
Composition as of December 31, 2018: | ||
Financials | 15.6 | % |
Information Technology | 14.7 | |
Industrials | 14.4 | |
Consumer Discretionary | 11.1 | |
Health Care | 9.5 | |
Real Estate | 9.2 | |
Materials | 6.3 | |
Utilities | 5.4 | |
Energy | 3.5 | |
Consumer Staples | 2.8 | |
Communication Services | 2.4 | |
Securities Lending Collateral | 4.1 | |
Other Short Term Investments | 1.0 | |
Total Investments | 100.0 | % |
For the year ended December 31, 2018, JNL/Mellon Capital S&P 400 MidCap Index Fund underperformed its benchmark by posting a return of -11.60% for Class A shares compared to -11.08% for the S&P MidCap 400 Index. Fund performance tends to differ from that of its benchmark due to the Fund’s operating and management expenses.
The investment objective of the Fund is to match the performance of the S&P MidCap 400 Index. The Fund is constructed to mirror the index to provide long term capital growth by investing in equity securities of medium capitalization-weighted domestic corporations.
The Fund invests, under normal circumstances, at least 80% of its assets (net assets plus the amount of any borrowings made for investment purposes) in the stocks in the S&P MidCap 400 Index in proportion to their market capitalization weighting in the S&P MidCap 400 Index. The Fund does not employ traditional methods of active investment management, which involves the buying and selling of securities based upon security analysis. The Fund attempts to replicate the S&P MidCap 400 Index by investing all or substantially all of its assets in the stocks that make up the S&P MidCap 400 Index.
Derivatives did not have meaningful impact on the Fund’s performance during the year.
JNL/Mellon Capital S&P 1500 Growth Index Fund
Composition as of December 31, 2018: | ||
Information Technology | 23.9 | % |
Health Care | 18.3 | |
Communication Services | 13.0 | |
Consumer Discretionary | 12.3 | |
Industrials | 8.7 | |
Financials | 5.9 | |
Consumer Staples | 5.2 | |
Real Estate | 3.7 | |
Energy | 3.4 | |
Materials | 2.2 | |
Utilities | 2.0 | |
Investment Companies | - | |
Other Short Term Investments | 1.0 | |
Securities Lending Collateral | 0.4 | |
Total Investments | 100.0 | % |
For the year ended December 31, 2018, JNL/Mellon Capital S&P 1500 Growth Index Fund underperformed its benchmark by posting a return of -1.30% for Class A shares compared to -0.82% for the S&P 1500 Growth Index. Fund performance tends to differ from that of its benchmark due to the Fund’s operating and management expenses.
The investment objective of the Fund is to match the performance of the S&P 1500 Growth Index. The Fund is constructed to mirror the S&P 1500 Growth Index to provide long term capital growth.
The Fund seeks to invest under normal circumstances at least 80% of its assets (net assets plus the amount of any borrowings made for investment purposes) in the stocks in the S&P 1500 Growth Index (“Index”) in proportion to their market capitalization weighting in the Index. The Fund attempts to replicate the Index by investing all or substantially all of its assets in the stocks that make up the Index. Indexing may offer a cost-effective investment approach to gaining diversified market exposure over the long-term.
Derivatives did not have meaningful impact on the Fund’s performance during the year.
JNL/Mellon Capital S&P 1500 Value Index Fund
Composition as of December 31, 2018: | ||
Financials | 21.4 | % |
Information Technology | 14.1 | |
Health Care | 10.9 | |
Industrials | 10.4 | |
Consumer Staples | 8.7 | |
Consumer Discretionary | 7.4 | |
Energy | 6.7 | |
Communication Services | 5.2 | |
Utilities | 4.8 | |
Materials | 3.8 | |
Real Estate | 3.1 | |
Investment Companies | 0.4 | |
Rights | - | |
Other Short Term Investments | 2.5 | |
Securities Lending Collateral | 0.6 | |
Total Investments | 100.0 | % |
For the year ended December 31, 2018, JNL/Mellon Capital S&P 1500 Value Index Fund underperformed its benchmark by posting a return of -10.00% for Class A shares compared to -9.29% for the S&P 1500 Value Index. Fund performance tends to differ from that of its benchmark due to the Fund’s operating and management expenses.
The investment objective of the Fund is to match the performance of the S&P 1500 Value Index. The Fund is constructed to mirror the S&P 1500 Value Index to provide long term capital growth.
The Fund seeks to invest under normal circumstances at least 80% of its assets (net assets plus the amount of any borrowings made for investment purposes) in the stocks in the S&P 1500 Value Index (“Index”) in proportion to their market capitalization weighting in the Index. The Fund attempts to replicate the Index by investing all or substantially all of its assets in the stocks that make up the Index. Indexing may offer a cost-effective investment approach to gaining diversified market exposure over the long term.
Derivatives did not have meaningful impact on the Fund’s performance during the year.
JNL/Mellon Capital Small Cap Index Fund
Composition as of December 31, 2018: | ||
Industrials | 17.9 | % |
Financials | 16.9 | |
Information Technology | 13.4 | |
Consumer Discretionary | 13.3 | |
Health Care | 11.0 | |
Real Estate | 7.5 | |
Materials | 3.9 | |
Consumer Staples | 3.4 | |
Energy | 3.3 | |
Utilities | 2.5 | |
Communication Services | 1.9 | |
Rights | - | |
Securities Lending Collateral | 4.7 | |
Other Short Term Investments | 0.3 | |
Total Investments | 100.0 | % |
For the year ended December 31, 2018, JNL/Mellon Capital Small Cap Index Fund underperformed its benchmark by posting a return of -8.92% for Class A shares compared to -8.48% for the S&P SmallCap 600 Index. Fund performance tends to differ from that of its benchmark due to the Fund’s operating and management expenses.
The investment objective of the Fund is to match the performance of the S&P SmallCap 600 Index. The Fund is constructed to mirror the index to provide long term growth of capital by investing in equity securities of small- to mid-size domestic companies.
The Fund invests, under normal circumstances, at least 80% of its assets (net assets plus the amount of any borrowings made for investment purposes) in the stocks included in the S&P SmallCap 600 Index in proportion to their market capitalization weighting in the S&P SmallCap 600 Index. The Fund does not employ traditional methods of active investment management, which involves the buying and selling of securities
41
| JNL/Mellon Capital Funds BNY Mellon Asset Management North America Corporation (Unaudited) |

based upon security analysis. The Fund attempts to replicate the S&P SmallCap 600 Index by investing all or substantially all of its assets in the stocks that make up the S&P SmallCap 600 Index.
Derivatives did not have meaningful impact on the Fund’s performance during the year.
JNL/Mellon Capital International Index Fund
Composition as of December 31, 2018: | ||
Financials | 19.3 | % |
Industrials | 13.8 | |
Consumer Staples | 11.6 | |
Health Care | 11.3 | |
Consumer Discretionary | 10.9 | |
Materials | 7.3 | |
Information Technology | 6.6 | |
Energy | 5.7 | |
Communication Services | 4.8 | |
Utilities | 3.8 | |
Real Estate | 3.6 | |
Rights | - | |
Securities Lending Collateral | 1.0 | |
Other Short Term Investments | 0.3 | |
Total Investments | 100.0 | % |
For the year ended December 31, 2018, JNL/Mellon Capital International Index Fund underperformed its benchmark by posting a return of -13.91% for Class A shares compared to -13.79 % for the MSCI EAFE Index (Net). Fund performance tends to differ from that of its benchmark due to the Fund’s operating and management expenses.
The investment objective of the Fund is to match the performance of the MSCI EAFE (Net) Index (“Index”). The Fund is constructed to mirror the Index to provide long term capital growth by investing in international equity securities attempting to match the characteristics of each country within the Index.
The Fund invests, under normal circumstances, at least 80% of its assets (net assets plus the amount of any borrowings made for investment purposes) in the stocks included in the Index or derivative securities economically related to the Index. The Fund seeks to match the performance and characteristics of the Index.
Derivatives did not have meaningful impact on the Fund’s performance during the year.
JNL/Mellon Capital MSCI KLD 400 Social Index Fund
Composition as of December 31, 2018: | ||
Information Technology | 23.1 | % |
Communication Services | 14.3 | |
Health Care | 12.8 | |
Industrials | 10.0 | |
Financials | 9.7 | |
Consumer Discretionary | 8.2 | |
Consumer Staples | 7.4 | |
Energy | 3.9 | |
Real Estate | 3.9 | |
Materials | 3.1 | |
Utilities | 2.0 | |
Other Short Term Investments | 0.8 | |
Securities Lending Collateral | 0.8 | |
Total Investments | 100.0 | % |
For the year ended December 31, 2018, JNL/Mellon Capital MSCI KLD 400 Social Index Fund underperformed its benchmark by posting a return of -4.30% for Class A shares compared to -3.50% for the MSCI KLD 400 Social Index (Gross). Fund performance tends to differ from that of its benchmark due to the Fund’s operating and management expenses.
The investment objective of the Fund is to seek to track the investment results of an index composed of U.S. companies that have positive environmental, social and governance characteristics as identified by the index provider.
The Fund seeks to track the investment results of the MSCI KLD 400 Social Index (“Index”), which is a free float-adjusted market capitalization index designed to target U.S. companies that have positive environmental, social and governance (“ESG”) characteristics. As of February 28, 2018, the Index consisted of 400 companies identified by MSCI Inc. (the “Index Provider” or “MSCI”) from the universe of companies included in the MSCI USA IMI Index, which targets 99% of the market coverage of stocks that are listed for trading on the New York Stock Exchange (“NYSE”), NASDAQ Stock Market and the NYSE MKT LLC. MSCI analyzes each eligible company’s ESG performance using proprietary ratings covering ESG criteria. The ratings identify the following six to ten issues: climate change, natural resources, pollution and waste, environmental opportunities, human capital, product liability, stakeholder opposition, social opportunities, corporate governance, and corporate behavior. The ESG criteria includes, but is not limited to, a company’s level of exposure relating to a material issue and the company’s management process of that issue. To assess a company’s exposure to and management of ESG risks and opportunities, MSCI collects data from at a segment or geographic level from academic and government datasets, publicly filed company reports, government databases, media and similar sources. Companies that MSCI determines have significant involvement in the following businesses are not eligible for the Index: alcohol, tobacco, gambling, civilian firearms, nuclear power, military weapons, adult entertainment and genetically modified organisms. The Index may include large-, mid- or small capitalization companies. Components of the Index primarily include consumer discretionary, healthcare and information technology companies. The components of the Index, and the degree to which these components represent certain industries, are likely to change over time.
Derivatives did not have meaningful impact on the Fund’s performance during the year.
JNL/Mellon Capital Bond Index Fund
Composition as of December 31, 2018: | ||
Government Securities | 40.6 | % |
U.S. Government Agency MBS | 26.9 | |
Financials | 7.3 | |
Health Care | 2.8 | |
Energy | 2.4 | |
Communication Services | 2.0 | |
Information Technology | 1.9 | |
Non-U.S. Government Agency ABS | 1.9 | |
Utilities | 1.6 | |
Industrials | 1.5 | |
Consumer Staples | 1.4 | |
Consumer Discretionary | 1.2 | |
Real Estate | 0.8 | |
Materials | 0.6 | |
Other Short Term Investments | 5.9 | |
Securities Lending Collateral | 1.2 | |
Net Long (Short) Investments | 100.0 | % |
For the year ended December 31, 2018, JNL/Mellon Capital Bond Index Fund underperformed its benchmark by posting a return of -0.57% for Class A shares compared to 0.01% for the Bloomberg Barclays U.S. Aggregate Bond Index. Fund performance tends to differ from that of its benchmark due to the Fund’s operating and management expenses.
The investment objective of the Fund is to match the performance of the Bloomberg Barclays U.S. Aggregate Bond Index (“Index”). The Fund is constructed utilizing a combination of stratified sampling, characteristics matching, and replication in order to match the key performance driving characteristics of the Index.
The Index returned 0.01% for the year, and the Fund closely tracked its benchmark, gross of fees. The Fund’s assets under management decreased to end the year with approximately $1,082 million under management.
The Index was essentially flat for the year, as gains in Treasuries were offset by widening corporate spreads. Interest rates were volatile during 2018. U.S. Treasury yields began the year by rising sharply across the curve as expectations of growth, inflation and interest rates shifted higher. The U.S. Federal Reserve (“Fed”) raised the Fed funds rate four times during the year as growth remained firm and unemployment hit record lows. After hitting a high of 3.23% in early October, rates fell sharply through December as tumbling equities increased safe haven demand.
42
| JNL/Mellon Capital Funds BNY Mellon Asset Management North America Corporation (Unaudited) |

Corporate spreads widened during the year as geopolitical and global growth concerns, trade wars, and geopolitics caused a flight to quality late in the year. The corporate sector fell 2.51% and underperformed duration neutral Treasuries by 3.15%. Long corporates fell 7.24% (total return) and underperformed by 6.51%. While the securitized sector rose on a total return basis, it declined 0.56% versus duration neutral Treasuries.
JNL/Mellon Capital Utilities Sector Fund
Composition as of December 31, 2018: | ||
Utilities | 97.7 | % |
Investment Companies | 0.1 | |
Securities Lending Collateral | 1.5 | |
Other Short Term Investments | 0.7 | |
Total Investments | 100.0 | % |
For the year ended December 31, 2018, JNL/Mellon Capital Utilities Sector Fund underperformed its benchmark by posting a return of 3.79% for Class A shares compared to 4.55% for the MSCI USA IMI/Utilities Index (Gross). Fund performance tends to differ from that of its benchmark due to the Fund’s operating and management expenses.
The objective of the Fund is total return through capital appreciation and dividend income.
The Fund invests, under normal circumstances, at least 80% of its assets (net assets plus the amount of any borrowings made for investment purposes) in the stocks included in the MSCI USA IMI/Utilities Index (“Index”) in proportion to their market capitalization weighting in the Index. The Fund may concentrate in certain industries in the utilities sector to the extent such industries are represented in the Index. The Index measures the performance of the utilities sector of the U.S. equity market. The Fund seeks to achieve its objective by utilizing a replication investment approach, called indexing, which attempts to replicate the investment performance of the Index. Indexing may eliminate the chance that the Fund will outperform the Index, but also may reduce some of the risk of active management, such as poor security selection. Indexing may offer a cost-effective investment approach to gaining sector exposure over the long term.
Derivatives did not have meaningful impact on the Fund’s performance during the year.
JNL/Morningstar Wide Moat Index Fund
Composition as of December 31, 2018: | ||
Health Care | 21.2 | % |
Information Technology | 19.9 | |
Consumer Staples | 15.0 | |
Financials | 12.0 | |
Communication Services | 8.5 | |
Consumer Discretionary | 7.8 | |
Industrials | 6.1 | |
Utilities | 2.7 | |
Real Estate | 2.5 | |
Materials | 2.0 | |
Other Short Term Investments | 1.6 | |
Securities Lending Collateral | 0.7 | |
Total Investments | 100.0 | % |
Total Return |
| |||||
Class A‡ |
|
|
| Class I† |
|
|
Since Inception | -7.20 | % | Since Inception | -7.10 | % | |
‡Inception date August 13, 2018 | ||||||
†Inception date August 13, 2018 | ||||||
Past performance is not predictive of future performance. Investment return and principal value will fluctuate so that an investor’s shares, when redeemed, may be worth more or less than their original cost. Performance numbers are net of all Fund operating expenses, but do not reflect the deduction of insurance charges. |
| |||||
For the period August 13, 2018 through December 31, 2018, JNL/Morningstar Wide Moat Index Fund underperformed its benchmark by posting a return of -7.20% for Class A shares compared to -6.98% for the Morningstar® Wide Moat Focus IndexSM. Fund performance tends to differ from that of its benchmark due to the Fund’s operating and management expenses.
The investment objective of the Fund is to provide total return by tracking the performance, net of expenses, of the Morningstar® Wide Moat Focus IndexSM.
The Fund seeks to invest under normal circumstances at least 80% of its assets (net assets plus the amount of any borrowings made for investment purposes) in the securities in the Morningstar® Wide Moat Focus IndexSM (“Index”). Indexing may offer a cost-effective investment approach to gaining diversified market exposure over the long-term.
Derivatives did not have meaningful impact on the Fund’s performance during the year.
43
| JNL/Mellon Capital Funds BNY Mellon Capital Asset Management North America Corporation (Unaudited) |

JNL/Mellon Capital Consumer Staples Sector Fund
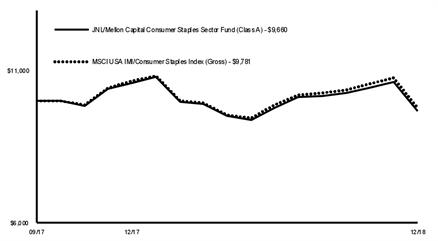
Average Annual Total Returns |
| |||||
Class A‡ |
|
|
| Class I† |
|
|
1 Year | -8.95 | % | 1 Year | -8.66 | % | |
Since Inception | -2.69 |
|
| Since Inception | -2.37 |
|
‡Inception date September 25, 2017 |
| |||||
†Inception date September 25, 2017 |
| |||||
The graph shows the change in value of an assumed $10,000 investment in the Fund's Class A shares over 10 years, or since inception if the inception is less than 10 years, as well as the Fund's benchmark(s) performance for the same period.
Past performance is not predictive of future performance. Investment return and principal value will fluctuate so that an investor’s shares, when redeemed, may be worth more or less than their original cost. Performance numbers are net of all Fund operating expenses, but do not reflect the deduction of insurance charges.
JNL/Mellon Capital Emerging Markets Index Fund

Average Annual Total Returns |
| |||||
Class A‡ |
|
|
| Class I† |
|
|
1 Year | -15.24 | % | 1 Year | -15.00 | % | |
5 Year | 0.71 |
|
| 5 Year | 0.93 |
|
Since Inception | 0.80 |
|
| Since Inception | 1.01 |
|
‡Inception date August 29, 2011 |
| |||||
†Inception date August 29, 2011 |
| |||||
The graph shows the change in value of an assumed $10,000 investment in the Fund's Class A shares over 10 years, or since inception if the inception is less than 10 years, as well as the Fund's benchmark(s) performance for the same period.
Past performance is not predictive of future performance. Investment return and principal value will fluctuate so that an investor’s shares, when redeemed, may be worth more or less than their original cost. Performance numbers are net of all Fund operating expenses, but do not reflect the deduction of insurance charges.
JNL/Mellon Capital European 30 Fund
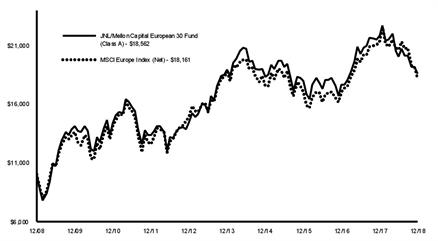
Average Annual Total Returns |
| |||||
Class A |
|
|
| Class I |
|
|
1 Year | -14.80 | % | 1 Year | -14.58 | % | |
5 Year | -0.40 |
|
| 5 Year | -0.20 |
|
10 Year | 6.38 |
|
| 10 Year | 6.60 |
|
The graph shows the change in value of an assumed $10,000 investment in the Fund's Class A shares over 10 years, or since inception if the inception is less than 10 years, as well as the Fund's benchmark(s) performance for the same period.
Past performance is not predictive of future performance. Investment return and principal value will fluctuate so that an investor’s shares, when redeemed, may be worth more or less than their original cost. Performance numbers are net of all Fund operating expenses, but do not reflect the deduction of insurance charges.
44
| JNL/Mellon Capital Funds BNY Mellon Capital Asset Management North America Corporation (Unaudited) |

JNL/Mellon Capital Industrials Sector Fund

Average Annual Total Returns |
| |||||
Class A‡ |
|
|
| Class I† |
|
|
1 Year | -14.43 | % | 1 Year | -14.06 | % | |
Since Inception | -6.92 |
|
| Since Inception | -6.60 |
|
‡Inception date September 25, 2017 |
| |||||
†Inception date September 25, 2017 |
| |||||
The graph shows the change in value of an assumed $10,000 investment in the Fund's Class A shares over 10 years, or since inception if the inception is less than 10 years, as well as the Fund's benchmark(s) performance for the same period.
Past performance is not predictive of future performance. Investment return and principal value will fluctuate so that an investor’s shares, when redeemed, may be worth more or less than their original cost. Performance numbers are net of all Fund operating expenses, but do not reflect the deduction of insurance charges.
JNL/Mellon Capital Materials Sector Fund
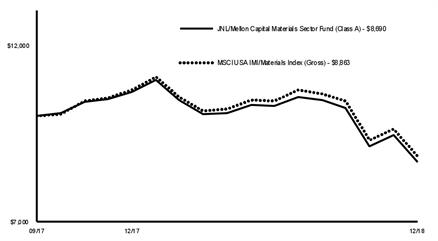
Average Annual Total Returns |
| |||||
Class A‡ |
|
|
| Class I† |
|
|
1 Year | -18.63 | % | 1 Year | -18.35 | % | |
Since Inception | -10.48 |
|
| Since Inception | -10.24 |
|
‡Inception date September 25, 2017 |
| |||||
†Inception date September 25, 2017 |
| |||||
The graph shows the change in value of an assumed $10,000 investment in the Fund's Class A shares over 10 years, or since inception if the inception is less than 10 years, as well as the Fund's benchmark(s) performance for the same period.
Past performance is not predictive of future performance. Investment return and principal value will fluctuate so that an investor’s shares, when redeemed, may be worth more or less than their original cost. Performance numbers are net of all Fund operating expenses, but do not reflect the deduction of insurance charges.
JNL/Mellon Capital Pacific Rim 30 Fund
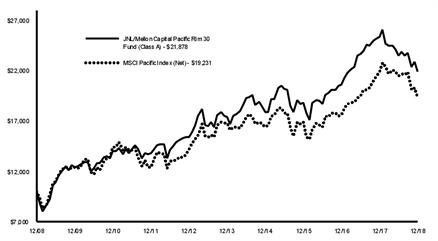
Average Annual Total Returns |
| |||||
Class A |
|
|
| Class I |
|
|
1 Year | -13.86 | % | 1 Year | -13.62 | % | |
5 Year | 4.74 |
|
| 5 Year | 4.96 |
|
10 Year | 8.14 |
|
| 10 Year | 8.37 |
|
The graph shows the change in value of an assumed $10,000 investment in the Fund's Class A shares over 10 years, or since inception if the inception is less than 10 years, as well as the Fund's benchmark(s) performance for the same period.
Past performance is not predictive of future performance. Investment return and principal value will fluctuate so that an investor’s shares, when redeemed, may be worth more or less than their original cost. Performance numbers are net of all Fund operating expenses, but do not reflect the deduction of insurance charges.
45
| JNL/Mellon Capital Funds BNY Mellon Capital Asset Management North America Corporation (Unaudited) |

JNL/Mellon Capital Real Estate Sector Fund
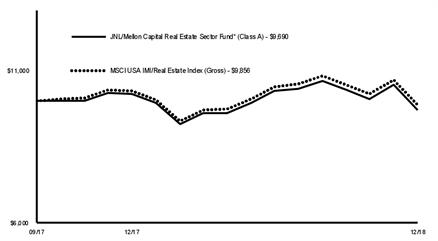
Average Annual Total Returns* |
| |||||
Class A‡ |
|
|
| Class I† |
|
|
1 Year | -5.28 | % | 1 Year | -5.37 | % | |
Since Inception | -2.45 |
|
| Since Inception | -2.45 |
|
‡Inception date September 25, 2017 |
| |||||
†Inception date September 25, 2017 |
| |||||
*The Fund's investment adviser waived/reimbursed certain expenses of the Fund. Performance results shown reflect the waiver, without which performance results would have been lower. |
| |||||
The graph shows the change in value of an assumed $10,000 investment in the Fund's Class A shares over 10 years, or since inception if the inception is less than 10 years, as well as the Fund's benchmark(s) performance for the same period.
Past performance is not predictive of future performance. Investment return and principal value will fluctuate so that an investor’s shares, when redeemed, may be worth more or less than their original cost. Performance numbers are net of all Fund operating expenses, but do not reflect the deduction of insurance charges.
JNL/Mellon Capital S&P 500 Index Fund
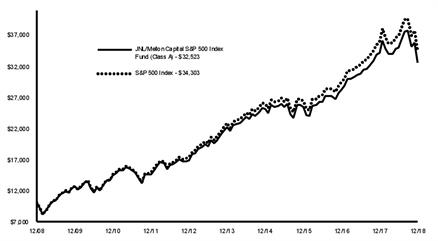
Average Annual Total Returns |
| |||||
Class A |
|
|
| Class I |
|
|
1 Year | -4.88 | % | 1 Year | -4.61 | % | |
5 Year | 7.92 |
|
| 5 Year | 8.12 |
|
10 Year | 12.52 |
|
| 10 Year | 12.74 |
|
The graph shows the change in value of an assumed $10,000 investment in the Fund's Class A shares over 10 years, or since inception if the inception is less than 10 years, as well as the Fund's benchmark(s) performance for the same period.
Past performance is not predictive of future performance. Investment return and principal value will fluctuate so that an investor’s shares, when redeemed, may be worth more or less than their original cost. Performance numbers are net of all Fund operating expenses, but do not reflect the deduction of insurance charges.
JNL S&P 500 Index Fund
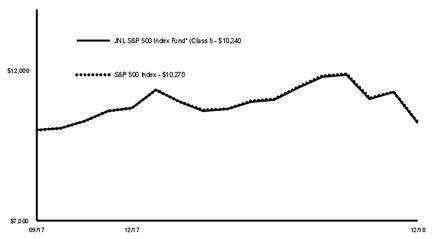
Total Return* |
| |||||
Class I‡ |
|
|
|
|
| |
1 Year | -4.66 | % | ||||
Since Inception | 1.89 | % |
| |||
†Inception date September 25, 2017 |
| |||||
*The Fund's investment adviser waived/reimbursed certain expenses of the Fund. Performance results shown reflect the waiver, without which performance results would have been lower. |
| |||||
The graph shows the change in value of an assumed $10,000 investment in the Fund's Class I shares over 10 years, or since inception if the inception is less than 10 years, as well as the Fund's benchmark(s) performance for the same period.
Past performance is not predictive of future performance. Investment return and principal value will fluctuate so that an investor’s shares, when redeemed, may be worth more or less than their original cost. Performance numbers are net of all Fund operating expenses, but do not reflect the deduction of insurance charges.
46
| JNL/Mellon Capital Funds BNY Mellon Capital Asset Management North America Corporation (Unaudited) |

JNL/Mellon Capital S&P 400 MidCap Index Fund
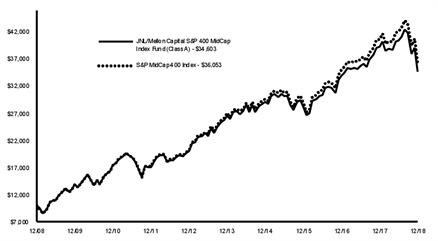
Average Annual Total Returns |
| |||||
Class A |
|
|
| Class I |
|
|
1 Year | -11.60 | % | 1 Year | -11.27 | % | |
5 Year | 5.48 |
|
| 5 Year | 5.67 |
|
10 Year | 13.22 |
|
| 10 Year | 13.44 |
|
The graph shows the change in value of an assumed $10,000 investment in the Fund's Class A shares over 10 years, or since inception if the inception is less than 10 years, as well as the Fund's benchmark(s) performance for the same period.
Past performance is not predictive of future performance. Investment return and principal value will fluctuate so that an investor’s shares, when redeemed, may be worth more or less than their original cost. Performance numbers are net of all Fund operating expenses, but do not reflect the deduction of insurance charges.
JNL/Mellon Capital S&P 1500 Growth Index Fund
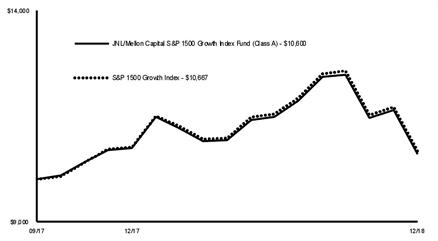
Average Annual Total Returns |
| |||||
Class A‡ |
|
|
| Class I† |
|
|
1 Year | -1.30 | % | 1 Year | -0.93 | % | |
Since Inception | 4.70 |
|
| Since Inception | 5.01 |
|
‡Inception date September 25, 2017 |
| |||||
†Inception date September 25, 2017 |
| |||||
The graph shows the change in value of an assumed $10,000 investment in the Fund's Class A shares over 10 years, or since inception if the inception is less than 10 years, as well as the Fund's benchmark(s) performance for the same period.
Past performance is not predictive of future performance. Investment return and principal value will fluctuate so that an investor’s shares, when redeemed, may be worth more or less than their original cost. Performance numbers are net of all Fund operating expenses, but do not reflect the deduction of insurance charges.
JNL/Mellon Capital S&P 1500 Value Index Fund

Average Annual Total Returns |
| |||||
Class A‡ |
|
|
| Class I† |
|
|
1 Year | -10.00 | % | 1 Year | -9.73 | % | |
Since Inception | -2.93 |
|
| Since Inception | -2.77 |
|
‡Inception date September 25, 2017 |
| |||||
†Inception date September 25, 2017 |
| |||||
The graph shows the change in value of an assumed $10,000 investment in the Fund's Class A shares over 10 years, or since inception if the inception is less than 10 years, as well as the Fund's benchmark(s) performance for the same period.
Past performance is not predictive of future performance. Investment return and principal value will fluctuate so that an investor’s shares, when redeemed, may be worth more or less than their original cost. Performance numbers are net of all Fund operating expenses, but do not reflect the deduction of insurance charges.
47
| JNL/Mellon Capital Funds BNY Mellon Capital Asset Management North America Corporation (Unaudited) |

JNL/Mellon Capital Small Cap Index Fund
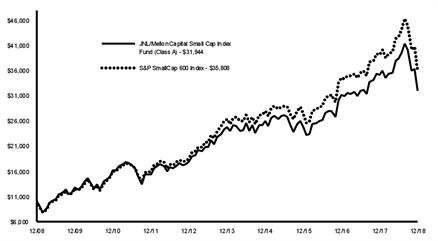
Average Annual Total Returns |
| |||||
Class A |
|
|
| Class I |
|
|
1 Year | -8.92 | % | 1 Year | -8.66 | % | |
5 Year | 5.26 |
|
| 5 Year | 5.48 |
|
10 Year | 12.32 |
|
| 10 Year | 12.53 |
|
The graph shows the change in value of an assumed $10,000 investment in the Fund's Class A shares over 10 years, or since inception if the inception is less than 10 years, as well as the Fund's benchmark(s) performance for the same period.
Past performance is not predictive of future performance. Investment return and principal value will fluctuate so that an investor’s shares, when redeemed, may be worth more or less than their original cost. Performance numbers are net of all Fund operating expenses, but do not reflect the deduction of insurance charges.
JNL/Mellon Capital International Index Fund
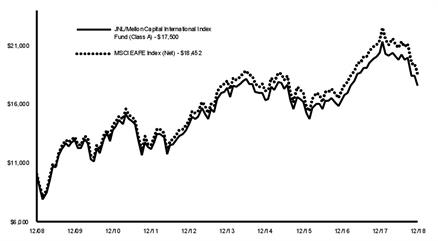
Average Annual Total Returns |
| |||||
Class A |
|
|
| Class I |
|
|
1 Year | -13.91 | % | 1 Year | -13.66 | % | |
5 Year | 0.16 |
|
| 5 Year | 0.38 |
|
10 Year | 5.76 |
|
| 10 Year | 5.98 |
|
The graph shows the change in value of an assumed $10,000 investment in the Fund's Class A shares over 10 years, or since inception if the inception is less than 10 years, as well as the Fund's benchmark(s) performance for the same period.
Past performance is not predictive of future performance. Investment return and principal value will fluctuate so that an investor’s shares, when redeemed, may be worth more or less than their original cost. Performance numbers are net of all Fund operating expenses, but do not reflect the deduction of insurance charges.
JNL/Mellon Capital MSCI KLD 400 Social Index Fund
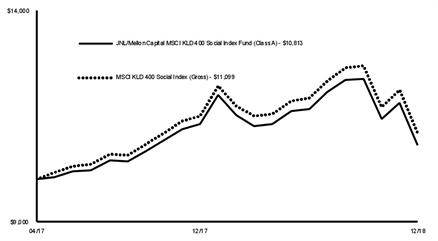
Average Annual Total Returns |
| |||||
Class A‡ |
|
|
| Class I† |
|
|
1 Year | -4.30 | % | 1 Year | -4.12 | % | |
Since Inception | 4.73 |
|
| Since Inception | 1.74 |
|
‡Inception date April 24, 2017 |
| |||||
†Inception date September 25, 2017 |
| |||||
The graph shows the change in value of an assumed $10,000 investment in the Fund's Class A shares over 10 years, or since inception if the inception is less than 10 years, as well as the Fund's benchmark(s) performance for the same period.
Past performance is not predictive of future performance. Investment return and principal value will fluctuate so that an investor’s shares, when redeemed, may be worth more or less than their original cost. Performance numbers are net of all Fund operating expenses, but do not reflect the deduction of insurance charges.
48
| JNL/Mellon Capital Funds BNY Mellon Capital Asset Management North America Corporation (Unaudited) |

JNL/Mellon Capital Bond Index Fund

Average Annual Total Returns |
| |||||
Class A |
|
|
| Class I |
|
|
1 Year | -0.57 | % | 1 Year | -0.28 | % | |
5 Year | 1.95 |
|
| 5 Year | 2.17 |
|
10 Year | 2.89 |
|
| 10 Year | 3.11 |
|
The graph shows the change in value of an assumed $10,000 investment in the Fund's Class A shares over 10 years, or since inception if the inception is less than 10 years, as well as the Fund's benchmark(s) performance for the same period.
Past performance is not predictive of future performance. Investment return and principal value will fluctuate so that an investor’s shares, when redeemed, may be worth more or less than their original cost. Performance numbers are net of all Fund operating expenses, but do not reflect the deduction of insurance charges.
JNL/Mellon Capital Utilities Sector Fund
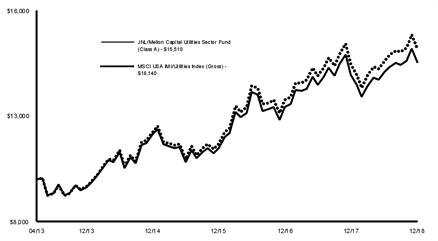
Average Annual Total Returns |
| |||||
Class A‡ |
|
|
| Class I† |
|
|
1 Year | 3.79 | % | 1 Year | 4.03 | % | |
5 Year | 10.07 |
|
| 5 Year | N/A |
|
Since Inception | 8.04 |
|
| Since Inception | 3.29 |
|
‡Inception date April 29, 2013 |
| |||||
†Inception date September 25, 2017 |
| |||||
The graph shows the change in value of an assumed $10,000 investment in the Fund's Class A shares over 10 years, or since inception if the inception is less than 10 years, as well as the Fund's benchmark(s) performance for the same period.
Past performance is not predictive of future performance. Investment return and principal value will fluctuate so that an investor’s shares, when redeemed, may be worth more or less than their original cost. Performance numbers are net of all Fund operating expenses, but do not reflect the deduction of insurance charges.
49
| JNL/MFS Mid Cap Value Fund Massachusetts Financial Services Company (Unaudited) |

JNL/MFS Mid Cap Value Fund
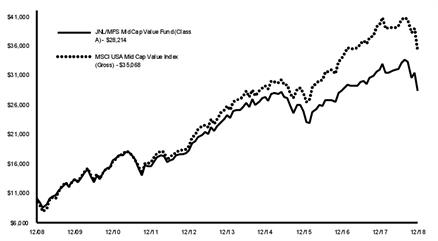
Average Annual Total Returns |
| |||||
Class A |
|
|
| Class I |
|
|
1 Year | -11.68 | % | 1 Year | -11.46 | % | |
5 Year | 3.15 |
|
| 5 Year | 3.38 |
|
10 Year | 10.93 |
|
| 10 Year | 11.18 |
|
The graph shows the change in value of an assumed $10,000 investment in the Fund's Class A shares over 10 years, or since inception if the inception is less than 10 years, as well as the Fund's benchmark(s) performance for the same period.
Past performance is not predictive of future performance. Investment return and principal value will fluctuate so that an investor’s shares, when redeemed, may be worth more or less than their original cost. Performance numbers are net of all Fund operating expenses, but do not reflect the deduction of insurance charges.
Massachusetts Financial Services Company assumed portfolio management responsibility on April 24, 2017.
Composition as of December 31, 2018: | ||
Financials | 21.1 | % |
Information Technology | 12.4 | |
Industrials | 11.4 | |
Utilities | 10.0 | |
Consumer Discretionary | 8.8 | |
Materials | 8.3 | |
Real Estate | 7.2 | |
Energy | 6.3 | |
Health Care | 5.9 | |
Consumer Staples | 5.4 | |
Communication Services | 1.5 | |
Other Short Term Investments | 1.0 | |
Securities Lending Collateral | 0.7 | |
Total Investments | 100.0 | % |
For the year ended December 31, 2018, JNL/MFS Mid Cap Value Fund underperformed its primary benchmark by posting a return of -11.68% for Class A shares compared to -11.35% for the MSCI USA Mid Cap Value Index (Gross).
Stock selection and, to a lesser extent, an underweight position in financials contributed to performance relative to the MSCI USA Mid Cap Value Index. Within this sector, not owning shares of global financial company Principal Financial Group Inc. and asset management firm Affiliated Managers Group Inc. bolstered relative returns. Additionally, the timing of the Fund's ownership in shares of general reinsurance services provider AXA SA further strengthened relative results.
Stock selection in health care also helped relative performance. Within this sector, not owning shares of health care company Perrigo Co. Plc and the Fund’s position in medical supply manufacturer Steris Plc aided relative performance.
Stock selection and, to a lesser extent, an overweight allocation to information technology was another positive contributor to relative results. Here, an overweight position in precision equipment manufacturer Keysight Technologies Inc. and the Fund’s position in shares of multinational telecommunications company Motorola Solutions Inc. lifted relative returns.
Stocks in other sectors that benefited relative performance included an overweight position in oil refiner Andeavor Logistics LP and the Fund’s ownership in shares of health care real estate investment trust Medical Properties Trust Inc. and oil and gas exploration and production company Energen Corp.
Stock selection and, to a lesser extent, an overweight position in energy detracted from relative performance. Within this sector, holding shares of petroleum and natural gas exploration company WPX Energy Inc. and oilfield products company Forum Energy Technologies Inc. weighed on relative returns. In addition, the timing of the Fund’s ownership in shares of petroleum refiner HollyFrontier Corp. weakened relative results.
An underweight position and, to a lesser extent, stock selection in utilities also held back relative performance led by an underweight position in power company Ameren Corp.
Stock selection in both consumer discretionary and industrials further detracted from relative results. Within consumer discretionary, holding shares of automotive parts manufacturer Adient Plc and an overweight position in fashion retailer L Brands Inc. held back relative returns. Within industrials, an overweight position in residential and commercial building materials manufacturer Owens Corning Inc. and not owning shares of facilities maintenance products supplier WW Grainger Inc. hurt relative returns. In addition, holding shares of chemical distributor Univar Inc. negatively impacted relative results. Elsewhere, not holding shares of real estate company Realty Income Corp. weighed on relative performance.
50
| JNL Multi-Manager Alternative Fund Jackson National Asset Management, LLC (Unaudited) |

JNL Multi-Manager Alternative Fund
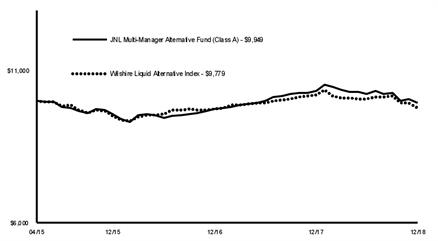
Average Annual Total Returns |
| |||||
Class A‡ |
|
|
| Class I† |
|
|
1 Year | -3.83 | % | 1 Year | -3.55 | % | |
Since Inception | -0.14 |
|
| Since Inception | -1.97 |
|
‡Inception date April 27, 2015 |
| |||||
†Inception date September 25, 2017 |
| |||||
The graph shows the change in value of an assumed $10,000 investment in the Fund's Class A shares over 10 years, or since inception if the inception is less than 10 years, as well as the Fund's benchmark(s) performance for the same period.
Past performance is not predictive of future performance. Investment return and principal value will fluctuate so that an investor’s shares, when redeemed, may be worth more or less than their original cost. Performance numbers are net of all Fund operating expenses, but do not reflect the deduction of insurance charges.
Composition as of December 31, 2018: | ||
Financials | 13.3 | % |
Non-U.S. Government Agency ABS | 9.3 | |
Health Care | 7.4 | |
Communication Services | 7.3 | |
Information Technology | 6.6 | |
Government Securities | 6.3 | |
Consumer Discretionary | 5.6 | |
Energy | 4.6 | |
Industrials | 3.9 | |
Materials | 3.8 | |
Consumer Staples | 3.7 | |
U.S. Government Agency MBS | 3.2 | |
Real Estate | 2.2 | |
Investment Companies | 1.5 | |
Utilities | 0.4 | |
Warrants | - | |
Rights | - | |
Other Equity Interests | - | |
Other Short Term Investments | 20.9 | |
Net Long (Short) Investments | 100.0 | % |
JNL Multi-Manager Alternative Fund seeks to achieve its investment objective by allocating among a variety of alternative strategies managed by unaffiliated investments managers (“Sub-Advisers”). Each of the Sub-Advisers may use different investment strategies in managing the Fund, acts independently from the others, and uses its own methodology for selecting investments. The Adviser (“JNAM”) is responsible for selecting the Fund’s alternatives investment strategies and for determining the amount of Fund assets to allocate to each Sub-Adviser.
For the year ended December 31, 2018, JNL Multi-Manager Alternative Fund outperformed its benchmark by posting a return of -3.83% for Class A shares compared to -4.26% for the Wilshire Liquid Alternative Index.
The Fund outperformed its benchmark due to allocations to relative value and event driven strategies, and strong underlying manager results. The Westchester merger arbitrage strategy (+8.92%) was the top performer, widely outperforming the broader market. Within relative value, the addition of the DoubleLine Opportunistic Income strategy (+0.40%) aided returns. The larger equity hedged segment was mixed with positive relative performance from the Invesco U.S. market neutral (-2.52%) and Loomis Sayles long short equity (-1.50%) strategies offset by weaker results from the Boston Partners emerging markets long short (-18.00%) and First Pacific contrarian value (-8.41%) strategies.
BlueBay Asset Management LLP (“BlueBay”)
For the Fund’s allocation to the relative value strategy, BlueBay invests in global investment grade fixed income securities. At December 31, 2018, the Fund’s allocation to this strategy was 9.5%.
Global leveraged finance markets endured a volatile year. Concerns over rising inflationary prospects and associated interest rate normalization, trade tension, emerging market stresses and the resumption of political uncertainty in Europe all weighed at various points during the first half of the year, overshadowing what continues to be a very strong fundamental corporate back drop. This strong corporate performance, which continues to underpin a negligible default rate, drove a robust rebound in performance in the market during the early part of the second half of the year. Of course this was outweighed during the closing months by wider risk market stresses. Ultimately, the ICE Bank of America Merrill Lynch Global High Yield Index returned -1.90% while U.S. leveraged loans faired a little better despite a significant late year reversal, returning 1.08%. Being underweight more cyclical industries such as autos and basic industry were key sources of outperformance during the latter part of the year, while exposure to European banking earlier in the year weighed on performance. The strategy utilized derivatives at various points of the year to both protect the downside and capture market beta. Most notably, during the equity market inspired sell off in the first quarter, the portfolio actively utilized S&P 500 put spreads and a short position in the High Yield CDX index to hedge the strategy. Over the course of the year, the use of derivative securities added approximately 50 basis points to strategy performance.
Boston Partners Global Investors, Inc (“Boston Partners”)
For the Fund’s allocation to equity long/short strategies, Boston Partners pursues a multi-faceted strategy that invests in a long-short portfolio of equity securities and financial investments with equity like characteristics designed to provide exposure to emerging markets. At December 31, 2018, the fund’s allocation to this strategy was 11.1%.
During 2018 the Fund had an average net exposure of 64%. During that time, the long strategy returned -20.9% and the short strategy returned -14.6%, indicating a long/short spread of -6.3%.
The macroeconomic forces of rising U.S. interest rates and rising U.S. China trade war tensions, among other factors, saw investors head for cover, ironically dumping quality emerging market (“EM”) stocks, EM smaller company shares, and especially punishing peripheral markets like Turkey, Argentina, and to a lesser extent Brazil, which were hit by large currency swings. We are widely diversified, with roughly 125 longs and 75 shorts across most markets, so there are no major blow ups. Our worst seven performing stocks, based on active weights, cost us 333 basis points (“bps”), the worst being 81 bps. These small-cap losers were in Brazil (2), Turkey (2), South Africa, Argentina, and India. The short side only matched the benchmark, whereas it normally falls more in a declining market, as it did in 2015. Finally, we had fewer
51
| JNL Multi-Manager Alternative Fund Jackson National Asset Management, LLC (Unaudited) |

short ideas given the relatively attractive valuations in EM at the start of the year, so our relative exposure was 64% net long for the year. In addition, value faced a difficult year.
DoubleLine Capital LP (“DoubleLine”)
For the Fund’s allocation to the relative value strategy, DoubleLine invests in fixed-income instruments and other investments with no limit on the duration of the strategy. At December 31, 2018, the Fund’s allocation to this strategy was 12.8%.
The strategy has a duration of approximately 4.4 years and a weighted average life of 5.9 years. It is composed of 22% agency residential mortgage-backed securities (“MBS”), 63% securitized credit, and 6% non-securitized credit. The strategy yields about 4.7%. The U.S. Treasury curve has rallied since August with two-year and 10-year yields down 12 basis points (“bps”) and 19 bps, respectively. Therefore, agency MBS were the largest drivers of performance as the rate move benefitted valuations for longer duration securities. The macro volatility during the fourth quarter resulted in spread widening and declining valuations for credit sectors. While total return was negative for most securitized and non-securitized sectors, robust interest income partially offset some of these losses. Spread widening across securitized products has largely been the result of macro volatility as opposed to any fundamental changes. This could provide for better entry points for new investments with a continued focus on bonds that offer high risk adjusted yields.
First Pacific Advisors, LLC (“First Pacific”)
For the Fund’s allocation to the contrarian value equity long/short strategy, First Pacific invests in common and preferred stocks, convertible securities and corporate, high yield and government debt. At December 31, 2018, the Fund’s allocation to this strategy was 8.8%.
First Pacific pursues a contrarian value strategy that seeks to identify absolute value opportunities across the capital structure and across market capitalizations, geographies and sectors, with the long term objective of achieving equity like rates of return with less risk than broad equity markets, all while avoiding the permanent impairment of capital.
During the course of 2018, long positions in various fixed income securities across Puerto Rico’s capital structure, Microsoft Corp., Broadcom Corp., Esterline Technologies Corp., and Aon Corp. contributed approximately 5% to gross performance in the sleeve. Meanwhile, American International Group Inc. (“AIG”), Jefferies Finance LLC, Arconic Inc., Baidu.com, and JD.com Inc. detracted approximately 6.7% from gross performance in the sleeve. As one of the largest equity holdings in the strategy, First Pacific’s strategy managers believe AIG shares represent good value based on current operations and are hopeful that new management will meaningfully improve the company’s return on equity.
Invesco Advisers, Inc. (“Invesco”)
For the Fund’s allocation to the U.S. equity long/short strategy, Invesco invests in U.S. stocks. At December 31, 2018, the Fund’s allocation to this strategy was 11.3%.
The strategy underperformed its benchmark in 2018. U.S. equity markets ended 2018 lower, following a dismal fourth quarter which saw most large cap indices fall over 9% in December alone. In an environment frequently driven by high dispersion and wide month to month performance swings, investors’ risk appetites generally fluctuated with macroeconomic shifts and changing political dynamics. Following a year in which growth seemed the sole focus of U.S. investors, both valuation and quality were more significant factors in 2018, with quality increasingly rewarded as the year closed, benefiting those willing to stay the course.
The strategy seeks to generate a positive return and manages risk by pairing long and short equity positions within their industry. In aggregate, the strategy’s return is positive when the longs perform better than the shorts, regardless of the direction of the market.
In 2018 the strategy returns were positive in energy, consumer staples and communication services, as the long holdings outpaced the shorts. However, this was not enough to offset the negative spread in financials, industrials and materials. Most of the negative return in financials, industrials and materials occurred in the fourth quarter, when the longs declined more than the shorts. Within energy, the strategy benefited from the longs outpacing the shorts in the third quarter, while in consumer staples, performance was strong in the fourth quarter as the shorts declined more than our long holdings.
Since its inception in April 2015, the strategy has delivered an attractive return/risk tradeoff with positive performance and low equity risk over the three plus year horizon.
Lazard Asset Management LLC (“Lazard”)
For the Fund’s allocation to the relative value strategy, Lazard invests in preferred securities, equity and debt convertible securities, with the objective of current income, long term capital appreciation. At December 31, 2018, the Fund’s allocation to this strategy was 9.6%.
Following a fairly subdued volatility backdrop in 2017, risk assets experienced numerous, significant repricings throughout 2018. On three occasions, the S&P 500 Index experienced a drawdown of greater than 10%, including the recent December drawdown of -16.6%. High yield credit spreads, as measured by the Bank of America Merrill Lynch Cash High Yield Index, traded in a relatively tight range for most of the year, before widening to a multiyear high of approximately 530 basis points by year end. The convertible basis was volatile and ended the year largely mixed. Volatility sensitive profiles were well supported, while credit sensitive bonds, which were well supported for most of the period, closed the year on a weaker note. Both long only (directional) and hedge fund investors were active, as were nontraditional investors, particularly during periods in which risk was for sale. Risk appetite varied throughout the year, and mirrored global growth expectations, which initially were very constructive, but weakened markedly in the fourth quarter. Geopolitical events, trade tariff deliberations, Chinese growth prospects, central bank policies, recession fears and the path of global interest rates, among other things, were significant sources of volatility. European, Japanese and the U.S. sovereign yields were particularly volatile. For instance, the U.S. Treasury 10-year yield traded in a range of 2.40% – 3.24% and ended the year at 2.68%. Convertible new issuance exceeded $74 billion globally, well above last year’s level. In our view, the current landscape – low absolute and relative credit spreads, and elevated single name volatility – bodes well for continued strong levels of global primary market activity. Looking ahead, the recent increase in volatility, lower absolute bond prices, attractive yield/premium relationships and a supportive backdrop for credit, make convertibles still compelling in our view, on a relative and absolute basis.
Loomis, Sayles & Company, L.P. (“Loomis”)
For the Fund’s allocation to the equity long/short strategies, Loomis invests in equity securities of all market capitalization. At December 31, 2018, the Fund’s allocation to Loomis was 10.8%.
The strategy posted positive returns during the period April 30, 2018 through December 31, 2018. The strategy’s short positions in Nvidia Corp., Best Buy Co. Inc., Micron
52
| JNL Multi-Manager Alternative Fund Jackson National Asset Management, LLC (Unaudited) |

Technology Inc. and Pandora Media Inc., as well as a long position in Regeneron Pharmaceuticals Inc., were among the top contributors to performance during the period. The strategy’s long positions in Schlumberger Ltd., Alibaba Group Holding Ltd., Facebook Inc. and AMBEV SA, as well as a short position in Burlington Stores Inc., were among the largest detractors from performance during the period.
The strategy’s investment process is characterized by bottom-up, fundamental research and a long term investment time horizon.
The strategy’s objective is to generate attractive long term absolute positive returns regardless of market direction by capturing long and short alpha insights in a hedged vehicle to deliver equity like returns with below market beta and volatility.
We are an active long/short equity manager with a long term, private equity approach to investing in public markets. Our proprietary bottom-up research framework represents our longstanding insights about markets and investing. The cornerstone of our investment decision-making process, it drives long and short security selection.
Westchester Capital Management, LLC (“Westchester”)
For the Fund’s allocation to the merger arbitrage and event driven strategy, Westchester employs a merger arbitrage strategy that invests in the common stock, preferred stock, corporate debt, derivatives, total return swaps and contracts for differences and, occasionally, warrants of companies which are involved in publicly announced mergers, takeovers, tender offers, leveraged buyouts, spin offs, liquidations and other corporate reorganizations. At December 31, 2018, the Fund’s allocation to this strategy was 13.6%.
While macro factors influence the strategy, our investment returns are primarily driven by outcomes of corporate events. The top contributors included Sky PLC/Twenty-First Century Fox Inc. (“Twenty-First Century Fox”), Twenty-First Century Fox/Walt Disney Co. and Time Warner Inc. /AT&T Inc.; while the biggest detractors were NXP Semiconductors NV/QUALCOMM Inc., Huntsman Corp. and Tribune Media Co./Sinclair Broadcast Group Inc. We ended the year with 90 positions and were approximately 94% invested.
While concern about continued changes in the regulatory environment, an uncertain political landscape and, most importantly, early indicators of an economic downturn may cause investors to be more cautious, we believe the key drivers of many deals in 2018 – that corporate and private equity investors continue to have record access to capital, have strong cash reserves along with ready access to financing – provide significant support for transaction activity in the year ahead.
We do not typically sell naked short options, nor do we speculate via long options, so the positions listed here generally reflect long equity positions with options written against them via long puts on the underlying or a highly correlated index/exchange traded funds.
We use derivatives to either hedge directional exposure of underlying long positions or arbitrage situations, or to reduce the correction of an underlying equity position. Derivatives slightly contributed to strategy performance during the year.
Western Asset Management Company, LLC (“Western Asset”)
For the Fund’s allocation to the global macro strategy, Western Asset invests in fixed income securities. At December 31, 2018, the Fund’s allocation to this strategy was 11.0%.
Emerging markets (“EM”) foreign exchange was the largest detractor, mainly as a result of long Argentine Peso, Russian Ruble and Turkish Lira as these currencies weakened versus U.S. Dollar. Duration/curve positioning detracted modestly on a net basis as the negative effect of short German rate exposures offset the positive effect of overall long U.S. duration. Investment grade credit detracted, mainly due to financials, energy and consumer non-cyclicals. High yield was a modest detractor, mainly due to financials and energy. Peripheral Europe helped, mainly due to long 10-year Italian Treasuries. EM debt was beneficial on a net basis, as the positive effect of exposure to Brazilian rates more than offset the negative effect of Mexican rate exposure.
The strategy used a number of derivative instruments to implement its positioning. Eurodollar and U.S. Federal Reserve Fund futures, futures on U.S., Canadian, French, German, Italian, UK, Japanese and Australian Treasuries, options on U.S., French, German, Italian and UK Treasury futures, as well as interest rate swaps, were used to manage duration/curve positioning and contributed. Forward foreign currency contracts, futures and options were utilized to manage currency positioning and detracted. Single-name and index credit default swaps and swaptions on credit default swap indices were used to tactically manage the Fund’s sector exposures and detracted.
53
| JNL Multi-Manager International Small Cap Fund Jackson National Asset Management, LLC (Unaudited) |

Composition as of December 31, 2018: | ||
Industrials | 24.9 | % |
Financials | 12.7 | |
Information Technology | 11.5 | |
Health Care | 11.4 | |
Consumer Discretionary | 9.3 | |
Consumer Staples | 8.7 | |
Materials | 5.8 | |
Real Estate | 5.2 | |
Energy | 3.6 | |
Communication Services | 2.8 | |
Utilities | 0.7 | |
Warrants | 0.7 | |
Other Short Term Investments | 2.7 | |
Total Investments | 100.0 | % |
Total Return |
| |||||
Class A‡ |
|
|
| Class I† |
|
|
Since Inception | -19.20 | % | Since Inception | -19.10 | % | |
‡Inception date August 13, 2018 |
| |||||
†Inception date August 13, 2018 |
| |||||
Past performance is not predictive of future performance. Investment return and principal value will fluctuate so that an investor’s shares, when redeemed, may be worth more or less than their original cost. Performance numbers are net of all Fund operating expenses, but do not reflect the deduction of insurance charges. | ||||||
The JNL Multi-Manager International Small Cap Fund seeks to achieve its investment objective by allocation to international small capitalization strategies managed by unaffiliated Sub-Advisers. Each Sub-Adviser may use different investment strategies in managing the Fund, acts independently from the others, and uses its own methodology for selecting investments. The Adviser (“JNAM”) is responsible for selecting the Fund’s investment strategies and for determining Fund assets allocated to each Sub-Adviser.
For the period August 13, 2018 through December 31, 2018, JNL Multi-Manager International Small Cap Fund underperformed its benchmark by posting a return of -19.20% for Class A shares compared to -14.67% for the MSCI All Country World Index ex USA Small Cap USD Index (Net).
Both sleeves underperformed the benchmark in the period following the Fund’s inception in August through the end of the year. WCM (-21.70%) performed relatively worse as their growth style was a headwind late in the year and stock selection detracted from results. Causeway (-16.90%) also trailed the benchmark due in part to an overweight to energy and poor selection elsewhere.
Causeway Capital Management LLC (“Causeway”)
At December 31, 2018, the Fund’s allocation to Causeway was 51.4%.
The strategy’s holdings in industrials, real estate and consumer staples detracted from relative performance, offset by holdings in financials and information technology, as well as an underweight position in consumer discretionary. The largest detractors were construction company Implenia AG, electronic components manufacturer Taiyo Yuden Co. Ltd. and paper products manufacturer Canfor Pulp Products Inc. The top contributors to return were electronics manufacturer Radiant Opto-Electronics Corp., financial services company Banco do Estado do Rio Grande do Sul SA, and automobile services provider Bilia AB.
Value factors receive the largest weight on average in the alpha model. The strategy’s managers believe that the current valuation premium of smaller cap growth stocks versus value stocks is unsustainable, especially against the backdrop of increasing global interest rates. The MSCI All Country World Index ex USA Small Cap Growth Index (Net) trades at a 39% premium to the MSCI All Country World Index ex USA Small Cap Value Index (Net), on a forward price to earnings basis, well above the 27% average premium over the last 15 years. We believe this growth premium supports our active exposure to value. The outlook for smaller cap equities remains favorable in our view. Smaller cap equities currently exhibit a higher long term earnings per share growth trend than larger cap equities. Additionally, international smaller cap equities have exhibited greater valuation dispersion than larger cap equities on both a forward earnings yield basis and a price to book value basis, indicating more information content in valuation ratios for these equities. This characteristic has allowed us to construct a strategy with lower valuation ratios relative to the benchmark without, in our view, compromising quality. The strategy combines the flexibility and breadth of quantitative analysis with our global industry knowledge, which we believe will benefit long term investors.
WCM Investment Management LLC (“WCM”)
At December 31, 2018, the Fund’s allocation to WCM was 48.6%.
Looking at attribution by sector, the primary detractors to returns included negative stock selection in consumer discretionary, communication services and information technology sectors.
Looking at attribution by geography, the primary detractors to returns included negative stock selection in Japan and the UK.
The fourth quarter of 2018 marked a volatile and difficult quarter for the broader equity markets but even more so for international small cap stocks. The international small cap asset class saw meaningful pressure this quarter as broader equity market selling was amplified by the asset class’ lower liquidity.
While macro and geopolitical challenges have cast increased volatility in the markets, causing valuations to come down meaningfully, our investment holdings have seen limited impact in their fundamental outlooks. As a result, we are increasingly confident in the outlook for these businesses with positive moat trajectories, healthy balance sheets and strong cultures.
54
| JNL Multi-Manager Mid Cap Fund Jackson National Asset Management, LLC (Unaudited) |

JNL Multi-Manager Mid Cap Fund
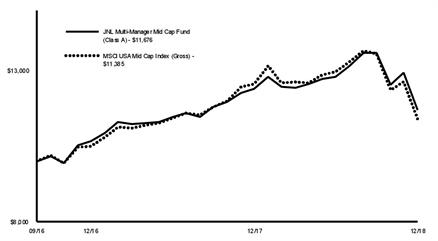
Average Annual Total Returns |
| |||||
Class A‡ |
|
|
| Class I† |
|
|
1 Year | -5.70 | % | 1 Year | -5.45 | % | |
Since Inception | 7.03 |
|
| Since Inception | 0.45 |
|
‡Inception date September 19, 2016 |
| |||||
†Inception date September 25, 2017 |
| |||||
The graph shows the change in value of an assumed $10,000 investment in the Fund's Class A shares over 10 years, or since inception if the inception is less than 10 years, as well as the Fund's benchmark(s) performance for the same period.
Past performance is not predictive of future performance. Investment return and principal value will fluctuate so that an investor’s shares, when redeemed, may be worth more or less than their original cost. Performance numbers are net of all Fund operating expenses, but do not reflect the deduction of insurance charges.
Composition as of December 31, 2018: | ||
Information Technology | 19.1 | % |
Industrials | 15.2 | |
Financials | 14.9 | |
Health Care | 13.3 | |
Consumer Staples | 9.2 | |
Consumer Discretionary | 8.6 | |
Materials | 5.2 | |
Real Estate | 4.7 | |
Utilities | 2.7 | |
Communication Services | 2.5 | |
Energy | 2.3 | |
Other Short Term Investments | 2.0 | |
Securities Lending Collateral | 0.3 | |
Total Investments | 100.0 | % |
The JNL Multi-Manager Mid Cap Fund seeks to achieve its investment objective by allocation to a variety of mid-capitalization growth and value strategies managed by unaffiliated Sub-Advisers. Each Sub-Adviser may use different investment strategies in managing the Fund, acts independently from the others, and uses its own methodology for selecting investments. The Adviser (“JNAM”) is responsible for selecting the Fund’s investment strategies and for determining Fund assets allocated to each Sub-Adviser.
For the year ended December 31, 2018, JNL Multi-Manager Mid Cap Fund outperformed its benchmark by posting a return of -5.70% for Class A shares compared to -9.37% for the MSCI USA Mid Cap Index (Gross).
Outperformance for the Fund was driven entirely by Champlain. While growth stocks were in favor for much of the year, Champlain (+3.97%) delivered results beyond any benefits from just a style tailwind. Stellar stock selection was the main contributor to outperformance. Clearbridge (-12.66%) was the worst relative performer, hurt by poor stock picks in the consumer discretionary and energy sectors. Victory (-10.03%) slightly underperformed the Fund’s benchmark mainly due to its value approach.
Champlain Investments Partners, LLC (“Champlain”)
At December 31, 2018, the Fund’s allocation to Champlain was 41.7%.
During the year, strong security selection across several sectors contributed to the strategy’s results. The majority of the strategy’s relative performance in information technology was driven by the strategy’s overweight position of the software industry, while stock selection was also a positive contributor. Within financials, the strategy’s continued focus on businesses with diversified revenue streams and expertise in niche market segments produced strong gains. Positive relative performance in health care was driven largely by the strategy’s overweight position to the sector. The strategy’s investment process which overweights in consumer staples and underweights in consumer discretionary, was distinctly positive this year. Between the two sectors, specialty retail and food products industries combined to contribute a significant relative performance. The strategy’s perennial lack of exposure to utilities and real estate slightly detracted from performance.
If we are on the verge of a recession or a bear market for U.S. equities, either would be the most anticipated one of our careers – and by a wide margin. Instead of raising cash, the Fund seized upon the widespread selling and exceptionally attractive discounts to estimated fair values for this strategy’s holdings to become essentially fully invested in the final weeks of the year.
ClearBridge Investments, LLC (“ClearBridge”)
At December 31, 2018, the Fund’s allocation to ClearBridge was 22.8%.
The strategy underperformed its MSCI USA Mid Cap benchmark over the year due to stock selection in consumer discretionary, energy, materials and industrials. Affiliated Managers Group Inc. in financials was the strategy’s largest detractor as the asset manager was hurt by outflows at one of its largest affiliates, while dental supplier Dentsply Sirona Inc. was pressured as new management reduced guidance due to increased spending to reaccelerate growth. The strategy sold out of both positions during the year. Energy equipment supplier Core Laboratories NV sold off on plummeting oil prices and shrinking demand while Alliance Data Systems Corp. was impacted by concerns over consumer credit quality. On the positive side, stock selection in consumer staples and communication services sectors and underweights to energy and materials contributed to results, boosted by strong execution at Xilinx Inc., a maker of programmable chips that target high growth markets like autonomous driving as well as software makers Aspen Technology Inc. and Palo Alto Networks Inc., which help enterprise clients optimize operations and keep their networks secure from cyber threats.
Diversification in attractively priced companies with quality fundamentals across all sectors of the mid cap market is a key characteristic of the strategy. That broad coverage proved constructive as our holdings in consumer discretionary and information technology sectors participated during a strong run up for stocks in the first nine months of the year, while our more defensive holdings in consumer staples and utilities sector held up well during a turbulent fourth quarter. The market correction has driven many blue chip companies to their lowest valuations in several years, and we have a full pipeline of such stocks we are targeting for the strategy.
55
| JNL Multi-Manager Mid Cap Fund Jackson National Asset Management, LLC (Unaudited) |

Victory Capital Management Inc. (“Victory”)
At December 31, 2018, The Fund’s allocation to Victory was 35.5%.
The market experienced bouts of elevated volatility during the period as fears over trade policy, peak margins, moderating economic growth and potential for policy error weighed on sentiment. Specifically, for the strategy, stock selection was the key driver of relative performance while sector allocation modestly detracted. Sector allocation is a byproduct of the bottom-up stock selection process and not a result of top-down tactical decisions. Specifically, stock selection in financials, consumer discretionary, health care, consumer staples and real estate contributed to performance for the year. However, an underweight in real estate coupled with an overweight in consumer staples and health care partially offset the favorable impact from selection. Furthermore, an overweight in information technology was positive, but that was partially offset by unfavorable stock selection in the sector. The strategy’s cash position was also beneficial. Conversely, an underweight in utilities—one of the best performing sectors—was the largest detractor. Stock selection in the energy and industrials also detracted from relative performance.
56
| JNL Multi-Manager Small Cap Growth Fund Jackson National Asset Management, LLC (Unaudited) |

JNL Multi-Manager Small Cap Growth Fund
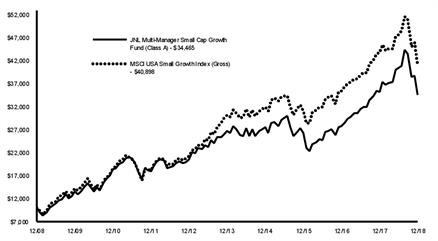
Average Annual Total Returns |
| |||||
Class A |
|
|
| Class I |
|
|
1 Year | -2.05 | % | 1 Year | -1.77 | % | |
5 Year | 5.25 |
|
| 5 Year | 5.49 |
|
10 Year | 13.17 |
|
| 10 Year | 13.41 |
|
The graph shows the change in value of an assumed $10,000 investment in the Fund's Class A shares over 10 years, or since inception if the inception is less than 10 years, as well as the Fund's benchmark(s) performance for the same period.
Past performance is not predictive of future performance. Investment return and principal value will fluctuate so that an investor’s shares, when redeemed, may be worth more or less than their original cost. Performance numbers are net of all Fund operating expenses, but do not reflect the deduction of insurance charges.
Granahan Investment Management, Inc. and Victory RS Investments assumed portfolio management responsibility on September 28, 2015. Chicago Equity Partners was added as an additional Sub-Adviser on July 11, 2016. Kayne Anderson Rudnick Investment Management, LLC replaced LMCG Investments, LLC as a Sub-Adviser and assumed portfolio management responsibilities effective April 30, 2018.
Composition as of December 31, 2018: | ||
Information Technology | 28.0 | % |
Health Care | 19.0 | |
Industrials | 17.3 | |
Consumer Discretionary | 11.5 | |
Financials | 7.7 | |
Communication Services | 3.5 | |
Consumer Staples | 2.9 | |
Materials | 2.0 | |
Energy | 0.9 | |
Real Estate | 0.3 | |
Utilities | 0.1 | |
Securities Lending Collateral | 5.0 | |
Other Short Term Investments | 1.8 | |
Total Investments | 100.0 | % |
JNL Multi-Manager Small Cap Growth Fund seeks to achieve its investment objective by investing in a variety of small cap growth strategies managed by unaffiliated investment managers (“Sub-Advisers”). Each Sub-Adviser may use different investment strategies in managing the Fund, acts independently from the others, and uses its own methodology for selecting investments. The Adviser (“JNAM”) is responsible for selecting the Fund’s investment strategies and for determining Fund assets allocated to each Sub-Adviser.
For the year ended December 31, 2018, JNL Multi-Manager Small Cap Growth Fund outperformed its benchmark by posting a return of -2.05% for Class A shares compared to -6.58% for the MSCI USA Small Growth Index (Gross).
The Fund delivered impressive relative returns amid a challenging year for U.S. small cap stocks. Granahan (+11.77%) delivered double-digit gains thanks to strong stock selection in beating the benchmark by more than 1,800 basis points. Kayne Anderson Rudnick (“KAR”) replaced LMCG Investment Management as a Sub-Adviser on April 30, 2018, and that sleeve was the other standout in beating the benchmark by nearly 900 basis points, with most of the outperformance coming after the transition to KAR. RS Investments (-7.20%) slightly underperformed while Chicago Equity (-11.91%) was the laggard of the group as their quantitative factor exposures struggled to hold up.
Chicago Equity Partners, LLC (“Chicago Equity”)
At December 31, 2018, the Fund’s allocation to Chicago Equity was 14.1%.
Stocks declined in 2018 due to uncertainty over trade, rising rates, and declining earnings expectations for 2019. While parts of the U.S. economy remain strong (2018 gross domestic product expected at just under 3%, unemployment rate remains under 4%, consumer spending strong), business confidence declined, as uncertainty over trade weighs on expectations.
The strategy underperformed in 2018, mostly due to weakness in the fourth quarter as investors shifted out of growth stocks and into value stocks. Growth stocks performed well the first three quarters of 2018, driven by good performance from momentum and growth factors. Then, as risk preference shifted starting early in the fourth quarter, momentum performed poorly as investors sold the winning stocks from earlier in the year. Overall, momentum and growth worked well until the fourth quarter, when quality factors came into focus as markets declined and risk aversion increased.
Expectations in 2019 are for risk aversion to continue, with an increased investor preference for stocks with quality balance sheets and lower volatility. It has been the strategy’s experience that the market rewards a broad set of fundamental factors often, which is why we consistently stick to our disciplined process.
Granahan Investment Management, Inc. (“Granahan”)
Granahan’s small cap advantage strategy invests in stocks of smaller growth oriented companies ranging from micro cap to mid cap. At December 31, 2018, the Fund’s allocation to Granahan was 26.8%.
Most equity markets worldwide had a tough year in 2018, and U.S. small caps were no exception. Amidst this backdrop, the Granahan Small Cap Advantage strategy sleeve posted strong gains for the year, aided by both style and execution.
In 2018, while all three lifecycles outperformed the overall benchmark, pioneer and core growth holdings drove the strategy’s performance.
Top performers represented four sectors and all three lifecycles. Core growth performers included SodaStream International Ltd., Axon Enterprise Inc., and Ensign Group Inc. Healthcare pioneer, Teladoc Health Inc., and special situation technology holding LivePerson Inc., rounded out the top five.
On the negative side, four of the five bottom detractors were from the special situation category: Invacare Corp., Titan Machinery Inc., Modine Manufacturing Co., and Weight Watchers International Inc. Technology pioneer Limelight Networks Inc. rounded out the bottom five contributors.
The year 2018 was jarring for investors, and such a jolt to the markets tends to create opportunities. We at Granahan are not complacent. We continue to seek investment opportunities in the small cap market with a keen focus on strict adherence to the investment process that underpins the
57
| JNL Multi-Manager Small Cap Growth Fund Jackson National Asset Management, LLC (Unaudited) |

strategy, including use of the lifecycle diversification tool, which allows us to uncover growth in all corners of the market and to capitalize on sentiment mispricing.
Kayne Anderson Rudnick Investment Management, LLC (“KAR”)
From the period January 1, 2018 through April 30, 2018 LMCG Investment, LLC was Sub-Adviser of the strategy. LMCG was a small cap growth strategy that invested in common stocks and other equity securities of small cap companies. Despite pockets of volatility in the first quarter, the market had, by and large in this period, continued to focus on company fundamentals rather than macro events or stylistic factors. This was supportive for our strategy, generally speaking. These pockets of volatility also created opportunities for our strategy. Health care was our best sector overall, driven primarily by stock selection in biotechnology. Strong selection in software and semiconductors helped in information technology, along with our overweight to the sector. Underweights in real estate and energy also helped relative returns in the period. Stock selection in industrials and consumer discretionary (concentrated mainly in our media holdings) detracted from performance this quarter.
Effective April 30, 2018 KAR took over as Sub-Adviser of the strategy.
At December 31, 2018, the Fund’s allocation to KAR was 17.8%.
The strategy outperformed its benchmark during the period. The U.S. equity market generated positive returns in the second and third quarters, but those gains were largely wiped out by sharp selloffs during the fourth quarter amid heightened volatility. In this environment, the equity sleeve ended the period essentially flat, versus a middle single digit loss by the benchmark. Outperformance was driven largely by strong stock selection in consumer discretionary and producer durables, while gains were slightly offset by underweights in real estate investment trusts and utilities.
The global equity market has just closed a challenging quarter and year, with not much clarity into the future. A disconnect remains between the market and the U.S. Federal Reserve in projecting growth, and global trade conflicts persist. Some resolution around these issues could help bring about stability in the markets. With the meaningful price declines in various asset classes over the past three months, we anticipate it will take some time to restore confidence among investors and that companies will need to prove that they can deliver positive earnings growth even in a slower growth economy.
Victory RS Investments (“RS Investments”)
RS Investment’s custom growth strategy invests in small and mid-capitalization companies. As of December 31, 2018, the Fund’s allocation to RS Investments was 48.9%. RS slightly underperformed the MSCI USA Small Growth Index for the year. Positive contribution came from stock selection within information technology (“IT”), with positive results also coming from materials, health care and financial services. Stock selection in consumer discretionary and producer durables offset to that positive relative performance.
Within IT, contributors included RingCentral Inc. (“RingCentral”), a provider of software as a service solution for businesses to support modern communications. RingCentral’s outperformance was driven by strong execution, as the company reported revenue up 32% year over year with wide gross margins, leading to earnings that grew 46% year over year in the most recent quarter and easily beat expectations.
Within financial services, outperformance was driven by an investment in Euronet Worldwide Inc., a payment and transaction processing company that provides distribution solutions to financial institutions, retailers, service providers and individual consumers worldwide. The stock performed well in 2018, driven by a 29% increase in operating income as the company continues to execute.
Producer durables proved to be a challenging sector in 2018, driven by underperformance in holding Herc Holdings Inc. (“Herc”). Herc operates as an equipment rental supplier and was under significant pressure over concerns of a renewed industrial recession. Despite strong execution by Herc, highlighted by a 14% increase in Earnings Before Interest, Taxes, Depreciation and Amortization year over year, the stock sold off on fears earnings represented a cyclical peak.
58
| JNL Multi-Manager Small Cap Value Fund Jackson National Asset Management, LLC (Unaudited) |

JNL Multi-Manager Small Cap Value Fund
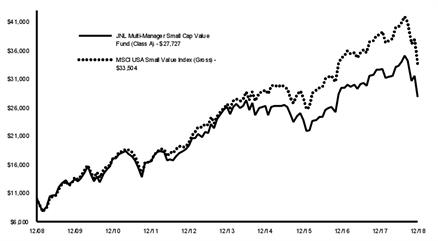
Average Annual Total Returns |
| |||||
Class A |
|
|
| Class I |
|
|
1 Year | -14.77 | % | 1 Year | -14.53 | % | |
5 Year | 1.22 |
|
| 5 Year | 1.44 |
|
10 Year | 10.74 |
|
| 10 Year | 10.96 |
|
The graph shows the change in value of an assumed $10,000 investment in the Fund's Class A shares over 10 years, or since inception if the inception is less than 10 years, as well as the Fund's benchmark(s) performance for the same period.
Past performance is not predictive of future performance. Investment return and principal value will fluctuate so that an investor’s shares, when redeemed, may be worth more or less than their original cost. Performance numbers are net of all Fund operating expenses, but do not reflect the deduction of insurance charges.
Congress Asset Management Company LLP, Chicago Equity Partners, LLC, Cooke & Bieler L.P. and Cortina Asset Management, LLC assumed portfolio management responsibility on September 28, 2015. WCM Investment Management, LLC replaced PPM America, Inc. as a Sub-Adviser and assumed portfolio management responsibilities effective August 13, 2018.
Composition as of December 31, 2018: | ||
Financials | 20.4 | % |
Industrials | 19.2 | |
Consumer Discretionary | 13.0 | |
Information Technology | 9.7 | |
Real Estate | 8.7 | |
Health Care | 6.0 | |
Utilities | 5.5 | |
Materials | 5.1 | |
Energy | 2.8 | |
Consumer Staples | 1.4 | |
Communication Services | 1.4 | |
Securities Lending Collateral | 4.5 | |
Other Short Term Investments | 2.3 | |
Total Investments | 100.0 | % |
JNL Multi-Manager Small Cap Value Fund seeks to achieve its investment objective by investing in a variety of small cap value strategies managed by unaffiliated investment managers (“Sub-Advisers”). Each Sub-Adviser may use different investment strategies in managing the Fund, acts independently from the others, and uses its own methodology for selecting investments. The Adviser (“JNAM”) is responsible for selecting the Fund’s investment strategies and for determining Fund assets allocated to each Sub-Adviser.
For the year ended December 31, 2018, JNL Multi-Manager Small Cap Value Fund underperformed its benchmark by posting a return of -14.77% for Class A shares compared to -13.34% for the MSCI USA Small Value Index (Gross).
Three of the five Sub-Advisers underperformed the benchmark amid a challenging year for small-value equities. Cooke & Bieler (-11.69%) was the best performer in beating the benchmark by 166 basis points. In August, WCM Investment Management replaced PPM America as the fifth Sub-Adviser of the Fund and outperformed the benchmark by nearly 400 basis points through year end. On the negative side, Chicago Equity Partners (-16.73%) was the worst performer as their quantitative factor exposures failed to add to performance over the benchmark in the year. Congress (-16.26%) and Cortina (-15.92%) also underperformed by nearly 300 basis points each.
Congress Asset Management Company LLP (“Congress”)
At December 31, 2018, the Fund’s allocation to Congress was 17.3%.
Equity markets were dominated by uncertainty as 2018 drew to a close. The idyllic environment we enjoyed through September seems a distant memory even as spending, income and wages all increased more than 4% in November, a rare trifecta.
Stock selection was a key driver of our relative performance and was positive in real estate and industrials but negative in materials and energy. The best performing sector in the Russell 2000 Index was utilities which returned -2.3% followed by consumer staples which returned -14.2%. Positive stock selection in information technology sector was led by strong earnings from Tech Data Corp. and Finisar Corp. who received a takeover bid from II-VI Inc. Negative stock selection in materials and energy detracted from performance and was driven by Superior Energy Services Inc. and Matador Resources Co.
Looking ahead, as uncertainty and volatility came back to the forefront of investors’ concerns we are looking for opportunities to invest in well positioned companies whose shares do not accurately reflect intrinsic value.
Chicago Equity Partners, LLC (“Chicago Equity”)
At December 31, 2018, the Fund’s allocation to Chicago Equity was 25.7%.
Stocks declined in 2018 due to uncertainty over trade, rising rates, and declining earnings expectations for 2019. While parts of the U.S. economy remain strong (2018 gross domestic product expected at just under 3%, unemployment rate remains under 4%, consumer spending strong), business confidence declined, as uncertainty over trade weighs on expectations.
The strategy underperformed in 2018, due to weakness during the risk on second and third quarters. In the second quarter, investors shifted from large cap stocks with greater exposure to trade wars into low quality, cheap small cap companies less impacted by trade. In the third quarter, as stocks hit new highs, investors overpaid for growth and value suffered. Overall, 2018 was a volatile year for equities and factors. Momentum and growth factors reversed throughout the year as risk preference shifted. Value factors were particularly weak, posting one of the worst calendar years of performance in almost three decades.
Expectations in 2019 are for risk aversion to continue, with an increased investor preference for stocks with quality balance sheets and lower volatility. It has been our experience that the market rewards a broad set of fundamental factors often, which is why we consistently stick to our disciplined process.
Cooke & Bieler, L.P. (“Cooke & Bieler”)
At December 31, 2018, the Fund’s allocation to Cooke & Bieler was 28.4%.
While sector allocation decisions contributed to the strategy’s excess return,
59
| JNL Multi-Manager Small Cap Value Fund Jackson National Asset Management, LLC (Unaudited) |

stock selection drove most of its positive relative result. The strategy benefitted from an underweight in energy and overweight in consumer discretionary, which more than offset the negative impact of an underweight in utilities and overweight in materials. Stock selection was particularly strong in the consumer discretionary and financials sectors. Top individual contributors included Helen of Troy Ltd., NOW Inc., Fox Factory Holding Corp., FirstCash Inc. and Malibu Boats Inc. Detractors included Schweitzer-Mauduit International Inc., Quanex Building Products Corp., Winnebago Industries Inc., Colfax Corp. and Air Lease Corp.
Among the major style indices, valuations for small cap value stocks contracted by the greatest margin in 2018. With the strategy trading at a discount to the Index, not only do we now view valuation as a likely positive factor in the absolute return equation, but we also remain confident in the strategy’s relative prospects in 2019.
Cortina Asset Management, LLC (“Cortina”)
At December 31, 2018, the Fund’s allocation to Cortina was 17.8%.
For 2018, the strategy’s defensive bias caused relative performance to lag in the first half of the year as the market continued towards new highs despite multiple indications of slowing economic trends in macroeconomic data and anecdotal evidence of slowing consumer demand for housing. While returns were negative for the full year, relative performance improved during the second half as equity markets recognized the developing slowdown and corrected sharply, particularly in the fourth quarter. From a relative performance standpoint, the strategy benefitted from holdings within consumer staples, utilities and real estate sectors, while allocations to financials and health care hindered the strategy’s results.
Our current outlook is that the data continue to indicate further softness in the economy to come. We expected the fourth quarter earnings reports to be generally decent but would be accompanied by disappointing outlooks. In an ideal world, the market will decline – we are buyers. We would repeat what we have stated before: value investing is episodic. In the face of market declines, should they occur, we expect to rotate capital away from our current overweight in utilities and into very inexpensive cyclicals, consumer companies, and, at the right price, energy companies.
WCM Investment Management, LLC (“WCM”)
From the period January 1, 2018 through August 13, 2018, PPM America, Inc. was Sub-Adviser of the strategy.
The strategy had underperformed the benchmark for the period, having significantly trailed the benchmark during the first quarter before recovering into the second quarter and onwards into July. Stock selection within consumer discretionary was the main detractor from performance with Tupperware Brands Corp. and Sketchers USA Inc. among the notable decliners. Performance of financials eventually became a detractor despite a strong first half of the year as a holding in asset manager Janus Henderson Group Plc struggled, offsetting positive results from the energy space.
Effective August 13, 2018, WCM took over as Sub-Adviser of the strategy.
At December 31, 2018, the Fund’s allocation to WCM was 10.8%.
Looking at attribution by sector, contributors to returns included strong stock selection in consumer discretionary and health care. Additionally, an overweighting in information technology and avoidance of the poor performing energy and materials aided performance against our benchmark.
The primary detractors from returns included our relative lack of real estate and utilities holdings, which were two of the best performing sectors in the benchmark. Stock selection in industrials, consumer staples and financials were minor detractors from returns.
We do not attempt to forecast macro events, as this seems a difficult and futile exercise. We are encouraged, however, at the valuation levels we see from a number of our strategy and elite list companies. As high quality, successful businesses get cheaper, we get more excited about the prospects for future returns.
We do not utilize derivatives as part of our investment process; accordingly, they were not used in our sleeve of the Fund during the above time period.
60
| JNL/Neuberger Berman Strategic Income Fund Neuberger Berman Investment Advisers LLC (Unaudited) |

JNL/Neuberger Berman Strategic Income Fund
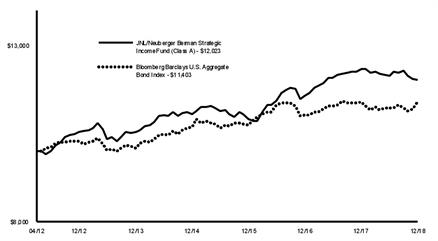
Average Annual Total Returns |
| |||||
Class A‡ |
|
|
| Class I† |
|
|
1 Year | -2.54 | % | 1 Year | -2.12 | % | |
5 Year | 2.69 |
|
| 5 Year | 2.96 |
|
Since Inception | 2.80 |
|
| Since Inception | 3.05 |
|
‡Inception date April 30, 2012 |
| |||||
†Inception date April 30, 2012 |
| |||||
The graph shows the change in value of an assumed $10,000 investment in the Fund's Class A shares over 10 years, or since inception if the inception is less than 10 years, as well as the Fund's benchmark(s) performance for the same period.
Past performance is not predictive of future performance. Investment return and principal value will fluctuate so that an investor’s shares, when redeemed, may be worth more or less than their original cost. Performance numbers are net of all Fund operating expenses, but do not reflect the deduction of insurance charges.
Composition as of December 31, 2018: | ||
U.S. Government Agency MBS | 26.3 | % |
Government Securities | 20.4 | |
Financials | 13.3 | |
Non-U.S. Government Agency ABS | 10.4 | |
Energy | 5.4 | |
Communication Services | 4.2 | |
Health Care | 2.7 | |
Information Technology | 2.2 | |
Industrials | 2.2 | |
Consumer Staples | 1.9 | |
Materials | 1.9 | |
Consumer Discretionary | 1.5 | |
Utilities | 1.5 | |
Real Estate | 0.3 | |
Other Short Term Investments | 4.1 | |
Securities Lending Collateral | 1.7 | |
Total Investments | 100.0 | % |
For the year ended December 31, 2018, JNL/Neuberger Berman Strategic Income Fund underperformed its benchmark by posting a return of -2.54% for Class A shares compared to 0.01% for the Bloomberg Barclays U.S. Aggregate Bond Index.
Throughout the year, the Fund maintained an emphasis on diversified exposure to spread sectors and a short duration position relative to its benchmark.
Security selection within U.S. investment grade credit and exposure to noninvestment grade credit were main detractors over the year. U.S. investment grade and noninvestment grade credit spreads widened over the fourth quarter, driven primarily by equity weakness and concerns stemming from select idiosyncratic events. The Fund’s duration underweight also negatively impacted performance, as U.S. rates rallied sharply in the fourth quarter after selling off for most of 2018. Exposure to hard currency emerging market debt further detracted, as global growth concerns and geopolitical risk factors weighed heavily on the sector in the second half of the year.
Over the year, the Fund reduced its exposure to floating rate bank loans and non-agency mortgage-backed securities; a decision driven primarily by valuations and some structural concerns within the sectors. The Fund selectively added exposure to hard currency emerging market debt, investment grade credit, asset-backed securities and credit risk transfers; decisions centered chiefly on relative value assessments.
The Fund selectively utilized U.S. Treasury futures, interest rate futures and interest rate swaps throughout the year to help manage the duration and curve exposure of the Fund.
The investment objective of the Fund over the year, and going forward, remains consistent with its prospectus objective: to seek high current income with a secondary objective of long term capital appreciation.
61
| JNL/Oppenheimer Emerging Markets Innovator Fund OppenheimerFunds, Inc. (Unaudited) |

JNL/Oppenheimer Emerging Markets Innovator Fund
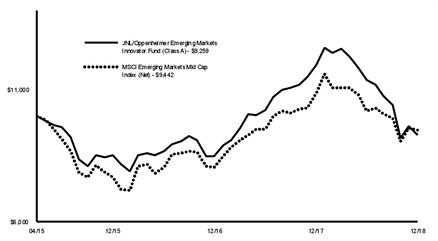
Average Annual Total Returns |
| |||||
Class A‡ |
|
|
| Class I† |
|
|
1 Year | -22.44 | % | 1 Year | -22.25 | % | |
Since Inception | -2.07 |
|
| Since Inception | -13.88 |
|
‡Inception date April 27, 2015 |
| |||||
†Inception date September 25, 2017 |
| |||||
The graph shows the change in value of an assumed $10,000 investment in the Fund's Class A shares over 10 years, or since inception if the inception is less than 10 years, as well as the Fund's benchmark(s) performance for the same period.
Past performance is not predictive of future performance. Investment return and principal value will fluctuate so that an investor’s shares, when redeemed, may be worth more or less than their original cost. Performance numbers are net of all Fund operating expenses, but do not reflect the deduction of insurance charges.
Composition as of December 31, 2018: | ||
Consumer Discretionary | 21.9 | % |
Information Technology | 20.0 | |
Health Care | 15.8 | |
Financials | 12.6 | |
Industrials | 10.5 | |
Consumer Staples | 7.5 | |
Materials | 2.3 | |
Real Estate | 1.0 | |
Other Short Term Investments | 5.4 | |
Securities Lending Collateral | 3.0 | |
Total Investments | 100.0 | % |
For the year ended December 31, 2018, JNL/Oppenheimer Emerging Markets Innovator Fund underperformed its benchmark by posting a return of -22.44% for Class A shares compared to -13.11% for the MSCI Emerging Markets Mid Cap Index (Net).
The Fund’s underperformance versus the benchmark stemmed largely from stock selection in consumer discretionary, information technology and materials. The Fund outperformed in real estate, due to our underweight position.
After a year of extraordinary outperformance in 2017, emerging market (“EM”) equities have been challenged in 2018. This year has brought heightened anxiety about a trade war with China, concerns about the outcome of pivotal elections, and a shifting monetary policy landscape.
Top performing stocks for the Fund this period included Fila Korea Ltd. (“Fila Korea”), Celltrion Inc. (“Celltrion”), and Linx SA (“Linx”). We expect to see continued growth from Fila Korea as they continue reviving the brand through collaborative efforts. Celltrion was among the first companies to get European or U.S. Food and Drug Administration approvals for its versions of blockbuster biologic drugs. Linx nearly doubled its share price in the fourth quarter as the company benefited from both an improved optimism around Brazil’s retailing industry after the presidential election, as well as from its recently announced FinTech Acquisition Corp. III initiatives.
The top detractors from Fund performance included My EG Services Bhd (“My EG”), AAC Technologies Holdings Inc. (“AAC Technologies”), and Beauty Community PCL (“Beauty Community”). My EG was our biggest single detractor in the second quarter of 2018 on the back of rumors that the company was too closely aligned with the defeated Najib Razak government. Beauty Community is a Thai skincare and cosmetics company. Between 25% to 35% of sales are from China. Beauty Community’s sell down in the fourth quarter of 2018 was due to slower growth in Chinese tourists visiting Thailand and the announcement by the Chinese government that it will limit travelers’ ability to buy foreign products and import them into China to sell. Long term we believe that demand for Beauty Community’s products will continue to ramp up. AAC Technologies is an electronic components company with a leading business in acoustics and haptics for smart devices. AAC Technologies has come under pressure as the iPhone 8 release was weaker than expected and as rising competition in Apple’s supplier market heats up. AAC Technologies continues to grow its customer base in the Android market, which we believe should help offset sluggish iPhone sales. The EM universe has changed. It now provides investors with more choices and allows them to be better positioned for structural growth. This evolution has not been fully captured by the indices, which are market cap weighted and, therefore, backward looking.
62
| JNL/Oppenheimer Global Growth Fund Oppenheimer Funds, Inc. (Unaudited) |

JNL/Oppenheimer Global Growth Fund

Average Annual Total Returns |
| |||||
Class A |
|
|
| Class I |
|
|
1 Year | -13.21 | % | 1 Year | -12.97 | % | |
5 Year | 4.58 |
|
| 5 Year | 4.81 |
|
10 Year | 10.89 |
|
| 10 Year | 11.11 |
|
The graph shows the change in value of an assumed $10,000 investment in the Fund's Class A shares over 10 years, or since inception if the inception is less than 10 years, as well as the Fund's benchmark(s) performance for the same period.
Past performance is not predictive of future performance. Investment return and principal value will fluctuate so that an investor’s shares, when redeemed, may be worth more or less than their original cost. Performance numbers are net of all Fund operating expenses, but do not reflect the deduction of insurance charges.
Composition as of December 31, 2018: | ||
Information Technology | 20.5 | % |
Industrials | 15.5 | |
Consumer Discretionary | 14.8 | |
Health Care | 14.5 | |
Financials | 13.5 | |
Communication Services | 12.4 | |
Consumer Staples | 4.1 | |
Real Estate | 2.1 | |
Energy | 0.7 | |
Securities Lending Collateral | 1.1 | |
Other Short Term Investments | 0.8 | |
Total Investments | 100.0 | % |
For the year ended December 31, 2018, JNL/Oppenheimer Global Growth Fund underperformed its benchmark by posting a return of -13.21% for Class A shares compared to -9.42% for the MSCI All Country World Index (Net).
Volatility returned to global equity markets in 2018, as trade tariffs, rising interest rates, and politics, yielded a challenging environment. Against this backdrop, the Fund underperformed its benchmark. The most significant underperforming sectors for the Fund were health care, financials, consumer discretionary, and real estate. The Fund outperformed its benchmark in information technology due to stock selection and in materials, where we have no exposure.
Top contributors to performance this period included Adobe Inc. (“Adobe”), Intuit Inc. (“Intuit”), and Kering SA (“Kering”). Adobe has risen by more than fourfold over the last five years as they have made a major shift to a subscription based economic model. This model is preferred by many customers as it offers no meaningful upfront costs, license flexibility, and seamless updates. Intuit’s small business and tax platforms, QuickBooks and TurboTax, continued to gain share. Kering continued the resurgence in its operations, which began in the middle of 2016. Gucci Group NV’s resurgence as a desirable brand has driven significant growth in sales and profits, and we believe it remains relevant for future growth as well. The most significant detractors from performance this period included JD.com Inc. (“JD.com”), Citigroup Inc. (”Citigroup”), and Facebook Inc. (“Facebook”). JD.com has had a difficult year. As the number two player in Chinese e-commerce, we believe it has immense long term potential. However, it has struggled to become consistently profitable, as it has been investing in the future. Citigroup, along with bank shares generally, underperformed in the fourth quarter of 2018 as the U.S. yield curve flattened, which impacts bank profitability negatively. Facebook has been weak this year, with the Cambridge Analytica controversy in the spring and lowered guidance following its second quarter earnings report. Despite this, we find appeal in the shares and see no reason to alter our thinking about its long term potential.
Our Fund continues to be centered around a collection of structural growth themes where we can invest in deeply advantaged companies. We used the volatility of recent months as an opportunity to add to many of our names that were down significantly.
63
| JNL/PIMCO Income Fund Pacific Investment Management Company LLC (Unaudited) |

JNL/PIMCO Income Fund
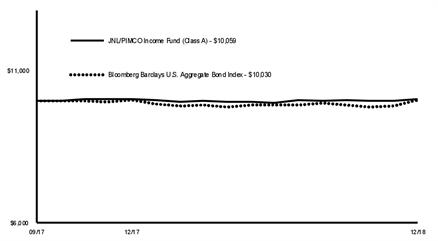
Average Annual Total Returns |
| |||||
Class A‡ |
|
|
| Class I† |
|
|
1 Year | -0.11 | % | 1 Year | 0.20 | % | |
Since Inception | 0.46 |
|
| Since Inception | 0.79 |
|
‡Inception date September 25, 2017 |
| |||||
†Inception date September 25, 2017 |
| |||||
The graph shows the change in value of an assumed $10,000 investment in the Fund's Class A shares over 10 years, or since inception if the inception is less than 10 years, as well as the Fund's benchmark(s) performance for the same period.
Past performance is not predictive of future performance. Investment return and principal value will fluctuate so that an investor’s shares, when redeemed, may be worth more or less than their original cost. Performance numbers are net of all Fund operating expenses, but do not reflect the deduction of insurance charges.
Composition as of December 31, 2018: | ||
Non-U.S. Government Agency ABS | 23.8 | % |
Financials | 16.1 | |
Government Securities | 15.4 | |
U.S. Government Agency MBS | 13.2 | |
Communication Services | 3.2 | |
Consumer Discretionary | 2.5 | |
Information Technology | 1.9 | |
Health Care | 1.8 | |
Industrials | 1.7 | |
Energy | 1.5 | |
Real Estate | 1.4 | |
Consumer Staples | 0.2 | |
Materials | 0.1 | |
Utilities | 0.1 | |
Other Equity Interests | - | |
Other Short Term Investments | 17.1 | |
Net Long (Short) Investments | 100.0 | % |
For the year ended December 31, 2018, JNL/PIMCO Income Fund underperformed its benchmark by posting a return of -0.11% for Class A shares compared to 0.01% for the Bloomberg Barclays U.S. Aggregate Bond Index.
2018 was characterized by a challenging market environment that featured higher yields and lower equities as volatility rose. Sustained U.S. China trade tensions and geopolitical turmoil weighed on risk sentiment, contributing to wider credit spreads and weakness in emerging market assets; declining oil prices suppressed global inflation expectations. Fears of monetary policy overtightening further waned investor confidence as the U.S. Federal Reserve continued to raise rates on its path toward policy normalization. Meanwhile, the U.S. Dollar strengthened amid divergent growth momentum and central bank activity between the U.S. and other developed regions.
Interest rate strategies were negative for overall returns, particularly short exposure to Japanese duration as long term yields modestly decreased through the year. This was partially offset by an allocation to Australian duration and exposure to the U.S. cash rate amid broader yield curve flattening. A long U.S. Dollar bias versus select developed market currencies added to performance, whereas tactical exposures to emerging market currencies, including the Argentine Peso and Russian Ruble detracted from performance, as the U.S. Dollar rallied.
Within spread strategies, exposures to investment grade and high yield corporate credit, as well as U.S. Dollar denominated emerging market debt, were negative for performance, as spreads ended the year wider. However, select holdings of securitized products, specifically non-agency mortgage-backed securities, contributed to performance.
Derivatives were used in the Fund and are instrumental in attaining specific exposures targeted to gain from anticipated market developments. The Fund’s overall duration positioning, which was negative for returns, was partly facilitated through the use of interest rate swaps and futures. Additionally, the Fund’s exposure to the U.S. cash rate, implemented in part through the use of options, was additive to performance. The Fund's overall corporate exposure, which was negative for performance, was partially obtained via the use of credit default swaps and swaptions. The Fund’s long U.S. Dollar positioning against select developed market currencies, partly achieved through currency forward agreements, was positive for performance.
64
| JNL/PIMCO Real Return Fund Pacific Investment Management Company LLC (Unaudited) |

JNL/PIMCO Real Return Fund
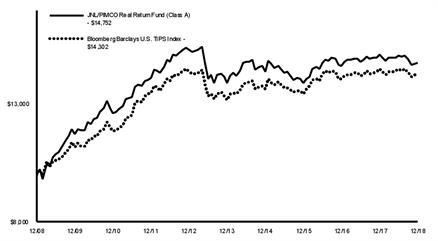
Average Annual Total Returns |
| |||||
Class A |
|
|
| Class I |
|
|
1 Year | -2.23 | % | 1 Year | -1.95 | % | |
5 Year | 1.19 |
|
| 5 Year | 1.40 |
|
10 Year | 3.96 |
|
| 10 Year | 4.20 |
|
The graph shows the change in value of an assumed $10,000 investment in the Fund's Class A shares over 10 years, or since inception if the inception is less than 10 years, as well as the Fund's benchmark(s) performance for the same period.
Past performance is not predictive of future performance. Investment return and principal value will fluctuate so that an investor’s shares, when redeemed, may be worth more or less than their original cost. Performance numbers are net of all Fund operating expenses, but do not reflect the deduction of insurance charges.
Composition as of December 31, 2018: | ||
Government Securities†† | 74.6 | % |
U.S. Government Agency MBS | 9.5 | |
Non-U.S. Government Agency ABS | 6.1 | |
Financials | 3.4 | |
Communication Services | 0.7 | |
Utilities | 0.7 | |
Industrials | 0.4 | |
Energy | 0.4 | |
Consumer Staples | 0.3 | |
Information Technology | 0.3 | |
Consumer Discretionary | 0.2 | |
Real Estate | 0.1 | |
Other Short Term Investments | 3.3 | |
Securities Lending Collateral | - | |
Total Investments | 100.0 | % |
††The Fund's weightings in TIPS was 73.6% of net investments
For the year ended December 31, 2018, JNL/PIMCO Real Return Fund underperformed its benchmark by posting a return of -2.23% for Class A shares compared to -1.26% for the Bloomberg Barclays U.S. TIPS Index.
2018 was characterized by a challenging market environment that featured higher yields and lower equities as volatility rose. Sustained U.S. China trade tensions and geopolitical turmoil weighed on risk sentiment, contributing to wider credit spreads and weakness in emerging market assets; declining oil prices suppressed global inflation expectations. Fears of monetary policy overtightening further waned investor confidence as the U.S. Federal Reserve continued to raise rates on its path toward policy normalization. Meanwhile, the U.S. Dollar strengthened amid divergent growth momentum and central bank activity between the U.S. and other developed regions.
An overweight to U.S. breakeven inflation levels (the difference between nominal and real yields) detracted from relative performance as inflation expectations contracted through the year. This was partially offset by short exposure to French breakevens, as long term inflation expectations in the region fell. Nominal interest rate strategies in the UK were negative for overall returns.
Allocations to U.S. Dollar denominated emerging market (“EM”) debt and financial corporates detracted from performance as spreads widened, while select exposure to residential mortgage-backed securities added. A long U.S. Dollar bias against select developed market currencies, specifically the Australian and Canadian Dollars, contributed to performance as those currencies depreciated. However, exposure to a basket of high carry EM currencies, including the Argentine and Colombian Pesos, was negative for Fund returns.
Derivatives were used in the Fund and were instrumental in attaining specific exposures targeted to gain from anticipated market developments. The Fund’s exposure to U.S. interest rates, which was negative for returns, was partly facilitated through the use of interest rate swaps, options, and futures. Additionally, the Fund’s exposure to French rates, which contributed to performance, was also implemented partially via interest rate swaps, options and futures. The Fund's overall corporate exposure, which was negative for performance, was partially obtained via the use of credit default swaps and swaptions. The Fund’s long U.S. Dollar positioning against the Australian and Canadian Dollars, was partly achieved through forward foreign currency contracts and ultimately contributed to performance.
65
| JNL/PPM America Floating Rate Income Fund PPM America, Inc. (Unaudited) |

JNL/PPM America Floating Rate Income Fund
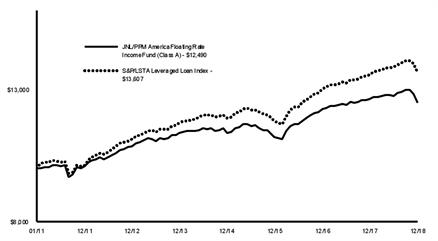
Average Annual Total Returns |
| |||||
Class A‡ |
|
|
| Class I† |
|
|
1 Year | -1.02 | % | 1 Year | -0.82 | % | |
5 Year | 1.96 |
|
| 5 Year | N/A |
|
Since Inception | 2.82 |
|
| Since Inception | 0.10 |
|
‡Inception date January 01, 2011 |
| |||||
†Inception date September 25, 2017 |
| |||||
The graph shows the change in value of an assumed $10,000 investment in the Fund's Class A shares over 10 years, or since inception if the inception is less than 10 years, as well as the Fund's benchmark(s) performance for the same period.
Past performance is not predictive of future performance. Investment return and principal value will fluctuate so that an investor’s shares, when redeemed, may be worth more or less than their original cost. Performance numbers are net of all Fund operating expenses, but do not reflect the deduction of insurance charges.
Composition as of December 31, 2018: | ||
Consumer Discretionary | 22.1 | % |
Health Care | 13.6 | |
Information Technology | 13.4 | |
Industrials | 11.8 | |
Financials | 10.6 | |
Materials | 9.8 | |
Communication Services | 6.5 | |
Consumer Staples | 4.4 | |
Energy | 2.6 | |
Real Estate | 1.3 | |
Utilities | 1.2 | |
Non-U.S. Government Agency ABS | 0.2 | |
Investment Companies | 0.1 | |
Warrants | - | |
Other Equity Interests | - | |
Other Short Term Investments | 2.4 | |
Total Investments | 100.0 | % |
For the year ended December 31, 2018, JNL/PPM America Floating Rate Income Fund underperformed its primary benchmark by posting a return of -1.02% of Class A shares compared to 0.44% for the S&P/LSTA Leveraged Loan Index. The Fund’s individual security selection within single B and BB loans detracted from performance for the year. In addition, the Fund’s modest exposure to high yield bonds detracted from performance.
Positioning among asset class types shifted slightly with the biggest change being a decrease in the corporate bonds position. At the beginning of the year, the Fund held roughly 91% corporate loans, 4% corporate bonds, and 4% cash, which migrated to 93%, 2%, and 5%, respectively, by the end of the year. The Fund was well diversified among industries at year end with the top five segments representing 42% of total investments.
In our view, the economic story through 2018 continued to be relatively solid, especially in the first half of 2018, although there were some signs of slowing. Into 2019, we find that jobs numbers remain solid, inflation is under control, earnings are encouraging and defaults are low. We also believe that the market selloff seen in the last quarter of 2018 has been driven by outsized fund flows rather than an underlying change in fundamentals. Risks to our outlook remain consistent with 2018. A global growth slowdown and growing European/Brexit headwinds could cause difficulty, and any slowdown could be potentially exacerbated by trade and tariff policy. Central banks also remain a risk, with the market pricing fewer hikes and potential rate cuts from the U.S. Federal Reserve in 2019.
66
| JNL/PPM America High Yield Bond Fund PPM America, Inc. (Unaudited) |

JNL/PPM America High Yield Bond Fund
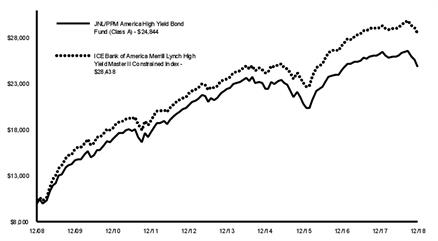
Average Annual Total Returns |
| |||||
Class A |
|
|
| Class I |
|
|
1 Year | -5.30 | % | 1 Year | -5.06 | % | |
5 Year | 2.12 |
|
| 5 Year | 2.34 |
|
10 Year | 9.53 |
|
| 10 Year | 9.75 |
|
The graph shows the change in value of an assumed $10,000 investment in the Fund's Class A shares over 10 years, or since inception if the inception is less than 10 years, as well as the Fund's benchmark(s) performance for the same period.
Past performance is not predictive of future performance. Investment return and principal value will fluctuate so that an investor’s shares, when redeemed, may be worth more or less than their original cost. Performance numbers are net of all Fund operating expenses, but do not reflect the deduction of insurance charges.
Composition as of December 31, 2018: | ||
Communication Services | 14.6 | % |
Consumer Discretionary | 14.0 | |
Energy | 13.1 | |
Health Care | 10.8 | |
Financials | 10.7 | |
Materials | 8.1 | |
Industrials | 4.4 | |
Consumer Staples | 4.3 | |
Information Technology | 2.8 | |
Investment Companies | 1.6 | |
Real Estate | 1.6 | |
Utilities | 1.3 | |
Government Securities | 0.6 | |
Non-U.S. Government Agency ABS | 0.6 | |
Other Equity Interests | - | |
Securities Lending Collateral | 10.0 | |
Other Short Term Investments | 1.5 | |
Total Investments | 100.0 | % |
For the year ended December 31, 2018, JNL/PPM America High Yield Bond Fund underperformed its benchmark by posting a return of -5.30% compared to -2.26% for ICE Bank of America Merrill Lynch High Yield Master II Constrained Index.
The Fund’s allocation to common stocks and energy sector bonds were the largest detractors from relative return while the Fund’s allocation to corporate loans and consumer sector bonds were the largest contributors for the year. Approximately 1% of the Fund was an exchange traded fund that is a proxy for the high yield (“HY”) market and held by the fund for cash management purposes. The Fund uses futures to manage duration.
Positioning among sectors and credit quality varied somewhat throughout the year. At the beginning of the year, the Fund held approximately 83% in corporate bonds, 5% in bank loans and 7% in common stocks, which migrated to 87%, 5% and 4%, respectively, by year end. The average rating at year end 2018 of investment grade was the same for year end 2017. The Fund was well diversified among industries at year end with the top five segments representing 55% of total investments.
We expect economic and earnings growth to slow from 2018’s brisk pace but to remain positive and supportive for HY performance in 2019. The HY market does not have 2008 level imbalances, and we do not believe leverage is extended for most of the market. We find defaults remain quite low and, while the distress ratio has increased, it is still below long term averages. We expect issuance to remain low. The HY market experienced significant outflows in 2018, but investors could reverse course given currently elevated yields are around 8%. Risks to our outlook include a sharper economic and profit slowdown, potentially exacerbated by trade disputes. Further declines in commodity prices are also a risk. Central banks are a concern, with the market pricing fewer hikes and potential rate cuts from the U.S. Federal Reserve in 2019.
67
| JNL/PPM America Mid Cap Value Fund PPM America, Inc. (Unaudited) |

JNL/PPM America Mid Cap Value Fund
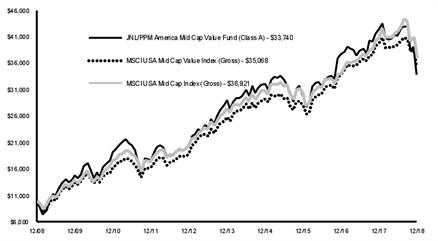
Average Annual Total Returns |
| |||||
Class A |
|
|
| Class I |
|
|
1 Year | -20.10 | % | 1 Year | -19.84 | % | |
5 Year | 3.04 |
|
| 5 Year | 3.29 |
|
10 Year | 12.93 |
|
| 10 Year | 13.18 |
|
The graph shows the change in value of an assumed $10,000 investment in the Fund's Class A shares over 10 years, or since inception if the inception is less than 10 years, as well as the Fund's benchmark(s) performance for the same period.
Past performance is not predictive of future performance. Investment return and principal value will fluctuate so that an investor’s shares, when redeemed, may be worth more or less than their original cost. Performance numbers are net of all Fund operating expenses, but do not reflect the deduction of insurance charges.
Composition as of December 31, 2018: | ||
Financials | 22.5 | % |
Consumer Discretionary | 16.6 | |
Industrials | 10.5 | |
Information Technology | 9.8 | |
Materials | 8.6 | |
Energy | 8.1 | |
Health Care | 6.2 | |
Utilities | 5.8 | |
Consumer Staples | 4.4 | |
Communication Services | 2.6 | |
Real Estate | 1.5 | |
Securities Lending Collateral | 3.0 | |
Other Short Term Investments | 0.4 | |
Total Investments | 100.0 | % |
For the year ended December 31, 2018, JNL/PPM America Mid Cap Value Fund underperformed its primary benchmark by posting a return of -20.10% for Class A shares compared to -11.35% for the MSCI USA Mid Cap Value Index (Gross). The Fund underperformed its other benchmark return of -9.37% for the MSCI USA Mid Cap Index (Gross).
Positive security selection influences on relative performance included names in consumer discretionary (Helen of Troy Ltd. up 36.2% and Macy’s Inc. up 23.7%) and health care (LifePoint Health Inc. up 29.5%). Negative security selection influences on relative performance included names in energy (Superior Energy Services Inc. down 65.2% and Patterson-UTI Energy Inc. down 54.6%) and financials (Bank OZK down 52.0%).
Positive sector influences on relative performance included an overweight position in information technology (“IT”). Negative sector influences on relative performance included underweight positions in utilities and real estate.
Positions added to the Fund during the year included AES Corp., Huntsman Corp., Berry Global Group Inc., Regency Centers Corp., Leidos Holdings Inc., and Sterling Bancorp Inc. Positions sold included Owens & Minor Inc., Cognizant Technology Solutions Corp., CSRA Inc., Hill-Rom Holdings Inc., Esterline Technologies Corp., Olin Corp., Steelcase Inc., and LifePoint Health Inc.
Relative to the primary benchmark during the year, the Fund’s overweight positions in consumer discretionary and consumer staples increased, while the overweight positions in energy, industrials, health care, IT, and materials decreased. The Fund’s underweight positions in communication services (formerly telecommunication services) and real estate increased, while the underweight position in utilities decreased. The underweight position in financials at year end 2017 is now an overweight position at year end 2018.
We see the U.S. equity market environment as supportive going into 2019, though trade remains a significant wild card. Following the correction in the fourth quarter, equity market valuations and earnings growth expectations have been reset near long term averages. Although late cycle fears persist, consensus expectations are for only a slight moderation in the economic growth seen in 2018. In our view, it appears that a recession is unlikely in 2019, but we would expect increased market volatility amid tariff and trade uncertainty, as well as U.S. Federal Reserve (“Fed”) overtightening fears. Fed policy was less accommodative in 2018. Going forward, the pace of monetary policy could be more dovish than expected if benign inflation expectations continue despite the much improved labor market. Overall, we remain optimistic going into 2019.
68
| JNL/PPM America Small Cap Value Fund PPM America, Inc. (Unaudited) |

JNL/PPM America Small Cap Value Fund

Average Annual Total Returns |
| |||||
Class A |
|
|
| Class I |
|
|
1 Year | -20.17 | % | 1 Year | -19.94 | % | |
5 Year | 4.52 |
|
| 5 Year | 5.16 |
|
10 Year | 12.43 |
|
| 10 Year | 12.88 |
|
The graph shows the change in value of an assumed $10,000 investment in the Fund's Class A shares over 10 years, or since inception if the inception is less than 10 years, as well as the Fund's benchmark(s) performance for the same period.
Past performance is not predictive of future performance. Investment return and principal value will fluctuate so that an investor’s shares, when redeemed, may be worth more or less than their original cost. Performance numbers are net of all Fund operating expenses, but do not reflect the deduction of insurance charges.
Composition as of December 31, 2018: | ||
Financials | 19.5 | % |
Industrials | 17.9 | |
Information Technology | 16.8 | |
Consumer Discretionary | 14.0 | |
Energy | 8.8 | |
Health Care | 6.5 | |
Materials | 4.9 | |
Communication Services | 2.6 | |
Consumer Staples | 2.6 | |
Utilities | 2.1 | |
Real Estate | 2.1 | |
Securities Lending Collateral | 1.8 | |
Other Short Term Investments | 0.4 | |
Total Investments | 100.0 | % |
For the year ended December 31, 2018, JNL/PPM America Small Cap Value Fund underperformed its benchmark by posting a return of -20.17% for Class A shares compared to -12.64% for the S&P 600 Value Index.
The Fund’s underperformance relative to the S&P 600 Value Index was attributed to both individual security selection and the related sector allocation as a result of the Fund’s bottom-up security selection process.
Positive security selection influences on relative performance included names in utilities (PNM Resources Inc. up 4.4%) and materials (Steel Dynamics Inc. (“Steel Dynamics”) up 9.8%). Negative security selection influences on relative performance included names in financials (Janus Henderson Group Plc down 43.2%) and consumer discretionary (Tupperware Brands Corp. down 46.0%).
Positive sector influence on relative performance included sector positioning in real estate and health care. Negative sector influence on relative performance included an overweight position in energy.
Positions added to the Fund during the year included Diamond Offshore Drilling Inc. and Electronics for Imaging Inc. Positions sold included Spirit AeroSystems Holdings Inc., American Financial Group Inc., Steel Dynamics, Superior Industries International Inc., and LifePoint Health Inc.
Relative to the benchmark during the year, the Fund’s overweight position in energy increased, while the overweight positions in health care, information technology, and consumer discretionary decreased. The Fund’s underweight positions in industrials, consumer staples and financials increased during the year, while the underweight positions in utilities, materials, and real estate decreased. The underweight position in communication services at year end 2017 is now an overweight position at year end 2018.
We see the U.S. equity market environment as supportive going into 2019, though trade remains a significant wild card. Following the correction in the fourth quarter, equity market valuations and earnings growth expectations have been reset near long term averages. Although late cycle fears persist, consensus expectations are for only a slight moderation in the economic growth seen in 2018. In our view, it appears that a recession is unlikely in 2019, but we would expect increased market volatility amid tariff and trade uncertainty, as well as U.S. Federal Reserve (“Fed”) overtightening fears. Fed policy was less accommodative in 2018. Going forward, the pace of monetary policy could be more dovish than expected if benign inflation expectations continue despite the much improved labor market. Overall, we remain optimistic going into 2019.
69
| JNL/PPM America Total Return Fund PPM America, Inc. (Unaudited) |

JNL/PPM America Total Return Fund
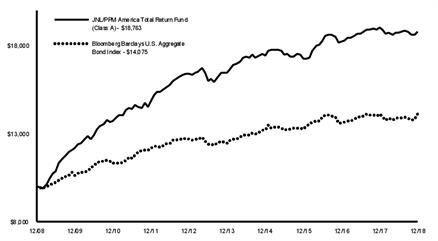
Average Annual Total Returns |
| |||||
Class A |
|
|
| Class I† |
|
|
1 Year | -1.23 | % | 1 Year | -0.97 | % | |
5 Year | 2.68 |
|
| 5 Year | N/A |
|
10 Year | 6.50 |
|
| 10 Year | N/A |
|
|
| Since Inception | -0.17 |
| ||
†Inception date September 25, 2017 |
| |||||
The graph shows the change in value of an assumed $10,000 investment in the Fund's Class A shares over 10 years, or since inception if the inception is less than 10 years, as well as the Fund's benchmark(s) performance for the same period.
Past performance is not predictive of future performance. Investment return and principal value will fluctuate so that an investor’s shares, when redeemed, may be worth more or less than their original cost. Performance numbers are net of all Fund operating expenses, but do not reflect the deduction of insurance charges.
Composition as of December 31, 2018: | ||
U.S. Government Agency MBS | 24.0 | % |
Government Securities | 17.3 | |
Financials | 15.9 | |
Non-U.S. Government Agency ABS | 11.9 | |
Energy | 4.5 | |
Utilities | 4.3 | |
Health Care | 3.9 | |
Communication Services | 3.6 | |
Industrials | 3.1 | |
Materials | 2.9 | |
Consumer Staples | 2.8 | |
Consumer Discretionary | 2.4 | |
Information Technology | 1.2 | |
Real Estate | 0.6 | |
Securities Lending Collateral | 0.8 | |
Other Short Term Investments | 0.8 | |
Total Investments | 100.0 | % |
For the year ended December 31, 2018, JNL/PPM America Total Return Fund underperformed its benchmark by posting a return of -1.23% for Class A shares compared to 0.01% for the Bloomberg Barclays U.S Aggregate Bond Index. The Fund’s overweight allocation to agency-backed securities (“ABS”) and security selection within commercial mortgage-backed securities were the primary contributors to relative return. The Fund’s security selection and overweight allocation to investment grade (“IG”) corporate bonds was the primary detractor to relative return for the year. The Fund uses futures to manage duration.
Positioning among sectors was stable during the year with a slight increase in mortgage-backed securities, 21% to 26%, and a decrease in ABS, 9% to 7%. The Fund was well diversified among industries at year end with the top five segments representing 64% of total investments.
We believe IG market fundamentals remain constructive. The U.S. is expected to grow at 2.5% in 2019, while areas of concern (e.g. housing) are a small portion of overall gross domestic product. Earnings will likely slow down without the initial boost from tax reform, but large caps are still expected to grow around 8%. We started to add IG corporate bonds in the fourth quarter as yield spreads became more attractive, and we may add further in the first quarter of 2019 if a heavy primary calendar widens spreads further.
70
| JNL/PPM America Value Equity Fund PPM America, Inc. (Unaudited) |

JNL/PPM America Value Equity Fund
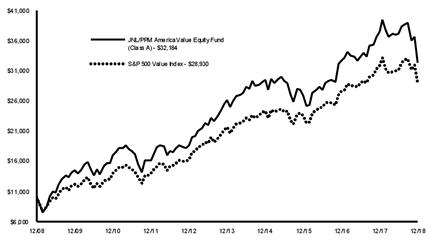
Average Annual Total Returns |
| |||||
Class A |
|
|
| Class I |
|
|
1 Year | -14.12 | % | 1 Year | -13.85 | % | |
5 Year | 4.29 |
|
| 5 Year | 4.53 |
|
10 Year | 12.40 |
|
| 10 Year | 12.62 |
|
The graph shows the change in value of an assumed $10,000 investment in the Fund's Class A shares over 10 years, or since inception if the inception is less than 10 years, as well as the Fund's benchmark(s) performance for the same period.
Past performance is not predictive of future performance. Investment return and principal value will fluctuate so that an investor’s shares, when redeemed, may be worth more or less than their original cost. Performance numbers are net of all Fund operating expenses, but do not reflect the deduction of insurance charges.
Composition as of December 31, 2018: | ||
Financials | 24.8 | % |
Health Care | 15.4 | |
Information Technology | 12.1 | |
Energy | 9.8 | |
Consumer Discretionary | 9.5 | |
Industrials | 9.1 | |
Communication Services | 6.4 | |
Consumer Staples | 5.0 | |
Utilities | 3.3 | |
Materials | 3.2 | |
Securities Lending Collateral | 0.9 | |
Other Short Term Investments | 0.5 | |
Total Investments | 100.0 | % |
For the year ended December 31, 2018, JNL/PPM America Value Equity Fund underperformed its benchmark by posting a return of -14.12% of Class A shares compared to -8.97% for the S&P 500 Value Index.
The Fund’s underperformance relative to the S&P 500 Value Index can be attributed to both individual security selection and the related sector allocation as a result of the Fund’s bottom-up security selection process.
Positive security selection influences on relative performance included names in information technology (“IT”) (Microsoft Corp. up 20.8% and CSRA Inc. up 38.6%) and industrials (not holding General Electric Co. down 55.4%). Negative security selection influences on relative performance included names in financials (Bank OZK down 52.0% and Lincoln National Corp. down 32.0%) and energy (Halliburton Co. down 44.6%).
Positive sector influence on relative performance primarily included overweight positions in IT and health care. Negative sector influence on relative performance primarily included an underweight position in utilities.
Positions added to the Fund during the year included CVS Health Corp., Berry Global Group Inc., Leidos Holdings Inc., Alliance Data Systems Corp., AES Corp., and Vistra Energy Corp. Positions sold included Cognizant Technology Solutions Corp., HP Inc., Lockheed Martin Corp., CSRA Inc., and Diamond Offshore Drilling Inc.
Relative to the benchmark during the year, the Fund’s overweight position in health care, financials, and energy increased, while the overweight positions in consumer discretionary decreased. The overweight positions in IT and industrials at year end 2017 are now underweight positions at year end 2018. The Fund’s underweight positions in consumer staples, utilities, real estate, and materials decreased. The underweight position in communication services at year end 2017 is now an overweight position at year end 2018.
We see the U.S. equity market environment as supportive going into 2019, though trade remains a significant wild card. Following the correction in the fourth quarter, equity market valuations and earnings growth expectations have been reset near long term averages. Although late cycle fears persist, consensus expectations are for only a slight moderation in the economic growth seen in 2018. In our view, it appears that a recession is unlikely in 2019, but we would expect increased market volatility amid tariff and trade uncertainty, as well as U.S. Federal Reserve (“Fed”) overtightening fears. Fed policy was less accommodative in 2018. Going forward, the pace of monetary policy could be more dovish than expected if benign inflation expectations continue despite the much improved labor market. Overall, we remain optimistic going into 2019.
71
| JNL/S&P Funds Standard & Poor’s Investment Advisory Services LLC (Unaudited) |

JNL/S&P Competitive Advantage Fund
Composition as of December 31, 2018: | ||
Consumer Discretionary | 31.5 | % |
Information Technology | 30.6 | |
Industrials | 18.6 | |
Consumer Staples | 7.0 | |
Health Care | 5.3 | |
Communication Services | 1.0 | |
Materials | 0.8 | |
Securities Lending Collateral | 4.9 | |
Other Short Term Investments | 0.3 | |
Total Investments | 100.0 | % |
For the year ended December 31, 2018, JNL/S&P Competitive Advantage Fund outperformed its benchmark by posting a return of -2.69% for Class A shares compared to -4.38% for the S&P 500 Index.
Return on invested capital (“ROIC”), one of the main factors in the selection process, was a strong contributor of outperformance in 2018. While investors did not show a strong preference for stocks with higher ROIC versus those in the median, investors strongly avoided stocks with below average ROIC in the S&P 500 Index. This general avoidance in the broader market, combined with the multiple factor selection process, contributed to the outperformance of the fund. Stocks that ranked in the top 20% for ROIC in the Fund contributed to the vast majority of the outperformance.
Throughout the year the fund maintained a significant overweight in consumer discretionary. This overweight has been present in the Fund since 2009. We see potential for continued consumer spending growth. We expect potential wage growth, tax reform, and the wealth effect all to contribute to sustained healthy consumer spending.
Netflix Inc., O'Reilly Automotive Inc., and Costco Wholesale Corp. were among the top performers for the year.
Nvidia Corp., Capri Holdings Ltd., and Skyworks Solutions Inc. were the worst performers on a total return basis for the year.
The Fund has displayed an average ROIC well above that of the S&P 500 Index. Historically, companies with higher ROIC have shown a tendency to be more resilient to economic recessions and less sensitive to overall broad market corporate earnings growth.
The turnover in names for the 2018 tri-rebalance was comparable to its historical average. The number of stocks in the Fund went from 40 to 45, with 17 new buys and 12 sells across three rebalances during the course of the year.
JNL/S&P Dividend Income & Growth Fund
Composition as of December 31, 2018: | ||
Communication Services | 9.8 | % |
Real Estate | 9.6 | |
Utilities | 9.5 | |
Consumer Staples | 9.1 | |
Materials | 8.6 | |
Health Care | 8.5 | |
Energy | 8.5 | |
Information Technology | 8.3 | |
Industrials | 8.2 | |
Financials | 8.1 | |
Consumer Discretionary | 7.0 | |
Securities Lending Collateral | 4.8 | |
Other Short Term Investments | - | |
Total Investments | 100.0 | % |
For the year ended December 31, 2018, JNL/S&P Dividend Income & Growth Fund underperformed its benchmark by posting a return of -5.31% for Class A shares compared to -4.38% for the S&P 500 Index.
Defensive high yielding companies were neither strong outperformers nor underperformers overall during the full year. While they were highly out of favor the first three quarters of 2018, they rebounded strongly in the fourth quarter. High dividend yielding stocks do not typically outperform in a rising interest rate environment, but the market carnage seen in the fourth quarter sent investors flying to dividend safety the last three months of the year. This led to the fund slightly underperforming after fees for the year.
WW Grainger Inc., CME Group Inc., and Eli Lilly & Co. were the top performers on a total return basis for the year.
General Electric Co., Principal Financial Group Inc., and Invesco Ltd. were the worst performers on a total return basis for the year.
The Fund is comprised of companies with higher than average credit ratings from S&P Global Ratings and S&P Quality Rankings. The Fund tends to hold large companies with a long history of steady earnings and dividend growth. In addition, this strategy tends to generate a Fund with an average dividend yield well above that of the S&P 500 Index. The Fund strategy continued its more-defensive positioning versus the S&P 500 Index.
The turnover in names for the 2018 tri-rebalance was slightly below its historical average. The number of stocks in the portfolio stayed at 47, with 16 new buys and 16 sells across three rebalances during the course of the year.
The Fund allocates to 11 sectors equally at each rebalance so sector exposures were similar to the prior year. The strategy selects 33 stocks, three from each of the 11 S&P 500 Index sectors at each rebalance.
JNL/S&P International 5 Fund
Composition as of December 31, 2018: | ||
Financials | 19.9 | % |
Industrials | 16.2 | |
Consumer Discretionary | 12.9 | |
Materials | 11.5 | |
Information Technology | 6.6 | |
Communication Services | 6.5 | |
Consumer Staples | 5.9 | |
Utilities | 5.9 | |
Energy | 5.8 | |
Real Estate | 4.5 | |
Health Care | 2.1 | |
Rights | - | |
Securities Lending Collateral | 1.8 | |
Other Short Term Investments | 0.4 | |
Total Investments | 100.0 | % |
For the year ending December 31, 2018, JNL/ S&P International 5 Fund underperformed its benchmark by posting a return of -15.48% for Class A shares compared to -13.65% for the S&P Developed ex-U.S. Large MidCap Index.
International markets lagged U.S. equities during the first half of the year as the anticipated 2018 global expansion fizzled out. Trade tensions between the U.S. and the rest of the world further compounded the international underperformance.
Canada, the Middle East and Asia Pacific Ex-Japan sub strategies all contributed positively to relative performance of the Fund as all three outperformed their regional benchmarks. Canada contributed the most as it had the largest outperformance relative to the benchmark index.
Europe and Japan sub-strategies underperformed their relative regions for the year, dragging the Fund’s overall performance down.
Samsung Electronics Co. Ltd., Banco Santander SA, and Daiichi Sankyo Co. Ltd. were the top performers on a total return U.S. Dollar basis for the year.
Covestro AG, Valeo SA, and Royal Mail Plc were the worst performers on a total return U.S. Dollar basis for the year.
The turnover in names during the 2018 rebalance was comparable to historical levels. The Fund reset the regional sub strategy exposures to the relative market cap weight in the benchmark. Relative outperformance to the regional benchmarks had resulted in overweights to Canada, the Middle East, and Asia Pacific Ex-Japan.
72
| JNL/S&P Funds Standard & Poor’s Investment Advisory Services LLC (Unaudited) |

JNL/S&P Intrinsic Value Fund
Composition as of December 31, 2018: | ||
Consumer Discretionary | 31.8 | % |
Information Technology | 21.3 | |
Health Care | 17.2 | |
Consumer Staples | 8.1 | |
Communication Services | 7.4 | |
Real Estate | 3.7 | |
Materials | 3.1 | |
Industrials | 2.2 | |
Energy | 2.0 | |
Utilities | 1.3 | |
Securities Lending Collateral | 1.2 | |
Other Short Term Investments | 0.7 | |
Total Investments | 100.0 | % |
For the year ended December 31, 2018, JNL/S&P Intrinsic Value Fund underperformed its benchmark by posting a return of -5.82% for Class A shares compared to -4.38% for the S&P 500 Index.
Value focused strategies such as intrinsic value underperformed for much of 2018. Free cash flow (“FCF”) yield, one of the main selection criteria factors, was not a main driving factor of performance for much of year in the S&P 500 benchmark.
While companies ranked among the highest 20% for FCF yield in the S&P 500 Index were the largest weight in the fund and had a large positive contribution to performance, it was not enough to overcome the negative contribution from underweighting higher valuation growth stocks.
Health care and information technology were large detractors during the year. This concentrated underperformance was driven by overweighting value stocks versus higher performing growth stocks within those sectors.
Discovery Inc., Macy's Inc., and Twenty-First Century Fox Inc. were the top performers on a total return basis for the year.
Capri Holdings Ltd., DXC Technology Co., and Hanesbrands Inc. were the worst performers on a total return basis for the year.
The Fund is comprised of companies with higher than average FCF yield. These companies tend to generate strong cash flow in excess of capital requirements and therefore are more likely to be able to finance growth, provide dividends, withstand earnings contractions and repurchase shares.
The turnover in names for the 2018 tri-rebalance was above its historical average. The number of stocks in the portfolio went from 45 to 57, with 31 new buys and 19 sells across three rebalances during the year.
JNL/S&P Mid 3 Fund
Composition as of December 31, 2018: | ||
Consumer Discretionary | 41.0 | % |
Financials | 9.8 | |
Industrials | 8.5 | |
Information Technology | 8.1 | |
Materials | 7.0 | |
Real Estate | 6.4 | |
Consumer Staples | 4.5 | |
Health Care | 3.1 | |
Communication Services | 2.6 | |
Securities Lending Collateral | 8.6 | |
Other Short Term Investments | 0.4 | |
Total Investments | 100.0 | % |
For the year ending December 31, 2018, JNL/S&P Mid 3 Fund underperformed its benchmark by posting a return of -15.23% for Class A shares compared to -11.08% for the S&P MidCap 400 Index.
The Fund is a blend of three independent sub strategies that seek attractive companies based on free cash flow yields, equity yields and cash flow profitability. These three strategies are blended to seek appreciation in a variety of market conditions.
The Fund lagged its benchmark for most of 2018. Two of the three sub strategies, the S&P Mid Intrinsic Value (-19.48%) and S&P Mid Total Equity Yield (-13.38%), underperformed while the S&P Mid Competitive Advantage sub strategy (-8.69%) outperformed, partially offsetting the other two strategies.
Bioverativ Inc., Dillards Inc., and Boston Beer Co. Inc. were the top performers on a total return basis for the year.
Thor Industries Inc., Michaels Store Inc., and Pitney Bowes Inc. were the worst performers on a total return basis for the year.
Real estate, industrials, health care, and the new sector communication services had the biggest impact on overall underperformance. Poor stock selection resulted in negative performance for real estate and communication services, while a significant overweight to industrials and underweight to health care were detractors. Strong stock selection in industrials prevented it from being the worst contributing sector, along with the underweights to information technology and energy.
The turnover in names for the 2018 rebalances was in line with expectations in averaging 28% name turnover per quarterly rebalance. The Fund held constant the number of names in the fund at 74, with an average of 21 names replaced each quarterly rebalance.
JNL/S&P Total Yield Fund
Composition as of December 31, 2018: | ||
Consumer Discretionary | 28.4 | % |
Information Technology | 19.7 | |
Financials | 13.1 | |
Industrials | 9.3 | |
Materials | 8.6 | |
Health Care | 7.5 | |
Consumer Staples | 4.6 | |
Communication Services | 4.1 | |
Real Estate | 2.4 | |
Securities Lending Collateral | 1.2 | |
Other Short Term Investments | 1.1 | |
Total Investments | 100.0 | % |
For the year ended December 31, 2018, JNL/S&P Total Yield Fund underperformed its benchmark by posting a return of -11.15% for Class A shares compared to -4.38% for the S&P 500 Index.
The Fund is comprised of companies with higher than average “total yield.” Total yield is calculated as the sum of the cash dividend, net cash used for stock repurchases, and net cash used to retire debt divided by the company’s market capitalization. As such, total yield is a broad measure of cash flow returned to shareholders and bondholders in the form of dividends, share buybacks or elimination of debt. This Fund seeks companies that are significantly reducing their debt and/or increasing their equity distributions.
Total yield was a negative contributing factor for the year in both the Fund and benchmark. Stocks ranked in the top 20% for total yield in the S&P 500 Index had the lowest annual returns and the biggest negative contribution of any other total yield quintile. Underperformance in the Fund is attributed to investor preference for growth over value. The total yield selection process led to a value bias that was out of favor for most of the year.
Andeavor Logistics LP, Motorola Solutions Inc., and TransDigm Group Inc. were the top performers on a total return basis for the year.
General Electric Co., Western Digital Corp., and Patterson Cos. Inc. were the worst performers on a total return basis for the year.
This Fund has displayed higher volatility than the benchmark since inception.
The turnover in names for the 2018 tri-rebalance was above its historical average. The number of stocks in the Fund went from 61 to 56, with 32 new buys and 37 sells across three rebalances over the course of the year.
73
| JNL/S&P Funds Standard & Poor’s Investment Advisory Services, LLC (Unaudited) |

JNL/S&P Competitive Advantage Fund
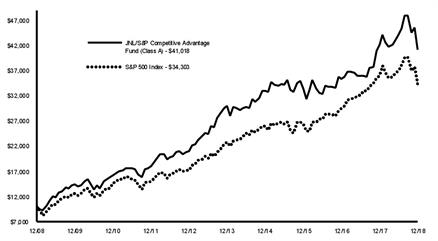
Average Annual Total Returns |
| |||||
Class A |
|
|
| Class I |
|
|
1 Year | -2.69 | % | 1 Year | -2.36 | % | |
5 Year | 6.51 |
|
| 5 Year | 6.76 |
|
10 Year | 15.16 |
|
| 10 Year | 15.42 |
|
The graph shows the change in value of an assumed $10,000 investment in the Fund's Class A shares over 10 years, or since inception if the inception is less than 10 years, as well as the Fund's benchmark(s) performance for the same period.
Past performance is not predictive of future performance. Investment return and principal value will fluctuate so that an investor’s shares, when redeemed, may be worth more or less than their original cost. Performance numbers are net of all Fund operating expenses, but do not reflect the deduction of insurance charges.
JNL/S&P Dividend Income & Growth Fund
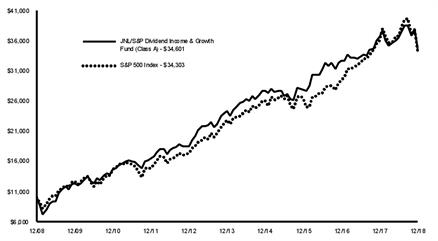
Average Annual Total Returns |
| |||||
Class A |
|
|
| Class I |
|
|
1 Year | -5.31 | % | 1 Year | -5.04 | % | |
5 Year | 7.40 |
|
| 5 Year | 7.63 |
|
10 Year | 13.22 |
|
| 10 Year | 13.48 |
|
The graph shows the change in value of an assumed $10,000 investment in the Fund's Class A shares over 10 years, or since inception if the inception is less than 10 years, as well as the Fund's benchmark(s) performance for the same period.
Past performance is not predictive of future performance. Investment return and principal value will fluctuate so that an investor’s shares, when redeemed, may be worth more or less than their original cost. Performance numbers are net of all Fund operating expenses, but do not reflect the deduction of insurance charges.
JNL/S&P International 5 Fund

Average Annual Total Returns |
| |||||
Class A‡ |
|
|
| Class I† |
|
|
1 Year | -15.48 | % | 1 Year | -15.10 | % | |
Since Inception | 2.83 |
|
| Since Inception | -8.65 |
|
‡Inception date September 15, 2014 |
| |||||
†Inception date September 25, 2017 |
| |||||
The graph shows the change in value of an assumed $10,000 investment in the Fund's Class A shares over 10 years, or since inception if the inception is less than 10 years, as well as the Fund's benchmark(s) performance for the same period.
Past performance is not predictive of future performance. Investment return and principal value will fluctuate so that an investor’s shares, when redeemed, may be worth more or less than their original cost. Performance numbers are net of all Fund operating expenses, but do not reflect the deduction of insurance charges.
74
| JNL/S&P Funds Standard & Poor’s Investment Advisory Services, LLC (Unaudited) |

JNL/S&P Intrinsic Value Fund

Average Annual Total Returns |
| |||||
Class A |
|
|
| Class I |
|
|
1 Year | -5.82 | % | 1 Year | -5.53 | % | |
5 Year | 3.70 |
|
| 5 Year | 3.92 |
|
10 Year | 14.65 |
|
| 10 Year | 14.94 |
|
The graph shows the change in value of an assumed $10,000 investment in the Fund's Class A shares over 10 years, or since inception if the inception is less than 10 years, as well as the Fund's benchmark(s) performance for the same period.
Past performance is not predictive of future performance. Investment return and principal value will fluctuate so that an investor’s shares, when redeemed, may be worth more or less than their original cost. Performance numbers are net of all Fund operating expenses, but do not reflect the deduction of insurance charges.
JNL/S&P Mid 3 Fund
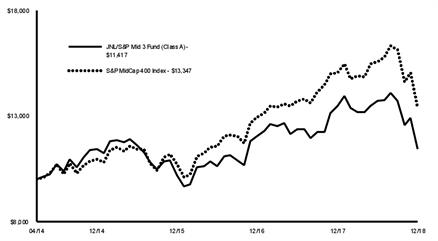
Average Annual Total Returns |
| |||||
Class A‡ |
|
|
| Class I† |
|
|
1 Year | -15.23 | % | 1 Year | -14.96 | % | |
Since Inception | 2.87 |
|
| Since Inception | 3.12 |
|
‡Inception date April 28, 2014 |
| |||||
†Inception date April 28, 2014 |
| |||||
The graph shows the change in value of an assumed $10,000 investment in the Fund's Class A shares over 10 years, or since inception if the inception is less than 10 years, as well as the Fund's benchmark(s) performance for the same period.
Past performance is not predictive of future performance. Investment return and principal value will fluctuate so that an investor’s shares, when redeemed, may be worth more or less than their original cost. Performance numbers are net of all Fund operating expenses, but do not reflect the deduction of insurance charges.
JNL/S&P Total Yield Fund

Average Annual Total Returns |
| |||||
Class A |
|
|
| Class I |
|
|
1 Year | -11.15 | % | 1 Year | -10.93 | % | |
5 Year | 3.51 |
|
| 5 Year | 3.73 |
|
10 Year | 12.57 |
|
| 10 Year | 12.79 |
|
The graph shows the change in value of an assumed $10,000 investment in the Fund's Class A shares over 10 years, or since inception if the inception is less than 10 years, as well as the Fund's benchmark(s) performance for the same period.
Past performance is not predictive of future performance. Investment return and principal value will fluctuate so that an investor’s shares, when redeemed, may be worth more or less than their original cost. Performance numbers are net of all Fund operating expenses, but do not reflect the deduction of insurance charges.
75
| JNL/Scout Unconstrained Bond Fund Scout Investments, Inc. (Unaudited) |

JNL/Scout Unconstrained Bond Fund
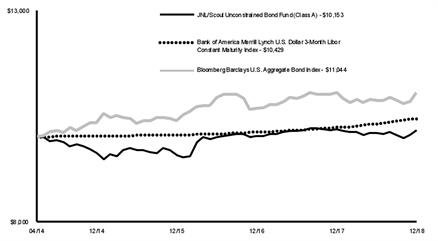
Average Annual Total Returns |
| |||||
Class A‡ |
|
|
| Class I† |
|
|
1 Year | -0.19 | % | 1 Year | 0.12 | % | |
Since Inception | 0.33 |
|
| Since Inception | 0.02 |
|
‡Inception date April 28, 2014 |
| |||||
†Inception date September 25, 2017 |
| |||||
The graph shows the change in value of an assumed $10,000 investment in the Fund's Class A shares over 10 years, or since inception if the inception is less than 10 years, as well as the Fund's benchmark(s) performance for the same period.
Past performance is not predictive of future performance. Investment return and principal value will fluctuate so that an investor’s shares, when redeemed, may be worth more or less than their original cost. Performance numbers are net of all Fund operating expenses, but do not reflect the deduction of insurance charges.
Composition as of December 31, 2018: | ||
Government Securities | 47.9 | % |
Financials | 17.0 | |
Non-U.S. Government Agency ABS | 13.4 | |
U.S. Government Agency MBS | 4.3 | |
Health Care | 3.3 | |
Industrials | 1.3 | |
Energy | 0.8 | |
Consumer Staples | 0.8 | |
Materials | 0.6 | |
Other Short Term Investments | 9.8 | |
Securities Lending Collateral | 0.8 | |
Total Investments | 100.0 | % |
For the year ended December 31, 2018, JNL/Scout Unconstrainted Bond Fund underperformed its primary benchmark by posting a return of -0.19% for Class A shares compared to 2.07% for the Bank of America Merrill Lynch U.S. Dollar 3-Month Libor Constant Maturity Index. The Fund underperformed its other benchmark return of 0.01% for the Bloomberg Barclays U.S. Aggregate Bond Index.
During 2018, U.S. Federal Reserve (“Fed”) rate increases drove short rates higher, but the yield curve flattened, highlighting the dislocation between the Fed’s aggressive campaign and the bond market’s skepticism of higher future inflation. The Fed also began unwinding its balance sheet and volatility increased, as this action reverses the dampening role of the Fed’s previous quantitative easing program. Gridlock in Washington following the midterm elections indicates that any further fiscal stimulus is unlikely.
Within this market, our positive duration positioning added 8 basis points (“bps”). This includes 142 bps of negative performance from being short 10-year German bund futures, offset by being long U.S. Treasury futures which added 64 bps as well as other Treasury positions which added 88 bps. We believed the spread between U.S. and German rates was too wide and would narrow. In the credit sector, higher quality outperformed as our investment grade holdings added 44 bps while our high yield subtracted 7bps. Structured products helped performance with commercial mortgage-backed securities (“CMBS”), mortgage-backed securities (“MBS”), and asset-backed securities adding 17 bps, 14 bps, and 8 bps, respectively.
This Fund seeks to maximize risk adjusted total return by systematically pursuing relative value opportunities throughout all sectors of the fixed income market. This is a “best ideas” strategy with a high level of flexibility to take advantage of opportunities while focusing on downside risk protection.
By the end of the year, capital markets retreated to more reasonable valuations, in our opinion after being overly optimistic earlier in the year. The Fund continues to be positioned defensively, but we responded to market opportunities. In the corporate sector, investment grade holdings are primarily focused in very short financials and industrials. When spreads widened late in the year, we added to both our investment grade and high yield positions. Our holdings in MBS are primarily in well structured, high quality CMBS, which we view as attractive due to the high degree of downside risk protection. We continue to view U.S. rates as attractive on a relative basis versus German rates. Overall, the Fund’s duration is positive, but we responded to the lower U.S. rates late in the year by reducing duration.
76
| JNL/T. Rowe Price Established Growth Fund T. Rowe Price Associates, Inc. (Unaudited) |

JNL/T. Rowe Price Established Growth Fund
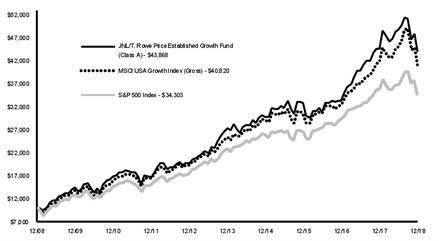
Average Annual Total Returns |
| |||||
Class A |
|
|
| Class I |
|
|
1 Year | -1.40 | % | 1 Year | -1.13 | % | |
5 Year | 9.96 |
|
| 5 Year | 10.21 |
|
10 Year | 15.94 |
|
| 10 Year | 16.18 |
|
The graph shows the change in value of an assumed $10,000 investment in the Fund's Class A shares over 10 years, or since inception if the inception is less than 10 years, as well as the Fund's benchmark(s) performance for the same period.
Past performance is not predictive of future performance. Investment return and principal value will fluctuate so that an investor’s shares, when redeemed, may be worth more or less than their original cost. Performance numbers are net of all Fund operating expenses, but do not reflect the deduction of insurance charges.
Composition as of December 31, 2018: | ||
Information Technology | 26.4 | % |
Consumer Discretionary | 22.3 | |
Communication Services | 17.0 | |
Health Care | 15.8 | |
Industrials | 8.9 | |
Financials | 5.3 | |
Utilities | 1.5 | |
Consumer Staples | 1.0 | |
Materials | 0.7 | |
Real Estate | 0.6 | |
Other Short Term Investments | 0.3 | |
Securities Lending Collateral | 0.2 | |
Total Investments | 100.0 | % |
For the year ended December 31, 2018, JNL/T. Rowe Price Established Growth Fund outperformed its benchmark by posting a return of -1.40% for Class A shares compared to -2.02% for the MSCI USA Growth Index (Gross). The Fund outperformed its other benchmark return of -4.38% for the S&P 500 Index.
Sector allocation drove relative outperformance. Information technology contributed the most to relative returns as favorable stock selection drove relative sector strength (Red Hat Inc., Apple Inc. (“Apple”) (underweight), Workday Inc.). A lack of exposure to energy boosted relative performance. Energy stocks plummeted in the final quarter of the year, in part because the U.S. granted several nations a six month waiver on sanctions. Industrials and business services added to relative results due to both effective stock selection (Boeing Co.) and a beneficial underweight position. Conversely, stock choices in consumer discretionary detracted from relative performance (Alibaba Group Holding Ltd., Wynn Resorts Ltd., Aptiv Plc). Stock selection in consumer staples also hurt relative returns (Philip Morris International Inc.).
The five largest purchases during the year were: Booking Holdings Inc. (“Booking Holdings”) (formerly Priceline Group Inc.); Becton Dickinson & Co.; Symantec Corp.; Apple; Tesla Inc. The five largest sales during the year were: Apple; Amazon.com Inc.; PayPal Holdings Inc.; Alphabet Inc.; Booking Holdings.
At the sector level, the largest increases in weighting during the year were in the newly formed communication services and consumer discretionary. The most significant decreases were in the Fund's weighting in Industrials and business services and real estate. Our sector weightings are residual of our bottom-up stock selection process and typically reflect where the Fund’s manager is finding compelling growth opportunities at the individual company level rather than through a broader thematic approach.
Overall, we remain sanguine on the prospects for a recovery due in part to more appealing valuations, slower but still healthy corporate earnings growth, continued strength in the U.S. economy, a fading headwind from U.S. monetary policy and possibly reduced tensions on trade and other geopolitical concerns. While overall global growth is expected to slow, we do not anticipate a recession in the U.S. and expect some rebound in European and Chinese growth.
Finally, although permitted in accordance with Fund guidelines, derivative instruments are not used in the management of the Fund.
77
| JNL/T. Rowe Price Managed Volatility Balanced Fund T. Rowe Price Associates, Inc. (Unaudited) |

JNL/T. Rowe Price Managed Volatility Balanced Fund
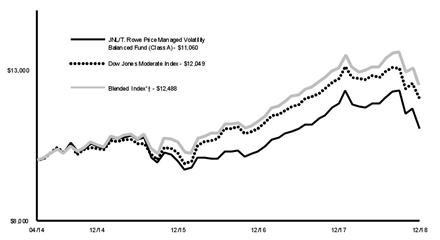
†45% S&P 500 Index, 20% MSCI EAFE Index (Net), 35% Bloomberg Barclays U.S. Aggregate Bond Index
Average Annual Total Returns |
| |||||
Class A‡ |
|
|
| Class I† |
|
|
1 Year | -6.90 | % | 1 Year | -6.72 | % | |
Since Inception | 2.18 |
|
| Since Inception | -1.74 |
|
‡Inception date April 28, 2014 |
| |||||
†Inception date September 25, 2017 |
| |||||
The graph shows the change in value of an assumed $10,000 investment in the Fund's Class A shares over 10 years, or since inception if the inception is less than 10 years, as well as the Fund's benchmark(s) performance for the same period.
Past performance is not predictive of future performance. Investment return and principal value will fluctuate so that an investor’s shares, when redeemed, may be worth more or less than their original cost. Performance numbers are net of all Fund operating expenses, but do not reflect the deduction of insurance charges.
T. Rowe Price Associates, Inc. assumed portfolio management responsibility on August 13, 2018.
Composition as of December 31, 2018: | ||
Financials | 13.8 | % |
Health Care | 10.8 | |
Information Technology | 9.8 | |
U.S. Government Agency MBS | 8.3 | |
Consumer Discretionary | 8.1 | |
Government Securities | 8.0 | |
Industrials | 6.6 | |
Communication Services | 6.5 | |
Consumer Staples | 3.7 | |
Materials | 3.2 | |
Energy | 3.1 | |
Utilities | 2.9 | |
Non-U.S. Government Agency ABS | 2.4 | |
Real Estate | 1.8 | |
Investment Companies | - | |
Other Short Term Investments | 10.2 | |
Securities Lending Collateral | 0.8 | |
Net Long (Short) Investments | 100.0 | % |
For the year ended December 31, 2018, JNL/T. Rowe Price Managed Volatility Fund underperformed its benchmark by posting a return of -6.90% for Class A shares compared to -5.21% for the Dow Jones Moderate Index. The Fund also underperformed its blended benchmark which posted a return of-4.56% for the 45% S&P 500 Index, 20% MSCI EAFE Index (Net), 35% Bloomberg Barclays U.S. Aggregate Bond Index.
Effective August 13, 2018, the JNL/MMRS Moderate Fund’s name was changed to JNL/T. Rowe Price Managed Volatility Fund.
For the period January 1, 2018 through August 12, 2018, the Fund was Sub-Advised by Milliman Financial Risk Management LLC. During the period, the Fund posted a return of 1.85% for Class A shares compared to 1.35% for the Dow Jones Moderate Index. The Fund’s blended benchmark posted a return of 1.85% for the 45% S&P 500 Index, 15% MSCI All Country World ex USA Index (Net) and 40% Bloomberg Barclays U.S. Aggregate Bond Index.
The investment objective of the Fund was to provide growth of capital while seeking to manage volatility and provide downside protection by investment in other funds.
The Fund sought to achieve its objective by investing in Class I shares of a diversified group of other Funds (“Underlying Funds”). The Underlying Funds in which the Fund invested are a part of the JNL Series Trust, JNL Variable Fund LLC, JNL Investors Series Trust and Jackson Variable Series Trust. Not all Funds of the JNL Series Trust, JNL Variable Fund LLC, JNL Investors Series Trust and Jackson Variable Series Trust were available as Underlying Funds. The Schedules of Investments and Financial Statements for the Underlying Funds are available on the SEC’s website at www.sec.gov.
The Fund invested based on a neutral allocation of 40% of its assets to Underlying Funds that invest primarily in fixed-income securities and 60% of its assets to Underlying Funds that invest primarily in equity securities. As market conditions changed, the Fund’s neutral allocation varied based on Milliman Financial Risk Management LLC’s (“Sub-Adviser”) risk management calculations. Under normal circumstances, the Fund allocated approximately 25% to 100% of its assets to Underlying Funds that invested primarily in fixed-income securities and the “risk control fund” and up to 75% of its assets to Underlying Funds that invested primarily in equity securities.
The outset of 2018 gave every appearance that 2017’s record setting, risk adjusted returns would continue, as the MSCI ACWI climbed 7.3% through the first four weeks of the year, amidst continued low volatility. That all changed abruptly heading into February as surprisingly strong economic data stoked fears that central bank policy would grow more hawkish. The fear triggered a chain reaction that resulted in a global equity market sell off of 9.0% in just eight trading days and sent market volatility sharply higher.
As the period wore on, global equity market volatility ebbed lower as global market segments increasingly diverged. Equities in the U.S. trended higher, while a strengthening U.S. Dollar weighed on equity returns outside the U.S. By August 13, the year to date 2018 total return of the MSCI ACWI was 1.4%; underneath the hood, U.S. equities were up 6.8%, but the rest of the world was down 6.0%.
During this period, the U.S. Federal Reserve (“Fed”) made two 25 basis point increases to its Fed funds rate and also reduced the size of its balance sheet by approximately $200 billion. This put upward pressure on longer term yields, sending the 10-year U.S. Treasury yield from 2.4% to 3.1% by mid-May. By August 13 it had retreated to 2.9%, but the U.S. bond market was still down 1.2% for the period.
Accordingly, while its fixed-income and non-U.S. equity allocations detracted from its return, the Fund benefited from having the bulk of its equity exposure in the U.S.
In contrast to 2017 when the Fund maintained its maximum equity exposure for the entire year, this period saw two stretches, in early February and early April, each for about two weeks, when it implemented a 10%-15% hedge position. While the reduction in equity exposure did not affect the return for the period, it did help to reduce fund’s volatility along the way.
Effective August 13, 2018, T. Rowe Price Associates, Inc. assumed management responsibility for the Fund. For the period August 13, 2018 through December 31, 2018, the Fund posted a return of -8.60% for Class A shares compared to -6.46% for the Dow Jones Moderate Index. The Fund’s blended
78
| JNL/T. Rowe Price Managed Volatility Balanced Fund T. Rowe Price Associates, Inc. (Unaudited) |

benchmark posted a return of -6.33% for the 45% S&P 500 Index, 20% MSCI EAFE Index (Net), 35% Bloomberg Barclays U.S. Aggregate Bond Index.
The managed volatility overlay detracted 1.74% from excess returns, as the Fund had an overweight position in equities for most of the period. The Fund’s forecast model uses longer term implied volatilities and therefore, is not as sensitive to changes in shorter term volatility, like what markets experienced in December. Within the underlying balanced Fund, unfavorable security selection within the international equity allocation detracted from relative returns. However, this negative impact was partly offset by positive security selection within the U.S. large cap value and growth equity allocations. Out of benchmark exposure to high yield bonds weighed on relative performance for the period. Conversely, the inclusion of real assets equities benefited relative performance, though this positive impact was limited by an underweight tactical allocation to the sector.
Global equities turned sharply lower during the period, while global bond returns were positive. The equity sell off was spurred by slowing economic growth globally, increased tensions between the U.S. and China and expectations for slowing corporate earnings growth in the U.S. Equity valuations have improved and now better reflect geopolitical risks and concerns over an aging economic cycle. Several near term risks remain, including receding global liquidity, moderating growth and ongoing trade tensions. We expect equity and bond market volatility to remain elevated as concerns over the path of monetary policy and political risks unfold.
After 2017’s synchronized upswing in global economic activity, growth trajectories worldwide diverged in 2018. Fiscal stimulus and the tax overhaul package of 2017 have benefited the U.S. economy, while growth has begun to flag in a few other markets despite support from longstanding accommodative monetary policies. Global central banks are in varying stages of winding down accommodative monetary policies, leading to a decrease in liquidity and the potential for upward pressure on yields. Near term risks to global markets include repercussions from potential monetary policy missteps and an escalation in trade tensions.
The estimated return impact from employing futures was -284 basis points and a negligible return impact from rights for the time period.
79
| JNL/T. Rowe Price Mid-Cap Growth Fund T. Rowe Price Associates, Inc. (Unaudited) |

JNL/T. Rowe Price Mid-Cap Growth Fund
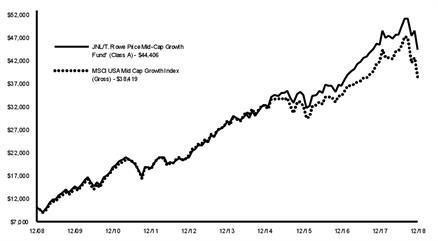
Average Annual Total Returns* |
| |||||
Class A | �� |
|
| Class I |
|
|
1 Year | -2.45 | % | 1 Year | -2.15 | % | |
5 Year | 9.12 |
|
| 5 Year | 9.37 |
|
10 Year | 16.08 |
|
| 10 Year | 16.32 |
|
*The Fund's investment adviser waived/reimbursed certain expenses of the Fund. Performance results shown reflect the waiver, without which performance results would have been lower. |
| |||||
The graph shows the change in value of an assumed $10,000 investment in the Fund's Class A shares over 10 years, or since inception if the inception is less than 10 years, as well as the Fund's benchmark(s) performance for the same period.
Past performance is not predictive of future performance. Investment return and principal value will fluctuate so that an investor’s shares, when redeemed, may be worth more or less than their original cost. Performance numbers are net of all Fund operating expenses, but do not reflect the deduction of insurance charges.
Composition as of December 31, 2018: | ||
Information Technology | 21.4 | % |
Industrials | 18.6 | |
Health Care | 15.7 | |
Consumer Discretionary | 14.3 | |
Financials | 9.0 | |
Materials | 6.0 | |
Consumer Staples | 3.0 | |
Communication Services | 2.0 | |
Energy | 1.9 | |
Utilities | 1.2 | |
Real Estate | 0.3 | |
Other Short Term Investments | 5.9 | |
Securities Lending Collateral | 0.7 | |
Total Investments | 100.0 | % |
For the year ended December 31, 2018, JNL/T. Rowe Price Mid-Cap Growth Fund outperformed its benchmark by posting a return of -2.45% for Class A shares compared to -7.92% for the MSCI USA Mid Cap Growth Index (Gross).
Stock selection in materials was the biggest contributor to relative returns. Ball Corp. (“Ball”) is a leading global manufacturer of metal food and beverage packaging products and the global share leader in the oligopoly aluminum beverage can market. The stock was under pressure early in the year as weakness in the U.S. beer markets coupled with decreased demand for defensive bond proxy names compressed the multiple. Shares rebounded after Ball announced a strategically sound joint venture project with Platinum Equity, LLC and closed one of its smaller Brazilian plants. Solid third quarter results continued to boost shares as growth and additional buyback plans offset margin pressure. Ball announced plans to sell its Chinese beverage can facilities to a local Chinese manufacturer in a deal structured to relieve the company of an underperforming business while enabling it to retain some exposure to any potential value the local manufacturer can generate. Trends toward specialty cans and away from plastic bode well for continued growth. Shares of RPM LLC (“RPM”) continued to rise on positive investor sentiment toward its partnership with activist Elliott Management to increase shareholder value via strategic initiatives intended to improve financial performance and deliver operating efficiencies. RPM also stands to gain from several recent strategic acquisitions. We like the company's risk/reward profile and the leading coatings brands that it sells to niche end markets and believe that the firm benefits from an entrepreneurial culture and focus on investment discipline.
Stock choices in consumer discretionary also boosted relative returns. Shares of discount retailer Dollar General Corp. benefited from solid same store sales growth, driven by an increase in average transaction size, as well as from investors rotating into more durable names due to increased market volatility.
Information technology (“IT”) also added value due to stock picks. IT experienced significant volatility during the year, and Keysight Technologies Inc., the largest global manufacturer of electronic test and measurement equipment, held up better than many industry peers, posting a third consecutive set of beat and raise quarterly results, with multiple business segments contributing. While a significant write down in the value of recently acquired IXIA disappointed investors, the business should be valuable for 5G as it performs the essential task of bringing wired and wireless together. We believe the company's focus on solutions based sales and service revenue growth will contribute to margin expansion going forward.
Conversely, stock selection in consumer staples detracted most from relative results. Shares of packaged food company ConAgra Brands Inc. (“ConAgra”) declined as the company faced challenges related to its recent acquisition of Pinnacle Foods Inc. (“Pinnacle”), including slowing sales growth in some of the newly acquired frozen food brands. While we acknowledge the ongoing challenges in integrating and revitalizing the Pinnacle brands, we like ConAgra Brands' relatively stable cash flow generation and strong management team.
Top purchases for the year were: Sensata Technologies Holding Plc (“Sensata”), Aptiv Plc, Corning Inc., Dollar Tree Inc., Sempra Energy. Top sales for the year were: Sensata, Red Hat Inc., Progressive Corp., Fiserv Inc., CSRA Inc.
We don't believe current market conditions expose the Fund to a particular or significant risk. We moved the Fund to a more defensive position in recent quarters given the worrisome echoes with past periods of exuberance, in particular, the dot-com bubble of the late 1990s, although valuations in 2018 never reached those extremes. For the past several years, we have warned that companies were gorging on nearly cost free financing due to the U.S. Federal Reserve’s extraordinary monetary easing. We are now keeping a close eye on how individual companies are faring as interest rates have risen. The outlook for the market is highly uncertain, but we are confident that our careful research process and our emphasis on reasonably valued mid-cap growth stocks will again serve our shareholders well if the downturn continues.
Finally, although permitted in accordance with Fund guidelines, derivative instruments are not used in the management of the Fund.
80
| JNL/T. Rowe Price Short-Term Bond Fund T. Rowe Price Associates, Inc. (Unaudited) |

JNL/T. Rowe Price Short-Term Bond Fund
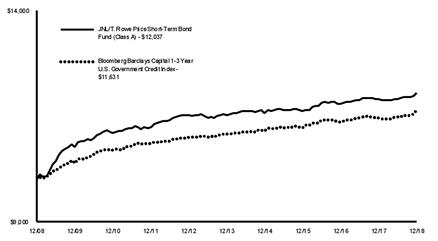
Average Annual Total Returns |
| |||||
Class A |
|
|
| Class I |
|
|
1 Year | 1.10 | % | 1 Year | 1.41 | % | |
5 Year | 0.88 |
|
| 5 Year | 1.13 |
|
10 Year | 1.87 |
|
| 10 Year | 2.09 |
|
The graph shows the change in value of an assumed $10,000 investment in the Fund's Class A shares over 10 years, or since inception if the inception is less than 10 years, as well as the Fund's benchmark(s) performance for the same period.
Past performance is not predictive of future performance. Investment return and principal value will fluctuate so that an investor’s shares, when redeemed, may be worth more or less than their original cost. Performance numbers are net of all Fund operating expenses, but do not reflect the deduction of insurance charges.
T. Rowe Price Associates, Inc. assumed portfolio management responsibility on September 28, 2009.
Composition as of December 31, 2018: | ||
Non-U.S. Government Agency ABS | 24.3 | % |
Financials | 21.6 | |
Government Securities | 19.0 | |
U.S. Government Agency MBS | 7.0 | |
Energy | 3.8 | |
Health Care | 3.7 | |
Industrials | 3.4 | |
Communication Services | 3.2 | |
Information Technology | 2.4 | |
Materials | 2.4 | |
Consumer Discretionary | 2.3 | |
Consumer Staples | 2.2 | |
Utilities | 2.1 | |
Real Estate | 1.0 | |
Securities Lending Collateral | 0.9 | |
Other Short Term Investments | 0.7 | |
Total Investments | 100.0 | % |
For the year ended December 31, 2018, JNL/T. Rowe Price Short-Term Bond Fund underperformed its benchmark by posting a return of 1.10% for Class A shares compared to 1.60% for the Bloomberg Barclays 1-3 Year U.S. Government Credit Index.
An out of benchmark allocation to Treasury inflation protected securities weighed on returns, as inflation expectations moderated throughout the year. Security selection within crossover corporate bonds was a modest drag on performance. Select bonds from Italian corporates declined amid investor concerns about Italy’s large public debt. Out of benchmark allocation to mortgage-backed securities was a modest drag on results.
Demand from investors looking to reduce interest rate risk provided support for short maturity corporate bonds. As a result, the Fund’s significant overweight to corporates provided a meaningful contribution to relative results. Strong corporate earnings reports, supported by federal tax cuts and generally solid economic growth, supported investor sentiment for the majority of the year. Concerns about global trade amid tariff disputes between the U.S. and China, however, weighed on corporate issues near the end of the year. Our structural underweight to Treasuries was positive as investors sought higher yielding, high quality investments with short durations. Treasury yields rose as positive economic news, four rate hikes and increased borrowing by the U.S. government reduced investor demand for Treasury securities until the end of the year when equity market volatility drove demand for safe haven assets.
As of December 31, 2018, the Fund held interest rate futures and currency forwards generating gross exposure of approximately 19.6%. The estimated return impact from employing currency forwards was negligible and -2 basis points from futures for the year.
Our outlook for the coming months remains somewhat guarded, which is reflected in the Fund’s relatively defensive profile. Growth slowed overseas in 2018 and is beginning to slow in the U.S. as the year comes to an end. Fiscal stimulus from tax cuts and spending increases will fade throughout 2019. Led by the U.S. Federal Reserve (“Fed”), global central banks have been withdrawing liquidity over the past year. However, current rates are very near or at the neutral rate, which should allow the Fed more degrees of freedom in its policy decisions. We favor higher quality, higher liquidity names in the front end of the curve. By focusing on bonds maturing within the next 18 months we are able to benefit in a carry environment while being defensive in a credit sell off.
81
| JNL/T. Rowe Price Value Fund T. Rowe Price Associates, Inc. (Unaudited) |

JNL/T. Rowe Price Value Fund
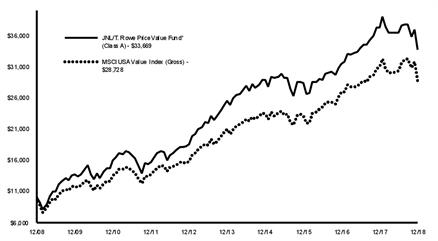
Average Annual Total Returns* |
| |||||
Class A |
|
|
| Class I |
|
|
1 Year | -9.58 | % | 1 Year | -9.30 | % | |
5 Year | 5.75 |
|
| 5 Year | 5.98 |
|
10 Year | 12.91 |
|
| 10 Year | 13.15 |
|
*The Fund's investment adviser waived/reimbursed certain expenses of the Fund. Performance results shown reflect the waiver, without which performance results would have been lower. |
| |||||
The graph shows the change in value of an assumed $10,000 investment in the Fund's Class A shares over 10 years, or since inception if the inception is less than 10 years, as well as the Fund's benchmark(s) performance for the same period.
Past performance is not predictive of future performance. Investment return and principal value will fluctuate so that an investor’s shares, when redeemed, may be worth more or less than their original cost. Performance numbers are net of all Fund operating expenses, but do not reflect the deduction of insurance charges.
Composition as of December 31, 2018: | ||
Health Care | 20.9 | % |
Financials | 17.4 | |
Information Technology | 13.0 | |
Utilities | 10.6 | |
Industrials | 8.5 | |
Consumer Staples | 7.3 | |
Energy | 7.1 | |
Communication Services | 6.2 | |
Consumer Discretionary | 3.8 | |
Materials | 2.5 | |
Real Estate | 1.9 | |
Other Short Term Investments | 0.8 | |
Total Investments | 100.0 | % |
For the year ended December 31, 2018, JNL/T. Rowe Price Value Fund underperformed its benchmark by posting a return of -9.58% for Class A shares compared to -7.18% for the MSCI USA Value Index (Gross).
The greatest detractor from relative performance was consumer staples due to stock selection (Tyson Foods Inc., Conagra Brands Inc.). Industrials hindered relative results due to an overweight position and stock choices (American Airlines Group Inc.). Materials detracted from relative performance due to stock selection (International Paper Co.), although a beneficial underweight position tempered the negative impact at the sector level. Health care was the leading contributor to relative results due to an overweight position and stock choices (Pfizer Inc.). Financials aided relative performance due to stock selection (XL Group Ltd.).
The five largest purchases during the year were Wells Fargo & Co., Total SA, Texas Instruments Inc., ExxonMobil Corp. and Verizon Communications Inc. The five largest sales during the year were JPMorgan Chase & Co., Citigroup Inc., Microsoft Corp., Chevron Corp. and Morgan Stanley.
At the sector level, the most significant decrease in weighting relative to the benchmark was in financials. The largest increase by relative weighting was in health care. The Fund’s sector weightings are residual of our bottom-up stock selection process and typically reflect where the Fund manager is finding compelling valuation opportunities at the individual company level rather than through a broader thematic approach.
We believe the market may remain volatile as macroeconomic and geopolitical developments unfold. As a result, we continue to take a balanced approach in the Fund. We favor solid businesses that we believe offer both downside protection and the potential to perform well in rising market environments. Amid the recent volatility, we found compelling buying opportunities within more cyclical areas of the market and in higher quality, traditionally defensive names that we believe were overly discounted in the broader sell-off.
Finally, although permitted in accordance with Fund guidelines, derivative instruments are not used in the management of the Fund.
82
| JNL/Vanguard ETF Allocation Funds Jackson National Asset Management, LLC (Unaudited) |

The JNL/Vanguard ETF Allocation Funds are allocated based on our most recent strategic asset allocation outlook and selection of underlying ETFs that provide the best fit in terms of diversification as well as the stated goal of each fund. Changes this year were mostly on the margin and involved modestly trimming U.S. equities in favor of international equities and reducing fixed income exposure to fund a modest new alternatives allocation to real estate. The case for international equities was based on relative improvement in long term forecasted returns owing in part to more favorable valuations than in the U.S. and better growth prospects. The Funds already had a sizeable allocation to emerging markets so the increase in international exposure went entirely to the Vanguard FTSE Developed Markets ETF.
In the fixed income sleeve, the Vanguard Intermediate-Term Corporate Bond, Vanguard Emerging Markets Government Bond and Vanguard Total Bond Market ETFs were trimmed while allocations to the Vanguard Short-Term Corporate Bond and Vanguard Mortgage-Backed Securities ETFs were increased. Real estate exposure was gained through both the U.S.-focused Vanguard Real Estate and Vanguard Global ex-US Real Estate ETFs.
JNL/Vanguard Growth ETF Allocation Fund
Composition as of December 31, 2018: | ||
Domestic Equity | 41.4 | % |
International Equity | 19.8 | |
Domestic Fixed Income | 15.4 | |
Emerging Markets Equity | 6.7 | |
Alternative | 3.0 | |
International Fixed Income | 1.9 | |
Securities Lending Collateral | 11.7 | |
Other Short Term Investments | 0.1 | |
Total Investments | 100.0 | % |
The investment objective for JNL/Vanguard Growth ETF Allocation Fund is to seek long term growth of capital through investment in exchange-traded funds (“ETFs”). The Fund seeks to achieve its investment objective primarily through investing at least 80% of its assets in a diversified group of underlying ETFs. The Adviser allocates approximately 70% to 90% of the Fund’s assets to underlying ETFs that invest primarily in equity securities and 10% to 30% of the Fund’s assets to underlying ETFs that invest primarily in fixed income securities and/or cash alternatives.
For the year ended December 31, 2018, JNL/Vanguard Growth ETF Allocation Fund underperformed its primary benchmark by posting a return of -7.91% for Class A shares compared to -7.33 % for the Dow Jones Moderately Aggressive Index. The Fund underperformed its blended benchmark return of -7.45% for the 80% MSCI All Country World Index (Net), 20% Bloomberg Barclays U.S. Aggregate Index.
The Fund underperformed its blended benchmark during 2018 due to underlying allocations in fixed income and exposure to small- and mid-cap U.S. equities. Within the fixed income sleeve, an allocation to the Vanguard Intermediate-Term Corporate Bond ETF detracted as corporate credit spreads widened and rates rose for most of the year. A smaller position in the Vanguard Emerging Markets Government Bond ETF also detracted amid broad emerging market weakness.
Small- and mid-cap equities were both down more than 9% during the year. The real estate addition added to relative results after its inclusion in the portfolio with the Vanguard Real Estate ETF (+2.64%) posting positive returns after its purchase in March. The Vanguard Growth ETF (-3.30%) also offset some of the small and mid-cap weakness by outperforming the broader market. Internationally, both the Vanguard FTSE Developed Markets (-14.75%) and Vanguard FTSE Emerging Markets (-14.77%) ETFs were the worst absolute performers in the Fund, though as the year went on the international equity stake became an underweight position that ended up being additive to relative results.
JNL/Vanguard Moderate ETF Allocation Fund
Composition as of December 31, 2018: | ||
Domestic Fixed Income | 55.1 | % |
Domestic Equity | 24.0 | |
International Equity | 11.1 | |
Emerging Markets Equity | 3.5 | |
International Fixed Income | 3.3 | |
Alternative | 1.9 | |
Securities Lending Collateral | 1.1 | |
Other Short Term Investments | - | |
Total Investments | 100.0 | % |
The investment objective for JNL/Vanguard Moderate ETF Allocation Fund is to seek long term growth of capital through investment in exchange-traded funds (“ETFs”). The Fund seeks to achieve its investment objective primarily through investing at least 80% of its assets in a diversified group of underlying ETFs. The Adviser allocates approximately 30% to 50% of the Fund’s assets to underlying ETFs that invest primarily in equity securities and 50% to 70% of the Fund’s assets to underlying ETFs that invest primarily in fixed income securities and/or cash alternatives.
For the year ended December 31, 2018, JNL/Vanguard Moderate ETF Allocation Fund underperformed its primary benchmark by posting a return of -4.59% for Class A shares compared to -3.15% for the Dow Jones Moderately Conservative Index. The Fund underperformed its blended benchmark return of -3.63% for the 40% MSCI All Country World Index (Net), 60% Bloomberg Barclays U.S. Aggregate Index.
The Fund underperformed its blended benchmark during 2018 due to a slight underweight and underlying allocations in fixed income and exposure to small- and mid-cap U.S. equities. Within the fixed income sleeve, an allocation to the Vanguard Intermediate-Term Corporate Bond ETF detracted as corporate credit spreads widened and rates rose for most of the year. A smaller position in the Vanguard Emerging Markets Government Bond ETF also detracted amid broad emerging market weakness.
Small- and mid-cap equities were both down more than 9% during the year. The real estate addition added to relative results after its inclusion in the Fund with the Vanguard Real Estate ETF (+2.64%) posting positive returns after its purchase in March. The Vanguard Growth ETF (-3.30%) also offset some of the small and mid-cap weakness by outperforming the broader market. Internationally, both the Vanguard FTSE Developed Markets (-14.75%) and Vanguard FTSE Emerging Markets (-14.77%) ETFs were the worst absolute performers in the Fund, though as the year went on the international equity stake became an underweight position that ended up being additive to relative results.
JNL/Vanguard Moderate Growth ETF Allocation Fund
Composition as of December 31, 2018: | ||
Domestic Equity | 35.5 | % |
Domestic Fixed Income | 34.0 | |
International Equity | 16.4 | |
Emerging Markets Equity | 5.2 | |
International Fixed Income | 3.1 | |
Alternative | 2.5 | |
Securities Lending Collateral | 3.2 | |
Other Short Term Investments | 0.1 | |
Total Investments | 100.0 | % |
The investment objective for JNL/Vanguard Moderate Growth ETF Allocation Fund is to seek long term growth of capital through investment in exchange-traded funds (“ETFs”). The Fund seeks to achieve its investment objective primarily through investing at least 80% of its assets in a diversified group of underlying ETFs. The Adviser allocates approximately 50% to 70% of the Fund’s assets to underlying ETFs that invest primarily in equity securities and 30% to 50% of the Fund’s assets to underlying ETFs that invest primarily in fixed income securities and/or cash alternatives.
83
| JNL/Vanguard ETF Allocation Funds Jackson National Asset Management, LLC (Unaudited) |

For the year ended December 31, 2018, JNL/Vanguard Moderate Growth ETF Allocation Fund underperformed its primary benchmark by posting a return of -6.46% for Class A shares compared to -5.21% for the Dow Jones Moderate Index. The Fund underperformed its blended benchmark return of -5.52% for the 60% MSCI All Country World Index (Net), 40% Bloomberg Barclays U.S. Aggregate Index.
The Fund underperformed its blended benchmark during 2018 due to a slight underweight and underlying allocations in fixed income and exposure to small- and mid-cap U.S. equities. Within the fixed income sleeve, an allocation to the Vanguard Intermediate-Term Corporate Bond ETF detracted as corporate credit spreads widened and rates rose for most of the year. A smaller position in the Vanguard Emerging Markets Government Bond ETF also detracted amid broad emerging market weakness.
Small- and mid-cap equities were both down more than 9% during the year. The real estate addition added to relative results after its inclusion in the portfolio with the Vanguard Real Estate ETF (+2.64%) posting positive returns after its purchase in March. The Vanguard Growth ETF (-3.30%) also offset some of the small- and mid-cap weakness by outperforming the broader market. Internationally, both the Vanguard FTSE Developed Markets (-14.75%) and Vanguard FTSE Emerging Markets (-14.77%) ETFs were the worst absolute performers in the Fund, though as the year went on the international equity stake became an underweight position that ended up being additive to relative results.
84
| JNL/Vanguard ETF Allocation Funds Jackson National Asset Management, LLC (Unaudited) |

JNL/Vanguard Growth ETF Allocation Fund
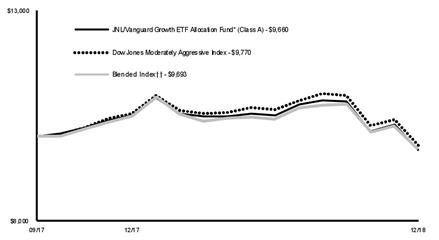
††80% MSCI All Country World Index (Net), 20% Bloomberg Barclays U.S. Aggregate Index
Average Annual Total Returns* |
| |||||
Class A‡ |
|
|
| Class I† |
|
|
1 Year | -7.91 | % | 1 Year | -7.52 | % | |
Since Inception | -2.69 |
|
| Since Inception | -2.21 |
|
‡Inception date September 25, 2017 |
| |||||
†Inception date September 25, 2017 |
| |||||
*The Fund's investment adviser waived/reimbursed certain expenses of the Fund. Performance results shown reflect the waiver, without which performance results would have been lower. |
| |||||
The graph shows the change in value of an assumed $10,000 investment in the Fund's Class A shares over 10 years, or since inception if the inception is less than 10 years, as well as the Fund's benchmark(s) performance for the same period.
Past performance is not predictive of future performance. Investment return and principal value will fluctuate so that an investor’s shares, when redeemed, may be worth more or less than their original cost. Performance numbers are net of all Fund operating expenses, but do not reflect the deduction of insurance charges.
JNL/Vanguard Moderate ETF Allocation Fund
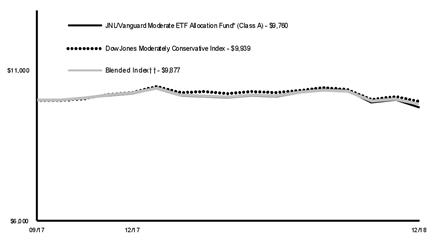
††40% MSCI All Country World Index (Net), 60% Bloomberg Barclays U.S. Aggregate Index
Average Annual Total Returns* |
| |||||
Class A‡ |
|
|
| Class I† |
|
|
1 Year | -4.59 | % | 1 Year | -4.10 | % | |
Since Inception | -1.90 |
|
| Since Inception | -1.42 |
|
‡Inception date September 25, 2017 |
| |||||
†Inception date September 25, 2017 |
| |||||
*The Fund's investment adviser waived/reimbursed certain expenses of the Fund. Performance results shown reflect the waiver, without which performance results would have been lower. |
| |||||
The graph shows the change in value of an assumed $10,000 investment in the Fund's Class A shares over 10 years, or since inception if the inception is less than 10 years, as well as the Fund's benchmark(s) performance for the same period.
Past performance is not predictive of future performance. Investment return and principal value will fluctuate so that an investor’s shares, when redeemed, may be worth more or less than their original cost. Performance numbers are net of all Fund operating expenses, but do not reflect the deduction of insurance charges.
JNL/Vanguard Moderate Growth ETF Allocation Fund

††60% MSCI All Country World Index (Net), 40% Bloomberg Barclays U.S. Aggregate Index
Average Annual Total Returns* |
| |||||
Class A‡ |
|
|
| Class I† |
|
|
1 Year | -6.46 | % | 1 Year | -6.07 | % | |
Since Inception | -2.37 |
|
| Since Inception | -1.98 |
|
‡Inception date September 25, 2017 |
| |||||
†Inception date September 25, 2017 |
| |||||
*The Fund's investment adviser waived/reimbursed certain expenses of the Fund. Performance results shown reflect the waiver, without which performance results would have been lower. |
| |||||
The graph shows the change in value of an assumed $10,000 investment in the Fund's Class A shares over 10 years, or since inception if the inception is less than 10 years, as well as the Fund's benchmark(s) performance for the same period.
Past performance is not predictive of future performance. Investment return and principal value will fluctuate so that an investor’s shares, when redeemed, may be worth more or less than their original cost. Performance numbers are net of all Fund operating expenses, but do not reflect the deduction of insurance charges.
85
| JNL/Westchester Capital Event Driven Fund Westchester Capital Management, LLC (Unaudited) |

JNL/Westchester Capital Event Driven Fund
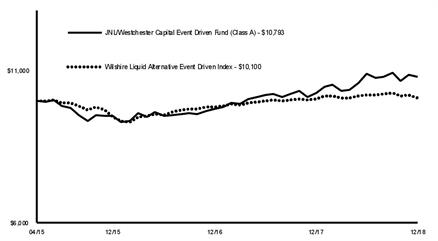
Average Annual Total Returns |
| |||||
Class A‡ |
|
|
| Class I† |
|
|
1 Year | 5.04 | % | 1 Year | 5.31 | % | |
Since Inception | 2.09 |
|
| Since Inception | 5.16 |
|
‡Inception date April 27, 2015 |
| |||||
†Inception date September 25, 2017 |
| |||||
The graph shows the change in value of an assumed $10,000 investment in the Fund's Class A shares over 10 years, or since inception if the inception is less than 10 years, as well as the Fund's benchmark(s) performance for the same period.
Past performance is not predictive of future performance. Investment return and principal value will fluctuate so that an investor’s shares, when redeemed, may be worth more or less than their original cost. Performance numbers are net of all Fund operating expenses, but do not reflect the deduction of insurance charges.
Composition as of December 31, 2018: | ||
Financials | 32.9 | % |
Energy | 13.2 | |
Communication Services | 11.9 | |
Investment Companies | 8.1 | |
Materials | 8.1 | |
Industrials | 5.3 | |
Health Care | 4.6 | |
Information Technology | 3.7 | |
Consumer Staples | 3.1 | |
Real Estate | 1.3 | |
Warrants | 0.4 | |
Rights | 0.2 | |
Other Equity Interests | - | |
Consumer Discretionary | (0.1) | |
Utilities | (2.8) | |
Other Short Term Investments | 10.1 | |
Net Long (Short) Investments | 100.0 | % |
For the year ended December 31, 2018, JNL/Westchester Capital Event Driven Fund outperformed its benchmark by posting a return of 5.04% for Class A shares compared to 0.26% for the Wilshire Liquid Alternative Event Driven Index.
While macro factors may influence the Fund, our investment returns are primarily driven by outcomes of corporate events. The top three contributors included Sky Plc/Twenty-First Century Fox Inc. (“Twenty-First Century”), Twenty-First Century Fox/Walt Disney Co. and Time Warner Inc./AT&T Inc.; while the biggest detractors were NXP Semiconductors NV/QUALCOMM Inc., Colony NorthStar Inc. and Tenneco Inc. We ended the year with 97 positions and were approximately 123% invested.
While concern about changes in the regulatory environment, an uncertain political landscape and, most importantly, early indicators of an economic downturn may cause investors to be more cautious, we believe the key drivers of many deals in 2018 – that corporate and private equity investors continue to have record access to capital, have strong cash reserves along with ready access to financing – provide significant support for transaction activity in the year ahead.
The Fund utilizes derivatives to either hedge directional exposure of underlying long positions or arbitrage situations, or to reduce the correlation of an underlying equity position. Derivatives did not have a material impact to Fund performance during the year.
We do not typically sell naked short options, nor do we speculate via long options, so the positions listed here generally reflect long equity positions with options written against it and/or long puts on that underlying or a highly correlated index/exchange traded fund.
86
| JNL/WMC Balanced Fund Wellington Management Company, LLP (Unaudited) |

JNL/WMC Balanced Fund
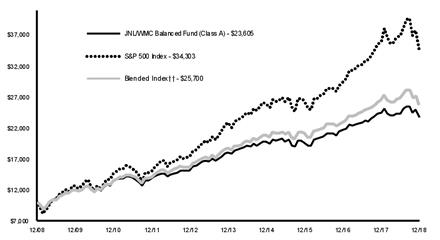
††65% S&P 500 Index, 35% Bloomberg Barclays U.S. Aggregate Bond Index
Average Annual Total Returns |
| |||||
Class A |
|
|
| Class I |
|
|
1 Year | -3.41 | % | 1 Year | -3.15 | % | |
5 Year | 5.56 |
|
| 5 Year | 5.79 |
|
10 Year | 8.97 |
|
| 10 Year | 9.20 |
|
The graph shows the change in value of an assumed $10,000 investment in the Fund's Class A shares over 10 years, or since inception if the inception is less than 10 years, as well as the Fund's benchmark(s) performance for the same period.
Past performance is not predictive of future performance. Investment return and principal value will fluctuate so that an investor’s shares, when redeemed, may be worth more or less than their original cost. Performance numbers are net of all Fund operating expenses, but do not reflect the deduction of insurance charges.
Composition as of December 31, 2018: | ||
Financials | 18.2 | % |
Health Care | 12.1 | |
U.S. Government Agency MBS | 10.3 | |
Information Technology | 8.8 | |
Communication Services | 7.0 | |
Energy | 6.6 | |
Government Securities | 6.2 | |
Utilities | 5.5 | |
Industrials | 5.5 | |
Non-U.S. Government Agency ABS | 5.5 | |
Consumer Staples | 3.9 | |
Consumer Discretionary | 3.4 | |
Materials | 3.0 | |
Real Estate | 2.3 | |
Other Short Term Investments | 1.4 | |
Securities Lending Collateral | 0.3 | |
Net Long (Short) Investments | 100.0 | % |
For the year ended December 31, 2018, JNL/WMC Balanced Fund outperformed its primary benchmark by posting a return of -3.41% for Class A shares compared to -4.38% for the S&P 500 Index. The Fund underperformed its blended benchmark return of -2.58% for the 65% S&P 500 Index and 35% Bloomberg Barclays U.S. Aggregate Bond Index.
The equity portfolio trailed the S&P 500 Index during the year. Sector allocation, a result of the fundamental, bottom-up stock selection process, was the primary driver of relative underperformance, while security selection contributed positively but was not enough to offset weakness elsewhere. Our overweight exposures to financials and energy had a negative impact on relative performance. Our overweight exposure to utilities and underweight exposure to industrials had a modest positive impact on relative performance. Security selection in communication services, health care and energy contributed most to relative performance while selection in consumer discretionary and financials detracted.
Top contributors to relative performance within the equity portfolio included Verizon Communications Inc. (“Verizon”) (communication services) and Motorola Solutions Inc. (information technology). Not owning Facebook Inc. (communication services) and our underweight to General Electric Co. (industrials) also contributed to relative performance. Top detractors within the equity portfolio included Prudential Financial Inc. (financials), Principal Financial Group Inc. (financials), and Halliburton Co. (energy). Not owning benchmark constituent Amazon.com Inc. (consumer discretionary) also detracted from relative performance.
General Dynamics Corp. (“General Dynamics”) (industrials) and Simon Property Group Inc. (“Simon Property”) (real estate) were new additions to the Fund during the year. We established our position in aerospace and defense contractor General Dynamics when shares sold off due to concerns about cyclicality in the defense business. We also increased our positions in Exxon Mobil Corp. (energy) and Verizon (communication services) during the year. We eliminated Total S.A. (energy) from the Fund as the company appeared to offer less favorable risk reward, and trimmed Intel Corp. (information technology).
As of the end of the year, the equity portfolio was most overweight financials, energy and utilities and most underweight consumer discretionary and information technology.
Global fixed income markets largely generated negative total returns during the year, driven by corporate spread widening and higher yields in the U.S. and select Emerging Markets government bond markets. Geopolitical uncertainty remained elevated.
The fixed income portfolio posted positive absolute and relative returns, outperforming the benchmark during the year. The Fund’s aggregate short duration/yield curve positioning contributed the most as rates rose over the year. Investment grade credit positioning detracted overall: positive impact from a modest overweight to and security selection within industrials and security selection within sovereigns were offset by negative impacts from an overweight to banking and overweight to and security selection within electric utilities. Within securitized sectors, an overweight to asset backed securities (“ABS”) had a positive impact. Inflation positioning via Treasury inflation protected securities (“TIPS”) detracted from performance, particularly in the last quarter as TIPS underperformed duration equivalent nominal U.S. Treasuries.
Over the year, we reduced the overweight exposure to corporates while favoring higher quality and less cyclical sectors. The Fund is currently positioned with a modestly short duration posture and maintains an allocation to TIPS. As of the end of the year, the Fund is overweight taxable municipals (which the Fund believes offer diversification benefits) and overweight investment grade corporates, favoring U.S. financials. The Fund’s also overweight commercial mortgage backed securities and ABS (including an out of benchmark allocation to high quality collateralized loan obligation). The Fund owns Fannie Mae Delegated Underwriting and Servicing securities and collateralized mortgage obligations for their favorable pre-payment profile.
At the end of the year, the Fund’s asset mix was aligned to its target, with 65% equities and 35% fixed income. While the fixed income portfolio did utilize bond futures for hedging purposes, these derivatives did not have a meaningful impact on performance.
87
| JNL/WMC Value Fund Wellington Management Company, LLP (Unaudited) |

JNL/WMC Value Fund

Average Annual Total Returns |
| |||||
Class A |
|
|
| Class I |
|
|
1 Year | -10.30 | % | 1 Year | -10.02 | % | |
5 Year | 4.80 |
|
| 5 Year | 5.05 |
|
10 Year | 10.28 |
|
| 10 Year | 10.52 |
|
The graph shows the change in value of an assumed $10,000 investment in the Fund's Class A shares over 10 years, or since inception if the inception is less than 10 years, as well as the Fund's benchmark(s) performance for the same period.
Past performance is not predictive of future performance. Investment return and principal value will fluctuate so that an investor’s shares, when redeemed, may be worth more or less than their original cost. Performance numbers are net of all Fund operating expenses, but do not reflect the deduction of insurance charges.
Composition as of December 31, 2018: | ||
Financials | 23.2 | % |
Health Care | 16.4 | |
Information Technology | 11.9 | |
Energy | 10.6 | |
Industrials | 8.3 | |
Communication Services | 6.2 | |
Consumer Staples | 6.2 | |
Utilities | 4.6 | |
Consumer Discretionary | 4.2 | |
Materials | 3.8 | |
Real Estate | 3.1 | |
Other Short Term Investments | 1.2 | |
Securities Lending Collateral | 0.3 | |
Total Investments | 100.0 | % |
For the year ended December 31, 2018, JNL/WMC Value Fund underperformed its benchmark by posting a return of -10.30% for Class A shares compared to -7.18% for the MSCI USA Value Index (Gross).
Stock selection was the main detractor from relative performance. Weak selection within consumer staples, consumer discretionary and energy weighed on relative results. This was partially offset by strong selection in information technology (“IT”), communication services and real estate. Sector allocation, a result of our fundamental bottom-up process, also detracted from relative performance. Our overweight allocation to energy and financials detracted but was partially offset by our underweight position in consumer staples, which contributed to relative results during the year.
Top relative detractors from performance during the year included not holding benchmark constituent Pfizer Inc. and our positions in Invesco Ltd. and Fortune Brands Home & Security Inc. Top contributors to relative performance during the year included an overweight position in Eli Lilly & Co., a position in XL Group Ltd. (“XL Group”) earlier in the year and our decision to exit General Electric Co. earlier in the year.
The largest purchases during the year included new positions in Anthem Inc., Crown Castle International Corp., and an increased position in Comcast Corp. The largest sales during the year included eliminating our exposure to Marathon Oil Corp., TJX Cos. Inc. and XL Group.
The Fund’s largest overweight at the end of the year was in financials. During the year, the Fund most notably increased its exposure to energy, health care, consumer staples and real estate and reduced exposure to financials, IT, industrials and consumer discretionary.
Derivatives were not utilized during the year.
88
JNL Series Trust Sub-Advised Funds
Schedules of Investments (in thousands)
December 31, 2018
Shares/Par1 | Value ($) | ||||||
JNL/AB Dynamic Asset Allocation Fund (a) | |||||||
INVESTMENT COMPANIES 81.4% | |||||||
FlexShares Global Upstream Natural Resources Index Fund (b) | 7 | 190 | |||||
iShares Core MSCI EAFE ETF | 47 | 2,594 | |||||
iShares Core MSCI Emerging Markets ETF | 28 | 1,296 | |||||
iShares Core S&P 500 ETF | 27 | 6,846 | |||||
iShares International Developed Real Estate ETF (b) | 14 | 361 | |||||
SPDR S&P 500 ETF Trust (b) | 23 | 5,772 | |||||
Vanguard FTSE Developed Markets ETF | 143 | 5,317 | |||||
Vanguard Global ex-U.S. Real Estate ETF (b) | 9 | 489 | |||||
Vanguard Mid-Cap ETF | 9 | 1,220 | |||||
Vanguard MSCI Emerging Markets ETF | 23 | 889 | |||||
Vanguard REIT ETF (b) | 7 | 529 | |||||
Vanguard Small-Cap ETF (b) | 5 | 685 | |||||
Total Investment Companies (cost $26,366) | 26,188 | ||||||
SHORT TERM INVESTMENTS 33.4% | |||||||
Investment Companies 3.3% | |||||||
JNL Government Money Market Fund - Institutional Class, 2.31% (c) (d) | 1,068 | 1,068 | |||||
Shares/Par1 | Value ($) | ||||||
Securities Lending Collateral 15.8% | |||||||
JNL Securities Lending Collateral Fund - Institutional Class, 2.46% (c) (d) | 5,102 | 5,102 | |||||
Treasury Securities 14.3% | |||||||
Japan Treasury Bill | |||||||
-0.30%, 01/21/19, JPY (e) | 301,000 | 2,747 | |||||
U.S. Treasury Bill | |||||||
2.19%, 01/31/19 (e) (f) | 850 | 848 | |||||
2.22%, 02/14/19 (e) | 1,000 | 997 | |||||
4,592 | |||||||
Total Short Term Investments (cost $10,698) | 10,762 | ||||||
Total Investments 114.8% (cost $37,064) | 36,950 | ||||||
Other Derivative Instruments 0.9% | 289 | ||||||
Other Assets and Liabilities, Net (15.7)% | (5,053) | ||||||
Total Net Assets 100.0% | 32,186 | ||||||
(a) Consolidated Schedule of Investments.
(b) All or portion of the security was on loan.
(c) Investment in affiliate.
(d) Yield changes daily to reflect current market conditions. Rate was the quoted yield as of December 31, 2018.
(e) The coupon rate represents the yield to maturity.
(f) All or a portion of the security is pledged or segregated as collateral.
JNL/AB Dynamic Asset Allocation Fund — Futures Contracts | ||||||||||||||||
Reference Entity | Contracts Long (Short)1 | Expiration | Notional 1 | Variation Margin Receivable (Payable) ($) | Unrealized Appreciation (Depreciation) ($) | |||||||||||
ASX SPI 200 Index | 1 | March 2019 | AUD | 135 | (1) | 3 | ||||||||||
Australia Commonwealth Treasury Bond, 10-Year | 2 | March 2019 | AUD | 262 | 1 | 2 | ||||||||||
E-Mini MSCI Emerging Markets Index | 12 | March 2019 | 591 | (2) | (11) | |||||||||||
E-Mini Russell 2000 Index | 8 | March 2019 | 582 | 3 | (43) | |||||||||||
Euro STOXX 50 | 15 | March 2019 | EUR | 452 | — | (6) | ||||||||||
FTSE 100 Index | 5 | March 2019 | GBP | 333 | (1) | — | ||||||||||
Hang Seng Index | (3) | January 2019 | HKD | (3,831) | (5) | (6) | ||||||||||
S&P 500 E-Mini Index | (14) | March 2019 | (1,781) | (13) | 27 | |||||||||||
S&P/Toronto Stock Exchange 60 Index | (3) | March 2019 | CAD | (531) | (2) | 12 | ||||||||||
Tokyo Price Index | 5 | March 2019 | JPY | 78,156 | — | (31) | ||||||||||
U.S. Treasury Note, 10-Year | 21 | March 2019 | 2,503 | 8 | 59 | |||||||||||
U.S. Treasury Note, 2-Year | 17 | March 2019 | 3,586 | 2 | 24 | |||||||||||
U.S. Treasury Note, 5-Year | 4 | March 2019 | 451 | 1 | 7 | |||||||||||
Ultra Long Term U.S. Treasury Bond | 11 | March 2019 | 1,684 | 6 | 84 | |||||||||||
(3) | 121 | |||||||||||||||
Forward Foreign Currency Contracts
Purchased/ Sold | Counter-party | Expiration | Notional 1 | Value ($) | Unrealized Appreciation (Depreciation) ($) | |||||||||||||
AUD/USD | CSI | 03/15/19 | AUD | 305 | 215 | (4) | ||||||||||||
AUD/USD | SSB | 03/15/19 | AUD | 137 | 97 | (2) | ||||||||||||
CAD/USD | SSB | 03/15/19 | CAD | 231 | 169 | (4) | ||||||||||||
EUR/USD | JPM | 03/15/19 | EUR | 225 | 259 | 1 | ||||||||||||
EUR/USD | SSB | 03/15/19 | EUR | 272 | 314 | 1 | ||||||||||||
EUR/USD | UBS | 03/15/19 | EUR | 39 | 45 | — | ||||||||||||
GBP/USD | SSB | 03/15/19 | GBP | 38 | 48 | (1) | ||||||||||||
GBP/USD | SSB | 03/15/19 | GBP | 136 | 174 | — | ||||||||||||
JPY/USD | SSB | 01/28/19 | JPY | 43,630 | 399 | 12 | ||||||||||||
NOK/USD | JPM | 03/15/19 | NOK | 1,037 | 120 | (2) | ||||||||||||
NOK/USD | SSB | 03/15/19 | NOK | 992 | 115 | (2) | ||||||||||||
NZD/USD | SSB | 03/15/19 | NZD | 351 | 236 | (6) | ||||||||||||
SEK/USD | SSB | 03/15/19 | SEK | 2,075 | 235 | 4 | ||||||||||||
USD/AUD | SSB | 03/15/19 | AUD | (289) | (204) | 5 | ||||||||||||
USD/CAD | MSC | 03/15/19 | CAD | (205) | (151) | 2 | ||||||||||||
USD/CAD | SSB | 03/15/19 | CAD | (668) | (490) | 11 | ||||||||||||
USD/CHF | SSB | 03/15/19 | CHF | (237) | (242) | (1) | ||||||||||||
USD/EUR | SSB | 03/15/19 | EUR | (211) | (243) | (2) | ||||||||||||
USD/EUR | SSB | 03/15/19 | EUR | (141) | (162) | — | ||||||||||||
USD/GBP | JPM | 03/15/19 | GBP | (37) | (47) | — | ||||||||||||
USD/JPY | MSC | 01/28/19 | JPY | (193,175) | (1,766) | (26) | ||||||||||||
USD/JPY | RBS | 03/15/19 | JPY | (51,685) | (474) | (16) | ||||||||||||
USD/JPY | SSB | 03/15/19 | JPY | (9,802) | (90) | (2) | ||||||||||||
USD/JPY | UBS | 03/15/19 | JPY | (58,511) | (537) | (17) | ||||||||||||
USD/SEK | SSB | 03/15/19 | SEK | (1,134) | (129) | (2) | ||||||||||||
(2,109) | (51) | |||||||||||||||||
JNL/AB Dynamic Asset Allocation Fund — OTC Interest Rate Swap Agreements | |||||||||||||||||||||
Floating Rate Index2 | Paying/ Receiving Floating Rate | Counterparty | Fixed Rate2 (%) | Expiration | Notional 1 | Premiums Paid (Received) ($) | Unrealized Appreciation (Depreciation) ($) | ||||||||||||||
US CPURNSA (A) | Receiving | MLP | 2.23 | (A) | 07/31/21 | 1,446 | — | (28) | |||||||||||||
See accompanying Notes to Financial Statements.
Abbreviations, counterparties and additional footnotes are defined on page 305.
89
JNL Series Trust Sub-Advised Funds
Schedules of Investments (in thousands)
December 31, 2018
US CPURNSA (A) | Receiving | MLP | 2.23 | (A) | 07/31/21 | 2,214 | — | (42) | |||||||||||||
— | (70) | ||||||||||||||||||||
JNL/AB Dynamic Asset Allocation Fund — OTC Total Return Swap Agreements | ||||||||||||||||
Reference Entity2 | Counter-party | Rate Paid/Received by Fund2,9 | Expiration | Notional1 | Premiums Paid (Received) ($) | Unrealized Appreciation (Depreciation) ($) | ||||||||||
Total return swap agreements - paying return | ||||||||||||||||
INDEX | ||||||||||||||||
S&P 500 Total Return (E) | CIT | 1M LIBOR +0.30% (M) | 01/15/19 | (3,637) | — | 57 | ||||||||||
S&P 500 Total Return (E) | CIT | 3M LIBOR +0.60% (Q) | 01/15/19 | (3,909) | — | 356 | ||||||||||
— | 413 | |||||||||||||||
See accompanying Notes to Financial Statements.
Abbreviations, counterparties and additional footnotes are defined on page 305.
90
JNL Series Trust Sub-Advised Funds
Schedules of Investments (in thousands)
December 31, 2018
Shares/Par1 | Value ($) | |||||
JNL/AQR Large Cap Relaxed Constraint Equity Fund * | ||||||
COMMON STOCKS 126.7% | ||||||
Communication Services 12.4% | ||||||
Alphabet Inc. - Class A (a) (b) | 7 | 7,326 | ||||
Alphabet Inc. - Class C (a) (b) | 6 | 5,890 | ||||
Comcast Corp. - Class A | 122 | 4,155 | ||||
Facebook Inc. - Class A (a) (b) | 84 | 10,954 | ||||
IAC/InterActiveCorp. (a) | 17 | 3,188 | ||||
Match Group Inc. (c) | 6 | 266 | ||||
Walt Disney Co. | 35 | 3,877 | ||||
Other Securities | 14,315 | |||||
49,971 | ||||||
Consumer Discretionary 19.4% | ||||||
Amazon.com Inc. (a) (b) | 9 | 13,989 | ||||
Booking Holdings Inc. (a) | 2 | 3,977 | ||||
Foot Locker Inc. | 95 | 5,066 | ||||
Macy's Inc. | 122 | 3,625 | ||||
Michael Kors Holdings Ltd. (a) | 99 | 3,755 | ||||
Target Corp. | 77 | 5,104 | ||||
TJX Cos. Inc. | 81 | 3,610 | ||||
Other Securities | 39,247 | |||||
78,373 | ||||||
Consumer Staples 4.4% | ||||||
Walmart Inc. (b) | 89 | 8,246 | ||||
Other Securities | 9,572 | |||||
17,818 | ||||||
Energy 8.9% | ||||||
Anadarko Petroleum Corp. | 84 | 3,677 | ||||
Chevron Corp. (b) | 65 | 7,080 | ||||
ConocoPhillips Co. (b) | 84 | 5,261 | ||||
Exxon Mobil Corp. | 67 | 4,582 | ||||
Valero Energy Corp. | 63 | 4,689 | ||||
Other Securities | 10,661 | |||||
35,950 | ||||||
Financials 11.5% | ||||||
Aflac Inc. (b) | 121 | 5,520 | ||||
Allstate Corp. | 43 | 3,548 | ||||
Bank of America Corp. | 141 | 3,475 | ||||
Berkshire Hathaway Inc. - Class B (a) | 23 | 4,709 | ||||
JPMorgan Chase & Co. (b) | 62 | 6,002 | ||||
PNC Financial Services Group Inc. | 30 | 3,451 | ||||
Other Securities | 19,675 | |||||
46,380 | ||||||
Health Care 24.4% | ||||||
AbbVie Inc. | 49 | 4,531 | ||||
Amgen Inc. | 25 | 4,821 | ||||
Baxter International Inc. | 60 | 3,956 | ||||
Biogen Inc. (a) (b) | 18 | 5,389 | ||||
Celgene Corp. (a) | 61 | 3,891 | ||||
Exelixis Inc. (a) | 210 | 4,132 | ||||
Shares/Par1 | Value ($) | |||||
Gilead Sciences Inc. (b) | 83 | 5,193 | ||||
Haemonetics Corp. (a) | 34 | 3,431 | ||||
Humana Inc. (b) | 20 | 5,634 | ||||
Johnson & Johnson (b) | 56 | 7,279 | ||||
McKesson Corp. | 41 | 4,564 | ||||
Merck & Co. Inc. (b) | 94 | 7,147 | ||||
Pfizer Inc. (b) | 165 | 7,202 | ||||
Other Securities | 31,023 | |||||
98,193 | ||||||
Industrials 10.1% | ||||||
Boeing Co. (b) | 24 | 7,610 | ||||
Other Securities | 32,917 | |||||
40,527 | ||||||
Information Technology 28.3% | ||||||
Adobe Inc. (a) (b) | 30 | 6,836 | ||||
Apple Inc. (b) | 93 | 14,691 | ||||
Cisco Systems Inc. (b) | 121 | 5,263 | ||||
Intel Corp. (b) | 198 | 9,300 | ||||
International Business Machines Corp. (b) | 58 | 6,607 | ||||
Microsoft Corp. (b) | 180 | 18,307 | ||||
Oracle Corp. (b) | 116 | 5,250 | ||||
Symantec Corp. | 185 | 3,492 | ||||
Texas Instruments Inc. | 41 | 3,843 | ||||
Other Securities | 40,629 | |||||
114,218 | ||||||
Materials 3.0% | ||||||
LyondellBasell Industries NV - Class A | 48 | 3,998 | ||||
Other Securities | 7,943 | |||||
11,941 | ||||||
Real Estate 3.1% | ||||||
Other Securities | 12,486 | |||||
Utilities 1.2% | ||||||
Exelon Corp. | 84 | 3,795 | ||||
Other Securities | 1,171 | |||||
4,966 | ||||||
Total Common Stocks (cost $526,414) | 510,823 | |||||
SHORT TERM INVESTMENTS 1.8% | ||||||
Investment Companies 1.8% | ||||||
JNL Government Money Market Fund - Institutional Class, 2.31% (d) (e) | 7,287 | 7,287 | ||||
Total Short Term Investments (cost $7,287) | 7,287 | |||||
Total Investments 128.5% (cost $533,701) | 518,110 | |||||
Total Securities Sold Short (28.6)% (proceeds $141,545) | (115,241) | |||||
Other Derivative Instruments 0.0% | 34 | |||||
Other Assets and Liabilities, Net 0.1% | 203 | |||||
Total Net Assets 100.0% | 403,106 | |||||
(a) Non-income producing security.
(b) All or a portion of the security is pledged or segregated as collateral.
(c) All or portion of the security was on loan.
(d) Investment in affiliate.
(e) Yield changes daily to reflect current market conditions. Rate was the quoted yield as of December 31, 2018.
Shares/Par1 | Value ($) | |||||
SECURITIES SOLD SHORT (28.6%) | ||||||
COMMON STOCKS (28.6%) | ||||||
Communication Services (1.1%) | ||||||
Discovery Inc. - Class A | (52) | (1,277) | ||||
GCI Liberty Inc. - Class A | (24) | (1,007) | ||||
Meredith Corp. | (39) | (2,029) | ||||
New York Times Co. - Class A | (8) | (174) | ||||
Take-Two Interactive Software Inc. | (1) | (81) | ||||
(4,568) | ||||||
Consumer Discretionary (5.4%) | ||||||
Adient Plc | (133) | (2,002) | ||||
Aptiv Plc | (1) | (82) | ||||
Caesars Entertainment Corp. | (304) | (2,066) | ||||
Carmax Inc. | (11) | (715) | ||||
Floor & Decor Holdings Inc. | (43) | (1,102) | ||||
HanesBrands Inc. | (71) | (892) | ||||
Shares/Par1 | Value ($) | |||||
Leggett & Platt Inc. | (10) | (355) | ||||
Newell Brands Inc. | (115) | (2,145) | ||||
Scientific Games Corp. - Class A | (99) | (1,764) | ||||
Tempur Sealy International Inc. | (27) | (1,128) | ||||
Tesla Inc. | (13) | (4,405) | ||||
TRI Pointe Homes Inc. | (7) | (79) | ||||
Under Armour Inc. - Class A | (115) | (2,028) | ||||
Visteon Corp. | (47) | (2,836) | ||||
(21,599) | ||||||
Consumer Staples (0.8%) | ||||||
Coty Inc. - Class A | (15) | (98) | ||||
Hain Celestial Group Inc. | (126) | (1,993) | ||||
Kraft Heinz Foods Co. | (29) | (1,266) | ||||
(3,357) | ||||||
Energy (3.9%) | ||||||
Callon Petroleum Co. | (250) | (1,621) | ||||
See accompanying Notes to Financial Statements.
Abbreviations, counterparties and additional footnotes are defined on page 305.
91
JNL Series Trust Sub-Advised Funds
Schedules of Investments (in thousands)
December 31, 2018
Shares/Par1 | Value ($) | ||||||
Centennial Resource Development Inc. - Class A | (29) | (325) | |||||
Core Laboratories NV | (19) | (1,154) | |||||
Diamond Offshore Drilling Inc. | (81) | (764) | |||||
Dril-Quip Inc. | (41) | (1,239) | |||||
Ensco Plc - Class A | (662) | (2,358) | |||||
EQT Corp. | (86) | (1,626) | |||||
Extraction Oil & Gas Inc. | (39) | (166) | |||||
Kosmos Energy Ltd. | (147) | (598) | |||||
Matador Resources Co. | (108) | (1,679) | |||||
Nabors Industries Ltd. | (450) | (900) | |||||
Oasis Petroleum Inc. | (103) | (569) | |||||
Oceaneering International Inc. | (13) | (161) | |||||
Targa Resources Corp. | (16) | (593) | |||||
Transocean Ltd. | (292) | (2,025) | |||||
Weatherford International Plc | (240) | (134) | |||||
(15,912) | |||||||
Financials (3.4%) | |||||||
Bank OZK | (8) | (183) | |||||
BGC Partners Inc. - Class A | (16) | (84) | |||||
FNB Corp. | (40) | (390) | |||||
Home Bancshares Inc. | (17) | (273) | |||||
LendingTree Inc. | (7) | (1,616) | |||||
Pinnacle Financial Partners Inc. | (37) | (1,714) | |||||
Sterling Bancorp | (341) | (5,630) | |||||
United Bankshares Inc. | (90) | (2,793) | |||||
Virtu Financial Inc. - Class A | (12) | (301) | |||||
Webster Financial Corp. | (13) | (647) | |||||
(13,631) | |||||||
Health Care (3.5%) | |||||||
Acadia HealthCare Co. Inc. | (57) | (1,458) | |||||
Agios Pharmaceuticals Inc. | (43) | (1,991) | |||||
Alnylam Pharmaceuticals Inc. | (3) | (245) | |||||
Bluebird Bio Inc. | (23) | (2,255) | |||||
Catalent Inc. | (4) | (136) | |||||
Exact Sciences Corp. | (30) | (1,911) | |||||
Insulet Corp. | (21) | (1,702) | |||||
Medidata Solutions Inc. | (11) | (730) | |||||
Prestige Consumer Healthcare Inc. | (21) | (637) | |||||
Sage Therapeutics Inc. | (13) | (1,282) | |||||
Seattle Genetics Inc. | (20) | (1,123) | |||||
Syneos Health Inc. - Class A | (12) | (476) | |||||
(13,946) | |||||||
Industrials (2.4%) | |||||||
Alaska Air Group Inc. | (1) | (87) | |||||
American Airlines Group Inc. | (4) | (141) | |||||
Arconic Inc. | (29) | (485) | |||||
Colfax Corp. | (32) | (663) | |||||
Shares/Par1 | Value ($) | ||||||
Dycom Industries Inc. | (9) | (467) | |||||
Flowserve Corp. | (27) | (1,026) | |||||
Granite Construction Inc. | (5) | (204) | |||||
Healthcare Services Group Inc. | (25) | (1,018) | |||||
Knight-Swift Transportation Holdings Inc. - Class A | (3) | (79) | |||||
MasTec Inc. | (26) | (1,056) | |||||
Middleby Corp. | (6) | (580) | |||||
NOW Inc. | (155) | (1,802) | |||||
TransDigm Group Inc. | (2) | (543) | |||||
Trinity Industries Inc. | (5) | (101) | |||||
Wabtec Corp. | (9) | (635) | |||||
Welbilt Inc. | (62) | (689) | |||||
(9,576) | |||||||
Information Technology (5.2%) | |||||||
2U Inc. | (29) | (1,467) | |||||
Belden Inc. | (35) | (1,453) | |||||
Cognex Corp. | (27) | (1,049) | |||||
Coherent Inc. | (5) | (547) | |||||
Cree Inc. | (65) | (2,788) | |||||
Cypress Semiconductor Corp. | (54) | (685) | |||||
IPG Photonics Corp. | (2) | (256) | |||||
Marvell Technology Group Ltd. | (142) | (2,299) | |||||
Microchip Technology Inc. | (48) | (3,439) | |||||
Monolithic Power Systems Inc. | (5) | (621) | |||||
Plantronics Inc. | (3) | (116) | |||||
Square Inc. - Class A | (5) | (288) | |||||
Switch Inc. - Class A | (40) | (281) | |||||
Synaptics Inc. | (4) | (137) | |||||
Universal Display Corp. | (36) | (3,327) | |||||
ViaSat Inc. | (40) | (2,336) | |||||
(21,089) | |||||||
Materials (2.7%) | |||||||
Albemarle Corp. | (54) | (4,163) | |||||
Allegheny Technologies Inc. | (106) | (2,318) | |||||
Compass Minerals International Inc. | (13) | (559) | |||||
Crown Holdings Inc. | (23) | (972) | |||||
Graphic Packaging Holding Co. | (69) | (729) | |||||
Royal Gold Inc. | (23) | (1,942) | |||||
(10,683) | |||||||
Real Estate (0.1%) | |||||||
Colony Capital Inc. - Class A | (61) | (285) | |||||
Newmark Group Inc. - Class A | — | — | |||||
Utilities (0.1%) | |||||||
NiSource Inc. | (23) | (595) | |||||
Total Common Stocks (proceeds $141,545) | (115,241) | ||||||
Total Securities Sold Short (28.6%) (proceeds $141,545) | (115,241) | ||||||
JNL/AQR Large Cap Relaxed Constraint Equity Fund — Futures Contracts | ||||||||||||||||
Reference Entity | Contracts Long (Short)1 | Expiration | Notional 1 | Variation Margin Receivable (Payable) ($) | Unrealized Appreciation (Depreciation) ($) | |||||||||||
S&P 500 E-Mini Index | 35 | March 2019 | 4,539 | 34 | (155) | |||||||||||
See accompanying Notes to Financial Statements.
Abbreviations, counterparties and additional footnotes are defined on page 305.
92
JNL Series Trust Sub-Advised Funds
Schedules of Investments (in thousands)
December 31, 2018
Shares/Par1 | Value ($) | ||||||
JNL/AQR Managed Futures Strategy Fund (a) | |||||||
SHORT TERM INVESTMENTS 90.5% | |||||||
Investment Companies 42.2% | |||||||
JNL Government Money Market Fund - Institutional Class, 2.31% (b) (c) | 67,052 | 67,052 | |||||
JPMorgan U.S. Treasury Plus Money Market Fund - IM Class, 2.56% (c) | 26,969 | 26,969 | |||||
94,021 | |||||||
Treasury Securities 48.3% | |||||||
U.S. Treasury Bill | |||||||
2.19%, 01/31/19 (d) | 2,478 | 2,473 | |||||
2.34%, 02/07/19 (d) | 42,091 | 41,990 | |||||
2.40%, 03/28/19 (d) | 32,005 | 31,830 | |||||
2.37%, 04/04/19 (d) | 23,319 | 23,176 | |||||
Shares/Par1 | Value ($) | ||||||
2.41%, 04/11/19 (d) | 3,612 | 3,588 | |||||
2.46%, 04/25/19 (d) | 4,366 | 4,333 | |||||
107,390 | |||||||
Total Short Term Investments (cost $201,417) | 201,411 | ||||||
Total Investments 90.5% (cost $201,417) | 201,411 | ||||||
Other Derivative Instruments (0.7)% | (1,515) | ||||||
Other Assets and Liabilities, Net 10.2% | 22,676 | ||||||
Total Net Assets 100.0% | 222,572 | ||||||
(a) Consolidated Schedule of Investments.
(b) Investment in affiliate.
(c) Yield changes daily to reflect current market conditions. Rate was the quoted yield as of December 31, 2018.
(d) The coupon rate represents the yield to maturity.
JNL/AQR Managed Futures Strategy Fund — Futures Contracts | ||||||||||||||||
Reference Entity | Contracts Long (Short)1 | Expiration | Notional 1 | Variation Margin Receivable (Payable) ($) | Unrealized Appreciation (Depreciation) ($) | |||||||||||
3M EURIBOR | 79 | June 2019 | EUR | 19,807 | (1) | 1 | ||||||||||
3M EURIBOR | 113 | September 2019 | EUR | 28,321 | (2) | 8 | ||||||||||
3M EURIBOR | 211 | December 2019 | EUR | 52,842 | — | 45 | ||||||||||
3M EURIBOR | 271 | March 2020 | EUR | 67,815 | — | 96 | ||||||||||
3M EURIBOR | 270 | June 2020 | EUR | 67,510 | 4 | 119 | ||||||||||
3M EURIBOR | 237 | September 2020 | EUR | 59,231 | 7 | 99 | ||||||||||
3M EURIBOR | 130 | December 2020 | EUR | 32,483 | 6 | 40 | ||||||||||
3M Sterling Interest Rate | 11 | June 2019 | GBP | 1,361 | — | — | ||||||||||
3M Sterling Interest Rate | 13 | September 2019 | GBP | 1,608 | — | — | ||||||||||
3M Sterling Interest Rate | 14 | December 2019 | GBP | 1,731 | — | — | ||||||||||
3M Sterling Interest Rate | 13 | March 2020 | GBP | 1,606 | — | — | ||||||||||
3M Sterling Interest Rate | 14 | June 2020 | GBP | 1,730 | — | — | ||||||||||
3M Sterling Interest Rate | 14 | September 2020 | GBP | 1,729 | — | — | ||||||||||
3M Sterling Interest Rate | 14 | December 2020 | GBP | 1,728 | — | — | ||||||||||
3M Swiss Franc Interest Rate | 2 | June 2019 | CHF | 504 | — | — | ||||||||||
3M Swiss Franc Interest Rate | 5 | September 2019 | CHF | 1,259 | — | — | ||||||||||
3M Swiss Franc Interest Rate | 6 | December 2019 | CHF | 1,510 | — | — | ||||||||||
90-Day Eurodollar | (26) | June 2019 | (6,311) | — | (15) | |||||||||||
90-Day Eurodollar | 1 | September 2019 | 243 | — | — | |||||||||||
90-Day Eurodollar | (2) | December 2019 | (484) | — | (3) | |||||||||||
90-Day Eurodollar | (1) | March 2020 | (242) | — | (2) | |||||||||||
90-Day Eurodollar | (2) | June 2020 | (484) | (1) | (4) | |||||||||||
90-Day Eurodollar | 4 | December 2020 | 975 | — | — | |||||||||||
Amsterdam Exchanges Index | (16) | January 2019 | EUR | (1,578) | (14) | 20 | ||||||||||
ASX SPI 200 Index | (23) | March 2019 | AUD | (3,176) | 17 | (15) | ||||||||||
Australia Commonwealth Treasury Bond, 10-Year | 99 | March 2019 | AUD | 13,019 | 31 | 82 | ||||||||||
Australia Commonwealth Treasury Bond, 3-Year | 324 | March 2019 | AUD | 36,237 | 25 | 85 | ||||||||||
Australian Dollar | (258) | March 2019 | (18,641) | 5 | 447 | |||||||||||
Brent Crude Oil | (53) | March 2019 | (3,125) | (30) | 273 | |||||||||||
British Pound | (31) | March 2019 | (2,480) | (10) | 2 | |||||||||||
CAC40 10 Euro | (58) | January 2019 | EUR | (2,781) | (35) | 44 | ||||||||||
Canadian Bank Acceptance | 7 | June 2019 | CAD | 1,710 | — | 1 | ||||||||||
Canadian Bank Acceptance | 9 | September 2019 | CAD | 2,197 | — | 2 | ||||||||||
Canadian Dollar | (68) | March 2019 | (5,127) | (5) | 128 | |||||||||||
Canadian Government Bond, 10-Year | 10 | March 2019 | CAD | 1,355 | — | 10 | ||||||||||
Cocoa | (1) | March 2019 | (21) | (1) | (3) | |||||||||||
Coffee 'C' | (28) | March 2019 | (1,169) | (10) | 99 | |||||||||||
Copper | (16) | March 2019 | (1,091) | 19 | 38 | |||||||||||
Corn | (52) | March 2019 | (969) | 1 | (6) | |||||||||||
Cotton No. 2 | (13) | March 2019 | (501) | — | 32 | |||||||||||
Dow Jones Industrial Average E-Mini Index | (17) | March 2019 | (2,067) | (21) | 89 | |||||||||||
E-Mini MSCI Emerging EAFE Index | (2) | March 2019 | (175) | — | 4 | |||||||||||
E-Mini MSCI Emerging Markets Index | (11) | March 2019 | (536) | 2 | 5 | |||||||||||
E-Mini Russell 2000 Index | (82) | March 2019 | (5,825) | (33) | 294 | |||||||||||
Euro FX Currency | (405) | March 2019 | (58,201) | (36) | (132) | |||||||||||
Euro STOXX 50 | (284) | March 2019 | EUR | (8,641) | — | 223 | ||||||||||
Euro-Bobl | 331 | March 2019 | EUR | 43,799 | — | 74 | ||||||||||
Euro-BTP | 13 | March 2019 | EUR | 1,657 | — | 5 | ||||||||||
Euro-Bund | 109 | March 2019 | EUR | 17,734 | — | 105 | ||||||||||
Euro-Buxl | 15 | March 2019 | EUR | 2,702 | — | 9 | ||||||||||
Euro-OAT | 193 | March 2019 | EUR | 29,124 | — | (22) | ||||||||||
Euro-Schatz | 448 | March 2019 | EUR | 50,133 | — | 19 | ||||||||||
FTSE 100 Index | (103) | March 2019 | GBP | (6,866) | 10 | 9 | ||||||||||
See accompanying Notes to Financial Statements.
Abbreviations, counterparties and additional footnotes are defined on page 305.
93
JNL Series Trust Sub-Advised Funds
Schedules of Investments (in thousands)
December 31, 2018
JNL/AQR Managed Futures Strategy Fund — Futures Contracts (continued) | ||||||||||||||||
Reference Entity | Contracts Long (Short)1 | Expiration | Notional 1 | Variation Margin Receivable (Payable) ($) | Unrealized Appreciation (Depreciation) ($) | |||||||||||
FTSE China A50 Index | (140) | January 2019 | (1,460) | (9) | 2 | |||||||||||
FTSE/JSE Top 40 Index | (9) | March 2019 | ZAR | (4,107) | (1) | (9) | ||||||||||
FTSE/MIB Index | (14) | March 2019 | EUR | (1,309) | — | 40 | ||||||||||
German Stock Index | (36) | March 2019 | EUR | (9,706) | — | 230 | ||||||||||
Gold 100 oz. | 11 | February 2019 | 1,410 | (2) | (1) | |||||||||||
Hang Seng China Enterprises Index | (29) | January 2019 | HKD | (14,621) | (12) | (3) | ||||||||||
Hang Seng Index | (22) | January 2019 | HKD | (28,288) | (40) | (19) | ||||||||||
IBEX 35 Index | (14) | January 2019 | EUR | (1,217) | (11) | 28 | ||||||||||
ICE Europe London Cocca | (5) | March 2019 | GBP | (80) | — | (10) | ||||||||||
Japanese Government Bond, 10-Year | 68 | March 2019 | JPY | 10,332,300 | — | 324 | ||||||||||
Japanese Yen | (177) | March 2019 | (19,806) | (133) | (485) | |||||||||||
KCBT Wheat | (26) | March 2019 | (651) | 10 | 16 | |||||||||||
KOSPI 200 | (127) | March 2019 | KRW | (8,327,892) | — | 7 | ||||||||||
Lean Hogs | (11) | February 2019 | (272) | (1) | 3 | |||||||||||
Live Cattle | (7) | March 2019 | (341) | 1 | (5) | |||||||||||
LME Aluminum | (30) | March 2019 | (1,479) | 91 | 93 | |||||||||||
LME Copper | (5) | March 2019 | (758) | 7 | 12 | |||||||||||
LME Nickel | (2) | March 2019 | (132) | 20 | 4 | |||||||||||
LME Zinc | (5) | March 2019 | (316) | (24) | 7 | |||||||||||
Low Sulphur Gas Oil | (122) | February 2019 | (6,640) | (203) | 403 | |||||||||||
Mexican Peso | (42) | March 2019 | (1,021) | (1) | (34) | |||||||||||
Mini MSCI Singapore Index | (20) | January 2019 | SGD | (681) | — | (2) | ||||||||||
MSCI Taiwan Index | (67) | January 2019 | (2,358) | (19) | (50) | |||||||||||
NASDAQ 100 E-Mini | (17) | March 2019 | (2,270) | (14) | 117 | |||||||||||
Natural Gas | 43 | February 2019 | 1,762 | (166) | (497) | |||||||||||
New Zealand Dollar | 617 | March 2019 | 42,604 | 18 | (1,142) | |||||||||||
Nikkei 225 | (18) | March 2019 | JPY | (381,019) | — | 189 | ||||||||||
NY Harbor ULSD | (18) | February 2019 | (1,402) | (14) | 132 | |||||||||||
OMX Stockholm 30 Index | (56) | January 2019 | SEK | (8,104) | — | 24 | ||||||||||
Palladium | 6 | March 2019 | 679 | 8 | 39 | |||||||||||
Platinum | (14) | April 2019 | (558) | (3) | (2) | |||||||||||
RBOB Gasoline | (25) | February 2019 | (1,521) | (1) | 153 | |||||||||||
S&P 500 E-Mini Index | (15) | March 2019 | (1,964) | (15) | 85 | |||||||||||
S&P MidCap 400 E-Mini Index | (8) | March 2019 | (1,387) | (14) | 57 | |||||||||||
S&P/Toronto Stock Exchange 60 Index | (23) | March 2019 | CAD | (4,036) | (17) | 69 | ||||||||||
Silver | (9) | March 2019 | (651) | (5) | (49) | |||||||||||
Soybean | (29) | March 2019 | (1,320) | 1 | 23 | |||||||||||
Soybean Meal | (1) | March 2019 | (31) | — | — | |||||||||||
Soybean Oil | (3) | March 2019 | (50) | — | — | |||||||||||
Sugar #11 (World Markets) | (72) | March 2019 | (1,020) | 29 | 50 | |||||||||||
Tokyo Price Index | (33) | March 2019 | JPY | (526,103) | — | 298 | ||||||||||
U.K. Long Gilt | 77 | March 2019 | GBP | 9,424 | (13) | 76 | ||||||||||
U.S. Treasury Long Bond | (23) | March 2019 | (3,217) | (16) | (141) | |||||||||||
U.S. Treasury Note, 10-Year | 5 | March 2019 | 609 | (1) | 1 | |||||||||||
U.S. Treasury Note, 2-Year | 54 | March 2019 | 11,457 | 6 | 7 | |||||||||||
U.S. Treasury Note, 5-Year | 25 | March 2019 | 2,862 | 4 | 5 | |||||||||||
Ultra Long Term U.S. Treasury Bond | (33) | March 2019 | (5,023) | (24) | (278) | |||||||||||
Wheat | (8) | March 2019 | (203) | 3 | 2 | |||||||||||
WTI Crude Oil | (44) | February 2019 | (2,279) | (4) | 281 | |||||||||||
(637) | 2,355 | |||||||||||||||
Forward Foreign Currency Contracts
Purchased/ Sold | Counter-party | Expiration | Notional 1 | Value ($) | Unrealized Appreciation (Depreciation) ($) | |||||||||||||
AUD/USD | CIT | 03/20/19 | AUD | 1,809 | 1,276 | (42) | ||||||||||||
BRL/USD | CIT | 03/20/19 | BRL | 920 | 236 | (8) | ||||||||||||
BRL/USD | CIT | 03/20/19 | BRL | 696 | 178 | — | ||||||||||||
CAD/USD | CIT | 03/20/19 | CAD | 906 | 666 | (14) | ||||||||||||
CHF/USD | CIT | 03/20/19 | CHF | 12,458 | 12,765 | 121 | ||||||||||||
CLP/USD | CIT | 03/20/19 | CLP | 1,472,069 | 2,123 | (74) | ||||||||||||
COP/USD | CIT | 03/20/19 | COP | 3,379,595 | 1,035 | (19) | ||||||||||||
COP/USD | CIT | 03/20/19 | COP | 396,890 | 122 | — | ||||||||||||
EUR/USD | CIT | 03/20/19 | EUR | 13,971 | 16,108 | (18) | ||||||||||||
EUR/USD | CIT | 03/20/19 | EUR | 18,157 | 20,935 | 63 | ||||||||||||
GBP/USD | CIT | 03/20/19 | GBP | 1,480 | 1,896 | (12) | ||||||||||||
GBP/USD | CIT | 03/20/19 | GBP | 990 | 1,268 | — | ||||||||||||
HKD/USD | CIT | 03/20/19 | HKD | 32 | 4 | — | ||||||||||||
HUF/USD | CIT | 03/20/19 | HUF | 1,177,047 | 4,223 | 44 | ||||||||||||
IDR/USD | CIT | 03/20/19 | IDR | 6,986,747 | 482 | (2) | ||||||||||||
IDR/USD | CIT | 03/20/19 | IDR | 39,614,393 | 2,732 | 34 | ||||||||||||
ILS/USD | CIT | 03/20/19 | ILS | 4,155 | 1,118 | (10) | ||||||||||||
ILS/USD | CIT | 03/20/19 | ILS | 1,735 | 466 | — | ||||||||||||
INR/USD | CIT | 03/20/19 | INR | 504,497 | 7,165 | 88 | ||||||||||||
JPY/USD | CIT | 03/20/19 | JPY | 2,848,789 | 26,152 | 678 | ||||||||||||
See accompanying Notes to Financial Statements.
Abbreviations, counterparties and additional footnotes are defined on page 305.
94
JNL Series Trust Sub-Advised Funds
Schedules of Investments (in thousands)
December 31, 2018
Purchased/ Sold | Counter-party | Expiration | Notional 1 | Value ($) | Unrealized Appreciation (Depreciation) ($) | |||||||||||||
KRW/USD | CIT | 03/20/19 | KRW | 3,371,706 | 3,031 | (13) | ||||||||||||
KRW/USD | CIT | 03/20/19 | KRW | 503,252 | 453 | 1 | ||||||||||||
MXN/USD | CIT | 03/20/19 | MXN | 33,928 | 1,709 | 37 | ||||||||||||
NOK/USD | CIT | 03/20/19 | NOK | 24,039 | 2,787 | (53) | ||||||||||||
NOK/USD | CIT | 03/20/19 | NOK | 2,407 | 279 | — | ||||||||||||
NZD/USD | CIT | 01/03/19 | NZD | 2,055 | 1,379 | 1 | ||||||||||||
NZD/USD | CIT | 01/04/19 | NZD | 2,057 | 1,380 | — | ||||||||||||
NZD/USD | CIT | 03/20/19 | NZD | 29,455 | 19,796 | (401) | ||||||||||||
PHP/USD | CIT | 03/20/19 | PHP | 87,440 | 1,653 | (4) | ||||||||||||
PHP/USD | CIT | 03/20/19 | PHP | 32,130 | 608 | — | ||||||||||||
PLN/USD | CIT | 03/20/19 | PLN | 35,971 | 9,620 | 73 | ||||||||||||
SEK/USD | CIT | 03/20/19 | SEK | 92,649 | 10,517 | 162 | ||||||||||||
SGD/USD | CIT | 03/20/19 | SGD | 7,382 | 5,425 | 26 | ||||||||||||
TWD/USD | CIT | 03/20/19 | TWD | 10,545 | 346 | (2) | ||||||||||||
TWD/USD | CIT | 03/20/19 | TWD | 39,643 | 1,298 | — | ||||||||||||
USD/AUD | CIT | 03/20/19 | AUD | (24,050) | (16,969) | 195 | ||||||||||||
USD/BRL | CIT | 03/20/19 | BRL | (1,298) | (333) | (4) | ||||||||||||
USD/BRL | CIT | 03/20/19 | BRL | (4,122) | (1,060) | 7 | ||||||||||||
USD/CAD | CIT | 03/20/19 | CAD | (15,108) | (11,096) | 91 | ||||||||||||
USD/CHF | CIT | 03/20/19 | CHF | (5,862) | (6,004) | (44) | ||||||||||||
USD/CHF | CIT | 03/20/19 | CHF | (289) | (294) | 1 | ||||||||||||
USD/CLP | CIT | 03/20/19 | CLP | (1,830,540) | (2,638) | 77 | ||||||||||||
USD/COP | CIT | 03/20/19 | COP | (5,341,134) | (1,639) | 9 | ||||||||||||
USD/EUR | CIT | 03/20/19 | EUR | (71,806) | (82,792) | (461) | ||||||||||||
USD/EUR | CIT | 03/20/19 | EUR | (4,491) | (5,178) | 7 | ||||||||||||
USD/GBP | CIT | 03/20/19 | GBP | (2,272) | (2,909) | (31) | ||||||||||||
USD/GBP | CIT | 03/20/19 | GBP | (4,442) | (5,687) | 26 | ||||||||||||
USD/HKD | CIT | 03/20/19 | HKD | (924) | (118) | — | ||||||||||||
USD/HUF | CIT | 03/20/19 | HUF | (1,458,556) | (5,235) | (53) | ||||||||||||
USD/HUF | CIT | 03/20/19 | HUF | (8,977) | (32) | — | ||||||||||||
USD/IDR | CIT | 03/20/19 | IDR | (9,939,360) | (685) | (10) | ||||||||||||
USD/IDR | CIT | 03/20/19 | IDR | (6,241,201) | (430) | — | ||||||||||||
USD/ILS | CIT | 03/20/19 | ILS | (13,496) | (3,628) | 26 | ||||||||||||
USD/INR | CIT | 03/20/19 | INR | (328,633) | (4,670) | (89) | ||||||||||||
USD/INR | CIT | 03/20/19 | INR | (837) | (12) | — | ||||||||||||
USD/JPY | CIT | 03/20/19 | JPY | (3,338,825) | (30,650) | (786) | ||||||||||||
USD/KRW | CIT | 03/20/19 | KRW | (8,165,680) | (7,337) | (66) | ||||||||||||
USD/KRW | CIT | 03/20/19 | KRW | (2,012,786) | (1,808) | 3 | ||||||||||||
USD/MXN | CIT | 03/20/19 | MXN | (39,601) | (1,990) | (78) | ||||||||||||
USD/NOK | CIT | 03/20/19 | NOK | (46,434) | (5,389) | 63 | ||||||||||||
USD/NZD | CIT | 01/03/19 | NZD | (2,055) | (1,379) | (1) | ||||||||||||
USD/NZD | CIT | 01/04/19 | NZD | (2,057) | (1,380) | — | ||||||||||||
USD/NZD | CIT | 03/20/19 | NZD | (2,055) | (1,381) | (1) | ||||||||||||
USD/NZD | CIT | 03/20/19 | NZD | (10,945) | (7,355) | 52 | ||||||||||||
USD/PHP | CIT | 03/20/19 | PHP | (56,722) | (1,071) | (8) | ||||||||||||
USD/PHP | CIT | 03/20/19 | PHP | (36,662) | (692) | — | ||||||||||||
USD/PLN | CIT | 03/20/19 | PLN | (3,870) | (1,036) | (11) | ||||||||||||
USD/PLN | CIT | 03/20/19 | PLN | (34) | (9) | — | ||||||||||||
USD/SEK | CIT | 03/20/19 | SEK | (122,372) | (13,887) | (239) | ||||||||||||
USD/SEK | CIT | 03/20/19 | SEK | (331) | (38) | — | ||||||||||||
USD/SGD | CIT | 03/20/19 | SGD | (4,342) | (3,192) | (17) | ||||||||||||
USD/SGD | CIT | 03/20/19 | SGD | (447) | (328) | — | ||||||||||||
USD/TWD | CIT | 03/20/19 | TWD | (14,219) | (466) | (2) | ||||||||||||
USD/TWD | CIT | 03/20/19 | TWD | (122,735) | (4,019) | 2 | ||||||||||||
USD/ZAR | CIT | 03/20/19 | ZAR | (21,164) | (1,458) | (11) | ||||||||||||
USD/ZAR | CIT | 03/20/19 | ZAR | (19,645) | (1,354) | 9 | ||||||||||||
ZAR/USD | CIT | 03/20/19 | ZAR | 127,412 | 8,777 | (306) | ||||||||||||
ZAR/USD | CIT | 03/20/19 | ZAR | 825 | 57 | — | ||||||||||||
(67,563) | (994) | |||||||||||||||||
JNL/AQR Managed Futures Strategy Fund — OTC Total Return Swap Agreements | ||||||||||||||||
Reference Entity2 | Counter-party | Rate Paid/Received by Fund2,9 | Expiration | Notional1 | Premiums Paid (Received) ($) | Unrealized Appreciation (Depreciation) ($) | ||||||||||
Total return swap agreements - receiving return | ||||||||||||||||
FUTURES | ||||||||||||||||
Bovespa Index Future, Expiration February 2019 | MSC | N/A | 02/13/19 | BRL | 4,998 | — | (34) | |||||||||
Total return swap agreements - paying return | ||||||||||||||||
FUTURES | ||||||||||||||||
Soybean Meal Future, Expiration March 2019 | CGM | N/A | 03/18/19 | (2,646) | — | 43 | ||||||||||
Soybean Oil Future, Expiration March 2019 | CGM | N/A | 03/25/19 | (872) | — | 37 | ||||||||||
Wheat Future, Expiration March 2019 | CGM | N/A | 03/18/19 | (280) | — | 3 | ||||||||||
Coffee 'C' Future, Expiration March 2019 | MLP | N/A | 03/29/19 | (666) | — | 93 | ||||||||||
Corn Future, Expiration March 2019 | MLP | N/A | 03/18/19 | (222) | — | (3) | ||||||||||
Hang Seng China Enterprises Index Future, Expiration January 2019 | MLP | N/A | 01/30/19 | HKD | (8,509) | — | (10) | |||||||||
Live Cattle Future, Expiration February 2019 | MLP | N/A | 03/15/19 | (622) | — | (22) | ||||||||||
Hang Seng China Enterprises Index Future, Expiration January 2019 | MSC | N/A | 01/30/19 | HKD | (1,999) | — | (3) | |||||||||
KOSPI 200 Future, Expiration March 2019 | MSC | N/A | 03/14/19 | KRW | (8,719,250) | — | 7 | |||||||||
Swiss Market Index Future, Expiration March 2019 | MSC | N/A | 03/15/19 | CHF | (420) | — | 5 | |||||||||
— | 150 | |||||||||||||||
See accompanying Notes to Financial Statements.
Abbreviations, counterparties and additional footnotes are defined on page 305.
95
JNL Series Trust Sub-Advised Funds
Schedules of Investments (in thousands)
December 31, 2018
Shares/Par1 | Value ($) | ||||||
JNL/BlackRock Global Allocation Fund * (a) | |||||||
COMMON STOCKS 58.1% | |||||||
Communication Services 8.2% | |||||||
Alphabet Inc. - Class A (b) | 1 | 606 | |||||
Alphabet Inc. - Class C (b) (c) | 50 | 52,135 | |||||
Charter Communications Inc. - Class A (b) | 101 | 28,771 | |||||
Comcast Corp. - Class A (c) (d) | 1,145 | 38,998 | |||||
Facebook Inc. - Class A (b) (c) | 166 | 21,702 | |||||
Tencent Holdings Ltd. (e) | 485 | 19,458 | |||||
Verizon Communications Inc. | 234 | 13,146 | |||||
Vodafone Group Plc | 12,549 | 24,583 | |||||
Other Securities | 84,657 | ||||||
284,056 | |||||||
Consumer Discretionary 5.6% | |||||||
Amazon.com Inc. (b) (c) | 22 | 32,991 | |||||
Denso Corp. | 358 | 15,841 | |||||
Maruti Suzuki India Ltd. | 39 | 4,191 | |||||
Sodexo SA | 172 | 17,679 | |||||
Suzuki Motor Corp. | 341 | 17,245 | |||||
Other Securities | 106,649 | ||||||
194,596 | |||||||
Consumer Staples 5.3% | |||||||
Altria Group Inc. | 381 | 18,796 | |||||
Colgate-Palmolive Co. | 349 | 20,761 | |||||
Danone SA | 379 | 26,701 | |||||
Nestle SA | 382 | 31,082 | |||||
Other Securities | 86,776 | ||||||
184,116 | |||||||
Energy 6.0% | |||||||
Enbridge Inc. | 507 | 15,770 | |||||
Exxon Mobil Corp. | 469 | 31,968 | |||||
Imperial Oil Ltd. (f) | 7 | 172 | |||||
Reliance Industries Ltd. | 1,144 | 18,348 | |||||
Royal Dutch Shell Plc - Class A | 1,007 | 29,631 | |||||
Royal Dutch Shell Plc - Class A | 8 | 249 | |||||
Royal Dutch Shell Plc - Class A - ADR (f) | 223 | 12,972 | |||||
Royal Dutch Shell Plc - Class B | 12 | 358 | |||||
Williams Cos. Inc. | 1,262 | 27,822 | |||||
Other Securities | 71,524 | ||||||
208,814 | |||||||
Financials 5.9% | |||||||
Bank of America Corp. | 530 | 13,059 | |||||
Citigroup Inc. | 199 | 10,370 | |||||
HSBC Holdings Plc | 1,535 | 12,699 | |||||
Marsh & McLennan Cos. Inc. | 282 | 22,503 | |||||
Morgan Stanley | 358 | 14,214 | |||||
Wells Fargo & Co. | 629 | 28,973 | |||||
Other Securities | 103,059 | ||||||
204,877 | |||||||
Health Care 8.5% | |||||||
Anthem Inc. | 121 | 31,655 | |||||
Bayer AG | 216 | 15,148 | |||||
CVS Health Corp. (c) | 383 | 25,098 | |||||
Fresenius SE & Co. KGaA | 348 | 16,961 | |||||
Gilead Sciences Inc. | 259 | 16,211 | |||||
Johnson & Johnson (c) | 346 | 44,697 | |||||
Pfizer Inc. | 687 | 29,980 | |||||
Other Securities | 114,677 | ||||||
294,427 | |||||||
Industrials 5.8% | |||||||
East Japan Railway Co. | 214 | 18,863 | |||||
Japan Airlines Co. Ltd. | 542 | 19,219 | |||||
Koninklijke Philips Electronics NV | 817 | 28,966 | |||||
Other Securities | 134,212 | ||||||
201,260 | |||||||
Information Technology 5.7% | |||||||
Apple Inc. (c) | 319 | 50,319 | |||||
Microsoft Corp. (c) | 492 | 50,017 | |||||
Other Securities | 98,424 | ||||||
198,760 | |||||||
Shares/Par1 | Value ($) | ||||||
Materials 3.3% | |||||||
Air Products & Chemicals Inc. | 151 | 24,193 | |||||
DowDuPont Inc. | 288 | 15,422 | |||||
Other Securities | 76,450 | ||||||
116,065 | |||||||
Real Estate 1.6% | |||||||
CapitaLand Ltd. | 6,702 | 15,250 | |||||
Sun Hung Kai Properties Ltd. | 1,211 | 17,257 | |||||
Other Securities | 22,392 | ||||||
54,899 | |||||||
Utilities 2.2% | |||||||
NextEra Energy Inc. | 162 | 28,144 | |||||
Other Securities | 47,258 | ||||||
75,402 | |||||||
Total Common Stocks (cost $2,083,564) | 2,017,272 | ||||||
TRUST PREFERREDS 0.2% | |||||||
Financials 0.2% | |||||||
Citigroup Capital XIII | 122 | 3,238 | |||||
Other Securities | 3,411 | ||||||
Total Trust Preferreds (cost $6,845) | 6,649 | ||||||
PREFERRED STOCKS 1.0% | |||||||
Communication Services 0.4% | |||||||
Other Securities | 13,631 | ||||||
Energy 0.0% | |||||||
Other Securities | 38 | ||||||
Financials 0.3% | |||||||
Wells Fargo & Co. - Series L, 7.50% (g) (h) | 1 | 1,431 | |||||
Other Securities | 9,961 | ||||||
11,392 | |||||||
Health Care 0.1% | |||||||
Other Securities | 1,565 | ||||||
Information Technology 0.1% | |||||||
Other Securities | 4,727 | ||||||
Materials 0.0% | |||||||
Other Securities | 42 | ||||||
Real Estate 0.1% | |||||||
Other Securities | 3,060 | ||||||
Total Preferred Stocks (cost $24,029) | 34,455 | ||||||
CORPORATE BONDS AND NOTES 5.3% | |||||||
Communication Services 0.7% | |||||||
Comcast Corp. | |||||||
3.45%, 10/01/21 | 2,099 | 2,120 | |||||
2.75%, 03/01/23 | 2,635 | 2,567 | |||||
3.70%, 04/15/24 | 5,209 | 5,232 | |||||
NBCUniversal Enterprise Inc. | |||||||
5.25%, (callable at 100 beginning 03/19/21) (g) (i) | 2,011 | 2,037 | |||||
Verizon Communications Inc. | |||||||
3.13%, 03/16/22 | 2,737 | 2,716 | |||||
Other Securities | 10,238 | ||||||
24,910 | |||||||
Consumer Discretionary 0.2% | |||||||
Other Securities | 6,574 | ||||||
Consumer Staples 0.3% | |||||||
Danone SA | |||||||
2.59%, 11/02/23 (i) | 2,720 | 2,586 | |||||
Other Securities | 8,047 | ||||||
10,633 | |||||||
Energy 0.2% | |||||||
Williams Cos. Inc. | |||||||
3.70%, 01/15/23 | 1,324 | 1,294 | |||||
Other Securities | 4,457 | ||||||
5,751 | |||||||
Financials 2.1% | |||||||
Bank of America Corp. | |||||||
2.37%, 07/21/21 (j) | 1,148 | 1,127 | |||||
3.30%, 01/11/23 | 2,630 | 2,588 | |||||
4.00%, 01/22/25 | 1,406 | 1,372 | |||||
See accompanying Notes to Financial Statements.
Abbreviations, counterparties and additional footnotes are defined on page 305.
96
JNL Series Trust Sub-Advised Funds
Schedules of Investments (in thousands)
December 31, 2018
Shares/Par1 | Value ($) | ||||||
Bayer Capital Corp. BV | |||||||
5.63%, 11/22/19, EUR (f) (h) (i) | 5,600 | 4,814 | |||||
Citigroup Inc. | |||||||
5.88%, (callable at 100 beginning 03/27/20) (f) (g) | 5,912 | 5,747 | |||||
5.95%, (callable at 100 beginning 08/15/20) (g) | 2,395 | 2,315 | |||||
2.45%, 01/10/20 | 2,535 | 2,513 | |||||
HSBC Holdings Plc | |||||||
6.38%, (callable at 100 beginning 09/17/24) (g) (h) | 5,095 | 4,834 | |||||
3.26%, 03/13/23 (j) | 2,534 | 2,481 | |||||
Morgan Stanley | |||||||
5.45%, (callable at 100 beginning 07/15/19) (g) | 1,971 | 1,922 | |||||
Wells Fargo & Co. | |||||||
3.07%, 01/24/23 | 547 | 532 | |||||
Wells Fargo Bank NA | |||||||
3.55%, 08/14/23 | 3,565 | 3,552 | |||||
Other Securities | 39,784 | ||||||
73,581 | |||||||
Health Care 1.0% | |||||||
CVS Health Corp. | |||||||
3.70%, 03/09/23 | 8,082 | 7,993 | |||||
Gilead Sciences Inc. | |||||||
3.25%, 09/01/22 | 2,631 | 2,619 | |||||
Other Securities | 22,246 | ||||||
32,858 | |||||||
Industrials 0.1% | |||||||
Other Securities | 2,600 | ||||||
Information Technology 0.3% | |||||||
Apple Inc. | |||||||
3.35%, 02/09/27 | 4,593 | 4,492 | |||||
3.20%, 05/11/27 | 4,414 | 4,268 | |||||
Other Securities | 2,774 | ||||||
11,534 | |||||||
Materials 0.3% | |||||||
DowDuPont Inc. | |||||||
3.77%, 11/15/20 | 2,085 | 2,105 | |||||
Other Securities | 8,269 | ||||||
10,374 | |||||||
Real Estate 0.1% | |||||||
CapitaLand Ltd. | |||||||
1.95%, 10/17/23, SGD (h) (i) | 2,750 | 1,897 | |||||
Other Securities | 1,568 | ||||||
3,465 | |||||||
Utilities 0.0% | |||||||
Other Securities | 713 | ||||||
Total Corporate Bonds And Notes (cost $190,162) | 182,993 | ||||||
SENIOR LOAN INTERESTS 0.1% | |||||||
Consumer Discretionary 0.1% | |||||||
Other Securities | 3,707 | ||||||
Energy 0.0% | |||||||
Other Securities | 1,023 | ||||||
Total Senior Loan Interests (cost $5,000) | 4,730 | ||||||
GOVERNMENT AND AGENCY OBLIGATIONS 25.3% | |||||||
Sovereign 2.8% | |||||||
Argentina Republic Government International Bond | |||||||
3.38%, 01/15/23, EUR | 3,172 | 2,852 | |||||
6.88%, 01/26/27 | 11,041 | 8,391 | |||||
5.88%, 01/11/28 (f) | 16,091 | 11,475 | |||||
5.25%, 01/15/28, EUR | 517 | 423 | |||||
Bundesrepublik Deutschland | |||||||
0.50%, 02/15/28, EUR (k) | 25,166 | 29,677 | |||||
Mexico Bonos | |||||||
6.50%, 06/10/21, MXN | 252,442 | 12,271 | |||||
8.00%, 12/07/23, MXN | 241,302 | 11,994 | |||||
Other Securities | 20,607 | ||||||
97,690 | |||||||
Treasury Inflation Indexed Securities 0.8% | |||||||
U.S. Treasury Inflation Indexed Note | |||||||
0.63%, 04/15/23 (l) | 28,440 | 27,991 | |||||
Shares/Par1 | Value ($) | ||||||
U.S. Treasury Securities 21.7% | |||||||
U.S. Treasury Note | |||||||
1.50%, 11/30/19 (m) | 8,325 | 8,240 | |||||
2.75%, 08/31/23 | 84,972 | 85,928 | |||||
2.88%, 09/30/23 | 220,399 | 223,980 | |||||
2.88%, 10/31/23 (d) | 236,356 | 240,345 | |||||
3.00%, 10/31/25 (d) | 111,490 | 114,382 | |||||
2.88%, 11/30/25 | 77,424 | 78,815 | |||||
751,690 | |||||||
Total Government And Agency Obligations (cost $870,092) | 877,371 | ||||||
INVESTMENT COMPANIES 1.3% | |||||||
iShares Gold Trust Fund (b) (m) (n) | 2,162 | 26,566 | |||||
Other Securities | 18,338 | ||||||
Total Investment Companies (cost $47,048) | 44,904 | ||||||
SHORT TERM INVESTMENTS 9.4% | |||||||
Securities Lending Collateral 1.1% | |||||||
JNL Securities Lending Collateral Fund - Institutional Class, 2.46% (n) (o) | 39,433 | 39,433 | |||||
Treasury Securities 8.3% | |||||||
Japan Treasury Bill | |||||||
-0.31%, 01/28/19, JPY (p) | 2,181,800 | 19,911 | |||||
-0.32%, 02/04/19, JPY (p) | 2,180,450 | 19,898 | |||||
-0.24%, 03/04/19, JPY (p) | 2,260,900 | 20,632 | |||||
-0.21%, 03/25/19, JPY (p) | 962,800 | 8,787 | |||||
U.S. Treasury Bill | |||||||
2.27%, 01/02/19 (p) | 3,000 | 3,000 | |||||
2.30%, 01/03/19 (p) | 50,000 | 49,991 | |||||
2.16%, 01/08/19 (p) | 19,000 | 18,991 | |||||
2.33%, 01/15/19 (p) | 35,000 | 34,969 | |||||
2.34%, 01/22/19 (p) | 60,000 | 59,915 | |||||
2.19%, 01/31/19 (p) | 50,000 | 49,900 | |||||
285,994 | |||||||
Total Short Term Investments (cost $323,798) | 325,427 | ||||||
Total Investments 100.7% (cost $3,550,538) | 3,493,801 | ||||||
Total Securities Sold Short (0.6)% (proceeds $23,922) | (20,235) | ||||||
Total Purchased Options 0.2% (cost $18,938) | 8,291 | ||||||
Other Derivative Instruments (0.7)% | (24,901) | ||||||
Other Assets and Liabilities, Net 0.4% | 13,344 | ||||||
Total Net Assets 100.0% | 3,470,300 | ||||||
(a) Consolidated Schedule of Investments.
(b) Non-income producing security.
(c) All or a portion of the security is subject to a written call option.
(d) All or a portion of the security is pledged or segregated as collateral.
(e) Security fair valued in good faith as a Level 2 security in accordance with the procedures approved by the JNL Series Trust's Board of Trustees. Good faith fair valued securities are classified for Financial Accounting Standards Board ("FASB") Accounting Standards Codification ("ASC") Topic 820 "Fair Value Measurement" based on the applicable valuation inputs. See FASB ASC Topic 820 in the Notes to Financial Statements.
(f) All or portion of the security was on loan.
(g) Perpetual security. Next contractual call date presented, if applicable.
(h) Convertible security.
(i) The Sub-Adviser has deemed this security which is exempt from registration under the Securities Act of 1933, as amended, to be liquid based on procedures approved by the JNL Series Trust's Board of Trustees. Determinations of liquidity are unaudited. As of December 31, 2018, the value and the percentage of net assets of these liquid securities was $41,102 and 1.2%, respectively.
See accompanying Notes to Financial Statements.
Abbreviations, counterparties and additional footnotes are defined on page 305.
97
JNL Series Trust Sub-Advised Funds
Schedules of Investments (in thousands)
December 31, 2018
(j) Security has a variable rate. Interest rates reset periodically. Rate stated was in effect as of December 31, 2018. For securities based on a published reference rate and spread, the reference rate and spread are presented. Certain variable rate securities do not indicate a reference rate and spread because they are determined by the issuer, remarketing agent, or offering documents and are based on current market conditions. The coupon rate for securities with certain features outlined in the offering documents may vary from the stated reference rate and spread. This includes, but is not limited to, securities with deferred rates, contingent distributions, caps, floors, and fixed-rate to float-rate features. In addition, variable rates for government and agency collateralized mortgage obligations (“CMO”) and mortgage-backed securities (“MBS”) are determined by tranches of underlying mortgage-backed security pools’ cash flows into securities and pass-through rates which reflects the rate earned on the asset pool after management and guarantee fees are paid to the securitizing corporation. CMO and MBS variable rates are determined by a formula set forth in the security’s offering documents.
(k) Security is restricted to resale to institutional investors. See Restricted Securities in the Schedules of Investments.
(l) Treasury inflation indexed note, par amount is adjusted for inflation.
(m) All or a portion of the security is held in the respective subsidiary. See Significant Accounting Policies, Basis of Consolidation in the Notes to Financial Statements.
(n) Investment in affiliate.
(o) Yield changes daily to reflect current market conditions. Rate was the quoted yield as of December 31, 2018.
(p) The coupon rate represents the yield to maturity.
Shares/Par1 | Value ($) | ||||||
SECURITIES SOLD SHORT (0.6%) | |||||||
COMMON STOCKS (0.6%) | |||||||
Communication Services (0.0%) | |||||||
BT Group Plc | (39) | (119) | |||||
Electronic Arts Inc. | — | (23) | |||||
LINE Corp. | (5) | (154) | |||||
(296) | |||||||
Consumer Discretionary (0.1%) | |||||||
Aptiv Plc | (1) | (41) | |||||
Brilliance China Automotive Holdings Ltd. | (278) | (207) | |||||
Ctrip.com International Ltd. - ADR | (3) | (82) | |||||
Daimler AG | (9) | (457) | |||||
Fast Retailing Co. Ltd. | — | (102) | |||||
Geely Automobile Holdings Ltd. | (34) | (60) | |||||
Great Wall Motor Co. Ltd. - Class H | (195) | (112) | |||||
Hennes & Mauritz AB - Class B | (6) | (80) | |||||
Huazhu Group Ltd. - ADS | (14) | (400) | |||||
Sharp Corp. | (7) | (72) | |||||
Shenzhou International Group Holdings Ltd. | (14) | (159) | |||||
Shimano Inc. | — | (42) | |||||
TAL Education Group - ADS | (6) | (153) | |||||
Tesla Inc. | (1) | (327) | |||||
Vipshop Holdings Ltd. - ADR | (91) | (497) | |||||
Volkswagen AG | (1) | (91) | |||||
(2,882) | |||||||
Consumer Staples (0.1%) | |||||||
British American Tobacco Plc | (3) | (103) | |||||
Clorox Co. | (3) | (440) | |||||
FamilyMart UNY Holdings Co. Ltd. | (2) | (304) | |||||
General Mills Inc. | (2) | (64) | |||||
Hershey Co. | — | (49) | |||||
Hormel Foods Corp. | (4) | (176) | |||||
Pernod-Ricard SA | (12) | (1,916) | |||||
Reckitt Benckiser Group Plc | (2) | (129) | |||||
Saputo Inc. | (9) | (268) | |||||
(3,449) | |||||||
Energy (0.0%) | |||||||
Baker Hughes a GE Co. LLC - Class A | (2) | (36) | |||||
Cenovus Energy Inc. | (62) | (438) | |||||
Concho Resources Inc. | (2) | (190) | |||||
Diamondback Energy Inc. | (1) | (138) | |||||
Hess Corp. | (1) | (32) | |||||
National Oilwell Varco Inc. | (1) | (16) | |||||
(850) | |||||||
Financials (0.0%) | |||||||
T. Rowe Price Group Inc. | (1) | (104) | |||||
Health Care (0.1%) | |||||||
Alibaba Health Information Technology Ltd. | (270) | (218) | |||||
AmerisourceBergen Corp. | (1) | (54) | |||||
Daiichi Sankyo Co. Ltd. | (2) | (70) | |||||
Incyte Corp. | (6) | (379) | |||||
Regeneron Pharmaceuticals Inc. | (1) | (241) | |||||
Wuxi Biologics Cayman Inc. | (59) | (371) | |||||
(1,333) | |||||||
Industrials (0.0%) | |||||||
Bollore SA | (35) | (139) | |||||
Shares/Par1 | Value ($) | ||||||
China Southern Airlines Co. Ltd. - Class H | (10) | (6) | |||||
China State Construction International Holdings Ltd. | (72) | (57) | |||||
Fanuc Ltd. | — | (30) | |||||
Fortive Corp. | (4) | (279) | |||||
Komatsu Ltd. | (4) | (86) | |||||
Makita Corp. | (5) | (163) | |||||
SMC Corp. | — | (60) | |||||
Transurban Group | (16) | (133) | |||||
Zhuzhou CSR Times Electric Co. Ltd. - Class H | (15) | (82) | |||||
(1,035) | |||||||
Information Technology (0.2%) | |||||||
AAC Technologies Holdings Inc. | (27) | (154) | |||||
Analog Devices Inc. | (1) | (93) | |||||
Autohome Inc. - Class A - ADR | (3) | (264) | |||||
BYD Electronic International Co. Ltd. | (20) | (25) | |||||
NEC Electronics Corp. | (3) | (15) | |||||
NetEase.com Inc. - ADR | (1) | (245) | |||||
Nvidia Corp. | (1) | (81) | |||||
Salesforce.com Inc. | — | (55) | |||||
Square Inc. - Class A | (8) | (468) | |||||
Sumco Corp. | (193) | (2,146) | |||||
Sunny Optical Technology Group Co. Ltd. | (52) | (464) | |||||
Workday Inc. - Class A | (1) | (207) | |||||
Worldpay Inc. - Class A | (2) | (141) | |||||
Yaskawa Electric Corp. | (94) | (2,292) | |||||
ZTE Corp. - Class H | (10) | (19) | |||||
(6,669) | |||||||
Materials (0.1%) | |||||||
Barrick Gold Corp. | (2) | (26) | |||||
BASF SE | (1) | (66) | |||||
Freeport-McMoRan Inc. - Class B | (2) | (16) | |||||
Linde Plc | — | (58) | |||||
LyondellBasell Industries NV - Class A | (15) | (1,216) | |||||
Nippon Paint Co. Ltd. | (12) | (407) | |||||
PPG Industries Inc. | (1) | (121) | |||||
Sherwin-Williams Co. | (1) | (506) | |||||
ThyssenKrupp AG | (21) | (355) | |||||
(2,771) | |||||||
Real Estate (0.0%) | |||||||
China Evergrande Group | (85) | (251) | |||||
Digital Realty Trust Inc. | (3) | (300) | |||||
(551) | |||||||
Utilities (0.0%) | |||||||
Beijing Enterprises Water Group Ltd. | (46) | (24) | |||||
China Gas Holdings Ltd. | (7) | (26) | |||||
Edison International | (1) | (71) | |||||
(121) | |||||||
Total Common Stocks (proceeds $23,739) | (20,061) | ||||||
PREFERRED STOCKS (0.0%) | |||||||
Consumer Discretionary (0.0%) | |||||||
Volkswagen AG (a) | (1) | (174) | |||||
Total Preferred Stocks (proceeds $183) | (174) | ||||||
Total Securities Sold Short (0.6%) (proceeds $23,922) | (20,235) | ||||||
(a) Convertible security.
See accompanying Notes to Financial Statements.
Abbreviations, counterparties and additional footnotes are defined on page 305.
98
JNL Series Trust Sub-Advised Funds
Schedules of Investments (in thousands)
December 31, 2018
Summary of Investments by Country^ | Total Long Term Investments | |
Argentina | 0.9 | % |
Australia | 0.7 | |
Belgium | 0.4 | |
Brazil | 0.8 | |
Canada | 1.8 | |
Chile | — | |
China | 1.6 | |
Czech Republic | 0.1 | |
Denmark | 0.1 | |
Finland | — | |
France | 3.0 | |
Germany | 2.5 | |
Hong Kong | 1.0 | |
India | 1.3 | |
Indonesia | — | |
Ireland | 0.1 | |
Italy | 0.7 | |
Japan | 8.8 | |
Luxembourg | — | |
Macau | — | |
Malaysia | — | |
Mexico | 0.8 | |
Netherlands | 2.8 | |
Norway | — | |
Poland | — | |
Portugal | 0.1 | |
Singapore | 0.7 | |
South Africa | — | |
South Korea | 0.7 | |
Spain | 0.4 | |
Sweden | — | |
Switzerland | 1.1 | |
Taiwan | 0.9 | |
Thailand | 0.2 | |
Turkey | — | |
United Arab Emirates | 0.4 | |
United Kingdom | 2.2 | |
United States of America | 65.9 | |
100.0 | % | |
^A country table is presented as a percentage of the Fund’s total long term investments because its strategy includes investment in non-U.S. securities as deemed significant by the Fund’s Adviser. | ||
Long Term Investments in Affiliates
Affiliated Investment | Value Beginning of Period($) | Purchases($) | Sales Proceeds($) | Dividend Income($) | Realized Gain (Loss)($) | Change in Unrealized Appreciation (Depreciation) ($) | Value End of Period($) | Percentage of Net Assets(%) | ||||||||||
iShares Gold Trust Fund | 9,265 | 18,340 | — | — | — | (1,039) | 26,566 | 0.8 | ||||||||||
See accompanying Notes to Financial Statements.
Abbreviations, counterparties and additional footnotes are defined on page 305.
99
JNL Series Trust Sub-Advised Funds
Schedules of Investments (in thousands)
December 31, 2018
Restricted Securities | |||||||||
Initial Acquisition | Cost ($) | Value ($) | Percent of Net Assets (%) | ||||||
Australia Government Bond, 3.00%, 03/21/47 | 05/25/17 | 7,758 | 8,178 | 0.2 | |||||
Bio City Development Co. BV, 0.00%, 07/06/18 | 08/26/11 | 708 | 93 | — | |||||
Bundesrepublik Deutschland, 0.50%, 02/15/28 | 06/29/18 | 29,889 | 29,677 | 0.9 | |||||
Domo Inc. | 06/29/18 | 8,527 | 3,805 | 0.1 | |||||
Fieldwood Energy Inc. | 05/16/18 | 353 | 635 | — | |||||
Fieldwood Energy Inc. | 05/16/18 | 149 | 172 | — | |||||
Grand Rounds Inc. - Series C | 04/01/15 | 1,774 | 1,565 | — | |||||
Inversiones Alsacia SA, 0.00%, 03/11/19 | 01/07/15 | 1,859 | 55 | — | |||||
Jawbone Health Hub Inc. | 01/31/17 | — | — | — | |||||
Lookout Inc. | 03/05/15 | 237 | — | — | |||||
Lookout Inc. - Series F | 09/22/14 | 3,242 | 1,714 | 0.1 | |||||
Palantir Technologies Inc. - Series I | 03/27/14 | 3,142 | 2,773 | 0.1 | |||||
Quintis Pty Ltd. | 11/02/17 | 1,905 | 2,019 | 0.1 | |||||
REI Agro Ltd., 0.00%, 11/13/14 | 05/13/14 | 606 | 2 | — | |||||
Uber Technologies Inc. | 01/09/15 | 4,702 | 13,631 | 0.4 | |||||
64,851 | 64,319 | 1.9 | |||||||
JNL/BlackRock Global Allocation Fund — Futures Contracts | ||||||||||||||||
Reference Entity | Contracts Long (Short)1 | Expiration | Notional 1 | Variation Margin Receivable (Payable) ($) | Unrealized Appreciation (Depreciation) ($) | |||||||||||
Canadian Government Bond, 10-Year | (296) | March 2019 | CAD | (39,999) | 10 | (360) | ||||||||||
Euro STOXX 50 | (2,089) | March 2019 | EUR | (63,839) | — | 1,958 | ||||||||||
FTSE 100 Index | (1) | March 2019 | GBP | (66) | — | (1) | ||||||||||
S&P 500 E-Mini Index | (63) | March 2019 | (7,823) | (60) | (68) | |||||||||||
Yen Denominated Nikkei 225 | (57) | March 2019 | JPY | (591,843) | 27 | 243 | ||||||||||
(23) | 1,772 | |||||||||||||||
JNL/BlackRock Global Allocation Fund — Centrally Cleared Interest Rate Swap Agreements | |||||||||||||||||
Floating Rate Index2 | Paying / Receiving Floating Rate | Fixed Rate2 (%) | Expiration | Notional1 | Variation Margin Receivable (Payable) ($) | Unrealized Appreciation (Depreciation) ($) | |||||||||||
3M LIBOR (Q) | Receiving | 2.99 | (S) | 07/18/50 | 27,177 | (120) | (611) | ||||||||||
3M LIBOR (Q) | Paying | 2.97 | (S) | 07/18/25 | 120,936 | 274 | 2,016 | ||||||||||
3M LIBOR (Q) | Paying | 3.20 | (S) | 10/29/28 | 95,728 | 377 | 4,135 | ||||||||||
6M EURIBOR (S) | Receiving | 0.84 | (A) | 02/15/28 | EUR | 13,343 | (2) | (156) | |||||||||
6M EURIBOR (S) | Receiving | 0.84 | (A) | 02/15/28 | EUR | 14,281 | (2) | (168) | |||||||||
6M EURIBOR (S) | Receiving | 0.99 | (A) | 10/29/28 | EUR | 75,866 | (58) | (1,631) | |||||||||
469 | 3,585 | ||||||||||||||||
JNL/BlackRock Global Allocation Fund — Centrally Cleared Credit Default Swap Agreements | ||||||||||||||||||
Reference Entity2 | Fixed Receive/ Pay Rate8 (%) | Expiration | Notional1,7 | Value6 ($) | Variation Margin Receivable (Payable) ($) | Unrealized Appreciation (Depreciation) ($) | ||||||||||||
Credit default swap agreements - sell protection4 | ||||||||||||||||||
CDX.NA.HY.30 (Q) | 5.00 | 06/20/23 | (6,008) | 185 | 6 | (180) | ||||||||||||
JNL/BlackRock Global Allocation Fund — OTC Purchased Options | |||||||||||||||||
Reference Entity | Counterparty | Put/Call | Exercise Price ($)/ Swaption Rate (%) | Expiration | Notional/ Contracts 1 | Value ($) | |||||||||||
Foreign Currency Options | |||||||||||||||||
British Pound versus USD | UBS | Call | 1.32 | 05/15/19 | GBP | 56,073,000 | 1,366 | ||||||||||
Index Options | |||||||||||||||||
Euro Stoxx Bank Index | BCL | Call | EUR | 136.97 | 03/19/21 | 61,665 | 70 | ||||||||||
Euro Stoxx Bank Index | UBS | Call | EUR | 134.92 | 06/18/21 | 63,580 | 83 | ||||||||||
KOSPI 200 | GSC | Call | 302.50 | 03/14/19 | 53,860 | 10 | |||||||||||
Russell 2000 Index | BOA | Call | 1,700.00 | 03/15/19 | 10,594 | 3 | |||||||||||
Tokyo Price Index | MSC | Call | JPY | 1,785.00 | 03/08/19 | 762,124 | 6 | ||||||||||
TOPIX Banks Index | BNP | Call | JPY | 194.04 | 03/13/20 | 3,556,337 | 78 | ||||||||||
TOPIX Banks Index | BOA | Call | JPY | 191.28 | 12/13/19 | 2,633,004 | 46 | ||||||||||
See accompanying Notes to Financial Statements.
Abbreviations, counterparties and additional footnotes are defined on page 305.
100
JNL Series Trust Sub-Advised Funds
Schedules of Investments (in thousands)
December 31, 2018
JNL/BlackRock Global Allocation Fund — OTC Purchased Options (continued) | |||||||||||||||||
Reference Entity | Counterparty | Put/Call | Exercise Price ($)/ Swaption Rate (%) | Expiration | Notional/ Contracts 1 | Value ($) | |||||||||||
TOPIX Banks Index | MSC | Call | JPY | 192.04 | 04/10/20 | 3,164,627 | 68 | ||||||||||
TOPIX Banks Index | MSC | Call | JPY | 191.28 | 12/13/19 | 4,976,232 | 86 | ||||||||||
S&P 500 Index | BCL | Put | 2,400.00 | 01/31/19 | 1,413 | 45 | |||||||||||
S&P 500 Index | BCL | Put | 2,700.00 | 01/18/19 | 13,325 | 2,607 | |||||||||||
S&P 500 Index | BCL | Put | 2,350.00 | 01/18/19 | 1,409 | 19 | |||||||||||
S&P 500 Index | BCL | Put | 2,400.00 | 01/18/19 | 1,703 | 9 | |||||||||||
3,130 | |||||||||||||||||
Interest Rate Swaptions10 | |||||||||||||||||
3M LIBOR, 03/04/19 | NSI | Put | 3.00 | 03/04/19 | 112,924,000 | 49 | |||||||||||
Options on Securities | |||||||||||||||||
Alphabet Inc. - Class C | JPM | Call | 1,225.00 | 01/17/20 | 6,404 | 368 | |||||||||||
Anadarko Petroleum Corp. | CSI | Call | 67.50 | 01/17/20 | 67,341 | 103 | |||||||||||
BP Plc | NSI | Call | 43.50 | 01/17/20 | 309,900 | 393 | |||||||||||
BP Plc | UBS | Call | 52.00 | 06/21/19 | 338,254 | 8 | |||||||||||
Chevron Corp. | UBS | Call | 125.00 | 01/18/19 | 101,328 | 1 | |||||||||||
ConocoPhillips Co. | UBS | Call | 75.00 | 06/21/19 | 176,716 | 212 | |||||||||||
CVS Health Corp. | JPM | Call | 78.50 | 01/17/20 | 47,369 | 145 | |||||||||||
Exxon Mobil Corp. | UBS | Call | 95.00 | 01/18/19 | 68,891 | — | |||||||||||
Facebook Inc. | UBS | Call | 165.00 | 09/20/19 | 110,064 | 598 | |||||||||||
Halliburton Co. | CIT | Call | 50.00 | 01/17/20 | 129,663 | 21 | |||||||||||
Johnson & Johnson | BOA | Call | 155.00 | 01/17/20 | 48,028 | 127 | |||||||||||
JPMorgan Chase & Co. | CGM | Call | 114.50 | 01/17/20 | 47,400 | 154 | |||||||||||
Jupai Holdings Ltd. | MSC | Call | JPY | 4,894.87 | 12/11/20 | 110,932 | 12 | ||||||||||
Jupai Holdings Ltd. | MSC | Call | JPY | 4,816.24 | 09/11/20 | 111,041 | 15 | ||||||||||
Jupai Holdings Ltd. | MSC | Call | JPY | 4,756.33 | 03/13/20 | 137,345 | 17 | ||||||||||
Occidental Petroleum Corp. | UBS | Call | 92.50 | 06/21/19 | 157,106 | 10 | |||||||||||
Royal Dutch Shell Plc - Class A | UBS | Call | 77.00 | 06/21/19 | 193,080 | 24 | |||||||||||
Schlumberger Ltd. | UBS | Call | 90.00 | 01/18/19 | 99,719 | — | |||||||||||
Schlumberger Ltd. | UBS | Call | 70.00 | 01/17/20 | 108,421 | 11 | |||||||||||
SPDR Gold Trust ‡ | JPM | Call | 120.00 | 02/15/19 | 56,523 | 161 | |||||||||||
SPDR Gold Trust ‡ | MSC | Call | 120.00 | 05/17/19 | 57,164 | 291 | |||||||||||
SPDR Gold Trust ‡ | SGB | Call | 124.00 | 06/21/19 | 100,646 | 398 | |||||||||||
SPDR Gold Trust ‡ | SGB | Call | 123.00 | 04/18/19 | 105,866 | 323 | |||||||||||
SPDR Gold Trust ‡ | SGB | Call | 121.00 | 03/15/19 | 100,646 | 312 | |||||||||||
Suncor Energy Inc. | UBS | Call | 45.00 | 06/21/19 | 228,336 | 6 | |||||||||||
Total SA | UBS | Call | 70.00 | 09/20/19 | 237,909 | 36 | |||||||||||
3,746 | |||||||||||||||||
JNL/BlackRock Global Allocation Fund — Exchange Traded Written Options | |||||||||||||||||||
Reference Entity | Put/Call | Exercise Price ($)/ Swaption Rate (%) | Expiration | Notional/ Contracts 1 | Value ($) | ||||||||||||||
Options on Securities | |||||||||||||||||||
Adobe Inc. | Call | 260.00 | 01/18/19 | 3 | — | ||||||||||||||
Amazon.com Inc. | Call | 1,800.00 | 02/15/19 | 31 | (42) | ||||||||||||||
Amazon.com Inc. | Call | 1,790.00 | 02/15/19 | 31 | (44) | ||||||||||||||
Amazon.com Inc. | Call | 1,780.00 | 02/15/19 | 31 | (54) | ||||||||||||||
Intuit Inc. | Call | 220.00 | 01/18/19 | 3 | — | ||||||||||||||
McDonald's Corp. | Call | 185.00 | 01/18/19 | 17 | (2) | ||||||||||||||
VeriSign Inc. | Call | 170.00 | 01/18/19 | 6 | — | ||||||||||||||
(142) | |||||||||||||||||||
JNL/BlackRock Global Allocation Fund — OTC Written Options | ||||||||||||||||||
Reference Entity | Counterparty | Put/Call | Exercise Price ($)/ Swaption Rate(%) | Expiration | Notional/ Contracts 1 | Value ($) | ||||||||||||
Index Options | ||||||||||||||||||
Euro Stoxx Bank Index | BCL | Put | EUR | 110.23 | 03/19/21 | 41,110 | (1,673) | |||||||||||
Euro Stoxx Bank Index | UBS | Put | EUR | 106.38 | 06/18/21 | 41,826 | (1,673) | |||||||||||
KOSPI 200 | GSC | Call | 327.50 | 03/14/19 | 53,860 | — | ||||||||||||
KOSPI 200 | GSC | Put | 270.00 | 03/14/19 | 53,860 | (636) | ||||||||||||
S&P 500 Index | BCL | Put | 2,250.00 | 01/18/19 | 1,703 | (36) | ||||||||||||
S&P 500 Index | BCL | Put | 2,200.00 | 01/18/19 | 1,409 | (5) | ||||||||||||
S&P 500 Index | BCL | Put | 2,250.00 | 01/31/19 | 1,413 | (15) | ||||||||||||
S&P 500 Index | BOA | Put | 2,600.00 | 03/15/19 | 5,650 | (812) | ||||||||||||
Tokyo Price Index | MSC | Call | JPY | 1,950.00 | 03/08/19 | 762,124 | (1) | |||||||||||
See accompanying Notes to Financial Statements.
Abbreviations, counterparties and additional footnotes are defined on page 305.
101
JNL Series Trust Sub-Advised Funds
Schedules of Investments (in thousands)
December 31, 2018
JNL/BlackRock Global Allocation Fund — OTC Written Options (continued) | ||||||||||||||||||
Reference Entity | Counterparty | Put/Call | Exercise Price ($)/ Swaption Rate(%) | Expiration | Notional/ Contracts 1 | Value ($) | ||||||||||||
Tokyo Price Index | MSC | Put | JPY | 1,600.00 | 03/08/19 | 762,124 | (873) | |||||||||||
TOPIX Banks Index | BNP | Call | JPY | 237.47 | 03/13/20 | 3,556,337 | (17) | |||||||||||
TOPIX Banks Index | BOA | Call | JPY | 221.29 | 12/13/19 | 2,633,004 | (14) | |||||||||||
TOPIX Banks Index | MSC | Call | JPY | 221.29 | 12/13/19 | 4,976,232 | (26) | |||||||||||
TOPIX Banks Index | MSC | Call | JPY | 233.87 | 04/10/20 | 3,164,627 | (17) | |||||||||||
TOPIX Banks Index | BNP | Put | JPY | 155.80 | 03/13/20 | 3,556,337 | (770) | |||||||||||
TOPIX Banks Index | BOA | Put | JPY | 156.59 | 12/13/19 | 2,633,004 | (553) | |||||||||||
TOPIX Banks Index | MSC | Put | JPY | 156.59 | 12/13/19 | 4,976,232 | (1,046) | |||||||||||
TOPIX Banks Index | MSC | Put | JPY | 157.82 | 04/10/20 | 3,164,627 | (791) | |||||||||||
(8,958) | ||||||||||||||||||
Interest Rate Swaptions10 | ||||||||||||||||||
3M LIBOR, 03/04/19 | NSI | Call | 2.70 | 03/04/19 | 112,924,000 | (995) | ||||||||||||
Options on Securities | ||||||||||||||||||
Alphabet Inc. - Class C | JPM | Call | 1,350.00 | 01/17/20 | 6,404 | (190) | ||||||||||||
Alphabet Inc. - Class C | JPM | Put | 860.00 | 01/17/20 | 6,404 | (291) | ||||||||||||
Anadarko Petroleum Corp. | CSI | Call | 76.00 | 01/17/20 | 67,341 | (60) | ||||||||||||
Anadarko Petroleum Corp. | CSI | Put | 46.00 | 01/17/20 | 67,341 | (562) | ||||||||||||
Apple Inc. | BCL | Call | 160.00 | 01/18/19 | 26,120 | (107) | ||||||||||||
BP Plc | NSI | Put | 28.00 | 01/17/20 | 309,900 | (333) | ||||||||||||
Comcast Corp. | CGM | Call | 37.50 | 01/17/20 | 117,715 | (268) | ||||||||||||
ConocoPhillips Co. | UBS | Call | 85.00 | 06/21/19 | 176,716 | (41) | ||||||||||||
CVS Health Corp. | JPM | Call | 87.50 | 01/17/20 | 47,369 | (71) | ||||||||||||
CVS Health Corp. | JPM | Put | 56.00 | 01/17/20 | 47,369 | (185) | ||||||||||||
Facebook Inc. - Class A | UBS | Call | 220.00 | 01/17/20 | 256,001 | (333) | ||||||||||||
Facebook Inc. - Class A | UBS | Put | 155.00 | 01/17/20 | 256,001 | (7,866) | ||||||||||||
Halliburton Co. | CIT | Put | 35.00 | 01/17/20 | 129,663 | (1,238) | ||||||||||||
Johnson & Johnson | BOA | Call | 170.00 | 01/17/20 | 48,028 | (43) | ||||||||||||
Johnson & Johnson | BOA | Put | 109.00 | 01/17/20 | 48,028 | (225) | ||||||||||||
JPMorgan Chase & Co. | CGM | Call | 125.50 | 01/17/20 | 47,400 | (66) | ||||||||||||
JPMorgan Chase & Co. | CGM | Put | 87.25 | 01/17/20 | 47,400 | (285) | ||||||||||||
Jupai Holdings Ltd. | MSC | Call | JPY | 5,679.90 | 03/13/20 | 137,345 | (3) | |||||||||||
Jupai Holdings Ltd. | MSC | Put | JPY | 3,832.77 | 03/13/20 | 137,345 | (653) | |||||||||||
Jupai Holdings Ltd. | MSC | Put | JPY | 3,820.96 | 09/11/20 | 74,027 | (407) | |||||||||||
Jupai Holdings Ltd. | MSC | Put | JPY | 3,786.60 | 12/11/20 | 73,955 | (433) | |||||||||||
Microsoft Corp. | BCL | Call | 90.00 | 01/18/19 | 46,293 | (558) | ||||||||||||
Schlumberger Ltd. | UBS | Put | 52.50 | 01/17/20 | 108,421 | (1,934) | ||||||||||||
SPDR Gold Trust ‡ | MSC | Put | 113.00 | 05/17/19 | 28,582 | (20) | ||||||||||||
Total SA | UBS | Call | 75.00 | 09/20/19 | 237,909 | (14) | ||||||||||||
United Continental Holdings Inc. | DUB | Call | 75.00 | 01/18/19 | 33,402 | (305) | ||||||||||||
(16,491) | ||||||||||||||||||
Forward Foreign Currency Contracts
Purchased/ Sold | Counter-party | Expiration | Notional 1 | Value ($) | Unrealized Appreciation (Depreciation) ($) | |||||||||||||
EUR/USD | MSC | 01/25/19 | EUR | 7,928 | 9,100 | (11) | ||||||||||||
EUR/USD | GSC | 02/15/19 | EUR | 7,992 | 9,189 | 58 | ||||||||||||
EUR/USD | MSC | 02/28/19 | EUR | 7,933 | 9,131 | 104 | ||||||||||||
EUR/USD | MSC | 03/14/19 | EUR | 7,817 | 9,008 | 117 | ||||||||||||
GBP/USD | JPM | 01/11/19 | GBP | 12,501 | 15,950 | (370) | ||||||||||||
GBP/USD | JPM | 02/15/19 | GBP | 14,164 | 18,103 | (438) | ||||||||||||
GBP/USD | JPM | 02/21/19 | GBP | 7,384 | 9,440 | (226) | ||||||||||||
JPY/USD | UBS | 01/04/19 | JPY | 285 | 3 | — | ||||||||||||
JPY/USD | JPM | 01/07/19 | JPY | 963,124 | 8,790 | 91 | ||||||||||||
JPY/USD | UBS | 01/07/19 | JPY | 10,990 | 100 | 1 | ||||||||||||
JPY/USD | JPM | 01/25/19 | JPY | 2,026,331 | 18,521 | 273 | ||||||||||||
JPY/USD | CIT | 01/31/19 | JPY | 2,017,789 | 18,452 | 386 | ||||||||||||
JPY/USD | JPM | 02/14/19 | JPY | 3,084,656 | 28,238 | 802 | ||||||||||||
JPY/USD | MSC | 03/07/19 | JPY | 1,234,514 | 11,319 | 389 | ||||||||||||
NOK/USD | JPM | 02/01/19 | NOK | 59,975 | 6,943 | (293) | ||||||||||||
SEK/EUR | GSC | 03/21/19 | EUR | (15,742) | (18,152) | 321 | ||||||||||||
USD/AUD | JPM | 01/25/19 | AUD | (8,524) | (6,009) | 20 | ||||||||||||
USD/BRL | DUB | 03/01/19 | BRL | (39,202) | (10,072) | (16) | ||||||||||||
USD/EUR | MSC | 02/15/19 | EUR | (7,992) | (9,189) | — | ||||||||||||
USD/EUR | DUB | 02/28/19 | EUR | (7,933) | (9,131) | (26) | ||||||||||||
USD/EUR | MSC | 03/14/19 | EUR | (7,817) | (9,008) | (45) | ||||||||||||
USD/JPY | JPM | 01/04/19 | JPY | (3,420) | (31) | — | ||||||||||||
USD/JPY | MSC | 01/28/19 | JPY | (2,181,800) | (19,947) | (263) | ||||||||||||
USD/JPY | GSC | 02/04/19 | JPY | (2,180,450) | (19,946) | (453) | ||||||||||||
USD/JPY | GSC | 03/04/19 | JPY | (2,260,900) | (20,724) | (436) | ||||||||||||
USD/JPY | JPM | 03/25/19 | JPY | (962,800) | (8,843) | (94) | ||||||||||||
ZAR/USD | BOA | 03/14/19 | ZAR | 154,741 | 10,666 | (138) | ||||||||||||
51,901 | (247) | |||||||||||||||||
See accompanying Notes to Financial Statements.
Abbreviations, counterparties and additional footnotes are defined on page 305.
102
JNL Series Trust Sub-Advised Funds
Schedules of Investments (in thousands)
December 31, 2018
JNL/BlackRock Global Allocation Fund — OTC Total Return Swap Agreements | ||||||||||||||||
Reference Entity2 | Counter-party | Rate Paid/Received by Fund2,9 | Expiration | Notional1 | Premiums Paid (Received) ($) | Unrealized Appreciation (Depreciation) ($) | ||||||||||
Total return swap agreements - receiving return | ||||||||||||||||
FUTURES | ||||||||||||||||
Nikkei Dividend Future, Expiration April 2021 | BNP | N/A | 04/01/21 | JPY | 135,800 | — | 144 | |||||||||
Nikkei Dividend Future, Expiration April 2021 | BNP | N/A | 04/01/21 | JPY | 50,580 | — | 13 | |||||||||
Nikkei Dividend Future, Expiration April 2021 | BNP | N/A | 04/01/21 | JPY | 68,895 | — | 83 | |||||||||
Nikkei Dividend Future, Expiration April 2022 | BNP | N/A | 04/01/22 | JPY | 71,730 | — | 58 | |||||||||
Nikkei Dividend Future, Expiration April 2022 | BNP | N/A | 04/01/22 | JPY | 51,120 | — | 9 | |||||||||
Nikkei Dividend Future, Expiration April 2022 | BNP | N/A | 04/01/22 | JPY | 137,550 | — | 131 | |||||||||
Nikkei Dividend Future, Expiration April 2022 | BNP | N/A | 04/01/22 | JPY | 71,550 | — | 60 | |||||||||
S&P 500 Annual Dividend Index Future, Expiration December 2021 | BNP | N/A | 12/17/21 | 1,287 | — | 221 | ||||||||||
S&P 500 Annual Dividend Index Future, Expiration December 2020 | GSC | N/A | 12/18/20 | 995 | — | 177 | ||||||||||
— | 896 | |||||||||||||||
Total return swap agreements - paying return | ||||||||||||||||
INDEX | ||||||||||||||||
Euro STOXX Banks Net Return Index (E) | BNP | 3M EURIBOR -0.25% (Q) | 04/30/19 | EUR | (5,493) | — | 584 | |||||||||
‡All or a portion of the derivative instrument is held in the respective subsidiary. See Significant Accounting Policies, Basis of Consolidation in the Notes to Financial Statements.
See accompanying Notes to Financial Statements.
Abbreviations, counterparties and additional footnotes are defined on page 305.
103
JNL Series Trust Sub-Advised Funds
Schedules of Investments (in thousands)
December 31, 2018
Shares/Par1 | Value ($) | |||||
JNL/BlackRock Global Natural Resources Fund | ||||||
COMMON STOCKS 97.9% | ||||||
Australia 7.2% | ||||||
Beadell Resources Ltd. (a) (b) | 21,713 | 788 | ||||
BHP Group Plc | 1,124 | 23,849 | ||||
Newcrest Mining Ltd. | 811 | 12,475 | ||||
OZ Minerals Ltd. | 1,308 | 8,109 | ||||
45,221 | ||||||
Belgium 0.7% | ||||||
Umicore SA | 103 | 4,142 | ||||
Brazil 3.1% | ||||||
Vale SA - ADR | 1,499 | 19,772 | ||||
Canada 20.7% | ||||||
Canadian Natural Resources Ltd. | 216 | 5,213 | ||||
Curaleaf Holdings Inc. (a) | 865 | 4,096 | ||||
First Quantum Minerals Ltd. | 2,178 | 17,627 | ||||
Lundin Mining Corp. | 1,137 | 4,700 | ||||
Neo Lithium Corp. (a) | 5,410 | 2,459 | ||||
Nutrien Ltd. (b) | 893 | 41,992 | ||||
Stelco Holdings Inc. (b) | 914 | 10,090 | ||||
Suncor Energy Inc. | 716 | 20,012 | ||||
Teck Resources Ltd. - Class B (b) | 875 | 18,850 | ||||
Wheaton Precious Metals Corp. | 258 | 5,032 | ||||
130,071 | ||||||
China 1.2% | ||||||
CNOOC Ltd. | 4,987 | 7,672 | ||||
France 5.8% | ||||||
Total SA | 695 | 36,772 | ||||
Ghana 0.5% | ||||||
Kosmos Energy Ltd. (a) (b) | 805 | 3,277 | ||||
Ireland 2.1% | ||||||
Glambia Plc | 362 | 6,809 | ||||
Smurfit Kappa Group Plc | 237 | 6,332 | ||||
13,141 | ||||||
Jersey 3.9% | ||||||
Randgold Resources Ltd. (c) | 152 | 12,647 | ||||
Randgold Resources Ltd. - ADR (b) (c) | 144 | 11,933 | ||||
24,580 | ||||||
Luxembourg 2.1% | ||||||
ArcelorMittal | 642 | 13,482 | ||||
Netherlands 6.0% | ||||||
Royal Dutch Shell Plc - Class B | 1,257 | 37,577 | ||||
Norway 1.0% | ||||||
Yara International ASA | 157 | 6,085 | ||||
Russian Federation 0.7% | ||||||
Polyus PJSC - GDR | 120 | 4,675 | ||||
Switzerland 3.7% | ||||||
Glencore Plc | 6,338 | 23,589 | ||||
Shares/Par1 | Value ($) | |||||
United Kingdom 12.2% | ||||||
BP Plc | 5,624 | 35,633 | ||||
Cairn Energy Plc (a) (b) | 1,673 | 3,211 | ||||
Fresnillo Plc | 1,111 | 12,233 | ||||
Mondi Plc | 426 | 8,896 | ||||
Rio Tinto Plc | 345 | 16,503 | ||||
76,476 | ||||||
United States of America 27.0% | ||||||
Anadarko Petroleum Corp. | 108 | 4,750 | ||||
Archer-Daniels-Midland Co. | 399 | 16,355 | ||||
Baker Hughes a GE Co. LLC - Class A | 150 | 3,225 | ||||
Bunge Ltd. | 76 | 4,050 | ||||
CF Industries Holdings Inc. (b) | 257 | 11,172 | ||||
Concho Resources Inc. (a) | 29 | 2,931 | ||||
ConocoPhillips Co. | 152 | 9,460 | ||||
Deere & Co. | 25 | 3,794 | ||||
Devon Energy Corp. | 181 | 4,090 | ||||
Exxon Mobil Corp. | 285 | 19,458 | ||||
FMC Corp. | 222 | 16,419 | ||||
Halliburton Co. | 172 | 4,567 | ||||
Hormel Foods Corp. | 103 | 4,395 | ||||
Ingredion Inc. | 100 | 9,159 | ||||
Marathon Petroleum Corp. | 56 | 3,301 | ||||
Mosaic Co. (b) | 316 | 9,235 | ||||
Newmont Mining Corp. | 258 | 8,932 | ||||
Packaging Corp. of America | 138 | 11,538 | ||||
Pioneer Natural Resources Co. | 39 | 5,152 | ||||
Trimble Inc. (a) | 186 | 6,133 | ||||
Valero Energy Corp. | 95 | 7,120 | ||||
Williams Cos. Inc. | 202 | 4,451 | ||||
169,687 | ||||||
Total Common Stocks (cost $719,050) | 616,219 | |||||
SHORT TERM INVESTMENTS 4.0% | ||||||
Investment Companies 1.9% | ||||||
JNL Government Money Market Fund - Institutional Class, 2.31% (d) (e) | 12,003 | 12,003 | ||||
Securities Lending Collateral 2.1% | ||||||
JNL Securities Lending Collateral Fund - Institutional Class, 2.46% (d) (e) | 13,008 | 13,008 | ||||
Total Short Term Investments (cost $25,011) | 25,011 | |||||
Total Investments 101.9% (cost $744,061) | 641,230 | |||||
Other Assets and Liabilities, Net (1.9)% | (11,699) | |||||
Total Net Assets 100.0% | 629,531 | |||||
(a) Non-income producing security.
(b) All or portion of the security was on loan.
(c) Security fair valued in good faith as a Level 3 security in accordance with the procedures approved by the JNL Series Trust's Board of Trustees. Good faith fair valued securities are classified for Financial Accounting Standards Board ("FASB") Accounting Standards Codification ("ASC") Topic 820 "Fair Value Measurement" based on the applicable valuation inputs. See FASB ASC Topic 820 in the Notes to Financial Statements.
(d) Investment in affiliate.
(e) Yield changes daily to reflect current market conditions. Rate was the quoted yield as of December 31, 2018.
See accompanying Notes to Financial Statements.
Abbreviations, counterparties and additional footnotes are defined on page 305.
104
JNL Series Trust Sub-Advised Funds
Schedules of Investments (in thousands)
December 31, 2018
Shares/Par1 | Value ($) | |||||
JNL/BlackRock Large Cap Select Growth Fund | ||||||
COMMON STOCKS 98.1% | ||||||
Communication Services 14.9% | ||||||
Activision Blizzard Inc. | 530 | 24,680 | ||||
Alphabet Inc. - Class A (a) | 122 | 127,020 | ||||
Electronic Arts Inc. (a) | 715 | 56,402 | ||||
Facebook Inc. - Class A (a) | 414 | 54,255 | ||||
IAC/InterActiveCorp. (a) | 149 | 27,202 | ||||
Netflix Inc. (a) | 329 | 88,106 | ||||
Tencent Holdings Ltd. (b) | 2,173 | 87,160 | ||||
464,825 | ||||||
Consumer Discretionary 16.2% | ||||||
Amazon.com Inc. (a) | 188 | 281,981 | ||||
Booking Holdings Inc. (a) | 47 | 81,219 | ||||
Domino's Pizza Inc. | 129 | 32,002 | ||||
MercadoLibre Inc. | 173 | 50,586 | ||||
Nike Inc. - Class B | 484 | 35,875 | ||||
Tesla Inc. (a) | 72 | 23,822 | ||||
505,485 | ||||||
Consumer Staples 1.8% | ||||||
Constellation Brands Inc. - Class A | 344 | 55,402 | ||||
Financials 5.2% | ||||||
Berkshire Hathaway Inc. - Class B (a) | 190 | 38,695 | ||||
CME Group Inc. | 247 | 46,401 | ||||
First Republic Bank | 204 | 17,764 | ||||
S&P Global Inc. | 351 | 59,729 | ||||
162,589 | ||||||
Health Care 19.0% | ||||||
Align Technology Inc. (a) | 227 | 47,611 | ||||
Becton Dickinson & Co. | 299 | 67,409 | ||||
BioMarin Pharmaceutical Inc. (a) | 155 | 13,240 | ||||
Boston Scientific Corp. (a) | 2,048 | 72,365 | ||||
Centene Corp. (a) | 384 | 44,272 | ||||
Illumina Inc. (a) | 179 | 53,543 | ||||
Intuitive Surgical Inc. (a) | 107 | 51,182 | ||||
Novartis AG - ADR | 599 | 51,436 | ||||
UnitedHealth Group Inc. | 493 | 122,921 | ||||
Vertex Pharmaceuticals Inc. (a) | 245 | 40,549 | ||||
Zoetis Inc. - Class A | 348 | 29,789 | ||||
594,317 | ||||||
Industrials 5.8% | ||||||
CoStar Group Inc. (a) | 207 | 69,707 | ||||
Roper Industries Inc. | 119 | 31,613 | ||||
Union Pacific Corp. | 369 | 51,013 | ||||
Xylem Inc. | 439 | 29,294 | ||||
181,627 | ||||||
Information Technology 31.9% | ||||||
Adobe Inc. (a) | 343 | 77,623 | ||||
Shares/Par1 | Value ($) | |||||
Apple Inc. | 177 | 27,849 | ||||
ASML Holding NV - ADR | 371 | 57,748 | ||||
Autodesk Inc. (a) | 374 | 48,113 | ||||
Intuit Inc. | 364 | 71,644 | ||||
Mastercard Inc. - Class A | 557 | 105,158 | ||||
Microsoft Corp. | 2,035 | 206,653 | ||||
Nvidia Corp. | 275 | 36,710 | ||||
PayPal Holdings Inc. (a) | 683 | 57,477 | ||||
Salesforce.com Inc. (a) | 687 | 94,102 | ||||
ServiceNow Inc. (a) | 263 | 46,813 | ||||
Visa Inc. - Class A | 1,265 | 166,890 | ||||
996,780 | ||||||
Materials 1.5% | ||||||
Sherwin-Williams Co. | 121 | 47,768 | ||||
Real Estate 1.8% | ||||||
SBA Communications Corp. (a) | 340 | 54,974 | ||||
Total Common Stocks (cost $2,491,019) | 3,063,767 | |||||
PREFERRED STOCKS 0.2% | ||||||
Information Technology 0.2% | ||||||
Palantir Technologies Inc. - Series I (a) (c) (d) (e) | 1,246 | 6,742 | ||||
Total Preferred Stocks (cost $7,639) | 6,742 | |||||
SHORT TERM INVESTMENTS 2.0% | ||||||
Investment Companies 2.0% | ||||||
JNL Government Money Market Fund - Institutional Class, 2.31% (f) (g) | 62,086 | 62,086 | ||||
Total Short Term Investments (cost $62,086) | 62,086 | |||||
Total Investments 100.3% (cost $2,560,744) | 3,132,595 | |||||
Other Assets and Liabilities, Net (0.3)% | (10,726) | |||||
Total Net Assets 100.0% | 3,121,869 | |||||
(a) Non-income producing security.
(b) Security fair valued in good faith as a Level 2 security in accordance with the procedures approved by the JNL Series Trust's Board of Trustees. Good faith fair valued securities are classified for Financial Accounting Standards Board ("FASB") Accounting Standards Codification ("ASC") Topic 820 "Fair Value Measurement" based on the applicable valuation inputs. See FASB ASC Topic 820 in the Notes to Financial Statements.
(c) Security fair valued in good faith as a Level 3 security in accordance with the procedures approved by the JNL Series Trust's Board of Trustees. Good faith fair valued securities are classified for Financial Accounting Standards Board ("FASB") Accounting Standards Codification ("ASC") Topic 820 "Fair Value Measurement" based on the applicable valuation inputs. See FASB ASC Topic 820 in the Notes to Financial Statements.
(d) The Sub-Adviser has deemed this security to be illiquid based on procedures approved by the JNL Series Trust's Board of Trustees. Determinations of liquidity are unaudited.
(e) Security is restricted to resale to institutional investors. See Restricted Securities in the Schedules of Investments.
(f) Investment in affiliate.
(g) Yield changes daily to reflect current market conditions. Rate was the quoted yield as of December 31, 2018.
Restricted Securities | ||||||||||||||||
Initial Acquisition | Cost ($) | Value ($) | Percent of Net Assets (%) | |||||||||||||
Palantir Technologies Inc. - Series I | 02/10/14 | 7,639 | 6,742 | 0.2 | ||||||||||||
See accompanying Notes to Financial Statements.
Abbreviations, counterparties and additional footnotes are defined on page 305.
105
JNL Series Trust Sub-Advised Funds
Schedules of Investments (in thousands)
December 31, 2018
Shares/Par1 | Value ($) | |||||
JNL/Boston Partners Global Long Short Equity Fund | ||||||
COMMON STOCKS 99.8% | ||||||
Communication Services 9.0% | ||||||
Alphabet Inc. - Class C (a) (b) | 9 | 9,054 | ||||
Comcast Corp. - Class A (b) (c) | 182 | 6,213 | ||||
KT Corp. - ADR | 104 | 1,477 | ||||
Nippon Telegraph & Telephone Corp. | 176 | 7,183 | ||||
Twenty-First Century Fox Inc. - Class A | 83 | 4,016 | ||||
Verizon Communications Inc. (b) | 180 | 10,094 | ||||
Vodafone Group Plc | 999 | 1,957 | ||||
39,994 | ||||||
Consumer Discretionary 8.6% | ||||||
Dick's Sporting Goods Inc. | 80 | 2,497 | ||||
Haseko Corp. | 209 | 2,194 | ||||
Kering SA | 8 | 3,754 | ||||
Lear Corp. | 22 | 2,715 | ||||
Lowe's Cos. Inc. | 38 | 3,546 | ||||
Melco Resorts & Entertainment Ltd. - ADR | 81 | 1,430 | ||||
Nordstrom Inc. (b) | 76 | 3,558 | ||||
Pulte Homes Inc. (c) | 142 | 3,693 | ||||
Sony Corp. | 187 | 8,956 | ||||
Stars Group Inc. (a) | 122 | 2,008 | ||||
Tapestry Inc. | 113 | 3,817 | ||||
38,168 | ||||||
Consumer Staples 10.0% | ||||||
Asahi Breweries Ltd. | 124 | 4,813 | ||||
Coca-Cola European Partners Plc (c) | 110 | 5,065 | ||||
Danone SA | 78 | 5,473 | ||||
Imperial Brands Plc | 224 | 6,789 | ||||
Matsumotokiyoshi Holdings Co. Ltd. | 44 | 1,339 | ||||
Molson Coors Brewing Co. - Class B | 66 | 3,709 | ||||
Nomad Holdings Ltd. (a) (b) | 161 | 2,693 | ||||
Seven & I Holdings Co. Ltd. | 145 | 6,314 | ||||
Unilever Plc | 96 | 5,045 | ||||
Walmart Inc. (c) | 32 | 3,009 | ||||
44,249 | ||||||
Energy 6.6% | ||||||
Diamondback Energy Inc. | 24 | 2,225 | ||||
EQT Corp. (b) | 80 | 1,511 | ||||
Marathon Petroleum Corp. | 32 | 1,891 | ||||
Parsley Energy Inc. - Class A (a) (b) | 124 | 1,981 | ||||
Peabody Energy Corp. | 41 | 1,264 | ||||
Pioneer Natural Resources Co. (b) | 36 | 4,694 | ||||
Royal Dutch Shell Plc - Class A | 125 | 3,688 | ||||
Total SA | 129 | 6,817 | ||||
Tullow Oil Plc (a) | 860 | 1,980 | ||||
Woodside Petroleum Ltd. | 148 | 3,256 | ||||
29,307 | ||||||
Financials 19.7% | ||||||
Allstate Corp. (b) (c) | 48 | 3,993 | ||||
American Express Co. (b) | 56 | 5,371 | ||||
American International Group Inc. (c) | 118 | 4,666 | ||||
Aviva Plc | 641 | 3,076 | ||||
Bank of America Corp. (b) | 73 | 1,793 | ||||
Bank of Ireland Group Plc | 365 | 2,031 | ||||
Berkshire Hathaway Inc. - Class B (a) (b) (c) | 66 | 13,487 | ||||
Chubb Ltd. (b) (c) | 56 | 7,208 | ||||
Citigroup Inc. (b) | 92 | 4,801 | ||||
Everest Re Group Ltd. (b) | 23 | 4,972 | ||||
Goldman Sachs Group Inc. | 43 | 7,212 | ||||
HSBC Holdings Plc | 367 | 3,036 | ||||
KeyCorp | 211 | 3,119 | ||||
Lloyds Banking Group Plc | 6,640 | 4,387 | ||||
Loews Corp. (b) | 48 | 2,169 | ||||
RenaissanceRe Holdings Ltd. | 38 | 5,055 | ||||
Sumitomo Mitsui Financial Group Inc. | 110 | 3,639 | ||||
Wells Fargo & Co. (b) | 154 | 7,074 | ||||
87,089 | ||||||
Health Care 13.2% | ||||||
Anthem Inc. (b) | 27 | 7,194 | ||||
Biogen Inc. (a) (b) | 6 | 1,954 | ||||
Cigna Corp. | 25 | 4,777 | ||||
Shares/Par1 | Value ($) | |||||
CVS Health Corp. | 101 | 6,627 | ||||
GlaxoSmithKline Plc | 360 | 6,861 | ||||
Johnson & Johnson (b) (c) | 42 | 5,460 | ||||
Laboratory Corp. of America Holdings (a) (b) | 48 | 6,078 | ||||
McKesson Corp. (b) | 38 | 4,158 | ||||
Novo Nordisk A/S - Class B | 127 | 5,845 | ||||
Pfizer Inc. (b) (c) | 149 | 6,496 | ||||
Shionogi & Co. Ltd. | 50 | 2,877 | ||||
58,327 | ||||||
Industrials 10.8% | ||||||
ABB Ltd. | 286 | 5,456 | ||||
Air Lease Corp. - Class A (b) | 62 | 1,870 | ||||
CK Hutchison Holdings Ltd. | 418 | 4,007 | ||||
Eaton Corp. Plc (b) | 85 | 5,802 | ||||
Fuji Electric Holdings Co. Ltd. | 116 | 3,415 | ||||
GrafTech International Ltd. | 203 | 2,320 | ||||
KAR Auction Services Inc. | 62 | 2,964 | ||||
Masco Corp. (b) | 144 | 4,219 | ||||
Owens Corning Inc. (b) | 59 | 2,610 | ||||
Toshiba Corp. | 169 | 4,760 | ||||
United Technologies Corp. (b) | 60 | 6,398 | ||||
Vinci SA | 47 | 3,856 | ||||
47,677 | ||||||
Information Technology 12.9% | ||||||
Capgemini SA | 34 | 3,360 | ||||
Cisco Systems Inc. (b) | 171 | 7,407 | ||||
HP Inc. (b) | 100 | 2,041 | ||||
Marvell Technology Group Ltd. (b) | 231 | 3,739 | ||||
Microsoft Corp. (b) | 184 | 18,674 | ||||
NetApp Inc. | 59 | 3,531 | ||||
Oracle Corp. (c) | 135 | 6,077 | ||||
Samsung Electronics Co. Ltd. | 124 | 4,283 | ||||
SYNNEX Corp. | 47 | 3,789 | ||||
TE Connectivity Ltd. | 28 | 2,087 | ||||
Ulvac Inc. | 70 | 2,025 | ||||
57,013 | ||||||
Materials 7.4% | ||||||
Cemex SAB de CV - ADR (a) | 587 | 2,830 | ||||
CRH Plc | 279 | 7,395 | ||||
DowDuPont Inc. (b) (c) | 94 | 5,028 | ||||
FMC Corp. | 24 | 1,761 | ||||
Glencore Plc | 870 | 3,238 | ||||
Mosaic Co. | 95 | 2,770 | ||||
Nutrien Ltd. (b) | 103 | 4,818 | ||||
Ternium SA - ADR | 59 | 1,587 | ||||
Trinseo SA | 72 | 3,275 | ||||
32,702 | ||||||
Utilities 1.6% | ||||||
Vistra Energy Corp. (a) (b) | 315 | 7,221 | ||||
Total Common Stocks (cost $475,213) | 441,747 | |||||
PREFERRED STOCKS 0.6% | ||||||
Consumer Discretionary 0.6% | ||||||
Volkswagen AG (d) | 17 | 2,697 | ||||
Total Preferred Stocks (cost $3,401) | 2,697 | |||||
SHORT TERM INVESTMENTS 0.0% | ||||||
Securities Lending Collateral 0.0% | ||||||
JNL Securities Lending Collateral Fund - Institutional Class, 2.46% (e) (f) | 140 | 140 | ||||
Total Short Term Investments (cost $140) | 140 | |||||
Total Investments 100.4% (cost $478,754) | 444,584 | |||||
Total Securities Sold Short (37.5)% (proceeds $181,433) | (166,175) | |||||
Other Derivative Instruments (0.3)% | (1,549) | |||||
Other Assets and Liabilities, Net 37.4% | 165,978 | |||||
Total Net Assets 100.0% | 442,838 | |||||
(a) Non-income producing security.
(b) All or a portion of the security is pledged or segregated as collateral.
(c) All or a portion of the security is subject to a written call option.
(d) Convertible security.
(e) Investment in affiliate.
See accompanying Notes to Financial Statements.
Abbreviations, counterparties and additional footnotes are defined on page 305.
106
JNL Series Trust Sub-Advised Funds
Schedules of Investments (in thousands)
December 31, 2018
(f) Yield changes daily to reflect current market conditions. Rate was the quoted yield as of December 31, 2018.
Shares/Par1 | Value ($) | |||||
SECURITIES SOLD SHORT (37.5%) | ||||||
COMMON STOCKS (37.5%) | ||||||
Communication Services (1.4%) | ||||||
ASOS Plc | (17) | (484) | ||||
Cogent Communications Group Inc. | (25) | (1,129) | ||||
GTT Communications Inc. | (48) | (1,143) | ||||
Netflix Inc. | (3) | (813) | ||||
TripAdvisor Inc. | (27) | (1,438) | ||||
World Wrestling Entertainment Inc. - Class A | (17) | (1,271) | ||||
(6,278) | ||||||
Consumer Discretionary (5.9%) | ||||||
Asics Corp. | (125) | (1,588) | ||||
Brembo SpA | (119) | (1,219) | ||||
Carvana Co. - Class A | (31) | (1,011) | ||||
Chegg Inc. | (43) | (1,222) | ||||
Choice Hotels International Inc. | (23) | (1,625) | ||||
iRobot Corp. | (20) | (1,668) | ||||
Leggett & Platt Inc. | (54) | (1,947) | ||||
Mattel Inc. | (126) | (1,257) | ||||
MercadoLibre Inc. | (5) | (1,508) | ||||
Pinduoduo Inc. - ADR | (69) | (1,546) | ||||
Sekisui Chemical Co. Ltd. | (82) | (1,211) | ||||
Skylark Holdings Co. Ltd. | (62) | (983) | ||||
Sodexo SA | (13) | (1,291) | ||||
Tesla Inc. | (13) | (4,404) | ||||
Texas Roadhouse Inc. | (36) | (2,148) | ||||
Tiffany & Co. | (11) | (887) | ||||
Wayfair Inc. - Class A | (8) | (732) | ||||
(26,247) | ||||||
Consumer Staples (2.5%) | ||||||
a2 Milk Co. Ltd. | (213) | (1,531) | ||||
Calbee Inc. | (40) | (1,249) | ||||
Casey's General Stores Inc. | (12) | (1,522) | ||||
Golden Agri-Resources Ltd. | (7,715) | (1,379) | ||||
Lancaster Colony Corp. | (11) | (2,032) | ||||
MGP Ingredients Inc. | (16) | (900) | ||||
National Beverage Corp. | (11) | (789) | ||||
Uni-President China Holdings Ltd. | (1,904) | (1,654) | ||||
(11,056) | ||||||
Energy (2.4%) | ||||||
Antero Resources Midstream Management LLC | (115) | (1,283) | ||||
Apache Corp. | (54) | (1,423) | ||||
Continental Resources Inc. | (34) | (1,380) | ||||
Core Laboratories NV | (10) | (625) | ||||
Helmerich & Payne Inc. | (27) | (1,295) | ||||
Matador Resources Co. | (27) | (419) | ||||
National Oilwell Varco Inc. | (43) | (1,102) | ||||
TransCanada Corp. | (45) | (1,611) | ||||
Williams Cos. Inc. | (59) | (1,309) | ||||
(10,447) | ||||||
Financials (6.1%) | ||||||
China International Capital Corp. - Class H | (634) | (1,192) | ||||
Cohen & Steers Inc. | (37) | (1,270) | ||||
Community Bank System Inc. | (39) | (2,279) | ||||
Credit Agricole SA | (121) | (1,306) | ||||
Credit Suisse Group AG | (106) | (1,159) | ||||
CVB Financial Corp. | (75) | (1,515) | ||||
Focus Financial Partners Inc. - Class A | (34) | (908) | ||||
Hargreaves Lansdown Plc | (94) | (2,234) | ||||
KKR & Co. Inc. | (46) | (905) | ||||
Macquarie Group Ltd. | (18) | (1,356) | ||||
MarketAxess Holdings Inc. | (8) | (1,750) | ||||
Metro Bank Plc | (33) | (711) | ||||
MS&AD Insurance Group Holdings | (75) | (2,133) | ||||
RLI Corp. | (26) | (1,786) | ||||
RSA Insurance Group Plc | (248) | (1,628) | ||||
Shopify Inc. - Class A | (7) | (964) | ||||
Sony Financial Holdings Inc. | (60) | (1,113) | ||||
State Bank of India - GDR | (24) | (1,010) | ||||
Westamerica Bancorp | (33) | (1,843) | ||||
(27,062) | ||||||
Shares/Par1 | Value ($) | |||||
Health Care (2.5%) | ||||||
Align Technology Inc. | (9) | (1,834) | ||||
Chugai Pharmaceutical Co. Ltd. | (22) | (1,290) | ||||
Exact Sciences Corp. | (13) | (807) | ||||
Genmab A/S | (11) | (1,752) | ||||
Hisamitsu Pharmaceutical Co. Inc. | (28) | (1,531) | ||||
Inovalon Holdings Inc. - Class A | (55) | (787) | ||||
Medidata Solutions Inc. | (19) | (1,291) | ||||
Moderna Inc. | (64) | (977) | ||||
Nevro Corp. | (23) | (885) | ||||
(11,154) | ||||||
Industrials (7.5%) | ||||||
AAON Inc. | (33) | (1,173) | ||||
Axon Enterprise Inc. | (35) | (1,531) | ||||
Cimpress NV | (17) | (1,729) | ||||
Fanuc Ltd. | (7) | (999) | ||||
Geberit AG | (4) | (1,741) | ||||
Healthcare Services Group Inc. | (55) | (2,202) | ||||
Heartland Express Inc. | (95) | (1,744) | ||||
John Bean Technologies Corp. | (6) | (456) | ||||
Koninklijke Philips Electronics NV | (25) | (899) | ||||
LATAM Airlines Group SA - ADR | (74) | (765) | ||||
Makita Corp. | (50) | (1,768) | ||||
Middleby Corp. | (9) | (892) | ||||
MISUMI Group Inc. | (67) | (1,395) | ||||
Nidec Corp. | (12) | (1,337) | ||||
Panalpina Welttransport Holding AG | (8) | (1,091) | ||||
Renishaw Plc | (51) | (2,738) | ||||
Saab AB | (8) | (266) | ||||
Saab AB - Class B | (32) | (1,129) | ||||
SembCorp Marine Ltd. | (798) | (899) | ||||
Singapore Airport Terminal Services Ltd. | (411) | (1,404) | ||||
SiteOne Landscape Supply Inc. | (19) | (1,050) | ||||
TransDigm Group Inc. | (7) | (2,361) | ||||
Wabtec Corp. | (17) | (1,199) | ||||
Weir Group Plc | (106) | (1,755) | ||||
Wesco Aircraft Holdings Inc. | (94) | (745) | ||||
(33,268) | ||||||
Information Technology (4.9%) | ||||||
2U Inc. | (18) | (892) | ||||
Badger Meter Inc. | (21) | (1,038) | ||||
Blackbaud Inc. | (11) | (691) | ||||
Cree Inc. | (31) | (1,322) | ||||
Ellie Mae Inc. | (16) | (1,014) | ||||
Manhattan Associates Inc. | (33) | (1,387) | ||||
National Instruments Corp. | (21) | (933) | ||||
Omron Corp. | (29) | (1,038) | ||||
Power Integrations Inc. | (34) | (2,101) | ||||
Pure Storage Inc. - Class A | (42) | (681) | ||||
TDK Corp. | (21) | (1,493) | ||||
Ultimate Software Group Inc. | (6) | (1,429) | ||||
WiseTech Global Ltd. | (132) | (1,574) | ||||
Workday Inc. - Class A | (10) | (1,675) | ||||
Workiva Inc. - Class A | (47) | (1,701) | ||||
Yaskawa Electric Corp. | (76) | (1,853) | ||||
Zendesk Inc. | (17) | (1,008) | ||||
(21,830) | ||||||
Materials (3.5%) | ||||||
Ball Corp. | (27) | (1,224) | ||||
Compass Minerals International Inc. | (12) | (489) | ||||
First Quantum Minerals Ltd. | (72) | (584) | ||||
GCP Applied Technologies Inc. | (66) | (1,619) | ||||
Gerdau SA - ADR | (290) | (1,091) | ||||
Givaudan SA | (1) | (1,631) | ||||
Greif Inc. - Class A | (20) | (733) | ||||
LafargeHolcim Ltd. | (27) | (1,098) | ||||
LyondellBasell Industries NV - Class A | (14) | (1,190) | ||||
NewMarket Corp. | (3) | (1,247) | ||||
Nippon Paint Co. Ltd. | (22) | (752) | ||||
Quaker Chemical Corp. | (12) | (2,092) | ||||
See accompanying Notes to Financial Statements.
Abbreviations, counterparties and additional footnotes are defined on page 305.
107
JNL Series Trust Sub-Advised Funds
Schedules of Investments (in thousands)
December 31, 2018
Shares/Par1 | Value ($) | ||||||
Yara International ASA | (44) | (1,699) | |||||
(15,449) | |||||||
Real Estate (0.2%) | |||||||
Public Storage | (5) | (938) | |||||
Shares/Par1 | Value ($) | ||||||
Utilities (0.6%) | |||||||
Hong Kong & China Gas Co. Ltd. | (472) | (974) | |||||
Severn Trent Plc | (64) | (1,472) | |||||
(2,446) | |||||||
Total Common Stocks (proceeds $181,433) | (166,175) | ||||||
Total Securities Sold Short (37.5%) (proceeds $181,433) | (166,175) | ||||||
Summary of Investments by Country^ | Total Long Term Investments | |
Australia | 0.7 | % |
Bermuda | 1.2 | |
Canada | 1.6 | |
Denmark | 1.3 | |
France | 5.2 | |
Germany | 0.6 | |
Hong Kong | 1.2 | |
Ireland | 2.1 | |
Japan | 10.7 | |
Mexico | 1.0 | |
Netherlands | 0.8 | |
South Korea | 1.3 | |
Switzerland | 2.4 | |
United Kingdom | 8.6 | |
United States of America | 61.3 | |
100.0 | % | |
^A country table is presented as a percentage of the Fund’s total long term investments because its strategy includes investment in non-U.S. securities as deemed significant by the Fund’s Adviser. | ||
JNL/Boston Partners Global Long Short Equity Fund — Exchange Traded Written Options | |||||||||||||||||||
Reference Entity | Put/Call | Exercise Price ($)/ Swaption Rate (%) | Expiration | Notional/ Contracts 1 | Value ($) | ||||||||||||||
Options on Securities | |||||||||||||||||||
Allstate Corp. | Call | 95.00 | 04/18/19 | 385 | (21) | ||||||||||||||
Berkshire Hathaway Inc. | Call | 220.00 | 03/15/19 | 233 | (73) | ||||||||||||||
Chubb Ltd. | Call | 130.00 | 02/15/19 | 333 | (136) | ||||||||||||||
Coca-Cola European Partners Plc | Call | 47.00 | 02/15/19 | 1,027 | (98) | ||||||||||||||
Comcast Corp. | Call | 40.00 | 06/21/19 | 1,223 | (87) | ||||||||||||||
DowDuPont Inc. | Call | 65.00 | 01/18/19 | 601 | (1) | ||||||||||||||
Johnson & Johnson | Call | 130.00 | 04/18/19 | 330 | (201) | ||||||||||||||
Northrop Grumman Corp. | Call | 275.00 | 02/15/19 | 89 | (20) | ||||||||||||||
Oracle Corp. | Call | 48.00 | 03/15/19 | 1,087 | (111) | ||||||||||||||
Pfizer Inc. | Call | 45.00 | 06/21/19 | 1,033 | (207) | ||||||||||||||
PulteGroup Inc. | Call | 26.00 | 04/18/19 | 1,184 | (234) | ||||||||||||||
Walmart Inc. | Call | 97.50 | 03/15/19 | 289 | (67) | ||||||||||||||
(1,256) | |||||||||||||||||||
JNL/Boston Partners Global Long Short Equity Fund — OTC Written Options | ||||||||||||||||||
Reference Entity | Counterparty | Put/Call | Exercise Price ($)/ Swaption Rate(%) | Expiration | Notional/ Contracts 1 | Value ($) | ||||||||||||
Options on Securities | ||||||||||||||||||
American International Group Inc. | GSC | Call | 50.00 | 01/18/19 | 606 | (1) | ||||||||||||
Flex Ltd. | GSC | Call | 15.00 | 01/18/19 | 1,980 | — | ||||||||||||
(1) | ||||||||||||||||||
Forward Foreign Currency Contracts
Purchased/ Sold | Counter-party | Expiration | Notional 1 | Value ($) | Unrealized Appreciation (Depreciation) ($) | |||||||||||||
DKK/USD | BBH | 01/02/19 | DKK | 2,699 | 414 | 1 | ||||||||||||
HKD/USD | BBH | 01/02/19 | HKD | 2,249 | 287 | — | ||||||||||||
JPY/USD | BBH | 01/04/19 | JPY | 129,011 | 1,177 | 9 | ||||||||||||
JPY/USD | BBH | 01/07/19 | JPY | 249,669 | 2,278 | 25 | ||||||||||||
JPY/USD | BBH | 01/08/19 | JPY | 24,282 | 222 | 2 | ||||||||||||
USD/JPY | BBH | 01/04/19 | JPY | (119,603) | (1,091) | (10) | ||||||||||||
USD/JPY | BBH | 01/08/19 | JPY | (37,902) | (346) | (2) | ||||||||||||
2,941 | 25 | |||||||||||||||||
See accompanying Notes to Financial Statements.
Abbreviations, counterparties and additional footnotes are defined on page 305.
108
JNL Series Trust Sub-Advised Funds
Schedules of Investments (in thousands)
December 31, 2018
JNL/Boston Partners Global Long Short Equity Fund — OTC Contracts for Difference | |||||||||||||||
Reference Entity2 | Counter-party | Financing Fee2 | Expiration | Contracts1 Long (Short) | Notional1 | Unrealized Appreciation (Depreciation) ($) | |||||||||
Aozora Bank Ltd. (E) | GSC | Tokyo Overnight Average Rate -0.45% (M) | TBD | (46) | JPY | (160,103) | 84 | ||||||||
Axis Bank Ltd. (E) | MSC | Federal Funds Effective Rate -1.07% (M) | TBD | (22) | (968) | (25) | |||||||||
BDO Unibank Inc. (E) | MBL | Federal Funds Effective Rate -3.52% (M) | TBD | (640) | (1,513) | (82) | |||||||||
Celltrion Inc. (E) | GSC | Federal Funds Effective Rate -5.00% (M) | TBD | (11) | (2,140) | (110) | |||||||||
Cheng Shin Rubber Industry Co. Ltd. (E) | GSC | Federal Funds Effective Rate -1.51% (M) | TBD | (993) | (1,383) | 64 | |||||||||
First Financial Bankshares Inc. (E) | GSC | Federal Funds Effective Rate -0.72% (M) | TBD | (40) | (2,266) | (33) | |||||||||
KGHM Polska Miedz SA (E) | GSC | Federal Funds Effective Rate -0.50% (M) | TBD | (63) | (1,484) | (10) | |||||||||
Pearson Plc (E) | GSC | Sterling Overnight Index Average -0.40% (M) | TBD | (128) | GBP | (1,190) | (20) | ||||||||
Pennon Group Plc (E) | GSC | Sterling Overnight Index Average -0.40% (M) | TBD | (165) | GBP | (1,136) | (5) | ||||||||
Prosperity Bancshares Inc. (E) | GSC | Federal Funds Effective Rate -0.25% (M) | TBD | (39) | (2,396) | (76) | |||||||||
Sillajen Inc. (E) | GSC | Federal Funds Effective Rate -6.50% (M) | TBD | (19) | (1,258) | (15) | |||||||||
Unilever Indonesia (E) | MBL | Federal Funds Effective Rate -4.49% (M) | TBD | (713) | (2,162) | (89) | |||||||||
(317) | |||||||||||||||
See accompanying Notes to Financial Statements.
Abbreviations, counterparties and additional footnotes are defined on page 305.
109
JNL Series Trust Sub-Advised Funds
Schedules of Investments (in thousands)
December 31, 2018
Shares/Par1 | Value ($) | |||||
JNL/Causeway International Value Select Fund | ||||||
COMMON STOCKS 92.9% | ||||||
Australia 0.9% | ||||||
BHP Group Plc | 636 | 13,504 | ||||
Canada 7.1% | ||||||
Canadian Imperial Bank of Commerce (a) | 151 | 11,242 | ||||
Canadian Pacific Railway Ltd. | 44 | 7,726 | ||||
EnCana Corp. | 3,592 | 20,751 | ||||
Gildan Activewear Inc. | 900 | 27,358 | ||||
Manulife Financial Corp. | 2,645 | 37,567 | ||||
104,644 | ||||||
China 6.1% | ||||||
Baidu.com - Class A - ADR (b) | 207 | 32,903 | ||||
China Merchants Holdings International Co. Ltd. | 5,213 | 9,323 | ||||
China Mobile Ltd. | 4,864 | 46,797 | ||||
89,023 | ||||||
France 2.9% | ||||||
BNP Paribas SA | 685 | 31,038 | ||||
Engie SA | 817 | 11,740 | ||||
42,778 | ||||||
Germany 7.0% | ||||||
BASF SE | 684 | 48,025 | ||||
Deutsche Post AG | 860 | 23,622 | ||||
SAP SE | 306 | 30,626 | ||||
102,273 | ||||||
Italy 3.3% | ||||||
Unicredit SpA | 4,335 | 49,186 | ||||
Japan 14.5% | ||||||
East Japan Railway Co. | 350 | 30,899 | ||||
Fanuc Ltd. | 163 | 24,638 | ||||
Japan Airlines Co. Ltd. | 725 | 25,697 | ||||
KDDI Corp. | 1,632 | 39,008 | ||||
Sompo Holdings Inc. | 628 | 21,270 | ||||
Sumitomo Mitsui Financial Group Inc. | 542 | 17,979 | ||||
Takeda Pharmaceutical Co. Ltd. (a) | 1,594 | 54,053 | ||||
213,544 | ||||||
Netherlands 6.6% | ||||||
Akzo Nobel NV | 517 | 41,685 | ||||
ING Groep NV | 1,408 | 15,213 | ||||
Royal Dutch Shell Plc - Class B | 1,343 | 40,124 | ||||
97,022 | ||||||
South Korea 4.7% | ||||||
Samsung Electronics Co. Ltd. | 663 | 22,986 | ||||
SK Innovation Co. Ltd. | 39 | 6,229 | ||||
SK Telecom Co. Ltd. | 166 | 40,120 | ||||
69,335 | ||||||
Shares/Par1 | Value ($) | |||||
Spain 1.0% | ||||||
CaixaBank SA | 4,136 | 15,036 | ||||
Switzerland 10.6% | ||||||
ABB Ltd. | 2,372 | 45,315 | ||||
Cie Financiere Richemont SA | 463 | 29,966 | ||||
Givaudan SA | 8 | 17,596 | ||||
Novartis AG | 377 | 32,343 | ||||
Roche Holding AG | 123 | 30,581 | ||||
155,801 | ||||||
United Kingdom 28.2% | ||||||
AstraZeneca Plc | 494 | 37,096 | ||||
Aviva Plc | 6,029 | 28,925 | ||||
Barclays Plc | 21,400 | 41,229 | ||||
BP Plc | 5,627 | 35,646 | ||||
British American Tobacco Plc | 1,240 | 39,661 | ||||
Carnival Plc | 426 | 20,534 | ||||
GlaxoSmithKline Plc | 806 | 15,358 | ||||
Johnson Matthey Plc | 290 | 10,364 | ||||
Linde Plc | 364 | 58,112 | ||||
Lloyds Banking Group Plc | 26,951 | 17,806 | ||||
Micro Focus International Plc | 1,140 | 20,164 | ||||
Rolls-Royce Holdings Plc | 2,922 | 30,987 | ||||
SSE Plc | 2,482 | 34,271 | ||||
Vodafone Group Plc | 13,080 | 25,624 | ||||
415,777 | ||||||
Total Common Stocks (cost $1,578,824) | 1,367,923 | |||||
PREFERRED STOCKS 4.5% | ||||||
Germany 4.5% | ||||||
Volkswagen AG (c) | 420 | 66,772 | ||||
Total Preferred Stocks (cost $63,116) | 66,772 | |||||
SHORT TERM INVESTMENTS 4.3% | ||||||
Investment Companies 2.3% | ||||||
JNL Government Money Market Fund - Institutional Class, 2.31% (d) (e) | 34,006 | 34,006 | ||||
Securities Lending Collateral 2.0% | ||||||
JNL Securities Lending Collateral Fund - Institutional Class, 2.46% (d) (e) | 29,229 | 29,229 | ||||
Total Short Term Investments (cost $63,235) | 63,235 | |||||
Total Investments 101.7% (cost $1,705,175) | 1,497,930 | |||||
Other Derivative Instruments 0.0% | 2 | |||||
Other Assets and Liabilities, Net (1.7)% | (24,978) | |||||
Total Net Assets 100.0% | 1,472,954 | |||||
(a) All or portion of the security was on loan.
(b) Non-income producing security.
(c) Convertible security.
(d) Investment in affiliate.
(e) Yield changes daily to reflect current market conditions. Rate was the quoted yield as of December 31, 2018.
Forward Foreign Currency Contracts
Purchased/ Sold | Counter-party | Expiration | Notional 1 | Value ($) | Unrealized Appreciation (Depreciation) ($) | |||||||||||||
JPY/USD | BNY | 01/08/19 | JPY | 30,515 | 279 | 2 | ||||||||||||
See accompanying Notes to Financial Statements.
Abbreviations, counterparties and additional footnotes are defined on page 305.
110
JNL Series Trust Sub-Advised Funds
Schedules of Investments (in thousands)
December 31, 2018
Shares/Par1 | Value ($) | |||||
JNL/ClearBridge Large Cap Growth Fund | ||||||
COMMON STOCKS 98.0% | ||||||
Communication Services 12.2% | ||||||
Alphabet Inc. - Class A (a) | 7 | 7,346 | ||||
Alphabet Inc. - Class C (a) | 18 | 18,249 | ||||
Comcast Corp. - Class A | 334 | 11,383 | ||||
Facebook Inc. - Class A (a) | 153 | 20,078 | ||||
Walt Disney Co. | 115 | 12,597 | ||||
69,653 | ||||||
Consumer Discretionary 12.0% | ||||||
Alibaba Group Holding Ltd. - ADS (a) | 46 | 6,263 | ||||
Amazon.com Inc. (a) | 23 | 34,373 | ||||
Chipotle Mexican Grill Inc. (a) | 17 | 7,317 | ||||
Home Depot Inc. | 65 | 11,188 | ||||
Yum China Holdings Inc. | 284 | 9,519 | ||||
68,660 | ||||||
Consumer Staples 5.8% | ||||||
Anheuser-Busch InBev NV - ADR (b) | 144 | 9,458 | ||||
Coca-Cola Co. | 177 | 8,361 | ||||
Costco Wholesale Corp. | 47 | 9,489 | ||||
McCormick & Co. Inc. | 39 | 5,500 | ||||
32,808 | ||||||
Energy 1.8% | ||||||
Pioneer Natural Resources Co. | 36 | 4,713 | ||||
Schlumberger Ltd. | 147 | 5,299 | ||||
10,012 | ||||||
Financials 5.2% | ||||||
American Express Co. | 99 | 9,436 | ||||
BlackRock Inc. | 26 | 10,066 | ||||
Charles Schwab Corp. | 248 | 10,281 | ||||
29,783 | ||||||
Health Care 16.6% | ||||||
Alexion Pharmaceuticals Inc. (a) | 82 | 8,028 | ||||
Biogen Inc. (a) | 39 | 11,898 | ||||
BioMarin Pharmaceutical Inc. (a) | 70 | 5,936 | ||||
Celgene Corp. (a) | 148 | 9,493 | ||||
Johnson & Johnson | 64 | 8,262 | ||||
Regeneron Pharmaceuticals Inc. (a) | 20 | 7,310 | ||||
Thermo Fisher Scientific Inc. | 56 | 12,465 | ||||
UnitedHealth Group Inc. | 73 | 18,124 | ||||
Zoetis Inc. - Class A | 151 | 12,933 | ||||
94,449 | ||||||
Industrials 7.0% | ||||||
Caterpillar Inc. | 59 | 7,546 | ||||
Honeywell International Inc. | 83 | 11,009 | ||||
United Parcel Service Inc. - Class B | 88 | 8,548 | ||||
WW Grainger Inc. | 45 | 12,749 | ||||
39,852 | ||||||
Information Technology 32.2% | ||||||
Adobe Inc. (a) | 70 | 15,754 | ||||
Akamai Technologies Inc. (a) | 178 | 10,880 | ||||
Apple Inc. | 83 | 13,117 | ||||
IHS Markit Ltd. (a) | 154 | 7,401 | ||||
Microsoft Corp. | 251 | 25,512 | ||||
Nutanix Inc. - Class A (a) | 148 | 6,159 | ||||
Nvidia Corp. | 30 | 4,076 | ||||
Oracle Corp. | 270 | 12,202 | ||||
Palo Alto Networks Inc. (a) | 51 | 9,631 | ||||
PayPal Holdings Inc. (a) | 140 | 11,760 | ||||
QUALCOMM Inc. | 181 | 10,308 | ||||
Red Hat Inc. (a) | 60 | 10,502 | ||||
Splunk Inc. (a) | 92 | 9,671 | ||||
Texas Instruments Inc. | 100 | 9,494 | ||||
Visa Inc. - Class A | 154 | 20,343 | ||||
VMware Inc. - Class A | 47 | 6,452 | ||||
183,262 | ||||||
Materials 3.6% | ||||||
Ecolab Inc. | 76 | 11,228 | ||||
Linde Plc | 60 | 9,324 | ||||
20,552 | ||||||
Shares/Par1 | Value ($) | |||||
Real Estate 1.6% | ||||||
Equinix Inc. | 27 | 9,391 | ||||
Total Common Stocks (cost $545,392) | 558,422 | |||||
SHORT TERM INVESTMENTS 2.9% | ||||||
Investment Companies 2.1% | ||||||
JNL Government Money Market Fund - Institutional Class, 2.31% (c) (d) | 11,822 | 11,822 | ||||
Securities Lending Collateral 0.8% | ||||||
JNL Securities Lending Collateral Fund - Institutional Class, 2.46% (c) (d) | 4,671 | 4,671 | ||||
Total Short Term Investments (cost $16,493) | 16,493 | |||||
Total Investments 100.9% (cost $561,885) | 574,915 | |||||
Other Assets and Liabilities, Net (0.9)% | (5,075) | |||||
Total Net Assets 100.0% | 569,840 | |||||
(a) Non-income producing security.
(b) All or portion of the security was on loan.
(c) Investment in affiliate.
(d) Yield changes daily to reflect current market conditions. Rate was the quoted yield as of December 31, 2018.
See accompanying Notes to Financial Statements.
Abbreviations, counterparties and additional footnotes are defined on page 305.
111
JNL Series Trust Sub-Advised Funds
Schedules of Investments (in thousands)
December 31, 2018
Shares/Par1 | Value ($) | ||||||
JNL/Crescent High Income Fund * (a) | |||||||
CORPORATE BONDS AND NOTES 74.8% | |||||||
Communication Services 11.8% | |||||||
Cablevision Systems Corp. | |||||||
5.88%, 09/15/22 | 6,000 | 5,905 | |||||
CCO Holdings LLC | |||||||
5.25%, 09/30/22 | 2,225 | 2,216 | |||||
5.13%, 02/15/23 | 4,025 | 3,924 | |||||
CenturyLink Inc. | |||||||
6.45%, 06/15/21 | 1,500 | 1,494 | |||||
5.80%, 03/15/22 | 1,750 | 1,681 | |||||
7.50%, 04/01/24 (b) | 1,000 | 969 | |||||
CSC Holdings LLC | |||||||
5.13%, 12/15/21 (c) | 1,500 | 1,472 | |||||
DISH DBS Corp. | |||||||
6.75%, 06/01/21 | 5,000 | 4,955 | |||||
5.00%, 03/15/23 | 4,350 | 3,583 | |||||
Frontier Communications Corp. | |||||||
10.50%, 09/15/22 (b) | 4,000 | 2,774 | |||||
8.50%, 04/01/26 (c) | 1,675 | 1,466 | |||||
Sirius XM Radio Inc. | |||||||
3.88%, 08/01/22 (c) | 5,500 | 5,264 | |||||
Sprint Corp. | |||||||
7.25%, 09/15/21 | 11,750 | 12,016 | |||||
Sprint Nextel Corp. | |||||||
6.00%, 11/15/22 | 1,500 | 1,474 | |||||
VTR Finance BV | |||||||
6.88%, 01/15/24 (c) | 1,797 | 1,798 | |||||
Other Securities | 20,737 | ||||||
71,728 | |||||||
Consumer Discretionary 7.7% | |||||||
Altice SA | |||||||
7.75%, 05/15/22 (b) (c) | 4,250 | 3,875 | |||||
AV Homes Inc. | |||||||
6.63%, 05/15/22 | 3,500 | 3,504 | |||||
MGM Resorts International | |||||||
6.63%, 12/15/21 | 4,000 | 4,109 | |||||
7.75%, 03/15/22 | 900 | 957 | |||||
5.75%, 06/15/25 | 1,500 | 1,449 | |||||
Scientific Games International Inc. | |||||||
10.00%, 12/01/22 | 3,750 | 3,800 | |||||
Tempur Sealy International Inc. | |||||||
5.63%, 10/15/23 | 4,000 | 3,853 | |||||
Videotron Ltd. | |||||||
5.00%, 07/15/22 | 3,500 | 3,498 | |||||
Other Securities | 21,863 | ||||||
46,908 | |||||||
Consumer Staples 1.1% | |||||||
Other Securities | 6,469 | ||||||
Energy 8.5% | |||||||
Welltec AS | |||||||
9.50%, 12/01/22 (c) | 4,875 | 4,804 | |||||
Other Securities | 46,943 | ||||||
51,747 | |||||||
Financials 12.9% | |||||||
Ally Financial Inc. | |||||||
4.13%, 02/13/22 (b) | 3,500 | 3,387 | |||||
4.63%, 05/19/22 | 1,750 | 1,723 | |||||
Altice Financing SA | |||||||
6.63%, 02/15/23 (c) | 2,250 | 2,165 | |||||
CIT Group Inc. | |||||||
5.00%, 08/15/22 | 5,250 | 5,178 | |||||
Credit Acceptance Corp. | |||||||
6.13%, 02/15/21 | 3,000 | 2,995 | |||||
7.38%, 03/15/23 | 2,044 | 2,092 | |||||
DAE Funding LLC | |||||||
4.50%, 08/01/22 (c) | 2,000 | 1,914 | |||||
5.00%, 08/01/24 (c) | 1,750 | 1,693 | |||||
Dell EMC | |||||||
7.13%, 06/15/24 (c) | 4,000 | 4,071 | |||||
Icahn Enterprises LP | |||||||
5.88%, 02/01/22 | 3,475 | 3,406 | |||||
Shares/Par1 | Value ($) | ||||||
6.25%, 02/01/22 | 2,775 | 2,768 | |||||
Level 3 Financing Inc. | |||||||
5.38%, 08/15/22 | 1,000 | 980 | |||||
5.38%, 01/15/24 | 3,535 | 3,370 | |||||
Navient Corp. | |||||||
5.88%, 03/25/21 | 5,000 | 4,788 | |||||
SLM Corp. | |||||||
5.50%, 01/25/23 | 1,500 | 1,315 | |||||
Springleaf Finance Corp. | |||||||
6.13%, 05/15/22 | 2,125 | 2,060 | |||||
5.63%, 03/15/23 | 4,500 | 4,121 | |||||
Virgin Media Secured Finance Plc | |||||||
5.25%, 01/15/21 | 4,000 | 3,930 | |||||
Other Securities | 26,642 | ||||||
78,598 | |||||||
Health Care 8.9% | |||||||
Community Health Systems Inc. | |||||||
8.00%, 11/15/19 | 3,500 | 3,322 | |||||
5.13%, 08/01/21 (b) | 1,000 | 930 | |||||
6.25%, 03/31/23 (b) | 2,300 | 2,092 | |||||
HCA Inc. | |||||||
6.50%, 02/15/20 | 4,000 | 4,100 | |||||
5.88%, 05/01/23 | 4,500 | 4,564 | |||||
5.38%, 02/01/25 | 2,300 | 2,254 | |||||
RegionalCare Hospital Partners Holdings Inc. | |||||||
8.25%, 05/01/23 (c) | 1,625 | 1,641 | |||||
Tenet Healthcare Corp. | |||||||
4.75%, 06/01/20 | 2,750 | 2,748 | |||||
4.38%, 10/01/21 | 2,250 | 2,179 | |||||
7.50%, 01/01/22 (c) | 1,000 | 1,015 | |||||
8.13%, 04/01/22 | 750 | 751 | |||||
Teva Pharmaceutical Finance Netherlands III BV | |||||||
2.80%, 07/21/23 | 4,000 | 3,483 | |||||
Universal Hospital Services Inc. | |||||||
7.63%, 08/15/20 | 4,500 | 4,475 | |||||
Valeant Pharmaceuticals International Inc. | |||||||
5.50%, 03/01/23 (c) | 4,000 | 3,653 | |||||
7.00%, 03/15/24 (c) | 5,000 | 5,065 | |||||
Other Securities | 11,820 | ||||||
54,092 | |||||||
Industrials 9.1% | |||||||
ADT Corp. | |||||||
3.50%, 07/15/22 | 750 | 694 | |||||
4.13%, 06/15/23 | 3,000 | 2,745 | |||||
Bombardier Inc. | |||||||
8.75%, 12/01/21 (c) | 2,500 | 2,575 | |||||
6.00%, 10/15/22 (b) (c) | 4,500 | 4,220 | |||||
Fortress Transportation & Infrastructure Investors LLC | |||||||
6.75%, 03/15/22 (c) | 1,750 | 1,747 | |||||
6.50%, 10/01/25 (c) | 2,200 | 2,075 | |||||
Gibraltar Industries Inc. | |||||||
6.25%, 02/01/21 (d) | 3,850 | 3,856 | |||||
Herc Rentals Inc. | |||||||
7.50%, 06/01/22 (b) (c) | 2,450 | 2,561 | |||||
Hertz Corp. | |||||||
5.88%, 10/15/20 | 4,375 | 4,250 | |||||
Park Aerospace Holdings Ltd. | |||||||
5.25%, 08/15/22 (c) | 4,000 | 3,883 | |||||
5.50%, 02/15/24 (c) | 500 | 483 | |||||
Prime Security Services Borrower LLC | |||||||
9.25%, 05/15/23 (c) | 2,750 | 2,835 | |||||
United Continental Holdings Inc. | |||||||
4.25%, 10/01/22 | 4,500 | 4,361 | |||||
Other Securities | 19,482 | ||||||
55,767 | |||||||
Information Technology 5.8% | |||||||
Advanced Micro Devices Inc. | |||||||
7.00%, 07/01/24 | 3,250 | 3,366 | |||||
Infor Software Parent LLC | |||||||
7.88%, 05/01/21 (c) (e) | 4,000 | 3,889 | |||||
Ingram Micro Inc. | |||||||
5.00%, 08/10/22 | 1,450 | 1,424 | |||||
5.45%, 12/15/24 (d) | 3,550 | 3,336 | |||||
See accompanying Notes to Financial Statements.
Abbreviations, counterparties and additional footnotes are defined on page 305.
112
JNL Series Trust Sub-Advised Funds
Schedules of Investments (in thousands)
December 31, 2018
Shares/Par1 | Value ($) | ||||||
Open Text Corp. | |||||||
5.63%, 01/15/23 (c) | 1,500 | 1,503 | |||||
5.88%, 06/01/26 (c) | 2,000 | 1,981 | |||||
Sabre GLBL Inc. | |||||||
5.38%, 04/15/23 (c) | 2,000 | 1,996 | |||||
5.25%, 11/15/23 (c) | 1,750 | 1,729 | |||||
Other Securities | 16,088 | ||||||
35,312 | |||||||
Materials 5.3% | |||||||
ARD Finance SA | |||||||
8.50%, 09/15/23 (e) | 2,075 | 1,880 | |||||
Ardagh Packaging Finance Plc | |||||||
4.63%, 05/15/23 (c) | 4,000 | 3,776 | |||||
Freeport-McMoRan Inc. | |||||||
4.00%, 11/14/21 | 2,000 | 1,944 | |||||
3.55%, 03/01/22 | 4,050 | 3,834 | |||||
Reynolds Group Issuer Inc. | |||||||
5.13%, 07/15/23 (c) | 5,250 | 4,995 | |||||
Other Securities | 15,941 | ||||||
32,370 | |||||||
Real Estate 1.6% | |||||||
SBA Communications Corp. | |||||||
4.88%, 07/15/22 | 3,250 | 3,203 | |||||
Other Securities | 6,785 | ||||||
9,988 | |||||||
Utilities 2.1% | |||||||
Talen Energy Supply LLC | |||||||
9.50%, 07/15/22 (c) | 4,225 | 4,253 | |||||
Other Securities | 8,420 | ||||||
12,673 | |||||||
Total Corporate Bonds And Notes (cost $480,378) | 455,652 | ||||||
SENIOR LOAN INTERESTS 19.0% | |||||||
Communication Services 1.0% | |||||||
CenturyLink Inc. | |||||||
Term Loan B, 5.27%, (3M LIBOR + 2.75%), 01/15/25 (f) | 238 | 221 | |||||
SBA Senior Finance II LLC | |||||||
Term Loan B, 4.35%, (3M LIBOR + 2.00%), 03/26/25 (f) | 601 | 575 | |||||
Sprint Communications Inc. | |||||||
1st Lien Term Loan B, 4.88%, (3M LIBOR + 2.50%), 02/01/24 (f) | 220 | 209 | |||||
Virgin Media Bristol LLC | |||||||
Term Loan K, 4.96%, (3M LIBOR + 2.50%), 02/10/26 (f) | 428 | 404 | |||||
Other Securities | 4,799 | ||||||
6,208 | |||||||
Consumer Discretionary 5.0% | |||||||
CSC Holdings LLC | |||||||
Term Loan B, 4.96%, (3M LIBOR + 2.50%), 01/12/26 (f) | 400 | 383 | |||||
Scientific Games International Inc. | |||||||
Term Loan B-5, 5.09%, (3M LIBOR + 2.75%), 08/14/24 (f) | 84 | 78 | |||||
Term Loan B-5, 5.24%, (3M LIBOR + 2.75%), 08/14/24 (f) | 350 | 328 | |||||
Other Securities | 29,425 | ||||||
30,214 | |||||||
Consumer Staples 0.3% | |||||||
Other Securities | 1,891 | ||||||
Energy 0.6% | |||||||
Other Securities | 3,517 | ||||||
Financials 2.8% | |||||||
Altice France SA | |||||||
Term Loan B-13, 6.46%, (3M LIBOR + 4.00%), 07/13/26 (f) | 500 | 471 | |||||
Other Securities | 16,736 | ||||||
17,207 | |||||||
Health Care 2.6% | |||||||
Universal Health Services Inc. | |||||||
Term Loan, 0.00%, (3M LIBOR + 3.00%), 10/10/25 (f) (g) (h) (i) | 100 | 97 | |||||
Shares/Par1 | Value ($) | ||||||
Other Securities | 15,470 | ||||||
15,567 | |||||||
Industrials 1.9% | |||||||
Avolon LLC | |||||||
Term Loan B-3, 4.47%, (3M LIBOR + 2.00%), 01/15/25 (f) | 806 | 773 | |||||
Prime Security Services Borrower LLC | |||||||
1st Lien Term Loan, 5.09%, (3M LIBOR + 2.75%), 05/02/22 (f) | 47 | 44 | |||||
1st Lien Term Loan, 5.09%, (3M LIBOR + 2.75%), 05/02/22 (f) | 386 | 367 | |||||
Other Securities | 10,376 | ||||||
11,560 | |||||||
Information Technology 2.6% | |||||||
Sabre GLBL Inc. | |||||||
Term Loan B, 4.34%, (3M LIBOR + 2.00%), 02/22/24 (f) | 584 | 564 | |||||
Other Securities | 15,155 | ||||||
15,719 | |||||||
Materials 1.8% | |||||||
Other Securities | 10,841 | ||||||
Real Estate 0.3% | |||||||
Other Securities | 1,872 | ||||||
Utilities 0.1% | |||||||
Other Securities | 756 | ||||||
Total Senior Loan Interests (cost $122,030) | 115,352 | ||||||
OTHER EQUITY INTERESTS 0.0% | |||||||
Other Securities | — | ||||||
Total Other Equity Interests (cost $0) | — | ||||||
SHORT TERM INVESTMENTS 9.2% | |||||||
Investment Companies 4.9% | |||||||
JNL Government Money Market Fund - Institutional Class, 2.31% (j) (k) | 29,855 | 29,855 | |||||
Securities Lending Collateral 4.3% | |||||||
JNL Securities Lending Collateral Fund - Institutional Class, 2.46% (j) (k) | 26,065 | 26,065 | |||||
Total Short Term Investments (cost $55,920) | 55,920 | ||||||
Total Investments 103.0% (cost $658,328) | 626,924 | ||||||
Other Assets and Liabilities, Net (3.0)% | (18,013) | ||||||
Total Net Assets 100.0% | 608,911 | ||||||
(a) The Fund had an unfunded commitment at December 31, 2018. See Unfunded Commitments in the Schedules of Investments.
(b) All or portion of the security was on loan.
(c) The Sub-Adviser has deemed this security which is exempt from registration under the Securities Act of 1933, as amended, to be liquid based on procedures approved by the JNL Series Trust's Board of Trustees. Determinations of liquidity are unaudited. As of December 31, 2018, the value and the percentage of net assets of these liquid securities was $170,346 and 28.0%, respectively.
(d) Security is a step-up bond where the coupon may increase or step up at a future date or as the result of an upgrade or downgrade to the credit rating of the issuer. Rate stated was the coupon as of December 31, 2018.
(e) Pay-in-kind security. Stated coupon is the pay-in-kind rate. The interest earned by the security may be paid in cash or additional par.
(f) Security has a variable rate. Interest rates reset periodically. Rate stated was in effect as of December 31, 2018. For securities based on a published reference rate and spread, the reference rate and spread are presented. Certain variable rate securities do not indicate a reference rate and spread because they are determined by the issuer, remarketing agent, or offering documents and are based on current market conditions. The coupon rate for securities with certain features outlined in the offering documents may vary from the stated reference rate and spread. This includes, but is not limited to, securities with deferred rates, contingent distributions, caps, floors, and fixed-rate to float-rate features. In addition, variable rates for government and agency collateralized mortgage obligations (“CMO”) and mortgage-backed securities (“MBS”) are determined by tranches of underlying mortgage-backed security pools’ cash flows into securities and pass-through rates which reflects the rate earned on the asset pool after management and guarantee fees are paid to the securitizing corporation. CMO and MBS variable rates are determined by a formula set forth in the security’s offering documents.
(g) Security fair valued in good faith as a Level 3 security in accordance with the procedures approved by the JNL Series Trust's Board of Trustees. Good faith
See accompanying Notes to Financial Statements.
Abbreviations, counterparties and additional footnotes are defined on page 305.
113
JNL Series Trust Sub-Advised Funds
Schedules of Investments (in thousands)
December 31, 2018
fair valued securities are classified for Financial Accounting Standards Board ("FASB") Accounting Standards Codification ("ASC") Topic 820 "Fair Value Measurement" based on the applicable valuation inputs. See FASB ASC Topic 820 in the Notes to Financial Statements.
(h) This senior loan will settle after December 31, 2018. The reference rate and spread presented will go into effect upon settlement.
(i) The Sub-Adviser has deemed this security to be illiquid based on procedures approved by the JNL Series Trust's Board of Trustees. Determinations of liquidity are unaudited.
(j) Investment in affiliate.
(k) Yield changes daily to reflect current market conditions. Rate was the quoted yield as of December 31, 2018.
Restricted Securities | |||||||||
Initial Acquisition | Cost ($) | Value ($) | Percent of Net Assets (%) | ||||||
CCM Merger Inc., 6.00%, 03/15/22 | 03/09/17 | 400 | 406 | 0.1 | |||||
Cemex Finance LLC, 6.00%, 04/01/24 | 03/20/18 | 774 | 746 | 0.1 | |||||
Clearwater Seafoods Inc., 6.88%, 05/01/25 | 04/24/17 | 897 | 836 | 0.1 | |||||
EMI Music Publishing Group North America Holdings Inc., 7.63%, 06/15/24 | 05/31/17 | 764 | 794 | 0.1 | |||||
PF Chang's China Bistro Inc., 10.25%, 06/30/20 | 08/10/17 | 1,750 | 1,606 | 0.3 | |||||
Salem Media Group Inc., 6.75%, 06/01/24 | 05/12/17 | 1,304 | 1,205 | 0.2 | |||||
Townsquare Media Inc., 6.50%, 04/01/23 | 03/23/17 | 2,939 | 2,716 | 0.4 | |||||
Viking Cruises Ltd., 6.25%, 05/15/25 | 09/14/16 | 949 | 985 | 0.2 | |||||
Williams Scotsman International Inc., 7.88%, 12/15/22 | 11/22/17 | 1,768 | 1,679 | 0.3 | |||||
11,545 | 10,973 | 1.8 | |||||||
Unfunded Commitments
Unfunded Commitment ($) | Appreciation/ (Depreciation) ($) | |||||
AMCP Clean Acquisition Co. LLC – Delayed Draw Term Loan | 66 | (1) | ||||
DentalCorp Perfect Smile ULC – 1st Lien Delayed Draw Term Loan | 38 | (1) | ||||
Pearl Intermediate Parent LLC – Delayed Draw Term Loan | 26 | (1) | ||||
Premise Health Holding Corp. – 1st Lien Delayed Draw Term Loan‡ | 10 | — | ||||
VT TopCo Inc. – Delayed Draw Term Loan | 22 | — | ||||
162 | (3) | |||||
‡ Security fair valued in good faith as a Level 3 security in accordance with the procedures approved by the JNL Series Trust's Board of Trustees. Good faith fair valued securities are classified for Financial Accounting Standards Board ("FASB") Accounting Standards Codification ("ASC") Topic 820 "Fair Value Measurement" based on the applicable valuation inputs. See FASB ASC Topic 820 in the Notes to Financial Statements.
See accompanying Notes to Financial Statements.
Abbreviations, counterparties and additional footnotes are defined on page 305.
114
JNL Series Trust Sub-Advised Funds
Schedules of Investments (in thousands)
December 31, 2018
Shares/Par1 | Value ($) | |||||
JNL/DFA U.S. Core Equity Fund * | ||||||
COMMON STOCKS 99.7% | ||||||
Communication Services 8.3% | ||||||
Alphabet Inc. - Class A (a) | 6 | 6,257 | ||||
Alphabet Inc. - Class C (a) | 6 | 6,567 | ||||
AT&T Inc. | 297 | 8,481 | ||||
Comcast Corp. - Class A | 214 | 7,276 | ||||
Facebook Inc. - Class A (a) | 69 | 9,040 | ||||
Verizon Communications Inc. | 179 | 10,039 | ||||
Walt Disney Co. | 51 | 5,636 | ||||
Other Securities | 31,951 | |||||
85,247 | ||||||
Consumer Discretionary 13.7% | ||||||
Amazon.com Inc. (a) | 16 | 23,878 | ||||
Home Depot Inc. | 52 | 8,857 | ||||
Lowe's Cos. Inc. | 36 | 3,331 | ||||
McDonald's Corp. | 25 | 4,494 | ||||
Nike Inc. - Class B | 48 | 3,569 | ||||
Starbucks Corp. | 61 | 3,941 | ||||
Other Securities | 92,054 | |||||
140,124 | ||||||
Consumer Staples 6.9% | ||||||
Altria Group Inc. | 84 | 4,146 | ||||
Coca-Cola Co. | 151 | 7,131 | ||||
Costco Wholesale Corp. | 18 | 3,763 | ||||
PepsiCo Inc. | 62 | 6,823 | ||||
Procter & Gamble Co. | 76 | 6,949 | ||||
Walmart Inc. | 50 | 4,621 | ||||
Other Securities | 37,697 | |||||
71,130 | ||||||
Energy 4.5% | ||||||
Chevron Corp. | 32 | 3,472 | ||||
Exxon Mobil Corp. | 120 | 8,206 | ||||
Other Securities | 34,628 | |||||
46,306 | ||||||
Financials 13.1% | ||||||
Bank of America Corp. | 142 | 3,510 | ||||
Berkshire Hathaway Inc. - Class B (a) | 28 | 5,801 | ||||
JPMorgan Chase & Co. | 104 | 10,133 | ||||
Wells Fargo & Co. | 114 | 5,267 | ||||
Other Securities | 109,493 | |||||
134,204 | ||||||
Health Care 12.7% | ||||||
AbbVie Inc. | 40 | 3,725 | ||||
Amgen Inc. | 23 | 4,394 | ||||
Cigna Corp. | 16 | 3,061 | ||||
CVS Health Corp. | 51 | 3,314 | ||||
Eli Lilly & Co. | 29 | 3,307 | ||||
Johnson & Johnson | 91 | 11,739 | ||||
Merck & Co. Inc. | 80 | 6,105 | ||||
Pfizer Inc. | 209 | 9,141 | ||||
UnitedHealth Group Inc. | 26 | 6,528 | ||||
Other Securities | 78,515 | |||||
129,829 | ||||||
Industrials 13.4% | ||||||
3M Co. | 26 | 4,898 | ||||
Boeing Co. | 15 | 4,721 | ||||
Honeywell International Inc. | 26 | 3,400 | ||||
Resideo Technologies Inc. (a) | 4 | 88 | ||||
Union Pacific Corp. | 31 | 4,233 | ||||
United Technologies Corp. | 33 | 3,539 | ||||
Other Securities | 116,517 | |||||
137,396 | ||||||
Information Technology 19.7% | ||||||
Accenture Plc - Class A | 27 | 3,763 | ||||
Adobe Inc. (a) | 14 | 3,121 | ||||
Apple Inc. | 199 | 31,349 | ||||
Cisco Systems Inc. | 122 | 5,305 | ||||
Intel Corp. | 217 | 10,173 | ||||
International Business Machines Corp. | 39 | 4,462 | ||||
Mastercard Inc. - Class A | 41 | 7,785 | ||||
Shares/Par1 | Value ($) | |||||
Microsoft Corp. | 255 | 25,863 | ||||
Oracle Corp. | 71 | 3,183 | ||||
Texas Instruments Inc. | 43 | 4,040 | ||||
Visa Inc. - Class A | 66 | 8,744 | ||||
Other Securities | 93,620 | |||||
201,408 | ||||||
Materials 3.9% | ||||||
Other Securities | 39,760 | |||||
Real Estate 0.3% | ||||||
Other Securities | 3,053 | |||||
Utilities 3.2% | ||||||
Other Securities | 32,469 | |||||
Total Common Stocks (cost $839,742) | 1,020,926 | |||||
RIGHTS 0.0% | ||||||
Other Securities | 6 | |||||
Total Rights (cost $1) | 6 | |||||
SHORT TERM INVESTMENTS 1.1% | ||||||
Investment Companies 0.2% | ||||||
JNL Government Money Market Fund - Institutional Class, 2.31% (b) (c) | 2,807 | 2,807 | ||||
Securities Lending Collateral 0.9% | ||||||
JNL Securities Lending Collateral Fund - Institutional Class, 2.46% (b) (c) | 9,087 | 9,087 | ||||
Total Short Term Investments (cost $11,894) | 11,894 | |||||
Total Investments 100.8% (cost $851,637) | 1,032,826 | |||||
Other Assets and Liabilities, Net (0.8)% | (8,504) | |||||
Total Net Assets 100.0% | 1,024,322 | |||||
(a) Non-income producing security.
(b) Investment in affiliate.
(c) Yield changes daily to reflect current market conditions. Rate was the quoted yield as of December 31, 2018.
See accompanying Notes to Financial Statements.
Abbreviations, counterparties and additional footnotes are defined on page 305.
115
JNL Series Trust Sub-Advised Funds
Schedules of Investments (in thousands)
December 31, 2018
Shares/Par1 | Value ($) | ||||||
JNL/DoubleLine Core Fixed Income Fund * (a) | |||||||
NON-U.S. GOVERNMENT AGENCY ASSET-BACKED SECURITIES 23.3% | |||||||
ACE Securities Corp. Home Equity Loan Trust | |||||||
Series 2006-A2D-HE1, REMIC, 2.81%, (1M USD LIBOR + 0.60%), 02/25/36 (b) | 11,788 | 11,417 | |||||
Alpine Securitization | |||||||
Series 2005-A3-32T1, REMIC, 3.51%, (1M USD LIBOR + 1.00%), 08/25/35 (b) | 7,733 | 5,537 | |||||
Series 2005-1A1-59, REMIC, 2.80%, (1M USD LIBOR + 0.33%), 11/20/35 (b) | 6,770 | 6,370 | |||||
Series 2006-A1B-OA12, REMIC, 2.66%, (1M USD LIBOR + 0.19%), 09/20/46 (b) | 3,796 | 3,310 | |||||
Alternative Loan Trust | |||||||
Series 2005-2A1-J12, REMIC, 3.05%, (1M USD LIBOR + 0.54%), 11/25/35 (b) | 3,401 | 2,294 | |||||
Ares XXIX CLO Ltd. | |||||||
Series 2014-A1R-1A, 3.64%, (3M USD LIBOR + 1.19%), 04/17/26 (b) (c) | 5,771 | 5,757 | |||||
Banc of America Funding Trust | |||||||
Series 2005-4A1-A, REMIC, 3.97%, 02/20/35 (b) | 653 | 639 | |||||
Series 2005-A1-D, REMIC, 4.36%, 05/25/35 (b) | 7,833 | 8,009 | |||||
Banc of America Mortgage Securities Inc. | |||||||
Series 2004-5A1-2, REMIC, 6.50%, 10/25/31 | 8 | 8 | |||||
BBCMS Mortgage Trust | |||||||
Series 2018-A-TALL, REMIC, 3.18%, (1M USD LIBOR + 0.72%), 03/16/20 (b) (c) | 2,771 | 2,745 | |||||
BBCMS Trust | |||||||
Series 2015-A-STP, REMIC, 3.32%, 09/14/20 (c) | 8,556 | 8,546 | |||||
Series 2017-C-DELC, REMIC, 3.66%, (1M USD LIBOR + 1.20%), 08/15/19 (b) (c) | 6 | 6 | |||||
Series 2017-D-DELC, REMIC, 4.16%, (1M USD LIBOR + 1.70%), 08/15/19 (b) (c) | 34 | 34 | |||||
Series 2017-E-DELC, REMIC, 4.96%, (1M USD LIBOR + 2.50%), 08/15/19 (b) (c) | 84 | 83 | |||||
Series 2018-A-BXH, REMIC, 3.46%, (1M USD LIBOR + 1.00%), 10/15/20 (b) (c) | 2,136 | 2,126 | |||||
BCAP LLC Trust | |||||||
Series 2011-5A1-RR5, REMIC, 5.25%, 05/26/22 (c) | 929 | 950 | |||||
Series 2011-8A1-RR4, REMIC, 5.25%, 02/26/36 (c) | 864 | 690 | |||||
Series 2011-12A1-RR5, REMIC, 4.93%, 03/26/37 (b) (c) | 225 | 220 | |||||
Series 2010-5A3-RR11, REMIC, 3.92%, 03/27/37 (b) (c) | 7,722 | 6,624 | |||||
Series 2011-9A1-RR5, REMIC, 5.25%, 05/25/37 (c) | 4,626 | 3,712 | |||||
Series 2012-6A6-RR1, REMIC, 2.49%, 12/27/46 (b) (c) | 13,681 | 12,925 | |||||
Bear Stearns Alt-A Trust | |||||||
Series 2005-23A1-4, REMIC, 4.03%, 05/25/35 (b) | 215 | 210 | |||||
Series 2005-26A1-7, REMIC, 4.14%, 09/25/35 (b) | 10,727 | 7,237 | |||||
Series 2005-22A1-7, REMIC, 4.21%, 09/25/35 (b) | 137 | 113 | |||||
Bear Stearns Asset Backed Securities I Trust | |||||||
Series 2007-1A2-HE3, REMIC, 2.71%, (1M USD LIBOR + 0.20%), 04/25/34 (b) | 819 | 1,079 | |||||
Series 2005-M2-AQ1, REMIC, 3.16%, (1M USD LIBOR + 0.98%), 03/25/35 (b) | 6,647 | 6,570 | |||||
Series 2006-1M1-HE1, REMIC, 2.92%, (1M USD LIBOR + 0.41%), 12/25/35 (b) | 786 | 790 | |||||
Series 2006-A2-4, REMIC, 2.77%, (1M USD LIBOR + 0.26%), 10/25/36 (b) | 5,403 | 5,365 | |||||
Series 2007-1A3-HE3, REMIC, 2.76%, (1M USD LIBOR + 0.25%), 01/25/37 (b) | 4,594 | 4,747 | |||||
Bear Stearns Structured Products Inc. Trust | |||||||
Series 2007-1A1-R6, REMIC, 4.43%, 01/26/36 (b) | 454 | 409 | |||||
Series 2007-A2-EMX1, REMIC, 3.81%, (1M USD LIBOR + 1.30%), 03/25/37 (b) (c) | 2,947 | 2,960 | |||||
Series 2007-2A1-R6, REMIC, 2.47%, 12/26/46 (b) | 285 | 265 | |||||
BX Commercial Mortgage Trust | |||||||
Series 2018-D-BIOA, REMIC, 3.78%, (1M USD LIBOR + 1.32%), 03/16/20 (b) (c) | 2,784 | 2,745 | |||||
Shares/Par1 | Value ($) | ||||||
Series 2018-E-BIOA, REMIC, 4.41%, (1M USD LIBOR + 1.95%), 03/16/20 (b) (c) | 6,960 | 6,875 | |||||
Countrywide Alternative Loan Trust | |||||||
Series 2005-1A2-27, REMIC, 3.56%, (12M US Federal Reserve Cumulative Average CMT + 1.40%), 08/25/35 (b) | 461 | 444 | |||||
Series 2006-1A1A-OA17, REMIC, 2.67%, (1M USD LIBOR + 0.20%), 12/20/46 (b) | 6,933 | 5,844 | |||||
Series 2006-A1-OA21, REMIC, 2.66%, (1M USD LIBOR + 0.19%), 03/20/47 (b) | 4,942 | 4,153 | |||||
Series 2007-A1A-OA7, REMIC, 2.69%, (1M USD LIBOR + 0.18%), 05/25/47 (b) | 310 | 294 | |||||
Countrywide Asset-Backed Certificates | |||||||
Series 2006-2A3-24, REMIC, 2.66%, (1M USD LIBOR + 0.15%), 04/25/34 (b) | 1,755 | 1,673 | |||||
Series 2004-M1-3, REMIC, 3.26%, (1M USD LIBOR + 0.75%), 06/25/34 (b) | 83 | 82 | |||||
Series 2005-M3-BC5, REMIC, 3.01%, (1M USD LIBOR + 0.75%), 12/25/35 (b) | 5,000 | 4,960 | |||||
Series 2007-1A-13, REMIC, 3.35%, (1M USD LIBOR + 0.84%), 06/25/36 (b) | 2,220 | 2,055 | |||||
Credit Acceptance Auto Loan Trust | |||||||
Series 2017-A-3A, 2.65%, 01/15/21 (c) | 10,000 | 9,909 | |||||
CWABS Asset-Backed Certificates Trust | |||||||
Series 2005-MV1-17, REMIC, 2.97%, (1M USD LIBOR + 0.46%), 04/25/36 (b) | 5,400 | 5,287 | |||||
Series 2005-2AV-17, REMIC, 2.75%, (1M USD LIBOR + 0.24%), 05/25/36 (b) | 6,133 | 6,040 | |||||
GS Mortgage Securities Corp. II | |||||||
Series 2017-C-GS8, 4.34%, 11/12/27 | 6,463 | 6,229 | |||||
GS Mortgage Securities Trust | |||||||
Series 2018-A-3PCK, 3.91%, (1M USD LIBOR + 1.45%), 09/15/21 (b) (c) | 1,340 | 1,333 | |||||
Series 2016-WMB-GS3, 3.60%, 10/10/49 (c) | 9,000 | 8,537 | |||||
Interest Only, Series 2018-XA-GS9, REMIC, 0.60%, 03/10/28 (b) | 112,622 | 3,799 | |||||
GSR Mortgage Loan Trust | |||||||
Series 2005-2A1-AR6, REMIC, 4.30%, 09/25/35 (b) | 339 | 338 | |||||
Series 2005-6A1-AR7, REMIC, 4.46%, 11/25/35 (b) | 103 | 102 | |||||
Harbour Aircraft Investments Ltd. | |||||||
Series 2017-A-1, 4.00%, 11/15/24 (d) | 13,418 | 13,382 | |||||
Hilton USA Trust | |||||||
Series 2016-A-SFP, REMIC, 2.83%, 11/07/23 (c) | 10,000 | 9,758 | |||||
JPMorgan Chase Commercial Mortgage Securities Corp. | |||||||
Series 2016-E-WIKI, REMIC, 4.01%, 10/07/21 (b) (c) | 5,248 | 5,037 | |||||
JPMorgan Mortgage Acquisition Trust | |||||||
Series 2006-A5-CW1, REMIC, 2.75%, (1M USD LIBOR + 0.24%), 05/25/36 (b) | 4,220 | 4,070 | |||||
Series 2007-MV6-CH1, REMIC, 3.06%, (1M USD LIBOR + 0.55%), 11/25/36 (b) | 2,414 | 2,284 | |||||
Series 2007-MV1-CH2, REMIC, 2.79%, (1M USD LIBOR + 0.28%), 01/25/37 (b) | 4,800 | 4,695 | |||||
Legacy Mortgage Asset Trust | |||||||
Series 2018-A1-GS1, REMIC, 4.00%, 04/25/20 (c) (e) | 47,531 | 47,378 | |||||
Lehman XS Trust | |||||||
Series 2005-1A3-4, REMIC, 3.31%, (1M USD LIBOR + 0.80%), 10/25/35 (b) | 1,224 | 1,191 | |||||
Series 2007-3A3-2N, REMIC, 2.68%, (1M USD LIBOR + 0.17%), 02/25/37 (b) | 7,419 | 6,022 | |||||
Merrill Lynch Mortgage Investors Trust | |||||||
Series 2003-1A-A3, REMIC, 4.27%, 05/25/33 (b) | 231 | 222 | |||||
Series 2005-2A3-A6, REMIC, 2.89%, (1M USD LIBOR + 0.38%), 08/25/35 (b) | 2,278 | 2,251 | |||||
Series 2005-5A-3, REMIC, 2.76%, (1M USD LIBOR + 0.50%), 11/25/35 (b) | 63 | 59 | |||||
Morgan Stanley Bank of America Merrill Lynch Trust | |||||||
Series 2015-ASB-C22, REMIC, 3.04%, 11/18/24 | 9,000 | 8,922 | |||||
Series 2016-ASB-C31, REMIC, 2.95%, 12/17/25 | 3,500 | 3,444 | |||||
Interest Only, Series 2017-XA-C34, REMIC, 0.83%, 11/15/52 (b) | 46,514 | 2,505 | |||||
Mosaic Solar Loans LLC | |||||||
Series 2017-A-2A, 3.82%, 09/20/42 (c) | 8,502 | 8,523 | |||||
Series 2018-A-1A, REMIC, 4.01%, 08/20/30 (c) | 2,189 | 2,216 | |||||
See accompanying Notes to Financial Statements.
Abbreviations, counterparties and additional footnotes are defined on page 305.
116
JNL Series Trust Sub-Advised Funds
Schedules of Investments (in thousands)
December 31, 2018
Shares/Par1 | Value ($) | |||||||||||
Navient Private Education Loan Trust | ||||||||||||
Series 2017-B-A, 3.91%, 09/15/25 (c) | 8,000 | 7,771 | ||||||||||
Navient Student Loan Trust | ||||||||||||
Series 2017-A1-3X, 2.81%, (1M USD LIBOR + 0.30%), 03/25/20 (b) (c) | 3,441 | 3,442 | ||||||||||
PRPM LLC | ||||||||||||
Series 2018-A1-1A, 3.75%, 04/25/23 (c) | 25,200 | 25,134 | ||||||||||
RAMP Trust | ||||||||||||
Series 2005-M5-EFC1, REMIC, 3.48%, (1M USD LIBOR + 0.98%), 05/25/35 (b) | 12,706 | 12,327 | ||||||||||
RASC Trust | ||||||||||||
Series 2005-M1-KS1, REMIC, 3.18%, (1M USD LIBOR + 0.68%), 02/25/35 (b) | 2,309 | 2,269 | ||||||||||
Series 2006-AI3-KS9, REMIC, 2.67%, (1M USD LIBOR + 0.16%), 09/25/36 (b) | 3,266 | 3,050 | ||||||||||
Series 2006-1A3-EMX9, REMIC, 2.68%, (1M USD LIBOR + 0.17%), 09/25/36 (b) | 2,508 | 2,175 | ||||||||||
Series 2006-A4-KS7, REMIC, 2.75%, (1M USD LIBOR + 0.24%), 09/25/36 (b) | 1,932 | 1,872 | ||||||||||
Series 2007-A3-KS1, REMIC, 2.66%, (1M USD LIBOR + 0.15%), 11/25/36 (b) | 6,858 | 6,670 | ||||||||||
Renew Financial LLC | ||||||||||||
Series 2017-A-2A, 3.22%, 09/22/53 (c) | 8,260 | 8,194 | ||||||||||
Residential Accredit Loans Inc. Trust | ||||||||||||
Series 2006-A21-QA1, REMIC, 4.75%, 01/25/36 (b) | 7,191 | 6,184 | ||||||||||
Securitized Asset Backed Receivables LLC Trust | ||||||||||||
Series 2005-M2-FR2, REMIC, 3.48%, (1M USD LIBOR + 0.98%), 03/25/35 (b) | 218 | 216 | ||||||||||
Series 2007-A2A-HE1, REMIC, 2.57%, (1M USD LIBOR + 0.06%), 12/25/36 (b) | 255 | 89 | ||||||||||
Small Business Administration Participation Certificates | ||||||||||||
6.29%, 01/01/21 | 1 | 1 | ||||||||||
5.13% - 5.52%, 09/01/23 - 06/01/24 | 81 | 84 | ||||||||||
Vantage Data Centers LLC | ||||||||||||
Series 2018-A2-1A, 4.07%, 02/15/23 (f) (g) | 6,942 | 6,953 | ||||||||||
Wells Fargo Commercial Mortgage Trust | ||||||||||||
Series 2017-B-C41, 4.19%, 11/15/50 (b) | 5,073 | 5,001 | ||||||||||
Series 2017-C-C41, 4.51%, 11/15/50 (b) | 6,601 | 6,417 | ||||||||||
Series 2018-D-BXI, REMIC, 4.01%, (1M USD LIBOR + 1.56%), 12/16/19 (b) (c) | 3,826 | 3,776 | ||||||||||
Series 2012-C-LC5, REMIC, 4.69%, 09/16/22 (b) | 2,195 | 2,234 | ||||||||||
Interest Only, Series 2015-XA-C28, REMIC, 0.70%, 05/15/48 (b) | 90,834 | 2,989 | ||||||||||
Interest Only, Series 2016-XA-BNK1, REMIC, 1.78%, 08/17/49 (b) | 6,343 | 654 | ||||||||||
Interest Only, Series 2018-XA-C43, REMIC, 0.71%, 03/17/51 (b) | 74,947 | 3,769 | ||||||||||
WhiteHorse VIII Ltd. | ||||||||||||
Series 2014-AR-1A, 3.44%, 05/01/26 (c) | 7,220 | 7,166 | ||||||||||
Other Securities | 373,352 | |||||||||||
Total Non-U.S. Government Agency Asset-Backed Securities (cost $788,003) | 796,194 | |||||||||||
CORPORATE BONDS AND NOTES 24.0% | ||||||||||||
Communication Services 1.7% | ||||||||||||
AT&T Inc. | ||||||||||||
5.25%, 03/01/37 | 6,535 | 6,419 | ||||||||||
Other Securities | 51,387 | |||||||||||
57,806 | ||||||||||||
Consumer Discretionary 1.2% | ||||||||||||
Other Securities | 42,021 | |||||||||||
Consumer Staples 1.1% | ||||||||||||
Other Securities | 36,213 | |||||||||||
Energy 2.8% | ||||||||||||
Kinder Morgan Energy Partners LP | ||||||||||||
6.95%, 01/15/38 | 5,510 | 6,254 | ||||||||||
Sabine Pass Liquefaction LLC | ||||||||||||
5.00%, 03/15/27 | 5,605 | 5,647 | ||||||||||
Other Securities | 83,947 | |||||||||||
95,848 | ||||||||||||
Financials 8.4% | ||||||||||||
American Express Co. | ||||||||||||
2.50%, 08/01/22 | 8,795 | 8,480 | ||||||||||
Shares/Par1 | Value ($) | |||||||||||
Barclays Plc | ||||||||||||
4.01%, (3M USD LIBOR + 1.38%), 05/16/24 (b) | 3,450 | 3,295 | ||||||||||
BBVA Bancomer SA | ||||||||||||
5.13% - 5.35%, 11/12/29 - 01/18/33 | 6,100 | 5,288 | ||||||||||
Continental Senior Trustee Ltd. | ||||||||||||
5.50%, 11/18/20 | 6,060 | 6,249 | ||||||||||
Daimler Finance North America LLC | ||||||||||||
3.42%, (3M USD LIBOR + 0.84%), 05/04/23 (b) (c) | 8,100 | 8,018 | ||||||||||
Fondo Mivivienda SA | ||||||||||||
3.50%, 01/31/23 | 6,350 | 6,108 | ||||||||||
General Motors Financial Co. Inc. | ||||||||||||
3.37%, (3M USD LIBOR + 0.93%), 04/13/20 (b) | 8,000 | 7,945 | ||||||||||
Goldman Sachs Group Inc. | ||||||||||||
3.31%, (3M USD LIBOR + 0.78%), 10/31/22 (b) | 2,540 | 2,474 | ||||||||||
3.79%, (3M USD LIBOR + 1.17%), 05/15/26 (b) | 2,890 | 2,707 | ||||||||||
HSBC Holdings Plc | ||||||||||||
4.16%, (3M USD LIBOR + 1.38%), 09/12/26 (b) | 6,680 | 6,586 | ||||||||||
Liberty Mutual Group Inc. | ||||||||||||
6.50%, 05/01/42 (c) | 5,350 | 6,361 | ||||||||||
SPARC EM Ltd. | ||||||||||||
0.00%, 12/05/22 (h) | 8,542 | 7,770 | ||||||||||
Sumitomo Mitsui Financial Group Inc. | ||||||||||||
3.19%, (3M USD LIBOR + 0.74%), 01/17/23 (b) | 6,690 | 6,616 | ||||||||||
Temasek Financial I Ltd. | ||||||||||||
2.38%, 01/23/23 | 6,000 | 5,811 | ||||||||||
Westpac Banking Corp. | ||||||||||||
3.34%, (3M USD LIBOR + 0.72%), 05/15/23 (b) | 6,915 | 6,851 | ||||||||||
Other Securities | 198,430 | |||||||||||
288,989 | ||||||||||||
Financials 0.1% | ||||||||||||
Banco Bilbao Vizcaya Argentaria SA | ||||||||||||
4.88%, 04/21/25 (i) | 600 | 581 | ||||||||||
Other Securities | 1,105 | |||||||||||
1,686 | ||||||||||||
Health Care 1.5% | ||||||||||||
Becton Dickinson & Co. | ||||||||||||
2.89%, 06/06/22 | 6,775 | 6,562 | ||||||||||
Other Securities | 44,396 | |||||||||||
50,958 | ||||||||||||
Industrials 1.4% | ||||||||||||
Empresa de Transporte de Pasajeros Metro SA | ||||||||||||
4.75%, 02/04/24 (c) | 1,062 | 1,080 | ||||||||||
5.00%, 01/25/47 (c) | 1,845 | 1,823 | ||||||||||
Other Securities | 46,546 | |||||||||||
49,449 | ||||||||||||
Information Technology 0.7% | ||||||||||||
Other Securities | 25,287 | |||||||||||
Materials 1.0% | ||||||||||||
Other Securities | 35,323 | |||||||||||
Real Estate 1.0% | ||||||||||||
Crown Castle International Corp. | ||||||||||||
3.65%, 09/01/27 | 9,595 | 8,937 | ||||||||||
Other Securities | 23,540 | |||||||||||
32,477 | ||||||||||||
Utilities 3.1% | ||||||||||||
NextEra Energy Capital Holdings Inc. | ||||||||||||
3.55%, 05/01/27 | 7,170 | 6,881 | ||||||||||
Other Securities | 99,848 | |||||||||||
106,729 | ||||||||||||
Total Corporate Bonds And Notes (cost $868,715) | 822,786 | |||||||||||
SENIOR LOAN INTERESTS 4.8% | ||||||||||||
Communication Services 0.3% | ||||||||||||
Other Securities | 11,374 | |||||||||||
Consumer Discretionary 0.8% | ||||||||||||
Other Securities | 25,292 | |||||||||||
Consumer Staples 0.1% | ||||||||||||
Other Securities | 4,207 | |||||||||||
Energy 0.3% | ||||||||||||
Other Securities | 10,254 | |||||||||||
See accompanying Notes to Financial Statements.
Abbreviations, counterparties and additional footnotes are defined on page 305.
117
JNL Series Trust Sub-Advised Funds
Schedules of Investments (in thousands)
December 31, 2018
Shares/Par1 | Value ($) | |||||||||||
Financials 0.6% | ||||||||||||
Other Securities | 19,362 | |||||||||||
Health Care 0.6% | ||||||||||||
Other Securities | 20,909 | |||||||||||
Industrials 0.8% | ||||||||||||
Other Securities | 26,599 | |||||||||||
Information Technology 0.9% | ||||||||||||
Other Securities | 30,126 | |||||||||||
Materials 0.4% | ||||||||||||
Other Securities | 12,987 | |||||||||||
Real Estate 0.0% | ||||||||||||
Other Securities | 516 | |||||||||||
Utilities 0.0% | ||||||||||||
Other Securities | 1,061 | |||||||||||
Total Senior Loan Interests (cost $171,925) | 162,687 | |||||||||||
GOVERNMENT AND AGENCY OBLIGATIONS 46.3% | ||||||||||||
Collateralized Mortgage Obligations 7.1% | ||||||||||||
Federal Home Loan Mortgage Corp. | ||||||||||||
Series 300-336, 3.00%, 08/15/44 | 40,951 | 40,322 | ||||||||||
Interest Only, Series FH-S358A, 3.00%, 10/15/47 | 8,490 | 8,311 | ||||||||||
Series JZ-1507, REMIC, 7.00%, 05/15/23 | 29 | 30 | ||||||||||
Series LZ-2764, REMIC, 4.50%, 03/15/34 | 3,150 | 3,299 | ||||||||||
Series T-A1-75, REMIC, 2.36%, (1M USD LIBOR + 0.04%), 12/25/36 (b) | 107 | 107 | ||||||||||
Series ZL-3979, REMIC, 3.50%, 01/15/42 | 4,829 | 4,837 | ||||||||||
Series QD-4076, REMIC, 2.50%, 11/15/41 | 5,652 | 5,438 | ||||||||||
Series AG-4729, REMIC, 3.00%, 01/15/44 | 25,110 | 24,458 | ||||||||||
Series GS-PA-4381, REMIC, 3.00%, 07/15/46 | 28,303 | 28,002 | ||||||||||
Federal National Mortgage Association | ||||||||||||
Series 2006-3A2-5, REMIC, 4.12%, 05/25/35 (b) | 22 | 24 | ||||||||||
Series 2012-KB-150, REMIC, 1.75%, 01/25/43 | 26,559 | 25,226 | ||||||||||
Principal Only, Series 2015-PO-67, REMIC, 0.00%, 09/25/43 (h) | 13,276 | 10,228 | ||||||||||
Series 2014-A-23, REMIC, 3.00%, 05/25/44 | 23,326 | 22,838 | ||||||||||
Series 2016-CZ-72, REMIC, 3.00%, 10/25/46 | 18,028 | 16,325 | ||||||||||
Principal Only, Series 2018-PO-21, REMIC, 0.00%, 04/25/48 (h) | 35,081 | 27,819 | ||||||||||
Series 2018-A-33, REMIC, 3.00%, 05/25/48 | 25,973 | 25,539 | ||||||||||
242,803 | ||||||||||||
Commercial Mortgage-Backed Securities 0.0% | ||||||||||||
Federal Home Loan Mortgage Corp. | ||||||||||||
Interest Only, Series X1-K023, REMIC, 1.26%, 08/25/22 (b) | 28,590 | 1,088 | ||||||||||
Mortgage-Backed Securities 8.7% | ||||||||||||
Federal Home Loan Mortgage Corp. | ||||||||||||
4.43%, (1Y US Treasury Yield Curve Rate Treasury Note Constant Maturity + 2.36%), 07/01/27 (b) | - | — | ||||||||||
3.00%, 08/01/46 | 58,230 | 56,866 | ||||||||||
3.00%, 01/01/47 | 32,924 | 32,142 | ||||||||||
3.00%, 03/01/47 | 42,439 | 41,431 | ||||||||||
3.00%, 06/01/47 | 29,540 | 28,839 | ||||||||||
3.50%, 10/01/47 | 46,671 | 46,665 | ||||||||||
4.00%, 10/01/48 | 22,703 | 23,150 | ||||||||||
Federal National Mortgage Association | ||||||||||||
3.33% - 5.50%, 03/01/19 - 11/01/21 | 3,037 | 3,099 | ||||||||||
3.16%, 05/01/22 | 11,065 | 11,146 | ||||||||||
2.31% - 5.50%, 03/01/22 - 09/01/27 | 26,104 | 26,428 | ||||||||||
3.73%, (12M USD LIBOR + 1.45%), 01/01/35 (b) | 415 | 430 | ||||||||||
4.26%, (1Y US Treasury Yield Curve Rate Treasury Note Constant Maturity + 2.24%), 01/01/36 (b) | 4,718 | 4,970 | ||||||||||
4.00% - 5.00%, 05/01/37 - 01/01/46 | 5,604 | 5,887 | ||||||||||
3.45%, (12M US Federal Reserve Cumulative Average CMT + 1.40%), 09/01/40 (b) | 1 | 1 | ||||||||||
3.25%, (12M US Federal Reserve Cumulative Average CMT + 1.20%), 06/01/43 (b) | 139 | 141 | ||||||||||
Government National Mortgage Association | ||||||||||||
3.38% - 3.62%, (1Y US Treasury Yield Curve Rate Treasury Note Constant Maturity + 1.50%), 05/20/26 - 02/20/27 (b) | 18 | 19 | ||||||||||
Shares/Par1 | Value ($) | |||||||||||
3.38% - 3.62%, (1Y US Treasury Yield Curve Rate Treasury Note Constant Maturity + 1.50%), 04/20/30 - 02/20/32 (b) | 41 | 41 | ||||||||||
3.00% - 5.00%, 02/15/38 - 07/15/45 | 15,556 | 16,147 | ||||||||||
297,402 | ||||||||||||
Municipal 0.1% | ||||||||||||
Other Securities | 3,504 | |||||||||||
Sovereign 5.9% | ||||||||||||
Belgium Government Bond | ||||||||||||
0.80%, 06/22/25, EUR (c) | 1,900 | 2,247 | ||||||||||
1.00%, 06/22/26, EUR (c) | 5,430 | 6,455 | ||||||||||
Chile Government International Bond | ||||||||||||
3.13%, 03/27/25 (i) | 8,000 | 7,787 | ||||||||||
Czech Republic Government Bond | ||||||||||||
0.45%, 10/25/23, CZK | 185,000 | 7,739 | ||||||||||
2.40%, 09/17/25, CZK | 34,300 | 1,574 | ||||||||||
Mexico Bonos | ||||||||||||
6.50%, 06/09/22, MXN | 209,200 | 9,999 | ||||||||||
Mexico Government International Bond | ||||||||||||
3.75% - 4.15%, 10/02/23 - 01/11/28 | 11,685 | 11,350 | ||||||||||
Panama Government International Bond | ||||||||||||
4.00%, 09/22/24 | 8,000 | 8,068 | ||||||||||
Peru Government International Bond | ||||||||||||
6.95%, 08/12/31, PEN (c) | 6,340 | 2,037 | ||||||||||
Philippine Government International Bond | ||||||||||||
4.20%, 01/21/24 | 8,600 | 8,857 | ||||||||||
Poland Government Bond | ||||||||||||
1.50%, 04/25/20, PLN | 22,675 | 6,070 | ||||||||||
3.25%, 07/25/25, PLN | 4,500 | 1,258 | ||||||||||
Other Securities | 130,013 | |||||||||||
203,454 | ||||||||||||
U.S. Treasury Securities 24.5% | ||||||||||||
U.S. Treasury Bond | ||||||||||||
3.13%, 02/15/43 | 26,100 | 26,679 | ||||||||||
2.75% - 2.88%, 11/15/42 - 05/15/43 | 5,300 | 5,103 | ||||||||||
3.63%, 08/15/43 | 26,850 | 29,757 | ||||||||||
3.75%, 11/15/43 | 29,350 | 33,193 | ||||||||||
2.75%, 08/15/47 | 15,000 | 14,252 | ||||||||||
2.75%, 11/15/47 | 21,100 | 20,032 | ||||||||||
3.00%, 08/15/48 (i) | 12,150 | 12,137 | ||||||||||
U.S. Treasury Note | ||||||||||||
1.13% - 1.63%, 01/31/19 - 08/31/20 | 10,030 | 9,921 | ||||||||||
1.38%, 02/15/20 | 33,200 | 32,743 | ||||||||||
2.13%, 08/31/20 | 33,850 | 33,623 | ||||||||||
2.00%, 09/30/20 | 29,400 | 29,138 | ||||||||||
1.75%, 10/31/20 | 33,150 | 32,694 | ||||||||||
1.63%, 11/30/20 | 22,680 | 22,308 | ||||||||||
1.13%, 02/28/21 | 37,750 | 36,665 | ||||||||||
2.00%, 05/31/21 | 36,400 | 36,002 | ||||||||||
2.75%, 08/15/21 | 35,250 | 35,492 | ||||||||||
2.75%, 09/15/21 | 35,650 | 35,901 | ||||||||||
1.50% - 2.50%, 01/31/22 - 02/15/26 | 33,200 | 32,323 | ||||||||||
1.88%, 01/31/22 | 5,710 | 5,608 | ||||||||||
2.63%, 02/28/23 | 30,450 | 30,607 | ||||||||||
2.50%, 03/31/23 | 36,350 | 36,350 | ||||||||||
2.75%, 04/30/23 | 35,650 | 36,018 | ||||||||||
1.88%, 08/31/24 | 37,500 | 36,205 | ||||||||||
2.13%, 09/30/24 | 37,550 | 36,699 | ||||||||||
2.25%, 10/31/24 | 44,140 | 43,416 | ||||||||||
3.00%, 09/30/25 | 24,150 | 24,769 | ||||||||||
2.00%, 12/31/21 - 11/15/26 | 5,600 | 5,412 | ||||||||||
2.25%, 02/15/27 | 30,000 | 29,137 | ||||||||||
2.25%, 08/15/27 | 43,030 | 41,658 | ||||||||||
2.25%, 11/15/27 | 34,900 | 33,722 | ||||||||||
837,564 | ||||||||||||
Total Government And Agency Obligations (cost $1,594,177) | 1,585,815 | |||||||||||
OTHER EQUITY INTERESTS 0.0% | ||||||||||||
General Motors Co. Escrow (d) (j) (k) | 128 | — | ||||||||||
Other Securities | — | |||||||||||
Total Other Equity Interests (cost $0) | — | |||||||||||
See accompanying Notes to Financial Statements.
Abbreviations, counterparties and additional footnotes are defined on page 305.
118
JNL Series Trust Sub-Advised Funds
Schedules of Investments (in thousands)
December 31, 2018
Shares/Par1 | Value ($) | |||||||||||
SHORT TERM INVESTMENTS 1.7% | ||||||||||||
Investment Companies 0.9% | ||||||||||||
JNL Government Money Market Fund - Institutional Class, 2.31% (l) (m) | 28,800 | 28,800 | ||||||||||
Securities Lending Collateral 0.6% | ||||||||||||
JNL Securities Lending Collateral Fund - Institutional Class, 2.46% (l) (m) | 21,191 | 21,191 | ||||||||||
Treasury Securities 0.2% | ||||||||||||
U.S. Treasury Bill | ||||||||||||
2.40%, 03/07/19 (n) | 6,520 | 6,493 | ||||||||||
Total Short Term Investments (cost $56,484) | 56,484 | |||||||||||
Total Investments 100.1% (cost $3,479,304) | 3,423,966 | |||||||||||
Other Assets and Liabilities, Net (0.1)% | (2,371) | |||||||||||
Total Net Assets 100.0% | 3,421,595 | |||||||||||
(a) The Fund had an unfunded commitment at December 31, 2018. See Unfunded Commitments in the Schedules of Investments.
(b) Security has a variable rate. Interest rates reset periodically. Rate stated was in effect as of December 31, 2018. For securities based on a published reference rate and spread, the reference rate and spread are presented. Certain variable rate securities do not indicate a reference rate and spread because they are determined by the issuer, remarketing agent, or offering documents and are based on current market conditions. The coupon rate for securities with certain features outlined in the offering documents may vary from the stated reference rate and spread. This includes, but is not limited to, securities with deferred rates, contingent distributions, caps, floors, and fixed-rate to float-rate features. In addition, variable rates for government and agency collateralized mortgage obligations (“CMO”) and mortgage-backed securities (“MBS”) are determined by tranches of underlying mortgage-backed security pools’ cash flows into securities and pass-through rates which reflects the rate earned on the asset pool after management and guarantee fees are paid to the securitizing corporation. CMO and MBS variable rates are determined by a formula set forth in the security’s offering documents.
(c) The Sub-Adviser has deemed this security which is exempt from registration under the Securities Act of 1933, as amended, to be liquid based on procedures approved by the JNL Series Trust's Board of Trustees. Determinations of liquidity are unaudited. As of December 31, 2018, the value and the percentage of net assets of these liquid securities was $669,655 and 19.6%, respectively.
(d) Security fair valued in good faith as a Level 3 security in accordance with the procedures approved by the JNL Series Trust's Board of Trustees. Good faith fair valued securities are classified for Financial Accounting Standards Board ("FASB") Accounting Standards Codification ("ASC") Topic 820 "Fair Value Measurement" based on the applicable valuation inputs. See FASB ASC Topic 820 in the Notes to Financial Statements.
(e) Security is a step-up bond where the coupon may increase or step up at a future date or as the result of an upgrade or downgrade to the credit rating of the issuer. Rate stated was the coupon as of December 31, 2018.
(f) The Sub-Adviser has deemed this security to be illiquid based on procedures approved by the JNL Series Trust's Board of Trustees. Determinations of liquidity are unaudited.
(g) Security is restricted to resale to institutional investors. See Restricted Securities in the Schedules of Investments.
(h) Security issued with a zero coupon. Income is recognized through the accretion of discount.
(i) All or portion of the security was on loan.
(j) Non-income producing security.
(k) Contingent distributions represent the right to receive additional distributions, if any, during the reorganization of the underlying company.
(l) Investment in affiliate.
(m) Yield changes daily to reflect current market conditions. Rate was the quoted yield as of December 31, 2018.
(n) The coupon rate represents the yield to maturity.
See accompanying Notes to Financial Statements.
Abbreviations, counterparties and additional footnotes are defined on page 305.
119
JNL Series Trust Sub-Advised Funds
Schedules of Investments (in thousands)
December 31, 2018
Summary of Investments by Country^ | Total Long Term Investments | |
Argentina | 0.6 | % |
Australia | 0.9 | |
Belgium | 0.4 | |
Bermuda | 0.1 | |
Brazil | 0.8 | |
Canada | 0.5 | |
Cayman Islands | 2.8 | |
Chile | 1.3 | |
China | 0.4 | |
Colombia | 0.5 | |
Czech Republic | 0.3 | |
Dominican Republic | 0.1 | |
France | 0.5 | |
Germany | 0.5 | |
Guatemala | 0.1 | |
Hong Kong | 0.1 | |
Hungary | 0.1 | |
India | 0.5 | |
Indonesia | 0.1 | |
Ireland | 0.5 | |
Israel | 0.1 | |
Italy | 0.1 | |
Japan | 1.7 | |
Luxembourg | 0.1 | |
Malaysia | 0.4 | |
Mexico | 1.5 | |
Netherlands | 0.4 | |
New Zealand | 0.2 | |
Panama | 0.6 | |
Peru | 0.6 | |
Philippines | 0.5 | |
Poland | 0.2 | |
Portugal | 0.3 | |
Singapore | 0.7 | |
South Africa | 0.2 | |
Spain | 0.4 | |
Switzerland | 0.1 | |
United Arab Emirates | — | |
United Kingdom | 0.9 | |
United States of America | 79.9 | |
100.0 | % | |
^A country table is presented as a percentage of the Fund’s total long term investments because its strategy includes investment in non-U.S. securities as deemed significant by the Fund’s Adviser. | ||
Restricted Securities | |||||||||
Initial Acquisition | Cost ($) | Value ($) | Percent of Net Assets (%) | ||||||
CGGS Commerical Mortgage Trust, Series 2018-D-WSS REMIC, 4.76%, 02/18/20 | 03/12/18 | 4,159 | 4,100 | 0.1 | |||||
Harley Marine Financing LLC, Series 2018-A2-1A, 5.68%, 05/15/22 | 05/11/18 | 1,968 | 1,357 | 0.1 | |||||
Vantage Data Centers LLC, Series 2018-A2-1A, 4.07%, 02/15/23 | 02/12/18 | 6,942 | 6,953 | 0.2 | |||||
13,069 | 12,410 | 0.4 | |||||||
Unfunded Commitments
Unfunded Commitment ($) | Appreciation/ (Depreciation) ($) | |||||
Access CIG LLC – 1st Lien Term Loan | 97 | (4) | ||||
Dental Corp Perfect Smile ULC – 1st Lien Delayed Draw Term Loan | 79 | (3) | ||||
Mavis Tire Express Services Corp. – Delayed Draw Term Loan‡ | 127 | (4) | ||||
303 | (11) | |||||
‡ Security fair valued in good faith as a Level 3 security in accordance with the procedures approved by the JNL Series Trust's Board of Trustees. Good faith fair valued securities are classified for Financial Accounting Standards Board ("FASB") Accounting Standards Codification ("ASC") Topic 820 "Fair Value Measurement" based on the applicable valuation inputs. See FASB ASC Topic 820 in the Notes to Financial Statements.
See accompanying Notes to Financial Statements.
Abbreviations, counterparties and additional footnotes are defined on page 305.
120
JNL Series Trust Sub-Advised Funds
Schedules of Investments (in thousands)
December 31, 2018
Shares/Par1 | Value ($) | ||||||
JNL/DoubleLine Emerging Markets Fixed Income Fund * | |||||||
CORPORATE BONDS AND NOTES 84.5% | |||||||
Argentina 4.0% | |||||||
Pampa Energia SA | |||||||
7.50%, 01/24/27 | 8,750 | 7,315 | |||||
Tecila SA | |||||||
6.95%, 07/21/27 (a) | 3,000 | 2,445 | |||||
YPF SA | |||||||
8.50%, 07/28/25 | 7,196 | 6,404 | |||||
Other Securities | 3,637 | ||||||
19,801 | |||||||
Brazil 10.7% | |||||||
Banco do Brasil SA | |||||||
6.25%, (callable at 100 beginning 04/15/24) (b) | 9,900 | 8,490 | |||||
ESAL GmbH | |||||||
6.25%, 02/05/23 | 6,000 | 5,940 | |||||
Itau Unibanco Holding SA | |||||||
6.13%, (callable at 100 begininng 12/12/22) (b) | 1,900 | 1,787 | |||||
6.50%, (callable at 100 begininng 03/19/23) (a) (b) | 4,000 | 3,768 | |||||
JBS Investments GmbH | |||||||
7.25%, 04/03/24 | 2,800 | 2,828 | |||||
Marb BondCo Plc | |||||||
7.00%, 03/15/24 (a) | 3,600 | 3,416 | |||||
Marfrig Holdings Europe BV | |||||||
8.00%, 06/08/23 (c) | 700 | 701 | |||||
7.00%, 03/15/24 (c) | 800 | 756 | |||||
6.88%, 01/19/25 | 3,700 | 3,440 | |||||
Minerva Luxembourg SA | |||||||
6.50%, 09/20/26 | 5,800 | 5,410 | |||||
5.88%, 01/19/28 | 2,600 | 2,236 | |||||
Petrobras Global Finance BV | |||||||
5.75%, 02/01/29 | 8,000 | 7,414 | |||||
Other Securities | 7,518 | ||||||
53,704 | |||||||
Cayman Islands 2.0% | |||||||
SPARC EM Ltd. | |||||||
0.00%, 12/05/22 (d) | 6,321 | 5,750 | |||||
0.00%, 12/05/22 (c) (d) | 4,954 | 4,507 | |||||
10,257 | |||||||
Chile 8.2% | |||||||
Empresa Electrica Angamos SA | |||||||
4.88%, 05/25/29 | 913 | 876 | |||||
Empresa Electrica Guacolda SA | |||||||
4.56%, 04/30/25 | 2,900 | 2,568 | |||||
Inversiones CMPC SA | |||||||
4.50%, 04/25/22 (a) | 4,500 | 4,512 | |||||
S.A.C.I. Falabella | |||||||
3.75%, 04/30/23 | 5,600 | 5,412 | |||||
Telefonica Chile SA | |||||||
3.88%, 10/12/22 | 3,000 | 2,949 | |||||
VTR Finance BV | |||||||
6.88%, 01/15/24 | 3,990 | 3,992 | |||||
6.88%, 01/15/24 (c) | 898 | 898 | |||||
Other Securities | 19,785 | ||||||
40,992 | |||||||
China 2.5% | |||||||
CNOOC Finance 2015 USA LLC | |||||||
3.50%, 05/05/25 | 6,000 | 5,841 | |||||
CNPC General Capital Ltd. | |||||||
3.40%, 04/16/23 | 1,600 | 1,581 | |||||
Sinopec Group Overseas Development 2017 Ltd. | |||||||
3.63%, 04/12/27 (c) | 5,500 | 5,307 | |||||
12,729 | |||||||
Colombia 7.0% | |||||||
Banco Bilbao Vizcaya Argentaria SA | |||||||
4.88%, 04/21/25 (a) | 1,000 | 969 | |||||
Bancolombia SA | |||||||
4.88%, 10/18/27 (a) | 3,850 | 3,715 | |||||
Shares/Par1 | Value ($) | ||||||
Canacol Energy Ltd. | |||||||
7.25%, 05/03/25 | 7,600 | 7,011 | |||||
7.25%, 05/03/25 (c) | 800 | 737 | |||||
Colombia Telecomunicaciones SA ESP | |||||||
8.50%, (callable at 100 beginning 03/30/20) (b) | 1,300 | 1,339 | |||||
Gran Tierra Energy Inc. | |||||||
6.25%, 02/15/25 | 6,400 | 5,952 | |||||
6.25%, 02/15/25 (c) | 300 | 279 | |||||
Millicom International Cellular SA | |||||||
6.00%, 03/15/25 | 1,995 | 1,970 | |||||
6.63%, 10/15/26 (c) | 600 | 609 | |||||
5.13%, 01/15/28 | 1,160 | 1,041 | |||||
Other Securities | 11,395 | ||||||
35,017 | |||||||
Costa Rica 0.3% | |||||||
Other Securities | 1,632 | ||||||
Dominican Republic 1.5% | |||||||
AES Andres BV | |||||||
7.95%, 05/11/26 | 5,400 | 5,434 | |||||
Other Securities | 2,244 | ||||||
7,678 | |||||||
Guatemala 1.0% | |||||||
Comcel Trust via Comunicaciones Celulares SA | |||||||
6.88%, 02/06/24 | 2,700 | 2,753 | |||||
Energuate Trust | |||||||
5.88%, 05/03/27 | 1,000 | 926 | |||||
Other Securities | 1,515 | ||||||
5,194 | |||||||
Hong Kong 0.9% | |||||||
CK Hutchison International 17 Ltd. | |||||||
3.50%, 04/05/27 | 1,600 | 1,542 | |||||
3.50%, 04/05/27 (c) | 3,000 | 2,902 | |||||
4,444 | |||||||
India 8.9% | |||||||
Bharat Petroleum Corp. Ltd. | |||||||
4.63%, 10/25/22 | 650 | 656 | |||||
Bharti Airtel Ltd. | |||||||
4.38%, 06/10/25 (a) | 8,000 | 7,250 | |||||
Indian Oil Corp. Ltd. | |||||||
5.63%, 08/02/21 | 3,742 | 3,893 | |||||
5.75%, 08/01/23 | 8,300 | 8,731 | |||||
ONGC Videsh Vankorneft Pte Ltd. | |||||||
3.75%, 07/27/26 | 10,000 | 9,287 | |||||
UPL Corp. Ltd. | |||||||
3.25%, 10/13/21 | 6,000 | 5,816 | |||||
Vedanta Resources Plc | |||||||
7.13%, 05/31/23 | 2,000 | 1,796 | |||||
6.13%, 08/09/24 | 4,700 | 3,907 | |||||
Other Securities | 3,291 | ||||||
44,627 | |||||||
Ireland 2.1% | |||||||
C&W Senior Financing DAC | |||||||
7.50%, 10/15/26 (c) | 3,000 | 2,899 | |||||
6.88%, 09/15/27 | 8,500 | 7,788 | |||||
10,687 | |||||||
Israel 0.5% | |||||||
Israel Electric Corp. Ltd. | |||||||
5.00%, 11/12/24 (c) | 800 | 806 | |||||
Other Securities | 1,689 | ||||||
2,495 | |||||||
Jamaica 0.5% | |||||||
Other Securities | 2,358 | ||||||
Malaysia 4.7% | |||||||
Axiata SPV 2 Bhd | |||||||
3.47%, 11/19/20 | 5,000 | 4,982 | |||||
Gohl Capital Ltd. | |||||||
4.25%, 01/24/27 | 10,500 | 9,890 | |||||
Petronas Capital Ltd. | |||||||
3.50%, 03/18/25 | 6,000 | 5,879 | |||||
Other Securities | 2,970 | ||||||
23,721 | |||||||
See accompanying Notes to Financial Statements.
Abbreviations, counterparties and additional footnotes are defined on page 305.
121
JNL Series Trust Sub-Advised Funds
Schedules of Investments (in thousands)
December 31, 2018
Shares/Par1 | Value ($) | ||||||
Mexico 9.3% | |||||||
Banco Mercantil del Norte SA | |||||||
7.63%, (callable at 100 beginning 01/06/28) (b) | 6,400 | 6,195 | |||||
5.75%, 10/04/31 (a) (e) | 2,200 | 1,988 | |||||
Banco Mercantil Del Norte SA | |||||||
6.88%, (callable at 100 begininng 07/06/22) (b) | 1,600 | 1,547 | |||||
BBVA Bancomer SA | |||||||
5.35%, 11/12/29 | 700 | 646 | |||||
5.13%, 01/18/33 | 10,700 | 9,256 | |||||
Cometa Energia SAB de CV | |||||||
6.38%, 04/24/35 | 9,149 | 8,530 | |||||
Unifin Financiera SAB de CV SOFOM ENR | |||||||
8.88%, (callable at 100 begininng 01/29/25) (b) | 6,950 | 5,699 | |||||
7.38%, 02/12/26 | 400 | 341 | |||||
Other Securities | 12,571 | ||||||
46,773 | |||||||
Netherlands 1.6% | |||||||
AES Andres BV | |||||||
7.95%, 05/11/26 (c) | 1,500 | 1,517 | |||||
Bharti Airtel International (Netherlands) BV | |||||||
5.13%, 03/11/23 | 4,800 | 4,716 | |||||
Petrobras Global Finance BV | |||||||
7.25%, 03/17/44 (a) | 1,600 | 1,581 | |||||
7,814 | |||||||
Panama 3.5% | |||||||
Banistmo SA | |||||||
3.65%, 09/19/22 (c) | 1,600 | 1,521 | |||||
ENA Norte Trust | |||||||
4.95%, 04/25/23 | 6,530 | 6,546 | |||||
Global Bank Corp. | |||||||
5.13%, 10/30/19 | 1,800 | 1,801 | |||||
4.50%, 10/20/21 (c) | 200 | 194 | |||||
4.50%, 10/20/21 (a) | 7,500 | 7,261 | |||||
17,323 | |||||||
Peru 4.2% | |||||||
Banco Bilbao Vizcaya Argentaria SA | |||||||
5.00%, 08/26/22 | 1,400 | 1,423 | |||||
Fondo Mivivienda SA | |||||||
3.50%, 01/31/23 | 6,802 | 6,543 | |||||
3.50%, 01/31/23 (c) | 450 | 433 | |||||
Inkia Energy Ltd. | |||||||
5.88%, 11/09/27 | 6,000 | 5,565 | |||||
Transportadora de Gas del Peru SA | |||||||
4.25%, 04/30/28 | 4,900 | 4,730 | |||||
Other Securities | 2,181 | ||||||
20,875 | |||||||
Philippines 1.3% | |||||||
BDO Unibank Inc. | |||||||
2.63%, 10/24/21 | 3,000 | 2,878 | |||||
2.95%, 03/06/23 | 3,200 | 3,041 | |||||
Other Securities | 478 | ||||||
6,397 | |||||||
Singapore 7.7% | |||||||
BPRL International Singapore Pte Ltd. | |||||||
4.38%, 01/18/27 | 8,500 | 8,017 | |||||
DBS Group Holdings Ltd. | |||||||
3.60%, (callable at 100 beginning 09/07/21) (b) | 10,400 | 9,932 | |||||
Temasek Financial I Ltd. | |||||||
2.38%, 01/23/23 | 13,000 | 12,591 | |||||
United Overseas Bank Ltd. | |||||||
3.88%, (callable at 100 beginning 10/19/23) (b) | 7,400 | 6,839 | |||||
3.50%, 09/16/26 (e) | 1,000 | 990 | |||||
38,369 | |||||||
United States of America 2.1% | |||||||
JBS Investments II GmbH | |||||||
7.00%, 01/15/26 (c) | 1,100 | 1,084 | |||||
Reliance Holding USA Inc. | |||||||
5.40%, 02/14/22 | 9,000 | 9,415 | |||||
10,499 | |||||||
Total Corporate Bonds And Notes (cost $442,086) | 423,386 | ||||||
Shares/Par1 | Value ($) | ||||||
GOVERNMENT AND AGENCY OBLIGATIONS 14.1% | |||||||
Argentina 3.0% | |||||||
Argentina Republic Government International Bond | |||||||
6.88%, 01/26/27 | 7,200 | 5,472 | |||||
5.88%, 01/11/28 | 3,000 | 2,139 | |||||
6.63%, 07/06/28 (a) | 2,250 | 1,648 | |||||
Provincia de Buenos Aires | |||||||
7.88%, 06/15/27 | 8,400 | 6,006 | |||||
15,265 | |||||||
Chile 1.4% | |||||||
Chile Government International Bond | |||||||
3.13%, 01/21/26 (a) | 7,500 | 7,226 | |||||
Costa Rica 0.4% | |||||||
Other Securities | 2,027 | ||||||
India 0.3% | |||||||
Export-Import Bank of India | |||||||
4.00%, 01/14/23 | 1,500 | 1,494 | |||||
Indonesia 2.1% | |||||||
Perusahaan Penerbit SBSN Indonesia III | |||||||
4.15%, 03/29/27 | 1,000 | 961 | |||||
4.15%, 03/29/27 (c) | 9,900 | 9,516 | |||||
10,477 | |||||||
Israel 0.8% | |||||||
Israel Government International Bond | |||||||
2.88%, 03/16/26 | 4,000 | 3,844 | |||||
Malaysia 0.8% | |||||||
Malaysia Sovereign Sukuk Bhd | |||||||
3.04%, 04/22/25 (a) | 4,000 | 3,869 | |||||
Mexico 1.4% | |||||||
Mexico Government International Bond | |||||||
4.15%, 03/28/27 | 6,500 | 6,290 | |||||
3.75%, 01/11/28 | 900 | 845 | |||||
7,135 | |||||||
Panama 1.9% | |||||||
Panama Government International Bond | |||||||
4.00%, 09/22/24 | 9,500 | 9,581 | |||||
Philippines 2.0% | |||||||
Philippine Government International Bond | |||||||
4.20%, 01/21/24 | 9,500 | 9,784 | |||||
Total Government And Agency Obligations (cost $77,918) | 70,702 | ||||||
SHORT TERM INVESTMENTS 3.6% | |||||||
Securities Lending Collateral 3.6% | |||||||
JNL Securities Lending Collateral Fund - Institutional Class, 2.46% (f) (g) | 18,177 | 18,177 | |||||
Total Short Term Investments (cost $18,177) | 18,177 | ||||||
Total Investments 102.2% (cost $538,181) | 512,265 | ||||||
Other Assets and Liabilities, Net (2.2)% | (10,998) | ||||||
Total Net Assets 100.0% | 501,267 | ||||||
(a) All or portion of the security was on loan.
(b) Perpetual security. Next contractual call date presented, if applicable.
(c) The Sub-Adviser has deemed this security which is exempt from registration under the Securities Act of 1933, as amended, to be liquid based on procedures approved by the JNL Series Trust's Board of Trustees. Determinations of liquidity are unaudited. As of December 31, 2018, the value and the percentage of net assets of these liquid securities was $40,811 and 8.1%, respectively.
(d) Security issued with a zero coupon. Income is recognized through the accretion of discount.
(e) Security has a variable rate. Interest rates reset periodically. Rate stated was in effect as of December 31, 2018. For securities based on a published reference rate and spread, the reference rate and spread are presented. Certain variable rate securities do not indicate a reference rate and spread because they are determined by the issuer, remarketing agent, or offering documents and are based on current market conditions. The coupon rate for securities with certain features outlined in the offering documents may vary from the stated reference rate and spread. This includes, but is not limited to, securities with deferred rates, contingent distributions, caps, floors, and fixed-rate to float-rate features. In addition, variable rates for government and agency collateralized mortgage obligations (“CMO”) and mortgage-backed securities (“MBS”) are determined by tranches of underlying mortgage-backed security pools’ cash flows into securities and pass-through rates which reflects the rate earned on the asset
See accompanying Notes to Financial Statements.
Abbreviations, counterparties and additional footnotes are defined on page 305.
122
JNL Series Trust Sub-Advised Funds
Schedules of Investments (in thousands)
December 31, 2018
pool after management and guarantee fees are paid to the securitizing corporation. CMO and MBS variable rates are determined by a formula set forth in the security’s offering documents.
(f) Investment in affiliate.
(g) Yield changes daily to reflect current market conditions. Rate was the quoted yield as of December 31, 2018.
See accompanying Notes to Financial Statements.
Abbreviations, counterparties and additional footnotes are defined on page 305.
123
JNL Series Trust Sub-Advised Funds
Schedules of Investments (in thousands)
December 31, 2018
Shares/Par1 | Value ($) | ||||||
JNL/DoubleLine Shiller Enhanced CAPE Fund * (a) | |||||||
NON-U.S. GOVERNMENT AGENCY ASSET-BACKED SECURITIES 52.7% | |||||||
ALM XIX LLC | |||||||
Series 2016-A1-19A, 3.99%, (3M USD LIBOR + 1.55%), 07/15/28 (b) (c) | 5,000 | 5,000 | |||||
Series 2016-A2-19A, 4.64%, (3M USD LIBOR + 2.20%), 07/15/28 (b) (c) | 5,000 | 4,987 | |||||
ArrowMark Colorado Holdings LLC | |||||||
Series 2018-A1-9A, 3.46%, (3M USD LIBOR + 1.12%), 07/15/31 (b) (c) | 6,000 | 5,864 | |||||
Atrium Hotel Portfolio Trust | |||||||
Series 2017-E-ATRM, 5.51%, (1M USD LIBOR + 3.05%), 12/16/19 (b) (c) | 1,692 | 1,638 | |||||
Series 2018-D-ATRM, 4.76%, (1M USD LIBOR + 2.30%), 06/15/21 (b) (c) | 1,232 | 1,197 | |||||
Series 2018-E-ATRM, REMIC, 5.86%, (1M USD LIBOR + 3.40%), 06/15/21 (b) (c) | 2,913 | 2,845 | |||||
Bayview Opportunity Master Fund IIIB Trust | |||||||
Series 2018-A1-RN7, REMIC, 4.26%, 08/28/33 (c) (d) | 7,149 | 7,123 | |||||
Bayview Opportunity Master Fund IVA Trust | |||||||
Series 2018-A1-RN3, REMIC, 3.67%, 03/28/33 (c) (d) | 2,125 | 2,117 | |||||
Bayview Opportunity Master Fund IVB Trust | |||||||
Series 2018-A1-SBR2, 3.84%, 04/28/23 (c) (d) | 6,657 | 6,631 | |||||
BBCMS Trust | |||||||
Series 2017-C-DELC, REMIC, 3.66%, (1M USD LIBOR + 1.20%), 08/15/19 (b) (c) | 331 | 326 | |||||
Series 2017-D-DELC, REMIC, 4.16%, (1M USD LIBOR + 1.70%), 08/15/19 (b) (c) | 377 | 372 | |||||
Series 2017-E-DELC, REMIC, 4.96%, (1M USD LIBOR + 2.50%), 08/15/19 (b) (c) | 759 | 746 | |||||
Series 2017-F-DELC, REMIC, 5.96%, (1M USD LIBOR + 3.50%), 08/15/19 (b) (c) | 756 | 738 | |||||
Series 2018-D-CBM, REMIC, 4.85%, (1M USD LIBOR + 2.39%), 07/15/20 (b) (c) | 2,753 | 2,670 | |||||
Series 2015-D-STP, REMIC, 4.28%, 09/10/20 (b) (c) | 425 | 421 | |||||
Series 2014-E-BXO, REMIC, 6.21%, (1M USD LIBOR + 3.75%), 08/15/27 (b) (c) | 2,669 | 2,669 | |||||
Interest Only, Series 2017-XA-C1, REMIC, 1.51%, 02/15/50 (b) | 22,639 | 2,038 | |||||
Bear Stearns Alt-A Trust | |||||||
Series 2006-31A1-4, REMIC, 4.01%, 07/25/36 (b) | 5,326 | 5,024 | |||||
BX Trust | |||||||
Series 2017-D-IMC, 4.71%, (1M USD LIBOR + 2.25%), 10/15/19 (b) (c) | 914 | 896 | |||||
Series 2017-E-IMC, 5.71%, (1M USD LIBOR + 3.25%), 10/15/19 (b) (c) | 1,475 | 1,456 | |||||
Series 2018-F-MCSF, REMIC, 5.05%, (1M USD LIBOR + 2.65%), 04/15/20 (b) (c) | 2,887 | 2,820 | |||||
Series 2018-E-GW, REMIC, 4.43%, (1M USD LIBOR + 1.97%), 05/15/20 (b) (c) | 968 | 951 | |||||
Series 2018-F-GW, REMIC, 4.88%, (1M USD LIBOR + 2.42%), 05/15/20 (b) (c) | 839 | 823 | |||||
Series 2018-G-GW, REMIC, 5.38%, (1M USD LIBOR + 2.92%), 05/15/20 (b) (c) | 581 | 567 | |||||
CFCRE Commercial Mortgage Trust | |||||||
Interest Only, Series 2016-XA-C3, REMIC, 1.05%, 12/12/25 (b) | 5,018 | 294 | |||||
Series 2016-C-C4, REMIC, 4.87%, 04/10/26 (b) | 2,332 | 2,348 | |||||
Interest Only, Series 2017-XA-C8, 1.66%, 06/15/50 (b) | 16,404 | 1,570 | |||||
Interest Only, Series 2016-XA-C4, REMIC, 1.73%, 05/10/58 (b) | 16,945 | 1,587 | |||||
CFIP CLO Ltd. | |||||||
Series 2014-AR-1A, 3.76%, (3M USD LIBOR + 1.32%), 07/13/29 (b) (c) | 7,500 | 7,443 | |||||
Citigroup Commercial Mortgage Trust | |||||||
Series 2018-E-TBR, 5.26%, (1M USD LIBOR + 2.80%), 12/16/19 (b) (c) | 4,739 | 4,676 | |||||
Series 2018-F-TBR, 6.11%, (1M USD LIBOR + 3.65%), 12/16/19 (b) (c) | 4,510 | 4,427 | |||||
Interest Only, Series 2014-XA-GC19, REMIC, 1.14%, 01/12/24 (b) | 28,162 | 1,346 | |||||
Interest Only, Series 2014-XA-GC21, REMIC, 1.19%, 04/12/24 (b) | 30,790 | 1,463 | |||||
Shares/Par1 | Value ($) | ||||||
Series 2015-C-GC27, REMIC, 4.43%, 01/10/25 (b) | 828 | 812 | |||||
Series 2015-C-GC35, REMIC, 4.65%, 11/10/25 | 311 | 303 | |||||
Interest Only, Series 2016-XA-P5, REMIC, 1.54%, 09/14/26 (b) | 11,278 | 912 | |||||
Interest Only, Series 2015-XA-GC35, REMIC, 1.02%, 11/10/48 (b) | 3,978 | 157 | |||||
Interest Only, Series 2016-XA-GC36, REMIC, 1.30%, 02/10/49 (b) | 4,220 | 291 | |||||
Interest Only, Series 2016-XA-GC37, REMIC, 1.79%, 04/10/49 (b) | 4,360 | 422 | |||||
Interest Only, Series 2016-XA-P3, REMIC, 1.70%, 04/15/49 (b) | 7,644 | 661 | |||||
Interest Only, Series 2017-XA-P7, REMIC, 1.13%, 04/14/50 (b) | 13,696 | 950 | |||||
Citigroup Mortgage Loan Trust Inc. | |||||||
Series 2018-A1-C, 4.13%, 03/25/59 (c) | 9,954 | 9,999 | |||||
Series 2018-A1-A, REMIC, 4.00%, 01/25/68 (c) (d) | 14,828 | 15,178 | |||||
Civic Mortgage LLC | |||||||
Series 2018-A1-1, 3.89%, 06/25/22 (c) (d) | 6,537 | 6,529 | |||||
COLT Funding LLC | |||||||
Series 2018-A1-1, REMIC, 2.93%, 02/25/48 (b) (c) | 5,515 | 5,481 | |||||
COMM Mortgage Trust | |||||||
Series 2018-D-HCLV, 4.63%, 09/15/20 (b) (c) | 197 | 194 | |||||
Series 2012-C-CR4, REMIC, 4.44%, 11/18/22 (b) (c) | 673 | 613 | |||||
Series 2013-D-LC13, REMIC, 5.27%, 09/12/23 (b) (c) | 1,483 | 1,411 | |||||
Interest Only, Series 2015-XA-CR27, REMIC, 1.13%, 09/12/25 (b) | 12,345 | 619 | |||||
Series 2016-C-CR28, REMIC, 4.65%, 12/12/25 (b) | 450 | 441 | |||||
Interest Only, Series 2015-XA-LC21, REMIC, 0.78%, 07/10/48 (b) | 22,802 | 758 | |||||
Interest Only, Series 2015-XA-CR25, REMIC, 0.92%, 08/10/48 (b) | 23,053 | 1,033 | |||||
Interest Only, Series 2015-XA-CR26, REMIC, 0.96%, 10/10/48 (b) | 5,088 | 253 | |||||
Commercial Mortgage Loan Trust | |||||||
Interest Only, Series 2013-XA-CR12, REMIC, 1.18%, 10/10/46 (b) | 35,511 | 1,600 | |||||
Commercial Mortgage Pass-Through Certificates | |||||||
Interest Only, Series 2014-XA-UBS3, REMIC, 1.27%, 05/10/24 (b) | 38,765 | 1,634 | |||||
Series 2015-C-LC23, REMIC, 4.65%, 10/10/25 (b) | 306 | 302 | |||||
Commercial Mortgage Trust | |||||||
Interest Only, Series 2017-XA-CD4, REMIC, 1.32%, 04/12/27 (b) | 18,326 | 1,419 | |||||
Credit Acceptance Auto Loan Trust | |||||||
Series 2017-A-2A, 2.55%, 08/15/20 (c) | 5,000 | 4,958 | |||||
Credit Suisse Commercial Mortgage Trust | |||||||
Series 2007-B-C2, REMIC, 5.72%, 01/15/49 (b) (c) | 3,500 | 3,525 | |||||
Credit Suisse First Boston Mortgage Securities Corp. | |||||||
Series 2005-2A1-11, REMIC, 6.00%, 12/25/35 | 1,077 | 998 | |||||
Credit Suisse Mortgage Trust | |||||||
Series 2017-A-1, 4.50%, 03/25/21 (c) | 2,722 | 2,718 | |||||
Series 2017-E-LSTK, REMIC, 3.44%, 04/07/21 (b) (c) | 1,799 | 1,749 | |||||
CSMC Trust | |||||||
Series 2018-A1-RPL7, REMIC, 4.00%, 09/25/21 (c) | 5,899 | 5,907 | |||||
Series 2018-A1-RPL8, 4.13%, 09/25/21 (c) | 9,745 | 9,741 | |||||
Series 2017-E-CHOP, REMIC, 5.76%, (1M USD LIBOR + 3.30%), 07/15/32 (b) (c) | 2,125 | 2,096 | |||||
CVP CLO Ltd. | |||||||
Series 2017-A-1A, 3.81%, (3M USD LIBOR + 1.34%), 07/20/30 (b) (c) | 7,500 | 7,429 | |||||
Series 2017-A-2A, 3.66%, (3M USD LIBOR + 1.19%), 01/20/31 (b) (c) | 10,000 | 9,824 | |||||
Deephaven Residential Mortgage Trust | |||||||
Series 2017-A1-1A, REMIC, 2.72%, 10/27/25 (b) (c) | 659 | 647 | |||||
Series 2017-A2-3A, REMIC, 2.71%, 10/25/47 (b) (c) | 3,348 | 3,312 | |||||
See accompanying Notes to Financial Statements.
Abbreviations, counterparties and additional footnotes are defined on page 305.
124
JNL Series Trust Sub-Advised Funds
Schedules of Investments (in thousands)
December 31, 2018
Shares/Par1 | Value ($) | ||||||
Series 2017-A3-3A, REMIC, 2.81%, 10/25/47 (b) (c) | 3,348 | 3,299 | |||||
GS Mortgage Securities Corp. II | |||||||
Interest Only, Series 2017-XA-GS8, 0.98%, 11/10/50 (b) | 32,617 | 2,124 | |||||
GS Mortgage Securities Trust | |||||||
Series 2018-G-RIVR, REMIC, 5.06%, (1M LIBOR + 2.6%), 07/15/20 (b) (c) | 2,000 | 1,967 | |||||
Series 2018-F-FBLU, REMIC, 5.71%, 11/15/20 (c) | 3,360 | 3,290 | |||||
Interest Only, Series 2014-XA-GC20, REMIC, 1.06%, 03/12/24 (b) | 7,367 | 290 | |||||
Interest Only, Series 2015-XA-GC34, REMIC, 1.34%, 10/10/25 (b) | 3,414 | 228 | |||||
Series 2018-E-LUAU, REMIC, 5.01%, (1M USD LIBOR + 2.25%), 11/15/32 (b) (c) | 3,342 | 3,330 | |||||
Interest Only, Series 2014-XA-GC24, REMIC, 0.80%, 09/10/47 (b) | 10,247 | 329 | |||||
Series 2014-D-GC26, REMIC, 4.51%, 11/10/47 (b) (c) | 2,349 | 1,975 | |||||
Interest Only, Series 2015-XA-GS1, REMIC, 0.81%, 11/10/48 (b) | 5,614 | 252 | |||||
Interest Only, Series 2017-XA-GS6, 1.19%, 05/10/50 (b) | 23,087 | 1,635 | |||||
Halcyon Loan Advisors Funding Ltd. | |||||||
Series 2015-A1R-3A, 3.34%, (3M USD LIBOR + 0.90%), 10/18/27 (b) (c) | 10,000 | 9,863 | |||||
Jimmy Johns Funding LLC | |||||||
Series 2017-A2II-1A, 4.85%, 07/30/27 (c) | 5,925 | 5,963 | |||||
JPMorgan Chase Commercial Mortgage Securities Corp. | |||||||
Series 2018-C-LAQ, 4.06%, (1M USD LIBOR + 1.60%), 06/15/20 (b) (c) | 4,788 | 4,740 | |||||
Series 2018-D-LAQ, 4.56%, (1M USD LIBOR + 2.10%), 06/15/20 (b) (c) | 1,900 | 1,866 | |||||
Series 2018-E-LAQ, 5.46%, (1M USD LIBOR + 3.00%), 06/15/20 (b) (c) | 608 | 594 | |||||
Series 2016-E-WIKI, REMIC, 4.01%, 10/07/21 (b) (c) | 2,356 | 2,261 | |||||
Series 2018-E-AON, 4.61%, 07/10/23 (b) (c) | 3,103 | 3,131 | |||||
Series 2006-AM-LDP9, REMIC, 5.37%, 05/15/47 | 118 | 118 | |||||
JPMorgan Chase Commercial Mortgage Securities Trust | |||||||
Series 2017-C-MAUI, REMIC, 3.64%, (1M USD LIBOR + 1.25%), 07/15/19 (b) (c) | 576 | 571 | |||||
Series 2017-D-MAUI, REMIC, 4.34%, (1M USD LIBOR + 1.95%), 07/15/19 (b) (c) | 541 | 535 | |||||
Series 2017-E-MAUI, REMIC, 5.34%, (1M USD LIBOR + 2.95%), 07/15/19 (b) (c) | 479 | 473 | |||||
Series 2017-F-MAUI, REMIC, 6.14%, (1M USD LIBOR + 3.75%), 07/15/19 (b) (c) | 674 | 669 | |||||
Series 2011-D-C5, REMIC, 5.41%, 09/17/21 (b) (c) | 2,400 | 2,364 | |||||
Series 2015-D-MAR7, REMIC, 5.23%, 06/07/22 (c) | 1,491 | 1,488 | |||||
Series 2018-EFX-WPT, REMIC, 5.54%, 07/07/23 (c) | 3,141 | 3,212 | |||||
Series 2015-F-JP1, REMIC, 4.74%, 12/15/25 (b) (c) | 498 | 394 | |||||
Series 2004-D-CBX, REMIC, 5.10%, 01/12/37 (b) | 1,581 | 1,598 | |||||
Series 2006-AMS-LDP9, REMIC, 5.34%, 05/15/47 | 1,000 | 993 | |||||
Series 2007-AM-CB18, REMIC, 5.47%, 06/12/47 (b) | 2 | 1 | |||||
Interest Only, Series 2015-XA-JP1, REMIC, 1.12%, 01/15/49 (b) | 4,893 | 218 | |||||
Interest Only, Series 2016-XA-JP4, REMIC, 0.80%, 12/15/49 (b) | 18,731 | 702 | |||||
JPMorgan Mortgage Trust | |||||||
Series 2018-A2-7FRB, 3.07%, (1M USD LIBOR + 0.75%), 11/25/33 (b) (c) | 4,114 | 4,137 | |||||
Kabbage Asset Securitization LLC | |||||||
Series 2017-A-1, 4.57%, 03/15/20 (c) | 5,000 | 5,039 | |||||
Legacy Mortgage Asset Trust | |||||||
Series 2018-A1-GS2, 4.00%, 06/25/20 (c) (d) | 14,463 | 14,467 | |||||
Series 2017-A1-GS1, REMIC, 3.50%, 01/25/57 (c) (d) | 4,255 | 4,223 | |||||
Shares/Par1 | Value ($) | ||||||
Midocean Credit CLO VII | |||||||
Series 2017-A1-7A, 3.76%, (3M USD LIBOR + 1.32%), 07/16/29 (b) (c) | 7,000 | 6,946 | |||||
Milos CLO Ltd. | |||||||
Series 2017-A-1A, 3.72%, (3M USD LIBOR + 1.25%), 10/20/30 (b) (c) | 7,500 | 7,446 | |||||
Morgan Stanley Bank of America Merrill Lynch Trust | |||||||
Interest Only, Series 2014-XA-C15, REMIC, 0.98%, 02/16/24 (b) | 14,008 | 558 | |||||
Series 2014-C-C17, REMIC, 4.46%, 07/17/24 (b) | 1,240 | 1,204 | |||||
Series 2015-D-C20, REMIC, 3.07%, 01/17/25 (c) | 1,000 | 820 | |||||
Series 2015-C-C25, REMIC, 4.53%, 09/15/25 (b) | 420 | 420 | |||||
Series 2015-D-C26, REMIC, 3.06%, 10/15/25 (c) | 312 | 262 | |||||
Series 2015-D-C27, REMIC, 3.24%, 11/15/25 (c) | 297 | 246 | |||||
Series 2015-C-C27, REMIC, 4.53%, 11/15/25 (b) | 207 | 200 | |||||
Interest Only, Series 2016-XA-C28, REMIC, 1.26%, 01/15/26 (b) | 4,547 | 289 | |||||
Series 2016-C-C29, REMIC, 4.75%, 04/17/26 (b) | 2,371 | 2,384 | |||||
Morgan Stanley Capital I Trust | |||||||
Series 2017-E-CLS, 4.41%, (1M USD LIBOR + 1.95%), 11/15/19 (b) (c) | 2,575 | 2,536 | |||||
Series 2017-F-CLS, 5.06%, (1M USD LIBOR + 2.60%), 11/15/19 (b) (c) | 2,556 | 2,512 | |||||
Series 2018-D-SUN, REMIC, 4.11%, (1M USD LIBOR + 1.65%), 07/15/20 (b) (c) | 899 | 890 | |||||
Series 2018-F-SUN, REMIC, 5.01%, (1M USD LIBOR + 2.55%), 07/15/20 (b) (c) | 1,342 | 1,327 | |||||
Series 2018-G-SUN, REMIC, 5.51%, (1M USD LIBOR + 3.05%), 07/15/20 (b) (c) | 899 | 890 | |||||
Series 2014-CPT, REMIC, 3.45%, 07/15/21 (b) (c) | 2,551 | 2,467 | |||||
Series 2014-CPT, REMIC, 3.45%, 07/15/21 (b) (c) | 540 | 531 | |||||
Series 2014-CPT, REMIC, 3.45%, 07/15/21 (b) (c) | 527 | 507 | |||||
Interest Only, Series 2015-XA-UBS8, REMIC, 0.92%, 12/15/48 (b) | 4,793 | 240 | |||||
Series 2007-B-IQ15, REMIC, 6.12%, 06/11/49 (b) (c) | 3,000 | 3,004 | |||||
Interest Only, Series 2017-XA-H1, 1.45%, 06/15/50 (b) | 26,465 | 2,161 | |||||
Motel 6 Trust | |||||||
Series 2017-A-MTL6, 3.38%, (1M USD LIBOR + 0.92%), 08/15/19 (b) (c) | 1,179 | 1,165 | |||||
Series 2017-D-MTL6, REMIC, 4.61%, (1M USD LIBOR + 2.15%), 08/15/19 (b) (c) | 2,263 | 2,236 | |||||
Series 2017-F-MTL6, REMIC, 6.71%, (1M USD LIBOR + 4.25%), 08/15/19 (b) (c) | 2,975 | 2,878 | |||||
MP CLO IV Ltd. | |||||||
Series 2013-ARR-2A, 3.77%, (3M USD LIBOR + 1.28%), 07/25/29 (b) (c) | 7,500 | 7,431 | |||||
MP CLO VIII Ltd. | |||||||
Series 2015-AR-2A, 3.42%, (3M USD LIBOR + 0.91%), 10/28/27 (b) (c) | 3,000 | 2,957 | |||||
Octagon Investment Partners XXIV Ltd. | |||||||
Series 2015-A1R-1A, 3.55%, (3M USD LIBOR + 0.90%), 05/21/27 (b) (c) | 10,000 | 9,951 | |||||
Pretium Mortgage Credit Partners I LLC | |||||||
Series 2018-A1-NLP3, 4.13%, 07/28/21 (c) (d) | 6,240 | 6,190 | |||||
Series 2017-NPL3, 3.25%, 06/29/32 (c) (d) | 6,453 | 6,447 | |||||
SBA Tower Trust | |||||||
Series 2017-C-1, 3.17%, 04/15/22 (c) | 5,000 | 4,944 | |||||
SoFi Consumer Loan Program LLC | |||||||
Series 2017-A1-5, 2.14%, 12/25/19 (c) | 529 | 527 | |||||
Series 2017-A1-6, 2.20%, 02/25/20 (c) | 1,059 | 1,054 | |||||
Series 2016-A-3, 3.05%, 05/25/21 (c) | 615 | 615 | |||||
Series 2017-A2-6, 2.82%, 02/25/22 (c) | 3,500 | 3,482 | |||||
Series 2017-A-3, 2.77%, 03/25/22 (c) | 683 | 677 | |||||
Series 2017-A2-5, 2.78%, 04/25/22 (c) | 1,250 | 1,237 | |||||
Series 2017-A-1, 3.28%, 01/26/26 (c) | 554 | 555 | |||||
Series 2017-A-2, 3.28%, 02/25/26 (c) | 388 | 387 | |||||
SoFi Consumer Loan Program Trust | |||||||
Series 2018-A1-1, 2.55%, 04/25/20 (c) | 1,067 | 1,061 | |||||
Series 2018-A1-2, 2.93%, 06/25/20 (c) | 568 | 567 | |||||
Steele Creek CLO Ltd. | |||||||
Series 2015-AR-1A, 3.91%, (3M USD LIBOR + 1.26%), 05/21/29 (b) (c) | 4,000 | 3,985 | |||||
See accompanying Notes to Financial Statements.
Abbreviations, counterparties and additional footnotes are defined on page 305.
125
JNL Series Trust Sub-Advised Funds
Schedules of Investments (in thousands)
December 31, 2018
Shares/Par1 | Value ($) | ||||||
Series 2014-A-1RA, 3.54%, 04/21/31 (c) | 2,550 | 2,530 | |||||
Series 2016-1A, 3.91%, (3M USD LIBOR + 1.12%), 06/15/31 (b) (c) | 2,500 | 2,467 | |||||
Series 2018-A-2A, 3.47%, (3M USD LIBOR + 1.20%), 08/18/31 (b) (c) | 2,000 | 1,973 | |||||
TAL Advantage VI LLC | |||||||
Series 2017-A-1A, 4.50%, 04/20/27 (c) | 6,674 | 6,808 | |||||
TCI-Cent CLO Ltd. | |||||||
Series 2016-A1-1A, 4.03%, (3M USD LIBOR + 1.52%), 12/21/29 (b) (c) | 3,000 | 3,000 | |||||
Series 2016-A2-1A, 4.71%, (3M USD LIBOR + 2.20%), 12/21/29 (b) (c) | 3,000 | 3,000 | |||||
UBS Commercial Mortgage Trust | |||||||
Series 2018-C-C8, 4.70%, 02/17/28 (b) | 1,858 | 1,822 | |||||
Interest Only, Series 2017-XB-C1, REMIC, 0.90%, 06/17/50 (b) | 25,883 | 1,697 | |||||
Interest Only, Series 2018-XA-C8, 0.89%, 02/17/51 (b) | 27,051 | 1,667 | |||||
Venture VII CDO Ltd. | |||||||
Series 2006-A1A-7A, 2.70%, (3M USD LIBOR + 0.23%), 01/20/22 (b) (c) | 1,967 | 1,966 | |||||
Series 2006-A2-7A, 2.71%, (3M USD LIBOR + 0.24%), 01/20/22 (b) (c) | 1,044 | 1,040 | |||||
Venture XXIX CDO Ltd. | |||||||
Series 2017-A-29A, 3.90%, (3M USD LIBOR + 1.28%), 09/09/30 (b) (c) | 4,000 | 3,959 | |||||
Vivint Solar Financing V LLC | |||||||
Series 2018-A-1A, 4.73%, 10/30/28 (c) | 4,993 | 5,124 | |||||
VOLT LX LLC | |||||||
Series 2017-A1-NPL7, 3.25%, 06/25/20 (c) (d) | 2,311 | 2,310 | |||||
VOLT LXII LLC | |||||||
Series 2017-A1-NPL9, 3.13%, 09/25/47 (c) (d) | 2,905 | 2,903 | |||||
VOLT LXIX LLC | |||||||
Series 2018-A1A-NPL5, 4.21%, 08/25/48 (c) (d) | 3,980 | 3,948 | |||||
VOLT LXXI LLC | |||||||
Series 2018-A1A-NPL7, 3.97%, 09/25/48 (c) (d) | 6,368 | 6,319 | |||||
VOLT LXXII LLC | |||||||
Series 2018-A1A-NPL8, 4.21%, 10/26/48 (c) (d) | 3,778 | 3,756 | |||||
Washington Mutual Asset-Backed Certificates WMABS Trust | |||||||
Series 2006-M1-HE1, REMIC, 2.85%, (1M USD LIBOR + 0.34%), 02/25/36 (b) | 14,984 | 12,898 | |||||
Wells Fargo Commercial Mortgage Trust | |||||||
Series 2018-E-BXI, REMIC, 4.61%, (1M USD LIBOR + 2.16%), 12/16/19 (b) (c) | 2,762 | 2,710 | |||||
Series 2014-D-LC16, REMIC, 3.94%, 06/15/24 (c) | 325 | 262 | |||||
Interest Only, Series 2015-XA-C31, REMIC, 1.07%, 07/15/25 (b) | 4,362 | 242 | |||||
Series 2015-C-C31, REMIC, 4.61%, 11/15/25 (b) | 400 | 390 | |||||
Series 2015-D-NXS4, REMIC, 3.60%, 11/18/25 (b) | 375 | 342 | |||||
Series 2015-C-NXS4, REMIC, 4.60%, 11/18/25 (b) | 310 | 309 | |||||
Series 2015-A4-P2, REMIC, 3.81%, 12/15/25 | 363 | 368 | |||||
Series 2016-C-C32, REMIC, 4.72%, 01/16/26 (b) | 311 | 303 | |||||
Interest Only, Series 2017-XA-C38, 1.08%, 07/15/50 (b) | 26,279 | 1,753 | |||||
Series 2015-C-LC22, REMIC, 4.54%, 09/15/58 (b) | 302 | 296 | |||||
WhiteHorse X Ltd. | |||||||
Series 2015-A1R-10A, 3.38%, (3M USD LIBOR + 0.93%), 04/17/27 (b) (c) | 5,000 | 4,948 | |||||
Other Securities | 270,382 | ||||||
Total Non-U.S. Government Agency Asset-Backed Securities (cost $732,537) | 725,966 | ||||||
CORPORATE BONDS AND NOTES 15.8% | |||||||
Communication Services 1.0% | |||||||
Other Securities | 14,363 | ||||||
Consumer Discretionary 0.2% | |||||||
Other Securities | 2,083 | ||||||
Consumer Staples 1.2% | |||||||
Other Securities | 16,993 | ||||||
Shares/Par1 | Value ($) | ||||||
Energy 1.6% | |||||||
Bharat Petroleum Corp. Ltd. | |||||||
4.63%, 10/25/22 | 2,300 | 2,321 | |||||
Indian Oil Corp. Ltd. | |||||||
5.63%, 08/02/21 | 900 | 936 | |||||
5.75%, 08/01/23 | 1,000 | 1,052 | |||||
ONGC Videsh Ltd. | |||||||
3.25%, 07/15/19 | 1,000 | 999 | |||||
3.75%, 05/07/23 | 200 | 195 | |||||
ONGC Videsh Vankorneft Pte Ltd. | |||||||
2.88%, 01/27/22 | 900 | 868 | |||||
Sinopec Group Overseas Development 2016 Ltd. | |||||||
2.00%, 09/29/21 | 200 | 192 | |||||
Sinopec Group Overseas Development 2017 Ltd. | |||||||
3.00%, 04/12/22 | 600 | 588 | |||||
3.00%, 04/12/22 (c) | 700 | 689 | |||||
Sinopec Group Overseas Development 2018 Ltd. | |||||||
3.75%, 09/12/23 (c) | 600 | 600 | |||||
Other Securities | 13,554 | ||||||
21,994 | |||||||
Financials 8.0% | |||||||
Banco Santander Chile | |||||||
2.50%, 12/15/20 (c) | 200 | 196 | |||||
3.88%, 09/20/22 | 800 | 794 | |||||
Banco Santander Mexico SA Institucion de Banca Multiple Grupo Financiero Santander | |||||||
4.13%, 11/09/22 | 300 | 297 | |||||
Banco Santander SA | |||||||
5.95%, 10/01/28 (c) | 1,000 | 1,005 | |||||
Citigroup Inc. | |||||||
3.76%, (3M USD LIBOR + 1.02%), 06/01/24 (b) | 1,150 | 1,125 | |||||
CNOOC Finance 2012 Ltd. | |||||||
3.88%, 05/02/22 | 800 | 805 | |||||
CNOOC Finance 2013 Ltd. | |||||||
3.00%, 05/09/23 | 1,000 | 969 | |||||
CNPC General Capital Ltd. | |||||||
3.95%, 04/19/22 | 1,900 | 1,920 | |||||
CNPC HK Overseas Capital Ltd. | |||||||
4.50%, 04/28/21 | 300 | 307 | |||||
Credit Suisse Group AG | |||||||
4.02%, (3M USD LIBOR + 1.24%), 06/12/24 (b) (c) | 1,270 | 1,251 | |||||
Goldman Sachs Bank USA | |||||||
3.20%, 06/05/20 | 990 | 988 | |||||
Goldman Sachs Group Inc. | |||||||
2.30%, 12/13/19 | 1,420 | 1,407 | |||||
Morgan Stanley | |||||||
3.40%, (3M USD LIBOR + 0.93%), 07/22/22 (b) | 2,390 | 2,356 | |||||
Santander UK Plc | |||||||
2.50%, 01/05/21 | 2,785 | 2,719 | |||||
Other Securities | 93,848 | ||||||
109,987 | |||||||
Health Care 1.6% | |||||||
Other Securities | 22,087 | ||||||
Industrials 0.6% | |||||||
Other Securities | 7,979 | ||||||
Information Technology 0.2% | |||||||
Other Securities | 2,575 | ||||||
Materials 0.6% | |||||||
Other Securities | 8,289 | ||||||
Utilities 0.8% | |||||||
Other Securities | 10,720 | ||||||
Total Corporate Bonds And Notes (cost $220,723) | 217,070 | ||||||
SENIOR LOAN INTERESTS 9.0% | |||||||
Communication Services 0.7% | |||||||
Other Securities | 9,801 | ||||||
Consumer Discretionary 1.5% | |||||||
Other Securities | 21,365 | ||||||
Consumer Staples 0.3% | |||||||
Other Securities | 3,787 | ||||||
See accompanying Notes to Financial Statements.
Abbreviations, counterparties and additional footnotes are defined on page 305.
126
JNL Series Trust Sub-Advised Funds
Schedules of Investments (in thousands)
December 31, 2018
Shares/Par1 | Value ($) | ||||||
Energy 0.5% | |||||||
Other Securities | 6,446 | ||||||
Financials 1.1% | |||||||
Other Securities | 14,853 | ||||||
Health Care 1.2% | |||||||
Other Securities | 16,182 | ||||||
Industrials 1.3% | |||||||
Other Securities | 17,765 | ||||||
Information Technology 1.7% | |||||||
Other Securities | 23,217 | ||||||
Materials 0.7% | |||||||
Other Securities | 9,209 | ||||||
Real Estate 0.0% | |||||||
Other Securities | 516 | ||||||
Utilities 0.0% | |||||||
Other Securities | 811 | ||||||
Total Senior Loan Interests (cost $131,023) | 123,952 | ||||||
GOVERNMENT AND AGENCY OBLIGATIONS 25.5% | |||||||
Collateralized Mortgage Obligations 7.7% | |||||||
Federal Home Loan Mortgage Corp. | |||||||
Series QA-4060, REMIC, 1.50%, 09/15/26 | 3,201 | 3,098 | |||||
Series AN-4030, REMIC, 1.75%, 04/15/27 | 5,763 | 5,593 | |||||
Series CD-4484, REMIC, 1.75%, 07/15/30 | 5,049 | 4,864 | |||||
Series BA-4642, REMIC, 3.00%, 02/15/41 | 6,704 | 6,678 | |||||
Series A-4734, REMIC, 3.00%, 07/15/42 | 6,403 | 6,367 | |||||
Series FA-4125, REMIC, 2.81%, (1M USD LIBOR + 0.35%), 11/15/42 (b) | 4,694 | 4,676 | |||||
Series LA-4738, REMIC, 3.00%, 11/15/43 | 6,448 | 6,398 | |||||
Series HA-4582, REMIC, 3.00%, 09/15/45 | 3,353 | 3,317 | |||||
Series CF-4750, REMIC, 2.81%, (1M USD LIBOR + 0.35%), 01/15/48 (b) | 8,562 | 8,511 | |||||
Federal National Mortgage Association | |||||||
Series 2012-FK-56, 2.96%, (1M USD LIBOR + 0.45%), 06/25/42 (b) | 5,911 | 5,906 | |||||
Series 2016-PA-72, REMIC, 3.00%, 07/25/46 | 4,987 | 4,935 | |||||
Series 2018-FA-55, REMIC, 2.81%, (1M USD LIBOR + 0.30%), 08/25/48 (b) | 9,314 | 9,270 | |||||
Series 2018-FA-64, REMIC, 2.86%, (1M USD LIBOR + 0.35%), 09/25/48 (b) | 8,595 | 8,532 | |||||
Series 2018-FA-77, REMIC, 2.81%, (1M USD LIBOR + 0.30%), 10/25/48 (b) | 7,697 | 7,661 | |||||
Series 2017-FA-96, REMIC, 2.91%, (1M USD LIBOR + 0.40%), 12/25/57 (b) | 10,080 | 10,089 | |||||
Series 2018-HF-70, 2.86%, (1M USD LIBOR + 0.35%), 10/25/58 (b) | 9,658 | 9,638 | |||||
105,533 | |||||||
Commercial Mortgage-Backed Securities 0.0% | |||||||
Federal Home Loan Mortgage Corp. | |||||||
Interest Only, Series X1-K722, REMIC, 1.31%, 03/25/23 (b) | 12,688 | 558 | |||||
Mortgage-Backed Securities 0.9% | |||||||
Federal Home Loan Mortgage Corp. | |||||||
3.50%, 09/01/32 | 8,154 | 8,265 | |||||
Federal National Mortgage Association | |||||||
2.35%, (12M USD LIBOR + 1.63%), 11/01/42 (b) | 3,746 | 3,818 | |||||
12,083 | |||||||
Sovereign 1.3% | |||||||
Banco del Estado de Chile | |||||||
2.67%, 01/08/21 (c) | 300 | 293 | |||||
3.88%, 02/08/22 | 2,400 | 2,379 | |||||
Chile Government International Bond | |||||||
3.25%, 09/14/21 | 1,000 | 1,002 | |||||
2.25%, 10/30/22 | 2,900 | 2,797 | |||||
Shares/Par1 | Value ($) | ||||||
Export-Import Bank of India | |||||||
2.75%, 04/01/20 | 300 | 296 | |||||
3.13%, 07/20/21 | 2,000 | 1,966 | |||||
Other Securities | 9,484 | ||||||
18,217 | |||||||
Treasury Inflation Indexed Securities 4.6% | |||||||
U.S. Treasury Inflation Indexed Note | |||||||
0.13%, 04/15/19 (e) (f) | 63,783 | 62,856 | |||||
U.S. Treasury Securities 11.0% | |||||||
U.S. Treasury Note | |||||||
2.25%, 03/31/20 | 13,400 | 13,346 | |||||
1.50%, 08/15/20 (e) | 27,300 | 26,848 | |||||
1.63%, 10/15/20 (e) | 20,000 | 19,687 | |||||
2.75%, 08/15/21 (e) | 20,000 | 20,137 | |||||
2.00%, 08/31/21 (e) | 31,750 | 31,358 | |||||
2.13%, 09/30/21 (e) | 31,650 | 31,353 | |||||
1.88%, 01/31/22 | 9,100 | 8,938 | |||||
151,667 | |||||||
Total Government And Agency Obligations (cost $353,322) | 350,914 | ||||||
SHORT TERM INVESTMENTS 5.1% | |||||||
Investment Companies 1.7% | |||||||
JNL Government Money Market Fund - Institutional Class, 2.31% (g) (h) | 23,708 | 23,708 | |||||
Treasury Securities 3.4% | |||||||
U.S. Treasury Bill | |||||||
2.31%, 02/21/19 (e) (i) | 22,450 | 22,376 | |||||
2.41%, 08/15/19 (e) (i) | 25,000 | 24,608 | |||||
46,984 | |||||||
Total Short Term Investments (cost $70,714) | 70,692 | ||||||
Total Investments 108.1% (cost $1,508,319) | 1,488,594 | ||||||
Other Derivative Instruments (8.6)% | (118,565) | ||||||
Other Assets and Liabilities, Net 0.5% | 7,469 | ||||||
Total Net Assets 100.0% | 1,377,498 | ||||||
(a) The Fund had an unfunded commitment at December 31, 2018. See Unfunded Commitments in the Schedules of Investments.
(b) Security has a variable rate. Interest rates reset periodically. Rate stated was in effect as of December 31, 2018. For securities based on a published reference rate and spread, the reference rate and spread are presented. Certain variable rate securities do not indicate a reference rate and spread because they are determined by the issuer, remarketing agent, or offering documents and are based on current market conditions. The coupon rate for securities with certain features outlined in the offering documents may vary from the stated reference rate and spread. This includes, but is not limited to, securities with deferred rates, contingent distributions, caps, floors, and fixed-rate to float-rate features. In addition, variable rates for government and agency collateralized mortgage obligations (“CMO”) and mortgage-backed securities (“MBS”) are determined by tranches of underlying mortgage-backed security pools’ cash flows into securities and pass-through rates which reflects the rate earned on the asset pool after management and guarantee fees are paid to the securitizing corporation. CMO and MBS variable rates are determined by a formula set forth in the security’s offering documents.
(c) The Sub-Adviser has deemed this security which is exempt from registration under the Securities Act of 1933, as amended, to be liquid based on procedures approved by the JNL Series Trust's Board of Trustees. Determinations of liquidity are unaudited. As of December 31, 2018, the value and the percentage of net assets of these liquid securities was $633,844 and 46.0%, respectively.
(d) Security is a step-up bond where the coupon may increase or step up at a future date or as the result of an upgrade or downgrade to the credit rating of the issuer. Rate stated was the coupon as of December 31, 2018.
(e) All or a portion of the security is pledged or segregated as collateral.
(f) Treasury inflation indexed note, par amount is adjusted for inflation.
(g) Investment in affiliate.
(h) Yield changes daily to reflect current market conditions. Rate was the quoted yield as of December 31, 2018.
(i) The coupon rate represents the yield to maturity.
Summary of Investments by Country^ | Total Long Term Investments | |
Argentina | 0.2 | % |
Australia | 0.3 | |
Bahamas | 0.4 |
See accompanying Notes to Financial Statements.
Abbreviations, counterparties and additional footnotes are defined on page 305.
127
JNL Series Trust Sub-Advised Funds
Schedules of Investments (in thousands)
December 31, 2018
Summary of Investments by Country^ | Total Long Term Investments | |
Bermuda | 0.1 | |
Brazil | 0.5 | |
Canada | 0.3 | |
Cayman Islands | 11.6 | |
Chile | 1.2 | |
China | 0.4 | |
Colombia | 0.3 | |
Costa Rica | — | |
Dominican Republic | 0.1 | |
France | 0.1 | |
Germany | 0.2 | |
Guatemala | 0.1 | |
Hong Kong | 0.2 | |
India | 0.7 | |
Indonesia | 0.2 | |
Ireland | 0.2 | |
Israel | 0.2 | |
Jamaica | — | |
Japan | 0.5 | |
Luxembourg | 0.1 | |
Malaysia | 0.3 | |
Mexico | 1.1 | |
Netherlands | 0.2 | |
Panama | 0.6 | |
Peru | 0.6 | |
Philippines | 0.2 | |
Singapore | 0.6 | |
Switzerland | 0.3 | |
United Kingdom | 1.1 | |
United States of America | 77.1 | |
100.0 | % | |
^A country table is presented as a percentage of the Fund’s total long term investments because its strategy includes investment in non-U.S. securities as deemed significant by the Fund’s Adviser. | ||
Restricted Securities | ||||||||||||||||
Initial Acquisition | Cost ($) | Value ($) | Percent of Net Assets (%) | |||||||||||||
CGGS Commerical Mortgage Trust, Series 2018-D-WSS REMIC, 4.76%, 02/18/20 | 03/12/18 | 2,837 | 2,797 | 0.2 | ||||||||||||
Unfunded Commitments
Unfunded Commitment ($) | Appreciation/ (Depreciation) ($) | |||||
Access CIG LLC – 1 | ||||||