|
Exhibit 99.2 
|
Exhibit 99.2
1st Quarter Fiscal 2012 Financial Results Conference Call
February 9, 2012
© Copyright 2012 by Brooks Automation, Inc. – Proprietary Information
1
Safe Harbor Statement
“Safe Harbor” Statement under the U.S. Private Securities Litigation Reform Act of 1995; certain matters in this presentation, including forecasts of future demand and future Company performance, are forward-looking statements that are subject to risks and uncertainties that could cause actual results to materially differ, either better or worse, from those projected. Further discussions of risk factors are available in the Company’s most recent SEC filings including form 10-K for the fiscal year ended 9/30/11. The Company assumes no obligation to update the information in this presentation.
Regulation G
This presentation contains certain non-GAAP measures which are provided to assist in an understanding of the Brooks business and it’s operational performance. These measures should always be considered in conjunction with the appropriate GAAP measure. Reconciliations of all non-GAAP amounts to the relevant GAAP amount are provided in either an attachment to our first quarter financial results press release issued on February 9, 2012 or as an attachment to call slides used to accompany prepared comments made during our financial results conference call of the same date. Both documents are available on our web site at www.brooks.com.
© Copyright 2012 by Brooks Automation, Inc. – Proprietary Information 2
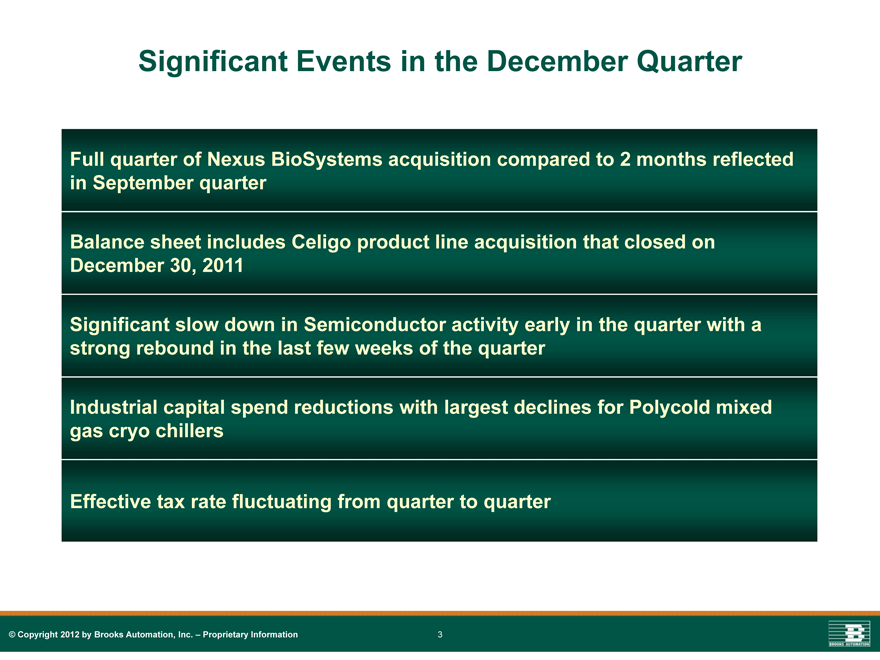
Significant Events in the December Quarter
Full quarter of Nexus BioSystems acquisition compared to 2 months reflected in September quarter
Balance sheet includes Celigo product line acquisition that closed on December 30, 2011
Significant slow down in Semiconductor activity early in the quarter with a strong rebound in the last few weeks of the quarter
Industrial capital spend reductions with largest declines for Polycold mixed gas cryo chillers
Effective tax rate fluctuating from quarter to quarter
© Copyright 2012 by Brooks Automation, Inc. – Proprietary Information 3
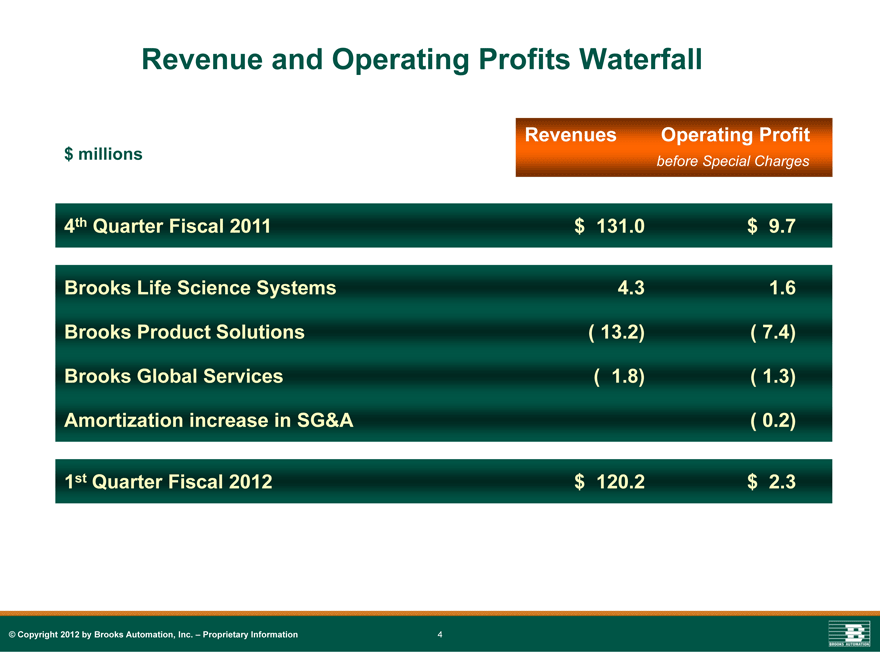
Revenue and Operating Profits Waterfall
Revenues Operating Profit
$ millions before Special Charges
4th Quarter Fiscal 2011 $ 131.0 $ 9.7
Brooks Life Science Systems 4.3 1.6
Brooks Product Solutions ( 13.2) ( 7.4)
Brooks Global Services ( 1.8) ( 1.3)
Amortization increase in SG&A ( 0.2)
1st Quarter Fiscal 2012 $ 120.2 $ 2.3
© Copyright 2012 by Brooks Automation, Inc. – Proprietary Information 4
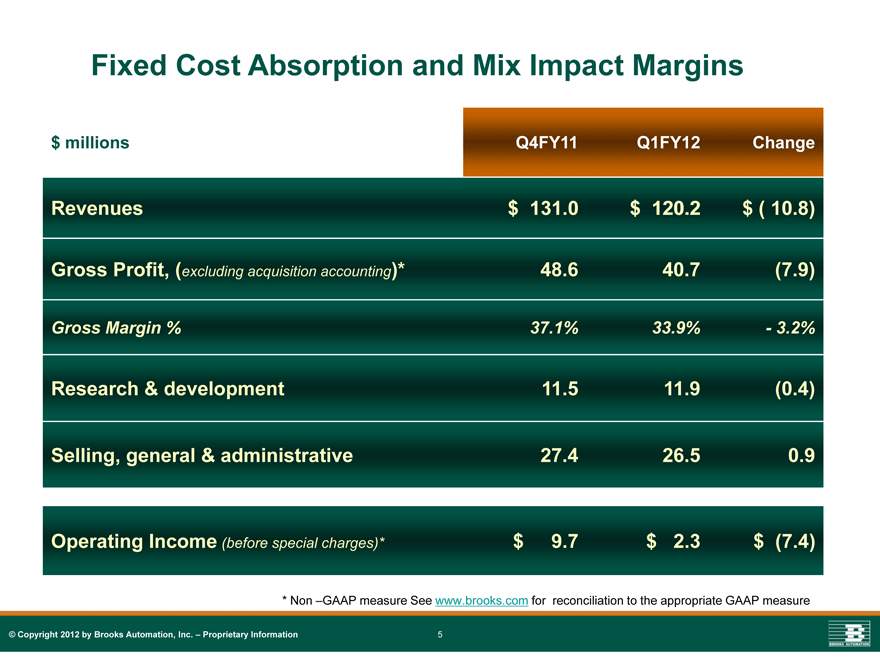
Fixed Cost Absorption and Mix Impact Margins
$ millions Q4FY11 Q1FY12 Change
Revenues $ 131.0 $ 120.2 $ ( 10.8)
Gross Profit, (excluding acquisition accounting)* 48.6 40.7 (7.9)
Gross Margin % 37.1% 33.9%—3.2%
Research & development 11.5 11.9 (0.4)
Selling, general & administrative 27.4 26.5 0.9
Operating Income (before special charges)* $ 9.7 $ 2.3 $ (7.4)
* Non –GAAP measure See www.brooks.com for reconciliation to the appropriate GAAP measure
© Copyright 2012 by Brooks Automation, Inc. – Proprietary Information 5
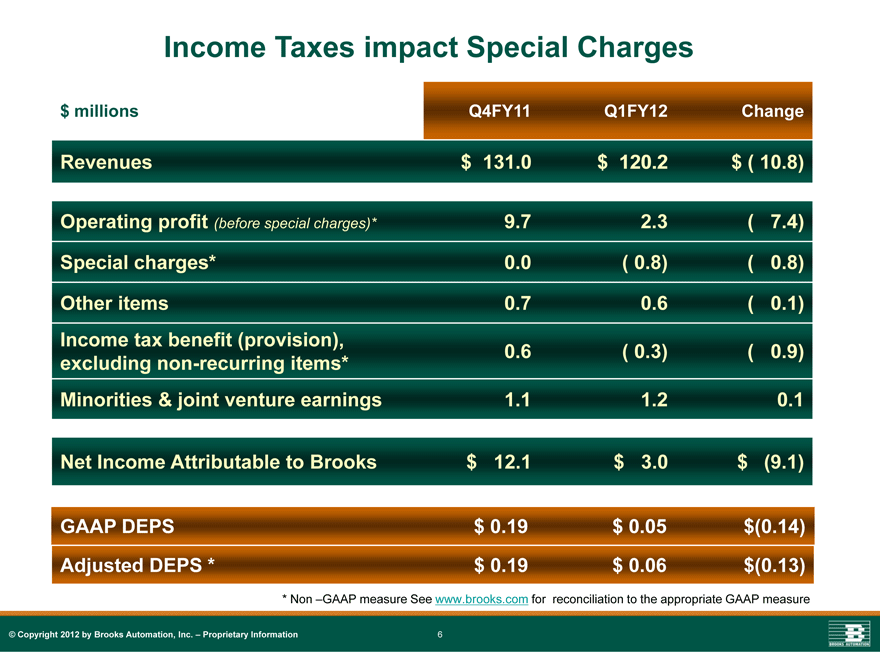
Income Taxes impact Special Charges
$ millions Q4FY11 Q1FY12 Change
Revenues $ 131.0 $ 120.2 $ ( 10.8)
Operating profit (before special charges)* 9.7 2.3 ( 7.4)
Special charges* 0.0 ( 0.8) ( 0.8)
Other items 0.7 0.6 ( 0.1)
Income tax benefit (provision), 0.6 ( 0.3) ( 0.9)
excluding non-recurring items*
Minorities & joint venture earnings 1.1 1.2 0.1
Net Income Attributable to Brooks $ 12.1 $ 3.0 $ (9.1)
GAAP DEPS $ 0.19 $ 0.05 $(0.14)
Adjusted DEPS * $ 0.19 $ 0.06 $(0.13)
* Non –GAAP measure See www.brooks.com for reconciliation to the appropriate GAAP measure
© Copyright 2012 by Brooks Automation, Inc. – Proprietary Information 6
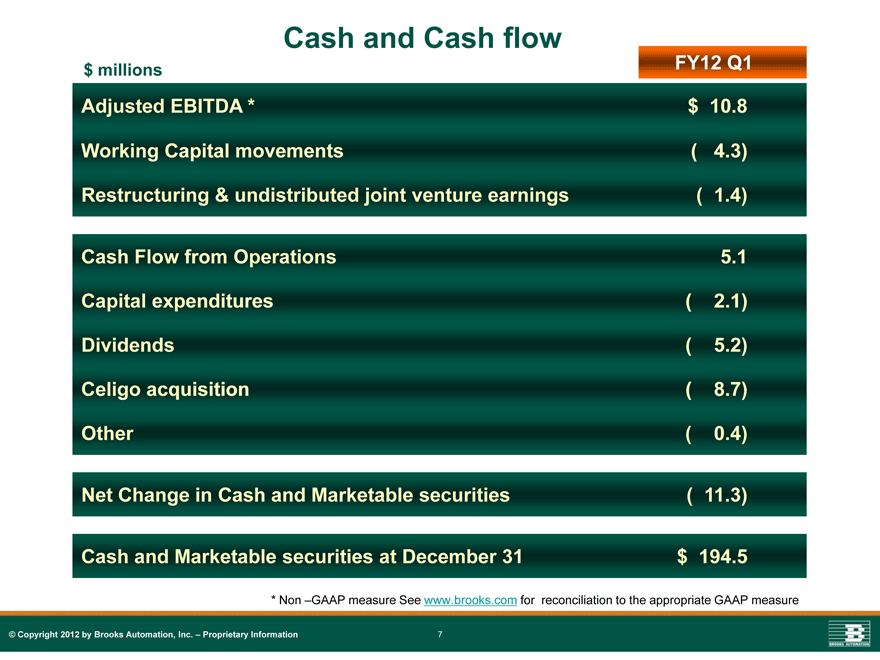
Cash and Cash flow
$ millions FY12 Q1
Adjusted EBITDA * $ 10.8
Working Capital movements (4.3)
Restructuring & undistributed joint venture earnings ( 1.4)
Cash Flow from Operations 5.1 Capital expenditures ( 2.1) Dividends ( 5.2) Celigo acquisition ( 8.7) Other ( 0.4)
Net Change in Cash and Marketable securities ( 11.3)
Cash and Marketable securities at December 31 $ 194.5
* Non –GAAP measure See www.brooks.com for reconciliation to the appropriate GAAP measure
© Copyright 2012 by Brooks Automation, Inc. – Proprietary Information 7
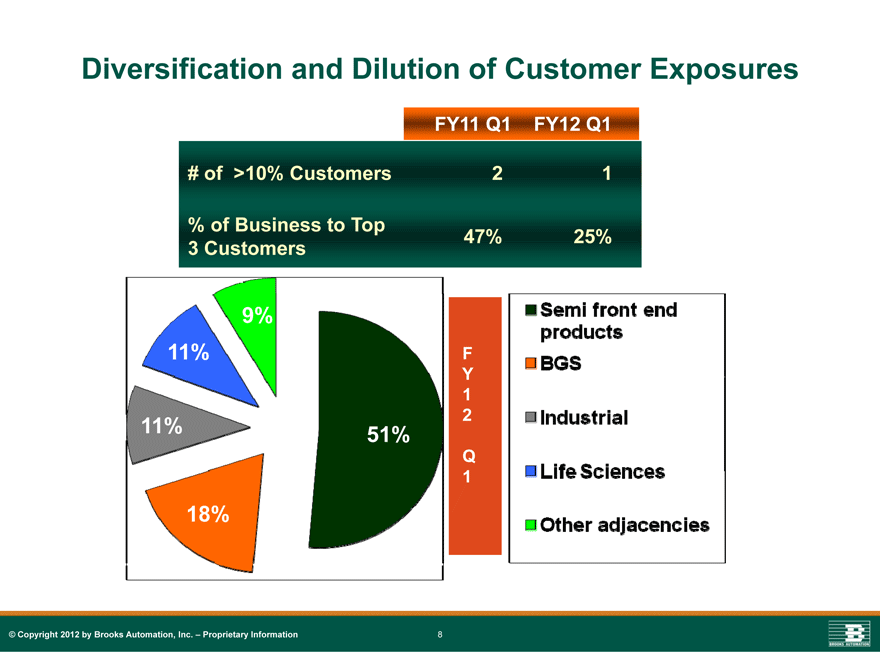
Diversification and Dilution of Customer Exposures
FY11 Q1 FY12 Q1
# of >10% Customers 2 1
% of Business to Top
47% 25%
3 Customers
9% 11%
11% 51%
18%
FY12Q1
Semi front end products
BGS
Industrial
Life Sciences
Other adjacencies
© Copyright 2012 by Brooks Automation, Inc. – Proprietary Information 8
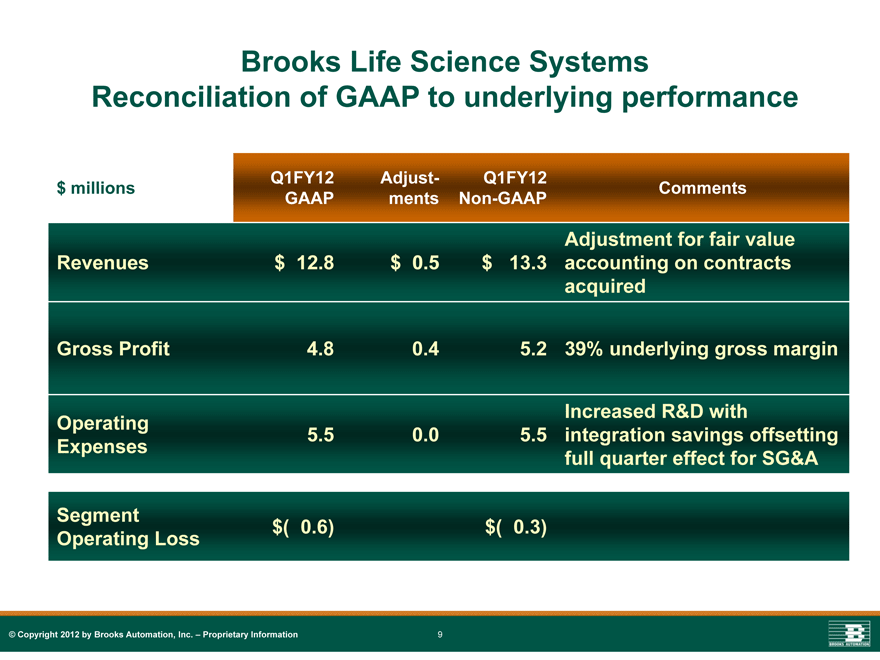
Brooks Life Science Systems
Reconciliation of GAAP to underlying performance
Q1FY12 Adjust- Q1FY12
$ millions Comments
GAAP ments Non-GAAP
Adjustment for fair value
Revenues $ 12.8 $ 0.5 $ 13.3 accounting on contracts
acquired
Gross Profit 4.8 0.4 5.2 39% underlying gross margin
Increased R&D with
Operating 5.5 0.0 5.5 integration savings offsetting
Expenses full quarter effect for SG&A
Segment $( 0.6) $( 0.3)
Operating Loss
© Copyright 2012 by Brooks Automation, Inc. – Proprietary Information 9
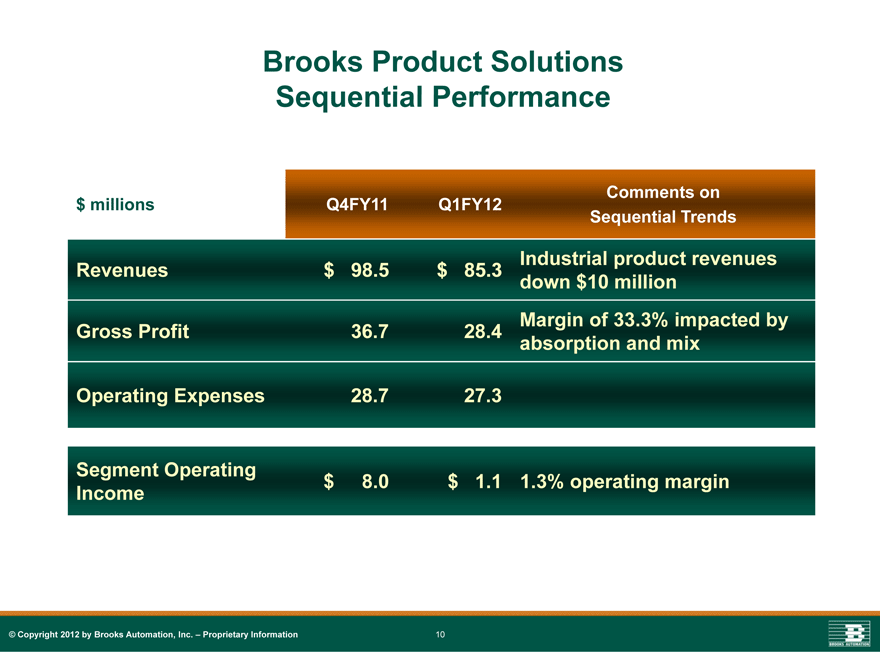
Brooks Product Solutions Sequential Performance
Comments on
$ millions Q4FY11 Q1FY12
Sequential Trends
Industrial product revenues
Revenues $ 98.5 $ 85.3 down $10 million
Margin of 33.3% impacted by
Gross Profit 36.7 28.4 absorption and mix
Operating Expenses 28.7 27.3
Segment Operating
Income $ 8.0 $ 1.1 1.3% operating margin
© Copyright 2012 by Brooks Automation, Inc. – Proprietary Information 10
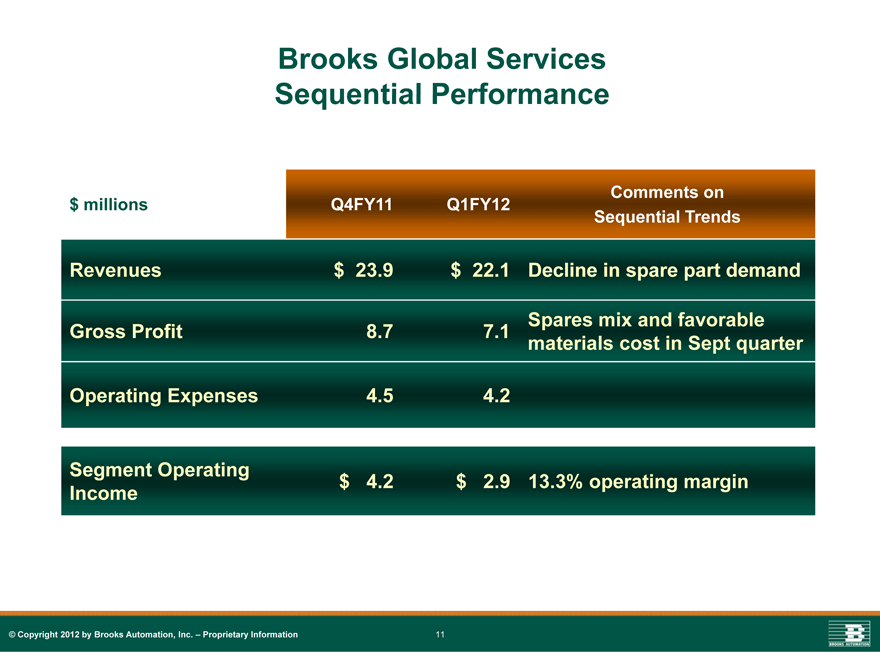
Brooks Global Services Sequential Performance
Comments on $ millions Q4FY11 Q1FY12 Sequential Trends
Revenues $ 23.9 $ 22.1 Decline in spare part demand
Spares mix and favorable Gross Profit 8.7 7.1 materials cost in Sept quarter
Operating Expenses 4.5 4.2
Segment Operating $ 4.2 $ 2.9 13.3% operating margin Income
© Copyright 2012 by Brooks Automation, Inc. – Proprietary Information 11
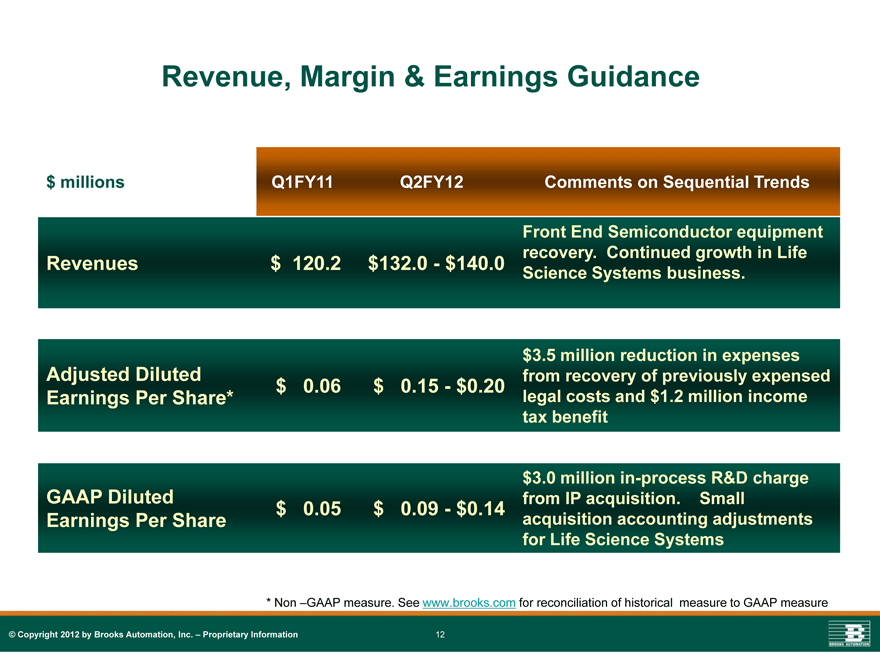
Revenue, Margin & Earnings Guidance
$ millions Q1FY11 Q2FY12 Comments on Sequential Trends
Front End Semiconductor equipment
recovery. Continued growth in Life
Revenues $ 120.2 $132.0—$140.0 Science Systems business.
$3.5 million reduction in expenses
Adjusted Diluted from recovery of previously expensed
$ 0.06 $ 0.15—$0.20
Earnings Per Share* legal costs and $1.2 million income
tax benefit
$3.0 million in-process R&D charge
GAAP Diluted from IP acquisition. Small
$ 0.05 $ 0.09—$0.14
Earnings Per Share acquisition accounting adjustments
for Life Science Systems
* Non –GAAP measure. See www.brooks.com for reconciliation of historical measure to GAAP measure
© Copyright 2012 by Brooks Automation, Inc. – Proprietary Information 12
1st Quarter Fiscal 2012 Financial Results Conference Call
February 9, 2012
© Copyright 2012 by Brooks Automation, Inc. – Proprietary Information 13
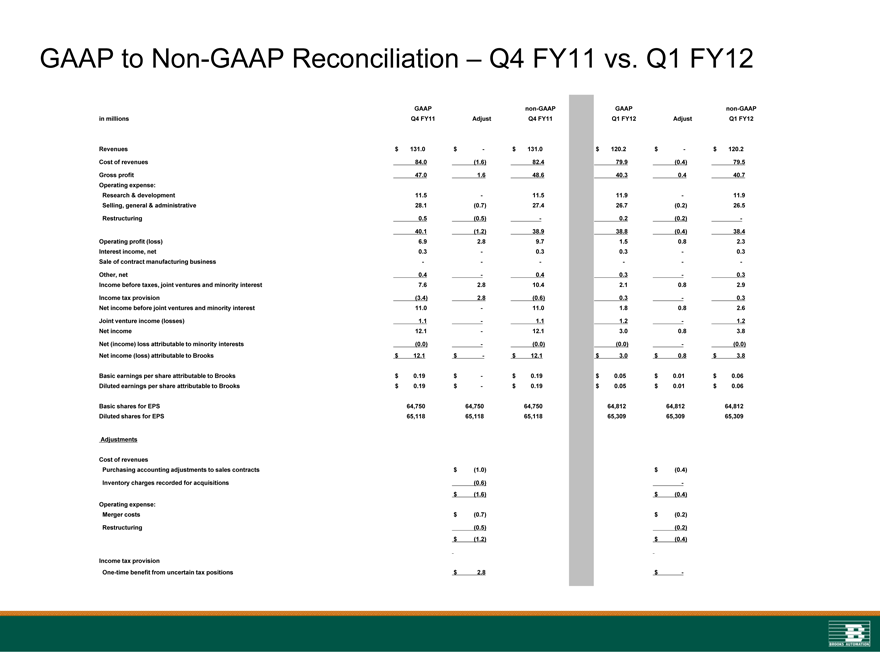
GAAP to Non-GAAP Reconciliation – Q4 FY11 vs. Q1 FY12
GAAP non-GAAP GAAP non-GAAP
in millions Q4 FY11 Adjust Q4 FY11 Q1 FY12 Adjust Q1 FY12
Revenues $ 131.0 $—$ 131.0 $ 120.2 $—$ 120.2
Cost of revenues 84.0 (1.6) 82.4 79.9 (0.4) 79.5
Gross profit 47.0 1.6 48.6 40.3 0.4 40.7
Operating expense:
Research & development 11.5 —11.5 11.9 —11.9
Selling, general & administrative 28.1 (0.7) 27.4 26.7 (0.2) 26.5
Restructuring 0.5 (0.5)—0.2 (0.2) -
40.1 (1.2) 38.9 38.8 (0.4) 38.4
Operating profit (loss) 6.9 2.8 9.7 1.5 0.8 2.3
Interest income, net 0.3 —0.3 0.3 —0.3
Sale of contract manufacturing business——— —-
Other, net 0.4 —0.4 0.3 —0.3
Income before taxes, joint ventures and minority interest 7.6 2.8 10.4 2.1 0.8 2.9
Income tax provision (3.4) 2.8 (0.6) 0.3 —0.3
Net income before joint ventures and minority interest 11.0 —11.0 1.8 0.8 2.6
Joint venture income (losses) 1.1 —1.1 1.2 —1.2
Net income 12.1 —12.1 3.0 0.8 3.8
Net (income) loss attributable to minority interests (0.0) —(0.0) (0.0) —(0.0)
Net income (loss) attributable to Brooks $ 12.1 $—$ 12.1 $ 3.0 $ 0.8 $ 3.8
Basic earnings per share attributable to Brooks $ 0.19 $—$ 0.19 $ 0.05 $ 0.01 $ 0.06
Diluted earnings per share attributable to Brooks $ 0.19 $—$ 0.19 $ 0.05 $ 0.01 $ 0.06
Basic shares for EPS 64,750 64,750 64,750 64,812 64,812 64,812
Diluted shares for EPS 65,118 65,118 65,118 65,309 65,309 65,309
Adjustments
Cost of revenues
Purchasing accounting adjustments to sales contracts $ (1.0) $ (0.4)
Inventory charges recorded for acquisitions (0.6) —
$ (1.6) $ (0.4)
Operating expense:
Merger costs $ (0.7) $ (0.2)
Restructuring (0.5) (0.2)
$ (1.2) $ (0.4)
Income tax provision
One-time benefit from uncertain tax positions $ 2.8 $—

