UNITED STATES
SECURITIES AND EXCHANGE COMMISSION
Washington, D.C. 20549
SCHEDULE 14A
Proxy Statement Pursuant to Section 14(a) of the
Securities Exchange Act of 1934
(Amendment No.)
Filed by the Registrant
☒
Filed by a Party other than the Registrant
☐
Check the appropriate box:
| ☐ | Preliminary Proxy Statement |
☐ | Confidential, for Use of the Commission Only (as permitted by Rule 14a-6(e)(2)) |
| ☐ | Definitive Proxy Statement |
| ☒ | Definitive Additional Materials |
| ☐ | Soliciting Material under §240.14a-12 |

CHEVRON CORPORATION
(Name of Registrant as Specified In Its Charter)
(Name of Person(s) Filing Proxy Statement, if other than the Registrant)
Payment of Filing Fee (Check all boxes that apply):
| ☒ | No fee required |
| ☐ | Fee paid previously with preliminary materials |
| ☐ | Fee computed on table in exhibit required by Item 25(b) per Exchange Act Rules 14a-6(i)(1) and 0-11 |
CHEVRON CORPORATION
supplement to the definitive proxy statement
for the 2024 annual meeting of stockholders
to be held on Wednesday, May 29, 2024
explanatory note
This proxy statement supplement (the “Supplement”) supplements and amends the definitive proxy statement on Schedule 14A (the “Proxy Statement”) filed with the Securities and Exchange Commission by Chevron Corporation (the “Company”) on April 10, 2024.
Following the filing of the Proxy Statement, it was determined that the Summary Compensation Table included in the “Executive Compensation” section of the Proxy Statement inadvertently understated perquisite compensation for A. N. Hearne, Executive Vice President of the Company, in the amount of $608,245, comprising expatriate & tax equalization benefits related to restricted stock units awarded to him under the Chevron Corporation Long-Term Incentive Plan. Following the adjustment, the total expatriate & tax equalization benefits for Mr. Hearne in 2023 increased from $1,217,892 to $1,826,137. All of our employees on expatriate assignments are entitled to expatriate and tax equalization benefits, which have been consistently administered and are intended to place expatriate employees in a similar net tax position as a similarly compensated employee in their home country.
As discussed in the Proxy Statement, we do not pay tax
gross-ups
to our Named Executive Officers (NEOs). We do provide standard expatriate packages, which include tax equalization payments, to all employees of the Company who serve on overseas assignments, including executive officers.This Supplement is being filed to correct this error by (i) reproducing the Summary Compensation Table, originally set forth on page 75 of the Proxy Statement, with changes to update the fiscal year 2023 information for Mr. Hearne with respect to his “All Other Compensation” and “Total” compensation amounts and revising footnote 6 to the Summary Compensation Table, and (ii) as a result of the changes to the Summary Compensation Table, reproducing the “Pay Versus Performance” section of the Proxy Statement, originally set forth on pages 98 through 101 of the Proxy Statement, with changes to update the “Average Summary Compensation Table Total for
Non-CEO
NEOs” and “Average Compensation Actually Paid toNon-CEO
NEOs.” This corrected information is provided below and replaces the information originally included in the Proxy Statement in its entirety.Except as specifically discussed in this Explanatory Note, this Supplement does not otherwise modify or update any other disclosures presented in the Proxy Statement. This Supplement should be read with the Proxy Statement, and, from and after the date of this Supplement, any references to the “Proxy Statement” shall be deemed to include the Proxy Statement as amended by this Supplement.
If you have already voted by Internet, telephone, or by mail, you do not need to take any action unless you wish to change your vote. Proxy voting instructions already returned by stockholders (via Internet, telephone, or mail) will remain valid and will be voted at the Annual Meeting unless revoked. Important information regarding how to vote your shares and revoke proxies already cast is available in the Proxy Statement under the caption “Voting and Additional Information.”
executive compensation
summary compensation table
The following table sets forth the compensation of our NEOs for the fiscal year ended December 31, 2023, and for the fiscal years ended December 31, 2022, and December 31, 2021, if they were NEOs in those years. The primary components of each NEO’s compensation are also described in our “Compensation Discussion and Analysis” in this Proxy Statement.
Name and principal position | Year | Salary ($) (1) | Stock awards ($) (2) | Option awards ($) (3) | Non-equity incentive plan compensation ($) (4) | Change in pension value and nonqualified deferred compensation earnings ($) (5) | All other compensation ($) (6) | Total ($) | ||||||||||||||||||||||||||||||||
M.K. Wirth Chairman and Chief Executive Officer | 2023 | $ | 1,818,750 | $ | 13,669,951 | $ | 4,252,096 | $ | 2,610,000 | $ | 3,702,609 | $ | 436,450 | $ | 26,489,856 | |||||||||||||||||||||||||
| 2022 | $ | 1,689,583 | $ | 12,909,537 | $ | 4,000,488 | $ | 4,500,000 | — | $ | 474,317 | $ | 23,573,925 | |||||||||||||||||||||||||||
| 2021 | $ | 1,650,000 | $ | 12,233,699 | $ | 3,874,962 | $ | 4,500,000 | — | $ | 351,624 | $ | 22,610,285 | |||||||||||||||||||||||||||
P.R. Breber Vice President and Chief Financial Officer | 2023 | $ | 1,134,375 | $ | 3,396,781 | $ | 1,053,860 | $ | 1,201,750 | $ | 980,658 | $ | 144,130 | $ | 7,911,554 | |||||||||||||||||||||||||
| 2022 | $ | 1,063,542 | $ | 3,275,929 | $ | 1,015,436 | $ | 1,820,000 | — | $ | 130,600 | $ | 7,305,507 | |||||||||||||||||||||||||||
| 2021 | $ | 1,020,000 | $ | 3,158,688 | $ | 1,000,818 | $ | 1,800,000 | $ | 1,007,726 | $ | 118,302 | $ | 8,105,534 | ||||||||||||||||||||||||||
M.A. Nelson Vice Chairman | 2023 | $ | 1,187,500 | $ | 4,433,692 | $ | 1,379,182 | $ | 1,436,400 | $ | 3,653,842 | $ | 127,248 | $ | 12,217,864 | |||||||||||||||||||||||||
| 2022 | $ | 1,039,583 | $ | 3,275,929 | $ | 1,015,436 | $ | 2,100,000 | — | $ | 129,730 | $ | 7,560,678 | |||||||||||||||||||||||||||
| 2021 | $ | 950,000 | $ | 3,158,688 | $ | 1,000,818 | $ | 1,800,000 | $ | 963,473 | $ | 115,401 | $ | 7,988,380 | ||||||||||||||||||||||||||
A.N. Hearne Executive Vice President, Oil, Products and Gas | 2023 | $ | 1,039,583 | $ | 4,433,692 | $ | 1,379,182 | $ | 1,017,450 | $ | 841,155 | $ | 1,941,405 | $ | 10,652,467 | |||||||||||||||||||||||||
R.H. Pate Vice President and General Counsel | 2023 | $ | 1,084,375 | $ | 3,396,781 | $ | 1,053,860 | $ | 1,149,500 | $ | 446,251 | $ | 149,226 | $ | 7,279,993 | |||||||||||||||||||||||||
| 2022 | $ | 1,018,542 | (7) | $ | 3,275,929 | $ | 1,015,436 | $ | 1,680,000 | $ | 522,067 | $ | 622,218 | (8) | $ | 8,134,192 | ||||||||||||||||||||||||
| (1) | Reflects actual salary earned during the fiscal year covered. The following table reflects the annual salary rate and effective date for the years in which each person was an NEO and the amounts deferred under the DCP. |
Name | Salary effective date | Salary | Total salary deferred under the DCP | |||||
| March 2023 | $ | 1,850,000 | $29,775 | |||||
M.K. Wirth | March 2022 | $ | 1,700,000 | $27,692 | ||||
| March 2021 | $ | 1,650,000 | $27,200 | |||||
| March 2023 | $ | 1,150,000 | $16,087 | |||||
P.R. Breber | March 2022 | $ | 1,075,000 | $15,171 | ||||
| March 2021 | $ | 1,020,000 | $14,600 | |||||
| February 2023 | $ | 1,200,000 | $17,150 | |||||
M.A. Nelson | October 2022 | $ | 1,100,000 | $14,692 | ||||
March 2022 | $ | 1,050,000 | ||||||
| March 2021 | $ | 950,000 | $13,200 | |||||
A.N. Hearne | March 2023 | $ | 1,050,000 | $51,979 | ||||
R.H. Pate | March 2023 | $ | 1,100,000 | $15,301 | ||||
March 2022 | $ | 1,025,000 | $20,157 | |||||
January 2022 | $ | 1,000,000 | ||||||
We explain the amount of salary and non-equity incentive plan compensation in proportion to total compensation in our “Compensation Discussion and Analysis–2023 Compensation Programs and Outcomes” in this Proxy Statement. |
executive compensation
| (2) | Amounts for the 2023 fiscal year reflect the aggregate grant date fair value of performance shares and RSUs granted under the LTIP on January 25, 2023. We calculate the grant date fair value of these awards in accordance with ASC Topic 718, as described in Note 22, “Stock Options and Other Share-Based Compensation,” to the Consolidated Financial Statements contained in our Annual Report on Form 10-K for the year ended December 31, 2023. These RSUs and performance shares accrue dividend equivalents. For purposes of this table only, estimates of forfeitures related to service-based vesting conditions for awards have been disregarded. |
For performance shares granted on January 25, 2023, the per-share grant date fair value was $198.49, with valuation weighted 70% based on relative TSR and 30% based on relativeROCE-I. For the relative TSR valuation, we used a Monte Carlo approach to calculate the grant date fair value of $206.81. To derive estimated grant date fair value per share, this valuation technique simulates TSR for the Company and the LTIP Performance Share Peer Group and the S&P 500 Index using market data for a period equal to the term of the performance period; correlates the simulated returns within the peer group to estimate a probable payout value; and discounts the probable payout value using a risk-free rate for Treasury bonds having a term equal to the performance period. For the relativeROCE-I valuation, we used the grant date fair value of $179.08, the closing price of Chevron common stock on the grant date. Performance shares are settled in cash, and the cash payout, if any, is based on market conditions at the end of the performance period (January 2023 through December 2025). Payout is calculated in the manner described in footnote 2 to the “Option Exercises and Stock Vested in Fiscal Year 2023” table in this Proxy Statement. If the maximum level of performance were to be achieved for the performance shares granted in 2023, the grant date value would be $358.16 per share (200% of the grant date stock price), or $16,998,274 for Mr. Wirth; $5,512,082 for Messrs. Nelson and Hearne; and $4,222,706 for Messrs. Breber and Pate. |
The per-unit grant date fair value of the RSUs was $179.08, the closing price of Chevron common stock on the grant date. These RSUs earn dividend equivalents and are settled in stock upon vestingone-third each January 31 following the first anniversary of the grant date. |
The material terms of performance shares and RSUs granted in 2023 are described in the “Grants of Plan-Based Awards in Fiscal Year 2023” and “Outstanding Equity Awards at 2023 Fiscal Year-End” tables in this Proxy Statement. |
| (3) | Amounts for each fiscal year reflect the aggregate grant date fair value of nonstatutory/nonqualified stock options granted under the LTIP on January 25, 2023. The per-option grant date fair value was $45.82. We calculate the grant date fair value of these stock options in accordance with ASC Topic 718, as described in Note 22, “Stock Options and Other Share-Based Compensation,” to the Consolidated Financial Statements contained in our Annual Report on Form10-K for the year ended December 31, 2023. Stock options do not accrue dividends or dividend equivalents. For purposes of this table only, estimates of forfeitures related to service-based vesting conditions for awards have been disregarded. The material terms of stock options granted in 2023 are described in the “Grants of Plan-Based Awards in Fiscal Year 2023” and “Outstanding Equity Awards at 2023 FiscalYear-End” tables in this Proxy Statement. |
| (4) | 2023 amounts reflect CIP awards for the 2023 performance year that were paid in March 2024. Messrs. Nelson, Hearne, and Pate elected to defer 25% of their CIP awards to the DCP, or $359,100 for Mr. Nelson, $254,363 for Mr. Hearne, and $287,375 for Mr. Pate. See “Compensation Discussion and Analysis–Compensation Discussion and Analysis in Detail–Annual Incentive Plan (Chevron Incentive Plan)” in this Proxy Statement for a detailed description of CIP awards. |
| (5) | 2023 amounts represent the aggregate change in the actuarial present value of the NEOs’ U.S. pension value for the CRP and the RRP and for Mr. Hearne the U.K. pension value from January 1, 2023, through December 31, 2023, expressed as a lump sum. The DCP and ESIP-RP do not pay above-market or preferential earnings and are not represented in this table. For purposes of this disclosure, we have used the same amounts required to be disclosed in the “Pension Benefits Table” in this Proxy Statement. |
| 2023 changes in the actuarial present value of an NEO’s U.S. pension value are attributable to seven factors: |
Highest average earnings (“HAE”) 36-month average base salary and CIP awards. The change in present value also reflects an offset for Social Security benefits, whose increase may cause a reduction in net benefits. For Messrs. Hearne and Pate, HAE is the highest consecutive five-year average base salary and CIP awards. |
Interest rate impact |
Lump-sum basis |
An additional year of age |
An additional year of benefit service earned in 2023 |
Demographic assumptions |
Change in lump-sum methodology |
executive compensation
| The following table provides a breakdown of the percent of change in the NEO’s pension: |
Factors | ||||||||||||||||
Name | Total percent change in pension value, Jan.–Dec. 2023 (a) | HAE | Interest rate impact | Lump-sum basis | One additional year of age | One additional year of service | Demographic assumption changes | Change in lump-sum methodology | ||||||||
M.K. Wirth | 11.6% | 11.9% | 0.5% | 0.8% | (2.0%) | 3.0% | 0.0% | (2.6%) | ||||||||
P.R. Breber | 6.5% | (0.1%) | (0.9%) | 1.1% | 5.5% | 3.2% | 0.0% | (2.3%) | ||||||||
M.A. Nelson | 25.0% | 24.6% | 0.7% | 0.8% | (1.8%) | 3.4% | 0.0% | (2.7%) | ||||||||
A.N. Hearne | 38.7% | 23.7% | 0.0% | 2.3% | 5.2% | 10.3% | 0.0% | (2.8%) | ||||||||
R.H. Pate | 14.0% | 5.7% | 0.0% | 0.8% | 0.0% | 9.9% | 0.0% | (2.4%) | ||||||||
| (a) | Calculated as follows: (actuarial present value of accumulated benefit at December 31, 2023 (reported in the “Pension Benefits Table” in this Proxy Statement) – actuarial present value of accumulated benefit at December 31, 2022 (reported in the “Pension Benefits Table” in last year’s Proxy Statement)) / actuarial present value of accumulated benefit at December 31, 2022 (reported in the “Pension Benefits Table” in last year’s Proxy Statement). |
| Additional information concerning the present value of benefits accumulated by our NEOs under these defined benefit retirement plans is included in the “Pension Benefits Table” in this Proxy Statement. |
| 2023 changes in the actuarial present value of an NEO’s U.K. pension value are attributable to five factors: |
An additional year of age |
Emerging inflation |
Interest rate impact |
Inflation – The inflation that is assumed after the measurement date impacts the projected pension at retirement and the assumed increases to benefits during retirement. |
Demographic assumptions |
| The following table provides a breakdown of the percent of change in Mr. Hearne’s U.K. pension: |
Factors | ||||||||||||
Name | Total percent change in pension value, Jan.–Dec. 2023 (a) | One additional year of age | Emerging inflation | Interest rate impact | Inflation | Demographic assumption changes | ||||||
A.N. Hearne | 12.6% | 5.0% | 4.9% | 5.3% | (1.1%) | (1.5%) | ||||||
| (a) | Calculated as follows: (actuarial present value of accumulated benefit at December 31, 2023 (reported in the “Pension Benefits Table” in this Proxy Statement) – actuarial present value of accumulated benefit at December 31, 2022) / actuarial present value of accumulated benefit at December 31, 2022. |
| Additional information concerning the present value of benefits accumulated by Mr. Hearne under this defined benefit retirement plan is included in the “Pension Benefits Table” in this Proxy Statement. |
executive compensation
| (6) | All Other Compensation for 2023 includes the following items, but excludes other arrangements that are generally available to our salaried employees on the U.S. payroll and do not discriminate in scope, terms, or operation in favor of our NEOs, such as our medical, dental, disability, group life insurance, and vacation programs. |
M.K. Wirth | P.R. Breber | M.A. Nelson | A.N. Hearne | R.H. Pate | ||||||||||||||||
ESIP Company Contributions (a) | $ | 26,400 | $ | 26,400 | $ | 26,400 | $ | 26,400 | $ | 26,400 | ||||||||||
ESIP-RP Company Contributions(a) | $ | 119,100 | $ | 64,350 | $ | 68,600 | $ | 56,767 | $ | 61,204 | ||||||||||
Perquisites (b) | ||||||||||||||||||||
Financial Counseling (c) | $ | 15,000 | $ | 25,687 | $ | 26,769 | $ | 6,618 | $ | 15,000 | ||||||||||
Motor Vehicles (d) | $ | 11,281 | — | — | — | ^ | ||||||||||||||
Corporate Aircraft (e) | $ | 220,921 | — | — | — | $ | 19,064 | |||||||||||||
Security (f) | $ | 33,970 | $ | 26,977 | — | $ | 17,840 | $ | 20,365 | |||||||||||
Executive Physical (g) | — | — | — | $ | 5,176 | — | ||||||||||||||
Expatriate & Tax Equalization Benefits (h) | — | — | — | $ | 1,826,137 | — | ||||||||||||||
Other (i) | $ | 9,778 | $ | 716 | $ | 5,479 | $ | 2,467 | $ | 7,133 | ||||||||||
Total, All Other Compensation | $ | 436,450 | $ | 144,130 | $ | 127,248 | $ | 1,941,405 | $ | 149,226 | ||||||||||
| (a) | The ESIP is a tax-qualified defined contribution plan open to employees on the U.S. payroll. The Company provides a matching contribution of 8% of annual compensation when an employee contributes 2% of annual compensation or 4% if they contribute 1%. Employees may also choose to contribute an amount above 2%, but none of the amount above 2% is matched. The Company match up to IRS limits ($330,000 of income in 2023) is made to the qualified ESIP account. For amounts above the IRS limit, the executive can elect to have 2% of base pay directed into the DCP, and the Company will match those funds with a contribution to the nonqualifiedESIP-RP. Company contributions to theESIP-RP are described further in the “Nonqualified Deferred Compensation Table” in this Proxy Statement. |
| (b) | Reflects perquisites and personal benefits received by an NEO in 2023 to the extent that the total value of such perquisites and personal benefits was equal to or exceeded $10,000. Items deemed perquisites are valued on the basis of their aggregate incremental cost to the Company. We do not provide tax gross-ups to our NEOs for any perquisites; however, we do in certain cases pay expatriate and tax equalization benefits in connection with overseas assignments, as discussed further in footnote h. In the table, dollar amounts below $100 are indicated by a “^.” |
| (c) | Reflects amounts related to income tax preparation services, plus other services provided under Chevron’s Financial Counseling Program, including life event, tax, investment, and estate planning services. |
| (d) | The Company maintains cars and drivers that the NEOs may use for business transportation and, in certain circumstances, for personal travel. NEOs may reimburse the Company’s incremental costs for any personal travel. For security reasons, Mr. Wirth is provided with access to the Company’s cars, drivers, and security personnel for both business and personal use. The aggregate incremental cost for such personal use reflects the sum of (i) a percentage of the total variable operating costs (including fuel and incremental maintenance costs, if any) for each vehicle used for personal use, based on personal use miles divided by the total miles traveled per vehicle, and (ii) all amounts paid for driver overtime for personal use. |
| (e) | Generally, executives are not allowed to use Company planes for personal use. For security reasons, due to the nature of Chevron’s business as a global integrated energy company, the Board mandates that Mr. Wirth fly on the corporate aircraft for all business and personal travel whenever it is feasible. Chevron U.S.A. Inc. (“CUSA”) and Mr. Wirth have entered into an Aircraft Time-Sharing Agreement (“ATSA”). Pursuant to the terms of the ATSA, Mr. Wirth reimbursed CUSA for a portion of his personal use of the corporate aircraft in 2023 within amounts permitted under FAA regulations. On a very limited basis, the CEO may authorize the personal use of a Company plane by other persons if, for example, it is in relation to and part of a trip that is otherwise business-related, such as a personal leg while on Company business, authorizing a spouse and/or other family members to accompany an executive on business travel (for which there was no incremental cost to the Company in 2023), or if it is in connection with a personal emergency. Aggregate incremental cost was determined by multiplying the operating hours attributable to personal use by the 2023 average hourly direct operating costs, plus actual crew and security costs (for overnight lodging, meals, transportation, and other incremental costs), plus actual flight-specific incremental costs and fees, where applicable. |
executive compensation
| (f) | For Mr. Wirth, reflects expenses related to security costs at his personal residences, which includes perimeter and physical security enhancements, network security and monitoring, and security consulting fees. Also included are incremental costs of security detail incurred in relation to personal air travel (for meals, transportation, and lodging). For Mr. Breber, residential security costs related to network security and monitoring fees ($26,977). For Messrs. Hearne and Pate, includes residential security costs related to network security and monitoring, and security consulting fees. |
| (g) | Includes executive physical and/or related diagnostic procedures. |
| (h) | Messrs. Breber, Nelson, and Hearne served on expatriate assignments in prior years, during which they received customary expatriate and tax equalization benefits intended to place expatriate employees in a similar net tax position as a similarly compensated employee in their home country. Amount shown for Mr. Hearne reflects amended tax equalization and similar tax payments in 2023 ($1,805,876) and expatriate assignment benefits ($20,261). For Messrs. Breber and Nelson, equalization benefits are not reflected above, as estimated taxes plus prior years’ amendments resulted in a net negative value. |
| (i) | Reflects the value of retirement gifts presented to Mr. Breber. Includes the aggregate incremental cost of tickets for performing arts events and commercial flights, meals, activities, ground transportation, domestic Board trips, and other amenities for corporate events attended by an NEO and their spouse. From time to time, the NEOs and/or their spouses attend sporting or performing arts events for which Chevron is a corporate sponsor and for which the Company incurs no incremental cost. |
| (7) | For Mr. Pate, reflects reconciling entry for paid time off taken in 2022, in the amount of $10,677. |
| (8) | For Mr. Pate, reflects payment of invoice received in 2023 of $1,115 for relocation benefits associated with moving his position from Chevron’s headquarters in the San Francisco Bay Area to our Houston, Texas, office, incurred in 2022. |
pay versus performance
pay versus performance table
As required by Section 953(a) of the Dodd-Frank Wall Street Reform and Consumer Protection Act and Item 402(v) of Regulationphilosophy and how the Company aligns executive compensation with the Company’s performance, refer to “Executive Compensation–Compensation Discussion and Analysis” starting on page 49.
S-K,
we are providing the following information about the relationship between executive Compensation Actually Paid (“CAP”) and certain financial performance of the Company. For further information concerning the Company’s variablepay-for-performance
CEO pay | Other NEO pay | Value of initial fixed $100 investment based on: | Other performance measures | |||||||||||||||||||||||||||||||||||||
Year | Summary compensation table total for CEO (1) | CAP for CEO (2) | Average summary compensation table total for non-CEO NEOs (3) | Average CAP for non-CEO NEOs (4) | Total stockholder return (5) | Peer Group total stockholder return (5)(6) | Net income (billions) (7) | Return on capital employed (ROCE ) (8) | ||||||||||||||||||||||||||||||||
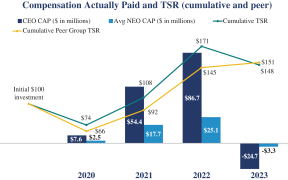
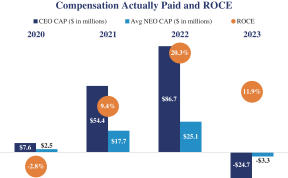
2023 | $ | 26,489,856 | $ | (24,671,364 | ) | $ | 9,515,470 | $ | (3,300,597 | ) | $ | 148 | $ | 151 | $ | 21.4 | 11.9 | % | ||||||||||||||||||||||
2022 | $ | 23,573,925 | $ | 86,746,262 | $ | 7,993,797 | (9) | $ | 25,087,289 | $ | 171 | $ | 145 | $ | 35.5 | 20.3 | % | |||||||||||||||||||||||
2021 | $ | 22,610,285 | $ | 54,351,572 | $ | 8,654,188 | $ | 17,681,842 | $ | 108 | $ | 92 | $ | 15.6 | 9.4 | % | ||||||||||||||||||||||||
2020 | $ | 29,017,031 | $ | 7,582,335 | $ | 9,053,126 | $ | 2,548,051 | $ | 74 | $ | 66 | $ | (5.5 | ) | (2.8 | %) | |||||||||||||||||||||||
| (1) | Represents amounts reported for Mr. Wirth for each corresponding year in the “Summary Compensation Table” in the “Total” column. |
| (2) | Amounts for each fiscal year do not reflect the actual amount of compensation earned by or paid to Mr. Wirth during the applicable year. In accordance with SEC rules, the amounts reported in this column for each fiscal year were calculated by making the following adjustments to amounts reported for Mr. Wirth in the “Summary Compensation Table” in the “Total” column: |
Year | Reported summary compensation table total for CEO | Less reported value of equity awards (a) | Plus award adjustments (b) | Less reported change in the actuarial present value of pension benefits (c) | Plus pension benefit adjustments (d) | CAP to CEO | ||||||||||||||||||||||||
2023 | $26,489,856 | $(17,922,047) | $(30,256,850) | $(3,702,609) | $720,286 | $(24,671,364) | ||||||||||||||||||||||||
| (a) | Represents, for each applicable year, the sum of the amounts reported in the “Summary Compensation Table” in the “Stock Awards” and “Option Awards” columns. |
pay versus performance
| (b) | Represents, for each applicable year, the following adjustments: (i) the addition of year-end fair value of any equity awards granted in the applicable year that are outstanding and unvested as of the end of the year; (ii) the addition (or subtraction if negative) of the amount of change as of the end of the applicable year (from the end of the prior fiscal year) in fair value of any awards granted in prior years that are outstanding and unvested as of the end of the applicable year; (iii) for awards that are granted and vest in same applicable year, the addition of the fair value as of the vesting date; (iv) for awards granted in prior years that vest in the applicable year, the addition (or subtraction if negative) of the amount equal to the change as of the vesting date (from the end of the prior fiscal year) in fair value; (v) for awards granted in prior years that are determined to fail to meet the applicable vesting conditions during the applicable year, a deduction for the amount equal to the fair value at the end of the prior fiscal year; and (vi) the addition of the dollar value of any dividends or other earnings paid on stock or option awards in the applicable year prior to the vesting date that are not otherwise reflected in the fair value of such award or included in any other component of total compensation for the applicable year. Equity award values are calculated in accordance with ASC Topic 718. The amounts deducted or added in calculating the equity award adjustments are as follows: |
Year | Year-end fair value of equity awards granted in the year and unvested at year-end | Year over year change in fair value of outstanding and unvested equity awards | Fair value as of vesting date of equity awards granted and vested in the year | Year over year change in fair value of equity awards granted in prior years that vested in the year | Fair value at the end of the prior year of equity awards that failed to meet vesting conditions in the year | Value of dividends or other earnings paid on stock or option awards not otherwise reflected in fair value or total compensation | Total equity award adjustments | ||||||||||||||||||||||||||||
2023 | $ | 10,248,856 | $ | (19,131,394 | ) | — | $ | (15,310,493 | ) | $ | (6,063,819 | ) | — | $ | (30,256,850 | ) | |||||||||||||||||||
| (c) | Represents, for each applicable year, the amount reported in the “Summary Compensation Table” in the “Change in Pension Value and Nonqualified Deferred Compensation Earnings” column. |
| (d) | Represents, for each applicable year, the aggregate of two components: (i) the actuarially determined service cost under the CRP and RRP for services rendered by Mr. Wirth during the applicable year (the “service cost”); and (ii) the entire cost of benefits granted in a plan amendment (or initiation) during the applicable year that are attributed by the benefit formula to services rendered in periods prior to the plan amendment or initiation (the “prior service cost”), in each case, calculated in accordance with U.S. GAAP. The amounts deducted or added in calculating the pension benefit adjustments are as follows: |
Year | Service cost | Prior service cost | Total pension benefit adjustments | ||||||||||||
2023 | $ | 720,286 | — | $ | 720,286 | ||||||||||
| (3) | Represents, for each applicable year, the average of the amounts reported in the “Summary Compensation Table” in the “Total” column for the NEOs as a group (excluding Mr. Wirth). The NEOs (excluding Mr. Wirth) included for purposes of calculating the average amounts in each applicable year are as follows: for 2023, Messrs. Breber, Nelson, Hearne, and Pate; for 2022, Messrs. Breber, Johnson, Nelson, and Pate; and for 2021 and 2020, Messrs. Breber, Johnson, Geagea, and Nelson. |
| (4) | Amounts for each fiscal year do not reflect the actual average of reported amounts of compensation earned by or paid to the NEOs as a group (excluding Mr. Wirth) during the applicable year. In accordance with SEC rules, the amounts reported in this column for each fiscal year were calculated by making the following adjustments to average total compensation for the NEOs as a group (excluding Mr. Wirth), using the same methodology described above in footnote 2. For Mr. Hearne, amounts include U.K. pension benefits. |
Year | Average reported summary compensation table total for non-CEO NEOs | Less average reported value of equity awards | Plus average equity award adjustments (a) | Less average reported change in the actuarial present value of pension benefits | Plus average pension benefit adjustments (b) | Average CAP to non-CEO NEOs | ||||||||||||||||||||||||
2023 | $ | 9,515,470 | $ | (5,131,758 | ) | $ | (6,484,360 | ) | $ | (1,480,477 | ) | $ | 280,528 | $ | (3,300,597 | ) | ||||||||||||||
pay versus performance
| (a) | The amounts deducted or added in calculating the total average equity award adjustments are as follows: |
Year | Average year- end fair value of equity awards granted in the year and unvested at year-end | Year over year average change in fair value of outstanding and unvested equity awards | Average fair value as of vesting date of equity awards granted and vested in the year | Year over year average change in fair value of equity awards granted in prior years that vested in the year | Average fair value at the end of the prior year of equity awards that failed to meet vesting conditions in the year | Average value of dividends or other earnings paid on stock or option awards not otherwise reflected in fair value or total compensation | Total average equity award adjustments | ||||||||||||||||||||||||||||
2023 | $ | 2,934,784 | $ | (4,557,135 | ) | — | $ | (3,489,420 | ) | $ | (1,372,589 | ) | — | $ | (6,484,360 | ) | |||||||||||||||||||
| (b) | The amounts deducted or added in calculating the total pension benefit adjustments are as follows: |
Year | Average service cost | Average prior service cost | Total average pension benefit adjustments | ||||||||||||
2023 | $ | 280,528 | — | $ | 280,528 | ||||||||||
| (5) | Represents, for each applicable year, cumulative total stockholder return beginning December 31, 2019, at market close. |
| (6) | Competitor Peer Group refers to BP, ExxonMobil, Shell, and TotalEnergies. The average cumulative TSR is weighted by each peer’s market cap as of the beginning of each year. |
| (7) | Figures rounded. |
| (8) | ROCE is calculated by dividing earnings (adjusted for after-tax interest expense and noncontrolling interests) by the average of total debt, noncontrolling interests, and Chevron Corporation stockholders’ equity for the year. |
| (9) | Reflects the updated figures for Salary and All Other Compensation in 2022 for Mr. Pate, as described in footnotes 7 and 8 to the “Summary Compensation Table.” |
financial performance measures
The three measures listed below are important financial performance measures used by the Company to link CAP to the NEOs, for the most recently completed fiscal year, to the Company’s performance. These financial measures are part of our short-term and long-term incentive plan design that reflects the Company’s philosophy to pay for absolute and competitive performance, in alignment with stockholder returns.
| • | Earnings 1 |
| • | ROCE 2 |
| • | Free cash flow 3 |
| 1 | Earnings as detailed in “Definitions of Selected Energy and Financial Terms” in Exhibit 99.1 of Chevron’s Annual Report on Form 10-K for the year ended December 31, 2023. |
| 2 | ROCE is calculated by dividing earnings (adjusted for after-tax interest expense and noncontrolling interests) by the average of total debt, noncontrolling interests and Chevron Corporation stockholders’ equity for the year. |
| 3 | Free cash flow is a non-GAAP financial measure. See Appendix A for a reconciliation to U.S. GAAP. |
pay versus performance
CAP versus TSR, net income, and company selected measure
A significant portion of the CAP to Mr. Wirth and to the other NEOs is composed of equity awards that motivate absolute and relative stock performance. As a result, the change in CAP amounts is aligned closely with Chevron’s absolute TSR and relative performance to the peer group.
In 2023, the CAP values for our CEO and the other NEOs are negative due to the decline in both absolute TSR and relative TSR to the peer group.
Net income and ROCE are significant components of the financial measures used to assess performance within the Company’s short-term incentive compensation program. The financial results category is weighted at 35% under the Company’s annual incentive plan, which includes earnings (or net income) and ROCE as components of the metrics within the financial results category. While the change in CAP amounts for CEO and the other NEOs shows directional correlation with the change in net income and ROCE in 2023, the negative CAP amounts are largely the result of decline in TSR, despite strong net income and ROCE.

The change in CAP to Mr. Wirth and the change in average CAP to the Company’s other NEOs are aligned with the financial measures detailed above. The CAP calculation largely reflects accounting adjustments to outstanding equity valuation and therefore does not equate to the actual realized compensation to the NEOs.
The MCC maintains a disciplined and consistent approach in managing Chevron’s executive compensation. Market data, Company performance, realizable pay, and realized pay are regularly reviewed and discussed to ensure a healthy balance between a competitive executive compensation program for talent attraction and retention, and alignment of pay and performance to drive long-term stockholder value creation.