UNITED STATES SECURITIES AND EXCHANGE COMMISSION
WASHINGTON, D.C. 20549
FORM 10-K
(Mark One)
| | x | ANNUAL REPORT PURSUANT TO SECTION 13 OR 15(d) OF THE SECURITIES
EXCHANGE ACT OF 1934 |
For the Fiscal Year Ended December 31, 2012
OR
| | ¨ | TRANSITION REPORT PURSUANT TO SECTION 13 OR 15(d) OF THE SECURITIES
EXCHANGE ACT OF 1934 |
For the transition period from______________to___________________.
Commission File Number:001-34214
| THE BANK OF KENTUCKY FINANCIAL CORPORATION |
| (Exact name of registrant as specified in its charter) |
| Kentucky | | 61-1256535 |
| (State or other jurisdiction of | | (I.R.S. Employer |
| incorporation or organization) | | Identification Number) |
| 111 Lookout Farm Drive, Crestview Hills, Kentucky 41017 |
| (Address of principal executive offices) (Zip Code) |
Registrant’s telephone number, including area code:(859) 371-2340
Securities registered pursuant to Section 12(b) of the Exchange Act:
| Common Stock, without par value | The Nasdaq Stock Market LLC |
| (Title of each class) | (Name of each exchange on which registered) |
Securities registered pursuant to Section 12(g) of the Exchange Act:
None
Indicate by check mark if the registrant is a well-known seasoned issuer, as defined in Rule 405 of the Securities Act.
Yes ¨ No x
Indicate by check mark if the registrant is not required to file reports pursuant to Section 13 or Section 15(d) of the Act.
Yes ¨ No x
Indicate by check mark whether the registrant has (1) filed all reports required to be filed by Section 13 or 15(d) of the Exchange Act during the preceding 12 months (or for such shorter period that the registrant was required to file such reports), and (2) has been subject to such filing requirements for the past 90 days. Yesx No¨
Indicate by check mark whether the registrant has submitted electronically and posted on its corporate web site, if any, every Interactive Data File required to be submitted and posted pursuant to Rule 405 of Regulation S-T (§232.405 of this chapter) during the preceding 12 months (or for such shorter period that the registrant was required to submit and post such files).
Yes x No ¨
Indicate by check mark if disclosure of delinquent filers pursuant to Item 405 of Regulation S-K is not contained herein, and will not be contained, to the best of registrant’s knowledge, in definitive proxy or information statements incorporated by reference in Part III of this Form 10-K or any amendment to this Form 10-K.¨
Indicate by check mark whether the registrant is a large accelerated filer, an accelerated filer, a non-accelerated filer or a smaller reporting company. See definitions of “large accelerated filer”, “accelerated filer,” and “smaller reporting company” in Rule 12b-2 of the Exchange Act (Check one):
Large accelerated filer ¨ Accelerated filer x Non-accelerated filer ¨ Smaller reporting company ¨
Indicate by check mark whether the registrant is a shell company (as defined in Rule 12b-2 of the Exchange Act).
Yes ¨ No x
The aggregate market value of the voting Common Stock held by non-affiliates of the registrant as of June 30, 2012 (the last business day of the registrant’s most recently completed second fiscal quarter) was approximately $156,142,000
At March 1, 2013, there were 7,480,762 shares of the registrant’s Common Stock issued and outstanding.
DOCUMENTS INCORPORATED BY REFERENCE
Part III of this Form 10-K incorporates by reference certain information from the registrant’s definitive Proxy Statement for the 2013 Annual Meeting of Stockholders, to be filed with the Securities and Exchange Commission.
| TABLE OF CONTENTS |
| | | |
| PART I | | 2 |
| Item 1. | Business. | 2 |
| Item 1A. | Risk Factors | 24 |
| Item 1B. | Unresolved Staff Comments | 31 |
| Item 2. | Properties | 31 |
| Item 3. | Legal Proceedings. | 31 |
| Item 4. | Mine Safety Disclosures | 31 |
| | | |
| PART II | | 32 |
| Item 5. | Market for Registrant’s Common Equity, Related Stockholder Mattersand Issuer Purchases of Equity Securities | 32 |
| Item 6. | Selected Financial Data. | 34 |
| Item 7. | Management’s Discussion and Analysis of Financial Condition and Results of Operation | 35 |
| Item 7A. | Quantitative and Qualitative Disclosure about Market Risk | 52 |
| Item 8. | Financial Statements and Supplementary Data | 54 |
| Item 9. | Changes in and Disagreements with Accountants on Accounting and Financial Disclosure | 113 |
| Item 9A. | Controls and Procedures. | 113 |
| Item 9B. | Other Information. | 115 |
| | | |
| PART III | | 115 |
| Item 10. | Directors, Executive Officers and Corporate Governance | 115 |
| Item 11. | Executive Compensation. | 115 |
| Item 12. | Security Ownership of Certain Beneficial Owners and Management and Related Stockholder Matters | 115 |
| Item 13. | Certain Relationships and Related Transactions, and Director Independence | 115 |
| Item 14. | Principal Accountant Fees and Services. | 115 |
| | | |
| PART IV | | 115 |
| Item 15. | Exhibits and Financial Statement Schedules.. | 115 |
| SIGNATURES | 116 |
| INDEX TO EXHIBITS | 117 |
PART I
Item 1. Business
General
The Bank of Kentucky Financial Corporation (“BKFC”) is a bank holding company that was incorporated as a Kentucky corporation in 1993 and engaged in no business activities until 1995, when BKFC acquired all of the issued and outstanding shares of common stock of The Bank of Kentucky, Inc. (the “Bank”), a bank incorporated under the laws of the Commonwealth of Kentucky (formerly named The Bank of Boone County, Inc.), and Burnett Federal Savings Bank (“Burnett”), a federal savings bank that was later merged into the Bank. BKFC, through the Bank, is engaged in the banking business in northern Kentucky and Hamilton county, Ohio.
Formed in 1990, the Bank provides financial services and other financial solutions through 33 offices located in northern Kentucky, which includes Boone, Kenton and Campbell counties and parts of Grant, Pendleton and Gallatin counties in northern Kentucky, and Hamilton county in Ohio. The principal products produced and services rendered by the Bank are as follows:
| · | Commercial Banking – The Bank provides a full range of commercial banking services to corporations and other business clients. Loans are provided for a variety of general corporate purposes, including financing for commercial and industrial projects, income producing commercial real estate, owner-occupied real estate and construction and land development. The Bank also provides a wide range of deposit services, including checking, lockbox services and other treasury management services. |
| · | Consumer Banking – The Bank provides banking services to consumers, including checking, savings and money market accounts as well as certificates of deposits and individual retirement accounts. The Bank also provides consumers with electronic banking products like internet banking, debit cards and 56 ATMs. In addition, the Bank provides consumer clients with installment and real estate loans and home equity lines of credit. |
| · | Trust Services – The Bank offers specialized services and expertise in the areas of wealth management and trust. These services include the administration of personal trusts and estates as well as the management of investment accounts for individuals. |
The majority of the Bank’s loan portfolio, approximately 80%, consists of loans secured with or by real estate. Loans secured with real estate are further broken down by loan type and borrower. Included in loans secured with or by real estate as of December 31, 2012 are:
| · | Residential real estate loans- $278 million or 23% of loans. These loans are secured by residential properties, where the repayment comes from the borrower’s personal cash flows and liquidity, and collateral values are a function of residential real estate values in the markets we serve. |
| · | Commercial real estate loans- $389 million or 33% of loans. This loan type includes non-owner-occupied commercial real estate loans and construction and land development loans. These loans are made to borrowers where the primary source of repayment is derived from the cash flows generated by the real estate collateral. These loans are secured by property such as apartment complexes, retail centers and land which is being developed and sold. |
| · | Owner-occupied commercial real estate loans - $288 million or 24% of loans. These are loans secured by real estate where the operating business is the source of repayment. These properties serving as collateral are characterized as industrial, warehouse or office. |
BKFC’s senior management monitors and evaluates financial performance on a company-wide basis. All of BKFC’s financial service operations are similar, and considered by management to be aggregated into one reportable operating segment for purposes of generally accepted accounting principles, although certain management responsibilities are assigned by business line. Accordingly, all of BKFC’s operations are aggregated in one reportable operating segment in this Annual Report on Form 10-K (this “Annual Report”). Revenue, net income and total assets for the years ended December 31, 2012, 2011 and 2010 are presented below:
| | | For the year ended December 31, | |
| | | 2012 | | | 2011 | | | 2010 | |
| | | (Dollars in thousands) | |
| Revenue: | | | | | | | | | | | | |
| Net Interest Income | | $ | 56,185 | | | $ | 55,538 | | | $ | 53,409 | |
| Non-interest Income | | | 22,421 | | | | 20,724 | | | | 20,714 | |
| Total Revenue | | | 78,606 | | | | 76,262 | | | | 74,123 | |
| Net Income available to common shareholders | | $ | 18,145 | | | $ | 15,517 | | | $ | 9,425 | |
| Total Assets | | $ | 1,844,104 | | | $ | 1,744,724 | | | $ | 1,664,884 | |
As described in more detail in this Annual Report, the recent economic recession and ongoing economic recovery have had a substantial effect on the operations of BKFC and the Bank. In an effort to stabilize and strengthen the financial markets and the banking industry, the United States Congress and various federal agencies have taken a number of significant actions over the past several years, including the passage of legislation and the implementation of a number of programs. The most recent of these actions was the passage into law, on July 21, 2010, of the Dodd-Frank Wall Street Reform and Consumer Protection Act (the “Dodd-Frank Act”). See below under “Regulation and Supervision” for further discussion of the Dodd-Frank Act.
BKFC and the Bank participated in two government programs enacted in response to the recession. First, inOctober 2008 the Bank participated in the transaction account guarantee component of the Federal Deposit Insurance Corporation’s (the “FDIC”) Temporary Liquidity Guarantee Program (the “TLGP”), whereby the FDIC would temporarily guarantee all depositor funds in qualifying non-interest-bearing transaction accounts. Second, in February 2009 BKFC participated in the Capital Purchase Program (“CPP”) as part of theTroubled Asset Relief Program (“TARP”) sponsored by the United States Department of the Treasury (the “Treasury Department”), in order to enhance BKFC’s liquidity and capital position. BKFC received $34.0 million under the CPP in exchange for issuing 34,000 shares of Fixed Rate Cumulative Perpetual Preferred Stock, Series A (the “Series A Preferred Stock”), and a warrant (the “Warrant”) to purchase approximately 274,784 shares of BKFC common stock (“Common Stock”). The Treasury Department’s authority to make new investments under the CPP expired in October 2010. On December 22, 2010, BKFC effected the repurchase of one-half of the outstanding $34 million of Series A Preferred Stock held by the Treasury Department. On November 23, 2011, BKFC effected the repurchase of the final $17 million of Series A Preferred Stock held by the Treasury Department. Neither BKFC nor the Bank has actively participated in any of the other wide-ranging programs that were instituted by the federal government in response to the economic recession. For a discussion of the impact of the current economic conditions on the financial condition and results of operations of BKFC and its subsidiaries, see below under “The Current Economic Environment,” as well as “Item 7. Management’s Discussion and Analysis of Financial Condition and Results of Operations” in this Annual Report.
As a bank incorporated under the laws of the Commonwealth of Kentucky, the Bank is subject to regulation, supervision and examination by the Department of Financial Institutions of the Commonwealth of Kentucky (the “Department”) and the FDIC. The Bank is also a member of the Federal Home Loan Bank of Cincinnati (the “FHLB”).
Acquisition Activities
On June 14, 2000, BKFC consummated the acquisition of the Fort Thomas Financial Corporation (“FTFC”) and its wholly owned subsidiary, the Fort Thomas Savings Bank (“FTSB”). FTFC was merged with and into BKFC and FTSB was merged with and into the Bank. Upon consummation of this acquisition, 865,592 shares of Common Stock were issued for substantially all of the outstanding shares of FTFC. The combination was accounted for as a pooling of interests and the historical financial position and results of operations of the two companies have been combined for financial reporting purposes.
On November 22, 2002, BKFC consummated the acquisition of certain assets and assumption of certain liabilities of Peoples Bank of Northern Kentucky (“PBNK”). This acquisition was accounted for under the purchase method of accounting and, accordingly, the tangible and identifiable intangible assets and liabilities of the purchase were recorded at estimated fair values. The excess of the purchase price over the net tangible and identifiable intangible assets was recorded as goodwill. The adjustments necessary to record tangible and identifiable intangible assets and liabilities at fair value are amortized to income and expensed over the estimated remaining lives of the related assets and liabilities.
On May 18, 2007, BKFC consummated the acquisition of FNB Bancorporation, Inc. and its subsidiary, First Bank of Northern Kentucky, Inc. (“First Bank”). This acquisition was accounted for under the purchase method of accounting and, accordingly, the tangible and identifiable intangible assets and liabilities of the purchase were recorded at estimated fair values. The excess of the purchase price over the net tangible and identifiable intangible assets was recorded as goodwill. The adjustments necessary to record tangible and identifiable intangible assets and liabilities at fair value are amortized to income and expensed over the estimated remaining lives of the related assets and liabilities.
On December 11, 2009, the Bank completed the purchase of three banking offices of Integra Bank Corporation’s wholly-owned bank subsidiary, Integra Bank N.A. (“Integra Bank”), located in Crittenden, Dry Ridge and Warsaw, Kentucky and a portfolio of selected commercial loans originated by Integra Bank’s Covington, Kentucky loan production office. This transaction also included the deposits of two additional branches in northern Kentucky where the banking offices were excluded. This transaction added $76 million in deposits and $51 million in loans. The deposits were purchased at a premium of 6.50%, while the loans were purchased at an approximate 1% discount. The acquisition included a core deposit intangible asset of $1.579 million and goodwill of $5.31 million. In a separate transaction, the Bank also bought an additional $49 million in loans from Integra Bank in the third quarter and $7 million in the fourth quarter of 2009 at an approximate 1% discount. None of these purchased loans had shown evidence of credit deterioration since origination
On December 31, 2009, the Bank completed the purchase of Tapke Asset Management, LLC (“TAM”). TAM was an independent investment advisory firm, headquartered in Fort Wright, Kentucky, and one of northern Kentucky’s largest independent investment advisory firms. As a result of this transaction, the Bank’s client assets increased to over $650 million at December 31, 2009. TAM was purchased for $3 million, consisting of $2 million in cash and $1 million in Common Stock, with an additional $500,000 in contingent consideration payable in three years based on revenue retention, which had a fair value of $395,000 and was paid out in 2012. The acquisition included a customer relationship intangible of $1,525,000, a non-compete agreement intangible of $320,000, a trade name intangible of $165,000 and goodwill of $1,370,000.
On October 28, 2011, the Bank completed the purchase of one banking office of the United Kentucky Bank of Pendleton County, Inc. (“United Kentucky Bank”), located in Falmouth, Kentucky and a portfolio of selected loans. This acquisition was consistent with the Bank’s strategy to strengthen and expand its northern Kentucky market share. This transaction added $28 million in deposits and $14 million in loans. The deposits were purchased at a $300,000 premium, while the loans were purchased at an approximate 1.58% discount. The acquisition included a core deposit intangible asset of $511,000 and goodwill of $134,000. The results of operations for this acquisition have been included since the transaction date of October 28, 2011.
The Current Economic Environment
During 2012, the nation continued to experience a slow economic recovery. However, the recovery remains fragile and is still threatened by slow jobs growth, continued issues with asset quality in the residential and commercial mortgage markets, household and business uncertainty and tight credit conditions. The effects of the financial crisis and recession are expected to continue for some time, especially as the magnitude of economic distress facing local markets places continued pressure on asset quality and earnings, with the potential for undermining the stability of the banking organizations that serve these markets.
Although the Bank has experienced an increase in defaults and foreclosures during 2009, 2010, 2011 and 2012, such levels have been significantly less than other regions of the United States. This is due, in part, to the fact that the Bank’s markets in northern Kentucky and Cincinnati, Ohio have not experienced as dramatic a reduction in real estate values from previous years as compared to markets like Florida and California.
As a result of management concerns over the current economic environment, individual lending authorities remain at reduced levels and the loan committee structure established in 2009 remains in place, which added the Bank’s Chief Executive Officer to the Bank’s loan committee to further scrutinize credit decisions. Additionally, the Bank previously established a problem asset workout group in 2009. This group’s primary task is to reduce risk by accelerating the exit from troubled credits. The problem asset workout group does this employing a number of strategies. In addition, this group provides advice and support for the Bank’s lending professionals with respect to those relationships that are showing signs of stress but have not elevated to the point of transfer to workout. In addition to these monitoring and management processes, BKFC also conducts quarterly reviews and evaluations of all criticized loans. These comprehensive reviews, which pre-date the recent economic recession, include the formulation of action plans and updates on recent developments on all criticized loans. Proactive management of problem loans remains a high priority of the Bank’s senior management.
BKFC has not experienced the stress or deterioration in its residential real estate portfolio that other financial institutions may be experiencing, as residential real estate loans represent a small portion of the Bank’s overall loan portfolio. The Bank has not created or marketed any sub-prime loan products to its customers and does not service mortgages on behalf of other institutions. The Bank follows a strategy of selling a majority of its originated residential loans in the secondary market. In the majority of situations, the Bank follows the underwriting guidelines of the various government agencies on residential real estate loans the Bank seeks to portfolio. For the year ended December 31, 2012, the Bank’s residential real estate loan production was $216.4 million. Of this, sold loans totaled $192.2 million, while portfolio and construction loans totaled $13.2 million and $11 million, respectively. Residential real estate charge-offs in this portfolio in 2012 and 2011 were 0.64% and 0.45% respectively. Delinquencies have been moderate, and non-accruals were $3.75 million as of December 31, 2012. The foregoing measures are a reflection of the Bank’s underwriting and collection practices. The Bank also added full time equivalent resources to its collections department, allowing the Bank to make more frequent and earlier collection calls, resulting in better working relationships with those borrowers who may have difficulty in making timely payments.
The economic recession and current recovery has also affected the operations of BKFC and the Bank. During the fourth quarter of 2008 and first quarter of 2009, BKFC and the Bank each participated in two government programs, which had the effect of enabling it to enhance liquidity and to augment its strong capital position and otherwise facilitate its response to the economic crisis. First, in October 2008 the Bank participated in the transaction account guarantee component of the FDIC’s TLGP program. Second, in February 2009 BKFC participated in the CPP, receiving $34,000,000, in exchange for issuing 34,000 shares of Series A Preferred Stock and a Warrant to purchase approximately 274,784 shares of Common Stock. As of December 31, 2012, all of the TARP Series A Preferred Stock has been repurchased by BKFC; however, the Warrant remains outstanding. As a result of the final repurchase, limitations on increasing dividends, executive compensation and other regulatory requirements are no longer applicable to BKFC. Neither BKFC nor the Bank actively participates in any of the other federal government programs that have been instituted in response to the current economic recession.
For additional discussion of the impact of the current economic recession on the financial condition and results of operations of BKFC and its subsidiaries, see “Item 7. Management’s Discussion and Analysis of Financial Condition and Results of Operations” in this Annual Report.
Available Information
BKFC maintains an internet website at the following internet address: www.bankofky.com. BKFC makes available free of charge through its website, its annual report on Form 10-K, quarterly reports on Form 10-Q, current reports on Form 8-K and amendments to those reports filed or furnished pursuant to Section 13(a) or 15(d) of the Securities Exchange Act of 1934, as amended (the “Exchange Act”), as soon as reasonably practicable after such material was electronically filed with, or furnished to, the Securities and Exchange Commission (“SEC”). Materials that BKFC files with the SEC may be read and copied at the SEC Public Reference Room at 100 F Street, N.E., Washington, DC 20549. This information may also be obtained by calling the SEC at 1-800-SEC-0330. The SEC also maintains an internet website that contains reports, proxy and information statements, and other information regarding issuers that file electronically with the SEC at the SEC’s website, www.sec.gov. BKFC will provide a copy of any of the foregoing documents to shareholders free of charge upon request.
Lending Activities
General. As a commercial bank, the Bank offers a wide variety of loans. Among the Bank’s various lending activities are the origination of loans secured by first mortgages on nonresidential real estate; loans secured by first mortgages on one- to four-family residences; unsecured commercial loans and commercial loans secured by various assets of the borrower; unsecured consumer loans and consumer loans secured by automobiles, boats and recreational vehicles; and construction and land development loans secured by mortgages on the underlying property.
The following table sets forth the composition of the Bank’s loan portfolio by type of loan at the dates indicated:
| | | As of December 31, | |
| | | 2012 | | | 2011 | | | 2010 | | | 2009 | | | 2008 | |
| | | Amount | | | % | | | Amount | | | % | | | Amount | | | % | | | Amount | | | % | | | Amount | | | % | |
| | | (Dollars in thousands) | |
| Type of Loan: | | | | | | | | | | | | | | | | | | | | | | | | | | | | | | | | | | | | | | | | |
| Nonresidential real estate loans | | $ | 573,101 | | | | 47.9 | % | | $ | 523,485 | | | | 46.2 | % | | $ | 482,173 | | | | 43.5 | % | | $ | 476,089 | | | | 41.2 | % | | $ | 428,859 | | | | 41.7 | % |
| | | | | | | | | | | | | | | | | | | | | | | | | | | | | | | | | | | | | | | | | |
| Residential real estate loans | | | 278,286 | | | | 23.3 | | | | 266,268 | | | | 23.5 | | | | 260,625 | | | | 23.5 | | | | 267,857 | | | | 23.2 | | | | 239,729 | | | | 23.3 | |
| Commercial loans | | | 201,384 | | | | 16.8 | | | | 193,176 | | | | 17.1 | | | | 216,660 | | | | 19.6 | | | | 223,404 | | | | 19.3 | | | | 175,188 | | | | 17.1 | |
| Consumer loans | | | 16,447 | | | | 1.4 | | | | 16,618 | | | | 1.5 | | | | 16,546 | | | | 1.5 | | | | 20,750 | | | | 1.8 | | | | 17,693 | | | | 1.7 | |
| Construction and land development loans | | | 104,498 | | | | 8.7 | | | | 104,788 | | | | 9.3 | | | | 107,611 | | | | 9.8 | | | | 148,288 | | | | 12.8 | | | | 150,754 | | | | 14.7 | |
| Municipal obligations | | | 23,128 | | | | 1.9 | | | | 27,066 | | | | 2.4 | | | | 23,573 | | | | 2.1 | | | | 20,232 | | | | 1.7 | | | | 14,983 | | | | 1.5 | |
| Total loans | | $ | 1,196,844 | | | | 100.0 | % | | $ | 1,131,401 | | | | 100.0 | % | | $ | 1,107,188 | | | | 100.0 | % | | $ | 1,156,620 | | | | 100.0 | % | | $ | 1,027,206 | | | | 100.0 | % |
| Less: | | | | | | | | | | | | | | | | | | | | | | | | | | | | | | | | | | | | | | | | |
| Deferred loan fees | | | 1,435 | | | | | | | | 1,447 | | | | | | | | 1,179 | | | | | | | | 1,636 | | | | | | | | 649 | | | | | |
| Allowance for loan losses | | | 16,568 | | | | | | | | 18,288 | | | | | | | | 17,368 | | | | | | | | 15,153 | | | | | | | | 9,910 | | | | | |
| Net loans | | $ | 1,178,841 | | | | | | | $ | 1,111,666 | | | | | | | $ | 1,088,641 | | | | | | | $ | 1,139,831 | | | | | | | $ | 1,016,647 | | | | | |
Loan Maturity Schedule. The following table sets forth certain information, as of December 31, 2012, regarding the dollar amount of certain loans maturing in the Bank’s portfolio based on their contractual terms to maturity and the dollar amount of such loans that have fixed or variable rates within certain maturity ranges ending after 2012:
| | | | | | Due after 1
year to 5 | | | Due after 5 | | | | |
| | | Due within one year | | | years | | | years | | | Total | |
| | | (Dollars in thousands) | |
| Commercial loans | | $ | 113,180 | | | $ | 85,252 | | | $ | 2,952 | | | $ | 201,384 | |
| Construction and land development loans | | | 104,498 | | | | - | | | | - | | | | 104,498 | |
| Total | | $ | 217,678 | | | $ | 85,252 | | | $ | 2,952 | | | $ | 305,882 | |
| | | | | | | | | | | | | | | | | |
| Interest sensitivity: | | | | | | | | | | | | | | | | |
| With fixed rates | | | | | | $ | 36,930 | | | $ | 1,187 | | | | | |
| With variable rates | | | | | | | 48,322 | | | | 1,765 | | | | | |
| Total | | | | | | $ | 85,252 | | | $ | 2,952 | | | | | |
Nonresidential Real Estate Loans. The Bank makes loans secured by first mortgages on nonresidential real estate, including retail stores, office buildings, warehouses, apartment buildings and recreational facilities. Such mortgage loans generally have maturities between 5 and 10 years with amortization periods of 10 to 20 years and are made with adjustable interest rates (“ARMs”). Interest rates on the ARMs adjust every one-, three- or five-years based upon the interest rates of the applicable one-, three- or five- year U.S. Treasury security then offered.
The Bank limits the amount of each loan in relationship, in accordance with the Bank’s policy, to the appraised value of the real estate and improvements at the time of origination of a nonresidential real estate loan. In accordance with regulations, the maximum loan-to-value ratio (the “LTV”) on nonresidential real estate loans made by the Bank is 80%, subject to certain exceptions.
Nonresidential real estate lending is generally considered to involve a higher degree of risk than residential lending. Such risk is due primarily to the dependence of the borrower on the cash flow from the property to service the loan. If the cash flow from the property is reduced due to a downturn in the economy, for example, or due to any other reason, the borrower’s ability to repay the loan may be impaired. To reduce such risk, the decision to underwrite a nonresidential real estate loan is based primarily on the quality and characteristics of the income stream generated by the property and/or the business of the borrower and any other applicable credit enhancement, such as global cash flow analysis. In addition, the Bank generally obtains the personal guarantees of one or more of the principals of the borrower and carefully evaluates the location of the real estate, the quality of the management operating the property, the debt service ratio and appraisals supporting the property’s valuation.
At December 31, 2012, the Bank had a total of $573 million in nonresidential real estate loans, the vast majority of which were secured by property located in the northern Kentucky and the Greater Cincinnati metropolitan area. Owner-occupied nonresidential real estate was $288 million of the total nonresidential real estate loans. Total nonresidential real estate loans comprised approximately 48% of the Bank’s total loans at such date, $12.14 million of which were classified as non-performing.
Residential Real Estate Loans. The Bank originates permanent conventional loans secured by first mortgages on single-family and multi-family residential properties located in the northern Kentucky area. The Bank also originates loans for the construction of residential properties and home equity loans secured by second mortgages on residential real estate. Each of such loans is secured by a mortgage on the underlying real estate and any improvements thereon.
The residential real estate loans originated for the Bank’s loan portfolio are either one- or three-year ARMs. Such loans typically have adjustment period caps of 2% and lifetime caps of 6%. The maximum amortization period of such loans is 30 years. The Bank does not engage in the practice of deeply discounting the initial rates on such loans, nor does the Bank engage in the practice of putting payment caps on loans that could lead to negative amortization. Historically, the Bank has not made fixed-rate residential mortgage loans for its portfolio. In order to meet consumer demand for fixed-rate loans, however, the Bank has originates and sells loans to other lenders willing to accept the interest rate and credit risk.
While in a rising interest rate environment the delinquencies and foreclosure rates associated with interest rate resets on residential real estate loans would increase, this risk is somewhat mitigated by the 2% period cap and the 6% lifetime cap on the typical loan in the Bank’s residential real estate portfolio. Furthermore, the aggregate amount of residential real estate loans held by the Bank does not represent a significant portion of the Bank’s overall loan portfolio. Accordingly, the risks associated with a material increase in delinquencies and foreclosures resulting upon the occurrence of any interest rate reset are minimal.
BKFC does not have higher risk loans such as subprime loans, “alt A” loans, no or little documentation loans, interest-only or option adjustable rate mortgage products in its portfolio. The majority of the Bank’s residential portfolio would be considered conforming loans in accordance with standards of governmental agencies.
The Bank requires private mortgage insurance for the amount of any such loan with an LTV in excess of 90%.
The aggregate amount of the Bank’s residential real estate loans equaled approximately $278 million at December 31, 2012 and represented 23% of total loans at such date. At December 31, 2012, the Bank had $5.44 million of non-performing loans of this type.
Loans Held for Sale. The Bank originates residential real estate loans to be sold, service released, subject to commitment to purchase in the secondary market. These loans are fixed rate with terms ranging from fifteen to thirty years. At December 31, 2012, these loans totaled $16.3 million.
Commercial Loans. The Bank offers commercial loans to individuals and businesses located throughout northern Kentucky and the Greater Cincinnati metropolitan area. The typical commercial borrower is a small to mid-sized company with annual sales under $10 million. The majority of commercial loans are made with adjustable rates of interest tied to the Bank’s prime interest rate. Commercial loans typically have terms of one to five years. In general, commercial lending entails significant risks. Such loans are subject to greater risk of default during periods of adverse economic conditions. Because such loans are secured by equipment, inventory, accounts receivable and other non-real estate assets, the collateral may not be sufficient to ensure full payment of the loan in the event of a default. To reduce such risk, the Bank generally obtains personal guarantees from one or more of the principals backing the borrower. At December 31, 2012, the Bank had $201 million, or 17% of total loans, in commercial loans, $740,000 of which were classified as non-performing.
Consumer Loans.The Bank makes a variety of consumer loans, including automobile loans, recreational vehicle loans and personal loans. Such loans generally have fixed rates with terms from three to five years. Consumer loans involve a higher risk of default than residential real estate loans, particularly in the case of consumer loans that are unsecured or secured by depreciating assets, such as automobiles. Repossessed collateral for a defaulted consumer loan may not provide an adequate source of repayment of the outstanding loan balance as a result of the greater likelihood of damage, loss or depreciation, and the remaining deficiency may not warrant further substantial collection efforts against the borrower. In addition, consumer loan collections depend on the borrower’s continuing financial stability, and thus are more likely to be adversely affected by job loss, illness or personal bankruptcy. Various federal and state laws, including federal and state bankruptcy and insolvency laws, may also limit the amount that can be recovered on such loans. At December 31, 2012, the Bank had $16 million, or 1% of total loans, in consumer loans, $70,000 of which were classified as non-performing.
Construction and Land Development Loans. The Bank makes loans for the construction of residential and nonresidential real estate and land development purposes. Most of these loans are structured with adjustable rates of interest tied to changes in the Bank’s prime interest rate for the period of construction. A general contractor is used with many of the construction loans originated by the Bank to owner-occupants for the construction of single-family homes. Other loans are made to builders and developers for various projects, including the construction of homes and other buildings that have not been pre-sold and the preparation of land for site and project development.
Construction and land development loans involve greater underwriting and default risks than do loans secured by mortgages on improved and developed properties, due to the effects of general economic conditions on real estate developments, developers, managers and builders. In addition, such loans are more challenging to evaluate and monitor. Loan funds are advanced upon the security of the project under construction, which is more challenging to value before the completion of construction. Moreover, because of the uncertainties inherent in estimating construction costs, it is challenging to evaluate accurately the value upon completion and the total loan funds required to complete a project. In the event a default on a construction or land development loan, it may be necessary for the Bank to take control of the project and attempt either to arrange for completion of construction or dispose of the unfinished project. At December 31, 2012, a total of $104 million, or approximately 9% of the Bank’s total loans, consisted of construction and land development loans, $1.1 million of which were classified as non-performing.
Municipal Obligations. The Bank makes loans to various Kentucky municipalities for various purposes, including the construction of municipal buildings and equipment purchases. Loans made to municipalities are usually secured by mortgages on the properties or financed by a lien on equipment purchased or by the general taxing authority of the municipality and provide certain tax benefits for the Bank. At December 31, 2012, the Bank had $23 million, or 2% of total loans, invested in municipal obligation loans, none of which were classified as non-performing.
Loan Solicitation and Processing. The Bank’s loan originations are developed from a number of sources, including its existing customer base, periodic newspaper and radio advertisements, solicitations by the Bank’s lending staff, walk-in customers, director referrals and an officer call program. For nonresidential real estate loans, the Bank obtains information with respect to the credit, business and financial history of the borrower and its current and prior real estate projects. Personal guarantees of one or more principals of the borrower are generally obtained. For loans that meet or exceed a certain dollar threshold, an environmental study of such real estate is normally conducted. Upon the completion of the appraisal of the nonresidential real estate and the receipt of information on the borrower, the loan application is submitted to the Bank’s Loan Committee if the amount and/or relationship exceed the officer’s lending authority for approval or rejection. If, however, the loan relationship is in excess of $2.50 million, the loan will be submitted to the Bank’s Executive Loan Committee for approval or rejection.
In connection with residential real estate loans, the Bank obtains a credit report, verification of employment and other documentation concerning the creditworthiness of the borrower. An appraisal of the fair market value of the real estate on which the Bank will be granted a mortgage to secure the loan is prepared by an independent fee appraiser approved by the Bank’s Board of Directors. An environmental study of such real estate is conducted only if the appraiser or Bank has reason to believe that an environmental problem may exist.
When a residential real estate loan application is approved, title insurance is normally obtained in respect of the real estate, which will secure the loan. At the time a nonresidential real estate loan is closed, title insurance is customarily obtained on the title to the real estate, which will secure the mortgage loan. All borrowers are required to carry satisfactory fire and casualty insurance and flood insurance, if applicable, and name the Bank as an insured mortgagee.
Commercial loans are underwritten primarily on the basis of the stability of the income and cash flows generated by the business and/or property. For most commercial loans, however, the personal guarantees of one or more principals of the borrowers are generally obtained. Consumer loans are underwritten on the basis of the borrower’s credit history and an analysis of the borrower’s income and expenses, ability to repay the loan and the value of any collateral. The procedure for approval of construction loans is the same as for permanent mortgage loans, except that an appraiser evaluates the building plans, construction specifications and estimates of construction costs. The Bank also evaluates the feasibility of the proposed construction project and the experience and record of the builder.
Loan Origination and Other Fees. The Bank realizes loan origination fees and other fee income from its lending activities and also realizes income from late payment charges, application fees and fees for other miscellaneous services. Loan origination fees and other fees are a volatile source of income, varying with the volume of lending, loan repayments and general economic conditions. Nonrefundable loan origination fees and certain direct loan origination costs are deferred and recognized as an adjustment to yield over the life of the related loan.
Delinquent Loans, Non-Performing Assets, Classified Assets and Troubled Debt Restructurings (TDRs). When a borrower fails to make a required payment on a loan, the Bank attempts to cause the deficiency to be cured by contacting the borrower. In most cases, deficiencies are cured promptly as a result of these collection efforts.
Loans that are 90 days past due or more that are not considered well secured and in the process of collection are placed on non-accrual status. Under-collateralized loans that are 90 days past due or more in which the Bank does not expect to be repaid by the borrower’s or guarantor’s financial wherewithal after an extensive collection effort, shall be reviewed for full or partial charge-off. The amount charged-off will be charged against the allowance for loan losses allowance.
The Bank utilizes a risk-rating system to quantify and monitor loan quality. The system assigns a risk rating from one to nine for each loan. Classified commercial loans are those with risk ratings of seven or higher. Each loan rating is determined by analyzing the borrowers’ management, financial ability, sales trends, operating results, financial conditions, asset protection, contingencies, payment history, financial flexibility, credit enhancements and other relevant factors. Loans that fall into the classified categories are monitored on a regular basis and proper action is taken to minimize the Bank’s loss exposure. Losses or partial losses are recognized when loans are deemed uncollectible.
The Bank’s risk rating system was developed in a manner that is consistent with the regulatory guidance. Problem assets are classified as “special mention” (risk rating 6), “substandard” (risk rating 7), “substandard non-accrual” (risk rating 8), or “doubtful” (risk rating 9). “Substandard” assets have one or more defined weaknesses and are characterized by the distinct possibility that the insured institution will sustain some loss if the deficiencies are not corrected. “Doubtful” assets have the same weaknesses as “substandard” assets, with the additional characteristics that (i) the weaknesses make collection or liquidation in full on the basis of currently existing facts, conditions and values questionable and (ii) there is a high possibility of loss. The regulations also contain a “special mention” or also known as “criticized assets” category, consisting of assets which do not currently expose an institution to a sufficient degree of risk to warrant classification but which possess credit deficiencies or potential weaknesses deserving management’s close attention.
The aggregate amounts of the Bank’s classified assets at December 31, 2012 and 2011 were as follows:
| | | 12/31/12 | | | 12/31/11 | |
| | | (Dollars in thousands) | |
| Special mention (risk rating 6) | | $ | 34,723 | | | $ | 31,910 | |
| Substandard (risk rating 7 & 8) | | | 53,542 | | | | 74,844 | |
| Doubtful (risk rating 9) | | | 0 | | | | 84 | |
| | | | | | | | | |
| Total classified assets | | $ | 88,265 | | | $ | 106,838 | |
The following table reflects the amount of loans that are in delinquent status of 30 to 89 days as of December 31, 2012 and 2011. Loans that are delinquent 90 days or more are included in the non-accrual loans noted below.
| | | 12/31/12 | | | 12/31/11 | |
| | | (Dollars in thousands) | |
| Loans delinquent | | | | | | | | |
| 30 to 59 days | | $ | 11,036 | | | $ | 11,425 | |
| 60 to 89 days | | | 4,095 | | | | 3,142 | |
| | | | | | | | | |
| Total delinquent loans | | $ | 15,131 | | | $ | 14,567 | |
| | | | | | | | | |
| Ratio of total delinquent loans 30 to 89 days to total loans | | | 1.26 | % | | | 1.29 | % |
The following table sets forth information with respect to the Bank’s non-performing assets for the periods indicated. In addition, the Bank evaluates loans to identify those that are “impaired.” Impaired loans are those for which management has determined that it is probable that the customer will be unable to comply with the contractual terms of the loan. Loans so identified are reduced (i) to the fair value of the collateral securing the loan, (ii) to the present value of expected future cash flows, or (iii) to the market price of the loan based upon readily available information for that type of loan, by the allocation of a portion of the allowance for loan losses to the loan. As of December 31, 2012, the Bank had designated $34 million as impaired loans, and a portion of these loans were included in the non-accrual and 90 days past due and troubled debt restructurings totals below. Management evaluates for impairment all loans selected for specific review during its quarterly allowance for loan losses analysis. Generally, the impairment analysis does not address smaller balance consumer credits.
| | | At December 31, | |
| | | 2012 | | | 2011 | | | 2010 | | | 2009 | | | 2008 | |
| | | (Dollars in thousands) | |
| Loans accounted for on a non-accrual basis:(1) | | | | | | | | | | | | | | | | | | | | |
| Nonresidential real estate | | $ | 12,138 | | | $ | 6,628 | | | $ | 6,311 | | | $ | 8,588 | | | $ | 2,401 | |
| Residential real estate | | | 5,243 | | | | 5,325 | | | | 4,208 | | | | 5,113 | | | | 2,325 | |
| Construction | | | 1,075 | | | | 1,897 | | | | 5,329 | | | | 7,302 | | | | 2,778 | |
| Commercial | | | 740 | | | | 1,175 | | | | 4,749 | | | | 2,712 | | | | 588 | |
| Consumer and other | | | 48 | | | | 626 | | | | 51 | | | | 111 | | | | 119 | |
| Total | | | 19,244 | | | | 15,651 | | | | 20,648 | | | | 23,826 | | | | 8,211 | |
| Accruing loans which are contractually past due 90 days or more: | | | | | | | | | | | | | | | | | | | | |
| Nonresidential real estate | | $ | 0 | | | $ | 0 | | | $ | 68 | | | $ | 220 | | | $ | 86 | |
| Residential real estate | | | 17 | | | | 112 | | | | 263 | | | | 758 | | | | 812 | |
| Construction | | | 0 | | | | 0 | | | | 0 | | | | 682 | | | | 0 | |
| Commercial | | | 0 | | | | 74 | | | | 0 | | | | 34 | | | | 291 | |
| Consumer and other loans | | | 22 | | | | 33 | | | | 83 | | | | 42 | | | | 161 | |
| Total | | | 39 | | | | 219 | | | | 414 | | | | 1,736 | | | | 1,350 | |
| Total non-performing loans | | $ | 19,283 | | | $ | 15,870 | | | $ | 21,062 | | | $ | 25,562 | | | $ | 9,561 | |
| | | | | | | | | | | | | | | | | | | | | |
| Percentage of total loans | | | 1.61 | % | | | 1.40 | % | | | 1.90 | % | | | 2.21 | % | | | 0.93 | % |
| | | | | | | | | | | | | | | | | | | | | |
| Other real estate owned(2) | | $ | 5,396 | | | $ | 5,844 | | | $ | 795 | | | $ | 1,381 | | | $ | 712 | |
| | | | | | | | | | | | | | | | | | | | | |
| Troubled debt restructured (TDR) loans: | | | | | | | | | | | | | | | | | | | | |
| Performing troubled debt restructured (TDR) loans(3) | | $ | 6,046 | | | $ | 13,306 | | | $ | 6,135 | | | $ | 3,568 | | | $ | 575 | |
| Nonperforming trouble debt restructured (TDR) loans (included in nonaccrual loans) | | $ | 11,095 | | | $ | 1,923 | | | $ | 2,186 | | | $ | 3,831 | | | $ | 633 | |
| Total troubled debt restructured loans | | $ | 17,141 | | | $ | 15,229 | | | $ | 8,321 | | | $ | 7,399 | | | $ | 1,208 | |
| (1) | A loan is generally placed on non-accrual status if: (1) the loan becomes 90 days or more past due (120 days past due for installment loans) or (2) payment in full of both principal and interest for the loan cannot be reasonably expected.Payments received on a non-accrual loan are applied to principal, until qualifying for return to accrual method. |
| (2) | Consists of real estate acquired through foreclosure, which is carried at fair value less estimated selling expenses. |
| (3) | Consists of accruing TDR loans to borrowers experiencing financial difficulties where the Bank made certain concessionary modifications to the loan’s contractual terms such as interest rate reductions, principal forgiveness and other actions intended to minimize or eliminate the economic loss and to avoid foreclosure or repossession of collateral. TDRs accrue interest as long as the borrower complies with the modified terms. |
The amount of gross interest income that would have been recorded for nonaccrual loans in 2012 if loans had been current in accordance with their original terms was $640,000 and $420,000 for 2011.
The credit quality table detailing loans by grade, the non-performing loan table and the aging of past due table are the indicators of potential problem loans and there were no other known potential problem loans beyond what is disclosed in these tables at December 31, 2012.
Allowance for Loan Losses. While management believes that it uses the best information available to determine the allowance for loan losses, unforeseen market conditions could result in adjustments, and net earnings could be significantly affected if circumstances differ substantially from the assumptions used in making the final determination. At December 31, 2012, the Bank’s allowance for loan losses totaled $16.6 million.
On at least a quarterly basis, a formal analysis of the adequacy of the allowance is prepared and reviewed by senior management and the Bank’s Board of Directors. This analysis serves as a point in time assessment of the level of the allowance and serves as a basis for provisions for loan losses. The loan quality monitoring process includes assigning loan grades and the use of a watch list to identify loans of concern.
The analysis of the allowance for loan losses includes the allocation of specific amounts of the allowance to individual problem loans, generally based on an analysis of the collateral securing those loans. Portions of the allowance are also allocated to loans based on their risk rating with the higher the risk rating, the higher the allowance allocated to that loan. These components are added together and compared to the balance of our allowance at the evaluation date.
The following table provides an allocation of the Bank’s allowance for loan losses as of each of the following dates:
| | | | | | | | | | | | | | | | | | | | | | | | | | | | | | | |
| | | At December 31, | |
| | | 2012 | | | 2011 | | | 2010 | | | 2009 | | | 2008 | |
| | | Amount | | | Percentage of Loans in each Category to Total Loans | | | Amount | | | Percentage of Loans in each Category to Total Loans | | | Amount | | | Percentage of Loans in each Category to Total Loans | | | Amount | | | Percentage of Loans in each Category to Total Loans | | | Amount | | | Percentage of Loans in each Category to Total Loans | |
| | | (Dollars in thousands) | |
| Loan type: | | | | | | | | | | | | | | | | | | | | | | | | | | | | | | | | | | | | | | | | |
| Commercial | | $ | 2,716 | | | | 17 | % | | $ | 3,207 | | | | 17 | % | | $ | 3,440 | | | | 20 | % | | $ | 3,001 | | | | 19 | % | | $ | 1,963 | | | | 17 | % |
| Residential real estate | | | 4,272 | | | | 23 | % | | | 2,591 | | | | 24 | % | | | 2,431 | | | | 23 | % | | | 2,121 | | | | 23 | % | | | 1,387 | | | | 23 | % |
| Nonresidential real estate | | | 6,991 | | | | 48 | % | | | 7,614 | | | | 46 | % | | | 8,126 | | | | 44 | % | | | 7,090 | | | | 41 | % | | | 4,637 | | | | 42 | % |
| Construction | | | 1,964 | | | | 9 | % | | | 4,701 | | | | 9 | % | | | 3,150 | | | | 10 | % | | | 2,748 | | | | 13 | % | | | 1,797 | | | | 15 | % |
| Consumer | | | 584 | | | | 1 | % | | | 162 | | | | 2 | % | | | 166 | | | | 1 | % | | | 145 | | | | 2 | % | | | 95 | | | | 2 | % |
| Municipal obligations | | | 41 | | | | 2 | % | | | 13 | | | | 2 | % | | | 55 | | | | 2 | % | | | 48 | | | | 2 | % | | | 31 | | | | 1 | % |
| | | | | | | | | | | | | | | | | | | | | | | | | | | | | | | | | | | | | | | | | |
| Total allowance for loan losses | | $ | 16,568 | | | | 100 | % | | $ | 18,288 | | | | 100 | % | | $ | 17,368 | | | | 100 | % | | $ | 15,153 | | | | 100 | % | | $ | 9,910 | | | | 100 | % |
The Bank’s allowance for loan losses decreased from $18.3 million at December 31, 2011, to $16.6 million at December 31, 2012. Because the loan loss allowance is based on estimates, it is monitored on an ongoing basis and adjusted as necessary to provide an adequate allowance. For further discussion on the allowance for loan losses see “Management’s Discussion and Analysis of Financial Condition and Results of Operations” of this Annual Report.
Investment Activities
The investment policy of the Bank is both to manage the utilization of excess funds and to provide for the liquidity needs of the Bank as loan demand and daily operations dictate. The Bank’s federal income tax position is also a consideration in its investment decisions. Investments in tax-exempt securities with maturities of less than 10 years are considered when the net yield exceeds that of taxable securities and the Bank’s effective tax rate warrants such investments.
The following table sets forth the composition of the Bank’s securities portfolio, at the dates indicated:
| | | At December 31, | |
| | | 2012 | | | 2011 | | | 2010 | |
| | | Amortized Cost | | | Fair Value | | | Amortized Cost | | | Fair Value | | | Amortized Cost | | | Fair Value | |
| | | (Dollars in thousands) | |
| Held-to-maturity securities: | | | | | | | | | | | | | | | | | | | | | | | | |
| | | | | | | | | | | | | | | | | | | | | | | | | |
| Municipal and other obligations | | $ | 66,843 | | | $ | 68,504 | | | $ | 48,975 | | | $ | 50,643 | | | $ | 39,778 | | | $ | 40,262 | |
| | | | | | | | | | | | | | | | | | | | | | | | | |
| Total held-to-maturity securities | | $ | 66,843 | | | $ | 68,504 | | | $ | 48,975 | | | $ | 50,643 | | | $ | 39,778 | | | $ | 40,262 | |
| | | | | | | | | | | | | | | | | | | | | | | | | |
| Available-for-sale securities: | | | | | | | | | | | | | | | | | | | | | | | | |
| | | | | | | | | | | | | | | | | | | | | | | | | |
| U.S. Government, Federal Agency and Government Sponsored Enterprises | | $ | 127,416 | | | $ | 128,477 | | | $ | 168,104 | | | $ | 169,460 | | | $ | 145,536 | | | $ | 145,067 | |
| U.S. Government Mortgage-Backed | | | 180,019 | | | | 184,907 | | | | 148,329 | | | | 151,992 | | | | 97,429 | | | | 99,256 | |
| Corporate obligations | | | 1,060 | | | | 1,060 | | | | 1,060 | | | | 1,060 | | | | 1,125 | | | | 1,125 | |
| | | | | | | | | | | | | | | | | | | | | | | | | |
| Total available-for-sale securities | | $ | 308,495 | | | $ | 314,444 | | | $ | 317,493 | | | $ | 322,512 | | | $ | 244,090 | | | $ | 245,448 | |
The following table sets forth the amortized cost of the Bank’s securities portfolio at December 31, 2012 by contractual or expected maturity. Securities with call features are presented at call date if management expects that option to be exercised.
| | | Maturing within
one year | | | Maturing after one
and within five years | | | Maturing after five
and within ten years | | | Maturing after
ten years | | | Total | |
| | | Amortized
Cost | | | Average
Yield | | | Amortized
Cost | | | Average
Yield | | | Amortized
Cost | | | Average
Yield | | | Amortized
Cost | | | Average
Yield | | | Amortized
Cost | | | Average
Yield | |
| (Dollars in thousands) |
| Held-to-maturity: | | | | | | | | | | | | | | | | | | | | | | | | | | | | | | | | | | | | | | | | |
| Municipal and other obligations (1) | | $ | 3,015 | | | | 2.67 | % | | $ | 34,949 | | | | 3.17 | % | | $ | 28,879 | | | | 2.99 | % | | $ | - | | | | - | % | | $ | 66,843 | | | | 3.07 | % |
| | | | | | | | | | | | | | | | | | | | | | | | | | | | | | | | | | | | | | | | | |
| Available- for- sale: | | | | | | | | | | | | | | | | | | | | | | | | | | | | | | | | | | | | | | | | |
| Corporate obligations | | | - | | | | 0.00 | % | | | - | | | | 0.00 | % | | | 1,060 | | | | 0.43 | % | | | - | | | | - | | | | 1,060 | | | | 0.43 | % |
| U.S. Government, Federal Agency and Government Sponsored Enterprises | | | 64,653 | | | | 1.45 | % | | | 62,762 | | | | 1.51 | % | | | - | | | | 0.00 | % | | | - | | | | - | | | | 127,415 | | | | 1.48 | % |
| U.S. Government Mortgage-Backed | | | 37,245 | | | | 2.47 | % | | | 94,997 | | | | 2.29 | % | | | 47,778 | | | | 2.43 | % | | | - | | | | - | | | | 180,020 | | | | 2.36 | % |
| Totals | | $ | 104,913 | | | | 1.85 | % | | $ | 192,708 | | | | 2.20 | % | | $ | 77,717 | | | | 2.61 | % | | $ | - | | | | - | % | | $ | 375,338 | | | | 2.18 | % |
_________________________
(1) Yield stated on a tax-equivalent basis using a 35% effective rate.
Deposits and Borrowings
General.Deposits have traditionally been the primary source of the Bank’s funds for use in lending and other investment activities. In addition to deposits, the Bank derives funds from interest payments and principal repayments on loans and income on earning assets. Loan payments are a relatively stable source of funds, while deposit inflows and outflows fluctuate more in response to economic conditions and interest rates. The Bank has lines of credit established at its major correspondent banks to purchase federal funds to meet liquidity needs. The Bank may also borrow funds from the FHLB in the form of advances.
The Bank also uses retail repurchase agreements as a source of funds. These agreements essentially represent borrowings by the Bank from customers with maturities of three months or less. Certain securities are pledged as collateral for these agreements. At December 31, 2012, the Bank had $21.4 million in retail repurchase agreements.
The Bank also entered into a capital lease obligation for a branch in 1997 with a term of 20 years and a monthly payment of $4,000.
Deposits. Deposits are attracted principally from within the Bank’s designated lending area through the offering of numerous deposit instruments, including regular passbook savings accounts, negotiable order of withdrawal (“NOW”) accounts, money market deposit accounts, term certificate accounts and individual retirement accounts (“IRAs”). Interest rates paid, maturity terms, service fees and withdrawal penalties for the various types of accounts are established periodically by the Bank’s Board of Directors based on the Bank’s liquidity requirements, growth goals and market trends. The Bank may on occasion use brokers to attract deposits. The Bank did not have brokered deposits as of December 31, 2012.
The following table presents the amount of the Bank’s jumbo certificates of deposit with principal balances greater than $100,000 by the time remaining until maturity as of December 31, 2012:
| Maturity | | At December 31, 2012 | |
| | | (In thousands) | |
| | | | |
| Three months or less | | $ | 25,871 | |
| Over 3 months to 6 months | | | 34,573 | |
| Over 6 months to 12 months | | | 31,998 | |
Over 12 months
| | | 41,185 | |
| | | | | |
| Total | | $ | 133,627 | |
The following table presents the average daily deposits for the years ended December 31, 2012, 2011 and 2010, and the average rates paid on those deposits are summarized in the following table:
| | | At December 31, | |
| | | 2012 | | | 2011 | | | 2010 | |
| | | Average Balance | | | Average Rate paid | | | Average Balance | | | Average Rate paid | | | Average Balance | | | Average Rate paid | |
| | | (Dollars in thousands) | |
| Demand deposits | | $ | 290,654 | | | | 0.00 | % | | $ | 251,033 | | | | 0.00 | % | | $ | 208,017 | | | | 0.00 | % |
| | | | | | | | | | | | | | | | | | | | | | | | | |
| Savings and transaction accounts: | | | | | | | | | | | | | | | | | | | | | | | | |
| Savings | | | 372,201 | | | | 0.20 | % | | | 350,755 | | | | 0.33 | % | | | 338,915 | | | | 0.51 | % |
| Interest bearing checking | | | 447,714 | | | | 0.22 | % | | | 385,568 | | | | 0.32 | % | | | 340,682 | | | | 0.38 | % |
| | | | | | | | | | | | | | | | | | | | | | | | | |
| Time deposits: | | | | | | | | | | | | | | | | | | | | | | | | |
| Deposits of $100,000 or more | | | 135,055 | | | | 0.86 | % | | | 137,210 | | | | 1.30 | % | | | 149,814 | | | | 1.93 | % |
| Other time deposits | | | 243,056 | | | | 0.98 | % | | | 282,816 | | | | 1.43 | % | | | 300,898 | | | | 2.05 | % |
| | | | | | | | | | | | | | | | | | | | | | | | | |
| Total deposits | | $ | 1,488,680 | | | | 0.35 | % | | $ | 1,407,382 | | | | 0.59 | % | | $ | 1,338,326 | | | | 0.90 | % |
Short-Term Borrowings.In addition to repurchase agreements, the Bank has agreements with correspondent banks to purchase federal funds on an as needed basis to meet liquidity needs.
The following table sets forth the maximum month-end balance amount of the Bank’s outstanding short-term borrowings during the years ended December 31, 2012, 2011 and 2010, along with the average aggregate balances of the Bank’s outstanding short-term borrowings for such periods:
| | | During year ended December 31, | |
| | | 2012 | | | 2011 | | | 2010 | |
| | | (Dollars in thousands) | |
| | | | | | | | | | |
| Maximum balance at any month-end during the period | | $ | 41,408 | | | $ | 29,300 | | | $ | 36,175 | |
| | | | | | | | | | | | | |
| Average balance | | | 26,060 | | | | 25,378 | | | | 22,532 | |
| | | | | | | | | | | | | |
| Weighted average interest rate | | | 0.30 | % | | | 0.41 | % | | | 0.60 | % |
The following table sets forth certain information as to short-term borrowings at the dates indicated:
| | | December 31, | |
| | | 2012 | | | 2011 | | | 2010 | |
| Short-term borrowings outstanding | | $ | 41,408 | | | $ | 29,300 | | | $ | 23,419 | |
| Weighted average interest rate | | | 0.26 | % | | | 0.31 | % | | | 0.53 | % |
Asset/Liability Management. The Bank’s earnings depend primarily upon its net interest income, which is the difference between its interest income on its interest-earning assets, such as mortgage loans and investment securities, and its interest expense paid on its interest-bearing liabilities, consisting of deposits and borrowings. As market interest rates change, asset yields and liability costs do not change simultaneously. Due to maturity, re-pricing and timing differences of interest-earning assets and interest-bearing liabilities, earnings will be affected differently under various interest rate scenarios. The Bank has sought to limit these net income fluctuations and manage interest rate risk by originating adjustable-rate loans and purchasing relatively short-term and variable-rate investments and securities.
The Bank’s interest rate spread is the principal determinant of the Bank’s net interest income. The interest rate spread can vary considerably over time because asset and liability re-pricing do not coincide. Moreover, the long-term and cumulative effect of interest rate changes can be substantial. Interest rate risk is defined as the sensitivity of an institution’s earnings and net asset values to changes in interest rates.
The ability to maximize net interest income is largely dependent upon sustaining a positive interest rate spread during fluctuations in the prevailing level of interest rates. Interest rate sensitivity is a measure of the difference between amounts of interest-earning assets and interest-bearing liabilities, which either re-price or mature within a given period of time. The difference, or the interest rate re-pricing “gap,” provides an indication of the extent to which a financial institution’s interest rate spread will be affected by changes in interest rates. A positive gap occurs when interest-earning assets exceed interest-bearing liabilities re-pricing during a designated time frame. Conversely, a negative gap occurs when interest-bearing liabilities exceed interest-earning assets re-pricing within a designated time frame. Generally, during a period of rising interest rates, a negative gap would adversely affect net interest income, while a positive gap would result in an increase in net interest income, and during a period of falling interest rates, a negative gap would result in an increase in net interest income, while a positive gap would have the opposite effect.
In recognition of the foregoing factors, the management and the Board of Directors of the Bank have implemented an asset and liability management strategy directed toward maintaining a reasonable degree of interest rate sensitivity. The principal elements of such strategy include: (i) meeting the consumer preference for fixed-rate loans by establishing a correspondent lending program that has enabled the Bank to originate and sell fixed-rate mortgage loans; (ii) maintaining relatively short weighted-average terms to maturity in the securities portfolio as a hedge against rising interest rates; (iii) emphasizing the origination and retention of adjustable-rate loans; and (iv) utilizing longer term certificates of deposit as funding sources when available. Management and the Board of Directors monitor the Bank’s exposure to interest rate risk on a monthly basis to ensure the interest rate risk is maintained within an acceptable range. For more information on the Bank’s interest rate risk see the “Asset/Liability Management and Market Risk” section of “Item 7A. Quantitative and Qualitative Disclosure about Market Risk”.
The following table sets forth the amounts of the Bank’s interest-earning assets and interest-bearing liabilities outstanding at December 31, 2012, which are scheduled to re-price or mature in each of the time periods shown. The amounts of assets and liabilities shown which re-price or mature in a given period were determined in accordance with the contractual terms of the asset or liability. The table shows that the maturity or re-pricing of the Bank’s liabilities exceed the contractual terms to maturity or re-pricing of the Bank’s earning assets in a twelve-month period by $124 million.
| | | Within 3 months | | | 4 - 12 months | | | 1 through 5 years | | | Over 5 years | | | Total | |
| | | (Dollars in thousands) | | | | |
| Interest-earning assets: | | | | | | | | | | | | | | | | | | | | |
| Federal funds sold | | $ | 76,062 | | | $ | - | | | $ | - | | | $ | - | | | $ | 76,062 | |
| Interest bearing deposits with banks | | | - | | | | - | | | | 250 | | | | - | | | | 250 | |
| Securities | | | 32,714 | | | | 78,397 | | | | 185,876 | | | | 89,399 | | | | 386,386 | |
| Loans receivable (1) | | | 647,747 | | | | 227,505 | | | | 308,955 | | | | 28,401 | | | | 1,212,608 | |
| | | | | | | | | | | | | | | | | | | | | |
| Total interest-earning assets | | | 756,523 | | | | 305,902 | | | | 495,081 | | | | 117,800 | | | | 1,675,306 | |
| | | | | | | | | | | | | | | | | | | | | |
| Interest-bearing liabilities: | | | | | | | | | | | | | | | | | | | | |
| Savings deposits | | | 122,468 | | | | - | | | | - | | | | - | | | | 122,468 | |
| Money market deposit accounts | | | 237,841 | | | | - | | | | - | | | | - | | | | 237,841 | |
| NOW accounts | | | 498,699 | | | | - | | | | - | | | | - | | | | 498,699 | |
| Certificates of deposit | | | 57,766 | | | | 147,397 | | | | 93,767 | | | | 107 | | | | 299,037 | |
| IRAs | | | 14,469 | | | | 23,114 | | | | 22,415 | | | | 26 | | | | 60,024 | |
| Federal funds purchased | | | 20,000 | | | | - | | | | - | | | | - | | | | 20,000 | |
| Repurchase agreements | | | 21,408 | | | | - | | | | - | | | | - | | | | 21,408 | |
| Notes payable | | | 38,000 | | | | 5,000 | | | | 5,000 | | | | 715 | | | | 48,715 | |
| | | | | | | | | | | | | | | | | | | | | |
| Total interest-bearing liabilities | | | 1,010,651 | | | | 175,511 | | | | 121,182 | | | | 848 | | | | 1,308,192 | |
| | | | | | | | | | | | | | | | | | | | | |
| Interest-earning assets less interest-bearing liabilities | | $ | (254,128 | ) | | $ | 130,391 | | | $ | 373,899 | | | $ | 116,952 | | | $ | 367,114 | |
| | | | | | | | | | | | | | | | | | | | | |
| Cumulative interest-rate sensitivity gap | | $ | (254,128 | ) | | $ | (123,737 | ) | | $ | 250,162 | | | $ | 367,114 | | | | | |
| | | | | | | | | | | | | | | | | | | | | |
| Cumulative interest-rate gap as a percentage of total interest earning assets | | | (15.17 | )% | | | (7.39 | )% | | | 14.93 | % | | | 21.91 | % | | | | |
(1) Excludes the allowance for loan losses, in process accounts and purchase accounting adjustments.
Competition
There is significant competition within the banking and financial services industry in northern Kentucky, which is the primary market in which the Bank operates. Changes in regulation, technology and product delivery systems have resulted in an increasingly competitive environment. The Bank expects to continue to face increasing competition from online and traditional financial institutions seeking to attract customers by providing access to similar services and products.
Some of the institutions which compete with the Bank are among the largest financial institutions in the United States. Any actual intervention or assistance to these competitors made by the U.S. federal government, as well as the perception that such assistance would be forthcoming if needed, could have the effect of eroding any competitive advantages of the Bank in the markets in which it operates. Within the northern Kentucky and greater Cincinnati, Ohio markets, the Bank competes with approximately six financial institutions with over $50 billion in total assets, as well as numerous state chartered banking institutions of comparable or larger size and resources and smaller community banking organizations. The Bank also has numerous local, regional and national nonbank competitors, including savings and loan associations, credit unions, mortgage companies, insurance companies, finance companies, financial service operations of major retailers, investment brokerage and financial advisory firms and mutual fund companies. Because nonbank financial institutions are not subject to the same regulatory restrictions as banks and bank holding companies, they can often operate with greater flexibility and lower cost structures. Currently, the Bank does not face meaningful competition from international banks in its market, although that could change in the future.
The Bank competes for deposits primarily with other commercial banks, savings associations and credit unions and with the issuers of commercial paper and other securities, such as shares in money market mutual funds. The primary factors in competing for deposits are interest rates and convenience of office locations. The Bank competes for making loans primarily with other banks, savings associations, consumer finance companies, credit unions, leasing companies and other nonbank competitors. The Bank competes for loan originations primarily through the interest rates and loan fees it charges and through the efficiency and quality of services it provides to borrowers. Competition for loans is affected by, among other things, the general availability of lendable funds, general and local economic conditions, current interest rate levels and other factors that are not readily predictable.
Due to the Bank’s size relative to the many other financial institutions in its market, management believes that the Bank does not have a substantial share of the deposit and loan markets. The table below presents FDIC deposit data regarding the Bank’s deposit market share. The June 2012 data set forth below are the most current data available from the FDIC at this time and represents those counties in which the Bank has reported market share for deposits.
Bank Deposit Market Share
($ in thousands)
| Market (1) | | June 2012 Deposits | | | Deposit Market Share | |
| Boone County, Kentucky | | $ | 503,456 | | | | 24,74 | % |
| Campbell County, Kentucky | | | 189,587 | | | | 14.38 | % |
| Gallatin County, Kentucky | | | 26,747 | | | | 59.82 | % |
| Grant County, Kentucky | | | 60,745 | | | | 23.76 | % |
| Kenton County, Kentucky | | | 636,197 | | | | 28.09 | % |
| Pendleton County, Kentucky | | | 22,857 | | | | 16.10 | % |
| | | | | | | | | |
| Hamilton County Ohio | | | 16,752 | | | | 0.03 | % |
___________________
(1)Source: FDIC
Services provided by the Bank’s trust division face competition from many national, regional and local financial institutions. Companies that offer broad services similar to those provided by the Bank, such as other banks, trust companies and full service brokerage firms, as well as companies that specialize in particular services offered by the Bank, such as investment advisors and mutual fund providers, all compete with the Bank’s trust division.
The Bank’s ability to compete effectively is a result of being able to provide customers with desired products and services in a convenient and cost effective manner. Customers for commercial, consumer and mortgage banking as well as trust services are influenced by convenience, quality of service, personal contacts, availability of products and services and related pricing. The Bank continually reviews its products, locations, alternative delivery channels and pricing strategies to maintain and enhance its competitive position. Management believes it can compete effectively as a result of local market knowledge and awareness of, and attention to, customer needs.
Employees
As of December 31, 2012, the Bank had 317 full-time employees and 72 part-time employees. The Bank believes that relations with its employees are good. None of the employees of the Bank are represented by a labor union or subject to a collective bargaining agreement.
Regulation and Supervision
The following discussion describes elements of an extensive regulatory framework applicable to bank holding companies and banks and specific information about BKFC. Federal and state regulation of banks and their holding companies is intended primarily for the protection of depositors and the Deposit Insurance Fund (“DIF”), rather than for the protection of shareholders and creditors. A change in statutes, regulations or policies could have a material impact on the business of BKFC and its subsidiaries, including changes resulting from the passage of the Dodd-Frank Act in 2010 and the implementation of rulemaking under the Dodd-Frank Act that has continued through 2012, as described in more detail below. BKFC and its subsidiaries may also be affected by future legislation and rulemaking that can change banking statutes in substantial and unexpected ways and by the actions of the Board of Governors of the Federal Reserve System (the “FRB”) as it attempts to control the money supply and credit availability in order to influence the economy.
Regulation of BKFC. BKFC is a bank holding company subject to regulation by the FRB under the Bank Holding Company Act of 1956, as amended (“BHCA”). As a bank holding company, BKFC is required to file periodic reports with, and is subject to the regulation, supervision and examination by, the FRB. Such examination by the FRB determines whether BKFC is operating in accordance with various regulatory requirements and in a safe and sound manner. The FRB may initiate enforcement proceedings against BKFC for violations of laws or regulations or for engaging in unsafe and unsound practices, particularly if such conduct could or does adversely impact the Bank. BKFC is also subject to the disclosure and regulatory requirements of the Securities Act of 1933, as amended, and the Securities Exchange Act of 1934, as amended, as administered by the SEC.
Under the BHCA, the FRB’s prior approval is required in any case in which BKFC proposes to acquire all or substantially all of the assets of any bank, acquire direct or indirect ownership or control of more than 5% of the voting shares of any bank, or merge or consolidate with any other bank holding company. The BHCA also prohibits, with certain exceptions, BKFC from acquiring direct or indirect ownership or control of more than 5% of any class of voting shares of any non-banking company. Under the BHCA, BKFC may not engage in any business other than managing and controlling banks or furnishing certain specified services to subsidiaries and may not acquire voting control of non-banking companies unless the FRB determines such businesses and services to be closely related to banking.When reviewing bank acquisition applications for approval, the FRB considers, among other things, each subsidiary bank’s record in meeting the credit needs of the communities it serves in accordance with the Community Reinvestment Act of 1977, as amended (the “CRA”). The Bank has a current CRA rating of “satisfactory.”In addition, the FRB could require that BKFC terminate any activity, if the FRB deems the activity to constitute a serious risk to the financial soundness of the Bank.
It is the policy of the FRB that a bank holding company be ready and able to use its resources to provide capital to its subsidiary banks during periods of financial stress or adversity. The FRB could require BKFC to provide such support at times when BKFC lacks the resources to do so. See “Regulatory Capital Requirements” and “Dividend Restrictions” regarding minimum capital levels to which BKFC is subject and regulatory limits on BKFC’s ability to pay dividends to shareholders. As a bank holding company, BKFC must notify the FRB if, during any one-year period, it seeks to redeem shares of stock in an amount such that total redemptions during the year, net of sales of shares, would be greater than 10% of BKFC’s net worth.
Regulation of the Bank.The Bank is a Kentucky-chartered bank with FDIC deposit insurance. The Bank is subject to numerous federal and state statutes and regulations regarding the conduct of its business, including, among other things, maintenance of reserves against deposits; capital adequacy; restrictions on the nature and amount of loans which may be made and the interest which may be charged thereon; restrictions on the terms of loans to officers, directors, large shareholders and their affiliates; restrictions relating to investments and other activities; and requirements regarding mergers and branching activities.
The Bank is subject to the regulation, supervision and examination by the Department and the FDIC. Both the Department and the FDIC have the authority to issue cease-and-desist orders if either determines that the activities of the Bank represent unsafe and unsound banking practices. If the grounds provided by law exist, the Department or the FDIC may appoint a conservator or receiver for the Bank.
State-chartered banks, like the Bank, are subject to regulatory oversight under various consumer protection and fair lending laws. These laws govern, among other things, truth-in-lending disclosure, equal credit opportunity, fair credit reporting and community reinvestment. Failure to abide by federal laws and regulations governing community reinvestment could limit the ability of a state-chartered bank to open a new branch or engage in a merger transaction.
The Bank is subject to the guidance on sound risk management practices for concentrations in commercial real estate lending set forth by the Office of the Comptroller of the Currency, the FRB and the FDIC. The guidance is intended to help ensure that institutions pursuing a significant commercial real estate lending strategy remain healthy and profitable while continuing to serve the credit needs of their communities. Also, this guidance directs institutions in developing risk management practices and levels of capital that are commensurate with the level and nature of their commercial real estate concentrations.
Kentucky law limits loans or other extensions of credit to any borrower to 20% of the Bank’s paid-in capital and actual surplus. Such limit is increased to 30% if the borrower provides good collateral security or executes to it a mortgage upon real or personal property with a cash value exceeding the amount of the loan. Loans or extensions of credit to certain borrowers are aggregated, and loans secured by certain government obligations are exempt from these limits. At December 31, 2012, the maximum the Bank could lend to any one borrower generally equaled $23 million and equaled $34 million if the borrower provided collateral with a cash value in excess of the amount of the loan. Federal banking laws and regulations also limit the transfer of funds or other items of value, including pursuant to the provision of loans, from banks to their affiliates.
Generally, the Bank’s permissible activities and investments are prescribed by Kentucky law. However, state-chartered banks, including the Bank, may not, directly or through a subsidiary, engage in activities or make any investments as principal not permitted for a national bank, a bank holding company or a subsidiary of a nonmember bank, unless they obtain FDIC approval.
The Dodd-Frank Act.The Dodd-Frank Act represents a significant overhaul of many aspects of the regulation of the financial-services industry. The Dodd-Frank Act implements numerous and far-reaching changes that affect financial companies, including banks and bank holding companies such as BKFC by, among other things:
| · | centralizing responsibility for consumer financial protection by creating a new independent agency, the Consumer Financial Protection Bureau, with responsibility for implementing, enforcing and examining for compliance with federal consumer financial laws; |
| · | applying the same leverage and risk-based capital requirements that apply to insured depository institutions to bank holding companies; |
| · | requiring the FDIC to seek to make its capital requirements for banks countercyclical so that the amount of capital required to be maintained increases in times of economic expansion and decreases in times of economic contraction; |
| · | changing the assessment base for federal deposit insurance from the amount of insured deposits to consolidated assets less tangible capital; |
| · | implementing corporate governance revisions, including with regard to executive compensation and proxy access by shareholders, that apply to all public companies, not just financial institutions; |
| · | making permanent the $250,000 limit for federal deposit insurance and increasing the cash limit of Securities Investor Protection Corporation protection from $100,000 to $250,000, and providing unlimited federal deposit insurance until December 31, 2012, for non-interest-bearing demand transaction accounts at all insured depository institutions; and |
| · | repealing the federal prohibitions on the payment of interest on demand deposits, thereby permitting depository institutions to pay interest on business transaction and other accounts. |
The majority of the provisions in the Dodd-Frank Act are aimed at financial institutions that are significantly larger than BKFC or the Bank. Nonetheless, there are provisions with which we will have to comply now that the Dodd-Frank Act is signed into law. Among many other legislative changes that BKFC will assess, BKFC will experience a new assessment model from the FDIC based on assets, not deposits, and be subject to enhanced executive compensation and corporate governance requirements. Many aspects of the Dodd-Frank Act are subject to further rulemaking and will take effect over several years, making it difficult to anticipate the overall financial impact on BKFC and the Bank. However, compliance with this law and its implementing regulations has resulted, and will continue to result, in additional operating costs that could have a material adverse effect on our future financial condition and results of operations.
Emergency Economic Stabilization Act of 2008. The Emergency Economic Stabilization Act of 2008 (the “EESA”) was enacted on October 3, 2008. The EESA authorized the Secretary of the Treasury Department (the “Secretary”) to purchase or guarantee up to $700 billion in troubled assets from financial institutions under TARP. Pursuant to authority granted under the EESA, the Secretary created the TARP CPP under which the Treasury Department was authorized to invest up to $250 billion in senior preferred stock of U.S. banks and savings associations or their holding companies. The Treasury Department’s authority to make new investments under the CPP expired in October 2010.
CPP Participation.On February 13, 2009, BKFC issued 34,000 shares of Series A Preferred Stock for a total price of $34 million pursuant to a Letter Agreement with the Treasury Department (the “Purchase Agreement”). On November 23, 2011, BKFC repurchased the final $17 million outstanding Series A Preferred Stock held by the Treasury Department. Accordingly, BKFC no longer is subject to the restrictions applicable to CPP participants.
As part of its purchase of the Series A Preferred Stock, the Treasury Department received the Warrant to purchase 274,784 shares of Common Stock at an initial per share exercise price of $18.56, which remains outstanding. The Warrant provides for the adjustment of the exercise price and the number of shares of Common Stock issuable upon exercise pursuant to customary anti-dilution provisions, such as upon stock splits or distributions of securities or other assets to holders of Common Stock, and upon certain issuances of Common Stock at or below a specified price relative to the initial exercise price. The Warrant expires ten years from the issuance date. Pursuant to the Purchase Agreement, the Treasury Department has agreed not to exercise voting power with respect to any shares of Common Stock issued upon exercise of the Warrant.
Both the Series A Preferred Stock and the Warrant were accounted for as components of Tier 1 capital.
Regulatory Capital Requirements. The FRB has adopted risk-based capital guidelines for bank holding companies. Such companies must maintain adequate consolidated capital to meet the minimum ratio of total capital to risk-weighted assets (including certain off-balance-sheet items, such as standby letters of credit) (the “Total Risk-Based Ratio”) of 8%. At least half of the minimum-required total capital of 8% must be composed of Tier 1 Capital, which consists of common shareholders’ equity, minority interests in the equity of consolidated subsidiaries and a limited amount of perpetual preferred stock, less goodwill and certain other intangibles (“Tier 1 Risk-Based Ratio”). The remainder of total capital may consist of subordinated and qualifying convertible debt, other preferred stock and a limited amount of loan and lease loss allowances.
The FRB also has established minimum leverage ratio guidelines for bank holding companies. The guidelines provide for a minimum ratio of Tier 1 Capital to average total assets (excluding the loan and lease loss allowance, goodwill and certain other intangibles, and portions of certain nonfinancial equity investments) (the “Leverage Ratio”) of 3% for bank holding companies that meet specified criteria, including having the highest regulatory rating. All other bank holding companies must maintain a Leverage Ratio of 4% to 5%. The guidelines further provide that bank holding companies making acquisitions are expected to maintain strong capital positions substantially above the minimum supervisory levels.
The Bank is subject to similar capital requirements, and such capital requirements are imposed and enforced by the FDIC.
As part of the Dodd-Frank Act, provisions were added that require federal banking agencies to develop capital requirements that address systemically risky activities. The effect of these capital rules are such that trust preferred securities issued by a company, such as BKFC, with total consolidated assets of less than $15 billion before May 19, 2010 and treated as regulatory capital are grandfathered, but any such securities issued later are not eligible as regulatory capital. The banking regulators must develop regulations setting minimum risk-based and leverage capital requirements for holding companies and banks on a consolidated basis that are no less stringent than the generally applicable requirements in effect for depository institutions under the prompt corrective action regulations discussed below. The banking regulators also must seek to make capital standards countercyclical so that the required levels of capital increase in times of economic expansion and decrease in times of economic contraction.
Basel III. In 2010, the Group of Governors and Heads of Supervisors of the Basel Committee on Banking Supervision, the oversight body of the Basel Committee, published its “calibrated” capital standards for major banking institutions (“Basel III”). Under these standards, when fully phased in, banking institutions will be required to maintain heightened Tier 1 common equity, Tier 1 capital and total capital ratios, as well as maintaining a “capital conservation buffer.” As proposed, Basel III provides for the Tier 1 common equity and Tier 1 capital ratio requirements to be phased in incrementally between January 1, 2013 and January 1, 2015; the deductions from common equity made in calculating Tier 1 common equity (for example, for mortgage servicing assets, deferred tax assets and investments in unconsolidated financial institutions) to be phased in incrementally over a four-year period commencing on January 1, 2014; and the capital conservation buffer to be phased in incrementally between January 1, 2016 and January 1, 2019. The Basel Committee also announced that a “countercyclical buffer” of 0% to 2.5% of common equity or other fully loss-absorbing capital “will be implemented according to national circumstances” as an “extension” of the conservation buffer. The final package of Basel III reforms were approved by the G20 leaders in November 2010 and are subject to individual adoption by member nations, including the United States. While Basel III is intended to be implemented on a global basis beginning January 1, 2013, to be fully phased in by January 1, 2019, on November 9, 2012 the FRB, FDIC, and Office of the Comptroller of the Currency (“OCC”) issued a joint release announcing that the implementation of the proposed rules under Basel III in the U.S. would be delayed.
U.S. Implementation of Basel III.On June 12, 2012, the FRB, FDIC, and OCC issued a joint release announcing three separate notices of proposed rulemaking (“NPRs”) seeking comment on proposed rules that would revise and replace their current capital rules in a manner consistent both with relevant provisions of the Dodd-Frank Act as well as the implementation of Basel III. The comment period on these NPRs ended on October 22, 2012. Also on June 12, 2012, these agencies announced the finalization of their market risk capital rule proposed in 2011.
One NPR (the “Basel III NPR”) proposes the majority of the revisions to international capital standards in Basel III, including a more restrictive definition of regulatory capital, higher minimum regulatory capital requirements, and the imposition of capital conservation and countercyclical capital buffers. It also proposes limitations on certain distributions and discretionary bonuses as well as revisions to the agencies’ prompt corrective action regulations. Another NPR (the “Standardized Approach NPR”) proposes new methodologies for determining risk-weighted assets, such as by expanding the number and type of exposure categories, providing a more comprehensive recognition of collateral and guarantees, and introducing or applying more risk-sensitive treatment for certain exposures (including certain high-volatility commercial real estate, corporate, equity, foreign, securitization, derivative, residential mortgage, and 90 day or more past due exposures). It also proposes detailed qualitative and quantitative public disclosure requirements relating to capital adequacy. The final NPR (the “Advanced Approaches NPR”) proposes to revise the current advanced approaches risk-based capital rule to incorporate certain aspects of Basel III as well as certain other revisions to the Basel capital framework published by the Basel Committee between 2009 and 2011. While BKFC and the Bank are subject to the Basel III and Standardized Approach NPRs, they are not subject to the Advanced Approaches NPR.
Final adoption of the NPRs has been delayed as a result of the actions of the FRB, FDIC and OCC delaying the implementation of Basel III in the U.S. as described above.
If the foregoing revised capital standards are adopted in their current form, BKFC estimates these standards would have a negligible impact on BKFC’s ability to comply with the revised regulatory capital ratios based on BKFC’s current understanding of the revisions to capital qualification. The regulations ultimately applicable to financial institutions may be substantially different from the Basel III final framework as described above and the NPRs. Management will continue to monitor these and any future proposals submitted by applicable regulators.
The following table sets forth the Tier 1 Risk-Based Ratio, Total Risk-Based Ratio and Leverage Ratio for BKFC and the Bank at December 31, 2012:
| | | At December 31, 2012 | |
| | | BKFC | | | Bank | |
| | | Amount | | | Percent | | | Amount | | | Percent | |
| | | (Dollars in thousands) | |
| Tier 1 risk-based | | $ | 156,988 | | | | 10.76 | % | | $ | 156,113 | | | | 10.71 | % |
| Requirement | | | 58,346 | | | | 4.00 | | | | 58,299 | | | | 4.00 | |
| Excess | | $ | 98,642 | | | | 6.76 | % | | $ | 97,814 | | | | 6.71 | % |
| | | | | | | | | | | | | | | | | |
| Total risk-based | | $ | 193,556 | | | | 13.27 | % | | $ | 192,681 | | | | 13.22 | % |
| Requirement | | | 116,692 | | | | 8.00 | | | | 116,599 | | | | 8.00 | |
| Excess | | $ | 76,864 | | | | 5.27 | % | | $ | 76,082 | | | | 5.22 | % |
| | | | | | | | | | | | | | | | | |
| Leverage ratio | | $ | 156,988 | | | | 9.00 | % | | $ | 156,113 | | | | 8.98 | % |
| Requirement | | | 69,810 | | | | 4.00 | | | | 69,539 | | | | 4.00 | |
| Excess | | $ | 87,178 | | | | 5.00 | % | | $ | 86,574 | | | | 4.98 | % |
The FDIC may require an increase in a bank’s risk-based capital requirements on an individualized basis to address the bank’s exposure to a decline in the economic value of its capital due to a change in interest rates, among other things.
Prompt Corrective Regulatory Action. The FDIC has adopted regulations governing prompt corrective action to resolve the problems of capital deficient and otherwise troubled banks under its regulation. For these purposes, the law establishes three categories of capital deficient institutions: undercapitalized, significantly undercapitalized and critically undercapitalized. At each successively lower defined capital category, an institution is subject to more restrictive and numerous mandatory or discretionary regulatory actions or limits, and the FDIC has less flexibility in determining how to resolve the problems of the institution. The FDIC generally can downgrade an institution’s capital category, notwithstanding its capital level, if, after notice and opportunity for hearing, the institution is deemed to be engaging in an unsafe or unsound practice because it has not corrected deficiencies that resulted in it receiving a less than satisfactory examination rating on matters other than capital or it is deemed to be in an unsafe or unsound condition. An undercapitalized institution must submit a capital restoration plan to the FDIC within 45 days after it becomes undercapitalized. Such institution will be subject to increased monitoring and asset growth restrictions and will be required to obtain prior approval for acquisitions, branching and engaging in new lines of business. Furthermore, critically undercapitalized institutions must be placed in conservatorship or receivership within 270 days of reaching that capitalization level, except under limited circumstances. At year-end 2012, the most recent regulatory notifications categorized the Bank as well capitalized under the regulatory framework for prompt corrective action. There are no conditions or events since that notification that management believes have changed the institution's category.
The FDIC has adopted regulations to implement the prompt corrective action legislation. An institution is deemed to be “well capitalized” if it has a Total Risk-Based Ratio of 10% or greater, a Tier 1 Risk-Based Ratio of 6% or greater, and a Leverage Ratio of 5% or greater. An institution is “adequately capitalized” if it has a Total Risk-Based Ratio of 8% or greater, a Tier 1 Risk-Based Ratio of 4% or greater and generally a Leverage Ratio of 4% or greater. An institution is “undercapitalized” if it has a Total Risk-Based Ratio of less than 8%, a Tier 1 Risk-Based Ratio of less than 4%, or generally a Leverage Ratio of less than 4% (3% or less for institutions with the highest examination rating). An institution is deemed to be “significantly undercapitalized” if it has a Total Risk-Based Ratio of less than 6%, a Tier 1 Risk-Based Ratio of less than 3%, or a Leverage Ratio of less than 3%. An institution is considered to be “critically undercapitalized” if it has a ratio of tangible equity (as defined in the regulations) to total assets that is equal to or less than 2%. The Bank’s capital levels at December 31, 2012 met the standards for the highest level, a “well-capitalized” institution.
Federal law prohibits a financial institution from making a capital distribution to anyone or paying management fees to any person having control of the institution if, after such distribution or payment, the institution would be undercapitalized. In addition, each holding company controlling an undercapitalized institution must guarantee that the institution will comply with its capital restoration plan until the institution has been adequately capitalized on an average during each of the four preceding calendar quarters and must provide adequate assurances of performance. The aggregate liability pursuant to such guarantee is limited to the lesser of (i) an amount equal to 5% of the institution’s total assets at the time it became undercapitalized or (ii) the amount necessary to bring the institution into compliance with all capital standards applicable to such institution at the time the institution fails to comply with its capital restoration plan.
Dividend Restrictions. There are a number of statutory and regulatory requirements applicable to the payment of dividends by banks and bank holding companies. Please see Note 18 of the financial statements for a discussion on the Bank’s current dividend restrictions.
If the FRB or the FDIC determines that a bank holding company or a bank is engaged in or is about to engage in an unsafe or unsound practice (which, depending on the financial condition of the entity, could include the payment of dividends), that regulator may require, after notice and hearing, that such bank holding company or bank cease and desist from such practice. In addition, the FRB and the FDIC have issued policy statements, which provide that insured banks and bank holding companies should generally only pay dividends out of current operating earnings. The FDIC prohibits the payment of any dividend by a bank that would constitute an unsafe or unsound practice. Compliance with the minimum capital requirements limits the amounts that BKFC and the Bank can pay as dividends.
In 2012, BKFC paid a cash dividend of $0.62 per share totaling approximately $4.62 million on common stock.
FDIC Deposit Insurance and Assessments.The FDIC is an independent federal agency that insures deposits, up to prescribed statutory limits, of federally insured banks and thrifts and safeguards the safety and soundness of the banking and thrift industries. TheBank’s deposits are insured by the DIF. The DIF is the successor to the Bank Insurance Fund and the Savings Association Insurance Fund, which were merged in 2006. The FDIC amended its risk-based assessment system to implement authority granted by the Federal Deposit Insurance Reform Act of 2005. Under the revised system, insured institutions are assigned to one of four risk categories based on supervisory evaluations, regulatory capital levels and certain other factors. An institution’s assessment rate depends upon the category to which it is assigned. Risk Category I, which contains the least risky depository institutions, is expected to include 90% of all institutions. Unlike the other categories, Risk Category I contains further risk differentiation based on the FDIC’s analysis of financial ratios, examination component ratings and other information.
In October 2008, the basic limit on federal deposit insurance coverage of interest bearing transaction accounts was temporarily increased from $100,000 to $250,000 per depositor under the EESA, which was subsequently made permanent under the Dodd-Frank Act. In October 2008, the FDIC announced TLGP which provided full coverage for noninterest-bearing transaction accounts at FDIC-insured institutions that agreed to participate in the program through December 31, 2010. The Bank participated in this program. In July 2010, the Dodd-Frank Act extended unlimited FDIC insurance coverage for non-interest-bearing transaction deposit accounts for an additional two years. This unlimited insurance coverage for noninterest-bearing transaction accounts expired on December 31, 2012.
On November 12, 2009, the FDIC adopted regulations that require all depository institutions to prepay on December 30, 2009 their estimated risk-based insurance assessments for the fourth quarter of 2009, and for all of 2010, 2011 and 2012. At that same time, institutions were also required to pay their regular quarterly assessments for the third quarter of 2009. An institution’s quarterly risk-based deposit insurance assessments thereafter would be paid from the amount the institution prepaid until that amount was exhausted or until June 30, 2013, when any amount remaining would be returned to the institution. The prepaid assessment amount was $1.85 million and $2.91 million on December 31, 2012 and December 31, 2011, respectively.
Pursuant to the Dodd-Frank Act, the FDIC has established 2.0% as the designated reserve ratio (“DRR”), that is, the ratio of the DIF to insured deposits. The FDIC has adopted a plan under which it will meet the statutory minimum DRR of 1.35% by September 30, 2020, the deadline imposed by the Dodd-Frank Act. The Dodd-Frank Act requires the FDIC to offset the effect on institutions with assets less than $10 billion of the increase in the statutory minimum DRR to 1.35% from the former statutory minimum of 1.15%. The FDIC has not yet announced how it will implement this offset.
As required by the Dodd-Frank Act, the FDIC has adopted rules which were effective April 1, 2011, under which insurance premium assessments are based on an institution’s total assets minus its tangible equity (defined as Tier 1 capital) instead of its deposits. Under these rules, an institution with total assets of less than $10 billion, such as the Bank, will be assigned to a risk category as described above and a range of initial base assessment rates will apply to each category, subject to adjustment downward based on unsecured debt issued by the institution and, except for an institution in Risk Category I, adjustment upward if the institution’s brokered deposits exceed 10% of its domestic deposits, to produce total base assessment rates. The FDIC may increase or decrease its rates by 2.0 basis points without further rulemaking. In an emergency, the FDIC may also impose a special assessment.
The FDIC may increase or decrease the assessment rate schedule from one quarter to the next. An increase in the assessment rate could have a material adverse effect on BKFC’s earnings, depending on the amount of the increase. The FDIC is authorized to terminate a depository institution’s deposit insurance upon a finding by the FDIC that the institution’s financial condition is unsafe or unsound, or that the institution has engaged in unsafe or unsound practices, or has violated any applicable rule, regulation, order or condition enacted or imposed by the institution’s regulatory agency. The termination of deposit insurance for the Bank could have a material adverse effect on BKFC’s earnings.
FRB Reserve Requirements.FRB regulations currently require banks to maintain reserves of 3% of net transaction accounts (primarily demand and NOW accounts) up to $79.5 million of such accounts (subject to an exemption of up to $12.4 million), and of 10% of net transaction accounts in excess of $79.5 million. At December 31, 2012, the Bank was in compliance with this reserve requirement, which was $10,997,000.
Acquisitions of Control. Acquisitions of controlling interests of BKFC and the Bank are subject to the limitations in federal and state laws. These limits generally require regulatory approval of acquisitions of specified levels of stock of any of these entities. Acquisitions of BKFC or the Bank by merger or pursuant to the purchase of assets also require regulatory approval.
Federal Home Loan Banks. The FHLBs provide credit to their members in the form of advances. The Bank is a member of the FHLB of Cincinnati and must maintain an investment in the capital stock of the FHLB of Cincinnati that consists of two components, the first is the membership component which is equal to 0.15% of the Bank’s total assets, and the second is an activity component that is equal to 2% to 4% of the Bank’s outstanding advances. The Bank is in compliance with this requirement with an investment in stock of the FHLB of Cincinnati of $5,099,000 at December 31, 2012 and 2011. Generally, FHLBs are not permitted to make new advances to a member without positive tangible capital.
Federal Taxation
BKFC. BKFC and the Bank file a consolidated federal income tax return on a calendar year basis. BKFC is subject to the federal tax laws and regulations that apply to corporations generally.
The Bank. In 2000, the Bank acquired the stock of FTFC. FTFC’s wholly owned subsidiary was FTSB. Federal income tax laws provided savings banks with additional bad debt deductions through 1987, totaling $1,255,000 for FTFC. Accounting standards do not require a deferred tax liability to be recorded on this amount, which would otherwise total $427,000. Upon acquisition, this unrecorded liability was transferred to the Bank. If the Bank was liquidated or otherwise ceased to be a bank or if tax laws were to change, the $427,000 would be recorded as a liability with an offset to income tax expense.
In 2007, BKFC consummated the acquisition of FNB Bancorporation, Inc. and its subsidiary, First Bank. The First Bank acquisition included a $13,748,000 net operating loss (“NOL”) carryforward which was set up as a $4,700,000 deferred tax asset. The NOL carryforward will be deducted from income over the next 18 years in accordance to section 382 of the Internal Revenue Code.
Kentucky Taxation
BKFC.Kentucky corporations, such as BKFC, are subject to the Kentucky corporation income tax and the Kentucky corporation license (franchise) tax. The income tax is imposed based on the following rates: 4% of the first $50,000 of taxable net income allocated or apportioned to Kentucky; 5% of the next $50,000; and 6% of taxable net income over $100,000. All dividend income received by a corporation is excluded for purposes of arriving at taxable net income.
Domestic corporations are subject to state and local ad valorem taxes on tangible personal property and real property that is not otherwise exempt from taxation. The rates of taxation for tangible personal property vary depending on the character of the property. The state rate of taxation on real property equals $0.122 per $100 of value as of January 1 each year. Thus, BKFC is subject to ad valorem taxation on its taxable tangible personal property and real property.
The Bank. State banks are not subject to the Kentucky corporation income tax.
The Commonwealth of Kentucky imposes both a “Kentucky Bank Franchise Tax” and “Local Deposits Franchise Tax”. The “Kentucky Bank Franchise Tax” is an annual tax equal to 1.1% of net capital after apportionment, if applicable. The value of net capital is calculated annually by deducting from total capital an amount equal to the same percentage of the total as the book value of United States obligations bears to the book value of the total assets of the financial institution. The Bank pays a portion of its franchise tax to the state of Ohio based on revenue apportioned to that state. The “Local Deposits Franchise Tax” is an annual tax of up to 0.025% imposed by each city and county on bank deposits within their jurisdictions.
The Kentucky property tax extends to bank deposits (the“Deposits Tax”). The tax is levied at a rate of 0.00001% of the amount of the deposits. It is the responsibility of the bank, not the depositor, to report and pay the Deposits Tax.
State banks are subject to state and local ad valorem taxes on tangible personal property and real property that is not otherwise exempt from taxation. The rates of taxation for tangible personal property vary depending on the character of the property. The state rate of taxation on real property equals $0.122 per $100 of value as of January 1 each year.
The Bank, as a financial institution, is exempt from both the corporate income and license taxes.
An investment in the Common Stock of BKFC is subject to certain risks inherent in the business of BKFC and the Bank. The material risks and uncertainties that management believes affect BKFC and the Bank are described below. Before making an investment decision, you should carefully consider the risks and uncertainties described below, together with all of the other information included or incorporated by reference into this Annual Report. The risks and uncertainties described below are not the only ones facing BKFC or the Bank. Additional risks and uncertainties that management is not aware of or focused on or that management currently deems immaterial may also impair the business operations of BKFC or the Bank. This Annual Report is qualified in its entirety by these risk factors.
If any of the following risks occur, or if any combination of the following risks occur, the financial condition and results of operations of BKFC or the Bank could be materially and adversely affected. If this were to happen, the value of Common Stock could decline significantly.
References to “we,” “us,” and “our” in this “Risk Factors” section refer to BKFC and its subsidiaries, including the Bank, unless otherwise specified or unless the context otherwise requires.
Our business depends upon the general economic conditions of the northern Kentucky and greater Cincinnati, Ohio area, and may continue to be adversely affected by downturns in the local economies in which we operate.
Our business operations are limited almost exclusively to the northern Kentucky and the greater Cincinnati, Ohio area, which is a small geographic area. As such, our business is closely tied to the general economic conditions of this area. Local economic conditions in this area have a significant impact on the demand for our products and services, as well as the ability of our customers to repay loans, the value of the collateral securing loans and the stability of the Bank’s deposit funding sources.
A significant decline in general economic conditions could increase loan delinquencies, increase problem assets and foreclosure, increase claims and lawsuits, decrease the demand for the Bank’s products and services, or decrease the value of collateral for loans, especially real estate, in turn reducing customers’ borrowing power and the value of assets associated with problem loans and collateral coverage, thereby having a material adverse effect on our financial condition and results of operations.
A significant portion of our loans are secured by real estate and concentrated in the northern Kentucky and greater Cincinnati area, which may adversely affect our earnings and capital if real estate values decline.
Nearly 80% of our total loans are real estate interests (residential, nonresidential including both owner-occupied and investment real estate, and construction and land development) concentrated in the northern Kentucky area and neighboring areas in greater Cincinnati, Ohio, a small geographic area. As a result, declining real estate values in the northern Kentucky and greater Cincinnati, Ohio markets as a result of the ongoing national economic recession could negatively impact the value of the real estate collateral securing such loans. If we are required to liquidate a significant amount of collateral during a period of reduced real estate values in satisfaction of any non-performing or defaulted loans, our earnings and capital could be adversely affected.
We are subject to intense competition in our market area, and our business will be adversely affected if we are unable to compete effectively.
BKFC and the Bank compete with national financial institutions, as well as numerous state chartered banking institutions of comparable or larger size and resources, smaller community banking organizations and a variety of nonbank competitors. The Bank competes for deposits with other commercial banks, savings associations and credit unions and with the issuers of commercial paper and other securities, such as shares in money market mutual funds. In making loans, the Bank competes with other banks, savings associations, consumer finance companies, credit unions, leasing companies and other lenders. Many of the institutions against whom we compete are national and regional banks that are significantly larger than us and, therefore, have significantly greater resources and the ability to achieve economies of scale by offering a broader range of products and services at more competitive prices than we can offer. We expect competition to increase in the future as a result of legislative, regulatory and technological changes and the continuing trend of consolidation in the financial services industry.
Our ability to compete successfully and to maintain and grow our profitability depends upon a number of factors, including: the ability to develop, maintain and build upon long-term customer relationships based on top-quality service, high ethical standards and safe, sound assets; the ability to continue to expand BKFC’s market position through organic growth and strategic acquisitions; the scope, relevance and pricing of products and services offered to meet customer needs and demands; the rate at which BKFC introduces new products and services relative to our competitors; and industry and general economic trends. Failure to perform in any of these areas could significantly weaken our competitive position, which could adversely impact our financial condition and results of operations.
Our nonresidential real estate loans expose us to greater risks of nonpayment and loss than residential mortgage loans, which may cause us to increase our allowance for loan losses which would reduce our net income.
At December 31, 2012, $573 million, or 48%, of our loan portfolio consisted of nonresidential real estate loans. Nonresidential real estate loans generally expose a lender to greater risk of non-payment and loss than residential mortgage loans because repayment of the loans often depends on the successful operation of the property and the income stream of the borrowers. Such loans expose us to additional risks because they typically are made on the basis of the borrower’s ability to make repayments from the cash flow of the borrower’s business and are secured by collateral that may depreciate over time. These loans typically involve larger loan balances to single borrowers or groups of related borrowers compared to residential mortgage loans. Because such loans generally entail greater risk than residential mortgage loans, we may need to increase our allowance for loan losses in the future to account for the likely increase in probable incurred credit losses associated with the growth of such loans, which would reduce our net income. Also, many of our nonresidential real estate borrowers have more than one loan outstanding with us. Consequently, an adverse development with respect to one loan or one credit relationship can expose us to a significantly greater risk of loss compared to an adverse development with respect to a residential mortgage loan.
We may require access to the capital and credit markets to conduct our business operations, and the unprecedented levels of volatility that have impacted such capital and credit markets could impair our access to the same.
From 2008 through 2012, the capital and credit markets experienced extended volatility and disruption. In the third quarter of 2008, the volatility and disruption reached unprecedented levels. In some cases, the markets produced downward pressure on stock prices and credit capacity for certain issuers without regard to those issuers’ underlying financial strength. In addition, during 2011 and 2012, the possibility that certain European Union (“EU”) member states could have defaulted on their debt obligations negatively impacted economic conditions and global markets. The continued uncertainty over the outcome of international and the EU’s financial support programs and the possibility that other EU member states may experience similar financial troubles could disrupt global markets. If these levels of market disruption and volatility continue, worsen or abate and then arise at a later date, BKFC’s ability to access capital could be materially impaired. BKFC’s inability to access the capital markets could constrain our ability to make new loans, to meet our existing lending commitments and, ultimately, jeopardize our overall liquidity and capitalization.
Further decline in general economic conditions could require further additions to our allowance for loan losses, which would reduce our net income.
If our borrowers do not repay their loans or if the collateral securing their loans is insufficient to provide for the full repayment, we may suffer credit losses. Credit losses are inherent in the lending business and could have a material adverse effect on our operating results. We make various assumptions and judgments about the collectability of our loan portfolio and provide an allowance for loan losses based on a number of factors. If our assumptions and judgments are wrong, our allowance for loan losses may not be sufficient to cover our losses. If we determine that our allowance for loan losses is insufficient, we would be required to take additional provisions for loan losses, which would reduce net income during the period those provisions are taken. In addition, our regulators periodically review our allowance for loan losses and may require us to increase our allowance for loan losses or to charge off particular loans. Current economic conditions and their impact upon the northern Kentucky and greater Cincinnati, Ohio markets where our business is concentrated have caused our allowance for loan losses to increase from 2008 through 2011 and decrease only in 2012. If current economic trends change, we may experience higher than normal delinquencies and credit losses, resulting in increases to our provisions for loan losses again in the future and reduced net income. Not all TDR’s are successful and may result in a higher allowance if they are evaluated on a collateral dependency basis.
Our accounting policies and estimates are critical to how we report our financial condition and results of operations, and any changes to such accounting policies and estimates could materially affect how we report our financial condition and results of operations.
Accounting policies and estimates are fundamental to how we record and report our financial condition and results of operations. Our management makes judgments and assumptions in selecting and adopting various accounting policies and in applying estimates so that such policies and estimates comply with U.S. generally accepted accounting principles (“GAAP”).
Management has identified certain accounting policies as being critical because they require management’s judgment to ascertain the valuations of assets, liabilities, commitments and contingencies. A variety of factors could affect the ultimate value that is obtained either when earning income, recognizing an expense, recovering an asset, valuing an asset or liability or reducing a liability. We have established detailed policies and control procedures that are intended to ensure that these critical accounting estimates and judgments are well controlled and applied consistently. In addition, these policies and procedures are intended to ensure that the process for changing methodologies occurs in an appropriate manner. Because of the uncertainty surrounding our judgments and the estimates pertaining to these matters, actual outcomes may be materially different from amounts previously estimated. For example, because of the inherent uncertainty of estimates, management cannot provide any assurance that the Bank will not significantly increase its allowance for loan losses if actual losses are more than the amount reserved. Any increase in its allowance for loan losses or loan charge-offs could have a material adverse effect on our financial condition and results of operations. In addition, we cannot guarantee that we will not be required to adjust accounting policies or restate prior financial statements. See “Allowance for Loan Losses” under “Item 1. Business” and “Critical Accounting Policies” under “Item 7. Management’s Discussion and Analysis of Financial Condition and Results of Operations” for additional discussion regarding these critical accounting policies.
Further, from time to time, the Financial Accounting Standards Board and SEC change the financial accounting and reporting standards that govern the preparation of our financial statements. The ongoing economic recession has resulted in increased scrutiny of accounting standards by legislators and our regulators, particularly as they relate to fair value accounting principles. In addition, ongoing efforts to achieve convergence between GAAP and International Financial Reporting Standards may result in changes to GAAP. These changes can be hard to predict and can materially impact how we record and report our financial condition and results of operations. In some cases, we could be required to apply a new or revised standard retroactively, resulting in our restating prior period financial statements or otherwise adversely affecting our financial condition or results of operations.
Our largest source of revenue (net interest income) is subject to interest rate risk.
The Bank’s financial condition and results of operations are significantly affected by changes in interest rates. The Bank’s earnings depend primarily upon its net interest income, which is the difference between its interest income earned on its interest-earning assets, such as loans and investment securities, and its interest expense paid on its interest-bearing liabilities, consisting of deposits and borrowings. Moreover, the loans included in our interest-earning assets are primarily comprised of variable and adjustable rate loans. Net interest income is subject to interest rate risk in the following ways:
| · | In general, for a given change in interest rates, the amount of change in value (positive or negative) is larger for assets and liabilities with longer remaining maturities. The shape of the yield curve may affect new loan yields, funding costs and investment income differently. |
| · | The remaining maturity of various assets or liabilities may shorten or lengthen as payment behavior changes in response to changes in interest rates. For example, if interest rates decline sharply, loans may pre-pay, or pay down, faster than anticipated, thus reducing future cash flows and interest income. Conversely, if interest rates increase, depositors may cash in their certificates of deposit prior to maturity (notwithstanding any applicable early withdrawal penalties) or otherwise reduce their deposits to pursue higher yielding investment alternatives. |
| · | Re-pricing frequencies and maturity profiles for assets and liabilities may occur at different times. For example, in a falling rate environment, if assets re-price faster than liabilities, there will be an initial decline in earnings. Moreover, if assets and liabilities re-price at the same time, they may not be by the same increment. For instance, if the Federal Funds Rate increased 50 basis points, rates on demand deposits may rise by 10 basis points; whereas rates on prime-based loans will instantly rise 50 basis points. |
Financial instruments do not respond in a parallel fashion to rising or falling interest rates. This causes asymmetry in the magnitude of changes to net interest income, net economic value and investment income resulting from the hypothetical increases and decreases in interest rates. Therefore, BKFC’s management monitors interest rate risk and adjusts BKFC’s funding strategies to mitigate adverse effects of interest rate shifts on BKFC’s balance sheet. The Bank’s asset and liability management strategies designed to maintain a reasonable degree of interest rate sensitivity are more fully described in “Asset/Liability Management” under “Item 1. Business” and “Asset/Liability Management and Market Risk” under “Item 7A. Quantitative and Qualitative Disclosure About Market Risk”.
Legislative and regulatory actions taken now or in the future may significantly affect BKFC’s financial condition, results of operation, liquidity or stock price.
There have been numerous actions undertaken in Congress, the Treasury Department, the FRB, the FDIC, the SEC and others in an effort to address the recent liquidity and credit crisis in the financial industry that followed the sub-prime mortgage market meltdown, which began in late 2007. These measures include the TARP CPP (under which the Treasury Department’s authority to make new investments expired on October 3, 2010); homeowner relief that encourages loan restructuring and modification; the establishment of significant liquidity and credit facilities for financial institutions and investment banks; the lowering of the federal funds rate; emergency action against short selling practices; a temporary guaranty program for money market funds; the establishment of a commercial paper funding facility to provide back-stop liquidity to commercial paper issuers; a mandatory “stress test” requirement for banking institutions with assets in excess of $100 billion to analyze capital sufficiency and risk exposure; and coordinated international efforts to address illiquidity and other weaknesses in the banking sector. The purpose of these legislative and regulatory actions was to help stabilize the U.S. banking system. However, these and any current or future legislative or regulatory initiatives may not have their desired effect, or may have an adverse effect when applied to BKFC.
The most recent of these actions was the passage into law on July 21, 2010 of the Dodd-Frank Act. The Dodd-Frank Act represents a significant overhaul of many aspects of the regulation of the financial-services industry, addressing, among other things, systemic risk, capital adequacy, deposit insurance assessments, consumer financial protection, interchange fees, derivatives, lending limits, and changes among the bank regulatory agencies. Many of these provisions are subject to further study, rulemaking and to the discretion of regulatory bodies.
While many of the provisions in the Dodd-Frank Act are aimed at financial institutions that are significantly larger than BKFC or the Bank, there are provisions with which we will have to comply now that the Dodd-Frank Act has become law. For instance, we will be subject to a new assessment model from the FDIC based on assets, not deposits, and be subject to enhanced executive compensation and corporate governance requirements. Under the Dodd-Frank Act, our ability to count trust preferred securities in our Tier 1 regulatory capital also will be constrained. Because many aspects of this legislation remain subject to ongoing agency rulemaking, including public comment periods prior to implementation, it is difficult to predict at this time the complete extent of the effects that the Dodd-Frank Act will have on us. As rules and regulations are promulgated by the federal agencies responsible for implementing and enforcing the provisions in the Dodd-Frank Act, we will have to work to apply resources to ensure that we are in compliance with all applicable provisions, which may adversely impact our earnings. Furthermore, any current or future legislative or regulatory initiatives may not have their desired effect, or may have an adverse effect when applied to us.
The effects of the Federal Government’s efforts to wind down various programs implemented to support the financial markets may affect BKFC in ways that cannot be predicted.
Economic conditions, particularly over the course of the last year and a half, have resulted in government regulatory agencies and political bodies placing increased focus on and scrutiny of the financial services industry. The Federal government has intervened on an unprecedented scale. Many of these programs are in the process of being unwound, as the government seeks to affect an orderly withdrawal of this support. The effects of this wind down on BKFC, or on the markets in which we compete, cannot be predicted.
Failure to meet any of the various capital adequacy guidelines which we are subject to could adversely affect our operations and could compromise the status of BKFC as a bank holding company.
BKFC and the Bank are required to meet certain regulatory capital adequacy guidelines and other regulatory requirements imposed by the FRB, the FDIC and the Department. If BKFC or the Bank fails to meet these minimum capital guidelines and other regulatory requirements, our financial condition and results of operations would be materially and adversely affected and could compromise the status of BKFC as a banking holding company. See “Regulatory Capital Requirements” under “Item 1. Business” for detailed capital guidelines for bank holding companies and banks.
Non-compliance with applicable laws and/or regulations, including the Bank Secrecy Act and USA Patriot Act, may adversely affect BKFC’s operations and financial results and could result in significant fines or sanctions.
Federal and state regulators have the ability to impose substantial sanctions, restrictions and requirements on the Bank if they determine, upon examination or otherwise, that we have violated laws or regulations with which we must comply, or that weaknesses or failures exist with respect to general standards of safety and soundness. Such enforcement may be formal or informal and can include, among other things, orders to take certain actions or to refrain from certain actions. The imposition of regulatory sanctions may have adverse effects on BKFC, including a material impact on its financial condition. In addition, compliance with any such action could distract management’s attention from operations, cause significant expenses, restrict BKFC from engaging in potentially profitable activities, and limit BKFC’s ability to raise capital.
The USA Patriot and Bank Secrecy Acts require financial institutions to develop programs to prevent the institutions from being used for money laundering and terrorist activities. If certain activities are detected, financial institutions are obligated to file suspicious activity reports with the Treasury Department’s Financial Crimes Enforcement Network. These rules also require financial institutions to establish procedures for identifying and verifying the identity of customers seeking to open new financial accounts or conduct transactions, and require the filing of certain reports, such as those for cash transactions above a certain threshold. Financial institutions must also refrain from transacting business with certain countries or persons designated by the Office of Foreign Assets Control.
Non-compliance with laws and regulations such as these could result in significant fines or sanctions. These particular laws and regulations have significant implications for all financial institutions, establish new crimes and penalties, and require the federal banking agencies, in reviewing merger and acquisition transactions, to consider the effectiveness of the parties to such transactions in combating money laundering and terrorist activities. Even inadvertent non-compliance and technical failure to follow the regulations may result in significant fines or other penalties, which could have a material adverse impact on BKFC’s business, financial condition, results of operations or liquidity.
The downgrade of the U.S. credit rating and Europe’s debt crisis could have a material adverse effect on our business, financial condition and liquidity.
Standard & Poor’s lowered its long term sovereign credit rating on the United States of America from AAA to AA+ on August 5, 2011. A further downgrade or a downgrade by other rating agencies could have a material adverse impact on financial markets and economic conditions in the United States and worldwide. Any such adverse impact could have a material adverse effect on our liquidity, financial condition and results of operations. Many of our investment securities are issued by and some of our loans are made to U.S. government agencies and U.S. government sponsored entities.
In addition, the possibility that certain EU member states will default on their debt obligations have negatively impacted economic conditions and global markets. The continued uncertainty over the outcome of international and the EU’s financial support programs and the possibility that other EU member states may experience similar financial troubles could further disrupt global markets. The negative impact on economic conditions and global markets could also have a material adverse effect on our liquidity, financial condition and results of operations.
The value of the securities in our investment securities portfolio may be negatively affected by continued disruptions in securities markets.
Due to heightened credit and liquidity risks and the volatile economy, making the determination of the value of a securities portfolio is less certain. There can be no assurance that decline in market value associated with these disruptions will not result in other-than-temporary or permanent impairments of these assets, which would lead to accounting charges which could have a material negative effect on our financial condition and results of operations.
The Bank could be held responsible for environmental liabilities relating to properties acquired through foreclosure, resulting in significant financial loss.
In the event the Bank forecloses on a defaulted commercial or residential mortgage loan to recover its investment, it may be subject to environmental liabilities in connection with the underlying real property, which could significantly exceed the value of the real property. Although the Bank exercises due diligence to discover potential environmental liabilities prior to acquiring any property through foreclosure, hazardous substances or wastes, contaminants, pollutants or their sources may be discovered on properties during its ownership or after a sale to a third party. BKFC cannot assure you that the Bank would not incur full recourse liability for the entire cost of any removal and cleanup on an acquired property, that the cost of removal and cleanup would not exceed the value of the property or that the Bank could recover any of the costs from any third party. Losses arising from environmental liabilities could have a material adverse impact on BKFC’s business, financial condition, results of operations or liquidity.
BKFC is subject to liquidity risk, which could disrupt our ability to meet our financial obligations.
Liquidity refers to the ability of BKFC to ensure sufficient levels of cash to fund operations, such as meeting deposit withdrawals, funding loan commitments, paying expenses and meeting quarterly payment obligations under certain subordinated debentures issued by BKFC in connection with the issuance of floating rate redeemable trust preferred securities issued by BKFC’s unconsolidated trust subsidiary. The source of the funds for BKFC’s debt obligations is dependent on the Bank. If needed, the Bank has the ability to borrow term and overnight funds from the FHLB or other financial intermediaries. The Bank also has $314 million of securities designated as available-for-sale that can serve as sources of funds as of December 31, 2012.
While management is satisfied that BKFC’s liquidity is sufficient at December 31, 2012 to meet known and potential obligations, any significant restriction or disruption of BKFC’s ability to obtain funding from these or other sources could have a negative effect on BKFC’s ability to satisfy its current and future financial obligations, which could materially affect BKFC’s financial condition.
BKFC is a bank holding company, and its sources of funds are limited.
BKFC is a bank holding company and its operations are primarily conducted by the Bank, which is subject to significant federal and state regulation. Cash available to pay dividends to shareholders of BKFC is derived primarily from dividends paid by the Bank. As a result, BKFC’s ability to receive dividends or loans from its subsidiaries is restricted. Under federal law, the payment of dividends by the Bank is subject to capital adequacy requirements. The FRB and/or the FDIC prohibit a dividend payment by BKFC or the Bank that would constitute an unsafe or unsound practice. See “Dividend Restrictions” under “Item 1. Business”.
The inability of the Bank to generate profits and pay such dividends to BKFC, or regulator restrictions on the payment of such dividends to BKFC even if earned, would have an adverse effect on the financial condition and results of operations of BKFC and BKFC’s ability to pay dividends to its shareholders.
In addition, since BKFC is a legal entity separate and distinct from the Bank, its right to participate in the distribution of assets of the Bank upon the Bank’s liquidation, reorganization or otherwise will be subject to the prior claims of the Bank’s creditors, which will generally take priority over the Bank’s shareholders.
Our Common Stock price can be volatile.
Our Common Stock price can fluctuate widely in response to a variety of factors, making it more difficult for you to resell your Common Stock at prices you find attractive and at the time you want. Factors include actual or anticipated variations in our quarterly operating results; changes in recommendations or projections by securities analysts; operating and stock price performance of other companies deemed to be peers; news reports and perception in the marketplace regarding BKFC, our competitors and/or the financial services industry as a whole; results of litigation; significant acquisitions or business combinations involving BKFC or our competitors; and other factors, including those described in this “Risk Factors” section. For example, the existence of the Warrant issued to the Treasury Department to purchase up to 274,784 shares of Common Stock at an exercise price of $18.56 per share and the potential for dilution or actual dilution the Warrant may cause, as described in detail below, may create volatility in the market price of BKFC’s Common Stock.
In addition, our Common Stock also has a low average daily trading volume, which limits a person’s ability to quickly accumulate or quickly divest themselves of large blocks of our Common Stock. Further, a low average trading volume can lead to significant price swings even when a relatively small number of shares are being traded.
Recent or future acquisitions by BKFC may not produce revenue enhancements or cost savings at levels or within timeframes originally anticipated and may result in unforeseen integration difficulties.
BKFC regularly explores opportunities to acquire financial services businesses or assets and may also consider opportunities to acquire other banks or financial institutions. In 2007, we acquired FNB Bancorporation. In 2009, we acquired certain banking offices and assumed certain deposit liabilities of Integra Bank, as well as adding the investment professionals of TAM to the Bank’s trust department. In 2011, we completed the purchase of one banking office of United Kentucky Bank in Falmouth, Kentucky and a portfolio of selected loans.Difficulty in integrating an acquired business or company such as those described above or other businesses we acquire in the future may cause BKFC not to realize expected revenue increases, cost savings, increases in geographic or product presence, and/or other projected benefits. The integration could result in higher than expected customer deposit attrition (run-off), loss of key employees, disruption of BKFC’s business or the business of the acquired company, or otherwise adversely affect BKFC’s ability to maintain relationships with customers and employees or achieve the anticipated benefits of the acquisition. Also, the negative effect of any divestitures required by regulatory authorities in acquisitions or business combinations may be greater than expected.
Some provisions contained in BKFC’s articles of incorporation and bylaws and under Kentucky law could deter a takeover attempt or delay changes in control or management of BKFC.
Certain provisions of BKFC’s articles of incorporation and bylaws may make it more difficult to acquire control of BKFC by means of a tender offer, open market purchase, proxy fight or otherwise. For example, the articles require the affirmative vote of a majority of the outstanding voting power of BKFC or, if the Board of Directors recommends against the approval of certain matters, by the holders of at least 75% of the voting power to, among other things, adopt (i) an amendment to the articles or bylaws, (ii) an agreement of merger or consolidation, (iii) a proposed combination or majority share acquisition involving the issuance of shares of BKFC and requiring shareholder approval, and (iv) a proposal to sell, exchange, transfer or otherwise dispose of all, or substantially all, of BKFC’s assets.
Additionally, certain provisions of the Kentucky Business Corporation Act that apply to BKFC limit the ability of certain shareholders to engage in business combinations with the company in which they own shares.
Such provisions of the articles, bylaws and Kentucky law may have the effect of deterring takeovers or delaying changes in control or management of BKFC.
The Treasury Department’s exercise of the Warrant may dilute earnings, encumber earnings to pay preferred dividends and require BKFC to accrue the related discount through earnings.
Full exercise of the Warrant issued to the Treasury Department as part of the CPP will dilute BKFC’s common shareholders by approximately 3.68%, based upon the approximately 7,470,236 shares of BKFC’s Common Stock issued and outstanding as of December 31, 2012. If the market value of BKFC’s Common Stock is above the exercise price of $18.56 per common share prior to the exercise of the Warrant, accounting rules require additional shares to be included in the fully diluted share count, which will effectively reduce reported diluted earnings per share to common shareholders. The effects of this dilution is detailed in note 13 of our financial statements, as BKFC’s Common Stock has been consistently trading above the exercise price for the year ended December 31, 2012 and subsequent periods. If the Warrant is exercised, dividends would become payable with respect to the newly issued shares. Likewise, in a scenario in which BKFC’s management might prefer to repurchase the Warrant, if the market price of the Common Stock is significantly above the exercise price of the Warrant, the value of the Warrant would rise with the market price of the Common Stock. In such a scenario, a higher amount of cash would be needed to repurchase the Warrant, reducing capital surplus. Assuming the market price of BKFC’s Common Stock equals its closing price as of February 28, 2013, which was $26.72 per share, we will need cash in the amount of approximately $3.1 million to repurchase all the Warrants while our average cash and due from banks during 2012 was approximately $56.2 million. Given BKFC’s current liquidity, management believes that to date the impact of the increase in our stock price on our available cash would not be significant.
Higher FDIC deposit insurance premiums and assessments could adversely impact our earnings.
FDIC insurance rates increased significantly in 2009, and we may pay higher FDIC premiums in the future. The Dodd-Frank Act established 1.35% as the minimum DRR. The FDIC has determined that the DRR should be 2.0% and has adopted a plan under which it will meet the statutory minimum DRR of 1.35% by the statutory deadline of September 30, 2020. The Dodd-Frank Act requires the FDIC to offset the effect on institutions with assets less than $10 billion of the increase in the statutory minimum DRR to 1.35% from the former statutory minimum of 1.15%, although the FDIC has not announced how it will implement this offset.
In addition, the FDIC has amended its regulations pursuant to the Dodd-Frank Act to base deposit insurance assessments on an insured depository institution’s average consolidated total assets minus its average tangible equity, rather than on its deposit base. It is possible that our insurance premiums will increase under these regulations.
We rely on other companies to provide key components of our business infrastructure.
Third parties provide key components of our business infrastructure such as banking services, processing, and Internet connections. Any disruption in such services provided by these third parties or any failure of these third parties to handle current or higher volumes of use could adversely affect our ability to deliver products and services to clients and otherwise to conduct business. Technological difficulties of a third party service provider could adversely affect our business to the extent those difficulties result in the interruption of services provided by that party. A cyber security breach of a vendor’s system may result in theft of our data or disruption of business processes. A material breach of customer data security at a service provider’s site may negatively impact our business reputation and cause a loss of customers; result in increased expense and may result in litigation. We rely on our outsourced service providers to implement and maintain prudent cyber security controls. Furthermore, we may not be insured against all types of losses as a result of third party failures and our insurance coverage may be inadequate to cover all losses resulting from system failures or other disruptions.
Item 1B. Unresolved Staff Comments
None.
Item 2. Properties
BKFC maintains its principal executive offices at 111 Lookout Farm Drive, Crestview Hills, Kentucky 41017, which is owned by BKFC. Of the 33 branch locations operated by the Bank, 18 are owned and 15 are leased. Certain of these leases are with affiliates and affiliated entities. The Bank also leases space for its cash management operations center.
No one facility is material to BKFC. Management believes that the facilities are generally in good condition and suitable for its banking operations. However, management continually looks for opportunities to upgrade its facilities and locations and may do so in the future.
Item 3. Legal Proceedings
From time to time, BKFC and the Bank are involved in litigation incidental to the conduct of its business, but neither BKFC nor the Bank is presently involved in any lawsuit or proceeding which, in the opinion of management, is likely to have a material adverse effect on BKFC.
Item 4. Mine Safety Disclosures
None.
PART II
Item 5. Market for Registrant’s Common Equity, Related Stockholder Matters and Issuer Purchases of Equity Securities
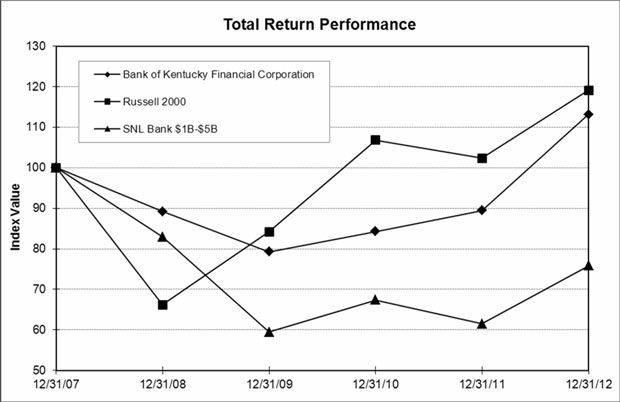
| | | Period Ending | |
| Index | | 12/31/07 | | | 12/31/08 | | | 12/31/09 | | | 12/31/10 | | | 12/31/11 | | | 12/31/12 | |
| Bank of Kentucky Financial Corporation | | | 100.00 | | | | 89.18 | | | | 79.26 | | | | 84.30 | | | | 89.46 | | | | 113.15 | |
| Russell 2000 | | | 100.00 | | | | 66.21 | | | | 84.20 | | | | 106.82 | | | | 102.36 | | | | 119.09 | |
| SNL Bank $1B-$5B | | | 100.00 | | | | 82.94 | | | | 59.45 | | | | 67.39 | | | | 61.46 | | | | 75.78 | |
Market Information. BKFC’s Common Stock is quoted on the NASDAQ (Global Market) under the symbol “BKYF.” Quarterly high and low prices for the last two fiscal years (which reflect inter-dealer prices, without retail mark-up, mark-down or commission, and may not necessarily represent actual transactions) are shown below.
| Fiscal Year 2012 | | High | | | Low | |
| First Quarter | | $ | 28.34 | | | $ | 20.74 | |
| Second Quarter | | | 26.64 | | | | 23.09 | |
| Third Quarter | | | 27.75 | | | | 23.98 | |
| Fourth Quarter | | | 28.05 | | | | 24.02 | |
| Fiscal Year 2011 | | High | | | Low | |
| First Quarter | | $ | 21.00 | | | $ | 19.25 | |
| Second Quarter | | | 26.00 | | | | 20.68 | |
| Third Quarter | | | 25.80 | | | | 19.25 | |
| Fourth Quarter | | | 22.53 | | | | 18.97 | |
Holders and Dividends. There were 7,470,146 shares of Common Stock outstanding on December 31, 2012, which were held of record by 776 shareholders. The Board of Directors declared cash dividends of $0.30 per share in February 2012, $0.32 per share in August 2012, $0.17 per share in December 2012, $0.28 per share in February 2011, and $0.28 per share in August 2011. The dividends declared in December 2012 were paid in January of 2013 in connection with BKFC’s decision to pay dividends on a quarterly basis starting in 2013. BKFC paid dividends on a semi-annual basis in 2011 and 2012.
There are a number of statutory and regulatory requirements applicable to the payment of dividends by banks and bank holding companies. Please see the section entitled “Regulation and Supervision – Dividend Restrictions” under “Item 1” and Note 18 of the financial statements for a discussion on the Bank’s current dividend restrictions.
Equity Compensation Plan Information.The following table reflects BKFC’s equity compensation plan’s information as of December 31, 2012.
| | | Number of Securities to be
Issued Upon Exercise of
Outstanding Options | | | Weighted Average Exercise
Price of
Outstanding Options | | | Number of Securities
Remaining Available for
Future Issuance | |
| | | | | | | | | | |
| Equity Compensation Plans Approved by Security Holders* | | | 348,024 | | | $ | 25.44 | | | | 0 | |
| Equity Compensation Plans Not Approved by Security Holders | | | N/A | | | | N/A | | | | N/A | |
| Total | | | 348,024 | | | $ | 25.44 | | | | 0 | |
(*) Consists of The Bank of Kentucky Financial Corporation 1997 Stock Option and Incentive Plan, approved by the shareholders of BKFC in 1997, and The Bank of Kentucky Financial Corporation 2007 Stock Option and Incentive Plan, approved by the shareholders of BKFC in 2007.
| | | Number of Securities to be
Issued Upon Exercise of
Restricted stock units | | | Number of Securities
Remaining Available for
Future Issuance | |
| | | | | | | |
| Equity Compensation Plans Approved by Security Holders* | | | 4,185 | | | | 995,815 | |
| | | | | | | | | |
| Total | | | 4,185 | | | | 995,815 | |
(*) Consists of The Bank of Kentucky Financial Corporation 2012 Stock Incentive Plan, approved by the shareholders of BKFC in 2012.
Issuer Purchases. Since January 1, 2010, BKFC has not had any repurchase program in place.
Item 6. Selected Financial Data
SELECTED FINANCIAL DATA
The following is a summary of selected consolidated financial data for The Bank of Kentucky Financial Corporation for the five years ended December 31, 2012. The summary should be read in conjunction with the Financial Statements and Notes to Consolidated Financial Statements.
| (Dollars In Thousands | | For Year Ended December 31st | |
| Except Per Share Amounts) | | 2012 | | | 2011 | | | 2010 | | | 2009 | | | 2008 | |
| Earnings: | | | | | | | | | | | | | | | | | | | | |
| Total Interest Income | | $ | 62,524 | | | $ | 64,798 | | | $ | 66,682 | | | $ | 62,750 | | | $ | 68,682 | |
| Total Interest Expense | | | 6,339 | | | | 9,260 | | | | 13,273 | | | | 17,957 | | | | 28,020 | |
| Net Interest Income | | | 56,185 | | | | 55,538 | | | | 53,409 | | | | 44,793 | | | | 40,662 | |
| Provision for Loan Losses | | | 7,000 | | | | 10,750 | | | | 15,500 | | | | 12,825 | | | | 4,850 | |
| Noninterest Income | | | 22,421 | | | | 20,724 | | | | 20,714 | | | | 16,616 | | | | 14,768 | |
| Noninterest Expense | | | 46,338 | | | | 42,114 | | | | 42,424 | | | | 36,677 | | | | 34,223 | |
| Income Before Income Taxes | | | 25,268 | | | | 23,398 | | | | 16,199 | | | | 11,907 | | | | 16,357 | |
| Federal Income Taxes | | | 7,123 | | | | 6,909 | | | | 4,528 | | | | 3,147 | | | | 5,016 | |
| Net Income | | $ | 18,145 | | | $ | 16,489 | | | $ | 11,671 | | | $ | 8,760 | | | $ | 11,341 | |
| Preferred Stock Dividend and Discount Accretion | | | - | | | | 972 | | | | 2,246 | | | | 1,792 | | | | - | |
| Net Income available to Common Shareholders | | $ | 18,145 | | | $ | 15,517 | | | $ | 9,425 | | | $ | 6,968 | | | $ | 11,341 | |
| Per Common Share Data: | | | | | | | | | | | | | | | | | | | | |
| Basic Earnings | | $ | 2.43 | | | $ | 2.09 | | | $ | 1.61 | | | $ | 1.24 | | | $ | 2.02 | |
| Diluted Earnings | | | 2.41 | | | | 2.07 | | | | 1.61 | | | | 1.23 | | | | 2.02 | |
| Dividends Declared | | | 0.79 | | | | 0.56 | | | | 0.56 | | | | 0.56 | | | | 0.54 | |
| Balances at December 31: | | | | | | | | | | | | | | | | | | | | |
| Total Investment Securities | | | 381,287 | | | | 371,487 | | | | 285,226 | | | | 214,567 | | | | 119,212 | |
| Gross Loans | | | 1,195,409 | | | | 1,129,954 | | | | 1,106,009 | | | | 1,154,984 | | | | 1,026,557 | |
| Allowance for Loan Losses | | | 16,568 | | | | 18,288 | | | | 17,368 | | | | 15,153 | | | | 9,910 | |
| Total Assets | | | 1,844,104 | | | | 1,744,724 | | | | 1,664,884 | | | | 1,564,998 | | | | 1,255,382 | |
| Noninterest Bearing Deposits | | | 351,916 | | | | 283,090 | | | | 260,992 | | | | 200,069 | | | | 157,082 | |
| Interest Bearing Deposits | | | 1,218,091 | | | | 1,215,731 | | | | 1,161,320 | | | | 1,143,203 | | | | 914,071 | |
| Total Deposits | | | 1,570,007 | | | | 1,498,821 | | | | 1,422,312 | | | | 1,343,272 | | | | 1,071,153 | |
| Total Shareholders’ Equity | | | 170,440 | | | | 156,570 | | | | 159,370 | | | | 141,133 | | | | 101,448 | |
| Other Statistical Information: | | | | | | | | | | | | | | | | | | | | |
| Return on Average Assets | | | 1.04 | % | | | 1.00 | % | | | 0.75 | % | | | 0.65 | % | | | 0.93 | % |
| Return on Average Equity | | | 11.08 | % | | | 10.41 | % | | | 8.23 | % | | | 6.66 | % | | | 11.80 | % |
| Dividend Payout Ratio | | | 32.51 | % | | | 26.79 | % | | | 34.78 | % | | | 45.16 | % | | | 26.79 | % |
| Capital Ratios at December 31: | | | | | | | | | | | | | | | | | | | | |
| Total Equity to Total Assets | | | 9.24 | % | | | 8.97 | % | | | 9.57 | % | | | 9.02 | % | | | 8.08 | % |
| Tier 1 Leverage Ratio | | | 9.00 | % | | | 8.45 | % | | | 9.41 | % | | | 8.94 | % | | | 7.96 | % |
| Tier 1 Capital to Risk-Weighted Assets | | | 10.77 | % | | | 10.26 | % | | | 11.02 | % | | | 9.42 | % | | | 8.19 | % |
| Total Risk-Based Capital to Risk- Weighted Assets | | | 13.28 | % | | | 12.95 | % | | | 13.77 | % | | | 12.02 | % | | | 10.73 | % |
| Loan Quality Ratios: | | | | | | | | | | | | | | | | | | | | |
| Allowance for Loan Losses | | | | | | | | | | | | | | | | | | | | |
| To Total Loans at year-end | | | 1.39 | % | | | 1.62 | % | | | 1.57 | % | | | 1.31 | % | | | 0.97 | % |
| Allowance for Loan Losses | | | | | | | | | | | | | | | | | | | | |
| To Nonperforming Loans at year end | | | 85.92 | % | | | 115.24 | % | | | 82.46 | % | | | 59.28 | % | | | 97.77 | % |
| Net Charge-Offs to Average Net Loans | | | 0.77 | % | | | 0.89 | % | | | 1.20 | % | | | 0.71 | % | | | 0.35 | % |
Item 7. Management’s Discussion and Analysis of Financial Condition and Results of Operation
Management’s Discussion and Analysis of Financial Condition
and Results of Operations
December 31, 2012
The objective of this section is to help shareholders and potential investors understand our views on our results of operations and financial condition. You should read this discussion in conjunction with the consolidated financial statements and notes to the consolidated financial statements that appear elsewhere in this Annual Report. References to “we,” “us,” and “our” in this section refer to BKFC and its subsidiaries, including the Bank, unless otherwise specified or unless the context otherwise requires.
FORWARD LOOKING STATEMENTS
Certain statements contained in this Annual Report which are not statements of historical fact constitute forward-looking statements within the meaning of the Private Securities Litigation Reform Act of 1995. Examples of forward-looking statements include, but are not limited to, projections of revenues, income or loss, earnings or loss per share, the payment or non-payment of dividends, capital structure and other financial items; statements of plans and objectives of us or our management or Board of Directors; and statements of future economic performance and statements of assumptions underlying such statements. Words such as “believes,” “anticipates,” “intends” and other similar expressions are intended to identify forward-looking statements but are not the exclusive means of identifying such statements.
Forward-looking statements involve risks and uncertainties that may cause actual results to differ materially from those in such statements. Factors that could cause actual results to differ from those discussed in the forward-looking statements include, but are not limited to, the following:
| · | indications of an improving economy may prove to be premature; |
| · | general economic or industry conditions could be less favorable than expected, resulting in a deterioration in credit quality, a change in the allowance for credit losses, or a reduced demand for credit or fee-based products and services; |
| · | changes or volatility in interest rates may adversely impact the value of securities, loans, deposits and other financial instruments and the interest rate sensitivity of our balance sheet as well as our liquidity; |
| · | our ability to determine accurate values of certain assets and liabilities; |
| · | the impact of turmoil in the financial markets and the effectiveness of governmental actions taken in response, and the effect of such governmental actions on us, our competitors and counterparties, financial markets generally and availability of credit specifically; |
| · | changes in the extensive laws, regulations and policies governing financial services companies, including the Dodd-Frank Act and any regulations promulgated thereunder; |
| · | the potential need to adapt to industry changes in information technology systems, on which the Bank is highly dependent, could present operational issues or require significant capital spending; |
| · | competitive pressures could intensify and affect the Bank’s profitability, including as a result of continued industry consolidation, the increased availability of financial services from non-banks, technological developments or bank regulatory reform; |
| · | acquisitions may not produce revenue enhancements or cost savings at levels or within timeframes originally anticipated, or may result in unforeseen integration difficulties; and |
| · | other risks and uncertainties summarized above under “Item 1A., Risk Factors,” in this Annual Report. |
Any forward-looking statements made by us or on our behalf speak only as of the date they are made, and we do not undertake any obligation to update any forward-looking statement to reflect the impact of subsequent events or circumstances. Before making an investment decision, you should carefully consider all risks and uncertainties disclosed in our other public documents on file with the SEC.
OVERVIEW
The business of BKFC consists of holding and administering its interest in the Bank. The Bank conducts basic banking operations from locations in Boone, Kenton, Campbell, Grant, Gallatin and Pendelton Counties in northern Kentucky and Hamilton County in Ohio. The majority of BKFC’s revenue is derived from the Bank’s loan portfolio. The loan portfolio is diversified and the ability of borrowers to repay their loans is not dependent upon any single industry. The majority of the Bank’s loan portfolio, approximately 80%, consists of loans secured by or with real estate. Loans secured by or with real estate are further categorized down by loan type and borrower. Included in loans secured with or by real estate as of December 31, 2012 are residential real estate loans, commercial real estate loans and owner-occupied commercial real estate loans.
Economic Overview
Fiscal 2012 proved to be another year of slow growth both nationally and in the geographic markets where we operate. The United States’ gross domestic product (GDP) improved each of the first three quarters of 2012 before decreasing slightly in the fourth-quarter. For the full year 2012, the economy experienced year-over-year growth of 2%. While the economy continues to show improvement, the rate of growth remains well below a historical normalized rate of 3%.
Growth was also sustained by increasing contributions from consumer spending, which grew at an average monthly rate of 0.3% for 2012, matching the rate of growth for both 2010 and 2011. Unemployment declined, beginning at 8.9% and ending at 8% in 2012. Home values rose slightly and equities, despite much uncertainty, finished the year with substantial gains.
Regulatory Reform Developments
As discussed in more detail above, on July 21, 2010, President Obama signed the Dodd-Frank Act into law. The Dodd-Frank Act is intended to address perceived deficiencies and gaps in the regulatory framework for financial services in the United States, reduce the risks of bank failures and better equip the nation’s regulators to guard against or mitigate any future financial crises, and manage systemic risk through increased supervision of systemically important financial companies (including nonbank financial companies). The Dodd-Frank Act implements numerous and far-reaching changes across the financial landscape affecting financial companies, including banks and bank holding companies such as BKFC. For a review of the various changes that the Dodd-Frank Act implements, see “Regulation and Supervision — The Dodd-Frank Act” in “Item 1. Business” of this Annual Report. Many of the rulemakings required by the various regulatory agencies are still in the process of being developed and/or implemented.
2012 Performance Overview
In 2012, BKFC was able to achieve strong operating results in a difficult banking environment. The primary factors contributing to this difficult environment included slow loan growth, compressing net interest margins and high regulatory burdens. Despite these challenges, overall improving credit metrics accompanied with modest revenue increases which more than offset higher overhead expenses, produced a 17% increase in net income available to BKFC common shareholders in 2012 as compared to 2011. The provision for loan losses decreased 35%, and total revenue increased 2%, which partially offset an increase in non-interest expense of 12% in 2012 as compared to 2011.
Although slower than the pre-recession pace, BKFC’s loan growth in 2012 was the highest organic loan growth experienced since the current recession began in 2008. Total loans increased $65 million, or 6%, with the majority of the growth occurring in the second half of 2012.
The 2012 operating results were also positively influenced by BKFC’s exit of the TARP program in 2011. Increased capital provided by available earnings allowed BKFC to repurchase the remaining $17 million TARP CPP investment in November of 2011. This repurchase accompanied with the 2010 repurchase of the first half of the TARP CPP investment led to a 100% decrease in the preferred stock dividends and amortization in 2012 as compared to 2011.
As discussed above, management believes that BKFC has benefited from the 2012 improvements in the economy. This is demonstrated in the improving credit metrics as compared to 2011. Net charge-offs decreased from $9,830,000 in 2011 to $8,720,000 in 2012 and criticized and classified loans decreased from $106,838,000 at the end of 2011 to $88,265,000 at the end of 2012.These improving credit quality metrics led the Bank to provide $7,000,000 in the provision for loans losses in 2012 compared to $10,750,000 in 2011. While net charge-offs and criticized and classified loans both decreased in 2012, they remained at a historically high level.
While the economy continued to show signs of improvement during 2012, BKFC continued to experience levels of defaults and foreclosures higher than historical levels during fiscal 2012. Such default levels have been significantly less as compared to other regions of the country. This is due, in part, to the fact that BKFC’s market in northern Kentucky and Cincinnati did not experience as dramatic a rise in real estate values over the last several years as compared to other markets, such as Florida and California. While BKFC’s local markets have not been affected as severely as other markets, management continues to closely monitor developments in the real estate market, given that the majority of the Bank’s loan portfolio is real estate related.
While the level of resources devoted to the credit review function and working out problem loans continued to be high in 2012, BKFC did not make significant changes to its loan underwriting standards. BKFC’s willingness to make loans to qualified applicants that meet its traditional, prudent lending standards has not changed.
While BKFC benefited from the slow recovery and the improving credit metrics as compared to 2011, management does not foresee a return to pre-recession levels of credit metrics, and particularly provisioning expense, in the near future. Despite the recovery, high unemployment and low real estate values continued to place significant economic strain on a majority of the Bank’s business partners. The Bank’s loan portfolio has been most significantly affected by economic conditions.
The following sections provide more detail on subjects presented in this overview.
CRITICAL ACCOUNTING POLICIES
BKFC has prepared all of the consolidated financial information in this Annual Report in accordance with U.S. Generally Accepted Accounting Principles (“GAAP”). In preparing the consolidated financial statements in accordance with GAAP, BKFC makes estimates and assumptions that affect the reported amount of assets and liabilities, disclosure of contingent assets and liabilities at the date of the financial statements, and the reported amounts of revenue and expenses during the reporting period. There can be no assurances that actual results will not differ from those estimates.
We have identified the accounting policy related to the allowance for loan losses as critical to the understanding of BKFC’s results of operations, since the application of this policy requires significant management assumptions and estimates that could result in reporting materially different amounts if conditions or underlying circumstances were to change.
The Bank maintains an allowance to absorb probable, incurred loan losses inherent in the loan portfolio. The allowance for loan losses is maintained at a level the Bank considers to be adequate and is based upon ongoing quarterly assessments and evaluations of the collectability and historical loss experience of loans. Loan losses are charged and recoveries are credited to the allowance for loan losses. Provisions for loan losses are based on the Bank’s review of its historical loan loss experience and such factors that, in management’s judgment, deserve consideration under existing economic conditions in estimating probable loan losses. The Bank’s strategy for credit risk management includes a combination of well-defined credit policies, uniform underwriting criteria, and ongoing risk monitoring and review processes for all commercial and consumer credit exposures. The credit risk management strategy also includes assessments of compliance with commercial and consumer policies, risk ratings and other important credit information. The strategy also emphasizes regular credit examinations and management reviews of loans exhibiting deterioration in credit quality. The Bank strives to identify potential problem loans early and promptly undertake the appropriate actions necessary to mitigate or eliminate the increasing risk identified in these loans.
The allowance for loan losses consists of two components, the specific reserve, pursuant to ASC 310,Accounting by Creditors for Impairment of a Loan, and the general reserve, pursuant to ASC 450-10,Accounting for Contingencies. A loan is considered impaired when, based upon current information and events, it is probable that the bank will be unable to collect all amounts due according to the contractual terms of the loan. The specific reserve component is an estimate of loss based upon an impairment review of larger loans that are considered impaired. The general reserve includes an estimate of commercial and consumer loans with similar characteristics. Depending on the set of facts with respect to a particular loan, the Bank utilizes one of the following methods for determining the proper impairment of a loan:
| · | the present value of expected future cash flows of a loan; |
| · | the market price of the loan based upon readily available information for that type of loan; and |
| · | the fair value of collateral. |
The allowance established for impaired loans is generally based, for all collateral-dependent loans, on the fair market value of the collateral, less the estimated cost to liquidate. For non-collateral dependent loans (such as accruing troubled debt restructurings), the allowance is based on the present value of expected future cash flows discounted by the loan’s effective interest rate. A small portion of the Bank’s loans which are impaired under the ASC 310 process carry no specific reserve allocation. These loans were reviewed for impairment and are considered adequately collateralized with respect to their respective outstanding principal loan balances. The majority of these loans are loans which have had their respective impairment (or specific reserve) amounts charged off, or are loans related to other impaired loans which continue to have a specific reserve allocation. It is the Bank’s practice to maintain these impaired loans, as analyzed and provided for in the ASC 310 component of the allowance for loan losses, to avoid double counting of any estimated losses that may have been included in the ASC 450-10 component of the allowance for loan losses.
Generally, the Bank orders a new or updated appraisal on real estate properties which are subject to an impairment review. Upon completion of the impairment review, loan reserves are increased as warranted. Charge-offs, if necessary, are generally recognized in a period after the reserves were established. Adjustments to new or updated appraisal values are not typically done, but in those cases when an adjustment is necessary, it is documented with supporting information and typically results in an adjustment to decrease the property’s value because of additional information obtained concerning the property after the appraisal or update has been received by the Bank. The Bank’s practice is to obtain new or updated appraisals or evaluation on the loans subject to impairment. If a new or updated appraisal is not available at the time of a loan’s impairment review, the Bank typically applies a discount to the value of an old appraisal to reflect the property’s current estimated value if there is believed to be deterioration in either (i) the physical or economic aspects of the subject property or (ii) any market conditions. Updated valuations on 1 to 4 family residential properties with small to moderate values are generally accomplished by obtaining an evaluation or appraisal. Generally, an “as is” value is utilized in most of the Bank’s real estate based impairment analyses. However, under certain limited circumstances, an “as stabilized” valuation may be utilized, provided that the “as stabilized” value is tied to a well-justified action plan to bring the real estate project to a stabilized occupancy under a reasonable period of time.
If a partially charged-off loan has been restructured in a manner that is reasonably assured of repayment and performance according to prudently modified terms, and has sustained historical payment performance for a reasonable period of time prior to and/or after the restructuring, it may be returned to accrual status and is classified as a TDR loan. However, if the above conditions can not be reasonably met, the loan remains on non-accrual status.
In addition, the Bank evaluates the collectability of both principal and interest when assessing the need for loans to be placed on non-accrual status. Non-accrual status denotes loans in which, in the opinion of management, the collection of additional interest is unlikely. A loan is generally placed on non-accrual status if: (i) it becomes 90 days or more past due or (ii) for which payment in full of both principal and interest cannot be reasonably expected.
Historical loss rates are applied to all other loans not subject to specific reserve allocations. The loss rates applied to loans are derived from analyzing the loss experience sustained on loans according to their internal risk rating. These loss rates may be adjusted to account for environmental factors. The general reserve also includes homogeneous loans, such as consumer installment, residential mortgage and home equity loans that are not individually risk graded. For these loans that are not individually risk graded, the historical loss experience of the portfolio is used to determine the appropriate allowance for the portfolios. Allocations for the allowance are established for each pool of loans based on the expected net charge-offs for one year.
In the second quarter of 2012, management developed a detailed approach to setting the environmental adjustments to the historical loss rates and discontinued the use of high and low range of reserve percentages. Management believes that this more detailed approach adds efficiencies and provides more precision to the allowance for loan losses estimations. Factors that management considers as part of this approach in setting the environmental adjustments include economic trends, loan policies, lender experience, loan growth, delinquency trend, non-performing asset trends, classified loan trends and credit concentrations.
Reserves on individual loans and historical loss rates are reviewed quarterly and adjusted as necessary based on changing borrower and/or collateral conditions, as well as actual collection and charge-off experience.
Charge-offs are recognized when it becomes evident that a loan or a portion of a loan is deemed uncollectible regardless of its delinquent status. The Bank generally charges off that portion of a loan that is determined to be unsupported by an obligor’s continued ability to repay the loan from income and/or assets, both pledged and unpledged as collateral.
FINANCIAL CONDITION
Highlighting the changes to the BKFC balance sheet from December 31, 2011 to December 31, 2012 was loan growth. In 2012, BKFC had the highest organic loan growth that it has experienced since the most recent recession. Total loans increased $65,455,000, or 6%, from the end of 2011 to the end of 2012. This contrasts to the previous two years, where total loans decreased in 2010 and were nearly flat in 2011 after the effect of the UKB transaction was taken into account. Total deposits increased $71,186,000, or 5%, from the end of 2011 to the end of 2012, while total short-term borrowings increased $12,108,000, or 41%, in the same period. Total capital increased $13,870,000, or 9%, from the end of 2011 to the end of 2012. The increase in capital was a result of increase in retained earnings, which was partially offset by a dividend of $1,270,000 declared in December of 2012 to be paid in January of 2013 in connection with BKFC’s decision to pay dividends on a quarterly basis starting in 2013. BKFC previously paid dividends on a semi-annual basis. As a result of these changes, the Bank’s total assets increased $99,380,000, or 6%, from $1,744,724,000 at December 31, 2011 to $1,844,104,000 at December 31, 2012.
Other changes on the asset side of the balance sheet included a $7,404,000, or 83%, increase in loans held for sale, and a $17,868,000, or 36%, increase in held-to-maturity securities, which was partially offset by a $8,068,000, or 3%, decrease in available-for-sale securities. The increase in loans held for sale was a result of the high level of mortgage loan refinancing activity. The increase in held-to-maturity securities was a result of purchases of Kentucky municipal bonds, while the decrease in available-for-sale securities was a result of government sponsored agency bonds being called in the low rate environment of 2012.
All of the loan portfolios except the municipal obligations increased in 2012. The largest increase in loans came from the commercial real estate portfolio, which increased $49,616,000, or 9%, which was partially offset by a $3,938,000, or 15%, decrease in the municipal obligation portfolio. Management of the Bank was encouraged by the increase in loan demand experienced in the second half of 2012 and intends to continue to make loans that meet its longstanding prudent lending standards.
The largest increase in deposits came from non-interest-bearing demand deposit accounts, which increased $68,826,000, or 24%, from 2011. Management believes that the low level of interest offered to corporate customers on alternative short-term investments contributed to the increase in non-interest-bearing accounts. The Bank also experienced a significant increase in interest-bearing transaction NOW accounts and savings accounts which increased $38,125,000, or 8%, and $26,221,000, or 27%, respectively, in 2012. The increase in NOW and savings accounts were partially offset by a $49,740,000, or 12%, decrease in certificates of deposit (CDs) from the end of 2011. Management believes that the lower level of interest rates offered on CDs have made them less desirable to consumers.
The following table illustrates the change in the mix of average assets during 2012 as compared to 2011 and 2010. With lower than historical loan demand and increasing deposits, the percentage of assets invested in short term investments and securities has increased from 23.7% in 2011 to 25.0% in 2012, while the percentage of assets invested in loans decreased from 66.8% in 2011 to 65.4% in 2012.
Table 1 - Average Assets 2012, 2011 and 2010 (dollars in thousands)
| Average Assets: | | 2012 | | | As a % of
total assets | | | 2011 | | | As a % of
total assets | | | 2010 | | | As a % of
total assets | |
| Cash and due from banks | | $ | 56,152 | | | | 3.3 | % | | | 49,218 | | | | 3.0 | % | | | 42,245 | | | | 2.7 | % |
| Short term investments | | | 60,367 | | | | 3.5 | % | | | 65,881 | | | | 4.0 | % | | | 57,663 | | | | 3.7 | % |
| Other interest-earning assets | | | 5,349 | | | | 0.3 | % | | | 5,204 | | | | 0.3 | % | | | 5,059 | | | | 0.3 | % |
| Securities | | | 373,029 | | | | 21.5 | % | | | 326,681 | | | | 19.7 | % | | | 236,838 | | | | 15.2 | % |
| Loans (net of allowance for loan losses) | | | 1,133,388 | | | | 65.4 | % | | | 1,106,021 | | | | 66.8 | % | | | 1,121,228 | | | | 71.8 | % |
| Premises and equipment | | | 22,986 | | | | 1.3 | % | | | 22,881 | | | | 1.4 | % | | | 23,659 | | | | 1.5 | % |
| Goodwill and acquisition intangibles | | | 24,857 | | | | 1.4 | % | | | 25,082 | | | | 1.5 | % | | | 26,180 | | | | 1.7 | % |
| Cash surrender value of life insurance | | | 33,307 | | | | 1.9 | % | | | 31,269 | | | | 1.9 | % | | | 24,717 | | | | 1.6 | % |
| Other assets | | | 24,173 | | | | 1.4 | % | | | 23,821 | | | | 1.4 | % | | | 23,752 | | | | 1.5 | % |
| Total average assets | | $ | 1,733,578 | | | | 100.0 | % | | | 1,656,058 | | | | 100.0 | % | | | 1,561,341 | | | | 100.0 | % |
RESULTS OF OPERATIONS
Summary
2012 vs. 2011. Driven by lower loan loss provisions and lower preferred stock dividends, net income available to common shareholders increased 17% from $15,517,000 for the year ended December 31, 2011, to $18,145,000 for the year ended December 31, 2012. The provision for loan losses decreased $3,750,000 from $10,750,000 in 2011 to $7,000,000 in 2012. The decrease in the provision reflected the overall improved credit metrics and slowly improving economic conditions as compared to 2011. These metrics included net charge-offs that decreased from $9,830,000 (0.88% of average loans) in 2011 to $8,720,000 (0.77% of average loans) in 2012, and criticized and classified loans that decreased 17% from $106,838,000 at December 31, 2011 to $88,263,000 at December 31, 2012. Total preferred stock dividends and discount accretion, which are not tax deductible, decreased $972,000, or 100%, from $972,000 in 2011 to nil in 2012 as a result of the TARP CPP repurchases in 2011. The operating results also included a $4,224,000, or 10%, increase in non-interest expense which was partially offset by an increase in revenue of $2,344,000, or 2%.
2011 vs. 2010. Driven by lower loan loss provisions and lower preferred stock dividends, net income available to common shareholders increased 65% from $9,425,000 for the year ended December 31, 2010, to $15,517,000 for the year ended December 31, 2011. The provision for loan losses decreased $4,750,000 from $15,500,000 in 2010 to $10,750,000 in 2011. The decrease in the provision reflected the improved credit metrics and slowly improving economic conditions as compared to 2010. These metrics included net charge-offs that decreased from $13,285,000 (1.18% of average loans) in 2010 to $9,830,000 (0.88% of average loans) in 2011, and non-performing loans that decreased from $21,062,000, or 1.90%, of loans at December 31, 2010 to $15,870,000, or 1.40%, of loans at December 31, 2011. Total preferred stock dividends and discount accretion, which are not tax deductible, decreased $1,274,000, or 57%, from $2,246,000 in 2010 to $972,000 in 2011 as a result of the TARP CPP repurchases in 2010 and 2011. The operating results also included a $2,139,000, or 3%, increase in revenue and $310,000, or 1%, decrease in non-interest expenses.
Net Interest Income
2012 vs. 2011. Net interest income grew to $56,185,000 in 2012, an increase of $647,000 (1%) over the $55,538,000 earned in 2011. As illustrated inTable 3, while the volume variance had a positive impact on net interest income, the rate variances had a negative impact on net interest income in 2012 in contrast to 2011.Table 3 shows the net interest income on a fully tax equivalent basis was positively impacted by the volume additions to the balance sheet by $2,628,000, which was partially offset by a negative rate variance by $1,818,000. As illustrated inTable 2, the net interest spread decreased by 7 basis points and the net interest margin of 3.62% for 2012 was 11 basis points lower than the 3.73% net interest margin for 2011. Contributing to the decrease in both of these measures was the current extreme low rate environment and the change in the mix of average assets as discussed above in the financial condition section of this Annual Report. The cost of interest-bearing liabilities decreased 25 basis points from 0.75% for 2011 to 0.50% for 2012, while the yield on earning assets decreased 32 basis points from 4.34% for 2011 to 4.02% for 2012. As illustrated inTable 2, average earning assets increased $68,493,000, or 5%, from 2011 to 2012, while average interest-bearing liabilities only increased $42,316,000, or 3%, in the same period. As further illustrated inTable 3, the unfavorable rate variance was driven by the decrease in interest income attributable to rate of $4,459,000 while the decrease in interest expense attributable to rate was only $2,641,000. Driving the decrease in interest income were loans, which contributed $3,588,000 or 80% of the decrease in interest income as a result of rate. BKFC is expected to be negatively affected if rates continue to fall in 2013. For more information on the Bank’s interest rate risk, see the section entitled “Asset/Liability Management and Market Risk” under “Item 7A.”
2011 vs. 2010. Net interest income grew to $55,538,000 in 2011, an increase of $2,129,000 (4%) over the $53,409,000 earned in 2010. As illustrated inTable 3, both the volume and rate variances had a positive impact on net interest income in 2011 as compared with 2010.Table 3 shows the net interest income on a fully tax equivalent basis was positively impacted by the volume additions to the balance sheet by $1,597,000 and by a positive rate variance by $727,000. As illustrated inTable 2, the net interest spread decreased by 1 basis point and the net interest margin of 3.73% for 2011 was 6 basis points lower than the 3.79% net interest margin for 2010. Contributing to the decrease in both of these measures was the change in the mix of average assets as was discussed above in the financial condition section of this Annual Report. The cost of interest-bearing liabilities decreased 36 basis points from 1.11% for 2010 to 0.75% for 2011, while the yield on earning assets decreased 37 basis points from 4.71% for 2010 to 4.34% for 2011. As illustrated inTable 2, average earning assets increased $84,458,000, or 6%, from 2010 to 2011, while average interest-bearing liabilities only increased $32,559,000, or 3%, in the same period. As further illustrated inTable 3, the favorable rate variance was driven by the decrease in interest expense attributable to rate of $3,774,000 which was offset by a $3,047,000 decrease in interest income as a result of rate. Driving the decrease in interest expense were time deposits, which contributed $2,637,000 or 70% of the decrease in interest expense as a result of rate.
Average Yield.Table 2, shown below, illustrates the Bank’s average balance sheet information and reflects the average yield on interest-earning assets, on a tax equivalent basis, and the average cost of interest-bearing liabilities for the periods indicated. Such yields and costs are derived by dividing income or expense by the average monthly balance of interest-earning assets or interest-bearing liabilities, respectively, for the years presented. Average balances are daily averages for the Bank and include nonaccruing loans in the loan portfolio, net of the allowance for loan losses.
Table 2 - Average Balance Sheet Rates 2012, 2011 and 2010 (presented on a tax equivalent basis in thousands)
| | | Year ended December 31, | |
| | | 2012 | | | 2011 | | | 2010 | |
| | | Average
outstanding
balance | | | Interest earned/
paid | | | Yield/
rate | | | Average
outstanding
balance | | | Interest earned/
paid | | | Yield/
rate | | | Average
outstanding
balance | | | Interest earned/
paid | | | Yield/
rate | |
| | | (Dollars in thousands) | |
| Interest-earning assets: | | | | | | | | | | | | | | | | | | | | | | | | | | | | | | | | | | | | |
| Loans receivable(1)(2) | | $ | 1,151,139 | | | $ | 56,196 | | | | 4.88 | % | | $ | 1,123,625 | | | $ | 58,379 | | | | 5.20 | % | | $ | 1,137,373 | | | $ | 61,535 | | | | 5.41 | |
| Securities(2) | | | 373,029 | | | | 7,412 | | | | 1.99 | | | | 326,681 | | | | 7,302 | | | | 2.24 | | | | 236,838 | | | | 5,812 | | | | 2.45 | |
| Other interest-earning assets | | | 65,716 | | | | 334 | | | | 0.51 | | | | 71,085 | | | | 372 | | | | 0.52 | | | | 62,722 | | | | 395 | | | | 0.63 | |
| Total interest-earning assets | | | 1,589,884 | | | | 63,942 | | | | 4.02 | | | | 1,521,391 | | | | 66,053 | | | | 4.34 | | | | 1,436,933 | | | | 67,742 | | | | 4.71 | |
| Non-interest-earning assets | | | 149,211 | | | | | | | | | | | | 134,667 | | | | | | | | | | | | 124,408 | | | | | | | | | |
| Total assets | | $ | 1,739,095 | | | | | | | | | | | $ | 1,656,058 | | | | | | | | | | | $ | 1,561,341 | | | | | | | | | |
| Interest-bearing liabilities: | | | | | | | | | | | | | | | | | | | | | | | | | | | | | | | | | | | | |
| Transaction accounts | | | 819,915 | | | | 1,552 | | | | 0.21 | | | | 736,323 | | | | 2,403 | | | | 0.33 | | | | 679,597 | | | | 3,012 | | | | 0.44 | |
| Time deposits | | | 378,111 | | | | 3,728 | | | | 0.93 | | | | 420,026 | | | | 5,835 | | | | 1.39 | | | | 450,712 | | | | 9,054 | | | | 2.01 | |
| Borrowings | | | 74,786 | | | | 1,059 | | | | 1.42 | | | | 74,147 | | | | 1,022 | | | | 1.38 | | | | 67,628 | | | | 1,207 | | | | 1.78 | |
| Total interest-bearing liabilities | | | 1,272,812 | | | | 6,339 | | | | 0.50 | | | | 1,230,496 | | | | 9,260 | | | | 0.75 | | | | 1,197,937 | | | | 13,273 | | | | 1.11 | |
| Non-interest-bearing liabilities | | | 302,520 | | | | | | | | | | | | 262,245 | | | | | | | | | | | | 215,427 | | | | | | | | | |
| Total liabilities | | | 1,575,332 | | | | | | | | | | | | 1,492,741 | | | | | | | | | | | | 1,413,364 | | | | | | | | | |
| | | | | | | | | | | | | | | | | | | | | | | | | | | | | | | | | | | | | |
| Shareholders’ equity | | | 163,763 | | | | | | | | | | | | 163,317 | | | | | | | | | | | | 147,977 | | | | | | | | | |
| | | | | | | | | | | | | | | | | | | | | | | | | | | | | | | | | | | | | |
| Total liabilities and shareholders’ equity | | $ | 1,739,095 | | | | | | | | | | | $ | 1,656,058 | | | | | | | | | | | $ | 1,561,341 | | | | | | | | | |
| Net interest income | | | | | | $ | 57,603 | | | | | | | | | | | $ | 56,793 | | | | | | | | | | | $ | 54,469 | | | | | |
| Interest rate spread | | | | | | | | | | | 3.52 | % | | | | | | | | | | | 3.59 | % | | | | | | | | | | | 3.60 | |
| Net interest margin (net interest income as a percent of average interest-earning assets) | | | | | | | | | | | 3.62 | % | | | | | | | | | | | 3.73 | % | | | | | | | | | | | 3.79 | |
| Effect of net free funds (the difference between the net interest margin and the interest rate spread) | | | | | | | | | | | 0.10 | % | | | | | | | | | | | 0.14 | % | | | | | | | | | | | 0.19 | |
| Average interest-earning assets to interest-bearing liabilities | | | 124.91 | % | | | | | | | | | | | 123.64 | % | | | | | | | | | | | 119.95 | % | | | | | | | | |
___________________________
| (1) | Includes non-accrual loans. |
| (2) | Income presented on a tax equivalent basis using a 35.00% tax rate in 2012, 35.00% in 2011 and 34.62% in 2010. The tax equivalent adjustment was $1,418,000, $1,255,000 and $1,060,000 in 2012, 2011 and 2010, respectively. |
Volume/Rate Analysis.Table 3 below illustrates the extent to which changes in interest rates and changes in volume of interest-earning assets and interest-bearing liabilities have affected the Bank’s interest income and expense during the periods indicated. For each category of interest-earning assets and interest-bearing liabilities, information is provided on changes attributable to: (i) changes in volume (change in volume multiplied by prior year rate); (ii) changes in rate (change in rate multiplied by prior year volume); and (iii) a combination of changes in rate and volume. The combined effects of changes in both volume and rate, which cannot be separately identified, have been allocated proportionately to the change due to volume and the change due to rate.
Table 3 – Volume/Rate Analysis (in thousands)
| | | Year ended December 31, | |
| | | 2012 vs. 2011 | | | 2011 vs. 2010 | |
| | | Increase (Decrease) Due to | | | Increase (Decrease) Due to | |
| | | Volume | | | Rate | | | Total | | | Volume | | | Rate | | | Total | |
| Interest income attributable to: | | | | | | | | | | | | | | | | | | | | | | | | |
| Loans receivable | | $ | 1,405 | | | $ | (3,588 | ) | | $ | (2,183 | ) | | $ | (737 | ) | | $ | (2,419 | ) | | $ | (3,156 | ) |
| Securities | | | 971 | | | | (861 | ) | | | 110 | | | | 2,046 | | | | (556 | ) | | | 1,490 | |
| Other interest-earning assets(1) | | | (28 | ) | | | (10 | ) | | | (38 | ) | | | 49 | | | | (72 | ) | | | (23 | ) |
| Total interest-earning assets | | | 2,348 | | | | (4,459 | ) | | | (2,111 | ) | | | 1,358 | | | | (3,047 | ) | | | (1,689 | ) |
| Interest expense attributable to: | | | | | | | | | | | | | | | | | | | | | | | | |
| Transaction accounts | | $ | 248 | | | | (907 | ) | | | (658 | ) | | $ | 235 | | | | (844 | ) | | | (609 | ) |
| Time deposits | | | (539 | ) | | | (1,762 | ) | | | (2,300 | ) | | | (582 | ) | | | (2,637 | ) | | | (3,219 | ) |
| Borrowings | | | 9 | | | | 28 | | | | 37 | | | | 108 | | | | (293 | ) | | | (185 | ) |
| Total interest-bearing liabilities | | | (282 | ) | | | (2,641 | ) | | | (2,921 | ) | | | (239 | ) | | | (3,774 | ) | | | (4,013 | ) |
| Increase (decrease) in net interest income | | $ | 2,630 | | | $ | (1,818 | ) | | $ | 810 | | | $ | 1,597 | | | $ | 727 | | | $ | 2,324 | |
______________________________
| (1) | Includes short-term investments and interest-bearing deposits in other financial institutions. |
Provision for Loan Losses
Like many other financial institutions, the Bank has been significantly affected by the national economic recession and the continued challenging economic environment. While the Bank experienced an increase in defaults and foreclosures since the recession began, the levels of such activity has been significantly less than other regions in the country due, in part, to the fact that the Bank’s market in the Northern Kentucky and Greater Cincinnati area did not experience as dramatic a rise in real estate values over the last several years as other markets.
Management believes that with the continuing economic uncertainty, high unemployment rates and low real estate values, the resulting pressure on earnings will remain above historical levels. This will include continuing higher levels of charge-offs in the loan portfolio, and as a result, higher provisions for loan losses and a higher reserve for loan losses on the balance sheet. Higher provisions for loan losses will lead to lower earnings and slower capital growth. Management also believes that the current economic conditions will lead to lower than historical levels of demand for loans.
While the economic conditions continue to be challenging, the provision for loan losses reflected the improving economy that was discussed above in the economic overview. While still well above historical levels, the credit metrics showed improvement in 2012 as compared to 2011.
2012 vs. 2011. As discussed above under “Management Overview,” the provision for loan losses reflected the slow economic recovery. The provision for loan losses was $7,000,000 for the year ended December 31, 2012, compared to $10,750,000 for 2011. The decrease of $3,750,000 (35%) reflected a decrease in the level of charge-offs, criticized and classified loans and lower specific reserves in 2012 as compared to 2011. For the year ended December 31, 2012, net charge-offs were $8,720,000, or 0.77%, of average loan balances compared to $9,830,000, or 0.88%, of average loan balances, for 2011. Criticized and classified loans decreased 17% from $106,838,000 at December 31, 2011 to $88,263,000 at December 31, 2012, and specific loan reserves decreased 16% from $7,433,000 to $6,265,000 over the same period.
As illustrated inTable 5 below, total non-accrual loans plus accruing loans past due 90 days or more were $19,283,000 (1.61% of loans outstanding) at December 31, 2012, compared to $15,870,000 (1.40% of loans outstanding) at December 31, 2011. Contributing to the increase in non-performing loans from December 31, 2011 to December 31, 2012 was one commercial relationship which added approximately $7,000,000 to non-accruing loans in the fourth quarter of 2012. This relationship was reported as an accruing restructured loan in December of 2011. Management’s evaluation of the inherent risk in the loan portfolio considers both historical losses and information regarding specific borrowers. Management continues to monitor the non-performing relationships and has established appropriate reserves.
Non-performing assets, which include non-performing loans and other real estate owned, totaled $24,679,000 at December 31, 2012 and $21,714,000 at December 31, 2011. This represented 1.34% of total assets at December 31, 2012 compared to 1.25% at December 31, 2011. While non-performing loans increased in 2012, other real estate owned decreased from $5,844,000 at December 31, 2011 to $5,396,000 at December 31, 2012. These properties are recorded at their fair value less estimated costs to sell with the difference between this value and the loan balance being recorded as a charge-off.
2011 vs. 2010. As discussed above under “Management Overview,” the provision for loan losses reflected the slow economic recovery. The provision for loan losses was $10,750,000 for the year ended December 31, 2011, compared to $15,500,000 for 2010. The decrease of $4,750,000 (31%) reflected a decrease in the level of charge-offs and lower non-performing loans in 2011 as compared to 2010. For the year ended December 31, 2011, net charge-offs were $9,830,000, or 0.88%, of average loan balances compared to 2010 figures of $13,285,000, or 1.18%, of average loan balances. As illustrated inTable 5 below, total non-accrual loans plus accruing loans past due 90 days or more were $15,870,000 (1.40% of loans outstanding) at December 31, 2011, compared to $21,062,000 (1.90% of loans outstanding) at December 31, 2010.
Non-performing assets, which include non-performing loans, other real estate owned and, totaled $21,714,000 at December 31, 2011 and $21,857,000 at December 31, 2010. This represents 1.25% of total assets at December 31, 2011 compared to 1.32% at December 31, 2010. While non-performing loans decreased in 2011, other real estate owned increased from $795,000 at December 31, 2010 to $5,844,000 at December 31, 2011. This increase was primarily the result of one commercial real estate relationship that added $3,475,000 in other real estate owned in the fourth quarter of 2011. These properties are recorded at their fair value less estimated costs to sell with the difference between this value and the loan balance being recorded as a charge-off.
Troubled Debt Restructurings (TDRs). In certain circumstances, the Bank may modify the terms of a loan to maximize the collection of amounts due. In cases where the borrower is experiencing financial difficulties or is expected to experience difficulties in the near term, concessionary modification is granted to minimize or eliminate the economic loss and to avoid foreclosure or repossession of the collateral. Modifications may include interest rate reductions, extension of the maturity date or a reduction in the principal balance. Restructured loans accrue interest as long as the borrower complies with the modified terms. Performing TDRs are loans that are paying as to the agreed upon modified terms and are not more than 30 days past due. Nonperforming TDRs are the remainder. Total performing TDRs, which are not considered non-performing loans by management, were $6,046,000 at December 31, 2012 as compared to $13,306,000 at December 31, 2012. Total nonperforming TDRs were $11,095,000 at December 31, 2012 as compared to $1,923,000 at December 31, 2012. In order to proactively manage and resolve problem loans, the Bank expects higher than normal levels of TDRs as it continues to work with relationships that show signs of stress. All TDRs are considered impaired loans and any specific reserves related to the TDRs are included in the allowance for loan losses on the balance sheet. Any additional specific reserves related to TDRs added or reduced in a period would be reflected in the provision for loan losses on the income statement for that period. Ordinarily, loans are identified as potential problem loans, through a higher risk weighting, before actually being restructured.
Allowance for Loan Losses (“ALL”). The decrease in the ALL was directionally consistent in 2012 with the improving credit metrics and the slow economic recovery. The ALL decreased 9%, from $18,288,000 at December 31, 2011 to $16,568,000 at December 31, 2012, which decreased the allowance for loan losses as a percentage of total loans from 1.62% at December 31, 2011, to 1.39% at December 31, 2012. The amount of the allowance allocated to impaired loans at year end 2012 was $6,265,000, which was down 16% from the $7,443,000 at year end 2011. The amount of the allowance allocated to specific pools of loans based on risk ratings also declined in 2012. This decrease was a result of the reduction in the volume of criticized and classified loans, which did not have specific allocations, from the end of 2011 to the end of 2012. The impairment process is described in the critical accounting policies section of this Annual Report. While the allowance decreased in 2012, it has increased significantly since the recession began in 2008. Contributing to the increase in the allowance for loan losses over this period is the significant decrease in real estate values experienced in the current economic cycle. Management believes the current level of the ALL is sufficient to absorb probable incurred losses in the loan portfolio. Management continues to monitor the loan portfolio closely and believes the provision for loan losses is directionally consistent with the changes in the probable losses inherent in the loan portfolio from 2011 to 2012. The Bank does not originate or purchase sub-prime loans for its portfolio. Management will continue to monitor and evaluate the effects of the slumping housing market conditions and any signs of further deterioration in credit quality on the Bank’s loan portfolio. Management believes the current economic strains will continue into 2013 and expects continuing higher than normal credit losses and provisioning expense in the foreseeable future.
Monitoring loan quality and maintaining an adequate allowance is an ongoing process overseen by senior management and the loan review function. On at least a quarterly basis, a formal analysis of the adequacy of the ALL is prepared and reviewed by management and the Board of Directors. This analysis serves as a point in time assessment of the level of the ALL and serves as a basis for provisions for loan losses. The loan quality monitoring process includes assigning loan grades and the use of a watch list to identify loans of concern.
For additional information on the ALL, see the critical accounting policies section of this discussion.
Table 4 - Analysis of the allowance for loan losses for the periods indicated
| | | At December 31 | |
| | | 2012 | | | 2011 | | | 2010 | | | 2009 | | | 2008 | |
| | | (dollars in thousands) | |
| Balance of allowance at beginning of period Recoveries of loans previously charged off: | | $ | 18,288 | | | $ | 17,368 | | | $ | 15,153 | | | $ | 9,910 | | | $ | 8,505 | |
| Commercial loans | | | 1,427 | | | | 267 | | | | 229 | | | | 140 | | | | 212 | |
| Consumer loans | | | 321 | | | | 382 | | | | 487 | | | | 309 | | | | 249 | |
| Mortgage loans | | | 15 | | | | 21 | | | | 5 | | | | 2 | | | | 2 | |
| Total recoveries | | | 1,763 | | | | 670 | | | | 721 | | | | 451 | | | | 463 | |
| Loans charged off: | | | | | | | | | | | | | | | | | | | | |
| Commercial loans | | | 6,464 | | | | 8,841 | | | | 11,499 | | | | 6,310 | | | | 2,675 | |
| Consumer loans | | | 1,827 | | | | 1,288 | | | | 2,101 | | | | 1,276 | | | | 1,065 | |
| Mortgage loans | | | 2,192 | | | | 371 | | | | 406 | | | | 447 | | | | 168 | |
| Total charge-offs | | | 10,483 | | | | 10,500 | | | | 14,006 | | | | 8,033 | | | | 3,908 | |
| Net charge-offs | | | (8,720 | ) | | | (9,830 | ) | | | (13,285 | ) | | | (7,582 | ) | | | (3,445 | ) |
| Provision for loan losses | | | 7,000 | | | | 10,750 | | | | 15,500 | | | | 12,825 | | | | 4,850 | |
| Merger adjustment | | | 0 | | | | 0 | | | | 0 | | | | 0 | | | | 0 | |
| Balance of allowance at end of period | | $ | 16,568 | | | $ | 18,288 | | | $ | 17,368 | | | $ | 15,153 | | | $ | 9,910 | |
| Net charge-offs to average loans outstanding for period | | | 0.77 | % | | | 0.88 | % | | | 1.18 | % | | | 0.71 | % | | | 0.35 | % |
| Allowance at end of period to loans at end of period | | | 1.39 | % | | | 1.62 | % | | | 1.57 | % | | | 1.31 | % | | | 0.97 | % |
| Allowance to non-performing loans at end of period | | | 85.92 | % | | | 115.24 | % | | | 82.46 | % | | | 59.28 | % | | | 103.65 | % |
Table 5 - Analysis of non-performing loans for the periods indicated
| | | At December 31 | |
| | | 2012 | | | 2011 | | | 2010 | | | 2009 | | | 2008 | |
| | | (dollars in thousands) | |
| Loans accounted for on a non-accrual basis: | | | | | | | | | | | | | | | | | | | | |
| Nonresidential real estate | | $ | 12,138 | | | $ | 6,628 | | | $ | 6,311 | | | $ | 8,588 | | | $ | 2,401 | |
| Residential real estate | | | 5,243 | | | | 5,325 | | | | 4,208 | | | | 5,113 | | | | 2,325 | |
| Construction | | | 1,075 | | | | 1,897 | | | | 5,329 | | | | 7,302 | | | | 2,778 | |
| Commercial | | | 740 | | | | 1,175 | | | | 4,749 | | | | 2,712 | | | | 588 | |
| Consumer and other | | | 48 | | | | 626 | | | | 51 | | | | 111 | | | | 119 | |
| Total | | | 19,244 | | | | 15,651 | | | | 20,648 | | | | 23,826 | | | | 8,211 | |
| Accruing loans which are contractually past due 90 days or more: | | | | | | | | | | | | | | | | | | | | |
| Nonresidential real estate | | $ | - | | | $ | - | | | $ | 68 | | | $ | 220 | | | $ | 86 | |
| Residential real estate | | | 17 | | | | 112 | | | | 263 | | | | 758 | | | | 812 | |
| Construction | | | - | | | | - | | | | - | | | | 682 | | | | 0 | |
| Commercial | | | - | | | | 74 | | | | - | | | | 34 | | | | 291 | |
| Consumer and other loans | | | 22 | | | | 33 | | | | 83 | | | | 42 | | | | 161 | |
| Total | | | 39 | | | | 219 | | | | 414 | | | | 1,736 | | | | 1,350 | |
| Total non-performing loans | | $ | 19,283 | | | $ | 15,870 | | | $ | 21,062 | | | $ | 25,562 | | | $ | 9,561 | |
| Non-performing loans as a percentage of total loans | | | 1.61 | % | | | 1.40 | % | | | 1.90 | % | | | 2.21 | % | | | 0.93 | % |
| | | | | | | | | | | | | | | | | | | | | |
| Other real estate owned | | $ | 5,396 | | | $ | 5,844 | | | $ | 795 | | | $ | 1,381 | | | $ | 712 | |
| | | | | | | | | | | | | | | | | | | | | |
| Trouble debt restructured (TDR) loans: | | | | | | | | | | | | | | | | | | | | |
| Performing troubled debt restructured (TDR) loans | | $ | 6,046 | | | $ | 13,306 | | | $ | 6,135 | | | $ | 3,568 | | | $ | 575 | |
| Nonperforming trouble debt restructured (TDR) loans (included in nonaccrual loans) | | | 11,095 | | | $ | 1,923 | | | $ | 2,186 | | | $ | 3,831 | | | $ | 633 | |
| Total troubled debt restructured loans | | $ | 17,141 | | | $ | 15,229 | | | $ | 8,321 | | | $ | 7,399 | | | $ | 1,208 | |
The amount of gross interest income that would have been recorded for nonaccrual loans in 2012 if loans had been current in accordance with their original terms was $640,000 and $420,000 for 2011.
Non-Interest Income
The following table shows the components of non-interest income and the percentage changes from 2011 to 2012 and from 2010 to 2011.
Table 6 - Major components of non-interest income (dollars in thousands)
| | | Year ended December 31 | | | Percentage Increase/(Decrease) | |
| | | 2012 | | | 2011 | | | 2010 | | | 2012/2011 | | | 2011/2010 | |
| Non-interest income: | | (dollars in thousands) | |
| Service charges and fees | | $ | 9,089 | | | $ | 9,441 | | | $ | 9,889 | | | | (4 | )% | | | (5 | )% |
| Mortgage banking income | | | 2,786 | | | | 1,789 | | | | 2,646 | | | | 56 | | | | (32 | ) |
| Trust fee income | | | 2,842 | | | | 2,641 | | | | 2,373 | | | | 8 | | | | 11 | |
| Bankcard transaction revenue | | | 3,767 | | | | 3,382 | | | | 2,921 | | | | 11 | | | | 16 | |
| Company owned life insurance earnings | | | 1,185 | | | | 1,151 | | | | 959 | | | | 3 | | | | 20 | |
| Net securities gains | | | 206 | | | | 231 | | | | - | | | | 11 | | | | - | |
| Losses on other real estate owned | | | (427 | ) | | | (261 | ) | | | (65 | ) | | | 64 | | | | 302 | |
| Other | | | 2,973 | | | | 2,350 | | | | 1,991 | | | | 27 | | | | 30 | |
| | | | | | | | | | | | | | | | | | | | | |
| Total non-interest income | | $ | 22,421 | | | $ | 20,724 | | | $ | 20,714 | | | | 8 | % | | | - | % |
2012 vs. 2011. Total non-interest income increased $1,697,000, or 8%, as higher mortgage banking income, bankcard transaction revenue, trust fee income, company owned life insurance earnings more than offset lower service charges and fees on deposits and higher losses on the sale of other real estate owned property. The $997,000, or 56%, increase in mortgage banking income was driven by a sharp drop in long-term interest rates in 2012, which prompted an increase in demand for home mortgage loan refinancing. Driving the $352,000, or 4%, decrease in service charges was the lower overdraft fees. The $385,000, or 11%, increase in bankcard transaction revenue reflected consumers’ continued acceptance of electronic forms of payment and the resulting growth in usage of the Bank’s debit and credit card products. The Dodd-Frank Act excludes banks under $10 billion in assets from the rule that limits the interchange fees paid by merchants to banks for certain debit card transactions.
2011 vs. 2010. Total non-interest income slightly increased $10,000 as higher bankcard transaction revenue, trust fee income, company owned life insurance earnings and a gain of the sale of securities more than offset lower mortgage banking income, service charges and fees on deposits and higher losses on the sale of other real estate owned property. The $857,000, or 32%, decrease in mortgage banking income was driven by a sharp drop in interest rates in the fourth quarter of 2010, which prompted an increase in demand for home mortgage loan refinancing. While interest rates remain low, 2011 did not continue to see this level of refinancing activity. The $448,000, or 5%, decrease in service charges was the result of the full year effect of the new banking regulations limiting fees charged on overdrafts initiated by electronic transactions, which began in August of 2009. Contributing to the increase in company owned life insurance was the purchase of $6,500,000 in additional policies in 2011. The $461,000, or 16%, increase in bankcard transaction revenue reflected consumers continued acceptance of electronic forms of payment and the resulting growth in usage of the Bank’s debit and credit card products.
Non-Interest Expense
The following table shows the components of non-interest expense and the percentage changes from 2011 to 2012 and from 2010 to 2011.
Table 7 - Major Components of non-interest expense (in thousands)
| | | Year ended December 31 | | | Percentage Increase/(Decrease) | |
| | | 2012 | | | 2011 | | | 2010 | | | 2012/2011 | | | 2011/2010 | |
| Non-interest expense: | | (Dollars in thousands) | |
| Salaries and employee benefits | | $ | 22,953 | | | $ | 20,194 | | | $ | 19,398 | | | | 14 | % | | | 4 | % |
| Occupancy and equipment | | | 5,249 | | | | 4,897 | | | | 5,017 | | | | 7 | | | | (2 | ) |
| Data processing | | | 2,191 | | | | 1,983 | | | | 1,830 | | | | 10 | | | | 8 | |
| Advertising | | | 1,503 | | | | 1,509 | | | | 1,168 | | | | (0 | ) | | | 29 | |
| Electronic banking processing fees | | | 1,525 | | | | 1,332 | | | | 1,161 | | | | 14 | | | | 15 | |
| Outside service fees | | | 1,026 | | | | 1,037 | | | | 1,484 | | | | (1 | ) | | | (30 | ) |
| State bank taxes | | | 2,219 | | | | 2,051 | | | | 1,966 | | | | 8 | | | | 4 | |
| Other real estate owned & loan collection | | | 1,543 | | | | 1,541 | | | | 1,436 | | | | 0 | | | | 7 | |
| Amortization of intangible assets | | | 766 | | | | 858 | | | | 1,472 | | | | (11 | ) | | | (42 | ) |
| FDIC insurance | | | 1,163 | | | | 1,541 | | | | 2,242 | | | | (25 | ) | | | (31 | ) |
| Other | | | 6,200 | | | | 5,171 | | | | 5,250 | | | | 20 | | | | (2 | ) |
| | | | | | | | | | | | | | | | | | | | | |
| Total non-interest expense | | $ | 46,338 | | | $ | 42,114 | | | $ | 42,424 | | | | 10 | % | | | (1 | )% |
2012 vs. 2011.Non-interest expense increased $4,224,000 (10%), to $46,338,000 for 2012, compared to $42,114,000 for 2011. The largest increase in non-interest expense was in the salaries and benefits expense, which increased $2,759,000 (14%) in 2012 compared to 2011. The increase in salaries and benefits included $556,000 in higher accruals for bonuses, $451,000 in higher incentive expense and $335,000 in higher accruals for pension plan expense . The added bonus accrual reflects the end of the TARP restriction on bonus pay for executives, while the increased pension plan expense was the result of a lower discount rate applied to future benefits. The increase in incentive cost was related to the higher mortgage banking income. The largest decrease in non-interest expense was FDIC insurance expense, which decreased $378,000 (25%) in 2012 as compared to 2011. The Bank benefited from the provision of the Dodd-Frank Act that changed the base on which the insurance is calculated from total deposits to total assets.
2011 vs. 2010.Non-interest expense decreased $310,000 (1%), to $42,114,000 for 2011, compared to $42,424,000 for 2010. The largest decrease in non-interest expense was FDIC insurance expense which decreased $701,000 (31%) in 2011 as compared to 2010. The Bank benefited from the provision of the Dodd-Frank Act that changed the base on which the insurance is calculated from total deposits to total assets. The next largest decrease in non-interest expense was in the amortization of intangible assets which decreased $614,000 (42%) in 2011 as compared to 2010. This was the result of the amortization associated with the 2002 transaction with Peoples Bank of Northern Kentucky being fully amortized at the end of 2010. The largest increase in non-interest expense was in the salaries and benefits expense, which increased $796,000 (4%) in 2011 compared to 2010, as a result of normal merit increases. As a result of the exit of the CPP, investment management expects salaries and benefits expense to increase at a higher rate in 2012. The CPP prohibited bonuses and other types compensation from being paid to the five highest paid executives of BKFC.
Tax Expense
2012 vs. 2011 As a result of higher income before taxes, the federal income tax expense increased $214,000 (3%) to $7,123,000 for 2012 compared to $6,909,000 for 2011. The effective tax rate was 28.2% for 2012, a decrease of 1.3% from 29.5% for 2011. The decrease in effective tax rate was a result of increased tax exempt income and an additional tax credit investment which reduced taxes by $299,000 in 2012 as compared to 2011.
2011 vs. 2010 As a result of higher income before taxes, the federal income tax expense increased $2,381,000 (53%) to $6,909,000 for 2011 compared to $4,528,000 for 2010. The effective tax rate was 29.5% for 2011, an increase of 1.6% from 27.9% for 2010. The increase in effective tax rate was a result of income before taxes increasing by 44%, while tax exempt income increased by 18%.
Contractual Obligations and Off-Balance Sheet Arrangements
The Bank enters into certain contractual obligations in the ordinary course of operations.Table 8 presents, as of December 31, 2012, the Bank’s significant fixed and determinable contractual obligations by payment date. The required payments under these contracts represent future cash requirements of the Bank. The payment amounts represent those amounts due to the recipient.
Table 8 - Contractual obligations (dollars in thousands)
| | | Maturity by Period | |
| | | Total | | | Less than 1
year | | | 1 - 3 years | | | 3 - 5 years | | | More than 5
years | |
| Certificates of deposit | | $ | 359,061 | | | $ | 238,305 | | | $ | 106,021 | | | $ | 14,735 | | | $ | - | |
| FHLB advances | | | 10,000 | | | | 5,000 | | | | 5,000 | | | | | | | | - | |
| Subordinated debentures | | | 38,557 | | | | - | | | | - | | | | - | | | | 38,557 | |
| Other notes payable | | | 158 | | | | 27 | | | | 63 | | | | 68 | | | | - | |
| Northern Kentucky University arena naming rights | | | 1,714 | | | | 857 | | | | 857 | | | | - | | | | - | |
| Gateway Community and Technical College naming rights | | | 666 | | | | 333 | | | | 333 | | | | - | | | | - | |
| Executive pension plan | | | 345 | | | | 25 | | | | 74 | | | | 49 | | | | 197 | |
| Lease commitments | | | 3,662 | | | | 871 | | | | 1,295 | | | | 496 | | | | 1,000 | |
| | | | | | | | | | | | | | | | | | | | | |
| Total | | $ | 414,163 | | | $ | 245,418 | | | $ | 113,643 | | | $ | 15,348 | | | $ | 39,754 | |
(1) Lease commitments represent the total minimum lease payments under non-cancelable leases.
In order to meet the financing needs of its customers, the Bank is also a party to certain financial instruments with off-balance sheet risk in the normal course of business. These financial instruments include commitments to extend credit and standby letters of credit, which involve, to varying degrees, elements of credit risk and interest rate risk in excess of the amounts recognized in BKFC’s consolidated balance sheets.Table 9 presents, as of December 31, 2012, the Bank’s significant off-balance sheet commitments.
Table 9 – Significant Off-Balance Sheet Commitments (in thousands)
| | | Maturity by Period | |
| | | Total | | | Less than 1
year | | | 1 - 3 years | | | 3 - 5 years | | | More than 5
years | |
| Unused lines of credit and loan commitments | | $ | 340,919 | | | $ | 204,665 | | | $ | 40,139 | | | $ | 27,257 | | | $ | 68,858 | |
| Standby letters of credit | | | 46,336 | | | | 33,645 | | | | 10,291 | | | | - | | | | 2,400 | |
| FHLB letters of credit | | | 107,000 | | | | 107,000 | | | | - | | | | - | | | | - | |
Unused lines of credit and loan commitments assure a borrower of financing for a specified period of time at a specified rate. The risk to the Bank under such commitments is limited to the terms of the contracts. For example, the Bank may not be obligated to advance funds if the customer’s financial condition deteriorates or if the customer fails to meet specific covenants. An approved, but unfunded, loan commitment represents a potential credit risk once the funds are advanced to the customer. The unused lines of credit and loan commitments also represent a future cash requirement, but this cash requirement will be limited since many commitments are expected to expire or only be used partially.
Standby letters of credit represent commitments by the Bank to repay a third-party beneficiary when a customer fails to repay a loan or debt instrument. The terms and risk of loss involved in issuing standby letters of credit are similar to those involved in issuing loan commitments and extending credit. In addition to credit risk, the letters of credit could present an immediate cash requirement if the obligations require funding.
The Bank maintains letters of credit from the FHLB to collateralize public funds deposits. These letters of credit reduce the Bank’s available borrowing line at the FHLB.
On March 3, 2005, the Bank entered into an agreement with Northern Kentucky University (the “University”) whereby the University granted to the Bank the naming rights for the new Northern Kentucky University Arena constructed on the campus of the University for a term commencing immediately upon execution of the agreement and expiring twenty years after the opening of the Arena. In consideration therefore, the Bank paid the lesser of 10% of the total construction cost of the Arena or $6,000,000, such sum to be paid in seven equal annual installments beginning after substantial completion and opening of the Arena. The cost of the naming rights will be amortized over the life of the contract commencing on the opening of the Arena, which took place in September 2008.
On November 8, 2012, the Bank entered into an agreement with Gateway Community and Technical College whereby the College granted to the Bank the naming rights for its new classroom and training center located in Boone County, Kentucky. The Bank committed $1,000,000 to the project, which will be named The Bank of Kentucky Classroom and Training Center. The cost of the naming rights will be amortized over a twenty-year period commencing at the time when the building is officially named, which is expected to take place in 2013.
Further discussion of the Bank’s contractual obligations and off-balance sheet activities is included in Note 16 of BKFC’s consolidated financial statements.
Liquidity and Capital Resources
Liquidity refers to the availability of sufficient levels of cash to fund BKFC’s operations, such as meeting deposit withdrawals, funding loan commitments, paying expenses, meeting its quarterly payment obligations under certain subordinated debentures issued by BKFC in connection with the issuance of floating rate redeemable trust preferred securities issued by BKFC’s unconsolidated trust subsidiary. The source of the funds for BKFC’s debt obligations is dependent on the Bank. During 2012, as discussed in the financial condition section of this Annual Report, the growth in securities and loans were funded by the growth in deposits. At December 31, 2012, the Bank’s customers had available $387,255,000 in unused lines and letters of credit, and the Bank has further extended loan commitments totaling $14,439,000. Historically, many such commitments have expired without being drawn and, accordingly, do not necessarily represent future cash commitments.
In 2009 BKFC filed a universal shelf registration statement on Form S-3 that was declared effective in November, 2010. This registration statement permits BKFC to engage in offerings of up to $50 million aggregate principal amount of debt securities, common stock, preferred stock, purchase contracts, units, warrants, rights and any combination of the foregoing. BKFC utilized the shelf registration to offer Common Stock in connection with the $28.1 million common Stock offering completed in November, 2010. As of the date of this Annual Report, $21.9 million of unused capacity remains available for future use. We may in the future utilize the unused portion of our existing shelf registration statement, or any future registration statements that we may file with the SEC, to conduct subsequent registered debt or equity offerings.
If needed, the Bank has the ability to borrow term and overnight funds from the FHLB or other financial intermediaries. Further, the Bank also has $314,444,000 of securities designated as available-for-sale and an additional $3,015,000 of held-to-maturity securities that mature within one year that can serve as sources of funds. Management is satisfied that BKFC’s liquidity is sufficient at December 31, 2012 to meet known and potential obligations.
As illustrated in BKFC’s statement of cash flows, the net change in cash and cash equivalents from 2012 as compared to 2011 was an increase of $15,868,000. Net income provided $18,145,000 of the $23,660,000 in the Bank’s cash flows from operating activities, while the largest cash outflow from investing activities was in the form of an increase in loans of $78,411,000. As discussed in the financial condition section of this Annual Report, the largest source of cash from financing activities came from the increase in deposits.
Both BKFC and the Bank are required to comply with capital requirements promulgated by their primary regulators. These regulations and other regulatory requirements limit the amount of dividends that may be paid by the Bank to BKFC and by BKFC to its shareholders. In 2012, BKFC paid cash dividends of $0.62 per share totaling $4,624,000 on Common Stock. Please see the section entitled “Regulation and Supervision – Dividend Restrictions” under “Item 1” and Note 18 of the financial statements for a discussion on the Bank’s current dividend restrictions.
The FDIC has issued regulations relating a bank’s deposit insurance assessment and certain aspects of its operations to specified capital levels. A “well-capitalized” bank, one with a leverage ratio of 5% or more and a Total Risk-Based Ratio of 10% or more, and no particular areas of supervisory concern, pays the lowest premium and is subject to the fewest restrictions. The Bank’s capital levels and ratios exceed the regulatory definitions of well-capitalized institutions. At December 31, 2012, BKFC’s Leverage Ratio and Total Risk-Based Ratios were 9.00% and13.28%, respectively, which exceed all required ratios established for bank holding companies.
Effect of Inflation and Changing Prices
The financial statements and related financial data presented in this Annual Report have been prepared in accordance with GAAP, which require the measurement of financial position and operating results in terms of historical dollars without considering the change in the relative purchasing power of money over time due to inflation. The primary impact of inflation on our operations is reflected in increased operating costs. Unlike most industrial companies, virtually all the assets and liabilities of a financial institution are monetary in nature. As a result, interest rates generally have a more significant impact on a financial institution’s performance than do general levels of inflation. Interest rates do not necessarily move in the same direction or to the same extent as the prices of goods andservices.
Adoption of New Accounting Standards
In July 2012, the Financial Accounting Standards Board (“FASB”) amended existing guidance for testing indefinite-lived intangible assets for impairment. The amendment permits an assessment of qualitative factors to determine whether the existence of events and circumstances indicates that it is more likely than not that the indefinite-lived intangible asset is impaired. If, after assessing the totality of events and circumstances, it is concluded that it is not more likely than not that the indefinite-lived intangible asset is impaired, then no further action is required. However, after the same assessment, if it is concluded that it is more likely than not that the indefinite-lived intangible asset is impaired, then a quantitative impairment test should be performed whereby the fair value of the indefinite-lived intangible asset is compared to the carrying amount. The amendments in this guidance are effective for annual and interim impairment tests performed for fiscal years beginning after September 15, 2012. Early adoption is permitted. The effect of adopting this standard did not have a material effect on BKFC’s operating results or financial condition.
In September 2011, the FASB amended existing guidance for goodwill impairment testing. The amendment permits an assessment of qualitative factors to determine whether the existence of events or circumstances leads to a determination that it is more likely than not that the fair value of a reporting unit is less than its carrying amount. If, after assessing these events or circumstances, it is concluded that it is not more likely than not that the fair value of a reporting unit is less than its carrying amount, then performing the two-step impairment test is unnecessary. The amendments in this guidance are effective for annual and interim goodwill impairment tests performed for fiscal years beginning after December 15, 2011. The effect of adopting this standard did not have a material effect on BKFC’s operating results or financial condition.
In June 2011, the FASB amended existing guidance and eliminated the option to present the components of other comprehensive income as part of the statement of changes in shareholders’ equity. The amendment requires that comprehensive income be presented in either a single continuous statement or in two separate consecutive statements. This update became effective for BKFC for interim and annual reporting periods beginning after December 15, 2011 and did not have a material effect on BKFC’s consolidated financial position or results of operations.
In May 2011, FASB issued an amendment to achieve common fair value measurement and disclosure requirements between U.S. and International accounting principles. Overall, the guidance is consistent with existing U.S. accounting principles; however, there are some amendments that change a particular principle or requirement for measuring fair value or for disclosing information about fair value measurements. This update became effective for BKFC for interim and annual reporting periods beginning after December 15, 2011 and did not have a material effect on BKFC’s consolidated financial position or results of operations.
Item 7A. Quantitative and Qualitative Disclosure About Market Risk
Asset/Liability Management and Market Risk
Market risk is the risk of loss arising from adverse changes in the fair value of financial instruments due to interest rate risk, exchange rate risk, equity price risk or commodity price risk. The Bank does not maintain a trading account for any class of financial instrument and is not currently subject to foreign currency exchange rate risk, equity price risk or commodity price risk. The Bank’s market risk is composed primarily of interest rate risk.
The Bank utilizes an earnings simulation model to measure and define the amount of interest rate risk it assumes. Interest rate risk is the potential for economic losses due to future interest rate changes. These economic losses can be reflected as a loss of future net interest income and/or a decline in fair market values. Interest rate risk results from the fact that the interest sensitive assets and liabilities can adjust their rates at different times and by different amounts. The goal of asset/liability management is to maintain a high, yet stable, net interest margin and to manage the effect that changes in market interest rates will have on net interest income. A common measure of interest rate risk is interest rate “gap” measurement. The gap is the difference, in dollars, between the amount of interest-earning assets and interest-bearing liabilities that will reprice within a certain time frame. Repricing can occur when an asset or liability matures or, if an adjustable rate instrument, when it can be adjusted. Typically, the measurement will focus on the interest rate gap position over the next 12 months. An institution is said to have a negative gap position when more interest-bearing liabilities reprice within a certain period than interest-earning assets, and a positive gap position when more interest-earning assets reprice than interest-bearing liabilities. Interest rate gap is considered an indicator of the effect that changing rates may have on net interest income. Generally, an institution with a negative gap will benefit from declining market interest rates and be negatively impacted by rising interest rates. The Bank currently is in a negative gap position, $123,737,000 (6.71%), and as a result would, without considering other factors, generally benefit from lower rates and be negatively impacted by higher interest rates. The ability to benefit from the Bank’s liability-sensitive position would depend on a number of factors, including: the competitive pressures on consumer deposit and loan pricing; the movement of certain deposit rate indices in relationship to asset rate indices; and the extent of the decrease in the rate environment.
At December 31, 2012, BKFC’s 12-month interest rate gap position, as measured by the Bank’s asset/liability model, was negative. Over the preceding 12 months, interest rate sensitive liabilities exceeded interest rate sensitive assets by $123,737,000 (6.71% of total assets). At December 31, 2012, interest rate sensitive liabilities exceeded interest rate sensitive assets by $139,589,000 (8.00% of total assets).
The Bank’s asset/liability management policy establishes guidelines governing the amount of interest income at risk, market value at risk and parameters for the gap position. Management continually monitors these risks through the use of gap analysis and the earnings simulation model. The simulation model is used to estimate and evaluate the impact of changing interest rates on earnings and market value. The model projects the effect of instantaneous movements in interest rates of both 100 and 200 basis points. The assumptions used in the simulation are inherently uncertain and, as a result, the model cannot precisely measure future net interest income. The results of the model are used by management to approximate the results of rate changes and do not indicate actual expected results. Actual results will differ from the model’s simulated results due to timing, frequency of interest rate changes as well as changes in various management strategies and market conditions. Additionally, actual results can differ materially from the model if interest rates do not move equally across the yield curve.
The changes in the estimates of an increasing rate scenario on the net interest income change, as shown below, from 2011 to 2012 were a result of the same influences that increased the liability sensitivity of BKFC’s gap position and show that risk to income from rate changes would be negative in a rising rate environment. Although the gap position is negative, or in a liability sensitive position, the results of the simulation show income would also decline in a falling rate environment. The effects of the estimates for a decreasing rate environment are the results of the current rate environment. In December of 2008, the FRB lowered the targeted federal funds rate to 0.25%, and as a result most short-term deposit interest rates cannot drop 100 basis points while earning assets could in theory decrease by these amounts. The result of this extreme low rate environment is a declining rate scenario which produces a negative impact on earnings.
Net interest income estimates are summarized below.
| | | Net Interest Income Change | |
| | | 2012 | | | 2011 | |
| Increase 200 bp | | | (3.38 | )% | | | (3.27 | )% |
| Increase 100 bp | | | (1.88 | ) | | | (1.50 | ) |
| Decrease 100 bp | | | (5.94 | ) | | | (5.67 | ) |
The table below provides information about the quantitative market risk of interest sensitive instruments at December 31, 2012 (dollars in thousands) and shows the contractual repricing intervals, and related average interest rates, for each of the next five years and thereafter. The amounts included in loans exclude ALL, deferred fees, in process accounts and purchase accounting adjustments:
Table 10 - Balance Sheet Repricing data (in thousands)
| Repricing in: | | 2013 | | | 2014 | | | 2015 | | | 2016-2017 | | | Thereafter | | | Total | | | Fair Value | |
| Federal Funds Sold | | $ | 76,062 | | | | - | | | | - | | | | - | | | | - | | | $ | 76,062 | | | $ | 76,062 | |
| | | | | | | | | | | | | | | | | | | | | | | | | | | | | |
| Average Interest Rate | | | 0.20 | % | | | - | | | | - | | | | - | | | | - | | | | - | | | | - | |
| | | | | | | | | | | | | | | | | | | | | | | | | | | | | |
| Interest-Bearing Deposits | | | | | | $ | 250 | | | | - | | | | - | | | | - | | | $ | 250 | | | $ | 250 | |
| | | | | | | | | | | | | | | | | | | | | | | | | | | | | |
| Average Interest Rate | | | | | | | 1.35 | % | | | - | | | | - | | | | - | | | | - | | | | - | |
| | | | | | | | | | | | | | | | | | | | | | | | | | | | | |
| Securities | | $ | 106,012 | | | $ | 82,107 | | | $ | 53,380 | | | $ | 50,389 | | | $ | 89,399 | | | $ | 381,287 | | | $ | 382,948 | |
| | | | | | | | | | | | | | | | | | | | | | | | | | | | | |
| Average Interest Rate | | | 1.93 | % | | | 1.95 | % | | | 1.86 | % | | | 2.50 | % | | | 2.23 | % | | | - | | | | - | |
| | | | | | | | | | | | | | | | | | | | | | | | | | | | | |
| FHLB Stock | | $ | 5,099 | | | | - | | | | - | | | | - | | | | - | | | $ | 5,099 | | | | N/A | |
| | | | | | | | | | | | | | | | | | | | | | | | | | | | | |
| Average Dividend Rate | | | 4.75 | % | | | - | | | | - | | | | - | | | | - | | | | - | | | | - | |
| | | | | | | | | | | | | | | | | | | | | | | | | | | | | |
| Loans | | $ | 875,252 | | | $ | 148,872 | | | $ | 85,345 | | | $ | 74,738 | | | $ | 28,401 | | | $ | 1,212,608 | | | $ | 1,216,082 | |
| | | | | | | | | | | | | | | | | | | | | | | | | | | | | |
| Average Interest Rate | | | 4.21 | % | | | 4.67 | % | | | 4.50 | % | | | 4.44 | % | | | 4.71 | % | | | - | | | | - | |
| | | | | | | | | | | | | | | | | | | | | | | | | | | | | |
| Liabilities | | | | | | | | | | | | | | | | | | | | | | | | | | | | |
| | | | | | | | | | | | | | | | | | | | | | | | | | | | | |
| Savings, NOW, MMA | | $ | 859,030 | | | | - | | | | - | | | | - | | | | - | | | $ | 859,030 | | | $ | 859,030 | |
| | | | | | | | | | | | | | | | | | | | | | | | | | | | | |
| Average Interest Rate | | | 0.24 | % | | | - | | | | - | | | | - | | | | 0.16 | % | | | - | | | | - | |
| | | | | | | | | | | | | | | | | | | | | | | | | | | | | |
| CDs and IRAs | | $ | 242,746 | | | $ | 83,050 | | | $ | 20,338 | | | $ | 12,794 | | | $ | 133 | | | $ | 359,061 | | | $ | 360,671 | |
| | | | | | | | | | | | | | | | | | | | | | | | | | | | | |
| Average Interest Rate | | | 0.72 | % | | | 0.81 | % | | | 1.24 | % | | | 1.78 | % | | | 1.97 | % | | | - | | | | - | |
| | | | | | | | | | | | | | | | | | | | | | | | | | | | | |
| Borrowings | | $ | 41,408 | | | | - | | | | - | | | | - | | | | - | | | $ | 41,408 | | | $ | 41,408 | |
| | | | | | | | | | | | | | | | | | | | | | | | | | | | | |
| Average Interest Rate | | | 0.25 | % | | | - | | | | - | | | | - | | | | - | | | | - | | | | - | |
| | | | | | | | | | | | | | | | | | | | | | | | | | | | | |
| Notes Payable | | $ | 43,000 | | | $ | 5,000 | | | | - | | | | - | | | $ | 715 | | | $ | 48,715 | | | $ | 45,953 | |
| | | | | | | | | | | | | | | | | | | | | | | | | | | | | |
| Average Interest Rate | | | 1.86 | % | | | 1.72 | % | | | - | | | | - | | | | 2.71 | % | | | - | | | | - | |
Item 8. Financial Statements and Supplementary Data
THE BANK OF KENTUCKY
FINANCIAL CORPORATION
FINANCIAL STATEMENTS
December 31, 2012, 2011 and 2010
THE BANK OF KENTUCKY FINANCIAL CORPORATION
Crestview Hills, Kentucky
FINANCIAL STATEMENTS
December 31, 2012, 2011 and 2010
CONTENTS
| REPORT OF INDEPENDENT REGISTERED PUBLIC ACCOUNTING FIRM | 57 |
| | |
| CONSOLIDATED FINANCIAL STATEMENTS | |
| | |
| CONSOLIDATED BALANCE SHEETS | 59 |
| | |
| CONSOLIDATED STATEMENTS OF INCOME | 60 |
| | |
| CONSOLIDATED STATEMENTS OF COMPREHENSIVE INCOME | 62 |
| | |
| CONSOLIDATED STATEMENTS OF CHANGES IN SHAREHOLDERS’ EQUITY | 63 |
| | |
| CONSOLIDATED STATEMENTS OF CASH FLOWS | 65 |
| | |
| NOTES TO CONSOLIDATED FINANCIAL STATEMENTS | 67 |
REPORT OF INDEPENDENT REGISTERED PUBLIC ACCOUNTING FIRM
Board of Directors and Shareholders
The Bank of Kentucky Financial Corporation
Crestview Hills, Kentucky
We have audited the accompanying consolidated balance sheets of The Bank of Kentucky Financial Corporation as of December 31, 2012 and 2011 and the related consolidated statements of income, comprehensive income, changes in shareholders’ equity, and cash flows for each of the three years in the period ended December 31, 2012. We also have audited The Bank of Kentucky Financial Corporation’s internal control over financial reporting as of December 31, 2012, based on criteria established in Internal Control – Integrated Frameworkissued by the Committee of Sponsoring Organizations of the Treadway Commission (COSO). The Bank of Kentucky Financial Corporation’s management is responsible for these financial statements, for maintaining effective internal control over financial reporting, and for its assessment of the effectiveness of internal control over financial reporting, included in Management’s Report on Internal Control over Financial Reporting included in Item 9A. Our responsibility is to express an opinion on these financial statements and an opinion on the company's internal control over financial reporting based on our audits.
We conducted our audits in accordance with the standards of the Public Company Accounting Oversight Board (United States). Those standards require that we plan and perform the audits to obtain reasonable assurance about whether the financial statements are free of material misstatement and whether effective internal control over financial reporting was maintained in all material respects. Our audits of the financial statements included examining, on a test basis, evidence supporting the amounts and disclosures in the financial statements, assessing the accounting principles used and significant estimates made by management, and evaluating the overall financial statement presentation. Our audit of internal control over financial reporting included obtaining an understanding of internal control over financial reporting, assessing the risk that a material weakness exists, and testing and evaluating the design and operating effectiveness of internal control based on the assessed risk. Our audits also included performing such other procedures as we considered necessary in the circumstances. We believe that our audits provide a reasonable basis for our opinions.
A company's internal control over financial reporting is a process designed to provide reasonable assurance regarding the reliability of financial reporting and the preparation of financial statements for external purposes in accordance with generally accepted accounting principles. A company's internal control over financial reporting includes those policies and procedures that (1) pertain to the maintenance of records that, in reasonable detail, accurately and fairly reflect the transactions and dispositions of the assets of the company; (2) provide reasonable assurance that transactions are recorded as necessary to permit preparation of financial statements in accordance with generally accepted accounting principles, and that receipts and expenditures of the company are being made only in accordance with authorizations of management and directors of the company; and (3) provide reasonable assurance regarding prevention or timely detection of unauthorized acquisition, use, or disposition of the company's assets that could have a material effect on the financial statements.
Because of its inherent limitations, internal control over financial reporting may not prevent or detect misstatements. Also, projections of any evaluation of effectiveness to future periods are subject to the risk that controls may become inadequate because of changes in conditions, or that the degree of compliance with the policies or procedures may deteriorate.
In our opinion, the consolidated financial statements referred to above present fairly, in all material respects, the financial position of The Bank of Kentucky Financial Corporation as of December 31, 2012 and 2011, and the results of its operations and its cash flows for each of the three years in the period ended December 31, 2012, in conformity with accounting principles generally accepted in the United States of America. Also in our opinion, The Bank of Kentucky Financial Corporation maintained, in all material respects, effective internal control over financial reporting as of December 31, 2012, based on criteria established inInternal Control – Integrated Frameworkissued by the COSO.
Indianapolis, Indiana
March 7, 2013
THE BANK OF KENTUCKY FINANCIAL CORPORATION
CONSOLIDATED BALANCE SHEETS
Years ended December 31, 2012 and 2011
(Dollar amounts in thousands, except per share amounts)
| | | 2012 | | | 2011 | |
| ASSETS | | | | | | | | |
| Cash and due from banks | | $ | 75,770 | | | $ | 63,046 | |
| Federal funds sold and other short-term investments | | | 76,062 | | | | 72,918 | |
| Total cash and cash equivalents | | | 151,832 | | | | 135,964 | |
| Interest bearing deposits with banks | | | 250 | | | | 250 | |
| Available-for-sale securities | | | 314,444 | | | | 322,512 | |
| Held-to-maturity securities | | | | | | | | |
| (Fair value of $68,504 and $50,643) | | | 66,843 | | | | 48,975 | |
| Loans held for sale | | | 16,324 | | | | 8,920 | |
| Loans, net of allowance ($16,568 and $18,288) | | | 1,178,841 | | | | 1,111,666 | |
| Premises and equipment-net | | | 22,494 | | | | 22,827 | |
| Federal Home Loan Bank stock, at cost | | | 5,099 | | | | 5,099 | |
| Goodwill | | | 22,023 | | | | 22,023 | |
| Acquisition intangibles | | | 2,462 | | | | 3,228 | |
| Company owned life insurance | | | 33,808 | | | | 32,850 | |
| Accrued interest receivable and other assets | | | 29,684 | | | | 30,410 | |
| | | | | | | | | |
| | | $ | 1,844,104 | | | $ | 1,744,724 | |
| LIABILITIES AND SHAREHOLDERS' EQUITY | | | | | | | | |
| Liabilities | | | | | | | | |
| Deposits | | | | | | | | |
| Noninterest bearing deposits | | $ | 351,916 | | | $ | 283,090 | |
| Interest bearing deposits | | | 1,218,091 | | | | 1,215,731 | |
| Total deposits | | | 1,570,007 | | | | 1,498,821 | |
| Short-term borrowings | | | 41,408 | | | | 29,300 | |
| Notes payable | | | 48,715 | | | | 48,739 | |
| Accrued expenses and other liabilities | | | 13,534 | | | | 11,294 | |
| | | | 1,673,664 | | | | 1,588,154 | |
| Commitments and contingent liabilities | | | | | | | | |
| Shareholders’ equity | | | | | | | | |
| Common stock, no par value, 15,000,000 shares authorized, | | | | | | | | |
| 7,470,236 (2012) and 7,432,995 (2011) shares issued | | | 3,098 | | | | 3,098 | |
| Additional paid-in capital | | | 35,126 | | | | 34,121 | |
| Retained earnings | | | 128,289 | | | | 116,038 | |
| Accumulated other comprehensive income | | | 3,927 | | | | 3,313 | |
| | | | 170,440 | | | | 156,570 | |
| | | | | | | | | |
| | | $ | 1,844,104 | | | $ | 1,744,724 | |
See accompanying notes
THE BANK OF KENTUCKY FINANCIAL CORPORATION
CONSOLIDATED STATEMENTS OF INCOME
Years ended December 31, 2012, 2011 and 2010
(Dollar amounts in thousands, except per share amounts)
| | | 2012 | | | 2011 | | | 2010 | |
| Interest income | | | | | | | | | | | | |
| Loans, including related fees | | $ | 55,468 | | | $ | 57,752 | | | $ | 61,023 | |
| Securities | | | | | | | | | | | | |
| Taxable | | | 5,440 | | | | 5,507 | | | | 4,229 | |
| Tax exempt | | | 1,282 | | | | 1,167 | | | | 1,035 | |
| Other | | | 334 | | | | 372 | | | | 395 | |
| | | | 62,524 | | | | 64,798 | | | | 66,682 | |
| Interest expense | | | | | | | | | | | | |
| Deposits | | | 5,280 | | | | 8,238 | | | | 12,066 | |
| Borrowings | | | 1,059 | | | | 1,022 | | | | 1,207 | |
| | | | 6,339 | | | | 9,260 | | | | 13,273 | |
| | | | | | | | | | | | | |
| Net interest income | | | 56,185 | | | | 55,538 | | | | 53,409 | |
| | | | | | | | | | | | | |
| Provision for loan losses | | | 7,000 | | | | 10,750 | | | | 15,500 | |
| | | | | | | | | | | | | |
| Net interest income after provision for loan losses | | | 49,185 | | | | 44,788 | | | | 37,909 | |
| | | | | | | | | | | | | |
| Non-interest income | | | | | | | | | | | | |
| Service charges and fees | | | 9,089 | | | | 9,441 | | | | 9,889 | |
| Mortgage banking income | | | 2,786 | | | | 1,789 | | | | 2,646 | |
| Trust fee income | | | 2,842 | | | | 2,641 | | | | 2,373 | |
| Bankcard transaction revenue | | | 3,767 | | | | 3,382 | | | | 2,921 | |
| Company owned life insurance earnings | | | 1,185 | | | | 1,151 | | | | 959 | |
| Net securities gains | | | 206 | | | | 231 | | | | - | |
| Other | | | 2,546 | | �� | | 2,089 | | | | 1,926 | |
| | | | 22,421 | | | | 20,724 | | | | 20,714 | |
| Non-interest expense | | | | | | | | | | | | |
| Salaries and employee benefits | | | 22,953 | | | | 20,194 | | | | 19,398 | |
| Occupancy and equipment | | | 5,249 | | | | 4,897 | | | | 5,017 | |
| Data processing | | | 2,191 | | | | 1,983 | | | | 1,830 | |
| Advertising | | | 1,503 | | | | 1,509 | | | | 1,168 | |
| Electronic banking processing fees | | | 1,525 | | | | 1,332 | | | | 1,161 | |
| Outside service fees | | | 1,026 | | | | 1,037 | | | | 1,484 | |
| State bank taxes | | | 2,219 | | | | 2,051 | | | | 1,966 | |
| Amortization of intangible assets | | | 766 | | | | 858 | | | | 1,472 | |
| FDIC insurance | | | 1,163 | | | | 1,541 | | | | 2,242 | |
| Other | | | 7,743 | | | | 6,712 | | | | 6,686 | |
| | | | 46,338 | | | | 42,114 | | | | 42,424 | |
| Income before income taxes | | | 25,268 | | | | 23,398 | | | | 16,199 | |
| | | | | | | | | | | | | |
| Federal income taxes | | | 7,123 | | | | 6,909 | | | | 4,528 | |
| | | | | | | | | | | | | |
| Net income | | $ | 18,145 | | | $ | 16,489 | | | $ | 11,671 | |
| Preferred stock dividend and discount accretion | | | - | | | | 972 | | | | 2,246 | |
| Net income available to common shareholders | | $ | 18,145 | | | $ | 15,517 | | | $ | 9,425 | |
| Per share data | | | | | | | | | | | | |
| Earnings per share | | $ | 2.43 | | | $ | 2.09 | | | $ | 1.61 | |
| Earnings per share, assuming dilution | | $ | 2.41 | | | $ | 2.07 | | | $ | 1.61 | |
See accompanying notes.
THE BANK OF KENTUCKY FINANCIAL CORPORATION
CONSOLIDATED STATEMENTS OF COMPREHENSIVE INCOME
Years ended December 31, 2012, 2011 and 2010
(Dollar amounts in thousands, except per share amounts)
| | | 2012 | | | 2011 | | | 2010 | |
| | | | | | | | | | |
| Net income | | $ | 18,145 | | | $ | 16,489 | | | $ | 11,671 | |
| | | | | | | | | | | | | |
| Other comprehensive income: | | | | | | | | | | | | |
| Unrealized gains/losses on securities: | | | | | | | | | | | | |
| Unrealized holding gain/(loss) arising during the period | | | 1,136 | | | | 3,892 | | | | (88 | ) |
| Reclassification adjustment for losses (gains) | | | (206 | ) | | | (231 | ) | | | - | |
| Included in net income | | | - | | | | - | | | | - | |
| Tax effect | | | 316 | | | | 1,244 | | | | 30 | |
| Net of tax | | | 614 | | | | 2,417 | | | | (58 | ) |
| | | | | | | | | | | | | |
| Total other comprehensive income (loss) | | | 614 | | | | 2,417 | | | | (58 | ) |
| | | | | | | | | | | | | |
| Comprehensive income | | $ | 18,759 | | | $ | 18,906 | | | $ | 11,613 | |
See accompanying notes.
THE BANK OF KENTUCKY FINANCIAL CORPORATION
CONSOLIDATED STATEMENTS OF CHANGES IN SHAREHOLDERS' EQUITY
Years ended December 31, 2012, 2011 and 2010
(Dollar amounts in thousands, except per share amounts)
| | | | | | | | | | | | | | | | | | Accumulated | | | | |
| | | | | | | | | | | | Additional | | | | | | Other | | | | |
| | | Preferred | | | Common | | | Common | | | Paid-in | | | Retained | | | Comprehensive | | | | |
| | | Stock | | | Shares | | | Stock | | | Capital | | | Earnings | | | Income (Loss) | | | Total | |
| | | | | | | | | | | | | | | | | | | | | | |
| Balance January 1, 2010 | | $ | 33,226 | | | | 5,666,707 | | | $ | 3,098 | | | $ | 5,423 | | | $ | 98,432 | | | $ | 954 | | | $ | 141,133 | |
| | | | | | | | | | | | | | | | | | | | | | | | | | | | | |
| Comprehensive income | | | | | | | | | | | | | | | | | | | | | | | | | | | | |
| Net income | | | | | | | | | | | | | | | | | | | 11,671 | | | | | | | | 11,671 | |
| Change in net unrealized gain (loss), net of tax | | | | | | | | | | | | | | | | | | | | | | | (58 | ) | | | (58 | ) |
| Total comprehensive income | | | | | | | | | | | | | | | | | | | | | | | | | | | 11,613 | |
| Dividends declared - $0.56 per share | | | | | | | | | | | | | | | | | | | (3,174 | ) | | | | | | | (3,174 | ) |
| Dividends paid and accrued on preferred stock | | | | | | | | | | | | | | | | | | | (1,682 | ) | | | | | | | (1,682 | ) |
| Preferred stock repurchased | | | (17,000 | ) | | | | | | | | | | | | | | | | | | | | | | | (17,000 | ) |
| Stock-based compensation expense | | | | | | | | | | | | | | | 307 | | | | | | | | | | | | 307 | |
| Issuance of common shares | | | | | | | 1,765,588 | | | | | | | | 28,173 | | | | | | | | | | | | 28,173 | |
| Accretion of preferred stock discount | | | 564 | | | | | | | | | | | | | | | | (564 | ) | | | | | | | - | |
| | | | | | | | | | | | | | | | | | | | | | | | | | | | | |
| Balance December 31, 2010 | | | 16,790 | | | | 7,432,295 | | | | 3,098 | | | | 33,903 | | | | 104,683 | | | | 896 | | | | 159,370 | |
| | | | | | | | | | | | | | | | | | | | | | | | | | | | | |
| Comprehensive income | | | | | | | | | | | | | | | | | | | | | | | | | | | | |
| Net income | | | | | | | | | | | | | | | | | | | 16,489 | | | | | | | | 16,489 | |
| Change in net unrealized gain (loss), net of tax | | | | | | | | | | | | | | | | | | | | | | | 2,417 | | | | 2,417 | |
| Total comprehensive income | | | | | | | | | | | | | | | | | | | | | | | | | | | 18,906 | |
| Dividends declared- $.56 per share | | | | | | | | | | | | | | | | | | | (4,162 | ) | | | | | | | (4,162 | ) |
| Dividends paid and accrued on preferred stock | | | | | | | | | | | | | | | | | | | (762 | ) | | | | | | | (762 | ) |
| Preferred stock repurchased | | | (17,000 | ) | | | | | | | | | | | | | | | | | | | | | | | (17,000 | ) |
| Exercise of stock options | | | | | | | 700 | | | | | | | | 15 | | | | | | | | | | | | 15 | |
| Stock-based compensation expense | | | | | | | | | | | | | | | 203 | | | | | | | | | | | | 203 | |
| Accretion of preferred stock discount | | | 210 | | | | | | | | | | | | | | | | (210 | ) | | | | | | | - | |
| | | | | | | | | | | | | | | | | | | | | | | | | | | | | |
| Balance December 31, 2011 | | $ | - | | | | 7,432,995 | | | $ | 3,098 | | | $ | 34,121 | | | $ | 116,038 | | | $ | 3,313 | | | $ | 156,570 | |
(Continued)
THE BANK OF KENTUCKY FINANCIAL CORPORATION
CONSOLIDATED STATEMENTS OF CHANGES IN SHAREHOLDERS' EQUITY
Years ended December 31, 2012, 2011 and 2010
(Dollar amounts in thousands, except per share amounts)
| | | | | | | | | | | | | | | | | | Accumulated | | | | |
| | | | | | | | | | | | Additional | | | | | | Other | | | | |
| | | Preferred | | | Common | | | Common | | | Paid-in | | | Retained | | | Comprehensive | | | | |
| | | Stock | | | Shares | | | Stock | | | Capital | | | Earnings | | | Income (Loss) | | | Total | |
| | | | | | | | | | | | | | | | | | | | | | |
| Balance December 31, 2011 | | $ | - | | | | 7,432,995 | | | $ | 3,098 | | | $ | 34,121 | | | $ | 116,038 | | | $ | 3,313 | | | $ | 156,570 | |
| | | | | | | | | | | | | | | | | | | | | | | | | | | | | |
| Comprehensive income | | | | | | | | | | | | | | | | | | | | | | | | | | | | |
| Net income | | | | | | | | | | | | | | | | | | | 18,145 | | | | | | | | 18,145 | |
| Change in net unrealized gain (loss), net of tax | | | | | | | | | | | | | | | | | | | | | | | 614 | | | | 614 | |
| Total comprehensive income | | | | | | | | | | | | | | | | | | | | | | | | | | | 18,759 | |
| Dividends declared - $0.79 per share | | | | | | | | | | | | | | | | | | | (5,894 | ) | | | | | | | (5,894 | ) |
| Dividends paid and accrued on preferred stock | | | | | | | | | | | | | | | | | | | | | | | | | | | | |
| Exercise of stock options | | | | | | | 37,241 | | | | | | | | 841 | | | | | | | | | | | | 841 | |
| Stock-based compensation expense | | | | | | | | | | | | | | | 164 | | | | | | | | | | | | 164 | |
| | | | | | | | | | | | | | | | | | | | | | | | | | | | | |
| Balance December 31, 2012 | | $ | - | | | | 7,470,236 | | | $ | 3,098 | | | $ | 35,126 | | | $ | 128,289 | | | $ | 3,927 | | | $ | 170,440 | |
See accompanying notes.
THE BANK OF KENTUCKY FINANCIAL CORPORATION
CONSOLIDATED STATEMENTS OF CASH FLOWS
Years ended December 31, 2012, 2011 and 2010
(Dollar amounts in thousands)
| | | 2012 | | | 2011 | | | 2010 | |
| Cash flows from operating activities | | | | | | | | | | | | |
| Net income | | $ | 18,145 | | | $ | 16,489 | | | $ | 11,671 | |
| Adjustments to reconcile net income to net cash from operating activities | | | | | | | | | | | | |
| Depreciation, amortization, and accretion | | | 1,544 | | | | 1,002 | | | | 822 | |
| Net amortization on securities | | | 3,419 | | | | 2,453 | | | | 2,300 | |
| Provision for loan losses | | | 7,000 | | | | 10,750 | | | | 15,500 | |
| Amortization of acquisition intangibles | | | 766 | | | | 858 | | | | 1,472 | |
| Earnings on life insurance | | | (1,185 | ) | | | (1,151 | ) | | | (959 | ) |
| (Gain)/Loss on sale/write-down of other real estate | | | 485 | | | | (261 | ) | | | 67 | |
| Mortgage banking income | | | (2,786 | ) | | | (1,789 | ) | | | (2,646 | ) |
| Proceeds from loans sold | | | 187,525 | | | | 118,011 | | | | 142,219 | |
| Origination of loans held for sale | | | (192,143 | ) | | | (109,863 | ) | | | (148,054 | ) |
| Net securities gains | | | (206 | ) | | | (231 | ) | | | - | |
| Stock based compensation expense | | | 164 | | | | 203 | | | | 307 | |
| Net change in: | | | | | | | | | | | | |
| Accrued interest receivable and other assets | | | 278 | | | | (371 | ) | | | 473 | |
| Accrued expenses and other liabilities | | | 654 | | | | (901 | ) | | | (2,987 | ) |
| Net cash from operating activities | | | 23,660 | | | | 35,199 | | | | 20,185 | |
| | | | | | | | | | | | | |
| Cash flows from investing activities | | | | | | | | | | | | |
| Net change in interest bearing balances | | | - | | | | (150 | ) | | | - | |
| Proceeds from maturities and principal reductions of held-to-maturity securities | | | 4,735 | | | | 8,654 | | | | 4,909 | |
| Purchase of held-to-maturity securities | | | (22,674 | ) | | | (17,903 | ) | | | (13,979 | ) |
| Proceeds from maturities and sales of available-for-sale securities | | | 181,966 | | | | 216,785 | | | | 180,770 | |
| Purchase of available-for-sale securities | | | (176,110 | ) | | | (282,465 | ) | | | (244,746 | ) |
| Purchase of company owned life insurance | | | - | | | | (6,500 | ) | | | - | |
| Proceeds from company owned life insurance | | | 227 | | | | - | | | | - | |
| Loans made to customers, net of principal collections | | | (78,411 | ) | | | (28,440 | ) | | | 34,297 | |
| Property and equipment expenditures, net | | | (1,422 | ) | | | (981 | ) | | | (1,363 | ) |
| Proceeds from the sale of other real estate | | | 4,410 | | | | 3,424 | | | | 2,671 | |
| Net payments in acquisition | | | - | | | | 3,322 | | | | - | |
| Net cash from investing activities | | | (87,279 | ) | | | (104,254 | ) | | | (37,441 | ) |
| | | | | | | | | | | | | |
| Cash flows from financing activities | | | | | | | | | | | | |
| Net change in deposits | | | 71,186 | | | | 48,512 | | | | 79,240 | |
| Net change in short-term borrowings | | | 12,108 | | | | 5,881 | | | | 1,750 | |
| Advances on notes payable | | | - | | | | - | | | | 10,000 | |
| Redemption of preferred stock | | | - | | | | (17,000 | ) | | | (17,000 | ) |
| Payments on notes payable | | | (24 | ) | | | (22 | ) | | | (6,020 | ) |
| Dividends paid on common stock | | | (4,624 | ) | | | (4,162 | ) | | | (3,174 | ) |
| Proceeds from issuance of common stock | | | | | | | - | | | | 28,173 | |
| Dividends paid on preferred stock | | | - | | | | (869 | ) | | | (1,787 | ) |
| Proceeds from exercise of stock options | | | 841 | | | | 15 | | | | - | |
| | | | | | | | | | |
| Net cash from financing activities | | | 79,488 | | | | 32,355 | | | | 91,182 | |
| | | | | | | | | | | | | |
| Net change in cash and cash equivalents | | | 15,867 | | | | (36,700 | ) | | | 73,926 | |
| | | | | | | | | | | | | |
| Cash and cash equivalents at beginning of year | | | 135,964 | | | | 172,664 | | | | 98,738 | |
| | | | | | | | | | | | | |
| Cash and cash equivalents at end of year | | $ | 151,832 | | | $ | 135,964 | | | $ | 172,664 | |
| | | | | | | | | | | | | |
| | | | 2012 | | | | 2011 | | | | 2010 | |
| Supplemental cash flow information: | | | | | | | | | | | | |
| Cash paid for interest | | $ | 6,889 | | | $ | 10,390 | | | $ | 14,418 | |
| Cash paid for income taxes | | | 6,995 | | | | 6,765 | | | | 5,000 | |
| | | | | | | | | | | | | |
| Supplemental noncash disclosures: | | | | | | | | | | | | |
| Transfers from loans to other real estate | | $ | 4,447 | | | $ | 8,734 | | | $ | 2,152 | |
See accompanying notes.
THE BANK OF KENTUCKY FINANCIAL CORPORATION
NOTES TO CONSOLIDATED FINANCIAL STATEMENTS
December 31, 2012, 2011 and 2010
(Dollar amounts in thousands, except per share amounts)
NOTE 1 - SUMMARY OF SIGNIFICANT ACCOUNTING POLICIES
Basis of Presentation: The consolidated financial statements include the accounts of The Bank of Kentucky Financial Corporation (the Company) and its wholly owned subsidiary, The Bank of Kentucky (the Bank). Intercompany transactions are eliminated in consolidation.
Description of Business: The Company provides financial services through its subsidiary, which operates primarily in Boone, Campbell, Grant, Gallatin, Kenton and Pendleton counties in northern Kentucky and also in Greater Cincinnati, Ohio. Operations consist of generating commercial, mortgage and consumer loans and accepting deposits from customers. The loan portfolio is diversified and the ability of debtors to repay loans is not dependent upon any single industry. The majority of the institution’s loans are secured by specific items of collateral including business assets, real property and consumer assets.
Use of Estimates: To prepare financial statements in conformity with U.S. generally accepted principles, management makes estimates and assumptions based on available information. These estimates and assumptions affect the amounts reported in the financial statements and the disclosures provided, and future results could differ. The allowance for loan losses and the fair values of financial instruments are particularly subject to change.
Cash Flows: Cash and cash equivalents include cash on hand, amounts due from banks, and federal funds sold. The Company reports net cash flows for customer loan and deposit transactions, interest-bearing balances with banks, short-term borrowings with maturities of 90 days or less, and property and equipment.
Interest-Bearing Deposits in Other Financial Institutions: Interest-bearing deposits in other financial institutions mature within one year and are carried at cost.
Securities: Securities are classified as held-to-maturity and carried at amortized cost when management has the positive intent and ability to hold them to maturity. Securities are classified as available-for-sale when they might be sold before maturity. Available-for-sale securities are carried at fair value, with unrealized holding gains and losses reported in other comprehensive income, net of tax.
Interest income includes amortization of purchase premium or discount. Premiums and discounts on securities are amortized on the level-yield method without anticipating prepayments except for mortgage backed securities where prepayments are anticipated. Gains and losses on sales are based on the amortized cost of the security sold.
Management evaluates securities for other-than-temporary impairment (“OTTI”) at least on a quarterly basis, and more frequently when economic or market conditions warrant such an evaluation.
In determining OTTI, management considers many factors, including: (1) the length of time and the extent to which the fair value has been less than cost, (2) the financial condition and near-term prospects of the issuer, (3) whether the market decline was affected by macroeconomic conditions, and (4) whether the Company has the intent to sell the debt security or more likely than not will be required to sell the debt security before its anticipated recovery. The assessment of whether an other-than temporary decline exists involves a high degree of subjectivity and judgment and is based on the information available to management at a point in time.
(Continued)
THE BANK OF KENTUCKY FINANCIAL CORPORATION
NOTES TO CONSOLIDATED FINANCIAL STATEMENTS
December 31, 2012, 2011 and 2010
(Dollar amounts in thousands, except per share amounts)
NOTE 1 - SUMMARY OF SIGNIFICANT ACCOUNTING POLICIES(Continued)
When OTTI occurs, the amount of the OTTI recognized in earnings depends on whether an entity intends to sell the security or more likely than not will be required to sell the security before recovery of its amortized cost basis less any current-period credit loss. If an entity intends to sell or more likely than not will be required to sell the security before recovery of its amortized cost basis less any current-period credit loss, the OTTI shall be recognized in earnings equal to the entire difference between the investment’s amortized cost basis and its fair value at the balance sheet date. Otherwise, the OTTI shall be separated into the amount representing the credit loss and the amount related to all other factors. The amount of the total OTTI related to the credit loss is determined based on the present value of cash flows expected to be collected and is recognized in earnings. The amount of the total OTTI related to other factors shall be recognized in other comprehensive income, net of applicable taxes. The previous amortized cost basis less the OTTI recognized in earnings shall become the new amortized cost basis of the investment.
Loans Held For Sale: The Bank originates loans for sale to secondary market brokers. Loans held for sale are loans which have been closed and are awaiting delivery to these brokers. They are reported at the lower of cost or fair value, on an aggregate basis. Net unrealized losses, if any, are recorded as a valuation allowance and charged to earnings. Most loans are sold servicing released such that there would be no servicing asset recognized upon the sale.
Loans: Loans that management has the intent and ability to hold for the foreseeable future or until maturity or payoff are reported at the principal balance outstanding, purchase premiums and discounts, deferred loan fees and costs, and an allowance for loan losses. Interest income is accrued on the unpaid principal balance. Loan origination fees, net of certain direct origination costs, are deferred and recognized in interest income using the level-yield method without anticipating prepayments.
Interest income on mortgage and commercial loans is discontinued at the time the loan is 90 days delinquent unless the loan is well-secured and in process of collection. Interest income is not reported when full loan repayment is in doubt, typically when the loan is impaired or payments are significantly past due. Past due status is based on the contractual terms of the loan.
All interest accrued but not received for loans placed on nonaccrual is reversed against interest income. Interest received on such loans is accounted for on cost-recovery method, until qualifying for return to accrual. Loans are returned to accrual status when all the principal and interest amounts contractually due are brought current and future payments are reasonably assured.
Troubled debt restructurings (TDR’s) are separately identified for impairment disclosures and are measured at the present value of estimated future cash flows using the loan’s effective rate at inception. If a troubled debt restructuring is considered to be a collateral dependent loan, the loan is reported, net, at the fair value of the collateral. For troubled debt restructurings that subsequently default, the Company determines the amount of reserve in accordance with the accounting policy for the allowance for loan losses.
In general, once a modified loan is considered a TDR, the loan will always be considered a TDR, and therefore impaired, until it is paid in full, otherwise settled, sold or charged off. However, the Company’s policy also permits for loans to be removed from TDR status in the years following the restructuring if the following two conditions are met: (1) the restructuring agreement specifies an interest rate equal to or greater than the rate that the Company was willing to accept at the time of the restructuring for a new loan with comparable risk, and (2) the loan is performing in accordance with its restructured terms. To determine if the interest rate is a market rate, management will look at the interest rates on the Bank’s pool of similar risk graded credits. Management will also consider other financial and non-financial factors to determine if a loan can be removed from TDR status.
(Continued)
THE BANK OF KENTUCKY FINANCIAL CORPORATION
NOTES TO CONSOLIDATED FINANCIAL STATEMENTS
December 31, 2012, 2011 and 2010
(Dollar amounts in thousands, except per share amounts)
NOTE 1 - SUMMARY OF SIGNIFICANT ACCOUNTING POLICIES(Continued)
If a partially charged-off loan has been restructured in a manner that is reasonably assured of repayment and performance according to prudently modified terms, and has sustained historical payment performance for a reasonable period of time of at least six months prior to and/or after the restructuring, it may be returned to accrual status and classified as a TDR loan. However, in limited situations, the Company may restore the accrual status of a TDR loan under a shorter period of time (versus the aforementioned minimum six month post-restructuring payment performance), if the restructuring coincides with another event which substantially improves a borrower’s financial condition and ability to repay the restructured loan. Such an event might include substantial new leases in a troubled real estate project, significant new sources of business revenues (i.e. new contracts) or significant new equity contributed from a source not financed by the Company. The Company also performs a financial analysis to determine the borrower’s current capacity to repay the loan, as modified before it is returned to accrual status. However, if the above conditions cannot be reasonably met, the loan remains on non-accrual status.
Concentration of Credit Risk: Most of the Company’s business activity is with customers located within Northern Kentucky and the Cincinnati metropolitan area. Therefore, the Company’s exposure to credit risk is significantly affected by changes in the economy in this area.
Allowance for Loan Losses: The allowance for loan losses is a valuation allowance for probable incurred credit losses, increased by the provision for loan losses and decreased by charge-offs less recoveries. Management estimates the allowance balance required using past loan loss experience, the nature and volume of the portfolio, information about specific borrower situations and estimated collateral values, economic conditions, and other factors. Allocations of the allowance may be made for specific loans, but the entire allowance is available for any loan that, in management’s judgment, should be charged off. Loan losses are charged against the allowance when management believes the uncollectibility of a loan balance is confirmed.
The allowance consists of specific and general components. The specific component relates to loans that are individually classified as impaired. The general component covers both classified and non-classified loans and is based on historical loss experience adjusted for current factors. In the second quarter of 2012 management developed a detailed approach to setting the environmental adjustments to the historic loss rates and discontinued the use of high and low range of reserve percentages. Management believes that this more detailed approach adds efficiencies and provides more precision to the allowance for loan losses estimations. Factors that management considers as part of this approach in setting the environmental adjustments include economic trends, loan policies, lender experience, loan growth, delinquency trend, non-performing asset trends, classified loan trends and credit concentrations.
The general component covers non-impaired loans and is based on historical loss experience adjusted for current factors. For loans that are risk rated, the historical loss experience is determined based on the actual loss history experienced by the Company over the most recent 4 years. These loss ratios are calculated from a migration analysis of the charge offs over this period, but excludes the ratios from the most recent six month period as they are not appropriately seasoned. The loss ratios for loans designated as belonging to homogeneous pools, including smaller balance consumer loans, are calculated for a five year period and a one year period, with the higher of the two loss ratio’s currently used in the allowance calculation. These actual loss experiences are supplemented with other economic factors based on the risks present for each portfolio segment. These economic factors include consideration of the following: levels of and trends in delinquencies and impaired loans; trends in volume and terms of loans; other changes in lending policies, procedures, and practices; experience, ability, and depth of lending management and other relevant staff; national and local economic trends and conditions; industry conditions; and effects of changes in credit concentrations. These factors are consistent within each of the portfolio segments, which have been identified as: commercial, residential real estate, nonresidential real estate, construction, consumer and municipal obligations.
(Continued)
THE BANK OF KENTUCKY FINANCIAL CORPORATION
NOTES TO CONSOLIDATED FINANCIAL STATEMENTS
December 31, 2012, 2011 and 2010
(Dollar amounts in thousands, except per share amounts)
NOTE 1 - SUMMARY OF SIGNIFICANT ACCOUNTING POLICIES(Continued)
The risk characteristics of each of the identified portfolio segments are as follows:
Commercial - Commercial loans are primarily based on the identified cash flows of the borrower and secondarily on the underlying collateral provided by the borrower. Borrowers may be subject to adverse economic conditions that can lead to decreases in product demand; increasing material or other production costs; interest rate increases that could have an adverse impact on profitability; non-payment of credit that has been extended under normal vendor terms for goods sold or services extended; and interruption related to the importing or exporting of production materials or sold products.
Residential Real Estate - Residential real estate loans are secured by 1-4 family residences and are generally owner occupied, the Company generally establishes a maximum loan-to-value ratio. Home equity loans are typically secured by a subordinate interest in 1-4 family residences. These loans are subject to adverse employment conditions in the local economy leading to increased default rate; decreased market values from oversupply in a geographic area and; impact to borrowers’ ability to maintain payments in the event of incremental rate increases on adjustable rate mortgages.
Non Residential Real Estate - Nonresidential real estate loans are viewed primarily as cash flow loans and secondarily as loans secured by real estate. Commercial real estate lending typically involves higher loan principal amounts and the repayment of these loans is generally dependent on the successful operation of the property securing the loan or the business conducted on the property securing the loan. These loans are subject to adverse market conditions that cause a decrease in market value or lease ratesand; the potential for environmental impairment and the obsolescence of the location or function.
Construction - Construction loans are underwritten utilizing independent appraisal reviews, absorption rate analysis, lease rates and financial analysis of the developers and property owners. Construction loans are generally based on estimates of costs and value associated with the complete project. These loans are subject to adverse market conditions that cause a decrease in market value or absorption rates and; the potential for environmental impairment. These loans are closely monitored by on-site inspections and are considered to have higher risks than other real estate loans.
(Continued)
THE BANK OF KENTUCKY FINANCIAL CORPORATION
NOTES TO CONSOLIDATED FINANCIAL STATEMENTS
December 31, 2012, 2011 and 2010
(Dollar amounts in thousands, except per share amounts)
NOTE 1 - SUMMARY OF SIGNIFICANT ACCOUNTING POLICIES(Continued)
Consumer - Consumer loans generally consist of loans secured by personal property or unsecured loans such as credit cards. Repayment of these loans is primarily dependent on the personal income of the borrowers, who are subject to adverse employment conditions in the local economy which may lead to higher unemployment.
Municipal Obligations - Municipal obligations are generally secured by specific assets or the taxing power of the municipality. These loans are subject to adverse employment conditions in the local economy and lower real estate values which can reduce the municipality’s tax base.
A loan is impaired when, based on current information and events, it is probable that the Company will be unable to collect all amounts due according to the contractual terms of the loan agreement. Loans, for which the terms have been modified resulting in a concession, and for which the borrower is experiencing financial difficulties, are considered troubled debt restructurings and classified as impaired.
Impairment is evaluated in total for smaller-balance loans of similar nature such as residential mortgage, consumer, and credit card loans, and on an individual loan basis for other loans. Large groups of smaller balance homogeneous loans, such as consumer and residential real estate loans, are collectively evaluated for impairment, and accordingly, they are not separately identified for impairment disclosures. If a loan is impaired, a portion of the allowance is allocated so that the loan is reported, net, at the present value of estimated future cash flows using the loan’s existing rate or at the fair value of collateral if repayment is expected solely from the collateral. Troubled debt restructurings are separately identified for impairment disclosures and are measured at the present value of estimated future cash flows using the loan’s effective rate at inception. If a troubled debt restructuring is considered to be a collateral dependent loan, the loan is reported, net, at the fair value of the collateral. For troubled debt restructurings that subsequently default, the Company determines the amount of reserve in accordance with the accounting policy for the allowance for loan losses. The Company’s impairment policies are consistent across all of the loan portfolio segments. Recorded investment excludes accrued interest, due to materiality.
Premises and Equipment: Land is carried at cost. Premises and equipment are stated at cost less accumulated depreciation. Buildings and related components are depreciated using the straight-line method with useful lives ranging from 10 to 25 years. Leasehold improvements are depreciated using the straight-line method over the lesser of the useful life of the asset or the length of the lease. Furniture, fixtures and equipment are depreciated using the straight-line method with useful lives ranging from 3 to 10 years.
Transfers of Financial Assets: Transfers of financial assets are accounted for as sales, when control over the assets has been relinquished. Control over transferred assets is deemed to be surrendered when the assets have been isolated from the Company, the transferee obtains the right (free of conditions that constrain it from taking advantage of that right) to pledge or exchange the transferred assets, and the Company does not maintain effective control over the transferred assets through an agreement to repurchase them before their maturity.
Other Real Estate: Other real estate acquired through or instead of foreclosure is initially recorded at fair value less cost to sell when acquired, establishing a new cost basis. If fair value declines subsequent to foreclosure, a valuation allowance is recorded through expense. Expenses incurred in carrying other real estate are charged to operations as incurred. A total of $5,396 and $5,844 of other real estate was owned on December 31, 2012 and 2011, respectively, and included in other assets.
(Continued)
THE BANK OF KENTUCKY FINANCIAL CORPORATION
NOTES TO CONSOLIDATED FINANCIAL STATEMENTS
December 31, 2012, 2011 and 2010
(Dollar amounts in thousands, except per share amounts)
NOTE 1 - SUMMARY OF SIGNIFICANT ACCOUNTING POLICIES(Continued)
Federal Home Loan Bank (FHLB) Stock: The Bank is a member of the FHLB system. Members are required to own a certain amount of stock based on the level of borrowings and other factors, and may invest in additional
amounts. FHLB stock is carried at cost, classified as a restricted security, and periodically evaluated for impairment based on ultimate recovery of par value. Both cash and stock dividends are reported as income.
Company Owned Life Insurance: The Company has purchased life insurance policies on certain key executives. Company owned life insurance is recorded at the amount that can be realized under the insurance contract at the balance sheet date, which is the cash surrender value adjusted for other charges or other amounts due that are probable at settlement.
Goodwill and Other Intangible Assets:Goodwill resulting from business combinations prior to January 1, 2009 represents the excess of the purchase price over the fair value of the net assets of businesses acquired. Goodwill resulting from business combinations after January 1, 2009 is generally determined as the excess of the fair value of the consideration transferred plus the fair value of any non-controlling interests in the acquiree, over the fair value of the net assets acquired and liabilities assumed as of the acquisition date. Goodwill and intangible assets acquired in a purchase business combination and determined to have an indefinite useful life are not amortized, but tested for impairment at least annually, or more frequently if events and circumstances exist that indicate that a goodwill impairment test should be performed. The Company has selected June 30 as the date to perform the annual impairment test. Intangible assets with definite useful lives are amortized over their estimated useful lives to their estimated residual values. Goodwill is the only intangible asset with an indefinite life on our balance sheet.
Other intangible assets consist of core deposit, acquired customer relationship, trade name and noncompete agreement intangible assets arising from whole bank, branch and asset management business acquisitions. They are initially measured at fair value and then are amortized on an accelerated method over their estimated useful lives of four to ten years.
Prepaid FDIC Insurance: On September 29, 2009, the Federal Deposit Insurance Corporation (“FDIC”) adopted an Amended Restoration Plan to allow the Deposit Insurance Fund to return to a reserve ratio of 1.15% within eight years, as mandated by statute. As part of the Amended Restoration Plan, the FDIC amended its assessment regulations to require all institutions to prepay on December 30, 2009 their estimated risk-based insurance assessments for the fourth quarter of 2009, and for all of 2010, 2011, and 2012. At that same time, institutions were also required to pay their regular quarterly assessments for the third quarter of 2009. An institution’s quarterly risk-based deposit insurance assessments thereafter would be paid from the amount the institution prepaid until that amount was exhausted or until June 30, 2013, when any amount remaining would be returned to the institution. The prepaid assessment amount was $1,848 and $2,908 on December 30, 2012 and 2011, and is included in other assets.
Repurchase Agreements: Substantially all repurchase agreement liabilities represent amounts advanced by various customers. Securities are pledged to cover these liabilities, which are not covered by federal deposit insurance.
(Continued)
THE BANK OF KENTUCKY FINANCIAL CORPORATION
NOTES TO CONSOLIDATED FINANCIAL STATEMENTS
December 31, 2012, 2011 and 2010
(Dollar amounts in thousands, except per share amounts)
NOTE 1 - SUMMARY OF SIGNIFICANT ACCOUNTING POLICIES(Continued)
Stock-Based Compensation: Compensation cost is recognized for stock options and restricted stock units issued to directors and officers, based on the fair value of these awards at the date of grant. For stock options, a Black-Scholes model is utilized to estimate the fair value of stock options. For restricted stocks units the fair value is equal to the stock price on the day the units are granted. Compensation cost is recognized over the required service period, generally defined as the vesting period. For awards with graded vesting, compensation cost is recognized on a straight-line basis over the requisite service period for the entire award.
Income Taxes: Income tax expense is the amount of taxes payable for the current year plus or minus the change in deferred taxes. Deferred tax liabilities and assets are the expected future tax consequences of temporary differences between the carrying amounts and tax bases of assets and liabilities, computed using enacted tax rates. Recognition of deferred tax assets is limited by the establishment of a valuation allowance unless management concludes that they are more likely than not to result in future tax benefits to the Company.
A tax position is recognized as a benefit only if it is “more likely than not” that the tax position would be sustained in a tax examination, with a tax examination being presumed to occur. The amount recognized is the largest amount of tax benefit that is greater than 50% likely of being realized on examination. For tax positions not meeting the “more likely than not” test, no tax benefit is recorded. The Company recognizes interest and/or penalties related to income tax matters in income tax expense.
Loan Commitments and Related Financial Instruments: Financial instruments include credit instruments, such as commitments to make loans and standby letters of credit, issued to meet customer financing needs. The face amount of these items represents the exposure to loss, before considering customer collateral or ability to repay. Such financial instruments are recorded when they are funded. Instruments, such as standby letters of credit that are considered financial guarantees are recorded at fair value.
Fair Value of Financial Instruments: Fair values of financial instruments are estimated using relevant market information and other assumptions, as more fully disclosed in a separate note. Fair value estimates involve uncertainties and matters of significant judgment regarding interest rates, credit risk, prepayments and other factors, especially in the absence of broad markets for particular items. Changes in assumptions or in market conditions could significantly affect the estimates.
Loss Contingencies: Loss contingencies, including claims and legal actions arising in the ordinary course of business, are recorded as liabilities when the likelihood of loss is probable and an amount or range of loss can be reasonably estimated. Management does not believe there are currently such matters that will have a material effect on the financial statements.
Comprehensive Income: Comprehensive income consists of net income and other comprehensive income. Other comprehensive income includes unrealized gains and losses on securities available for sale which are also recognized as separate components of equity.
Dividend Restriction: Banking regulations require the maintenance of certain capital levels and may limit the amount of dividends which may be paid by the Bank to the Company or by the Company to its shareholders. See Note 18 for further discussion.
(Continued)
THE BANK OF KENTUCKY FINANCIAL CORPORATION
NOTES TO CONSOLIDATED FINANCIAL STATEMENTS
December 31, 2012, 2011 and 2010
(Dollar amounts in thousands, except per share amounts)
NOTE 1 - SUMMARY OF SIGNIFICANT ACCOUNTING POLICIES(Continued)
Long-term Assets: These assets are reviewed for impairment when events indicate their carrying amount may not be recoverable from future undiscounted cash flows. If impaired, the assets are recorded at fair value.
Restrictions on Cash: Cash on hand or on deposit with the Federal Reserve Bank was required to meet regulatory reserve and clearing requirements.
Business Segment: Internal financial information is reported and aggregated in one line of business, banking. While the chief decision-makers monitor the revenue streams of the various products and services, the identifiable
segments are not material and operations are managed and financial performance is evaluated on a Company-wide basis. Accordingly, all of the financial service operations are considered by management to be aggregated in one reportable operating segment.
Reclassifications: Some items in the prior year financial statements were reclassified to conform to the current presentation. Reclassifications had no material effect on the financial statements.
Derivative Financial Instruments: As a result of loans acquired through the Integra acquisition in the fourth quarter of 2009, the Bank initiated an interest rate protection program in which the Bank earns a fee by providing the Bank’s commercial loan customers the ability to swap from variable to fixed, or fixed to variable interest rates. Under these agreements the Bank enters into a variable or fixed rate loan agreement with its customer in addition to a swap agreement. The swap agreement effectively swaps the customer’s variable rate to a fixed rate or vice versa. The Bank then enters into a corresponding swap agreement with a third party in order to swap its exposure on the variable to fixed rate swap with the Bank’s customer. The agreements are considered standalone derivatives and changes in the fair value of derivatives are reported in earnings as noninterest income.
The Bank is exposed to losses if a counterparty fails to make its payments under a contract in which the Bank is in the receiving status. In this situation the Bank receives collateral from the counterparty for the fair market value of the derivative. Also, the Bank minimizes its credit risk by monitoring the credit standing of the counterparties. We anticipate the counterparties will be able to fully satisfy their obligations under these agreements.
Earnings Per Common Share: Basic earnings per common share is net income available to common shareholders divided by the weighted average number of common shares outstanding during the period. Diluted earnings per common share includes the dilutive effect of additional potential common shares issuable under stock options, restricted stock units, and warrants. Earnings and dividends per share are restated for all stock splits and stock dividends through the date of issuance of the financial statements.
Retirement Plans: Employee 401(k) and profit sharing plan expense is the amount of matching contributions. Deferred compensation and supplemental retirement plan expense allocates the benefits over years of service.
Adoption of New Accounting Standards:In July 2012, the FASB amended existing guidance for testing indefinite-lived intangible assets for impairment. The amendment permits an assessment of qualitative factors to determine whether the existence of events and circumstances indicates that it is more likely than not that the indefinite-lived intangible asset is impaired. If, after assessing the totality of events and circumstances, it is concluded that it is not more likely than not that the indefinite-lived intangible asset is impaired, then no further action is required. However, after the same assessment, if it is concluded that it is more likely than not that the indefinite-lived intangible asset is impaired, then a quantitative impairment test should be performed whereby the fair value of the indefinite-lived intangible asset is compared to the carrying amount. The amendments in this guidance are effective for annual and interim impairment tests performed for fiscal years beginning after September 15, 2012. Early adoption is permitted. The effect of adopting this standard did not have a material effect on the Company’s operating results or financial condition.
(Continued)
THE BANK OF KENTUCKY FINANCIAL CORPORATION
NOTES TO CONSOLIDATED FINANCIAL STATEMENTS
December 31, 2012, 2011 and 2010
(Dollar amounts in thousands, except per share amounts)
NOTE 1 - SUMMARY OF SIGNIFICANT ACCOUNTING POLICIES(Continued)
In September 2011, the FASB amended existing guidance for goodwill impairment testing. The amendment permits an assessment of qualitative factors to determine whether the existence of events or circumstances leads to a determination that it is more likely than not that the fair value of a reporting unit is less than its carrying amount. If, after assessing these events or circumstances, it is concluded that it is not more likely than not that the fair value of a reporting unit is less than its carrying amount, then performing the two-step impairment test is unnecessary. The amendments in this guidance are effective for annual and interim goodwill impairment tests performed for fiscal years beginning after December 15, 2011. The effect of adopting this standard did not have a material effect on the Company’s operating results or financial condition.
In June 2011, the FASB amended existing guidance and eliminated the option to present the components of other comprehensive income as part of the statement of changes in shareholders’ equity. The amendment requires that comprehensive income be presented in either a single continuous statement or in two separate consecutive statements. This update became effective for the Company for interim and annual reporting periods beginning after December 15, 2011 and did not have a material effect on the Company's consolidated financial position or results of operations.
In May 2011, the Financial Accounting Standards Board (“FASB”) issued an amendment to achieve common fair value measurement and disclosure requirements between U.S. and International accounting principles. Overall, the guidance is consistent with existing U.S. accounting principles; however, there are some amendments that change a particular principle or requirement for measuring fair value or for disclosing information about fair value measurements. This update became effective for the Company for interim and annual reporting periods beginning after December 15, 2011 and did not have a material effect on the Company's consolidated financial position or results of operations.
(Continued)
THE BANK OF KENTUCKY FINANCIAL CORPORATION
NOTES TO CONSOLIDATED FINANCIAL STATEMENTS
December 31, 2012, 2011 and 2010
(Dollar amounts in thousands, except per share amounts)
NOTE 2 - SECURITIES
The amortized cost and fair value of available for sale securities and the related gains and losses recognized in accumulated other comprehensive income (loss) was as follows:
| | | | | | Gross | | | Gross | | | | |
| | | Amortized | | | Unrealized | | | Unrealized | | | Fair | |
| Available-for-Sale | | Cost | | | Gains | | | Losses | | | Value | |
| 2012 | | | | | | | | | | | | | | | | |
| U.S. Government, federal agencies and Government sponsored enterprises | | $ | 127,416 | | | $ | 1,130 | | | $ | (69 | ) | | $ | 128,477 | |
| U.S. Government mortgage-backed | | | 180,019 | | | | 4,972 | | | | (84 | ) | | | 184,907 | |
| Corporate | | | 1,060 | | | | - | | | | - | | | | 1,060 | |
| | | | | | | | | | | | | | | | | |
| | | $ | 308,495 | | | $ | 6,102 | | | $ | (153 | ) | | $ | 314,444 | |
| | | | | | Gross | | | Gross | | | | |
| | | Amortized | | | Unrealized | | | Unrealized | | | Fair | |
| | | Cost | | | Gains | | | Losses | | | Value | |
| 2011 | | | | | | | | | | | | | | | | |
| | | | | | | | | | | | | | | | | |
| U.S. Government, federal agencies and Government sponsored enterprises | | $ | 168,104 | | | $ | 1,368 | | | $ | (12 | ) | | $ | 169,460 | |
| U.S. Government mortgage-backed | | | 148,329 | | | | 3,727 | | | | (64 | ) | | | 151,992 | |
| Corporate | | | 1,060 | | | | - | | | | - | | | | 1,060 | |
| | | | | | | | | | | | | | | | | |
| | | $ | 317,493 | | | $ | 5,095 | | | $ | (76 | ) | | $ | 322,512 | |
All mortgage-backed securities are secured by residential properties.
The amortized cost, unrecognized gains and losses, and fair value of securities held to maturity were as follows:
| | | | | | Gross | | | Gross | | | | |
| | | Amortized | | | Unrecognized | | | Unrecognized | | | Fair | |
| Held-to-Maturity | | Cost | | | Gains | | | Losses | | | Value | |
| 2012 | | | | | | | | | | | | | | | | |
| Municipal and other obligations | | $ | 66,843 | | | $ | 1,900 | | | $ | (239 | ) | | $ | 68,504 | |
| | | | | | | | | | | | | | | | | |
| 2011 | | | | | | | | | | | | | | | | |
| Municipal and other obligations | | $ | 48,975 | | | $ | 1,693 | | | $ | (25 | ) | | $ | 50,643 | |
(Continued)
THE BANK OF KENTUCKY FINANCIAL CORPORATION
NOTES TO CONSOLIDATED FINANCIAL STATEMENTS
December 31, 2012, 2011 and 2010
(Dollar amounts in thousands, except per share amounts)
NOTE 2 - SECURITIES(Continued)
The fair value of debt securities and amortized cost, if different, at year-end 2012 by contractual maturity were as follows. Securities not due at a single maturity date, primarily mortgage backed securities, are shown separately.
| | | Available-for-Sale | | | Held-to-Maturity | |
| | | Amortized | | | Fair | | | Amortized | | | Fair | |
| | | Cost | | | Value | | | Cost | | | Value | |
| | | | | | | | | | | | | |
| Due in one year or less | | $ | - | | | $ | - | | | $ | 3,015 | | | $ | 3,033 | |
| Due after one year through five years | | | 54,060 | | | | 54,630 | | | | 34,949 | | | | 35,963 | |
| Due after five years through ten years | | | 74,416 | | | | 74,907 | | | | 28,879 | | | | 29,508 | |
| Due after ten years | | | - | | | | - | | | | - | | | | - | |
| Mortgage-backed | | | 180,019 | | | | 184,907 | | | | - | | | | - | |
| | | | | | | | | | | | | | | | | |
| | | $ | 308,495 | | | $ | 314,444 | | | $ | 66,843 | | | $ | 68,504 | |
At December 31, 2012 and 2011, securities with a carrying value of $368,504 and $342,288 were pledged to secure public deposits and repurchase agreements.
The proceeds from sales and calls of securities and the associated gains are listed below:
| | | 2012 | | | 2011 | | | 2010 | |
| | | | | | | | | | |
| Proceeds | | $ | 6,944 | | | $ | 13,598 | | | $ | - | |
| Gross gains | | | 206 | | | | 231 | | | | - | |
| Gross losses | | | - | | | | - | | | | - | |
The tax provision related to these net realized gains and losses was $72, $81, and $0, respectively.
Securities with unrealized losses at year-end 2012 and 2011, aggregated by investment category and length of time that individual securities have been in a continuous unrealized loss position, were as follows:
(Continued)
THE BANK OF KENTUCKY FINANCIAL CORPORATION
NOTES TO CONSOLIDATED FINANCIAL STATEMENTS
December 31, 2012, 2011 and 2010
(Dollar amounts in thousands, except per share amounts)
NOTE 2 - SECURITIES(Continued)
| | | Less than 12 Months | | | 12 Months or More | | | Total | |
| | | Fair | | | Unrealized | | | Fair | | | Unrealized | | | Fair | | | Unrealized | |
| Description of Securities | | Value | | | Loss | | | Value | | | Loss | | | Value | | | Loss | |
| 2012 | | | | | | | | | | | | | | | | | | | | | | | | |
| U.S. Gov’t., federal agencies and Government sponsored enterprises | | $ | 11,877 | | | $ | (69 | ) | | $ | - | | | $ | - | | | $ | 11,877 | | | $ | (69 | ) |
| U.S Gov’t. mortgage-backed | | | 18,142 | | | | (84 | ) | | | - | | | | - | | | | 18,142 | | | | (84 | ) |
| Municipal & other obligations | | | 15,056 | | | | (239 | ) | | | - | | | | - | | | | 15,056 | | | | (239 | ) |
| | | | | | | | | | | | | | | | | | | | | | | | | |
| Total temporarily impaired | | $ | 45,075 | | | $ | (392 | ) | | $ | - | | | $ | - | | | $ | 45,075 | | | $ | (392 | ) |
| | | Less than 12 Months | | | 12 Months or More | | | Total | |
| | | Fair | | | Unrealized | | | Fair | | | Unrealized | | | Fair | | | Unrealized | |
| Description of Securities | | Value | | | Loss | | | Value | | | Loss | | | Value | | | Loss | |
| | | | | | | | | | | | | | | | | | | |
| 2011 | | | | | | | | | | | | | | | | | | | | | | | | |
| U.S. Gov’t., federal agencies and Government sponsored enterprises | | $ | 18,734 | | | $ | (12 | ) | | $ | - | | | $ | - | | | $ | 18,734 | | | $ | (12 | ) |
| U.S Gov’t. mortgage-backed | | | 36,707 | | | | (64 | ) | | | - | | | | - | | | | 36,707 | | | | (64 | ) |
| Municipal & other obligations | | | 3,225 | | | | (24 | ) | | | 388 | | | | (1 | ) | | | 3,613 | | | | (25 | ) |
| Total temporarily impaired | | $ | 58,666 | | | $ | (100 | ) | | $ | 388 | | | $ | (1 | ) | | $ | 59,054 | | | $ | (101 | ) |
As of December 31, 2012, the Bank’s security portfolio consisted of 237 securities, 28 of which were in an unrealized loss position; totaling $392. There was no other-than-temporary-impairment of securities as of or for the year ended December 31, 2012. Unrealized losses have not been recognized into income because the issuers’ bonds are of high credit quality (U.S. government agencies and government sponsored enterprises and “A” rated or better Kentucky municipalities), management does not have the intent to sell these securities and it is not likely that it will be required to sell the securities before their anticipated recovery.
(Continued)
THE BANK OF KENTUCKY FINANCIAL CORPORATION
NOTES TO CONSOLIDATED FINANCIAL STATEMENTS
December 31, 2012, 2011 and 2010
(Dollar amounts in thousands, except per share amounts)
NOTE 3 - LOANS
Year-end loans were as follows:
| | | 2012 | | | 2011 | |
| | | | | | | |
| Commercial | | $ | 201,384 | | | $ | 193,176 | |
| Residential real estate | | | 278,286 | | | | 266,268 | |
| Nonresidential real estate | | | 573,101 | | | | 523,485 | |
| Construction | | | 104,498 | | | | 104,788 | |
| Consumer | | | 16,447 | | | | 16,618 | |
| Municipal obligations | | | 23,128 | | | | 27,066 | |
| Gross loans | | | 1,196,844 | | | | 1,131,401 | |
| Less: Deferred loan origination fees and discount | | | (1,435 | ) | | | (1,447 | ) |
| Allowance for loan losses | | | (16,568 | ) | | | (18,288 | ) |
| | | | | | | | | |
| Net loans | | $ | 1,178,841 | | | $ | 1,111,666 | |
Certain of the Company’s directors are loan customers of the Bank. A schedule of the aggregate activity in these loans follows:
| | | 2012 | |
| | | | |
| Beginning balance | | $ | 3,973 | |
| Effect of change in composition of board | | | (350 | ) |
| New loans and advances on lines of credit | | | 15,431 | |
| Loan payments | | | (15,779 | ) |
| | | | | |
| Ending balance | | $ | 3,275 | |
(Continued)
THE BANK OF KENTUCKY FINANCIAL CORPORATION
NOTES TO CONSOLIDATED FINANCIAL STATEMENTS
December 31, 2012, 2011 and 2010
(Dollar amounts in thousands, except per share amounts)
NOTE 3 - LOANS (Continued)
The following table presents the activity in the allowance for loan losses by portfolio segment for the years ending December 31, 2012 and 2011:
| | | | | | | | | Non | | | | | | | | | | | | | |
| | | | | | Residential | | | Residential | | | | | | | | | Municipal | | | | |
| December 31, 2012 | | Commercial | | | Real estate | | | Real estate | | | Construction | | | Consumer | | | Obligations | | | Total | |
| Allowance for loan losses | | | | | | | | | | | | | | | | | | | | | | | | | | | | |
| Beginning balance | | $ | 3,207 | | | $ | 2,591 | | | $ | 7,614 | | | $ | 4,701 | | | $ | 162 | | | $ | 13 | | | $ | 18,288 | |
| Provision for loan losses | | | 303 | | | | 3,831 | | | | 1,955 | | | | (187 | ) | | | 1,070 | | | | 28 | | | | 7,000 | |
| Loans charged off | | | (975 | ) | | | (2,196 | ) | | | (2,817 | ) | | | (3,554 | ) | | | (941 | ) | | | - | | | | (10,483 | ) |
| Recoveries | | | 181 | | | | 46 | | | | 239 | | | | 1,004 | | | | 293 | | | | - | | | | 1,763 | |
| | | | | | | | | | | | | | | | | | | | | | | | | | | | | |
| Total ending allowance balance | | $ | 2,716 | | | $ | 4,272 | | | $ | 6,991 | | | $ | 1,964 | | | $ | 584 | | | $ | 41 | | | $ | 16,568 | |
| | | | | | | | | | | | | | | | | | | | | | | | | | | | | |
| Ending allowance balance attributable to loans | | | | | | | | | | | | | | | | | | | | | | | | | | | | |
| Individually evaluated for impairment | | $ | 1,266 | | | $ | 970 | | | $ | 2,540 | | | $ | 1,369 | | | $ | 120 | | | $ | - | | | $ | 6,265 | |
| Collectively evaluated for impairment | | | 1,450 | | | | 3,302 | | | | 4,451 | | | | 595 | | | | 464 | | | | 41 | | | | 10,303 | |
| | | | | | | | | | | | | | | | | | | | | | | | | | | | | |
| Total ending allowance balance | | $ | 2,716 | | | $ | 4,272 | | | $ | 6,991 | | | $ | 1,964 | | | $ | 584 | | | $ | 41 | | | $ | 16,568 | |
| | | | | | | | | | | | | | | | | | | | | | | | | | | | | |
| Loans | | | | | | | | | | | | | | | | | | | | | | | | | | | | |
| Loans individually evaluated for impairment | | $ | 1,840 | | | $ | 8,666 | | | $ | 18,076 | | | $ | 5,154 | | | $ | 120 | | | $ | - | | | $ | 33,856 | |
| Loans collectively evaluated for impairment | | | 199,544 | | | | 269,620 | | | | 555,025 | | | | 99,344 | | | | 16,327 | | | | 23,128 | | | | 1,162,988 | |
| | | | | | | | | | | | | | | | | | | | | | | | | | | | | |
| Total ending loan balance | | $ | 201,384 | | | $ | 278,286 | | | $ | 573,101 | | | $ | 104,498 | | | $ | 16,447 | | | $ | 23,128 | | | $ | 1,196,844 | |
(Continued)
THE BANK OF KENTUCKY FINANCIAL CORPORATION
NOTES TO CONSOLIDATED FINANCIAL STATEMENTS
December 31, 2012, 2011 and 2010
(Dollar amounts in thousands, except per share amounts)
NOTE 3 - LOANS (Continued)
| | | | | | | | | Non | | | | | | | | | | | | | |
| | | | | | Residential | | | Residential | | | | | | | | | Municipal | | | | |
| December 31, 2011 | | Commercial | | | Real estate | | | Real estate | | | Construction | | | Consumer | | | Obligations | | | Total | |
| Allowance for loan losses | | | | | | | | | | | | | | | | | | | | | | | | | | | | |
| Beginning balance | | $ | 3,440 | | | $ | 2,431 | | | $ | 8,126 | | | $ | 3,150 | | | $ | 166 | | | $ | 55 | | | $ | 17,368 | |
| Provision for loan losses | | | 1,919 | | | | 1,330 | | | | 3,400 | | | | 3,616 | | | | 527 | | | | (42 | ) | | | 10,750 | |
| Loans charged off | | | (2,236 | ) | | | (1,214 | ) | | | (4,076 | ) | | | (2,066 | ) | | | (908 | ) | | | - | | | | (10,500 | ) |
| Recoveries | | | 84 | | | | 44 | | | | 164 | | | | 1 | | | | 377 | | | | - | | | | 670 | |
| | | | | | | | | | | | | | | | | | | | | | | | | | | | | |
| Total ending allowance balance | | $ | 3,207 | | | $ | 2,591 | | | $ | 7,614 | | | $ | 4,701 | | | $ | 162 | | | $ | 13 | | | $ | 18,288 | |
| Ending allowance balance attributable to loans | | | | | | | | | | | | | | | | | | | | | | | | | | | | |
| Individually evaluated for impairment | | $ | 224 | | | $ | 477 | | | $ | 2,994 | | | $ | 3,748 | | | $ | - | | | $ | - | | | $ | 7,443 | |
| Collectively evaluated for impairment | | | 2,983 | | | | 2,114 | | | | 4,620 | | | | 953 | | | | 162 | | | | 13 | | | | 10,845 | |
| | | | | | | | | | | | | | | | | | | | | | | | | | | | | |
| | | $ | 3,207 | | | $ | 2,591 | | | $ | 7,614 | | | $ | 4,701 | | | $ | 162 | | | $ | 13 | | | $ | 18,288 | |
| Loans | | | | | | | | | | | | | | | | | | | | | | | | | | | | |
| Loans individually evaluated for impairment | | $ | 917 | | | $ | 6,100 | | | $ | 20,390 | | | $ | 7,854 | | | $ | - | | | $ | - | | | $ | 35,261 | |
| Loans collectively evaluated for impairment | | | 192,259 | | | | 260,168 | | | | 503,095 | | | | 96,934 | | | | 16,618 | | | | 27,066 | | | | 1,096,140 | |
| | | | | | | | | | | | | | | | | | | | | | | | | | | | | |
| Total ending loan balance | | $ | 193,176 | | | $ | 266,268 | | | $ | 523,485 | | | $ | 104,788 | | | $ | 16,618 | | | $ | 27,066 | | | $ | 1,131,401 | |
Activity in the allowance for loan losses as of December 31, 2010 was as follows:
| December 31, 2010 | | | |
| Beginning balance | | $ | 15,153 | |
| Provision charged to operations | | | 15,500 | |
| Loans charged off | | | (14,006 | ) |
| Recoveries | | | 721 | |
| | | | | |
| Ending balance | | $ | 17,368 | |
(Continued)
THE BANK OF KENTUCKY FINANCIAL CORPORATION
NOTES TO CONSOLIDATED FINANCIAL STATEMENTS
December 31, 2012, 2011 and 2010
(Dollar amounts in thousands, except per share amounts)
NOTE 3 - LOANS (Continued)
The following table presents loans individually evaluated for impairment by class of loans as of December 31, 2012:
| | | Unpaid | | | | | | Allowance for | | | Average | | | Interest | | | Cash Basis | |
| | | Principal | | | Recorded | | | Loan Losses | | | Recorded | | | Income | | | Interest | |
| | | Balance | | | Investment | | | Allocated | | | Investment | | | Recognized | | | Recognized | |
| With no related allowance recorded | | | | | | | | | | | | | | | | | | | | | | | | |
| Commercial | | $ | 28 | | | $ | 28 | | | $ | - | | | $ | 204 | | | $ | - | | | $ | - | |
| Residential real estate | | | | | | | | | | | | | | | | | | | | | | | | |
| Home equity lines of credit | | | 50 | | | | 50 | | | | - | | | | 50 | | | | - | | | | - | |
| Multifamily properties | | | - | | | | - | | | | - | | | | 211 | | | | - | | | | - | |
| Other | | | 1,922 | | | | 1,679 | | | | - | | | | 2,109 | | | | - | | | | - | |
| Nonresidential real estate | | | | | | | | | | | | | | | | | | | | | | | | |
| Owner occupied properties | | | - | | | | - | | | | - | | | | 623 | | | | - | | | | - | |
| Non owner occupied properties | | | 5,056 | | | | 4,551 | | | | - | | | | 3,417 | | | | - | | | | - | |
| Construction | | | - | | | | - | | | | - | | | | 256 | | | | - | | | | - | |
| Consumer | | | - | | | | - | | | | - | | | | - | | | | - | | | | - | |
| | | | 7,056 | | | | 6,308 | | | | - | | | | 6,870 | | | | - | | | | - | |
| With an allowance recorded | | | | | | | | | | | | | | | | | | | | | | | | |
| Commercial | | | 1,812 | | | | 1,812 | | | | 1,266 | | | | 1,075 | | | | 20 | | | | 18 | |
| Residential real estate | | | | | | | | | | | | | | | | | | | | | | | | |
| Home equity lines of credit | | | 766 | | | | 566 | | | | 212 | | | | 511 | | | | 15 | | | | 15 | |
| Multifamily properties | | | 1,320 | | | | 1,320 | | | | 248 | | | | 942 | | | | 33 | | | | 33 | |
| Other | | | 5,196 | | | | 5,051 | | | | 510 | | | | 3,670 | | | | 121 | | | | 106 | |
| Nonresidential real estate | | | | | | | | | | | | | | | | | | | | | | | | |
| Owner occupied properties | | | 9,142 | | | | 8,190 | | | | 1,644 | | | | 8,903 | | | | 250 | | | | 248 | |
| Non owner occupied properties | | | 5,876 | | | | 5,335 | | | | 896 | | | | 6,731 | | | | 194 | | | | 156 | |
| Construction | | | 6,274 | | | | 5,154 | | | | 1,369 | | | | 7,315 | | | | 207 | | | | 193 | |
| Consumer | | | 120 | | | | 120 | | | | 120 | | | | 15 | | | | 1 | | | | 1 | |
| | | | 30,506 | | | | 27,548 | | | | 6,265 | | | | 29,162 | | | | 841 | | | | 770 | |
| | | | | | | | | | | | | | | | | | | | | | | | | |
| Total | | $ | 37,562 | | | $ | 33,856 | | | $ | 6,265 | | | $ | 36,032 | | | $ | 841 | | | $ | 770 | |
(Continued)
THE BANK OF KENTUCKY FINANCIAL CORPORATION
NOTES TO CONSOLIDATED FINANCIAL STATEMENTS
December 31, 2012, 2011 and 2010
(Dollar amounts in thousands, except per share amounts)
NOTE 3 - LOANS(Continued)
The following table presents loans individually evaluated for impairment by class of loans as of December 31, 2011:
| | | Unpaid | | | | | | Allowance for | | | Average | | | Interest | | | Cash Basis | |
| | | Principal | | | Recorded | | | Loan Losses | | | Recorded | | | Income | | | Interest | |
| | | Balance | | | Investment | | | Allocated | | | Investment | | | Recognized | | | Recognized | |
| With no related allowance recorded | | | | | | | | | | | | | | | | | | | | | | | | |
| Commercial | | $ | 350 | | | $ | 310 | | | $ | - | | | $ | 341 | | | $ | - | | | $ | - | |
| Residential real estate | | | | | | | | | | | | | | | | | | | | | | | | |
| Home equity lines of credit | | | 50 | | | | 50 | | | | - | | | | 6 | | | | - | | | | - | |
| Multifamily properties | | | 538 | | | | 538 | | | | - | | | | 80 | | | | - | | | | - | |
| Other | | | 1,703 | | | | 1,703 | | | | - | | | | 1,444 | | | | - | | | | - | |
| Nonresidential real estate | | | | | | | | | | | | | | | | | | | | | | | | |
| Owner occupied properties | | | 1,101 | | | | 1,101 | | | | - | | | | 635 | | | | - | | | | - | |
| Non owner occupied properties | | | 2,122 | | | | 2,116 | | | | - | | | | 1,013 | | | | - | | | | - | |
| Construction | | | 356 | | | | 319 | | | | - | | | | 570 | | | | - | | | | - | |
| | | | 6,220 | | | | 6,137 | | | | - | | | | 4,089 | | | | - | | | | - | |
| | | | | | | | | | | | | | | | | | | | | | | | | |
| With an allowance recorded | | | | | | | | | | | | | | | | | | | | | | | | |
| Commercial | | | 733 | | | | 607 | | | | 224 | | | | 1,718 | | | | 18 | | | | 10 | |
| Residential real estate | | | | | | | | | | | | | | | | | | | | | | | | |
| Home equity lines of credit | | | - | | | | - | | | | - | | | | - | | | | - | | | | - | |
| Multifamily properties | | | - | | | | - | | | | - | | | | 800 | | | | 42 | | | | 28 | |
| Other | | | 3,859 | | | | 3,809 | | | | 477 | | | | 2,663 | | | | 78 | | | | 73 | |
| Nonresidential real estate | | | | | | | | | | | | | | | | | | | | | | | | |
| Owner occupied properties | | | 10,771 | | | | 9,798 | | | | 1,477 | | | | 4,556 | | | | 166 | | | | 106 | |
| Non owner occupied properties | | | 8,476 | | | | 7,375 | | | | 1,517 | | | | 9,933 | | | | 284 | | | | 263 | |
| Construction | | | 8,267 | | | | 7,535 | | | | 3,748 | | | | 7,934 | | | | 278 | | | | 262 | |
| | | | 32,106 | | | | 29,124 | | | | 7,443 | | | | 27,604 | | | | 866 | | | | 742 | |
| | | | | | | | | | | | | | | | | | | | | | | | | |
| Total | | $ | 38,326 | | | $ | 35,261 | | | $ | 7,443 | | | $ | 31,692 | | | $ | 866 | | | $ | 742 | |
(Continued)
THE BANK OF KENTUCKY FINANCIAL CORPORATION
NOTES TO CONSOLIDATED FINANCIAL STATEMENTS
December 31, 2012, 2011 and 2010
(Dollar amounts in thousands, except per share amounts)
NOTE 3 - LOANS(Continued)
The following table presents the aging of the recorded investment in past due loans as of December 31, 2012 and 2011 by class of loans:
| | | Loans | | | Loans over | | | | | | | | | | |
| | | 30-90 days | | | 90 days | | | | | | Loans Not | | | | |
| | | past due | | | past due | | | Nonaccrual | | | past due | | | Total | |
| December 31, 2012 | | | | | | | | | | | | | | | | | | | | |
| Commercial | | $ | 1,668 | | | $ | - | | | $ | 740 | | | $ | 198,976 | | | $ | 201,384 | |
| Residential real estate | | | | | | | | | | | | | | | | | | | | |
| Home equity lines of credit | | | 476 | | | | - | | | | 775 | | | | 98,806 | | | | 100,057 | |
| Multifamily properties | | | - | | | | - | | | | - | | | | 48,558 | | | | 48,558 | |
| Other residential real estate | | | 6,615 | | | | 17 | | | | 4,468 | | | | 118,571 | | | | 129,671 | |
| Nonresidential real estate | | | | | | | | | | | | | | | | | | | | |
| Owner occupied properties | | | 2,809 | | | | - | | | | 7,000 | | | | 278,362 | | | | 288,171 | |
| Non owner occupied properties | | | 2,788 | | | | - | | | | 5,138 | | | | 277,004 | | | | 284,930 | |
| Construction | | | 738 | | | | - | | | | 1,075 | | | | 102,685 | | | | 104,498 | |
| Consumer | | | | | | | | | | | | | | | | | | | | |
| Credit card balances | | | 32 | | | | 22 | | | | - | | | | 6,905 | | | | 6,959 | |
| Other consumer | | | 5 | | | | - | | | | 48 | | | | 9,435 | | | | 9,488 | |
| Municipal obligations | | | - | | | | - | | | | - | | | | 23,128 | | | | 23,128 | |
| | | | | | | | | | | | | | | | | | | | | |
| Total | | $ | 15,131 | | | $ | 39 | | | $ | 19,244 | | | $ | 1,162,430 | | | $ | 1,196,844 | |
| | | Loans | | | Loans over | | | | | | | | | | |
| | | 30-90 days | | | 90 days | | | | | | Loans Not | | | | |
| | | past due | | | past due | | | Nonaccrual | | | past due | | | Total | |
| December 31, 2011 | | | | | | | | | | | | | | | | | | | | |
| Commercial | | $ | 692 | | | $ | 74 | | | $ | 1,175 | | | $ | 191,235 | | | $ | 193,176 | |
| Residential real estate | | | | | | | | | | | | | | | | | | | | |
| Home equity lines of credit | | | 1,094 | | | | - | | | | 910 | | | | 92,676 | | | | 94,680 | |
| Multifamily properties | | | - | | | | - | | | | - | | | | 36,756 | | | | 36,756 | |
| Other residential real estate | | | 5,854 | | | | 112 | | | | 4,415 | | | | 124,451 | | | | 134,832 | |
| Nonresidential real estate | | | | | | | | | | | | | | | | | | | | |
| Owner occupied properties | | | 2,623 | | | | - | | | | 2,270 | | | | 247,875 | | | | 252,768 | |
| Non owner occupied properties | | | 3,942 | | | | - | | | | 4,358 | | | | 262,417 | | | | 270,717 | |
| Construction | | | 265 | | | | - | | | | 1,897 | | | | 102,626 | | | | 104,788 | |
| Consumer | | | | | | | | | | | | | | | | | | | | |
| Credit card balances | | | 60 | | | | 32 | | | | - | | | | 6,400 | | | | 6,492 | |
| Other consumer | | | 37 | | | | 1 | | | | 626 | | | | 9,462 | | | | 10,126 | |
| Municipal obligations | | | - | | | | - | | | | - | | | | 27,066 | | | | 27,066 | |
| | | | | | | | | | | | | | | | | | | | | |
| Total | | $ | 14,567 | | | $ | 219 | | | $ | 15,651 | | | $ | 1,100,964 | | | $ | 1,131,401 | |
(Continued)
THE BANK OF KENTUCKY FINANCIAL CORPORATION
NOTES TO CONSOLIDATED FINANCIAL STATEMENTS
December 31, 2012, 2011 and 2010
(Dollar amounts in thousands, except per share amounts)
NOTE 3 - LOANS (Continued)
Troubled Debt Restructurings:
The Company has allocated $2,498 and $2,074 of specific reserves to customers whose loan terms have been modified in troubled debt restructurings as of December 31, 2012 and December 31, 2011, respectively. Troubled debt restructurings totaled $17,141 and $15,229 as of December 31, 2012 and December 31, 2011, respectively. The Company has not committed to lend additional amounts as of December 31, 2012 and December 31, 2011 to customers with outstanding loans that are classified as troubled debt restructurings.
Modifications involving a reduction of the stated interest rate of the loan were for periods up to three years. Modifications involving an extension of the maturity date were for periods ranging from eight months to twelve months.
The following table presents loans by class modified as troubled debt restructurings that occurred during the year ending December 31, 2012 and 2011:
| | | 2012 | | | 2011 | |
| | | Number
Of
Loans | | | Pre-
Modification
Outstanding
Recorded
Investment | | | Post-Modification
Outstanding
Recorded
Investment | | | Number
Of
Loans | | | Pre-
Modification
Outstanding
Recorded
Investment | | | Post-
Modification
Outstanding
Recorded
Investment | |
| Troubled Debt Restructurings: | | | | | | | | | | | | | | | | | | | | | | | | |
| | | | | | | | | | | | | | | | | | | | | | | | | |
| Commercial | | | 3 | | | $ | 1,186 | | | $ | 1,177 | | | | - | | | $ | - | | | $ | - | |
| | | | | | | | | | | | | | | | | | | | | | | | | |
| Residential real estate | | | | | | | | | | | | | | | | | | | | | | | | |
| Home equity lines of credit | | | - | | | | - | | | | - | | | | - | | | | - | | | | - | |
| Multifamily properties | | | - | | | | - | | | | - | | | | - | | | | - | | | | - | |
| Other residential real estate | | | 4 | | | | 1,182 | | | | 1,180 | | | | 2 | | | | 667 | | | | 667 | |
| Nonresidential real estate | | | | | | | | | | | | | | | | | | | | | | | | |
| Owner occupied properties | | | 2 | | | | 210 | | | | 208 | | | | 3 | | | | 8,138 | | | | 7,989 | |
| Non owner occupied properties | | | 2 | | | | 2,954 | | | | 2,804 | | | | 3 | | | | 4,654 | | | | 4,650 | |
| Construction | | | 5 | | | | 3,205 | | | | 2,927 | | | | - | | | | | | | | | |
| Consumer | | | | | | | | | | | | | | | | | | | | | | | | |
| Credit card balances | | | - | | | | - | | | | - | | | | - | | | | - | | | | - | |
| Other consumer | | | - | | | | - | | | | - | | | | - | | | | - | | | | - | |
| Municipal obligations | | | - | | | | - | | | | - | | | | - | | | | - | | | | - | |
| Total | | | 16 | | | $ | 8,737 | | | $ | 8,296 | | | | 8 | | | $ | 13,459 | | | $ | 13,306 | |
(Continued)
THE BANK OF KENTUCKY FINANCIAL CORPORATION
NOTES TO CONSOLIDATED FINANCIAL STATEMENTS
December 31, 2012, 2011 and 2010
(Dollar amounts in thousands, except per share amounts)
NOTE 3 - LOANS (Continued)
The sixteen restructured notes added during 2012 for $8,296 were added as performing troubled debt restructured loans. The eight restructured notes added in 2011 for a total of $13,306 were added as performing troubled debt restructured loans.
The troubled debt restructurings described above increased the allowance for loan losses by $1,385 and resulted in charge-offs of $0 during the fourth quarter ending December 31, 2012 and charge offs of $1,112 for the year ending December 31, 2012.
The following table presents loans by class modified as troubled debt restructurings for which there was a payment default within twelve months following the modification during the period ending December 31, 2012:
Troubled Debt Restructurings
| That Subsequently Defaulted: | | Number of Loans | | | Recorded Investment | |
| | | | | | | |
| Commercial | | | 1 | | | $ | 152 | |
| Residential real estate | | | | | | | | |
| Home equity lines of credit | | | | | | | | |
| Multifamily properties | | | - | | | | - | |
| Other residential real estate | | | 1 | | | | 465 | |
| Nonresidential real estate | | | | | | | | |
| Owner occupied properties | | | 2 | | | | 6,591 | |
| Non owner occupied properties | | | 3 | | | | 3,081 | |
| Construction | | | 3 | | | | 1,695 | |
| Consumer | | | | | | | | |
| Credit card balances | | | | | | | | |
| Other consumer | | | | | | | | |
| Municipal obligations | | | - | | | | - | |
| | | | | | | | | |
| Total | | | 10 | | | $ | 11,984 | |
(Continued)
THE BANK OF KENTUCKY FINANCIAL CORPORATION
NOTES TO CONSOLIDATED FINANCIAL STATEMENTS
December 31, 2012, 2011 and 2010
(Dollar amounts in thousands, except per share amounts)
NOTE 3 - LOANS (Continued)
A loan is considered to be in payment default once it is 30 days contractually past due under the modified terms.
The troubled debt restructurings that subsequently defaulted described above increased the allowance for loan losses by $176, and resulted in charge-offs of $2,690 for the year ending December 31, 2012.
Credit Quality Indicators:
The Company categorizes loans into risk categories based on relevant information about the ability of borrowers to service their debt such as: current financial information, historical payment experience, credit documentation, public information, and current economic trends, among other factors. The Company analyzes loans individually by classifying the loans as to credit risk. This analysis includes loans with an outstanding balance greater than $100 and non-homogeneous loans, such as commercial and commercial real estate loans. This analysis is performed on a quarterly basis. The Company uses the following definitions for risk ratings:
Special Mention.Loans classified as special mention have a potential weakness that deserves management's close attention. If left uncorrected, these potential weaknesses may result in deterioration of the repayment prospects for the loan or of the institution's credit position at some future date.
Substandard. Loans classified as substandard are inadequately protected by the current net worth and paying capacity of the obligor or of the collateral pledged, if any. Loans so classified have a well-defined weakness or weaknesses that jeopardize the liquidation of the debt. They are characterized by the distinct possibility that the institution will sustain some loss if the deficiencies are not corrected.
Doubtful. Loans classified as doubtful have all the weaknesses inherent in those classified as substandard, with the added characteristic that the weaknesses make collection or liquidation in full, on the basis of currently existing facts, conditions, and values, highly questionable and improbable.
Loans not meeting the criteria above that are analyzed individually as part of the above described process are considered to be pass rated loans. Loans listed as not rated are either less than $100 or are included in group of homogeneous loans.
(Continued)
THE BANK OF KENTUCKY FINANCIAL CORPORATION
NOTES TO CONSOLIDATED FINANCIAL STATEMENTS
December 31, 2012, 2011 and 2010
(Dollar amounts in thousands, except per share amounts)
NOTE 3 - LOANS (Continued)
As of December 31, 2012 and 2011, and based on the most recent analysis performed, the risk category of loans by class of loans is as follows:
| | | | | | Special | | | | | | | | | | | | | |
| | | Pass | | | Mention | | | Substandard | | | Doubtful | | | Not Rated | | | Total | |
| December 31, 2012 | | | | | | | | | | | | | | | | | | | | | | | | |
| Commercial | | $ | 188,686 | | | $ | 8,469 | | | $ | 4,229 | | | $ | - | | | $ | - | | | $ | 201,384 | |
| Residential real estate | | | | | | | | | | | | | | | | | | | | | | | | |
| Home equity lines of credit | | | 10,840 | | | | 999 | | | | 1,388 | | | | - | | | | 86,830 | | | | 100,057 | |
| Multifamily properties | | | 45,329 | | | | 99 | | | | 3,130 | | | | - | | | | - | | | | 48,558 | |
| Other residential real estate | | | 35,922 | | | | 1,146 | | | | 10,477 | | | | - | | | | 82,126 | | | | 129,671 | |
| | | | | | | | | | | | | | | | | | | | | | | | | |
| Nonresidential real estate | | | | | | | | | | | | | | | | | | | | | | | | |
| Owner occupied properties | | | 258,816 | | | | 13,648 | | | | 15,707 | | | | - | | | | - | | | | 288,171 | |
| Non owner occupied properties | | | 264,442 | | | | 8,098 | | | | 12,390 | | | | - | | | | - | | | | 284,930 | |
| Construction | | | 96,154 | | | | 2,264 | | | | 6,080 | | | | - | | | | - | | | | 104,498 | |
| | | | | | | | | | | | | | | | | | | | | | | | | |
| Consumer | | | | | | | | | | | | | | | | | | | | | | | | |
| Credit card balances | | | - | | | | - | | | | - | | | | - | | | | 6,959 | | | | 6,959 | |
| Other consumer | | | - | | | | - | | | | 141 | | | | - | | | | 9,347 | | | | 9,488 | |
| Municipal obligations | | | 23,128 | | | | - | | | | - | | | | - | | | | - | | | | 23,128 | |
| | | | | | | | | | | | | | | | | | | | | | | | | |
| Total | | $ | 923,317 | | | $ | 34,723 | | | $ | 53,542 | | | $ | - | | | $ | 185,262 | | | $ | 1,196,844 | |
(Continued)
THE BANK OF KENTUCKY FINANCIAL CORPORATION
NOTES TO CONSOLIDATED FINANCIAL STATEMENTS
December 31, 2012, 2011 and 2010
(Dollar amounts in thousands, except per share amounts)
NOTE 3 - LOANS (Continued)
| | | | | | Special | | | | | | | | | | | | | |
| | | Pass | | | Mention | | | Substandard | | | Doubtful | | | Not Rated | | | Total | |
| December 31, 2011 | | | | | | | | | | | | | | | | | | | | | | | | |
| Commercial | | $ | 170,394 | | | $ | 9,684 | | | $ | 13,098 | | | $ | - | | | $ | - | | | $ | 193,176 | |
| Residential real estate | | | | | | | | | | | | | | | | | | | | | | | | |
| Home equity lines of credit | | | - | | | | 712 | | | | 976 | | | | 84 | | | | 92,908 | | | | 94,680 | |
| Multifamily properties | | | 36,115 | | | | 103 | | | | 538 | | | | - | | | | - | | | | 36,756 | |
| Other residential real estate | | | 38,725 | | | | 1,357 | | | | 10,843 | | | | - | | | | 83,907 | | | | 134,832 | |
| | | | | | | | | | | | | | | | | | | | | | | | | |
| Nonresidential real estate | | | | | | | | | | | | | | | | | | | | | | | | |
| Owner occupied properties | | | 221,941 | | | | 7,754 | | | | 23,073 | | | | - | | | | - | | | | 252,768 | |
| Non owner occupied properties | | | 246,614 | | | | 8,902 | | | | 15,201 | | | | - | | | | - | | | | 270,717 | |
| Construction | | | 90,297 | | | | 3,398 | | | | 11,093 | | | | - | | | | - | | | | 104,788 | |
| | | | | | | | | | | | | | | | | | | | | | | | | |
| Consumer | | | | | | | | | | | | | | | | | | | | | | | | |
| Credit card balances | | | - | | | | - | | | | - | | | | - | | | | 6,492 | | | | 6,492 | |
| Other consumer | | | - | | | | - | | | | 22 | | | | - | | | | 10,104 | | | | 10,126 | |
| Municipal obligations | | | 27,066 | | | | - | | | | - | | | | - | | | | - | | | | 27,066 | |
| | | | | | | | | | | | | | | | | | | | | | | | | |
| Total | | $ | 831,152 | | | $ | 31,910 | | | $ | 74,844 | | | $ | 84 | | | $ | 193,411 | | | $ | 1,131,401 | |
Loans listed as not rated are included in groups of homogeneous loans. These loans are evaluated based on delinquency status.
NOTE 4 - PREMISES AND EQUIPMENT
Year-end premises and equipment were as follows:
| | | 2012 | | | 2011 | |
| | | | | | | |
| Land and improvements | | $ | 7,920 | | | $ | 8,166 | |
| Leasehold improvements | | | 2,747 | | | | 1,809 | |
| Buildings | | | 18,718 | | | | 19,257 | |
| Furniture, fixtures and equipment | | | 11,849 | | | | 11,144 | |
| Total | | | 41,234 | | | | 40,374 | |
| Accumulated depreciation | | | (18,740 | ) | | | (17,549 | ) |
| | | | | | | | | |
| Net premises and equipment | | $ | 22,494 | | | $ | 22,827 | |
Year-end depreciation expense was $1,755, $1,691, and $1,781 for 2012, 2011, and 2010, respectively. Depreciation expense for 2011 included $50 impairment expense for the Walton banking center. This property was sold in 2012 for a loss of $15.
(Continued)
THE BANK OF KENTUCKY FINANCIAL CORPORATION
NOTES TO CONSOLIDATED FINANCIAL STATEMENTS
December 31, 2012, 2011 and 2010
(Dollar amounts in thousands, except per share amounts)
NOTE 5 - GOODWILL AND ACQUISITION INTANGIBLES
Goodwill
There was no change in Goodwill in 2012. Goodwill increased $134 in 2011 as a result of the United Kentucky Bank acquisition.
Acquisition Intangibles
Acquisition intangibles were as follows as of year-end:
| | | 2012 | | | 2011 | |
| | | Gross | | | | | | Gross | | | | |
| | | Carrying | | | Accumulated | | | Carrying | | | Accumulated | |
| | | Amount | | | Amortization | | | Amount | | | Amortization | |
| Amortized intangible assets: | | | | | | | | | | | | | | | | |
| Core deposit intangibles | | $ | 3,595 | | | $ | 2,031 | | | $ | 3,595 | | | $ | 1,583 | |
| Trade name intangibles | | | 165 | | | | 156 | | | | 165 | | | | 137 | |
| Non-compete agreement intangibles | | | 320 | | | | 303 | | | | 320 | | | | 266 | |
| Other customer relationship intangibles | | | 2,650 | | | | 1,778 | | | | 2,650 | | | | 1,516 | |
| | | | | | | | | | | | | | | | | |
| Total | | $ | 6,730 | | | $ | 4,268 | | | $ | 6,730 | | | $ | 3,502 | |
Aggregate amortization expense was $766, $858, and $1,472 for 2012, 2011 and 2010, respectively.
Estimated amortization expense for each of the next five years:
| 2013 | | $ | 615 | |
| 2014 | | | 487 | |
| 2015 | | | 403 | |
| 2016 | | | 332 | |
| 2017 | | | 249 | |
(Continued)
THE BANK OF KENTUCKY FINANCIAL CORPORATION
NOTES TO CONSOLIDATED FINANCIAL STATEMENTS
December 31, 2012, 2011 and 2010
(Dollar amounts in thousands, except per share amounts)
NOTE 6 - INTEREST BEARING DEPOSITS
Time deposits of $100 or more were $133,627 and $141,963 at year-end 2012 and 2011.
Scheduled maturities of time deposits are as follows:
| 2013 | | $ | 238,305 | |
| 2014 | | | 84,546 | |
| 2015 | | | 21,475 | |
| 2016 | | | 6,834 | |
| 2017 | | | 7,901 | |
| | | $ | 359,061 | |
Deposits from directors and their affiliates at year-end 2012 and 2011 were $13,410 and $11,024, comprising 0.85% and 0.74% of total deposits at those dates.
NOTE 7 -SHORT-TERM BORROWINGS
Short-term borrowings consisted of the following:
| | | 2012 | | | 2011 | |
| | | | | | | |
| FHLB advance | | $ | 20,000 | | | $ | - | |
| Retail repurchase agreements | | | 21,408 | | | | 29,300 | |
| | | | | | | | | |
| | | $ | 41,408 | | | $ | 29,300 | |
Information regarding repurchase agreements for the years ended December 31, 2012 and 2011 is presented below:
| | | 2012 | | | 2011 | |
| | | | | | | |
| Average balance during the year | | $ | 25,823 | | | $ | 25,302 | |
| | | | | | | | | |
| Maximum month end balance during the year | | | 32,593 | | | | 29,300 | |
| | | | | | | | | |
| Average rate paid during the year | | | 0.30 | % | | | 0.41 | % |
| | | | | | | | | |
| Year-end weighted average rate | | | 0.26 | % | | | 0.31 | % |
(Continued)
THE BANK OF KENTUCKY FINANCIAL CORPORATION
NOTES TO CONSOLIDATED FINANCIAL STATEMENTS
December 31, 2012, 2011 and 2010
(Dollar amounts in thousands, except per share amounts)
NOTE 8 - NOTES PAYABLE
Notes payable consisted of the following:
| | | 2012 | | | 2011 | |
| | | | | | | |
| FHLB advances | | $ | 10,000 | | | $ | 10,000 | |
| Subordinated debentures | | | 38,557 | | | | 38,557 | |
| Other notes payable | | | 158 | | | | 182 | |
| | | | | | | | | |
| | | $ | 48,715 | | | $ | 48,739 | |
The FHLB advances are secured by a blanket pledge of eligible loans and securities and require monthly interest payments. The following advances were outstanding as of December 31:
| | | 2012 | | | 2011 | |
| Fixed rate advances with maturity in 2013 and an interest rate of 1.35% | | $ | 5,000 | | | $ | 5,000 | |
| Fixed rate advances with maturity in 2014 and an interest rate of 1.72% | | | 5,000 | | | | 5,000 | |
| | | | | | | | | |
| | | $ | 10,000 | | | $ | 10,000 | |
In March 2008, The Bank of Kentucky, a wholly-owned subsidiary of the Company, issued $20,000 of LIBOR plus 1.75% floating rate subordinated debenture to USB Capital Resources, Inc. The debenture may be redeemed after March 2013 at face value. Final maturity is March of 2018. The subordinated debentures are classified as liabilities on the Consolidated Balance Sheets and are considered Tier 2 capital for regulatory capital purposes.
In May of 2007, The Bank of Kentucky Capital Trust II (“the Trust”), a trust subsidiary of the Company, issued $18,000 of LIBOR plus 1.47% floating rate obligated mandatory redeemable securities “Trust Preferred Securities” as part of a pooled offering. The Trust may redeem the Trust Preferred Securities, in whole but not in part, any time after May 2011 at face value. The final maturity date is May of 2037. The Trust used the proceeds from the issuance of its Trust Preferred Securities and common securities to buy $18,557 aggregate principal amount of junior subordinated debentures issued by the Company. These debentures are the Trust’s only assets, with terms similar to the Trust Preferred Securities, and mature in 2037. The subordinated debentures are classified as liabilities on the Consolidated Balance Sheets and are considered as Tier 1 capital for regulatory capital purposes, subject to certain limitations. The Company is not considered the primary beneficiary of this Trust (variable interest entity). Therefore the trust is not consolidated in the Company’s financial statements, but rather the subordinated debentures are shown as a liability.
Other notes payable included a capitalized lease obligation.
The Bank maintains a $175,000 letter of credit from the Federal Home Loan Bank of Cincinnati. The letter is pledged to secure public funds deposit accounts and is secured by a blanket pledge of the Bank’s residential and commercial real estate loans.
(Continued)
THE BANK OF KENTUCKY FINANCIAL CORPORATION
NOTES TO CONSOLIDATED FINANCIAL STATEMENTS
December 31, 2012, 2011 and 2010
(Dollar amounts in thousands, except per share amounts)
NOTE 9 - PREFERRED STOCK
On February 13, 2009, the Company entered into a Letter Agreement (the “Purchase Agreement”) with the United States Department of Treasury (the “Treasury Department”) under the Troubled Asset Relief Program (“TARP”) Capital Purchase Program (“CPP”), pursuant to which the Company issued 34,000 shares of Series A Non-Cumulative Perpetual Preferred Stock (the “Series A Preferred Stock”) for a total price of $34 million. The Series A Preferred Stock is to pay cumulative dividends at an annual dividend rate of 5% for the first five years and thereafter at an annual dividend rate of 9%. No cash dividends can be paid to common stockholders unless all dividends on the Series A Preferred Stock have been declared and paid in full (or an amount sufficient for the payment of the dividends on the Series A Preferred Stock has been set aside for the payment of such dividends). Pursuant to the American Recovery and Reinvestment Act of 2009 (the “ARRA”), the Company may redeem the Series A Preferred Stock at any time, subject to the approval of its primary federal regulator.
As part of its purchase of the Series A Preferred Stock, the Treasury Department received a warrant (the “Warrant”) to purchase 274,784 shares of the Company’s common stock at an initial per share exercise price of $18.56. The Warrant provides for the adjustment of the exercise price and the number of shares of common stock issuable upon exercise pursuant to customary anti-dilution provisions. The Warrant expires ten years from the issuance date.
Both the Series A Preferred Stock and the Warrant are accounted for as components of Tier 1 capital. The net proceeds received from the Treasury Department were allocated between the Series A Preferred Stock and Warrant based on relative fair value. The Series A Preferred Stock will be accreted to liquidation value over the expected life of the shares, with accretion charged to retained earnings.
On December 22, 2010, the Company repurchased $17 million of the outstanding $34 million of its Fixed Rate Cumulative Perpetual Preferred Stock, Series A, issued in February 2009 to the U.S. Department of the Treasury pursuant to the Troubled Asset Relief Program Capital Purchase Program.
On November 23, 2011, the Company repurchased the final $17 million of the original outstanding $34 million of its Fixed Rate Cumulative Perpetual Preferred Stock, Series A, issued in February 2009 to the U.S. Department of the Treasury pursuant to the Troubled Asset Relief Program Capital Purchase Program.
The Warrant to purchase 274,784 shares of common stock was still outstanding as of December 31, 2012.
NOTE 10 - EMPLOYEE BENEFITS
The Bank maintains an employee profit sharing plan covering substantially all employees. Contributions are at the discretion of the Board of Directors. Profit sharing expense totaled $249, $227, and $210 for the years ended December 31, 2012, 2011 and 2010, respectively.
In 2003, the Company adopted a benefit program for certain officers to encourage long-term retention. The program consists principally of a defined benefit component, providing each officer with payments equal to 30% of final average pay for 15 years after retirement, and a deferral component, permitting each officer the ability to defer a portion of their current compensation and earn pre-tax returns on such deferred amounts. The accrued liability under the defined benefit component was $3,773 and $2,947 at December 31, 2012 and 2011, respectively. Expense related to the program was $850, $515, and $487 for the years ended December 31, 2012, 2011 and 2010.
(Continued)
THE BANK OF KENTUCKY FINANCIAL CORPORATION
NOTES TO CONSOLIDATED FINANCIAL STATEMENTS
December 31, 2012, 2011 and 2010
(Dollar amounts in thousands, except per share amounts)
NOTE 11 - STOCK-BASED COMPENSATION
Stock-based compensation in the form of options to buy stock and restricted stock units (“RSUs”) are granted to directors, officers and employees under the Company’s incentive stock plan (the “Plan”), which provides for the issuance of up to 1,000,000 shares. The Company believes that such awards better align the interests of its employees with those of its shareholders. The specific terms of each option agreement are determined by the Compensation Committee at the date of the grant.
Stock Option Plan
The specific terms of each option agreement are determined by the Compensation Committee at the date of the grant. For current options outstanding, options granted to directors vest immediately and options granted to employees generally vest evenly over a five-year period.
The options’ lives are generally ten years for employees and five years for directors. Total compensation cost that has been charged against income for those plans was $97, $203, and $307 for 2012, 2011 and 2010, respectively. The total income tax benefit was $0, $0, and $0.
The fair value of each option award is estimated on the date of grant using a closed form option valuation (Black-Scholes) model that uses the assumptions noted in the table below. Expected volatilities are based on historical volatilities of the Company’s common stock. The risk-free interest rate for the expected term of the option is based on the U.S. Treasury yield curve in effect at the time of the grant. Expected term is estimated based upon the contractual term and vesting period of the options including consideration of historical trends segregated by employees and directors. A forfeiture rate of 19% for employees and 0% for directors is used in the model and is based on historical experience.
There have been no options granted in 2012, 2011, or 2010.
(Continued)
THE BANK OF KENTUCKY FINANCIAL CORPORATION
NOTES TO CONSOLIDATED FINANCIAL STATEMENTS
December 31, 2012, 2011 and 2010
(Dollar amounts in thousands, except per share amounts)
NOTE 11 - STOCK-BASED COMPENSATION (Continued)
A summary of the activity in the stock option plan for 2012 follows:
| | | | | | | | | Weighted | | | | |
| | | | | | Weighted | | | Average | | | | |
| | | | | | Average | | | Remaining | | | Aggregate | |
| | | | | | Exercise | | | Contractual | | | Intrinsic | |
| | | Shares | | | Price | | | Term | | | Value | |
| | | | | | | | | | | | | |
| Outstanding at beginning of year | | | 456,645 | | | $ | 25.24 | | | | | | | | | |
| Granted | | | - | | | | - | | | | | | | | | |
| Exercised | | | 37,241 | | | | 21.75 | | | | | | | | | |
| Forfeited or expired | | | 71,380 | | | | 26.00 | | | | | | | | | |
| Outstanding at end of year | | | 348,024 | | | $ | 25.44 | | | | 2.75 | | | $ | 344 | |
| Exercisable at end of year | | | 293,605 | | | $ | 25.58 | | | | 2.53 | | | $ | 257 | |
The Company expects approximately 49 of the nonvested shares to become exercisable.
Information related to the stock option plan during each year follows:
| | | 2012 | | | 2011 | | | 2010 | |
| | | | | | | | | | |
| Intrinsic value of options exercised | | $ | 84 | | | $ | 4 | | | $ | - | |
| Cash received from option exercises | | | 810 | | | | 15 | | | | - | |
| Tax benefit realized from option exercises | | | 31 | | | | 1 | | | | - | |
| Weighted average fair value/share of options granted | | | - | | | | - | | | | - | |
As of December 31, 2012, there was $89 of total unrecognized compensation cost related to nonvested stock options granted under the plan. The cost is expected to be recognized over a weighted-average period of 1.44 years.
Restricted Stock Units
The specific terms of each restricted stock unit (“RSU”) award are determined by the Compensation Committee at the date of the grant. Compensation expense is recognized over the vesting period of the awards based on the fair value of the stock at the issue date. The fair value of the stock was determined using the total number of RSUs granted multiplied by the fair market value of a share of Company stock at the grant date. RSU’s are fully vested on the first anniversary of the grant date.
(Continued)
THE BANK OF KENTUCKY FINANCIAL CORPORATION
NOTES TO CONSOLIDATED FINANCIAL STATEMENTS
December 31, 2012, 2011 and 2010
(Dollar amounts in thousands, except per share amounts)
NOTE 11 - STOCK-BASED COMPENSATION (Continued)
A summary of changes in the Company’s nonvested shares for the year follows:
| | | | | | Weighted-Average | |
| | | | | | Grant-Date | |
| Nonvested Shares | | Shares | | | Fair Value | |
| | | | | | | |
| Nonvested at January 1, 2012 | | | - | | | $ | - | |
| Granted | | | 4,185 | | | | 25.80 | |
| Vested | | | - | | | | - | |
| Forfeited | | | - | | | | - | |
| | | | | | | | | |
| Nonvested at December 31, 2012 | | | 4,185 | | | $ | 25.80 | |
The Company recorded RSU expense of $67,000 in 2012. As of December 31, 2012, there was $41,000 of total unrecognized compensation cost related to nonvested shares granted under the RRP. The cost is expected to be recognized in 2013.
NOTE 12 - FEDERAL INCOME TAXES
Federal income taxes consisted of the following components:
| | | 2012 | | | 2011 | | | 2010 | |
| Income tax/(benefit) | | | | | | | | | | | | |
| Currently payable | | $ | 7,275 | | | $ | 7,445 | | | $ | 5,300 | |
| Deferred | | | (152 | ) | | | (536 | ) | | | (772 | ) |
| | | $ | 7,123 | | | $ | 6,909 | | | $ | 4,528 | |
The following is a reconciliation of income tax expense and the amount computed by applying the effective federal income tax rate of 35% to income before income taxes:
(Continued)
THE BANK OF KENTUCKY FINANCIAL CORPORATION
NOTES TO CONSOLIDATED FINANCIAL STATEMENTS
December 31, 2012, 2011 and 2010
(Dollar amounts in thousands, except per share amounts)
NOTE 12 - FEDERAL INCOME TAXES(Continued)
| | | 2012 | | | 2011 | | | 2010 | |
| Statutory rate applied to income before income taxes | | $ | 8,844 | | | $ | 8,189 | | | $ | 5,669 | |
| Tax exempt income | | | (903 | ) | | | (785 | ) | | | (668 | ) |
| Company owned life insurance income | | | (407 | ) | | | (393 | ) | | | (325 | ) |
| Incentive stock options | | | 34 | | | | 71 | | | | 107 | |
| Low-income housing tax credit | | | (547 | ) | | | (248 | ) | | | (249 | ) |
| Other | | | 102 | | | | 75 | | | | (6 | ) |
| | | $ | 7,123 | | | $ | 6,909 | | | $ | 4,528 | |
Year-end deferred tax assets and liabilities were due to the following factors:
| | | 2012 | | | 2011 | |
| Deferred tax assets from: | | | | | | | | |
| Allowance for loan losses | | $ | 5,799 | | | $ | 5,642 | |
| Benefit plans | | | 1,749 | | | | 1,312 | |
| Premises and equipment | | | 828 | | | | 868 | |
| Net operating loss carryforward | | | 3,131 | | | | 3,430 | |
| Acquisition intangibles | | | 430 | | | | 485 | |
| Other | | | 675 | | | | 491 | |
| | | | 12,612 | | | | 12,228 | |
| Deferred tax liabilities for: | | | | | | | | |
| FHLB stock dividends | | | (966 | ) | | | (966 | ) |
| Acquisition intangibles | | | (2,776 | ) | | | (2,534 | ) |
| Net unrealized gain on available for sale securities | | | (2,023 | ) | | | (1,706 | ) |
| Other | | | (52 | ) | | | (62 | ) |
| | | | (5,817 | ) | | | (5,268 | ) |
| Net deferred tax asset | | $ | 6,795 | | | $ | 6,960 | |
At year-end 2012, the Company had net operating loss carry forwards from its 2007 acquisition of approximately $8,945, which expire beginning in 2022 and have an annual limitation by IRC section 382. No valuation allowance has been established as management believes it will generate sufficient income in future years to realize the net operating loss benefits before expiration.
The Company had no unrecognized tax benefits as of January 1, 2012 and 2011 and did not recognize any increase in unrecognized benefits during 2012 or 2011 relative to any tax positions taken in 2012 and 2011. Should the accrual of any interest or penalties relative to unrecognized tax benefits be necessary, it is the Company’s policy to record such accruals in its income taxes accounts; no such accruals exist as of December 31, 2012 and 2011. The Company and its corporate subsidiary file a consolidated U.S. federal income tax return, which is subject to examination for all years after 2008.
(Continued)
THE BANK OF KENTUCKY FINANCIAL CORPORATION
NOTES TO CONSOLIDATED FINANCIAL STATEMENTS
December 31, 2012, 2011 and 2010
(Dollar amounts in thousands, except per share amounts)
NOTE 13 - EARNINGS PER SHARE
The factors used in the earnings per share computation follow:
| | | 2012 | | | 2011 | | | 2010 | |
| Basic | | | | | | | | | | | | |
| Net income available to common shareholders | | $ | 18,145 | | | $ | 15,517 | | | $ | 9,425 | |
| | | | | | | | | | | | | |
| Weighted average common shares outstanding | | | 7,462,528 | | | | 7,432,693 | | | | 5,858,619 | |
| | | | | | | | | | | | | |
| Basic earnings per common share | | $ | 2.43 | | | $ | 2.09 | | | $ | 1.61 | |
| | | | | | | | | | | | | |
| Diluted | | | | | | | | | | | | |
| Net income available to common shareholders | | $ | 18,145 | | | $ | 15,517 | | | $ | 9,425 | |
| | | | | | | | | | | | | |
| Weighted average common shares outstanding for basic earnings per common share | | | 7,462,528 | | | | 7,432,693 | | | | 5,858,619 | |
| Add: Dilutive effects of assumed exercises of stock options | | | 11,972 | | | | 4,741 | | | | - | |
| Add: Dilutive effects of assumed exercise of stock warrant | | | 69,800 | | | | 40,768 | | | | - | |
| | | | | | | | | | | | | |
| Average shares and dilutive potential common shares | | | 7,544,300 | | | | 7,478,202 | | | | 5,858,619 | |
| | | | | | | | | | | | | |
| Diluted earnings per common share | | $ | 2.41 | | | $ | 2.07 | | | $ | 1.61 | |
Stock options for 239,225, 378,950, and 523,730 shares of common stock were not considered in computing diluted earnings per common share for 2012, 2011 and 2010 because they were antidilutive. Also, 274,784 warrants were considered in computing diluted earnings per common share for 2012 and 2011, but not in 2010 because they were antidilutive.
(Continued)
THE BANK OF KENTUCKY FINANCIAL CORPORATION
NOTES TO CONSOLIDATED FINANCIAL STATEMENTS
December 31, 2012, 2011 and 2010
(Dollar amounts in thousands, except per share amounts)
NOTE 14 - COMMITMENTS AND OFF BALANCE SHEET ACTIVITIES
The Bank leases branch facilities and sites and is committed under various non-cancelable lease contracts that expire at various dates through the year 2026. Some of these leases are with members of the Bank’s Board of Directors or companies they control, these leases were originated at market terms at the date of inception. Expense for leased premises was $947, $839, and $870 for 2012, 2011 and 2010, respectively. Minimum lease payments at December 31, 2012 for all non-cancelable leases were as follows:
| 2013 | | $ | 871 | |
| 2014 | | | 763 | |
| 2015 | | | 532 | |
| 2016 | | | 282 | |
| 2017 | | | 214 | |
| Thereafter | | | 1,000 | |
| | | | | |
| Total minimum lease payments | | $ | 3,662 | |
Some financial instruments, such as loan commitments, credit lines, letters of credit, and overdraft protection, are issued to meet customer financing needs. These are agreements to provide credit or to support the credit of others, so long as conditions established in the contract are met, and usually have expiration dates. Commitments may expire without being used. Off-balance-sheet risk to credit loss exists up to the face amount of these instruments, although material losses are not anticipated. The same credit policies are used to make such commitments as are used for loans, including obtaining collateral at exercise of the commitment.
Financial instruments with off-balance-sheet risk were as follows at year-end:
| | | 2012 | | | 2011 | |
| | | Fixed | | | Variable | | | Fixed | | | Variable | |
| | | Rate | | | Rate | | | Rate | | | Rate | |
| Commitments to make loans (at market rates) | | $ | 6,115 | | | $ | 8,324 | | | $ | 6,354 | | | $ | 9,304 | |
| Unused lines of credit | | | - | | | | 340,919 | | | | - | | | | 306,262 | |
| Unused letters of credit | | | - | | | | 46,336 | | | | - | | | | 49,229 | |
The loan commitments are generally extended for terms of up to 60 days and, in many cases, allow the customer to select from one of several financing options offered. For the fixed rate commitments, the interest range was 3.25% to 5.25% in 2012 and 4.25% to 6.00% in 2011.
At December 31, 2012 and 2011, the Bank was required to have $10,997 and $8,460, respectively, on deposit with the Federal Reserve or as cash on hand as reserve.
On March 3, 2005, the Bank entered into an agreement with Northern Kentucky University whereby the University granted to the Bank the naming rights for the new Northern Kentucky University Arena constructed on the campus of the University for a term commencing immediately upon execution of the agreement and expiring twenty years after the opening of the Arena. In consideration therefore, the Bank is paying $6,000 in seven equal annual installments which began after substantial completion and opening of the Arena which occurred in September 2009.
(Continued)
THE BANK OF KENTUCKY FINANCIAL CORPORATION
NOTES TO CONSOLIDATED FINANCIAL STATEMENTS
December 31, 2012, 2011 and 2010
(Dollar amounts in thousands, except per share amounts)
NOTE 14 - COMMITMENTS AND OFF BALANCE SHEET ACTIVITIES(continued)
The cost of the naming rights is being amortized over the life of the contract commencing on the opening of the Arena, which took place in September 2009. The Company recorded $300 in expense for these naming rights in 2012, 2011 and 2010, the year end balances for this asset was $2,986 and $2,429 at December 31, 2012 and 2011, respectively.
In the second quarter of 2007, the Bank and Thomas More College announced a naming rights agreement for the new athletic field being constructed on Thomas More’s campus. The Bank committed $1,000 to the project, which has been named The Bank of Kentucky Field. The cost of the naming rights are being amortized over the twenty-five year life of the agreement commencing on the opening of the field, which took place in September 2008. The Company recorded $40 in expense for these naming rights in 2012, 2011 and 2010, the year end balances for this asset was $827 and $667 at December 31, 2012 and 2011 respectively.
On November 8, 2012, the Bank entered into an agreement with Gateway Community and Technical College whereby the College granted to the Bank the naming rights for the new classroom and training center located in Boone County Kentucky. The Bank committed $1,000 to the project, which will be named The Bank of Kentucky Classroom and Training Center. The cost of the naming rights will be amortized over a twenty year life commencing when the building is officially named, which is expected to take place in 2013. The Company expects to record $50 in expense annually beginning with the dedication of the building. The year end balance for this asset was $334 at December 31, 2012.
(Continued)
THE BANK OF KENTUCKY FINANCIAL CORPORATION
NOTES TO CONSOLIDATED FINANCIAL STATEMENTS
December 31, 2012, 2011 and 2010
(Dollar amounts in thousands, except per share amounts)
NOTE 15 - INTEREST RATE CONTRACTS
As a result of loans acquired through the Integra Bank transaction in the fourth quarter of 2010, the Bank initiated an interest rate protection program in which the Bank earns a fee by providing the Bank’s commercial loan customers the ability to swap from variable to fixed, or fixed to variable interest rates. Under these agreements the Bank enters into a variable or fixed rate loan agreement with its customer in addition to a swap agreement. The swap agreement effectively swaps the customer’s variable rate to a fixed rate or vice versa. The Bank then enters into a corresponding swap agreement with a third party in order to swap its exposure on the variable to fixed rate swap with the Bank’s customer. Since the swaps are structured to offset each other, changes in fair values, while recorded, have no material net earnings impact. The notional amount of interest rate swaps at December 31, 2012 was $50,771 and $30,871 on December 31, 2011 with maturities ranging from one to seven years. The current fair value of these swaps was $1,926 and $1,349 at December 31, 2012 and 2011, respectively, and is included in other assets and other liabilities for the value of each of the swaps.
The Bank is exposed to losses if a counterparty fails to make its payments under a contract in which the Bank is in the receiving status. Although collateral or other security is not obtained, as the Bank is not currently in the receiving status, we minimize our credit risk by monitoring the credit standing of the counterparties. We anticipate the counterparties will be able to fully satisfy their obligations under these agreements.
NOTE 16 - CAPITAL REQUIREMENTS AND RESTRICTIONS ON RETAINED EARNINGS
Banks and bank holding companies are subject to regulatory capital requirements administered by federal banking agencies. Capital adequacy guidelines and, additionally for banks, prompt corrective action regulations, involve quantitative measures of assets, liabilities, and certain off-balance sheet items calculated under regulatory accounting practices. Capital amounts and classifications are also subject to qualitative judgments by regulators. Failure to meet capital requirements can initiate regulatory action. Management believes as of December 31, 2012, the Company and Bank meet all capital adequacy requirements to which they are subject.
Prompt corrective action regulations provide five classifications: well capitalized, adequately capitalized, undercapitalized, significantly undercapitalized, and critically undercapitalized, although these terms are not used to represent overall financial condition. If adequately capitalized, regulatory approval is required to accept brokered deposits. If undercapitalized, capital distributions are limited, as is asset growth and expansion, and capital restoration plans are required. At year-end 2012 and 2011, the most recent regulatory notifications categorized the Bank as “well capitalized” under the regulatory framework for prompt corrective action.
There have been no subsequent conditions or events that management believes have changed the institution's category.
(Continued)
THE BANK OF KENTUCKY FINANCIAL CORPORATION
NOTES TO CONSOLIDATED FINANCIAL STATEMENTS
December 31, 2012, 2011 and 2010
(Dollar amounts in thousands, except per share amounts)
NOTE 16 - CAPITAL REQUIREMENTS AND RESTRICTIONS ON RETAINED EARNINGS (Continued)
The consolidated and Bank’s capital amounts and ratios, at December 31, 2012 and 2011 are presented below:
| | | | | | | | | | | | | | | To Be Well | |
| | | | | | | | | | | | | | | Capitalized Under | |
| | | | | | | | | For Capital | | | Prompt Corrective | |
| | | Actual | | | Adequacy Purposes | | | Action Provisions | |
| | | Amount | | | Ratio | | | Amount | | | Ratio | | | Amount | | | Ratio | |
| 2012 | | | | | | | | | | | | | | | | | | | | | | | | |
| Total Capital to risk weighted assets | | $ | 193,556 | | | | 13.28 | % | | $ | 116,568 | | | | 8.00 | % | | $ | N/A | | | | N/A | |
| Consolidated | | | | | | | | | | | | | | | | | | | | | | | | |
| Bank | | | 192,681 | | | | 13.22 | % | | | 116,599 | | | | 8.00 | % | | | 145,748 | | | | 10.00 | % |
| Tier 1 (Core) Capital to risk weighted assets | | | | | | | | | | | | | | | | | | | | | | | | |
| Consolidated | | $ | 156,988 | | | | 10.77 | % | | $ | 58,284 | | | | 4.00 | % | | $ | N/A | | | | N/A | |
| Bank | | | 156,113 | | | | 10.71 | % | | | 58,299 | | | | 4.00 | % | | | 87,449 | | | | 6.00 | % |
| | | | | | | | | | | | | | | | | | | | | | | | | |
| Tier 1 (Core) Capital to average assets | | | | | | | | | | | | | | | | | | | | | | | | |
| Consolidated | | $ | 156,988 | | | | 9.00 | % | | $ | 69,810 | | | | 4.00 | % | | $ | N/A | | | | N/A | |
| Bank | | | 156,113 | | | | 8.98 | % | | | 69,539 | | | | 4.00 | % | | | 86,924 | | | | 5.00 | % |
| | | | | | | | | | | | | | | To Be Well | |
| | | | | | | | | | | | | | | Capitalized Under | |
| | | | | | | | | For Capital | | | Prompt Corrective | |
| | | Actual | | | Adequacy Purposes | | | Action Provisions | |
| | | Amount | | | Ratio | | | Amount | | | Ratio | | | Amount | | Ratio | |
| 2011 | | | | | | | | | | | | | | | | | | | | | | | |
| Total Capital to risk weighted assets | | | | | | | | | | | | | | | | | | | | | | | |
| Consolidated | | $ | 180,043 | | | | 12.95 | % | | $ | 111,193 | | | | 8.00 | % | | $ | N/A | | | N/A | |
| Bank | | | 179,253 | | | | 12.91 | % | | | 111,101 | | | | 8.00 | % | | | 138,877 | | | 10.00 | % |
| Tier 1 (Core) Capital to risk weighted assets | | | | | | | | | | | | | | | | | | | | | | | |
| Consolidated | | $ | 142,658 | | | | 10.26 | % | | $ | 55,596 | | | | 4.00 | % | | $ | N/A | | | N/A | |
| Bank | | | 141,882 | | | | 10.22 | % | | | 55,551 | | | | 4.00 | % | | | 83,326 | | | 6.00 | % |
| Tier 1 (Core) Capital to average assets | | | | | | | | | | | | | | | | | | | | | | | |
| Consolidated | | $ | 142,658 | | | | 8.45 | % | | $ | 67,569 | | | | 4.00 | % | | $ | N/A | | | N/A | |
| Bank | | | 141,882 | | | | 8.43 | % | | | 67,298 | | | | 4.00 | % | | | 84,123 | | | 5.00 | % |
(Continued)
THE BANK OF KENTUCKY FINANCIAL CORPORATION
NOTES TO CONSOLIDATED FINANCIAL STATEMENTS
December 31, 2012, 2011 and 2010
(Dollar amounts in thousands, except per share amounts)
NOTE 16 - CAPITAL REQUIREMENTS AND RESTRICTIONS ON RETAINED EARNINGS (Continued)
The Company’s principal source of funds for dividend payments is dividends received from the Bank. Banking regulations limit the amount of dividends that may be paid without prior approval of regulatory agencies. Under these regulations, the amount of dividends that may be paid in any calendar year is limited to the current year’s net profits, combined with the retained net profits of the preceding two years, subject to the capital requirements described above. At December 31, 2012 the Bank could pay $20,027 without regulatory approval.
NOTE 17 - DISCLOSURES ABOUT FAIR VALUE
Accounting guidance establishes a fair value hierarchy which requires an entity to maximize the use of observable inputs and minimize the use of unobservable inputs when measuring fair value. The standard describes three levels of inputs that may be used to measure fair value:
Level 1: Quoted prices (unadjusted) for identical assets or liabilities in active markets that the entity has the ability to access as of the measurement date.
Level 2: Significant other observable inputs other than Level 1 prices such as quoted prices for similar assets or liabilities; quoted prices in markets that are not active; or other inputs that are observable or can be corroborated by observable market data.
Level 3: Significant unobservable inputs that reflect a reporting entity’s own assumptions about the assumptions that market participants would use in pricing an asset or liability.
Investment Securities: The fair values of securities available-for-sale are determined by matrix pricing, which is a mathematical technique widely used in the industry to value debt securities without relying exclusively on quoted prices for the specific securities but rather by relying on the securities’ relationship to other benchmark quoted securities (Level 2 inputs). One corporate security is valued using Level 3 inputs as there is no readily observable market activity. Management determines the value of this security based on expected cash flows, the credit quality of the security and current market interest rates.
Derivatives: The Bank’s derivative instruments consist of over-the-counter interest-rate swaps that trade in liquid markets. The fair value of the derivative instruments is primarily measured by obtaining pricing from broker-dealers recognized to be market participants. The pricing is derived from market observable inputs that can generally be verified and do not typically involve significant judgment by the Bank. This valuation method is classified as Level 2 in the fair value hierarchy.
Impaired Loans: At the time a loan is considered impaired, it is recorded at the lower of cost or fair value. Impaired loans carried at fair value generally receive specific allocations of the allowance for loan losses. For collateral dependent loans, fair value is commonly based on recent real estate appraisals. These appraisals may utilize a single valuation approach or a combination of approaches including comparable sales and the income approach. Adjustments are routinely made in the appraisal process by the independent appraisers to adjust for differences between the comparable sales and income data available. Such adjustments are usually significant and typically result in a Level 3 classification of the inputs for determining fair value. Non-real estate collateral may be valued
(Continued)
THE BANK OF KENTUCKY FINANCIAL CORPORATION
NOTES TO CONSOLIDATED FINANCIAL STATEMENTS
December 31, 2012, 2011 and 2010
(Dollar amounts in thousands, except per share amounts)
NOTE 17 - DISCLOSURES ABOUT FAIR VALUE(continued)
using an appraisal, net book value per the borrower’s financial statements or aging reports, adjusted or discounted based on management’s historical knowledge, changes in market conditions from the time of the valuation and management’s expertise and knowledge of the client and client’s business, resulting in a Level 3 fair value classification. Impaired loans are evaluated on a quarterly basis for additional impairment and adjusted accordingly.
Other Real Estate Owned: Assets acquired through or instead of loan foreclosure are initially recorded at fair value less costs to sell when acquired, establishing a new cost basis. These assets are subsequently accounted for at the lower of cost or fair value less estimated costs to sell. Fair value is commonly based on recent real estate appraisals. These appraisals may utilize a single valuation approach or a combination of approaches including comparable sales and the income approach. Adjustments are routinely made in the appraisal process by the independent appraisers to adjust for differences between the comparable sales and income data available. Such adjustments are usually significant and typically result in a Level 3 classification of the inputs for determining fair value.
Loans Held For Sale: Loans held for sale are carried at the lower of cost or fair value, which is evaluated on a pool-level basis. The fair value of loans held for sale is determined using quoted prices for similar assets, adjusted for specific attributes of that loan or other observable market data, such as outstanding commitments from third party investors (Level 2).
Assets and Liabilities Measured on a Recurring Basis
Assets and liabilities measured at fair value on a recurring basis are summarized below (in thousands):
| | | | | | Fair Value Measurements at | |
| | | | | | December 31, 2012 Using: | |
| | | | | | | | | Significant | | | | |
| | | | | | Quoted Prices in | | | Other | | | Significant | |
| | | Total | | | Active Markets for | | | Observable | | | Unobservable | |
| | | December 31, | | | Identical Assets | | | Inputs | | | Inputs | |
| | | 2012 | | | (Level 1) | | | (Level 2) | | | (Level 3) | |
| Assets | | | | | | | | | | | | | | | | |
| Investment securities available-for-sale | | | | | | | | | | | | | | | | |
| U.S. government sponsored entities and agencies | | $ | 128,477 | | | $ | - | | | $ | 128,477 | | | $ | - | |
| U.S. government agency mortgage backed | | | 184,907 | | | | - | | | | 184,907 | | | | - | |
| Corporate | | | 1,060 | | | | - | | | | - | | | | 1,060 | |
| Derivatives | | | 1,926 | | | | - | | | | 1,926 | | | | - | |
| Total | | $ | 316,370 | | | $ | - | | | $ | 315,310 | | | $ | 1,060 | |
| | | | | | | | | | | | | | | | | |
| Liabilities | | | | | | | | | | | | | | | | |
| Derivatives | | $ | 1,926 | | | $ | - | | | $ | 1,926 | | | $ | - | |
| Total | | $ | 1,926 | | | $ | - | | | $ | 1,926 | | | $ | - | |
(Continued)
THE BANK OF KENTUCKY FINANCIAL CORPORATION
NOTES TO CONSOLIDATED FINANCIAL STATEMENTS
December 31, 2012, 2011 and 2010
(Dollar amounts in thousands, except per share amounts)
NOTE 17 - DISCLOSURES ABOUT FAIR VALUE(continued)
| | | | | | Fair Value Measurements at | |
| | | | | | December 31, 2011 Using: | |
| | | | | | | | | Significant | | | | |
| | | | | | Quoted Prices in | | | Other | | | Significant | |
| | | Total | | | Active Markets for | | | Observable | | | Unobservable | |
| | | December 31, | | | Identical Assets | | | Inputs | | | Inputs | |
| | | 2011 | | | (Level 1) | | | (Level 2) | | | (Level 3) | |
| Assets | | | | | | | | | | | | | | | | |
| Investment securities available-for-sale | | | | | | | | | | | | | | | | |
| U.S. government sponsored entities and agencies | | $ | 169,460 | | | $ | - | | | $ | 169,460 | | | $ | - | |
| U.S. government agency mortgage backed | | | 151,992 | | | | - | | | | 151,992 | | | | - | |
| Corporate | | | 1,060 | | | | - | | | | - | | | | 1,060 | |
| Derivatives | | | 1,349 | | | | - | | | | 1,349 | | | | - | |
| Total | | $ | 323,861 | | | $ | - | | | $ | 322,801 | | | $ | 1,060 | |
| | | | | | | | | | | | | | | | | |
| Liabilities | | | | | | | | | | | | | | | | |
| Derivatives | | $ | 1,349 | | | $ | - | | | $ | 1,349 | | | $ | - | |
| Total | | $ | 1,349 | | | $ | - | | | $ | 1,349 | | | $ | - | |
There were no transfers between Level 1 and Level 2 during 2012 or 2011.
There were no gains or losses for assets measured at fair value on a recurring basis using significant unobservable inputs (Level 3) for the quarter ended December 31, 2012.
There were no changes in unrealized gains and losses recorded in earnings for the quarter ended December 31, 2012 for Level 3 assets and liabilities that are still held at December 31, 2012.
(Continued)
THE BANK OF KENTUCKY FINANCIAL CORPORATION
NOTES TO CONSOLIDATED FINANCIAL STATEMENTS
December 31, 2012, 2011 and 2010
(Dollar amounts in thousands, except per share amounts)
NOTE 17 - DISCLOSURES ABOUT FAIR VALUE(continued)
The table below presents a reconciliation of all assets measured at fair value on a recurring basis using significant unobservable inputs (Level 3) for the period ended December 31 (in thousands):
| | | Corporate Securities | |
| | | 12/31/12 | | | 12/31/11 | |
| | | | | | | |
| Balance of recurring Level 3 assets at January 1 | | $ | 1,060 | | | $ | 1,060 | |
| Total gains or losses for the period: | | | | | | | | |
| Included in earnings | | | | | | | | |
| Included in other comprehensive income | | | | | | | | |
| Purchases | | | - | | | | - | |
| Sales | | | - | | | | - | |
| Issuances | | | - | | | | - | |
| Settlements | | | - | | | | - | |
| Transfers into Level 3 | | | - | | | | - | |
| Transfers out of Level 3 | | | - | | | | - | |
| | | | | | | | | |
| Balance of recurring Level 3 assets at December 31 | | $ | 1,060 | | | $ | 1,060 | |
The following table presents quantitative information about recurring Level 3 fair value measurements at December 31, 2012 (in thousands):
| | | | | | Valuation | | | | | |
| | | Fair value | | | Technique(s) | | Unobservable Input(s) | | Value | |
| | | | | | | | | | | | | |
| Corporate security | | $ | 1,060 | | | Discounted cash flow | | Probability of default | | | 0 | % |
The interest rate on this security is based on interest rates paid for securities with similar credit characteristics, but the probability of default is determined through a credit quality review rather than formal ratings or other observable inputs. The interest rate adjusts to reflect current market conditions of highly rated investments, if probability of default changed significantly, the interest rate would adjust accordingly and the fair value would be updated. Management reviews this interest rate and the security’s credit quality quarterly and a market value adjustment is made if necessary pursuant to this review.
(Continued)
THE BANK OF KENTUCKY FINANCIAL CORPORATION
NOTES TO CONSOLIDATED FINANCIAL STATEMENTS
December 31, 2012, 2011 and 2010
(Dollar amounts in thousands, except per share amounts)
NOTE 17 - DISCLOSURES ABOUT FAIR VALUE(continued)
Assets and Liabilities Measured on a Non-Recurring Basis (Dollars in thousands) Assets and liabilities measured at fair value on a non-recurring basis are summarized below:
| | | | | | Fair Value Measurements at | |
| | | | | | December 31, 2012 Using: | |
| | | | | | | | | Significant | | | | |
| | | | | | Quoted Prices in | | | Other | | | Significant | |
| | | Total | | | Active Markets for | | | Observable | | | Unobservable | |
| | | December 31 | | | Identical Assets | | | Inputs | | | Inputs | |
| | | 2012 | | | (Level 1) | | | (Level 2) | | | (Level 3) | |
| Assets | | | | | | | | | | | | | | | | |
| Impaired loans | | | | | | | | | | | | | | | | |
| Commercial | | $ | 546 | | | $ | - | | | $ | - | | | $ | 546 | |
| Nonresidential real estate | | | | | | | - | | | | | | | | | |
| Owner occupied properties | | | 6,346 | | | | - | | | | - | | | | 6,346 | |
| Non owner occupied properties | | | 2,788 | | | | - | | | | - | | | | 2,788 | |
| Residential real estate | | | | | | | | | | | | | | | | |
| Home equity lines of credit | | | 354 | | | | - | | | | - | | | | 354 | |
| Multifamily properties | | | 1,072 | | | | - | | | | - | | | | 1,072 | |
| Other | | | 4,541 | | | | - | | | | - | | | | 4,541 | |
| Construction | | | 2,657 | | | | - | | | | - | | | | 2,657 | |
| Other real estate owned | | | | | | | | | | | | | | | | |
| Residential | | | 396 | | | | - | | | | - | | | | 396 | |
| Non-Residential | | | 2,683 | | | | - | | | | - | | | | 2,683 | |
| Total | | $ | 21,383 | | | $ | - | | | $ | - | | | $ | 21,383 | |
| | | | | | Fair Value Measurements at | |
| | | | | | December 31, 2011 Using: | |
| | | | | | | | | Significant | | | | |
| | | | | | Quoted Prices in | | | Other | | | Significant | |
| | | Total | | | Active Markets for | | | Observable | | | Unobservable | |
| | | December 31 | | | Identical Assets | | | Inputs | | | Inputs | |
| | | 2011 | | | (Level 1) | | | (Level 2) | | | (Level 3) | |
| Assets | | | | | | | | | | | | | | | | |
| Impaired loans | | | | | | | | | | | | | | | | |
| Commercial | | $ | 383 | | | $ | - | | | $ | - | | | $ | 383 | |
| Nonresidential real estate | | | | | | | - | | | | | | | | | |
| Owner occupied properties | | | 8,320 | | | | - | | | | - | | | | 8,320 | |
| Non owner occupied properties | | | 5,858 | | | | - | | | | 375 | | | | 5,483 | |
| Residential real estate | | | | | | | | | | | | | | | | |
| Home equity lines of credit | | | - | | | | - | | | | - | | | | - | |
| Multifamily properties | | | - | | | | - | | | | - | | | | - | |
| Other | | | 3,332 | | | | - | | | | 1,832 | | | | 1,500 | |
| Construction | | | 3,787 | | | | - | | | | 214 | | | | 3,573 | |
| Other real estate owned | | | | | | | | | | | | | | | | |
| Residential | | | 200 | | | | - | | | | - | | | | 200 | |
| Non-residential | | | - | | | | - | | | | - | | | | - | |
| Total | | $ | 21,880 | | | $ | - | | | $ | 2,421 | | | $ | 19,459 | |
(Continued)
THE BANK OF KENTUCKY FINANCIAL CORPORATION
NOTES TO CONSOLIDATED FINANCIAL STATEMENTS
December 31, 2012, 2011 and 2010
(Dollar amounts in thousands, except per share amounts)
NOTE 17 - DISCLOSURES ABOUT FAIR VALUE(continued)
Impaired loans, which are measured for impairment using the fair value of the collateral for collateral dependent loans, had a gross carrying amount of $27,548 with a valuation allowance of $6,265, resulting in a decrease in provision for loan losses of $1,178 for 2012. As of December 31, 2011, impaired loans had a gross carrying amount of $29,124, with a valuation allowance of $7,443, resulting in an increase in provision for loan losses of $1,699.
Other real estate owned measured at fair value less costs to sell, had a net carrying amount of $3,079, which is made up of the outstanding balance of $3,728, net of a valuation allowance of $649 at December 31, 2012 resulting in a write-down of $369, for the year ended December 31, 2012. At December 31, 2011, other real estate owned had a net carrying amount of $200, made up of the outstanding balance of $286, net of a valuation allowance of $86, resulting in a write-down of $86 for the year ended December 31, 2011.
Values for collateral dependent loans and other real estate owned are generally based on appraisals obtained from licensed real estate appraisers and in certain circumstances consideration of offers obtained to purchase properties prior to foreclosure or other factors management deems relevant to arrive at a representative fair value. Appraisals for commercial real estate generally use three methods to derive value: cost, sales or market comparison and income approach. The cost method bases value on the cost to replace the current property. The market comparison approach evaluates the sales price of similar properties in the same market area. The income approach considers net operating income generated by the property and an investor’s required return. The final fair value is based on a reconciliation of these three approaches. Values for non real estate collateral, such as business equipment, are based on the licensed real estate appraisals valuation or the customers financial statements. Values for the non real estate collateral use much higher discounts than does real estate collateral. This is reflected in the high discount rate used on Commercial loans which have a much higher percentage of equipment collateral than other loan types have.
The following table presents quantitative information about recurring Level 3 fair value measurements at December 31, 2012 (in thousands):
| | | FairValue | | | Valuation Technique(s) | | Unobservable Input(s) | | Discount Range
(Avg discount) |
| Assets | | | | | | | | | | |
| Impaired Loans: | | | | | | | | | | |
| Commercial | | $ | 546 | | | Cost, sales, income approach | | Adjustment for comparable propertiesor equipment, market conditions | | 0-100%
(62%) |
| Nonresidential real estate | | | | | | | | | | |
Owner occupied properties | | | 8,243 | | | Cost, sales, income approach | | Adjustment for comparable properties, market conditions | | 0-80%
(6%) |
| Non owner occupied properties | | | 2,742 | | | Cost, sales, income approach | | Adjustment for comparable properties, market conditions | | 0-80%
(10%) |
| Residential real estate | | | | | | | | | | |
Home equity lines of credit | | | 354 | | | Cost, sales, income approach | | Adjustment for comparable properties, market conditions | | 0-100%
(27%) |
| Multifamily properties | | | 1,072 | | | Cost, sales, income approach | | Adjustment for comparable properties, market conditions | | 0%
(0%) |
| Other | | | 4,541 | | | Cost, sales, income approach | | Adjustment for comparable properties, market conditions | | 0-100%
(10%) |
| Construction | | | 3,785 | | | Cost, sales, income approach | | Adjustment for comparable properties, market conditions | | 0-80%
(14%) |
| Total | | $ | 21,283 | | | | | | | |
(Continued)
THE BANK OF KENTUCKY FINANCIAL CORPORATION
NOTES TO CONSOLIDATED FINANCIAL STATEMENTS
December 31, 2012, 2011 and 2010
(Dollar amounts in thousands, except per share amounts)
NOTE 17 - DISCLOSURES ABOUT FAIR VALUE(continued)
The carrying amounts and estimated fair values of financial instruments at December 31, 2012 and December 31, 2011 are as follows (in thousands):
| | | | | | Fair Value Measurements at | |
| | | | | | December 31, 2012 Using: | |
| | | Carrying Value | | | Level 1 | | | Level 2 | | | Level 3 | | | Total | |
| (Dollars in thousands) | | | | | | | | | | | | | | | |
| Financial assets | | | | | | | | | | | | | | | | | | | | |
| Cash and cash equivalents | | $ | 151,832 | | | $ | 151,832 | | | $ | - | | | $ | - | | | $ | 151,832 | |
| Interest-bearing deposits with banks | | | 250 | | | | 250 | | | | - | | | | - | | | | 250 | |
| Securities available-for-sale | | | 314,444 | | | | - | | | | 313,384 | | | | 1,060 | | | | 314,444 | |
| Securities held-to-maturity | | | 66,843 | | | | - | | | | 68,504 | | | | - | | | | 68,504 | |
| Federal Home Loan Bank stock | | | 5,099 | | | | N/A | | | | N/A | | | | N/A | | | | N/A | |
| Loans held for sale | | | 16,324 | | | | - | | | | 16,324 | | | | - | | | | 16,324 | |
| Loans, net | | | 1,178,841 | | | | - | | | | - | | | | 1,182,273 | | | | 1,182,273 | |
| Accrued interest receivable | | | 4,259 | | | | - | | | | 1,447 | | | | 2,812 | | | | 4,259 | |
| Derivative assets | | | 1,926 | | | | | | | | 1,926 | | | | - | | | | 1,926 | |
| Financial liabilities | | | | | | | | | | | | | | | | | | | | |
| Deposits | | $ | (1,570,007 | ) | | $ | (1,210,925 | ) | | $ | (360,671 | ) | | $ | - | | | $ | (1,571,596 | ) |
| Short-term borrowings | | | (41,408 | ) | | | - | | | | (41,408 | ) | | | - | | | | (41,408 | ) |
| Notes payable | | | (48,721 | ) | | | - | | | | (22,392 | ) | | | (17,192 | ) | | | (39,584 | ) |
| Accrued interest payable | | | (1,031 | ) | | | - | | | | (1,018) | | | | (13 | ) | | | (1,031 | ) |
| Standby letters of credit | | | (271 | ) | | | - | | | | - | | | | (271 | ) | | | (271 | ) |
| Derivative liabilities | | | (1,926 | ) | | | - | | | | (1,926 | ) | | | - | | | | (1,926 | ) |
| | | | | | Fair Value Measurements at | |
| | | | | | December 31, 2011 Using: | |
| | | Carrying Value | | | Level 1 | | | Level 2 | | | Level 3 | | | Total | |
| (Dollars in thousands) | | | | | | | | | | | | | | | | | | | | |
| Financial assets | | | | | | | | | | | | | | | | | | | | |
| Cash and cash equivalents | | $ | 135,964 | | | $ | 135,964 | | | $ | - | | | $ | - | | | $ | 135,964 | |
| Interest-bearing deposits with banks | | | 250 | | | | - | | | | 250 | | | | - | | | | 250 | |
| Securities available-for-sale | | | 322,512 | | | | - | | | | 321,452 | | | | 1,060 | | | | 322,512 | |
| Securities held-to-maturity | | | 48,975 | | | | - | | | | 50,643 | | | | - | | | | 50,643 | |
| Federal Home Loan Bank stock | | | 5,099 | | | | N/A | | | | N/A | | | | N/A | | | | N/A | |
| Loans held for sale | | | 8,920 | | | | - | | | | 8,920 | | | | - | | | | 8,920 | |
| Loans, net | | | 1,111,666 | | | | - | | | | 1,093,529 | | | | 19,259 | | | | 1,112,788 | |
| Accrued interest receivable | | | 4,887 | | | | - | | | | 4,887 | | | | - | | | | ,887 | |
| Derivative assets | | | 1,349 | | | | - | | | | 1,349 | | | | - | | | | 1,349 | |
| Financial liabilities | | | | | | | | | | | | | | | | | | | | |
| Deposits | | $ | (1,498,821 | ) | | $ | (1,092,434 | ) | | $ | (408,859 | ) | | $ | - | | | $ | (1,501,293 | ) |
| Short-term borrowings | | | (29,300 | ) | | | - | | | | (29,300 | ) | | | - | | | | (29,300 | ) |
| Notes payable | | | (48,739 | ) | | | - | | | | (27,477 | ) | | | (18,476 | ) | | | (45,953 | ) |
| Accrued interest payable | | | (1,582 | ) | | | - | | | | (1,582 | ) | | | - | | | | (1,582 | ) |
| Standby letters of credit | | | (263 | ) | | | - | | | | (263 | ) | | | - | | | | (263 | ) |
| Derivative liabilities | | | (1,349 | ) | | | - | | | | (1,349 | ) | | | - | | | | (1,349 | ) |
(Continued)
THE BANK OF KENTUCKY FINANCIAL CORPORATION
NOTES TO CONSOLIDATED FINANCIAL STATEMENTS
December 31, 2012, 2011 and 2010
(Dollar amounts in thousands, except per share amounts)
NOTE 17 - DISCLOSURES ABOUT FAIR VALUE(continued)
The estimated fair value approximates carrying amounts for all items except those described below. The carrying amounts of cash and short-term instruments approximate fair values and are classified as either Level 1 or Level 2. Estimated fair value for both securities available-for-sale and held-to-maturity is as previously described for securities available-for-sale. It is not practicable to determine the fair value of Federal Home Loan Bank stock due to restrictions placed on its transferability. Fair values of loans, excluding loans held for sale, are estimated as set forth below:
The methods and assumptions, not previously presented, used to estimate fair values are described as follows:
Cash and cash equivalents: The carrying amounts of cash and cash equivalents approximate fair values and are classified as Level 1.
Interest-bearing deposits with banks: The carrying amount of interet-bearing deposits equivalents approximate fair value and are classified a Level 1.
Federal Home Loan Bank stock: It is not practicable to determine the fair value of Federal Home Loan Bank stock due to restrictions placed on its transferability.
Loans held for sale: The fair value of loans held for sale is estimated based upon binding contracts and quotes from third party investors resulting in a Level 2 classification.
Loans, net: For variable rate loans that reprice frequently and with no significant change in credit risk, fair values are based on carrying values resulting in a Level 3 classification. Fair values for other loans are estimated using discounted cash flow analyses, using interest rates currently being offered for loans with similar terms to borrowers of similar credit quality resulting in a Level 3 classification. Impaired loans are valued at the lower of cost or fair value as described previously. The methods utilized to estimate the fair value of loans do not necessarily represent an exit price.
Accrued interest receivable/payable: The carrying amounts of accrued interest approximate fair value resulting in a Level 2 or Level 3 classification consistent with the classification of the asset/liability with which they are associated.
Deposits: The fair values disclosed for demand deposits (e.g., interest and non-interest checking, passbook savings and certain types of money market accounts) are, by definition, equal to the amount payable on demand at the reporting date (i.e., their carrying amount) resulting in either a Level 1 or Level 2 classification. The carrying amounts of variable rate, fixed-term money market accounts and certificates of deposit approximate their fair values at the reporting date resulting in either a Level 2 or Level 3 classification. Fair values for fixed rate certificates of deposit are estimated using a discounted cash flows calculation that applies interest rates currently being offered on certificates to a schedule of aggregated expected monthly maturities on time deposits resulting in a Level 3 classification.
(Continued)
THE BANK OF KENTUCKY FINANCIAL CORPORATION
NOTES TO CONSOLIDATED FINANCIAL STATEMENTS
December 31, 2012, 2011 and 2010
(Dollar amounts in thousands, except per share amounts)
NOTE 17 - DISCLOSURES ABOUT FAIR VALUE(continued)
Short-term borrowings: The carrying amounts of short-term borrowings, generally maturing within ninety days, approximate their fair values resulting in a Level 2 classification.
Notes payable: The carrying amounts of borrowings under repurchase agreements approximate their fair values resulting in a Level 2 classification. The fair values of the Company’s long-term borrowings are estimated using discounted cash flow analyses based on the current borrowing rates for similar types of borrowing arrangements resulting in a Level 2 classification. The fair values of the Company’s subordinated debentures are estimated using discounted cash flow analyses based on the current borrowing rates for similar types of borrowing arrangements resulting in a Level 3 classification.
Standby letters of credit and off-balance sheet instruments: Fair values for off-balance sheet, credit-related financial instruments are based on fees currently charged to enter into similar agreements, taking into account the remaining terms of the agreements and the counterparties’ credit standing. The fair value of commitments is not material. Estimated fair value of standby letters of credit are based on their current unearned fee balance. Estimated fair value for commitments to make loans and unused lines of credit are considered nominal.
NOTE 18 - PARENT COMPANY FINANCIAL STATEMENTS
Presented below are condensed balance sheets and the related statements of income and cash flows for the parent company:
CONDENSED BALANCE SHEETS
December 31, 2012 and 2011
| | | 2012 | | | 2011 | |
| Assets | | | | | | | | |
| Cash | | $ | 1,541 | | | $ | 221 | |
| Investment in bank subsidiary | | | 187,565 | | | | 173,795 | |
| Investment in unconsolidated trust | | | 557 | | | | 557 | |
| Other assets | | | 617 | | | | 571 | |
| | | | | | | | | |
| | | $ | 190,280 | | | $ | 175,144 | |
| Liabilities and shareholders’ equity | | | | | | | | |
| Subordinated debentures | | $ | 18,557 | | | $ | 18,557 | |
| Other liabilities | | | 1,283 | | | | 17 | |
| Total liabilities | | | 19,840 | | | | 18,574 | |
| | | | | | | | | |
| Shareholders’ equity | | | 170,440 | | | | 156,570 | |
| | | | | | | | | |
| | | $ | 190,280 | | | $ | 175,144 | |
(Continued)
THE BANK OF KENTUCKY FINANCIAL CORPORATION
NOTES TO CONSOLIDATED FINANCIAL STATEMENTS
December 31, 2012, 2011 and 2010
(Dollar amounts in thousands, except per share amounts)
NOTE 18 - PARENT COMPANY FINANCIAL STATEMENTS(continued)
CONDENSED STATEMENTS OF INCOME
Years ended December 31, 2012, 2011 and 2010
| | | 2012 | | | 2011 | | | 2010 | |
| | | | | | | | | | |
| Dividends from subsidiary | | $ | 5,500 | | | $ | 19,500 | | | $ | 3,000 | |
| Interest expense | | | (355 | ) | | | (326 | ) | | | (330 | ) |
| Operating expenses | | | (381 | ) | | | (405 | ) | | | (520 | ) |
| Tax benefit | | | 224 | | | | 185 | | | | 188 | |
| | | | | | | | | | | | | |
| Income before equity in undistributed income of the Bank | | | 4,988 | | | | 18,954 | | | | 2,338 | |
| | | | | | | | | | | | | |
| Equity in undistributed income (dividends in excess of earnings) of the Bank | | | 13,157 | | | | (2,465 | ) | | | 9,333 | |
| | | | | | | | | | | | | |
| Net income | | $ | 18,145 | | | $ | 16,489 | | | $ | 11,671 | |
| | | | | | | | | | | | | |
| Preferred stock dividend and discount accretion | | | - | | | | (972 | ) | | | (2,246 | ) |
| | | | | | | | | | | | | |
| Net income available to common shareholders | | $ | 18,145 | | | $ | 15,517 | | | $ | 9,425 | |
(Continued)
THE BANK OF KENTUCKY FINANCIAL CORPORATION
NOTES TO CONSOLIDATED FINANCIAL STATEMENTS
December 31, 2012, 2011 and 2010
(Dollar amounts in thousands, except per share amounts)
NOTE 18 - PARENT COMPANY FINANCIAL STATEMENTS (Continued)
CONDENSED STATEMENTS OF CASH FLOWS
Years ended December 31, 2012, 2011 and 2010
| | | 2012 | | | 2011 | | | 2010 | |
| Cash flows from operating activities | | | | | | | | | | | | |
| Net income | | $ | 18,145 | | | $ | 16,489 | | | $ | 11,671 | |
| Adjustments to reconcile net income to net cash from operating activities | | | | | | | | | | | | |
| (Equity in undistributed income)/dividends in excess of earnings | | | (13,157 | ) | | | 2,465 | | | | (9,333 | ) |
| Other changes | | | 113 | | | | 120 | | | | 430 | |
| Net cash from operating activities | | | 5,101 | | | | 19,074 | | | | 2,768 | |
| | | | | | | | | | | | | |
| Cash flows from investing activities | | | | | | | | | | | | |
| Contribution to Bank | | | - | | | | - | | | | (9,000 | ) |
| Net cash from investing activities | | | - | | | | - | | | | (9,000 | ) |
| | | | | | | | | | | | | |
| Cash flows from financing activities | | | | | | | | | | | | |
| Net change in short-term borrowings | | | - | | | | - | | | | - | |
| Proceeds from issuance of common stock | | | - | | | | - | | | | 28,173 | |
| Redemption of preferred stock | | | - | | | | (17,000 | ) | | | (17,000 | ) |
| Dividends paid on common stock | | | (4,624 | ) | | | (4,162 | ) | | | (3,174 | ) |
| Dividends paid on preferred stock | | | - | | | | (869 | ) | | | (1,787 | ) |
| Exercise of stock options | | | 841 | | | | 15 | | | | - | |
| | | | | | | | | | | | | |
| Net cash from financing activities | | | (5,051 | ) | | | (22,016 | ) | | | 6,212 | |
| | | | | | | | | | | | | |
| Net change in cash | | | 1,320 | | | | (2,942 | ) | | | (20 | ) |
| | | | | | | | | | | | | |
| Cash at beginning of year | | | 221 | | | | 3,163 | | | | 3,183 | |
| | | | | | | | | | | | | |
| Cash at end of year | | $ | 1,541 | | | $ | 221 | | | $ | 3,163 | |
(Continued)
THE BANK OF KENTUCKY FINANCIAL CORPORATION
NOTES TO CONSOLIDATED FINANCIAL STATEMENTS
December 31, 2012, 2011 and 2010
(Dollar amounts in thousands, except per share amounts)
NOTE 19 - OTHER COMPREHENSIVE INCOME
Other comprehensive income components and related tax effects were as follows:
| | | 2012 | | | 2011 | | | 2010 | |
| Unrealized holding gains on available-for-sale securities | | $ | 1,136 | | | $ | 3,892 | | | $ | (88 | ) |
| Reclassification adjustment for losses (gains) realized in income | | | (206 | ) | | | (231 | ) | | | - | |
| Net unrealized gains (losses) | | | 930 | | | | 3,661 | | | | (88 | ) |
| Tax effect | | | 316 | | | | 1,244 | | | | (30 | ) |
| | | | | | | | | | | | | |
| | | $ | 614 | | | $ | 2,417 | | | $ | (58 | ) |
The following is a summary of the accumulated other comrehenive income balances, net of tax:
| | | Balance at
December 31,
2011 | | | Current year
change | | | Balance at
December 31,
2012 | |
| Unrealized gains (losses) on securities available for sale | | $ | 3,313 | | | $ | 614 | | | $ | 3,927 | |
(Continued)
THE BANK OF KENTUCKY FINANCIAL CORPORATION
NOTES TO CONSOLIDATED FINANCIAL STATEMENTS
December 31, 2012, 2011 and 2010
(Dollar amounts in thousands, except per share amounts)
NOTE 20 - SELECTED QUARTERLY DATA (Unaudited)
Presented below is a summary of the consolidated quarterly financial data for the years ended December 31, 2012 and 2011.
| | | 2012 | |
| | | | | | | | | Net | | | Provision | | | Net Income | | | Earnings Per | |
| | | Interest | | | Interest | | | Interest | | | for Loan | | | Available to | | | Common Share | |
| | | Income | | | Expense | | | Income | | | Losses | | | Common Shareholders | | | Basic | | | Diluted | |
| Quarter ended | | | | | | | | | | | | | | | | | | | | | | | | | | | | |
| March 31 | | $ | 15,688 | | | $ | 1,844 | | | $ | 13,844 | | | $ | 1,800 | | | $ | 4,515 | | | $ | .61 | | | $ | .60 | |
| June 30 | | | 15,661 | | | | 1,614 | | | | 14,047 | | | | 1,700 | | | | 4,424 | | | | .59 | | | | .59 | |
| September 30 | | | 15,433 | | | | 1,471 | | | | 13,962 | | | | 2,200 | | | | 4,196 | | | | .56 | | | | .56 | |
| December 31 | | | 15,742 | | | | 1,410 | | | | 14,332 | | | | 1,300 | | | | 5,010 | | | | .67 | | | | .66 | |
| | | 2011 | |
| | | | | | | | | Net | | | Provision | | | Net Income | | | Earnings Per | |
| | | Interest | | | Interest | | | Interest | | | for Loan | | | Available to | | | Common Share | |
| | | Income | | | Expense | | | Income | | | Losses | | | Common Shareholders | | | Basic | | | Diluted | |
| Quarter ended | | | | | | | | | | | | | | | | | | | | | | | | | | | | |
| March 31 | | $ | 15,999 | | | $ | 2,651 | | | $ | 13,348 | | | $ | 3,000 | | | $ | 3,255 | | | $ | .44 | | | $ | .44 | |
| June 30 | | | 16,423 | | | | 2,396 | | | | 14,027 | | | | 3,000 | | | | 3,535 | | | | .48 | | | | .47 | |
| September 30 | | | 16,280 | | | | 2,204 | | | | 14,076 | | | | 2,550 | | | | 4,013 | | | | .54 | | | | .54 | |
| December 31 | | | 16,096 | | | | 2,009 | | | | 14,087 | | | | 2,200 | | | | 4,714 | | | | .63 | | | | .63 | |
Item 9. Changes in and Disagreements with Accountants on Accounting and Financial Disclosure
None.
Item 9A. Controls and Procedures
Disclosure Controls and Procedures
Disclosure controls and procedures are BKFC’s controls and other procedures that are designed to ensure that information required to be disclosed by BKFC in the reports that we file or submit under the Exchange Act is recorded, processed, summarized, and reported, within the time periods specified in the SEC’s rules and forms. Disclosure controls and procedures include, without limitation, controls and procedures designed to ensure that information required to be disclosed by us in the reports that we file under the Exchange Act is accumulated and communicated to our management, including our chief executive officer and chief financial officer, as appropriate to allow timely decisions regarding required disclosure. Under the supervision, and with the participation of our management, including our chief executive officer and chief financial officer, we have evaluated the effectiveness of the design and operation of our disclosure controls and procedures as of December 31, 2012. Based upon this evaluation, our chief executive officer and chief financial officer have concluded that these controls and procedures were effective at December 31, 2012 to ensure that information requiring disclosure be communicated to management in a timely manner and reported within the timeframe specified by the SEC’s rules and forms.
Changes in Internal Control Over Financial Reporting
During the fourth quarter of 2012, no change occurred in our internal control over financial reporting that materially affected, or is reasonably likely to materially affect, BKFC’s internal control over financial reporting.
MANAGEMENT’S REPORT ON INTERNAL CONTROL OVER FINANCIAL REPORTING
Management of The Bank of Kentucky Financial Corporation has prepared the consolidated financial statements in accordance with U.S. generally accepted accounting principles and is responsible for its accuracy. The financial statements necessarily include amounts that are based on management’s best estimates and judgments.
The Bank of Kentucky Financial Corporation’s management is responsible for establishing and maintaining adequate internal control over financial reporting, as such term is defined in Exchange Act Rules 13a-15(f). Under the supervision and with the participation of management, including The Bank of Kentucky Financial Corporation’s principal executive officer and principal financial officer, the Company conducted an evaluation of the effectiveness of internal control over financial reporting based on the framework inInternal Control – Integrated Framework issued by the Committee of Sponsoring Organizations of the Treadway Commission. Our evaluation included a review of the documentation of controls, evaluations of the design of the internal control system, and tests of the effectiveness of internal controls.
Based on The Bank of Kentucky Financial Corporation’s evaluation under the framework in Internal Control – Integrated Framework, management concluded that internal control over financial reporting was effective as of December 31, 2012. Management’s internal control over financial reporting as of December 31, 2012 has been audited by Crowe Horwath LLP, an independent registered public accounting firm, as stated in their report which is contained herein.
| Robert W. Zapp | Martin J. Gerrety |
| President & CEO | Treasurer and Assistant Secretary |
The Independent Registered Public Accounting Firm’s opinion on the effectiveness of internal controls over financial reporting is included in their opinion in the financial statement section of this Annual Report.
Item 9B. Other Information
None.
PART III
Item 10. Directors, Executive Officers and Corporate Governance
Information in response to this item is incorporated by reference from BKFC’s definitive Proxy Statement for the 2013 Annual Meeting of Shareholders.
Item 11. Executive Compensation
Information in response to this item is incorporated by reference from BKFC’s definitive Proxy Statement for the 2013 Annual Meeting of Shareholders.
Item 12. Security Ownership of Certain Beneficial Owners and Management and Related Stockholder Matters
Information in response to this item is incorporated by reference from BKFC’s definitive Proxy Statement for the 2013 Annual Meeting of Shareholders.
Item 13. Certain Relationships and Related Transactions, and Director Independence
Information in response to this item is incorporated by reference from BKFC’s definitive Proxy Statement for the 2013 Annual Meeting of Shareholders.
Item 14. Principal Accountant Fees and Services
Information in response to this item is incorporated by reference from BKFC’s definitive Proxy Statement for the 2013 Annual Meeting of Shareholders.
PART IV
Item 15. Exhibits and Financial Statement Schedules.
(a) Financial Statements.A list of Financial Statements included herein is set forth in the Index to Financial Statements appearing in Item 8 of this Form 10-K.
(b) Exhibits.See Index to Exhibits filed with this Annual Report on Form 10-K.
SIGNATURES
Pursuant to the requirements of Section 13 or 15(d) of the Securities Exchange Act of 1934, the registrant has duly caused this report to be signed on its behalf by the undersigned, thereunto duly authorized on this 8th day of March 2013.
| | THE BANK OF KENTUCKY FINANCIAL |
| | CORPORATION |
| | |
| | By | /s/ Robert W. Zapp |
| | | Robert W. Zapp, |
| | | President and Chief Executive |
| | | Officer |
Pursuant to the requirements of the Securities Exchange Act of 1934, this report has been duly signed below on March 8th, 2013, by the following persons on behalf of the registrant and in the capacities indicated.
| /s/ Martin J. Gerrety | | /s/ Charles M. Berger |
| Martin J. Gerrety | | Charles M. Berger |
| Treasurer and Assistant Secretary (principal financial officer and principal accounting officer) | | Director |
| | | |
| /s/ Robert W. Zapp | | /s/ John S. Cain |
| Robert W. Zapp | | John S. Cain |
| President, Chief Executive Officer and Director | | Director |
| (principal executive officer) | | |
| | | /s/ John E. Miracle, D.M.D. |
| /s/ Mary Sue Rudicill | | John E. Miracle, D.M.D. |
| Mary Sue Rudicill | | Director |
| Director | | |
| | | /s/ Herbert H. Works |
| /s/ Harry J. Humpert | | Herbert H. Works |
| Harry J. Humpert | | Director |
| Director | | |
| | | Ruth Seligman Doering |
| /s/ Barry G. Kienzle | | Ruth Seligman-Doering |
| Barry G. Kienzle | | Director |
| Director | | |
INDEX TO EXHIBITS
Exhibit
Number | | Description |
| | | |
| 2.1 | | Purchase and Assumption Agreement, by and between The Bank of Kentucky, Inc., as buyer, and Peoples Bank of Northern Kentucky, Inc., as seller, and Peoples Bancorporation of Northern Kentucky, Inc., dated as of September 24, 2002(1) |
| | | |
| 3.1 | | Articles of Incorporation of The Bank of Kentucky Financial Corporation, including all amendments through February 12, 2009(2) |
| | | |
| 3.2 | | Second Amended and Restated By-laws of The Bank of Kentucky Financial Corporation(3) |
| | | |
| 4.1 | | Junior Subordinated Indenture between The Bank of Kentucky Financial Corporation and The Bank of New York, as trustee, dated as of November 14, 2002(4) |
| | | |
| 4.2 | | Amended and Restated Trust Agreement among The Bank of Kentucky Financial Corporation, as depositor, The Bank of New York, as Property Trustee, The Bank of New York (Delaware), as Delaware Trustee and the Administrative Trustees named therein, dated as of November 14, 2002(4) |
| | | |
| 4.3 | | Warrant to Purchase up to 274,784 Shares of Common Stock of The Bank of Kentucky Financial Corporation(9) |
| | | |
| 10.1 | | The Bank of Kentucky Financial Corporation 1997 Stock Option and Incentive Plan(5) |
| | | |
| 10.2 | | The Bank of Kentucky Financial Corporation 2007 Stock Option and Incentive Plan(6) |
| | | |
| 10.3 | | The Bank of Kentucky, Inc. Executive Deferred Contribution Plan(7) |
| | | |
| 10.4 | | Amendment to the Bank of Kentucky, Inc. Executive Deferred Contribution Plan, dated November 17, 2010(8) |
| | | |
| 10.5 | | The Bank of Kentucky, Inc. Executive Private Pension Plan(7) |
| | | |
| 10.6 | | Amendment to the Bank of Kentucky, Inc. Executive Private Pension Plan, dated November 17, 2010(8) |
| | | |
| 10.7 | | Amendment to the Bank of Kentucky, Inc. Group Insurance Endorsement Plan(7) |
| | | |
| 10.8 | | Purchase Agreement among The Bank of Kentucky Financial Corporation, The Bank of Kentucky Capital Trust I and Trapeza CDO I, LLC, dated as of November 14, 2002(4) |
| | | |
| 10.9 | | The Bank of Kentucky, Inc. Executive Deferred Contribution Plan Trust Agreement, dated November 17, 2010(8) |
| | | |
| 21 | | Subsidiaries of The Bank of Kentucky Financial Corporation |
| | | |
| 23 | | Consent of Crowe Horwath LLP |
| | | |
| 31.1 | | Section 302 Certification of Robert W. Zapp, Chief Executive Officer |
| | | |
| 31.2 | | Section 302 Certification of Martin J. Gerrety, Treasurer and Assistant Secretary |
| | | |
| 32.1 | | Section 906 of Sarbanes-Oxley Act of 2002 Certification of Robert W. Zapp |
| 32.2 | | Section 906 of Sarbanes-Oxley Act of 2002 Certification of Martin J. Gerrety |
| | | |
| 101.INS | | XBRL Instance Document* |
| | | |
| 101.SCH | | XBRL Taxonomy Extension Schema Document* |
| | | |
| 101.CAL | | XBRL Taxonomy Extension Calculation Linkbase* |
| | | |
| 101.LAB | | XBRL Taxonomy Extension Label Linkbase* |
| | | |
| 101.PRE | | XBRL Taxonomy Extension Presentation Linkbase* |
| | | |
| 101.DEF | | XBRL Taxonomy Extension Definition Linkbase* |
| (1) | Incorporated by reference to the Quarterly Report on Form 10-Q for the period ended September 30, 2002, filed with the SEC on November 14, 2002. |
| (2) | Incorporated by reference to the Annual Report on Form 10-K, filed with the SEC on March 13, 2009. |
| (3) | Incorporated by reference to the Current Report on Form 8-K, filed with the SEC on September 24, 2008. |
| (4) | Incorporated by reference to the Form 8-K, filed with the SEC on December 9, 2002. |
| (5) | Incorporated by reference to the Form S-8, filed with the SEC on October 2, 1997. |
| (6) | Incorporated by reference to the Form 8-K, filed with the SEC on April 25, 2007. |
| (7) | Incorporated by reference to the Form 10-K for the year ended December 31, 2003, filed with the SEC on March 12, 2004. |
| (8) | Incorporated by reference to the Current Report on Form 8-K, filed with the SEC on November 23, 2010. |
| (9) | Incorporated by reference to the Current Report on Form 8-K, filed with the SEC on February 19, 2009. |
*As provided in Rule 406T of Regulation S-T, this interactive data file shall not be deemed “filed” for purposes of Section 11 and 12 of the Securities Act of 1933 and Section 18 of the Securities Exchange Act of 1934 or otherwise subject to liability under those sections.