U.S. Securities and Exchange Commission
Washington, D.C. 20549
FORM 10-K
(Mark One)
| x | ANNUAL REPORT PURSUANT TO SECTION 13 OR 15(d) OF THE SECURITIES EXCHANGE ACT OF 1934 |
For the Fiscal Year Ended December 31, 2008
OR
| ¨ | TRANSITION REPORT PURSUANT TO SECTION 13 OR 15(d) OF THE SECURITIES EXCHANGE ACT OF 1934 |
For the transition period from to .
Commission File Number: 0-25960
THE BANK OF KENTUCKY FINANCIAL CORPORATION
(Exact name of registrant as specified in its charter)
| | |
| Kentucky | | 61-1256535 |
(State or other jurisdiction of incorporation or organization) | | (I.R.S. Employer Identification Number) |
111 Lookout Farm Drive, Crestview Hills, Kentucky 41017
(Address of principal executive offices) (Zip Code)
Registrant’s telephone number, including area code: (859) 371-2340
Securities registered pursuant to Section 12(b) of the Exchange Act:
| | |
| Common Stock, without par value | | The Nasdaq Stock Market LLC |
| (Title of each class) | | (Name of each exchange on which registered) |
Securities registered pursuant to Section 12(g) of the Exchange Act:
None
Indicate by check mark if the registrant is a well-known seasoned issuer, as defined in Rule 405 of the Securities Act. Yes ¨ No x
Indicate by check mark if the registrant is not required to file reports pursuant to Section 13 or Section 15(d) of the Act. Yes ¨ No x
Indicate by check mark whether the registrant has (1) filed all reports required to be filed by Section 13 or 15(d) of the Exchange Act during the preceding 12 months (or for such shorter period that the registrant was required to file such reports), and (2) has been subject to such filing requirements for the past 90 days. Yes x No ¨
Indicate by check mark if disclosure of delinquent filers pursuant to Item 405 of Regulation S-K is not contained herein, and will not be contained, to the best of registrant’s knowledge, in definitive proxy or information statements incorporated by reference in Part III of this Form 10-K or any amendment to this Form 10-K. ¨
Indicate by check mark whether the registrant is a large accelerated filer, an accelerated filer, a non-accelerated filer or a smaller reporting company. See definitions of “large accelerated filer”, “accelerated filer,” and “smaller reporting company” in Rule 12b-2 of the Exchange Act (Check one):
Large accelerated filer ¨ Accelerated filer x Non-accelerated filer ¨ Smaller reporting company ¨
Indicate by check mark whether the registrant is a shell company (as defined in Rule 12b-2 of the Exchange Act). Yes ¨ No x
The aggregate market value of the voting Common Stock held by non-affiliates of the registrant as of June 30, 2008 (the last business day of the registrant’s most recently completed second fiscal quarter) was approximately $59,725,000.
At March 1, 2009, there were 5,612,607 shares of the registrant’s common stock issued and outstanding.
DOCUMENTS INCORPORATED BY REFERENCE
Portions of the Proxy Statement of the registrant filed, or to be filed, with the Securities and Exchange Commission are incorporated by reference into Part III of this Form 10-K.
TABLE OF CONTENTS
| | |
| Exhibit 3.1 | | ARTICLES OF INCORPORATION |
| Exhibit 21 | | SUBSIDIARIES OF THE REGISTRANT |
| Exhibit 23 | | CONSENT OF INDEPENDENT REGISTERED PUBLIC ACCOUNTING FIRM |
| Exhibit 31.1 | | CERTIFICATIONS |
| Exhibit 31.2 | | CERTIFICATIONS |
| Exhibit 32.1 | | CERTIFICATION PURSUANT TO 18 U.S.C. SECTION 1350, AS ADOPTED PURSUANT TO SECTION 906 OF THE SARBANES-OXLEY ACT OF 2002 |
| Exhibit 32.2 | | CERTIFICATION PURSUANT TO 18 U.S.C. SECTION 1350, AS ADOPTED PURSUANT TO SECTION 906 OF THE SARBANES-OXLEY ACT OF 2002 |
2
PART I
General
The Bank of Kentucky Financial Corporation (“BKFC”) is a bank holding company that was incorporated as a Kentucky corporation in 1993 and engaged in no business activities until 1995, when BKFC acquired all of the issued and outstanding shares of common stock of The Bank of Kentucky, Inc. (the “Bank”), a bank incorporated under the laws of the Commonwealth of Kentucky (formerly named “The Bank of Boone County, Inc.”), and Burnett Federal Savings Bank (“Burnett”), a federal savings bank that was later merged into the Bank. BKFC, through the Bank, is engaged in the banking business in Kentucky.
Formed in 1990, the Bank provides a variety of community-oriented consumer and commercial financial services to customers throughout Northern Kentucky. The principal business activity of the Bank consists of accepting consumer and commercial deposits and using such deposits to fund residential and non-residential real estate loans and commercial, consumer, construction and land development loans. The Bank’s primary market area for both loans and deposits includes Boone, Kenton and Campbell counties and parts of Grant and Gallatin counties in Northern Kentucky and also greater Cincinnati, Ohio.
On June 14, 2000, BKFC consummated the acquisition of the Fort Thomas Financial Corporation (“FTFC”) and its wholly owned subsidiary, the Fort Thomas Savings Bank (“FTSB”). FTFC was merged with and into BKFC and FTSB was merged with and into the Bank. Upon consummation of this acquisition, 865,592 shares of BKFC were issued for substantially all of the outstanding shares of FTFC. The combination was accounted for as a pooling of interests and the historical financial position and results of operations of the two companies have been combined for financial reporting purposes.
On November 22, 2002, BKFC consummated the acquisition of certain assets and assumption of certain liabilities of Peoples Bank of Northern Kentucky (“PBNK”). This acquisition was accounted for under the purchase method of accounting and accordingly the tangible and identifiable intangible assets and liabilities of the purchase were recorded at estimated fair values. The excess of the purchase price over the net tangible and identifiable intangible assets was recorded as goodwill. The adjustments necessary to record tangible and identifiable intangible assets and liabilities at fair value are amortized to income and expensed over the estimated remaining lives of the related assets and liabilities.
On May 18, 2007, BKFC consummated the acquisition of FNB Bancorporation, Inc. and its subsidiary, First Bank of Northern Kentucky, Inc. (“First Bank”). This acquisition was accounted for under the purchase method of accounting and accordingly the tangible and identifiable intangible assets and liabilities of the purchase were recorded at estimated fair values. The excess of the purchase price over the net tangible and identifiable intangible assets was recorded as goodwill. The adjustments necessary to record tangible and identifiable intangible assets and liabilities at fair value are amortized to income and expensed over the estimated remaining lives of the related assets and liabilities.
As a bank incorporated under the laws of the Commonwealth of Kentucky, the Bank is subject to regulation, supervision and examination by the Department of Financial Institutions of the Commonwealth of Kentucky (the “Department”) and the Federal Deposit Insurance Corporation (the “FDIC”). The Bank is also a member of the Federal Home Loan Bank of Cincinnati (the “FHLB”).
Because BKFC’s activities have been limited primarily to holding the shares of common stock of the Bank, the following discussion of operations focuses primarily on the business of the Bank.
Available Information
BKFC maintains an Internet web site at the following internet address: http://www.bankofky.com. BKFC makes available free of charge through its website, its annual report on Form 10-K, quarterly reports on Form 10-Q, current reports on Form 8-K and amendments to those reports filed or furnished pursuant to Section 13(a) or 15(d) of the Exchange Act, as soon as reasonably practicable after such material was electronically filed with, or furnished to the SEC. Materials that BKFC files with the SEC may be read and copied at the Securities and Exchange Commission (“SEC”) Public Reference Room at 100 F Street, N.E., Washington, DC 20549. This information may also be obtained by calling the SEC at 1-800-SEC-0330. The SEC also maintains an internet website that contains reports, proxy and information statements, and other information regarding issuers that file electronically with the SEC at the SEC’s website, www.sec.gov. BKFC will provide a copy of any of the foregoing documents to stockholders free of charge upon request.
3
Lending Activities
General. As a commercial bank, the Bank offers a wide variety of loans. Among the Bank’s lending activities are the origination of loans secured by first mortgages on nonresidential real estate; loans secured by first mortgages on one- to four-family residences; commercial loans secured by various assets of the borrower; unsecured consumer loans and consumer loans secured by automobiles, boats and recreational vehicles; and construction and land development loans secured by mortgages on the underlying property.
The following table sets forth the composition of the Bank’s loan portfolio by type of loan at the dates indicated:
| | | | | | | | | | | | | | | | | | | | | | | | | | | | | | |
| | | As of December 31, | |
| | | 2008 | | | 2007 | | | 2006 | | | 2005 | | | 2004 | |
| | | Amount | | % | | | Amount | | % | | | Amount | | % | | | Amount | | % | | | Amount | | % | |
| | | (Dollars in thousands) | |
Type of Loan: | | | | | | | | | | | | | | | | | | | | | | | | | | | | | | |
Nonresidential real estate loans | | $ | 428,859 | | 41.7 | % | | $ | 387,234 | | 40.7 | % | | $ | 359,943 | | 44.2 | % | | $ | 295,326 | | 40.4 | % | | $ | 290,684 | | 40.3 | % |
Residential real estate loans | | | 239,729 | | 23.3 | | | | 215,915 | | 22.7 | | | | 181,534 | | 22.3 | | | | 183,644 | | 25.1 | | | | 188,140 | | 26.1 | |
Commercial loans | | | 175,188 | | 17.1 | | | | 182,431 | | 19.2 | | | | 151,213 | | 18.6 | | | | 136,693 | | 18.7 | | | | 130,760 | | 18.2 | |
Consumer loans | | | 17,693 | | 1.7 | | | | 20,601 | | 2.2 | | | | 19,260 | | 2.3 | | | | 20,046 | | 2.7 | | | | 20,606 | | 2.9 | |
Construction and land development loans | | | 150,754 | | 14.7 | | | | 134,807 | | 14.2 | | | | 95,812 | | 11.8 | | | | 89,847 | | 12.3 | | | | 84,690 | | 11.8 | |
Municipal obligations | | | 14,983 | | 1.5 | | | | 9,354 | | 1.0 | | | | 6,970 | | 0.8 | | | | 6,171 | | 0.8 | | | | 5,074 | | 0.7 | |
| | | | | | | | | | | | | | | | | | | | | | | | | | | | | | |
Total loans | | $ | 1,027,206 | | 100.0 | % | | $ | 950,342 | | 100.0 | % | | $ | 814,732 | | 100.0 | % | | $ | 731,727 | | 100.0 | % | | $ | 719,954 | | 100.0 | % |
| | | | | | | | | | | | | | | | | | | | | | | | | | | | | | |
Less: | | | | | | | | | | | | | | | | | | | | | | | | | | | | | | |
Deferred loan fees | | | 649 | | | | | | 628 | | | | | | 631 | | | | | | 668 | | | | | | 797 | | | |
Allowance for loan losses | | | 9,910 | | | | | | 8,505 | | | | | | 6,918 | | | | | | 7,581 | | | | | | 7,214 | | | |
| | | | | | | | | | | | | | | | | | | | | | | | | | | | | | |
Net loans | | $ | 1,016,647 | | | | | $ | 941,209 | | | | | $ | 807,183 | | | | | $ | 723,478 | | | | | $ | 711,943 | | | |
| | | | | | | | | | | | | | | | | | | | | | | | | | | | | | |
4
Loan Maturity Schedule. The following table sets forth certain information, as of December 31, 2008, regarding the dollar amount of loans maturing in the Bank’s portfolio based on their contractual terms to maturity and the dollar amount of such loans that have fixed or variable rates within certain maturity ranges ending after 2008:
| | | | | | | | | | | | |
| | | Due within one year | | Due after 1 year
to 5 years | | Due after 5
years | | Total |
| | | (Dollars in thousands) |
Commercial loans | | $ | 94,477 | | $ | 79,707 | | $ | 1,004 | | $ | 175,188 |
Construction and land development loans | | | 150,754 | | | — | | | — | | | 150,754 |
| | | | | | | | | | | | |
Total | | $ | 245,231 | | $ | 79,707 | | $ | 1,004 | | $ | 325,942 |
| | | | | | | | | | | | |
Interest sensitivity: | | | | | | | | | | | | |
With fixed rates | | | | | $ | 31,656 | | $ | 482 | | | |
With variable rates | | | | | | 48,051 | | | 522 | | | |
| | | | | | | | | | | | |
Total | | | | | $ | 79,707 | | $ | 1,004 | | | |
| | | | | | | | | | | | |
Nonresidential Real Estate Loans. The Bank makes loans secured by first mortgages on nonresidential real estate, including retail stores, office buildings, warehouses, apartment buildings and recreational facilities. Such mortgage loans generally have terms to maturity of between 10 and 20 years and are made with adjustable interest rates (“ARMs”). Interest rates on the ARMs adjust every one-, three- or five-years based upon the interest rates of the applicable one- three or five year U.S. Treasury security then offered.
The Bank limits the amount of each loan in relationship to the appraised value of the real estate and improvements at the time of origination of a nonresidential real estate loan. In accordance with regulations, the maximum loan-to-value ratio (the “LTV”) on nonresidential real estate loans made by the Bank is 80%, subject to certain exceptions.
Nonresidential real estate lending is generally considered to involve a higher degree of risk than residential lending. Such risk is due primarily to the dependence of the borrower on the cash flow from the property to service the loan. If the cash flow from the property is reduced due to a downturn in the economy, for example, or due to any other reason the borrower’s ability to repay the loan may be impaired. To reduce such risk, the decision to underwrite a nonresidential real estate loan is based primarily on the quality and characteristics of the income stream generated by the property and/or the business of the borrower. In addition, the Bank generally obtains the personal guarantees of one or more of the principals of the borrower and carefully evaluates the location of the real estate, the quality of the management operating the property, the debt service ratio and appraisals supporting the property’s valuation.
At December 31, 2008, the Bank had a total of $429 million invested in nonresidential real estate loans, the vast majority of which were secured by property located in the Northern Kentucky metropolitan area. Such loans comprised approximately 42% of the Bank’s total loans at such date, $3.06 million of which were non-performing.
Residential Real Estate Loans. The Bank originates permanent conventional loans secured by first mortgages on single-family and multi-family residential properties located in the Northern Kentucky area. The Bank also originates loans for the construction of residential properties and home equity loans secured by second mortgages on residential real estate. Each of such loans is secured by a mortgage on the underlying real estate and improvements thereon, if any.
The residential real estate loans originated for the Bank’s portfolio are either one- or three-year ARMs. Such loans typically have adjustment period caps of 2% and lifetime caps of 6%. The maximum amortization period of such loans is 30 years. The Bank does not engage in the practice of deeply discounting the initial rates on such loans, nor does the Bank engage in the practice of putting payment caps on loans that could lead to negative amortization. Historically, the Bank has not made fixed-rate residential mortgage loans for its portfolio. In order to meet consumer demand for fixed-rate loans, however, the Bank has originated loans for other lenders willing to accept the interest rate and credit risk.
The Bank requires private mortgage insurance for the amount of any such loan with an LTV in excess of 90%.
The aggregate amount of the Bank’s residential real estate loans equaled approximately $240 million at December 31, 2008, and represented 23% of total loans at such date. At December 31, 2008, the Bank had $3.14 million of non-performing loans of this type.
5
Loans held for sale. The Bank originates residential real estate loans to be sold, service released, subject to commitment to purchase in the secondary market. These loans are fixed rate with terms ranging from fifteen to thirty years. At December 31, 2008, these loans totaled $2.63 million.
Commercial Loans. The Bank offers commercial loans to individuals and businesses located throughout Northern Kentucky and the metropolitan area. The typical commercial borrower is a small to mid-sized company with annual sales under $10 million. The majority of commercial loans are made with adjustable rates of interest tied to the Bank’s prime interest rate. Commercial loans typically have terms of one to five years. Commercial lending entails significant risks. Such loans are subject to greater risk of default during periods of adverse economic conditions. Because such loans are secured by equipment, inventory, accounts receivable and other non-real estate assets, the collateral may not be sufficient to ensure full payment of the loan in the event of a default. To reduce such risk, the Bank generally obtains personal guarantees from one or more of the principals backing the borrower. At December 31, 2008, the Bank had $175 million, or 17% of total loans, invested in commercial loans, $890,000 of which was non-performing.
Consumer Loans. The Bank makes a variety of consumer loans, including automobile loans, recreational vehicle loans and personal loans. Such loans generally have fixed rates with terms from three to five years. Consumer loans involve a higher risk of default than residential real estate loans, particularly in the case of consumer loans that are unsecured or secured by rapidly depreciating assets, such as automobiles. Repossessed collateral for a defaulted consumer loan may not provide an adequate source of repayment of the outstanding loan balance as a result of the greater likelihood of damage, loss or depreciation, and the remaining deficiency may not warrant further substantial collection efforts against the borrower. In addition, consumer loan collections depend on the borrower’s continuing financial stability, and thus are more likely to be adversely affected by job loss, illness or personal bankruptcy. Various federal and state laws, including federal and state bankruptcy and insolvency laws, may also limit the amount that can be recovered on such loans. At December 31, 2008, the Bank had $18 million, or 2% of total loans, invested in consumer loans, $280,000 of which was non-performing.
Construction and Land Development Loans. The Bank makes loans for the construction of residential and nonresidential real estate and land development purposes. Most of these loans are structured with adjustable rates of interest tied to changes in the Bank’s prime interest rate for the period of construction. A general contractor makes many of the construction loans originated by the Bank to owner-occupants for the construction of single-family homes. Other loans are made to builders and developers for various projects, including the construction of homes and other buildings that have not been pre-sold and the preparation of land for site and project development.
Construction and land development loans involve greater underwriting and default risks than do loans secured by mortgages on improved and developing properties, due to the effects of general economic conditions on real estate developments, developers, managers and builders. In addition, such loans are more difficult to evaluate and monitor. Loan funds are advanced upon the security of the project under construction, which is more difficult to value before the completion of construction. Moreover, because of the uncertainties inherent in estimating construction costs, it is relatively difficult to evaluate accurately the LTVs and the total loan funds required to complete a project. In the event a default on a construction or land development loan occurs and foreclosure follows, the Bank must take control of the project and attempt either to arrange for completion of construction or dispose of the unfinished project. At December 31, 2008, a total of $151 million, or approximately 15% of the Bank’s total loans, consisted of construction and land development loans, $2.78 million of which were non-performing.
Municipal Obligations. The Bank makes loans to various Kentucky municipalities for various purposes, including the construction of municipal buildings and equipment purchases. Loans made to municipalities are usually secured by mortgages on the properties financed or by a lien on equipment purchased or by the general taxing authority of the municipality and provide certain tax benefits for the Bank. At December 31, 2008, the Bank had $15 million, or 1.5% of total loans, invested in municipal obligation loans, none of which were non-performing.
Loan Solicitation and Processing. The Bank’s loan originations are developed from a number of sources, including continuing business with depositors, borrowers and real estate developers, periodic newspaper and radio advertisements, solicitations by the Bank’s lending staff, walk-in customers, director referrals and an officer call program. For nonresidential real estate loans, the Bank obtains information with respect to the credit and business history of the borrower and prior projects completed by the borrower. Personal guarantees of one or more principals of the borrower are generally obtained. An environmental study of such real estate is normally conducted. Upon the completion of the appraisal of the nonresidential real estate and the receipt of information on the borrower, the loan application is submitted to the Bank’s Loan Committee if the amount and/or relationship exceeds the officer’s lending authority for approval or rejection. If, however, the loan relationship is in excess of $2.50 million, the loan will be submitted to the Bank’s Executive Committee for approval or rejection.
6
In connection with residential real estate loans, the Bank obtains a credit report, verification of employment and other documentation concerning the creditworthiness of the borrower. An appraisal of the fair market value of the real estate on which the Bank will be granted a mortgage to secure the loan is prepared by an independent fee appraiser approved by the Bank’s Board of Directors. An environmental study of such real estate is conducted only if the appraiser has reason to believe that an environmental problem may exist.
When a residential real estate loan application is approved, title insurance is normally obtained in respect of the real estate, which will secure the loan. When a nonresidential real estate loan application is approved, title insurance is customarily obtained on the title to the real estate, which will secure the mortgage loan. All borrowers are required to carry satisfactory fire and casualty insurance and flood insurance, if applicable, and name the Bank as an insured mortgagee.
Commercial loans are underwritten primarily on the basis of the stability of the income generated by the business and/or property. For most commercial loans, however, the personal guarantees of one or more principals of the borrowers are generally obtained. Consumer loans are underwritten on the basis of the borrower’s credit history and an analysis of the borrower’s income and expenses, ability to repay the loan and the value of the collateral, if any. The procedure for approval of construction loans is the same as for permanent mortgage loans, except that an appraiser evaluates the building plans, construction specifications and estimates of construction costs. The Bank also evaluates the feasibility of the proposed construction project and the experience and record of the builder.
Loan Origination and Other Fees. The Bank realizes loan origination fees and other fee income from its lending activities and also realizes income from late payment charges, application fees, and fees for other miscellaneous services. Loan origination fees and other fees are a volatile source of income, varying with the volume of lending, loan repayments and general economic conditions. Nonrefundable loan origination fees and certain direct loan origination costs are deferred and recognized as an adjustment to yield over the life of the related loan.
Delinquent Loans, Non-performing Assets and Classified Assets. When a borrower fails to make a required payment on a loan, the Bank attempts to cause the deficiency to be cured by contacting the borrower. In most cases, deficiencies are cured promptly as a result of these collection efforts.
Loans that are 90 days past due are not well secured and in the process of collection will be placed on non-accrual status. Under-collateralized loans that are 90 days past due will be fully or partially charged-off. The amount charged-off will be charged against the loan loss allowance.
The Bank has developed a risk-rating system to quantify commercial loan quality. The system assigns a risk rating from one to nine for each loan. Classified commercial loans are those with risk ratings of seven or higher. Each loan rating is determined by analyzing the borrowers’ management, financial ability, sales trends, operating results, financial conditions, asset protection, contingencies, payment history, financial flexibility, credit enhancements and other relevant factors. Loans that fall into the classified categories are monitored on a regular basis and proper action is taken to minimize the Bank’s exposure. Losses or partial losses will be taken when they are recognized.
The Bank’s risk rating system is similar to that used by regulatory agencies. Problem assets are classified as “special mention” (risk rating 6), ”substandard” (risk rating 7), “doubtful” (risk rating 8) or “loss” (risk rating 9). “Substandard” assets have one or more defined weaknesses and are characterized by the distinct possibility that the insured institution will sustain some loss if the deficiencies are not corrected. “Doubtful” assets have the same weaknesses as “substandard” assets, with the additional characteristics that (i) the weaknesses make collection or liquidation in full on the basis of currently existing facts, conditions and values questionable and (ii) there is a high possibility of loss. An asset classified as a “loss” is considered uncollectable and of such little value that its continuance as an asset of the institution is not warranted and is charged off. The regulations also contain a “special mention” category, consisting of assets which do not currently expose an institution to a sufficient degree of risk to warrant classification but which possess credit deficiencies or potential weaknesses deserving management’s close attention.
Generally, the Bank classifies as “substandard” all commercial loans that are delinquent more than 60 days, unless management believes the delinquency status is short-term due to unusual circumstances. Loans delinquent fewer than 60 days may also be classified if the loans have the characteristics described above rendering classification appropriate.
7
The aggregate amounts of the Bank’s classified assets at December 31, 2008 and 2007 were as follows:
| | | | | | | |
| | | 12/31/08 | | 12/31/07 | |
| | | (Dollars in thousands) | |
Special mention (risk rating 6) | | $ | 47,149 | | $ | 31,136 | |
Substandard (risk rating 7) | | | 39,524 | | | 21,248 | |
Doubtful (risk rating 8) | | | 175 | | | 3,040 | |
Loss (risk rating 9) | | | — | | | — | |
| | | | | | | |
Total classified assets | | $ | 86,848 | | $ | 55,424 | |
| | | | | | | |
The following table reflects the amount of loans that are in delinquent status of 30 to 89 days as of December 31, 2008 and 2007. Loans that are delinquent 90 days or more or are in non-accrual status are detailed below.
| | | | | | | | |
| | | 12/31/08 | | | 12/31/07 | |
| | | (Dollars in thousands) | |
Loans delinquent | | | | | | | | |
30 to 59 days | | $ | 4,177 | | | $ | 5,649 | |
60 to 89 days | | | 1,063 | | | | 920 | |
| | | | | | | | |
Total delinquent loans | | $ | 5,240 | | | $ | 6,569 | |
| | | | | | | | |
Ratio of total delinquent loans 30 to 89 days to total loans | | | 0.51 | % | | | 0.69 | % |
| | | | | | | | |
The following table sets forth information with respect to the Bank’s nonperforming assets for the periods indicated. In addition, the Bank evaluates loans to identify those that are “impaired.” Impaired loans are those for which management has determined that it is probable that the customer will be unable to comply with the contractual terms of the loan. Loans so identified are reduced to the present value of expected future cash flows, or to the fair value of the collateral securing the loan, by the allocation of a portion of the allowance for loan losses to the loan. As of December 31, 2008, the Bank had designated $14 million as impaired loans, a portion of these loans were included in the non-accrual and 90 days past due totals below. Management evaluates for impairment all loans selected for specific review during the quarterly allowance analysis. Generally, that analysis will not address smaller balance consumer credits.
| | | | | | | | | | | | | | | | | | | | |
| | | At December 31, | |
| | | 2008 | | | 2007 | | | 2006 | | | 2005 | | | 2004 | |
| | | (Dollars in thousands) | |
Loans accounted for on a non-accrual basis:(1) | | | | | | | | | | | | | | | | | | | | |
Nonresidential real estate | | $ | 2,401 | | | $ | 1,391 | | | $ | 318 | | | $ | 2,996 | | | $ | 1,319 | |
Residential real estate | | | 2,325 | | | | 1,731 | | | | 1,630 | | | | 95 | | | | 941 | |
Construction | | | 2,778 | | | | 2,281 | | | | 601 | | | | 941 | | | | 217 | |
Commercial | | | 588 | | | | 851 | | | | 356 | | | | 2,664 | | | | 1,010 | |
Consumer and other | | | 119 | | | | 135 | | | | — | | | | — | | | | — | |
| | | | | | | | | | | | | | | | | | | | |
Total | | | 8,211 | | | | 6,389 | | | | 2,905 | | | | 6,696 | | | | 3,487 | |
| | | | | | | | | | | | | | | | | | | | |
Accruing loans which are contractually past due 90 days or more: | | | | | | | | | | | | | | | | | | | | |
Nonresidential real estate | | $ | 86 | | | $ | 297 | | | $ | 271 | | | $ | 67 | | | $ | 361 | |
Residential real estate | | | 812 | | | | 1,739 | | | | 799 | | | | 1,225 | | | | 1,115 | |
Construction | | | 0 | | | | 205 | | | | — | | | | 114 | | | | — | |
Commercial | | | 291 | | | | 360 | | | | 959 | | | | 850 | | | | 113 | |
Consumer and other loans | | | 161 | | | | 57 | | | | 39 | | | | 93 | | | | 69 | |
| | | | | | | | | | | | | | | | | | | | |
Total | | | 1,350 | | | $ | 2,658 | | | | 2,068 | | | | 2,349 | | | | 1,658 | |
| | | | | | | | | | | | | | | | | | | | |
Restructured loans: Nonresidential real estate | | | 575 | | | | — | | | | — | | | | — | | | | — | |
| | | | | | | | | | | | | | | | | | | | |
Total non-performing loans | | $ | 10,136 | | | $ | 9,047 | | | $ | 4,973 | | | $ | 9,045 | | | $ | 5,145 | |
| | | | | | | | | | | | | | | | | | | | |
Percentage of total loans | | | 0.99 | % | | | 0.95 | % | | | 0.61 | % | | | 1.24 | % | | | 0.72 | % |
| | | | | | | | | | | | | | | | | | | | |
Other non-performing assets(2) | | $ | 712 | | | $ | 4,117 | | | $ | 2,981 | | | $ | 5,063 | | | $ | 1,434 | |
| | | | | | | | | | | | | | | | | | | | |
| (1) | Non-accrual status denotes loans in which, in the opinion of management, the collection of additional interest is unlikely, or loans that meet non-accrual criteria as established by regulatory authorities. Payments received on a non-accrual loan are accounted for on the cash-basis or cost-recovery method, until qualifying for return to accrual method. |
| (2) | Consists of real estate acquired through foreclosure, which is carried at fair value less estimated selling expenses. |
8
Allowance for Loan Losses. While management believes that it uses the best information available to determine the allowance for loan losses, unforeseen market conditions could result in adjustments, and net earnings could be significantly affected if circumstances differ substantially from the assumptions used in making the final determination. At December 31, 2008, the Bank’s allowance for loan losses totaled $9.9 million.
On at least a quarterly basis, a formal analysis of the adequacy of the allowance is prepared and reviewed by management and the Bank’s Board of Directors. This analysis serves as a point in time assessment of the level of the allowance and serves as a basis for provisions for loan losses. The loan quality monitoring process includes assigning loan grades and the use of a watch list to identify loans of concern.
The analysis of the allowance for loan losses includes the allocation of specific amounts of the allowance to individual problem loans, generally based on an analysis of the collateral securing those loans. Portions of the allowance are also allocated to loans based on their risk rating. These components are added together and compared to the balance of our allowance at the evaluation date.
The following table provides an allocation of the Bank’s allowance for loan losses as of each of the following dates:
| | | | | | | | | | | | | | | |
| | | At December 31, |
| | | 2008 | | 2007 | | 2006 | | 2005 | | 2004 |
| | | (Dollars in thousands) |
Loan type: | | | | | | | | | | | | | | | |
Commercial | | $ | 5,560 | | $ | 4,772 | | $ | 3,360 | | $ | 3,827 | | $ | 3,537 |
Real estate | | | 3,084 | | | 2,851 | | | 2,520 | | | 2,571 | | | 2,528 |
Consumer, CRA and credit cards | | | 1,266 | | | 882 | | | 1,038 | | | 1,183 | | | 1,149 |
| | | | | | | | | | | | | | | |
Total allowance for loan losses | | $ | 9,910 | | $ | 8,505 | | $ | 6,918 | | $ | 7,581 | | $ | 7,214 |
| | | | | | | | | | | | | | | |
The Bank increased its allowance for loan losses from $8.5 million at December 31, 2007, to $9.9 million at December 31, 2008. Because the loan loss allowance is based on estimates, it is monitored on an ongoing basis and adjusted as necessary to provide an adequate allowance. For further discussion on the allowance for loan losses see “Management Discussion and Analysis” of this Form 10-K.
Investment Activities
The investment policy of the Bank is both to manage the utilization of excess funds and to provide for the liquidity needs of the Bank as loan demand and daily operations dictate. The Bank’s federal income tax position is also consideration in its investment decisions. Investments in tax-exempt securities with maturities of less than 10 years are considered when the net yield exceeds that of taxable securities and the Bank’s effective tax rate warrants such investments.
9
The following table sets forth the composition of the Bank’s securities portfolio, at the dates indicated:
| | | | | | | | | | | | | | | | | | |
| | | At December 31, |
| | | 2008 | | 2007 | | 2006 |
| | | Amortized
Cost | | Fair
Value | | Amortized
Cost | | Fair
Value | | Amortized
Cost | | Fair
Value |
| | | (Dollars in thousands) |
Held-to-maturity securities: | | | | | | | | | | | | | | | | | | |
Municipal and other obligations | | $ | 33,725 | | $ | 33,416 | | $ | 16,230 | | $ | 16,170 | | $ | 12,028 | | $ | 11,815 |
| | | | | | | | | | | | | | | | | | |
Total held-to-maturity securities | | $ | 33,725 | | $ | 33,416 | | $ | 16,230 | | $ | 16,170 | | $ | 12,028 | | $ | 11,815 |
| | | | | | | | | | | | | | | | | | |
Available-for-sale securities: | | | | | | | | | | | | | | | | | | |
U.S.Treasury | | $ | | | $ | | | $ | 39,999 | | $ | 39,995 | | $ | 14,995 | | $ | 14,996 |
U.S. Government, federal agency and Government sponsored enterprises | | | 82,676 | | | 84,242 | | | 110,444 | | | 110,774 | | | 90,958 | | | 90,575 |
Corporate obligations | | | 1,245 | | | 1,245 | | | 1,300 | | | 1,300 | | | 1,355 | | | 1,355 |
| | | | | | | | | | | | | | | | | | |
Total available-for-sale securities | | $ | 83,921 | | $ | 85,487 | | $ | 151,743 | | $ | 152,069 | | $ | 107,308 | | $ | 106,926 |
| | | | | | | | | | | | | | | | | | |
The following table sets forth the amortized cost of the Bank’s securities portfolio at December 31, 2008 by contractual or expected maturity. Securities with call features are presented at call date if management expects that option to be exercised.
| | | | | | | | | | | | | | | | | | | | | | | | | | | | | |
| | | Maturing within
one year | | | Maturing after one
and within five years | | | Maturing after five
and within ten years | | | Maturing after
ten years | | | Total | |
| | | Amortized
Cost | | Average
Yield | | | Amortized
Cost | | Average
Yield | | | Amortized
Cost | | Average
Yield | | | Amortized
Cost | | Average
Yield | | | Amortized
Cost | | Average
Yield | |
| | | | | | | | (Dollars in thousands) | | | | | | | | | | | | | |
Held-to-maturity: | | | | | | | | | | | | | | | | | | | | | | | | | | | | | |
Municipal and other obligations (1) | | $ | 550 | | 3.24 | % | | $ | 15,109 | | 4.13 | % | | $ | 18,066 | | 4.53 | % | | — | | 0.00 | % | | $ | 33,725 | | 4.33 | % |
Available for sale: | | | | | | | | | | | | | | | | | | | | | | | | | | | | | |
Corporate obligations | | | — | | 0.00 | % | | | — | | 0.00 | % | | | — | | 0.00 | % | | 1,245 | | 5.51 | % | | | 1,245 | | 5.51 | % |
U.S. Government, federal agency and Government sponsored enterprises | | | 19,582 | | 3.30 | % | | | 26,255 | | 4.68 | % | | | 36,839 | | 5.25 | % | | — | | 0.00 | % | | | 82,676 | | 4.61 | % |
| (1) | Yield stated on a tax-equivalent basis using a 35% effective rate. |
Deposits and Borrowings
General.Deposits have traditionally been the primary source of the Bank’s funds for use in lending and other investment activities. In addition to deposits, the Bank derives funds from interest payments and principal repayments on loans and income on earning assets. Loan payments are a relatively stable source of funds, while deposit inflows and outflows fluctuate more in response to economic conditions and interest rates. The Bank has lines of credit established at its major correspondent banks to purchase federal funds to meet liquidity needs. The Bank may also borrow funds from the FHLB in the form of advances.
The Bank also uses retail repurchase agreements as a source of funds. These agreements essentially represent borrowings by the Bank from customers with maturities of three months or less. Certain securities are pledged as collateral for these agreements. At December 31, 2008, the Bank had $19.0 million in retail repurchase agreements.
10
The Bank also entered into a capital lease obligation for a branch in 1997 with a term of 20 years and a monthly payment of $4,000.
Deposits. Deposits are attracted principally from within the Bank’s designated lending area through the offering of numerous deposit instruments, including regular passbook savings accounts, negotiable order of withdrawal (“NOW”) accounts, money market deposit accounts, term certificate accounts and individual retirement accounts (“IRAs”). Interest rates paid, maturity terms, service fees and withdrawal penalties for the various types of accounts are established periodically by the Bank’s Board of Directors based on the Bank’s liquidity requirements, growth goals and market trends. The Bank may on occasion use brokers to attract deposits. The Bank had $5 million in brokered deposits as of December 31, 2008.
The following table presents the amount of the Bank’s jumbo certificates of deposit with principal balances greater than $100,000 by the time remaining until maturity as of December 31, 2008:
| | | |
Maturity | | At December 31, 2008 |
| | | (In thousands) |
Three months or less | | $ | 32,758 |
Over 3 months to 6 months | | | 50,217 |
Over 6 months to 12 months | | | 25,515 |
Over 12 months | | | 30,364 |
| | | |
Total | | $ | 138,854 |
| | | |
Short-Term Borrowings. In addition to repurchase agreements, the Bank has agreements with correspondent banks to purchase federal funds on an as needed basis to meet liquidity needs.
The following table sets forth the maximum month-end balance amount of the Bank’s outstanding short-term borrowings during the years ended December 31, 2008, 2007 and 2006, along with the average aggregate balances of the Bank’s outstanding short-term borrowings for such periods:
| | | | | | | | | | | | |
| | | During year ended December 31, | |
| | | 2008 | | | 2007 | | | 2006 | |
| | | (Dollars in thousands) | |
Maximum balance at any month-end during the period | | $ | 68,454 | | | $ | 22,789 | | | $ | 46,486 | |
Average balance | | | 29,616 | | | | 17,371 | | | | 16,904 | |
Weighted average interest rate | | | 1.63 | % | | �� | 3.75 | % | | | 4.81 | % |
The following table sets forth certain information as to short-term borrowings at the dates indicated:
| | | | | | | | | | | | |
| | | December 31, | |
| | | 2008 | | | 2007 | | | 2006 | |
Short-term borrowings outstanding | | $ | 28,153 | | | $ | 22,789 | | | $ | 15,960 | |
Weighted average interest rate | | | 1.49 | % | | | 3.12 | % | | | 3.96 | % |
Asset/Liability Management. The Bank’s earnings depend primarily upon its net interest income, which is the difference between its interest income on its interest-earning assets, such as mortgage loans and investment securities, and its interest expense paid on its interest-bearing liabilities, consisting of deposits and borrowings. As market interest rates change, asset yields and liability costs do not change simultaneously. Due to maturity, re-pricing and timing differences of interest-earning assets and interest-bearing liabilities, earnings will be affected differently under various interest rate scenarios. The Bank has sought to limit these net income fluctuations and manage interest rate risk by originating adjustable-rate loans and purchasing relatively short-term and variable-rate investments and securities.
11
The Bank’s interest rate spread is the principal determinant of the Bank’s net interest income. The interest rate spread can vary considerably over time because asset and liability re-pricing do not coincide. Moreover, the long-term and cumulative effect of interest rate changes can be substantial. Interest rate risk is defined as the sensitivity of an institution’s earnings and net asset values to changes in interest rates.
The ability to maximize net interest income is largely dependent upon sustaining a positive interest rate spread during fluctuations in the prevailing level of interest rates. Interest rate sensitivity is a measure of the difference between amounts of interest-earning assets and interest-bearing liabilities, which either re-price or mature within a given period of time. The difference, or the interest rate re-pricing “gap,” provides an indication of the extent to which a financial institution’s interest rate spread will be affected by changes in interest rates. A positive gap occurs when interest-earning assets exceed interest-bearing liabilities re-pricing during a designated time frame. Conversely, a negative gap occurs when interest-bearing liabilities exceed interest-earning assets re-pricing within a designated time frame. Generally, during a period of rising interest rates, a negative gap would adversely affect net interest income, while a positive gap would result in an increase in net interest income, and during a period of falling interest rates, a negative gap would result in an increase in net interest income, while a positive gap would have the opposite effect.
In recognition of the foregoing factors, the management and the Board of Directors of the Bank have implemented an asset and liability management strategy directed toward maintaining a reasonable degree of interest rate sensitivity. The principal elements of such strategy include: (i) meeting the consumer preference for fixed-rate loans over the past two years by establishing a correspondent lending program that has enabled the Bank to originate and sell fixed-rate mortgage loans; (ii) maintaining relatively short weighted-average terms to maturity in the securities portfolio as a hedge against rising interest rates; (iii) emphasizing the origination and retention of adjustable-rate loans; and (iv) utilizing longer term certificates of deposit as funding sources when available. Management and the Board of Directors monitor the Bank’s exposure to interest rate risk on a monthly basis to ensure the interest rate risk is maintained within an acceptable range. For more information on the Bank’s interest rate risk see the “Asset/Liability Management and Market Risk” section of the “Management’s Discussion and Analysis of Financial Condition”.
The following table sets forth the amounts of the Bank’s interest-earning assets and interest-bearing liabilities outstanding at December 31, 2008, which is scheduled to re-price or mature in each of the time periods shown. The amount of assets and liabilities shown which re-price or mature in a given period were determined in accordance with the contractual terms of the asset or liability. The table shows that the maturity or repricing of the Bank’s liabilities exceed the contractual terms to maturity or repricing of the Bank’s earning assets in a twelve-month period by $317.6 million. While this table based on contractual terms shows a negative “gap,” the Bank’s interest rate model which incorporates assumptions based on historical behavior shows a negative “gap” of $215.4 million. The difference is a result of the Bank’s interest rate model assumption that the balances in NOW and savings accounts react within a two-year timeframe to market rate changes, rather than repricing immediately. These instruments are not tied to specific indices and are only influenced by market conditions and other factors. The Bank’s experience with NOW and savings accounts has been that they have repriced at a pace equal to approximately 25% of a prime change. Accordingly, a general movement in interest rates may not have any immediate effect on the rates paid on those deposit accounts.
12
| | | | | | | | | | | | | | | | | | | |
| | | Within 3 months | | | 4 - 12 months | | | 1 through 5 years | | | Over 5 years | | | Total |
| | | (Dollars in thousands) | | | |
Interest-earning assets: | | | | | | | | | | | | | | | | | | | |
Federal funds sold | | $ | 501 | | | $ | — | | | $ | — | | | $ | — | | | $ | 501 |
Interest bearing deposits with banks | | | 100 | | | | — | | | | — | | | | — | | | | 100 |
Securities | | | 20,688 | | | | 5,647 | | | | 41,696 | | | | 56,140 | | | | 124,171 |
Loans receivable (1) | | | 304,112 | | | | 242,806 | | | | 476,610 | | | | 6,335 | | | | 1,029,863 |
| | | | | | | | | | | | | | | | | | | |
Total interest-earning assets | | | 325,401 | | | | 248,453 | | | | 518,306 | | | | 62,475 | | | | 1,154,635 |
| | | | | | | | | | | | | | | | | | | |
Interest-bearing liabilities: | | | | | | | | | | | | | | | | | | | |
Savings deposits | | | 35,355 | | | | — | | | | — | | | | — | | | | 35,355 |
Money market deposit accounts | | | 220,704 | | | | — | | | | — | | | | — | | | | 220,704 |
NOW accounts | | | 266,704 | | | | — | | | | — | | | | — | | | | 266,704 |
Certificates of deposit | | | 79,719 | | | | 183,922 | | | | 70,671 | | | | — | | | | 334,312 |
IRAs | | | 12,206 | | | | 26,858 | | | | 17,932 | | | | — | | | | 56,996 |
Federal funds purchased | | | 4,716 | | | | — | | | | — | | | | — | | | | 4,716 |
Repurchase agreements | | | 19,037 | | | | — | | | | — | | | | — | | | | 19,037 |
Other borrowings | | | 4,400 | | | | — | | | | — | | | | — | | | | 4,400 |
Notes payable | | | 38,000 | | | | — | | | | 6,000 | | | | 798 | | | | 44,798 |
| | | | | | | | | | | | | | | | | | | |
Total interest-bearing liabilities | | | 680,841 | | | | 210,780 | | | | 94,603 | | | | 798 | | | | 987,022 |
| | | | | | | | | | | | | | | | | | | |
Interest-earning assets less | | | | | | | | | | | | | | | | | | | |
interest-bearing liabilities | | $ | (355,440 | ) | | $ | 37,637 | | | $ | 423,703 | | | $ | 61,677 | | | $ | 167,613 |
| | | | | | | | | | | | | | | | | | | |
Cumulative interest-rate sensitivity gap | | $ | (355,440 | ) | | $ | (317,767 | ) | | $ | 105,936 | | | $ | 167,613 | | | | |
| | | | | | | | | | | | | | | | | | | |
Cumulative interest-rate gap as a percentage of total interest earning assets | | | (30.78 | )% | | | (27.52 | )% | | | 9.17 | % | | | 14.52 | % | | | |
| | | | | | | | | | | | | | | | | | | |
| (1) | Excludes the allowance for loan losses, in process accounts and purchase accounting adjustments. |
Competition
The Bank competes for deposits with other commercial banks, savings associations and credit unions and with the issuers of commercial paper and other securities, such as shares in money market mutual funds. The primary factors in competing for deposits are interest rates and convenience of office locations. In making loans, the Bank competes with other banks, savings associations, consumer finance companies, credit unions, leasing companies and other lenders. The Bank competes for loan originations primarily through the interest rates and loan fees it charges and through the efficiency and quality of services it provides to borrowers. Competition is affected by, among other things, the general availability of lendable funds, general and local economic conditions, current interest rate levels and other factors that are not readily predictable.
Due to the Bank’s size relative to the many other financial institutions in its market area, management believes that the Bank does not have a substantial share of the deposit and loan markets. The size of financial institutions competing with the Bank is likely to increase as a result of changes in statutes and regulations eliminating various restrictions on interstate and inter-industry branching and acquisitions. Such increased competition may have an adverse effect upon the Bank.
Employees
As of December 31, 2008, the Bank had 264 full-time employees and 67 part-time employees. The Bank believes that relations with its employees are good. None of the employees of the Bank are represented by a labor union or subject to a collective bargaining agreement.
13
Regulation and Supervision
The following discussion describes elements of an extensive regulatory framework applicable to bank holding companies and banks and specific information about BKFC. Federal and state regulation of banks and their holding companies is intended primarily for the protection of depositors and the Deposit Insurance Fund, rather than for the protection of stockholders and creditors.
Regulation of BKFC. BKFC is a bank holding company subject to regulation by the Board of Governors of the Federal Reserve System (“FRB”) under the Bank Holding Company Act of 1956, as amended (“BHCA”). As a bank holding company, BKFC is required to file periodic reports with, and is subject to the regulation, supervision and examination by, the FRB. Such examination by the FRB determines whether BKFC is operating in accordance with various regulatory requirements and in a safe and sound manner. The FRB may initiate enforcement proceedings against BKFC for violations of laws or regulations or for engaging in unsafe and unsound practices, particularly if such conduct could or does adversely impact the Bank. BKFC is also subject to the disclosure and regulatory requirements of the Securities Act of 1933, as amended, and the Securities Exchange Act of 1934, as amended, as administered by the SEC.
Under the BHCA, the FRB’s prior approval is required in any case in which BKFC proposes to acquire all or substantially all of the assets of any bank, acquire direct or indirect ownership or control of more than 5% of the voting shares of any bank, or merge or consolidate with any other bank holding company. The BHCA also prohibits, with certain exceptions, BKFC from acquiring direct or indirect ownership or control of more than 5% of any class of voting shares of any non-banking company. Under the BHCA, BKFC may not engage in any business other than managing and controlling banks or furnishing certain specified services to subsidiaries and may not acquire voting control of non-banking companies unless the FRB determines such businesses and services to be closely related to banking. When reviewing bank acquisition applications for approval, the FRB considers, among other things, each subsidiary bank’s record in meeting the credit needs of the communities it serves in accordance with the Community Reinvestment Act of 1977, as amended (the “CRA”). The Bank has a current CRA rating of “satisfactory.” In addition, the FRB could require that BKFC terminate any activity, if the FRB deems the activity to constitute a serious risk to the financial soundness of the Bank.
It is the policy of the FRB that a bank holding company be ready and able to use its resources to provide capital to its subsidiary banks during periods of financial stress or adversity. The FRB could require BKFC to provide such support at times when BKFC lacks the resources to do so. See “Regulatory Capital Requirements” and “Dividend Restrictions” regarding minimum capital levels to which BKFC is subject and regulatory limits on BKFC’s ability to pay dividends to stockholders. As a bank holding company, BKFC must notify the FRB if, during any one-year period, it seeks to redeem shares of stock in an amount such that total redemptions during the year, net of sales of shares, would be greater than 10% of BKFC’s net worth.
Regulation of the Bank.The Bank is a Kentucky-chartered bank with Federal Deposit Insurance Corporation (“FDIC”) deposit insurance. The Bank is subject to numerous federal and state statutes and regulations regarding the conduct of its business, including, among other things, maintenance of reserves against deposits; capital adequacy; restrictions on the nature and amount of loans which may be made and the interest which may be charged thereon; restrictions on the terms of loans to officers, directors, large shareholders and their affiliates; restrictions relating to investments and other activities; and requirements regarding mergers and branching activities.
The Bank is subject to the regulation, supervision and examination by the Department and the FDIC. Both the Department and the FDIC have the authority to issue cease-and-desist orders if either determines that the activities of the Bank represent unsafe and unsound banking practices. If the grounds provided by law exist, the Department or the FDIC may appoint a conservator or receiver for the Bank.
State-chartered banks, like the Bank, are subject to regulatory oversight under various consumer protection and fair lending laws. These laws govern, among other things, truth-in-lending disclosure, equal credit opportunity, fair credit reporting and community reinvestment. Failure to abide by federal laws and regulations governing community reinvestment could limit the ability of a state-chartered bank to open a new branch or engage in a merger transaction.
The Bank is subject to the guidance on sound risk management practices for concentrations in commercial real estate lending set forth by the Office of the Comptroller of the Currency, the Board of Governors of the Federal Reserve System, and the Federal Deposit Insurance Corporation. The guidance is intended to help ensure that institutions pursuing a significant commercial real estate lending strategy remain healthy and profitable while continuing to serve the credit needs of their communities. Also, this guidance directs institutions in developing risk management practices and levels of capital that are commensurate with the level and nature of their commercial real estate concentrations.
14
Kentucky law limits loans or other extensions of credit to any borrower to 20% of the Bank’s paid-in capital and actual surplus. Such limit is increased to 30% if the borrower provides good collateral security or executes to it a mortgage upon real or personal property with a cash value exceeding the amount of the loan. Loans or extensions of credit to certain borrowers are aggregated, and loans secured by certain government obligations are exempt from these limits. At December 31, 2008, the maximum the Bank could lend to any one borrower generally equaled $16 million and equaled $24 million if the borrower provided collateral with a cash value in excess of the amount of the loan. Federal banking laws and regulations also limit the transfer of funds or other items of value, including pursuant to the provision of loans, from banks to their affiliates.
Generally, the Bank’s permissible activities and investments are prescribed by Kentucky law. However, state-chartered banks, including the Bank, may not, directly or through a subsidiary, engage in activities or make any investments as principal not permitted for a national bank, a bank holding company or a subsidiary of a nonmember bank, unless they obtain FDIC approval.
Emergency Economic Stabilization Act of 2008. In response to recent unprecedented market turmoil, the Emergency Economic Stabilization Act of 2008 (the “EESA”) was enacted on October 3, 2008. The EESA authorizes the Secretary of the United States Department of the Treasury (the “Secretary”) to purchase or guarantee up to $700 billion in troubled assets from financial institutions under the Troubled Asset Relief Program (“TARP”). Pursuant to authority granted under the EESA, the Secretary has created the TARP Capital Purchase Program (“CPP”) under which the Treasury Department will invest up to $250 billion in senior preferred stock of U.S. banks and savings associations or their holding companies. Qualifying financial institutions may issue senior preferred stock with a value equal to not less than 1% of risk-weighted assets and not more than the lesser of $25 billion or 3% of risk-weighted assets.
Institutions participating in the TARP or CPP are required to issue warrants for common or preferred stock or senior debt to the Secretary. If an institution participates in the CPP or if the Secretary acquires a meaningful equity or debt position in the institution as a result of TARP participation, the institution is required to meet certain standards for executive compensation and corporate governance, including a prohibition against incentives to take unnecessary and excessive risks, recovery of bonuses paid to senior executives based on materially inaccurate earnings or other statements and a prohibition against agreements for the payment of golden parachutes. Institutions that sell more than $300 million in assets under TARP auctions or participate in the CPP will not be entitled to a tax deduction for compensation in excess of $500,000 paid to its chief executive or chief financial official or any of its other three most highly compensated officers. In addition, any severance paid to such officers for involuntary termination or termination in connection with a bankruptcy or receivership will be subject to the golden parachute rules under the Internal Revenue Code. Additional standards with respect to executive compensation and corporate governance for institutions that have participated or will participate in the TARP (including the CPP) were enacted as part of the ARRA, described below.
CPP Participation. On February 13, 2009, BKFC entered into a Letter Agreement (the “Purchase Agreement”) with the Treasury Department under the CPP, pursuant to which BKFC agreed to issue 34,000 shares of BKFC’s Fixed Rate Cumulative Perpetual Preferred Stock, Series A (the “Series A Preferred Stock”), having a liquidation amount per share equal to $1,000, for a total price of $34 million. The Series A Preferred Stock is to pay cumulative dividends at a rate of 5% per year for the first five years and thereafter at a rate of 9% per year. BKFC may not redeem the Series A Preferred Stock during the first three years except with the proceeds from a “qualified equity offering” (as defined in BKFC’s articles of incorporation). However, under the ARRA, BKFC may redeem the Series A Preferred Stock without a “qualified equity offering,” subject to the approval of its primary federal regulator. BKFC may, at its option, redeem the Series A Preferred Stock at par value plus accrued and unpaid dividends. The Series A Preferred Stock is generally non-voting, but does have the right to vote as a class on the issuance of any preferred stock ranking senior, any change in its terms or any merger, exchange or similar transaction that would adversely affect its rights. The holder(s) of Series A Preferred Stock also have the right to elect two directors if dividends have not been paid for six periods.
As part of its purchase of the Series A Preferred Stock, the Treasury Department received a warrant (the “Warrant”) to purchase 274,784 shares of BKFC’s common stock at an initial per share exercise price of $18.56. The Warrant provides for the adjustment of the exercise price and the number of shares of BKFC’s common stock issuable upon exercise pursuant to customary anti-dilution provisions, such as upon stock splits or distributions of securities or other assets to holders of BKFC’s common stock, and upon certain issuances of BKFC’s common stock at or below a specified price relative to the initial exercise price. The Warrant expires ten years from the issuance date. If, on or prior to December 31, 2009, BKFC receives aggregate gross cash proceeds of not less than $34 million from “qualified equity offerings” announced after
15
October 13, 2008, the number of shares of common stock issuable pursuant to the Treasury Department’s exercise of the Warrant will be reduced by one-half of the original number of shares, taking into account all adjustments, underlying the Warrant. Pursuant to the Purchase Agreement, the Treasury Department has agreed not to exercise voting power with respect to any shares of common stock issued upon exercise of the Warrant. Under the ARRA, the Warrant would be liquidated upon the redemption by BKFC of the Series A Preferred Stock.
Both the Series A Preferred Stock and the Warrant will be accounted for as components of Tier 1 capital, as further described below.
Prior to February 13, 2012, unless BKFC has redeemed the Series A Preferred Stock or the Treasury Department has transferred the Series A Preferred Stock to a third party, the consent of the Treasury Department will be required for BKFC to (1) declare or pay any dividend or make any distribution on its common stock (other than regular semiannual cash dividends of not more than $0.28 per share of common stock) or (2) redeem, purchase or acquire any shares of its common stock or other equity or capital securities, other than in connection with benefit plans consistent with past practice and certain other circumstances specified in the Purchase Agreement.
American Recovery and Reinvestment Act of 2009. The ARRA was enacted on February 17, 2009. The ARRA includes a wide variety of programs intended to stimulate the economy and provide for extensive infrastructure, energy, health, and education needs. In addition, the ARRA imposes certain new executive compensation and corporate governance obligations on all current and future TARP recipients, including BKFC, until the institution has redeemed the preferred stock, which TARP recipients are now permitted to do under the ARRA without regard to the three year holding period and without the need to raise new capital, subject to approval of its primary federal regulator. The executive compensation restrictions under the ARRA (described below) are more stringent than those currently in effect under the CPP, but it is yet unclear how these executive compensation standards will relate to the similar standards recently announced by the Treasury Department, or whether the standards will be considered effective immediately or only after implementing regulations are issued by the Treasury Department.
The ARRA amends Section 111 of the EESA to require the Secretary to adopt additional standards with respect to executive compensation and corporate governance for TARP recipients (including BKFC). The standards required to be established by the Secretary include, in part, (1) prohibitions on making golden parachute payments to senior executive officers and the next 5 most highly-compensated employees during such time as any obligation arising from financial assistance provided under the TARP remains outstanding (the “Restricted Period”), (2) prohibitions on paying or accruing bonuses or other incentive awards for certain senior executive officers and employees, except for awards of long-term restricted stock with a value equal to no greater than 1/3 of the subject employee’s annual compensation that do not fully vest during the Restricted Period or unless such compensation is pursuant to a valid written employment contract prior to February 11, 2009, (3) requirements that TARP CPP participants provide for the recovery of any bonus or incentive compensation paid to the five most highly-compensated employees based on statements of earnings, revenues, gains or other criteria later found to be materially inaccurate, with the Secretary having authority to negotiate for reimbursement, and (4) a review by the Secretary of all bonuses and other compensation paid by TARP participants to senior executive employees and the next 20 most highly-compensated employees before the date of enactment of the ARRA to determine whether such payments were inconsistent with the purposes of the Act.
The ARRA also sets forth additional corporate governance obligations for TARP recipients, including requirements for the Secretary to establish standards that provide for semi-annual meetings of compensation committees of the board of directors to discuss and evaluate employee compensation plans in light of an assessment of any risk posed from such compensation plans. TARP recipients are further required by the ARRA to have in place company-wide policies regarding excessive or luxury expenditures, permit non-binding shareholder “say-on-pay” proposals to be included in proxy materials, as well as require written certifications by the chief executive officer and chief financial officer with respect to compliance. The Secretary is required to promulgate regulations to implement the executive compensation and certain corporate governance provisions detailed in the ARRA.
Regulatory Capital Requirements. The FRB has adopted risk-based capital guidelines for bank holding companies. Such companies must maintain adequate consolidated capital to meet the minimum ratio of total capital to risk-weighted assets (including certain off-balance-sheet items, such as standby letters of credit) (the “Risk-Based Ratio”) of 8%. At least half of the minimum-required total capital of 8% must be composed of Tier 1 Capital, which consists of common shareholders’ equity, minority interests in the equity of consolidated subsidiaries and a limited amount of perpetual preferred stock, less goodwill and certain other intangibles (“Tier 1 Risk-Based Ratio”). The remainder of total capital may consist of subordinated and qualifying convertible debt, other preferred stock and a limited amount of loan and lease loss allowances.
16
The FRB also has established minimum leverage ratio guidelines for bank holding companies. The guidelines provide for a minimum ratio of Tier 1 Capital to average total assets (excluding the loan and lease loss allowance, goodwill and certain other intangibles, and portions of certain nonfinancial equity investments) (the “Leverage Ratio”) of 3% for bank holding companies that meet specified criteria, including having the highest regulatory rating. All other bank holding companies must maintain a Leverage Ratio of 4% to 5%. The guidelines further provide that bank holding companies making acquisitions will be expected to maintain strong capital positions substantially above the minimum supervisory levels.
The Bank is subject to similar capital requirements, and such capital requirements are imposed and enforced by the FDIC.
The following table sets forth the Tier 1 Risk-Based Ratio, Total Risk-Based Ratio and Leverage Ratio for BKFC and the Bank at December 31, 2008:
| | | | | | | | | | | | |
| | | At December 31, 2008 | |
| | | BKFC | | | Bank | |
| | | Amount | | Percent | | | Amount | | Percent | |
| | | (Dollars in thousands) | |
Tier 1 risk-based | | $ | 96,673 | | 8.19 | % | | $ | 100,212 | | 8.50 | % |
Requirement | | | 47,192 | | 4.00 | | | | 47,136 | | 4.00 | |
| | | | | | | | | | | | |
Excess | | $ | 49,481 | | 4.19 | % | | $ | 53,050 | | 4.50 | % |
| | | | | | | | | | | | |
Total risk-based | | $ | 126,583 | | 10.73 | % | | $ | 130,122 | | 11.04 | % |
Requirement | | | 94,384 | | 8.00 | | | | 94,273 | | 8.00 | |
| | | | | | | | | | | | |
Excess | | $ | 32,199 | | 2.73 | % | | $ | 35,798 | | 3.04 | % |
| | | | | | | | | | | | |
Leverage ratio | | $ | 96,673 | | 7.96 | % | | $ | 100,212 | | 8.29 | % |
Requirement | | | 48,575 | | 4.00 | | | | 48,343 | | 4.00 | |
| | | | | | | | | | | | |
Excess | | $ | 48,098 | | 3.96 | % | | $ | 51,869 | | 4.29 | % |
| | | | | | | | | | | | |
The FDIC may require an increase in a bank’s risk-based capital requirements on an individualized basis to address the bank’s exposure to a decline in the economic value of its capital due to a change in interest rates, among other things.
Prompt Corrective Regulatory Action. The FDIC has adopted regulations governing prompt corrective action to resolve the problems of capital deficient and otherwise troubled banks under its regulation. For these purposes, the law establishes three categories of capital deficient institutions: undercapitalized, significantly undercapitalized and critically undercapitalized. At each successively lower defined capital category, an institution is subject to more restrictive and numerous mandatory or discretionary regulatory actions or limits, and the FDIC has less flexibility in determining how to resolve the problems of the institution. The FDIC generally can downgrade an institution’s capital category, notwithstanding its capital level, if, after notice and opportunity for hearing, the institution is deemed to be engaging in an unsafe or unsound practice because it has not corrected deficiencies that resulted in it receiving a less than satisfactory examination rating on matters other than capital or it is deemed to be in an unsafe or unsound condition. An undercapitalized institution must submit a capital restoration plan to the FDIC within 45 days after it becomes undercapitalized. Such institution will be subject to increased monitoring and asset growth restrictions and will be required to obtain prior approval for acquisitions, branching and engaging in new lines of business. Furthermore, critically undercapitalized institutions must be placed in conservatorship or receivership within 270 days of reaching that capitalization level, except under limited circumstances. At year-end 2008 the most recent regulatory notifications categorized the Bank as well capitalized under the regulatory framework for prompt corrective action. There are no conditions or events since that notification that management believes have changed the institution’s category.
The FDIC has adopted regulations to implement the prompt corrective action legislation. An institution is deemed to be “well capitalized” if it has a total risk-based capital ratio of 10% or greater, a Tier 1 risk-based capital ratio of 6% or greater, and a leverage ratio of 5% or greater. An institution is “adequately capitalized” if it has a total risk-based capital ratio of 8% or greater, a Tier 1 risk-based capital ratio of 4% or greater and generally a leverage ratio of 4% or greater. An institution is “undercapitalized” if it has a total risk-based capital ratio of less than 8%, a Tier 1 risk-based capital ratio of less than 4%, or generally a leverage ratio of less than 4% (3% or less for institutions with the highest examination rating). An institution is deemed to be “significantly undercapitalized” if it has a total risk-based capital ratio of less than 6%, a Tier 1 risk-based capital ratio of less than 3%, or a leverage ratio of less than 3%. An institution is considered to be “critically
17
undercapitalized” if it has a ratio of tangible equity (as defined in the regulations) to total assets that is equal to or less than 2%. The Bank’s capital levels at December 31, 2008 met the standards for the highest level, a “well-capitalized” institution.
Federal law prohibits a financial institution from making a capital distribution to anyone or paying management fees to any person having control of the institution if, after such distribution or payment, the institution would be undercapitalized. In addition, each holding company controlling an undercapitalized institution must guarantee that the institution will comply with its capital restoration plan until the institution has been adequately capitalized on an average during each of the four preceding calendar quarters and must provide adequate assurances of performance. The aggregate liability pursuant to such guarantee is limited to the lesser of (i) an amount equal to 5% of the institution’s total assets at the time it became undercapitalized or (ii) the amount necessary to bring the institution into compliance with all capital standards applicable to such institution at the time the institution fails to comply with its capital restoration plan.
Dividend Restrictions.The ability of BKFC to pay cash dividends to its stockholders depends on the amount of dividends that may be declared and paid by the Bank and the ability of BKFC to draw on its $10 million borrowing line of credit, which currently has $4.4 million outstanding. There are a number of statutory and regulatory requirements applicable to the payment of dividends by banks and bank holding companies. Please see note 15 of the financial statements for a discussion on the Bank’s current dividend restrictions.
As part of the CPP program the Corporation any increase in the dividend level from the September 2008 semi-annual payment of $.28 per share must be approved by the Treasury department.
If the FRB or the FDIC determines that a bank holding company or a bank is engaged in or is about to engage in an unsafe or unsound practice (which, depending on the financial condition of the entity, could include the payment of dividends), that regulator may require, after notice and hearing, that such bank holding company or bank cease and desist from such practice. In addition, the FRB and the FDIC have issued policy statements, which provide that insured banks and bank holding companies should generally only pay dividends out of current operating earnings. The FDIC prohibits the payment of any dividend by a bank that would constitute an unsafe or unsound practice. Compliance with the minimum capital requirements limits the amounts that BKFC and the Bank can pay as dividends.
In 2008, BKFC paid a cash dividend of $0.54 per share totaling approximately $3.04 million.
FDIC Deposit Insurance and Assessments.The FDIC is an independent federal agency that insures deposits, up to prescribed statutory limits, of federally insured banks and thrifts and safeguards the safety and soundness of the banking and thrift industries. The Bank’s deposits are insured by the Deposit Insurance Fund of the FDIC (the “DIF”). The DIF is the successor to the Bank Insurance Fund and the Savings Association Insurance Fund, which were merged in 2006. The FDIC amended its risk-based assessment system for to implement authority granted by the Federal Deposit Insurance Reform Act of 2005 (the “Reform Act”). Under the revised system, insured institutions are assigned to one of four risk categories based on supervisory evaluations, regulatory capital levels and certain other factors. An institution’s assessment rate depends upon the category to which it is assigned. Risk Category I, which contains the least risky depository institutions, is expected to include 90% of all institutions. Unlike the other categories, Risk Category I contains further risk differentiation based on the FDIC’s analysis of financial ratios, examination component ratings and other information.
In October 2008, the basic limit on federal deposit insurance coverage of interest bearing transaction accounts increased from $100,000 to $250,000 per depositor under the EESA. In November 2008, the FDIC offered a voluntary expanded insurance program to depository institutions, which provides, without charge to depositors, full guarantee on all non-interest bearing transaction accounts held by any depositor, regardless of dollar amount. The Bank participates in this program. The FDIC maintains the DIF by assessing each depository institution an insurance premium. The amount of FDIC assessments paid by a DIF member institution is based on its relative risk of default as measured by a company’s FDIC supervisory rating, and other various measures, such as the level of brokered deposits, unsecured debt, and debt issuer ratings.
On February 27, 2009, the FDIC adopted an amended restoration plan for the DIF that was originally established and implemented on October 7, 2008. The amended Plan requires an increase in premium assessment rates to return the DIF reserve ratio to 1.15 percent within seven years. The FDIC also adopted an interim rule imposing a special assessment equal to 20 basis points of an institution’s assessment base on June 30, 2009. The assessment will be payable on or about September 30, 2009. The interim rule provides that the FDIC may impose additional emergency special assessments of up to 10 basis points, if necessary. There can be no assurance as to what the amount of the assessment rates will be when the final rule is adopted.
The DIF assessment rate currently ranges from 12 to 50 cents per $100 of domestic deposits. Effective April 1, 2009, the FDIC has proposed an assessment rate range of 12 to 45 basis points for institutions that do not exceed a certain
18
threshold amount of brokered deposits and secured liabilities, and higher rates for those that do exceed the threshold amount. The FDIC may increase or decrease the assessment rate schedule from one quarter to the next. An increase in the assessment rate could have a material adverse effect on BKFC’s earnings, depending on the amount of the increase. The FDIC is authorized to terminate a depository institution’s deposit insurance upon a finding by the FDIC that the institution’s financial condition is unsafe or unsound, or that the institution has engaged in unsafe or unsound practices, or has violated any applicable rule, regulation, order or condition enacted or imposed by the institution’s regulatory agency. The termination of deposit insurance for the Bank could have a material adverse effect on BKFC’s earnings.
FRB Reserve Requirements. FRB regulations currently require banks to maintain reserves of 3% of net transaction accounts (primarily demand and NOW accounts) up to $44.4 million of such accounts (subject to an exemption of up to $10.3 million), and of 10% of net transaction accounts in excess of $44.4 million. At December 31, 2008, the Bank was in compliance with this reserve requirement, which was $4,583,000.
Acquisitions of Control.Acquisitions of controlling interests of BKFC and the Bank are subject to the limitations in federal and state laws. These limits generally require regulatory approval of acquisitions of specified levels of stock of any of these entities. Acquisitions of BKFC or the Bank by merger or pursuant to the purchase of assets also require regulatory approval.
Federal Home Loan Banks. The Federal Home Loan Banks (“FHLBs”) provide credit to their members in the form of advances. The Bank is a member of the FHLB of Cincinnati and must maintain an investment in the capital stock of the FHLB of Cincinnati that consist of two components, the first is the membership component which is equal to 0.15% of the Bank’s total assets, the second is an activity component that is equal to 2% to 4% of the Bank’s outstanding advances. The Bank is in compliance with this requirement with an investment in stock of the FHLB of Cincinnati of $4,959,000 at December 31, 2008. Generally, FHLBs are not permitted to make new advances to a member without positive tangible capital.
Federal Taxation
BKFC. BKFC and the Bank file a consolidated federal income tax return on a calendar year basis. BKFC is subject to the federal tax laws and regulations that apply to corporations generally.
The Bank. In 2000, the Bank acquired the stock of Fort Thomas Financial Corporation. Fort Thomas Financial Corporation’s wholly owned subsidiary was Fort Thomas Savings Bank. Federal income tax laws provided savings banks with additional bad debt deductions through 1987, totaling $1,255,000 for Fort Thomas Financial Corporation. Accounting standards do not require a deferred tax liability to be recorded on this amount, which would otherwise total $427,000. Upon acquisition, this unrecorded liability was transferred to the Bank. If the Bank was liquidated or otherwise ceased to be a bank or if tax laws were to change, the $427,000 would be recorded as a liability with an offset to income tax expense.
In 2007, BKFC consummated the acquisition of FNB Bancorporation, Inc. and its subsidiary, First Bank of Northern Kentucky, Inc. (“First Bank”). The First Bank acquisition included a $13,748,000 net operating loss (NOL) carryforward which was set up as a $4,700,000 deferred tax asset. The NOL carryforward will be deducted from income over the next 18 years in accordance to section 382 of the tax code.
Kentucky Taxation
The Bank. State banks are not subject to the Kentucky corporation income tax.
The Commonwealth of Kentucky imposes both a “Kentucky Bank Franchise Tax” and “Local Deposits Franchise Tax”. The “Kentucky Bank Franchise Tax” is an annual tax equal to 1.1% of net capital after apportionment if applicable. The value of net capital is calculated annually by deducting from total capital an amount equal to the same percentage of the total as the book value of United States obligations bears to the book value of the total assets of the financial institution. The Bank pays a portion of its franchise tax to the state of Ohio based on revenue apportioned to that state. The “Local Deposits Franchise Tax” is an annual tax of up to .025% imposed by each city and county on bank deposits within their jurisdictions.
The Kentucky property tax extends to bank deposits (the”Deposits Tax”). The tax is levied at a rate of 0.0001% of the amount of the deposits. It is the responsibility of the bank, not the depositor, to report and pay the Deposits Tax.
19
State banks are subject to state and local ad valorem taxes on tangible personal property and real property that is not otherwise exempt from taxation. The rates of taxation for tangible personal property vary depending on the character of the property. The state rate of taxation on real property equals $0.315 per $100 of value as of January 1 each year.
The Bank, as a financial institution, is exempt from both the corporate income and license taxes.
BKFC. Kentucky corporations, such as BKFC, are subject to the Kentucky corporation income tax and the Kentucky corporation license (franchise) tax. The income tax is imposed based on the following rates: 4% of the first $50,000 of taxable net income allocated or apportioned to Kentucky; 5% of the next $50,000; 7% of taxable net income over $100,000. All dividend income received by a corporation is excluded for purposes of arriving at taxable net income.
Domestic corporations are subject to state and local ad valorem taxes on tangible personal property and real property that is not otherwise exempt from taxation. The rates of taxation for tangible personal property vary depending on the character of the property. The state rate of taxation on real property equals $0.315 per $100 of value as of January 1 each year. Thus, BKFC is subject to ad valorem taxation on its taxable tangible personal property and real property.
An investment in the common stock of BKFC is subject to certain risks inherent in the business of BKFC and the Bank. The material risks and uncertainties that management believes affect BKFC and the Bank are described below. Before making an investment decision, you should carefully consider the risks and uncertainties described below, together with all of the other information included or incorporated by reference into this Form 10-K. The risks and uncertainties described below are not the only ones facing BKFC or the Bank. Additional risks and uncertainties that management is not aware of or focused on or that management currently deems immaterial may also impair the business operations of BKFC or the Bank. This Form 10-K is qualified in its entirety by these risk factors.
If any of the following risks occur, the financial condition and results of operations of BKFC or the Bank could be materially and adversely affected. If this were to happen, the value of BKFC’s common stock could decline significantly.
References to “we,” “us,” and “our” in this “Risk Factors” section refer to BKFC and its subsidiaries, including the Bank, unless otherwise specified or unless the context otherwise requires.
Our success depends upon the general economic conditions in the area in which we operate.
Our success depends upon the general economic conditions of the specific local markets in which we operate. Our operations are concentrated in the northern Kentucky area. As a result, local economic conditions in this area have a significant impact on the demand for our products and services, as well as the ability of our customers to repay loans, the value of the collateral securing loans and the stability of the Bank’s deposit funding sources. A significant decline in general economic conditions could increase loan delinquencies, increase problem assets and foreclosure, increase claims and lawsuits, decrease the demand for the Bank’s products and services, or decrease the value of collateral for loans, especially real estate, in turn reducing customers’ borrowing power and the value of assets associated with problem loans and collateral coverage, thereby having a material adverse effect on our financial condition and results of operations.
We are subject to intense competition with other financial institutions that could adversely affect our business.
The Bank competes for deposits with other commercial banks, savings associations and credit unions and with the issuers of commercial paper and other securities, such as shares in money market mutual funds. The primary factors in competing for deposits are interest rates and convenience of office locations. In making loans, the Bank competes with other banks, savings associations, consumer finance companies, credit unions, leasing companies and other lenders. The Bank competes for loan originations primarily through the interest rates and loan fees it charges and through the efficiency and quality of services it provides to borrowers. Competition is affected by, among other things, the general availability of lendable funds, general and local economic conditions, current interest rate levels and other factors that are not readily predictable.
20
Due to the Bank’s size relative to the many other financial institutions in its market area, management believes that the Bank does not have a substantial share of the deposit and loan markets. Many of the institutions against whom we compete are significantly larger than us and, therefore, have significantly greater resources. We expect competition to increase in the future as a result of legislative, regulatory and technological changes and the continuing trend of consolidation in the financial services industry. Our profitability depends upon our continued ability to compete successfully in our market area.
Our nonresidential real estate loans expose us to increased lending risks.
At December 31, 2008, $429 million, or 42%, of our loan portfolio consisted of nonresidential real estate loans. Nonresidential real estate loans generally expose a lender to greater risk of non-payment and loss than residential mortgage loans because repayment of the loans often depends on the successful operation of the property and the income stream of the borrowers. Such loans expose us to additional risks because they typically are made on the basis of the borrower’s ability to make repayments from the cash flow of the borrower’s business and are secured by collateral that may depreciate over time. These loans typically involve larger loan balances to single borrowers or groups of related borrowers compared to residential mortgage loans. Because such loans generally entail greater risk than residential mortgage loans, we may need to increase our allowance for loan losses in the future to account for the likely increase in probable incurred credit losses associated with the growth of such loans. Also, many of our nonresidential real estate borrowers have more than one loan outstanding with us. Consequently, an adverse development with respect to one loan or one credit relationship can expose us to a significantly greater risk of loss compared to an adverse development with respect to a residential mortgage loan.
The capital and credit markets have experienced unprecedented levels of volatility.
During 2008, the capital and credit markets experienced extended volatility and disruption. In the third quarter of 2008, the volatility and disruption reached unprecedented levels. In some cases, the markets produced downward pressure on stock prices and credit capacity for certain issuers without regard to those issuers’ underlying financial strength. If these levels of market disruption and volatility continue, worsen or abate and then arise at a later date, BKFC’s ability to access capital could be materially impaired. BKFC’s inability to access the capital markets could constrain our ability to make new loans, to meet our existing lending commitments and, ultimately, jeopardize our overall liquidity and capitalization.
In response to financial conditions affecting the banking system and financial markets and the potential threats to the solvency of investment banks and other financial institutions, the U.S. government has taken unprecedented actions. These actions include the government assisted acquisition of Bear Stearns by JPMorgan Chase, the federal conservatorship of Fannie Mae and Freddie Mac, and the plan of the United States Department of the Treasury (the “Treasury Department”) to inject capital and to purchase mortgage loans and mortgage-backed and other securities from financial institutions for the purpose of stabilizing the financial markets or particular financial institutions. Investors should not assume that these governmental actions will necessarily benefit the financial markets in general, or BKFC in particular. BKFC could also be adversely impacted if one or more of its direct competitors are beneficiaries of selective governmental interventions (such as FDIC-assisted transactions) and BKFC does not receive comparable assistance. Further, investors should not assume that the government will continue to intervene in the financial markets at all. Investors should be aware that governmental intervention (or the lack thereof) could materially and adversely affect BKFC’s business, financial condition and results of operations.
We may require further additions to our allowance for loan losses, which would reduce net income.
If our borrowers do not repay their loans or if the collateral securing their loans is insufficient to provide for the full repayment, we may suffer credit losses. Credit losses are inherent in the lending business and could have a material adverse effect on our operating results. We make various assumptions and judgments about the collectability of our loan portfolio and provide an allowance for loan losses based on a number of factors. If our assumptions and judgments are wrong, our allowance for loan losses may not be sufficient to cover our losses. If we determine that our allowance for loan losses is insufficient, we would be required to take additional provisions for loan losses, which would reduce net income during the period those provisions are taken. In addition, our regulators periodically review our allowance for loan losses and may require us to increase our allowance for loan losses or to charge off particular loans.
21
Any changes in our accounting policies and estimates could adversely affect our business.
Our management makes judgments and assumptions in selecting and adopting various accounting policies and in applying estimates. Actual outcomes may be materially different from amounts previously estimated. Management has identified the accounting policy related to the allowance for loan losses as critical to the understanding of BKFC’s results of operations. See “Item 1 – Allowance for Loan Losses” and “Item 7 – Critical Accounting Policies” for additional discussion regarding these critical accounting policies. Because of the inherent uncertainty of estimates, management cannot provide any assurance that the Bank will not significantly increase its allowance for loan losses if actual losses are more than the amount reserved. Any increase in its allowance for loan losses or loan charge-offs could have a material adverse effect on our financial condition and results of operations.
We are subject to interest rate risk.
The Bank’s financial condition and results of operations are significantly affected by changes in interest rates. The Bank’s earnings depend primarily upon its net interest income, which is the difference between its interest income earned on its interest-earning assets, such as mortgage loans and investment securities, and its interest expense paid on its interest-bearing liabilities, consisting of deposits and borrowings. Management cannot predict or control changes in interest rates, which are highly sensitive to many factors that are beyond our control, including general economic conditions and the policies of various governmental and regulatory agencies and, in particular, the Federal Reserve Board.
Although the Bank has implemented an asset and liability management strategy designed to maintain a reasonable degree of interest rate sensitivity (as more fully described in “Item 1 – Asset/Liability Management”), at any given time the Bank’s assets and liabilities will likely be affected differently by a given change in interest rates, principally because asset and liability re-pricing do not coincide. Changes in interest rates may also affect the level of voluntary prepayments on the Bank’s loans and the level of financing or refinancing by customers. While management and the Board of Directors of the Bank intend to continue to implement our asset and liability management strategy and monitor interest rate risk, there can be no assurance as to whether such measures will be entirely effective in mitigating the Bank’s exposure to interest rate risk.
We are subject to intensive government regulation and supervision.
BKFC and the Bank are subject to extensive state and federal regulation, supervision and legislation that govern almost all aspects of the operations of BKFC and the Bank. See “Item 1 – “Regulation of BKFC” and “Regulation of the Bank” for additional discussion regarding government regulation. Any change in applicable federal or state laws or regulations could have a substantial impact on BKFC and the Bank. While it is not reasonably predictable what effect any presently contemplated or future changes in the laws or regulations or their interpretations would have on BKFC and the Bank, these changes could have a material adverse effect on our financial condition and results of operations, and could also adversely affect the market value of our common stock.
Legislative and regulatory actions taken now or in the future to address the current liquidity and credit crisis in the financial industry may significantly affect BKFC’s financial condition, results of operation, liquidity or stock price.
The Emergency Economic Stabilization Act of 2008 (the “EESA”), which established the Treasury Department’s Troubled Asset Relief Program (“TARP”), was enacted on October 3, 2008. As part of the TARP, the Treasury Department created the Capital Purchase Program (“CPP”), under which the Treasury Department will invest up to $250 billion in senior preferred stock of U.S. banks and savings associations or their holding companies for the purpose of stabilizing and providing liquidity to the U.S. financial markets. On February 17, 2009, the American Recovery and Reinvestment Act of 2009 (the “ARRA”) was enacted as a sweeping economic recovery package intended to stimulate the economy and provide for extensive infrastructure, energy, health, and education needs. There can be no assurance as to the actual impact that the EESA or its programs, including the CPP, and ARRA or its programs, will have on the national economy or financial markets. The failure of these significant legislative measures to help stabilize the financial markets and a continuation or worsening of current financial market conditions could materially and adversely affect BKFC’s financial condition, results of operation, liquidity or stock price.
In addition, there have been numerous actions undertaken in connection with or following the EESA and ARRA by the Federal Reserve Board, Congress, the Treasury Department, the FDIC, the SEC and others in efforts to address the current liquidity and credit crisis in the financial industry that followed the sub-prime mortgage market meltdown which began in late 2007. These measures include homeowner relief that encourages loan restructuring and modification; the establishment of significant liquidity and credit facilities for financial institutions and investment banks; the lowering of the federal funds rate; emergency action against short selling practices; a temporary guaranty program for money market funds; the establishment of a commercial paper funding facility to provide back-stop liquidity to commercial paper issuers; a mandatory “stress test” requirement for banking institutions with assets in excess of $100 billion to analyze capital sufficiency and risk exposure; and coordinated international efforts to address illiquidity and other weaknesses in the banking sector. The purpose of these legislative and regulatory actions is to help stabilize the U.S. banking system. However, the EESA, the ARRA and any current or future legislative or regulatory initiatives may not have their desired effect, or may have an adverse effect when applied to BKFC.
22
We are required to meet various capital adequacy guidelines.
BKFC and the Bank are required to meet certain regulatory capital adequacy guidelines and other regulatory requirements imposed by the FRB, the FDIC and the Department. If BKFC or the Bank fails to meet these minimum capital guidelines and other regulatory requirements, our financial condition and results of operations would be materially and adversely affected and could compromise the status of BKFC as a banking holding company. See “Item 1 – Regulatory Capital Requirements” for detailed capital guidelines for bank holding companies and banks.
BKFC is a bank holding company, and its sources of funds are limited.
BKFC is a bank holding company and its operations are primarily conducted by the Bank, which is subject to significant federal and state regulation. Cash available to pay dividends to stockholders of BKFC is derived primarily, from dividends paid by the Bank. As a result, BKFC’s ability to receive dividends or loans from its subsidiaries is restricted. Under federal law, the payment of dividends by the Bank is subject to capital adequacy requirements. The FRB and/or the FDIC prohibit a dividend payment by BKFC or the Bank that would constitute an unsafe or unsound practice. See “Item 1 – Dividend Restrictions.”
The inability of the Bank to generate profits and pay such dividends to BKFC, or regulator restrictions on the payment of such dividends to BKFC even if earned, would have an adverse effect on the financial condition and results of operations of BKFC and BKFC’s ability to pay dividends to its shareholders.
In addition, since BKFC is a legal entity separate and distinct from the Bank, its right to participate in the distribution of assets of the Bank upon the Bank’s liquidation, reorganization or otherwise will be subject to the prior claims of the Bank’s creditors, which will generally take priority over the Bank’s shareholders.
Our success depends upon attracting and retaining senior management.
BKFC’s success depends to a great extent on its ability to attract and retain members of senior management. The unexpected loss of a member of senior management could have a material adverse impact on BKFC’s business and its operations. In addition, BKFC’s future performance depends on its ability to attract and retain key personnel and skilled employees, particularly at the senior management level. As a result of our participation in the CPP, we are required to meet certain standards for executive compensation as set forth under the EESA, and related interim regulations. The recently enacted ARRA requires the Treasury Department to adopt additional standards with respect to executive compensation and governance that may impact certain of our executive officers and employees. Such restrictions imposed as a result of the Treasury Department’s investment in BKFC, in addition to other competitive pressures, may have an adverse effect on our ability to attract and retain skilled personnel, resulting in BKFC not being able to hire the best people or to retain them
Our stock price can be volatile.
Our stock price can fluctuate widely in response to a variety of factors. Factors include actual or anticipated variations in our quarterly operating results, recommendations by securities analysts, operating and stock price performance of other companies, news reports, results of litigation and other factors, including those described in this “Risk Factors” section. Our common stock also has a low average daily trading volume, which limits a person’s ability to quickly accumulate or quickly divest themselves of large blocks of our stock. In addition, a low average trading volume can lead to significant price swings even when a relatively small number of shares are being traded.
Our acquisition of FNB Bancorporation resulted in goodwill, which if it becomes impaired would be required to be written down, which would negatively impact earnings.
We acquired FNB Bancorporation on May 18, 2007 and we may pursue additional opportunities for acquisitions in the future. The success of the FNB Bancorporation acquisition depends on many factors, including the long-term retention of key personnel and acquired customer relationships. We recorded goodwill and other intangible assets in conjunction with the acquisition, and such assets may be recorded in future acquisitions. If these assets were to become impaired, we would be required to write them down.
23
The Treasury Department’s investment in BKFC imposes restrictions and obligations limiting BKFC’s ability to increase dividends, repurchase common stock or preferred stock and access the equity capital markets.
In February 2009, BKFC issued preferred stock and a warrant to purchase common stock to the Treasury Department under the CPP. Prior to February 13, 2012, unless BKFC has redeemed all of the preferred stock, or the Treasury Department has transferred all of the preferred stock to a third party, the consent of the Treasury Department will be required for BKFC to, among other things, increase common stock dividends or effect repurchases of common stock or other preferred stock (with certain exceptions, including the repurchase of BKFC’s common stock to offset share dilution from equity-based employee compensation awards). BKFC has also granted registration rights to the Treasury Department pursuant to which BKFC has agreed to lock-up periods prior to and following the effective date of an underwritten offering of the preferred stock, the warrant or the underlying common stock held by the Treasury Department, during such time when BKFC would be unable to issue equity securities.
| Item 1B. | Unresolved Staff Comments |
None.
BKFC maintains its principal executive offices at 111 Lookout Farm Drive, Crestview Hills, Kentucky 41017, which is owned by BKFC. Of the 28 branch locations operated by the Bank, 14 are owned and 14 are leased. Certain of these leases are with affiliates and affiliated entities. The Bank also leases space for its cash management operations center.
No one facility is material to BKFC. Management believes that the facilities are generally in good condition and suitable for its banking operations. However, management continually looks for opportunities to upgrade its facilities and locations and may do so in the future.
From time to time, BKFC and the Bank are involved in litigation incidental to the conduct of its business, but neither BKFC nor the Bank is presently involved in any lawsuit or proceeding which, in the opinion of management, is likely to have a material adverse affect on BKFC.
| Item 4. | Submission of Matters to a Vote of Security Holders |
No matters were submitted to a vote of stockholders of BKFC during the fourth quarter of the fiscal year covered by this report.
24
PART II
| Item 5. | Market for Registrant’s Common Equity, Related Stockholder Matters and Issuer Purchases of Equity Securities |
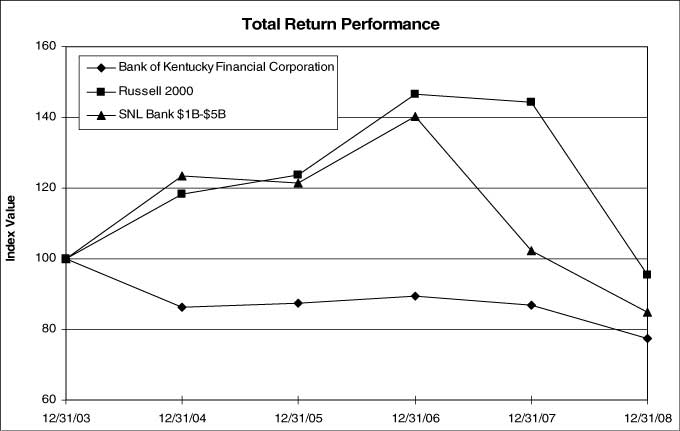
| | | | | | | | | | | | |
| | | Period Ending |
Index | | 12/31/03 | | 12/31/04 | | 12/31/05 | | 12/31/06 | | 12/31/07 | | 12/31/08 |
Bank of Kentucky Financial Corporation | | 100.00 | | 86.37 | | 87.38 | | 89.51 | | 86.77 | | 77.38 |
Russell 2000 | | 100.00 | | 118.33 | | 123.72 | | 146.44 | | 144.15 | | 95.44 |
SNL Bank $1B-$5B Index | | 100.00 | | 123.42 | | 121.31 | | 140.38 | | 102.26 | | 84.81 |
Market Information. BKFC’s common stock is quoted on the OTC Bulletin Board under the symbol “BKYF.” Quarterly high and low prices for the last two fiscal years (which reflect inter-dealer prices, without retail mark-up, mark-down or commission, and may not necessarily represent actual transactions) are shown below.
| | | | | | | | | | | | | | | | |
Fiscal Year 2008 | | High | | Low | | | | Fiscal Year 2007 | | High | | Low |
First Quarter | | $ | 25.75 | | $ | 22.25 | | | | First Quarter | | $ | 27.00 | | $ | 25.90 |
Second Quarter | | | 22.50 | | | 19.00 | | | | Second Quarter | | | 26.25 | | | 25.70 |
Third Quarter | | | 20.50 | | | 17.75 | | | | Third Quarter | | | 26.50 | | | 25.25 |
Fourth Quarter | | | 23.00 | | | 17.55 | | | | Fourth Quarter | | | 25.50 | | | 25.00 |
Holders and Dividends. There were 5,606,607 shares of common stock of BKFC outstanding on December 31, 2008, which were held of record by 914 shareholders. The Board of Directors declared cash dividends of $.22 per share in March 2007, $.24 per share in September 2007, $.26 per share in March 2008, and $.28 per share in September 2008.
25
Equity Compensation Plan Information. The following table reflects BKFC’s equity compensation plan information as of December 31, 2008.
| | | | | | | |
| | | Number of Securities
to be Issued Upon Exercise
of Outstanding Options | | Weighted Average
Exercise Price of
Outstanding Options | | Number of Securities
Remaining Available for
Future Issuance |
Equity Compensation Plans Approved by Security Holders* | | 612,050 | | $ | 25.61 | | 1,049,155 |
Equity Compensation Plans Not Approved by Security Holders | | N/A | | | N/A | | N/A |
Total | | 612,050 | | $ | 25.61 | | 1,049,155 |
| (*) | Consists of The Bank of Kentucky Financial Corporation 1997 Stock Option and Incentive Plan, approved by the stockholders of BKFC in 1997, and The Bank of Kentucky Financial Corporation 2007 Stock Option and Incentive Plan, approved by the stockholders of BKFC |
Issuer Purchases. The following table shows information relating to the repurchase of shares by the Company during the fourth quarter of 2008:
| | | | | | | | |
Period | | Total number
of shares
purchased | | Average price
paid per share | | Total number of
shares purchased as
part of publicly
announced plans or
programs (1) | | Maximum
number of
shares that may
yet be purchased
under the plans
or programs |
October 1-31, 2008 | | — | | — | | 80,300 | | 119,700 |
November 1-30, 2008 | | — | | — | | 80,300 | | 119,700 |
December 1-31, 2008 | | — | | — | | 80,300 | | 119,700 |
| (1) | The Company maintained a share repurchase program that was approved by the Company’s Board of Directors in December of 2007. This repurchase program, which expired on December 31, 2008, authorized the repurchase and retirement of 200,000 common shares of the Company in the over-the-counter market. As of the date of this report, 80,300 of the 200,000 shares authorized for repurchase had been repurchased. The Company did not terminate any plan prior to its expiration date. |
As of January 1, 2009, the Company does not have any repurchase program in place.
26
| Item 6. | Selected Financial Data |
SELECTED FINANCIAL DATA
The following is a summary of selected consolidated financial data for The Bank of Kentucky Financial Corporation for the five years ended December 31, 2008. The summary should be read in conjunction with the Financial Statements and Notes to Consolidated Financial Statements.
| | | | | | | | | | | | | | | | | | | | |
| | | For Year Ended December 31st | |
| | | 2008 | | | 2007 | | | 2006 | | | 2005 | | | 2004 | |
| | | (Dollars In Thousands Except Per Share Amounts) | |
Earnings: | | | | | | | | | | | | | | | | | | | | |
Total Interest Income | | $ | 68,682 | | | $ | 75,713 | | | $ | 63,617 | | | $ | 50,755 | | | $ | 41,591 | |
Total Interest Expense | | | 28,020 | | | | 38,477 | | | | 29,324 | | | | 18,132 | | | | 11,598 | |
| | | | | | | | | | | | | | | | | | | | |
Net Interest Income | | | 40,662 | | | | 37,236 | | | | 34,293 | | | | 32,623 | | | | 29,993 | |
Provision for Loan Losses | | | 4,850 | | | | 1,575 | | | | 1,700 | | | | 1,825 | | | | 1,675 | |
Noninterest Income | | | 14,768 | | | | 14,043 | | | | 11,788 | | | | 9,085 | | | | 8,271 | |
Noninterest Expense | | | 34,223 | | | | 33,719 | | | | 29,142 | | | | 25,161 | | | | 21,602 | |
| | | | | | | | | | | | | | | | | | | | |
Income Before Income Taxes | | | 16,357 | | | | 15,985 | | | | 15,239 | | | | 14,722 | | | | 14,987 | |
Federal Income Taxes | | | 5,016 | | | | 4,854 | | | | 4,787 | | | | 4,595 | | | | 4,929 | |
| | | | | | | | | | | | | | | | | | | | |
Net Income | | $ | 11,341 | | | $ | 11,131 | | | $ | 10,452 | | | $ | 10,127 | | | $ | 10,058 | |
| | | | | | | | | | | | | | | | | | | | |
Per Common Share Data: | | | | | | | | | | | | | | | | | | | | |
Basic Earnings | | $ | 2.02 | | | $ | 1.93 | | | $ | 1.79 | | | $ | 1.71 | | | $ | 1.69 | |
Diluted Earnings | | | 2.02 | | | | 1.93 | | | | 1.78 | | | | 1.70 | | | | 1.68 | |
Dividends Declared and Paid | | | 0.54 | | | | 0.46 | | | | 0.38 | | | | 0.30 | | | | 0.23 | |
Balances at December 31: | | | | | | | | | | | | | | | | | | | | |
Total Investment Securities | | | 119,212 | | | | 168,299 | | | | 118,954 | | | $ | 94,375 | | | $ | 64,266 | |
Gross Loans | | | 1,026,557 | | | | 949,714 | | | | 814,101 | | | | 731,059 | | | | 719,157 | |
Allowance for Loan Losses | | | 9,910 | | | | 8,505 | | | | 6,918 | | | | 7,581 | | | | 7,214 | |
Total Assets | | | 1,255,382 | | | | 1,232,724 | | | | 1,051,563 | | | | 957,338 | | | | 878,129 | |
Noninterest Bearing Deposits | | | 157,082 | | | | 167,578 | | | | 149,519 | | | | 135,620 | | | | 121,454 | |
Interest Bearing Deposits | | | 914,071 | | | | 894,501 | | | | 764,908 | | | | 695,490 | | | | 631,346 | |
Total Deposits | | | 1,071,153 | | | | 1,062,079 | | | | 914,427 | | | | 831,110 | | | | 752,800 | |
Notes Payable | | | 44,798 | | | | 42,340 | | | | 23,907 | | | | 34,291 | | | | 37,573 | |
Total Shareholders’ Equity | | | 101,448 | | | | 93,485 | | | | 86,883 | | | | 80,447 | | | | 73,664 | |
Other Statistical Information: | | | | | | | | | | | | | | | | | | | | |
Return on Average Assets | | | .93 | % | | | .99 | % | | | 1.08 | % | | | 1.14 | % | | | 1.21 | % |
Return on Average Equity | | | 11.80 | % | | | 12.39 | % | | | 12.58 | % | | | 13.11 | % | | | 14.39 | % |
Dividend Payout Ratio | | | 26.79 | % | | | 23.83 | % | | | 21.22 | % | | | 17.54 | % | | | 13.61 | % |
Capital Ratios at December 31: | | | | | | | | | | | | | | | | | | | | |
Total Equity to Total Assets | | | 8.08 | % | | | 7.58 | % | | | 8.26 | % | | | 8.40 | % | | | 8.39 | % |
Average Equity to Average Assets | | | 7.90 | % | | | 8.01 | % | | | 8.55 | % | | | 8.67 | % | | | 8.38 | % |
Tier 1 Leverage Ratio | | | 7.96 | % | | | 7.91 | % | | | 9.13 | % | | | 9.21 | % | | | 9.08 | % |
Tier 1 Capital to Risk-Weighted Assets | | | 8.19 | % | | | 8.34 | % | | | 9.48 | % | | | 9.79 | % | | | 9.50 | % |
Total Risk-Based Capital to Risk-Weighted Assets | | | 10.73 | % | | | 10.12 | % | | | 10.20 | % | | | 10.66 | % | | | 10.38 | % |
Loan Quality Ratios: | | | | | | | | | | | | | | | | | | | | |
Allowance for Loan Losses | | | | | | | | | | | | | | | | | | | | |
To Total Loans at year-end | | | .97 | % | | | .90 | % | | | .85 | % | | | 1.04 | % | | | 1.00 | % |
Allowance for Loan Losses | | | | | | | | | | | | | | | | | | | | |
To Nonperforming Loans at year end | | | 97.77 | % | | | 97.33 | % | | | 139.11 | % | | | 83.81 | % | | | 140.21 | % |
Net Charge-Offs to Average Net Loans | | | 0.35 | % | | | 0.11 | % | | | 0.30 | % | | | 0.20 | % | | | 0.19 | % |
27
| Item 7. | Management’s Discussion and Analysis of Financial Condition and Results of Operation |
Management’s Discussion and Analysis of Financial Condition
And the Results of Operations
December 31, 2008
The objective of this section is to help shareholders and potential investors understand our views on our results of operations and financial condition. You should read this discussion in conjunction with the consolidated financial statements and notes to the consolidated financial statements that appear elsewhere in this report.
FORWARD LOOKING STATEMENTS
This report includes forward-looking statements by The Bank of Kentucky Financial Corporation (“BKFC” or the “Corporation”) relating to such matters as anticipated operating results, credit quality expectations, prospects for new lines of business, technological developments, economic trends (including interest rates) and similar matters. Such statements are based upon the current beliefs and expectations of the Corporation’s management and are subject to risks and uncertainties. While the Corporation believes that the assumptions underlying the forward-looking statements contained herein are reasonable, any of the assumptions could prove to be inaccurate, and accordingly, actual results and experience could differ materially from the anticipated results or other expectations expressed by the Corporation in its forward-looking statements. Factors that could cause actual results or experience to differ from results discussed in the forward-looking statements include, but are not limited to: economic conditions; volatility and direction of market interest rates; governmental legislation and regulation, including changes in accounting regulations or standards; material unforeseen changes in the financial condition or results of operations of the Corporation’s customers; and other risks identified from time-to-time in the Corporation’s other public documents on file with the Securities and Exchange Commission, including those described in Item 1A of the Corporation’s Annual Report on Form 10-K. The Private Securities Litigation Reform Act of 1995 provides a safe harbor for forward-looking statements, and the purpose of this paragraph is to secure the use of the safe harbor provisions.
MANAGEMENT OVERVIEW
The business of the Corporation consists of holding and administering its interest in The Bank of Kentucky, Inc. (the “Bank”). The Bank conducts basic banking operations from locations in Boone, Kenton, Campbell, and Grant Counties in Northern Kentucky and also in Greater Cincinnati, Ohio. The majority of the Corporation’s revenue is derived from the Bank’s loan portfolio. The loan portfolio is diversified and the ability of borrowers to repay their loans is not dependent upon any single industry. Commercial or residential real estate or other business and consumer assets secure the majority of the Bank’s loans.
The 2008 operating results reflect the very difficult and challenging economic environment in which we find ourselves. This economic environment produced two offsetting factors in 2008 that competed with each other and combined to produce the Corporation’s record annual earnings of $11,341,000, which was an increase of $210,000, or 2%, over 2007. The primary positive factor affecting the 2008 results was loan growth, as the current economic challenges presented
28
the Corporation with opportunities to talk to businesses in our market that had been with competitors in the past. These same challenges resulted in the primary negative factor, which was higher credit cost reflected in the two fold increase in the provision for loan losses.
Total loans in 2008 increased $75,438,000, or 8% from 2007, and drove the $3,426,000, or 9%, increase in net interest income. The loan growth included strong growth in the nonresidential real estate and residential real estate portfolios. Offsetting the increase in revenue was the provision for loan losses which increased $3,275,000, or 208% from 2007. Contributing to the increased in the provisions were higher levels of charge-offs in 2008 as compared to 2007, and management’s concerns over the declining housing market and overall deteriorating economic conditions. The Corporation recorded $3,445,000 (.35% of average loans) in net charge-offs in 2008 as compared to $998,000 (.11% of average loans) in 2007. The Corporation does not originate or purchase sub-prime loans for its portfolio. Management will continue to monitor and evaluate the effects of the slumping housing market conditions and the signs of deteriorating credit quality on the Bank’s loan portfolio.
The largest increase in non-interest income was service charges on deposit account which increased $675,000 or 8%. The largest increases in non-interest expense were FDIC insurance, $611,000 or 399% and state bank taxes, $318,000 or 25%, which were offset with lower expenses associated with other real estate owned properties, down $677,000 or 78%.
The following sections provide more detail on subjects presented in the overview.
CRITICAL ACCOUNTING POLICIES
BKFC has prepared all of the consolidated financial information in this report in accordance with accounting principles generally accepted in the United States of America (“U.S. GAAP”). In preparing the consolidated financial statements in accordance with U.S. GAAP, BKFC makes estimates and assumptions that affect the reported amount of assets and liabilities, disclosure of contingent assets and liabilities at the date of the financial statements, and the reported amounts of revenue and expenses during the reporting period. There can be no assurances that actual results will not differ from those estimates.
We have identified the accounting policy related to the allowance for loan losses as critical to the understanding of BKFC’s results of operations, since the application of this policy requires significant management assumptions and estimates that could result in reporting materially different amounts if conditions or underlying circumstances were to change.
The Bank maintains an allowance to absorb probable, incurred loan losses inherent in the loan portfolio. The allowance for loan losses is maintained at a level the Bank considers to be adequate and is based on ongoing quarterly assessments and evaluations of the collectibility and historical loss experience of loans. Loan losses are charged and recoveries are credited to the allowance for loan losses. Provisions for loan losses are based on the Bank’s review of its historical loan loss experience and such factors that, in management’s judgment, deserve consideration under existing economic conditions in estimating probable loan losses. The Bank’s strategy for credit risk management includes a combination of conservative underwriting, documentation and collections standards, and quarterly management reviews of large loan exposures and loans experiencing deterioration of loan quality.
29
Larger commercial loans that exhibit probable or observed loan weaknesses are subject to individual review. Where appropriate, specific portions of the allowance are allocated to individual loans based on management’s estimate of the borrower’s ability to repay the loan given the availability of collateral, other sources of cash flow and legal options available to the Bank. The review of individual loans includes those loans that are impaired as provided in Statement of Financial Accounting Standard No. 114, Accounting by Creditors for Impairment of a Loan. Impaired loans are those for which management has determined that it is probable that the customer will be unable to comply with the contractual terms of the loan. Loans so identified are reduced to the present value of expected future cash flows, or to the fair value of the collateral securing the loan, by the allocation of a portion of the allowance for loan losses to the loan. In addition, the Bank evaluates the collectibility of both principal and interest when assessing the need for loans being placed on non-accrual status. Non-accrual status denotes loans in which, in the opinion of management, the collection of additional interest is unlikely. Historical loss rates are applied to other commercial loans not subject to specific reserve allocations. The loss rates applied to commercial loans are derived from analyzing a range of the loss experience sustained on loans according to their internal risk grade. These loss rates may be adjusted to account for environmental factors if warranted.
Homogeneous loans, such as consumer installment, residential mortgage and home equity loans are not individually risk graded. Rather, a range of historic loss experience of the portfolio is used to determine the appropriate allowance for the portfolios. Allocations for the allowance are established for each pool of loans based on the expected net charge-offs for one year.
A high and low range of reserve percentages is calculated to recognize the imprecision in estimating and measuring loss when evaluating reserves for individual loans or pools of loans. The position of the allowance for loan losses within the computed range may be adjusted for significant factors that, in management’s judgment, reflect the impact of any current conditions of credit quality. Factors that management considers in the analysis include the effects of the local economy, trends in the nature and volume of loans (delinquencies, charge-offs and nonaccrual loans), changes in mix of loans, asset quality trends, risk management and loan administration, changes in the internal lending policies and credit standards, and examination results from bank regulatory agencies and internal review by the credit department.
Reserves on individual loans and historical loss rates are reviewed quarterly and adjusted as necessary based on changing borrower and/or collateral conditions and actual collection and charge-off experience.
FINANCIAL CONDITION
Our total assets at December 31, 2008 were $1,255,382,000 as compared to $1,232,724,000 at December 31, 2007, an increase of $22,658,000 (2%). In 2008, the growth in loans, which increased $75,438,000 or 8%, was offset by a reduction in available-for-sale securities, which decreased $66,582,000 or 44%. The growth in loans was distributed between commercial real
30
estate, residential real estate and construction in 2008, with increases of $41,625,000 (11%), $23,814,000 (11%), and $15,947,000 (12%), respectively. Contributing to the reduction in available-for-sale securities was the maturity of a $40,000,000 US treasury security that matured in early January of 2008 and other short-term discount notes, which the Bank invested in as an alternative to federal funds. These securities were allowed to run-off in 2008 as loan demand exceeded deposit growth. While the majority of the Bank’s loan growth was funded by decreases in AFS securities, deposits growth also contributed to the loan funding. Total deposits increased $9,074,000 (1%) to $1,071,153,000 at December 31, 2008, compared to $1,062,079,000 at December 31, 2007. The largest increase in deposits came from NOW (negotiable orders of withdrawal) accounts, which increased $21,100,000, or 9%, from 2007. The Bank’s NOW accounts include public fund accounts which increased $18,790,000 or 11% from 2007. Public funds are deposits of local municipalities, schools and other public entities. These public fund balances are collateralized with the Corporation’s security portfolio and letter of credit guarantees from the Federal Home Loan Bank.
Other changes on the asset side of the balance sheet at December 31, 2008 relative to December 31, 2007, included a $4,188,000 (22%) reduction in other assets, which was driven by a $3,405,000 (83%) decrease in other real estate owned. Other real estate owned includes properties the bank acquires through foreclosure. Other changes to liabilities included growth of $5,364,000 (24%) in short-term borrowings and an increase in notes payable of $2,458,000 (6%). The increase in notes payable resulted from issuing $20,000,000 in subordinated debentures, the proceeds of which were used to payoff $17,000,000 in trust preferred securities. This refinancing resulted in a 170 basis point reduction borrowing cost. The subordinated debenture has an interest rate of LIBOR (London interbank offered rate) plus 175 basis points, while the trust preferred securities that were paid off had an interest rate of LIBOR plus 345 basis points. Total shareholders’ equity increased $7,963,000 (9%) to $101,448,000 at December 31, 2008, compared to $93,485,000 at December 31, 2007.
The following table illustrates the change in the mix of average assets during 2008 as compared to 2007 and 2006.
Table 1—Average Assets 2008, 2007 and 2006
(Dollars in Thousands)
| | | | | | | | | | | | | | | | | | |
Average Assets: | | 2008 | | As a % of
total assets | | | 2007 | | As a % of
total assets | | | 2006 | | As a % of
total assets | |
Cash and due from banks | | $ | 30,256 | | 2.5 | % | | $ | 29,157 | | 2.6 | % | | $ | 28,716 | | 3.0 | % |
Short term investments | | | 22,740 | | 1.9 | % | | | 39,922 | | 3.6 | % | | | 13,464 | | 1.4 | % |
Other interest-earning assets | | | 4,963 | | .4 | % | | | 4,772 | | .4 | % | | | 4,477 | | .4 | % |
Securities | | | 110,017 | | 9.0 | % | | | 99,544 | | 8.9 | % | | | 89,191 | | 9.2 | % |
Loans (net of allowance for loan losses) | | | 971,289 | | 79.9 | % | | | 875,853 | | 78.1 | % | | | 772,188 | | 79.5 | % |
Premises and equipment | | | 18,042 | | 1.5 | % | | | 17,240 | | 1.5 | % | | | 17,492 | | 1.8 | % |
Goodwill and acquisition intangibles | | | 18,366 | | 1.5 | % | | | 15,403 | | 1.4 | % | | | 12,474 | | 1.3 | % |
Cash surrender value of life insurance | | | 20,926 | | 1.7 | % | | | 20,153 | | 1.8 | % | | | 19,407 | | 2.0 | % |
Other assets | | | 19,402 | | 1.6 | % | | | 19,339 | | 1.7 | % | | | 13,905 | | 1.4 | % |
| | | | | | | | | | | | | | | | | | |
Total average assets | | $ | 1,216,001 | | 100.0 | % | | $ | 1,121,383 | | 100.0 | % | | $ | 971,314 | | 100.0 | % |
| | | | | | | | | | | | | | | | | | |
31
RESULTS OF OPERATIONS
SUMMARY
2008 vs. 2007. Our net income was $11,341,000 for the year ended December 31, 2008, compared to $11,131,000 for the year ended December 31, 2007, an increase of $210,000 (2%). Net income for the year ended December 31, 2007 increased $679,000 (7%) from the $10,452,000 for the year ended December 31, 2006. The growth in earnings from 2007 to 2008 was driven by increases in net interest income of $3,426,000 (9%) and non-interest income of $725,000 (5%), and was offset a higher provision for loan losses of $3,275,000 (208%) and by an increase in non-interest expense of $504,000 (1%). The growth in the net interest income was driven by the strong loan growth and was complemented with a small increase in the net interest margin which increased from 3.66% in 2007 to 3.68% in 2008. Contributing to the increase in the provision for loan losses were higher levels of charge-offs in 2008 as compared to 2007, and management’s concerns over the declining housing market and overall deteriorating economic conditions. The Corporation recorded $3,445,000 (.35% of average loans) in net charge-offs in 2008 as compared to $998,000 (.11% of average loans) in 2007.
2007 vs. 2006. The growth in earnings from 2006 to 2007 was driven by increases in non-interest income of $2,255,000 (19%) and net interest income of $2,943,000 (9%), and was offset by an increase in non-interest expense of $4,577,000 (16%). Increases in overdraft charges contributed to the growth in non-interest income. The growth in the net interest income was driven by the strong balance sheet growth and was offset by the negative impact of a volatile interest rate environment. The increase in non-interest expense was due to salaries and benefits, which increased $1,452,000 (10%) in 2007 compared to 2006, an increase of $596,000 in expenses associated with other real estate owned properties and an increase of $445,000 in amortization of intangible assets for 2007 as the result of the BKFC’s acquisition of FNB Bancorporation, Inc. and its subsidiary, First Bank of Northern Kentucky, Inc. (the “First Bank Acquisition”).
NET INTEREST INCOME
2008 vs. 2007. Net interest income grew to $40,662,000 in 2008, an increase of $3,426,000 (9%) over the $37,236,000 earned in 2007. The increase was driven by the growth in earning assets. As illustrated in Table 3, net interest income was positively impacted by the volume additions to the balance sheet by $3,582,000 and to a much smaller extent by the rate variance, which had a $54,000 decrease impact on net interest income. Driving the balance sheet growth was loans which accounted for 107% of the growth in average earning assets in 2008. In 2008, total average earning assets increased $91,633,000 or 9%, while average loans increased
32
$98,151,000 or 11%. Accounting for the difference between growth in earning assets and the growth in loans was a decrease in lower yielding short-term investments, particularly federal funds sold which were down on average $17,182,000 or 43% from 2007. As seen in table 3, this favorable mix of earning asset growth contributed to the 16 basis point increase in the net interest spread, from 3.12 in 2007, to 3.28 in 2008. Despite an extremely volatile interest rate environment, the Corporations net interest income increased from 3.66% in 2007 to 3.68% in 2008. The effects of this rate environment are demonstrated in Table 2, where the yields on interest earning assets decreased by 121 basis points from 7.40% in 2007 to 6.19% in 2008, while the cost of interest bearing liabilities decreased 137 basis points from 4.28% in 2007 to 2.91% in 2008. While the Corporation benefited from falling rates in 2008, if rates continue to fall in 2009 the effects on the Bank will be negative, as shown and explained in the interest rate section of this analysis.
2007 vs. 2006. Net interest income grew to $37,236,000 in 2007, an increase of $2,943,000 (9%) over the $34,293,000 earned in 2006. The increase was driven by the growth in the balance sheet. As illustrated in Table 3, net interest income was positively impacted by the volume additions to the balance sheet by $4,186,000, which was partially offset by the rate variance, which had a $1,197,000 negative impact on net interest income. The volatile interest rate environment contributed to the unfavorable rate variance. The effects of this rate environment are demonstrated in Table 2, where the yield on interest earning assets increased by 19 basis points from 7.21% in 2006 to 7.40% in 2007, while the cost of interest bearing liabilities increased 41 basis points from 3.87% to 4.28%. The result of the rate variance was a decrease in the net interest margin from 3.90% in 2006 to 3.66% in 2007.
Average Yield. The below table illustrates the Bank’s average balance sheet information and reflects the average yield on interest-earning assets, on a tax equivalent basis, and the average cost of interest-bearing liabilities for the periods indicated. Such yields and costs are derived by dividing income or expense by the average monthly balance of interest-earning assets or interest-bearing liabilities, respectively, for the years presented. Average balances are daily averages for the Bank and include nonaccruing loans in the loan portfolio, net of the allowance for loan losses.
33
Table 2—Average Balance Sheet Rates 2008, 2007 and 2006 (presented on a tax equivalent basis in thousands)
| | | | | | | | | | | | | | | | | | | | | | | | | | | | | | |
| | | Year ended December 31, | |
| | | 2008 | | | 2007 | | | 2006 | |
| | | Average
outstanding
balance | | | Interest
earned/
paid | | Yield/
rate | | | Average
outstanding
balance | | | Interest
earned/
paid | | Yield/
rate | | | Average
outstanding
balance | | | Interest
earned/
paid | | Yield/rate | |
| | | (Dollars in thousands) | |
Interest-earning assets: | | | | | | | | | | | | | | | | | | | | | | | | | | | | | | |
Loans receivable (1)(2) | | $ | 982,044 | | | $ | 63,559 | | 6.47 | % | | $ | 883,893 | | | $ | 68,949 | | 7.80 | % | | $ | 779,568 | | | $ | 59,256 | | 7.60 | % |
Securities (2) | | | 110,017 | | | | 4,881 | | 4.44 | | | | 99,544 | | | | 4,737 | | 4.76 | | | | 89,191 | | | | 3,760 | | 4.22 | |
Other interest-earning assets | | | 27,703 | | | | 820 | | 2.96 | | | | 44,694 | | | | 2,395 | | 5.36 | | | | 17,941 | | | | 923 | | 5.14 | |
| | | | | | | | | | | | | | | | | | | | | | | | | | | | | | |
Total interest-earning assets | | | 1,119,764 | | | | 69,260 | | 6.19 | | | | 1,028,131 | | | | 76,081 | | 7.40 | | | | 886,700 | | | | 63,939 | | 7.21 | |
| | | | | | | | | | | | | | | | | | | | | | | | | | | | | | |
Non-interest-earning assets | | | 96,237 | | | | | | | | | | 93,252 | | | | | | | | | | 84,614 | | | | | | | |
| | | | | | | | | | | | | | | | | | | | | | | | | | | | | | |
Total assets | | $ | 1,216,001 | | | | | | | | | $ | 1,121,383 | | | | | | | | | $ | 971,314 | | | | | | | |
| | | | | | | | | | | | | | | | | | | | | | | | | | | | | | |
Interest-bearing liabilities: | | | | | | | | | | | | | | | | | | | | | | | | | | | | | | |
Transaction accounts | | | 517,302 | | | | 9,244 | | 1.79 | | | | 474,367 | | | | 17,555 | | 3.70 | | | | 397,819 | | | | 13,092 | | 3.29 | |
Time deposits | | | 370,017 | | | | 15,778 | | 4.26 | | | | 356,702 | | | | 17,752 | | 4.76 | | | | 315,071 | | | | 13,623 | | 4.32 | |
Borrowings | | | 76,803 | | | | 2,998 | | 3.90 | | | | 51,950 | | | | 3,170 | | 6.10 | | | | 44,450 | | | | 2,609 | | 5.87 | |
| | | | | | | | | | | | | | | | | | | | | | | | | | | | | | |
Total interest-bearing liabilities | | | 964,122 | | | | 28,020 | | 2.91 | | | | 883,019 | | | | 38,477 | | 4.28 | | | | 757,340 | | | | 29,324 | | 3.87 | |
| | | | | | | | | | | | | | | | | | | | | | | | | | | | | | |
Non-interest-bearing liabilities | | | 155,805 | | | | | | | | | | 148,530 | | | | | | | | | | 130,921 | | | | | | | |
| | | | | | | | | | | | | | | | | | | | | | | | | | | | | | |
Total liabilities | | | 1,119,927 | | | | | | | | | | 1,031,549 | | | | | | | | | | 888,261 | | | | | | | |
Shareholders’ equity | | | 96,074 | | | | | | | | | | 89,834 | | | | | | | | | | 83,053 | | | | | | | |
| | | | | | | | | | | | | | | | | | | | | | | | | | | | | | |
Total liabilities and shareholders’ equity | | $ | 1,216,001 | | | | | | | | | $ | 1,121,383 | | | | | | | | | $ | 971,314 | | | | | | | |
| | | | | | | | | | | | | | | | | | | | | | | | | | | | | | |
Net interest income | | | | | | $ | 41,240 | | | | | | | | | $ | 37,604 | | | | | | | | | $ | 34,615 | | | |
| | | | | | | | | | | | | | | | | | | | | | | | | | | | | | |
Interest rate spread | | | | | | | | | 3.28 | % | | | | | | | | | 3.12 | % | | | | | | | | | 3.34 | % |
| | | | | | | | | | | | | | | | | | | | | | | | | | | | | | |
Net interest margin (net interest income as a percent of average interest-earning assets) | | | | | | | | | 3.68 | % | | | | | | | | | 3.66 | % | | | | | | | | | 3.90 | % |
| | | | | | | | | | | | | | | | | | | | | | | | | | | | | | |
Effect of Net Free Funds (the difference between the net interest margin and the interest rate spread) | | | | | | | | | .40 | % | | | | | | | | | .54 | % | | | | | | | | | .56 | % |
| | | | | | | | | | | | | | | | | | | | | | | | | | | | | | |
Average interest-earning assets to interest-bearing liabilities | | | 116.14 | % | | | | | | | | | 116.43 | % | | | | | | | | | 117.08 | % | | | | | | |
| | | | | | | | | | | | | | | | | | | | | | | | | | | | | | |
| (1) | Includes non-accrual loans. |
| (2) | Income presented on a tax equivalent basis using a 34.40% tax rate in 2008 and 34.25% in 2007 and 2006. The tax equivalent adjustment was $578,000, $368, 000, and $322,000, in 2008, 2007, and 2006, respectively. |
34
Volume/Rate Analysis. The below table illustrates the extent to which changes in interest rates and changes in volume of interest-earning assets and interest-bearing liabilities have affected the Bank’s interest income and expense during the periods indicated. For each category of interest-earning assets and interest-bearing liabilities, information is provided on changes attributable to (i) changes in volume (change in volume multiplied by prior year rate), (ii) changes in rate (change in rate multiplied by prior year volume) and (iii) total changes in rate and volume. The combined effects of changes in both volume and rate, which cannot be separately identified, have been allocated proportionately to the change due to volume and the change due to rate.
Table 3—Volume/Rate Analysis (in thousands)
| | | | | | | | | | | | | | | | | | | | | | |
| | | Year ended December 31, |
| | | 2008 vs. 2007 | | | 2007 vs. 2006 |
| | | Increase (Decrease)
Due to | | | Increase (Decrease)
Due to |
| | | Volume | | | Rate | | | Total | | | Volume | | Rate | | | Total |
| | | (Dollars in thousands) |
Interest income attributable to: | | | | | | | | | | | | | | | | | | | | | | |
Loans receivable | | $ | 7,142 | | | $ | (12,531 | ) | | $ | (5,389 | ) | | $ | 8,104 | | $ | 1,589 | | | $ | 9,693 |
Securities | | | 478 | | | | (334 | ) | | | 144 | | | | 463 | | | 514 | | | | 977 |
Other interest-earning assets(1) | | | (723 | ) | | | (853 | ) | | | (1,576 | ) | | | 1,432 | | | 40 | | | | 1,472 |
| | | | | | | | | | | | | | | | | | | | | | |
Total interest-earning assets | | | 6,897 | | | | (13,718 | ) | | | (6,821 | ) | | | 9,999 | | | 2,145 | | | | 12,142 |
| | | | | | | | | | | | | | | | | | | | | | |
Interest expense attributable to: | | | | | | | | | | | | | | | | | | | | | | |
Transaction accounts | | | 1,467 | | | | (9,778 | ) | | | (8,311 | ) | | | 2,710 | | | 1,753 | | | | 4,463 |
Time deposits | | | 643 | | | | (2,617 | ) | | | (1,974 | ) | | | 2,649 | | | 1,480 | | | | 4,129 |
Borrowings | | | 1,205 | | | | (1,377 | ) | | | (172 | ) | | | 454 | | | 107 | | | | 561 |
| | | | | | | | | | | | | | | | | | | | | | |
Total interest-bearing liabilities | | | 3,315 | | | | (13,772 | ) | | | (10,457 | ) | | | 5,813 | | | 3,340 | | | | 9,153 |
| | | | | | | | | | | | | | | | | | | | | | |
Increase (decrease) in net interest income | | $ | 3,582 | | | $ | 54 | | | $ | 3,636 | | | $ | 4,186 | | $ | (1,197 | ) | | $ | 2,989 |
| | | | | | | | | | | | | | | | | | | | | | |
| (1) | Includes short-term investments and interest-bearing deposits in other financial institutions. |
PROVISION FOR LOAN LOSSES
2008 vs. 2007. The provision for loan losses was $4,850,000 for the year ended December 31, 2008, compared to $1,575,000 for 2007. The increase of $3,275,000 (208%) reflected an increase in loans charged–off in 2008, and management’s continuing concerns over the deteriorating economic conditions. For the year ended December 31, 2008, net charge-offs were $3,445,000 or .35% of average loan balances compared to 2007 figures of $998,000 or .11% of average loan balances. Total non-accrual loans, loans past due 90 days or more and restructured loans were $10,136,000 (.99% of loans outstanding) at December 31, 2008, compared to $9,047,000 (.95% of loans outstanding) at December 31, 2007. Management’s evaluation of the inherent risk in the loan portfolio considers both historic losses and information regarding specific borrowers. The increase in the loan loss allowance to total loans ratio, from .90% at December 31, 2007 to .97% at December 31, 2008, was due to increasing historical loss ratios and current economic conditions. Management continues to monitor the non-performing relationships and has established appropriate reserves.
35
Non-performing assets, which include non-performing loans, other real estate owned and repossessed assets, totaled $10,848,000 at December 31, 2008 and $13,164,000 at December 31, 2007. This represents .86% of total assets at December 31, 2008 compared to 1.07% at December 31, 2007. Contributing to the decrease was the sale in December of 2008 of the largest property included in the other real estate owned at December 31, 2007, which was a repossessed commercial office building that was sold for $2,617,000.
2007 vs. 2006. The provision for loan losses was $1,575,000 for the year ended December 31, 2007, compared to $1,700,000 for 2006. The decrease of $125,000 (7%) reflected a decrease in loans charged–off in 2007, which was offset by a higher level of non-performing loans. For the year ended December 31, 2007, net charge-offs were $998,000 or .11% of average loan balances compared to 2006 figures of $2,363,000 or .30% of average loan balances. The majority of the loans charged-off in 2007 had been reserved for in previous periods. Total non-accrual loans and loans past due 90 days or more were $9,047,000 (.95% of loans outstanding) at December 31, 2007, compared to $4,973,000 (.61% of loans outstanding) at December 31, 2006. The largest increase in non-performing loans since December 31, 2006 was a $1,700,000 residential development loan which resulted in the specific impairment reserve in the first quarter of 2007 and $350,000 of this relationship was charged-off in the fourth quarter of 2007. As the non-performing loan balances increased, the ratio of the allowance to nonperforming loans (coverage ratio) decreased from 139% at the end of 2006 to 94% at the end of 2007. Management’s evaluation of the inherent risk in the loan portfolio considers both historic losses and information regarding specific borrowers. The increase in the loan loss allowance to total loans ratio, from .85% at December 31, 2006 to .90% at December 31, 2007, was in part due to the allowance brought over in the First Bank acquisition, which had relatively higher historical losses associated with its loan portfolio. Management continues to monitor the nonperforming relationships and has established appropriate reserves.
Non-performing assets, which include non-performing loans, other real estate owned and repossessed assets, totaled $13,164,000 at December 31, 2007 and $7,954,000 at December 31, 2006. This represents 1.07% of total assets at December 31, 2007 compared to .76% at December 31, 2006. The largest property included in the other real estate owned at December 31, 2007 was a repossessed commercial office building valued at $2,700,000 that was acquired in 2006.
Allowance for Loan Losses. The allowance for loan losses as a percentage of total loans was .97% at December 31, 2008, which was an increase from .90% at December 31, 2007. This percentage increase represented an increase of $1,405,000, or 17%, in the allowance for loan losses from the end of 2007 to the end of 2008. The amount of the allowance allocated to impaired loans at year end 2008 was $3,432,000, which was up 21% from the $2,833,000 at year end 2007. Management believes the current level of the allowance for loan losses is sufficient to absorb probable incurred losses in the loan portfolio. Management continues to monitor the loan portfolio closely and believes the provision for loan losses is directionally consistent with the changes in the probable losses inherent in the loan portfolio from 2007 to 2008. The Bank does not originate or purchase sub-prime loans for its portfolio. Management will continue to monitor and evaluate the effects of the slumping housing market conditions and any signs of deteriorating credit quality on the Bank’s loan portfolio.
36
Monitoring loan quality and maintaining an adequate allowance is an ongoing process overseen by senior management and the loan review function. On at least a quarterly basis, a formal analysis of the adequacy of the allowance is prepared and reviewed by management and the Board of Directors. This analysis serves as a point in time assessment of the level of the allowance and serves as a basis for provisions for loan losses. The loan quality monitoring process includes assigning loan grades and the use of a watch list to identify loans of concern.
For additional information on the allowance for loan losses, see the critical accounting policies section of this discussion.
Table 4—Analysis of the allowance for losses for the periods indicated:
| | | | | | | | | | | | | | | | | | | | |
| | | Year ended at December 31, | |
| | | 2008 | | | 2007 | | | 2006 | | | 2005 | | | 2004 | |
| | | (Dollars in thousands) | |
Balance of allowance at beginning of period | | $ | 8,505 | | | $ | 6,918 | | | $ | 7,581 | | | $ | 7,214 | | | $ | 6,855 | |
Recoveries of loans previously charged off: | | | | | | | | | | | | | | | | | | | | |
Commercial loans | | | 212 | | | | 369 | | | | 41 | | | | 67 | | | | 8 | |
Consumer loans | | | 249 | | | | 106 | | | | 40 | | | | 11 | | | | 2 | |
Mortgage loans | | | 2 | | | | 23 | | | | 0 | | | | 0 | | | | 0 | |
| | | | | | | | | | | | | | | | | | | | |
Total recoveries | | | 463 | | | | 498 | | | | 81 | | | | 78 | | | | 10 | |
| | | | | | | | | | | | | | | | | | | | |
Loans charged off: | | | | | | | | | | | | | | | | | | | | |
Commercial loans | | | 2,675 | | | | 1,097 | | | | 2,208 | | | | 1,127 | | | | 936 | |
Consumer loans | | | 1,065 | | | | 368 | | | | 185 | | | | 277 | | | | 360 | |
Mortgage loans | | | 168 | | | | 31 | | | | 51 | | | | 132 | | | | 30 | |
| | | | | | | | | | | | | | | | | | | | |
Total charge-offs | | | 3,908 | | | | 1,496 | | | | 2,444 | | | | 1,536 | | | | 1,326 | |
| | | | | | | | | | | | | | | | | | | | |
Net charge-offs | | | (3,445 | ) | | | (998 | ) | | | (2,363 | ) | | | (1,458 | ) | | | (1,316 | ) |
Provision for loan losses | | | 4,850 | | | | 1,575 | | | | 1,700 | | | | 1,825 | | | | 1,675 | |
Merger adjustment | | | 0 | | | | 1,010 | | | | 0 | | | | 0 | | | | 0 | |
| | | | | | | | | | | | | | | | | | | | |
Balance of allowance at end of period | | $ | 9,910 | | | $ | 8,505 | | | $ | 6,918 | | | $ | 7,581 | | | $ | 7,214 | |
| | | | | | | | | | | | | | | | | | | | |
Net charge-offs to average loans outstanding for period | | | .35 | % | | | .11 | % | | | .30 | % | | | .20 | % | | | .19 | % |
| | | | | | | | | | | | | | | | | | | | |
Allowance at end of period to loans at end of period | | | .97 | % | | | .90 | % | | | .85 | % | | | 1.04 | % | | | 1.00 | % |
| | | | | | | | | | | | | | | | | | | | |
Allowance to nonperforming loans at end of period | | | 97.77 | % | | | 97.33 | % | | | 139.11 | % | | | 83.81 | % | | | 140.21 | % |
| | | | | | | | | | | | | | | | | | | | |
37
NON-INTEREST INCOME
The following table shows the components of non-interest income and the percentage changes from 2008 to 2007 and from 2007 to 2006.
Table 5—Major Components of non-interest income (dollars in thousands)
| | | | | | | | | | | | | | | |
| | | Year ended December 31, | | Percentage Increase/(Decrease) | |
Non-interest income: | | 2008 | | 2007 | | 2006 | | 2008/2007 | | | 2007/2006 | |
Service charges and fees | | $ | 8,918 | | $ | 8,243 | | $ | 5,976 | | 8 | % | | 38 | % |
Mortgage banking income | | | 937 | | | 919 | | | 1,056 | | 2 | | | (13 | ) |
Trust fee income | | | 1,111 | | | 1,089 | | | 1,088 | | 2 | | | 0 | |
Bankcard transaction revenue | | | 1,924 | | | 1,626 | | | 1,298 | | 18 | | | 25 | |
Company owned life insurance earnings | | | 794 | | | 749 | | | 700 | | 6 | | | 7 | |
Other | | | 1,084 | | | 1,417 | | | 1,670 | | (24 | ) | | 15 | |
| | | | | | | | | | | | | | | |
Total non-interest income | | $ | 14,768 | | $ | 14,043 | | $ | 11,788 | | 5 | % | | 19 | % |
| | | | | | | | | | | | | | | |
2008 vs. 2007. Total non-interest income increased $725,000 (5%) in 2008 from $14,043,000 in 2007 to $14,768,000 in 2008. Increases for 2008 included service charges and fees (up $675,000, or 8%), and bankcard transaction revenue (up $298,000, or 18%), which was partially offset by a decrease in other non-interest income (down $333,000, or 24%). Contributing to the decrease in other non-interest income was a $276,000 decrease in loan servicing revenue. This servicing revenue relates to the small business association loans, the balances of which dropped significantly from 2007. Contributing to the increase in service charges and fees were the continued growth in cash management products.
The increase in bankcard transaction revenue reflects consumers continued acceptance of electronic forms of payment and the resulting growth in usage of the Bank’s debit and credit card products.
2007 vs. 2006. Total non-interest income increased $2,255,000 (19%) in 2007 from $11,788,000 in 2006 to $14,043,000 in 2007. Increases for 2007 included service charges and fees (up $2,267,000, or 38%), and bankcard transaction revenue (up $328,000, or 25%), which was partially offset by a decrease in other non-interest income (down $253,000, or 15%). Contributing to the decrease in other non-interest income was $202,000 in gains on the payoff of certain Federal Home Loan Bank advances that were recognized in 2006.
Contributing to the growth in service charges and fees was revenue from the Bank’s overdraft program that was implemented in the third quarter of 2006. This program allows qualified customers the courtesy of the Bank paying items that overdraw the account up to a set limit. This program contributed to the $2,024,000 or 61%, increase in overdraft revenue from $3,295,000 in 2006 to $5,320,000 in 2007.
38
NON-INTEREST EXPENSE
The following table shows the components of non-interest income and the percentage changes from 2008 to 2007 and from 2007 to 2006.
Table 6—Major Components of non-interest expense (in thousands)
| | | | | | | | | | | | | | | |
| | | Year ended December 31, | | Percentage Increase/(Decrease) | |
Non-interest expense: | | 2008 | | 2007 | | 2006 | | 2008/2007 | | | 2007/2006 | |
Salaries and employee benefits | | $ | 16,385 | | $ | 16,402 | | $ | 14,950 | | 0 | % | | 10 | % |
Occupancy and equipment | | | 4,718 | | | 4,517 | | | 4,076 | | 4 | | | 11 | |
Data processing | | | 1,365 | | | 1,433 | | | 1,256 | | (5 | ) | | 14 | |
Advertising | | | 840 | | | 854 | | | 740 | | (2 | ) | | 15 | |
Electronic banking processing fees | | | 1,030 | | | 875 | | | 820 | | 18 | | | 7 | |
Outside service fees | | | 1,322 | | | 1,183 | | | 934 | | 12 | | | 27 | |
State bank taxes | | | 1,576 | | | 1,258 | | | 1,192 | | 25 | | | 5 | |
Amortization of intangible assets | | | 1,278 | | | 1,090 | | | 645 | | 17 | | | 69 | |
FDIC insurance | | | 764 | | | 153 | | | 102 | | 399 | | | 50 | |
Other | | | 4,945 | | | 5,954 | | | 4,427 | | (17 | ) | | 34 | |
| | | | | | | | | | | | | | | |
Total non-interest expense | | $ | 34,223 | | $ | 33,719 | | $ | 29,142 | | 1 | % | | 16 | % |
| | | | | | | | | | | | | | | |
2008 vs. 2007. Non-interest expense increased $504,000 (1%) to 34,223,000 for 2008, compared to $33,719,000 for 2007. The largest increase in non-interest expense was in FDIC insurance, which increased $611,000 (399%) in 2008 compared to 2007, which was partially offset with a decrease in other expenses. The increase in FDIC insurance was the result of the FDIC increasing the deposit assessment rate charged to banks in 2007. The majority of the FDIC insurance cost in 2007 was offset with a one-time credit that the FDIC passed to financial institutions for the institutions previous contributions to the FDIC insurance fund. Other expenses in 2008 included a decrease of $677,000 in expenses associated with other real estate owned properties from $866,000 in 2007 to $189,000 in 2008. The majority of this expense was the result of certain improvements made to a repossessed commercial office building in 2007. The largest overhead expense in the Corporation is salaries and benefits which account for 48% of the total non-interest expense. In 2008, total salaries and benefits decreased $17,000 from 2008 primarily as a result of lower bonus and profit sharing expense, which were off-set by normal annual salary adjustments. For 2008, the bonus and profit sharing expense decreased $823,000 (75%) from 2007. The decreases in these incentive plans cost was the result of the Corporation not meeting certain financial goals. The increase of $188,000 in amortization of intangible assets for 2008 was the result of the First Bank acquisition in mid-year 2007.
2007 vs. 2006. Non-interest expense increased $4,577,000 (16%) to 33,719,000 for 2007, compared to $29,142,000 for 2006. The largest increase in non-interest expense was in salaries and benefits, which increased $1,452,000 (10%) in 2007 compared to 2006. The increase in salaries and benefits was the result of both annual merit increases and an increase in the number
39
of employees. The total number of employees increased 18 (6%) from 314 at the end of 2006 to 332 at the end of 2007, and included the added employees from the First Bank Acquisition. Other expenses in 2007 included an increase of $596,000 in expenses associated with other real estate owned properties from $270,000 in 2006 to $866,000 in 2007. The majority of this expense was the result of certain improvements made to a repossessed commercial office building. The increase of $445,000 in amortization of intangible assets for 2007 was the result of the First Bank acquisition.
TAX EXPENSE
2008 vs. 2007. Federal income tax expense increased $162,000 (3%) to $5,016,000 for 2008 compared to $4,854,000 for 2007. The effective tax rate was 30.7% for 2008, which was an increase of .3% from 30.4% in 2007. Contributing to the increase in the effective tax rate was the $100,000 historic tax credit realized in 2007.
2007 vs. 2006. Federal income tax expense increased $67,000 (1%) to $4,854,000 for 2007 compared to $4,787,000 for 2006. The effective tax rate was 30.4% for 2007, which was a decrease of 1% from 31.4% in 2006. Contributing to the decrease in the effective tax rate was higher tax free revenue and a $100,000 historic tax credit realized in 2007.
CONTRACTUAL OBLIGATIONS AND OFF-BALANCE SHEET ARRANGEMENTS
The Bank enters into certain contractual obligations in the ordinary course of operations. Table 7 presents, as of December 31, 2008, the Bank’s significant fixed and determinable contractual obligations by payment date. The required payments under these contacts represent future cash requirements of the Bank. The payment amounts represent those amounts due to the recipient.
Table 7—Contractual obligations (in thousands)
| | | | | | | | | | | | | | | |
| | | Maturity by period |
| | | Total | | Less than
1 Year | | 1-3
Years | | 3-5
Years | | More than
5 Years |
FHLB advances | | $ | 6,000 | | | — | | $ | 6,000 | | | — | | | — |
Subordinated debentures | | | 38,557 | | | — | | | — | | | — | | | 38,557 |
Other notes payable | | | 241 | | | 15 | | | 29 | | | 29 | | | 168 |
Northern Kentucky University arena naming rights | | | 5,142 | | | 858 | | | 1,713 | | | 1,713 | | | 858 |
Thomas More College athletic field naming rights | | | 800 | | | 200 | | | 600 | | | — | | | — |
Lease commitments | | | 2,936 | | | 840 | | | 1,105 | | | 649 | | | 342 |
| | | | | | | | | | | | | | | |
Total | | $ | 53,676 | | $ | 1,913 | | $ | 9,447 | | $ | 2,391 | | $ | 39,925 |
| | | | | | | | | | | | | | | |
Lease commitments represent the total minimum lease payments under noncancelable leases.
In order to meet the financing needs of its customers, the Bank is also a party to certain financial instruments with off-balance sheet risk in the normal course of business. These financial instruments include commitments to extend credit and standby letters of credit, which involve, to varying degrees, elements of credit risk and interest rate risk in excess of the amounts recognized in the Corporation’s consolidated balance sheets. Table 8 presents, as of December 31, 2008, the Bank’s significant off-balance sheet commitments.
40
Table 8—Significant Off-Balance Sheet Commitments (in thousands)
| | | | | | | | | | | | | | | |
| | | Maturity by period |
| | | Total | | Less than
1 Year | | 1-3
Years | | 3-5
Years | | More than
5 Years |
Unused lines of credit and loan commitments | | $ | 243,605 | | $ | 150,983 | | $ | 18,674 | | $ | 522 | | $ | 73,426 |
Standby letters of credit | | | 49,471 | | | 43,041 | | | 3,595 | | | — | | | 2,835 |
FHLB letters of credit | | | 148,300 | | | 148,300 | | | — | | | — | | | — |
Unused lines of credit and loan commitments assure a borrower of financing for a specified period of time at a specified rate. The risk to the Bank under such commitments is limited to the terms of the contracts. For example, the Bank may not be obligated to advance funds if the customer’s financial condition deteriorates or if the customer fails to meet specific covenants. An approved, but unfunded, loan commitment represents a potential credit risk once the funds are advanced to the customer. The unused lines of credit and loan commitments also represent a future cash requirement, but this cash requirement will be limited since many commitments are expected to expire or only be used partially.
Standby letters of credit represent commitments by the Bank to repay a third-party beneficiary when a customer fails to repay a loan or debt instrument. The terms and risk of loss involved in issuing standby letters of credit are similar to those involved in issuing loan commitments and extending credit. In addition to credit risk, the letters of credit could present an immediate cash requirement if the obligations require funding.
The Bank maintains letters of credit from the FHLB to collateralize public funds deposits. These letters of credit reduce the Bank’s available borrowing line at the FHLB.
On March 3, 2005, the Bank entered into an agreement with Northern Kentucky University whereby the University granted to the Bank the naming rights for the new Northern Kentucky University Arena constructed on the campus of the University for a term commencing immediately upon execution of the agreement and expiring twenty years after the opening of the Arena. In consideration therefore, the Bank paid the lesser of 10% of the total construction cost of the Arena or $6,000,000, such sum to be paid in seven equal annual installments beginning after substantial completion and opening of the Arena. The cost of the naming rights will be amortized over the life of the contract commencing on the opening of the Arena, which took place in September 2008.
In the second quarter of 2007, the Bank and Thomas More College announced a naming rights agreement for the new athletic field being constructed on Thomas More’s campus. The Bank committed $1 million to the project, such sum to be paid in five equal annual installments beginning after substantial completion of the field, which is named The Bank of Kentucky Field. The cost of the naming rights will be amortized over the twenty-five year life of the agreement commencing on the opening of the field, which took place in September 2008.
Further discussion of the Bank’s contractual obligations and off-balance sheet activities is included in Note 14 of the Corporation’s consolidated financial statements.
41
| Item 7A. | Quantitative and Qualitative Disclosure about Market Risk |
ASSET/LIABILITY MANAGEMENT AND MARKET RISK
Market risk is the risk of loss arising from adverse changes in the fair value of financial instruments due to interest rate risk, exchange rate risk, equity price risk or commodity price risk. The Bank does not maintain a trading account for any class of financial instrument and is not currently subject to foreign currency exchange rate risk, equity price risk or commodity price risk. The Bank’s market risk is composed primarily of interest rate risk.
The Bank utilizes an earnings simulation model to measure and define the amount of interest rate risk it assumes. Interest rate risk is the potential for economic losses due to future interest rate changes. These economic losses can be reflected as a loss of future net interest income and/or a decline in fair market values. Interest rate risk results from the fact that the interest sensitive assets and liabilities can adjust their rates at different times and by different amounts. The goal of asset/liability management is to maintain a high, yet stable, net interest margin and to manage the effect that changes in market interest rates will have on net interest income. A common measure of interest rate risk is interest rate “gap” measurement. The gap is the difference, in dollars, between the amount of interest-earning assets and interest-bearing liabilities that will reprice within a certain time frame. Repricing can occur when an asset or liability matures or, if an adjustable rate instrument, when it can be adjusted. Typically, the measurement will focus on the interest rate gap position over the next 12 months. An institution is said to have a negative gap position when more interest-bearing liabilities reprice within a certain period than interest-earning assets, and a positive gap position when more interest-earning assets reprice than interest-bearing liabilities. Interest rate gap is considered an indicator of the effect that changing rates may have on net interest income. Generally, an institution with a negative gap will benefit from declining market interest rates and be negatively impacted by rising interest rates. The Bank currently is in a negative gap position, $215,448,000 (17.16%), and as a result would, without considering other factors, generally benefit from lower rates and be negatively impacted by higher interest rates. The ability to benefit from the Bank’s liability-sensitive position would depend on a number of factors, including: the competitive pressures on consumer deposit and loan pricing, the movement of certain deposit rate indices in relationship to asset rate indices, and the extent of the decrease in the rate environment.
At December 31, 2008, BKFC’s 12-month interest rate gap position, as measured by the Bank’s asset/liability model, was negative. Over the preceding 12 months, interest rate sensitive liabilities exceeded interest rate sensitive assets by $215,448,000 (17.16% of total assets). At December 31, 2007, interest rate sensitive liabilities exceeded interest rate sensitive assets by $152,561,000 (12.37% of total assets). Contributing to the increased liability sensitive position from 2007 to 2008 was lower levels of short-term investments, which were replaced with loans in 2008. An assumption, based on historical behavior, contributing to the Corporation’s gap position is that the balances in NOW and savings accounts react within a two-year timeframe to market rate changes, rather than reacting immediately. These instruments are not tied to specific indices and are only influenced by market conditions and other factors. The Bank’s experience with NOW and savings accounts has been that they have repriced at a pace equal to approximately 25% of a prime change. Accordingly, a general movement in interest rates may not have an immediate effect on the rates paid on those deposit accounts.
42
The Bank’s asset/liability management policy establishes guidelines governing the amount of interest income at risk, market value at risk and parameters for the gap position. Management continually monitors these risks through the use of gap analysis and the earnings simulation model. The simulation model is used to estimate and evaluate the impact of changing interest rates on earnings and market value. The model projects the effect of instantaneous movements in interest rates of both 100 and 200 basis points. The assumptions used in the simulation are inherently uncertain and, as a result, the model cannot precisely measure future net interest income. The results of the model are used by management to approximate the results of rate changes and do not indicate actual expected results. Actual results will differ from the model’s simulated results due to timing, frequency of interest rate changes as well as changes in various management strategies and market conditions. Additionally, actual results can differ materially from the model if interest rates do not move equally across the yield curve.
For the changes in the estimates of an increasing rate scenario on the net interest income change, as shown below, between 2007 to 2008 was a result of the same influences that increased the liability sensitivity of the Corporation’s gap position. However the differences in the estimates for a decreasing rate environment are the results of the current rate environment. In December of 2008 the Federal Reserve Bank lowered the targeted federal funds rate to .25%, and as a result most short-term deposit interest rates cannot drop 100 or 200 basis points while earning assets could in theory decrease by these amounts. The result of this extreme low rate environment is both rising and declining rate scenarios produce a negative impact on earnings.
Net interest income estimates are summarized below.
| | | | | | |
| | | Net Interest Income Change | |
| | | 2008 | | | 2007 | |
Increase 200 bp | | (5.21 | )% | | (2.03 | )% |
Increase 100 bp | | (2.48 | ) | | (1.01 | ) |
Decrease 100 bp | | .18 | | | 1.03 | |
Decrease 200 bp | | (6.30 | ) | | 1.61 | |
The table below provides information about the quantitative market risk of interest sensitive instruments at December 31, 2008 (dollars in thousands) and shows the contractually repricing intervals, and related average interest rates, for each of the next five years and thereafter. As discussed above, while this table uses the contractual repricing intervals for NOW and savings accounts and therefore reflects the Bank’s ability to adjust rates on those accounts at any time, the Bank’s interest rate risk model incorporates assumptions based on historical behavior to determine the expected repricing of these deposits. The amounts included in loans excludes allowance for loan losses, deferred fees, in process accounts and purchase accounting adjustments:
43
Table 9—Balance sheet repricing data (in thousands)
| | | | | | | | | | | | | | | | | | | | | | | | |
| | | 2009 | | | 2010 | | | 2011 | | | 2012 | | | 2013 | | | Thereafter | | Total | | Fair Value |
Repricing in: | | | | | | | | | | | | | | | | | | | | | |
Federal Funds Sold | | 501 | | | — | | | — | | | — | | | — | | | — | | | 501 | | 501 |
Average Interest Rate | | .25 | % | | — | | | — | | | — | | | — | | | — | | | — | | — |
Interest Bearing Deposits | | 100 | | | — | | | — | | | — | | | — | | | — | | | 100 | | 100 |
Average Interest Rate | | 2.09 | % | | — | | | — | | | — | | | — | | | — | | | — | | — |
Securities | | 21,377 | | | 5,783 | | | 10,834 | | | 11,171 | | | 13,907 | | | 56,140 | | | 119,212 | | 118,903 |
Average Interest Rate | | 3.47 | % | | 4.58 | % | | 4.22 | % | | 4.69 | % | | 3.86 | % | | 4.90 | % | | — | | — |
FHLB Stock | | 4,959 | | | — | | | — | | | — | | | — | | | — | | | 4,959 | | 4,959 |
Average Dividend Rate | | 5.00 | % | | — | | | — | | | — | | | — | | | — | | | — | | — |
Loans | | 546,919 | | | 120,796 | | | 125,800 | | | 73,986 | | | 156,028 | | | 6,335 | | | 1,029,864 | | 1,004,230 |
Average Interest Rate | | 4.68 | % | | 6.55 | % | | 6.16 | % | | 6.79 | % | | 5.74 | % | | 6.05 | % | | — | | — |
| | | | | | | | |
Liabilities | | | | | | | | | | | | | | | | | | | | | | |
Savings, NOW, MMA | | 522,763 | | | — | | | — | | | — | | | — | | | — | | | 522,763 | | 522,763 |
Average Interest Rate | | .97 | % | | — | | | — | | | — | | | — | | | — | | | — | | — |
CDs and IRAs | | 302,706 | | | 70,554 | | | 15,878 | | | 1,317 | | | 853 | | | — | | | 391,308 | | 392,070 |
Average Interest Rate | | 3.62 | % | | 3.62 | % | | 4.26 | % | | 4.31 | % | | 3.54 | % | | — | | | — | | — |
Borrowings | | 28,153 | | | — | | | — | | | — | | | — | | | — | | | 28,153 | | 28,153 |
Average Interest Rate | | 1.49 | % | | — | | | — | | | — | | | — | | | — | | | — | | — |
Notes Payable | | 38,000 | | | — | | | — | | | — | | | 6,000 | | | 798 | | | 44,798 | | 36,777 |
Average Interest Rate | | 3.33 | % | | — | | | — | | | — | | | 5.01 | % | | 3.27 | % | | — | | — |
44
LIQUIDITY AND CAPITAL RESOURCES
Liquidity refers to the availability of sufficient levels of cash to fund operations, such as meeting deposit withdrawals, funding loan commitments, paying expenses and meeting its quarterly payment obligations under certain subordinated debentures issued by BKFC in connection with the issuance of floating rate redeemable trust preferred securities issued by BKFC’s unconsolidated trust subsidiary. The source of the funds for BKFC’s debt obligations is dependent on the Bank and BKFC’s line of credit. During 2008, the Bank funded the majority of its loan growth with decreases in short-term investments. At December 31, 2008, the Bank’s customers had available $285,776,000 in unused lines and letters of credit, and the Bank has further extended loan commitments totaling $7,300,000. Historically, many such commitments have expired without being drawn and, accordingly, do not necessarily represent future cash commitments.
If needed, the Bank has the ability to borrow term and overnight funds from the Federal Home Loan Bank or other financial intermediaries. In addition BKFC has a $10,000,000 line of credit with U.S Bank that had $4,400,000 outstanding at December 31, 2007. Further, the Bank has $85,487,000 of securities designated as available-for-sale and an additional $550,000 of held-to-maturity securities that mature within one year that can serve as sources of funds. Management is satisfied that BKFC’s liquidity is sufficient at December 31, 2008 to meet known and potential obligations.
As illustrated in the Corporation’s statement of cash flows, the net change in cash and cash equivalents resulted in a decrease of $220,000. Net income provided $11,341,000 of the $17,230,000 in the Bank’s cash flows from operating activities, while the largest cash outflow from investing activities was in the form of an increase in loans of $82,039,000, excluding securities. The largest source of cash from financing activities excluding the sub debt, came from the increase of $9,074,000 in deposits.
During 2009, the Bank will be required to obtain approval from the Kentucky department of financial institutions to declare dividends to the Corporation. This restriction is in place as a result of the accumulated dividends paid to the Corporation over the last two years was greater than the accumulated earnings of the Bank for those periods. This was a result of the $17,000,000 payoff of the trust preferred securities at the Corporation with a $20,000,000 subordinated debenture (as detailed in Note 9 of The Corporation’s consolidated financial statements) entered into at the Bank. This transaction required the Bank to declare a $17,000,000 dividend to pay off these securities of the Corporation. This transaction was approved by the appropriate regulatory agencies, and the Bank expects to receive approval from the department of financial institutions to pay dividends to the Corporation as before. In 2008, BKFC paid cash dividends of $.54 per share totaling $3,038,000.
On November 12, 2008, BKFC filed an application to participate in the Capital Purchase Program (“CPP”), which was created by the Treasury Department under the Emergency Economic Stabilization Act of 2008, and on December 11, 2008, BKFC was notified that the Treasury Department had preliminarily approved an investment in BKFC of up to $34,000,000 in new capital under the CPP. The U.S. Treasury funded this $34,000,000 in new capital on February 13, 2009. By participating in the CPP, BKFC sold senior preferred shares on
45
standardized terms to the Treasury Department. Although BKFC is currently well-capitalized under regulatory guidelines, the Board of Directors believed it was advisable to take advantage of the CPP to raise additional capital to ensure that during these uncertain times, BKFC is well-positioned to support its existing operations as well as anticipated future growth.
Upon the consummation of this investment, the Treasury Department purchased from BKFC cumulative perpetual preferred stock, with a liquidation preference of $1,000 per share (the “Senior Preferred Shares”). The Senior Preferred Shares constitute Tier 1 capital and rank senior to BKFC’s common stock. The Senior Preferred Shares will pay cumulative dividends at a rate of 5% per annum for the first five years and will reset to a rate of 9% per annum after year five. Dividends will be payable quarterly in arrears. Financial institutions participating in the CPP must also issue warrants (the “Warrants”) to the Treasury Department to purchase a number of common shares having a market price equal to 15% of the aggregate amount of the Senior Preferred Shares purchased by the Treasury Department. BKFC anticipates that a total of 274,784 shares of common stock underlying the Warrants would be issued upon exercise of the Warrants that were issued to the Treasury Department at the time of its investment, with an exercise price of $18.56 per share (which was the 20-day trailing average price from December 11, 2008, the date upon which BKFC received preliminary approval from the Treasury Department). The Warrants have a term of 10 years and the Treasury Department has agreed not to exercise voting power with respect to any shares of common stock of BKFC issued to it upon exercise of the Warrants. Holders of BKFC’s common stock will not have preemptive rights with respect to any common stock which may be delivered upon exercise of the Warrants. Unless the Senior Preferred Shares have been transferred or redeemed in whole, until the third anniversary of the. Treasury Department’s investment, any increase in common stock dividends is prohibited without the prior approval of the Treasury Department. In addition, unless the Senior Preferred Shares have been transferred or redeemed in whole, until the third anniversary of the Treasury Department’s investment, the Treasury Department’s consent is required for any share repurchases other than repurchases of the Senior Preferred Shares and repurchases of junior preferred stock or common stock in connection with any benefit plan in the ordinary course of business and consistent with past practice.
As part of the CPP program any increase in the dividend level from the September 2008 semi-annual payment of $.28 per share must be approved by the Treasury department.
The FDIC has issued regulations relating a bank’s deposit insurance assessment and certain aspects of its operations to specified capital levels. A “well-capitalized” bank, one with a leverage ratio of 5% or more and a total risk-based capital ratio of 10% or more, and no particular areas of supervisory concern, pays the lowest premium and is subject to the fewest restrictions. The Bank’s capital levels and ratios exceed the regulatory definitions of well-capitalized institutions. At December 31, 2008, BKFC’s leverage and total risk-based capital ratios were 7.96% and 10.73%, respectively, which exceed all required ratios established for bank holding companies.
46
EFFECT OF INFLATION AND CHANGING PRICES
The financial statements and related financial data presented in this annual report have been prepared in accordance with U.S. GAAP, which require the measurement of financial position and operating results in terms of historical dollars without considering the change in the relative purchasing power of money over time due to inflation. The primary impact of inflation on our operations is reflected in increased operating costs. Unlike most industrial companies, virtually all the assets and liabilities of a financial institution are monetary in nature. As a result, interest rates generally have a more significant impact on a financial institution’s performance than do general levels of inflation. Interest rates do not necessarily move in the same direction or to the same extent as the prices of goods and services.
ADOPTION OF NEW ACCOUNTING STANDARDS:
In September 2006, the FASB issued Statement No. 157,Fair Value Measurements(FAS 157). This Statement defines fair value, establishes a framework for measuring fair value and expands disclosures about fair value measurements. This Statement establishes a fair value hierarchy about the assumptions used to measure fair value and clarifies assumptions about risk and the effect of a restriction on the sale or use of an asset. The standard was effective for fiscal years beginning after November 15, 2007. In February 2008, the FASB issued Staff Position (FSP) 157-2, Effective Date of FASB Statement No. 157.This FSP delays the effective date of FAS 157 for all nonfinancial assets and nonfinancial liabilities, except those that are recognized or disclosed at fair value on a recurring basis (at least annually) to fiscal years beginning after November 15, 2008, and interim periods within those fiscal years. In October 2008, the FASB issued Staff Position (FSP) 157-3,Determining the Fair Value of a Financial Asset when the Market for That Asset Is Not Active. This FSP clarifies the application of FAS 157 in a market that is not active. The impact of the adoption of this FSP was not material for BKFC.
In February 2007, the FASB issued Statement No. 159,The Fair Value Option for Financial Assets and Financial Liabilities.The standard provides companies with an option to report selected financial assets and liabilities at fair value and establishes presentation and disclosure requirements designed to facilitate comparisons between companies that choose different measurement attributes for similar types of assets and liabilities. The new standard was adopted for the Corporatation on January 1, 2008 having no material impact on the financial statements. The Corporation did not elect the fair value option for any financial assets or financial liabilities as of January 1, 2008.
In September 2006, the FASB Emerging Issues Task Force finalized Issue No. 06-4,Accounting for Deferred Compensation and Postretirement Benefit Aspects of Endorsement Split-Dollar Life Insurance Arrangements. This issue requires that a liability be recorded during the service period when a split-dollar life insurance agreement continues after participants’ employment or
47
retirement. The required accrued liability will be based on either the post-employment benefit cost for the continuing life insurance or based on the future death benefit depending on the contractual terms of the underlying agreement. This new standard was adopted January 1, 2008 having no material impact on the financial statements.
On November 5, 2007, the SEC issued Staff Accounting Bulletin No. 109,Written Loan Commitments Recorded at Fair Value through Earnings(“SAB 109”). Previously, SAB 105,Application of Accounting Principles to Loan Commitments, stated that in measuring the fair value of a derivative loan commitment, a company should not incorporate the expected net future cash flows related to the associated servicing of the loan. SAB 109 supersedes SAB 105 and indicates that the expected net future cash flows related to the associated servicing of the loan should be included in measuring fair value for all written loan commitments that are accounted for at fair value through earnings. SAB 105 also indicated that internally-developed intangible assets should not be recorded as part of the fair value of a derivative loan commitment, and SAB 109 retains that view. SAB 109 is effective for derivative loan commitments issued or modified in fiscal quarters beginning after December 15, 2007. The standard was adopted January 1, 2008 having no material impact on the financial statements.
In December 2007, the SEC issued SAB No. 110, which expresses the views of the SEC regarding the use of a “simplified” method, as discussed in SAB No. 107, in developing an estimate of expected term of “plain vanilla” share options in accordance with SFAS No. 123(R), Share-Based Payment. The SEC concluded that a company could, under certain circumstances, continue to use the simplified method for share option grants after December 31, 2007. The Corporation does not use the simplified method for share options and therefore SAB No. 110 has no impact on the Corporation’s consolidated financial statements.
EFFECT OF NEWLY ISSUED BUT NOT YET EFFECTIVE ACCOUNTING STANDARDS
In December 2007, the FASB issued FAS No. 141 (revised 2007), Business Combinations (“FAS 141(R)”), which establishes principles and requirements for how an acquirer recognizes and measures in its financial statements the identifiable assets acquired, the liabilities assumed, and any noncontrolling interest in an acquiree, including the recognition and measurement of goodwill acquired in a business combination. FAS 141(R) is effective for fiscal years beginning on or after December 15, 2008. Earlier adoption is prohibited. The adoption of this standard had no effect on the Corporation’s results of operations or financial position, but would significantly impact the accounting for future business combinations.
48
| Item 8. | Financial Statements and Supplementary Data |
THE BANK OF KENTUCKY
FINANCIAL CORPORATION
FINANCIAL STATEMENTS
December 31, 2008, 2007 and 2006
49
THE BANK OF KENTUCKY FINANCIAL CORPORATION
Crestview Hills, Kentucky
FINANCIAL STATEMENTS
December 31, 2008, 2007 and 2006
CONTENTS
50
REPORT OF INDEPENDENT REGISTERED PUBLIC ACCOUNTING FIRM
Board of Directors and Shareholders
The Bank of Kentucky Financial Corporation
Crestview Hills, Kentucky
We have audited the accompanying consolidated balance sheets of The Bank of Kentucky Financial Corporation as of December 31, 2008 and 2007 and the related consolidated statements of income, changes in shareholders’ equity, and cash flows for each of the three years in the period ended December 31, 2008. We also have audited The Bank of Kentucky Financial Corporation’s internal control over financial reporting as of December 31, 2008, based on criteria established in Internal Control – Integrated Frameworkissued by the Committee of Sponsoring Organizations of the Treadway Commission (COSO). The Bank of Kentucky Financial Corporation’s management is responsible for these financial statements, for maintaining effective internal control over financial reporting, and for its assessment of the effectiveness of internal control over financial reporting, included in the accompanying Management’s Report on Internal Control over Financial Reporting. Our responsibility is to express an opinion on these financial statements and an opinion on the company’s internal control over financial reporting based on our audits.
We conducted our audits in accordance with the standards of the Public Company Accounting Oversight Board (United States). Those standards require that we plan and perform the audit to obtain reasonable assurance about whether the financial statements are free of material misstatement and whether effective internal control over financial reporting was maintained in all material respects. Our audits of the financial statements included examining, on a test basis, evidence supporting the amounts and disclosures in the financial statements, assessing the accounting principles used and significant estimates made by management, and evaluating the overall financial statement presentation. Our audit of internal control over financial reporting included obtaining an understanding of internal control over financial reporting, assessing the risk that a material weakness exists, and testing and evaluating the design and operating effectiveness of internal control based on the assessed risk. Our audits also included performing such other procedures as we considered necessary in the circumstances. We believe that our audits provide a reasonable basis for our opinions.
51
A company’s internal control over financial reporting is a process designed to provide reasonable assurance regarding the reliability of financial reporting and the preparation of financial statements for external purposes in accordance with generally accepted accounting principles. A company’s internal control over financial reporting includes those policies and procedures that (1) pertain to the maintenance of records that, in reasonable detail, accurately and fairly reflect the transactions and dispositions of the assets of the company; (2) provide reasonable assurance that transactions are recorded as necessary to permit preparation of financial statements in accordance with generally accepted accounting principles, and that receipts and expenditures of the company are being made only in accordance with authorizations of management and directors of the company; and (3) provide reasonable assurance regarding prevention or timely detection of unauthorized acquisition, use, or disposition of the company’s assets that could have a material effect on the financial statements.
Because of its inherent limitations, internal control over financial reporting may not prevent or detect misstatements. Also, projections of any evaluation of effectiveness to future periods are subject to the risk that controls may become inadequate because of changes in conditions, or that the degree of compliance with the policies or procedures may deteriorate.
In our opinion, the consolidated financial statements referred to above present fairly, in all material respects, the financial position of The Bank of Kentucky Financial Corporation as of December 31, 2008 and 2007, and the results of its operations and its cash flows for each of the three years in the period ended December 31, 2008, in conformity with accounting principles generally accepted in the United States of America. Also in our opinion The Bank of Kentucky Financial Corporation maintained, in all material respects, effective internal control over financial reporting as of December 31, 2008, based on criteria established inInternal Control – Integrated Frameworkissued by the COSO.
| | | | |
| | | | Crowe Horwath LLP |
| Columbus, Ohio | | | | |
| March 7, 2009 | | | | |
52
THE BANK OF KENTUCKY FINANCIAL CORPORATION
CONSOLIDATED BALANCE SHEETS
December 31, 2008 and 2007
(Dollar amounts in thousands, except share and per share amounts)
| | | | | | |
| | | 2008 | | 2007 |
ASSETS | | | | | | |
Cash and due from banks | | $ | 38,155 | | $ | 38,307 |
Federal funds sold and other short-term investments | | | 501 | | | 569 |
| | | | | | |
Total cash and cash equivalents | | | 38,656 | | | 38,876 |
Interest bearing deposits with banks | | | 100 | | | 100 |
Available-for-sale securities | | | 85,487 | | | 152,069 |
Held-to-maturity securities (Fair value of $33,416 and $16,170) | | | 33,725 | | | 16,230 |
Loans held for sale | | | 2,625 | | | 2,673 |
Loans, net of allowance ($9,910 and $8,505) | | | 1,016,647 | | | 941,209 |
Premises and equipment-net | | | 18,824 | | | 17,764 |
Federal Home Loan Bank stock, at cost | | | 4,959 | | | 4,766 |
Goodwill | | | 15,209 | | | 15,209 |
Acquisition intangibles | | | 2,552 | | | 3,830 |
Company owned life insurance | | | 21,316 | | | 20,528 |
Accrued interest receivable and other assets | | | 15,282 | | | 19,470 |
| | | | | | |
| | $ | 1,255,382 | | $ | 1,232,724 |
| | | | | | |
LIABILITIES AND SHAREHOLDERS’ EQUITY | | | | | | |
Liabilities | | | | | | |
Deposits | | | | | | |
Noninterest bearing deposits | | $ | 157,082 | | $ | 167,578 |
Interest bearing deposits | | | 914,071 | | | 894,501 |
| | | | | | |
Total deposits | | | 1,071,153 | | | 1,062,079 |
Short-term borrowings | | | 28,153 | | | 22,789 |
Notes payable | | | 44,798 | | | 42,340 |
Accrued expenses and other liabilities | | | 9,830 | | | 12,031 |
| | | | | | |
| | | 1,153,934 | | | 1,139,239 |
Commitments and contingent liabilities | | | — | | | — |
Shareholders’ equity | | | | | | |
Common stock, no par value, 15,000,000 shares authorized, 5,606,607 (2008) and 5,684,207 (2007) shares issued | | | 3,098 | | | 3,098 |
Additional paid-in capital | | | 2,708 | | | 3,880 |
Retained earnings | | | 94,608 | | | 86,305 |
Accumulated other comprehensive income | | | 1,034 | | | 202 |
| | | | | | |
| | | 101,448 | | | 93,485 |
| | | | | | |
| | $ | 1,255,382 | | $ | 1,232,724 |
| | | | | | |
See accompanying notes.
53
THE BANK OF KENTUCKY FINANCIAL CORPORATION
CONSOLIDATED STATEMENTS OF INCOME
Years ended December 31, 2008, 2007 and 2006
(Dollar amounts in thousands, except share and per share amounts)
| | | | | | | | | |
| | | 2008 | | 2007 | | 2006 |
Interest income | | | | | | | | | |
Loans, including related fees | | $ | 63,375 | | $ | 68,769 | | $ | 59,131 |
Securities | | | | | | | | | |
Taxable | | | 3,737 | | | 4,189 | | | 3,184 |
Tax exempt | | | 750 | | | 360 | | | 379 |
Other | | | 820 | | | 2,395 | | | 923 |
| | | | | | | | | |
| | | 68,682 | | | 75,713 | | | 63,617 |
| | | |
Interest expense | | | | | | | | | |
Deposits | | | 25,022 | | | 35,307 | | | 26,715 |
Borrowings | | | 2,998 | | | 3,170 | | | 2,609 |
| | | | | | | | | |
| | | 28,020 | | | 38,477 | | | 29,324 |
| | | | | | | | | |
Net interest income | | | 40,662 | | | 37,236 | | | 34,293 |
| | | |
Provision for loan losses | | | 4,850 | | | 1,575 | | | 1,700 |
| | | | | | | | | |
Net interest income after provision for loan losses | | | 35,812 | | | 35,661 | | | 32,593 |
| | | |
Non-interest income | | | | | | | | | |
Service charges and fees | | | 8,918 | | | 8,243 | | | 5,976 |
Mortgage banking income | | | 937 | | | 919 | | | 1,056 |
Trust fee income | | | 1,111 | | | 1,089 | | | 1,088 |
Bankcard transaction revenue | | | 1,924 | | | 1,626 | | | 1,298 |
Company owned life insurance earnings | | | 794 | | | 749 | | | 700 |
Other | | | 1,084 | | | 1,417 | | | 1,670 |
| | | | | | | | | |
| | | 14,768 | | | 14,043 | | | 11,788 |
| | | |
Non-interest expense | | | | | | | | | |
Salaries and employee benefits | | | 16,385 | | | 16,402 | | | 14,950 |
Occupancy and equipment | | | 4,718 | | | 4,517 | | | 4,076 |
Data processing | | | 1,365 | | | 1,433 | | | 1,256 |
Advertising | | | 840 | | | 854 | | | 740 |
Electronic banking processing fees | | | 1,030 | | | 875 | | | 820 |
Outside service fees | | | 1,322 | | | 1,183 | | | 934 |
State bank taxes | | | 1,576 | | | 1,258 | | | 1,192 |
Amortization of intangible assets | | | 1,278 | | | 1,090 | | | 645 |
FDIC insurance | | | 764 | | | 153 | | | 102 |
Other | | | 4,945 | | | 5,954 | | | 4,427 |
| | | | | | | | | |
| | | 34,223 | | | 33,719 | | | 29,142 |
| | | | | | | | | |
Income before income taxes | | | 16,357 | | | 15,985 | | | 15,239 |
| | | |
Federal income taxes | | | 5,016 | | | 4,854 | | | 4,787 |
| | | | | | | | | |
Net income | | $ | 11,341 | | $ | 11,131 | | $ | 10,452 |
| | | | | | | | | |
Per share data | | | | | | | | | |
Earnings per share | | $ | 2.02 | | $ | 1.93 | | $ | 1.79 |
| | | | | | | | | |
Earnings per share, assuming dilution | | $ | 2.02 | | $ | 1.93 | | $ | 1.78 |
| | | | | | | | | |
See accompanying notes.
54
THE BANK OF KENTUCKY FINANCIAL CORPORATION
CONSOLIDATED STATEMENTS
OF CHANGES IN SHAREHOLDERS’ EQUITY
Years ended December 31, 2008, 2007 and 2006
(Dollar amounts in thousands, except share and per share amounts)
| | | | | | | | | | | | | | | | | | | | | | |
| | | Shares | | | Common
Stock | | Additional
Paid-in
Capital | | | Retained
Earnings | | | Accumulated
Other
Comprehensive
Income (Loss) | | | Total | |
Balance January 1, 2006 | | 5,884,079 | | | $ | 3,098 | | $ | 7,888 | | | $ | 69,969 | | | $ | (508 | ) | | $ | 80,447 | |
| | | | | | |
Cumulative adjustment related to SAB 108 adoption | | — | | | | — | | | — | | | | (379 | ) | | | — | | | | (379 | ) |
Comprehensive income | | — | | | | — | | | — | | | | | | | | — | | | | — | |
Net income | | — | | | | — | | | — | | | | 10,452 | | | | — | | | | 10,452 | |
Change in net unrealized gain (loss), net of tax | | — | | | | — | | | — | | | | — | | | | 261 | | | | 261 | |
| | | | | | | | | | | | | | | | | | | | | | |
Total comprehensive income | | — | | | | — | | | — | | | | — | | | | — | | | | 10,713 | |
Cash dividends - $.38 per share | | — | | | | — | | | — | | | | (2,217 | ) | | | — | | | | (2,217 | ) |
Stock-based compensation expense | | — | | | | — | | | 775 | | | | — | | | | — | | | | 775 | |
Exercise of stock options, including tax benefit | | 29,020 | | | | — | | | 621 | | | | — | | | | — | | | | 621 | |
Repurchase and retirement of common shares | | (118,400 | ) | | | — | | | (3,077 | ) | | | — | | | | — | | | | (3,077 | ) |
| | | | | | | | | | | | | | | | | | | | | | |
Balance December 31, 2006 | | 5,794,699 | | | | 3,098 | | | 6,207 | | | | 77,825 | | | | (247 | ) | | | 86,883 | |
| | | | | | |
Comprehensive income | | — | | | | — | | | — | | | | — | | | | — | | | | — | |
Net income | | — | | | | — | | | — | | | | 11,131 | | | | — | | | | 11,131 | |
Change in net unrealized gain (loss), net of tax | | — | | | | — | | | — | | | | — | | | | 449 | | | | 449 | |
| | | | | | | | | | | | | | | | | | | | | | |
Total comprehensive income | | — | | | | — | | | — | | | | — | | | | — | | | | 11,580 | |
Cash dividends - $.46 per share | | — | | | | — | | | — | | | | (2,651 | ) | | | — | | | | (2,651 | ) |
Stock-based compensation expense | | — | | | | — | | | 839 | | | | — | | | | — | | | | 839 | |
Exercise of stock options, including tax benefit | | 43,253 | | | | — | | | 777 | | | | — | | | | — | | | | 777 | |
Repurchase and retirement of common shares | | (153,745 | ) | | | — | | | (3,943 | ) | | | — | | | | — | | | | (3,943 | ) |
| | | | | | | | | | | | | | | | | | | | | | |
Balance December 31, 2007 | | 5,684,207 | | | | 3,098 | | | 3,880 | | | | 86,305 | | | | 202 | | | | 93,485 | |
| | | | | | |
Comprehensive income | | — | | | | — | | | — | | | | — | | | | — | | | | — | |
Net income | | — | | | | — | | | — | | | | 11,341 | | | | — | | | | 11,341 | |
Change in net unrealized gain (loss), net of tax | | — | | | | — | | | — | | | | — | | | | 832 | | | | 832 | |
| | | | | | | | | | | | | | | | | | | | | | |
Total comprehensive income | | — | | | | — | | | — | | | | — | | | | — | | | | 12,173 | |
Cash dividends - $.54 per share | | — | | | | — | | | — | | | | (3,038 | ) | | | — | | | | (3,038 | ) |
Stock-based compensation expense | | — | | | | — | | | 642 | | | | — | | | | — | | | | 642 | |
Exercise of stock options, including tax benefit | | 2,700 | | | | — | | | 51 | | | | — | | | | — | | | | 51 | |
Repurchase and retirement of common shares | | (80,300 | ) | | | — | | | (1,865 | ) | | | — | | | | — | | | | (1,865 | ) |
| | | | | | | | | | | | | | | | | | | | | | |
Balance December 31, 2008 | | 5,606,607 | | | $ | 3,098 | | $ | 2,708 | | | $ | 94,608 | | | $ | 1,034 | | | $ | 101,448 | |
| | | | | | | | | | | | | | | | | | | | | | |
See accompanying notes.
55
THE BANK OF KENTUCKY FINANCIAL CORPORATION
CONSOLIDATED STATEMENTS OF CASH FLOWS
Years ended December 31, 2008, 2007 and 2006
(Dollar amounts in thousands, except share and per share amounts)
| | | | | | | | | | | | |
| | | 2008 | | | 2007 | | | 2006 | |
Cash flows from operating activities | | | | | | | | | | | | |
Net income | | $ | 11,341 | | | $ | 11,131 | | | $ | 10,452 | |
Adjustments to reconcile net income to net cash from operating activities | | | | | | | | | | | | |
Depreciation and amortization | | | 1,459 | | | | 1,505 | | | | 1,255 | |
Net amortization (accretion) on securities | | | 34 | | | | (1,453 | ) | | | (824 | ) |
Provision for loan losses | | | 4,850 | | | | 1,575 | | | | 1,700 | |
Federal Home Loan Bank stock dividend | | | (193 | ) | | | — | | | | (254 | ) |
Amortization of acquisition intangibles | | | 1,278 | | | | 1,090 | | | | 645 | |
Earnings on life insurance | | | (788 | ) | | | (749 | ) | | | (701 | ) |
Loss on sale/write-down of other real estate | | | 380 | | | | 312 | | | | 224 | |
Mortgage banking income | | | (937 | ) | | | (919 | ) | | | (1,056 | ) |
Proceeds from loans sold | | | 60,061 | | | | 71,668 | | | | 80,814 | |
Origination of loans held for sale | | | (59,076 | ) | | | (69,413 | ) | | | (82,158 | ) |
Stock based compensation expense | | | 642 | | | | 839 | | | | 775 | |
Net change in: | | | | | | | | | | | | |
Accrued interest receivable and other assets | | | 788 | | | | (2,369 | ) | | | (2,153 | ) |
Accrued expenses and other liabilities | | | (2,609 | ) | | | 1,338 | | | | 2,544 | |
| | | | | | | | | | | | |
Net cash from operating activities | | | 17,230 | | | | 14,555 | | | | 11,263 | |
| | | |
Cash flows from investing activities | | | | | | | | | | | | |
Proceeds from maturities and principal reductions of held-to-maturity securities | | | 5,217 | | | | 3,445 | | | | 2,778 | |
Purchase of held-to-maturity securities | | | (22,723 | ) | | | (7,662 | ) | | | — | |
Proceeds from maturities and sales of available-for-sale securities | | | 189,473 | | | | 272,327 | | | | 113,967 | |
Purchase of available-for-sale securities | | | (121,674 | ) | | | (313,153 | ) | | | (140,098 | ) |
Loans made to customers, net of principal collections | | | (82,039 | ) | | | (75,574 | ) | | | (89,817 | ) |
Property and equipment expenditures, net | | | (2,668 | ) | | | (2,095 | ) | | | (1,074 | ) |
Proceeds from the sale of other real estate | | | 4,920 | | | | 163 | | | | 6,150 | |
Net payments in acquisition | | | — | | | | (12,014 | ) | | | — | |
| | | | | | | | | | | | |
Net cash from investing activities | | | (29,494 | ) | | | (134,563 | ) | | | (108,094 | ) |
| | | |
Cash flows from financing activities | | | | | | | | | | | | |
Net change in deposits | | | 9,074 | | | | 84,470 | | | | 83,317 | |
Net change in short-term borrowings | | | 5,364 | | | | 6,829 | | | | 11,735 | |
Advances on notes payable | | | 20,000 | | | | 18,557 | | | | — | |
Payments on notes payable | | | (17,542 | ) | | | (14 | ) | | | (10,033 | ) |
Dividends paid on common stock | | | (3,038 | ) | | | (2,651 | ) | | | (2,217 | ) |
Stock repurchase and retirement | | | (1,865 | ) | | | (3,943 | ) | | | (3,077 | ) |
Proceeds from exercise of stock options | | | 51 | | | | 777 | | | | 621 | |
| | | | | | | | | | | | |
Net cash from financing activities | | | 12,044 | | | | 104,025 | | | | 80,346 | |
| | | | | | | | | | | | |
Net change in cash and cash equivalents | | | (220 | ) | | | (15,983 | ) | | | (16,485 | ) |
| | | |
Cash and cash equivalents at beginning of year | | | 38,876 | | | | 54,859 | | | | 71,344 | |
| | | | | | | | | | | | |
| | | |
Cash and cash equivalents at end of year | | $ | 38,656 | | | $ | 38,876 | | | $ | 54,859 | |
| | | | | | | | | | | | |
Supplemental cash flow information: | | | | | | | | | | | | |
Cash paid for interest | | $ | 30,171 | | | $ | 37,145 | | | $ | 27,666 | |
Cash paid for income taxes | | | 5,220 | | | | 5,503 | | | | 4,203 | |
Supplemental noncash disclosures: | | | | | | | | | | | | |
Transfers from loans to other real estate | | $ | 1,895 | | | $ | 1,612 | | | $ | 4,292 | |
See accompanying notes.
56
THE BANK OF KENTUCKY FINANCIAL CORPORATION
NOTES TO CONSOLIDATED FINANCIAL STATEMENTS
December 31, 2008, 2007 and 2006
(Dollar amounts in thousands, except share and per share amounts)
NOTE 1 - SUMMARY OF SIGNIFICANT ACCOUNTING POLICIES
Basis of Presentation: The consolidated financial statements include the accounts of The Bank of Kentucky Financial Corporation (the Company) and its wholly owned subsidiary, The Bank of Kentucky (the Bank). Intercompany transactions are eliminated in consolidation.
Description of Business: The Company provides financial services through its subsidiary, which operates primarily in Boone, Campbell, Grant and Kenton counties in northern Kentucky and also in Greater Cincinnati, Ohio. Operations consist of generating commercial, mortgage and consumer loans and accepting deposits from customers. The loan portfolio is diversified and the ability of debtors to repay loans is not dependent upon any single industry. The majority of the institution’s loans are secured by specific items of collateral including business assets, real property and consumer assets.
Use of Estimates: To prepare financial statements in conformity with accounting principles generally accepted in the United States of America, management makes estimates and assumptions based on available information. These estimates and assumptions affect the amounts reported in the financial statements and the disclosures provided, and future results could differ. The allowance for loan losses and the fair values of financial instruments are particularly subject to change.
Cash Flows: Cash and cash equivalents include cash on hand, amounts due from banks, and federal funds sold. The Company reports net cash flows for customer loan and deposit transactions, interest-bearing balances with banks and short-term borrowings with maturities of 90 days or less.
Interest-Bearing Deposits in Other Financial Institutions: Interest-bearing deposits in other financial institutions mature within one year and are carried at cost.
Securities: Securities are classified as held-to-maturity and carried at amortized cost when management has the positive intent and ability to hold them to maturity. Securities are classified as available-for-sale when they might be sold before maturity. Available-for-sale securities are carried at fair value, with unrealized holding gains and losses reported in other comprehensive income.
Interest income includes amortization of purchase premium or discount. Premiums and discounts on securities are amortized on the level-yield method without anticipating prepayments except for mortgage backed securities where prepayments are anticipated. Gains and losses on sales are based on the amortized cost of the security sold.
Declines in the fair value of securities below their cost that are other than temporary are reflected as realized losses. In estimating other-than-temporary losses, management considers: the length of time and extent that fair value of securities have been below their cost, the financial condition and near term prospects of the issuer, and the Company’s ability and intent to hold the security for a period sufficient to allow for any anticipated recovery in fair value.
(Continued)
57
THE BANK OF KENTUCKY FINANCIAL CORPORATION
NOTES TO CONSOLIDATED FINANCIAL STATEMENTS
December 31, 2008, 2007 and 2006
(Dollar amounts in thousands, except share and per share amounts)
NOTE 1 - SUMMARY OF SIGNIFICANT ACCOUNTING POLICIES(Continued)
Loans Held For Sale: The Bank originates loans for sale, to secondary market brokers. Loans held for sale are loans which have been closed and are awaiting delivery to these brokers. They are reported at the lower of cost or market, on an aggregate basis. Net unrealized losses, if any, are recorded as a valuation allowance and charged to earnings. Most loans are sold servicing released such that there would be no servicing asset recognized upon the sale.
Loans: Loans that management has the intent and ability to hold for the foreseeable future or until maturity or payoff are reported at the principal balance outstanding, deferred loan fees and costs, and an allowance for loan losses. Interest income is accrued on the unpaid principal balance. Loan origination fees, net of certain direct origination costs, are deferred and recognized in interest income using the level-yield method without anticipating prepayments.
Interest income on mortgage and commercial loans is discontinued at the time the loan is 90 days delinquent unless the loan is well-secured and in process of collection. Interest income is not reported when full loan repayment is in doubt, typically when the loan is impaired or payments are significantly past due.
All interest accrued but not received for loans placed on nonaccrual is reversed against interest income. Interest received on such loans is accounted for on the cash-basis or cost-recovery method, until qualifying for return to accrual. Loans are returned to accrual status when all the principal and interest amounts contractually due are brought current and future payments are reasonably assured.
Concentration of Credit Risk: Most of the Company’s business activity is with customers located within Northern Kentucky and the Cincinnati metropolitan area. Therefore, the Company’s exposure to credit risk is significantly affected by changes in the economy in this area.
Allowance for Loan Losses: The allowance for loan losses is a valuation allowance for probable incurred credit losses, increased by the provision for loan losses and decreased by charge-offs less recoveries. Management estimates the allowance balance required using past loan loss experience, the nature and volume of the portfolio, information about specific borrower situations and estimated collateral values, economic conditions, and other factors. Allocations of the allowance may be made for specific loans, but the entire allowance is available for any loan that, in management’s judgment, should be charged off. Loan losses are charged against the allowance when management believes the uncollectibility of a loan balance is confirmed.
(Continued)
58
THE BANK OF KENTUCKY FINANCIAL CORPORATION
NOTES TO CONSOLIDATED FINANCIAL STATEMENTS
December 31, 2008, 2007 and 2006
(Dollar amounts in thousands, except share and per share amounts)
NOTE 1 - SUMMARY OF SIGNIFICANT ACCOUNTING POLICIES(Continued)
The allowance consists of specific and general components. The specific component relates to loans that are individually classified as impaired. The general component covers non-classified loans and is based on historical loss experience adjusted for current factors.
A loan is impaired when full payment under the loan terms is not expected. Impairment is evaluated in total for smaller-balance loans of similar nature such as residential mortgage, consumer, and credit card loans, and on an individual loan basis for other loans. Large groups of smaller balance homogeneous loans, such as consumer and residential real estate loans, are collectively evaluated for impairment, and accordingly, they are not separately identified for impairment disclosures. If a loan is impaired, a portion of the allowance is allocated so that the loan is reported, net, at the present value of estimated future cash flows using the loan’s existing rate or at the fair value of collateral if repayment is expected solely from the collateral.
Premises and Equipment: Land is carried at cost. Premises and equipment are stated at cost less accumulated depreciation. Buildings and related components are depreciated using the straight-line method with useful lives ranging from 10 to 25 years. Leasehold improvements are depreciated using the straight-line method over the lesser of the useful life of the asset or the length of the lease. Furniture, fixtures and equipment are depreciated using the straight-line method with useful lives ranging from 3 to 10 years.
Other Real Estate: Other real estate acquired through or instead of foreclosure is initially recorded at fair value less cost to sell when acquired, establishing a new cost basis. If fair value declines subsequent to foreclosure, a valuation allowance is recorded through expense. Expenses incurred in carrying other real estate are charged to operations as incurred. A total of $712 and $4,117 of other real estate was owned on December 31, 2008 and 2007, respectively, and included in other assets.
Federal Home Loan Bank (FHLB) Stock: The Bank is a member of the FHLB system. Members are required to own a certain amount of stock based on the level of borrowings and other factors, and may invest in additional amounts. FHLB stock is carried at cost, classified as a restricted security, and periodically evaluated for impairment based on ultimate recovery of par value. Both cash and stock dividends are reported as income.
Company Owned Life Insurance: The Company has purchased life insurance policies on certain key executives. In accordance with of EITF 06-5, Company owned life insurance is recorded at the amount that can be realized under the insurance contract at the balance sheet date, which is the cash surrender value adjusted for other charges or other amounts due that are probable at settlement.
(Continued)
59
THE BANK OF KENTUCKY FINANCIAL CORPORATION
NOTES TO CONSOLIDATED FINANCIAL STATEMENTS
December 31, 2008, 2007 and 2006
(Dollar amounts in thousands, except share and per share amounts)
NOTE 1 - SUMMARY OF SIGNIFICANT ACCOUNTING POLICIES(Continued)
Goodwill and Other Intangible Assets: Goodwill results from business acquisitions and represents the excess of the purchase price over the fair value of acquired tangible assets and liabilities and identifiable intangible assets. Goodwill is assessed at least annually for impairment and any such impairment will be recognized in the period identified.
Other intangible assets consist of core deposit and acquired customer relationship intangible assets arising from whole bank and branch acquisitions. They are initially measured at fair value and then are amortized either on the straight-line method or an accelerated method over their estimated useful lives of eight to ten years for the core deposit intangible and seven to ten years for the customer relationship intangible.
Repurchase Agreements: Substantially all repurchase agreement liabilities represent amounts advanced by various customers. Securities are pledged to cover these liabilities, which are not covered by federal deposit insurance.
Stock-Based Compensation: Compensation cost is recognized for stock options issued to directors and officers, based on the fair value of these awards at the date of grant. A Black-Scholes model is utilized to estimate the fair value of stock options. Compensation cost is recognized over the required service period, generally defined as the vesting period. For awards with graded vesting, compensation cost is recognized on a straight-line basis over the requisite service period for the entire award.
Income Taxes: Income tax expense is the amount of taxes payable for the current year plus or minus the change in deferred taxes. Deferred tax liabilities and assets are the expected future tax consequences of temporary differences between the carrying amounts and tax bases of assets and liabilities, computed using enacted tax rates. Recognition of deferred tax assets is limited by the establishment of a valuation allowance unless management concludes that they are more likely than not to result in future tax benefits to the Company.
The Company adopted FASB Interpretation 48,Accounting for Uncertainty in Income Taxes (“FIN 48”), as of January 1, 2007. A tax position is recognized as a benefit only if it is “more likely than not” that the tax position would be sustained in a tax examination, with a tax examination being presumed to occur. The amount recognized is the largest amount of tax benefit that is greater than 50% likely of being realized on examination. For tax positions not meeting the “more likely than not” test, no tax benefit is recorded. The adoption had no effect on the Company’s financial statements.
Loan Commitments and Related Financial Instruments: Financial instruments include credit instruments, such as commitments to make loans and standby letters of credit, issued to meet customer financing needs. The face amount of these items represents the exposure to loss,
(Continued)
60
THE BANK OF KENTUCKY FINANCIAL CORPORATION
NOTES TO CONSOLIDATED FINANCIAL STATEMENTS
December 31, 2008, 2007 and 2006
(Dollar amounts in thousands, except share and per share amounts)
NOTE 1 - SUMMARY OF SIGNIFICANT ACCOUNTING POLICIES(Continued)
before considering customer collateral or ability to repay. Such financial instruments are recorded when they are funded. Instruments, such as standby letters of credit that are considered financial guarantees in accordance with FASB interpretation No. 45 are recorded at fair value.
Fair Value of Financial Instruments: Fair values of financial instruments are estimated using relevant market information and other assumptions, as more fully disclosed in a separate note. Fair value estimates involve uncertainties and matters of significant judgment regarding interest rates, credit risk, prepayments and other factors, especially in the absence of broad markets for particular items. Changes in assumptions or in market conditions could significantly affect the estimates.
Loss Contingencies: Loss contingencies, including claims and legal actions arising in the ordinary course of business, are recorded as liabilities when the likelihood of loss is probable and an amount or range of loss can be reasonably estimated. Management does not believe there are currently such matters that will have a material effect on the financial statements.
Comprehensive Income: Comprehensive income consists of net income and other comprehensive income. Other comprehensive income includes unrealized gains and losses on securities available for sale which are also recognized as separate components of equity.
Dividend Restriction: Banking regulations require the maintenance of certain capital levels and may limit the amount of dividends which may be paid by the Bank to the Company or by the Company to its shareholders. See Note 15 for further discussion.
Long-term Assets: These assets are reviewed for impairment when events indicate their carrying amount may not be recoverable from future undiscounted cash flows. If impaired, the assets are recorded at fair value.
Business Segment: Internal financial information is reported and aggregated in one line of business, banking. While the chief decision-makers monitor the revenue streams of the various products and services, the identifiable segments are not material and operations are managed and financial performance is evaluated on a Company-wide basis. Accordingly, all of the financial service operations are considered by management to be aggregated in one reportable operating segment.
Reclassifications: Some items in the prior year financial statements were reclassified to conform to the current presentation.
(Continued)
61
THE BANK OF KENTUCKY FINANCIAL CORPORATION
NOTES TO CONSOLIDATED FINANCIAL STATEMENTS
December 31, 2008, 2007 and 2006
(Dollar amounts in thousands, except share and per share amounts)
NOTE 1 - SUMMARY OF SIGNIFICANT ACCOUNTING POLICIES(Continued)
Earnings Per Common Share: Basic earnings per common share is net income divided by the weighted average number of common shares outstanding during the period. Diluted earnings per common share includes the dilutive effect of additional potential common shares issuable under stock options. Earnings and dividends per share are restated for all stock splits and stock dividends through the date of issuance of the financial statements.
Retirement Plans: Employee 401(k) and profit sharing plan expense is the amount of matching contributions. Deferred compensation and supplemental retirement plan expense allocates the benefits over years of service.
Adoption of New Accounting Standards: In September 2006, the FASB issued Statement No. 157,Fair Value Measurements(FAS 157). This Statement defines fair value, establishes a framework for measuring fair value and expands disclosures about fair value measurements. This Statement establishes a fair value hierarchy about the assumptions used to measure fair value and clarifies assumptions about risk and the effect of a restriction on the sale or use of an asset. The standard was effective for fiscal years beginning after November 15, 2007. In February 2008, the FASB issued Staff Position (FSP) 157-2, Effective Date of FASB Statement No. 157.This FSP delays the effective date of FAS 157 for all nonfinancial assets and nonfinancial liabilities, except those that are recognized or disclosed at fair value on a recurring basis (at least annually) to fiscal years beginning after November 15, 2008, and interim periods within those fiscal years. In October 2008, the FASB issued Staff Position (FSP) 157-3,Determining the Fair Value of a Financial Asset when the Market for That Asset Is Not Active. This FSP clarifies the application of FAS 157 in a market that is not active. The impact of adoption was not material.
In February 2007, the FASB issued Statement No. 159,The Fair Value Option for Financial Assets and Financial Liabilities.The standard provides companies with an option to report selected financial assets and liabilities at fair value and establishes presentation and disclosure requirements designed to facilitate comparisons between companies that choose different measurement attributes for similar types of assets and liabilities. The new standard was adopted for the Company on January 1, 2008 having no material impact on the financial statements. The Company did not elect the fair value option for any financial assets or financial liabilities as of January 1, 2008.
In September 2006, the FASB Emerging Issues Task Force finalized Issue No. 06-4,Accounting for Deferred Compensation and Postretirement Benefit Aspects of Endorsement Split-Dollar Life Insurance Arrangements. This issue requires that a liability be recorded during the service period when a split-dollar life insurance agreement continues after participants’ employment or retirement. The required accrued liability will be based on either the post-employment benefit cost for the continuing life insurance or based on the future death benefit depending on the contractual terms of the underlying agreement. This new standard was adopted January 1, 2008 having no material impact on the financial statements.
(Continued)
62
THE BANK OF KENTUCKY FINANCIAL CORPORATION
NOTES TO CONSOLIDATED FINANCIAL STATEMENTS
December 31, 2008, 2007 and 2006
(Dollar amounts in thousands, except share and per share amounts)
NOTE 1 - SUMMARY OF SIGNIFICANT ACCOUNTING POLICIES(Continued)
On November 5, 2007, the SEC issued Staff Accounting Bulletin No. 109,Written Loan Commitments Recorded at Fair Value through Earnings(“SAB 109”). Previously, SAB 105,Application of Accounting Principles to Loan Commitments, stated that in measuring the fair value of a derivative loan commitment, a company should not incorporate the expected net future cash flows related to the associated servicing of the loan. SAB 109 supersedes SAB 105 and indicates that the expected net future cash flows related to the associated servicing of the loan should be included in measuring fair value for all written loan commitments that are accounted for at fair value through earnings. SAB 105 also indicated that internally-developed intangible assets should not be recorded as part of the fair value of a derivative loan commitment, and SAB 109 retains that view. SAB 109 is effective for derivative loan commitments issued or modified in fiscal quarters beginning after December 15, 2007. The standard was adopted January 1, 2008 having no material impact on the financial statements.
In December 2007, the SEC issued SAB No. 110, which expresses the views of the SEC regarding the use of a “simplified” method, as discussed in SAB No. 107, in developing an estimate of expected term of “plain vanilla” share options in accordance with SFAS No. 123(R), Share-Based Payment. The SEC concluded that a company could, under certain circumstances, continue to use the simplified method for share option grants after December 31, 2007. The Company does not use the simplified method for share options and therefore SAB No. 110 has no impact on the Company’s consolidated financial statements.
Effect of Newly Issued But Not Yet Effective Accounting Standards: In December 2007, the FASB issued FAS No. 141 (revised 2007), Business Combinations (“FAS 141(R)”), which establishes principles and requirements for how an acquirer recognizes and measures in its financial statements the identifiable assets acquired, the liabilities assumed, and any noncontrolling interest in an acquiree, including the recognition and measurement of goodwill acquired in a business combination. FAS No. 141(R) is effective for fiscal years beginning on or after December 15, 2008. Earlier adoption is prohibited. The adoption of this standard had no effect on the Corporation’s results of operations or financial position, but would significantly impact the accounting for future business combinations.
(Continued)
63
THE BANK OF KENTUCKY FINANCIAL CORPORATION
NOTES TO CONSOLIDATED FINANCIAL STATEMENTS
December 31, 2008, 2007 and 2006
(Dollar amounts in thousands, except share and per share amounts)
NOTE 2 - SECURITIES
The fair value of available for sale securities and the related gains and losses recognized in accumulated other comprehensive income (loss) was as follows:
| | | | | | | | | | |
Available-for-Sale | | Fair
Value | | Gross
Unrealized
Gains | | Gross
Unrealized
Losses | |
2008 | | | | | | | | | | |
U.S. Government, federal agencies and Government sponsored enterprises | | $ | 40,425 | | $ | 381 | | $ | — | |
Mortgage-backed | | | 43,817 | | | 1,191 | | | (6 | ) |
Corporate | | | 1,245 | | | — | | | — | |
| | | | | | | | | | |
| | $ | 85,487 | | $ | 1,572 | | $ | (6 | ) |
| | | | | | | | | | |
| | | Fair
Value | | Gross
Unrealized
Gains | | Gross
Unrealized
Losses | |
2007 | | | | | | | | | | |
U.S. Government, federal agencies and Government sponsored enterprises | | $ | 96,975 | | $ | 271 | | $ | (30 | ) |
U.S. Treasury | | | 39,995 | | | — | | | (4 | ) |
Mortgage-backed | | | 13,799 | | | 118 | | | (29 | ) |
Corporate | | | 1,300 | | | — | | | — | |
| | | | | | | | | | |
| | $ | 152,069 | | $ | 389 | | $ | (63 | ) |
| | | | | | | | | | |
(Continued)
64
THE BANK OF KENTUCKY FINANCIAL CORPORATION
NOTES TO CONSOLIDATED FINANCIAL STATEMENTS
December 31, 2008, 2007 and 2006
(Dollar amounts in thousands, except share and per share amounts)
NOTE 2 - SECURITIES(Continued)
The carrying amount, unrecognized gains and losses, and fair value of securities held to maturity were as follows:
| | | | | | | | | | | | | |
Held-to-Maturity | | Carrying
Amount | | Gross
Unrecognized
Gains | | Gross
Unrecognized
Losses | | | Fair
Value |
2008 | | | | | | | | | | | | | |
Municipal and other obligations | | $ | 33,725 | | $ | 45 | | $ | (354 | ) | | $ | 33,416 |
| | | | | | | | | | | | | |
2007 | | | | | | | | | | | | | |
Municipal and other obligations | | $ | 16,230 | | $ | 21 | | $ | (81 | ) | | $ | 16,170 |
| | | | | | | | | | | | | |
The fair value of debt securities and carrying amount, if different, at year-end 2008 by contractual maturity were as follows. Securities not due at a single maturity date, primarily mortgage backed securities, are shown separately.
| | | | | | | | | |
| | | Available-for-Sale | | Held-to-Maturity |
| | | Fair
Value | | Carrying
Value | | Fair
Value |
Due in one year or less | | $ | 3,029 | | $ | 550 | | $ | 550 |
Due after one year through five years | | | 37,396 | | | 15,109 | | | 15,083 |
Due after five years through ten years | | | — | | | 10,886 | | | 10,603 |
Due after ten years | | | 1,245 | | | 7,180 | | | 7,180 |
Mortgage-backed | | | 43,817 | | | — | | | — |
| | | | | | | | | |
| | $ | 85,487 | | $ | 33,725 | | $ | 33,416 |
| | | | | | | | | |
There were no sales of available for sale securities in 2006, 2007 or 2008.
At December 31, 2008 and 2007, securities with a carrying value of $101,407 and $114,320 were pledged to secure public deposits and repurchase agreements.
(Continued)
65
THE BANK OF KENTUCKY FINANCIAL CORPORATION
NOTES TO CONSOLIDATED FINANCIAL STATEMENTS
December 31, 2008, 2007 and 2006
(Dollar amounts in thousands, except share and per share amounts)
NOTE 2 - SECURITIES(Continued)
Securities with unrealized losses at year-end 2008 and 2007, aggregated by investment category and length of time that individual securities have been in a continuous unrealized loss position, were as follows:
| | | | | | | | | | | | | | | | | | | | | |
| | | Less than 12 Months | | | 12 Months or More | | | Total | |
Description of Securities | | Fair
Value | | Unrealized
Loss | | | Fair
Value | | Unrealized
Loss | | | Fair
Value | | Unrealized
Loss | |
2008 | | | | | | | | | | | | | | | | | | | | | |
Mortgage-backed | | $ | 458 | | $ | (6 | ) | | $ | — | | $ | — | | | $ | 458 | | $ | (6 | ) |
Municipal & other obligations | | | 9,440 | | | (309 | ) | | | 3,371 | | | (45 | ) | | | 12,811 | | | (354 | ) |
| | | | | | | | | | | | | | | | | | | | | |
Total temporarily impaired | | $ | 9,898 | | $ | (315 | ) | | $ | 3,371 | | $ | (45 | ) | | $ | 13,269 | | $ | (360 | ) |
| | | | | | | | | | | | | | | | | | | | | |
2007 | | | | | | | | | | | | | | | | | | | | | |
U.S. Government, federal agencies and government sponsored enterprises | | $ | 4,002 | | $ | (3 | ) | | $ | 9,498 | | $ | (27 | ) | | $ | 13,500 | | $ | (30 | ) |
U.S Treasury | | | 39,995 | | | (4 | ) | | | — | | | — | | | | 39,995 | | | (4 | ) |
Mortgage-backed | | | 284 | | | (2 | ) | | | 2,282 | | | (27 | ) | | | 2,566 | | | (29 | ) |
Municipal & other obligations | | | 1,638 | | | (11 | ) | | | 6,660 | | | (70 | ) | | | 8,298 | | | (81 | ) |
| | | | | | | | | | | | | | | | | | | | | |
Total temporarily impaired | | $ | 45,919 | | $ | (20 | ) | | $ | 18,440 | | $ | (124 | ) | | $ | 64,359 | | $ | (144 | ) |
| | | | | | | | | | | | | | | | | | | | | |
Unrealized losses on these securities have not been recognized into income because the issuers’ bonds are of high credit quality (US government agencies and government sponsored enterprises and “A” rated or better Kentucky municipalities), management has the intent and ability to hold for the foreseeable future, and the decline in fair value is largely driven by interest rates. Management has the intent and ability to hold the securities until the fair values recover, which may be maturity.
(Continued)
66
THE BANK OF KENTUCKY FINANCIAL CORPORATION
NOTES TO CONSOLIDATED FINANCIAL STATEMENTS
December 31, 2008, 2007 and 2006
(Dollar amounts in thousands, except share and per share amounts)
NOTE 3 - LOANS
Year-end loans were as follows:
| | | | | | | | |
| | | 2008 | | | 2007 | |
Commercial | | $ | 175,188 | | | $ | 182,431 | |
Residential real estate | | | 239,729 | | | | 215,915 | |
Nonresidential real estate | | | 428,859 | | | | 387,234 | |
Construction | | | 150,754 | | | | 134,807 | |
Consumer | | | 17,693 | | | | 20,601 | |
Municipal obligations | | | 14,983 | | | | 9,354 | |
| | | | | | | | |
Gross loans | | | 1,027,206 | | | | 950,342 | |
Less: Deferred loan origination fees | | | (649 | ) | | | (628 | ) |
Allowance for loan losses | | | (9,910 | ) | | | (8,505 | ) |
| | | | | | | | |
Net loans | | $ | 1,016,647 | | | $ | 941,209 | |
| | | | | | | | |
Certain of the Company’s directors are loan customers of the Bank. A schedule of the aggregate activity in these loans follows:
| | | | |
| | | 2008 | |
Beginning balance | | $ | 4,428 | |
New loans and advances on lines of credit | | | 11,824 | |
Loan reductions | | | (13,300 | ) |
| | | | |
Ending balance | | $ | 2,952 | |
| | | | |
(Continued)
67
THE BANK OF KENTUCKY FINANCIAL CORPORATION
NOTES TO CONSOLIDATED FINANCIAL STATEMENTS
December 31, 2008, 2007 and 2006
(Dollar amounts in thousands, except share and per share amounts)
NOTE 4 - ALLOWANCE FOR LOAN LOSSES
Activity in the allowance for loan losses was as follows:
| | | | | | | | | | | | |
| | | 2008 | | | 2007 | | | 2006 | |
Beginning balance | | $ | 8,505 | | | $ | 6,918 | | | $ | 7,581 | |
Allowance of acquired bank | | | — | | | | 1,010 | | | | — | |
Provision charged to operations | | | 4,850 | | | | 1,575 | | | | 1,700 | |
Loans charged off | | | (3,908 | ) | | | (1,497 | ) | | | (2,444 | ) |
Recoveries | | | 463 | | | | 499 | | | | 81 | |
| | | | | | | | | | | | |
Ending balance | | $ | 9,910 | | | $ | 8,505 | | | $ | 6,918 | |
| | | | | | | | | | | | |
Nonperforming and impaired loans were as follows | | | | | | | | | | | | |
Nonaccrual loans at year end | | $ | 8,211 | | | $ | 6,389 | | | $ | 2,905 | |
Loans past due over 90 days, still accruing at year-end | | | 1,350 | | | | 2,658 | | | | 2,068 | |
Restructured loans | | | 575 | | | | — | | | | — | |
Average impaired loans during the year | | | 10,798 | | | | 8,785 | | | | 7,741 | |
Interest income recognized during impairment | | | 266 | | | | 444 | | | | 391 | |
Interest income received during impairment | | | 234 | | | | 336 | | | | 342 | |
Loans designated as impaired at year end | | | 13,956 | | | | 7,899 | | | | 6,142 | |
Allowance allocated to impaired loans at year end | | | 3,432 | | | | 2,833 | | | | 1,783 | |
There were no loans designated as impaired for which there was no allowance for loan losses allocated. Nonperforming loans includes both smaller balance homogeneous loans that are collectively evaluated for impairment and individually classified impaired loans.
NOTE 5 - PREMISES AND EQUIPMENT
Year-end premises and equipment were as follows:
| | | | | | | | |
| | | 2008 | | | 2007 | |
Land and improvements | | $ | 6,257 | | | $ | 5,779 | |
Leasehold improvements | | | 1,744 | | | | 1,733 | |
Buildings | | | 14,108 | | | | 12,567 | |
Furniture, fixtures and equipment | | | 9,245 | | | | 8,678 | |
| | | | | | | | |
Total | | | 31,354 | | | | 28,757 | |
Accumulated depreciation | | | (12,530 | ) | | | (10,993 | ) |
| | | | | | | | |
Net premises and equipment | | $ | 18,824 | | | $ | 17,764 | |
| | | | | | | | |
(Continued)
68
THE BANK OF KENTUCKY FINANCIAL CORPORATION
NOTES TO CONSOLIDATED FINANCIAL STATEMENTS
December 31, 2008, 2007 and 2006
(Dollar amounts in thousands, except share and per share amounts)
NOTE 5 - PREMISES AND EQUIPMENT(Continued)
Depreciation expense was $1,602, $1,625, and $1,486 for 2008, 2007, and 2006, respectively. Year-end premises included $520 for the Walton banking center that was relocated on December 31, 2007. This property is currently held for sale. The property’s estimated fair value exceeds its carrying value.
NOTE 6 - GOODWILL AND ACQUISITION INTANGIBLES
Goodwill
Goodwill increased by $5,342 in 2007 due to the acquisition of FNB Bancorporation Inc. in May 2007.
Acquisition Intangibles
Acquisition intangibles were as follows as of year-end:
| | | | | | | | |
| | | 2008 | | | 2007 | |
Core deposit intangibles | | $ | 4,368 | | | $ | 4,368 | |
Other customer relationship intangibles | | | 3,170 | | | | 3,170 | |
| | | | | | | | |
Total | | | 7,538 | | | | 7,538 | |
Accumulated amortization | | | (4,986 | ) | | | (3,708 | ) |
| | | | | | | | |
Net | | $ | 2,552 | | | $ | 3,830 | |
| | | | | | | | |
Aggregate amortization expense was $1,278, $1,090, and $645 for 2008, 2007 and 2006, respectively.
Estimated amortization expense for each of the next five years:
| | | |
| 2009 | | $ | 1,094 |
| 2010 | | | 675 |
| 2011 | | | 232 |
| 2012 | | | 170 |
| 2013 | | | 128 |
(Continued)
69
THE BANK OF KENTUCKY FINANCIAL CORPORATION
NOTES TO CONSOLIDATED FINANCIAL STATEMENTS
December 31, 2008, 2007 and 2006
(Dollar amounts in thousands, except share and per share amounts)
NOTE 7 - INTEREST BEARING DEPOSITS
Time deposits of $100 or more were $138,854 and $125,577 at year-end 2008 and 2007.
Scheduled maturities of time deposits are as follows:
| | | |
2009 | | $ | 302,705 |
2010 | | | 70,555 |
2011 | | | 15,878 |
2012 | | | 1,317 |
2013 | | | 853 |
| | | |
| | | $391,308 |
| | | |
Deposits from directors and their affiliates at year-end 2008 and 2007 were $11,747 and $6,272, comprising 1.10% and .59% of total deposits at those dates.
NOTE 8 - SHORT-TERM BORROWINGS
Short-term borrowings consisted of the following:
| | | | | | |
| | | 2008 | | 2007 |
Revolving line of credit | | $ | 4,400 | | $ | 2,200 |
Fed funds purchased | | | 4,716 | | | 2,770 |
Retail repurchase agreements | | | 19,037 | | | 17,819 |
| | | | | | |
| | $ | 28,153 | | $ | 22,789 |
| | | | | | |
Repurchase agreements outstanding at year-end 2008 had remaining maturities ranging from one day up to one year.
Information regarding repurchase agreements for the years ended December 31, 2008 and 2007 is presented below:
| | | | | | | | |
| | | 2008 | | | 2007 | |
Average balance during the year | | $ | 20,590 | | | $ | 16,410 | |
Maximum month end balance during the year | | | 26,179 | | | | 19,054 | |
Average rate paid during the year | | | 1.47 | % | | | 3.57 | % |
| | |
Year-end weighted average rate | | | 1.08 | % | | | 2.64 | % |
(Continued)
70
THE BANK OF KENTUCKY FINANCIAL CORPORATION
NOTES TO CONSOLIDATED FINANCIAL STATEMENTS
December 31, 2008, 2007 and 2006
(Dollar amounts in thousands, except share and per share amounts)
NOTE 8 - SHORT-TERM BORROWINGS(Continued)
The Company maintains a $10,000 revolving credit line from US Bank, which matures November 30, 2009. The credit line is secured with 100% of the voting shares of the Bank. The Company is required to obtain approval from US Bank for draws on the credit line for capital injections into the subsidiary bank, acquisitions, the purchase of any assets from the subsidiary bank or any repurchase of shares of the Company’s stock. The interest rate is 175 basis points above the 3-month LIBOR rate, which resulted in a rate of 3.43% at December 31, 2008. The balance on the line of credit was $4,400 at December 31, 2008.
NOTE 9 - NOTES PAYABLE
Notes payable consisted of the following:
| | | | | | |
| | | 2008 | | 2007 |
FHLB advances | | $ | 6,000 | | $ | 6,000 |
Subordinated debentures | | | 38,557 | | | 36,083 |
Other notes payable | | | 241 | | | 257 |
| | | | | | |
| | $ | 44,798 | | $ | 42,340 |
| | | | | | |
The FHLB advances are secured by a blanket pledge of eligible loans and securities and require monthly interest payments. The following advances were outstanding as of December 31:
| | | | | | |
| | | 2008 | | 2007 |
Convertible fixed rate advances with maturity in 2010 and an interest rate of 5.01% | | $ | 6,000 | | $ | 6,000 |
Principal payments on FHLB advances for the next four years consist of $6,000 due in 2010.
In March 2008, The Bank of Kentucky, a wholly-owned subsidiary of the Company, issued $20,000 of LIBOR plus 1.75% floating rate subordinated debenture to USB Capital Resources, Inc. The debenture may be redeemed any time after March 2013 at face value. Final maturity is March of 2018. The subordinated debentures are classified as liabilities on the balance sheet and count as Tier 2 capital for regulatory capital purposes. The proceeds of the subordinated debenture were used in part to redeem $17,000 in Trust Preferred Securities issued by The Bank of Kentucky Capital Trust I in 2002.
In May of 2007, The Bank of Kentucky Capital Trust II (“the Trust”), a trust subsidiary of the Company, issued $18,000 of LIBOR plus 1.47% floating rate obligated mandatory redeemable securities “Trust Preferred Securities” as part of a pooled offering. The Trust may redeem the
(Continued)
71
THE BANK OF KENTUCKY FINANCIAL CORPORATION
NOTES TO CONSOLIDATED FINANCIAL STATEMENTS
December 31, 2008, 2007 and 2006
(Dollar amounts in thousands, except share and per share amounts)
NOTE 9 - NOTES PAYABLE(Continued)
Trust Preferred Securities, in whole but not in part, any time after May 2012 at face value. The final maturity date is May of 2037. The Trust used the proceeds from the issuance of its Trust Preferred Securities and common securities to buy $18,557 aggregate principal amount of junior subordinated debentures issued by the Company. These debentures are the Trust’s only assets, with terms similar to the Trust Preferred Securities, and mature in 2037. The subordinated debentures are classified as liabilities on the balance sheet and count as Tier 1 capital for regulatory capital purposes, subject to certain limitations.
Other notes payable included a capitalized lease obligation.
The Bank maintains a $150,000 letter of credit from the Federal Home Loan Bank of Cincinnati. The letter is pledged to secure public funds deposit accounts and is secured by a blanket pledge of the Bank’s residential and commercial real estate loans.
NOTE 10 - EMPLOYEE BENEFITS
The Bank maintains an employee profit sharing plan covering substantially all employees. Contributions are at the discretion of the Board of Directors. Profit sharing expense totaled $294, $507, and $534 for the years ended December 31, 2008, 2007 and 2006, respectively.
In 2003, the Company adopted a benefit program for certain officers to encourage long-term retention. The program consists principally of a defined benefit component, providing each officer with payments equal to 30% of final average pay for 15 years after retirement, and a deferral component, permitting each officer the ability to defer a portion of their current compensation and earn pre-tax returns on such deferred amounts. The accrued liability under the defined benefit component was $1,771 and $1,148 at December 31, 2008 and 2007, respectively. Expense related to the program was $623 and $354 for the years ended December 31, 2008 and 2007.
NOTE 11 - STOCK-BASED COMPENSATION
Stock Option Plan
Options to buy stock are granted to directors, officers and employees under the Company’s stock option and incentive plan which provide for the issuance of up to 1,200,000 shares. The Company believes that such awards better align the interests of its employees with those of its shareholders. The specific terms of each option agreement are determined by the
(Continued)
72
THE BANK OF KENTUCKY FINANCIAL CORPORATION
NOTES TO CONSOLIDATED FINANCIAL STATEMENTS
December 31, 2008, 2007 and 2006
(Dollar amounts in thousands, except share and per share amounts)
NOTE 11 - STOCK-BASED COMPENSATION(Continued)
Compensation Committee at the date of the grant. For current options outstanding, options granted to directors vest immediately and options granted to employees generally vest evenly over a five-year period. The options lives are generally ten years for employees and five years for directors. Total compensation cost that has been charged against income for those plans was $642, $839, and $775 for 2008, 2007 and 2006, respectively. The total income tax benefit was $27, $77, and $72.
The fair value of each option award is estimated on the date of grant using a closed form option valuation (Black-Scholes) model that uses the assumptions noted in the table below. Expected volatilities are based on historical volatilities of the Company’s common stock. The risk-free interest rate for the expected term of the option is based on the U.S. Treasury yield curve in effect at the time of the grant. Expected term is estimated based upon the contractual term and vesting period of the options including consideration of historical trends segregated by employees and directors. A forfeiture rate of 13% for employees and 0% for directors is used in the model and is based on historical experience.
The fair value of options granted was determined using the following weighted-average assumptions as of grant date.
| | | | | | | | | |
| | | 2008 | | | 2007 | | | 2006 | |
Risk-free interest rate | | 3.36 | % | | 4.82 | % | | 4.46 | % |
Expected term | | 6.9 years | | | 6.5 years | | | 6.7 years | |
Expected stock price volatility | | 17.69 | % | | 21.85 | % | | 24.83 | % |
Dividend yield | | 1.83 | % | | 1.49 | % | | 1.19 | % |
A summary of the activity in the stock option plan for 2008 follows:
| | | | | | | | | | | |
| | | Shares | | | Weighted
Average
Exercise
Price | | Weighted
Average
Remaining
Contractual
Term | | Aggregate
Intrinsic
Value |
Outstanding at beginning of year | | 599,575 | | | $ | 26.54 | | | | | |
Granted | | 86,925 | | | | 22.09 | | | | | |
Exercised | | (2,700 | ) | | | 16.14 | | | | | |
Forfeited or expired | | (71,750 | ) | | | 29.54 | | | | | |
| | | | | | | | | | | |
Outstanding at end of year | | 612,050 | | | $ | 25.61 | | 4.90 | | $ | 148 |
| | | | | | | | | | | |
Exercisable at end of year | | 410,065 | | | $ | 25.76 | | 3.58 | | $ | 147 |
| | | | | | | | | | | |
(Continued)
73
THE BANK OF KENTUCKY FINANCIAL CORPORATION
NOTES TO CONSOLIDATED FINANCIAL STATEMENTS
December 31, 2008, 2007 and 2006
(Dollar amounts in thousands, except share and per share amounts)
NOTE 11 - STOCK-BASED COMPENSATION(Continued)
We believe the impact of expected forfeitures on outstanding, but not yet exercisable options to be immaterial
Information related to the stock option plan during each year follows:
| | | | | | | | | | | | |
| | | 2008 | | | 2007 | | | 2006 | |
Intrinsic value of options exercised | | $ | 27 | | | $ | 398 | | | $ | 172 | |
Cash received from option exercises | | | 44 | | | | 724 | | | | 564 | |
Tax benefit realized from option exercises | | | 7 | | | | 53 | | | | 57 | |
Weighted average fair value/share of options granted | | | 4.18 | | | | 7.38 | | | | 7.77 | |
As of December 31, 2008, there was $1,034 of total unrecognized compensation cost related to nonvested stock options granted under the plan. The cost is expected to be recognized over a weighted-average period of 1.81 years.
NOTE 12 - FEDERAL INCOME TAXES
Federal income taxes consisted of the following components:
| | | | | | | | | | | | |
| | | 2008 | | | 2007 | | | 2006 | |
Income tax/(benefit) | | | | | | | | | | | | |
Currently payable | | $ | 5,462 | | | $ | 4,948 | | | $ | 4,705 | |
Deferred | | | (446 | ) | | | (94 | ) | | | 82 | |
| | | | | | | | | | | | |
| | $ | 5,016 | | | $ | 4,854 | | | $ | 4,787 | |
| | | | | | | | | | | | |
The following is a reconciliation of income tax expense and the amount computed by applying the effective federal income tax rate of 35% to income before income taxes:
| | | | | | | | | | | | |
| | | 2008 | | | 2007 | | | 2006 | |
Statutory rate applied to income before income taxes | | $ | 5,725 | | | $ | 5,595 | | | $ | 5,334 | |
Tax exempt income | | | (334 | ) | | | (200 | ) | | | (177 | ) |
Company owned life insurance income | | | (261 | ) | | | (254 | ) | | | (238 | ) |
Low-income housing tax credit | | | (248 | ) | | | (248 | ) | | | (248 | ) |
Historic tax credit | | | (35 | ) | | | (100 | ) | | | — | |
Other | | | 169 | | | | 61 | | | | 116 | |
| | | | | | | | | | | | |
| | $ | 5,016 | | | $ | 4,854 | | | $ | 4,787 | |
| | | | | | | | | | | | |
(Continued)
74
THE BANK OF KENTUCKY FINANCIAL CORPORATION
NOTES TO CONSOLIDATED FINANCIAL STATEMENTS
December 31, 2008, 2007 and 2006
(Dollar amounts in thousands, except share and per share amounts)
NOTE 12 - FEDERAL INCOME TAXES(Continued)
Year-end deferred tax assets and liabilities were due to the following factors:
| | | | | | | | |
| | | 2008 | | | 2007 | |
Deferred tax assets from: | | | | | | | | |
Allowance for loan losses | | $ | 2,407 | | | $ | 1,851 | |
Benefit plans | | | 838 | | | | 616 | |
Premises and equipment | | | 452 | | | | 280 | |
Net operating loss carryforward | | | 4,245 | | | | 4,527 | |
Other | | | 200 | | | | 353 | |
| | | | | | | | |
| | | 8,142 | | | | 7,627 | |
Deferred tax liabilities for: | | | | | | | | |
FHLB stock dividends | | | (948 | ) | | | (879 | ) |
Acquisition intangibles | | | (1,752 | ) | | | (1,843 | ) |
Net unrealized gain on available for sale securities | | | (532 | ) | | | (124 | ) |
Other | | | (91 | ) | | | — | |
| | | | | | | | |
| | | (3,323 | ) | | | (2,846 | ) |
| | | | | | | | |
Net deferred tax asset | | $ | 4,819 | | | $ | 4,781 | |
| | | | | | | | |
At year end 2008, the Company had net operating loss carryforwards from its 2007 acquisition of approximately $12,362 which expire beginning in 2022. No valuation allowance has been established as management believes it will generate sufficient income in future years to realize the net operating loss benefits.
The Company had no unrecognized tax benefits as of January 1, 2008 and 2007 and did not recognize any increase in unrecognized benefits during 2008 or 2007 relative to any tax positions taken in 2008 and 2007. Should the accrual of any interest or penalties relative to unrecognized tax benefits be necessary, it is the Company’s policy to record such accruals in its income taxes accounts; no such accruals exist as of December 31, 2008 and 2007. The Company and its corporate subsidiary file a consolidated U.S. federal income tax return, which is subject to examination for all years after 2004.
NOTE 13 - EARNINGS PER SHARE
Earnings per share is computed based upon the weighted average number of shares outstanding during the period which were 5,621,186 for 2008, 5,753,250 for 2007 and 5,837,673 for 2006. Diluted earnings per share are computed assuming that the stock options outstanding are exercised and the proceeds used entirely to reacquire shares at the year’s average price. For 2008, 2007 and 2006, this would result in an additional 2,576, 24,452, and 33,570 shares outstanding, respectively. For 2008, 2007 and 2006, 574,100, 415,290, and 286,265 options were not considered, as they were not dilutive.
(Continued)
75
THE BANK OF KENTUCKY FINANCIAL CORPORATION
NOTES TO CONSOLIDATED FINANCIAL STATEMENTS
December 31, 2008, 2007 and 2006
(Dollar amounts in thousands, except share and per share amounts)
NOTE 14 - COMMITMENTS AND OFF BALANCE SHEET ACTIVITIES
The Bank leases branch facilities and sites and is committed under various non-cancelable lease contracts that expire at various dates through the year 2017. Most of these leases are with members of the Bank’s Board of Directors or companies they control. Expense for leased premises was $1,065, $1,022, and $967 for 2008, 2007 and 2006, respectively. Minimum lease payments at December 31, 2008 for all non-cancelable leases were as follows:
| | | |
2009 | | $ | 840 |
2010 | | | 659 |
2011 | | | 446 |
2012 | | | 392 |
2013 | | | 257 |
Thereafter | | | 342 |
| | | |
Total minimum lease payments | | $ | 2,936 |
| | | |
Some financial instruments, such as loan commitments, credit lines, letters of credit, and overdraft protection, are issued to meet customer financing needs. These are agreements to provide credit or to support the credit of others, as long as conditions established in the contract are met, and usually have expiration dates. Commitments may expire without being used. Off-balance-sheet risk to credit loss exists up to the face amount of these instruments, although material losses are not anticipated. The same credit policies are used to make such commitments as are used for loans, including obtaining collateral at exercise of the commitment.
Financial instruments with off-balance-sheet risk were as follows at year-end:
| | | | | | | | | | |
| | | 2 0 0 8 | | 2 0 0 7 |
| | | Fixed
Rate | | Variable
Rate | | Fixed
Rate | | Variable
Rate |
Commitments to make loans (at market rates) | | $ | 3,415 | | 3,885 | | $ | 3,473 | | 5,829 |
Unused lines of credit | | | — | | 236,305 | | | — | | 248,961 |
Unused letters of credit | | | — | | 49,471 | | | — | | 65,304 |
(Continued)
76
THE BANK OF KENTUCKY FINANCIAL CORPORATION
NOTES TO CONSOLIDATED FINANCIAL STATEMENTS
December 31, 2008, 2007 and 2006
(Dollar amounts in thousands, except share and per share amounts)
NOTE 14 - COMMITMENTS AND OFF BALANCE SHEET ACTIVITIES(Continued)
The loan commitments are generally extended for terms of up to 60 days and, in many cases, allow the customer to select from one of several financing options offered. For the fixed rate commitments, the interest range was 6.25% to 6.75% in 2008 and 5.65% to 7.99% in 2007.
At December 31, 2008 and 2007, the Bank was required to have $4,583 and $4,676, respectively, on deposit with the Federal Reserve or as cash on hand as reserve.
On March 3, 2005, the Bank entered into an agreement with Northern Kentucky University whereby the University granted to the Bank the naming rights for the new Northern Kentucky University Arena constructed on the campus of the University for a term commencing immediately upon execution of the agreement and expiring twenty years after the opening of the Arena. In consideration therefore, the Bank is paying $6,000 in seven equal annual installments beginning after substantial completion and opening of the Arena which occurred in September 2008. The cost of the naming rights will be amortized over the life of the contract commencing on the opening of the Arena, which took place in September 2008.
In the second quarter of 2007, the Bank and Thomas More College announced a naming rights agreement for the new athletic field being constructed on Thomas More’s campus. The Bank committed $1,000 to the project, which will be named The Bank of Kentucky Field. The cost of the naming rights will be amortized over the twenty-five year life of the agreement commencing on the opening of the field, which took place in September 2008.
(Continued)
77
THE BANK OF KENTUCKY FINANCIAL CORPORATION
NOTES TO CONSOLIDATED FINANCIAL STATEMENTS
December 31, 2008, 2007 and 2006
(Dollar amounts in thousands, except share and per share amounts)
NOTE 15 - CAPITAL REQUIREMENTS AND RESTRICTIONS ON RETAINED EARNINGS
Banks and bank holding companies are subject to regulatory capital requirements administered by federal banking agencies. Capital adequacy guidelines and, additionally for banks, prompt corrective action regulations, involve quantitative measures of assets, liabilities, and certain off-balance-sheet items calculated under regulatory accounting practices. Capital amounts and classifications are also subject to qualitative judgments by regulators. Failure to meet capital requirements can initiate regulatory action. Management believes as of December 31, 2008, the Company and Bank meet all capital adequacy requirements to which they are subject.
Prompt corrective action regulations provide five classifications: well capitalized, adequately capitalized, undercapitalized, significantly undercapitalized, and critically undercapitalized, although these terms are not used to represent overall financial condition. If adequately capitalized, regulatory approval is required to accept brokered deposits. If undercapitalized, capital distributions are limited, as is asset growth and expansion, and capital restoration plans are required. At year-end 2008 and 2007, the most recent regulatory notifications categorized the Bank as “well capitalized” under the regulatory framework for prompt corrective action. There have been no subsequent conditions or events that management believes have changed the institution's category.
(Continued)
78
THE BANK OF KENTUCKY FINANCIAL CORPORATION
NOTES TO CONSOLIDATED FINANCIAL STATEMENTS
December 31, 2008, 2007 and 2006
(Dollar amounts in thousands, except share and per share amounts)
NOTE 15 - CAPITAL REQUIREMENTS AND RESTRICTIONS ON RETAINED EARNINGS(Continued)
The consolidated and Bank’s capital amounts and ratios, at December 31, 2008 and 2007 are presented below:
| | | | | | | | | | | | | | | | | |
| | | Actual | | | For Capital
Adequacy Purposes | | | To Be Well
Capitalized Under
Prompt Corrective
Action Provisions | |
| | | Amount | | Ratio | | | Amount | | Ratio | | | Amount | | Ratio | |
2008 | | | | | | | | | | | | | | | | | |
Total Capital to risk weighted assets | | | | | | | | | | | | | | | | | |
Consolidated | | $ | 126,583 | | 10.73 | % | | $ | 94,384 | | 8.00 | % | | N/A | | N/A | |
Bank | | | 130,122 | | 11.04 | % | | | 94,273 | | 8.00 | % | | 117,841 | | 10.00 | % |
Tier 1 (Core) Capital to risk weighted assets | | | | | | | | | | | | | | | | | |
Consolidated | | $ | 96,673 | | 8.19 | % | | $ | 47,192 | | 4.00 | % | | N/A | | N/A | |
Bank | | | 100,212 | | 8.50 | % | | | 47,136 | | 4.00 | % | | 70,705 | | 6.00 | % |
Tier 1 (Core) Capital to average assets | | | | | | | | | | | | | | | | | |
Consolidated | | $ | 96,673 | | 7.96 | % | | $ | 48,575 | | 4.00 | % | | N/A | | N/A | |
Bank | | | 100,212 | | 8.29 | % | | | 48,343 | | 4.00 | % | | 60,429 | | 5.00 | % |
| | | |
| | | Actual | | | For Capital
Adequacy Purposes | | | To Be Well
Capitalized Under
Prompt Corrective
Action Provisions | |
| | | Amount | | Ratio | | | Amount | | Ratio | | | Amount | | Ratio | |
2007 | | | | | | | | | | | | | | | | | |
Total Capital to risk weighted assets | | | | | | | | | | | | | | | | | |
Consolidated | | $ | 113,390 | | 10.12 | % | | $ | 89,616 | | 8.00 | % | | N/A | | N/A | |
Bank | | | 114,931 | | 10.28 | % | | | 89,463 | | 8.00 | % | | 111,828 | | 10.00 | % |
Tier 1 (Core) Capital to risk weighted assets | | | | | | | | | | | | | | | | | |
Consolidated | | $ | 93,385 | | 8.34 | % | | $ | 44,808 | | 4.00 | % | | N/A | | N/A | |
Bank | | | 106,426 | | 9.52 | % | | | 44,731 | | 4.00 | % | | 67,097 | | 6.00 | % |
Tier 1 (Core) Capital to average assets | | | | | | | | | | | | | | | | | |
Consolidated | | $ | 93,385 | | 7.91 | % | | $ | 47,215 | | 4.00 | % | | N/A | | N/A | |
Bank | | | 106,426 | | 9.03 | % | | | 47,139 | | 4.00 | % | | 58,923 | | 5.00 | % |
The Company’s principal source of funds for dividend payments is dividends received from the Bank. Banking regulations limit the amount of dividends that may be paid without prior approval of regulatory agencies. Under these regulations, the amount of dividends that may be paid in any calendar year is limited to the current year’s net profits, combined with the retained net profits of the preceding two years, subject to the capital requirements described above.
(Continued)
79
THE BANK OF KENTUCKY FINANCIAL CORPORATION
NOTES TO CONSOLIDATED FINANCIAL STATEMENTS
December 31, 2008, 2007 and 2006
(Dollar amounts in thousands, except share and per share amounts)
NOTE 15 - CAPITAL REQUIREMENTS AND RESTRICTIONS ON RETAINED EARNINGS(Continued)
During 2009, the Bank is required to obtain approval from the Kentucky department of financial institutions to declare dividends to the Company. This restriction is in place as a result of the accumulated dividends paid to the Company over the last two years was greater than the accumulated earnings of the Bank for those periods. This was a result of the $17,000 payoff of the trust preferred securities at the Company with a $20,000 subordinated debenture (as detailed in note 9) entered into at the Bank. This transaction required the Bank to declare a $17,000 dividend to payoff these securities of the Company. This transaction was approved by the appropriate regulatory agencies, and the Bank expects to receive approval from the department of financial institutions to pay dividends to the Company as before.
On December 21, 2007, the Company’s Board of Directors approved a new share repurchase program. The repurchase program began January 1, 2008 and expired on December 31, 2008. The repurchase program authorized the repurchase of up to 200,000 shares of the Company’s outstanding common shares in the over-the-counter market from time to time. At December 31, 2008 a total of 80,300 of the 200,000 shares had been repurchased.
As of January 1, 2009, the Company did not have a repurchase program in place.
On November 12, 2008, BKFC filed an application to participate in the Capital Purchase Program and on December 11, 2008, BKFC was notified that the U.S. Treasury has preliminarily approved an investment in BKFC of up to $34,000 in new capital under the Capital Purchase Program. The U.S. Treasury funded this $34,000 in new capital on February 13, 2009. By participating in the Capital Purchase Program, BKFC sold senior preferred shares on standardized terms to the U.S. Treasury. Although BKFC is currently well-capitalized under regulatory guidelines, the Board of Directors believed it was advisable to take advantage of the Capital Purchase Program to raise additional capital to ensure that during these uncertain times, BKFC is well-positioned to support its existing operations as well as anticipated future growth.
When this investment is consummated, the U.S. Treasury will purchase from BKFC cumulative perpetual preferred stock, with a liquidation preference of $1,000 per share (the “Senior Preferred Shares”). The Senior Preferred Shares would constitute Tier 1 capital and would rank senior to BKFC’s common stock. The Senior Preferred Shares would pay cumulative dividends at a rate of 5% per annum for the first five years and will reset to a rate of 9% per annum after year five. Dividends would be payable quarterly in arrears. Financial institutions participating in the Capital Purchase Program must also issue warrants (the “Warrants”) to the U.S. Treasury to purchase a number of common shares having a market price equal to 15% of the aggregate amount of the Senior Preferred Shares purchased by the U.S. Treasury. A total of 274,784 shares of common stock underlying the Warrants would be issued upon exercise of the Warrants, with an exercise price of $18.56 per share which is the 20-day trailing average price from December 11, 2008, the date upon which BKFC received preliminary approval from the
(Continued)
80
THE BANK OF KENTUCKY FINANCIAL CORPORATION
NOTES TO CONSOLIDATED FINANCIAL STATEMENTS
December 31, 2008, 2007 and 2006
(Dollar amounts in thousands, except share and per share amounts)
NOTE 15 - CAPITAL REQUIREMENTS AND RESTRICTIONS ON RETAINED EARNINGS(Continued)
U.S. Treasury. The Warrants will have a term of 10 years and the U.S. Treasury will agree not to exercise voting power with respect to any shares of common stock of BKFC issued to it upon exercise of the Warrants. Holders of BKFC’s common stock will not have preemptive rights with respect to any common stock which may be delivered upon exercise of the Warrants. Unless the Senior Preferred Shares have been transferred or redeemed in whole, until the third anniversary of the U.S. Treasury’s investment, any increase in common stock dividends would be prohibited without the prior approval of the U.S. Treasury. In addition, unless the Senior Preferred Shares have been transferred or redeemed in whole, until the third anniversary of the U.S. Treasury’s investment, the U.S. Treasury’s consent would be required for any share repurchases other than repurchases of the Senior Preferred Shares and repurchases of junior preferred stock or common stock in connection with any benefit plan in the ordinary course of business and consistent with past practice.
As part of the Capital Purchase Program, any increase in the dividend level from the September 2008 semi-annual payment of $.28 per share must be approved by the Treasury department.
NOTE 16 - DISCLOSURES ABOUT FAIR VALUE
Disclosures About Fair Value of Assets and Liabilities:
SFAS 157 establishes a fair value hierarchy which requires an entity to maximize the use of observable inputs and minimize the use of unobservable inputs when measuring fair value. The standard describes three levels of inputs that may be used to measure fair value:
Level 1: Quoted prices (unadjusted) for identical assets or liabilities in active markets that the entity has the ability to access as of the measurement date.
Level 2: Significant other observable inputs other than Level 1 prices such as quoted prices for similar assets or liabilities; quoted prices in markets that are not active; or other inputs that are observable or can be corroborated by observable market data.
Level 3: Significant unobservable inputs that reflect a reporting entity’s own assumptions about the assumptions that market participants would use in pricing an asset or liability.
(Continued)
81
THE BANK OF KENTUCKY FINANCIAL CORPORATION
NOTES TO CONSOLIDATED FINANCIAL STATEMENTS
December 31, 2008, 2007 and 2006
(Dollar amounts in thousands, except share and per share amounts)
NOTE 16 - DISCLOSURES ABOUT FAIR VALUE(Continued)
The fair values of securities available for sale are determined by matrix pricing, which is a mathematical technique widely used to in the industry to value debt securities without relying exclusively on quoted prices for the specific securities but rather by relying on the securities’ relationship to other benchmark quoted securities (Level 2). One corporate security is valued at book value because there is no market activity for this issue. Book value is used for this particular corporate security as a result of its current credit and interest rate characteristics (Level 3). The credit quality of the security is reviewed periodically and shows no deterioration since the security was purchased. The interest rate is variable, so changes in the rate environment are reflected in the actual interest received, and the spreads on associated with like kind securities, in the current market, are in line with the spread on this security. Assets and liabilities measured at fair value on a recurring and non-recurring basis as of December 31, 2008 are listed below.
Assets and Liabilities Measured on a Recurring Basis
(Dollars in thousands)
Assets and liabilities measured at fair value on a recurring basis are summarized below:
| | | | | | | | | | | | |
| | | | | Fair Value Measurements at December 31, 2008 Using |
| | | December 31,
2008 | | Quoted Prices in
Active Markets
for Identical
Assets
(Level 1) | | Significant
Other
Observable
Inputs (Level 2) | | Significant
Unobservable
Inputs
(Level 3) |
Assets: | | | | | | | | | | | | |
Available for sale securities | | $ | 85,487 | | $ | — | | $ | 84,242 | | $ | 1,245 |
There were no gains or losses for assets measured at fair value on a recurring basis using significant unobservable inputs (Level 3) for the year ended December 31, 2008.
There were no changes in unrealized gains and losses recorded in earnings for the year ended December 31, 2008 for Level 3 assets and liabilities that are still held at December 31, 2008.
(Continued)
82
THE BANK OF KENTUCKY FINANCIAL CORPORATION
NOTES TO CONSOLIDATED FINANCIAL STATEMENTS
December 31, 2008, 2007 and 2006
(Dollar amounts in thousands, except share and per share amounts)
NOTE 16 - DISCLOSURES ABOUT FAIR VALUE(Continued)
Assets and Liabilities Measured on a Non-Recurring Basis
(Dollars in thousands)
Assets and liabilities measured at fair value on a non-recurring basis are summarized below:
| | | | | | | | | | | | |
| | | | | Fair Value Measurements at December 31, 2008 Using |
| | | December 31,
2008 | | Quoted Prices
in Active
Markets for
Identical Assets
(Level 1) | | Significant
Other
Observable
Inputs
(Level 2) | | Significant
Unobservable
Inputs
(Level 3) |
Assets: | | | | | | | | | | | | |
Impaired loans | | $ | 10,524 | | $ | — | | $ | 4,064 | | $ | 6,460 |
Impaired loans, which are measured for impairment using the fair value of the collateral for collateral dependent loans, had a gross carrying amount of $13,956, with a valuation allowance of $3,432, resulting in an additional provision for loan losses of $1,931 for 2008.
Values for collateral dependent loans are generally based on appraisals obtained from licensed real estate appraisers and in certain circumstances consideration of offers obtained to purchase properties prior to foreclosure or other factors management deems relevant to arrive at a representative fair value. Appraisals for commercial real estate generally use three methods to derive value: cost, sales or market comparison and income approach. The cost method bases value on the cost to replace the current property. Values using the market comparison approach evaluates the sales price of similar properties in the same market area. The income approach considers net operating income generated by the property and an investor’s required return. The final fair value is based on a reconciliation of these three approaches. The loans classified as level 2 had current and viable appraisals, while loans classified as level 3 had older appraisal and required the use of other unobservable inputs.
(Continued)
83
THE BANK OF KENTUCKY FINANCIAL CORPORATION
NOTES TO CONSOLIDATED FINANCIAL STATEMENTS
December 31, 2008, 2007 and 2006
(Dollar amounts in thousands, except share and per share amounts)
Financial instruments at year-end were as follows at December 31:
| | | | | | | | | | | | | | | | |
| | | 2 0 0 8 | | | 2 0 0 7 | |
| | | Carrying
Value | | | Fair
Value | | | Carrying
Value | | | Fair
Value | |
Financial assets | | | | | | | | | | | | | | | | |
Cash and cash equivalents | | $ | 38,656 | | | $ | 38,656 | | | $ | 38,876 | | | $ | 38,876 | |
Interest-bearing deposits with banks | | | 100 | | | | 100 | | | | 100 | | | | 100 | |
Available-for-sale securities | | | 85,487 | | | | 85,487 | | | | 152,069 | | | | 152,069 | |
Held-to-maturity securities | | | 33,725 | | | | 33,416 | | | | 16,230 | | | | 16,170 | |
Loans held for sale | | | 2,625 | | | | 2,625 | | | | 2,673 | | | | 2,713 | |
Loans (net) | | | 1,016,647 | | | | 991,013 | | | | 941,209 | | | | 945,838 | |
Federal Home Loan Bank stock | | | 4,959 | | | | 4,959 | | | | 4,766 | | | | 4,766 | |
Accrued interest receivable | | | 4,317 | | | | 4,317 | | | | 5,211 | | | | 5,211 | |
| | | | |
Financial liabilities | | | | | | | | | | | | | | | | |
Deposits | | $ | (1,071,153 | ) | | $ | (1,071,915 | ) | | $ | (1,062,079 | ) | | $ | (1,064,194 | ) |
Short-term borrowings | | | (28,153 | ) | | | (28,153 | ) | | | (22,789 | ) | | | (22,789 | ) |
Notes payable | | | (44,798 | ) | | | (36,777 | ) | | | (42,340 | ) | | | (42,542 | ) |
Accrued interest payable | | | (4,757 | ) | | | (4,757 | ) | | | (6,908 | ) | | | (6,908 | ) |
Standby letters of credit | | | (185 | ) | | | (185 | ) | | | (313 | ) | | | (313 | ) |
The estimated fair value approximates carrying amount for all items except those described below. Estimated fair value for securities is based on quoted market values for the individual securities or for equivalent securities with the exception of one security priced at book value given lack of market activity and its current credit and interest rate characteristics. It is not practicable to determine the fair value of FHLB stock to restrictions placed on its transferability. Estimated fair value of loans held for sale is based on market quotes. Estimated fair value for loans is based on the rates charged at year-end for new loans with similar maturities, applied until the loan is assumed to reprice or be paid. Estimated fair value for time deposits is based on the rates paid at year-end for new deposits, applied until maturity. Estimated fair value of debt is based on current rates for similar financing. Estimated fair value for commitments to make loans and unused lines of credit are considered nominal.
(Continued)
84
THE BANK OF KENTUCKY FINANCIAL CORPORATION
NOTES TO CONSOLIDATED FINANCIAL STATEMENTS
December 31, 2008, 2007 and 2006
(Dollar amounts in thousands, except share and per share amounts)
NOTE 17 - PARENT COMPANY FINANCIAL STATEMENTS
Presented below are condensed balance sheets and the related statements of income and cash flows for the parent company:
CONDENSED BALANCE SHEETS
December 31, 2008 and 2007
| | | | | | |
| | | 2008 | | 2007 |
Assets | | | | | | |
Cash | | $ | 58 | | $ | 49 |
Investment in bank subsidiary | | | 122,988 | | | 130,027 |
Investment in unconsolidated trust | | | 557 | | | 1,083 |
Other assets | | | 830 | | | 835 |
| | | | | | |
| | $ | 124,433 | | $ | 131,994 |
| | | | | | |
Liabilities and shareholders’ equity | | | | | | |
Short-term borrowings | | $ | 4,400 | | $ | 2,200 |
Subordinated debentures | | | 18,557 | | | 36,083 |
Other liabilities | | | 28 | | | 226 |
| | | | | | |
Total liabilities | | | 22,985 | | | 38,509 |
| | |
Shareholders’ equity | | | 101,448 | | | 93,485 |
| | | | | | |
| | $ | 124,433 | | $ | 131,994 |
| | | | | | |
CONDENSED STATEMENTS OF INCOME
Years ended December 31, 2008, 2007 and 2006
| | | | | | | | | | | | |
| | | 2008 | | | 2007 | | | 2006 | |
Dividends from subsidiary | | $ | 21,000 | | | $ | 8,000 | | | $ | 5,900 | |
Interest expense | | | (1,494 | ) | | | (2,365 | ) | | | (1,447 | ) |
Operating expenses | | | (931 | ) | | | (1,037 | ) | | | (936 | ) |
Tax benefit | | | 637 | | | | 955 | | | | 620 | |
| | | | | | | | | | | | |
Income before equity in undistributed income of the Bank | | | 19,212 | | | | 5,553 | | | | 4,137 | |
| | | |
Equity in undistributed income (dividends in excess of earnings) of the Bank | | | (7,871 | ) | | | 5,578 | | | | 6,315 | |
| | | | | | | | | | | | |
Net income | | $ | 11,341 | | | $ | 11,131 | | | $ | 10,452 | |
| | | | | | | | | | | | |
(Continued)
85
THE BANK OF KENTUCKY FINANCIAL CORPORATION
NOTES TO CONSOLIDATED FINANCIAL STATEMENTS
December 31, 2008, 2007 and 2006
(Dollar amounts in thousands, except share and per share amounts)
NOTE 17 - PARENT COMPANY FINANCIAL STATEMENTS (Continued)
CONDENSED STATEMENTS OF CASH FLOWS
Years ended December 31, 2008, 2007 and 2006
| | | | | | | | | | | | |
| | | 2008 | | | 2007 | | | 2006 | |
Cash flows from operating activities | | | | | | | | | | | | |
Net income | | $ | 11,341 | | | $ | 11,131 | | | $ | 10,452 | |
| | | |
Adjustments to reconcile net income to net cash from operating activities | | | | | | | | | | | | |
(Equity in undistributed income)/dividends in excess of earnings | | | 7,871 | | | | (5,578 | ) | | | (6,315 | ) |
Other changes | | | 449 | | | | 849 | | | | 780 | |
| | | | | | | | | | | | |
Net cash from operating activities | | | 19,661 | | | | 6,402 | | | | 4,917 | |
| | | |
Cash flows from investing activities | | | | | | | | | | | | |
Cash paid for acquisition | | | — | | | | (20,440 | ) | | | — | |
Contribution to Bank | | | — | | | | — | | | | (1,000 | ) |
Net change in investment in unconsolidated subsidiary | | | 526 | | | | (557 | ) | | | — | |
| | | | | | | | | | | | |
Net cash from investing activities | | | 526 | | | | (20,997 | ) | | | (1,000 | ) |
| | | |
Cash flows from financing activities | | | | | | | | | | | | |
Net change in short-term borrowings | | | 2,200 | | | | 1,700 | | | | 500 | |
Proceeds from issuance of subordinated debentures | | | — | | | | 18,557 | | | | — | |
Redemption of subordinated debentures | | | (17,526 | ) | | | — | | | | — | |
Dividends paid | | | (3,038 | ) | | | (2,651 | ) | | | (2,217 | ) |
Exercise of stock options | | | 51 | | | | 777 | | | | 621 | |
Stock repurchase and retirement | | | (1,865 | ) | | | (3,943 | ) | | | (3,077 | ) |
| | | | | | | | | | | | |
Net cash from financing activities | | | (20,178 | ) | | | 14,440 | | | | (4,173 | ) |
| | | | | | | | | | | | |
Net change in cash | | | 9 | | | | (155 | ) | | | (256 | ) |
| | | |
Cash at beginning of year | | | 49 | | | | 204 | | | | 460 | |
| | | | | | | | | | | | |
Cash at end of year | | $ | 58 | | | $ | 49 | | | $ | 204 | |
| | | | | | | | | | | | |
(Continued)
86
THE BANK OF KENTUCKY FINANCIAL CORPORATION
NOTES TO CONSOLIDATED FINANCIAL STATEMENTS
December 31, 2008, 2007 and 2006
(Dollar amounts in thousands, except share and per share amounts)
NOTE 18 - OTHER COMPREHENSIVE INCOME
Other comprehensive income components and related tax effects were as follows:
| | | | | | | | | | | | |
| | | 2008 | | | 2007 | | | 2006 | |
Unrealized holding gains on available-for-sale securities | | $ | 1,240 | | | $ | 708 | | | $ | 402 | |
Reclassification adjustment for losses (gains) realized in income | | | — | | | | — | | | | — | |
| | | | | | | | | | | | |
Net unrealized gains | | | 1,240 | | | | 708 | | | | 402 | |
Tax effect | | | (408 | ) | | | (259 | ) | | | (141 | ) |
| | | | | | | | | | | | |
| | $ | 832 | | | $ | 449 | | | $ | 261 | |
| | | | | | | | | | | | |
(Continued)
87
THE BANK OF KENTUCKY FINANCIAL CORPORATION
NOTES TO CONSOLIDATED FINANCIAL STATEMENTS
December 31, 2008, 2007 and 2006
(Dollar amounts in thousands, except share and per share amounts)
NOTE 19 - SELECTED QUARTERLY DATA (Unaudited)
Presented below is a summary of the consolidated quarterly financial data for the years ended December 31, 2008 and 2007.
| | | | | | | | | | | | | | | | | | | | | |
| | | 2008 |
| | | Interest
Income | | Interest
Expense | | Net Interest
Income | | Provision for
Loan Losses | | Net
Income | | Earnings Per Share |
| | | | | | | | Basic | | Diluted |
Quarter ended | | | | | | | | | | | | | | | | | | | | | |
March 31 | | $ | 18,510 | | $ | 8,903 | | $ | 9,607 | | $ | 800 | | $ | 2,504 | | $ | .44 | | $ | .44 |
June 30 | | | 17,041 | | | 6,924 | | | 10,117 | | | 1,600 | | | 2,627 | | | .47 | | | .47 |
September 30 | | | 16,863 | | | 6,319 | | | 10,544 | | | 775 | | | 3,419 | | | .61 | | | .61 |
December 31 | | | 16,268 | | | 5,874 | | | 10,394 | | | 1,675 | | | 2,791 | | | .50 | | | .50 |
| | | | | | | | | | | | | | | | | | | | | |
| | | 2007 |
| | | Interest
Income | | Interest
Expense | | Net Interest
Income | | Provision for
Loan Losses | | Net
Income | | Earnings Per Share |
| | | | | | | | Basic | | Diluted |
Quarter ended | | | | | | | | | | | | | | | | | | | | | |
March 31 | | $ | 17,525 | | $ | 8,758 | | $ | 8,767 | | $ | 650 | | $ | 2,157 | | $ | .37 | | $ | .37 |
June 30 | | | 18,414 | | | 9,320 | | | 9,094 | | | 300 | | | 2,848 | | | .49 | | | .49 |
September 30 | | | 19,811 | | | 10,130 | | | 9,681 | | | 100 | | | 3,041 | | | .53 | | | .53 |
December 31 | | | 19,963 | | | 10,269 | | | 9,694 | | | 525 | | | 3,085 | | | .54 | | | .54 |
(Continued)
88
| Item 9. | Changes in and Disagreements with Accountants on Accounting and Financial Disclosure |
None.
| Item 9A. | Controls and Procedures |
Disclosure Controls and Procedures
Disclosure controls and procedures are BKFC’s controls and other procedures that are designed to ensure that information required to be disclosed by BKFC in the reports that we file or submit under the Exchange Act is recorded, processed, summarized, and reported, within the time periods specified in the SEC’s rules and forms. Disclosure controls and procedures include, without limitation, controls and procedures designed to ensure that information required to be disclosed by us in the reports that we file under the Exchange Act is accumulated and communicated to our management, including our chief executive officer and chief financial officer, as appropriate to allow timely decisions regarding required disclosure. Under the supervision, and with the participation of our management, including our chief executive officer and chief financial officer, we have evaluated the effectiveness of the design and operation of our disclosure controls and procedures as of December 31, 2008. Based upon this evaluation, our chief executive officer and chief financial officer have concluded that these controls and procedures are adequate to ensure that information requiring disclosure is communicated to management in a timely manner and reported within the timeframe specified by the SEC’s rules and forms.
Changes in Internal Control Over Financial Reporting
During the fourth quarter of 2008, no change occurred in our internal control over financial reporting that materially affected, or is reasonably likely to materially affect, BKFC’s internal control over financial reporting.
89
MANAGEMENT’S REPORT ON INTERNAL CONTROL OVER FINANCIAL REPORTING
Management of The Bank of Kentucky Financial Corporation has prepared the consolidated financial statements in accordance with U.S. generally accepted accounting principles and is responsible for its accuracy. The financial statements necessarily include amounts that are based on management’s best estimates and judgments.
The Bank of Kentucky Financial Corporation’s management is responsible for establishing and maintaining adequate internal control over financial reporting, as such term is defined in Exchange Act Rules 13a-15(f). Under the supervision and with the participation of management, including The Bank of Kentucky Financial Corporation’s principal executive officer and principal financial officer, the Company conducted an evaluation of the effectiveness of internal control over financial reporting based on the framework inInternal Control – Integrated Framework issued by the Committee of Sponsoring Organizations of the Treadway Commission. Our evaluation included a review of the documentation of controls, evaluations of the design of the internal control system, and tests of the effectiveness of internal controls.
Based on The Bank of Kentucky Financial Corporation’s evaluation under the framework in Internal Control – Integrated Framework, management concluded that internal control over financial reporting was effective as of December 31, 2008. Management’s internal control over financial reporting as of December 31, 2008 has been audited by Crowe Horwath LLP, an independent registered public accounting firm, as stated in their report which is contained herein.
| | | | |
| Robert W. Zapp | | | | Martin J. Gerrety |
| President & CEO | | | | Treasurer and Assistant Secretary |
90
The Independent Registered Public Accounting Firm’s opinion on the effectiveness of internal controls over financial reporting is included in their opinion in the financial statement section of this report.
| Item 9B. | Other Information |
None.
PART III
| Item 10. | Directors, Executive Officers and Corporate Governance |
Information in response to this item is incorporated by reference from BKFC’s definitive Proxy Statement for the 2009 Annual Meeting of Shareholders.
| Item 11. | Executive Compensation |
Information in response to this item is incorporated by reference from BKFC’s definitive Proxy Statement for the 2009 Annual Meeting of Shareholders.
| Item 12. | Security Ownership of Certain Beneficial Owners and Management and Related Stockholder Matters |
Information in response to this item is incorporated by reference from BKFC’s definitive Proxy Statement for the 2009 Annual Meeting of Shareholders.
| Item 13. | Certain Relationships and Related Transactions, and Director Independence |
Information in response to this item is incorporated by reference from BKFC’s definitive Proxy Statement for the 2009 Annual Meeting of Shareholders.
Item 14. Principal Accountant Fees and Services
Information in response to this item is incorporated by reference from BKFC’s definitive Proxy Statement for the 2009 Annual Meeting of Shareholders.
91
PART IV
| Item 15. | Exhibits and Financial Statement Schedules. |
(a) Financial Statements. A list of Financial Statements included herein is set forth in the Index to Financial Statements appearing in Item 8 of this Form 10-K.
(b) Exhibits.See Index to Exhibits filed with this Annual Report on Form 10-K.
92
SIGNATURES
Pursuant to the requirements of Section 13 or 15(d) of the Securities Exchange Act of 1934, the registrant has duly caused this report to be signed on its behalf by the undersigned, thereunto duly authorized on this 13th day of March 2008.
| | |
| THE BANK OF KENTUCKY FINANCIAL CORPORATION |
| |
| By | | /s/ Robert W. Zapp |
| | Robert W. Zapp, |
| | President, Chief Executive |
| | Officer and a Director |
Pursuant to the requirements of the Securities Exchange Act of 1934, this report has been duly signed below by the following persons on behalf of the registrant and in the capacities and on the dates indicated.
| | | | |
/s/ Martin J. Gerrety | | | | /s/ Charles M. Berger* |
Martin J. Gerrety Treasurer March 13, 2009 | | | | Charles M. Berger Director March 13, 2009 |
| | |
/s/ Robert W. Zapp | | | | /s/ Rodney S. Cain* |
Robert W. Zapp President, Chief Executive Officer and Director March 13, 2009 | | | | Rodney S. Cain Director March 13, 2009 |
| | |
/s/ Mary Sue Rudicill* | | | | /s/ John F. Miracle, M.D.* |
Mary Sue Rudicill Director March 13, 2009 | | | | John F. Miracle, M.D. Director March 13, 2009 |
| | |
/s/ Harry J. Humpert* | | | | /s/ Herbert H. Works* |
Harry J. Humpert Director March 13, 2009 | | | | Herbert H. Works Director March 13, 2009 |
| | |
/s/ Barry C. Kienzle* | | | | Ruth Seligman Doering* |
Barry C. Kienzle Director March 13, 2009 | | | | Ruth Seligman Doering Director |
| | | | | | | | |
| * By | | /s/ Martin J. Gerrety | | | | | | |
| | Martin J. Gerrety Attorney-in-fact for the persons indicated above with an * | | | | | | |
93
INDEX TO EXHIBITS
| | |
Exhibit
Number | | Description |
2.1 | | Purchase and Assumption Agreement, by and between The Bank of Kentucky, Inc., as buyer, and Peoples Bank of Northern Kentucky, Inc., as seller, and Peoples Bancorporation of Northern Kentucky, Inc., dated as of September 24, 2002(1) |
| |
3.1 | | Articles of Incorporation of The Bank of Kentucky Financial Corporation, including all amendments through February 12, 2009 |
| |
3.2 | | Second Amended and Restated By-laws of The Bank of Kentucky Financial Corporation(2) |
| |
4.1 | | Warrant to Purchase up to 274,784 Shares of Common Stock of The Bank of Kentucky Financial Corporation(3) |
| |
4.2 | | Form of Series A Preferred Stock Certificate(3) |
| |
10.1 | | The Bank of Kentucky Financial Corporation 1997 Stock Option and Incentive Plan(4) |
| |
10.2 | | The Bank of Kentucky Financial Corporation 2007 Stock Option and Incentive Plan(5) |
| |
10.3 | | The Bank of Kentucky, Inc. Executive Deferred Contribution Plan(6) |
| |
10.4 | | The Bank of Kentucky, Inc. Executive Private Pension Plan(6) |
| |
10.5 | | The Bank of Kentucky, Inc. Group Insurance Endorsement Plan(6) |
| |
10.6 | | Letter Agreement (including the Securities Purchase Agreement—Standard Terms) between The Bank of Kentucky Financial Corporation and the United States Department of the Treasury, dated as of February 13, 2009(3) |
| |
10.7 | | Form of Waiver, executed by each of the Senior Executive Officers(3) |
| |
10.8 | | Form of Letter Agreement between The Bank of Kentucky Financial Corporation and each of the Senior Executive Officers(3) |
| |
21 | | Subsidiaries of BKFC |
| |
23 | | Consent of Crowe Horwath LLP |
| |
24 | | Power of Attorney |
| |
31.1 | | Certifications of Robert W. Zapp, Chief Executive Officer, pursuant to Section 302 of the Sarbanes-Oxley Act of 2002 |
94
| | |
31.2 | | Certifications of Martin J. Gerrety, Treasurer and Assistant Secretary, pursuant to Section 302 of the Sarbanes-Oxley Act of 2002 |
| |
32.1 | | Section 906 of Sarbanes-Oxley Act of 2002 Certification of Robert W. Zapp |
| |
32.2 | | Section 906 of Sarbanes-Oxley Act of 2002 Certification of Martin J. Gerrety |
(1) | Incorporated by reference to the Quarterly Report on Form 10-Q for the period ended September 30, 2002, filed with the SEC on November 14, 2002. |
(2) | Incorporated by reference to the Current Report on Form 8-K, filed with the SEC on September 24, 2008. |
(3) | Incorporated by reference to the Current Report on Form 8-K, filed with the SEC on February 19, 2009. |
(4) | Incorporated by reference to the Form S-8, filed with the SEC on October 2, 1997. |
(5) | Incorporated by reference to the Form 8-K, filed with the SEC on April 25, 2007. |
(6) | Incorporated by reference to the Form 10-K for the year ended December 31, 2003, filed with the SEC on March 12, 2004. |
95