Investor Contact: Linda Hurt
(817) 352-6452
Media Contact: John Ambler
(817) 867-6407
Burlington Northern Santa Fe Reports
Third Quarter 2009 Results
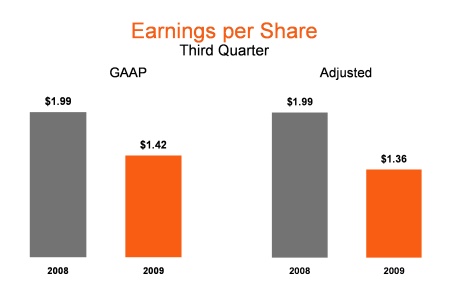
| Quarterly earnings were $1.42 per diluted share, which included a $0.06 per share impact related to a favorable coal rate case adjustment. |
| · | Compared to third-quarter 2008 earnings of $1.99 per diluted share. |
| · | Quarterly freight revenues were $3.49 billion, which included a decrease in fuel surcharges of $725 million. |
| · | Compared to third-quarter 2008 freight revenues of $4.77 billion. |
| · | Loads handled decreased 17 percent. |
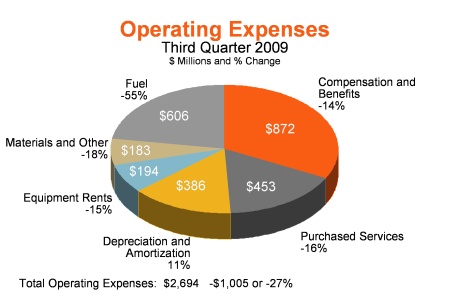
| · | Quarterly operating expenses were $2.69 billion, which included a decrease of about $550 million related to lower fuel prices. |
| · | Compared to third-quarter 2008 operating expenses of $3.70 billion. |
| · | Decreased unit volumes. |
FORT WORTH, Texas, October 22, 2009 - Burlington Northern Santa Fe Corporation (BNSF) (NYSE: BNI) today reported quarterly earnings of $1.42 per diluted share, which included a $0.06 per share impact related to a favorable coal rate case adjustment. This compared to third-quarter 2008 earnings of $1.99 per diluted share.
“During the recession, BNSF has demonstrated significant operating leverage through ongoing dedication to controlling costs and productivity improvements,” said Matthew K. Rose, BNSF Chairman, President and Chief Executive Officer. “The combination of our significant operating leverage and long-term market opportunities places BNSF in a strong position when the economy recovers.”
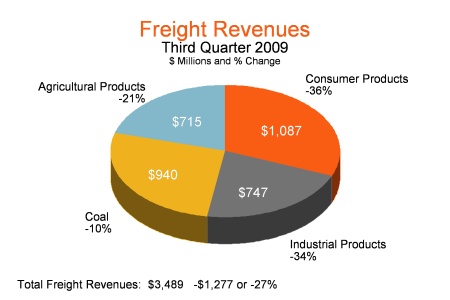
Third-quarter 2009 freight revenues decreased $1.28 billion, or 27 percent, to $3.49 billion compared with $4.77 billion in the prior year. The 27-percent decrease in revenues included a decrease in fuel surcharges of $725 million. The remaining variance was due to 17 percent lower unit volumes as a result of the economic downturn, partially offset by improved yields.
Coal revenues were down $107 million, or 10 percent, to $940 million on lower unit volumes driven by soft demand due to economic conditions and mild summer weather, partially offset by a favorable coal rate case adjustment and improved yields. Agricultural Products revenues declined $194 million, or 21 percent, to $715 million on lower unit volumes predominately driven by reduced domestic loadings and international grain shipments. Industrial Products revenues of $747 million were $377 million, or 34 percent lower than the third quarter of 2008, due primarily to lower unit volumes, driven by lower demand for construction and building products, partially offset by improved yields. Consumer Products revenues decreased $599 million, or 36 percent, to $1.09 billion, on lower international intermodal, domestic intermodal and automotive volumes due to economic conditions. Revenue was also impacted in each of the business units because of lower fuel surcharges.
Operating expenses for the third quarter of 2009 declined $1.01 billion, or 27 percent, to $2.69 billion, compared with third-quarter 2008 operating expenses of $3.70 billion. About half of the $1.01 billion reduction was due to lower fuel prices, with the remainder due to strong cost controls and decreased unit volumes.
Burlington Northern Santa Fe Corporation’s subsidiary BNSF Railway Company operates one of the largest North American rail networks, with about 32,000 route miles in 28 states and two Canadian provinces. BNSF Railway Company is among the world's top transporters of intermodal traffic, moves more grain than any other American railroad, carries the components of many of the products we depend on daily, and hauls enough low-sulfur coal to generate about ten percent of the electricity produced in the United States. BNSF Railway Company is an industry leader in Web-enabling a variety of customer transactions at www.bnsf.com.
Burlington Northern Santa Fe Corporation will present additional information on its third quarter earnings in a webcast at 4:30 p.m. Eastern Time October 22, 2009.
Financial information follows:
| Quarterly earnings were $1.42 per diluted share, which included a $0.06 per share impact related to a favorable coal rate case adjustment. · Compared to third-quarter 2008 earnings of $1.99 per diluted share. |
| Third quarter operating income for 2009 was $901 million, which included a $30 million impact related to a favorable coal rate case adjustment. · Compared to third-quarter 2008 operating income of $1.21 billion. |
| Freight revenues decreased $1.28 billion, or 27 percent, to $3.49 billion compared with the third quarter of 2008. · Loads handled decreased 17 percent. · Fuel surcharges declined by $725 million. |
| Operating expenses of $2.69 billion were $1.01 billion, or 27 percent, lower than third quarter 2008. · Strong cost controls. · Decreased unit volumes. · Lower fuel prices decreased fuel expense by about $550 million. |
Burlington Northern Santa Fe Corporation | |
| Consolidated Income Information* | |
| (Dollars in millions, except per share data) | |
| | |
| | | | |
| | | | Three Months | | | | Nine Months | |
| | | | Ended September 30, | | | | Ended September 30, | |
| | | | 2009 | | | | 2008 | | | | 2009 | | | | 2008 | |
| Operating revenues | | | | | | | | | | | | | | | | |
| Freight revenues (a) | | $ | 3,489 | | | $ | 4,766 | | | $ | 10,018 | | | $ | 13,258 | |
| Other revenues | | | 106 | | | | 140 | | | | 317 | | | | 387 | |
| Total operating revenues | | | 3,595 | | | | 4,906 | | | | 10,335 | | | | 13,645 | |
| | | | | | | | | | | | | | | | | |
| Operating expenses | | | | | | | | | | | | | | | | |
| Compensation and benefits | | | 872 | | | | 1,013 | | | | 2,564 | | | | 2,947 | |
| Fuel | | | 606 | | | | 1,349 | | | | 1,729 | | | | 3,685 | |
| Purchased services | | | 453 | | | | 537 | | | | 1,396 | | | | 1,600 | |
| Depreciation and amortization | | | 386 | | | | 349 | | | | 1,135 | | | | 1,039 | |
| Equipment rents | | | 194 | | | | 229 | | | | 591 | | | | 682 | |
| Materials and other (b) | | | 183 | | | | 222 | | | | 553 | | | | 896 | |
| Total operating expenses | | | 2,694 | | | | 3,699 | | | | 7,968 | | | | 10,849 | |
| | | | | | | | | | | | | | | | | |
| Operating income | | | 901 | | | | 1,207 | | | | 2,367 | | | | 2,796 | |
| Interest expense (c) | | | 127 | | | | 122 | | | | 462 | | | | 396 | |
| Other expense, net | | | 1 | | | | 6 | | | | 5 | | | | 11 | |
| | | | | | | | | | | | | | | | | |
| Income before income taxes | | | 773 | | | | 1,079 | | | | 1,900 | | | | 2,389 | |
| Income tax expense | | | 285 | | | | 384 | | | | 715 | | | | 889 | |
| | | | | | | | | | | | | | | | | |
| Net income | | $ | 488 | | | $ | 695 | | | $ | 1,185 | | | $ | 1,500 | |
| | | | | | | | | | | | | | | | | |
| Diluted earnings per share | | $ | 1.42 | | | $ | 1.99 | | | $ | 3.45 | | | $ | 4.28 | |
| | | | | | | | | | | | | | | | | |
| Operating ratio (d) | | | 74.2 | % | | | 74.7 | % | | | 76.4 | % | | | 78.9 | % |
| * | Certain comparative prior period amounts have been adjusted to conform to the current period presentation. | |
| | | |
| (a) | Third quarter 2009 includes a $30 million favorable adjustment to the charge taken in the first quarter 2009 related to an unfavorable coal rate case decision. The first nine months of 2009 includes a $66 million charge related to the unfavorable coal rate case decision. | |
| | | |
| (b) | Second quarter 2008 includes a $175 million increase in expense related to environmental matters in Montana. | |
| | | |
| (c) | The first nine months of 2009 includes a net $32 million loss on interest rate hedges and $8 million related to an unfavorable coal rate case decision. | |
| | | |
| (d) | Calculated as total operating expenses less other revenues divided by freight revenues. | |
| | | |
Burlington Northern Santa Fe Corporation |
| Consolidated Balance Sheet Information |
| (Dollars in millions, except per share amounts) |
| |
| |
| | | | September 30, 2009 | | | | December 31, 2008 | |
| Assets | | | | | | | | |
| Current assets: | | | | | | | | |
| Cash and cash equivalents | | $ | 1,161 | | | $ | 633 | |
| Accounts receivable, net | | | 853 | | | | 847 | |
| Materials and supplies | | | 523 | | | | 525 | |
| Current portion of deferred income taxes | | | 454 | | | | 442 | |
| Other current assets | | | 286 | | | | 218 | |
| Total current assets | | | 3,277 | | | | 2,665 | |
| | | | | | | | | |
| Property and equipment, net | | | 32,135 | | | | 30,847 | |
| | | | | | | | | |
| Other assets | | | 3,141 | | | | 2,891 | |
| | | | | | | | | |
| Total assets | | $ | 38,553 | | | $ | 36,403 | |
| | | | | | | | | |
| Liabilities and stockholders' equity | | | | | | | | |
| Current liabilities: | | | | | | | | |
| Accounts payable and other current liabilities | | $ | 2,848 | | | $ | 3,190 | |
| Long-term debt due within one year | | | 323 | | | | 456 | |
| Total current liabilities | | | 3,171 | | | | 3,646 | |
| | | | | | | | | |
| Long-term debt | | | 10,062 | | | | 9,099 | |
| Deferred income taxes | | | 9,235 | | | | 8,590 | |
| Pension and retiree health and welfare liability | | | 1,020 | | | | 1,047 | |
| Casualty and environmental liabilities | | | 963 | | | | 959 | |
| Employee separation costs | | | 55 | | | | 57 | |
| Other liabilities | | | 1,792 | | | | 1,874 | |
| Total liabilities | | | 26,298 | | | | 25,272 | |
| | | | | | | | | |
| Stockholders' equity: | | | | | | | | |
| Common stock and additional paid-in capital | | | 7,726 | | | | 7,636 | |
| Retained earnings | | | 13,541 | | | | 12,764 | |
| Treasury stock and other | | | (9,012 | ) | | | (9,269 | ) |
| Total stockholders' equity | | | 12,255 | | | | 11,131 | |
| | | | | | | | | |
| Total liabilities and stockholders' equity | | $ | 38,553 | | | $ | 36,403 | |
| | | | | | | | | |
| Book value per share | | $ | 36.00 | | | $ | 32.82 | |
| Common shares outstanding (in millions) | | | 340.4 | | | | 339.2 | |
Burlington Northern Santa Fe Corporation |
| Consolidated Cash Flow Information* |
| (in millions) |
| |
| |
| | | | Three Months | | | | Nine Months | |
| | | | Ended September 30, | | | | Ended September 30, | |
| | | | 2009 | | | | 2008 | | | | 2009 | | | | 2008 | |
| Operating activities | | | | | | | | | | | | | | | | |
| | | | | | | | | | | | | | | | | |
| Net income | | $ | 488 | | | $ | 695 | | | $ | 1,185 | | | $ | 1,500 | |
| Adjustments to reconcile net income to net cash provided by operating activities: | | | | | | | | | | | | | | | | |
| Depreciation and amortization | | | 386 | | | | 349 | | | | 1,135 | | | | 1,039 | |
| Deferred income taxes | | | 200 | | | | 116 | | | | 458 | | | | 248 | |
| Long-term casualty and environmental liabilities, net | | | (1 | ) | | | (10 | ) | | | (31 | ) | | | 181 | |
| Other, net | | | 1 | | | | 6 | | | | 16 | | | | 39 | |
| Changes in accounts receivable sales program | | | - | | | | 278 | | | | (50 | ) | | | 278 | |
| Other changes in working capital | | | 42 | | | | 213 | | | | (75 | ) | | | 18 | |
| | | | | | | | | | | | | | | | | |
| Net cash provided by operating activities | | | 1,116 | | | | 1,647 | | | | 2,638 | | | | 3,303 | |
| | | | | | | | | | | | | | | | | |
| Investing activities | | | | | | | | | | | | | | | | |
| | | | | | | | | | | | | | | | | |
| Capital expenditures excluding equipment | | | (587 | ) | | | (670 | ) | | | (1,669 | ) | | | (1,704 | ) |
| Acquisition of equipment | | | (159 | ) | | | (238 | ) | | | (615 | ) | | | (676 | ) |
| Proceeds from sale of equipment financed | | | - | | | | - | | | | 368 | | | | 190 | |
| Construction costs for facility financing obligation | | | (5 | ) | | | (21 | ) | | | (36 | ) | | | (38 | ) |
| Other, net | | | (71 | ) | | | (43 | ) | | | (167 | ) | | | (153 | ) |
| | | | | | | | | | | | | | | | | |
| Net cash used for investing activities | | | (822 | ) | | | (972 | ) | | | (2,119 | ) | | | (2,381 | ) |
| | | | | | | | | | | | | | | | | |
| Financing activities | | | | | | | | | | | | | | | | |
| | | | | | | | | | | | | | | | | |
| Net borrowings (payments) | | | 507 | | | | (370 | ) | | | 352 | | | | 215 | |
| Dividends paid | | | (136 | ) | | | (111 | ) | | | (409 | ) | | | (334 | ) |
| Purchase of BNSF common stock | | | (3 | ) | | | (236 | ) | | | (15 | ) | | | (878 | ) |
| Proceeds from stock options exercised | | | 14 | | | | 8 | | | | 26 | | | | 87 | |
| Proceeds from facility financing obligation | | | - | | | | 21 | | | | 51 | | | | 50 | |
| Other, net | | | 1 | | | | 8 | | | | 4 | | | | 84 | |
| | | | | | | | | | | | | | | | | |
| Net cash provided by (used for) financing activities | | | 383 | | | | (680 | ) | | | 9 | | | | (776 | ) |
| Increase (decrease) in cash and cash equivalents | | | 677 | | | | (5 | ) | | | 528 | | | | 146 | |
| | | | | | | | | | | | | | | | | |
| Cash and cash equivalents: | | | | | | | | | | | | | | | | |
| Beginning of period | | | 484 | | | | 481 | | | | 633 | | | | 330 | |
| End of period | | $ | 1,161 | | | $ | 476 | | | $ | 1,161 | | | $ | 476 | |
| * | Certain comparative prior period amounts have been adjusted to conform to the current period presentation. |
Burlington Northern Santa Fe Corporation | |
| Operating Statistics* | |
| | |
| | | | Three Months | | | Nine Months | |
| | | | Ended September 30, | | | Ended September 30, | |
| | | | 2009 | | | 2008 | | | 2009 | | | 2008 | |
| Revenue Statistics | | | | | | | | | | | | | |
| | | | | | | | | | | | | | |
| Cars / units (in thousands) | | | 2,137 | | | 2,590 | | | 6,306 | | | 7,585 | |
| | | | | | | | | | | | | | |
| Average revenue per car / unit (a) | | $ | 1,619 | | $ | 1,840 | | $ | 1,599 | | $ | 1,748 | |
| | | | | | | | | | | | | | |
| Average length of haul (miles) | | | 1,096 | | | 1,081 | | | 1,102 | | | 1,088 | |
| | | | | | | | | | | | | | |
| Revenue ton miles (in millions) | | | 150,675 | | | 170,134 | | | 443,526 | | | 502,443 | |
| | | | | | | | | | | | | | |
| Freight revenue / thousand GTM (a) | | $ | 13.88 | | $ | 16.64 | | $ | 13.73 | | $ | 15.63 | |
| | | | | | | | | | | | | | |
| Freight revenue / thousand RTM (a) | | $ | 22.96 | | $ | 28.01 | | $ | 22.74 | | $ | 26.39 | |
| | | | | | | | | | | | | | |
| Operating / Productivity Statistics | | | | | | | | | | | | | |
| | | | | | | | | | | | | | |
| Operating Expense | | | | | | | | | | | | | |
| Gross ton miles (in millions) | | | 249,260 | | | 286,486 | | | 734,644 | | | 848,364 | |
| | | | | | | | | | | | | | |
| Operating expense / thousand GTM (b) | | $ | 10.81 | | $ | 12.91 | | $ | 10.85 | | $ | 12.79 | |
| | | | | | | | | | | | | | |
| Thousand GTM / average employee | | | 6,672 | | | 6,970 | | | 19,411 | | | 20,698 | |
| | | | | | | | | | | | | | |
| Compensation | | | | | | | | | | | | | |
| Average employees | | | 37,359 | | | 41,103 | | | 37,847 | | | 40,987 | |
| | | | | | | | | | | | | | |
| Compensation and benefits / average employee | | $ | 23,326 | | $ | 24,646 | | $ | 67,728 | | $ | 71,893 | |
| | | | | | | | | | | | | | |
| Compensation and benefits / thousand GTM | | $ | 3.49 | | $ | 3.54 | | $ | 3.49 | | $ | 3.47 | |
| | | | | | | | | | | | | | |
| Fuel (c) | | | | | | | | | | | | | |
| GTM / gallon of fuel | | | 860 | | | 821 | | | 816 | | | 794 | |
| | | | | | | | | | | | | | |
| Gallons of fuel used (in millions) | | | 290 | | | 349 | | | 900 | | | 1,068 | |
| | | | | | | | | | | | | | |
| Average price per gallon of fuel (d) | | $ | 1.99 | | $ | 3.72 | | $ | 1.83 | | $ | 3.33 | |
| | | | | | | | | | | | | | |
| Velocity | | | | | | | | | | | | | |
| Locomotive miles per day | | | 312.1 | | | 294.7 | | | 306.9 | | | 298.0 | |
| | | | | | | | | | | | | | |
| Car miles per day | | | 229.2 | | | 205.5 | | | 229.6 | | | 203.3 | |
| * | Certain comparative prior period amounts have been adjusted to conform to the current period presentation. |
| (a) | Coal revenues on a GAAP basis were $940 million and $2,678 million for the three and nine month periods ended September 30, 2009, respectively. However, for comparative purposes the table above excludes (from coal revenues and from the computation of amounts derived therefrom) a $30 million favorable and $66 million unfavorable impact related to a coal rate case decision for the three and nine month periods ended September 30, 2009, respectively. |
| (b) | Second quarter 2008 includes a $175 million increase in expense related to environmental matters in Montana. |
| (c) | Fuel statistics are based on locomotive diesel fuel. |
| (d) | Includes handling, taxes and hedge effect. |
| Burlington Northern Santa Fe Corporation |
| Revenue Statistics by Commodity |
| |
| |
| | | | | | | | | | | | | | | | | | | | | | | | | |
| | | | | | | | | | | | | | | | | | | | | | | | | |
| | | | Three Months | | | | | | | | Nine Months | | | | | | |
| | | | Ended September 30, | | | | Percent | | | | Ended September 30, | | | | Percent | | |
| Revenues (in millions) | | | 2009 | | | | 2008 | | | | Change | | | | 2009 | | | | 2008 | | | | Change | | |
| | | | | | | | | | | | | | | | | | | | | | | | | | |
| Domestic Intermodal | | $ | 526 | | | $ | 783 | | | | (32.8 | ) % | | $ | 1,553 | | | $ | 2,149 | | | | (27.7 | ) % | |
| International Intermodal | | | 477 | | | | 776 | | | | (38.5 | ) | | | 1,383 | | | | 2,095 | | | | (34.0 | ) | |
| Automotive | | | 84 | | | | 127 | | | | (33.9 | ) | | | 240 | | | | 399 | | | | (39.8 | ) | |
| Total Consumer Products | | | 1,087 | | | | 1,686 | | | | (35.5 | ) | | | 3,176 | | | | 4,643 | | | | (31.6 | ) | |
| | | | | | | | | | | | | | | | | | | | | | | | | | |
| Coal (a) | | | 910 | | | | 1,047 | | | | (13.1 | ) | | | 2,744 | | | | 2,903 | | | | (5.5 | ) | |
| Industrial Products | | | 747 | | | | 1,124 | | | | (33.5 | ) | | | 2,152 | | | | 3,109 | | | | (30.8 | ) | |
| Agricultural Products | | | 715 | | | | 909 | | | | (21.3 | ) | | | 2,012 | | | | 2,603 | | | | (22.7 | ) | |
| Total freight revenue | | | 3,459 | | | | 4,766 | | | | (27.4 | ) | | | 10,084 | | | | 13,258 | | | | (23.9 | ) | |
| Other revenue | | | 106 | | | | 140 | | | | (24.3 | ) | | | 317 | | | | 387 | | | | (18.1 | ) | |
| Total revenues | | $ | 3,565 | | | $ | 4,906 | | | | (27.3 | ) % | | $ | 10,401 | | | $ | 13,645 | | | | (23.8 | ) % | |
| | | | | | | | | | | | | | | | | | | | | | | | | | |
Cars/units (in thousands) | | | | | | | | | | | | | | | | | | | | | | | | | |
| Domestic Intermodal | | | 463 | | | | 555 | | | | (16.6 | ) % | | | 1,381 | | | | 1,598 | | | | (13.6 | ) % | |
| International Intermodal | | | 490 | | | | 667 | | | | (26.5 | ) | | | 1,461 | | | | 1,943 | | | | (24.8 | ) | |
| Automotive | | | 25 | | | | 32 | | | | (21.9 | ) | | | 70 | | | | 114 | | | | (38.6 | ) | |
| Total Consumer Products | | | 978 | | | | 1,254 | | | | (22.0 | ) | | | 2,912 | | | | 3,655 | | | | (20.3 | ) | |
| | | | | | | | | | | | | | | | | | | | | | | | | | |
| Coal | | | 604 | | | | 645 | | | | (6.4 | ) | | | 1,820 | | | | 1,868 | | | | (2.6 | ) | |
| Industrial Products | | | 308 | | | | 420 | | | | (26.7 | ) | | | 888 | | | | 1,245 | | | | (28.7 | ) | |
| Agricultural Products | | | 247 | | | | 271 | | | | (8.9 | ) | | | 686 | | | | 817 | | | | (16.0 | ) | |
| Total cars/units | | | 2,137 | | | | 2,590 | | | | (17.5 | ) % | | | 6,306 | | | | 7,585 | | | | (16.9 | ) % | |
| | | | | | | | | | | | | | | | | | | | | | | | | | |
| Average revenue per car/unit | | | | | | | | | | | | | | | | | | | | | | | | | |
| Domestic Intermodal | | $ | 1,136 | | | $ | 1,411 | | | | (19.5 | ) % | | $ | 1,125 | | | $ | 1,345 | | | | (16.4 | ) % | |
| International Intermodal | | | 973 | | | | 1,163 | | | | (16.3 | ) | | | 947 | | | | 1,078 | | | | (12.2 | ) | |
| Automotive | | | 3,360 | | | | 3,969 | | | | (15.3 | ) | | | 3,429 | | | | 3,500 | | | | (2.0 | ) | |
| Total Consumer Products | | | 1,111 | | | | 1,344 | | | | (17.3 | ) | | | 1,091 | | | | 1,270 | | | | (14.1 | ) | |
| | | | | | | | | | | | | | | | | | | | | | | | | | |
| Coal (a) | | | 1,507 | | | | 1,623 | | | | (7.1 | ) | | | 1,508 | | | | 1,554 | | | | (3.0 | ) | |
| Industrial Products | | | 2,425 | | | | 2,676 | | | | (9.4 | ) | | | 2,423 | | | | 2,497 | | | | (3.0 | ) | |
| Agricultural Products | | | 2,895 | | | | 3,354 | | | | (13.7 | ) | | | 2,933 | | | | 3,186 | | | | (7.9 | ) | |
| Average revenue per car/unit | | $ | 1,619 | | | $ | 1,840 | | | | (12.0 | ) % | | $ | 1,599 | | | $ | 1,748 | | | | (8.5 | ) % | |
| | | | | | | | | | | | | | | | | | | | | | | | | | |
Revenue ton miles (in millions) | | | | | | | | | | | | | | | | | | | | | | | | | |
| Domestic Intermodal | | | 12,154 | | | | 14,249 | | | | (14.7 | ) % | | | 36,146 | | | | 40,951 | | | | (11.7 | ) % | |
| International Intermodal | | | 15,165 | | | | 19,556 | | | | (22.5 | ) | | | 44,824 | | | | 58,194 | | | | (23.0 | ) | |
| Automotive | | | 960 | | | | 1,231 | | | | (22.0 | ) | | | 2,693 | | | | 4,236 | | | | (36.4 | ) | |
| Total Consumer Products | | | 28,279 | | | | 35,036 | | | | (19.3 | ) | | | 83,663 | | | | 103,381 | | | | (19.1 | ) | |
| | | | | | | | | | | | | | | | | | | | | | | | | | |
| Coal | | | 71,253 | | | | 75,001 | | | | (5.0 | ) | | | 213,973 | | | | 215,570 | | | | (0.7 | ) | |
| Industrial Products | | | 22,952 | | | | 29,557 | | | | (22.3 | ) | | | 65,313 | | | | 88,056 | | | | (25.8 | ) | |
| Agricultural Products | | | 28,191 | | | | 30,540 | | | | (7.7 | ) | | | 80,577 | | | | 95,436 | | | | (15.6 | ) | |
| Total revenue ton miles | | | 150,675 | | | | 170,134 | | | | (11.4 | ) % | | | 443,526 | | | | 502,443 | | | | (11.7 | ) % | |
| | | | | | | | | | | | | | | | | | | | | | | | | | |
| Freight revenue per thousand ton miles | | | | | | | | | | | | | | | | | | | | | | | | | |
| Domestic Intermodal | | $ | 43.28 | | | $ | 54.95 | | | | (21.2 | ) % | | $ | 42.96 | | | $ | 52.48 | | | | (18.1 | ) % | |
| International Intermodal | | | 31.45 | | | | 39.68 | | | | (20.7 | ) | | | 30.85 | | | | 36.00 | | | | (14.3 | ) | |
| Automotive | | | 87.50 | | | | 103.17 | | | | (15.2 | ) | | | 89.12 | | | | 94.19 | | | | (5.4 | ) | |
| Total Consumer Products | | | 38.44 | | | | 48.12 | | | | (20.1 | ) | | | 37.96 | | | | 44.91 | | | | (15.5 | ) | |
| | | | | | | | | | | | | | | | | | | | | | | | | | |
| Coal (a) | | | 12.77 | | | | 13.96 | | | | (8.5 | ) | | | 12.82 | | | | 13.47 | | | | (4.8 | ) | |
| Industrial Products | | | 32.55 | | | | 38.03 | | | | (14.4 | ) | | | 32.95 | | | | 35.31 | | | | (6.7 | ) | |
| Agricultural Products | | | 25.36 | | | | 29.76 | | | | (14.8 | ) | | | 24.97 | | | | 27.27 | | | | (8.4 | ) | |
| Freight revenue per thousand ton miles | | $ | 22.96 | | | $ | 28.01 | | | | (18.0 | ) % | | $ | 22.74 | | | $ | 26.39 | | | | (13.8 | ) % | |
(a) Coal revenues on a GAAP basis were $940 million and $2,678 million for the three and nine month periods ended September 30, 2009, respectively. For comparative purposes, the table above excludes the impact related to the coal rate decision (see note (a) on page 7).
| Burlington Northern Santa Fe Corporation |
| Capital Expenditures* |
| |
| |
| | | | Three Months | | | | Nine Months | |
| | | | Ended September 30, | | | | Ended September 30, | |
| | | | 2009 | | | | 2008 | | | | 2009 | | | | 2008 | |
Capital expenditures excluding equipment (in millions) | | | | | | | | | | | | | | | | |
| Engineering | | | | | | | | | | | | | | | | |
| Rail | | $ | 134 | | | $ | 131 | | | $ | 382 | | | $ | 340 | |
| Ties | | | 124 | | | | 111 | | | | 355 | | | | 289 | |
| Surfacing | | | 82 | | | | 76 | | | | 202 | | | | 185 | |
| Other | | | 154 | | | | 177 | | | | 419 | | | | 406 | |
| Total engineering | | | 494 | | | | 495 | | | | 1,358 | | | | 1,220 | |
| Mechanical | | | 24 | | | | 47 | | | | 86 | | | | 116 | |
| Other | | | 30 | | | | 35 | | | | 88 | | | | 87 | |
| Total replacement capital | | | 548 | | | | 577 | | | | 1,532 | | | | 1,423 | |
| | | | | | | | | | | | | | | | | |
| Information services | | | 16 | | | | 28 | | | | 59 | | | | 71 | |
| Terminal and line expansion | | | 23 | | | | 65 | | | | 78 | | | | 210 | |
| Total capital expenditures excluding equipment | | $ | 587 | | | $ | 670 | | | $ | 1,669 | | | $ | 1,704 | |
| | | | | | | | | | | | | | | | | |
| Acquisition of equipment | | $ | 159 | | | $ | 238 | | | $ | 615 | | | $ | 676 | |
| | | | | | | | | | | | | | | | | |
| Track miles of rail laid | | | | | | | | | | | | | | | | |
| Replacement capital | | | 327 | | | | 295 | | | | 850 | | | | 699 | |
| Expansion projects | | | 5 | | | | 20 | | | | 17 | | | | 43 | |
| Total | | | 332 | | | | 315 | | | | 867 | | | | 742 | |
| | | | | | | | | | | | | | | | | |
| Cross ties inserted (thousands) | | | | | | | | | | | | | | | | |
| Replacement capital | | | 1,110 | | | | 1,008 | | | | 3,102 | | | | 2,387 | |
| Expansion projects | | | 9 | | | | 53 | | | | 22 | | | | 120 | |
| Total | | | 1,119 | | | | 1,061 | | | | 3,124 | | | | 2,507 | |
| | | | | | | | | | | | | | | | | |
| Track resurfaced (miles) | | | 5,257 | | | | 4,465 | | | | 12,623 | | | | 10,068 | |
| | |
| | |
| * | Certain comparative prior period amounts have been adjusted to conform to the current period presentation. |
9