UNITED STATES
SECURITIES AND EXCHANGE COMMISSION
WASHINGTON, D.C. 20549
FORM 10-Q
(Mark One)
| x | QUARTERLY REPORT PURSUANT TO SECTION 13 or 15(d) OF THE SECURITIES EXCHANGE ACT OF 1934 |
For the quarterly period ended September 30, 2005
OR
| ¨ | TRANSITION REPORT PURSUANT TO SECTION 13 OR 15(d) OF THE SECURITIES EXCHANGE ACT OF 1934 |
For the transition period from to
Commission file number 1-11535
BURLINGTON NORTHERN SANTA FE CORPORATION
(Exact name of registrant as specified in its charter)
| | |
| Delaware | | 41-1804964 |
(State or other jurisdiction of incorporation or organization) | | (I.R.S. Employer Identification No.) |
2650 Lou Menk Drive
Fort Worth, Texas
(Address of principal executive offices)
76131
(Zip Code)
(800) 795-2673
(Registrant’s telephone number, including area code)
Indicate by check mark whether the registrant (1) has filed all reports required to be filed by Section 13 or 15(d) of the Securities Exchange Act of 1934 during the preceding 12 months (or for such shorter period that the registrant was required to file such reports), and (2) has been subject to such filing requirements for the past 90 days. Yes x No ¨
Indicate by check mark whether the registrant is an accelerated filer (as defined in Rule 12b-2 of the Exchange Act). Yes x No ¨
Indicate by check mark whether the registrant is a shell company (as defined in Rule 12b-2 of the Exchange Act). Yes ¨ No x
Indicate the number of shares outstanding of each of the issuer’s classes of common stock, as of the latest practicable date.
| | |
Class
| | Shares Outstanding at October 17, 2005
|
| Common stock, $.01 par value | | 373,424,406 shares |
Table of Contents
2
PART I
FINANCIAL INFORMATION
Item 1. Financial Statements
BURLINGTON NORTHERN SANTA FE CORPORATION and SUBSIDIARIES
CONSOLIDATED STATEMENTS OF INCOME
(Dollars in millions, except per share data)
(Unaudited)
| | | | | | | | | | | | | | |
| | | Three Months Ended September 30,
| | | Nine Months Ended September 30,
| |
| | | 2005
| | 2004
| | | 2005
| | 2004
| |
Revenues | | $ | 3,317 | | $ | 2,793 | | | $ | 9,437 | | $ | 7,968 | |
| | |
|
| |
|
|
| |
|
| |
|
|
|
Operating expenses: | | | | | | | | | | | | | | |
Compensation and benefits | | | 900 | | | 853 | | | | 2,602 | | | 2,458 | |
Fuel | | | 499 | | | 332 | | | | 1,352 | | | 938 | |
Purchased services | | | 432 | | | 357 | | | | 1,273 | | | 1,048 | |
Depreciation and amortization | | | 271 | | | 254 | | | | 802 | | | 754 | |
Equipment rents | | | 223 | | | 210 | | | | 654 | | | 594 | |
Materials and other | | | 214 | | | 687 | | | | 632 | | | 1,158 | |
| | |
|
| |
|
|
| |
|
| |
|
|
|
Total operating expenses | | | 2,539 | | | 2,693 | | | | 7,315 | | | 6,950 | |
| | |
|
| |
|
|
| |
|
| |
|
|
|
Operating income | | | 778 | | | 100 | | | | 2,122 | | | 1,018 | |
Interest expense | | | 106 | | | 102 | | | | 327 | | | 305 | |
Other expense (income), net | | | 16 | | | (5 | ) | | | 31 | | | (3 | ) |
| | |
|
| |
|
|
| |
|
| |
|
|
|
Income before income taxes | | | 656 | | | 3 | | | | 1,764 | | | 716 | |
Income tax expense | | | 242 | | | 1 | | | | 663 | | | 272 | |
| | |
|
| |
|
|
| |
|
| |
|
|
|
Net income | | $ | 414 | | $ | 2 | | | $ | 1,101 | | $ | 444 | |
| | |
|
| |
|
|
| |
|
| |
|
|
|
Earnings per share: | | | | | | | | | | | | | | |
Basic earnings per share | | $ | 1.12 | | $ | 0.01 | | | $ | 2.96 | | $ | 1.20 | |
Diluted earnings per share | | $ | 1.09 | | $ | 0.01 | | | $ | 2.88 | | $ | 1.19 | |
Average shares (in millions): | | | | | | | | | | | | | | |
Basic | | | 370.8 | | | 369.5 | | | | 372.3 | | | 369.1 | |
Dilutive effect of stock awards | | | 9.6 | | | 7.0 | | | | 9.9 | | | 5.5 | |
| | |
|
| |
|
|
| |
|
| |
|
|
|
Diluted | | | 380.4 | | | 376.5 | | | | 382.2 | | | 374.6 | |
| | |
|
| |
|
|
| |
|
| |
|
|
|
Dividends declared per share | | $ | 0.20 | | $ | 0.17 | | | $ | 0.54 | | $ | 0.47 | |
| | |
|
| |
|
|
| |
|
| |
|
|
|
See accompanying Notes to Consolidated Financial Statements.
3
BURLINGTON NORTHERN SANTA FE CORPORATION and SUBSIDIARIES
CONSOLIDATED BALANCE SHEETS
(Dollars in millions, shares in thousands)
(Unaudited)
| | | | | | | | |
| | | September 30, 2005
| | | December 31, 2004
| |
ASSETS | | | | | | | | |
Current assets: | | | | | | | | |
Cash and cash equivalents | | $ | 274 | | | $ | 322 | |
Accounts receivable, net | | | 286 | | | | 181 | |
Materials and supplies | | | 395 | | | | 339 | |
Current portion of deferred income taxes | | | 181 | | | | 308 | |
Current portion of fuel-hedging asset | | | 493 | | | | 264 | |
Other current assets | | | 272 | | | | 201 | |
| | |
|
|
| |
|
|
|
Total current assets | | | 1,901 | | | | 1,615 | |
| | |
Property and equipment, net | | | 26,302 | | | | 25,814 | |
Other assets | | | 1,816 | | | | 1,496 | |
| | |
|
|
| |
|
|
|
Total assets | | $ | 30,019 | | | $ | 28,925 | |
| | |
|
|
| |
|
|
|
LIABILITIES AND STOCKHOLDERS’ EQUITY | | | | | | | | |
Current liabilities: | | | | | | | | |
Accounts payable and other current liabilities | | $ | 2,541 | | | $ | 2,251 | |
Long-term debt due within one year | | | 472 | | | | 465 | |
| | |
|
|
| |
|
|
|
Total current liabilities | | | 3,013 | | | | 2,716 | |
| | |
Long-term debt and commercial paper | | | 5,931 | | | | 6,051 | |
Deferred income taxes | | | 7,986 | | | | 7,820 | |
Casualty and environmental liabilities | | | 909 | | | | 941 | |
Minimum pension liability | | | 353 | | | | 353 | |
Employee separation costs | | | 108 | | | | 124 | |
Other liabilities | | | 1,651 | | | | 1,609 | |
| | |
|
|
| |
|
|
|
Total liabilities | | | 19,951 | | | | 19,614 | |
| | |
|
|
| |
|
|
|
Commitments and contingencies (see Notes 2, 4, and 5) | | | | | | | | |
Stockholders’ equity: | | | | | | | | |
Common stock, $.01 par value, 600,000 shares authorized; 525,315 shares and 517,275 shares issued, respectively | | | 5 | | | | 5 | |
Additional paid-in capital | | | 6,606 | | | | 6,299 | |
Retained earnings | | | 7,690 | | | | 6,792 | |
Treasury stock, at cost, 152,163 shares and 140,463 shares, respectively | | | (4,339 | ) | | | (3,741 | ) |
Unearned compensation | | | (27 | ) | | | (43 | ) |
Accumulated other comprehensive income (loss) | | | 133 | | | | (1 | ) |
| | |
|
|
| |
|
|
|
Total stockholders’ equity | | | 10,068 | | | | 9,311 | |
| | |
|
|
| |
|
|
|
Total liabilities and stockholders’ equity | | $ | 30,019 | | | $ | 28,925 | |
| | |
|
|
| |
|
|
|
See accompanying Notes to Consolidated Financial Statements.
4
BURLINGTON NORTHERN SANTA FE CORPORATION and SUBSIDIARIES
CONSOLIDATED STATEMENTS OF CASH FLOWS
(Dollars in millions)
(Unaudited)
| | | | | | | | |
Nine Months Ended September 30,
| | 2005
| | | 2004
| |
OPERATING ACTIVITIES | | | | | | | | |
Net income | | $ | 1,101 | | | $ | 444 | |
Adjustments to reconcile net income to net cash provided by operating activities: | | | | | | | | |
Depreciation and amortization | | | 802 | | | | 754 | |
Deferred income taxes | | | 209 | | | | 150 | |
Employee separation costs paid | | | (27 | ) | | | (29 | ) |
Long-term casualty and environmental liabilities, net | | | (40 | ) | | | 484 | |
Other, net | | | (45 | ) | | | (62 | ) |
Changes in current assets and liabilities: | | | | | | | | |
Accounts receivable, net | | | (97 | ) | | | (105 | ) |
Materials and supplies | | | (56 | ) | | | (54 | ) |
Other current assets | | | (68 | ) | | | (127 | ) |
Accounts payable and other current liabilities | | | 317 | | | | 228 | |
| | |
|
|
| |
|
|
|
Net cash provided by operating activities | | | 2,096 | | | | 1,683 | |
| | |
|
|
| |
|
|
|
INVESTING ACTIVITIES | | | | | | | | |
Capital expenditures | | | (1,245 | ) | | | (1,164 | ) |
Other, net | | | (184 | ) | | | (203 | ) |
| | |
|
|
| |
|
|
|
Net cash used for investing activities | | | (1,429 | ) | | | (1,367 | ) |
| | |
|
|
| |
|
|
|
FINANCING ACTIVITIES | | | | | | | | |
Net decrease in commercial paper and bank borrowings | | | — | | | | (1 | ) |
Payments on long-term debt | | | (139 | ) | | | (126 | ) |
Dividends paid | | | (192 | ) | | | (168 | ) |
Proceeds from stock options exercised | | | 193 | | | | 274 | |
Purchase of BNSF common stock | | | (575 | ) | | | (258 | ) |
Other, net | | | (2 | ) | | | 3 | |
| | |
|
|
| |
|
|
|
Net cash used for financing activities | | | (715 | ) | | | (276 | ) |
| | |
|
|
| |
|
|
|
(Decrease) increase in cash and cash equivalents | | | (48 | ) | | | 40 | |
Cash and cash equivalents: | | | | | | | | |
Beginning of period | | | 322 | | | | 18 | |
| | |
|
|
| |
|
|
|
End of period | | $ | 274 | | | $ | 58 | |
| | |
|
|
| |
|
|
|
SUPPLEMENTAL CASH FLOW INFORMATION | | | | | | | | |
Interest paid, net of amounts capitalized | | $ | 317 | | | $ | 327 | |
Income taxes paid, net of refunds | | $ | 391 | | | $ | 71 | |
Non-cash asset financing | | $ | 49 | | | $ | 74 | |
| | |
|
|
| |
|
|
|
See accompanying Notes to Consolidated Financial Statements.
5
BURLINGTON NORTHERN SANTA FE CORPORATION and SUBSIDIARIES
CONSOLIDATED STATEMENT OF CHANGES IN STOCKHOLDERS’ EQUITY
(Shares in thousands, dollars in millions, except per share data)
(Unaudited)
| | | | | | | | | | | | | | | | | | | | | | | | | | | | |
| | | Common Shares
| | Treasury Shares
| | | Common Stock and Paid-in Capital
| | Retained Earnings
| | | Treasury Stock
| | | Unearned Compensation
| | | Accumulated Other Comprehensive Income (Loss)
| | | Total Stockholders’ Equity
| |
Balance at December 31, 2004 | | 517,275 | | (140,463 | ) | | $ | 6,304 | | $ | 6,792 | | | $ | (3,741 | ) | | $ | (43 | ) | | $ | (1 | ) | | $ | 9,311 | |
Common stock dividends, $0.54 per share | | | | | | | | — | | | (203 | ) | | | — | | | | — | | | | — | | | | (203 | ) |
Adjustments associated with unearned compensation, restricted stock | | 662 | | (122 | ) | | | 31 | | | — | | | | — | | | | 16 | | | | — | | | | 47 | |
Exercise of stock options and related tax benefit of $60 | | 7,378 | | (434 | ) | | | 276 | | | — | | | | (23 | ) | | | — | | | | — | | | | 253 | |
Purchase of BNSF common stock (a) | | — | | (11,144 | ) | | | — | | | — | | | | (575 | ) | | | — | | | | — | | | | (575 | ) |
| | | | | | | | |
Comprehensive income: | | | | | | | | | | | | | | | | | | | | | | | | | | | | |
Net income | | | | | | | | — | | | 1,101 | | | | — | | | | — | | | | — | | | | 1,101 | |
Gain on derivative instruments and other items, net of tax expense of $83 | | | | | | | | — | | | — | | | | — | | | | — | | | | 134 | | | | 134 | |
| | | | | | | | | | | | | | | | | | | | | | | | | | |
|
|
|
Total comprehensive income | | | | | | | | | | | | | | | | | | | | | | | | | | | 1,235 | |
| | |
| |
|
| |
|
| |
|
|
| |
|
|
| |
|
|
| |
|
|
| |
|
|
|
Balance at September 30, 2005 | | 525,315 | | (152,163 | ) | | $ | 6,611 | | $ | 7,690 | | | $ | (4,339 | ) | | $ | (27 | ) | | $ | 133 | | | $ | 10,068 | |
| | |
| |
|
| |
|
| |
|
|
| |
|
|
| |
|
|
| |
|
|
| |
|
|
|
| a | Total-to-date share repurchases through September 30, 2005, were 145 million shares at an average price of $28.66 per share, leaving 5 million shares available for repurchase out of the 150 million shares authorized. |
See accompanying Notes to Consolidated Financial Statements.
6
BURLINGTON NORTHERN SANTA FE CORPORATION and SUBSIDIARIES
NOTES TO CONSOLIDATED FINANCIAL STATEMENTS (Unaudited)
1. Accounting Policies and Interim Results
The Consolidated Financial Statements should be read in conjunction with Burlington Northern Santa Fe Corporation’s Annual Report on Form 10-K for the year ended December 31, 2004, including the financial statements and notes thereto. Burlington Northern Santa Fe Corporation (BNSF) is a holding company that conducts no operating activities and owns no significant assets other than through its interests in its subsidiaries. The Consolidated Financial Statements include the accounts of BNSF and its majority-owned subsidiaries, all of which are separate legal entities (collectively, the Company). BNSF’s principal operating subsidiary is BNSF Railway Company (BNSF Railway). All significant intercompany accounts and transactions have been eliminated. BNSF was incorporated in Delaware on December 16, 1994.
The results of operations for any interim period are not necessarily indicative of the results of operations to be expected for the entire year. In the opinion of management, the unaudited financial statements reflect all adjustments (consisting of only normal recurring adjustments except as disclosed) necessary for a fair statement of BNSF’s consolidated financial position as of September 30, 2005, and the results of operations for the three and nine month periods ended September 30, 2005 and 2004.
Certain comparative prior year amounts in the Consolidated Financial Statements have been reclassified to conform to the current year presentation.
Stock-Based Compensation
The Company applies Accounting Principles Board (APB) Opinion 25,Accounting for Stock Issued to Employees, and related interpretations in accounting for its stock-based plans. In accordance with APB Opinion 25, the Company records the intrinsic value of stock-based compensation as expense. Accordingly, no compensation expense has been recognized for its fixed stock option plans as the exercise price equals the stock price on the date of grant. Stock-based compensation expense related to restricted stock has been recognized as compensation expense.
The following table illustrates the effect on net income and earnings per share if the Company had applied the fair value recognition provisions of Statement of Financial Accounting Standards (SFAS) No. 123,Accounting for Stock-Based Compensation, to stock-based employee compensation (in millions, except per share data):
| | | | | | | | | | | | | | | | |
| | | Three Months Ended September 30,
| | | Nine Months Ended September 30,
| |
| | | 2005
| | | 2004
| | | 2005
| | | 2004
| |
Net income, as reported | | $ | 414 | | | $ | 2 | | | $ | 1,101 | | | $ | 444 | |
| | | | |
Stock-based employee compensation expense included in reported net income, net of related tax effects | | | 7 | | | | 4 | | | | 17 | | | | 11 | |
| | | | |
Total stock-based compensation expense determined under fair value method for all awards, net of related tax effects | | | (11 | ) | | | (9 | ) | | | (31 | ) | | | (28 | ) |
| | |
|
|
| |
|
|
| |
|
|
| |
|
|
|
Pro forma net income | | $ | 410 | | | $ | (3 | ) | | $ | 1,087 | | | $ | 427 | |
| | |
|
|
| |
|
|
| |
|
|
| |
|
|
|
Earnings per share: | | | | | | | | | | | | | | | | |
Basic – as reported | | $ | 1.12 | | | $ | 0.01 | | | $ | 2.96 | | | $ | 1.20 | |
| | |
|
|
| |
|
|
| |
|
|
| |
|
|
|
Basic – pro forma | | $ | 1.11 | | | $ | (0.01 | ) | | $ | 2.92 | | | $ | 1.16 | |
| | |
|
|
| |
|
|
| |
|
|
| |
|
|
|
Diluted – as reported | | $ | 1.09 | | | $ | 0.01 | | | $ | 2.88 | | | $ | 1.19 | |
| | |
|
|
| |
|
|
| |
|
|
| |
|
|
|
Diluted – pro forma | | $ | 1.08 | | | $ | (0.01 | ) | | $ | 2.84 | | | $ | 1.14 | |
| | |
|
|
| |
|
|
| |
|
|
| |
|
|
|
See Note 9 of the Consolidated Financial Statements for additional information regarding developments related to SFAS No. 123 and SFAS No. 123R.
7
BURLINGTON NORTHERN SANTA FE CORPORATION and SUBSIDIARIES
NOTES TO CONSOLIDATED FINANCIAL STATEMENTS (Unaudited) – (Continued)
2. Hedging Activities
The Company uses derivatives to hedge against increases in diesel fuel prices and interest rates as well as to convert a portion of its fixed-rate long-term debt to floating-rate debt. The Company formally documents the relationship between the hedging instrument and the hedged item, as well as the risk management objective and strategy for the use of the hedging instrument. This documentation includes linking the derivatives that are designated as fair value or cash flow hedges to specific assets or liabilities on the balance sheets, commitments or forecasted transactions. The Company assesses at the time a derivative contract is entered into, and at least quarterly, whether the derivative item is effective in offsetting the changes in fair value or cash flows. Any change in fair value resulting from ineffectiveness, as defined by SFAS No. 133,Accounting for Derivative Instruments and Hedging Activities, as amended, is recognized in current period earnings. For derivative instruments that are designated and qualify as cash flow hedges, the effective portion of the gain or loss on the derivative instrument is recorded in accumulated other comprehensive income (AOCI) as a separate component of stockholders’ equity and reclassified into earnings in the period during which the hedge transaction affects earnings.
BNSF monitors its hedging positions and credit ratings of its counterparties and does not anticipate losses due to counterparty nonperformance.
Fuel
Fuel costs represented 18 percent and 13 percent of total operating expenses during the nine month periods ended September 30, 2005 and 2004, respectively. Due to the significance of diesel fuel expenses to the operations of BNSF and the historical volatility of fuel prices, the Company has entered into hedges to partially mitigate the risk of fluctuations in the price of its diesel fuel purchases. The fuel-hedges include the use of derivatives that are accounted for as cash flow hedges. The hedging is intended to protect the Company’s operating margins and overall profitability from adverse fuel price changes by entering into fuel-hedge instruments based on management’s evaluation of current and expected diesel fuel price trends. However, to the extent the Company hedges portions of its fuel purchases, it may not realize the impact of decreases in fuel prices. Conversely, to the extent the Company does not hedge portions of its fuel purchases, it may be adversely affected by increases in fuel prices. Based on fuel consumption during the first nine months of 2005 and excluding the impact of the hedges, each one-cent increase in the price of fuel would result in approximately $14 million of additional fuel expense on an annual basis.
Total Fuel-Hedging Activities
As of September 30, 2005, BNSF’s total fuel hedging activities covered 45 percent, 27 percent, and 3 percent of estimated fuel purchases for the remainder of 2005, 2006 and 2007, respectively. Hedge positions are closely monitored to ensure that they will not exceed actual fuel requirements in any period.
The amounts recorded in the Consolidated Statements of Income for fuel-hedge transactions were as follows (in millions):
| | | | | | | | | | | | | | | | |
| | | Three Months Ended September 30,
| | | Nine Months Ended September 30,
| |
| | | 2005
| | | 2004
| | | 2005
| | | 2004
| |
Hedge benefit | | $ | 161 | | | $ | 92 | | | $ | 392 | | | $ | 206 | |
Ineffective portion of unexpired hedges | | | — | | | | 3 | | | | (2 | ) | | | 6 | |
Tax effect | | | (61 | ) | | | (37 | ) | | | (149 | ) | | | (81 | ) |
| | |
|
|
| |
|
|
| |
|
|
| |
|
|
|
Hedge benefit, net of tax | | $ | 100 | | | $ | 58 | | | $ | 241 | | | $ | 131 | |
| | |
|
|
| |
|
|
| |
|
|
| |
|
|
|
8
BURLINGTON NORTHERN SANTA FE CORPORATION and SUBSIDIARIES
NOTES TO CONSOLIDATED FINANCIAL STATEMENTS (Unaudited) – (Continued)
The amounts recorded in the Consolidated Balance Sheets for fuel-hedge transactions are as follows (in millions):
| | | | | | | | |
| | | September 30, 2005
| | | December 31, 2004
| |
Short-term fuel-hedging asset | | $ | 493 | | | $ | 264 | |
Long-term fuel-hedging asset | | | 84 | | | | 105 | |
Ineffective portion of unexpired hedges | | | (2 | ) | | | (4 | ) |
Tax effect | | | (220 | ) | | | (140 | ) |
| | |
|
|
| |
|
|
|
Amount included in AOCI, net of tax | | $ | 355 | | | $ | 225 | |
| | |
|
|
| |
|
|
|
Settled fuel-hedging contracts receivable | | $ | 161 | | | $ | 131 | |
| | |
|
|
| |
|
|
|
BNSF measures the fair value of hedges from data provided by various external counterparties. To value a swap, the Company uses the forward commodity price for the period hedged. The fair values of costless collars are calculated and provided by the corresponding counterparties.
NYMEX #2 Heating Oil Hedges
As of September 30, 2005, BNSF had entered into fuel swap and costless collar agreements utilizing New York Mercantile Exchange (NYMEX) #2 heating oil (HO). The hedge prices do not include taxes, transportation costs, certain other fuel handling costs and any differences which may occur between the prices of HO and the purchase price of BNSF’s diesel fuel. Over the twelve months ended September 30, 2005, the sum of all such costs averaged approximately 12 cents per gallon.
During the first nine months of 2005, the Company converted approximately 64 million gallons of West Texas Intermediate (WTI) collars into HO swaps at an average price of $0.88 per gallon. The following tables provide fuel-hedge data based on the quarter being hedged for all HO fuel hedges outstanding as of September 30, 2005:
| | | |
2005
| | Quarter Ending December 31,
|
| |
HO Swaps | | | |
Gallons hedged (in millions) | | | 53.55 |
Average swap price (per gallon) | | $ | 0.92 |
Fair value (in millions) | | $ | 65 |
| |
HO Collars | | | |
Gallons hedged (in millions) | | | 22.05 |
Average cap price (per gallon) | | $ | 0.98 |
Average floor price (per gallon) | | $ | 0.90 |
Fair value (in millions) | | $ | 26 |
9
BURLINGTON NORTHERN SANTA FE CORPORATION and SUBSIDIARIES
NOTES TO CONSOLIDATED FINANCIAL STATEMENTS (Unaudited) – (Continued)
| | | | | | | | | | | | | | | |
| | | Quarter Ending
| | |
2006
| | March 31,
| | June 30,
| | September 30,
| | December 31,
| | Annual
|
HO Collars | | | | | | | | | | | | | | | |
Gallons hedged (in millions) | | | 15.75 | | | 22.05 | | | 28.35 | | | 31.50 | | | 97.65 |
Average cap price (per gallon) | | $ | 0.97 | | $ | 0.92 | | $ | 0.91 | | $ | 0.94 | | $ | 0.93 |
Average floor price (per gallon) | | $ | 0.90 | | $ | 0.84 | | $ | 0.84 | | $ | 0.87 | | $ | 0.86 |
Fair value (in millions) | | $ | 18 | | $ | 22 | | $ | 28 | | $ | 32 | | $ | 100 |
| | |
| | | Quarter Ending
| | |
2007
| | March 31,
| | June 30,
| | September 30,
| | December 31,
| | Annual
|
HO Collars | | | | | | | | | | | | | | | |
Gallons hedged (in millions) | | | 31.50 | | | — | | | — | | | — | | | 31.50 |
Average cap price (per gallon) | | $ | 0.93 | | $ | — | | $ | — | | $ | — | | $ | 0.93 |
Average floor price (per gallon) | | $ | 0.86 | | $ | — | | $ | — | | $ | — | | $ | 0.86 |
Fair value (in millions) | | $ | 31 | | $ | — | | $ | — | | $ | — | | $ | 31 |
WTI Crude Oil Hedges
In addition, BNSF enters into fuel swap and costless collar agreements utilizing WTI crude oil (WTI). The hedge prices do not include taxes, transportation costs, certain other fuel handling costs, and any differences which may occur between the prices of WTI and the purchase price of BNSF’s diesel fuel, including refining costs. Over the twelve months ended September 30, 2005, the sum of all such costs averaged approximately 38 cents per gallon.
No additional WTI hedges were entered into during the first nine months of 2005. However, during the first nine months of 2005, the Company converted approximately 64 million gallons of WTI collars into HO swaps as stated in the NYMEX #2 Heating Oil Hedges section. The following tables provide fuel-hedge data based on the quarter being hedged for all WTI fuel hedges outstanding as of September 30, 2005:
| | | |
2005
| | Quarter Ending
December 31,
|
WTI Swaps | | | |
Barrels hedged (in thousands) | | | 1,350 |
Equivalent gallons hedged (in millions) | | | 56.70 |
Average swap price (per barrel) | | $ | 24.54 |
Fair value (in millions) | | $ | 56 |
| |
WTI Collars | | | |
Barrels hedged (in thousands) | | | 750 |
Equivalent gallons hedged (in millions) | | | 31.50 |
Average cap price (per barrel) | | $ | 28.49 |
Average floor price (per barrel) | | $ | 24.05 |
Fair value (in millions) | | $ | 28 |
10
BURLINGTON NORTHERN SANTA FE CORPORATION and SUBSIDIARIES
NOTES TO CONSOLIDATED FINANCIAL STATEMENTS (Unaudited) – (Continued)
| | | | | | | | | | | | | | | |
| | | Quarter Ending
| | |
2006
| | March 31,
| | June 30,
| | September 30,
| | December 31,
| | Annual
|
| WTI Swaps | | | | | | | | | | | | | | | |
Barrels hedged (in thousands) | | | 1,350 | | | 675 | | | 375 | | | — | | | 2,400 |
Equivalent gallons hedged (in millions) | | | 56.70 | | | 28.35 | | | 15.75 | | | — | | | 100.80 |
Average swap price (per barrel) | | $ | 24.43 | | $ | 25.16 | | $ | 25.69 | | $ | — | | $ | 24.83 |
Fair value (in millions) | | $ | 56 | | $ | 27 | | $ | 15 | | $ | — | | $ | 98 |
| | | | | |
| WTI Collars | | | | | | | | | | | | | | | |
Barrels hedged (in thousands) | | | 1,500 | | | 1,500 | | | 825 | | | 525 | | | 4,350 |
Equivalent gallons hedged (in millions) | | | 63.00 | | | 63.00 | | | 34.65 | | | 22.05 | | | 182.70 |
Average cap price (per barrel) | | $ | 30.05 | | $ | 30.20 | | $ | 30.81 | | $ | 31.93 | | $ | 30.47 |
Average floor price (per barrel) | | $ | 25.66 | | $ | 25.79 | | $ | 26.32 | | $ | 27.42 | | $ | 26.04 |
Fair value (in millions) | | $ | 54 | | $ | 53 | | $ | 29 | | $ | 17 | | $ | 153 |
| | |
| | | Quarter Ending
| | |
2007
| | March 31,
| | June 30,
| | September 30,
| | December 31,
| | Annual
|
| WTI Collars | | | | | | | | | | | | | | | |
Barrels hedged (in thousands) | | | 150 | | | — | | | — | | | — | | | 150 |
Equivalent gallons hedged (in millions) | | | 6.30 | | | — | | | — | | | — | | | 6.30 |
Average cap price (per barrel) | | $ | 33.00 | | $ | — | | $ | — | | $ | — | | $ | 33.00 |
Average floor price (per barrel) | | $ | 29.00 | | $ | — | | $ | — | | $ | — | | $ | 29.00 |
Fair value (in millions) | | $ | 4 | | $ | — | | $ | — | | $ | — | | $ | 4 |
NYMEX #2 Heating Oil Refining Spread Hedges
During the nine months ended September 30, 2005, the Company entered into fuel swap agreements utilizing the HO refining spread (HO-WTI) to hedge the equivalent of approximately 57 million gallons of fuel with an average swap price of $11.79 per barrel. HO-WTI is the difference in price between HO and WTI; therefore, a HO-WTI swap in combination with a WTI swap is equivalent to a HO swap. The following table provides fuel hedge data based upon the quarter being hedged for all HO-WTI fuel hedges outstanding as of September 30, 2005:
| | | |
2005
| | Quarter Ending
December 31,
|
| HO-WTI Swaps | | | |
Barrels hedged (in thousands) | | | 1,350 |
Equivalent gallons hedged (in millions) | | | 56.70 |
Average swap price (per barrel) | | $ | 11.79 |
Fair value (in millions) | | $ | 16 |
Interest Rate
From time to time, the Company enters into various interest rate hedging transactions for the purpose of managing exposure to fluctuations in interest rates, establishing rates in anticipation of future debt issuances and converting a portion of its fixed-rate long-term debt to floating-rate debt. The Company uses interest rate swaps and treasury locks as part of its interest rate risk management strategy.
11
BURLINGTON NORTHERN SANTA FE CORPORATION and SUBSIDIARIES
NOTES TO CONSOLIDATED FINANCIAL STATEMENTS (Unaudited) – (Continued)
All interest rate derivative transactions outstanding are reflected in the following table:
| | | | | | | | | | | | | | | | | | | | | | | | | | | |
| | | September 30, 2005
|
| | | Maturity Date
| | | | | | |
| | | 2005
| | | 2006
| | 2007
| | | 2008
| | 2009
| | | Thereafter
| | | Total
| | | Fair Value
|
| Fair value hedges | | | | | | | | | | | | | | | | | | | | | | | | | | | |
Fixed to variable swaps (in millions) | | $ | 300 | | | — | | $ | 300 | | | — | | $ | 200 | | | $ | 250 | | | $ | 1,050 | | | $ | 9 |
Average fixed rate | | | 6.38 | % | | — | | | 7.88 | % | | — | | | 6.13 | % | | | 7.13 | % | | | 6.93 | % | | | |
Average floating rate | | | 5.33 | % | | — | | | 6.20 | % | | — | | | 4.35 | % | | | 6.74 | % | | | 5.73 | % | | | |
| | | | | | | | |
| Cash flow hedges | | | | | | | | | | | | | | | | | | | | | | | | | | | |
Forward-starting swaps (in millions) | | | — | | | — | | $ | 250 | | | — | | | — | | | | — | | | $ | 250 | | | $ | 7 |
Average swap rate | | | — | | | — | | | 4.87 | % | | — | | | — | | | | — | | | | 4.87 | % | | | |
BNSF’s measurement of the fair value of interest rate swaps and forward-starting swaps is based on estimates of the mid-market values for the transactions provided by the counterparties to these agreements.
Fair Value Interest Rate Hedges
As of September 30, 2005, the Company had entered into interest rate swaps to convert fixed-rate long-term debt to floating-rate debt. These swaps are accounted for as fair value hedges under SFAS No. 133. These fair value hedges qualify for the short-cut method of recognition; therefore, no portion of these swaps is treated as ineffective. As of both September 30, 2005 and December 31, 2004, BNSF had entered into thirteen separate swaps with an aggregate notional amount of $1,050 million, in which it pays an average floating rate, which fluctuates quarterly, based on the London Interbank Offered Rate (LIBOR).
The amounts recorded in the Consolidated Statements of Income, as a reduction of interest expense, for interest rate fair value hedge transactions were as follows (in millions):
| | | | | | | | | | | | | | | | |
| | | Three Months Ended September 30,
| | | Nine Months Ended September 30,
| |
| | | 2005
| | | 2004
| | | 2005
| | | 2004
| |
Hedge benefit | | $ | 4 | | | $ | 10 | | | $ | 15 | | | $ | 29 | |
Tax effect | | | (2 | ) | | | (4 | ) | | | (6 | ) | | | (11 | ) |
| | |
|
|
| |
|
|
| |
|
|
| |
|
|
|
Hedge benefit, net of tax | | $ | 2 | | | $ | 6 | | | $ | 9 | | | $ | 18 | |
| | |
|
|
| |
|
|
| |
|
|
| |
|
|
|
The amounts recorded in the Consolidated Balance Sheets for interest rate fair value hedge transactions, which represent the fair value of unexpired hedges, with a corresponding increase to debt or accrued interest, are as follows (in millions):
| | | | | | |
| | | September 30, 2005
| | December 31, 2004
|
Short-term interest rate hedging asset | | $ | 5 | | $ | 10 |
Long-term interest rate hedging asset | | $ | 4 | | $ | 25 |
12
BURLINGTON NORTHERN SANTA FE CORPORATION and SUBSIDIARIES
NOTES TO CONSOLIDATED FINANCIAL STATEMENTS (Unaudited) – (Continued)
Cash Flow Interest Rate Hedges
In anticipation of a future debt issuance, the Company entered into five forward starting interest rate swaps between July 8 and August 31, 2005 having an aggregate notional amount of $250 million to fix the treasury rate for a future 30-year unsecured debt issuance. The forward starting swaps have an average swap rate of 4.87 percent, which includes an average forward treasury rate of 4.41 percent and a swap spread of 0.46 percent. The forward starting date of the swaps is October 16, 2006, but the Company may terminate the swaps at any time prior to that date. The swaps must be terminated on or prior to February 28, 2007. The resulting locked in rate on the debt to be issued (excluding the credit spread and issuance fees) will be 4.87 percent minus the swap spread received by BNSF on the termination date. Any gain or loss on these hedges will be amortized to interest expense over the life of the issued debt. These transactions are accounted for as cash flow hedges.
The amounts recorded in the Consolidated Balance Sheets for interest rate cash flow hedge transactions, which represent the fair value of unexpired hedges, were as follows (in millions):
| | | | | | | |
| | | September 30, 2005
| | | December 31, 2004
|
Interest rate hedging asset | | $ | 7 | | | $ | — |
Tax effect | | | (3 | ) | | | — |
| | |
|
|
| |
|
|
Interest rate hedging asset in AOCI, net of tax | | $ | 4 | | | $ | — |
| | |
|
|
| |
|
|
3. Accounts Receivable, Net
BNSF Railway transfers most of its accounts receivable to Santa Fe Receivables Corporation (SFRC), a special purpose subsidiary. SFRC transfers an undivided interest in such receivables, with limited exceptions, to a master trust, and causes the trust to issue an undivided interest in the receivables to investors (the A/R sales program). The undivided interests in the master trust may be in the form of certificates or purchased interests.
The Company’s total capacity to sell undivided interests to investors under the A/R sales program was $700 million at September 30, 2005, which was comprised of a $350 million, 364-day accounts receivable facility and a $350 million, five-year accounts receivable facility. The Company amended these facilities on October 14, 2005, modifying their maturities to October 2006. Outstanding undivided interests held by investors under the A/R sales program were $650 million at September 30, 2005 and December 31, 2004. These receivables are derecognized by BNSF Railway in connection with the sale of undivided interests under the A/R sales program. The undivided interests were supported by $994 million and $864 million of receivables transferred by SFRC to the master trust at September 30, 2005 and December 31, 2004, respectively. When SFRC transfers these receivables to the master trust, it retains an undivided interest in the receivables sold. This retained interest is included in accounts receivable in the Company’s financial statements. SFRC’s retained interest in these receivables of $344 million and $214 million at September 30, 2005 and December 31, 2004, respectively, less an allowance for uncollectible accounts, reflected the total accounts receivable transferred by SFRC to the master trust less $650 million at September 30, 2005 and December 31, 2004, of outstanding undivided interests held by investors. Due to a relatively short collection cycle, the fair value of the undivided interest transferred to investors in the A/R sales program approximated book value, and there was no gain or loss from the transaction.
The Company retains the collection responsibility with respect to the accounts receivable. Proceeds from collections reinvested in the A/R sales program were approximately $10 billion and $8 billion for the nine months ended September 30, 2005 and 2004, respectively. No servicing asset or liability has been recorded because the fees the Company receives for servicing the receivables approximate the related costs. SFRC’s costs of the sale of receivables are included in other expense, net and were $11 million and $8 million for the nine months ended September 30, 2005 and 2004, respectively. These costs fluctuate monthly with changes in prevailing interest rates and were based on weighted average interest rates of 3.1 percent and 1.3 percent in the nine months ended September 30, 2005 and 2004, respectively. These costs include interest, discounts associated with transferring the receivables under the A/R sales program to SFRC, program fees paid to banks, incidental commercial paper issuing costs, and fees for unused commitment availability.
13
BURLINGTON NORTHERN SANTA FE CORPORATION and SUBSIDIARIES
NOTES TO CONSOLIDATED FINANCIAL STATEMENTS (Unaudited) – (Continued)
The amount of accounts receivable transferred by BNSF Railway to SFRC fluctuates based upon the availability of receivables and is directly affected by changing business volumes and credit risks, including dilution and delinquencies. BNSF Railway has historically experienced very low levels of default or dilution. If dilution or delinquency percentages were to increase by one percentage point, there would be no impact to the amount of receivables BNSF Railway could sell.
Receivables funded under the A/R sales program may not include amounts over 90 days past due or concentrations over certain limits with any one customer and certain other receivables. At September 30, 2005 and December 31, 2004, $46 million and $47 million, respectively, of accounts receivable were greater than 90 days old. The Company maintains an allowance for bill adjustments and uncollectible accounts based upon the expected collectibility of accounts receivable, including receivables transferred to the master trust. Credit losses are based on specific identification of uncollectible accounts and application of historical collection percentages by aging category. At September 30, 2005 and December 31, 2004, $47 million and $59 million, respectively, of such allowances had been recorded of which $40 million and $52 million, respectively, had been recorded as a reduction to accounts receivable, net. Additionally, at September 30, 2005 and December 31, 2004, approximately $7 million had been recorded as an allowance for bill adjustments and uncollectible accounts in accounts payable and other current liabilities because they relate to the $650 million of outstanding undivided interests held by investors. During the nine months ended September 30, 2005 and 2004, $6 million of accounts receivable were written off.
The investors in the master trust have no recourse against BNSF Railway’s other assets except for customary warranty and indemnity claims. Creditors of BNSF Railway have no recourse to the assets of the master trust or SFRC unless and until all claims of their respective creditors have been paid. The A/R sales program includes provisions that, if triggered, allow the investors participating in this program, at their option, to cancel the program. At September 30, 2005, BNSF Railway is in compliance with these provisions.
4. Debt
Commercial Paper
BNSF issues commercial paper from time to time that is supported by bank revolving credit agreements. At September 30, 2005, there are no bank borrowings against the revolving credit agreements. Outstanding commercial paper balances are considered as reducing the amount of borrowings available under these agreements. As of September 30, 2005, the Company has borrowing capacity of up to $1.2 billion under its long-term bank credit facility, which expires in June 2010. Annual facility fees are currently 0.1 percent for the facility. The rate is subject to change based upon changes in BNSF’s senior unsecured debt ratings. Borrowing rates are based on the following: (i) LIBOR plus a spread determined by BNSF’s senior unsecured debt ratings, (ii) money market rates offered at the option of the lenders, or (iii) an alternate base rate. The Company classifies commercial paper as long-term based on the final expiration date of the credit facility. BNSF must maintain compliance with certain financial covenants under its revolving credit agreements. At September 30, 2005, the Company is in compliance with these covenants.
The maturity value of commercial paper outstanding as of September 30, 2005, is $368 million, reducing the total capacity available under the revolving credit agreements to approximately $832 million. The $368 million maturity value of commercial paper was issued to a consolidated subsidiary of BNSF, which is eliminated upon consolidation.
Notes and Debentures
As of September 30, 2005, the Company has $500 million available under its shelf registration of debt securities.
14
BURLINGTON NORTHERN SANTA FE CORPORATION and SUBSIDIARIES
NOTES TO CONSOLIDATED FINANCIAL STATEMENTS (Unaudited) – (Continued)
Guarantees
Debt and other obligations of non-consolidated entities guaranteed by the Company as of September 30, 2005, are as follows (dollars in millions):
| | | | | | | | | | | | | | | | | | |
| | | Guarantees
| | | |
| | | BNSF Ownership Percentage
| | | Principal Amount Guaranteed
| | Maximum Future Payments
| | Maximum Recourse Amounta
| | Remaining Term (in years)
| | Capitalized Obligations
| |
| | | | | | |
Kinder Morgan Energy Partners, L.P. | | 0.5 | % | | $ | 190 | | $ | 190 | | $ | — | | Termination
of Ownership | | $ | — | |
Kansas City Terminal Intermodal Transportation Corporation | | 0.0 | % | | $ | 62 | | $ | 96 | | $ | 96 | | 13 | | $ | 35 | b |
Westside Intermodal Transportation Corporation | | 0.0 | % | | $ | 43 | | $ | 70 | | $ | — | | 18 | | $ | 35 | b |
The Unified Government of Wyandotte County/Kansas City, Kansas | | 0.0 | % | | $ | 14 | | $ | 22 | | $ | — | | 18 | | $ | 11 | b |
Various lessors (Residual value guarantees) | | 0.0 | % | | | N/A | | $ | 298 | | $ | 298 | | Various | | $ | 68 | c |
All other | | 0.0 | % | | $ | 9 | | $ | 10 | | $ | 4 | | Various | | $ | — | |
| a | Reflects the maximum amount the Company could recover from a third party other than the counterparty. |
| b | Reflects capitalized obligations that are recorded on the Company’s Consolidated Balance Sheet. |
| c | Reflects the FIN 45 asset and corresponding liability for the fair value of the residual value guarantees on the Company’s Consolidated Balance Sheet. |
Kinder Morgan Energy Partners, L.P.
Santa Fe Pacific Pipelines, Inc. (SFPP), an indirect, wholly owned subsidiary of BNSF, has a guarantee in connection with its remaining special limited partnership interest in SFPP, L.P., a subsidiary of Kinder Morgan Energy Partners, L.P. to be paid only upon default by the partnership. All obligations with respect to the guarantee will cease upon termination of ownership rights which would occur upon a put notice issued by BNSF or the exercise of the call rights by the general partners of SFPP, L.P.
Kansas City Terminal Intermodal Transportation Corporation
BNSF and another major railroad jointly and severally guarantee $62 million of debt of Kansas City Terminal Intermodal Transportation Corporation, the proceeds of which were used to finance construction of a double track grade separation bridge in Kansas City, Missouri, which is operated and used by Kansas City Terminal Railway Company (KCTRC). BNSF has a 25 percent ownership in KCTRC, accounts for its interest using the equity method of accounting, and will be required to fund a portion of the remaining obligation upon default by the original debtor.
Westside Intermodal Transportation Corporation and The Unified Government of
Wyandotte County/Kansas City, Kansas
BNSF has guaranteed $57 million of debt, the proceeds of which were used to finance construction of a bridge that connects BNSF Railway’s Argentine Yard in Kansas City, Kansas, with the KCTRC mainline tracks in Kansas City, Missouri. The bridge is operated by KCTRC, and payments related to BNSF’s guarantee of this obligation will only be called for upon default by the original debtor.
15
BURLINGTON NORTHERN SANTA FE CORPORATION and SUBSIDIARIES
NOTES TO CONSOLIDATED FINANCIAL STATEMENTS (Unaudited) – (Continued)
Residual value guarantees (RVG)
In the normal course of business, the Company enters into leases in which it guarantees the residual value of certain leased equipment. Some of these leases have renewal or purchase options, or both, that the Company may exercise at the end of the lease term. If the Company elects not to exercise these options it may be required to pay the lessor an amount not exceeding the RVG. The amount of any payment is contingent upon the actual residual value of the leased equipment. Some of these leases also require the lessor to pay the Company any surplus in the actual residual value of the leased equipment over the RVG. These guarantees will expire between 2005 and 2011.
The maximum future payments, as disclosed in the Guarantees table above, represent the undiscounted maximum amount that BNSF could be required to pay in the event the Company did not exercise its renewal option and the fair market value of the equipment had significantly declined. BNSF does not anticipate such a large reduction in the fair market value of the leased equipment. As of September 30, 2005, the Company has recorded a $68 million asset and corresponding liability for the fair value of the RVG.
All other
BNSF guarantees $9 million of other debt. BNSF holds a performance bond and has the option to sub-lease property to recover up to $4 million of the $9 million of guarantees. These guarantees expire between 2005 and 2014.
Other than as discussed above, there is no collateral held by a third party which the Company could obtain and liquidate to recover any amounts paid under the above guarantees.
Other than as discussed above, none of the guarantees are recorded in the Consolidated Financial Statements of the Company. The Company does not expect performance under these guarantees to have a material effect on the Company in the foreseeable future.
Indemnities
In the ordinary course of business, BNSF enters into agreements with third parties that include indemnification clauses. In general, these clauses are customary for the types of agreements in which they are included. At times, these clauses may involve indemnification for the acts of the Company, its employees and agents, indemnification for another party’s acts, indemnification for future events, indemnification based upon a certain standard of performance, indemnification for liabilities arising out of the Company’s use of leased equipment or other property, or other types of indemnification. Due to the uncertainty of whether events which would trigger the indemnification obligations would ever occur, the Company does not believe that these indemnity agreements will have a material adverse effect on the Company’s results of operations, financial position or liquidity.
Additionally, the Company believes that, due to lack of historical payment experience, the fair value of indemnities cannot be estimated with any amount of certainty and that the fair value of any such amount would be immaterial to the financial statements. Accordingly, no fair value liability related to indemnities has been recorded in the financial statements.
16
BURLINGTON NORTHERN SANTA FE CORPORATION and SUBSIDIARIES
NOTES TO CONSOLIDATED FINANCIAL STATEMENTS (Unaudited) – (Continued)
5. Commitments and Contingencies
Personal Injury
Personal injury claims, including asbestos claims and employee work-related injuries and third party injuries (collectively, other personal injury), are a significant expense for the railroad industry. Personal injury claims by BNSF Railway employees are subject to the provisions of the Federal Employers’ Liability Act (FELA) rather than state workers’ compensation laws. FELA’s system of requiring the finding of fault, coupled with unscheduled awards and reliance on the jury system, contributed to increased expenses in past years. Other proceedings include claims by non-employees for punitive as well as compensatory damages. A few proceedings purport to be class actions. The variability present in settling these claims, including non-employee personal injury and matters in which punitive damages are alleged, could result in increased expenses in future years. BNSF has implemented a number of safety programs designed to reduce the number of personal injuries as well as the associated claims and personal injury expense.
BNSF records a liability for personal injury claims when the expected loss is both probable and reasonably estimable. The liability and ultimate expense projections are estimated using standard actuarial methodologies. Liabilities recorded for unasserted personal injury claims are based on information currently available. Due to the inherent uncertainty involved in projecting future events such as the number of claims filed each year, developments in judicial and legislative standards, and the average costs to settle projected claims, actual costs may differ from amounts recorded.
Asbestos
The Company is party to a number of personal injury claims by employees and non-employees who may have been exposed to asbestos. The heaviest exposure for BNSF employees was due to work conducted in and around the use of steam locomotive engines that were phased out between the years of 1950 and 1967. However, other types of exposures, including exposure from locomotive component parts and building materials, continued after 1967, until it was substantially eliminated by 1985.
Prior to 2000, claim filings against the Company for asbestos were not numerous and were sporadic. Accordingly, while the Company had concluded that a probable loss had occurred, it did not believe it could estimate the range of reasonably possible loss because of the lack of experience with such claims and the lack of detailed employment records for the population of exposed employees. The Company believed, however, that the low end of the range of reasonably possible loss, as that term is used in Financial Accounting Standards Board (FASB) Interpretation No. 14 (FIN 14), Reasonable Estimation of the Amount of a Loss, was immaterial. Subsequent to this period, claim filings increased and, when they continued into 2004, the Company concluded that the low end of the range of reasonably possible loss would be material and that an estimate for unasserted asbestos exposure liability needed to be recorded. BNSF then engaged a third party, with extensive experience in performing asbestos studies, to assist in assessing the unasserted liability exposure. The objective of the assessment was to determine the number of estimated unasserted asbestos claims and the estimated average cost per claim. The Company, with the assistance of the third party, first determined its exposed population from which it was able to derive the estimated number of unasserted claims. The estimated average cost per claim was then determined utilizing recent actual average cost per claim data.
Based on the assessment, the Company recorded an undiscounted $293 million pre-tax charge for unasserted asbestos claims in the third quarter of 2004. The $293 million pre-tax charge was recorded in materials and other expense and reduced net income by $182 million, or $0.48 and $0.49 per share, for the three and nine months ended September 30, 2004, respectively.
During the third quarter of 2005, the Company obtained an update of this study which concluded that the original September 2004 study continues to represent a reasonable estimate of BNSF’s future asbestos exposure. Therefore, management recorded no additional expense as a result of this update. The Company plans to update the study in the third quarter of 2006. On a quarterly basis, BNSF monitors actual experience against the number of forecasted claims and expected claim payments. Adjustments to the Company’s estimates will be recorded when necessary.
17
BURLINGTON NORTHERN SANTA FE CORPORATION and SUBSIDIARIES
NOTES TO CONSOLIDATED FINANCIAL STATEMENTS (Unaudited) – (Continued)
The following table summarizes the activity in the Company’s accrued obligations for both asserted and unasserted asbestos matters (in millions):
| | | | | | | | | | | | | | | | |
| | | Three Months Ended September 30,
| | | Nine Months Ended September 30,
| |
| | | 2005
| | | 2004
| | | 2005
| | | 2004
| |
Beginning balance | | $ | 336 | | | $ | 63 | | | $ | 345 | | | $ | 60 | |
Accruals | | | — | | | | 293 | | | | — | | | | 308 | |
Payments | | | (4 | ) | | | (5 | ) | | | (13 | ) | | | (17 | ) |
| | |
|
|
| |
|
|
| |
|
|
| |
|
|
|
Ending balance at September 30, | | $ | 332 | | | $ | 351 | | | $ | 332 | | | $ | 351 | |
| | |
|
|
| |
|
|
| |
|
|
| |
|
|
|
Of the September 30, 2005 obligation, $270 million is related to unasserted claims while $62 million is related to asserted claims. At September 30, 2005, $20 million is included in current liabilities. The recorded liability is not discounted. In addition, defense and processing costs, which are recorded on an as-reported basis, are not included in the recorded liability. The Company is presently self-insured for asbestos-related claims.
The following table summarizes information regarding the number of asserted asbestos claims filed against BNSF:
| | | | | | | | | | | | |
| | | Three Months Ended September 30,
| | | Nine Months Ended September 30,
| |
| | | 2005
| | | 2004
| | | 2005
| | | 2004
| |
Claims unresolved at beginning of period | | 2,120 | | | 1,976 | | | 1,926 | | | 1,985 | |
Claims filed | | 234 | | | 155 | | | 719 | | | 587 | |
Claims settled, dismissed or otherwise resolved | | (150 | ) | | (132 | ) | | (441 | ) | | (573 | ) |
| | |
|
| |
|
| |
|
| |
|
|
Ending balance at September 30, | | 2,204 | | | 1,999 | | | 2,204 | | | 1,999 | |
| | |
|
| |
|
| |
|
| |
|
|
Based on BNSF’s estimate of the potentially exposed employees and related mortality assumptions, it is anticipated that unasserted claims will continue to be filed through the year 2050. The Company recorded an amount for the full estimated filing period through 2050 because it had a relatively finite exposed population (former and current employees hired prior to 1985) which it was able to identify and reasonably estimate and about which it had obtained reliable demographic data (including age, hire date and occupation) derived from industry or BNSF specific data that was the basis for the study. BNSF projects that approximately 50, 70, and 90 percent of the future unasserted asbestos claims will be incurred within the next 10, 15, and 25 years, respectively.
Because of the uncertainty surrounding the factors used in the study, it is reasonably possible that future costs to settle asbestos claims may range from approximately $225 million to $425 million. However, BNSF believes that the $332 million recorded is the best estimate of the Company’s future obligation for the settlement of asbestos claims.
The amounts recorded by BNSF for the asbestos-related liability were based upon currently known facts. Future events, such as the number of new claims to be filed each year, the average cost of disposing of claims, as well as the numerous uncertainties surrounding asbestos litigation in the United States, could cause the actual costs to be higher or lower than projected.
While the final outcome of asbestos-related matters cannot be predicted with certainty, considering among other things the meritorious legal defenses available and liabilities that have been recorded, it is the opinion of BNSF that none of these items, when finally resolved, will have a material adverse effect on the Company’s financial position or liquidity. However, should a number of these items occur in the same period, it could have a material adverse effect on the results of operations in a particular quarter or fiscal year.
18
BURLINGTON NORTHERN SANTA FE CORPORATION and SUBSIDIARIES
NOTES TO CONSOLIDATED FINANCIAL STATEMENTS (Unaudited) – (Continued)
Other Personal Injury
BNSF uses a third party actuary to assist the Company in estimating its other personal injury liability claims and expense. These estimates are based on the covered population, activity levels and trends in frequency, and the costs of covered injuries. These actuarial estimates include unasserted claims except for certain repetitive stress and other occupational trauma claims that result from prolonged repeated events or exposure. Such claims are estimated on an as-reported basis because, while the Company has concluded that a probable loss has occurred, it cannot estimate the range of reasonably possible loss due to other contributing causes of such injuries and the fact that continued exposure is required for the potential injury to manifest itself as a claim. The Company believes that the low end of the range of reasonably possible loss, as that term is used in FIN 14, is immaterial.
BNSF obtains quarterly actuarial updates for other personal injury liabilities and monitors actual experience against the number of forecasted claims to be received, the forecasted number of claims closing with payment and expected claims payments. Adjustments to the Company’s estimates are recorded quarterly as necessary or more frequently as new events or revised estimates develop.
The following table summarizes the activity in the Company’s accrued obligations for other personal injury matters (in millions):
| | | | | | | | | | | | | | | | |
| | | Three Months Ended September 30,
| | | Nine Months Ended September 30,
| |
| | | 2005
| | | 2004
| | | 2005
| | | 2004
| |
Beginning balance | | $ | 449 | | | $ | 439 | | | $ | 459 | | | $ | 453 | |
Accruals | | | 46 | | | | 57 | | | | 136 | | | | 150 | |
Payments | | | (59 | ) | | | (41 | ) | | | (159 | ) | | | (148 | ) |
| | |
|
|
| |
|
|
| |
|
|
| |
|
|
|
Ending balance at September 30, | | $ | 436 | | | $ | 455 | | | $ | 436 | | | $ | 455 | |
| | |
|
|
| |
|
|
| |
|
|
| |
|
|
|
At September 30, 2005, $165 million is included in current liabilities. BNSF’s liabilities for other personal injury claims are undiscounted. In addition, defense and processing costs, which are recorded on an as-reported basis, are not included in the recorded liability. The Company is substantially self-insured for other personal injury claims.
The following table summarizes information regarding the number of personal injury claims, other than asbestos, filed against BNSF:
| | | | | | | | | | | | |
| | | Three Months Ended September 30,
| | | Nine Months Ended September 30,
| |
| | | 2005
| | | 2004
| | | 2005
| | | 2004
| |
Claims unresolved at beginning of period | | 3,715 | | | 4,351 | | | 4,116 | | | 4,393 | |
Claims filed | | 922 | | | 945 | | | 2,859 | | | 2,722 | |
Claims settled, dismissed or otherwise resolved | | (986 | ) | | (1,083 | ) | | (3,324 | ) | | (2,902 | ) |
| | |
|
| |
|
| |
|
| |
|
|
Ending balance at September 30, | | 3,651 | | | 4,213 | | | 3,651 | | | 4,213 | |
| | |
|
| |
|
| |
|
| |
|
|
Because of the uncertainty surrounding the ultimate outcome of other personal injury claims, it is reasonably possible that future costs to settle other personal injury claims may range from approximately $400 million to $550 million. However, BNSF believes that the $436 million recorded is the best estimate of the Company’s future obligation for the settlement of other personal injury claims.
The amounts recorded by BNSF for other personal injury claims were based upon currently known facts. Future events, such as the number of new claims to be filed each year, the average cost of disposing of claims, as well as the numerous uncertainties surrounding personal injury litigation in the United States, could cause the actual costs to be higher or lower than projected.
19
BURLINGTON NORTHERN SANTA FE CORPORATION and SUBSIDIARIES
NOTES TO CONSOLIDATED FINANCIAL STATEMENTS (Unaudited) – (Continued)
While the final outcome of these other personal injury matters cannot be predicted with certainty, considering among other things the meritorious legal defenses available and liabilities that have been recorded, it is the opinion of BNSF that none of these items, when finally resolved, will have a material adverse effect on the Company’s financial position or liquidity. However, should a number of these items occur in the same period, it could have a material adverse effect on the results of operations in a particular quarter or fiscal year.
Environmental
The Company’s operations, as well as those of its competitors, are subject to extensive federal, state and local environmental regulation. BNSF’s operating procedures include practices to protect the environment from the risks inherent in railroad operations, which frequently involve transporting chemicals and other hazardous materials. Additionally, many of BNSF’s land holdings are and have been used for industrial or transportation-related purposes or leased to commercial or industrial companies whose activities may have resulted in discharges onto the property. As a result, BNSF is subject to environmental cleanup and enforcement actions. In particular, the Federal Comprehensive Environmental Response, Compensation and Liability Act of 1980 (CERCLA), also known as the Superfund law, as well as similar state laws, generally impose joint and several liability for cleanup and enforcement costs on current and former owners and operators of a site without regard to fault or the legality of the original conduct. BNSF has been notified that it is a potentially responsible party (PRP) for study and cleanup costs at Superfund sites for which investigation and remediation payments are or will be made or are yet to be determined (the Superfund sites) and, in many instances, is one of several PRPs. In addition, BNSF may be considered a PRP under certain other laws. Accordingly, under CERCLA and other federal and state statutes, BNSF may be held jointly and severally liable for all environmental costs associated with a particular site. If there are other PRPs, BNSF generally participates in the cleanup of these sites through cost-sharing agreements with terms that vary from site to site. Costs are typically allocated based on such factors as relative volumetric contribution of material, the amount of time the site was owned or operated, and/or the portion of the total site owned or operated by each PRP.
Liabilities for environmental cleanup costs are recorded when BNSF’s liability for environmental cleanup is probable and reasonably estimable. Subsequent adjustments to initial estimates are recorded as necessary based upon additional information developed in subsequent periods. Environmental costs include initial site surveys and environmental studies as well as costs for remediation of sites determined to be contaminated.
During the first half of 2004, the Company experienced a significant increase in expense relating to environmental remediation developments at known sites for which the majority of the contamination occurred decades ago. Because of these and other developments, the Company performed an assessment in 2004 to determine if it was feasible to better estimate developments at its known sites. The Company determined that a third party actuary had proprietary data that included information from the EPA and other governmental agencies as well as information accumulated from public sources and work performed for other clients. Because of its determination that a better estimate of future development could be made with this data, BNSF engaged this third party actuary, which has an extensive background in performing various studies for large companies, including environmental matters, to assist BNSF in determining the Company’s potential future environmental exposure at known sites. As a result of this study, the Company revised its estimate of its probable environmental losses and its accrued liabilities.
Consequently, during the third quarter of 2004, BNSF recorded an undiscounted $172 million pre-tax charge related to its change in estimated environmental liabilities on a site by site basis. The $172 million pre-tax charge was recorded in materials and other expense and reduced net income by $106 million, or $0.28 per share, for the three and nine months ended September 30, 2004. The charge did not include (i) contaminated sites of which the Company is not aware, or (ii) additional amounts for third party claims, which arise out of contaminants allegedly migrating from BNSF property, due to a limited number of sites. BNSF continues to estimate third party claims on a site by site basis when the liability for such claims is probable and reasonably estimable. BNSF’s recorded liability for third party claims as of September 30, 2005 is approximately $26 million.
The Company’s estimate of ultimate cost for clean up efforts at its known environmental sites utilizes BNSF’s historical payment patterns, its current estimated percentage to closure ratios, and the actuary’s proprietary benchmark patterns developed from data accumulated from public sources and work performed by it for other clients, including the EPA and other governmental agencies. These factors incorporate experience gained from clean up efforts at other similar sites into the estimates for which remediation and restoration efforts are still in progress. BNSF also conducts an ongoing environmental contingency analysis, which considers a combination of factors including independent consulting reports, site visits, legal reviews and analysis of the likelihood of participation in, and the ability to pay for, cleanup of other PRPs.
20
BURLINGTON NORTHERN SANTA FE CORPORATION and SUBSIDIARIES
NOTES TO CONSOLIDATED FINANCIAL STATEMENTS (Unaudited) – (Continued)
During the third quarter of 2005, the Company obtained an update of this study. Based on the results of the study, management recorded additional expense of approximately $12 million. The Company plans to update the study in the third quarter of 2006. On a quarterly basis, BNSF monitors actual experience against the forecasted remediation and related payments made on existing sites. Adjustments to the Company’s estimates will continue to be recorded when necessary based on developments in subsequent periods. Additionally, environmental accruals include amounts for newly identified sites or contaminants, third-party claims, and legal fees incurred for defense of third-party claims and recovery efforts.
BNSF is involved in a number of administrative and judicial proceedings and other mandatory cleanup efforts for 377 sites, including Superfund sites, at which it is participating in the study or cleanup, or both, of alleged environmental contamination.
The following table summarizes the activity in the Company’s accrued obligations for environmental matters (in millions):
| | | | | | | | | | | | | | | | |
| | | Three Months Ended September 30,
| | | Nine Months Ended September 30,
| |
| | | 2005
| | | 2004
| | | 2005
| | | 2004
| |
Beginning balance | | $ | 371 | | | $ | 242 | | | $ | 385 | | | $ | 199 | |
Accruals | | | 24 | | | | 186 | | | | 32 | | | | 250 | |
Payments | | | (14 | ) | | | (38 | ) | | | (36 | ) | | | (59 | ) |
| | |
|
|
| |
|
|
| |
|
|
| |
|
|
|
Ending balance at September 30, | | $ | 381 | | | $ | 390 | | | $ | 381 | | | $ | 390 | |
| | |
|
|
| |
|
|
| |
|
|
| |
|
|
|
At September 30, 2005, $55 million is included in current liabilities. BNSF’s environmental liabilities are not discounted. BNSF anticipates that the majority of the accrued costs at September 30, 2005 will be paid over the next ten years, and no individual site is considered to be material.
The following table summarizes the environmental sites:
| | | | | | | | | | | |
| | | Three Months Ended September 30,
| | Nine Months Ended September 30,
| |
| | | 2005
| | | 2004
| | 2005
| | | 2004
| |
| BNSF Sites | | | | | | | | | | | |
Number of sites at beginning of period | | 379 | | | 380 | | 384 | | | 402 | |
Sites added during the period | | 13 | | | 4 | | 19 | | | 26 | |
Sites closed during the period | | (15 | ) | | — | | (26 | ) | | (44 | ) |
| | |
|
| |
| |
|
| |
|
|
Number of sites at September 30, | | 377 | | | 384 | | 377 | | | 384 | |
| | |
|
| |
| |
|
| |
|
|
| | |
| | | Three Months Ended September 30,
| | Nine Months Ended September 30,
| |
| | | 2005
| | | 2004
| | 2005
| | | 2004
| |
| Superfund Sites | | | | | | | | | | | |
Number of sites at beginning of period | | 23 | | | 21 | | 24 | | | 22 | |
Sites added during the period | | — | | | 2 | | — | | | 4 | |
Sites closed during the period | | (3 | ) | | — | | (4 | ) | | (3 | ) |
| | |
|
| |
| |
|
| |
|
|
Number of sites at September 30, | | 20 | | | 23 | | 20 | | | 23 | |
| | |
|
| |
| |
|
| |
|
|
Liabilities recorded for environmental costs represent BNSF’s best estimate of its probable future obligation for the remediation and settlement of these sites and include both asserted and unasserted claims. Unasserted claims are not a material component of the liability. Although recorded liabilities include BNSF’s best estimate of all probable costs, without reduction for anticipated recoveries from third parties, BNSF’s total cleanup costs at these sites cannot be predicted with certainty due to various factors such as the extent of corrective actions that may be required, evolving environmental laws and regulations, advances in environmental technology, the extent of other parties’ participation in cleanup efforts, developments in ongoing environmental analyses related to sites determined to be contaminated, and developments in environmental surveys and studies of contaminated sites.
21
BURLINGTON NORTHERN SANTA FE CORPORATION and SUBSIDIARIES
NOTES TO CONSOLIDATED FINANCIAL STATEMENTS (Unaudited) – (Continued)
Because of the uncertainty surrounding these factors, it is reasonably possible that future costs for environmental liabilities may range from approximately $300 million to $600 million. However, BNSF believes that the $381 million recorded is the best estimate of the Company’s future obligation for environmental costs.
While the final outcome of these environmental matters cannot be predicted with certainty, it is the opinion of BNSF that none of these items, when finally resolved, will have a material adverse effect on the Company’s financial position or liquidity. However, an unexpected adverse resolution of one or more of these items could have a material adverse effect on the results of operations in a particular quarter or fiscal year.
Other Claims and Litigation
In addition to asbestos, other personal injury, and environmental matters discussed above, BNSF and its subsidiaries are also parties to a number of other legal actions and claims, various governmental proceedings and private civil suits arising in the ordinary course of business, including those related to disputes and complaints involving certain transportation rates and charges (including complaints seeking refunds of prior charges paid for coal transportation and the prescription of future rates for such movements). Some of the legal proceedings include claims for punitive as well as compensatory damages, and a few proceedings purport to be class actions.
While the final outcome of these matters cannot be predicted with certainty, considering among other things the meritorious legal defenses available and liabilities that have been recorded along with applicable insurance, it is the opinion of BNSF that none of these items, when finally resolved, will have a material adverse effect on the Company’s financial position or liquidity. However, an unexpected adverse resolution of one or more of these items could have a material adverse effect on the results of operations in a particular quarter or fiscal year.
6. Employee Separation Costs
Employee separation costs activity was as follows (in millions):
| | | | | | | | |
Nine Months Ended September 30,
| | 2005
| | | 2004
| |
Beginning balance at January 1, | | $ | 154 | | | $ | 179 | |
Accruals | | | 9 | | | | 7 | |
Payments | | | (27 | ) | | | (29 | ) |
| | |
|
|
| |
|
|
|
Ending balance at September 30, | | $ | 136 | | | $ | 157 | |
| | |
|
|
| |
|
|
|
Employee separation liabilities of $136 million are included in the Consolidated Balance Sheet at September 30, 2005, and principally represent the following: (i) deferred benefits payable upon separation or retirement to certain active conductors, trainmen and locomotive engineers; (ii) employee-related severance costs for the consolidation of clerical functions, material handlers in mechanical shops and trainmen on reserve boards; and (iii) certain non-union employee severance costs. Employee separation expenses are recorded in materials and other in the Consolidated Statements of Income. At September 30, 2005, $28 million of the remaining liabilities are included in current liabilities for anticipated costs to be paid over the next twelve months.
Conductors, Trainmen and Locomotive Engineers
Liabilities related to deferred benefits payable upon separation or retirement to certain active conductors, trainmen and locomotive engineers are $117 million at September 30, 2005. These costs were primarily incurred in connection with labor agreements reached prior to the consummation of the business combination of BNSF’s predecessor companies Burlington Northern, Inc. and Santa Fe Pacific Corporation (the Merger) which, among other things, reduced train crew sizes and allowed for more flexible work rules. The remaining costs will be paid through approximately 2024. In 2005 and 2004, the Company updated its estimates and recorded an additional liability of $2 million each year related to deferred benefits.
22
BURLINGTON NORTHERN SANTA FE CORPORATION and SUBSIDIARIES
NOTES TO CONSOLIDATED FINANCIAL STATEMENTS (Unaudited) – (Continued)
Consolidation of Clerical Functions
Liabilities related to the consolidation of clerical functions are $13 million at September 30, 2005, and primarily provide for separation programs announced in 2003, 2004 and 2005 and severance costs associated with the clerical consolidation plan adopted in 1995 upon the Merger. The July 2004 separation program affected approximately 40 employees and resulted in accrued severance costs of approximately $4 million. Reductions related to the July 2004 separation program were substantially completed by December 31, 2004. The July 2003 separation program resulted in accrued severance costs of approximately $12 million, affected approximately 150 employees and was substantially completed in 2003. The 1995 consolidation plan resulted in the elimination of approximately 1,500 permanent positions and was substantially completed during 1999. The liability also includes costs related to the reduction of approximately 40 and 140 material handlers in 2001 and 2000, respectively. In the first nine months of 2005, BNSF recorded other liabilities of approximately $6 million primarily related to a voluntary severance program for certain union employees.
Other Employee Separation Costs
Other employee separation cost liabilities are $6 million at September 30, 2005, and principally relate to certain remaining non-union employee severances resulting from the fourth quarter 2001 workforce reduction and the Merger. These costs will be paid over the next several years based on deferral elections made by the affected employees. Also included in the other employee separation costs accrual is an estimate for the remaining payments to be made to other union employees as a result of a $1 million relocation program initiated in the first quarter of 2005. This program is expected to be substantially complete by the end of 2005.
7. Retirement Plans and Other Post-employment Benefit Plans
Components of the net periodic cost for the three and nine months ended September 30 were as follows (in millions):
| | | | | | | | | | | | | | | | |
| | | Pension Benefits
| |
| | | Three Months Ended September 30,
| | | Nine Months Ended September 30,
| |
Net Periodic Cost
| | 2005
| | | 2004
| | | 2005
| | | 2004
| |
Service cost | | $ | 5 | | | $ | 4 | | | $ | 15 | | | $ | 14 | |
Interest cost | | | 24 | | | | 24 | | | | 71 | | | | 72 | |
Expected return on plan assets | | | (25 | ) | | | (28 | ) | | | (76 | ) | | | (84 | ) |
Amortization of net loss | | | 6 | | | | 3 | | | | 19 | | | | 9 | |
| | |
|
|
| |
|
|
| |
|
|
| |
|
|
|
Net cost recognized | | $ | 10 | | | $ | 3 | | | $ | 29 | | | $ | 11 | |
| | |
|
|
| |
|
|
| |
|
|
| |
|
|
|
| |
| | | Health and Welfare Benefits
| |
| | | Three Months Ended September 30,
| | | Nine Months Ended September 30,
| |
Net Periodic Cost
| | 2005
| | | 2004
| | | 2005
| | | 2004
| |
Service cost | | $ | — | | | $ | 1 | | | $ | 1 | | | $ | 3 | |
Interest cost | | | 2 | | | | 5 | | | | 9 | | | | 15 | |
Amortization of net loss | | | 1 | | | | 1 | | | | 3 | | | | 4 | |
Amortization of prior service costs | | | (1 | ) | | | (1 | ) | | | (4 | ) | | | (3 | ) |
| | |
|
|
| |
|
|
| |
|
|
| |
|
|
|
Net cost recognized | | $ | 2 | | | $ | 6 | | | $ | 9 | | | $ | 19 | |
| | |
|
|
| |
|
|
| |
|
|
| |
|
|
|
8. Earnings Per Share
Basic earnings per share is based on the weighted average number of common shares outstanding. Diluted earnings per share is based on basic earnings per share adjusted for the effect of potential dilutive common shares outstanding, arising from employee stock awards. The incremental shares were calculated using the treasury stock method.
23
BURLINGTON NORTHERN SANTA FE CORPORATION and SUBSIDIARIES
NOTES TO CONSOLIDATED FINANCIAL STATEMENTS (Unaudited) – (Continued)
Weighted average stock options totaling 0.1 million for the three and nine months ended September 30, 2005, respectively, and 2.7 million for the nine months ended September 30, 2004, were not included in the computation of diluted earnings per share because the options’ exercise price exceeded the average market price of the Company’s stock for those periods. For the three months ended September 30, 2004, weighted average stock options excluded from the computation of diluted earnings per share were insignificant.
9. Accounting Pronouncements
Stock-Based Compensation
The FASB issued SFAS No. 123R, Share-Based Payment, which originally required implementation for interim or annual reporting periods beginning after June 15, 2005. However, in April 2005, the Securities and Exchange Commission adopted a new rule to amend the compliance date to the beginning of the Company’s next fiscal year (January 1, 2006, for the Company). SFAS No. 123R requires the Company to recognize the cost of employee services received in exchange for the Company’s equity instruments. Currently, in accordance with APB Opinion 25, the Company records the intrinsic value of stock based compensation as expense. Accordingly, no compensation expense is currently recognized for fixed stock option plans as the exercise price equals the stock price on the date of grant. Under SFAS No. 123R, BNSF will be required to measure compensation expense over the options’ vesting period based on the stock options’ fair value at the date the options are granted. SFAS No. 123R allows for the use of the Black-Scholes or a lattice option-pricing model to value such options. The Company has determined that it will use the Black-Scholes option-pricing model to calculate the fair value of its options. Based on a study performed by the Company’s management, the fair values obtained from each of the two pricing models were not substantially different. Additionally, the Company has elected to adopt SFAS No. 123R on a modified prospective basis. Note 1 of the Consolidated Financial Statements illustrates the effects on net income and earnings per share if the Company had adopted SFAS No. 123 using the Black-Scholes option-pricing model.
Conditional Asset Retirement Obligations
In March 2005, the FASB issued Interpretation No. 47,Accounting for Conditional Asset Retirement Obligations—an interpretation of FASB Statement No. 143, Accounting for Asset Retirement Obligations. This Interpretation clarifies that the term conditional asset retirement obligation, as used in FASB Statement No. 143, refers to a legal obligation to perform an asset retirement activity in which the timing or method of settlement, or both, are conditional on a future event that may or may not be within the control of the entity. An entity is required to recognize a liability for the fair value of a conditional asset retirement obligation if the fair value of the liability can be reasonably estimated. The Company has assessed the impact of the interpretation and does not anticipate that it will have any impact to its financial statements when the interpretation becomes effective on December 31, 2005.
10. Report of Independent Registered Public Accounting Firm
PricewaterhouseCoopers LLP’s review report is included in this quarterly report; however, PricewaterhouseCoopers LLP does not express an opinion on the unaudited financial information. Accordingly, such report is not a “report” or “part of a registration statement” within the meaning of Sections 7 and 11 of the Securities Act of 1933 and PricewaterhouseCoopers LLP is not subject to the liability provisions of Section 11 of such Act with respect to the review report.
24
Report of Independent Registered Public Accounting Firm
To the Shareholders and Board of Directors of
Burlington Northern Santa Fe Corporation:
We have reviewed the accompanying consolidated balance sheet of Burlington Northern Santa Fe Corporation and its subsidiaries (the “Company”) as of September 30, 2005, and the related consolidated statements of income for each of the three-month and nine-month periods ended September 30, 2005 and 2004, the consolidated statements of cash flows for the nine-months ended September 30, 2005 and 2004 and the consolidated statement of changes in stockholders’ equity for the nine-month period ended September 30, 2005. These interim financial statements are the responsibility of the Company’s management.
We conducted our review in accordance with the standards of the Public Company Accounting Oversight Board (United States). A review of interim financial information consists principally of applying analytical procedures and making inquiries of persons responsible for financial and accounting matters. It is substantially less in scope than an audit conducted in accordance with the standards of the Public Company Accounting Oversight Board, the objective of which is the expression of an opinion regarding the financial statements taken as a whole. Accordingly, we do not express such an opinion.
Based on our review, we are not aware of any material modifications that should be made to the accompanying consolidated interim financial statements for them to be in conformity with accounting principles generally accepted in the United States of America.
We have previously audited, in accordance with the standards of the Public Company Accounting Oversight Board (United States), the consolidated balance sheet as of December 31, 2004, and the related consolidated statements of income, of changes in stockholders’ equity, and of cash flows for the year then ended, management’s assessment of the effectiveness of the Company’s internal control over financial reporting as of December 31, 2004, and the effectiveness of the Company’s internal control over financial reporting as of December 31, 2004; and in our report dated February 10, 2005, we expressed unqualified opinions thereon. The consolidated financial statements and management’s assessment of the effectiveness of internal control over financial reporting referred to above are not presented herein. In our opinion, the information set forth in the accompanying consolidated balance sheet information as of December 31, 2004, is fairly stated in all material respects in relation to the consolidated balance sheet from which it has been derived.
/s/ PricewaterhouseCoopers LLP
Fort Worth, Texas
October 20, 2005
25
Item 2. Management’s Discussion and Analysis of Financial Condition and Results of Operations
Management’s discussion and analysis relates to the financial condition and results of operations of Burlington Northern Santa Fe Corporation and its majority-owned subsidiaries (collectively BNSF, Registrant or Company). The principal operating subsidiary of BNSF is the BNSF Railway Company (BNSF Railway) through which BNSF derives almost all of its revenues. All earnings per share information is stated on a diluted basis.
Company Overview
Through its subsidiaries, BNSF is engaged primarily in the rail transportation business. The rail operations of BNSF’s primary operating subsidiary, BNSF Railway, comprise one of the largest railroad systems in North America, with 32,000 route miles in 28 states and two Canadian provinces. Through one operating transportation segment, BNSF Railway transports a wide range of products and commodities including Consumer Products, Industrial Products, Coal and Agricultural Products.
Additional operational information, including weekly intermodal and carload unit reports as submitted to the American Association of Railroads and annual reports submitted to the Surface Transportation Board, are available on our website at www.bnsf.com/investors.
Third Quarter 2005 Financial Overview
BNSF continues to drive operating income increases through strong customer demand, increasing yields, and operating efficiencies as reflected by the following:
| • | | The Company achieved record quarterly earnings of $1.09 per share, compared with third-quarter 2004 earnings of $0.01 per share, which included a charge for a change in estimate of asbestos and environmental liabilities of $0.76 per share. |
| • | | Freight revenues increased 18 percent compared with the third quarter of 2004 to $3.2 billion, a record for quarterly revenues. This includes double digit revenue increases in three of the four major business groups. |
| • | | Operating expenses for the third quarter of 2005 decreased 6 percent compared with the third quarter of 2004, primarily due to the $465 million charge in 2004 related to a change in BNSF’s estimates of asbestos and environmental liabilities. |
| • | | Operating income increased to approximately $778 million, an all-time quarterly record. |
| • | | Moody’s Investors Service affirmed the ratings of BNSF’s senior unsecured debt at Baa2 and changed the outlook to positive from stable in August of 2005. |
26
Results of Operations
Three Months Ended September 30, 2005 Compared with Three Months Ended September 30, 2004
Operating Income
BNSF continues to drive operating income increases through strong customer demand, increasing yields, and operating efficiencies. As a result of these efforts, operating income for the three months ended September 30, 2005 increased to $778 million.
Revenues
The following table presents BNSF’s revenue information by commodity group for the three months ended September 30, 2005 and 2004:
| | | | | | | | | | | | | | | | |
| | | Revenues
| | Cars / Units
| | Average Revenue Per Car / Unit
|
| | | 2005
| | 2004
| | 2005
| | 2004
| | 2005
| | 2004
|
| | | (in millions) | | (in thousands) | | | | |
Consumer Products | | $ | 1,331 | | $ | 1,097 | | 1,374 | | 1,278 | | $ | 969 | | $ | 858 |
Industrial Products | | | 743 | | | 634 | | 399 | | 407 | | | 1,862 | | | 1,558 |
Coal | | | 622 | | | 589 | | 570 | | 572 | | | 1,091 | | | 1,030 |
Agricultural Products | | | 522 | | | 418 | | 227 | | 210 | | | 2,300 | | | 1,990 |
| | |
|
| |
|
| |
| |
| |
|
| |
|
|
Total Freight Revenues | | | 3,218 | | | 2,738 | | 2,570 | | 2,467 | | $ | 1,252 | | $ | 1,110 |
| | | | | | | | |
| |
| |
|
| |
|
|
Other Revenues | | | 99 | | | 55 | | | | | | | | | | |
| | |
|
| |
|
| | | | | | | | | | |
Total Operating Revenues | | $ | 3,317 | | $ | 2,793 | | | | | | | | | | |
| | |
|
| |
|
| | | | | | | | | | |
Freight revenues for the third quarter of 2005 were $3,218 million, up 18 percent compared with the same 2004 period. This increase is due to a 4 percent increase in cars/units and a 13 percent increase in average revenue per car/unit, which includes $296 million in fuel surcharges compared with $95 million in the prior year.
| | |
Consumer Products The Consumer Products freight business is principally composed of International and Intermodal business. Intermodal business is comprised of the Truckload, Intermodal Marketing Companies, and Direct Marketing sectors. The revenues generated by each business area, as a percentage of Consumer Products revenues, are demonstrated in the graph. Consumer Products revenues of $1,331 million for the third quarter of 2005 were $234 million, or 21 percent, greater than the third quarter of 2004. The 8 percent increase in units was driven primarily by the international and truckload sectors. Rate increases and increases in fuel surcharges resulted in a 13 percent increase in revenue per unit. | | 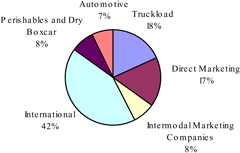 |
Industrial Products Industrial Products freight business consists of four business areas: building products, construction products, chemicals and plastics, and petroleum products. The make-up of Industrial products revenue, by business area, is demonstrated in the graph. | | 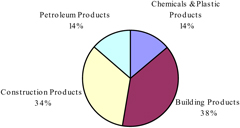 |
27
Industrial Products revenues increased $109 million, or 17 percent, to $743 million for the third quarter of 2005 as compared to the third quarter of 2004. The Company experienced double-digit revenue gains in all four business areas with especially strong gains in lumber, panel, petroleum, paper, and steel products. Rate increases along with increases in fuel surcharges contributed to a 20 percent increase in average revenue per car.
Coal
BNSF is one of the largest transporters of low-sulfur coal in the United States. Approximately 90 percent of all BNSF Railway’s coal tons transported originate from the Powder River Basin of Wyoming and Montana (Powder River Basin).
Coal revenues of $622 million for the third quarter of 2005 increased $33 million, or 6 percent, compared with the same period a year ago. Coal carloads remained relatively flat despite weather-related maintenance activities in the Powder River Basin. Average revenue per car increased 6 percent, primarily driven by price increases, contractual rate escalations, fuel surcharges and increased length of haul.
| | |
Agricultural Products Agricultural Products freight business is the transportation of agricultural products including corn, wheat, soybeans, bulk foods, fertilizer, and other products. A breakdown of revenue generated by these commodities is illustrated in the graph. Agricultural Products revenues of $522 million for the third quarter of 2005 were $104 million, or 25 percent, higher than revenues for the third quarter of 2004. This increase was primarily due to a 16 percent increase in average revenue per car, which was partially driven by fuel surcharges and a favorable mix change as a result of increased corn and soybean exports to Asia. | | 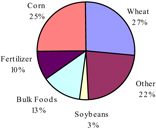 |
Other Revenues
Other revenues increased $44 million, or 80 percent, to $99 million for the third quarter of 2005. This increase was primarily attributable to increases in storage related revenues and volume growth, in addition to the acquisitions and volume growth of BNSF Logistics (a wholly owned subsidiary of BNSF that specializes in providing third-party logistics services).
Expenses
Total operating expenses for the third quarter of 2005 were $2,539 million, a decrease of $154 million, or 6 percent, versus the same period in 2004. This decrease was primarily driven by the $465 million pre-tax charge recorded in the third quarter of 2004 to reflect changes in the Company’s estimates of unasserted asbestos liabilities and environmental liabilities (see Note 10 of the Consolidated Financial Statements in the Company’s Form 10-K for the year ended December 31, 2004). The overall decrease was partially offset by a 5 percent increase in gross ton-miles and a 45 percent increase in fuel price, after hedge benefit.
Compensation and benefits
Compensation and benefits includes expenses for BNSF Railway employee compensation and benefit programs. The primary factors influencing the expenses recorded are volume, headcount, utilization, wage rates, incentives earned during the period, benefit plan participation and pension expenses.
Compensation and benefits expenses of $900 million were $47 million, or 6 percent, higher than the third quarter of 2004. This increase was primarily related to 4 percent higher unit volumes and wage inflation, partially offset by lower incentive compensation expense.
28
Fuel
Fuel expenses are driven by the level of locomotive consumption of diesel fuel, market prices and the effects of hedging activities.
Fuel expenses of $499 million for the third quarter of 2005 were $167 million, or 50 percent, higher than the third quarter of 2004. The increase in fuel expenses was primarily due to an increase in the average all-in cost per gallon of diesel fuel. The average all-in cost per gallon of diesel fuel increased by 44 cents to $1.43, resulting in a $154 million increase in expenses. The increase in the average all-in cost was comprised of an increase in the average purchase price of 62 cents, or $220 million increase in fuel expenses, partially offset by an increase in the hedge benefit of 18 cents, or $66 million (third quarter 2005 benefit of $161 million less third quarter 2004 benefit of $95 million). Consumption in the third quarter of 2005 was 349 million gallons compared with 336 million gallons in the same 2004 period, resulting in a $13 million increase in fuel expenses.
Purchased services
Purchased services expenses include ramping and drayage, maintenance of locomotive and freight car equipment and technology services outsourcing, and other services, such as vegetation control, provided to BNSF. This expense line also includes purchased transportation costs for BNSF Logistics, the expenses for which are driven by the rates established in the service contracts and the volume of services required.
Purchased services expenses of $432 million for the third quarter of 2005 were $75 million, or 21 percent, higher than the third quarter of 2004. This increase was primarily due to increases in the following volume-related costs: intermodal ramp costs, locomotive and freight car contract maintenance expense, haulage payments for contracted transportation over other railroads, and purchased transportation costs for BNSF Logistics.
Depreciation and amortization
Depreciation and amortization expenses for the period are determined by using the group method of depreciation, applying a single rate to the gross investment in a particular class of property. Due to the capital-intensive nature of BNSF’s operations, depreciation expense is a significant component of the Company’s operating expense. The full effect of inflation is not reflected in operating expenses since depreciation is based on historical cost.
Depreciation and amortization expenses of $271 million for the third quarter of 2005 were $17 million, or 7 percent, higher than the same period in 2004. The increase in depreciation expense was due to ongoing capital expenditures.
Equipment rents
Equipment rents expenses include long-term and short-term payments primarily for locomotives, freight cars, containers and trailers. The expenses are driven primarily by volume, rental rates, the results of lease negotiations, utilization of owned equipment versus leased equipment, and changes in business mix resulting in equipment usage variances.
Equipment rents expenses of $223 million for the third quarter of 2005 were $13 million, or 6 percent, higher than the third quarter of 2004. The variance represents expense increases for freight car equipment and locomotive leases, which are predominantly related to volume increases.
Materials and other
Materials expenses consist mainly of the costs involved to purchase mechanical and engineering materials and other items for construction and maintenance of property and equipment. Other expenses include personal injury claims, environmental remediation, and derailments as well as employee separation costs, utilities, and property and miscellaneous taxes, offset by gains on land sales.
Materials and other expenses of $214 million for the third quarter of 2005, which consists of approximately $90 million of materials expense with the remainder consisting of other items, were $473 million lower than the third quarter of 2004. Excluding the impact of the $465 million pre-tax charge in the third quarter of 2004 to reflect changes in the Company’s estimates of unasserted asbestos liabilities and environmental liabilities, materials and other expenses decreased by $8 million.
29
Interest expense
Interest expense of $106 million for the third quarter of 2005 was $4 million, or 4 percent, higher than the third quarter of 2004. The increase is primarily due to higher average interest rates and a lower net interest rate hedge benefit, slightly offset by lower average debt balances.
Other expense (income), net
Other expense, net was $16 million for the third quarter of 2005 compared with other income of $5 million in the same 2004 period. The change is primarily due to the receipt of interest income from a settlement received in 2004 as well as losses on BNSF’s participation in a synthetic fuel partnership recorded in 2005.
Income Taxes
The effective tax rate for the third quarter of 2005 was 36.9 percent compared to 38.0 for the prior year period. This decrease in the effective tax rate primarily reflects a federal tax settlement attributable to tax returns filed for years 1993-1995 that settled favorably in the third quarter of 2005.
30
Nine Months Ended September 30, 2005 Compared with Nine Months Ended September 30, 2004
Operating Income
BNSF continues to drive operating income increases through strong customer demand, increasing yields, and operating efficiencies. As a result of these efforts, operating income for the nine months ended September 30, 2005 increased to $2,122 million.
Revenues
The following table presents BNSF’s revenue information by commodity group for the nine months ended September 30, 2005 and 2004:
| | | | | | | | | | | | | | | | |
| | | Revenues
| | Cars / Units
| | Average Revenue Per Car / Unit
|
| | | 2005
| | 2004
| | 2005
| | 2004
| | 2005
| | 2004
|
| | | (in millions) | | (in thousands) | | | | |
Consumer Products | | $ | 3,702 | | $ | 3,064 | | 3,919 | | 3,563 | | $ | 945 | | $ | 860 |
Industrial Products | | | 2,108 | | | 1,817 | | 1,182 | | 1,164 | | | 1,783 | | | 1,561 |
Coal | | | 1,811 | | | 1,662 | | 1,660 | | 1,641 | | | 1,091 | | | 1,013 |
Agricultural Products | | | 1,539 | | | 1,280 | | 682 | | 667 | | | 2,257 | | | 1,919 |
| | |
|
| |
|
| |
| |
| |
|
| |
|
|
Total Freight Revenues | | | 9,160 | | | 7,823 | | 7,443 | | 7,035 | | $ | 1,231 | | $ | 1,112 |
| | | | | | | | |
| |
| |
|
| |
|
|
Other Revenues | | | 277 | | | 145 | | | | | | | | | | |
| | |
|
| |
|
| | | | | | | | | | |
Total Operating Revenues | | $ | 9,437 | | $ | 7,968 | | | | | | | | | | |
| | |
|
| |
|
| | | | | | | | | | |
Freight revenues for the first nine months of 2005 were $9,160 million, up 17 percent compared with the same 2004 period. This increase is due to a 6 percent increase in cars/units and an 11 percent increase in average revenue per car/unit, which includes $710 million in fuel surcharges compared with $207 million in the prior year.
| | |
Consumer Products Consumer Products revenues of $3,702 million for the first nine months of 2005 were $638 million, or 21 percent, greater than the first nine months of 2004. The 10 percent increase in units was driven primarily by the international and truckload sectors. Rate increases and increases in fuel surcharges resulted in a 10 percent increase in revenue per unit. | | 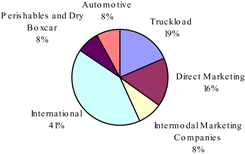 |
| | |
Industrial Products Industrial Products revenues increased $291 million, or 16 percent, to $2,108 million for the first nine months of 2005. The revenue increase was due to strength in all four business areas (chemicals & plastics, petroleum products, building products and construction products), with especially strong gains in lumber, panel products, paper, petroleum and steel products. Rate increases, an increase in fuel surcharges and larger volume increases in higher-rated commodities contributed to a 14 percent increase in average revenue per car. | | 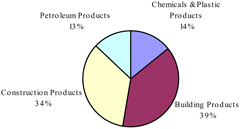 |
31
Coal
Coal revenues of $1,811 million, for the first nine months of 2005, increased $149 million, or 9 percent, versus the same period a year ago. Coal carloads increased 1 percent as a result of new customer business volumes and higher demand from existing customers partially offset by weather-related operational and maintenance disruptions in the Powder River Basin. Average revenue per car increased 8 percent, primarily driven by contractual rate escalations, fuel surcharges and increased length of haul.
| | |
Agricultural Products Agricultural Products revenues of $1,539 million for the first nine months of 2005 were $259 million, or 20 percent, higher than revenues for the first nine months of 2004. This increase was primarily due to an 18 percent increase in average revenue per car, which was partially driven by fuel surcharges and a favorable mix change as a result of increased corn and soybean exports to Asia. | |  |
Other Revenues
Other revenues increased $132 million, or 91 percent, to $277 million for the first nine months of 2005 compared with the same period in 2004. This increase was primarily attributable to increases in storage related revenues and volume growth, in addition to the acquisitions and volume growth of BNSF Logistics (a wholly owned subsidiary of BNSF that specializes in providing third-party logistics services).
Expenses
Total operating expenses for the first nine months of 2005 were $7,315 million, an increase of $365 million, or 5 percent, versus the same 2004 period.
Compensation and benefits
Compensation and benefits expenses for the first three quarters of 2005 of $2,602 million were $144 million, or 6 percent, higher than the same 2004 period. This increase in expense was primarily related to 6 percent higher volumes. Additionally, compared to the same 2004 period, pension expense was higher, while incentive compensation expense was lower.
Fuel
Fuel expenses of $1,352 million for the first nine months of 2005 were $414 million, or 44 percent, higher than the first nine months of 2004. The increase in fuel expenses was due to an increase in the average all-in cost per gallon of diesel fuel. The average all-in cost per gallon of diesel fuel increased by 36 cents to $1.30 resulting in a $369 million increase in expense. The expense increase was comprised of an increase in the average purchase price of 52 cents, or $547 million, offset by an increase in the hedge benefit of approximately 16 cents, or $178 million (first nine months 2005 benefit of $390 million less first nine months of 2004 benefit of $212 million). Consumption in the first nine months of 2005 was 1,043 million gallons, up 5 percent, compared with consumption for the first nine months of 2004 of 996 million gallons, resulting in a $45 million increase in fuel expenses.
Purchased services
Purchased services expenses of $1,273 million for the first nine months of 2005 were $225 million, or 21 percent, higher than the same 2004 period. This increase was primarily due to increases in the following volume-related costs: intermodal ramp costs, locomotive and freight car contract maintenance expense, haulage payments for contracted transportation over other railroads, and purchased transportation costs for BNSF Logistics.
32
Depreciation and amortization
Depreciation and amortization expenses of $802 million for the first nine months of 2005 were $48 million, or 6 percent, higher than the same period in 2004. The increase in depreciation expense was due to ongoing capital expenditures.
Equipment rents
Equipment rents expenses for the first nine months of 2005 of $654 million were $60 million, or 10 percent, higher than the first nine months of 2004. The variance represents expense increases for freight car equipment and locomotive leases which are predominantly related to volume and lease rate increases.
Materials and other
Materials and other expenses of $632 million for the first nine months of 2005 were $526 million, or 45 percent, lower than the first nine months of 2004. Approximately $260 million of the total represents materials expenses with the remainder consisting of other items. The overall decrease was primarily the result of the $465 million pre-tax charge recorded in the third quarter of 2004 to reflect changes in the Company’s estimates of unasserted asbestos liabilities and environmental liabilities (see Note 10 of the Consolidated Financial Statements in the Company’s 2004 Form 10-K). Additionally, environmental expenses recorded in the first nine months of 2004 related to developments at two former fueling sites, higher casualty costs driven by two large derailments that occurred in the first quarter of 2004, and overall lower environmental and personal injury expenses in the first nine months of 2005 primarily as a result of the aforementioned third quarter 2004 charge contributed to this decrease. The overall decrease in materials and other was partially offset by higher material costs to maintain locomotives, freight cars and track structure.
Interest expense
Interest expense of $327 million for the first nine months of 2005 was $22 million, or 7 percent, higher than the first nine months of 2004. This increase was primarily the result of higher average interest rates and a lower net interest rate hedge benefit offset by lower average debt outstanding.
Other expense, net
Other expense, net was $31 million for the first nine months of 2005 compared with other income of $3 million in the same 2004 period. This increase is primarily due to the receipt of interest income from a settlement and an interest recovery, both recorded in 2004 as well as additional losses on BNSF’s participation in a synthetic fuel partnership recorded in 2005.
Income Taxes
The effective tax rate for the first nine months of 2005 was 37.6 percent compared to 38.0 for the prior year period.
33
Liquidity and Capital Resources
Cash generated from operations is BNSF’s principal source of liquidity. BNSF generally funds any additional liquidity requirements through debt issuance, including commercial paper, through leasing of assets and through the sale of a portion of accounts receivable.
Operating Activities
Net cash provided by operating activities was $2,096 million for the nine months ended September 30, 2005, compared with $1,683 million for the nine months ended September 30, 2004. The increase is primarily the result of an increase in earnings and an increase in working capital.
Investing Activities
Net cash used for investing activities was $1,429 million for the nine months ended September 30, 2005, compared with $1,367 million for the nine months ended September 30, 2004. Investing activities for the nine months ended September 30, 2005, included $1,245 million of capital expenditures, as discussed below, and $184 million of cash used for other investing activities.
A breakdown of cash capital expenditures for the nine months ended September 30, 2005 and 2004, is set forth in the following table (in millions):
| | | | | | |
Nine Months Ended September 30,
| | 2005
| | 2004
|
Maintenance of Way | | $ | 791 | | $ | 774 |
Mechanical | | | 94 | | | 76 |
Information Services | | | 50 | | | 63 |
Other | | | 67 | | | 62 |
| | |
|
| |
|
|
Total Maintenance of Business | | | 1,002 | | | 975 |
New Locomotive Acquisitions | | | — | | | 16 |
Terminal and Line Expansion | | | 243 | | | 173 |
| | |
|
| |
|
|
Total | | $ | 1,245 | | $ | 1,164 |
| | |
|
| |
|
|
The increase in cash capital expenditures in the first nine months of 2005 is primarily due to an increase in capital expenditures to maintain BNSF’s freight equipment and locomotives, as well as terminal and line expansions and other transportation-related projects.
Financing Activities
Nine Months Ended September 30, 2005
Net cash used for financing activities during the first nine months of 2005 was $715 million, primarily related to common stock repurchases of $575 million, including $23 million to satisfy tax withholding obligations for stock option exercises, dividend payments of $192 million, and net repayments on long-term debt of $139 million, partially offset by proceeds from stock options exercised of $193 million.
Aggregate debt due to mature within one year is $472 million. BNSF’s ratio of net debt to total capitalization was 37.8 percent at September 30, 2005 compared with 39.9 percent at December 31, 2004. The Company’s adjusted net debt to total capitalization, including operating lease commitments was 50.0 percent at September 30, 2005, compared with 51.0 percent at December 31, 2004. BNSF’s adjusted net debt to total capitalization is a non-GAAP measure and should be considered in addition to, but not as a substitute for or preferable to, the information prepared in accordance with GAAP. However, the information is included herein as management believes that adjusted net debt to total capitalization provides meaningful additional information about the ability of BNSF to service long-term debt and other fixed obligations and to fund future growth. The following table presents a reconciliation of the calculation of adjusted net debt to total capitalization:
34
| | | | | | |
| | | September 30, 2005
| | | December 31, 2004
| |
Net debt to total capitalization a | | 37.8 | % | | 39.9 | % |
Adjustment for long-term operating leases | | 10.4 | % | | 9.3 | % |
Adjustment for other debt equivalents b | | 1.8 | % | | 1.8 | % |
| | |
|
| |
|
|
Adjusted net debt to total capitalization | | 50.0 | % | | 51.0 | % |
| | |
|
| |
|
|
| a | Net debt to total capitalization is calculated as total debt less cash and cash equivalents divided by the sum of net debt and total stockholders’ equity |
| b | Adjustment for other debt equivalents principally includes accounts receivable financing. See Note 3 of the Consolidated Financial Statements. |
As of September 30, 2005, the Company has $500 million available under its shelf registration.
Nine Months Ended September 30, 2004
Net cash used for financing activities during the first nine months of 2004 was $276 million, primarily related to additional net payments on debt of $127 million, common stock repurchases of $258 million and dividend payments of $168 million, partially offset by proceeds from stock options exercised of $274 million.
Dividends
Common stock dividends declared for the nine months ended September 30, 2005 and 2004, were $0.54 and $0.47 per share, respectively. Dividends paid on common stock during the first nine months of 2005 and 2004 were $192 million and $168 million, respectively. On July 21, 2005, the Board declared a quarterly dividend of $0.20 per share on its outstanding shares of common stock, payable October 3, 2005 to shareholders of record on September 12, 2005. On October 20, 2005, the Board declared a quarterly dividend of $0.20 per share on outstanding shares of common stock, payable January 3, 2006 to shareholders of record December 12, 2005.
Common Stock Repurchases
During the first nine months of 2005, BNSF repurchased approximately 11 million shares of its common stock at an average price of $51.69 per share under the Company’s share repurchase program amounting to a total cost of $552 million. Program-to-date repurchases through September 30, 2005, were 145 million shares at an average price of $28.66 per share, leaving 5 million shares available for repurchase out of the 150 million shares authorized. Additionally, during the nine months ended September 30, 2005, the Company repurchased shares from employees at a cost of $23 million to satisfy tax withholding obligations.
Long-Term Debt and Lease Obligations
The Company’s business is capital intensive. BNSF has historically generated a significant amount of cash from operating activities, which it uses to fund capital additions, service debt, repurchase shares and pay dividends. Additionally, the Company relies on access to the debt and leasing markets to finance a portion of capital additions on a long-term basis.
BNSF previously agreed to acquire a total of 1,315 locomotives, in three separate agreements, by 2009. As of December 31, 2004, all 500 of the locomotives under the first agreement had been delivered, bringing the outstanding total commitments to 815. In addition, through December 31, 2004, 115 locomotives were delivered under these remaining agreements. During the first nine months of 2005, BNSF took delivery of an additional 218 locomotives.
In the first quarter of 2004, BNSF entered into a contractual obligation to acquire 6,000 grain cars over the course of the next four years. Through September 30, 2005, BNSF has taken delivery of 4,118 of the hoppers, of which 2,625 were delivered during the first nine months of 2005.
35
The locomotives and grain cars under these agreements have been or are expected to be financed from one or a combination of sources including, but not limited to, cash from operations, capital or operating leases and debt issuances. The decision on the method used for a particular acquisition financing will depend on the current market conditions and other factors at the time.
In the normal course of business, the Company enters into long-term contracts for future goods and services needed for the operations of the business. Such commitments are not in excess of expected requirements and are not reasonably likely to result in performance penalties or payments that would have a material adverse effect on the Company’s liquidity.
Credit Agreements
Information concerning the Company’s outstanding commercial paper balances and revolving credit agreements is incorporated by reference from Note 4 of the Consolidated Financial Statements.
Off-Balance Sheet Arrangements
Sale of Accounts Receivable
The accounts receivable sales program of Santa Fe Receivables Corporation (SFRC), as described in Note 3 of the Consolidated Financial Statements, includes various provisions that, if triggered, would allow the investors participating in this program, at their option, to cancel the program. These provisions include a minimum consolidated tangible net worth test and a maximum debt-to-capital test. These tests are the same as required in BNSF’s revolving credit agreements. At September 30, 2005, BNSF Railway is in compliance with these provisions.
The accounts receivable sales program provides efficient financing at a competitive interest rate to traditional borrowing arrangements. Because the funding is collateralized by BNSF receivables, the risk of exposure is only as great as the risk of default on these receivables.
Guarantees
The Company acts as guarantor for certain debt and lease obligations of others. During the last couple of years, the Company has primarily utilized guarantees to obtain favorable leasing terms. Additionally, the Company has guaranteed third-party debt to facilitate construction that benefits BNSF. Further, in the ordinary course of business, BNSF enters into agreements with third parties that include indemnification clauses. The Company does not expect performance under these guarantees or indemnities to have a material adverse effect on the Company’s liquidity in the foreseeable future. See Note 4 of the Consolidated Financial Statements.
Other Matters
Commercial
In July 2004, BNSF Railway initiated an arbitration proceeding under a Joint Service Agreement (JSA) with J.B. Hunt Transportation (J.B. Hunt), a major truckload carrier with which BNSF Railway handles substantial joint intermodal movements. In the proceeding, BNSF Railway sought an increase in its divisions of joint revenue for intermodal movements. Additionally, J.B. Hunt challenged the basis of the divisions and raised other issues under the JSA. An Interim Award decision was issued by the arbitration panel on September 16, 2005 increasing BNSF’s revenue divisions, and favorably resolving other issues raised in the proceeding. Both parties accepted the Interim Award as the final and binding award in the arbitration on October 17, 2005. By agreement of the parties, on October 19 the panel entered an order terminating the proceeding. BNSF expects to receive a favorable EPS impact of approximately $0.04 related to the retroactive award [of compensation] for the period of July 7, 2004 through September 30, 2005. However, because the Interim Award was not final as of September 30, 2005 and was a gain contingency at that time, the Company did not recognize any impacts of the interim ruling in the third quarter. The retroactive award will be recognized in the fourth quarter.
In February 2005, the Company received a Civil Investigative Demand from the Antitrust Division of the Department of Justice requesting information concerning the Company’s pricing activities relating to the shipment of coal from the southern Powder River Basin. The Company continues to respond to requests for information.
36
Hedging Activities
The Company uses derivatives to hedge against increases in diesel fuel prices and interest rates as well as to convert a portion of its fixed-rate long-term debt to floating-rate debt. The Company formally documents the relationship between the hedging instrument and the hedged item, as well as the risk management objective and strategy for the use of the hedging instrument. This documentation includes linking the derivatives that are designated as fair value or cash flow hedges to specific assets or liabilities on the balance sheet, commitments or forecasted transactions. The Company assesses at the time a derivative contract is entered into, and at least quarterly thereafter, whether the derivative item is effective in offsetting the changes in fair value or cash flows. Any change in fair value resulting from ineffectiveness, as defined by SFAS No. 133,Accounting for Derivative Instruments and Hedging Activities,as amended, is recognized in current period earnings. For derivative instruments that are designated and qualify as cash flow hedges, the effective portion of the gain or loss on the derivative instrument is recorded in Accumulated Other Comprehensive Income (AOCI) as a separate component of stockholders’ equity and reclassified into earnings in the period during which the hedge transaction affects earnings.
Fuel
BNSF measures the fair value of fuel hedges from data provided by various external counterparties. To value a swap, the Company uses the forward commodity price for the period hedged. The fair values of costless collars are calculated and provided by the corresponding counterparties. BNSF monitors its hedging positions and credit ratings of its counterparties and does not anticipate losses due to counterparty nonperformance. See Note 2 of the Consolidated Financial Statements.
Interest Rate
From time to time, the Company enters into various interest rate hedging transactions for the purpose of managing exposure to fluctuations in interest rates, establishing rates in anticipation of future debt issuances, and converting a portion of its fixed-rate long-term debt to floating-rate debt. The Company uses interest rate swaps and treasury locks as part of its interest rate risk management strategy. BNSF’s measurement of the fair value of interest rate swaps and treasury locks is based on estimates of the mid-market values for the transactions provided by the counterparties to these agreements. See Note 2 of the Consolidated Financial Statements.
Employee and Labor Relations
Approximately 89 percent of BNSF Railway’s employees are union-represented. BNSF Railway’s union employees work under collective bargaining agreements with various labor organizations. A negotiating process for new, major collective bargaining agreements covering all of BNSF Railway’s union employees has been underway since the bargaining round was initiated November 1, 2004. Wages, health and welfare benefits, work rules and other issues have traditionally been addressed through industry-wide negotiations. These negotiations have generally taken place over an extended period of time and have previously not resulted in any extended work stoppages. The existing agreements have remained in effect and will continue to remain in effect until new agreements are reached or the Railway Labor Act’s procedures (which include mediation, cooling-off periods and the possibility of presidential intervention) are exhausted. Agreements undergoing renegotiation in the current bargaining round provide for periodic wage increases until new agreements are reached.
Unions with an Agreement under the Previous Bargaining Round
In the previous bargaining round, which began on November 1, 1999, BNSF’s entire unionized workforce, reached final agreements that cover periods through December 2004.
2005 Bargaining Round
The current bargaining round for all unions with contracts that came into effect after January 1, 2005, began on and after November 1, 2004, with the serving of Section 6 notices, which are each side’s initial proposals. BNSF is participating in coordinated national handling of these proposals. The current agreements remain in effect until new agreements are reached or until changes to the existing agreements are made.
37
Accounting Pronouncements
See Note 9 of the Consolidated Financial Statements for information about recent accounting pronouncements that may have an impact on BNSF.
38
Forward-Looking Information
To the extent that statements made by the Company relate to the Company’s future economic performance or business outlook, projections or expectations of financial or operational results, or refer to matters that are not historical facts, such statements are “forward-looking” statements within the meaning of the federal securities laws. Forward-looking statements involve a number of risks and uncertainties, and actual performance or results may differ materially. Important factors that could cause actual performance or results to differ materially include, but are not limited to:
•Economic and industry conditions: material adverse changes in economic or industry conditions, both in the United States and globally, changes in customer demand, effects of adverse economic conditions affecting shippers, adverse economic conditions in the industries and geographic areas that produce and consume freight, adverse economic conditions in BNSF’s supplier base, competition and consolidation within the transportation industry, the extent to which BNSF is successful in gaining new long-term relationships with customers or retaining existing ones, changes in fuel prices and other key materials and disruptions in supply chains for these materials, changes in the securities and capital markets, and changes in crew availability, labor costs and labor difficulties, including stoppages affecting either BNSF’s operations or our customers’ abilities to deliver goods to BNSF for shipment;
•Legal and regulatory factors: developments and changes in laws and regulations, including those affecting train operations or the marketing of services, the ultimate outcome of shipper and rate claims subject to adjudication, economic re-regulation of the rail industry, developments in environmental investigations or proceedings with respect to rail operations or current or past ownership or control of real property, and developments or other types of claims and litigation, including those relating to personal injuries, asbestos and other occupational disease, the release of hazardous materials, environmental contamination and damage to property; and
•Operating factors: technical difficulties, changes in operating conditions and costs, commodity concentrations, the availability of equipment and human resources to meet changes in demand, the extent of the Company’s ability to achieve its operational and financial initiatives and to contain costs, the effectiveness of steps taken to maintain and improve operations and network fluidity, including the management of the amount of traffic on the system to meet demand and the ability to acquire sufficient resources to meet that demand, congestion on other railroads, disruptions to BNSF’s technology network including computer systems and software, as well as natural events such as severe weather, fires, floods and earthquakes or man-made or other disruptions of BNSF Railway’s operating systems, structures, or equipment including the effects of acts of terrorism on the Company’s system or other railroads’ systems.
The Company cautions against placing undue reliance on forward-looking statements, which reflect its current beliefs and are based on information currently available to it as of the date a forward-looking statement is made. The Company undertakes no obligation to revise forward-looking statements to reflect future events, changes in circumstances, or changes in beliefs. In the event the Company does update any forward-looking statement, no inference should be made that the Company will make additional updates with respect to that statement, related matters, or any other forward-looking statements. Any corrections or revisions may appear in the Company’s public filings with the Securities and Exchange Commission, which are accessible at www.sec.gov, and on the Company’s website at www.bnsf.com, and which investors are advised to consult.
39
Item 3. Quantitative and Qualitative Disclosures About Market Risk
In the ordinary course of business, BNSF utilizes various financial instruments that inherently have some degree of market risk. The following table summarizes the impact of these hedging activities on the Company’s results of operations (in millions):
| | | | | | | | |
Quarter ended September 30,
| | 2005
| | | 2004
| |
Fuel hedge benefit (including ineffective portion of unexpired hedges) | | $ | 161 | | | $ | 95 | |
Interest rate hedge benefit | | | 4 | | | | 10 | |
| | |
|
|
| |
|
|
|
Total hedge benefit | | $ | 165 | | | $ | 105 | |
Tax effect | | | (63 | ) | | | (41 | ) |
| | |
|
|
| |
|
|
|
Hedge benefit, net of tax | | $ | 102 | | | $ | 64 | |
| | |
|
|
| |
|
|
|
| | |
Nine months ended September 30,
| | 2005
| | | 2004
| |
Fuel hedge benefit (including ineffective portion of unexpired hedges) | | $ | 390 | | | $ | 212 | |
Interest rate hedge benefit | | | 15 | | | | 29 | |
| | |
|
|
| |
|
|
|
Total hedge benefit | | $ | 405 | | | $ | 241 | |
Tax effect | | | (155 | ) | | | (92 | ) |
| | |
|
|
| |
|
|
|
Hedge benefit, net of tax | | $ | 250 | | | $ | 149 | |
| | |
|
|
| |
|
|
|
The Company’s fuel-hedge benefit is due to increases in fuel prices subsequent to the initiation of various hedges. The interest rate hedge benefit is the result of the conversion of fixed-rate long-term debt to floating-rate debt coupled with lower interest rates. The information presented in the Management’s Discussion and Analysis of Financial Condition and Results of Operations section and Notes 2 and 4 of the Consolidated Financial Statements describe significant aspects of BNSF’s financial instrument programs which have a material market risk. Additionally, the Company has a fuel surcharge program (see further discussion under the revenue section of the Management’s Discussion and Analysis of Financial Condition and Results of Operations).
Commodity Price Sensitivity
BNSF engages in hedging activities to partially mitigate the risk of fluctuations in the price of its diesel fuel purchases. Existing hedge transactions as of September 30, 2005, are based on the front month settlement prices of NYMEX #2 heating oil (HO), West Texas Intermediate crude oil (WTI), or the HO refining spread (HO-WTI) which is defined as the difference between HO and WTI. A WTI hedge combined with a HO-WTI hedge will result in the equivalent of a HO hedge. For swaps, BNSF either pays or receives the difference between the hedge price and the actual average price of the hedge commodity during a specified determination period for a specified number of gallons. For costless collars, if the average hedge commodity price for a specified determination period is greater than the cap price, BNSF receives the difference for a specified number of gallons. If the average commodity price is less than the floor price, BNSF pays the difference for a specified number of gallons. If the commodity price is between the floor price and the cap price, BNSF neither makes nor receives a payment. Hedge transactions are generally settled with the counterparty in cash. Based on historical information, BNSF believes there is a significant correlation between the market prices for diesel fuel, WTI, and HO.
At September 30, 2005, BNSF had recorded in the Consolidated Balance Sheet a fuel-hedging asset of $575 million for fuel hedges covering 2005 through 2007.
40
The following table is an estimate of the impact to earnings that could result from hypothetical price changes during the twelve month period ending September 30, 2006 and the balance sheet impact from the hypothetical price changes, both based on hedge position at September 30, 2005:
Sensitivity Analysis
| | | | |
Hedged commodity price change
| | Fuel-hedge annual pre-tax earnings impact
| | Balance Sheet impact of change in fuel-hedge fair value
|
| | |
| 10 percent increase | | $88 million increase | | $112 million increase |
| 10 percent decrease | | $88 million decrease | | $109 million decrease |
Based on fuel consumption during the twelve month period ending September 30, 2005 of 1,391 million gallons and fuel prices during that same period, excluding the impact of the Company’s hedging activities, a ten percent increase or decrease in the commodity price per gallon would result in an approximate $225 million increase or decrease, respectively, in fuel expense (pre-tax) on an annual basis. This impact would be substantially offset by changes in revenues and fuel expenses related to the Company’s fuel surcharge program and fuel hedging activities, respectively.
At September 30, 2005, BNSF maintained fuel inventories for use in normal operations which were not material to BNSF’s overall financial position and, therefore, represent no significant market exposure. Further information on fuel hedges is incorporated by reference from Note 2 to the Consolidated Financial Statements.
Interest Rate Sensitivity
From time to time, BNSF enters into various interest rate hedging transactions for purposes of managing exposure to fluctuations in interest rates and establishing rates in anticipation of future debt issuances as well as to convert a portion of its fixed-rate debt to floating-rate debt. BNSF’s measurement of fair value of interest rate swaps is based on estimates of the mid-market values for the transactions provided by the counterparties to these agreements.
At September 30, 2005, the fair value of BNSF’s debt, excluding capital leases, was $6,463 million, and the interest rate hedging asset was $16 million.
The following table is an estimate of the impact to earnings and the fair value of the total debt and interest rate hedges that could result from hypothetical interest rate changes during the twelve month period ending September 30, 2006 based on debt levels as of September 30, 2005:
Sensitivity Analysis
| | | | | | |
Hypothetical change in interest rates
| | Floating rate debt - Annual pre-tax earnings impact
| | Change in fair value
|
| | | Total debt
| | Interest rate hedges
|
| | | |
| 1 percent decrease | | $14 million increase | | $568 million increase | | $19 million decrease |
| 1 percent increase | | $14 million decrease | | $484 million decrease | | $9 million increase |
Further information on interest rate hedges is incorporated by reference from Note 2 to the Consolidated Financial Statements. Information on the Company’s debt which may be sensitive to interest rate fluctuations is incorporated by reference from Note 4 to the Consolidated Financial Statements.
41
Item 4. Controls and Procedures
Based on their evaluation as of the end of the period covered by this quarterly report on Form 10-Q, BNSF’s principal executive officer and principal financial officer have concluded that BNSF’s disclosure controls and procedures (as defined in Rules 13a-15(e) and 15d-15(e) of the Securities Exchange Act of 1934) are effective to ensure that information required to be disclosed by BNSF in the reports that it files or submits under the Securities Exchange Act of 1934 is recorded, processed, summarized, and reported within the time periods specified in Securities and Exchange Commission rules and forms and that such information is accumulated and communicated to BNSF’s management, including its principal executive and principal financial officers, as appropriate to allow timely decisions regarding required disclosure. Additionally, as of the end of the period covered by this report, BNSF’s principal executive officer and principal financial officer have concluded that there have been no changes in BNSF’s internal control over financial reporting that occurred during BNSF’s third fiscal quarter that have materially affected, or are reasonably likely to materially affect, BNSF’s internal control over financial reporting.
42
BURLINGTON NORTHERN SANTA FE CORPORATION and SUBSIDIARIES
PART II OTHER INFORMATION
Item 1. Legal Proceedings
BNSF Railway was notified by the Minnesota Pollution Control Agency (MPCA) of a proposed Stipulation Agreement to resolve alleged environmental violations with respect to BNSF Railway’s Dilworth, Minnesota fueling facility. The MPCA alleges violations involving BNSF Railway’s wastewater permit, tank regulations, and hazardous waste regulations. In October 2005, the MPCA presented BNSF Railway with proposed monetary sanctions proposed to be included in a settlement agreement. Although the parties are negotiating a settlement, it is possible that resolution of this matter could result in monetary sanctions exceeding $100 thousand.
Item 2. Unregistered Sales of Equity Securities and Use of Proceeds
Common Stock Repurchases
The following table presents repurchases by the Company of its common stock for each of the three months for the quarter ended September 30, 2005 (shares in thousands):
Issuer Purchases of Equity Securities
| | | | | | | | | |
Period
| | Total Number of Shares Purchaseda
| | Average Price Paid Per Share
| | Total Number of Shares Purchased as Part of Publicly Announced Plans or Programsb
| | Maximum Number of Shares that May Yet Be Purchased Under the Plans or Programs
|
July 1 –31 | | 7 | | $ | 51.12 | | — | | 7,564 |
August 1 –31 | | 1,364 | | $ | 54.64 | | 1,354 | | 6,210 |
September 1 –30 | | 1,190 | | $ | 54.23 | | 1,050 | | 5,160 |
| | |
| |
|
| |
| |
|
Total | | 2,561 | | $ | 54.44 | | 2,404 | | |
| | |
| |
|
| |
| | |
| a | Total number of shares purchased includes approximately 157,000 shares where employees delivered already owned shares or used an attestation procedure to satisfy the exercise price of stock options or the withholding of tax payments. Total number of shares purchased does not include approximately 48,000 shares acquired from employees to satisfy tax withholding. |
| b | On July 17, 1997, the Board initially authorized and the Company announced the repurchase of up to 30 million shares of the Company’s common stock from time to time in the open market. On December 9, 1999, April 20, 2000, September 21, 2000 and January 16, 2003, the Board authorized extensions of the BNSF share repurchase program, adding 30 million shares at each date for a total of 150 million shares authorized. The share repurchase program does not have an expiration date. |
Item 6. Exhibits
See Index to Exhibits on page E-1 for a description of the exhibits filed as part of this report.
43
SIGNATURES
Pursuant to the requirements of the Securities Exchange Act of 1934, the registrant has duly caused this report to be signed on its behalf by the undersigned thereunto duly authorized.
| | |
| BURLINGTON NORTHERN SANTA FE CORPORATION |
| (Registrant) |
| |
| By: | | /s/ Thomas N. Hund
|
| | | Thomas N. Hund |
| | | Executive Vice President and Chief Financial Officer |
| | | (On behalf of the Registrant and |
| | | as principal financial officer) |
Dated: October 25, 2005
S-1
BURLINGTON NORTHERN SANTA FE CORPORATION and SUBSIDIARIES
Exhibit Index
| | |
| 12.1 | | Computation of Ratio of Earnings to Fixed Charges |
| |
| 15.1 | | Independent Registered Public Accounting Firm’s Awareness Letter |
| |
| 31.1 | | Principal Executive Officer’s Certifications Pursuant to Rule 13a-14(a) (Section 302 of the Sarbanes-Oxley Act of 2002) |
| |
| 31.2 | | Principal Financial Officer’s Certifications Pursuant to Rule 13a-14(a) (Section 302 of the Sarbanes-Oxley Act of 2002) |
| |
| 32.1 | | Certification Pursuant to Rule 13a-14(b) and 18 U.S.C. § 1350 (Section 906 of the Sarbanes-Oxley Act of 2002) |
E-1