UNITED STATES
SECURITIES AND EXCHANGE COMMISSION
Washington, D.C. 20549
FORM N-CSR
CERTIFIED SHAREHOLDER REPORT OF REGISTERED MANAGEMENT
INVESTMENT COMPANIES
Investment Company Act file number 811-08932
Artisan Funds, Inc.
(Exact name of registrant as specified in charter)
875 East Wisconsin Avenue, Suite 800
Milwaukee, WI 53202
(Address of principal executive offices) (Zip Code)
| | |
| Janet D. Olsen | | Cameron S. Avery |
| Artisan Funds, Inc. | | Bell, Boyd & Lloyd LLC |
| 875 East Wisconsin Avenue, #800 | | Three First National Plaza, #3100 |
| Milwaukee, Wisconsin 53202 | | Chicago, IL 60602 |
(Name and address of agents for service)
Registrant’s telephone number, including area code: (414) 390-6100
Date of fiscal year end: 09/30/04
Date of reporting period: 09/30/04
Item 1. Reports to Shareholders.

ANNUAL
REPORT
SEPTEMBER 30, 2004
ARTISAN INTERNATIONAL FUND
ARTISAN INTERNATIONAL SMALL CAP FUND
ARTISAN INTERNATIONAL VALUE FUND
ARTISAN MID CAP FUND
ARTISAN MID CAP VALUE FUND
ARTISAN SMALL CAP FUND
ARTISAN SMALL CAP VALUE FUND
Artisan Funds, Inc.
INVESTOR SHARES
ARTISAN FUNDS
P.O. BOX 8412
BOSTON, MA 02266-8412
This report and the audited financial statements contained herein are provided for the general information of the shareholders of Artisan Funds. This report is not authorized for distribution to prospective investors unless preceded or accompanied by an effective prospectus. For more complete information on any Fund, including fees and expenses, please call 800.344.1770 or visit our website at www.artisanfunds.com for a free prospectus. Read it carefully before you invest or send money.
Company discussions are for illustration only and are not intended as recommendations of individual stocks. The discussions present information about the companies believed to be accurate, and the views of the portfolio manager(s), as of September 30, 2004. That information and those views may change, and the Funds disclaim any obligation to advise shareholders of any such changes. Artisan International Fund and Artisan Mid Cap Fund offer institutional classes of shares for institutional investors meeting certain minimum investment requirements. A report on each institutional class is available under separate cover.
Artisan Funds offered through Artisan Distributors LLC, member NASD.
TABLE OF CONTENTS
AVERAGE ANNUAL TOTAL RETURNS (as of 9/30/04)
| | | | | | | | | | | | |
| | | 1-Year | | | 3-Year | | | 5-Year | | | Since
Inception | |
Artisan International Fund (inception 12/28/95) | | 18.04 | % | | 5.54 | % | | 3.73 | % | | 11.93 | % |
Artisan International Small Cap Fund (inception 12/21/01) | | 22.66 | | | NA | | | NA | | | 21.15 | |
Artisan International Value Fund (inception 9/23/02) | | 32.81 | | | NA | | | NA | | | 37.49 | |
Artisan Mid Cap Fund (inception 6/27/97) | | 13.02 | | | 8.44 | | | 11.45 | | | 18.22 | |
Artisan Mid Cap Value Fund (inception 3/28/01) | | 29.60 | | | 20.41 | | | NA | | | 14.28 | |
Artisan Small Cap Fund (inception 3/28/95) | | 20.67 | | | 11.06 | | | 7.89 | | | 9.00 | |
Artisan Small Cap Value Fund (inception 9/29/97) | | 30.76 | | | 19.86 | | | 16.30 | | | 12.60 | |
The performance quoted represents past performance, which does not guarantee future results. The investment return and principal value of an investment in a Fund will fluctuate, so that an investor’s shares in the Fund, when redeemed, may be worth more or less than their original cost. Current performance may be lower or higher than the performance data quoted. For current to most recent month-end performance information, visit www.artisanfunds.com or call 800.344.1770. The performance information shown for Artisan International Fund, Artisan International Small Cap Fund and Artisan International Value Fund does not reflect the deduction of a 2% redemption fee on shares held by an investor for 90 days or less and, if reflected, the fee would reduce the performance quoted. The performance of Artisan International Value Fund and Artisan Mid Cap Value Fund reflects Artisan Partners’ undertaking to limit each Fund’s expenses, which may be terminated at any time, has been in effect since each Fund’s inception, and has had a material impact on each Fund’s performance, which would have been lower in its absence. Artisan International Small Cap Fund’s investments in initial public offerings (IPOs) made a material contribution to the Fund’s performance. IPO investments are not an integral component of the Fund’s investment process and may not be available in the future.
Artisan International, International Small Cap & International Value Funds: International investments involve special risks, including currency fluctuation, lower liquidity, different accounting methods and economic and political systems and higher transaction costs. These risks typically are greater in emerging markets. Artisan International and International Small Cap Funds invest in growth stocks, which may underperform other asset types during a given period. Artisan International Small Cap Fund invests in the stocks of smaller companies, which tend to be more volatile and less liquid than those of larger companies, have underperformed the stocks of larger companies during some periods and tend to have a shorter history of operations than larger companies. Artisan International Value Fund invests in value stocks, which may underperform other asset types during a given period. In addition, the Fund may invest a significant portion of its assets in small and medium-sized companies, which tend to be more volatile and less liquid than those of large companies, have underperformed the stocks of larger companies during some periods and tend to have a shorter history of operations than larger companies.
Artisan Mid Cap & Mid Cap Value Funds: Stocks of medium-sized companies tend to be more volatile than those of larger companies and have underperformed the stocks of small and large companies during some periods. Artisan Mid Cap Fund invests primarily in growth stocks, which may underperform other asset types during a given period. Artisan Mid Cap Value Fund invests primarily in value stocks, which may underperform other asset types during a given period.
Artisan Small Cap & Small Cap Value Funds: Stocks of smaller companies tend to be more volatile and less liquid than those of larger companies, have underperformed the stocks of larger companies during some periods and tend to have a shorter history of operations than larger companies. Artisan Small Cap Fund invests primarily in growth stocks, which may underperform other asset types during a given period. Artisan Small Cap Value Fund invests primarily in value stocks, which may underperform other asset types during a given period.
ARTISAN INTERNATIONAL FUND (ARTIX)
| | |
| HIGHLIGHTS | | |
• During the twelve months ended September 30, 2004, Artisan International Fund produced a strong absolute return, but underperformed its benchmark, the MSCI EAFE® Index. • Our decision to invest in a select group
of emerging market stocks contributed | | strongly to performance compared to the benchmark. • The financials sector was a positive contributor to our return, but our average stock underperformed the benchmark sector return. |
| | | |
| INVESTMENT APPROACH | | |
| We use a bottom-up investment process to construct a portfolio of international growth companies of all market capitalizations. The investment team conducts its own fundamental analysis with particular emphasis on: | | 1) well-managed companies focused on increasing shareholder value; 2) sustainable growth prospects; 3) reasonable valuations; or 4) dominant or increasing market shares or direct exposure to an identified theme. |
| | | |
| PERFORMANCE REVIEW | | |
| From the Fund’s inception through September 30, 2004, Artisan International Fund has outpaced the MSCI EAFE® Index by a wide margin. |
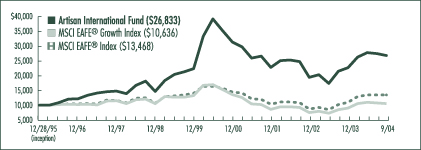
GROWTH OF AN ASSUMED $10,000 INVESTMENT (12/28/95 to 9/30/04)
AVERAGE ANNUAL TOTAL RETURNS (as of 9/30/04)
| | | | | | | | | | | | |
| Fund / Index | | 1-Year | | | 3-Year | | | 5-Year | | | Since
Inception | |
Artisan International Fund | | 18.04 | % | | 5.54 | % | | 3.73 | % | | 11.93 | % |
MSCI EAFE® Growth Index | | 16.66 | | | 7.12 | | | -4.37 | | | 0.71 | |
MSCI EAFE® Index | | 22.08 | | | 9.12 | | | -0.85 | | | 3.46 | |
The performance quoted represents past performance, which does not guarantee future results. The investment return and principal value of an investment in the Fund will fluctuate, so that an investor’s shares in the Fund, when redeemed, may be worth more or less than their original cost. Current performance may be lower or higher than the performance data quoted. For current to most recent month-end performance information, visit www.artisanfunds.com or call 800.344.1770. The graph and table above do not reflect the deduction of taxes that a shareholder would pay on distributions or sale of Fund shares. The performance shown does not reflect the deduction of a 2% redemption fee on shares held by an investor for 90 days or less and, if reflected, the fee would reduce the performance quoted. See page 81 for a description of each index.
02
TWO
INVESTING ENVIRONMENT
During the twelve months ended September 30, 2004, international equity markets recorded strong gains, outpacing their domestic counterparts. Returns for U.S. investors were enhanced by a weak dollar, which led to profitable currency conversions when local currencies were translated into U.S. dollars at the cheaper rate. Small-caps as a group performed better than large-caps, and value stocks outperformed growth stocks by a wide margin.
The strong stock market returns over the fiscal year as a whole masked the fact that sentiment was quite different in the first half of the fiscal year than in the second half. The first half of the year seemed to reflect a synchronized global economic recovery aided by a favorable interest rate environment. The second half of the fiscal year was marked by uncertainty as the outlook for the global economy became less clear. Perhaps the initial thread of doubt that entered investors’ minds was the prospect of rising interest rates in the U.S., driven by a pick up in inflation. Other concerns included slowing economic growth in China, continued turmoil in Iraq and terrorist activity such as the Madrid attack and Russian school tragedy.
With all of those factors weighing on investors’ minds, the spike in oil prices had a dampening effect on the markets. On the other hand, rising energy prices had a very positive effect on energy stocks, which were among the leading performers in the MSCI EAFE® Index. Oil wasn’t the only commodity that saw price increases throughout the year. Generally rising commodities prices gave a boost to the materials sector, making it a leading performer. The technology sector was the worst performing sector in our benchmark, followed by consumer staples and telecommunications. Most of the other sectors generated returns roughly on par with the index average.
On a regional basis many emerging markets, led by markets in Latin America, turned in very strong returns. Europe and the Far East (excluding Japan) also performed well. Japan was a laggard among developed markets, but still managed to turn in low double-digit returns.
PERFORMANCE DISCUSSION
In the Fund, every sector contributed positively to performance, but our largest gains compared to the benchmark were in technology, telecommunications and energy. Our returns in the financials and consumer sectors, although positive, were below the benchmark. Regionally, Japan and our emerging markets stocks contributed positively compared to our benchmark index, while Europe detracted from relative results, due in part to our lower exposure to the U.K.
TOP 10 HOLDINGS
| | | | | |
| Company Name | | Country | | % | |
Telefonaktiebolaget LM Ericsson | | Sweden | | 3.2 | % |
Fortis | | Netherlands | | 3.0 | |
UBS AG | | Switzerland | | 2.9 | |
Kingfisher PLC | | United Kingdom | | 2.8 | |
Tesco PLC | | United Kingdom | | 2.7 | |
ITV PLC | | United Kingdom | | 2.6 | |
Honda Motor Co., Ltd. | | Japan | | 2.4 | |
Nestle S.A. | | Switzerland | | 2.1 | |
EnCana Corporation | | Canada | | 2.1 | |
Allianz AG | | Germany | | 2.1 | |
Total | | | | 25.9 | % |
As a percentage of total net assets as of 9/30/04. Top 10 Holdings are determined by issuer.
SECTOR REVIEW
We focused on just a few select industry-leading technology companies last year. The decision to limit the number of names we owned in the area enhanced our relative return in a tough period for the group. Performance also was boosted by a price gain of more than 100% from Telefonaktiebolaget LM Ericsson (Ericsson), a Swedish manufacturer of wireless communications equipment. Ericsson underwent a significant restructuring program driven by a new CEO and management team that aggressively pushed through cost cutting goals ahead of expectations. That led to a strong increase in profitability, which drove up the company’s share price. Unfortunately, we were not immune to the general softness in the sector as our position in ASML Holding N.V. declined. ASML softened in anticipation of a potential industry-wide slowdown in semiconductor equipment orders. We used the weakness to add to our holdings.
Our holdings in the telecommunications sector outpaced the benchmark sector return despite a less favorable contribution from currency translation gains. Leading the way were Telenor ASA, Cesky Telecom, A.S., and
03
THREE
Chunghwa Telecom Co., Ltd. All three stocks reported good revenue growth.
Supply concerns and strong demand were the driving factors behind the high price of oil, which provided a stiff tailwind for performance in the energy sector. We were underweighted in the energy sector, but our stocks advanced even more than the lofty index sector return. China’s seemingly insatiable demand for energy led us to purchase Sinopec, China’s largest oil refiner, and CNOOC, which controls offshore gas assets. Both stocks produced meaningful gains and we sold both during the period. We also sold Spanish oil company Repsol YPF, S.A. Its earnings and production were strong, but we elected to secure our gains as we thought its upside had decreased. We used some of the proceeds from those sales to buy two Italian companies: Saipem S.p.A. (oil services) and ENI S.p.A. (oil and gas exploration). Two other very solid gainers were Russian oil company Lukoil and Brazilian oil company Petroleo Brasileiro S.A. (Petrobras). One catalyst behind Lukoil’s ascent was the Russian government’s decision to sell its stake in the company.
SECTOR DIVERSIFICATION
| | | | | | |
| Sector | | 9/30/03 | | | 9/30/04 | |
Consumer Discretionary | | 24.9 | % | | 23.9 | % |
Consumer Staples | | 16.5 | | | 11.9 | |
Energy | | 4.7 | | | 8.2 | |
Financials | | 24.2 | | | 26.8 | |
Healthcare | | 6.9 | | | 4.5 | |
Industrials | | 3.4 | | | 4.7 | |
Information Technology | | 1.9 | | | 6.4 | |
Materials | | 7.4 | | | 4.8 | |
Telecommunication Services | | 7.9 | | | 6.9 | |
Utilities | | 0.3 | | | 0.7 | |
Other assets less liabilities | | 1.9 | | | 1.2 | |
Total | | 100.0 | % | | 100.0 | % |
As a percentage of total net assets as of 9/30/03 and 9/30/04, respectively.
Our financial holdings were a contributor to our underperformance during the fiscal year. As the year wore on, the potential for higher interest rates around the world and concerns about the rate of growth of the Japanese economy weighed on our positions. We used softness late in the period to build our holdings in several stocks that we purchased earlier in the fiscal year: Orix, Bank of Yokohama and Credit Saison. We continue to hold Japanese brokerage company Nikko Cordial Corp., which hurt the Fund’s return. It was pressured by Citigroup’s announced reduction of its stake in the company. One of the better performers in the sector was Belgian financial services company Fortis, which benefited from lower loss provisions and an improved capital structure following the initial public offering of its U.S. insurance unit Assurant. Japanese consumer finance company Promise Co., Ltd. also did very well.
In the materials sector we were primarily hurt by the performance of Rhodia S.A., although Clariant AG was also weak. Rhodia management was trying to restructure, but the slow pace of progress relative to financing and liquidity concerns increased the risk and we closed out the position. Clariant was hurt by low cost competition in some of its product areas. Imperial Chemical Industries PLC was a bright spot. It disposed of a food ingredients unit in a continued restructuring effort and reported strong earnings growth.
Within the consumer sectors, the media industry is our largest overweight compared to the benchmark. A few of the leading performers in the Fund were French outdoor advertising company JC Decaux, Spanish media company Promotora de Informaciones, S.A. (Prisa) and Spanish language broadcaster Grupo Televisa S.A. JC Decaux improved profitability and was the subject of merger speculation. Prisa benefited from solid sales growth. Televisa announced a restructuring of its holding company, which eliminated a potential overhang on the stock without diluting earnings. One media holding that trailed during the last part of the year was British Sky Broadcasting (BSkyB), a pay TV operator. BSkyB’s shares came under pressure when it announced an unexpected change in strategy, aimed at boosting subscriber growth, which may lead to lower profitability in the short-term.
The performance of food caterer Compass Group and food retailer Carrefour was a disappointment. Compass dropped late in the period after management unexpectedly announced that future cash flows would be lower than expected due to new payment terms with suppliers primarily in the U.K. Carrefour released a weak sales report and we sold our position based on the slower growth prospects.
04
FOUR
COUNTRY REVIEW
Overall, our country allocations contributed strongly to relative performance. One of the chief reasons was our underweight position in Japan, which weakened amid indications of a cooling Chinese economy and declining exports. However, economic figures at the end of the period showed that household consumption continued to strengthen, employment improved and business confidence reached its highest level since the burst of the asset bubble in 1991. Our emerging markets stocks were another source of positive relative gains as they outpaced the Index overall.
REGION ALLOCATION
| | | | | | |
| Region | | 9/30/03 | | | 9/30/04 | |
Europe | | 74.6 | % | | 65.6 | % |
Asia/Pacific | | 13.8 | | | 25.0 | |
Latin America | | 6.8 | | | 5.3 | |
North America | | 2.9 | | | 2.9 | |
As a percentage of total net assets as of 9/30/03 and 9/30/04, respectively.
TOP 5 COUNTRY ALLOCATIONS
| | | |
| Country | | % | |
Japan | | 18.5 | % |
United Kingdom | | 16.7 | |
Switzerland | | 11.5 | |
Germany | | 7.9 | |
Spain | | 5.4 | |
As a percentage of total net assets as of 9/30/04.
In Europe, the U.K. was a solid performer and our underweight position hurt performance. Its economy grew at a fast pace, leading to several interest rate increases by the Bank of England. In Continental Europe, there were improvements in domestic consumption and manufacturing, but economic growth was not on par with the U.K.
FUND CHANGES
We continued to focus on our long-term investment themes throughout the year. As a result, the changes to our regional allocations and sector weights were primarily due to individual security decisions. On a regional basis, the extension of our themes to the Pacific resulted in a marked increase to our Japanese exposure and smaller increases to Singapore and China. Our emerging markets exposure also increased with the addition of a few select stocks. As a result, the Fund’s allocation to Europe fell and for the first time in a considerable period we are underweighted in European stocks compared to our benchmark. The country weights within the region that fell the most were Germany, Switzerland and the U.K.
We reduced our weighting in consumer staples and healthcare during the fiscal year and increased financials and energy. The change in consumer staples was due to the sale of Carrefour and significant reductions in Henkel KGaA, Diageo PLC and Nestle S.A. Other consumer transactions included the sales of British retailer Next PLC after it reached our price target and Dutch publisher Wolters Kluwer N.V. in favor of better alternatives. We used some of the capital to purchase PagesJaunes S.A., France’s leading telephone directories publisher, and Pearson, which publishes the Financial Times and is strong in higher education publishing.
In healthcare, we sold both Novartis AG and Sanofi-Synthelabo S.A., which got into a bidding war to buy Aventis S.A. We used proceeds from those sales to partially fund the additions in energy and Japanese financials discussed above.
FUND STATISTICS
| | |
Net Assets | | $ 9.8 billion |
Number of Holdings | | 119 |
Weighted Average Market Cap | | $ 26.1 billion |
Weighted Average Growth Rate (3-5 yr) | | 11.0% |
Weighted Harmonic Average P/E (2004E) | | 16.3X |
Source: FactSet/Artisan Partners. All statistics are as of 9/30/04.
05
FIVE
ARTISAN INTERNATIONAL SMALL CAP FUND (ARTJX)
| | |
| HIGHLIGHTS | | |
• During the twelve months ended September 30, 2004, Artisan International Small Cap Fund produced a strong absolute return, but underperformed the MSCI EAFE Small Cap® Index. | | • The two strongest contributors to Fund performance compared to the benchmark were the telecommunication services and industrials sectors. • Our stocks in the consumer discretionary sector trailed the benchmark sector return. |
| | | |
| INVESTMENT APPROACH | | |
| We use a bottom-up investment process to construct a portfolio of smaller international growth companies. The investment team conducts its own fundamental analysis with particular emphasis on: | | 1) well-managed companies focused on increasing shareholder value; 2) sustainable growth prospects; 3) reasonable valuations; or 4) strong or increasing market shares or direct exposure to an identified theme. |
| | | |
| PERFORMANCE SUMMARY | | |
| Artisan International Small Cap Fund performed roughly in line with the MSCI EAFE Small Cap® Index since its inception, which generally has been a favorable period for small-cap stocks. |
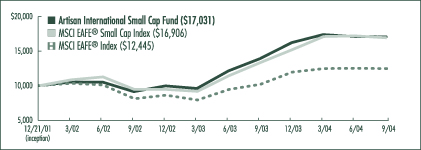
GROWTH OF AN ASSUMED $10,000 INVESTMENT (12/21/01 to 9/30/04)
AVERAGE ANNUAL TOTAL RETURNS (as of 9/30/04)
| | | | | | |
| Fund / Index | | 1-Year | | | Since
Inception | |
Artisan International Small Cap Fund | | 22.66 | % | | 21.15 | % |
MSCI EAFE® Small Cap Index | | 26.88 | | | 20.83 | |
MSCI EAFE® Index | | 22.08 | | | 8.20 | |
The performance quoted represents past performance, which does not guarantee future results. The investment return and principal value of an investment in the Fund will fluctuate, so that an investor’s shares in the Fund, when redeemed, may be worth more or less than their original cost. Current performance may be lower or higher than the performance data quoted. For current to most recent month-end performance information, visit www.artisanfunds.com or call 800.344.1770. The graph and table above do not reflect the deduction of taxes that a shareholder would pay on distributions or sale of Fund shares. The performance shown does not reflect the deduction of a 2% redemption fee on shares held by an investor for 90 days or less and, if reflected, the fee would reduce the performance quoted. The Fund’s investments in initial public offerings (IPOs) made a material contribution to the Fund’s performance. IPO investments are not an integral component of the Fund’s investment process and may not be available in the future. See page 81 for a description of each index.
06
SIX
MARKET OVERVIEW
During the twelve months ended September 30, 2004, international small-cap stocks recorded strong gains, generally outpacing their domestic counterparts. Returns for U.S. investors were enhanced by a relatively weak dollar, which led to profitable currency conversions when local currencies were translated into U.S. dollars at the cheaper rate.
During the first half of the year, it appeared – for the first time since the 1980s – as though we were in the midst of a synchronized global economic recovery. Relatively low interest rates around the world promoted economic growth, which contributed to the strong performance of riskier assets such as small-cap stocks. Unfortunately, sentiment during the second half was quite different. The second half of the fiscal year was marked by uncertainty as the outlook for the global economy became less clear. Perhaps the initial thread of doubt that entered investors’ minds was the prospect of rising interest rates in the U.S., driven by an increase in inflation. Other concerns included slowing economic growth in China, continued turmoil in Iraq and terrorist activity such as the Madrid attack and Russian school tragedy.
With all of those factors in mind, a rise in oil prices had a dampening effect on the markets. On the other hand, it had an extremely positive effect on small-cap energy stocks, although they represent a small portion of the MSCI EAFE® Small Cap Index. Other strong performers included the materials sector, as commodity prices rose during the year, and the utilities, financials and consumer discretionary sectors. The technology sector was the worst performing sector in our benchmark followed by consumer staples and telecommunications. On a regional basis, Japan was a laggard among developed markets (although it still produced positive returns), while several European markets, including the U.K., Spain and Sweden, outperformed.
PERFORMANCE DISCUSSION
We achieved our largest performance gains when compared to our benchmark in the industrials, telecommunications and healthcare sectors. The technology sector also contributed positively compared to the benchmark, but it was mainly because we have limited our exposure to the area. The consumer sectors were the source of our biggest negative contribution relative to the benchmark.
TOP 10 HOLDINGS
| | | | | |
| Company Name | | Country | | % | |
Banco Latinoamericano de Exportaciones, S.A., E Shares | | Panama | | 4.6 | % |
AO VimpelCom (ADR) | | Russia | | 3.4 | |
Fraser & Neave Limited | | Singapore | | 3.0 | |
Stada Arzneimittel AG | | Germany | | 2.5 | |
Clarins S.A. | | France | | 2.5 | |
Sulzer AG | | Switzerland | | 2.3 | |
Gruppo Editoriale L’Espresso S.p.A. | | Italy | | 2.3 | |
John Fairfax Holdings Limited | | Australia | | 2.2 | |
Wienerberger AG | | Austria | | 2.2 | |
Elekta AB, B shares | | Sweden | | 2.1 | |
Total | | | | 27.1 | % |
As a percentage of total net assets as of 9/30/04. Top 10 Holdings are determined by issuer.
SECTOR REVIEW
Our gains in the industrials sector were primarily due to strong security selection. Among the leaders were diversified Swiss industrial company Sulzer AG, South Korean shipbuilder Samsung Heavy Industries Co. Ltd. and Swiss drink carton maker SIG Holding AG. Each company had positive fundamental news. Sulzer divested certain non-strategic businesses, improved profitability and generated solid sales growth. Samsung Heavy Industries benefited from an upturn in demand that pushed its industry near capacity, which provided an opportunity to raise prices. We sold Samsung into its share price strength. SIG Holding sold its packaging business as part of a restructuring program to focus on its drink cartons and plastic bottles business.
The main contributor in the healthcare sector was Swiss dental implant manufacturer Straumann AG, which advanced more than 100%. Its earnings and sales rose firmly and it maintained a high level of profitability. Germany
07
SEVEN
and the U.S. were two markets that drove its robust financial gains, as demand was solid in both countries. Given our significant gains in the stock, we elected to trim back our position late in the fiscal year. U.K. diagnostics and life sciences company Amersham PLC was another strong performer. It received a takeover offer from GE very early in our fiscal year that was a premium to the share price at the time of the announcement. Elekta AB, a Swedish manufacturer of radiation surgery equipment, rose as profits and sales increased due to demand for its products. German pharmaceutical company Stada Arzneimittel AG was one stock in the area that had a negative impact on returns. It fell due to German healthcare reform, which required drug companies to pay a rebate on certain drugs. We used the weakness to add to our position.
Our holdings in the telecommunications sector significantly outpaced the benchmark sector return. Our best performer was Russian wireless provider AO VimpelCom. It advanced as subscriber growth in Russia’s growing mobile market accelerated and profitability improved due to limited marketing expenditures. Microcell Telecommunications, a Canadian wireless company, increased, in part, after a debt refinancing and rights offering, which alleviated the market’s capital concerns. We sold our position into the share price strength. Telekom Austria AG was also sold after recording a solid gain.
Our allocation to the consumer staples sector hurt results during the fiscal year as it underperformed the index return. Weakness at Russian juice and dairy producer Wimm-Bill-Dann Foods OJSC further dampened results. Belgian food retailer Colruyt N.V. and Lianhua Supermarket Holdings Limited, a Chinese supermarket operator, were two strong performers in the area. Colruyt showed strong same store sales growth due to its pricing advantage and differentiated business model. Lianhua also reported strong sales growth. We sold Lianhua into the strength.
Among our consumer discretionary holdings, several media stocks performed very well including Sogecable S.A., a dominant Spanish pay television provider; Gestevision Telecinco SA, a Spanish television broadcaster; and JC Decaux S.A., a French outdoor advertiser. However, those gains were not enough to offset losses at luxury boat maker Rodriguez Group and Thai real estate company Land & Houses Public Company Limited. Rodriguez Group declined early in our fiscal year following a report of lower than expected sales and we sold our position in favor of better alternatives. Rising development costs and lower than expected housing revenues hurt Land & Houses.
COUNTRY REVIEW
Our country allocations detracted from performance during the fiscal year. Our position in a number of emerging markets stocks was the main reason for the shortfall. The stocks we held in those countries, though they advanced over 19% as a group, underperformed the MSCI EAFE® Small Cap Index and did not benefit from the same positive currency translation contribution as many other markets.
REGION ALLOCATION
| | | | | | |
| Region | | 9/30/03 | | | 9/30/04 | |
Europe | | 63.8 | % | | 56.5 | % |
Asia/Pacific | | 21.0 | | | 25.1 | |
Latin America | | 7.2 | | | 8.3 | |
North America | | 4.8 | | | 3.5 | |
As a percentage of total net assets as of 9/30/03 and 9/30/04, respectively.
TOP 5 COUNTRY ALLOCATIONS
| | | |
| Country | | % | |
Switzerland | | 12.3 | % |
France | | 9.2 | |
United Kingdom | | 7.4 | |
Japan | | 5.6 | |
Russia | | 4.6 | |
As a percentage of total net assets as of 9/30/04.
The Fund’s underweight position in Japan, which trailed most other markets, offset some of the disadvantage. We will add names in Japan, but only when we are confident of their growth prospects and comfortable with their cost. The additions will not be based on an overriding macroeconomic assumption.
08
EIGHT
In Europe, our security selection was broadly positive as our average stock outpaced the average European stock in our benchmark. However, we were not optimally aligned to the best performing countries in the region, which hurt on a local and currency adjusted basis. The U.K. economy grew at a fast pace, leading to several interest rate increases by the Bank of England. In Continental Europe, there were improvements in domestic consumption and manufacturing.
SECTOR DIVERSIFICATION
| | | | | | |
| Sector | | 9/30/03 | | | 9/30/04 | |
Consumer Discretionary | | 29.4 | % | | 27.6 | % |
Consumer Staples | | 21.1 | | | 11.6 | |
Energy | | 1.5 | | | 5.2 | |
Financials | | 13.0 | | | 13.9 | |
Healthcare | | 11.2 | | | 8.0 | |
Industrials | | 8.2 | | | 13.1 | |
Information Technology | | 1.5 | | | 3.3 | |
Materials | | 3.1 | | | 3.1 | |
Telecommunication Services | | 7.8 | | | 5.8 | |
Utilities | | — | | | 1.8 | |
Other assets less liabilities | | 3.2 | | | 6.6 | |
Total | | 100.0 | % | | 100.0 | % |
As a percentage of total net assets as of 9/30/03 and 9/30/04, respectively.
FUND CHANGES
The one significant change to the portfolio during our fiscal year was a reduction in our exposure to the consumer sectors, mainly consumer staples. Our exposure to the healthcare sector also fell with the sales of Amersham and Nobel Biocare Holding AG. We used the capital from transactions in those sectors to purchase stocks in the technology, industrials and energy sectors. On a regional basis, the extension of our themes to the Pacific resulted in an increased exposure to Japan, Hong Kong, Thailand and South Korea. As a result, the Fund’s allocation to Europe decreased.
Within the consumer sectors, in addition to those stocks already mentioned, we trimmed or sold several beverage companies, food retailers, food products companies and select other holdings. Among our beverage stocks, we sold Baron de Lay S.A., Davide Campari Milano S.p.A., Grupo Modelo S.A. de C.V. and Koninklijke Grolsch N.V. In the food retail and food products areas, we closed out our positions in Laurus N.V., Seiyu Ltd., Chipita International S.A. and Wimm-Bill-Dann. Elsewhere, Agfa Gevaert N.V., a leading international imaging company, was undergoing a restructuring put in place by new management. It struggled during the period and we became concerned that the poor stock price performance, driven by pricing pressures and higher raw material costs, could continue and sold our position. We also sold Italian luxury goods company Bulgari and Japanese retailer Don Quijote Co.
In technology, we were cautious to add only those companies that we believed were of the highest quality and relative weakness in the sector provided an opportunity to add three stocks at more favorable prices. We purchased Sify Ltd., India’s premier Internet company; Logitech International S.A., a leading company in the computer and gaming peripherals market; and Fine Tec, which manufactures superconducting materials. The two largest purchases in the industrials sector were Austria-based Wienerberger, the world’s largest producer of bricks and SONAE SGPS S.A., which manufactures wood products among other operations.
At the beginning of our fiscal year, we only had one position in the energy sector, Precision Drilling Corporation. However, we added two service and equipment providers, Smedvig ASA and John Wood Group PLC, because we believed that there was a lack of investment in exploration spending that could create demand for their services.
FUND STATISTICS
| | |
Net Assets | | $ 515.0 million |
Number of Holdings | | 67 |
Median Market Cap | | $ 1.3 billion |
Weighted Average Market Cap | | $ 1.9 billion |
Weighted Average Growth Rate (3-5 yr) | | 13.7% |
Weighted Harmonic Average P/E (2004E) | | 16.6X |
Source: FactSet/Artisan Partners. All statistics are as of 9/30/04.
09
NINE
ARTISAN INTERNATIONAL VALUE FUND (ARTKX)
| | |
| HIGHLIGHTS | | |
• During the twelve months ended September 30, 2004, Artisan International Value Fund outperformed the MSCI EAFE® and MSCI EAFE® Value Indices. | | • The Fund’s return was driven by the strength of the team’s security selection. • Two consumer companies negatively influenced performance during the fiscal year. |
| | | |
| INVESTMENT APPROACH | | |
| We use a bottom-up investment process to construct a portfolio of undervalued non-U.S. companies. We conduct our own in-depth fundamental research with the goal of investing in companies at prices that reflect a significant discount to our estimate of economic | | value. Attention is also given to a company’s balance sheet, historic returns on its capital and management team. Assessing the tradeoffs among these factors is at the heart of our investment process. |
| | | |
| PERFORMANCE REVIEW | | |
Since inception, the net asset value of Artisan International Value Fund has increased by 90.19% on a cumulative basis and 37.49% on an annualized basis, outperforming our benchmarks. |
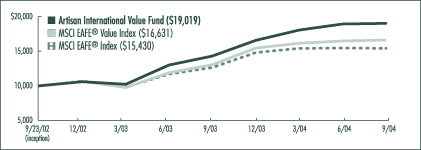
GROWTH OF AN ASSUMED $10,000 INVESTMENT (9/23/02 to 9/30/04)
AVERAGE ANNUAL TOTAL RETURNS (as of 9/30/04)
| | | | | | |
| Fund / Index | | 1-Year | | | Since
Inception | |
Artisan International Value Fund | | 32.81 | % | | 37.49 | % |
MSCI EAFE® Value Index | | 27.54 | | | 28.65 | |
MSCI EAFE® Index | | 22.08 | | | 23.96 | |
The performance quoted represents past performance, which does not guarantee future results. The investment return and principal value of an investment in the Fund will fluctuate, so that an investor’s shares in the Fund, when redeemed, may be worth more or less than their original cost. Current performance may be lower or higher than the performance data quoted. For current to most recent month-end performance information, visit www.artisanfunds.com or call 800.344.1770. The performance shown does not reflect the deduction of a 2% redemption fee on shares held by an investor for 90 days or less and, if reflected, the fee would reduce the performance quoted. The Fund’s performance reflects Artisan Partners’ undertaking to limit the Fund’s expenses, which may be terminated at any time, has been in effect since the Fund’s inception, and has had a material impact on the Fund’s performance, which would have been lower in its absence. The graph and table above do not reflect the deduction of taxes that a shareholder would pay on distributions or sale of Fund shares. See page 81 for a description of each index.
10
TEN
INVESTING ENVIRONMENT
Worldwide, most equity markets performed well over the last twelve months. The largest European markets—U.K., France and Germany—all increased by more than 25%. The Japanese market did not perform as well, but was up 11%. Asian markets (excluding Japan) increased by an average of 25% and Latin American markets averaged an increase of nearly 43%.
REGION ALLOCATION
| | | | | | |
| Region | | 9/30/03 | | | 9/30/04 | |
Europe | | 65.4 | % | | 70.1 | % |
Asia/Pacific | | 22.1 | | | 20.2 | |
Latin America | | 4.3 | | | 1.8 | |
North America | | 2.3 | | | 2.0 | |
As a percentage of total net assets as of 9/30/03 and 9/30/04, respectively.
TOP 5 COUNTRY ALLOCATIONS
| | | |
| Country | | % | |
United Kingdom | | 31.1 | % |
Switzerland | | 12.8 | |
Netherlands | | 7.2 | |
Italy | | 7.1 | |
France | | 7.0 | |
As a percentage of total net assets as of 9/30/04.
PERFORMANCE DISCUSSION
As we have written on a number of occasions, we are value investors and our sole focus is the purchase of shares in companies that are selling at a meaningful discount to our estimate of economic value. This process is a constant one and does not change based on any prevailing macroeconomic or stock market trend. Over time, we believe our success will be a function of how effectively we value companies, and how disciplined we are at buying them at a discount to fair value, and selling them when they approach fair value. Nevertheless, our performance can be influenced by macroeconomic factors as well as stock market trends over which we have no control. For example, although we do not generally try to manage the Fund’s exposure to currencies, foreign currency movements do influence total return. Over the past year, the euro, the British pound, the Swiss franc and the Japanese yen all appreciated versus the U.S. dollar. There are many reasons for the dollar’s weak performance, including a growing federal budget deficit, low interest rates, inflation concerns and a sizable current account deficit. In any event, the strength of foreign currencies versus the dollar had a sizable positive impact on performance.
In addition, we note that smaller companies have tended to outperform larger companies over the past year. The MSCI EAFE® Small Cap Index returned 26.88% while the MSCI EAFE® Index returned 22.08%. Our quarterly weighted average market cap ranged from $7.0 billion to $11.8 billion during the fiscal year compared to the weighted average market cap range of $39.0 billion to $46.1 billion for the MSCI EAFE® Index, highlighting the fact that we own more medium-sized companies on a relative basis than the Index. This was arguably a positive influence on our performance for the year. However, we do not focus on company size as an investment criteria. We invest in companies of all sizes based on valuation and company fundamentals. We believe that smaller companies outperformed large companies in the past year because their valuations were more depressed at the beginning of the year, exactly the reason for their presence in our portfolio.
In terms of company specifics, there were a number of stocks that had a significant impact on the Fund’s total return during the period.
| • | Cementir S.p.A. is an Italian cement producer with operations in Italy and Turkey. In August, it announced the acquisition of the largest cement producer in Denmark. The acquisition was expected to further diversify the company’s operations and put to use its significant cash resources. Investors viewed the transaction very favorably because it appeared likely to increase the company’s earnings per share. The stock price rose significantly as a result, contributing meaningfully to the Fund’s growth in NAV during the fiscal year. |
| • | Ichiyoshi Securities Co., Ltd. is a Japanese brokerage firm that has benefited from the recent bull market in Japan. Over the last twelve months, its share price has increased dramatically and it was a significant contributor to our results during the period. |
11
ELEVEN
| • | Givaudan S.A. is the world’s largest producer of flavors and fragrances. Management of Givaudan has produced consistent, albeit modest revenue growth combined with shareholder-oriented share repurchases and special cash dividends. Its share price appreciation and dividend payments were an important driver behind the Fund’s return. |
| • | Aventis S.A.’s share price increased by over 40% largely due to a hostile takeover bid from fellow French pharmaceutical company Sanofi-Synthelabo S.A. |
| • | Hunter Douglas N.V., a leading manufacturer of window coverings, continued to generate attractive earnings and cash flow growth. In addition, the company announced a 50 million euro share buyback program, equivalent to about 3% of its shares outstanding. This action demonstrated management’s commitment to return more of the company’s cash flow to shareholders and these developments helped to drive Hunter Douglas’ share price up toward a multi-year high. |
TOP 10 HOLDINGS
| | | | | |
| Company Name | | Country | | % | |
Cementir S.p.A. Cementerie del Tirreno | | Italy | | 5.4 | % |
Diageo PLC | | United Kingdom | | 5.3 | |
Euronext NV | | France | | 4.1 | |
Unilever PLC (ADR) | | United Kingdom | | 3.8 | |
Wolters Kluwer N.V. | | Netherlands | | 3.7 | |
Benfield Group PLC | | United Kingdom | | 3.3 | |
Countrywide PLC | | United Kingdom | | 3.2 | |
Guoco Group, Ltd. | | Hong Kong | | 3.2 | |
Vodafone Group PLC (ADR) | | United Kingdom | | 3.2 | |
Givaudan S.A. | | Switzerland | | 3.1 | |
Total | | | | 38.3 | % |
As a percentage of total net assets as of 9/30/04. Top 10 Holdings are determined by issuer.
There were two companies that had a meaningful negative impact on the portfolio in the last twelve months.
| • | MFI Furniture PLC is the U.K.’s largest retailer of kitchen and bedroom furniture, with a market share in excess of 30%. Its retail business has suffered from an increased level of competition. In addition, a failed installation of operating software caused delivery and other service problems that have pushed the division into operating losses. |
| • | Unilever PLC is an Anglo-Dutch consumer products company. After rising significantly from our initial purchase price, shares ended lower due to disappointing sales and earnings. The company’s operating issues appeared to be part of a trend in the packaged consumer goods industry as many of its peers also reported similarly disappointing results. |
FUND CHANGES
Since our semi-annual report on March 31, 2004, we acquired shares in several companies, including Benfield Group, Countrywide PLC, Tate & Lyle PLC, Clariant AS, Vodafone Group PLC and Admiral Group PLC. A brief discussion of each of these companies is provided below.
Benfield is the world’s fourth largest reinsurance broker. We think insurance brokerage is a terrific business characterized by high profit margins and strong cash flow generation. We believe our initial purchase price was significantly below the intrinsic value of this high quality business. Moreover, we were impressed with CEO Grahame Chilton, who is a substantial shareholder, and liked that the employees of the company owned over 50% of the shares outstanding. We believed that this level of ownership aligned the interests of the company’s employees with our interests as shareholders.
Countrywide PLC owns the U.K.’s largest chain of residential real estate brokers. In our view, CEO Harry Hill has expanded the value of this franchise by effectively cross selling a number of financial service products. Countrywide sells mortgages, homeowner’s insurance and life insurance. Importantly, the company takes none of the risk behind these products, but simply collects a commission and passes the business on to third parties. It also effectively leverages its relationship with the underwriting banks by retaining the real estate appraisal services. There are numerous other attractions to this company, not the least of which is the fact that we started buying the shares at what we believed was a significant discount to its economic value.
12
TWELVE
Tate & Lyle is a U.K.-based manufacturer of sugars and starches. Tate’s businesses, in our view, are largely mature and face a myriad of challenges. At the time of purchase, we believed those businesses were fairly priced. However, we thought that value could be created by Tate’s ownership of a no-calorie sweetener, sucralose, sold under the Splenda® brand name. In addition to being about 400 times sweeter than sugar, Splenda® is temperature stable and therefore can be used for cooking.
SECTOR DIVERSIFICATION
| | | | | | |
| Sector | | 9/30/03 | | | 9/30/04 | |
Consumer Discretionary | | 18.9 | % | | 18.2 | % |
Consumer Staples | | 16.3 | | | 17.1 | |
Energy | | 2.1 | | | 0.4 | |
Financials | | 25.1 | | | 23.0 | |
Healthcare | | 7.6 | | | 2.6 | |
Industrials | | 12.1 | | | 10.8 | |
Information Technology | | — | | | — | |
Materials | | 4.6 | | | 14.5 | |
Telecommunication Services | | 7.4 | | | 6.5 | |
Utilities | | — | | | 1.0 | |
Other assets less liabilities | | 5.9 | | | 5.9 | |
Total | | 100.0 | % | | 100.0 | % |
As a percentage of total net assets as of 9/30/03 and 9/30/04, respectively.
Clariant is a Switzerland-based specialty chemical company that was in the midst of a restructuring program. Over the last decade, prior management used debt to make several acquisitions and then failed to earn an appropriate return. As a result, earnings declined and the company was forced to restructure its balance sheet. With the financial risk reduced, we believed management had the flexibility to improve profitability.
Vodafone Group is the world’s largest provider of mobile phone services. With strong market positions in the U.K., Germany, Japan, Italy, France and the U.S. (as well as other markets), Vodafone has a global footprint that is unmatched by any of its competitors. The quality of the company’s assets combined with attractive mobile industry growth endeared investors to Vodafone’s stock, resulting in a lofty (often absurd) valuation. As is often the case, the growth implied by such a valuation did not materialize and Vodafone’s stock declined significantly from its bubble-era peak. This stock price decline drove the valuation to a level that we found attractive. Just as important as the valuation, however, was the recent shift in management strategy. Recently, the CEO has signaled to the market that Vodafone is unlikely to make any more major acquisitions and that the company’s free cash flow increasingly will be used for dividends and stock buybacks.
Admiral Group PLC is a U.K.-based direct seller of auto insurance. Admiral has an intriguing business model. It either sells policies that are co-insured by other companies or sells them to reinsurers. Admiral does keep some of the underwriting profits from the policies it sells, but more importantly, it keeps all of the profits from any ancillary services that can be sold to the entire group of policyholders. We purchased Admiral because of its high profitability, rapid growth, management’s significant share ownership, and because it was trading at a price that we thought did not reflect its profitability and growth prospects.
FUND STATISTICS
| | |
Net Assets | | $ 217.5 million |
Number of Holdings | | 45 |
Median Market Cap | | $ 2.0 billion |
Weighted Average Market Cap | | $ 11.8 billion |
Median P/B Value | | 2.2X |
Weighted Harmonic Average P/E (2004E) | | 14.2X |
Source: FactSet/Artisan Partners. All statistics are as of 9/30/04.
We sold five companies since our last report. Jyske Bank, Cable & Wireless PLC, Tower Limited and Aventis S.A. were sold after each reached our assessment of economic value. We sold our shares in Gurit-Heberlein because we felt that management had made too many acquisitions in too many different businesses. Despite a decline in our assessment of Gurit’s economic value, the Fund still earned a significant positive return from its investment.
13
THIRTEEN
ARTISAN MID CAP FUND (ARTMX)
| | |
| HIGHLIGHTS | | |
• During the twelve months ended September 30, 2004, Artisan Mid Cap Fund underperformed the Russell Midcap® Index and was slightly behind the Russell Midcap® Growth Index. | | • Our security selection in the consumer sectors was a leading contributor to performance compared to both benchmarks. • The performance of our stocks in the producer durables sector was a drag on relative returns. |
| | | |
| INVESTMENT APPROACH | | |
| We use a bottom-up investment process to identify well-managed mid-sized companies whose growth and profit potential are not yet fully recognized by investors. Specifically, we spend most of our time answering three questions about a company before we will invest in it: | | 1) Does the company exhibit franchise characteristics? 2) Is the company positioned for long-term growth and at an early stage in its profit cycle? 3) Is the stock of the company trading at a reasonable discount to our estimate of its private market value? |
| | | |
| PERFORMANCE REVIEW | | |
| Artisan Mid Cap Fund has outperformed both benchmark indices for the five years ended September 30, 2004 and from the Fund’s inception through September 30, 2004. |
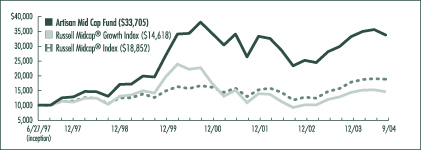
GROWTH OF AN ASSUMED $10,000 INVESTMENT (6/27/97 to 9/30/04)
AVERAGE ANNUAL TOTAL RETURNS (as of 9/30/04)
| | | | | | | | | | | | |
| Fund / Index | | 1-Year | | | 3-Year | | | 5-Year | | | Since
Inception | |
Artisan Mid Cap Fund | | 13.02 | % | | 8.44 | % | | 11.45 | % | | 18.22 | % |
Russell Midcap® Growth Index | | 13.68 | | | 10.09 | | | 0.63 | | | 5.37 | |
Russell Midcap® Index | | 20.55 | | | 13.32 | | | 8.26 | | | 9.13 | |
The performance quoted represents past performance, which does not guarantee future results. The investment return and principal value of an investment in the Fund will fluctuate, so that an investor’s shares in the Fund, when redeemed, may be worth more or less than their original cost. Current performance may be lower or higher than the performance data quoted. For current to most recent month-end performance information, visit www.artisanfunds.com or call 800.344.1770. The graph and table above do not reflect the deduction of taxes that a shareholder would pay on distributions or sale of Fund shares. See page 81 for a description of each index.
14
FOURTEEN
INVESTING ENVIRONMENT
Our fiscal year ended September 30, 2004 was a good period to own mid-cap stocks as they outpaced their small- and large-cap brethren. However, a simple analysis of returns by quarter reveals that stocks of all sizes saw gains moderate throughout the period and ultimately tail off at the end of the fiscal year. Over the course of a twelve-month time frame there could be a variety of reasons to point to that might explain the performance trend, but we think the most important influence was probably economic growth. During the fiscal year, economic growth slowed and expectations for future growth moderated. Two factors that contributed to the moderation were rising commodities prices, particularly oil, and market participants’ expectation for higher interest rates, driven in part by a pick up in inflation.
Throughout the period, one of the high-level assumptions that impacted our investment decisions was that broad economic growth would inevitably slow, but continue at a moderate pace. We felt the best way to capitalize on that assumption was to tilt the Fund toward companies more sensitive to business spending than consumer spending and toward larger, more established franchises. Consequently, we were pleased to see that business investment and hiring stepped up during the year. Our tilt away from the consumer was based on the belief that the benefits of tax cuts and a favorable interest rate environment would dissipate over time, but that didn’t happen to the extent we expected. The consumer remained fairly resilient throughout the period as confidence readings and spending were both healthy.
In our benchmarks, two sectors that advanced strongly were energy and materials, which came as no surprise given the rise in oil prices and other commodities. Most other sectors recorded solid double-digit gains, with technology the main laggard.
PERFORMANCE DISCUSSION
In the Fund, our security selection was strong relative to the Russell Midcap® Growth Index, although we were not optimally aligned to the best performing sectors. On a sector basis the largest contributor to Fund performance was the consumer discretionary sector, but a number of stocks in the materials, energy and transportation sectors also recorded strong gains. The weakest parts of the portfolio were the technology and producer durables sectors.
TOP 10 HOLDINGS
| | | |
| Company Name | | % | |
Aetna Inc. | | 1.6 | % |
Weatherford International Ltd. | | 1.5 | |
Caremark Rx, Inc. | | 1.5 | |
Smith International, Inc. | | 1.5 | |
EchoStar Communications Corporation | | 1.4 | |
Diebold, Incorporated | | 1.4 | |
MGIC Investment Corporation | | 1.4 | |
CIT Group Inc. | | 1.4 | |
Jabil Circuit, Inc. | | 1.4 | |
Precision Castparts Corp. | | 1.3 | |
Total | | 14.4 | % |
As a percentage of total net assets as of 9/30/04. Top 10 Holdings are determined by issuer.
In the consumer discretionary sector, two of our better performers were Robert Half International Inc. and Iron Mountain Incorporated, which benefited from the pick up in hiring. Robert Half is one of the world’s largest temporary and permanent staffing providers and Iron Mountain, a new addition early in the period, is the global leader in records and information management. We tend to think about these stocks as payroll related and tied to business spending, but our benchmark classifies them as consumer-oriented. Other meaningful gainers in the sector were outdoor advertiser Lamar Advertising Company, global Internet media company Yahoo! Inc., warehouse club operator Costco Wholesale Corporation and teen apparel retailer American Eagle Outfitters, Inc. Each company reported strong improvements in its business, but we would make special mention of American Eagle. Its share price
15
FIFTEEN
increased over 80%, rising steadily throughout our fiscal year. Among the factors that contributed to the stock’s ascent was good sales momentum driven by improved merchandise.
In a strong period for energy and materials stocks, our performance in each sector outpaced the growth benchmark sector return. Within the energy sector our best performers were Smith International, Inc. (a leading provider of drilling bits to the oil and gas industries), Weatherford International Ltd. (a top provider of oil and gas services) and EOG Resources, Inc. (an independent oil and gas driller). Smith produced solid results because it was able to push through some price increases due to robust demand for spending on exploration and production. In addition, the company took advantage of price declines to repurchase shares. Weatherford also instituted pricing increases and had good earnings, which were supported by better operating profitability as the company cut costs. EOG was purchased during the period with some very good initial returns. We were attracted to EOG’s strong return on investment, driven by a tight control over costs and history of successful reserve additions.
In the materials sector, our leading gainers were Smurfit Stone Container Corporation and Precision Castparts Corp. Smurfit is a container and packaging company and it benefited as demand for its products increased steadily throughout the period. Precision Castparts, a metal components manufacturer for the aerospace industry, was a new purchase. It gained market share, realized meaningful cost savings from an acquisition
FUND STATISTICS
| | |
Net Assets | | $ 5.1 billion |
Number of Holdings | | 116 |
Median Market Cap | | $ 5.2 billion |
Weighted Average Market Cap | | $ 8.3 billion |
Weighted Average Growth Rate (3-5 yr) | | 16.8% |
Weighted Harmonic Average P/E (2004E) | | 22.2X |
Source: FactSet/Artisan Partners. All statistics are as of 9/30/04.
and strategically divested units to focus on its core end markets, which showed strength.
Overall, transportation stocks posted positive, although not robust, returns in our benchmarks. Three of our holdings recorded impressive gains leading to a strong performance contribution. Expeditors International of Washington, Inc., a global logistics provider; FedEx Corporation, the recognized leader in global express delivery; and PACCAR Inc., a producer of heavy-duty and medium-duty trucks, each advanced more than 30%. All three companies reported excellent earnings growth driven by healthy demand for their services.
Compared to the Russell Midcap® Growth Index, the performance of our technology holdings was mildly better and our exposure to the sector was fairly similar. On balance this meant that we held a slight advantage relative to the Index. However, the story was considerably different versus the Russell Midcap® Index where we had a meaningfully larger exposure to technology and our stocks were weaker. In our opinion, this meant that investors were generally more concerned about valuation and risk than growth. While we were frustrated by that sentiment, we are growth investors and it did not deter our long-term strategy.
Some of the holdings that had a negative impact on performance included Seagate Technology, a hard disk drive manufacturer; Agere Systems Inc., an integrated circuits manufacturer; Broadcom Corporation, an integrated semiconductor developer and Vishay Intertechnology, Inc., a passive electronic components manufacturer. Seagate was pressured by pricing concerns. Agere, Broadcom and Vishay were under particular strain late in the fiscal year as a variety of data pointed to excess supply and moderating demand for their products. We sold Agere and Vishay. The positions we held in technology that had strong showings during the year and offset some of the weakness in those names were enterprise communications systems provider Avaya Inc., personal computer manufacturer Apple Computer, Inc., digital imaging company Adobe
16
SIXTEEN
Systems Incorporated and storage semiconductor producer PMC-Sierra, Inc. We sold Apple and PMC-Sierra into the share price strength.
Danaher Corporation, a diversified industrial and consumer products company, was a standout performer in the producer durables sector. It produced profitability levels that were near historically high levels and announced acquisitions that were expected to add to earnings. However, Danaher’s performance gains were offset by several of our technology-related producer durables. Among those that declined were KLA-Tencor Corporation, Andrew Corporation, Lam Research Corporation and Novellus Systems, Inc., which we ultimately sold. Lam Research is a semiconductor equipment manufacturer that we purchased during the fiscal year. Its share price weakness provided us with an opportunity to initiate our position.
FUND CHANGES
Throughout the fiscal year and at its close, our portfolio was tilted toward companies sensitive to business spending. We also had a skew toward companies at the larger end of our market capitalization range. The sector
| | | | | | |
| SECTOR DIVERSIFICATION | | | | | | |
| Sector | | 9/30/03 | | | 9/30/04 | |
Auto & Transportation | | 5.2 | % | | 4.0 | % |
Consumer Discretionary | | 24.1 | | | 24.9 | |
Consumer Staples | | 1.6 | | | 2.1 | |
Financial Services | | 12.4 | | | 10.3 | |
Healthcare | | 13.3 | | | 16.6 | |
Integrated Oils | | — | | | — | |
Materials & Processing | | 3.0 | | | 8.1 | |
Other | | 0.4 | | | 2.4 | |
Other Energy | | 4.8 | | | 5.0 | |
Producer Durables | | 7.8 | | | 8.1 | |
Technology | | 22.2 | | | 14.9 | |
Utilities | | 0.7 | | | 0.9 | |
Other assets less liabilities | | 4.5 | | | 2.7 | |
Total | | 100.0 | % | | 100.0 | % |
As a percentage of total net assets as of 9/30/03 and 9/30/04, respectively.
positioning of the Fund changed the most during the year in technology, financial services, healthcare and materials.
The decrease in our technology weighting was due in part to the weak performance of the group when compared to the other sectors, but we also made a few select sales in addition to those discussed above. We sold Nortel Networks Corporation, Rockwell Automation Inc., Veritas Software Corporation and BEA Systems, Inc. to realize gains. We sold McAfee, Inc. (formerly Network Associates, Inc.) and Amdocs Limited in favor of other alternatives. Partially offsetting the sales were investments in Jabil Circuit, Inc. (electronic manufacturing services), Macromedia, Inc. (develops software to deliver content on the Internet) and TIBCO Software Inc. (integration software provider).
Our position in financial services is lower because we believed that the next move for interest rates would be higher and financial stocks have historically been sensitive to moves in rates. Thus when stocks such as T. Rowe Price Group, Inc., Platinum Underwriters Holdings, Ltd., Fiserv, Inc. and SEI Investments Company reached our target prices, we sold them and redeployed most of the capital into other areas.
The healthcare and materials sectors saw the largest increases as a percentage of portfolio assets. Neither change was the result of a broader view about the sectors. Our investment discipline led us to a number of quality franchises in those areas, including healthcare benefits provider Aetna Inc., which was our largest holding at the end of the period, radiation therapy systems producer Varian Medical Systems, Inc., foodservice products provider Ecolab Inc., gas and chemicals distributor Air Products and Chemicals, Inc. and Precision Castparts.
17
SEVENTEEN
ARTISAN MID CAP VALUE FUND (ARTQX)
| | |
| HIGHLIGHTS | | |
• For the twelve months ended September 30, 2004, Artisan Mid Cap Value Fund outperformed the Russell Midcap® and Russell Midcap® Value Indices. • The strongest contributors to our relative performance were our overweight position and | | security selection in the energy sector and our security selection in financial services. • Our consumer discretionary and transportation stocks hurt our performance during the period. |
| | | |
| INVESTMENT APPROACH | | |
| Our goal is to invest in companies that are priced below our estimate of the value of the business and that provide a controlled level of risk. It is important to complement stock price value with a company that is financially strong and possesses favorable economics. Our focus is on individual companies, rather than on economic or market trends. | | The Fund often finds investment opportunities in companies that are in the midst of a turnaround, are in transition, are experiencing declining earnings and/or have earnings short-falls. |
| | | |
| PERFORMANCE REVIEW | | |
| Artisan Mid Cap Value Fund has outperformed the Russell Midcap® and Russell Midcap® Value Indices over the trailing one and three-year periods ended September 30, 2004 and from the Fund’s inception through September 30, 2004. |
GROWTH OF AN ASSUMED $10,000 INVESTMENT (3/28/01 to 9/30/04)
AVERAGE ANNUAL TOTAL RETURNS (as of 9/30/04)
| | | | | | | | | |
| Fund / Index | | 1-Year | | | 3-Year | | | Since
Inception | |
Artisan Mid Cap Value Fund | | 29.60 | % | | 20.41 | % | | 14.28 | % |
Russell Midcap® Value Index | | 25.62 | | | 15.07 | | | 11.48 | |
Russell Midcap® Index | | 20.55 | | | 13.32 | | | 8.28 | |
The performance quoted represents past performance, which does not guarantee future results. The investment return and principal value of an investment in the Fund will fluctuate, so that an investor’s shares in the Fund, when redeemed, may be worth more or less than their original cost. Current performance may be lower or higher than the performance data quoted. For current to most recent month-end performance information, visit www.artisanfunds.com or call 800.344.1770. The Fund’s performance reflects Artisan Partners’ undertaking to limit the Fund’s expenses, which may be terminated at any time, has been in effect since the Fund’s inception, and has had a material impact on the Fund’s performance, which would have been lower in its absence. The graph and table above do not reflect the deduction of taxes that a shareholder would pay on distributions or sale of Fund shares. See page 81 for a description of each index.
18
EIGHTEEN
INVESTING ENVIRONMENT
For our fiscal year ended September 30, 2004, mid-cap stocks were the best performing market capitalization group in the U.S. Given that mid-caps have historically been overlooked in favor of small- and large-cap stocks, it was satisfying to see the group receive some attention. Despite their advantage relative to small- and large-cap stocks, companies of all sizes and styles actually performed very well as economic developments throughout the period were fairly solid. Most notably, after some poor readings early in the fiscal year, there was a definite pick up in hiring that produced optimism about consumer spending and profitability improved at many companies around the market. Unfortunately, concerns about rising interest rates and a sizeable increase in the price of oil later in the fiscal year dampened that optimism and raised doubt about the level and sustainability of economic growth.
The increase in oil and natural gas prices was a driving force behind the performance of the energy sector, which was among the leaders in the Russell Midcap® Value Index. Market commentators and headline writers pointed to a variety of reasons for the upward pressure on oil prices and, while the explanations may or may not have been correct, we thought there was too much attention paid to short-term issues and too little focus on longer-term views. Elsewhere, the strength of commodity prices drove materials stocks to very strong gains and the continued low level of interest rates supported financials. The worst performing sector in the Index for the fiscal year as a whole was healthcare, although technology stocks fell the most at the end of our fiscal year. For the year ended September 30, 2004, no sector recorded a negative return in the mid-cap space.
PERFORMANCE DISCUSSION
The Fund received its largest performance contributions from the energy and financials sectors. In both areas, our security selection was strong. In the energy sector, we also
benefited from our overweight position compared to the Russell Midcap® Value Index. Additional areas of strength compared to the Index were the technology and consumer staples sectors. Our returns from our transportation and consumer discretionary stocks, though positive, were not as strong as those of the Index sectors.
TOP 10 HOLDINGS
| | | |
| Company Name | | % | |
The Student Loan Corporation | | 4.7 | % |
Apache Corporation | | 4.3 | |
EOG Resources, Inc. | | 4.2 | |
Furniture Brands International, Inc. | | 3.6 | |
White Mountains Insurance Group, Ltd. | | 3.5 | |
Countrywide Financial Corporation | | 3.5 | |
XTO Energy Inc. | | 3.3 | |
Alleghany Corporation | | 3.2 | |
Old Republic International Corporation | | 3.2 | |
Liz Claiborne Inc. | | 3.0 | |
Total | | 36.5 | % |
As a percentage of total net assets as of 9/30/04. Top 10 Holdings are determined by issuer.
The absolute performance gain of our stocks in the energy sector was very strong as several of our holdings outperformed the benchmark sector return. We have had an overweight position in energy for some time based on those companies’ strong cash flow and earnings potential over the long-term. In the short-term, market participants have priced the majority of the group higher due to high oil and natural gas prices. Given the impact of geopolitical influences and other economic wildcards, we have never believed that it was worthwhile to focus on the short-term outlook for energy prices. Analyzing the long-term outlook is no easy task, but we believed there was enough information available regarding supply and demand factors to determine a long-run normalized price range for natural gas (and potentially oil). It was our assessment of the normalized price level that drove our valuation thought process and our conviction that it was possible to invest in energy rather
19
NINETEEN
than merely speculate about commodity prices. It was also the reason we continued to see value in many of our stocks through the upswing.
During the period, our strongest performing energy stock was XTO Energy Inc. XTO continued its development strategy of purchasing producing properties and raised cash to fund additional acquisitions through an equity offering, all while posting strong financial results. EOG Resources, Inc. was another meaningful gainer. It benefited from the positive prospects of its central Texas drilling program and raised production and reserve estimates. Newfield Exploration Company and Diamond Offshore Drilling, Inc., though smaller positions than XTO and EOG, also added to returns. Newfield entered into a drilling agreement with energy giants Exxon Mobil and BP, which demonstrated the potential of its Gulf of Mexico assets. Diamond Offshore Drilling signed a number of new contracts for its fleet of rigs and improved pricing.
In the financials sector, our leading performer was mortgage lender Countrywide Financial Corporation. It experienced some volatility in its share price during our fiscal year as a temporary rise in long-term interest rates slowed demand for mortgage refinancings, but it continued to gain market share and grew its mortgage servicing portfolio. We pared back our exposure to the company during the fiscal year as its market capitalization moved outside of our range. Alleghany Corporation, an insurer, was another strong gainer. During the period, it announced the sale of a profitable investment. We achieved additional positive contributions compared to our benchmark from Concord EFS, Inc. and Loews Corporation.
FUND STATISTICS
| | |
Net Assets | | $ 312.3 million |
Number of Holdings | | 49 |
Median Market Cap | | $ 2.9 billion |
Weighted Average Market Cap | | $ 5.0 billion |
Weighted Harmonic Average P/E (2004E) | | 14.2X |
Source: FactSet/Artisan Partners. All statistics are as of 9/30/04.
Our excess performance compared to the benchmark in the technology sector was primarily due to our low weight in the group. We had little or no exposure to technology stocks for much of the fiscal year because we believed that many were overvalued. That sensitivity to valuation provided positive returns. However, late in the period when many technology companies were being beaten down, we found an opportunity to build small positions in select companies. We added BMC Software, Inc., infrastructure systems software; Siebel Systems, Inc., eBusiness applications; Synopsys, Inc., electronic design automation software; Bearingpoint, Inc., technology consulting; and National Semiconductor Corporation, semiconductor products manufacturer. Additionally, although not technically classified as technology stocks, we bought into two stocks we would define as technology related: SunGard Data Systems Inc., which provides technology services and solutions to the financial services industry, and Convergys Corporation, which is a provider of outsourced, integrated billing software.
In the consumer staples sector, we benefited from the strength of Tyson Foods, Inc., Dial Corporation and Hormel Foods Corporation. Tyson, the world’s largest meat processor, encountered numerous distractions, but management continued to execute its business strategy. Consumer products company Dial was purchased by German consumer products company Henkel KGaA. Hormel, a meat and poultry processor, profited in part from a rebound in turkey prices. We sold all three stocks into share price strength.
Our underperformance in the transportation and consumer discretionary sectors can be attributed to weakness in select holdings. Swift Transportation Co., Inc., one of the largest publicly held truckload carriers, fell due to higher fuel costs and news of a regulatory review of driver log documentation.
In the consumer discretionary sector, we were hurt by poor results from three of our purchases: Rent-A-Center, Inc., AutoZone, Inc. and
20
TWENTY
Blockbuster Inc. Rent-A-Center is a rent-to-own merchandise retailer with a leading market share. It fell due to weak demand. AutoZone, which is an automotive parts retailer, was hurt by poor sales results. Video rental chain Blockbuster announced the terms of its split-off from Viacom Inc. (its majority owner), which included a new debt facility that created concern. Blockbuster was also hurt by competition from mail rentals, video on demand and discounted DVD sales.
FUND CHANGES
In the early part of our fiscal year, we felt handcuffed by the valuations of many stocks in the market and limited in our buying opportunities. However, late in the period interest rate fears and higher oil prices appeared to generate some headline risk in the market, leading to some volatility in certain industries. Whereas many investors fear volatility, we welcomed it with a sigh of relief because it created opportunities for us to initiate new positions when price declines moved several stocks into our buying range. We already noted several of our purchases in the technology sector, but pressure on healthcare and consumer discretionary stocks also led us to several purchases in those sectors.
SECTOR DIVERSIFICATION
| | | | | | |
| Sector | | 9/30/03 | | | 9/30/04 | |
Auto & Transportation | | 3.7 | % | | 3.5 | % |
Consumer Discretionary | | 14.6 | | | 22.9 | |
Consumer Staples | | 10.2 | | | 1.3 | |
Financial Services | | 33.5 | | | 29.3 | |
Healthcare | | 0.7 | | | 5.7 | |
Integrated Oils | | — | | | — | |
Materials & Processing | | 6.2 | | | 5.0 | |
Other | | 1.5 | | | 0.3 | |
Other Energy | | 14.1 | | | 18.3 | |
Producer Durables | | 3.5 | | | — | |
Technology | | 1.5 | | | 6.0 | |
Utilities | | 4.8 | | | 1.5 | |
Other assets less liabilities | | 5.7 | | | 6.2 | |
Total | | 100.0 | % | | 100.0 | % |
As a percentage of total net assets as of 9/30/03 and 9/30/04, respectively.
We added pharmacy benefit manager Medco Health Solutions, Inc. in the healthcare sector. It was struggling due to market share losses, but we believed that the company’s growing cash pile and changes to marketing and distribution made the company an attractive investment. In the consumer discretionary sector, we added athletic shoemaker Reebok International Ltd., character franchise Marvel Enterprises Inc. and casual dining company Darden Restaurants Inc. At Reebok and Marvel, we were attracted to the business model, which historically has carried a lower degree of capital intensiveness by emphasizing marketing and distribution versus manufacturing. We believed the valuation of Darden’s stock at the time of our initial purchase undervalued its Olive Garden® and Red Lobster® brands. We also thought new management would do a good job tweaking the strategy to turn around the company and expose its true value.
We funded our new purchases with the proceeds of the sales already noted plus several others. In the utilities sector, we sold Sempra Energy, Vectren Corporation and Cinergy Corporation. In consumer staples we sold Safeway Inc. due to a continued deterioration in fundamentals. In the financials sector, we sold TCF Financial Corporation, Golden West Financial Corporation and Everest Re Group, Ltd. In materials, we sold MeadWestvaco Corporation, Harsco Corporation and Domtar Inc.
21
TWENTY-ONE
ARTISAN SMALL CAP FUND (ARTSX)
| | |
| HIGHLIGHTS | | |
• The twelve months ended September 30, 2004 was a strong period for small-cap stocks. We outperformed the Russell 2000® Index slightly and held a wide advantage compared to the Russell 2000® Growth Index. • Our stock picks in the healthcare and financial services sectors were leading | | contributors to performance compared to both of our benchmarks. • The materials sector was an area of underperformance relative to both benchmarks. |
| | | |
| INVESTMENT APPROACH | | |
| We use a bottom-up investment process to identify well-managed small companies whose growth and profit potential are not yet fully recognized by investors. During the security selection process, our analysis is aimed at addressing four questions about a company: | | 1) Is the company growing earnings? 2) Does the company have a competitive advantage? 3) Is the company investing capital wisely? 4) Is the company’s stock trading at a reasonable price? |
| | | |
| PERFORMANCE REVIEW | | |
| The Fund outperformed the Russell 2000® Growth Index for the one, three and five-year periods ended September 30, 2004 and from the Fund’s inception through September 30, 2004. |
GROWTH OF AN ASSUMED $10,000 INVESTMENT (3/28/95 to 9/30/04)
AVERAGE ANNUAL TOTAL RETURNS (as of 9/30/04)
| | | | | | | | | | | | |
| Fund / Index | | 1-Year | | | 3-Year | | | 5-Year | | | Since
Inception | |
Artisan Small Cap Fund | | 20.67 | % | | 11.06 | % | | 7.89 | % | | 9.00 | % |
Russell 2000® Growth Index | | 11.92 | | | 9.09 | | | -0.68 | | | 5.29 | |
Russell 2000® Index | | 18.77 | | | 13.71 | | | 7.41 | | | 10.12 | |
The performance quoted represents past performance, which does not guarantee future results. The investment return and principal value of an investment in the Fund will fluctuate, so that an investor’s shares in the Fund, when redeemed, may be worth more or less than their original cost. Current performance may be lower or higher than the performance data quoted. For current to most recent month-end performance information, visit www.artisanfunds.com or call 800.344.1770. The graph and table above do not reflect the deduction of taxes that a shareholder would pay on distributions or sale of Fund shares. See page 81 for a description of each index.
22
TWENTY-TWO
INVESTING ENVIRONMENT
For the twelve months ended September 30, 2004 (our Fund’s fiscal year), stocks of all sizes posted double-digit gains, but growth stocks lagged value stocks by a fair margin. In general, the economic situation throughout the fiscal year was favorable, although there was a definite moderation in growth expectations as the period wore on, which was consistent with the type of environment we expected coming into the year. A number of factors contributed to the decline in expectations, but perhaps the most visible was the sizeable increase in the price of oil. Oil has historically acted as a headwind for both individuals and businesses. As a result, the manufacturing sector expanded throughout the fiscal year, but the rate of growth peaked early in 2004. A similar story unfolded among consumers, although it took longer for consumer confidence and spending to show signs of easing. Two additional influences on the market during the period were the Federal Reserve’s decision to begin raising interest rates, after an extended period of very low rates, and an improved employment situation. However, the potential negative impact of rising interest rates was offset by the perception of a muted inflation picture and the benefits of an increase in employment were buffered by less than stellar income growth.
As you would expect during a time of rising oil prices, energy related stocks were the clear performance leaders in the market. The materials sector was another solid performer as commodity prices trended higher due, in part, to particularly strong demand from China. The only sector to record negative returns was technology. Gains among the rest of the sectors were in reasonable proximity to the market averages.
PERFORMANCE DISCUSSION
Our security selection, rather than sector weightings, made the biggest difference in the Fund’s performance compared to our benchmarks during our fiscal year. Our stock picks were strongest in the healthcare, financial services and consumer discretionary sectors. Despite the rather tough period for technology stocks, our average technology holding was able to muster a slightly positive return. The materials sector was the weakest part of our portfolio.
TOP 10 HOLDINGS
| | | |
| Company Name | | % | |
MTC Technologies, Inc. | | 1.9 | % |
School Specialty, Inc. | | 1.8 | |
Jackson Hewitt Tax Service Inc. | | 1.7 | |
RC2 Corporation | | 1.7 | |
Pacer International, Inc. | | 1.7 | |
Avocent Corporation | | 1.6 | |
Aeroflex Incorporated | | 1.6 | |
TNS Inc. | | 1.6 | |
The First Marblehead Corporation | | 1.6 | |
Texas Capital Bancshares, Inc. | | 1.6 | |
Total | | 16.8 | % |
As a percentage of total net assets as of 9/30/04. Top 10 Holdings are determined by issuer.
In the healthcare sector, we limited our exposure to biotechnology and pharmaceutical companies in favor of the “tools” providers (equipment, service and supplies), and that decision turned out to be a good one. The strong performance of several specific holdings also helped drive returns in the sector. Those positions were: VCA Antech, Inc., an animal healthcare company; American Medical Systems Holdings, Inc. (AMMD), a leading medical device supplier to physicians specializing in the treatment of urological disorders; Inveresk Research Group, Inc., a drug development services provider; and Charles River Laboratories International, Inc., a research tools provider. VCA moved higher due to growth in both its animal hospital and laboratory segments. Its laboratory business was highly profitable and management used its cash flows to build out the animal hospital business through a prudent acquisition strategy. AMMD attempted to increase market opportunities by expanding into women’s
23
TWENTY-THREE
health, building its salesforce and revitalizing its research and development effort. Results during the period indicated that the women’s health business was growing at a rapid rate. Inveresk announced a number of new business wins and, late in the period, it received an acquisition offer from Charles River Laboratories, which ultimately led to our decision to sell the position. In addition to the announced Inveresk offer, Charles River Laboratories benefited from increased spending by drug companies.
The largest performance gain in the financial services sector was from The First Marblehead Corporation (FMD), which provides outsourcing services for private education lending. We initiated a position in FMD early in the fiscal year because we were attracted to the strong long-term demographic trends in the private student loan industry. In addition, we liked the company’s business model because it was highly profitable and did not possess the same capital constraints or credit risks of a direct lender. During the period, FMD announced that it had signed up the second largest federal student lender as a client and completed multiple large loan securitizations. Due to the stock’s appreciation, we began trimming back our position because it had grown to the top end of our market cap range. Other winners in the sector included: Texas Capital Bancshares, Inc., primarily a commercial lender focused on the middle market; Greater Bay Bancorp, a commercial real estate lender in the San Francisco bay area; and HealthExtras, Inc., a pharmacy benefit manager. We ultimately sold Greater Bay Bancorp and HealthExtras into share price strength, but, as of the end of the fiscal year, continued to maintain a position in Texas Capital Bancshares. One disappointment in the sector was fixed income securities trading platform eSpeed, Inc. It fell due to competitive pricing concerns and, after re-evaluating the prospects for the stock, we sold our position.
In the consumer discretionary sector, one of our best individual performers was RC2 Corporation. RC2 produces and markets branded collectible, hobby, toy and infant products. It has a diverse product offering serving a broad customer base through a variety of distribution channels and successfully integrated multiple strategically favorable acquisitions. The services sub-sector produced a number of strong performers including Waste Connections, Inc. and new additions Charles River Associates Incorporated and Jackson Hewitt Tax Service Inc., but the clear leader was risk consultant Kroll Inc. It improved earnings during the period and announced that it would be acquired by Marsh & McLennan Companies, Inc. We sold our position after the deal was announced. Healthcare consulting firm The Advisory Board Company was a laggard. Its decline was influenced by management concerns related to hospital customer spending.
FUND STATISTICS
| | |
Net Assets | | $239.6 million |
Number of Holdings | | 78 |
Median Market Cap | | $741.0 million |
Weighted Average Market Cap | | $813.7 million |
Weighted Average Growth Rate (3-5 yr) | | 18.6% |
Weighted Harmonic Average P/E (2004E) | | 20.4X |
Source: FactSet/Artisan Partners. All statistics are as of 9/30/04.
After starting our fiscal year on an upswing, the technology sector consistently lost momentum throughout the period. It was among the best performers leading up to the beginning of our fiscal year, which might explain some of the pressure. However, moderating economic growth, concerns about inventories exceeding demand at several industry bellwethers and slower earnings growth expectations also contributed to the decline. In the Fund, the mix of winners and losers was fairly evenly split, which led to a modest overall gain. Our list of strong performers included Anteon International Corporation, Anixter International Inc. and Aeroflex Incorporated. Micromuse Inc., Planar
24
TWENTY-FOUR
Systems Inc. and Verisity Ltd. were three stocks that disappointed. We sold Planar and Verisity during the fiscal year and we began to sell Micromuse.
The materials sector was a strong performer during the fiscal year and our underweight position relative to our benchmarks hurt results. Moreover, our investments within the sector were not as exposed to the surge in commodities such as copper, aluminum, steel and other metals. For example, we owned Hughes Supply, Inc., which distributes construction and industrial materials. It advanced strongly due to a number of fundamental positives, but its revenues are more directly tied to industrial production and construction spending versus commodity pricing. Anchor Glass Container Corporation, which manufactures glass containers for the beverage industry, is another example. Unfortunately, its news was less positive than Hughes’ and we sold our position.
FUND CHANGES
The most notable differences in the general makeup of the portfolio from the beginning to the end of the fiscal year were an increase in the consumer discretionary sector and decreases in the financial services and healthcare sectors. However, this generalization does not provide a complete picture of the transaction activity that took place. Changing perceptions about the economy and the prospects for future earnings growth led to a somewhat choppy market. As a result, although the weights held in many sectors seem unchanged, there was a fair amount of activity that took place.
In the consumer discretionary sector, most of the additions that led to the increased sector weight were found in the retail and services industries. Among our new additions in retail were “tween” girls clothing retailer Too, Inc.; lawn, garden and pet supply company Central Garden & Pet Company; and educational supplies marketer School Specialty, Inc. In the services industry, in addition to Jackson Hewitt and Charles River Associates (noted above), we purchased recruiting firm Hudson Highland Group, Inc. and online automotive marketer Autobytel Inc.
SECTOR DIVERSIFICATION
| | | | | | |
| Sector | | 9/30/03 | | | 9/30/04 | |
Auto & Transportation | | 3.3 | % | | 4.0 | % |
Consumer Discretionary | | 18.1 | | | 25.2 | |
Consumer Staples | | 1.6 | | | — | |
Financial Services | | 11.8 | | | 10.8 | |
Healthcare | | 15.7 | | | 13.5 | |
Integrated Oils | | 0.8 | | | — | |
Materials & Processing | | 4.8 | | | 3.8 | |
Other | | — | | | — | |
Other Energy | | 5.5 | | | 5.0 | |
Producer Durables | | 7.6 | | | 8.7 | |
Technology | | 22.0 | | | 23.5 | |
Utilities | | 2.1 | | | 1.1 | |
Other assets less liabilities | | 6.7 | | | 4.4 | |
Total | | 100.0 | % | | 100.0 | % |
As a percentage of total net assets as of 9/30/03 and 9/30/04, respectively.
Within the financial services sector, we sold all of our insurance stocks, Jefferies Group, Inc., Community First Bankshares, Inc. and FactSet Research Systems Inc., among others. Some of the capital was reallocated to First Marblehead, TNS Inc., Bank Mutual Corporation and BankAtlantic Bancorp, Inc., but the net result of the transactions was a reduction in our financial exposure. Activity was fairly similar in the healthcare sector. In addition to Inveresk Research Group, we sold Taro Pharmaceuticals Industries Ltd., Priority Healthcare Corporation, Lifepoint Hospitals, Inc. and Mid Atlantic Medical Services, Inc. We used some of the proceeds from those sales to buy PSS World Medical, Inc., LabOne, Inc. and Impax Laboratories, Inc. However, our overall position in healthcare fell during the fiscal year.
25
TWENTY-FIVE
ARTISAN SMALL CAP VALUE FUND (ARTVX)
| | |
| HIGHLIGHTS | | |
• For the twelve months ended September 30, 2004, Artisan Small Cap Value Fund outperformed the Russell 2000® and Russell 2000® Value Indices. • The leading contributor to relative performance was the energy sector as our | | stocks were the beneficiaries of rising oil and gas prices. • Although our stocks in the consumer discretionary sector performed well, they underperformed the average stock in our benchmark, which hurt relative performance. |
| | | |
| INVESTMENT APPROACH | | |
| Our goal is to invest in companies that are priced below our estimate of the value of the business and that provide a controlled level of risk. It is important to complement stock price value with a company that is financially strong and possesses favorable economics. Our focus is on individual companies, rather than on economic or market trends. | | The Fund often finds investment opportunities in companies that are in the midst of a turnaround, are undiscovered or unsponsored, have hidden assets and/or are in the process of a major change. |
| | | |
| PERFORMANCE REVIEW | | |
| Artisan Small Cap Value Fund has outperformed the Russell 2000® Value Index over the trailing one, three and five-year periods ended September 30, 2004 and from the Fund’s inception through September 30, 2004. |
GROWTH OF AN ASSUMED $10,000 INVESTMENT (9/29/97 to 9/30/04)
AVERAGE ANNUAL TOTAL RETURNS (as of 9/30/04)
| | | | | | | | | | | | |
| Fund / Index | | 1-Year | | | 3-Year | | | 5-Year | | | Since
Inception | |
Artisan Small Cap Value Fund | | 30.76 | % | | 19.86 | % | | 16.30 | % | | 12.60 | % |
Russell 2000® Value Index | | 25.66 | | | 17.69 | | | 14.71 | | | 9.12 | |
Russell 2000® Index | | 18.77 | | | 13.71 | | | 7.41 | | | 4.78 | |
The performance quoted represents past performance, which does not guarantee future results. The investment return and principal value of an investment in the Fund will fluctuate, so that an investor’s shares in the Fund, when redeemed, may be worth more or less than their original cost. Current performance may be lower or higher than the performance data quoted. For current to most recent month-end performance information, visit www.artisanfunds.com or call 800.344.1770. The graph and table above do not reflect the deduction of taxes that a shareholder would pay on distributions or sale of Fund shares. See page 81 for a description of each index.
26
TWENTY-SIX
INVESTING ENVIRONMENT
During our fiscal year ended September 30, 2004, small-cap value stocks were among the best performing asset classes, although most of the performance contribution was concentrated in the first half of the fiscal year. Economic developments were generally favorable throughout the period, but there was a tail off in expectations that fed investor concern near the end of the fiscal year. One of the driving factors behind the shift in sentiment was the marked increase in the price of oil. The increase in oil and natural gas prices, along with an upward trend in other commodities, darkened the outlook for inflation and raised doubt about the sustainability of economic growth. On the bright side, there was a definite increase in hiring (which could lead to a rise in consumer spending), long-term interest rates remained at very low levels, profitability improved at companies across the market and business spending was solid.
The increase in oil and natural gas prices was a driving force behind the performance of the energy sector, which almost tripled the return of the Russell 2000® Value Index. Elsewhere, the strength of commodity prices drove materials stocks to very strong gains and the continued low level of interest rates supported financials. The worst returns in the Index were found in the technology sector, which was the only sector to post a negative result.
PERFORMANCE DISCUSSION
The Fund benefited from the strength of oil and natural gas prices, which supported energy stock performance. We have held an overweight position in the energy sector for some time and it led to a strong performance contribution compared to the Russell 2000® Value Index. The technology sector also produced a strong gain compared to the Index as our decision to limit the Fund’s exposure to the group proved positive in a tough period for technology stocks. Our stock picks in the producer durables and financial sectors were also solid. The performance of our consumer discretionary stocks, although positive, was not as good as the performance of the Index sector return.
TOP 10 HOLDINGS
| | | |
| Company Name | | % | |
Kellwood Company | | 3.5 | % |
Stewart Information Services Corporation | | 3.3 | |
Plains Exploration & Production Company | | 3.1 | |
Hilb Rogal and Hobbs Co. | | 3.0 | |
Stone Energy Corporation | | 2.7 | |
Forest Oil Corporation | | 2.7 | |
Zale Corporation | | 2.6 | |
Simpson Manufacturing Co., Inc. | | 2.3 | |
ADVO, Inc. | | 2.1 | |
PNM Resources, Inc. | | 2.0 | |
Total | | 27.3 | % |
As a percentage of total net assets as of 9/30/04. Top 10 Holdings are determined by issuer.
The performance gains of most of our stocks in the energy sector were significant. We have noted in the past that our energy investments were in companies with strong cash flow and earnings growth. During our fiscal year, two of the best performers in the portfolio were Veritas DGC Inc. and Range Resources Corporation. Veritas is an oil services company and its gains were supported, in part, by strong sales from its library of seismic data. Range Resources, an oil and gas producer, announced a completed acquisition and posted a solid increase in production. Two of our other energy holdings, Plains Exploration & Production Company and Nuevo Energy Company, merged during the period. Nuevo’s assets were concentrated in onshore and offshore California and it boosted Plains’ inventory of low-risk reserves in the region. The Fund also realized a strong performance contribution from Tom Brown, Inc. and Prima Energy Corporation. Tom Brown and Prima each attracted a Canadian energy company acquirer interested in the production potential of its Rocky Mountains assets. Tom Brown was acquired by EnCana and Prima Energy by
27
TWENTY-SEVEN
Petro-Canada. We tendered our shares in both companies, believing the offers represented good value for our positions. Forest Oil Corporation, one of our top holdings, advanced roughly 26%, but trailed the benchmark sector return. Forest was impacted early in the fiscal year by management’s reserve estimates. We added to our position after we became more confident that the company had put itself on the right track.
For most of our fiscal year, we had little exposure to technology stocks because we believed that many were overvalued. However, the pressure on certain technology companies’ share prices provided us with an opportunity to build small positions when they moved into the high end of our buying range. Among the additions were Advanced Digital Information Corporation (data storage), Black Box Corp. (networking products), Newport Corp. (test and measurement systems supplier), Borland Software Corporation (application development) and MSC.Software Corporation (simulation software).
FUND STATISTICS
| | |
Net Assets | | $1.2 billion |
Number of Holdings | | 106 |
Median Market Cap | | $755.7 million |
Weighted Average Market Cap | | $1,027.5 million |
Median P/B Value | | 1.7X |
Source: FactSet/Artisan Partners. All statistics are as of 9/30/04.
In the producer durables sector, we benefited from the strength of United Industrial Corporation (UIC), Lincoln Electric Holdings, Inc. and General Cable Corporation, a new purchase during the period. UIC produces products for the defense industry, including unmanned air vehicles and training and simulation systems. It advanced due to a strong earnings report and news of a large contract from the U.S. Defense Department. Lincoln Electric, which manufactures welding products, reported excellent sales results due to strong global demand for its products. General Cable, a fiber optic wire and cable manufacturer, experienced strong revenue growth and better pricing.
Title insurer Stewart Information Corporation, was a strong contributor to performance in the financials sector, although it took a fairly rocky path to its gain. Early in the period, a strong housing market supported Stewart’s shares, as new home sales and refinancing transactions were strong. Near the midway point of our fiscal year, long-term interest rates started to rise in anticipation of interest rate hikes by the Federal Reserve and the shares declined. We felt the sell-off was overdone and added to our position. Then, following a moderation in long-term rates late in the period, Stewart’s stock price rose again. In our view, speculators used the stock as a proxy for interest rates, which we did not think was entirely justified.
Our stocks in the consumer discretionary sector collectively advanced almost 12%, but fell short of the benchmark sector gain, hurting our performance compared to our benchmark. Apparel manufacturer Kellwood Company, our largest holding at the end of the fiscal year, was one of our stocks that underperformed. It reported somewhat disappointing sales results, but the company put in place new initiatives aimed at eliminating marginal merchandise lines in favor of higher margin labels. The company also raised cash to fund acquisitions by issuing convertible securities. We invested in video rental chains Hollywood Entertainment Corporation and Movie Gallery, Inc. because we thought they had been punished too severely, given their cash producing profile, as the market favored direct cable purchasing and other non-store front video rental service providers. However, each stock posted a loss during the period. Discount shoe retailer Payless ShoeSource, Inc. was hurt by weak same-store sales results. Despite the disappointing sales results, we thought the company’s financial position was solid and that management had underway a number of
28
TWENTY-EIGHT
strategic initiatives designed to enhance profitability. So, we purchased additional shares.
Several of our stocks in the sector recorded index-beating returns, including Zale Corporation, School Specialty, Inc., Coinstar, Inc. and Chemed Corp. (formerly Roto-Rooter, Inc.). Coinstar, which manufactures coin counting and processing machines, was a new addition during the period. We were attracted to the company’s proprietary technology, management team and new initiatives.
FUND CHANGES
In the early part of our fiscal year, we started to become concerned that the valuation of many stocks was pricing in overly aggressive assumptions. The surge in the markets early in our fiscal year further fueled those concerns. Strong company earnings probably kept valuations at high levels, but it did not provide us with many opportunities. Consequently, our sell ideas outpaced our buy ideas. It was not until interest rate fears and higher oil prices generated some headline risk in the market that volatility surfaced in certain industries. We used the volatility to our advantage when stocks in various industries moved into our buying range. We already noted several of our purchases in the technology sector.
We also made a number of new investments in technology-related stocks. In the consumer electronics area, we initiated positions in United Online, Inc. and DoubleClick Inc. United Online is a nationwide dial-up Internet service provider that offers access through its brands NetZero® and Juno®. It is a value segment player and share price pressure created what we estimated to be an attractive valuation. DoubleClick provides Internet advertising solutions. In the producer durables sector, we bought MKS Instruments, Inc., a semiconductor equipment supplier, and former holding Ultratech, Inc. a semiconductor equipment company.
SECTOR DIVERSIFICATION
| | | | | | |
| Sector | | 9/30/03 | | | 9/30/04 | |
Auto & Transportation | | 8.2 | % | | 7.1 | % |
Consumer Discretionary | | 23.0 | | | 25.7 | |
Consumer Staples | | 0.9 | | | — | |
Financial Services | | 12.9 | | | 14.6 | |
Healthcare | | 1.3 | | | 2.0 | |
Integrated Oils | | 1.0 | | | — | |
Materials & Processing | | 16.2 | | | 11.1 | |
Other | | — | | | — | |
Other Energy | | 17.8 | | | 20.5 | |
Producer Durables | | 4.9 | | | 4.1 | |
Technology | | 1.5 | | | 3.1 | |
Utilities | | 4.2 | | | 5.9 | |
Other assets less liabilities | | 8.1 | | | 5.9 | |
Total | | 100.0 | % | | 100.0 | % |
As a percentage of total net assets as of 9/30/03 and 9/30/04, respectively.
Several other purchases of note included: Heartland Express, Inc., a short- to medium-haul trucker; Jackson Hewitt Tax Service Inc., the nation’s second largest tax preparer; Sola International Inc., an eyeglass lens manufacturer; Superior Essex Inc., a wire and cable manufacturer; Par Pharmaceutical Companies Inc., a generic drug manufacturer; and Washington Group International, Inc., a heavy engineering firm.
The large increase in energy share prices drove a number of stocks up to our sell ranges. As a result, we sold Spinnaker Exploration Company and significantly scaled back our positions in Atwood Oceanics, Inc., Cabot Oil & Gas Corporation and Veritas DGC Inc. near the end of the period. Outside of the energy sector, we had a number of additional sales that funded our new buys. We sold Lincoln Electric Holdings, Inc., White Mountains Insurance Group, Ltd., Commscope, Inc., America Service Group Inc., LNR Property Corporation, Butler Manufacturing Company and Ralcorp Holdings, Inc. among others.
29
TWENTY-NINE
ARTISAN INTERNATIONAL FUND (ARTIX)
Schedule of Investments – September 30, 2004
| | | | | |
| | | Shares Held
| | Value
|
| | | | | | |
COMMON AND
PREFERRED STOCKS - 98.8% | | | | | |
| | | | | | |
| AUSTRALIA - 0.5% | | | | | |
Commonwealth Bank of Australia | | 2,231,694 | | $ | 48,796,218 |
| | | | | | |
| AUSTRIA - 0.2% | | | | | |
Erste Bank der oesterreichischen Sparkassen AG | | 400,400 | | | 16,656,091 |
| | | | | | |
| BELGIUM - 1.5% | | | | | |
InBev | | 4,514,222 | | | 150,452,579 |
| | | | | | |
| BRAZIL - 2.1% | | | | | |
Banco Bradesco S.A. (ADR) | | 78,350 | | | 4,129,045 |
Banco Bradesco S.A., Preferred | | 529,339 | | | 27,901,849 |
Banco Itau Holding Financeira S.A., Preferred | | 178,301,400 | | | 19,800,873 |
Companhia de Bebidas das Americas (Ambev), Preferred (ADR) | | 973,000 | | | 21,795,200 |
Petroleo Brasileiro S.A. (ADR) | | 1,937,200 | | | 68,286,300 |
Telesp Celular Participacoes S.A., Preferred (ADR)(1) | | 10,109,200 | | | 62,474,856 |
| | | | |
|
|
| | | | | | 204,388,123 |
| CANADA - 2.9% | | | | | |
Corus Entertainment, Inc., Class B | | 3,015,450 | | | 56,007,173 |
EnCana Corporation | | 4,393,600 | | | 202,621,269 |
Nortel Networks Corporation(1) | | 8,269,700 | | | 28,116,980 |
| | | | |
|
|
| | | | | | 286,745,422 |
| CHINA - 1.6% | | | | | |
China Mobile (Hong Kong) Limited | | 36,686,000 | | | 111,260,935 |
Citic Pacific Limited | | 18,818,400 | | | 48,384,725 |
| | | | |
|
|
| | | | | | 159,645,660 |
| CZECH REPUBLIC - 0.9% | | | | | |
Cesky Telecom, A.S. | | 6,794,605 | | | 90,345,259 |
| | | | | | |
| DENMARK - 1.1% | | | | | |
H. Lundbeck A/S | | 997,550 | | | 18,061,606 |
Novo Nordisk A/S, Class B | | 1,651,950 | | | 90,419,625 |
| | | | |
|
|
| | | | | | 108,481,231 |
| FRANCE - 4.8% | | | | | |
Credit Agricole S.A. | | 1,919,465 | | | 52,341,570 |
JC Decaux S.A.(1) | | 8,233,500 | | | 187,098,278 |
LVMH Moet Hennessy Louis Vuitton S.A. | | 280,790 | | | 18,741,067 |
| | | | | |
| | | Shares Held
| | Value
|
| | | | | | |
| FRANCE (CONTINUED) | | | |
M6 Metropole Television | | 1,460,700 | | $ | 39,069,778 |
PagesJaunes S.A.(1) | | 4,236,198 | | | 81,376,831 |
Total S.A. | | 453,100 | | | 92,272,465 |
| | | | |
|
|
| | | | | | 470,899,989 |
| GERMANY - 7.9% | | | | | |
Allianz AG | | 1,998,032 | | | 201,188,870 |
Deutsche Boerse AG | | 1,840,621 | | | 93,069,280 |
Henkel KGaA | | 293,230 | | | 21,544,885 |
KDG Investors, L.P.(1)(2)(3) | | - | | | - |
Linde AG | | 2,675,916 | | | 154,178,803 |
Muenchener Rueckversicherungs-Gesellschaft AG | | 1,852,039 | | | 178,370,134 |
ProSiebenSat.1 Media AG, Preferred | | 5,884,866 | | | 108,443,791 |
Schering AG | | 249,600 | | | 15,760,491 |
| | | | |
|
|
| | | | | | 772,556,254 |
| GREECE - 0.3% | | | | | |
OPAP S.A. | | 1,372,570 | | | 26,349,853 |
| | | | | | |
| HONG KONG - 0.9% | | | | | |
Hang Lung Group Limited | | 607,700 | | | 950,737 |
Hong Kong & China Gas Company Limited | | 24,395,700 | | | 45,831,293 |
Sun Hung Kai Properties Limited | | 3,889,400 | | | 36,659,045 |
| | | | |
|
|
| | | | | | 83,441,075 |
| ITALY - 3.2% | | | | | |
Assicurazioni Generali S.p.A | | 881,500 | | | 24,223,558 |
Banca Intesa S.p.A | | 15,259,606 | | | 57,982,770 |
Eni S.p.A. | | 5,141,717 | | | 115,180,488 |
Saipem S.p.A. | | 9,955,747 | | | 111,881,078 |
| | | | |
|
|
| | | | | | 309,267,894 |
| JAPAN - 18.5% | | | | | |
AEON Co., Ltd. | | 221,100 | | | 3,559,430 |
AEON Co., Ltd. - When Issued(1) | | 221,100 | | | 3,523,314 |
All Nippon Airways Co., Ltd. | | 7,781,000 | | | 24,925,750 |
The Bank of Yokohama, Ltd. | | 19,639,000 | | | 105,506,493 |
CANON Inc. | | 782,100 | | | 36,764,626 |
Credit Saison Co., Ltd. | | 4,474,500 | | | 137,651,935 |
East Japan Railway Co. | | 18,678 | | | 96,614,729 |
The Fuji Fire and Marine Insurance Co., Ltd. | | 804,900 | | | 2,549,209 |
Fuji Television Network, Inc. | | 18,908 | | | 38,435,428 |
Honda Motor Co., Ltd. | | 4,826,300 | | | 233,880,321 |
Japan Airlines Corp. | | 19,202,000 | | | 52,624,929 |
KEYENCE Corp. | | 332,350 | | | 69,911,276 |
30
THIRTY
| | | | | |
| | | Shares Held
| | Value
|
| | | | | | |
| JAPAN (CONTINUED) | | | |
KOMATSU Ltd. | | 3,417,300 | | $ | 21,956,063 |
Mizuho Financial Group, Inc. | | 15,556 | | | 58,443,523 |
Nikko Cordial Corp. | | 33,866,200 | | | 137,376,391 |
Nippon Broadcasting System, Inc. | | 194,940 | | | 9,022,134 |
Nomura Holdings, Inc. | | 6,233,000 | | | 80,037,161 |
Olympus Corp. | | 3,666,200 | | | 70,698,988 |
ORIX Corp. | | 1,096,000 | | | 112,389,854 |
Promise Co., Ltd. | | 2,126,400 | | | 139,129,216 |
SAMMY Corp. | | 397,800 | | | 19,493,806 |
Sankyo Co., Ltd. | | 67,500 | | | 2,664,595 |
SEGA Corp.(1) | | 1,437,900 | | | 19,429,494 |
Seven-Eleven Japan Co., Ltd. | | 604,000 | | | 17,265,756 |
SMC Corp. | | 720,800 | | | 69,008,939 |
The Sumitomo Trust & Banking Co., Ltd. | | 15,557,500 | | | 92,050,365 |
Tokyo Broadcasting System, Inc. | | 2,692,900 | | | 42,008,214 |
TOKYU Corp. | | 15,911,400 | | | 72,485,347 |
Yamato Transport Co., Ltd. | | 2,597,300 | | | 35,755,743 |
| | | | |
|
|
| | | | | | 1,805,163,029 |
| LUXEMBOURG - 0.5% | | | | | |
RTL Group | | 849,486 | | | 50,727,705 |
| | | | | | |
| MEXICO - 3.2% | | | | | |
Cemex S.A. de C.V. (ADR) | | 825,600 | | | 23,232,384 |
Grupo Televisa S.A. (ADR) | | 3,508,500 | | | 185,003,205 |
Wal-Mart de Mexico S.A. de C.V.,
Series V | | 29,419,200 | | | 99,889,889 |
| | | | |
|
|
| | | | | | 308,125,478 |
| NETHERLANDS - 5.3% | | | | | |
ASML Holding N.V.(1) | | 9,557,746 | | | 122,955,922 |
ASML Holding N.V., NY Shares(1)(4) | | 1,394,500 | | | 17,947,215 |
Fortis | | 12,360,376 | | | 293,770,260 |
Unilever N.V. | | 1,488,700 | | | 85,626,847 |
| | | | |
|
|
| | | | | | 520,300,244 |
| NORWAY - 1.0% | | | | | |
Telenor ASA | | 12,702,300 | | | 96,712,752 |
| | | | | | |
| REPUBLIC OF KOREA - 0.1% | | | | | |
Kookmin Bank(1) | | 288,900 | | | 9,144,946 |
| | | | | | |
| RUSSIA - 2.0% | | | | | |
Gazprom (ADR)(1) | | 637,709 | | | 22,829,982 |
LUKOIL (ADR) | | 897,700 | | | 111,988,075 |
Sibneft (ADR) | | 1,734,598 | | | 59,462,020 |
| | | | |
|
|
| | | | | | 194,280,077 |
| SINGAPORE - 2.3% | | | | | |
DBS Group Holdings Ltd. | | 10,968,734 | | | 104,200,531 |
Singapore Airlines Ltd. | | 5,808,000 | | | 37,587,769 |
Singapore Telecommunications Ltd. | | 55,724,970 | | | 77,421,065 |
| | | | |
|
|
| | | | | | 219,209,365 |
| | | | | |
| | | Shares Held
| | Value
|
| | | | | | |
| SPAIN - 5.4% | | | | | |
Altadis, S.A. | | 3,258,584 | | $ | 110,869,910 |
Amadeus Global Travel Distribution S.A. | | 3,900,272 | | | 30,850,950 |
Banco Bilbao Vizcaya Argentaria, S.A. | | 4,043,970 | | | 55,639,331 |
Industria de Diseno Textil, S.A. | | 1,823,613 | | | 45,062,986 |
Promotora de Informaciones, S.A. | | 8,307,954 | | | 153,198,583 |
Telefonica, S.A. | | 8,554,780 | | | 128,005,934 |
| | | | |
|
|
| | | | | | 523,627,694 |
| SWEDEN - 3.3% | | | | | |
Hennes & Mauritz AB, Class B | | 385,350 | | | 10,602,810 |
Telefonaktiebolaget LM Ericsson, Class B(1) | | 62,726,100 | | | 194,539,572 |
Telefonaktiebolaget LM Ericsson (ADR)(1) | | 3,795,000 | | | 118,555,800 |
| | | | |
|
|
| | | | | | 323,698,182 |
| SWITZERLAND - 11.5% | | | | | |
Clariant AG(5) | | 13,411,333 | | | 160,753,200 |
Credit Suisse Group | | 5,336,231 | | | 170,494,131 |
Julius Baer Holding, Ltd. Class B | | 270,024 | | | 74,149,705 |
Nestle S.A. | | 910,836 | | | 208,858,766 |
Roche Holding AG | | 1,194,000 | | | 123,492,483 |
Serono S.A. | | 161,556 | | | 99,867,449 |
UBS AG | | 4,033,081 | | | 284,231,565 |
| | | | |
|
|
| | | | | | 1,121,847,299 |
| TAIWAN - 1.0% | | | | | |
Chunghwa Telecom Co., Ltd. (ADR) | | 5,287,400 | | | 93,111,114 |
| | | | | | |
| THAILAND - 0.1% | | | | | |
Advanced Info Service PLC(2) | | 5,588,500 | | | 13,231,020 |
| | | | | | |
| UNITED KINGDOM - 16.7% | | | | | |
Allied Domecq PLC | | 5,276,513 | | | 44,784,349 |
AstraZeneca PLC | | 297,300 | | | 12,186,234 |
BP PLC | | 3,972,100 | | | 37,918,317 |
British American Tobacco PLC | | 414,500 | | | 6,008,464 |
British Sky Broadcasting Group PLC | | 20,130,407 | | | 174,590,692 |
Carnival PLC | | 470,701 | | | 23,144,147 |
Compass Group PLC | | 30,684,496 | | | 122,443,010 |
Diageo PLC | | 6,991,951 | | | 87,307,967 |
GlaxoSmithKline PLC | | 458,600 | | | 9,884,443 |
Imperial Chemical Industries PLC | | 33,483,520 | | | 127,855,664 |
ITV PLC | | 130,783,280 | | | 255,020,982 |
Kesa Electricals PLC | | 12,283,370 | | | 62,908,652 |
Kingfisher PLC | | 48,552,610 | | | 270,845,782 |
Marks & Spencer Group PLC | | 4,343,305 | | | 26,960,060 |
Pearson PLC | | 6,429,200 | | | 68,762,368 |
Tesco PLC | | 50,982,868 | | | 263,182,087 |
William Morrison Supermarkets PLC | | 9,694,000 | | | 33,770,708 |
| | | | |
|
|
| | | | | | 1,627,573,926 |
| | | | |
|
|
Total common and preferred stocks
(Cost $8,361,282,308) | | | | | 9,634,778,479 |
31
THIRTY-ONE
| | | | | | |
| | | Par Amount
| | Value
|
| SHORT-TERM INVESTMENTS (CASH EQUIVALENTS) - 0.7% | | | | | | |
Repurchase agreement with State Street Bank and Trust Company, 1.50%, dated 9/30/04, due 10/1/04, maturity value $68,419,851, collateralized by $51,001,746 market value
Federal National Mortgage Association Note,
5.250%, due 6/15/06 and $18,786,437 market value
Federal National Mortgage Association Note,
1.875%, due 1/15/05
(Cost $68,417,000) | | $ | 68,417,000 | | $ | 68,417,000 |
| | | | | |
|
|
| | | | | | | |
Total investments - 99.5%
(Cost $8,429,699,308) | | | | | | 9,703,195,479 |
| | | | | | | |
Other assets less liabilities - 0.5% | | | | | | 49,084,544 |
| | | | | |
|
|
| | | | | | | |
Total net assets - 100.0%(6) | | | | | $ | 9,752,280,023 |
| | | | | |
|
|
| (1) | Non-income producing security. |
| (2) | Valued at a fair value in accordance with procedures established by the Board of Directors of Artisan Funds. |
| (3) | Private investment partnership which is restricted as to resale. Total investment cost of $10 million, made through capital contributions on 3/6/00, 7/10/00, and 5/15/01. Value at September 30, 2004 represents 0.0% of total net assets. |
| (4) | Principally traded in the United States. |
| (5) | Affiliated company as defined by the Investment Company Act of 1940. See Note 6 to the financial statements. |
| (6) | Percentages for the various classifications relate to total net assets. |
(ADR) American Depository Receipt
| | | | | | |
| PORTFOLIO DIVERSIFICATION - SEPTEMBER 30, 2004 | |
| | | Value
| | Percentage
| |
Consumer Discretionary | | $ | 2,331,291,745 | | 23.9 | % |
Consumer Staples | | | 1,158,440,150 | | 11.9 | |
Energy | | | 799,610,010 | | 8.2 | |
Financials | | | 2,618,834,659 | | 26.8 | |
Healthcare | | | 440,371,321 | | 4.5 | |
Industrials | | | 459,343,992 | | 4.7 | |
Information Technology | | | 619,642,341 | | 6.4 | |
Materials | | | 466,020,050 | | 4.8 | |
Telecommunication Services | | | 672,562,936 | | 6.9 | |
Utilities | | | 68,661,275 | | 0.7 | |
| | |
|
| |
|
|
Total common and preferred stocks | | | 9,634,778,479 | | 98.8 | |
Total short-term investments | | | 68,417,000 | | 0.7 | |
| | |
|
| |
|
|
Total investments | | | 9,703,195,479 | | 99.5 | |
Other assets less liabilities | | | 49,084,544 | | 0.5 | |
| | |
|
| |
|
|
Total net assets | | $ | 9,752,280,023 | | 100.0 | % |
| | |
|
| |
|
|
The accompanying notes are an integral part of the financial statements.
32
THIRTY-TWO
ARTISAN INTERNATIONAL SMALL CAP FUND (ARTJX)
Schedule of Investments – September 30, 2004
| | | | | |
| | | Shares
Held
| | Value
|
| | | | | | |
COMMON AND
PREFERRED STOCKS - 93.4% | | | | | |
| | | | | | |
| AUSTRALIA - 3.1% | | | | | |
APN News & Media Limited | | 1,438,650 | | $ | 4,730,416 |
John Fairfax Holdings Limited | | 4,184,480 | | | 11,243,559 |
| | | | |
|
|
| | | | | | 15,973,975 |
| AUSTRIA - 2.2% | | | | | |
Wienerberger AG | | 297,925 | | | 11,172,442 |
| | | | | | |
| BELGIUM - 2.0% | | | | | |
Colruyt N.V. | | 73,410 | | | 10,300,727 |
Colruyt N.V., Rights(1) | | 73,410 | | | 97,538 |
| | | | |
|
|
| | | | | | 10,398,265 |
| BRAZIL - 2.9% | | | | | |
Natura Cosmeticos S.A. | | 430,500 | | | 8,703,358 |
Telesp Celular Participacoes S.A., Preferred (ADR)(1) | | 1,001,200 | | | 6,187,416 |
| | | | |
|
|
| | | | | | 14,890,774 |
| CANADA - 3.5% | | | | | |
Corus Entertainment, Inc., Class B | | 406,600 | | | 7,551,946 |
Precision Drilling Corporation(1) | | 182,400 | | | 10,470,431 |
| | | | |
|
|
| | | | | | 18,022,377 |
| CHINA - 1.0% | | | | | |
Beijing Capital International Airport Company Limited | | 14,456,600 | | | 5,098,120 |
| | | | | | |
| COLOMBIA - 0.8% | | | | | |
Bancolombia S.A., Preferred (ADR) | | 506,400 | | | 4,101,840 |
| | | | | | |
| FRANCE - 9.2% | | | | | |
Camaieu | | 89,802 | | | 8,028,838 |
Clarins S.A. | | 208,395 | | | 12,729,118 |
Eramet SLN | | 92,825 | | | 7,376,989 |
Ipsos | | 46,912 | | | 4,450,528 |
JC Decaux S.A.(1) | | 328,958 | | | 7,475,251 |
Remy Cointreau S.A. | | 212,603 | | | 7,249,435 |
| | | | |
|
|
| | | | | | 47,310,159 |
| GERMANY - 3.3% | | | | | |
AMB Generali Holding AG | | 11,462 | | | 811,278 |
Grenkeleasing AG | | 84,162 | | | 3,344,261 |
Stada Arzneimittel AG | | 580,114 | | | 12,894,384 |
| | | | |
|
|
| | | | | | 17,049,923 |
| GREECE - 0.6% | | | | | |
Coca-Cola Hellenic Bottling Company S.A. | | 137,720 | | | 2,961,959 |
| | | | | |
| | | Shares
Held
| | Value
|
| | | | | | |
| HONG KONG - 2.7% | | | | | |
China Resources Power Holdings Company Limited | | 4,764,850 | | $ | 2,734,346 |
Hong Kong Exchanges & Clearing Limited | | 1,886,000 | | | 4,280,812 |
Panva Gas Holdings Limited(1) | | 15,926,800 | | | 6,790,963 |
| | | | |
|
|
| | | | | | 13,806,121 |
| INDIA - 1.1% | | | | | |
Sify Limited (ADR)(1) | | 974,556 | | | 5,506,241 |
| | | | | | |
| ITALY - 3.5% | | | | | |
Gruppo Editoriale L’Espresso S.p.A. | | 2,136,900 | | | 11,808,056 |
RCS MediaGroup S.p.A. | | 1,299,200 | | | 6,033,674 |
| | | | |
|
|
| | | | | | 17,841,730 |
| JAPAN - 5.6% | | | | | |
Creed Corporation | | 2,586 | | | 9,480,866 |
Ito En, Ltd. | | 22,100 | | | 964,663 |
Komeri Company, Ltd. | | 425,900 | | | 9,256,595 |
Park24 Company, Ltd. | | 71,200 | | | 2,093,452 |
Toho Company, Ltd. | | 510,800 | | | 7,254,431 |
| | | | |
|
|
| | | | | | 29,050,007 |
| MALAYSIA - 1.2% | | | | | |
AMMB Holdings Berhad | | 7,073,740 | | | 6,142,985 |
| | | | | | |
| NORWAY - 1.5% | | | | | |
Smedvig ASA, B shares | | 702,200 | | | 7,563,213 |
| | | | | | |
| PANAMA - 4.6% | | | | | |
Banco Latinoamericano de Exportaciones, S.A., E Shares(2) | | 1,541,014 | | | 23,654,565 |
| | | | | | |
| PORTUGAL - 3.7% | | | | | |
CIMPOR-Cimentos de Portugal,
S.G.P.S., S.A. | | 951,674 | | | 4,904,226 |
Impresa - Sociedade Gestora de Participacoes, S.A.(1) | | 1,094,784 | | | 6,090,328 |
Sonae, S.G.P.S., S.A. | | 7,466,100 | | | 8,343,928 |
| | | | |
|
|
| | | | | | 19,338,482 |
| REPUBLIC OF KOREA - 3.8% | | | | | |
Fine Tec Corporation(3) | | 1,201,124 | | | 4,902,547 |
Gwangju Shinsegae Company, Ltd. | | 21,080 | | | 660,867 |
Hanil Cement Company, Ltd. | | 95,205 | | | 3,811,507 |
Kangwon Land, Inc. | | 805,126 | | | 8,670,050 |
Shinsegae Food System Company, Ltd. | | 47,284 | | | 1,387,928 |
| | | | |
|
|
| | | | | | 19,432,899 |
33
THIRTY-THREE
| | | | | |
| | | Shares
Held
| | Value
|
| | | | | | |
| RUSSIA - 4.6% | | | | | |
AO VimpelCom (ADR)(1) | | 160,000 | | $ | 17,408,000 |
Uralsvyazinform (ADR) | | 873,400 | | | 6,480,628 |
| | | | |
|
|
| | | | | | 23,888,628 |
| SINGAPORE - 3.0% | | | | | |
Fraser & Neave Limited | | 1,865,320 | | | 15,394,358 |
| | | | | | |
| SPAIN - 3.1% | | | | | |
Gestevision Telecinco, S.A.(1) | | 479,200 | | | 8,663,880 |
Recoletos Grupo de Comunicacion, S.A. | | 995,241 | | | 7,612,778 |
| | | | |
|
|
| | | | | | 16,276,658 |
| SWEDEN - 3.1% | | | | | |
Elekta AB, B shares(1) | | 440,224 | | | 10,692,967 |
JM AB | | 271,300 | | | 5,435,680 |
| | | | |
|
|
| | | | | | 16,128,647 |
| SWITZERLAND - 12.3% | | | | | |
Bank Sarasin & Cie AG, B shares | | 5,883 | | | 8,867,541 |
Bobst Group AG | | 263,825 | | | 8,566,777 |
Logitech International S.A.(1) | | 135,834 | | | 6,588,861 |
Schindler Holding AG, Participation Certificates | | 35,661 | | | 10,150,054 |
Straumann AG | | 48,615 | | | 10,329,104 |
Sulzer AG | | 39,452 | | | 11,830,064 |
Synthes, Inc. | | 65,955 | | | 7,191,726 |
| | | | |
|
|
| | | | | | 63,524,127 |
| THAILAND - 3.6% | | | | | |
Bangkok Bank Public Company Limited(1) | | 1,816,500 | | | 4,320,822 |
Land and Houses Public Company Limited - Foreign Shares | | 16,112,300 | | | 3,696,374 |
Land and Houses Public Company Limited - Local Shares | | 18,422,500 | | | 4,048,412 |
National Finance Public Company Limited | | 21,700,000 | | | 6,497,948 |
| | | | |
|
|
| | | | | | 18,563,556 |
| UNITED KINGDOM - 7.4% | | | | | |
Capital Radio PLC | | 442,200 | | | 3,289,023 |
GWR Group PLC | | 1,056,987 | | | 4,629,045 |
Intertek Group PLC | | 938,500 | | | 10,190,417 |
John Wood Group PLC | | 3,438,699 | | | 8,603,313 |
MFI Furniture Group PLC | | 1,591,363 | | | 3,038,282 |
SMG PLC | | 4,194,476 | | | 8,349,814 |
| | | | |
|
|
| | | | | | 38,099,894 |
| | | | |
|
|
Total common and preferred stocks (Cost $390,635,956) | | | | | 481,191,945 |
| | | | | | | |
| | | Par
Amount
| | Value
| |
| | | | | | | | |
| SHORT-TERM INVESTMENTS (CASH EQUIVALENTS) - 7.4% | | | | | | | |
Repurchase agreement with State Street Bank and Trust Company, 1.50%, dated 9/30/04, due 10/1/04, maturity value $38,119,588, collateralized by $38,882,155 market value
Federal National Mortgage
Association Note,
1.875%, due 1/15/05
(Cost $38,118,000) | | $ | 38,118,000 | | $ | 38,118,000 | |
| | | | | |
|
|
|
| | | | | | | | |
Total investments - 100.8%
(Cost $428,753,956) | | | | | | 519,309,945 | |
| | | | | | | | |
| Other assets less liabilities - (0.8%) | | | | | | (4,301,277 | ) |
| | | | | |
|
|
|
| | | | | | | | |
| Total net assets - 100.0%(4) | | | | | $ | 515,008,668 | |
| | | | | |
|
|
|
| (1) | Non-income producing security. |
| (2) | Principally traded in the United States. |
| (3) | Affiliated company as defined by the Investment Company Act of 1940. See Note 6 to the financial statements. |
| (4) | Percentages for the various classifications relate to total net assets. |
(ADR) American Depository Receipt
| | | | | | | |
| PORTFOLIO DIVERSIFICATION - SEPTEMBER 30, 2004 | |
| | | Value
| | | Percentage
| |
Consumer Discretionary | | $ | 142,017,827 | | | 27.6 | % |
Consumer Staples | | | 59,789,084 | | | 11.6 | |
Energy | | | 26,636,957 | | | 5.2 | |
Financials | | | 71,502,918 | | | 13.9 | |
Healthcare | | | 41,108,181 | | | 8.0 | |
Industrials | | | 67,445,254 | | | 13.1 | |
Information Technology | | | 16,997,649 | | | 3.3 | |
Materials | | | 16,092,722 | | | 3.1 | |
Telecommunication Services | | | 30,076,044 | | | 5.8 | |
Utilities | | | 9,525,309 | | | 1.8 | |
| | |
|
|
| |
|
|
Total common and preferred stocks | | | 481,191,945 | | | 93.4 | |
Total short-term investments | | | 38,118,000 | | | 7.4 | |
| | |
|
|
| |
|
|
Total investments | | | 519,309,945 | | | 100.8 | |
Other assets less liabilities | | | (4,301,277 | ) | | (0.8 | ) |
| | |
|
|
| |
|
|
Total net assets | | $ | 515,008,668 | | | 100.0 | % |
| | |
|
|
| |
|
|
The accompanying notes are an integral part of the financial statements.
34
THIRTY-FOUR
ARTISAN INTERNATIONAL VALUE FUND (ARTKX)
Schedule of Investments – September 30, 2004
| | | | | |
| | | Shares
Held
| | Value
|
| | | | | | |
COMMON AND
PREFERRED STOCKS - 94.1% | | | | | |
| | | | | | |
| AUSTRALIA - 3.0% | | | | | |
Rinker Group, Ltd. | | 680,400 | | $ | 4,252,688 |
Rinker Group, Ltd. (ADR) | | 37,660 | | | 2,359,022 |
| | | | |
|
|
| | | | | | 6,611,710 |
| FRANCE - 7.0% | | | | | |
Euronext N.V. | | 313,484 | | | 8,918,148 |
Vivendi Universal S.A.(1) | | 249,660 | | | 6,395,616 |
| | | | |
|
|
| | | | | | 15,313,764 |
| GERMANY - 4.5% | | | | | |
Henkel KGaA | | 34,850 | | | 2,423,400 |
Pfeiffer Vacuum Technology AG | | 165,482 | | | 6,370,106 |
Schering AG | | 17,130 | | | 1,081,639 |
| | | | |
|
|
| | | | | | 9,875,145 |
| HONG KONG - 4.8% | | | | | |
Asia Satellite Telecommunications Holdings, Ltd. | | 1,839,500 | | | 3,491,184 |
Guoco Group, Ltd. | | 818,000 | | | 6,949,449 |
| | | | |
|
|
| | | | | | 10,440,633 |
| ITALY - 7.1% | | | | | |
Caltagirone Editore S.p.A. | | 437,254 | | | 3,572,678 |
Cementir S.p.A. Cementerie del Tirreno | | 2,634,853 | | | 11,778,585 |
| | | | |
|
|
| | | | | | 15,351,263 |
| JAPAN - 6.0% | | | | | |
Ichiyoshi Securities Co., Ltd. | | 353,000 | | | 2,662,035 |
Meitec Corporation | | 129,000 | | | 4,635,782 |
NIPPONKOA Insurance Company, Ltd. | | 192,000 | | | 1,075,040 |
Olympus Corporation | | 241,000 | | | 4,647,443 |
| | | | |
|
|
| | | | | | 13,020,300 |
| MEXICO - 1.8% | | | | | |
Grupo Aeroportuario del Sureste S.A. de C.V. (ADR) | | 181,290 | | | 4,006,509 |
| | | | | | |
| NETHERLANDS - 7.2% | | | | | |
Hunter Douglas N.V. | | 99,491 | | | 4,569,854 |
Koninklijke Numico N.V.(1) | | 94,000 | | | 2,992,816 |
Wolters Kluwer N.V. | | 476,308 | | | 8,014,222 |
| | | | |
|
|
| | | | | | 15,576,892 |
| | | | | |
| | | Shares
Held
| | Value
|
| | | | | | |
| NEW ZEALAND - 1.8% | | | | | |
Telecom Corporation of New Zealand, Ltd. | | 958,315 | | $ | 3,816,795 |
| | | | | | |
| NORWAY - 0.4% | | | | | |
Statoil ASA | | 54,195 | | | 776,952 |
| | | | | | |
| REPUBLIC OF KOREA - 4.6% | | | | | |
Lotte Chilsung Beverage Co., Ltd. | | 6,510 | | | 4,675,441 |
Lotte Chilsung Beverage Co., Ltd., Preferred | | 580 | | | 152,115 |
Lotte Confectionary Co., Ltd. | | 4,535 | | | 2,977,386 |
Samchully Co., Ltd. | | 40,850 | | | 2,153,361 |
| | | | |
|
|
| | | | | | 9,958,303 |
| SWITZERLAND - 12.8% | | | | | |
Clariant AG(2) | | 529,280 | | | 6,344,146 |
Givaudan S.A. | | 10,976 | | | 6,679,322 |
Pargesa Holding AG | | 1,733 | | | 5,279,936 |
PubliGroupe S.A. | | 2,027 | | | 589,939 |
Schindler Holding AG | | 6,864 | | | 2,132,532 |
Tamedia AG | | 36,369 | | | 2,974,254 |
Zehnder Group AG | | 3,697 | | | 3,853,357 |
| | | | |
|
|
| | | | | | 27,853,486 |
| UNITED KINGDOM - 31.1% | | | | | |
Admiral Group PLC(1) | | 300,000 | | | 1,563,580 |
Benfield Group PLC | | 1,655,900 | | | 7,192,034 |
Brit Insurance Holdings PLC | | 3,698,694 | | | 4,852,805 |
Carpetright PLC | | 110,860 | | | 2,110,557 |
Countrywide PLC | | 1,249,900 | | | 7,068,572 |
Diageo PLC | | 925,626 | | | 11,558,222 |
MFI Furniture Group PLC | | 2,661,000 | | | 5,080,468 |
Rotork PLC | | 358,000 | | | 2,581,771 |
Signet Group PLC | | 3,038,150 | | | 6,295,368 |
Tate & Lyle PLC | | 581,500 | | | 4,062,033 |
Unilever PLC (ADR) | | 253,225 | | | 8,361,490 |
Vodafone Group PLC (ADR) | | 285,050 | | | 6,872,556 |
| | | | |
|
|
| | | | | | 67,599,456 |
| UNITED STATES - 2.0% | | | | | |
Arch Capital Group Ltd.(1)(3) | | 114,700 | | | 4,466,418 |
| | | | |
|
|
Total common and preferred stocks
(Cost $187,616,947) | | | | | 204,667,626 |
35
THIRTY-FIVE
| | | | | | |
| | | Par Amount
| | Value
|
| | | | | | | |
| SHORT-TERM INVESTMENTS (CASH EQUIVALENTS) - 5.1% | | | | | | |
Repurchase agreement with State Street Bank and Trust Company,
1.50%, dated 9/30/04, due 10/1/04, maturity value $11,044,460, collateralized by $11,266,846 market value
Federal National Mortgage
Association Note,
1.875%, due 1/15/05
(Cost $11,044,000) | | $ | 11,044,000 | | $ | 11,044,000 |
| | | | | |
|
|
| | | | | | | |
Total investments - 99.2%
(Cost $198,660,947) | | | | | | 215,711,626 |
| | | | | | | |
Other assets less liabilities - 0.8% | | | | | | 1,786,907 |
| | | | | |
|
|
| | | | | | | |
Total net assets - 100.0%(4) | | | | | $ | 217,498,533 |
| | | | | |
|
|
| (1) | Non-income producing security. |
| (2) | Affiliated company as defined by the Investment Company Act of 1940. See Note 6 to the financial statements. |
| (3) | Principally traded in the United States. |
| (4) | Percentages for the various classifications relate to total net assets. |
(ADR) American Depository Receipt
| | | | | | |
| PORTFOLIO DIVERSIFICATION - SEPTEMBER 30, 2004 | |
| | | Value
| | Percentage
| |
Consumer Discretionary | | $ | 39,602,956 | | 18.2 | % |
Consumer Staples | | | 37,202,902 | | 17.1 | |
Energy | | | 776,952 | | 0.4 | |
Financials | | | 50,028,018 | | 23.0 | |
Healthcare | | | 5,729,083 | | 2.6 | |
Industrials | | | 23,580,057 | | 10.8 | |
Information Technology | | | — | | — | |
Materials | | | 31,413,762 | | 14.5 | |
Telecommunication Services | | | 14,180,535 | | 6.5 | |
Utilities | | | 2,153,361 | | 1.0 | |
| | |
|
| |
|
|
Total common and preferred stocks | | | 204,667,626 | | 94.1 | |
Total short-term investments | | | 11,044,000 | | 5.1 | |
| | |
|
| |
|
|
Total investments | | | 215,711,626 | | 99.2 | |
Other assets less liabilities | | | 1,786,907 | | 0.8 | |
| | |
|
| |
|
|
Total net assets | | $ | 217,498,533 | | 100.0 | % |
| | |
|
| |
|
|
The accompanying notes are an integral part of the financial statements.
36
THIRTY-SIX
ARTISAN MID CAP FUND (ARTMX)
Schedule of Investments – September 30, 2004
| | | | | |
| | | Shares
Held
| | Value
|
| | | | | | |
| COMMON STOCKS - 97.3% | | | | | |
| | | | | | |
| AUTO & TRANSPORTATION - 4.0% | | | |
Air Transport - 2.5% | | | | | |
Expeditors International of Washington, Inc. | | 1,010,000 | | $ | 52,217,000 |
FedEx Corporation | | 535,800 | | | 45,912,702 |
JetBlue Airways Corporation(1) | | 1,474,600 | | | 30,848,632 |
| | | | |
|
|
| | | | | | 128,978,334 |
Auto Trucks & Parts - 1.5% | | | | | |
Gentex Corporation | | 355,600 | | | 12,492,228 |
PACCAR Inc. | | 952,600 | | | 65,843,712 |
| | | | |
|
|
| | | | | | 78,335,940 |
| CONSUMER DISCRETIONARY - 24.9% | | | |
Advertising Agencies - 1.7% | | | |
Dex Media, Inc.(1) | | 999,500 | | | 21,159,415 |
Lamar Advertising Company(1) | | 1,623,800 | | | 67,566,318 |
| | | | |
|
|
| | | | | | 88,725,733 |
Cable Television Services - 1.4% | | | |
EchoStar Communications Corporation(1) | | 2,352,600 | | | 73,212,912 |
| | | | | | |
Consumer Electronics - 1.8% | | | |
VeriSign, Inc.(1) | | 1,478,000 | | | 29,382,640 |
Yahoo! Inc.(1) | | 1,888,800 | | | 64,049,208 |
| | | | |
|
|
| | | | | | 93,431,848 |
Education Services - 0.5% | | | | | |
Corinthian Colleges, Inc.(1) | | 2,047,800 | | | 27,604,344 |
| | | | | | |
Leisure Time - 0.7% | | | | | |
Royal Caribbean Cruises Ltd. | | 858,100 | | | 37,413,160 |
| | | | | | |
Radio & TV Broadcasters - 1.4% | | | |
Entercom Communications Corp.(1) | | 450,600 | | | 14,716,596 |
Univision Communications Inc.(1) | | 1,815,600 | | | 57,391,116 |
| | | | |
|
|
| | | | | | 72,107,712 |
Restaurants - 1.7% | | | | | |
Starbucks Corporation(1) | | 595,000 | | | 27,048,700 |
YUM! Brands, Inc. | | 1,451,300 | | | 59,009,858 |
| | | | |
|
|
| | | | | | 86,058,558 |
Retail - 9.9% | | | | | |
Amazon.com, Inc.(1) | | 1,271,000 | | | 51,933,060 |
American Eagle Outfitters, Inc. | | 745,000 | | | 27,453,250 |
Bed Bath & Beyond Inc.(1) | | 448,500 | | | 16,643,835 |
| | | | | |
| | | Shares
Held
| | Value
|
| | | | | | |
| CONSUMER DISCRETIONARY (CONTINUED) | | | |
Retail (Continued) | | | | | |
CarMax, Inc.(1) | | 1,851,300 | | $ | 39,895,515 |
CDW Corporation | | 993,800 | | | 57,670,214 |
Chico’s FAS, Inc.(1) | | 700,900 | | | 23,970,780 |
Costco Wholesale Corporation | | 924,400 | | | 38,418,064 |
Fisher Scientific International Inc.(1) | | 1,060,400 | | | 61,853,132 |
Kohl’s Corporation(1) | | 1,399,100 | | | 67,422,629 |
Linens ‘n Things, Inc.(1) | | 793,600 | | | 18,387,712 |
Nordstrom, Inc. | | 664,300 | | | 25,402,832 |
Ross Stores, Inc. | | 727,100 | | | 17,043,224 |
Staples, Inc. | | 1,874,500 | | | 55,897,590 |
| | | | |
|
|
| | | | | | 501,991,837 |
Services: Commercial - 5.0% | | | | | |
Accenture Ltd., Class A(1) | | 1,961,400 | | | 53,055,870 |
Getty Images, Inc.(1) | | 962,000 | | | 53,198,600 |
Hewitt Associates, Inc.(1) | | 1,566,700 | | | 41,454,882 |
Iron Mountain Incorporated(1) | | 1,830,200 | | | 61,952,270 |
Robert Half International Inc. | | 1,802,196 | | | 46,442,591 |
| | | | |
|
|
| | | | | | 256,104,213 |
Textiles: Apparel
Manufacturers - 0.8% | | | | | |
Jones Apparel Group, Inc. | | 1,067,600 | | | 38,220,080 |
| | | | | | |
| CONSUMER STAPLES - 2.1% | | | | | |
Beverage: Brewers
(Wineries) - 1.3% | | | | | |
Constellation Brands, Inc.(1) | | 1,680,800 | | | 63,971,248 |
| | | | | | |
Beverage: Soft Drinks - 0.0%(2) | | | |
Cott Corporation(1) | | 40,900 | | | 1,179,556 |
| | | | | | |
Drug & Grocery Store Chains - 0.8% | | | |
Whole Foods Market, Inc. | | 453,300 | | | 38,888,607 |
| | | | | | |
| FINANCIAL SERVICES - 10.3% | | | |
Banks: Outside New York City - 0.9% | | | |
North Fork Bancorporation, Inc. | | 1,016,400 | | | 45,178,980 |
| | | | | | |
Diversified Financial Services - 1.4% | | | |
CIT Group Inc. | | 1,859,400 | | | 69,522,966 |
| | | | | | |
Finance: Small Loan - 0.0%(2) | | | |
The First Marblehead Corporation(1) | | 32,800 | | | 1,521,920 |
37
THIRTY-SEVEN
| | | | | |
| | | Shares
Held
| | Value
|
| | | | | | |
| FINANCIAL SERVICES (CONTINUED) | | | |
Financial Data Processing Services & Systems - 1.7% | | | | | |
CheckFree Corporation(1) | | 955,700 | | $ | 26,444,219 |
Paychex, Inc. | | 2,038,600 | | | 61,463,790 |
| | | | |
|
|
| | | | | | 87,908,009 |
Financial Miscellaneous - 3.4% | | | | | |
CapitalSource Inc.(1) | | 2,310,200 | | | 51,609,868 |
MGIC Investment Corporation | | 1,060,700 | | | 70,589,585 |
Willis Group Holdings Limited | | 1,283,600 | | | 48,006,640 |
| | | | |
|
|
| | | | | | 170,206,093 |
Insurance: Property-Casualty - 0.2% | | | |
RenaissanceRe Holdings Ltd. | | 214,700 | | | 11,074,226 |
| | | | | | |
Rental & Leasing Services: Commercial - 0.4% | | | | | |
GATX Corporation | | 780,700 | | | 20,813,462 |
| | | | | | |
Savings & Loans - 0.8% | | | | | |
Golden West Financial Corporation | | 376,800 | | | 41,805,960 |
| | | | | | |
Securities Brokerage &
Services - 1.5% | | | | | |
Ameritrade Holding Corporation(1) | | 3,739,500 | | | 44,911,395 |
The Bear Stearns Companies Inc. | | 302,800 | | | 29,120,276 |
| | | | |
|
|
| | | | | | 74,031,671 |
| HEALTHCARE - 16.6% | | | | | |
Biotechnology Research & Production - 3.5% | | | | | |
Chiron Corporation(1) | | 1,026,200 | | | 45,358,040 |
ICOS Corporation(1) | | 1,224,000 | | | 29,547,360 |
Invitrogen Corporation(1) | | 1,111,300 | | | 61,110,387 |
Millennium Pharmaceuticals, Inc.(1) | | 2,888,700 | | | 39,604,077 |
| | | | |
|
|
| | | | | | 175,619,864 |
Drugs & Pharmaceuticals - 4.3% | | | |
Allergan, Inc. | | 658,900 | | | 47,803,195 |
Barr Pharmaceuticals, Inc.(1) | | 599,000 | | | 24,816,570 |
Hospira, Inc.(1) | | 1,228,600 | | | 37,595,160 |
IVAX Corporation(1) | | 1,892,525 | | | 36,241,853 |
MedImmune, Inc.(1) | | 1,527,000 | | | 36,189,900 |
Mylan Laboratories Inc. | | 2,117,800 | | | 38,120,400 |
| | | | |
|
|
| | | | | | 220,767,078 |
Electronics: Medical Systems - 1.0% | | | |
Varian Medical Systems, Inc.(1) | | 1,468,200 | | | 50,755,674 |
| | | | | | |
Health Care Facilities - 0.5% | | | | | |
DaVita Inc.(1) | | 888,300 | | | 27,670,545 |
| | | | | | |
Health Care Management Services - 4.8% | | | | | |
Aetna Inc. | | 790,300 | | | 78,974,679 |
| | | | | |
| | | Shares
Held
| | Value
|
| | | | | | |
| HEALTHCARE (CONTINUED) | | | |
Health Care Management Services (Continued) | | | | | |
Caremark Rx, Inc.(1) | | 2,425,100 | | $ | 77,772,957 |
Cerner Corporation(1) | | 1,156,200 | | | 50,017,212 |
IMS Health Incorporated | | 1,561,700 | | | 37,355,864 |
| | | | |
|
|
| | | | | | 244,120,712 |
Health Care Services - 0.2% | | | | | |
Stericycle, Inc.(1) | | 221,200 | | | 10,153,080 |
| | | | | | |
Medical & Dental Instruments & Supplies - 2.3% | | | | | |
Boston Scientific Corporation(1) | | 1,590,100 | | | 63,174,673 |
Zimmer Holdings, Inc.(1) | | 645,700 | | | 51,036,128 |
| | | | |
|
|
| | | | | | 114,210,801 |
| MATERIALS & PROCESSING - 8.1% | | | |
Chemicals - 2.5% | | | | | |
Air Products and Chemicals, Inc. | | 1,214,000 | | | 66,017,320 |
Ecolab Inc. | | 1,858,100 | | | 58,418,664 |
| | | | |
|
|
| | | | | | 124,435,984 |
Containers & Packaging: Paper & Plastic - 1.1% | | | | | |
Smurfit-Stone Container Corporation(1) | | 2,867,200 | | | 55,537,664 |
| | | | | | |
Copper - 0.7% | | | | | |
Freeport-McMoRan Copper & Gold Inc. | | 841,200 | | | 34,068,600 |
| | | | | | |
Diversified Materials & Processing - 0.7% | | | | | |
American Standard Companies Inc.(1) | | 846,600 | | | 32,941,206 |
| | | | | | |
Metal Fabricating - 1.3% | | | | | |
Precision Castparts Corp. | | 1,136,700 | | | 68,258,835 |
| | | | | | |
Office Supplies - 0.8% | | | | | |
Avery Dennison Corporation | | 596,700 | | | 39,250,926 |
| | | | | | |
Real Estate - 1.0% | | | | | |
The St. Joe Company | | 1,096,600 | | | 52,384,582 |
| | | | | | |
| OTHER - 2.4% | | | | | |
Multi-Sector Companies - 2.4% | | | | | |
Brunswick Corporation(1) | | 495,000 | | | 22,651,200 |
Eaton Corporation | | 984,600 | | | 62,433,486 |
ITT Industries, Inc. | | 460,900 | | | 36,867,391 |
| | | | |
|
|
| | | | | | 121,952,077 |
| OTHER ENERGY - 5.0% | | | | | |
Coal - 0.3% | | | | | |
Peabody Energy Corporation | | 223,300 | | | 13,286,350 |
38
THIRTY-EIGHT
| | | | | |
| | | Shares
Held
| | Value
|
| | | | | | |
| OTHER ENERGY (CONTINUED) | | | |
Machinery: Oil Well Equipment & Services - 3.3% | | | | | |
Noble Corporation(1) | | 315,300 | | | $ 14,172,735 |
Smith International, Inc.(1) | | 1,250,400 | | | 75,936,792 |
Weatherford International Ltd.(1) | | 1,524,500 | | | 77,779,990 |
| | | | |
|
|
| | | | | | 167,889,517 |
Oil: Crude Producers - 1.4% | | | | | |
Devon Energy Corporation | | 350,100 | | | 24,860,601 |
EOG Resources, Inc. | | 721,700 | | | 47,523,945 |
| | | | |
|
|
| | | | | | 72,384,546 |
| | | | | | |
| PRODUCER DURABLES - 8.1% | | | | | |
Diversified Production - 1.2% | | | | | |
Danaher Corporation | | 1,225,300 | | | 62,833,384 |
| | | | | | |
Electrical Equipment & Components - 1.1% | | | | | |
Molex Incorporated | | 1,815,500 | | | 54,138,210 |
| | | | | | |
Electronics: Instruments Gauges & Meters - 1.2% | | | | | |
Thermo Electron Corporation(1) | | 2,311,700 | | | 62,462,134 |
| | | | | | |
Machinery: Industrial/
Specialty - 0.3% | | | |
Joy Global Inc. | | 390,300 | | | 13,418,514 |
| | | | | | |
Office Furniture & Business Equipment - 2.4% | | | | | |
Diebold, Incorporated | | 1,551,800 | | | 72,469,060 |
Lexmark International, Inc.(1) | | 556,700 | | | 46,768,367 |
| | | | |
|
|
| | | | | | 119,237,427 |
Production Technology Equipment - 1.0% | | | | | |
Lam Research Corporation(1) | | 2,241,000 | | | 49,033,080 |
| | | | | | |
Telecommunications
Equipment - 0.9% | | | | | |
Andrew Corporation(1) | | 3,523,000 | | | 43,121,520 |
| | | | | |
| | | Shares
Held
| | Value
|
| | | | | | |
| TECHNOLOGY - 14.9% | | | | | |
Communications Technology - 5.8% | | | |
Avaya Inc.(1) | | 3,837,200 | | $ | 53,490,568 |
Avocent Corporation(1) | | 1,091,900 | | | 28,422,157 |
Corning Incorporated(1) | | 4,568,500 | | | 50,618,980 |
Juniper Networks, Inc.(1) | | 1,670,600 | | | 39,426,160 |
Scientific-Atlanta, Inc. | | 1,440,000 | | | 37,324,800 |
Symbol Technologies, Inc. | | 3,541,200 | | | 44,760,768 |
TIBCO Software Inc.(1) | | 4,758,900 | | | 40,498,239 |
| | | | |
|
|
| | | | | | 294,541,672 |
Computer Services Software & Systems - 4.0% | | | | | |
Adobe Systems Incorporated | | 1,223,900 | | | 60,546,333 |
Cognos Incorporated(1) | | 989,200 | | | 35,136,384 |
Macromedia, Inc.(1) | | 2,017,600 | | | 40,513,408 |
Mercury Interactive Corporation(1) | | 282,000 | | | 9,836,160 |
Novell, Inc.(1) | | 3,711,500 | | | 23,419,565 |
Seagate Technology(1) | | 2,617,100 | | | 35,383,192 |
| | | | |
|
|
| | | | | | 204,835,042 |
Computer Technology - 0.7% | | | |
Network Appliance, Inc.(1) | | 1,512,500 | | | 34,787,500 |
| | | | | | |
Electronics: Semi-Conductors/ Components - 4.4% | | | | | |
Altera Corporation(1) | | 727,600 | | | 14,239,132 |
Broadcom Corporation(1) | | 1,363,600 | | | 37,212,644 |
Jabil Circuit, Inc.(1) | | 2,985,600 | | | 68,668,800 |
Linear Technology Corporation | | 1,050,100 | | | 38,055,624 |
National Semiconductor Corporation | | 1,422,600 | | | 22,036,074 |
Xilinx, Inc. | | 1,518,200 | | | 40,991,400 |
| | | | |
|
|
| | | | | | 221,203,674 |
| UTILITIES - 0.9% | | | | | |
Utilities: Telecommunications - 0.9% | | | |
Western Wireless Corporation(1) | | 1,848,300 | | | 47,519,793 |
| | | | |
|
|
Total common stocks
(Cost $4,342,901,088) | | | | | 4,941,107,360 |
39
THIRTY-NINE
| | | | | | | |
| | | Par
Amount
| | Value
| |
| | | | | | | | |
| SHORT-TERM INVESTMENTS (CASH EQUIVALENTS) - 2.8% | | | | | | | |
Repurchase agreement with State Street Bank and Trust Company, 1.50%, dated 9/30/04, due 10/1/04, maturity value $140,996,875, collateralized by $102,003,215 market value Federal National Mortgage Association Note,
1.875%, due 2/15/05, and $41,811,736 market value Federal National Mortgage Association Note,
1.875%, due 1/15/05
(Cost $140,991,000) | | $ | 140,991,000 | | $ | 140,991,000 | |
| | | | | |
|
|
|
Total investments - 100.1%
(Cost $4,483,892,088) | | | | | | 5,082,098,360 | |
| | | | | | | | |
Other assets less liabilities - (0.1%) | | | (3,399,851 | ) |
| | | | | |
|
|
|
| | | | | | | | |
Total net assets - 100.0%(3) | | | | | $ | 5,078,698,509 | |
| | | | | |
|
|
|
| (1) | Non-income producing security. |
| (2) | Represents less than 0.1% of total net assets. |
| (3) | Percentages for the various classifications relate to total net assets. |
The accompanying notes are an integral part of the financial statements.
40
FORTY
ARTISAN MID CAP VALUE FUND (ARTQX)
Schedule of Investments – September 30, 2004
| | | | | |
| | | Shares
Held
| | Value
|
| | | | | | |
| COMMON STOCKS - 93.8% | | | | | |
| | | | | | |
| AUTO & TRANSPORTATION - 3.5% | | | | | |
Auto Parts: Original Equipment - 0.9% | | | |
BorgWarner Inc. | | 67,800 | | $ | 2,935,062 |
| | | | | | |
Transportation: Miscellaneous - 1.6% | | | |
Tidewater Inc. | | 147,800 | | | 4,810,890 |
| | | | | | |
Truckers - 1.0% | | | | | |
Swift Transportation Co., Inc.(1) | | 183,400 | | | 3,084,788 |
| | | | | | |
| CONSUMER DISCRETIONARY - 22.9% | | | |
Household Furnishings - 3.6% | | | | | |
Furniture Brands International, Inc. | | 452,700 | | | 11,353,716 |
| | | | | | |
Rental & Leasing Services: Consumer - 2.0% | | | | | |
Rent-A-Center, Inc.(1) | | 239,400 | | | 6,190,884 |
| | | | | | |
Restaurants - 1.3% | | | | | |
Darden Restaurants, Inc. | | 180,000 | | | 4,197,600 |
| | | | | | |
Retail - 4.8% | | | | | |
AutoZone, Inc.(1) | | 80,900 | | | 6,249,525 |
Blockbuster Inc. | | 244,300 | | | 1,854,237 |
Zale Corporation(1) | | 248,700 | | | 6,988,470 |
| | | | |
|
|
| | | | | | 15,092,232 |
Services: Commercial - 2.8% | | | | | |
Convergys Corporation(1) | | 316,600 | | | 4,251,938 |
Republic Services, Inc. | | 152,500 | | | 4,538,400 |
| | | | |
|
|
| | | | | | 8,790,338 |
Shoes - 2.2% | | | | | |
Reebok International Ltd. | | 186,500 | | | 6,848,280 |
| | | | | | |
Textiles: Apparel Manufacturers - 4.6% | | | |
Liz Claiborne Inc. | | 250,900 | | | 9,463,948 |
Polo Ralph Lauren Corporation | | 130,000 | | | 4,728,100 |
| | | | |
|
|
| | | | | | 14,192,048 |
Toys - 1.6% | | | | | |
Marvel Enterprises, Inc.(1) | | 336,300 | | | 4,896,528 |
| | | | | | |
| CONSUMER STAPLES - 1.3% | | | | | |
Tobacco - 1.3% | | | | | |
Loews Corporation - Carolina Group | | 171,300 | | | 4,174,581 |
| | | | | |
| | | Shares
Held
| | Value
|
| | | | | | |
| FINANCIAL SERVICES - 29.3% | | | | | |
Finance: Small Loan - 4.7% | | | | | |
The Student Loan Corporation | | 104,400 | | $ | 14,798,700 |
| | | | | | |
Financial Data Processing Services & Systems - 3.0% | | | | | |
Deluxe Corporation | | 136,700 | | | 5,607,434 |
SunGard Data Systems Inc.(1) | | 162,600 | | | 3,865,002 |
| | | | |
|
|
| | | | | | 9,472,436 |
Insurance: Multi-Line - 7.6% | | | | | |
Alleghany Corporation(1) | | 36,808 | | | 10,044,903 |
Loews Corporation | | 64,700 | | | 3,784,950 |
Old Republic International Corporation | | 396,350 | | | 9,920,641 |
| | | | |
|
|
| | | | | | 23,750,494 |
Insurance: Property-Casualty - 5.9% | | | |
Arch Capital Group Ltd.(1) | | 89,300 | | | 3,477,342 |
PartnerRe Ltd. | | 70,900 | | | 3,877,521 |
White Mountains Insurance Group, Ltd. | | 20,800 | | | 10,940,800 |
| | | | |
|
|
| | | | | | 18,295,663 |
Savings & Loans - 1.9% | | | | | |
Washington Federal, Inc. | | 231,260 | | | 5,816,189 |
| | | | | | |
Securities Brokerage & Services - 6.2% | | | |
Countrywide Financial Corporation | | 274,300 | | | 10,804,677 |
Nuveen Investments, Inc. | | 293,800 | | | 8,696,480 |
| | | | |
|
|
| | | | | | 19,501,157 |
| HEALTHCARE - 5.7% | | | | | |
Drugs & Pharmaceuticals - 1.4% | | | | | |
King Pharmaceuticals, Inc.(1) | | 363,700 | | | 4,342,578 |
| | | | | | |
Health Care Facilities - 1.8% | | | | | |
Pharmaceutical Product
Development, Inc.(1) | | 150,500 | | | 5,418,000 |
| | | | | | |
Health Care Management
Services - 1.0% | | | | | |
Universal Health Services, Inc., Class B | | 73,900 | | | 3,214,650 |
| | | | | | |
Health Care Services - 1.5% | | | | | |
Medco Health Solutions, Inc.(1) | | 152,900 | | | 4,724,610 |
| | | | | | |
| MATERIALS & PROCESSING - 5.0% | | | |
Building: Cement - 1.5% | | | | | |
Lafarge North America Inc. | | 100,000 | | | 4,689,000 |
41
FORTY-ONE
| | | | | |
| | | Shares
Held
| | Value
|
| | | | | | |
| MATERIALS & PROCESSING (CONTINUED) | | | |
Engineering & Contracting Services - 1.4% | | | | | |
Jacobs Engineering Group Inc.(1) | | 112,400 | | $ | 4,303,796 |
| | | | | | |
Paints & Coatings - 2.1% | | | | | |
The Sherwin-Williams Company | | 150,200 | | | 6,602,792 |
| | | | | | |
| OTHER - 0.3% | | | | | |
Multi-Sector Companies - 0.3% | | | | | |
Wesco Financial Corporation | | 2,660 | | | 934,990 |
| | | | | | |
| OTHER ENERGY - 18.3% | | | | | |
Offshore Drilling - 1.3% | | | | | |
Diamond Offshore Drilling, Inc. | | 120,000 | | | 3,958,800 |
| | | | | | |
Oil: Crude Producers - 14.7% | | | | | |
Apache Corporation | | 269,846 | | | 13,521,983 |
EOG Resources, Inc. | | 197,000 | | | 12,972,450 |
Newfield Exploration Company(1) | | 73,500 | | | 4,501,140 |
Pioneer Natural Resources Company | | 138,505 | | | 4,775,656 |
XTO Energy Inc. | | 314,807 | | | 10,224,931 |
| | | | |
|
|
| | | | | | 45,996,160 |
Utilities: Gas Pipelines - 2.3% | | | | | |
Equitable Resources, Inc. | | 134,400 | | | 7,299,264 |
| | | | | | |
| TECHNOLOGY - 6.0% | | | | | |
Computer Services Software & Systems - 4.3% | | | | | |
BearingPoint, Inc.(1) | | 608,900 | | | 5,443,566 |
BMC Software, Inc.(1) | | 261,300 | | | 4,131,153 |
Siebel Systems, Inc.(1) | | 519,500 | | | 3,917,030 |
| | | | |
|
|
| | | | | | 13,491,749 |
Computer Technology - 0.9% | | | | | |
Synopsys, Inc.(1) | | 170,900 | | | 2,705,347 |
| | | | | | |
Electronics: Semi-Conductors/Components - 0.8% | | | | | |
National Semiconductor Corporation | | 151,800 | | | 2,351,382 |
| | | | | | |
| UTILITIES - 1.5% | | | | | |
Utilities: Electrical - 1.5% | | | | | |
Westar Energy, Inc. | | 223,700 | | | 4,518,740 |
| | | | |
|
|
Total common stocks
(Cost $261,130,142) | | | | | 292,753,444 |
| | | | | | | |
| | | Par
Amount
| | Value
| |
| SHORT-TERM INVESTMENTS (CASH EQUIVALENTS) - 6.3% | | | | | | | |
Repurchase agreement with State
Street Bank and Trust Company,
1.50%, dated 9/30/04, due
10/1/04, maturity value
$19,744,823, collateralized by
$20,140,866 market value
Federal National Mortgage
Association Note,
1.875%, due 1/15/05
(Cost $19,744,000) | | $ | 19,744,000 | | $ | 19,744,000 | |
| | | | | |
|
|
|
| | | | | | | | |
Total investments - 100.1%
(Cost $280,874,142) | | | | | | 312,497,444 | |
| | | | | | | | |
Other assets less liabilities - (0.1%) | | | (217,758 | ) |
| | | | | |
|
|
|
| | | | | | | | |
Total net assets - 100.0%(2) | | | | | $ | 312,279,686 | |
| | | | | |
|
|
|
| (1) | Non-income producing security. |
| (2) | Percentages for the various classifications relate to total net assets. |
The accompanying notes are an integral part of the financial statements.
42
FORTY-TWO
ARTISAN SMALL CAP FUND (ARTSX)
Schedule of Investments – September 30, 2004
| | | | | |
| | | Shares
Held
| | Value
|
| | | | | | |
| COMMON STOCKS - 95.6% | | | | | |
| | | | | | |
| AUTO & TRANSPORTATION - 4.0% | | | | | |
Air Transport - 1.2% | | | | | |
AirTran Holdings, Inc.(1) | | 286,100 | | $ | 2,849,556 |
| | | | | | |
Transportation: Miscellaneous - 1.7% | | | |
Pacer International, Inc.(1) | | 243,100 | | | 3,986,840 |
| | | | | | |
Truckers - 1.1% | | | | | |
Forward Air Corporation(1) | | 68,200 | | | 2,729,364 |
| | | | | | |
| CONSUMER DISCRETIONARY - 25.2% | | | | | |
Casinos & Gambling - 1.1% | | | | | |
Alliance Gaming Corporation(1) | | 177,900 | | | 2,679,174 |
| | | | | | |
Consumer Electronics - 1.5% | | | | | |
FindWhat.com(1) | | 187,700 | | | 3,515,621 |
| | | | | | |
Consumer Products - 1.7% | | | | | |
RC2 Corporation(1) | | 121,900 | | | 4,010,510 |
| | | | | | |
Leisure Time - 0.9% | | | | | |
Steinway Musical Instruments, Inc.(1) | | 81,100 | | | 2,205,920 |
| | | | | | |
Radio & TV Broadcasters - 0.8% | | | | | |
Regent Communications, Inc.(1) | | 353,100 | | | 1,998,546 |
| | | | | | |
Restaurants - 1.0% | | | | | |
RARE Hospitality International, Inc.(1) | | 92,050 | | | 2,453,133 |
| | | | | | |
Retail - 6.1% | | | | | |
Central Garden & Pet Company(1) | | 109,800 | | | 3,362,076 |
Coldwater Creek Inc.(1) | | 80,650 | | | 1,683,165 |
Hibbett Sporting Goods, Inc.(1) | | 75,000 | | | 1,536,750 |
School Specialty, Inc.(1) | | 111,400 | | | 4,390,274 |
Too, Inc.(1) | | 196,500 | | | 3,550,755 |
| | | | |
|
|
| | | | | | 14,523,020 |
Services: Commercial - 9.6% | | | | | |
The Advisory Board Company(1) | | 94,000 | | | 3,158,400 |
Autobytel Inc.(1) | | 384,700 | | | 3,450,759 |
Charles River Associates Incorporated(1) | | 90,100 | | | 3,449,929 |
Harris Interactive Inc.(1) | | 458,900 | | | 3,024,151 |
Hudson Highland Group, Inc.(1) | | 100,300 | | | 2,927,757 |
Jackson Hewitt Tax Service Inc. | | 207,100 | | | 4,189,633 |
Waste Connections, Inc.(1) | | 92,250 | | | 2,922,480 |
| | | | |
|
|
| | | | | | 23,123,109 |
| | | | | |
| | | Shares
Held
| | Value
|
| | | | | | |
| CONSUMER DISCRETIONARY (CONTINUED) | | | |
Textiles Apparel Manufacturers - 1.0% | | | |
Carter’s, Inc.(1) | | 85,800 | | $ | 2,375,802 |
| | | | | | |
Wholesalers - 1.5% | | | | | |
Beacon Roofing Supply, Inc.(1) | | 68,500 | | | 1,123,400 |
LKQ Corporation(1) | | 132,400 | | | 2,418,948 |
| | | | |
|
|
| | | | | | 3,542,348 |
| FINANCIAL SERVICES - 10.8% | | | | | |
Banks: Outside New York City - 2.8% | | | |
Alabama National BanCorporation | | 48,200 | | | 2,885,734 |
Texas Capital Bancshares, Inc.(1) | | 206,100 | | | 3,740,715 |
| | | | |
|
|
| | | | | | 6,626,449 |
Finance: Small Loan - 1.6% | | | | | |
The First Marblehead Corporation(1) | | 80,900 | | | 3,753,760 |
| | | | | | |
Financial Data Processing Services & Systems - 1.6% | | | | | |
TNS Inc.(1) | | 195,100 | | | 3,784,940 |
| | | | | | |
Real Estate Investment Trusts (REIT) - 2.1% | | | | | |
La Quinta Corporation(1) | | 323,400 | | | 2,522,520 |
Strategic Hotel Capital, Inc. | | 191,000 | | | 2,582,320 |
| | | | |
|
|
| | | | | | 5,104,840 |
Savings & Loans - 2.7% | | | | | |
Bank Mutual Corporation | | 271,300 | | | 3,255,600 |
BankAtlantic Bancorp, Inc. | | 176,900 | | | 3,240,808 |
| | | | |
|
|
| | | | | | 6,496,408 |
| HEALTHCARE - 13.5% | | | | | |
Biotechnology Research & Production - 0.9% | | | | | |
Charles River Laboratories
International, Inc.(1) | | 50,000 | | | 2,290,000 |
| | | | | | |
Drugs & Pharmaceuticals - 1.3% | | | | | |
Impax Laboratories, Inc.(1) | | 196,900 | | | 3,024,384 |
| | | | | | |
Health Care Facilities - 1.5% | | | | | |
Radiation Therapy Services, Inc.(1) | | 117,200 | | | 1,329,048 |
United Surgical Partners
International, Inc.(1) | | 69,100 | | | 2,373,585 |
| | | | |
|
|
| | | | | | 3,702,633 |
43
FORTY-THREE
| | | | | |
| | | Shares
Held
| | Value
|
| | | | | | |
| HEALTHCARE (CONTINUED) | | | |
Health Care Management
Services - 1.4% | | | | | |
Omnicell, Inc.(1) | | 253,600 | | $ | 3,352,592 |
| | | | | | |
Health Care Services - 1.5% | | | | | |
LabOne, Inc.(1) | | 122,200 | | | 3,571,906 |
| | | | | | |
Medical & Dental Instruments & Supplies - 5.7% | | | | | |
American Medical Systems
Holdings, Inc.(1) | | 73,400 | | | 2,662,218 |
Immucor, Inc.(1) | | 100,600 | | | 2,489,850 |
PSS World Medical, Inc.(1) | | 370,300 | | | 3,717,812 |
Respironics, Inc.(1) | | 42,600 | | | 2,276,544 |
Wright Medical Group, Inc.(1) | | 96,700 | | | 2,429,104 |
| | | | |
|
|
| | | | | | 13,575,528 |
Medical Services - 1.2% | | | | | |
VCA Antech, Inc.(1) | | 142,500 | | | 2,939,775 |
| | | | | | |
| MATERIALS & PROCESSING - 3.8% | | | | | |
Building Materials - 0.9% | | | | | |
Hughes Supply, Inc. | | 71,400 | | | 2,146,998 |
| | | | | | |
Building: Roofing & Wallboard - 1.5% | | | |
ElkCorp | | 128,800 | | | 3,575,488 |
| | | | | | |
Plastics - 1.4% | | | | | |
Spartech Corporation | | 132,000 | | | 3,313,200 |
| | | | | | |
| OTHER ENERGY - 5.0% | | | | | |
Machinery: Oil Well Equipment & Services - 1.6% | | | | | |
W-H Energy Services, Inc.(1) | | 178,200 | | | 3,697,650 |
| | | | | | |
Oil: Crude Producers - 3.4% | | | | | |
Magnum Hunter Resources, Inc.(1) | | 295,600 | | | 3,411,224 |
Pioneer Drilling Company(1) | | 248,000 | | | 2,083,200 |
Unit Corporation(1) | | 77,800 | | | 2,729,224 |
| | | | |
|
|
| | | | | | 8,223,648 |
| PRODUCER DURABLES - 8.7% | | | | | |
Aerospace - 1.9% | | | | | |
MTC Technologies, Inc.(1) | | 164,500 | | | 4,545,135 |
| | | | | | |
Electrical Equipment &
Components - 1.3% | | | | | |
Technitrol, Inc.(1) | | 158,300 | | | 3,086,850 |
| | | | | | |
Machinery: Industrial/Specialty - 1.7% | | | |
Actuant Corporation(1) | | 36,600 | | | 1,508,286 |
Gardner Denver, Inc.(1) | | 87,200 | | | 2,404,104 |
| | | | |
|
|
| | | | | | 3,912,390 |
| | | | | |
| | | Shares
Held
| | Value
|
| | | | | | |
| PRODUCER DURABLES (CONTINUED) | | | |
Machinery: Specialty - 1.1% | | | | | |
Applied Films Corporation(1) | | 150,700 | | $ | 2,714,107 |
| | | | | | |
Manufacturing - 1.4% | | | | | |
Rayovac Corporation(1) | | 129,800 | | | 3,420,230 |
| | | | | | |
Production Technology
Equipment - 1.3% | | | | | |
Axcelis Technologies, Inc.(1) | | 368,000 | | | 3,047,040 |
| | | | | | |
| TECHNOLOGY - 23.5% | | | | | |
Communications Technology - 5.6% | | | |
Avocent Corporation(1) | | 148,100 | | | 3,855,043 |
Foundry Networks, Inc.(1) | | 265,700 | | | 2,521,493 |
Inter-Tel Incorporated | | 162,500 | | | 3,513,250 |
Tekelec(1) | | 205,800 | | | 3,432,744 |
| | | | |
|
|
| | | | | | 13,322,530 |
Computer Services Software & Systems - 11.1% | | | | | |
Anteon International Corporation(1) | | 90,000 | | | 3,298,500 |
Borland Software Corporation(1) | | 301,800 | | | 2,520,030 |
Dendrite International, Inc.(1) | | 88,400 | | | 1,425,008 |
Hyperion Solutions Corporation(1) | | 70,400 | | | 2,392,896 |
Macrovision Corporation(1) | | 114,000 | | | 2,745,120 |
Magma Design Automation, Inc.(1) | | 193,700 | | | 2,920,996 |
Micromuse Inc.(1) | | 292,400 | | | 1,076,032 |
Progress Software Corporation(1) | | 178,900 | | | 3,560,110 |
Serena Software Inc.(1) | | 199,500 | | | 3,337,635 |
SS&C Technologies, Inc. | | 175,300 | | | 3,423,609 |
| | | | |
|
|
| | | | | | 26,699,936 |
Computer Technology - 2.4% | | | |
Dot Hill Systems Corp.(1) | | 391,900 | | | 3,143,038 |
Sierra Wireless, Inc.(1) | | 141,600 | | | 2,520,480 |
| | | | |
|
|
| | | | | | 5,663,518 |
Electronics - 3.0% | | | | | |
Aeroflex Incorporated(1) | | 364,000 | | | 3,847,480 |
Semtech Corporation(1) | | 172,000 | | | 3,297,240 |
| | | | |
|
|
| | | | | | 7,144,720 |
Electronics: Semi-Conductors/Components - 1.4% | | | | | |
DSP Group, Inc.(1) | | 164,500 | | | 3,462,725 |
| | | | | | |
| UTILITIES - 1.1% | | | | | |
Utilities: Telecommunications - 1.1% | | | |
Alamosa Holdings, Inc.(1) | | 355,200 | | | 2,713,728 |
| | | | |
|
|
Total common stocks
(Cost $205,454,843) | | | | | 228,906,051 |
44
FORTY-FOUR
| | | | | | |
| | | Par
Amount
| | Value
|
SHORT-TERM INVESTMENTS
(CASH EQUIVALENTS) - 3.3% | | | | | | |
Repurchase agreement with State
Street Bank and Trust Company,
1.50%, dated 9/30/04, due
10/1/04, maturity value
$7,938,331, collateralized by
$8,101,494 market value
Federal National Mortgage
Association Note,
1.875%, due 1/15/2005
(Cost $7,938,000) | | $ | 7,938,000 | | $ | 7,938,000 |
| | | | | |
|
|
| | | | | | | |
Total investments - 98.9%
(Cost $213,392,843) | | | | | | 236,844,051 |
| | | | | | | |
Other assets less liabilities - 1.1% | | | 2,721,987 |
| | | | | |
|
|
| | | | | | | |
Total net assets - 100.0%(2) | | | | | $ | 239,566,038 |
| | | | | |
|
|
| (1) | Non-income producing security. |
| (2) | Percentages for the various classifications relate to total net assets. |
The accompanying notes are an integral part of the financial statements.
45
FORTY-FIVE
ARTISAN SMALL CAP VALUE FUND (ARTVX)
Schedule of Investments – September 30, 2004
| | | | | |
| | | Shares
Held
| | Value
|
| | | | | | |
| COMMON STOCKS - 94.1% | | | | | |
| | | | | | |
| AUTO & TRANSPORTATION - 7.1% | | | |
Auto Parts: After Market - 1.7% | | | |
Superior Industries International, Inc. | | 685,100 | | $ | 20,518,745 |
| | | | | | |
Auto Parts: Original Equipment - 1.2% | | | | | |
BorgWarner Inc. | | 337,900 | | | 14,627,691 |
| | | | | | |
Shipping - 1.9% | | | | | |
Kirby Corporation(1) | | 566,200 | | | 22,732,930 |
| | | | | | |
Truckers - 2.3% | | | | | |
Arkansas Best Corporation | | 135,500 | | | 4,962,010 |
Heartland Express, Inc. | | 332,900 | | | 6,142,005 |
USF Corporation | | 449,500 | | | 16,132,555 |
| | | | |
|
|
| | | | | | 27,236,570 |
| CONSUMER DISCRETIONARY - 25.7% | | | |
Advertising Agencies - 2.1% | | | | | |
ADVO, Inc. | | 807,300 | | | 24,977,862 |
| | | | | | |
Commercial Information Services - 1.3% | | | | | |
ProQuest Company(1) | | 598,200 | | | 15,373,740 |
| | | | | | |
Consumer Electronics - 0.8% | | | | | |
DoubleClick Inc.(1) | | 677,400 | | | 4,003,434 |
United Online, Inc.(1) | | 549,900 | | | 5,290,038 |
| | | | |
|
|
| | | | | | 9,293,472 |
Entertainment - 2.7% | | | | | |
Hollywood Entertainment Corporation(1) | | 1,618,600 | | | 15,975,582 |
Movie Gallery, Inc. | | 895,000 | | | 15,689,350 |
| | | | |
|
|
| | | | | | 31,664,932 |
Household Furnishings - 1.4% | | | | | |
Ethan Allen Interiors Inc. | | 376,900 | | | 13,097,275 |
Furniture Brands International, Inc. | | 169,700 | | | 4,256,076 |
| | | | |
|
|
| | | | | | 17,353,351 |
Radio & TV Broadcasters - 0.5% | | | |
World Wrestling Entertainment, Inc. | | 506,800 | | | 6,193,096 |
| | | | | | |
Restaurants - 1.3% | | | | | |
IHOP Corp. | | 158,600 | | | 6,060,106 |
Papa John’s International, Inc.(1) | | 329,000 | | | 10,093,720 |
| | | | |
|
|
| | | | | | 16,153,826 |
| | | | | |
| | | Shares
Held
| | Value
|
| | | | | | |
| CONSUMER DISCRETIONARY (CONTINUED) | | | |
Retail - 5.7% | | | | | |
1-800 CONTACTS, INC.(1) | | 430,700 | | $ | 6,550,947 |
Payless ShoeSource, Inc.(1) | | 1,696,300 | | | 17,183,519 |
School Specialty, Inc.(1) | | 333,200 | | | 13,131,412 |
Zale Corporation(1) | | 1,108,500 | | | 31,148,850 |
| | | | |
|
|
| | | | | | 68,014,728 |
Services: Commercial - 5.4% | | | | | |
CDI Corp. | | 211,900 | | | 4,343,950 |
Coinstar, Inc(1) | | 102,500 | | | 2,388,250 |
Cross Country Healthcare, Inc.(1) | | 496,600 | | | 7,697,300 |
FTI Consulting, Inc.(1) | | 458,600 | | | 8,667,540 |
Jackson Hewitt Tax Service Inc. | | 288,300 | | | 5,832,309 |
Medical Staffing Network
Holdings, Inc.(1) | | 990,400 | | | 6,081,056 |
Pegasus Solutions, Inc.(1) | | 469,300 | | | 5,594,056 |
Tetra Tech, Inc.(1) | | 630,900 | | | 7,993,503 |
Watson Wyatt & Company | | 602,000 | | | 15,832,600 |
| | | | |
|
|
| | | | | | 64,430,564 |
Textiles Apparel
Manufacturers - 3.5% | | | | | |
Kellwood Company | | 1,136,750 | | | 41,434,537 |
| | | | | | |
Wholesale & International Trade - 0.5% | | | | | |
CellStar Corporation(1)(2) | | 1,194,400 | | | 5,445,270 |
| | | | | | |
Wholesalers - 0.5% | | | | | |
United Stationers Inc.(1) | | 134,800 | | | 5,850,320 |
| | | | | | |
| FINANCIAL SERVICES - 14.6% | | | | | |
Diversified Financial Services - 0.7% | | | |
Jones Lang LaSalle Incorporated(1) | | 234,400 | | | 7,737,544 |
| | | | | | |
Financial Data Processing Services & Systems - 1.5% | | | | | |
CCC Information Services
Group Inc.(1) | | 165,617 | | | 2,929,765 |
John H. Harland Company | | 331,900 | | | 10,405,065 |
National Processing, Inc.(1) | | 191,300 | | | 5,073,276 |
| | | | |
|
|
| | | | | | 18,408,106 |
Financial Miscellaneous - 4.6% | | | | | |
LandAmerica Financial Group, Inc. | | 328,200 | | | 14,933,100 |
Stewart Information Services Corporation(2) | | 1,005,300 | | | 39,608,820 |
| | | | |
|
|
| | | | | | 54,541,920 |
46
FORTY-SIX
| | | | | |
| | | Shares
Held
| | Value
|
| | | | | | |
| FINANCIAL SERVICES (CONTINUED) | | | |
Insurance: Life - 0.5% | | | | | |
Scottish Re Group Limited | | 292,800 | | $ | 6,198,576 |
| | | | | | |
Insurance: Multi-Line - 4.6% | | | | | |
Hilb Rogal and Hobbs Company | | 981,900 | | | 35,564,418 |
Hub International Limited | | 332,300 | | | 6,007,984 |
PICO Holdings, Inc.(1)(2) | | 703,100 | | | 13,379,993 |
| | | | |
|
|
| | | | | | 54,952,395 |
Insurance: Property-Casualty - 1.3% | | | |
Arch Capital Group Ltd.(1) | | 170,000 | | | 6,619,800 |
IPC Holdings, Ltd. | | 234,500 | | | 8,913,345 |
| | | | |
|
|
| | | | | | 15,533,145 |
Investment Management Companies - 0.9% | | | | | |
Capital Southwest Corporation | | 142,300 | | | 10,814,800 |
| | | | | | |
Real Estate Investment Trusts (REIT) - 0.5% | | | | | |
Post Properties, Inc. | | 179,000 | | | 5,352,100 |
| | | | | | |
| HEALTHCARE - 2.0% | | | | | |
Drugs & Pharmaceuticals - 0.5% | | | |
Par Pharmaceutical
Companies, Inc.(1) | | 161,800 | | | 5,813,474 |
| | | | | | |
Medical & Dental Instruments & Supplies - 1.5% | | | | | |
National Dentex Corporation(1)(2) | | 229,200 | | | 6,458,856 |
SOLA International Inc.(1) | | 596,600 | | | 11,365,230 |
| | | | |
|
|
| | | | | | 17,824,086 |
| MATERIALS & PROCESSING - 11.1% | | | |
Agriculture Fishing &
Ranching - 0.7% | | | | | |
Delta and Pine Land Company | | 317,500 | | | 8,493,125 |
| | | | | | |
Building: Cement - 0.9% | | | | | |
Eagle Materials Inc. | | 97,500 | | | 6,951,750 |
Eagle Materials Inc., Class B | | 59,500 | | | 4,105,500 |
| | | | |
|
|
| | | | | | 11,057,250 |
Building Materials - 2.9% | | | | | |
LSI Industries Inc. | | 654,962 | | | 6,837,803 |
Simpson Manufacturing Co., Inc. | | 435,400 | | | 27,517,280 |
| | | | |
|
|
| | | | | | 34,355,083 |
Chemicals - 1.2% | | | | | |
Albermarle Corporation | | 406,900 | | | 14,278,121 |
| | | | | | |
Construction - 1.4% | | | | | |
EMCOR Group, Inc.(1) | | 240,600 | | | 9,051,372 |
Washington Group
International, Inc.(1) | | 213,900 | | | 7,405,218 |
| | | | |
|
|
| | | | | | 16,456,590 |
| | | | | |
| | | Shares
Held
| | Value
|
| | | | | | |
| MATERIALS & PROCESSING (CONTINUED) | | | |
Copper - 0.9% | | | | | |
Mueller Industries, Inc. | | 261,300 | | $ | 11,222,835 |
| | | | | | |
Engineering & Contracting Services - 0.4% | | | | | |
Integrated Electrical Services, Inc.(1) | | 868,100 | | | 4,175,561 |
| | | | | | |
Metal Fabricating - 1.4% | | | | | |
Quanex Corporation | | 303,100 | | | 15,542,968 |
Roanoke Electric Steel Corporation | | 84,700 | | | 1,212,904 |
| | | | |
|
|
| | | | | | 16,755,872 |
Miscellaneous Materials & Processing - 0.4% | | | | | |
Insituform Technologies, Inc.(1) | | 254,400 | | | 4,749,648 |
| | | | | | |
Real Estate - 0.9% | | | | | |
Trammell Crow Company(1) | | 664,300 | | | 10,442,796 |
| | | | | | |
| OTHER ENERGY - 20.5% | | | | | |
Energy Equipment - 0.2% | | | | | |
Global Power Equipment Group Inc.(1) | | 333,500 | | | 2,471,235 |
| | | | | | |
Energy: Miscellaneous - 0.8% | | | | | |
Penn Virginia Corporation | | 161,200 | | | 6,381,908 |
Veritas DGC Inc.(1) | | 146,500 | | | 3,337,270 |
| | | | |
|
|
| | | | | | 9,719,178 |
Machinery: Oil Well Equipment & Services - 1.7% | | | | | |
Core Laboratories N.V.(1) | | 398,900 | | | 9,808,951 |
Key Energy Services, Inc.(1) | | 652,800 | | | 7,213,440 |
Superior Energy Services, Inc.(1) | | 285,500 | | | 3,688,660 |
| | | | |
|
|
| | | | | | 20,711,051 |
Offshore Drilling - 0.7% | | | | | |
Atwood Oceanics, Inc.(1) | | 169,200 | | | 8,043,768 |
| | | | | | |
Oil: Crude Producers - 17.1% | | | | | |
Cabot Oil & Gas Corporation | | 377,950 | | | 16,969,955 |
Cimarex Energy Co.(1) | | 442,100 | | | 15,446,974 |
Energy Partners, Ltd.(1) | | 564,900 | | | 9,196,572 |
Forest Oil Corporation(1) | | 1,059,858 | | | 31,922,923 |
Pioneer Natural Resources Company | | 445,361 | | | 15,356,055 |
Plains Exploration & Production Company(1) | | 1,557,893 | | | 37,171,327 |
Range Resources Corporation | | 915,500 | | | 16,012,095 |
Remington Oil and Gas Corporation(1) | | 219,300 | | | 5,756,625 |
St. Mary Land & Exploration Company | | 595,300 | | | 23,698,893 |
Stone Energy Corporation(1) | | 739,500 | | | 32,360,520 |
| | | | |
|
|
| | | | | | 203,891,939 |
47
FORTY-SEVEN
| | | | | |
| | | Shares
Held
| | Value
|
| | | | | | |
| PRODUCER DURABLES - 4.1% | | | | | |
Aerospace - 0.2% | | | | | |
United Industrial Corporation | | 60,600 | | $ | 1,993,134 |
| | | | | | |
Electrical Equipment & Components - 2.2% | | | | | |
General Cable Corporation(1) | | 1,084,800 | | | 11,542,272 |
The Genlyte Group Incorporated(1) | | 176,200 | | | 11,345,518 |
MKS Instruments, Inc.(1) | | 235,900 | | | 3,613,988 |
| | | | |
|
|
| | | | | | 26,501,778 |
Machinery: Industrial/Specialty - 0.1% | | | | | |
Thomas Industries Inc. | | 34,900 | | | 1,095,860 |
| | | | | | |
Power Transmission Equipment - 0.9% | | | | | |
Regal-Beloit Corporation | | 440,400 | | | 10,653,276 |
| | | | | | |
Production Technology Equipment - 0.2% | | | | | |
LTX Corporation(1) | | 66,400 | | | 359,224 |
Ultratech, Inc.(1) | | 175,500 | | | 2,750,085 |
| | | | |
|
|
| | | | | | 3,109,309 |
Telecommunications Equipment - 0.5% | | | | | |
Superior Essex Inc.(1) | | 412,500 | | | 6,043,125 |
| | | | | | |
| TECHNOLOGY - 3.1% | | | | | |
Communications
Technology - 0.3% | | | | | |
Black Box Corporation | | 105,600 | | | 3,901,920 |
| | | | | | |
Computer Services Software & Systems - 1.8% | | | | | |
BearingPoint, Inc.(1) | | 1,252,500 | | | 11,197,350 |
Borland Software Corporation(1) | | 190,400 | | | 1,589,840 |
Lawson Software, Inc.(1) | | 38,600 | | | 216,160 |
MSC.Software Corporation(1) | | 247,200 | | | 1,987,488 |
webMethods, Inc.(1) | | 1,288,800 | | | 6,856,416 |
| | | | |
|
|
| | | | | | 21,847,254 |
Computer Technology - 0.5% | | | |
Advanced Digital Information Corporation(1) | | 659,400 | | | 5,736,780 |
| | | | | | |
Scientific Equipment & Supplies - 0.5% | | | | | |
Newport Corporation(1) | | 506,600 | | | 5,810,702 |
| | | | | | |
| UTILITIES - 5.9% | | | | | |
Utilities: Electrical - 3.9% | | | | | |
Black Hills Corporation | | 424,800 | | | 11,800,944 |
| | | | | | | |
| | | Shares
Held
| | Value
| |
| | | | | | | | |
| UTILITIES (CONTINUED) | | | | | | | |
Utilities: Electrical (Continued) | | | | | | | |
El Paso Electric Company(1) | | | 712,500 | | $ | 11,449,875 | |
PNM Resources, Inc. | | | 1,070,150 | | | 24,089,076 | |
| | | | | |
|
|
|
| | | | | | | 47,339,895 | |
Utilities: Gas Distributors - 1.0% | | | | |
NUI Corporation | | | 469,500 | | | 6,263,130 | |
SEMCO Energy, Inc. | | | 1,031,640 | | | 5,663,704 | |
| | | | | |
|
|
|
| | | | | | | 11,926,834 | |
Utilities:
Telecommunications - 1.0% | | | | | | | |
Boston Communications
Group, Inc.(1) | | | 534,100 | | | 4,684,057 | |
IDT Corporation, Class B(1) | | | 342,300 | | | 5,144,769 | |
IDT Corporation, Class C(1) | | | 120,200 | | | 1,752,516 | |
| | | | | |
|
|
|
| | | | | | | 11,581,342 | |
| | | | | |
|
|
|
Total common stocks
(Cost $865,679,221) | | | | | | 1,122,843,041 | |
| | | | | | | | |
| | | Par
Amount
| | | |
| SHORT-TERM INVESTMENTS (CASH EQUIVALENTS) - 7.4% | | | | | | | |
Repurchase agreement with State
Street Bank and Trust Company,
1.50%, dated 9/30/04, due
10/1/04, maturity value
$88,044.668, collateralized by
$51,004,133 market value
Federal National Mortgage Association Note,
3.875% due 03/15/05 and $38,801,893 market value
Federal National Mortgage Association Note,
1.875% due 1/15/05
(Cost $88,041,000) | | $ | 88,041,000 | | $ | 88,041,000 | |
| | | | | |
|
|
|
| | | | | | | | |
Total investments - 101.5%
(Cost $953,720,221) | | | | | | 1,210,884,041 | |
| | | | | | | | |
Other assets less liabilities - (1.5%) | | | | | | (18,133,893 | ) |
| | | | | |
|
|
|
| | | | | | | | |
Total net assets - 100.0%(3) | | | | | $ | 1,192,750,148 | |
| | | | | |
|
|
|
| (1) | Non-income producing security. |
| (2) | Affiliated company as defined by the Investment Company Act of 1940. See Note 6 to the financial statements. |
| (3) | Percentages for the various classifications relate to total net assets. |
The accompanying notes are an integral part of the financial statements.
48
FORTY-EIGHT
[THIS PAGE INTENTIONALLY LEFT BLANK]
49
FORTY-NINE
ARTISAN FUNDS, INC.
Statements of Assets and Liabilities – September 30, 2004
| | | | | | | | | |
| | | INTERNATIONAL
| | | INTERNATIONAL SMALL CAP
| | |
| ASSETS: | | | | | | | | | |
Investments in securities, unaffiliated, at value | | $ | 9,474,025,279 | | | $ | 476,289,398 | | |
Investments in securities, affiliated, at value | | | 160,753,200 | | | | 4,902,547 | | |
Short-term investments (repurchase agreements), at value | | | 68,417,000 | | | | 38,118,000 | | |
| | |
|
|
| |
|
| | |
Total investments | | | 9,703,195,479 | | | | 519,309,945 | | |
Cash | | | 655 | | | | 744 | | |
Receivable from investments sold | | | 50,676,433 | | | | 490,899 | | |
Unrealized gain on foreign currency forward contracts | | | 40,569 | | | | - | | |
Receivable from fund shares sold | | | 31,009,853 | | | | 228,645 | | |
Dividends and interest receivable | | | 28,644,194 | | | | 2,895,403 | | |
| | |
|
|
| |
|
| | |
Total assets | | | 9,813,567,183 | | | | 522,925,636 | | |
| | | |
| LIABILITIES: | | | | | | | | | |
Payable for investments purchased | | | 51,669,681 | | | | 7,329,368 | | |
Unrealized loss on foreign currency forward contracts | | | - | | | | 8,027 | | |
Payable for fund shares redeemed | | | 3,589,320 | | | | 305,951 | | |
Payable for operating expenses | | | 2,895,915 | | | | 166,716 | | |
Payable for withholding taxes | | | 3,132,244 | | | | 106,906 | | |
| | |
|
|
| |
|
| | |
Total liabilities | | | 61,287,160 | | | | 7,916,968 | | |
| | |
|
|
| |
|
| | |
Total net assets | | $ | 9,752,280,023 | | | $ | 515,008,668 | | |
| | |
|
|
| |
|
| | |
| NET ASSETS CONSIST OF: | | | | | | | | | |
Fund shares issued and outstanding | | $ | 9,992,373,797 | | | $ | 367,657,209 | | |
Net unrealized appreciation (depreciation) on investments and foreign currency related transactions | | | 1,273,610,357 | | | | 90,500,219 | | |
Accumulated undistributed net investment income (loss) | | | 64,567,549 | | | | 3,383,684 | | |
Accumulated undistributed net realized gains (losses) on investments and foreign currency related transactions | | | (1,578,271,680 | ) | | | 53,467,556 | | |
| | |
|
|
| |
|
| | |
| | | $ | 9,752,280,023 | | | $ | 515,008,668 | | |
| | |
|
|
| |
|
| | |
| SUPPLEMENTARY INFORMATION: | | | | | | | | | |
Net assets | | | | | | | | | |
Investor Shares | | $ | 6,130,171,325 | | | $ | 515,008,668 | | |
Institutional Shares | | $ | 3,622,108,698 | | | | | | |
Shares outstanding | | | | | | | | | |
Investor Shares | | | 317,155,993 | | | | 31,401,751 | | |
Institutional Shares | | | 186,360,705 | | | | | | |
Net asset value, offering price and redemption price per share | | | | | | | | | |
Investor Shares | | $ | 19.33 | | | $ | 16.40 | | |
Institutional Shares | | $ | 19.44 | | | | | | |
Cost of securities of unaffiliated issuers held | | $ | 8,226,982,845 | | | $ | 422,591,950 | | |
Cost of securities of affiliated issuers held | | $ | 202,716,463 | | | $ | 6,162,006 | | |
50
FIFTY
| | | | | | | | | | | | | | | | |
| | | INTERNATIONAL VALUE
| | MID CAP
| | | MID CAP VALUE
| | SMALL CAP
| | SMALL CAP VALUE
|
| | | | | | | | | | | | | | | | | |
| | | $ | 198,323,480 | | $ | 4,941,107,360 | | | $ | 292,753,444 | | $ | 228,906,051 | | $ | 1,057,950,102 |
| | | | 6,344,146 | | | - | | | | - | | | - | | | 64,892,939 |
| | | | 11,044,000 | | | 140,991,000 | | | | 19,744,000 | | | 7,938,000 | | | 88,041,000 |
| | |
|
| |
|
|
| |
|
| |
|
| |
|
|
| | | | 215,711,626 | | | 5,082,098,360 | | | | 312,497,444 | | | 236,844,051 | | | 1,210,884,041 |
| | | | 618 | | | 830 | | | | 491 | | | 811 | | | 13,927 |
| | | | 500,124 | | | 92,058,343 | | | | 10,689,239 | | | 4,008,964 | | | 22,920,144 |
| | | | 4,904 | | | - | | | | - | | | - | | | - |
| | | | 1,299,110 | | | 24,482,859 | | | | 5,123,146 | | | 7,099,996 | | | 2,495,103 |
| | | | 1,276,590 | | | 1,096,897 | | | | 75,354 | | | 84,848 | | | 448,804 |
| | |
|
| |
|
|
| |
|
| |
|
| |
|
|
| | | | 218,792,972 | | | 5,199,737,289 | | | | 328,385,674 | | | 248,038,670 | | | 1,236,762,019 |
| | | | | |
| | | | | | | | | | | | | | | | | |
| | | | 1,017,108 | | | 96,628,807 | | | | 15,936,190 | | | 8,313,680 | | | 43,253,798 |
| | | | - | | | - | | | | - | | | - | | | - |
| | | | 51,695 | | | 22,790,559 | | | | 91,637 | | | 81,678 | | | 379,296 |
| | | | 109,546 | | | 1,619,414 | | | | 78,161 | | | 77,274 | | | 378,777 |
| | | | 116,090 | | | - | | | | - | | | - | | | - |
| | |
|
| |
|
|
| |
|
| |
|
| |
|
|
| | | | 1,294,439 | | | 121,038,780 | | | | 16,105,988 | | | 8,472,632 | | | 44,011,871 |
| | |
|
| |
|
|
| |
|
| |
|
| |
|
|
| | | $ | 217,498,533 | | $ | 5,078,698,509 | | | $ | 312,279,686 | | $ | 239,566,038 | | $ | 1,192,750,148 |
| | |
|
| |
|
|
| |
|
| |
|
| |
|
|
| | | | | | | | | | | | | | | | | |
| | | $ | 195,742,310 | | $ | 4,682,338,103 | | | $ | 270,595,586 | | $ | 209,254,880 | | $ | 830,464,628 |
| | | | | | | | | | | | | | | | | |
| | | | 17,067,803 | | | 598,206,272 | | | | 31,623,302 | | | 23,451,208 | | | 257,163,820 |
| | | | 1,398,660 | | | - | | | | 1,037,046 | | | - | | | - |
| | | | | | | | | | | | | | | | | |
| | | | 3,289,760 | | | (201,845,866 | ) | | | 9,023,752 | | | 6,859,950 | | | 105,121,700 |
| | |
|
| |
|
|
| |
|
| |
|
| |
|
|
| | | $ | 217,498,533 | | $ | 5,078,698,509 | | | $ | 312,279,686 | | $ | 239,566,038 | | $ | 1,192,750,148 |
| | |
|
| |
|
|
| |
|
| |
|
| |
|
|
| | | | | | | | | | | | | | | | | |
| | | | | | | | | | | | | | | | | |
| | | $ | 217,498,533 | | $ | 4,042,685,752 | | | $ | 312,279,686 | | $ | 239,566,038 | | $ | 1,192,750,148 |
| | | | | | $ | 1,036,012,757 | | | | | | | | | | |
| | | | | | | | | | | | | | | | | |
| | | | 11,733,274 | | | 154,716,643 | | | | 20,081,412 | | | 15,844,374 | | | 67,670,565 |
| | | | | | | 39,269,285 | | | | | | | | | | |
| | | | | | | | | | | | | | | | | |
| | | $ | 18.54 | | $ | 26.13 | | | $ | 15.55 | | $ | 15.12 | | $ | 17.63 |
| | | | | | $ | 26.38 | | | | | | | | | | |
| | | $ | 192,101,319 | | $ | 4,483,892,088 | | | $ | 280,874,142 | | $ | 213,392,843 | | $ | 909,639,739 |
| | | $ | 6,559,628 | | $ | - | | | $ | - | | $ | - | | $ | 44,080,482 |
The accompanying notes are an integral part of the financial statements.
51
FIFTY-ONE
ARTISAN FUNDS, INC.
Statements of Operations – For the Year Ended September 30, 2004
| | | | | | | | | | |
| | | INTERNATIONAL
| | | INTERNATIONAL SMALL CAP
| | | |
| INVESTMENT INCOME: | | | | | | | | | | |
Interest | | $ | 1,161,567 | | | $ | 161,440 | | | |
Dividends, from unaffiliated issuers(1) | | | 170,620,936 | | | | 10,881,925 | | | |
Dividends, from affiliated issuers(1) | | | 6,626,007 | | | | 2,237,389 | | | |
Securities lending | | | 2,820,813 | | | | - | | | |
| | |
|
|
| |
|
|
| | |
Total investment income | | | 181,229,323 | | | | 13,280,754 | | | |
| | | |
| EXPENSES: | | | | | | | | | | |
Advisory fees | | | 90,708,425 | | | | 6,587,775 | | | |
Transfer agent fees | | | | | | | | | | |
Investor Shares | | | 11,534,259 | | | | 868,763 | | | |
Institutional Shares | | | 29,530 | | | | | | | |
Shareholder communications | | | | | | | | | | |
Investor Shares | | | 1,283,973 | | | | 101,254 | | | |
Institutional Shares | | | 20,020 | | | | | | | |
Custodian fees | | | 5,715,663 | | | | 512,303 | | | |
Accounting fees | | | 78,097 | | | | 56,813 | | | |
Professional fees | | | 1,200,590 | | | | 75,342 | | | |
Registration fees | | | | | | | | | | |
Investor Shares | | | 37,551 | | | | 31,473 | | | |
Institutional Shares | | | 23,169 | | | | | | | |
Directors’ fees | | | 236,558 | | | | 12,313 | | | |
Other operating expenses | | | 286,285 | | | | 37,375 | | | |
| | |
|
|
| |
|
|
| | |
Total operating expenses | | | 111,154,120 | | | | 8,283,411 | | | |
| | |
|
|
| |
|
|
| | |
Net investment income (loss) | | | 70,075,203 | | | | 4,997,343 | | | |
| | | |
| NET REALIZED AND UNREALIZED GAINS (LOSSES) ON INVESTMENTS: | | | | | | | | | | |
Net realized gain (loss) on: | | | | | | | | | | |
Investments(1) | | | (91,940,847 | ) | | | 67,154,595 | | | |
Foreign currency related transactions | | | (5,531,519 | ) | | | (346,102 | ) | | |
| | |
|
|
| |
|
|
| | |
| | | | (97,472,366 | ) | | | 66,808,493 | | | |
Net increase (decrease) in unrealized appreciation or depreciation on: | | | | | | | | | | |
Investments | | | 1,580,915,556 | | | | 25,704,988 | | | |
Foreign currency related transactions | | | (820,070 | ) | | | (7,379 | ) | | |
| | |
|
|
| |
|
|
| | |
| | | | 1,580,095,486 | | | | 25,697,609 | | | |
| | |
|
|
| |
|
|
| | |
Net gain (loss) on investments and foreign currency related transactions | | | 1,482,623,120 | | | | 92,506,102 | | | |
| | |
|
|
| |
|
|
| | |
Net increase (decrease) in net assets resulting from operations | | $ | 1,552,698,323 | | | $ | 97,503,445 | | | |
| | |
|
|
| |
|
|
| | |
| | | | | | | |
(1) Fund
| | Net of foreign taxes
withheld on dividends,
unaffiliated issuers
| | Net of foreign taxes
withheld on dividends,
affiliated issuers
| | Including net realized
gain (loss) on investments
from affiliated issuers
| |
International | | $22,455,295 | | $810,975 | | $(87,986,262 | ) |
International Small Cap | | 1,376,957 | | 32,880 | | 1,134,761 | |
International Value | | 332,729 | | - | | - | |
Small Cap Value | | - | | - | | 11,901 | |
52
FIFTY-TWO
| | | | | | | | | | | | | | | | | | | |
| | | INTERNATIONAL VALUE
| | | MID CAP
| | | MID CAP VALUE
| | SMALL CAP
| | | SMALL CAP VALUE
| |
| | | | | | | | | | | | | | | | | | | | |
| | | $ | 69,806 | | | $ | 1,663,670 | | | $ | 94,466 | | $ | 55,209 | | | $ | 572,068 | |
| | | | 3,216,435 | | | | 16,629,469 | | | | 2,919,785 | | | 481,114 | | | | 9,444,947 | |
| | | | - | | | | - | | | | - | | | - | | | | 381,846 | |
| | | | - | | | | - | | | | - | | | - | | | | - | |
| | |
|
|
| |
|
|
| |
|
| |
|
|
| |
|
|
|
| | | | 3,286,241 | | | | 18,293,139 | | | | 3,014,251 | | | 536,323 | | | | 10,398,861 | |
| | | | | |
| | | | | | | | | | | | | | | | | | | | |
| | | | 1,038,265 | | | | 42,817,855 | | | | 1,418,528 | | | 1,676,128 | | | | 10,123,807 | |
| | | | | | | | | | | | | | | | | | | | |
| | | | 273,917 | | | | 7,257,052 | | | | 334,235 | | | 216,603 | | �� | | 1,615,559 | |
| | | | | | | | 23,013 | | | | | | | | | | | | |
| | | | | | | | | | | | | | | | | | | | |
| | | | 33,402 | | | | 768,224 | | | | 44,327 | | | 53,229 | | | | 113,623 | |
| | | | | | | | 7,200 | | | | | | | | | | | | |
| | | | 104,741 | | | | 406,825 | | | | 35,639 | | | 51,833 | | | | 98,010 | |
| | | | 53,137 | | | | 68,480 | | | | 42,104 | | | 42,957 | | | | 45,562 | |
| | | | 40,323 | | | | 167,825 | | | | 28,939 | | | 38,005 | | | | 61,942 | |
| | | | | | | | | | | | | | | | | | | | |
| | | | 43,931 | | | | 124,973 | | | | 34,182 | | | 29,633 | | | | 43,060 | |
| | | | | | | | 11,355 | | | | | | | | | | | | |
| | | | 3,109 | | | | 129,480 | | | | 3,240 | | | 3,809 | | | | 24,056 | |
| | | | 27,080 | | | | 123,966 | | | | 36,447 | | | 10,523 | | | | 40,189 | |
| | |
|
|
| |
|
|
| |
|
| |
|
|
| |
|
|
|
| | | | 1,617,905 | | | | 51,906,248 | | | | 1,977,641 | | | 2,122,720 | | | | 12,165,808 | |
| | |
|
|
| |
|
|
| |
|
| |
|
|
| |
|
|
|
| | | | 1,668,336 | | | | (33,613,109 | ) | | | 1,036,610 | | | (1,586,397 | ) | | | (1,766,947 | ) |
| | | | | |
| | | | | | | | | | | | | | | | | | | | |
| | | | | | | | | | | | | | | | | | | | |
| | | | 3,496,007 | | | | 330,560,106 | | | | 10,522,572 | | | 27,262,462 | | | | 126,320,385 | |
| | | | (47,257 | ) | | | - | | | | - | | | - | | | | - | |
| | |
|
|
| |
|
|
| |
|
| |
|
|
| |
|
|
|
| | | | 3,448,750 | | | | 330,560,106 | | | | 10,522,572 | | | 27,262,462 | | | | 126,320,385 | |
| | | | | | | | | | | | | | | | | | | | |
| | | | 13,353,539 | | | | 172,866,182 | | | | 22,190,097 | | | 1,847,755 | | | | 127,503,467 | |
| | | | 12,754 | | | | - | | | | - | | | - | | | | - | |
| | |
|
|
| |
|
|
| |
|
| |
|
|
| |
|
|
|
| | | | 13,366,293 | | | | 172,866,182 | | | | 22,190,097 | | | 1,847,755 | | | | 127,503,467 | |
| | |
|
|
| |
|
|
| |
|
| |
|
|
| |
|
|
|
| | | | 16,815,043 | | | | 503,426,288 | | | | 32,712,669 | | | 29,110,217 | | | | 253,823,852 | |
| | |
|
|
| |
|
|
| |
|
| |
|
|
| |
|
|
|
| | | $ | 18,483,379 | | | $ | 469,813,179 | | | $ | 33,749,279 | | $ | 27,523,820 | | | $ | 252,056,905 | |
| | |
|
|
| |
|
|
| |
|
| |
|
|
| |
|
|
|
The accompanying notes are an integral part of the financial statements.
53
FIFTY-THREE
ARTISAN FUNDS, INC.
Statements of Changes in Net Assets
| | | | | | | | | | | | | | |
| | | INTERNATIONAL
| | | |
| | | Year Ended
9/30/04
| | | Period Ended
9/30/03(1)
| | | Year Ended
6/30/03
| | | |
| OPERATIONS: | | | | | | | | | | | | | | |
Net investment income (loss) | | $ | 70,075,203 | | | $ | 12,639,412 | | | $ | 103,725,637 | | | |
Net realized gain (loss) on: | | | | | | | | | | | | | | |
Investments | | | (91,940,847 | ) | | | 74,854,666 | | | | (529,007,531 | ) | | |
Foreign currency related transactions | | | (5,531,519 | ) | | | (1,317,643 | ) | | | (10,809,131 | ) | | |
Net increase (decrease) in unrealized appreciation or depreciation on: | | | | | | | | | | | | | | |
Investments | | | 1,580,915,556 | | | | 409,874,381 | | | | (423,541,570 | ) | | |
Foreign currency related transactions | | | (820,070 | ) | | | 538,027 | | | | 52,282 | | | |
| | |
|
|
| |
|
|
| |
|
|
| | |
Net increase (decrease) in net assets resulting from operations | | | 1,552,698,323 | | | | 496,588,843 | | | | (859,580,313 | ) | | |
| | | | |
| DISTRIBUTIONS PAID TO SHAREHOLDERS: | | | | | | | | | | | | | | |
Net investment income: | | | | | | | | | | | | | | |
Investor Shares | | | (59,414,982 | ) | | | - | | | | (31,901,533 | ) | | |
Institutional Shares | | | (42,472,917 | ) | | | - | | | | (18,341,682 | ) | | |
Net realized gains on investment transactions: | | | | | | | | | | | | | | |
Investor Shares | | | - | | | | - | | | | - | | | |
Institutional Shares | | | - | | | | - | | | | - | | | |
| | |
|
|
| |
|
|
| |
|
|
| | |
Total distributions paid to shareholders | | | (101,887,899 | ) | | | - | | | | (50,243,215 | ) | | |
| | | | |
| FUND SHARE ACTIVITIES: | | | | | | | | | | | | | | |
Net increase (decrease) in net assets
resulting from fund share activities | | | (597,923,467 | ) | | | 244,966,499 | | | | 1,716,020,036 | | | |
| | |
|
|
| |
|
|
| |
|
|
| | |
Total increase (decrease) in net assets | | | 852,886,957 | | | | 741,555,342 | | | | 806,196,508 | | | |
| | |
|
|
| |
|
|
| |
|
|
| | |
Net assets, beginning of period | | | 8,899,393,066 | | | | 8,157,837,724 | | | | 7,351,641,216 | | | |
| | |
|
|
| |
|
|
| |
|
|
| | |
Net assets, end of period | | $ | 9,752,280,023 | | | $ | 8,899,393,066 | | | $ | 8,157,837,724 | | | |
| | |
|
|
| |
|
|
| |
|
|
| | |
| | | | | | | | | | | | | | | |
Accumulated undistributed net investment income (loss) | | $ | 64,567,549 | | | $ | 101,915,854 | | | $ | 90,594,085 | | | |
| | |
|
|
| |
|
|
| |
|
|
| | |
| (1) | For the period from July 1, 2003 through September 30, 2003. Artisan Funds changed its fiscal year-end from June 30 to September 30 effective September 30, 2003. |
| (2) | For the period from commencement of operations (September 23, 2002) through June 30, 2003. |
54
FIFTY-FOUR
| | | | | | | | | | | | | | | | | | | | | | | | |
| | | INTERNATIONAL SMALL CAP
| | | INTERNATIONAL VALUE
| |
| | | Year Ended
9/30/04
| | | Period Ended
9/30/03(1)
| | | Year Ended
6/30/03
| | | Year Ended
9/30/04
| | | Period Ended
9/30/03(1)
| | | Period Ended
6/30/03(2)
| |
| | | | | | | | | | | | | | | | | | | | | | | | | |
| | | $ | 4,997,343 | | | $ | 46,733 | | | $ | 335,121 | | | $ | 1,668,336 | | | $ | 22,736 | | | $ | 55,293 | |
| | | | | | | | | | | | | | | | | | | | | | | | | |
| | | | 67,154,595 | | | | 5,281,076 | | | | 3,302,104 | | | | 3,496,007 | | | | 497,624 | | | | 130,388 | |
| | | | (346,102 | ) | | | (202,732 | ) | | | (152,047 | ) | | | (47,257 | ) | | | (4,859 | ) | | | (2,222 | ) |
| | | | | | | | | | | | | | | | | | | | | | | | | |
| | | | 25,704,988 | | | | 37,030,177 | | | | 28,634,982 | | | | 13,353,539 | | | | 1,374,411 | | | | 2,325,237 | |
| | | | (7,379 | ) | | | 79,419 | | | | (112,904 | ) | | | 12,754 | | | | 1,525 | | | | 337 | |
| | |
|
|
| |
|
|
| |
|
|
| |
|
|
| |
|
|
| |
|
|
|
| | | | 97,503,445 | | | | 42,234,673 | | | | 32,007,256 | | | | 18,483,379 | | | | 1,891,437 | | | | 2,509,033 | |
| | | | | | |
| | | | | | | | | | | | | | | | | | | | | | | | | |
| | | | | | | | | | | | | | | | | | | | | | | | | |
| | | | (1,142,162 | ) | | | - | | | | - | | | | (191,806 | ) | | | - | | | | - | |
| | | | | | | | | | | | | | | | | | | | | | | | | |
| | | | | | | | | | | | | | | | | | | | | | | | | |
| | | | (15,685,346 | ) | | | - | | | | (236,073 | ) | | | (636,769 | ) | | | - | | | | - | |
| | | | | | | | | | | | | | | | | | | | | | | | | |
| | |
|
|
| |
|
|
| |
|
|
| |
|
|
| |
|
|
| |
|
|
|
| | | | (16,827,508 | ) | | | - | | | | (236,073 | ) | | | (828,575 | ) | | | - | | | | - | |
| | | | | | |
| | | | | | | | | | | | | | | | | | | | | | | | | |
| | | | 43,008,188 | | | | 110,508,433 | | | | 132,312,967 | | | | 176,229,783 | | | | 5,433,053 | | | | 13,780,423 | |
| | |
|
|
| |
|
|
| |
|
|
| |
|
|
| |
|
|
| |
|
|
|
| | | | 123,684,125 | | | | 152,743,106 | | | | 164,084,150 | | | | 193,884,587 | | | | 7,324,490 | | | | 16,289,456 | |
| | |
|
|
| |
|
|
| |
|
|
| |
|
|
| |
|
|
| |
|
|
|
| | | | 391,324,543 | | | | 238,581,437 | | | | 74,497,287 | | | | 23,613,946 | | | | 16,289,456 | | | | - | |
| | |
|
|
| |
|
|
| |
|
|
| |
|
|
| |
|
|
| |
|
|
|
| | | $ | 515,008,668 | | | $ | 391,324,543 | | | $ | 238,581,437 | | | $ | 217,498,533 | | | $ | 23,613,946 | | | $ | 16,289,456 | |
| | |
|
|
| |
|
|
| |
|
|
| |
|
|
| |
|
|
| |
|
|
|
| | | | | | | | | | | | | | | | | | | | | | | | | |
| | | $ | 3,383,684 | | | $ | 291,438 | | | $ | 162,036 | | | $ | 1,398,660 | | | $ | 70,865 | | | $ | 53,071 | |
| | |
|
|
| |
|
|
| |
|
|
| |
|
|
| |
|
|
| |
|
|
|
The accompanying notes are an integral part of the financial statements.
55
FIFTY-FIVE
ARTISAN FUNDS, INC.
Statements of Changes in Net Assets (Continued)
| | | | | | | | | | | | | | |
| | | MID CAP
| | | |
| | | Year Ended
9/30/04
| | | Period Ended
9/30/03(1)
| | | Year Ended
6/30/03
| | | |
| OPERATIONS: | | | | | | | | | | | | | | |
Net investment income (loss) | | $ | (33,613,109 | ) | | $ | (6,409,147 | ) | | $ | (12,208,186 | ) | | |
Net realized gain (loss) on: | | | | | | | | | | | | | | |
Investments | | | 330,560,106 | | | | 105,075,097 | | | | (325,149,190 | ) | | |
Foreign currency related transactions | | | - | | | | - | | | | - | | | |
Net increase (decrease) in unrealized appreciation or depreciation on: | | | | | | | | | | | | | | |
Investments | | | 172,866,182 | | | | 90,208,363 | | | | 376,988,686 | | | |
Foreign currency related transactions | | | - | | | | - | | | | - | | | |
| | |
|
|
| |
|
|
| |
|
|
| | |
Net increase (decrease) in net assets resulting from operations | | | 469,813,179 | | | | 188,874,313 | | | | 39,631,310 | | | |
| | | | |
| DISTRIBUTIONS PAID TO SHAREHOLDERS: | | | | | | | | | | | | | | |
Net investment income: | | | | | | | | | | | | | | |
Investor Shares | | | - | | | | - | | | | - | | | |
Institutional Shares | | | - | | | | - | | | | - | | | |
Net realized gains on investment transactions: | | | | | | | | | | | | | | |
Investor Shares | | | - | | | | - | | | | - | | | |
Institutional Shares | | | - | | | | - | | | | - | | | |
| | |
|
|
| |
|
|
| |
|
|
| | |
Total distributions paid to shareholders | | | - | | | | - | | | | - | | | |
| | | | |
| FUND SHARE ACTIVITIES: | | | | | | | | | | | | | | |
Net increase (decrease) in net assets
resulting from fund share activities | | | 1,096,126,727 | | | | 208,283,211 | | | | 770,633,859 | | | |
| | |
|
|
| |
|
|
| |
|
|
| | |
Total increase (decrease) in net assets | | | 1,565,939,906 | | | | 397,157,524 | | | | 810,265,169 | | | |
| | |
|
|
| |
|
|
| |
|
|
| | |
Net assets, beginning of period | | | 3,512,758,603 | | | | 3,115,601,079 | | | | 2,305,335,910 | | | |
| | |
|
|
| |
|
|
| |
|
|
| | |
Net assets, end of period | | $ | 5,078,698,509 | | | $ | 3,512,758,603 | | | $ | 3,115,601,079 | | | |
| | |
|
|
| |
|
|
| |
|
|
| | |
| | | | | | | | | | | | | | | |
Accumulated undistributed net investment income (loss) | | $ | - | | | $ | - | | | $ | - | | | |
| | |
|
|
| |
|
|
| |
|
|
| | |
| (1) | For the period from July 1, 2003 through September 30, 2003. Artisan Funds changed its fiscal year-end from June 30 to September 30 effective September 30, 2003. | |
56
FIFTY-SIX
| | | | | | | | | | | | | | | | | | | | | | | | | | | | | | | | | | | | |
| | | MID CAP VALUE
| | | SMALL CAP
| | | SMALL CAP VALUE
| |
| | | Year Ended
9/30/04
| | | Period Ended
9/30/03(1)
| | | Year Ended
6/30/03
| | | Year Ended
9/30/04
| | | Period Ended
9/30/03(1)
| | | Year Ended
6/30/03
| | | Year Ended
9/30/04
| | | Period Ended
9/30/03(1)
| | | Year Ended
6/30/03
| |
| | | | | | | | | | | | | | | | | | | | | | | | | | | | | | | | | | | | | |
| | | $ | 1,036,610 | | | $ | (56,920 | ) | | $ | (131,368 | ) | | $ | (1,586,397 | ) | | $ | (361,184 | ) | | $ | (987,365 | ) | | $ | (1,766,947 | ) | | $ | (762,736 | ) | | $ | (1,225,260 | ) |
| | | | | | | | | | | | | | | | | | | | | | | | | | | | | | | | | | | | | |
| | | | 10,522,572 | | | | 1,143,665 | | | | (110,623 | ) | | | 27,262,462 | | | | 4,973,748 | | | | (22,436,510 | ) | | | 126,320,385 | | | | 18,221,191 | | | | (20,174,753 | ) |
| | | | - | | | | - | | | | - | | | | - | | | | - | | | | - | | | | - | | | | - | | | | - | |
| | | | | | | | | | | | | | | | | | | | | | | | | | | | | | | | | | | | | |
| | | | 22,190,097 | | | | 2,308,116 | | | | 6,300,648 | | | | 1,847,755 | | | | 1,464,390 | | | | 20,333,623 | | | | 127,503,467 | | | | 10,070,646 | | | | 36,753,479 | |
| | | | - | | | | - | | | | - | | | | - | | | | - | | | | - | | | | - | | | | - | | | | - | |
| | |
|
|
| |
|
|
| |
|
|
| |
|
|
| |
|
|
| |
|
|
| |
|
|
| |
|
|
| |
|
|
|
| | | | 33,749,279 | | | | 3,394,861 | | | | 6,058,657 | | | | 27,523,820 | | | | 6,076,954 | | | | (3,090,252 | ) | | | 252,056,905 | | | | 27,529,101 | | | | 15,353,466 | |
| | | | | | | | | |
| | | | | | | | | | | | | | | | | | | | | | | | | | | | | | | | | | | | | |
| | | | | | | | | | | | | | | | | | | | | | | | | | | | | | | | | | | | | |
| | | | - | | | | - | | | | - | | | | - | | | | - | | | | - | | | | - | | | | - | | | | - | |
| | | | | | | | | | | | | | | | | | | | | | | | | | | | | | | | | | | | | |
| | | | | | | | | | | | | | | | | | | | | | | | | | | | | | | | | | | | | |
| | | | (1,599,811 | ) | | | - | | | | - | | | | - | | | | - | | | | (629,095 | ) | | | (11,783,598 | ) | | | - | | | | (22,600,376 | ) |
| | | | | | | | | | | | | | | | | | | | | | | | | | | | | | | | | | | | | |
| | |
|
|
| |
|
|
| |
|
|
| |
|
|
| |
|
|
| |
|
|
| |
|
|
| |
|
|
| |
|
|
|
| | | | (1,599,811 | ) | | | - | | | | - | | | | - | | | | - | | | | (629,095 | ) | | | (11,783,598 | ) | | | - | | | | (22,600,376 | ) |
| | | | | | | | | |
| | | | | | | | | | | | | | | | | | | | | | | | | | | | | | | | | | | | | |
| | | | 202,730,099 | | | | 9,507,195 | | | | 36,457,011 | | | | 84,168,692 | | | | 5,759,810 | | | | (12,182,933 | ) | | | 177,321,270 | | | | 45,076,888 | | | | 86,250,860 | |
| | |
|
|
| |
|
|
| |
|
|
| |
|
|
| |
|
|
| |
|
|
| |
|
|
| |
|
|
| |
|
|
|
| | | | 234,879,567 | | | | 12,902,056 | | | | 42,515,668 | | | | 111,692,512 | | | | 11,836,764 | | | | (15,902,280 | ) | | | 417,594,577 | | | | 72,605,989 | | | | 79,003,950 | |
| | |
|
|
| |
|
|
| |
|
|
| |
|
|
| |
|
|
| |
|
|
| |
|
|
| |
|
|
| |
|
|
|
| | | | 77,400,119 | | | | 64,498,063 | | | | 21,982,395 | | | | 127,873,526 | | | | 116,036,762 | | | | 131,939,042 | | | | 775,155,571 | | | | 702,549,582 | | | | 623,545,632 | |
| | |
|
|
| |
|
|
| |
|
|
| |
|
|
| |
|
|
| |
|
|
| |
|
|
| |
|
|
| |
|
|
|
| | | $ | 312,279,686 | | | $ | 77,400,119 | | | $ | 64,498,063 | | | $ | 239,566,038 | | | $ | 127,873,526 | | | $ | 116,036,762 | | | $ | 1,192,750,148 | | | $ | 775,155,571 | | | $ | 702,549,582 | |
| | |
|
|
| |
|
|
| |
|
|
| |
|
|
| |
|
|
| |
|
|
| |
|
|
| |
|
|
| |
|
|
|
| | | | | | | | | | | | | | | | | | | | | | | | | | | | | | | | | | | | | |
| | | $ | 1,037,046 | | | $ | - | | | $ | - | | | $ | - | | | $ | - | | | $ | - | | | $ | - | | | $ | - | | | $ | - | |
| | |
|
|
| |
|
|
| |
|
|
| |
|
|
| |
|
|
| |
|
|
| |
|
|
| |
|
|
| |
|
|
|
The accompanying notes are an integral part of the financial statements.
57
FIFTY-SEVEN
ARTISAN FUNDS, INC.
Financial Highlights – For a share outstanding throughout each period
| | | | | | | | | | | | | | | | | | | | | | | | |
Year or
Period
Ended | | | Net Asset
Value
Beginning
of Period | | Net
Investment
Income
(Loss)(1) | | | Net Realized
and Unrealized
Gain (Loss) on
Investments | | | Total Income
(Loss) from
Investment
Operations | | | Dividends
from Net
Investment
Income | | | Distributions
from Net
Realized
Gains | |
| | | | | | | | | | | | | | | | | | | | | | | | | |
| ARTISAN INTERNATIONAL FUND | | | | | |
| Investor Shares | | | | | |
| 9/30/2004 | | | $ | 16.54 | | $ | 0.12 | | | $ | 2.85 | | | $ | 2.97 | | | $ | (0.18 | ) | | $ | - | |
| 9/30/2003 | (4) | | | 15.63 | | | 0.02 | | | | 0.89 | | | | 0.91 | | | | - | | | | - | |
| 6/30/2003 | | | | 18.15 | | | 0.20 | | | | (2.62 | ) | | | (2.42 | ) | | | (0.10 | ) | | | - | |
| 6/30/2002 | | | | 19.53 | | | 0.15 | | | | (1.46 | ) | | | (1.31 | ) | | | (0.07 | ) | | | - | |
| 6/30/2001 | | | | 30.16 | | | 0.10 | | | | (7.18 | ) | | | (7.08 | ) | | | - | | | | (3.55 | ) |
| 6/30/2000 | | | | 18.67 | | | (0.03 | ) | | | 12.08 | | | | 12.05 | | | | (0.02 | ) | | | (0.54 | ) |
| Institutional Shares | | | | | | | | | | | | | | | | | | | | | | | | |
| 9/30/2004 | | | $ | 16.63 | | $ | 0.16 | | | $ | 2.86 | | | $ | 3.02 | | | $ | (0.21 | ) | | $ | - | |
| 9/30/2003 | (4) | | | 15.71 | | | 0.03 | | | | 0.89 | | | | 0.92 | | | | - | | | | - | |
| 6/30/2003 | | | | 18.24 | | | 0.25 | | | | (2.65 | ) | | | (2.40 | ) | | | (0.13 | ) | | | - | |
| 6/30/2002 | | | | 19.62 | | | 0.18 | | | | (1.46 | ) | | | (1.28 | ) | | | (0.10 | ) | | | - | |
| 6/30/2001 | | | | 30.22 | | | 0.16 | | | | (7.21 | ) | | | (7.05 | ) | | | - | | | | (3.55 | ) |
| 6/30/2000 | | | | 18.70 | | | 0.03 | | | | 12.09 | | | | 12.12 | | | | (0.06 | ) | | | (0.54 | ) |
| | | | | | | | | | | | | | | | | | | | | | | | | |
| ARTISAN INTERNATIONAL SMALL CAP FUND | | | | | |
| Investor Shares | | | | | |
| 9/30/2004 | | | $ | 13.84 | | $ | 0.15 | | | $ | 2.93 | | | $ | 3.08 | | | $ | (0.03 | ) | | $ | (0.49 | ) |
| 9/30/2003 | (4) | | | 12.10 | | | - | | | | 1.74 | | | | 1.74 | | | | - | | | | - | |
| 6/30/2003 | | | | 10.50 | | | 0.03 | | | | 1.59 | | | | 1.62 | | | | - | | | | (0.02 | ) |
| 6/30/2002 | (6) | | | 10.00 | | | - | | | | 0.50 | (7) | | | 0.50 | | | | - | | | | - | |
| | | | | | | | | | | | | | | | | | | | | | | | | |
| ARTISAN INTERNATIONAL VALUE FUND | | | | | |
| Investor Shares | | | | | |
| 9/30/2004 | | | $ | 14.32 | | $ | 0.28 | | | $ | 4.33 | | | $ | 4.61 | | | $ | (0.09 | ) | | $ | (0.30 | ) |
| 9/30/2003 | (4) | | | 13.01 | | | 0.02 | | | | 1.29 | | | | 1.31 | | | | - | | | | - | |
| 6/30/2003 | (8) | | | 10.00 | | | 0.09 | | | | 2.92 | | | | 3.01 | | | | - | | | | - | |
| (1) | Computed based on average shares outstanding. |
| (2) | Periods less than 12 months (where applicable) are not annualized. |
| (3) | Periods less than 12 months (where applicable) are annualized. |
| (4) | For the period from July 1, 2003 to September 30, 2003. Artisan Funds changed its fiscal year-end from June 30 to September 30 effective September 30, 2003. | |
| (5) | The ratios of expenses to average net assets and net investment income (loss) to average net assets exclude expenses waived or paid by the Adviser. Absent expenses waived or paid by the Adviser, the ratios of expenses to average net assets and net investment income (loss) to average net assets would have been as follows: | |
| | | | | | | | |
| Fund | | Period Ended | | Ratio of Expenses to
Average Net Assets | | | Ratio of Net Investment Income
(Loss) to Average Net Assets | |
International Investor Shares | | 9/30/2003 | | 1.23 | % | | 0.49 | % |
International Institutional Shares | | 9/30/2003 | | 1.00 | | | 0.73 | |
International Small Cap Investor Shares | | 9/30/2003 | | 1.69 | | | 0.05 | |
International Value Investor Shares | | 9/30/2003 | | 2.80 | | | (0.34 | ) |
| | | 6/30/2003 | | 5.02 | | | (1.43 | ) |
58
FIFTY-EIGHT
| | | | | | | | | | | | | | | | | | | | | | |
| | | Total
Distributions | | | Net Asset
Value
End
of Period | | Total
Return(2) | | | Net Assets
End of
Period
(millions) | | Ratio of
Expenses
to Average
Net Assets(3) | | | Ratio of Net
Investment
Income (Loss)
to Average
Net Assets(3) | | | Portfolio
Turnover
Rate(2) | |
| | | | | | | | | | | | | | | | | | | | | | | |
| | | | | | | | | | | | | | | | | | | | | | | |
| | | | | | | | | | | | | | | | | | | | | | | |
| | | $ | (0.18 | ) | | $ | 19.33 | | 18.0 | % | | $ | 6,130.2 | | 1.22 | % | | 0.64 | % | | 54.96 | % |
| | | | - | | | | 16.54 | | 5.8 | | | | 5,544.7 | | 1.23 | (5) | | 0.49 | (5) | | 15.23 | |
| | | | (0.10 | ) | | | 15.63 | | (13.3 | ) | | | 5,182.8 | | 1.20 | | | 1.35 | | | 37.13 | |
| | | | (0.07 | ) | | | 18.15 | | (6.7 | ) | | | 5,289.6 | | 1.21 | | | 0.82 | | | 50.67 | |
| | | | (3.55 | ) | | | 19.53 | | (24.7 | ) | | | 3,907.1 | | 1.22 | | | 0.45 | | | 72.01 | |
| | | | (0.56 | ) | | | 30.16 | | 65.6 | | | | 3,734.8 | | 1.27 | | | (0.10 | ) | | 99.02 | |
| | | | | | | | | | | | | | | | | | | | | | | |
| | | $ | (0.21 | ) | | $ | 19.44 | | 18.3 | % | | $ | 3,622.1 | | 1.01 | % | | 0.85 | % | | 54.96 | % |
| | | | - | | | | 16.63 | | 5.9 | | | | 3,354.7 | | 1.00 | (5) | | 0.73 | (5) | | 15.23 | |
| | | | (0.13 | ) | | | 15.71 | | (13.1 | ) | | | 2,975.0 | | 1.01 | | | 1.68 | | | 37.13 | |
| | | | (0.10 | ) | | | 18.24 | | (6.5 | ) | | | 2,062.0 | | 1.01 | | | 1.01 | | | 50.67 | |
| | | | (3.55 | ) | | | 19.62 | | (24.5 | ) | | | 1,486.6 | | 1.03 | | | 0.70 | | | 72.01 | |
| | | | (0.60 | ) | | | 30.22 | | 66.0 | | | | 1,136.2 | | 1.08 | | | 0.09 | | | 99.02 | |
| | | | | | | | | | | | | | | | | | | | | | | |
| | | | | | | | | | | | | | | | | | | | | | | |
| | | | | | | | | | | | | | | | | | | | | | | |
| | | $ | (0.52 | ) | | $ | 16.40 | | 22.7 | % | | $ | 515.0 | | 1.57 | % | | 0.95 | % | | 81.03 | % |
| | | | - | | | | 13.84 | | 14.5 | | | | 391.3 | | 1.68 | (5) | | 0.06 | (5) | | 13.28 | |
| | | | (0.02 | ) | | | 12.10 | | 15.5 | | | | 238.6 | | 1.77 | | | 0.28 | | | 62.79 | |
| | | | - | | | | 10.50 | | 5.0 | | | | 74.5 | | 2.39 | | | (0.02 | ) | | 25.14 | |
| | | | | | | | | | | | | | | | | | | | | | | |
| | | | | | | | | | | | | | | | | | | | | | | |
| | | | | | | | | | | | | | | | | | | | | | | |
| | | $ | (0.39 | ) | | $ | 18.54 | | 32.8 | % | | $ | 217.5 | | 1.56 | % | | 1.61 | % | | 14.66 | % |
| | | | - | | | | 14.32 | | 10.1 | | | | 23.6 | | 2.00 | (5) | | 0.46 | (5) | | 9.30 | |
| | | | - | | | | 13.01 | | 30.1 | | | | 16.3 | | 2.45 | (5) | | 1.14 | (5) | | 17.42 | |
| | (6) | For the period from commencement of operations (December 21, 2001) through June 30, 2002. |
| | (7) | The amount shown may not correlate with the aggregate gains and losses of portfolio securities due to the timing of subscriptions and redemptions of fund shares. |
| | (8) | For the period from commencement of operations (September 23, 2002) through June 30, 2003. |
The accompanying notes are an integral part of the financial statements.
59
FIFTY-NINE
ARTISAN FUNDS, INC.
Financial Highlights – For a share outstanding throughout each period (Continued)
| | | | | | | | | | | | | | | | | | | | | | | | | |
Year or
Period
Ended | | | Net Asset
Value
Beginning
of Period | | Net
Investment
Income
(Loss)(1) | | | Net Realized
and Unrealized
Gain (Loss) on
Investments | | | Total Income
(Loss) from
Investment
Operations | | | Dividends
from Net
Investment
Income | | | Distributions
from Net
Realized Gains | | | |
| | | | | | | | | | | | | | | | | | | | | | | | | | |
| ARTISAN MID CAP FUND | | | | | | | | | | | | | | | | | | | | | | | | | |
| Investor Shares | | | | | | | | | | | | | | | | | | | | | | | | | |
| 9/30/2004 | | | $ | 23.11 | | $ | (0.20 | ) | | $ | 3.22 | | | $ | 3.02 | | | $ - | | | | $ - | | | |
| 9/30/2003 | (4) | | | 21.81 | | | (0.05 | ) | | | 1.35 | | | | 1.30 | | | - | | | | - | | | |
| 6/30/2003 | | | | 22.13 | | | (0.11 | ) | | | (0.21 | )(6) | | | (0.32 | ) | | - | | | | - | | | |
| 6/30/2002 | | | | 26.43 | | | (0.19 | ) | | | (4.11 | ) | | | (4.30 | ) | | - | | | | - | | | |
| 6/30/2001 | | | | 27.57 | | | (0.13 | ) | | | 0.02 | (6) | | | (0.11 | ) | | - | | | | (1.03 | ) | | |
| 6/30/2000 | | | | 16.67 | | | (0.18 | ) | | | 11.91 | | | | 11.73 | | | - | | | | (0.83 | ) | | |
| Institutional Shares | | | | | | | | | | | | | | | | | | | | | | | | | |
| 9/30/2004 | | | $ | 23.28 | | $ | (0.14 | ) | | $ | 3.24 | | | $ | 3.10 | | | $ - | | | | $ - | | | |
| 9/30/2003 | (4) | | | 21.96 | | | (0.03 | ) | | | 1.35 | | | | 1.32 | | | - | | | | - | | | |
| 6/30/2003 | | | | 22.24 | | | (0.07 | ) | | | (0.21 | )(6) | | | (0.28 | ) | | - | | | | - | | | |
| 6/30/2002 | | | | 26.48 | | | (0.13 | ) | | | (4.11 | ) | | | (4.24 | ) | | - | | | | - | | | |
| 6/30/2001 | | | | 27.57 | | | (0.08 | ) | | | 0.02 | (6) | | | (0.06 | ) | | - | | | | (1.03 | ) | | |
| | | | | | | | | | | | | | | | | | | | | | | | | | |
| ARTISAN MID CAP VALUE FUND | | | |
| Investor Shares | | | | | | | | | | | | | | | | | | | | | | | | | |
| 9/30/2004 | | | $ | 12.22 | | $ | 0.10 | | | $ | 3.47 | | | $ | 3.57 | | | $ - | | | $ | (0.24 | ) | | |
| 9/30/2003 | (4) | | | 11.64 | | | (0.01 | ) | | | 0.59 | | | | 0.58 | | | - | | | | - | | | |
| 6/30/2003 | | | | 10.82 | | | (0.03 | ) | | | 0.85 | | | | 0.82 | | | - | | | | - | | | |
| 6/30/2002 | | | | 11.18 | | | (0.09 | ) | | | (0.19 | ) | | | (0.28 | ) | | - | | | | (0.08 | ) | | |
| 6/30/2001 | (7) | | | 10.00 | | | (0.01 | ) | | | 1.19 | | | | 1.18 | | | - | | | | - | | | |
| | | | | | | | | | | | | | | | | | | | | | | | | | |
| ARTISAN SMALL CAP FUND | | | |
| Investor Shares | | | | | | | | | | | | | | | | | | | | | | | | | |
| 9/30/2004 | | | $ | 12.53 | | $ | (0.14 | ) | | $ | 2.73 | | | $ | 2.59 | | | $ - | | | | $ - | | | |
| 9/30/2003 | (4) | | | 11.90 | | | (0.04 | ) | | | 0.67 | | | | 0.63 | | | - | | | | - | | | |
| 6/30/2003 | | | | 11.99 | | | (0.10 | ) | | | 0.07 | (6) | | | (0.03 | ) | | - | | | | (0.06 | ) | | |
| 6/30/2002 | | | | 13.99 | | | (0.13 | ) | | | (1.81 | ) | | | (1.94 | ) | | - | | | | (0.06 | ) | | |
| 6/30/2001 | | | | 14.69 | | | (0.09 | ) | | | 0.05 | (6) | | | (0.04 | ) | | - | | | | (0.66 | ) | | |
| 6/30/2000 | | | | 11.09 | | | (0.10 | ) | | | 3.70 | | | | 3.60 | | | - | | | | - | | | |
| | | | | | | | | | | | | | | | | | | | | | | | | | |
| ARTISAN SMALL CAP VALUE FUND | | | |
| Investor Shares | | | | | | | | | | | | | | | | | | | | | | | | | |
| 9/30/2004 | | | $ | 13.67 | | $ | (0.03 | ) | | $ | 4.19 | | | $ | 4.16 | | | $ - | | | $ | (0.20 | ) | | |
| 9/30/2003 | (4) | | | 13.15 | | | (0.01 | ) | | | 0.53 | | | | 0.52 | | | - | | | | - | | | |
| 6/30/2003 | | | | 13.48 | | | (0.03 | ) | | | 0.20 | | | | 0.17 | | | - | | | | (0.50 | ) | | |
| 6/30/2002 | | | | 13.05 | | | (0.01 | ) | | | 1.16 | | | | 1.15 | | | (0.01 | ) | | | (0.71 | ) | | |
| 6/30/2001 | | | | 10.63 | | | 0.05 | | | | 2.91 | | | | 2.96 | | | (0.05 | ) | | | (0.49 | ) | | |
| 6/30/2000 | | | | 10.59 | | | 0.06 | | | | 0.36 | | | | 0.42 | | | (0.03 | ) | | | (0.35 | ) | | |
| (1) | Computed based on average shares outstanding. |
| (2) | Periods less than 12 months (where applicable) are not annualized. |
| (3) | Periods less than 12 months (where applicable) are annualized. |
| (4) | For the period from July 1, 2003 to September 30, 2003. Artisan Funds changed its fiscal year-end from June 30 to September 30 effective September 30, 2003. | |
| (5) | The ratios of expenses to average net assets and net investment income (loss) to average net assets exclude expenses waived or paid by the Adviser. Absent expenses waived or paid by the Adviser, the ratios of expenses to average net assets and net investment income (loss) to average net assets would have been as follows: | |
| | | | | | | | |
| Fund | | Year or
Period Ended | | Ratio of Expenses to
Average Net Assets | | | Ratio of Net Investment Income
(Loss) to Average Net Assets | |
Mid Cap Investor Shares | | 9/30/2003 | | 1.20 | % | | (0.81 | )% |
Mid Cap Institutional Shares | | 9/30/2003 | | 0.98 | | | (0.59 | ) |
60
SIXTY
| | | | | | | | | | | | | | | | | | | | | | |
| | | Total
Distributions | | | Net Asset
Value
End
of Period | | Total
Return(2) | | | Net Assets
End of
Period
(millions) | | Ratio of
Expenses
to Average
Net Assets(3) | | | Ratio of Net
Investment
Income (Loss)
to Average
Net Assets(3) | | | Portfolio
Turnover
Rate(2) | |
| | | | | | | | | | | | | | | | | | | | | | | |
| | | | | | | | | | | | | | | | | | | | | | | |
| | | | | | | | | | | | | | | | | | | | | | | |
| | | | $ - | | | $ | 26.13 | | 13.0 | % | | $ | 4,042.7 | | 1.19 | % | | (0.77 | )% | | 101.09 | % |
| | | | - | | | | 23.11 | | 6.0 | | | | 2,583.2 | | 1.20 | (5) | | (0.81 | )(5) | | 26.52 | |
| | | | - | | | | 21.81 | | (1.4 | ) | | | 2,286.6 | | 1.20 | | | (0.56 | ) | | 102.85 | |
| | | | - | | | | 22.13 | | (16.3 | ) | | | 1,855.5 | | 1.22 | | | (0.77 | ) | | 121.14 | |
| | | | (1.03 | ) | | | 26.43 | | (0.6 | ) | | | 1,333.6 | | 1.31 | | | (0.52 | ) | | 153.95 | |
| | | | (0.83 | ) | | | 27.57 | | 72.9 | | | | 225.0 | | 1.40 | | | (0.79 | ) | | 245.69 | |
| | | | | | | | | | | | | | | | | | | | | | | |
| | | | $ - | | | $ | 26.38 | | 13.3 | % | | $ | 1,036.0 | | 0.96 | % | | (0.54 | )% | | 101.09 | % |
| | | | - | | | | 23.28 | | 6.1 | | | | 929.6 | | 0.98 | (5) | | (0.59 | )(5) | | 26.52 | |
| | | | - | | | | 21.96 | | (1.3 | ) | | | 829.0 | | 1.00 | | | (0.36 | ) | | 102.85 | |
| | | | - | | | | 22.24 | | (16.0 | ) | | | 449.8 | | 1.02 | | | (0.56 | ) | | 121.14 | |
| | | | (1.03 | ) | | | 26.48 | | (0.4 | ) | | | 212.2 | | 1.08 | | | (0.29 | ) | | 153.95 | |
| | | | | | | | | | | | | | | | | | | | | | | |
| | | | | | | | | | | | | | | | | | | | |
| | | | | | | | | | | | | | | | | | | | | | | |
| | | $ | (0.24 | ) | | $ | 15.55 | | 29.6 | % | | $ | 312.3 | | 1.39 | % | | 0.73 | % | | 53.79 | % |
| | | | - | | | | 12.22 | | 5.0 | | | | 77.4 | | 1.59 | (5) | | (0.31 | )(5) | | 11.90 | |
| | | | - | | | | 11.64 | | 7.6 | | | | 64.5 | | 1.78 | | | (0.34 | ) | | 45.55 | |
| | | | (0.08 | ) | | | 10.82 | | (2.4 | ) | | | 22.0 | | 1.95 | (5) | | (0.82 | )(5) | | 167.70 | |
| | | | - | | | | 11.18 | | 11.8 | | | | 13.2 | | 1.84 | (5) | | (0.52 | )(5) | | 40.72 | |
| | | | | | | | | | | | | | | | | | | | | | | |
| | | | | | | | | | | | | | | | | | | | | | | |
| | | | | | | | | | | | | | | | | | | | | | | |
| | | | $ - | | | $ | 15.12 | | 20.7 | % | | $ | 239.6 | | 1.27 | % | | (0.95 | )% | | 119.40 | % |
| | | | - | | | | 12.53 | | 5.3 | | | | 127.9 | | 1.44 | (5) | | (1.16 | )(5) | | 30.18 | |
| | | | (0.06 | ) | | | 11.90 | | (0.1 | ) | | | 116.0 | | 1.39 | | | (0.98 | ) | | 127.41 | |
| | | | (0.06 | ) | | | 11.99 | | (13.9 | ) | | | 131.9 | | 1.31 | | | (1.00 | ) | | 139.72 | |
| | | | (0.66 | ) | | | 13.99 | | 0.1 | | | | 145.4 | | 1.34 | | | (0.68 | ) | | 147.13 | |
| | | | - | | | | 14.69 | | 32.5 | | | | 185.4 | | 1.35 | | | (0.79 | ) | | 193.76 | |
| | | | | | | | | | | | | | | | | | | | | | | |
| | | | | | | | | | | | | | | | | | | | |
| | | | | | | | | | | | | | | | | | | | | | | |
| | | $ | (0.20 | ) | | $ | 17.63 | | 30.8 | % | | $ | 1,192.8 | | 1.18 | % | | (0.17 | )% | | 41.31 | % |
| | | | - | | | | 13.67 | | 4.0 | | | | 775.2 | | 1.20 | (5) | | (0.40 | )(5) | | 12.20 | |
| | | | (0.50 | ) | | | 13.15 | | 1.9 | | | | 702.5 | | 1.21 | | | (0.21 | ) | | 49.57 | |
| | | | (0.72 | ) | | | 13.48 | | 9.7 | | | | 623.5 | | 1.20 | | | (0.10 | ) | | 33.59 | |
| | | | (0.54 | ) | | | 13.05 | | 28.8 | | | | 460.3 | | 1.20 | | | 0.45 | | | 40.77 | |
| | | | (0.38 | ) | | | 10.63 | | 4.2 | | | | 261.7 | | 1.35 | | | 0.60 | | | 38.19 | |
| | | | | | | | |
| Fund | | Year or
Period Ended | | Ratio of Expenses to
Average Net Assets | | | Ratio of Net Investment Income
(Loss) to Average Net Assets | |
Mid Cap Value Investor Shares | | 9/30/2003 | | 1.63 | % | | (0.35 | )% |
| | | 6/30/2002 | | 2.53 | | | (1.40 | ) |
| | | 6/30/2001 | | 5.17 | | | (3.84 | ) |
Small Cap Investor Shares | | 9/30/2003 | | 1.46 | | | (1.18 | ) |
Small Cap Value Investor Shares | | 9/30/2003 | | 1.20 | | | (0.41 | ) |
| | (6) | The amount shown may not correlate with the aggregate gains and losses of portfolio securities due to the timing of subscriptions and redemptions of fund shares. |
| | (7) | For the period from commencement of operations (March 28, 2001) through June 30, 2001. |
The accompanying notes are an integral part of the financial statements.
61
SIXTY-ONE
Artisan Funds, Inc.
Notes to Financial Statements – September 30, 2004
Artisan Funds, Inc. (“Artisan Funds”) was incorporated on January 5, 1995, as a Wisconsin corporation and is registered under the Investment Company Act of 1940, as amended. Artisan Funds is a series comprised of seven open-end, diversified mutual funds (each a “Fund” and collectively the “Funds”):
| | |
| Fund Name | | Inception Date |
Artisan International Fund (“International Fund” or “International”) | | December 28, 1995 |
Artisan International Small Cap Fund (“International Small Cap Fund” or “International Small Cap”) | | December 21, 2001 |
Artisan International Value Fund (“International Value Fund” or “International Value”) | | September 23, 2002 |
Artisan Mid Cap Fund (“Mid Cap Fund” or “Mid Cap”) | | June 27, 1997 |
Artisan Mid Cap Value Fund (“Mid Cap Value Fund” or “Mid Cap Value”) | | March 28, 2001 |
Artisan Small Cap Fund (“Small Cap Fund” or “Small Cap”) | | March 28, 1995 |
Artisan Small Cap Value Fund (“Small Cap Value Fund” or “Small Cap Value”) | | September 29, 1997 |
Each Fund’s investment objective is to seek long-term capital growth. Each Fund offers shares of capital stock of the class designated Investor Shares. International Fund and Mid Cap Fund began offering a second class of capital shares, Institutional Shares, effective July 1, 1997 and July 1, 2000, respectively. Institutional Shares are sold to institutional investors meeting certain minimum investment requirements. Each class of shares has equal rights with respect to portfolio assets and voting privileges. Each class has exclusive voting rights with respect to any matters involving only that class. Income, non-class specific expenses and realized and unrealized gains and losses are allocated daily to each class of shares based upon the relative net asset value of outstanding shares. Expenses attributable to a particular class of shares, such as transfer agency fees, shareholder communication expenses and registration fees, are allocated directly to that class.
Each class of the Funds has an indefinite number of shares authorized with a $0.01 par value.
| (2) | Summary of significant accounting policies: |
The following is a summary of significant accounting policies of the Funds in effect during the period covered by the financial statements, which are in accordance with U.S. generally accepted accounting principles.
| | (a) | Security valuation – The net asset value (“NAV”) of the shares of each class of each Fund was determined as of the close of regular session trading on the |
62
SIXTY-TWO
NOTES TO FINANCIAL STATEMENTS
| | New York Stock Exchange (“NYSE”) (usually 3:00 p.m., Central time, but sometimes earlier) each day the NYSE was open for regular session trading. The NAV of each class of shares was determined by dividing the value of each Fund’s securities and other assets attributed to that class, less its liabilities attributed to that class, by the number of outstanding shares of that class of that Fund. |
In determining NAV, each equity security traded on a securities exchange, including the Nasdaq Stock Market, was valued at the closing price as of the time of valuation on the exchange or market on which the security was principally traded (the “principal exchange”). The closing price provided by each exchange may differ and may represent information such as last sales price, an official closing price, a closing auction price or other information, depending on exchange or market convention. Absent closing price information for a security from the principal exchange as of the time of valuation, the security was valued using the most recent bid quotation on the principal exchange, except that securities listed on the London Stock Exchange were valued at the mean of the most recent bid and asked quotations as of the time of valuation. Short-term investments maturing within sixty days of the valuation date were valued at amortized cost, which approximates market.
Securities for which prices were not readily available were valued by the Funds’ valuation committee (the “valuation committee”) at a fair value determined in good faith under procedures established by and under the general supervision of Artisan Funds’ Board of Directors (the “Board of Directors”). A price was considered not to be readily available if, among other things, the valuation committee believed that the price determined as described in the preceding paragraph did not reflect a fair value of the security.
International Fund, International Small Cap Fund and International Value Fund generally invest a significant portion, and perhaps as much as substantially all, of their total assets in securities principally traded in markets outside the U.S. Each of the other Funds has the ability to invest in securities principally traded outside the U.S., but did not do so in the period covered by these financial statements. The foreign markets in which the Funds may invest are sometimes open on days when the NYSE is not open and the Funds do not calculate their NAVs, and sometimes are not open on days when the Funds do calculate their NAVs. Even on days on which both the foreign market and the NYSE are open, several hours may have passed between the time when trading in the foreign market closed and the time as of which the Funds calculate their NAVs. That is generally the case for markets in Europe,
63
SIXTY-THREE
NOTES TO FINANCIAL STATEMENTS
Asia, Australia and other far eastern markets; the regular closing time of foreign markets in North and South America is generally the same as the closing time of the NYSE and the time as of which the Funds calculate their NAVs.
The valuation committee concluded that a price determined under the Funds’ valuation procedures was not readily available if, among other things, the valuation committee believed that the value of the security might have been materially affected by events occurring after the close of the market in which the security was principally traded but before the time for determination of NAV (“subsequent event”). A subsequent event might include a company-specific development (for example, announcement of a merger that is made after the close of the foreign market), a development that might affect an entire market or region (for example, imposition of foreign exchange controls by a foreign government) or a potentially global development (such as a terrorist attack that may be expected to have an impact on investor expectations worldwide). Artisan Funds monitored for subsequent events using several tools, including reviewing changes in certain U.S. market indexes and, before May 19, 2004, a statistical model developed by a third party used by the Funds to make broad projections of NAV fluctuation based on changes in certain U.S. market indexes and securities prices weighted to reflect each Fund’s geographic weightings. An indication by any of those tools of a potential material change in the value of securities resulted in a meeting of the valuation committee, which considered whether a subsequent event had occurred and whether local market closing prices continued to represent fair values for potentially affected non-U.S. securities. Effective May 19, 2004, a third party research service was retained to assist in determining estimates of fair values for foreign securities. That service utilized statistical data based on historical performance of securities, markets and other data in developing factors used to estimate a fair value.
Estimates of fair values utilized by the Funds as described above may differ from the value realized on the sale of those securities and the differences may be material to the NAV of the applicable Fund or to the financial statements presented.
| | (b) | Income taxes – No provision has been made for federal income taxes since each Fund intends to (i) comply with the provisions of subchapter M of the Internal Revenue Code applicable to regulated investment companies and (ii) distribute to its shareholders substantially all of its taxable income as well as net realized gains from the sale of investment securities. The Funds may utilize earnings and profits distributed to shareholders on redemptions of Fund shares as part of the dividends paid deduction. |
64
SIXTY-FOUR
NOTES TO FINANCIAL STATEMENTS
| | (c) | Portfolio transactions – Security and shareholder transactions are recorded on trade date. Net realized gains and losses on securities are computed on specific security lot identification. |
| | (d) | Foreign currency translation – Values of investments and other assets and liabilities denominated in foreign currencies were converted into U.S. dollars using a spot market rate of exchange as of noon (eastern time) on the day of valuation, unless the valuation committee determined that exchange rates as of that time did not fairly reflect exchange rates as of the time of calculation of the Funds’ NAV. Purchases and sales of investments and dividend and interest income are translated into U.S. dollars using a spot market rate of exchange prevailing on the respective dates of such transactions. The portion of security gains or losses resulting from changes in foreign exchange rates is included with net realized and unrealized gain or loss from investments, as appropriate, for both financial reporting and tax purposes. |
International Fund, International Small Cap Fund and International Value Fund may enter into foreign currency forward contracts to hedge the foreign currency exposure on open payables and receivables. The foreign currency forward contracts are recorded at market value and any related realized and unrealized gains and losses are reported as foreign currency related transactions for financial reporting purposes. For tax purposes, these foreign exchange gains and losses are treated as ordinary income or loss. International Fund, International Small Cap Fund and International Value Fund could be exposed to loss if the counterparties fail to perform under these contracts.
Other foreign currency related transaction gains and losses may result from currency gains and losses realized from the difference between the amounts of dividends and foreign withholding taxes recorded on the Funds’ books and the U.S. dollar equivalent of the amounts actually received or paid. The net increase (decrease) in unrealized appreciation or depreciation on foreign currency related transactions arise from changes in the values of assets and liabilities, other than investments in securities, resulting from changes in foreign exchange rates.
| | (e) | Repurchase agreements – Each Fund may enter into repurchase agreements with institutions that Artisan Partners Limited Partnership (“the Adviser”) has determined are creditworthy pursuant to criteria adopted by the Board of Directors. Repurchase agreements are recorded at cost plus accrued interest and are collateralized in an amount greater than or equal to the repurchase price plus accrued interest. If the proceeds from any sale of such collateral upon a default on the obligation to repurchase were less than the repurchase price, the Fund would suffer a loss. |
65
SIXTY-FIVE
NOTES TO FINANCIAL STATEMENTS
| | (f) | Securities lending – Each Fund may enter into securities lending transactions with borrowers approved by the Board of Directors. During the year ended September 30, 2004, International Fund earned $2,820,813 from securities lending transactions. As of September 30, 2004, there were no securities on loan. Each Fund’s risks in entering into securities lending arrangements are that the borrower may not provide additional collateral when required or return the securities when due, or, if the borrower defaults, the Fund may experience delays in selling collateral or the collateral may not be sufficient to cover the value of securities lent. |
| | (g) | Commission recapture – Each of the Funds may direct portfolio trades, subject to obtaining best price and execution, to various brokers who have agreed to rebate a portion of the commissions generated. Such rebates are made directly to the applicable Fund as cash payments and are included in net realized gain or loss on investments in the Statements of Operations as follows: |
| | | |
International | | $ | 3,277,082 |
International Small Cap | | | 268,571 |
International Value | | | 72,724 |
Mid Cap | | | 882,381 |
Mid Cap Value | | | 17,161 |
Small Cap | | | 57,816 |
Small Cap Value | | | 156,590 |
| | (h) | Use of estimates – The preparation of financial statements in conformity with U.S. generally accepted accounting principles requires management to make estimates and assumptions that affect the reported amounts and disclosures in the financial statements. Actual results could differ from those estimates. |
| | (i) | Indemnifications – In the normal course of business, the Funds enter into contracts in which the Funds agree to indemnify the other party or parties against various potential costs or liabilities. The Funds’ maximum exposure under these arrangements is unknown. No claim has been made for indemnification pursuant to any such agreement. |
| | (j) | Other – Dividend income less foreign taxes withheld, if any, is recorded on the ex-dividend date, except that certain dividends from private placements and foreign securities are recorded as soon after the ex-dividend date as the information becomes available to the Funds. Interest income is reported on the accrual basis. Distributions to shareholders are recorded on the ex-dividend date. Expenses attributable to the Artisan Funds are generally allocated to each Fund based on net assets. Expenses attributable to a particular Fund are allocated directly to that Fund. |
66
SIXTY-SIX
NOTES TO FINANCIAL STATEMENTS
The character of income and net realized gains and losses may differ for financial statement and tax purposes and may result in reclassification of permanent differences among certain capital accounts to more appropriately conform financial accounting to tax characterizations of dividend distributions.
International Fund, International Small Cap Fund and International Value Fund generally impose a 2% redemption fee on shares held 90 days or less. Those redemption fees are recorded as a reduction in the cost of shares redeemed and have the primary effect of increasing paid-in capital.
| (3) | Transactions with affiliates: |
The Adviser, with which the officers and certain directors of Artisan Funds are affiliated, provides investment advisory and administrative services to the Funds. In exchange for those services, each Fund (with the exception of International Small Cap Fund) pays a monthly management fee to the Adviser as follows:
| | | | | |
Average Daily Net Assets
| | | | Annual Rate
| |
Less than $500 million | | | | 1.000 | % |
$500 million to $750 million | | | | 0.975 | |
$750 million to $1 billion | | | | 0.950 | |
Greater than $1 billion | | | | 0.925 | |
International Small Cap Fund pays a monthly management fee to the Adviser at an annual rate of 1.250% of average daily net assets.
Shares of Artisan Funds are offered for sale by Artisan Distributors LLC (“Distributors”). Distributors is wholly owned by the Adviser. All distribution expenses relating to the Funds are paid by the Adviser.
Each Fund also incurs other expenses for services such as maintaining shareholder records and furnishing shareholder statements and reports. The Adviser has voluntarily undertaken to waive or reimburse International Value Fund for any ordinary operating expenses in excess of 2.00% of average daily net assets, annually.
Each director who is not an interested person of Artisan Funds or the Adviser received an annual retainer of $60,000, plus a fee for each board or committee meeting attended (other than a committee meeting held on the same day as a board meeting) of $3,000 for an in-person meeting and $500 for a telephonic meeting, as well as reimbursement of expenses related to his duties as a director of Artisan Funds. In addition, each chairman of a board committee who is a non-interested director and each non-interested director performing services deemed
67
SIXTY-SEVEN
NOTES TO FINANCIAL STATEMENTS
by the Board of Directors to be substantially equivalent to those of a committee chair received a supplemental annual retainer of $5,000. Those fees were generally allocated to each Fund based on net assets.
| (4) | Line of credit arrangements: |
Artisan Funds is party to a line of credit agreement with State Street Bank and Trust Company, under which each Fund may borrow up to the lesser of (a) $75 million or (b) the lesser of (i) 10% of its total assets (after giving effect to the loan) or (ii) the maximum amount the Fund may borrow under the Investment Company Act, the limitations included in the Fund’s prospectus, or any limit or restriction under any law or regulation to which the Fund is subject or any agreement to which the Fund or Artisan Funds is a party; provided that the aggregate borrowings by all Funds may not exceed $100 million. Artisan Funds pays a commitment fee at the annual rate of 0.10% on the unused portion of the line of credit. Interest is charged on any borrowings at the current Federal Funds rate plus 0.50%. The use of the line of credit is generally restricted to temporary borrowing for extraordinary or emergency purposes. There were minimal borrowings under the line of credit during the year ended September 30, 2004.
| (5) | Investment transactions: |
The cost of securities purchased and the proceeds from the sale of securities (excluding short-term securities) for the year ended September 30, 2004 were as follows:
| | | | | | |
| Fund | | Security Purchases | | Security Sales |
International | | $ | 5,254,614,327 | | $ | 5,803,949,808 |
International Small Cap | | | 417,550,787 | | | 407,538,756 |
International Value | | | 180,306,989 | | | 14,645,002 |
Mid Cap | | | 5,499,926,725 | | | 4,433,180,680 |
Mid Cap Value | | | 261,203,626 | | | 74,120,946 |
Small Cap | | | 276,290,114 | | | 195,618,275 |
Small Cap Value | | | 557,414,704 | | | 400,535,638 |
68
SIXTY-EIGHT
NOTES TO FINANCIAL STATEMENTS
| (6) | Transactions in securities of affiliates: |
If one or more of the Funds owns, in the aggregate, 5% or more of the outstanding voting securities of a portfolio company, that company is deemed to be an affiliate of the Funds under the Investment Company Act of 1940. During the year ended September 30, 2004, the Funds held securities of affiliates or purchased and sold securities of affiliates in open market transactions and received dividends from affiliates as summarized below:
| | | | | | | | | | | | | | | | | | | | | | |
Fund | | Security | | Share
Balance
9/30/03 | | Purchase
Cost | | Sales
Cost | | Net
Realized
Gain (Loss) | | | Dividend
Income | | As of 9/30/04 |
| | | | | | | | Share
Balance | | Value |
International | | Clariant AG | | 8,999,193 | | $ | 52,219,024 | | $ | 18,846,723 | | $ | (7,923,084 | ) | | $ | 1,143,704 | | 13,411,333 | | $ | 160,753,200 |
| | | Imperial Chemical Industries PLC(1) | | 59,764,246 | | | - | | | 121,455,540 | | | (25,462,736 | ) | | | 5,482,303 | | 33,483,520 | | | 127,855,664 |
| | | Rhodia S.A.(1) | | 9,177,312 | | | - | | | 80,897,347 | | | (54,600,442 | ) | | | - | | - | | | - |
International Small Cap | | Banco Latinoamericano de Exportaciones, S.A.,
E Shares(1) | | 1,458,614 | | | 2,166,081 | | | 1,137,258 | | | (401,045 | ) | | | 2,066,719 | | 1,541,014 | | | 23,654,565 |
| | | Clariant AG | | 265,600 | | | 1,877,918 | | | 5,059,810 | | | 1,535,806 | | | | 40,022 | | - | | | - |
| | | Fine Tec Corporation(2) | | - | | | 6,126,006 | | | - | | | - | | | | 130,648 | | 1,201,124 | | | 4,902,547 |
International Value | | Clariant AG | | - | | | 6,559,628 | | | - | | | - | | | | - | | 529,280 | | | 6,344,146 |
Small Cap Value | | Cellstar Corporation(2)(3) | | - | | | 6,859,185 | | | - | | | - | | | | - | | 1,194,400 | | | 5,445,270 |
| | | National Dentex Corporation(3) | | 189,900 | | | 864,897 | | | - | | | - | | | | - | | 229,200 | | | 6,458,856 |
| | | Pico Holdings, Inc.(2)(3) | | 550,800 | | | 2,459,476 | | | - | | | - | | | | - | | 703,100 | | | 13,379,993 |
| | | Stewart Information Services Corporation(2) | | 737,600 | | | 9,553,761 | | | 432,970 | | | 11,901 | | | | 381,846 | | 1,005,300 | | | 39,608,820 |
| | (1) | Issuer was no longer an affiliate as of September 30, 2004. |
| | (2) | Issuer was not an affiliate as of September 30, 2003. |
| | (3) | Non-income producing security. |
69
SIXTY-NINE
NOTES TO FINANCIAL STATEMENTS
| (7) | Information for Federal income tax purposes: |
| | | | | | | | | | | | | | | | | | | |
Fund | | Cost of
Investments | | Gross
Unrealized
Appreciation | | Gross
Unrealized
Depreciation | | | Net
Unrealized
Appreciation
(Depreciation)
on
Investments | | 9/30/04 |
| | | | | | Undistributed
Ordinary
Income | | Undistributed
Long-Term
Gain |
International | | $ | 8,554,931,114 | | $ | 1,599,836,484 | | $ | (451,572,119 | ) | | $ | 1,148,264,365 | | $ | 69,318,695 | | $ | - |
International Small Cap | | | 429,499,058 | | | 104,834,599 | | | (15,023,712 | ) | | | 89,810,887 | | | 38,628,418 | | | 19,236,544 |
International Value | | | 198,969,060 | | | 21,016,125 | | | (4,273,559 | ) | | | 16,742,566 | | | 3,704,544 | | | 1,336,782 |
Mid Cap | | | 4,507,234,051 | | | 725,808,221 | | | (150,943,912 | ) | | | 574,864,309 | | | - | | | - |
Mid Cap Value | | | 281,056,170 | | | 35,293,899 | | | (3,852,625 | ) | | | 31,441,274 | | | 5,458,103 | | | 4,784,724 |
Small Cap | | | 216,464,654 | | | 27,032,832 | | | (6,653,435 | ) | | | 20,379,397 | | | - | | | 9,932,799 |
Small Cap Value | | | 955,034,493 | | | 285,080,404 | | | (29,230,856 | ) | | | 255,849,548 | | | 28,429,410 | | | 78,006,562 |
The difference between cost amounts for financial reporting and tax purposes is due primarily to timing differences in recognizing certain gains and losses on security transactions.
The tax basis of dividends and long-term capital gain distributions paid during the fiscal years ended September 30, 2004 and June 30, 2003, capital loss carryovers as of September 30, 2004 and capital loss carryovers utilized during the year ended September 30, 2004, and tax basis post-October loss deferrals as of September 30, 2004 (recognized for tax purposes on October 1, 2004) were as follows:
| | | | | | | | | | | | | | | | | | | | | | | |
| | | Year Ended 9/30/04 | | Year Ended 6/30/03 | | As of 9/30/04 | | Year Ended 9/30/04 |
| Fund | | Ordinary Income Dividends | | Long-Term Capital Gain Distributions | | Ordinary Income Dividends | | Long-Term Capital Gain Distributions | | Net Capital
Loss Carryforward(1) | | Capital Loss Carryforward Expiration | | Capital Loss Carryforward Utilized | | Post-October
Losses |
International | | $ | 101,887,899 | | $ | - | | $ | 50,243,215 | | $ | - | | $ | 74,827,358 | | 2008 | | $ | 41,400,656 | | $ | 101,585,966 |
| | | | | | | | | | | | | | | | 694,241,382 | | 2009 | | | | | | |
| | | | | | | | | | | | | | | | 384,841,928 | | 2010 | | | | | | |
| | | | | | | | | | | | | | | | 202,299,105 | | 2011 | | | | | | |
International Small Cap | | | 12,868,474 | | | 3,959,034 | | | 236,073 | | | - | | | - | | | | | - | | | 277,712 |
International Value(2) | | | 828,575 | | | - | | | - | | | - | | | - | | | | | - | | | 39,888 |
Mid Cap | | | - | | | - | | | - | | | - | | | 178,503,906 | | 2010 | | | 321,169,449 | | | - |
Mid Cap Value | | | 920,430 | | | 679,381 | | | - | | | - | | | - | | | | | - | | | - |
Small Cap | | | - | | | - | | | - | | | 629,095 | | | - | | | | | 17,550,585 | | | - |
Small Cap Value | | | 2,241,194 | | | 9,542,404 | | | 6,321,911 | | | 16,278,465 | | | - | | | | | 1,664,820 | | | - |
| | (1) | Capital gain distributions will resume in the future to the extent gains are realized in excess of the available carryforwards. |
| | (2) | Commencement of operations – September 23, 2002. |
There were no dividends or long-term capital gain distributions paid during the period ended September 30, 2003.
70
SEVENTY
NOTES TO FINANCIAL STATEMENTS
[THIS PAGE INTENTIONALLY LEFT BLANK]
71
SEVENTY-ONE
NOTES TO FINANCIAL STATEMENTS
| (8) | Fund share activities: |
Capital share transactions for the Funds were as follows:
| | | | | | | | | | | | |
| | | INTERNATIONAL
| | | INTERNATIONAL
SMALL CAP
| |
Year ended September 30, 2004
| | Investor Shares
| | | Institutional Shares
| | | Investor
Shares
| |
Proceeds from shares issued | | $ | 2,536,272,455 | | | $ | 334,559,000 | | | $ | 193,292,258 | |
Net asset value of shares issued in reinvestment of dividends and distributions | | | 54,531,342 | | | | 38,442,969 | | | | 16,704,120 | |
Cost of shares redeemed(1) | | | (2,903,431,496 | ) | | | (658,297,737 | ) | | | (166,988,190 | ) |
| | |
|
|
| |
|
|
| |
|
|
|
Net increase (decrease) from fund share transactions | | $ | (312,627,699 | ) | | $ | (285,295,768 | ) | | $ | 43,008,188 | |
| | |
|
|
| |
|
|
| |
|
|
|
| | | |
Shares sold | | | 134,972,302 | | | | 17,620,515 | | | | 12,511,213 | |
Shares issued in reinvestment of dividends and distributions | | | 3,107,199 | | | | 2,183,019 | | | | 1,141,772 | |
Shares redeemed | | | (156,104,065 | ) | | | (35,129,349 | ) | | | (10,515,918 | ) |
| | |
|
|
| |
|
|
| |
|
|
|
Net increase (decrease) in capital shares | | | (18,024,564 | ) | | | (15,325,815 | ) | | | 3,137,067 | |
| | |
|
|
| |
|
|
| |
|
|
|
| | |
| | | INTERNATIONAL
| | | INTERNATIONAL
SMALL CAP
| |
Period ended September 30, 2003
| | Investor Shares
| | | Institutional Shares
| | | Investor
Shares
| |
Proceeds from shares issued | | $ | 1,653,682,408 | | | $ | 222,370,761 | | | $ | 118,234,351 | |
Net asset value of shares issued in reinvestment of dividends and distributions | | | - | | | | - | | | | - | |
Cost of shares redeemed(2) | | | (1,607,024,622 | ) | | | (24,062,048 | ) | | | (7,725,918 | ) |
| | |
|
|
| |
|
|
| |
|
|
|
Net increase (decrease) from fund share transactions | | $ | 46,657,786 | | | $ | 198,308,713 | | | $ | 110,508,433 | |
| | |
|
|
| |
|
|
| |
|
|
|
| | | |
Shares sold | | | 102,140,758 | | | | 13,738,314 | | | | 9,146,005 | |
Shares issued in reinvestment of dividends and distributions | | | - | | | | - | | | | - | |
Shares redeemed | | | (98,579,720 | ) | | | (1,477,132 | ) | | | (592,457 | ) |
| | |
|
|
| |
|
|
| |
|
|
|
Net increase (decrease) in capital shares | | | 3,561,038 | | | | 12,261,182 | | | | 8,553,548 | |
| | |
|
|
| |
|
|
| |
|
|
|
| (1) | Net of redemption fees of $74,205, $41,388, $207,006 and $11,254 for International-Investor Shares, International-Institutional Shares, International Small Cap and International Value, respectively. |
| (2) | Net of redemption fees of $48,643 and $509 for International Small Cap and International Value, respectively. |
72
SEVENTY-TWO
NOTES TO FINANCIAL STATEMENTS
| | | | | | | | | | | | | | | | | | | | | | |
INTERNATIONAL
VALUE
| | | MID CAP
| | | MID CAP
VALUE
| | | SMALL CAP
| | | SMALL CAP
VALUE
| |
Investor
Shares
| | | Investor
Shares
| | | Institutional
Shares
| | | Investor
Shares
| | | Investor
Shares
| | | Investor
Shares
| |
| $ | 199,024,062 | | | $ | 1,972,432,516 | | | $ | 69,966,247 | | | $ | 229,241,036 | | | $ | 119,391,774 | | | $ | 368,267,157 | |
| | 788,115 | | | | - | | | | - | | | | 1,567,572 | | | | - | | | | 10,992,907 | |
| | (23,582,394 | ) | | | (855,149,594 | ) | | | (91,122,442 | ) | | | (28,078,509 | ) | | | (35,223,082 | ) | | | (201,938,794 | ) |
|
|
| |
|
|
| |
|
|
| |
|
|
| |
|
|
| |
|
|
|
| $ | 176,229,783 | | | $ | 1,117,282,922 | | | $ | (21,156,195 | ) | | $ | 202,730,099 | | | $ | 84,168,692 | | | $ | 177,321,270 | |
|
|
| |
|
|
| |
|
|
| |
|
|
| |
|
|
| |
|
|
|
| | | | | |
| | 11,382,724 | | | | 75,836,138 | | | | 2,793,091 | | | | 15,586,699 | | | | 8,008,103 | | | | 22,595,547 | |
| | 52,262 | | | | - | | | | - | | | | 121,706 | | | | - | | | | 747,308 | |
| | (1,350,339 | ) | | | (32,884,883 | ) | | | (3,449,277 | ) | | | (1,960,621 | ) | | | (2,368,256 | ) | | | (12,359,689 | ) |
|
|
| |
|
|
| |
|
|
| |
|
|
| |
|
|
| |
|
|
|
| | 10,084,647 | | | | 42,951,255 | | | | (656,186 | ) | | | 13,747,784 | | | | 5,639,847 | | | | 10,983,166 | |
|
|
| |
|
|
| |
|
|
| |
|
|
| |
|
|
| |
|
|
|
| | | | |
INTERNATIONAL
VALUE
| | | MID CAP
| | | MID CAP
VALUE
| | | SMALL CAP
| | | SMALL CAP
VALUE
| |
Investor
Shares
| | | Investor
Shares
| | | Institutional
Shares
| | | Investor
Shares
| | | Investor
Shares
| | | Investor
Shares
| |
| $ | 5,774,285 | | | $ | 320,410,216 | | | $ | 56,462,660 | | | $ | 15,855,003 | | | $ | 10,625,353 | | | $ | 74,751,717 | |
| | - | | | | - | | | | - | | | | - | | | | - | | | | - | |
| | (341,232 | ) | | | (161,733,175 | ) | | | (6,856,490 | ) | | | (6,347,808 | ) | | | (4,865,543 | ) | | | (29,674,829 | ) |
|
|
| |
|
|
| |
|
|
| |
|
|
| |
|
|
| |
|
|
|
| $ | 5,433,053 | | | $ | 158,677,041 | | | $ | 49,606,170 | | | $ | 9,507,195 | | | $ | 5,759,810 | | | $ | 45,076,888 | |
|
|
| |
|
|
| |
|
|
| |
|
|
| |
|
|
| |
|
|
|
| | | | | |
| | 421,672 | | | | 13,957,902 | | | | 2,468,566 | | | | 1,323,657 | | | | 839,721 | | | | 5,442,976 | |
| | - | | | | - | | | | - | | | | - | | | | - | | | | - | |
| | (25,017 | ) | | | (7,041,572 | ) | | | (296,096 | ) | | | (529,220 | ) | | | (385,700 | ) | | | (2,163,557 | ) |
|
|
| |
|
|
| |
|
|
| |
|
|
| |
|
|
| |
|
|
|
| | 396,655 | | | | 6,916,330 | | | | 2,172,470 | | | | 794,437 | | | | 454,021 | | | | 3,279,419 | |
|
|
| |
|
|
| |
|
|
| |
|
|
| |
|
|
| |
|
|
|
73
SEVENTY-THREE
NOTES TO FINANCIAL STATEMENTS
| (8) | Fund share activities (continued): |
| | | | | | | | | | | | | | |
| | | INTERNATIONAL
| | | INTERNATIONAL
SMALL CAP
| | |
|
Year ended June 30, 2003
| | Investor Shares
| | | Institutional Shares
| | | Investor
Shares
| | |
|
Proceeds from shares issued | | $ | 6,609,449,427 | | | $ | 1,265,372,555 | | | $ | 156,597,326 | | | |
Net asset value of shares issued in reinvestment of dividends and distributions | | | 29,416,168 | | | | 16,663,234 | | | | 233,838 | | | |
Cost of shares redeemed(3) | | | (6,063,741,583 | ) | | | (141,139,765 | ) | | | (24,518,197 | ) | | |
| | |
|
|
| |
|
|
| |
|
|
| |
|
Net increase (decrease) from fund share transactions | | $ | 575,124,012 | | | $ | 1,140,896,024 | | | $ | 132,312,967 | | | |
| | |
|
|
| |
|
|
| |
|
|
| |
|
| | | | |
Shares sold | | | 448,720,763 | | | | 84,658,208 | | | | 15,036,137 | | | |
Shares issued in reinvestment of dividends and distributions | | | 1,986,215 | | | | 1,121,348 | | | | 24,615 | | | |
Shares redeemed | | | (410,530,756 | ) | | | (9,434,864 | ) | | | (2,445,304 | ) | | |
| | |
|
|
| |
|
|
| |
|
|
| |
|
Net increase (decrease) in capital shares | | | 40,176,222 | | | | 76,344,692 | | | | 12,615,448 | | | |
| | |
|
|
| |
|
|
| |
|
|
| |
|
| (3) | Net of redemption fees of $76,057 and $578 for International Small Cap and International Value, respectively. |
| (4) | For the period from commencement of operations (September 23, 2002) to June 30, 2003. |
Artisan Funds and the Adviser are defendants in a lawsuit that seeks certification of a plaintiff class consisting of all persons in the United States who held shares in International Fund for a period of more than 14 days during the five years prior to the filing of the lawsuit. The suit seeks compensatory and punitive damages, as well as interest, costs and attorney’s fees. The lawsuit alleges, in summary, that Artisan Funds and the Adviser exposed long-term International Fund shareholders to trading by market timers by allegedly (a) failing to properly evaluate daily whether a significant event affecting the value of International Fund’s securities had occurred after foreign markets had closed but before the calculation of the Fund’s NAV; (b) failing to implement the Fund’s portfolio valuation and share pricing policies and procedures; (c) allowing portfolio valuation and share policies and procedures that benefited market timers at the expense of long-term shareholders; and (d) failing to know and implement applicable rules and regulations concerning the calculation of NAV. Artisan Funds and the Adviser intend to defend the lawsuit vigorously. Legal fees incurred by Artisan Funds in defense of the lawsuit have been allocated to International Fund and are included in Professional fees in the Statement of Operations. Artisan Funds does not believe that the pending action will have a material effect on the financial condition of any Fund.
74
SEVENTY-FOUR
NOTES TO FINANCIAL STATEMENTS
| | | | | | | | | | | | | | | | | | | | | | |
INTERNATIONAL
VALUE(4)
| | | MID CAP
| | | MID CAP
VALUE
| | | SMALL CAP
| | | SMALL CAP
VALUE
| |
Investor
Shares
| | | Investor
Shares
| | | Institutional
Shares
| | | Investor
Shares
| | | Investor
Shares
| | | Investor
Shares
| |
| $ | 14,046,764 | | | $ | 1,165,389,769 | | | $ | 364,499,717 | | | $ | 48,987,982 | | | $ | 53,637,048 | | | $ | 218,256,845 | |
| | - | | | | - | | | | - | | | | - | | | | 615,881 | | | | 21,684,627 | |
| | (266,341 | ) | | | (740,991,149 | ) | | | (18,264,478 | ) | | | (12,530,971 | ) | | | (66,435,862 | ) | | | (153,690,612 | ) |
|
|
| |
|
|
| |
|
|
| |
|
|
| |
|
|
| |
|
|
|
| $ | 13,780,423 | | | $ | 424,398,620 | | | $ | 346,235,239 | | | $ | 36,457,011 | | | $ | (12,182,933 | ) | | $ | 86,250,860 | |
|
|
| |
|
|
| |
|
|
| |
|
|
| |
|
|
| |
|
|
|
| | | | | |
| | 1,275,274 | | | | 58,902,392 | | | | 18,444,267 | | | | 4,746,201 | | | | 5,277,657 | | | | 18,453,943 | |
| | - | | | | - | | | | - | | | | - | | | | 62,909 | | | | 1,946,555 | |
| | (23,302 | ) | | | (37,879,947 | ) | | | (921,013 | ) | | | (1,238,891 | ) | | | (6,597,238 | ) | | | (13,245,797 | ) |
|
|
| |
|
|
| |
|
|
| |
|
|
| |
|
|
| |
|
|
|
| | 1,251,972 | | | | 21,022,445 | | | | 17,523,254 | | | | 3,507,310 | | | | (1,256,672 | ) | | | 7,154,701 | |
|
|
| |
|
|
| |
|
|
| |
|
|
| |
|
|
| |
|
|
|
75
SEVENTY-FIVE
Report of Independent Registered Public Accounting Firm
To the Board of Directors and Shareholders of Artisan Funds, Inc.
We have audited the accompanying statements of assets and liabilities, including the schedules of investments, of Artisan Funds, Inc., comprising Artisan International Fund, Artisan International Small Cap Fund, Artisan International Value Fund, Artisan Mid Cap Fund, Artisan Mid Cap Value Fund, Artisan Small Cap Fund and Artisan Small Cap Value Fund (the “Funds”) as of September 30, 2004, and the related statements of operations for the year then ended, and the statements of changes in net assets and the financial highlights for the year then ended and for the period from July 1, 2003 to September 30, 2003. These financial statements and financial highlights are the responsibility of the Funds’ management. Our responsibility is to express an opinion on these financial statements and financial highlights based on our audits. The statements of changes in net assets and the financial highlights of the Funds for the periods ended prior to September 30, 2003, were audited by other auditors whose report dated July 31, 2003, expressed an unqualified opinion on those statements of changes in net assets and financial highlights.
We conducted our audits in accordance with the standards of the Public Company Accounting Oversight Board (United States). Those standards require that we plan and perform the audit to obtain reasonable assurance about whether the financial statements and financial highlights are free of material misstatement. An audit includes examining, on a test basis, evidence supporting the amounts and disclosures in the financial statements and financial highlights. Our procedures included confirmation of securities owned as of September 30, 2004, by correspondence with the custodian and brokers or by other appropriate auditing procedures where replies from brokers were not received. An audit also includes assessing the accounting principles used and significant estimates made by management, as well as evaluating the overall financial statement presentation. We believe that our audits provide a reasonable basis for our opinion.
In our opinion, the financial statements and financial highlights referred to above present fairly, in all material respects, the financial position of each of the Funds constituting Artisan Funds, Inc. at September 30, 2004, the results of their operations for the year then ended, and the changes in their net assets and the financial highlights for the year then ended and for the period from July 1, 2003 to September 30, 2003, in conformity with U.S. generally accepted accounting principles.

Milwaukee, Wisconsin
November 4, 2004
76
SEVENTY-SIX
NOTES TO FINANCIAL STATEMENTS
Other Federal tax information (unaudited):
The Internal Revenue Code requires that shareholders be notified within 60 days of the Funds’ fiscal year-end of certain information regarding long-term capital gains, qualified dividend income, the dividends received deduction for corporate shareholders and the foreign tax credit. This data is informational only. Every year in January, shareholders are sent a Form 1099-DIV which provides the federal tax status of dividends and distributions received during the calendar year. Shareholders are advised to consult their own tax advisor with respect to the specific tax consequences of investment in the Funds.
Each Fund hereby designates the following amounts as (i) long-term capital gain distributions for purposes of the dividends paid deduction (including earnings and profits distributed to shareholders on redemption of Fund shares), and (ii) the amount of ordinary dividends paid during the fiscal year ended September 30, 2004 that are considered qualified dividend income as defined in the Jobs and Growth Tax Relief Reconciliation Act of 2003.
| | | | | | |
| Fund | | Long-Term Capital Gains | | Qualified Dividend Income | |
International | | $ | - | | 100.00 | % |
International Small Cap | | | 6,154,479 | | 37.44 | |
International Value | | | 78,553 | | 36.53 | |
Mid Cap | | | - | | - | |
Mid Cap Value | | | 908,187 | | 65.99 | |
Small Cap | | | 97,669 | | - | |
Small Cap Value | | | 13,189,014 | | 84.17 | |
For the year ended September 30, 2004, of the ordinary income dividends paid by Mid Cap Value Fund and Small Cap Value Fund, 45% and 30%, respectively, are eligible for the dividends received deduction available to certain corporate shareholders.
During the year ended September 30, 2004, International Fund, International Small Cap Fund and International Value Fund generated $200,513,212, $14,529,150 and $3,549,164 of foreign source income on which $23,603,794, $1,407,376 and $332,729 of foreign taxes were paid, respectively. International Fund, International Small Cap Fund and International Value Fund elect to pass foreign taxes through to shareholders for their 2004 tax returns. The Funds will provide final information with Form 1099 in January 2005 to permit shareholders either to claim a foreign tax credit or to take a deduction for foreign taxes paid on shareholders’ 2004 income tax returns. For the year ended September 30, 2004 the gross income and related foreign taxes paid by country were as follows (in each case, expressed as a percentage of total income and total qualified foreign taxes paid, respectively):
| | | | | | | | | | | | | | | | | | |
| | | International
| | | International Small Cap
| | | International Value
| |
| | | Income | | | Foreign Tax | | | Income | | | Foreign Tax | | | Income | | | Foreign Tax | |
Australia | | 1.95 | % | | 0.00 | % | | 6.65 | % | | 1.50 | % | | 1.50 | % | | 0.00 | % |
Austria | | 0.09 | | | 0.11 | | | 0.90 | | | 1.40 | | | 0.00 | | | 0.00 | |
Belgium | | 1.04 | | | 1.35 | | | 2.09 | | | 3.25 | | | 0.00 | | | 0.00 | |
Brazil | | 3.18 | | | 3.87 | | | 0.89 | | | 0.21 | | | 0.00 | | | 0.00 | |
Canada | | 0.88 | | | 1.14 | | | 0.10 | | | 0.16 | | | 0.00 | | | 0.00 | |
Chile | | 0.00 | | | 0.00 | | | 0.24 | | | 0.00 | | | 0.00 | | | 0.00 | |
China | | 1.48 | | | 0.00 | | | 0.41 | | | 0.00 | | | 0.00 | | | 0.00 | |
77
SEVENTY-SEVEN
NOTES TO FINANCIAL STATEMENTS
Other Federal tax information (unaudited) (continued):
| | | | | | | | | | | | | | | | | | |
| | | International
| | | International Small Cap
| | | International Value
| |
| | | Income | | | Foreign Tax | | | Income | | | Foreign Tax | | | Income | | | Foreign Tax | |
Colombia | | 0.00 | % | | 0.00 | % | | 0.71 | % | | 0.00 | % | | 0.00 | % | | 0.00 | % |
Czech Republic | | 2.24 | | | 2.90 | | | 0.00 | | | 0.00 | | | 0.00 | | | 0.00 | |
Denmark | | 0.75 | | | 0.97 | | | 0.99 | | | 1.55 | | | 0.00 | | | 0.00 | |
Finland | | 0.47 | | | 0.61 | | | 0.00 | | | 0.00 | | | 0.00 | | | 0.00 | |
France | | 2.63 | | | 3.40 | | | 4.75 | | | 7.33 | | | 3.70 | | | 6.30 | |
Germany | | 8.52 | | | 11.02 | | | 2.03 | | | 3.15 | | | 4.15 | | | 7.06 | |
Greece | | 0.00 | | | 0.00 | | | 0.23 | | | 0.00 | | | 0.00 | | | 0.00 | |
Hong Kong | | 1.33 | | | 0.00 | | | 7.84 | | | 0.00 | | | 1.71 | | | 0.00 | |
India | | 0.00 | | | 0.00 | | | 0.01 | | | 0.00 | | | 0.00 | | | 0.00 | |
Italy | | 2.39 | | | 3.09 | | | 6.65 | | | 6.04 | | | 5.99 | | | 1.21 | |
Japan | | 7.05 | | | 4.34 | | | 1.57 | | | 1.14 | | | 6.32 | | | 5.05 | |
Luxembourg | | 0.40 | | | 0.53 | | | 0.00 | | | 0.00 | | | 0.00 | | | 0.00 | |
Malaysia | | 0.00 | | | 0.00 | | | 2.38 | | | 6.01 | | | 0.00 | | | 0.00 | |
Mexico | | 4.59 | | | 0.00 | | | 0.26 | | | 0.00 | | | 0.62 | | | 0.00 | |
Netherlands | | 6.71 | | | 8.69 | | | 0.43 | | | 0.67 | | | 6.71 | | | 0.29 | |
New Zealand | | 0.00 | | | 0.00 | | | 0.00 | | | 0.00 | | | 4.48 | | | 7.63 | |
Norway | | 0.92 | | | 1.19 | | | 0.88 | | | 1.37 | | | 0.63 | | | 1.07 | |
Panama | | 0.00 | | | 0.00 | | | 14.14 | | | 0.00 | | | 0.00 | | | 0.00 | |
Portugal | | 0.00 | | | 0.00 | | | 0.86 | | | 1.34 | | | 0.00 | | | 0.00 | |
Republic of Korea | | 1.64 | | | 2.22 | | | 7.17 | | | 12.45 | | | 0.19 | | | 0.35 | |
Russia | | 1.64 | | | 2.13 | | | 0.00 | | | 0.00 | | | 0.00 | | | 0.00 | |
Singapore | | 2.53 | | | 3.74 | | | 5.07 | | | 11.19 | | | 0.00 | | | 0.00 | |
Spain | | 4.79 | | | 6.06 | | | 3.43 | | | 4.78 | | | 0.00 | | | 0.00 | |
Sweden | | 0.00 | | | 0.00 | | | 4.96 | | | 7.72 | | | 0.00 | | | 0.00 | |
Switzerland | | 9.57 | | | 12.39 | | | 8.82 | | | 13.18 | | | 9.21 | | | 15.68 | |
Taiwan | | 3.42 | | | 5.90 | | | 0.00 | | | 0.00 | | | 0.00 | | | 0.00 | |
Thailand | | 0.15 | | | 0.13 | | | 7.67 | | | 7.97 | | | 0.00 | | | 0.00 | |
United Kingdom | | 28.05 | | | 24.22 | | | 7.31 | | | 7.59 | | | 48.73 | | | 55.36 | |
United States | | 1.59 | | | 0.00 | | | 0.56 | | | 0.00 | | | 6.06 | | | 0.00 | |
78
SEVENTY-EIGHT
SHAREHOLDER EXPENSE EXAMPLE
As a shareholder of Artisan Funds, you incur two types of costs: (1) transaction costs, including redemption fees; and (2) ongoing costs, including management fees, and other Fund expenses. This example is intended to help you understand your ongoing costs (in dollars) of investing in a Fund and to compare these costs with the ongoing costs of investing in other mutual funds.
The example is based on an investment of $1,000 invested at the beginning of the period and held for the entire period from April 1, 2004 to September 30, 2004.
Actual Expenses
The first line of the table below provides information about actual account values and actual expenses. You may use the information in this line, together with the amount you invested, to estimate the expenses that you paid over the period. Simply divide your account value by $1,000 (for example, an $8,600 account value divided by $1,000 = 8.6), then multiply the result by the number in the first line under the heading entitled “Expenses Paid During Period” to estimate the expenses you paid on your account during this period.
Hypothetical Example for Comparison Purposes
The second line of the table below provides information about hypothetical account values and hypothetical expenses based on each Fund’s actual expense ratio and an assumed rate of return of 5% per year before expenses, which is not the Fund’s actual return. The hypothetical account values and expenses may not be used to estimate the actual ending account balances or expenses you paid for the period. You may use this information to compare the ongoing costs of investing in each Fund and other funds. To do so, compare the 5% hypothetical example with the 5% hypothetical examples that appear in the shareholder reports of the other funds.
Please note that the expenses shown in the table are meant to highlight your ongoing costs only and do not reflect any transactional costs, such as redemption fees. Therefore, the second line of the table is useful in comparing ongoing costs only, and will not help you determine the relative costs of owning different funds. In addition, if these transactional costs were included, your costs would have been higher.
| | | | | | | | | |
| | | Beginning
Account Value
4/1/2004 | | Ending
Account Value
9/30/2004 | | Expenses Paid During
Period*
4/1/2004-9/30/2004 |
Artisan International Fund - Investor Shares | | | | | | | | | |
Actual | | $ | 1,000.00 | | $ | 963.60 | | $ | 6.04 |
Hypothetical (5% return before expenses) | | $ | 1,000.00 | | $ | 1,018.85 | | $ | 6.21 |
Artisan International Fund - Institutional Shares | | | | | | | | | |
Actual | | $ | 1,000.00 | | $ | 964.80 | | $ | 5.01 |
Hypothetical (5% return before expenses) | | $ | 1,000.00 | | $ | 1,019.90 | | $ | 5.15 |
Artisan International Small Cap Fund | | | | | | | | | |
Actual | | $ | 1,000.00 | | $ | 981.40 | | $ | 7.78 |
Hypothetical (5% return before expenses) | | $ | 1,000.00 | | $ | 1,017.15 | | $ | 7.92 |
Artisan International Value Fund | | | | | | | | | |
Actual | | $ | 1,000.00 | | $ | 1,052.20 | | $ | 7.49 |
Hypothetical (5% return before expenses) | | $ | 1,000.00 | | $ | 1,017.70 | | $ | 7.36 |
79
SEVENTY-NINE
SHAREHOLDER EXPENSE EXAMPLE
| | | | | | | | | |
| | | Beginning
Account Value
4/1/2004 | | Ending
Account Value
9/30/2004 | | Expenses Paid During
Period*
4/1/2004-9/30/2004 |
Artisan Mid Cap Fund - Investor Shares | | | | | | | | | |
Actual | | $ | 1,000.00 | | $ | 964.90 | | $ | 5.94 |
Hypothetical (5% return before expenses) | | $ | 1,000.00 | | $ | 1,018.95 | | $ | 6.11 |
Artisan Mid Cap Fund - Institutional Shares | | | | | | | | | |
Actual | | $ | 1,000.00 | | $ | 965.90 | | $ | 4.72 |
Hypothetical (5% return before expenses) | | $ | 1,000.00 | | $ | 1,020.20 | | $ | 4.85 |
Artisan Mid Cap Value Fund | | | | | | | | | |
Actual | | $ | 1,000.00 | | $ | 1,057.10 | | $ | 7.10 |
Hypothetical (5% return before expenses) | | $ | 1,000.00 | | $ | 1,018.10 | | $ | 6.96 |
Artisan Small Cap Fund | | | | | | | | | |
Actual | | $ | 1,000.00 | | $ | 996.70 | | $ | 6.29 |
Hypothetical (5% return before expenses) | | $ | 1,000.00 | | $ | 1,018.70 | | $ | 6.36 |
Artisan Small Cap Value Fund | | | | | | | | | |
Actual | | $ | 1,000.00 | | $ | 1,057.00 | | $ | 6.07 |
Hypothetical (5% return before expenses) | | $ | 1,000.00 | | $ | 1,019.10 | | $ | 5.96 |
| * | Expenses are equal to the Fund’s ratio of expenses to average net assets for the six-month period ended September 30, 2004 (shown below); multiplied by the average account value over the period; multiplied by 183/366 (to reflect the one-half year period). |
| | | |
| Fund | | Annualized Ratio of Expenses to Average Net Assets for the Six-Month
Period Ended September 30, 2004 | |
Artisan International Fund - Investor Shares | | 1.23 | % |
Artisan International Fund - Institutional Shares | | 1.02 | |
Artisan International Small Cap Fund | | 1.57 | |
Artisan International Value Fund | | 1.46 | |
Artisan Mid Cap Fund - Investor Shares | | 1.21 | |
Artisan Mid Cap Fund - Institutional Shares | | 0.96 | |
Artisan Mid Cap Value Fund | | 1.38 | |
Artisan Small Cap Fund | | 1.26 | |
Artisan Small Cap Value Fund | | 1.18 | |
80
EIGHTY
NOTES ON MANAGEMENT’S DISCUSSION OF FUND PERFORMANCE
The discussions of each Fund included in this Annual Report include statistical information about the portfolios of each of the Artisan Funds. Except as otherwise noted, that information is as of September 30, 2004; it varies with changes in a Fund’s portfolio investments. The performance information for each Fund relative to its benchmark index discussed in this Report was prepared by the Adviser using information reported by FactSet Databases (“FactSet”). Artisan Funds may consider an issuer to be from a particular country if (i) its principal securities trading market is in that country; (ii) alone or on a consolidated basis it derives more of its annual revenue from goods produced, sales made or services performed in that country than any other country; or (iii) it is organized under the laws of, or has a principal office in that country. By applying these tests, it is possible that Artisan Funds could deem a particular issuer to be from more than one country.
Definitions of Portfolio Statistics
Median Market Cap provides a measure of the market capitalization value of the companies in a portfolio. Market capitalization is the aggregate value of all a company’s outstanding common stock. Market capitalization is calculated by FactSet using the price as of the most recent month-end multiplied by the number of shares outstanding as shown in the financial statements of the issuer. Equal numbers of companies in the portfolio have market capitalizations higher and lower than the median. Weighted Average Market Cap is the average of the market capitalizations of the companies in the portfolio weighted by the size of each company’s position within the portfolio. Weighted Average Growth Rate is a measure of the rate at which a company’s earnings are expected to grow and is the average of the 3-5 year forecasted growth rates of each company in the portfolio, weighted by the size of the company’s position within the portfolio. Median Price/Book Value measures the median ratio of portfolio stock prices to each stock’s book value of equity per share. Book value is a company’s assets minus its liabilities. Weighted Harmonic Average P/E is the harmonic average, which measures the price/earnings ratio (a measure of how expensive a stock is) of the Fund, excluding negative earners, weighted by the size of the company’s position within the portfolio. The earnings figures used are estimates for the current calendar year. Median P/E measures the median ratio of the portfolio stock prices to each stock’s earnings. The earnings figures used are estimates for the current calendar year.
Descriptions of Indices
Each Fund’s performance is compared in this report to changes in one or more indices, including in all cases a broad-based index of changes in prices of securities in the market in which the Fund invests. All of the indices are unmanaged and their returns include reinvested dividends. Unlike the Funds’ returns, the returns of each index, do not include the payment of sales commissions or other expenses that would be incurred in the purchase or sale of the securities included in that index.
The indices to which the Funds are compared are:
Artisan International, Artisan International Small Cap and Artisan International Value Funds – Morgan Stanley Capital International EAFE® Index (MSCI EAFE) is a market-weighted index of companies in developed markets, excluding the U.S. and Canada. MSCI EAFE’s average annual return since inception of the International Fund is based upon a starting date of December 31, 1995.
Artisan International Fund – Morgan Stanley Capital International EAFE® Growth Index (MSCI EAFE® Growth) is a market-weighted index of companies in developed markets, excluding the U.S. and Canada, with higher price-to-book ratios. MSCI EAFE Growth’s average annual return since inception of the International Fund is based upon a starting date of December 31, 1995.
Artisan International Small Cap Fund – Morgan Stanley Capital International EAFE® Small Cap Index is a market-weighted index of small companies in developed markets, excluding the U.S. and Canada.
Artisan International Value Fund – Morgan Stanley Capital International EAFE® Value Index is a market-weighted index of companies in developed markets, excluding the U.S. and Canada, with lower price-to-book ratios.
Artisan Mid Cap Fund – Russell Midcap® Index is a market-weighted index of about 800 medium-sized U.S. companies. The Russell Midcap® Growth Index is a market-weighted index of those medium-sized companies included in the Russell Midcap® Index with higher price-to-book and higher forecasted growth values.
81
EIGHTY-ONE
NOTES ON MANAGEMENT’S DISCUSSION OF FUND PERFORMANCE
Artisan Mid Cap Value Fund – Russell Midcap® Index is a market-weighted index of about 800 medium-sized U.S. companies. The Russell Midcap® Value Index is a market-weighted index of those medium-sized companies included in the Russell Midcap® Index with lower price-to-book ratios and lower forecasted growth values.
Artisan Small Cap Fund – Russell 2000® Index is a market-weighted index of about 2,000 small U.S. companies. Russell 2000® Growth Index is a market-weighted index of those small companies included in the Russell 2000® Index with higher price-to-book ratios and higher forecasted growth values.
Artisan Small Cap Value Fund – Russell 2000® Index is a market-weighted index of about 2,000 small U.S. companies. The Russell 2000® Value Index is a market-weighted index of those small companies included in the Russell 2000® Index with lower price-to-book ratios and lower forecasted growth values.
Trademarks
Trademarks and copyrights relating to the indices and products of portfolio companies mentioned in this report are owned by their respective owners. Except as otherwise indicated, the trademarks, including names, logos, slogans and service marks appearing in this report are the property of Artisan Partners Limited Partnership and may not be copied, reproduced, published or in any way used without written permission.
PROXY VOTING POLICIES AND PROCEDURES
You may obtain a description of the Artisan Funds’ proxy voting policies and procedures, without charge, upon request by calling 800.344.1770. That information also is included in Artisan Funds’ statement of additional information, which is available on the Funds’ website at www.artisanfunds.com and the Securities and Exchange Commission’s website at www.sec.gov.
Information relating to how each Artisan Fund voted proxies relating to portfolio securities held during the twelve months ended June 30, 2004 is available on the Funds’ website at www.artisanfunds.com and on the Securities and Exchange Commission’s website at www.sec.gov.
INFORMATION ABOUT PORTFOLIO SECURITIES
Artisan Funds will file a complete schedule of portfolio holdings with the Securities and Exchange Commission for the quarters ending December 31 and June 30 (the Funds’ first and third quarters of its fiscal year) on Form N-Q. The Funds’ Forms N-Q, when filed, will be available on the Securities and Exchange Commission’s website at www.sec.gov. You may also review and copy those documents by visiting the Securities and Exchange Commission’s Public Reference Room in Washington, D.C. Information on the operation of the Public Reference Room may be obtained by calling the Securities and Exchange Commission at 800.SEC-0330.
DIRECTORS AND OFFICERS
The Board of Directors has overall responsibility for the conduct of the affairs of Artisan Funds. Each director serves an indefinite term of unlimited duration until the next annual meeting of shareholders and until the election and qualification of his or her successor. The Board of Directors may fill any vacancy on the board provided that after such appointment at least two-thirds of the directors have been elected by the shareholders. The shareholders may remove a director by a vote of a majority of the outstanding shares of the Funds at any meeting of shareholders called for the purpose of removing such director.
The Board of Directors elects the officers of Artisan Funds. Each officer serves until the election and qualification of his or her successor, or until he or she sooner dies, resigns, or is removed or disqualified. The Board of Directors may remove any officer with or without cause at any time.
82
EIGHTY-TWO
DIRECTORS AND OFFICERS
The names and ages of the directors and officers as of November 15, 2004, the position each holds with the Funds, the date each was first elected to office, their principal business occupations and other directorships they have held during the last five years are shown below.
| | | | | | | | |
| | | | | |
Name and Age at 11/15/04 | | Positions Held with Funds | | Date First
Elected or
Appointed to Office | | Principal Occupations during Past 5 Years | | Other Directorships Held |
| Directors who are not “interested persons” |
David A. Erne – 61 | | Director | | 3/27/95 | | Partner of the law firm Reinhart Boerner Van Deuren s.c., Milwaukee, WI | | Trustee, Northwestern Mutual Life Insurance Company (individual life insurance, disability insurance and annuity company) |
Thomas R. Hefty – 57 | | Director | | 3/27/95 | | Retired; Adjunct Faculty, Department of Business and Economics, Ripon College; Of Counsel to the law firm Reinhart Boerner Van Deuren s.c., Milwaukee, WI.; until December 2002, Chairman of the Board and Chief Executive Officer of Cobalt Corporation (provider of managed care and specialty business services) | | None |
Jeffrey A. Joerres – 44 | | Director | | 8/9/01 | | Chairman of the Board (since May 2001), President and Chief Executive Officer of Manpower Inc. (non-governmental employment service organization); formerly, Senior Vice President, European Operations and Global Account Management and Development of Manpower Inc. | | Director, Johnson Controls, Inc. (manufacturer of automotive systems and building controls) |
Patrick S. Pittard – 58 | | Director | | 8/9/01 | | Distinguished Executive in Residence (teaching position), University of Georgia. Until November 2001, Chairman of the Board, President and Chief Executive Officer of Heidrick & Struggles International, Inc. (executive search firm) | | Director, Jefferson Pilot Corporation (individual and group life insurance and annuity company); Former Chairman of the Board, The University of Georgia Foundation; Member, Board of Regents of the University System of Georgia |
Howard B. Witt – 64 | | Director | | 3/27/95 | | Chairman of the Board, President and Chief Executive Officer of Littelfuse, Inc. (manufacturer of advanced circuit protection devices) | | Director, Franklin Electric Co., Inc. (manufacturer of electric motors) |
83
EIGHTY-THREE
DIRECTORS AND OFFICERS
| | | | | | | | |
| | | | | |
Name and Age at 11/15/04 | | Positions Held with Funds | | Date First
Elected or
Appointed to Office | | Principal Occupations during Past 5 Years | | Other Directorships Held |
| Directors who are “interested persons”* |
Andrew A. Ziegler – 47 | | Director and President | | 1/5/95; 12/19/03 elected President | | Managing Director of Artisan Partners; Chairman and President of Artisan Distributors; until December 2003, Chairman of Artisan Funds | | None |
Carlene M. Ziegler – 48 | | Director and Vice President | | 3/27/95 | | Managing Director of Artisan Partners and Portfolio Co-Manager of Artisan Small Cap Fund | | None |
| Officers of Artisan Funds |
Lawrence A. Totsky – 45 | | Chief Financial Officer and Treasurer | | 1/22/98 | | Managing Director and Chief Financial Officer of Artisan Partners; Vice President, Chief Financial Officer and Treasurer of Artisan Distributors | | None |
Janet D. Olsen – 48 | | General Counsel and Secretary | | 1/18/01 | | Managing Director and General Counsel of Artisan Partners; Vice President and Secretary of Artisan Distributors; prior to joining Artisan Partners in November 2000, Member of the law firm Bell, Boyd & Lloyd LLC, Chicago, IL | | None |
Brooke J. Billick – 50 | | Chief Compliance Officer | | 8/19/04 | | Chief Compliance Officer and Associate Counsel of Artisan Partners; Chief Compliance Officer of Artisan Distributors; prior to joining Artisan Partners in February 2004, Vice President, Securities Counsel and Corporate Secretary of Marshall & Ilsley Trust Company, N.A. (bank) and M&I Investment Management Corp. (investment adviser) and Chief Legal Officer and Secretary of Marshall Funds, Inc. (mutual fund company) | | None |
Michael C. Roos – 46 | | Vice President | | 12/19/03 | | Managing Director of Artisan Partners; Vice President of Artisan Distributors; until December 2003, President of Artisan Funds | | None |
Mark L. Yockey – 48 | | Vice President | | 4/23/96 | | Managing Director of Artisan Partners and Portfolio Manager of Artisan International Fund and Artisan International Small Cap Fund | | None |
| * | Mr. and Ms. Ziegler are married to each other. Mr. and Ms. Ziegler are “interested persons” of Artisan Funds, as defined in the Investment Company Act of 1940, because each is a Managing Director of Artisan Partners, the investment adviser to Artisan Funds. As officers of Artisan Investment Corporation (an entity incorporated for the sole purpose of acting as general partner to Artisan Partners), Mr. and Ms. Ziegler manage Artisan Partners. Mr. Ziegler is also President of Artisan Distributors, Artisan Funds’ principal underwriter. |
84
EIGHTY-FOUR
DIRECTORS AND OFFICERS
| | | | | | | | |
| | | | | |
Name and Age at 11/15/04 | | Positions Held with Funds | | Date First
Elected or
Appointed to Office | | Principal Occupations during Past 5 Years | | Other Directorships Held |
Scott C. Satterwhite – 47 | | Vice President | | 7/31/97 | | Managing Director of Artisan Partners and Portfolio Co-Manager of Artisan Mid Cap Value Fund and Artisan Small Cap Value Fund | | None |
Andrew C. Stephens – 41 | | Vice President | | 7/31/97 | | Managing Director of Artisan Partners and Portfolio Manager of Artisan Mid Cap Fund | | None |
Marina T. Carlson – 40 | | Vice President | | 8/5/99 | | Managing Director of Artisan Partners and Portfolio Co-Manager of Artisan Small Cap Fund | | None |
James C. Kieffer – 39 | | Vice President | | 1/27/00 | | Managing Director of Artisan Partners and Portfolio Co-Manager of Artisan Mid Cap Value Fund and Artisan Small Cap Value Fund; until 2000, Research Analyst for Artisan Partners | | None |
N. David Samra – 40 | | Vice President | | 6/5/02 | | Managing Director of Artisan Partners and Portfolio Manager of Artisan International Value Fund; until 2002, Portfolio Manager and Analyst for Harris Associates L.P. (investment management firm) | | None |
Gregory K. Ramirez – 34 | | Assistant Secretary and Assistant Treasurer | | 1/22/98 | | Managing Director of Client Accounting and Administration of Artisan Partners since January 2003, Director of Client Accounting and Administration from January 2000 to December 2002 and Controller of Artisan Partners prior thereto; Assistant Treasurer of Artisan Distributors | | None |
Sarah A. Johnson – 32 | | Assistant Secretary | | 2/5/03 | | Associate Counsel of Artisan Partners; prior to joining Artisan Partners in July 2002, Associate of the law firm Bell, Boyd & Lloyd LLC, Chicago, IL | | None |
The business address of the directors and officers affiliated with Artisan Partners is 875 E. Wisconsin Avenue, Suite 800, Milwaukee, Wisconsin 53202. The addresses of the other directors are: Mr. Erne –1000 N. Water Street, Milwaukee, Wisconsin 53202; Mr. Hefty – W233 N2080 Ridgeview Parkway, Waukesha, Wisconsin 53188; Mr. Joerres – 5301 North Ironwood, Milwaukee, Wisconsin 53217; Mr. Pittard – c/o Artisan Funds, 875 E. Wisconsin Avenue, Suite 800, Milwaukee, Wisconsin 53202; and Mr. Witt – 800 E. Northwest Highway, Des Plaines, Illinois 60016.
Artisan Funds’ statement of additional information (SAI) contains further information about the directors. Please call 800.344.1770 or visit our website at www.artisanfunds.com for a free copy of the SAI.
85
EIGHTY-FIVE
| | | | |
 | | 875 EAST WISCONSIN AVENUE SUITE 800 MILWAUKEE WI 53202-5402 800.344.1770 WWWW.ARTISANFUNDS.COM | | |


ANNUAL
REPORT
SEPTEMBER 30, 2004
ARTISAN INTERNATIONAL FUND
ARTISAN MID CAP FUND
Institutional Shares
Artisan Funds, Inc.
INSTITUTIONAL SHARES
TABLE OF CONTENTS
ARTISAN FUNDS
P.O. BOX 8412
BOSTON, MA 02266-8412
This report and the audited financial statements contained herein are provided for the general information of the shareholders of the Institutional Shares of Artisan International Fund and Artisan Mid Cap Fund. This report is not authorized for distribution to prospective investors unless preceded or accompanied by an effective prospectus. For more complete information on the Funds, including fees and expenses, please call 800.399.1770 for a free prospectus. Read it carefully before you invest or send money.
Company discussions are for illustration only and are not intended as recommendations of individual stocks. The discussions present information about the companies believed to be accurate, and the views of the portfolio managers, as of September 30, 2004. That information and those views may change, and the Funds disclaim any obligation to advise shareholders of any such changes.
Artisan Funds offered through Artisan Distributors LLC, member NASD.
ARTISAN INTERNATIONAL FUND
INSTITUTIONAL SHARES
| | |
| HIGHLIGHTS | | |
• During the twelve months ended September 30, 2004, Artisan International Fund produced a strong absolute return, but underperformed its benchmark, the MSCI EAFE® Index. • Our decision to invest in a select group of | | emerging market stocks contributed strongly to performance compared to the benchmark. • The financials sector was a positive contributor to our return, but our average stock underperformed the benchmark sector return. |
| | | |
| INVESTMENT APPROACH | | |
| We use a bottom-up investment process to construct a portfolio of international growth companies of all market capitalizations. The investment team conducts its own fundamental analysis with particular emphasis on: | | 1) well-managed companies focused on increasing shareholder value; 2) sustainable growth prospects; 3) reasonable valuations; or 4) dominant or increasing market shares or direct exposure to an identified theme. |
| | | |
| PERFORMANCE REVIEW | | |
| From the inception of the Fund’s Institutional Shares through September 30, 2004, Artisan International Fund has outpaced the MSCI EAFE® and the MSCI EAFE® Growth Indices. |
GROWTH OF AN ASSUMED $10,000 INVESTMENT (7/1/97 to 9/30/04)
AVERAGE ANNUAL TOTAL RETURNS (as of 9/30/04)
| | | | | | | | | | | | |
| Fund / Index | | 1-Year | | | 3-Year | | | 5-Year | | | Since
Inception | |
Artisan International Fund -
Institutional Shares | | 18.31 | % | | 5.76 | % | | 3.94 | % | | 8.97 | % |
MSCI EAFE® Growth Index | | 16.66 | | | 7.12 | | | -4.37 | | | -1.02 | |
MSCI EAFE® Index | | 22.08 | | | 9.12 | | | -0.85 | | | 1.85 | |
The performance quoted represents past performance, which does not guarantee future results. The investment return and principal value of an investment in the Fund will fluctuate, so that an investor’s shares in the Fund, when redeemed, may be worth more or less than their original cost. The inception date shown is inception of the Fund’s Institutional Shares. Current performance may be lower or higher than the performance data quoted. For current to most recent month-end performance information, or for performance information for periods before inception of the Fund’s Institutional Shares, call 800.399.1770. The graph and table above do not reflect the deduction of taxes that a shareholder would pay on distributions or sale of Fund shares. The performance shown does not reflect the deduction of a 2% redemption fee on shares held by an investor for 90 days or less and, if reflected, the fee would reduce the performance quoted. See page 37 for a description of each index.
02
TWO
INVESTING ENVIRONMENT
During the twelve months ended September 30, 2004, international equity markets recorded strong gains, outpacing their domestic counterparts. Returns for U.S. investors were enhanced by a weak dollar, which led to profitable currency conversions when local currencies were translated into U.S. dollars at the cheaper rate. Small-caps as a group performed better than large-caps, and value stocks outperformed growth stocks by a wide margin.
The strong stock market returns over the fiscal year as a whole masked the fact that sentiment was quite different in the first half of the fiscal year than in the second half. The first half of the year seemed to reflect a synchronized global economic recovery aided by a favorable interest rate environment. The second half of the fiscal year was marked by uncertainty as the outlook for the global economy became less clear. Perhaps the initial thread of doubt that entered investors’ minds was the prospect of rising interest rates in the U.S., driven by a pick up in inflation. Other concerns included slowing economic growth in China, continued turmoil in Iraq and terrorist activity such as the Madrid attack and Russian school tragedy.
With all of those factors weighing on investors’ minds, the spike in oil prices had a dampening effect on the markets. On the other hand, rising energy prices had a very positive effect on energy stocks, which were among the leading performers in the MSCI EAFE® Index. Oil wasn’t the only commodity that saw price increases throughout the year. Generally rising commodities prices gave a boost to the materials sector, making it a leading performer. The technology sector was the worst performing sector in our benchmark, followed by consumer staples and telecommunications. Most of the other sectors generated returns roughly on par with the index average.
On a regional basis many emerging markets, led by markets in Latin America, turned in very strong returns. Europe and the Far East (excluding Japan) also performed well. Japan was a laggard among developed markets, but still managed to turn in low double-digit returns.
PERFORMANCE DISCUSSION
In the Fund, every sector contributed positively to performance, but our largest gains compared to the benchmark were in technology, telecommunications and energy. Our returns in the financials and consumer sectors, although positive, were below the benchmark. Regionally, Japan and our emerging markets stocks contributed positively compared to our benchmark index, while Europe detracted from relative results, due in part to our lower exposure to the U.K.
TOP 10 HOLDINGS
| | | | | |
| Company Name | | Country | | % | |
Telefonaktiebolaget LM Ericsson | | Sweden | | 3.2 | % |
Fortis | | Netherlands | | 3.0 | |
UBS AG | | Switzerland | | 2.9 | |
Kingfisher PLC | | United Kingdom | | 2.8 | |
Tesco PLC | | United Kingdom | | 2.7 | |
ITV PLC | | United Kingdom | | 2.6 | |
Honda Motor Co., Ltd. | | Japan | | 2.4 | |
Nestle S.A. | | Switzerland | | 2.1 | |
EnCana Corporation | | Canada | | 2.1 | |
Allianz AG | | Germany | | 2.1 | |
Total | | | | 25.9 | % |
As a percentage of total net assets as of 9/30/04. Top 10 Holdings are determined by issuer.
SECTOR REVIEW
We focused on just a few select industry-leading technology companies last year. The decision to limit the number of names we owned in the area enhanced our relative return in a tough period for the group. Performance also was boosted by a price gain of more than 100% from Telefonaktiebolaget LM Ericsson (Ericsson), a Swedish manufacturer of wireless communications equipment. Ericsson underwent a significant restructuring program driven by a new CEO and management team that aggressively pushed through cost cutting goals ahead of expectations. That led to a strong increase in profitability, which drove up the company’s share price. Unfortunately, we were not immune to the general softness in the sector as our position in ASML Holding N.V. declined. ASML softened in anticipation of a potential industry-wide slowdown in semiconductor equipment orders. We used the weakness to add to our holdings.
Our holdings in the telecommunications sector outpaced the benchmark sector return despite a less favorable contribution from currency translation gains. Leading the way were Telenor ASA, Cesky Telecom, A.S., and Chunghwa Telecom Co., Ltd. All three stocks reported good revenue growth.
03
THREE
Supply concerns and strong demand were the driving factors behind the high price of oil, which provided a stiff tailwind for performance in the energy sector. We were underweighted in the energy sector, but our stocks advanced even more than the lofty index sector return. China’s seemingly insatiable demand for energy led us to purchase Sinopec, China’s largest oil refiner, and CNOOC, which controls offshore gas assets. Both stocks produced meaningful gains and we sold both during the period. We also sold Spanish oil company Repsol YPF, S.A. Its earnings and production were strong, but we elected to secure our gains as we thought its upside had decreased. We used some of the proceeds from those sales to buy two Italian companies: Saipem S.p.A. (oil services) and ENI S.p.A. (oil and gas exploration). Two other very solid gainers were Russian oil company Lukoil and Brazilian oil company Petroleo Brasileiro S.A. (Petrobras). One catalyst behind Lukoil’s ascent was the Russian government’s decision to sell its stake in the company.
SECTOR DIVERSIFICATION
| | | | | | |
| Sector | | 9/30/03 | | | 9/30/04 | |
Consumer Discretionary | | 24.9 | % | | 23.9 | % |
Consumer Staples | | 16.5 | | | 11.9 | |
Energy | | 4.7 | | | 8.2 | |
Financials | | 24.2 | | | 26.8 | |
Healthcare | | 6.9 | | | 4.5 | |
Industrials | | 3.4 | | | 4.7 | |
Information Technology | | 1.9 | | | 6.4 | |
Materials | | 7.4 | | | 4.8 | |
Telecommunication Services | | 7.9 | | | 6.9 | |
Utilities | | 0.3 | | | 0.7 | |
Other assets less liabilities | | 1.9 | | | 1.2 | |
Total | | 100.0 | % | | 100.0 | % |
As a percentage of total net assets as of 9/30/03 and 9/30/04, respectively.
Our financial holdings were a contributor to our underperformance during the fiscal year. As the year wore on, the potential for higher interest rates around the world and concerns about the rate of growth of the Japanese economy weighed on our positions. We used softness late in the period to build our holdings in several stocks that we purchased earlier in the fiscal year: Orix, Bank of Yokohama and Credit Saison. We continue to hold Japanese brokerage company Nikko Cordial Corp., which hurt the Fund’s return. It was pressured by Citigroup’s announced reduction of its stake in the company. One of the better performers in the sector was Belgian financial services company Fortis, which benefited from lower loss provisions and an improved capital structure following the initial public offering of its U.S. insurance unit Assurant. Japanese consumer finance company Promise Co., Ltd. also did very well.
In the materials sector we were primarily hurt by the performance of Rhodia S.A., although Clariant AG was also weak. Rhodia management was trying to restructure, but the slow pace of progress relative to financing and liquidity concerns increased the risk and we closed out the position. Clariant was hurt by low cost competition in some of its product areas. Imperial Chemical Industries PLC was a bright spot. It disposed of a food ingredients unit in a continued restructuring effort and reported strong earnings growth.
Within the consumer sectors, the media industry is our largest overweight compared to the benchmark. A few of the leading performers in the Fund were French outdoor advertising company JC Decaux, Spanish media company Promotora de Informaciones, S.A. (Prisa) and Spanish language broadcaster Grupo Televisa S.A. JC Decaux improved profitability and was the subject of merger speculation. Prisa benefited from solid sales growth. Televisa announced a restructuring of its holding company, which eliminated a potential overhang on the stock without diluting earnings. One media holding that trailed during the last part of the year was British Sky Broadcasting (BSkyB), a pay TV operator. BSkyB’s shares came under pressure when it announced an unexpected change in strategy, aimed at boosting subscriber growth, which may lead to lower profitability in the short-term.
The performance of food caterer Compass Group and food retailer Carrefour was a disappointment. Compass dropped late in the period after management unexpectedly announced that future cash flows would be lower than expected due to new payment terms with suppliers primarily in the U.K. Carrefour released a weak sales report and we sold our position based on the slower growth prospects.
04
FOUR
COUNTRY REVIEW
Overall, our country allocations contributed strongly to relative performance. One of the chief reasons was our underweight position in Japan, which weakened amid indications of a cooling Chinese economy and declining exports. However, economic figures at the end of the period showed that household consumption continued to strengthen, employment improved and business confidence reached its highest level since the burst of the asset bubble in 1991. Our emerging markets stocks were another source of positive relative gains as they outpaced the Index overall.
REGION ALLOCATION
| | | | | | |
| Region | | 9/30/03 | | | 9/30/04 | |
Europe | | 74.6 | % | | 65.6 | % |
Asia/Pacific | | 13.8 | | | 25.0 | |
Latin America | | 6.8 | | | 5.3 | |
North America | | 2.9 | | | 2.9 | |
As a percentage of total net assets as of 9/30/03 and 9/30/04, respectively.
TOP 5 COUNTRY ALLOCATIONS
| | | |
| Country | | % | |
Japan | | 18.5 | % |
United Kingdom | | 16.7 | |
Switzerland | | 11.5 | |
Germany | | 7.9 | |
Spain | | 5.4 | |
As a percentage of total net assets as of 9/30/04.
In Europe, the U.K. was a solid performer and our underweight position hurt performance. Its economy grew at a fast pace, leading to several interest rate increases by the Bank of England. In Continental Europe, there were improvements in domestic consumption and manufacturing, but economic growth was not on par with the U.K.
FUND CHANGES
We continued to focus on our long-term investment themes throughout the year. As a result, the changes to our regional allocations and sector weights were primarily due to individual security decisions. On a regional basis, the extension of our themes to the Pacific resulted in a marked increase to our Japanese exposure and smaller increases to Singapore and China. Our emerging markets exposure also increased with the addition of a few select stocks. As a result, the Fund’s allocation to Europe fell and for the first time in a considerable period we are underweighted in European stocks compared to our benchmark. The country weights within the region that fell the most were Germany, Switzerland and the U.K.
We reduced our weighting in consumer staples and healthcare during the fiscal year and increased financials and energy. The change in consumer staples was due to the sale of Carrefour and significant reductions in Henkel KGaA, Diageo PLC and Nestle S.A. Other consumer transactions included the sales of British retailer Next PLC after it reached our price target and Dutch publisher Wolters Kluwer N.V. in favor of better alternatives. We used some of the capital to purchase PagesJaunes S.A., France’s leading telephone directories publisher, and Pearson, which publishes the Financial Times and is strong in higher education publishing.
In healthcare, we sold both Novartis AG and Sanofi-Synthelabo S.A., which got into a bidding war to buy Aventis S.A. We used proceeds from those sales to partially fund the additions in energy and Japanese financials discussed above.
FUND STATISTICS
| | |
Net Assets | | $ 9.8 billion |
Number of Holdings | | 119 |
Weighted Average Market Cap | | $ 26.1 billion |
Weighted Average Growth Rate (3-5 yr) | | 11.0% |
Weighted Harmonic Average P/E (2004E) | | 16.3X |
Source: FactSet/Artisan Partners. All statistics are as of 9/30/04.
05
FIVE
ARTISAN MID CAP FUND
INSTITUTIONAL SHARES
| | |
| HIGHLIGHTS | | |
• During the twelve months ended September 30, 2004, Artisan Mid Cap Fund underperformed the Russell Midcap® Index and was slightly behind the Russell Midcap® Growth Index. • Our security selection in the consumer
| | sectors was a leading contributor to performance compared to both benchmarks. • The performance of our stocks in the producer durables sector was a drag on relative returns. |
| | | |
| INVESTMENT APPROACH | | |
| We use a bottom-up investment process to identify well-managed mid-sized companies whose growth and profit potential are not yet fully recognized by investors. Specifically, we spend most of our time answering three questions about a company before we will invest in it: | | 1) Does the company exhibit franchise characteristics? 2) Is the company positioned for long-term growth and at an early stage in its profit cycle? 3) Is the stock of the company trading at a reasonable discount to our estimate of its private market value? |
| | | |
| PERFORMANCE REVIEW | | |
| Artisan Mid Cap Fund has outperformed the Russell Midcap® Growth Index from the inception of the Fund’s Institutional Shares through September 30, 2004, but has underperformed the Russell Midcap® Index for the same period. |
GROWTH OF AN ASSUMED $10,000 INVESTMENT (7/1/00 to 9/30/04)
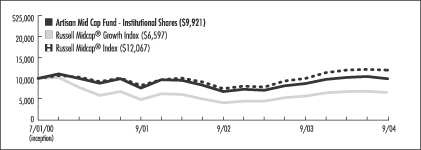
AVERAGE ANNUAL TOTAL RETURNS (as of 9/30/04)
| | | | | | | | | |
| Fund / Index | | 1-Year | | | 3-Year | | | Since
Inception | |
Artisan Mid Cap Fund | | 13.27 | % | | 8.66 | % | | -0.19 | % |
Russell Midcap® Growth Index | | 13.68 | | | 10.09 | | | -9.32 | |
Russell Midcap® Index | | 20.55 | | | 13.32 | | | 4.52 | |
The performance quoted represents past performance, which does not guarantee future results. The investment return and principal value of an investment in the Fund will fluctuate, so that an investor’s shares in the Fund, when redeemed, may be worth more or less than their original cost. The inception date shown is inception of the Fund’s Institutional Shares. Current performance may be lower or higher than the performance data quoted. For current to most recent month-end performance information, or for performance information for periods before inception of the Fund’s Institutional Shares, call 800.399.1770. The graph and table above do not reflect the deduction of taxes that a shareholder would pay on distributions or sale of Fund shares. See page 37 for a description of each index.
06
SIX
INVESTING ENVIRONMENT
Our fiscal year ended September 30, 2004 was a good period to own mid-cap stocks as they outpaced their small- and large-cap brethren. However, a simple analysis of returns by quarter reveals that stocks of all sizes saw gains moderate throughout the period and ultimately tail off at the end of the fiscal year. Over the course of a twelve-month time frame there could be a variety of reasons to point to that might explain the performance trend, but we think the most important influence was probably economic growth. During the fiscal year, economic growth slowed and expectations for future growth moderated. Two factors that contributed to the moderation were rising commodities prices, particularly oil, and market participants’ expectation for higher interest rates, driven in part by a pick up in inflation.
Throughout the period, one of the high-level assumptions that impacted our investment decisions was that broad economic growth would inevitably slow, but continue at a moderate pace. We felt the best way to capitalize on that assumption was to tilt the Fund toward companies more sensitive to business spending than consumer spending and toward larger, more established franchises. Consequently, we were pleased to see that business investment and hiring stepped up during the year. Our tilt away from the consumer was based on the belief that the benefits of tax cuts and a favorable interest rate environment would dissipate over time, but that didn’t happen to the extent we expected. The consumer remained fairly resilient throughout the period as confidence readings and spending were both healthy.
In our benchmarks, two sectors that advanced strongly were energy and materials, which came as no surprise given the rise in oil prices and other commodities. Most other sectors recorded solid double-digit gains, with technology the main laggard.
PERFORMANCE DISCUSSION
In the Fund, our security selection was strong relative to the Russell Midcap® Growth Index, although we were not optimally aligned to the best performing sectors. On a sector basis the largest contributor to Fund performance was the consumer discretionary sector, but a number of stocks in the materials, energy and transportation sectors also recorded strong gains. The weakest parts of the portfolio were the technology and producer durables sectors.
TOP 10 HOLDINGS
| | | |
| Company Name | | % | |
Aetna Inc. | | 1.6 | % |
Weatherford International Ltd. | | 1.5 | |
Caremark Rx, Inc. | | 1.5 | |
Smith International, Inc. | | 1.5 | |
EchoStar Communications Corporation | | 1.4 | |
Diebold, Incorporated | | 1.4 | |
MGIC Investment Corporation | | 1.4 | |
CIT Group Inc. | | 1.4 | |
Jabil Circuit, Inc. | | 1.4 | |
Precision Castparts Corp. | | 1.3 | |
Total | | 14.4 | % |
As a percentage of total net assets as of 9/30/04. Top 10 Holdings are determined by issuer.
In the consumer discretionary sector, two of our better performers were Robert Half International Inc. and Iron Mountain Incorporated, which benefited from the pick up in hiring. Robert Half is one of the world’s largest temporary and permanent staffing providers and Iron Mountain, a new addition early in the period, is the global leader in records and information management. We tend to think about these stocks as payroll related and tied to business spending, but our benchmark classifies them as consumer-oriented. Other meaningful gainers in the sector were outdoor advertiser Lamar Advertising Company, global Internet media company Yahoo! Inc., warehouse club operator Costco Wholesale Corporation and teen apparel retailer American Eagle Outfitters, Inc. Each company reported strong improvements in its business, but we would make special mention of American Eagle. Its share price increased over 80%, rising steadily throughout
07
SEVEN
our fiscal year. Among the factors that contributed to the stock’s ascent was good sales momentum driven by improved merchandise.
In a strong period for energy and materials stocks, our performance in each sector outpaced the growth benchmark sector return. Within the energy sector our best performers were Smith International, Inc. (a leading provider of drilling bits to the oil and gas industries), Weatherford International Ltd. (a top provider of oil and gas services) and EOG Resources, Inc. (an independent oil and gas driller). Smith produced solid results because it was able to push through some price increases due to robust demand for spending on exploration and production. In addition, the company took advantage of price declines to repurchase shares. Weatherford also instituted pricing increases and had good earnings, which were supported by better operating profitability as the company cut costs. EOG was purchased during the period with some very good initial returns. We were attracted to EOG’s strong return on investment, driven by a tight control over costs and history of successful reserve additions.
In the materials sector, our leading gainers were Smurfit Stone Container Corporation and Precision Castparts Corp. Smurfit is a container and packaging company and it benefited as demand for its products increased steadily throughout the period. Precision Castparts, a metal components manufacturer for the aerospace industry, was a new purchase. It gained market share, realized meaningful cost savings from an acquisition and strategically divested units to focus on its core end markets, which showed strength.
FUND STATISTICS
| | |
Net Assets | | $ 5.1 billion |
Number of Holdings | | 116 |
Median Market Cap | | $ 5.2 billion |
Weighted Average Market Cap | | $ 8.3 billion |
Weighted Average Growth Rate (3-5 yr) | | 16.8% |
Weighted Harmonic Average P/E (2004E) | | 22.2X |
Source: FactSet/Artisan Partners. All statistics are as of 9/30/04.
Overall, transportation stocks posted positive, although not robust, returns in our benchmarks. Three of our holdings recorded impressive gains leading to a strong performance contribution. Expeditors International of Washington, Inc., a global logistics provider; FedEx Corporation, the recognized leader in global express delivery; and PACCAR Inc., a producer of heavy-duty and medium-duty trucks, each advanced more than 30%. All three companies reported excellent earnings growth driven by healthy demand for their services.
Compared to the Russell Midcap® Growth Index, the performance of our technology holdings was mildly better and our exposure to the sector was fairly similar. On balance this meant that we held a slight advantage relative to the Index. However, the story was considerably different versus the Russell Midcap® Growth Index where we had a meaningfully larger exposure to technology and our stocks were weaker. In our opinion, this meant that investors were generally more concerned about valuation and risk than growth. While we were frustrated by that sentiment, we are growth investors and it did not deter our long-term strategy.
Some of the holdings that had a negative impact on performance included Seagate Technology, a hard disk drive manufacturer; Agere Systems Inc., an integrated circuits manufacturer; Broadcom Corporation, an integrated semiconductor developer and Vishay Intertechnology, Inc., a passive electronic components manufacturer. Seagate was pressured by pricing concerns. Agere, Broadcom and Vishay were under particular strain late in the fiscal year as a variety of data pointed to excess supply and moderating demand for their products. We sold Agere and Vishay. The positions we held in technology that had strong showings during the year and offset some of the weakness in those names were enterprise communications systems provider Avaya Inc., personal computer manufacturer Apple Computer, Inc., digital imaging company Adobe Systems Incorporated and storage semiconductor producer PMC-Sierra, Inc. We sold Apple and PMC-Sierra into the share price strength.
08
EIGHT
Danaher Corporation, a diversified industrial and consumer products company, was a standout performer in the producer durables sector. It produced profitability levels that were near historically high levels and announced acquisitions that were expected to add to earnings. However, Danaher’s performance gains were offset by several of our technology-related producer durables. Among those that declined were KLA-Tencor Corporation, Andrew Corporation, Lam Research Corporation and Novellus Systems, Inc., which we ultimately sold. Lam Research is a semiconductor equipment manufacturer that we purchased during the fiscal year. Its share price weakness provided us with an opportunity to initiate our position.
FUND CHANGES
Throughout the fiscal year and at its close, our portfolio was tilted toward companies sensitive to business spending. We also had a skew toward companies at the larger end of our market capitalization range. The sector positioning of the Fund changed the most during the year in technology, financial services, healthcare and materials.
| | | | | | |
| SECTOR DIVERSIFICATION Sector | | 9/30/03 | | | 9/30/04 | |
Auto & Transportation | | 5.2 | % | | 4.0 | % |
Consumer Discretionary | | 24.1 | | | 24.9 | |
Consumer Staples | | 1.6 | | | 2.1 | |
Financial Services | | 12.4 | | | 10.3 | |
Healthcare | | 13.3 | | | 16.6 | |
Integrated Oils | | - | | | - | |
Materials & Processing | | 3.0 | | | 8.1 | |
Other | | 0.4 | | | 2.4 | |
Other Energy | | 4.8 | | | 5.0 | |
Producer Durables | | 7.8 | | | 8.1 | |
Technology | | 22.2 | | | 14.9 | |
Utilities | | 0.7 | | | 0.9 | |
Other assets less liabilities | | 4.5 | | | 2.7 | |
Total | | 100.0 | % | | 100.0 | % |
As a percentage of total net assets as of 9/30/03 and 9/30/04, respectively.
The decrease in our technology weighting was due in part to the weak performance of the group when compared to the other sectors, but we also made a few select sales in addition to those discussed above. We sold Nortel Networks Corporation, Rockwell Automation Inc., Veritas Software Corporation and BEA Systems, Inc. to realize gains. We sold McAfee, Inc. (formerly Network Associates, Inc.) and Amdocs Limited in favor of other alternatives. Partially offsetting the sales were investments in Jabil Circuit, Inc. (electronic manufacturing services), Macromedia, Inc. (develops software to deliver content on the Internet) and TIBCO Software Inc. (integration software provider).
Our position in financial services is lower because we believed that the next move for interest rates would be higher and financial stocks have historically been sensitive to moves in rates. Thus when stocks such as T. Rowe Price Group, Inc., Platinum Underwriters Holdings, Ltd., Fiserv, Inc. and SEI Investments Company reached our target prices, we sold them and redeployed most of the capital into other areas.
The healthcare and materials sectors saw the largest increases as a percentage of portfolio assets. Neither change was the result of a broader view about the sectors. Our investment discipline led us to a number of quality franchises in those areas, including healthcare benefits provider Aetna Inc., which was our largest holding at the end of the period, radiation therapy systems producer Varian Medical Systems, Inc., foodservice products provider Ecolab Inc., gas and chemicals distributor Air Products and Chemicals, Inc. and Precision Castparts.
09
NINE
ARTISAN INTERNATIONAL FUND
Schedule of Investments – September 30, 2004
| | | | | |
| | | Shares Held
| | Value
|
| | | | | | |
COMMON AND
PREFERRED STOCKS - 98.8% | | | | | |
| | | | | | |
| AUSTRALIA - 0.5% | | | | | |
Commonwealth Bank of Australia | | 2,231,694 | | $ | 48,796,218 |
| | | | | | |
| AUSTRIA - 0.2% | | | | | |
Erste Bank der oesterreichischen Sparkassen AG | | 400,400 | | | 16,656,091 |
| | | | | | |
| BELGIUM - 1.5% | | | | | |
InBev | | 4,514,222 | | | 150,452,579 |
| | | | | | |
| BRAZIL - 2.1% | | | | | |
Banco Bradesco S.A. (ADR) | | 78,350 | | | 4,129,045 |
Banco Bradesco S.A., Preferred | | 529,339 | | | 27,901,849 |
Banco Itau Holding Financeira S.A., Preferred | | 178,301,400 | | | 19,800,873 |
Companhia de Bebidas das Americas (Ambev), Preferred (ADR) | | 973,000 | | | 21,795,200 |
Petroleo Brasileiro S.A. (ADR) | | 1,937,200 | | | 68,286,300 |
Telesp Celular Participacoes S.A., Preferred (ADR)(1) | | 10,109,200 | | | 62,474,856 |
| | | | |
|
|
| | | | | | 204,388,123 |
| CANADA - 2.9% | | | | | |
Corus Entertainment, Inc., Class B | | 3,015,450 | | | 56,007,173 |
EnCana Corporation | | 4,393,600 | | | 202,621,269 |
Nortel Networks Corporation(1) | | 8,269,700 | | | 28,116,980 |
| | | | |
|
|
| | | | | | 286,745,422 |
| CHINA - 1.6% | | | | | |
China Mobile (Hong Kong) Limited | | 36,686,000 | | | 111,260,935 |
Citic Pacific Limited | | 18,818,400 | | | 48,384,725 |
| | | | |
|
|
| | | | | | 159,645,660 |
| CZECH REPUBLIC - 0.9% | | | | | |
Cesky Telecom, A.S. | | 6,794,605 | | | 90,345,259 |
| | | | | | |
| DENMARK - 1.1% | | | | | |
H. Lundbeck A/S | | 997,550 | | | 18,061,606 |
Novo Nordisk A/S, Class B | | 1,651,950 | | | 90,419,625 |
| | | | |
|
|
| | | | | | 108,481,231 |
| FRANCE - 4.8% | | | | | |
Credit Agricole S.A. | | 1,919,465 | | | 52,341,570 |
JC Decaux S.A.(1) | | 8,233,500 | | | 187,098,278 |
LVMH Moet Hennessy Louis Vuitton S.A. | | 280,790 | | | 18,741,067 |
| | | | | |
| | | Shares Held
| | Value
|
| | | | | | |
| FRANCE (CONTINUED) | | | |
M6 Metropole Television | | 1,460,700 | | $ | 39,069,778 |
PagesJaunes S.A.(1) | | 4,236,198 | | | 81,376,831 |
Total S.A. | | 453,100 | | | 92,272,465 |
| | | | |
|
|
| | | | | | 470,899,989 |
| GERMANY - 7.9% | | | | | |
Allianz AG | | 1,998,032 | | | 201,188,870 |
Deutsche Boerse AG | | 1,840,621 | | | 93,069,280 |
Henkel KGaA | | 293,230 | | | 21,544,885 |
KDG Investors, L.P.(1)(2)(3) | | - | | | - |
Linde AG | | 2,675,916 | | | 154,178,803 |
Muenchener Rueckversicherungs-Gesellschaft AG | | 1,852,039 | | | 178,370,134 |
ProSiebenSat.1 Media AG, Preferred | | 5,884,866 | | | 108,443,791 |
Schering AG | | 249,600 | | | 15,760,491 |
| | | | |
|
|
| | | | | | 772,556,254 |
| GREECE - 0.3% | | | | | |
OPAP S.A. | | 1,372,570 | | | 26,349,853 |
| | | | | | |
| HONG KONG - 0.9% | | | | | |
Hang Lung Group Limited | | 607,700 | | | 950,737 |
Hong Kong & China Gas Company Limited | | 24,395,700 | | | 45,831,293 |
Sun Hung Kai Properties Limited | | 3,889,400 | | | 36,659,045 |
| | | | |
|
|
| | | | | | 83,441,075 |
| ITALY - 3.2% | | | | | |
Assicurazioni Generali S.p.A | | 881,500 | | | 24,223,558 |
Banca Intesa S.p.A | | 15,259,606 | | | 57,982,770 |
Eni S.p.A. | | 5,141,717 | | | 115,180,488 |
Saipem S.p.A. | | 9,955,747 | | | 111,881,078 |
| | | | |
|
|
| | | | | | 309,267,894 |
| JAPAN - 18.5% | | | | | |
AEON Co., Ltd. | | 221,100 | | | 3,559,430 |
AEON Co., Ltd. - When Issued(1) | | 221,100 | | | 3,523,314 |
All Nippon Airways Co., Ltd. | | 7,781,000 | | | 24,925,750 |
The Bank of Yokohama, Ltd. | | 19,639,000 | | | 105,506,493 |
CANON Inc. | | 782,100 | | | 36,764,626 |
Credit Saison Co., Ltd. | | 4,474,500 | | | 137,651,935 |
East Japan Railway Co. | | 18,678 | | | 96,614,729 |
The Fuji Fire and Marine Insurance Co., Ltd. | | 804,900 | | | 2,549,209 |
Fuji Television Network, Inc. | | 18,908 | | | 38,435,428 |
Honda Motor Co., Ltd. | | 4,826,300 | | | 233,880,321 |
Japan Airlines Corp. | | 19,202,000 | | | 52,624,929 |
KEYENCE Corp. | | 332,350 | | | 69,911,276 |
10
TEN
SCHEDULE OF INVESTMENTS
| | | | | |
| | | Shares Held
| | Value
|
| | | | | | |
| JAPAN (CONTINUED) | | | |
KOMATSU Ltd. | | 3,417,300 | | $ | 21,956,063 |
Mizuho Financial Group, Inc. | | 15,556 | | | 58,443,523 |
Nikko Cordial Corp. | | 33,866,200 | | | 137,376,391 |
Nippon Broadcasting System, Inc. | | 194,940 | | | 9,022,134 |
Nomura Holdings, Inc. | | 6,233,000 | | | 80,037,161 |
Olympus Corp. | | 3,666,200 | | | 70,698,988 |
ORIX Corp. | | 1,096,000 | | | 112,389,854 |
Promise Co., Ltd. | | 2,126,400 | | | 139,129,216 |
SAMMY Corp. | | 397,800 | | | 19,493,806 |
Sankyo Co., Ltd. | | 67,500 | | | 2,664,595 |
SEGA Corp.(1) | | 1,437,900 | | | 19,429,494 |
Seven-Eleven Japan Co., Ltd. | | 604,000 | | | 17,265,756 |
SMC Corp. | | 720,800 | | | 69,008,939 |
The Sumitomo Trust & Banking Co., Ltd. | | 15,557,500 | | | 92,050,365 |
Tokyo Broadcasting System, Inc. | | 2,692,900 | | | 42,008,214 |
TOKYU Corp. | | 15,911,400 | | | 72,485,347 |
Yamato Transport Co., Ltd. | | 2,597,300 | | | 35,755,743 |
| | | | |
|
|
| | | | | | 1,805,163,029 |
| LUXEMBOURG - 0.5% | | | | | |
RTL Group | | 849,486 | | | 50,727,705 |
| | | | | | |
| MEXICO - 3.2% | | | | | |
Cemex S.A. de C.V. (ADR) | | 825,600 | | | 23,232,384 |
Grupo Televisa S.A. (ADR) | | 3,508,500 | | | 185,003,205 |
Wal-Mart de Mexico S.A. de C.V.,
Series V | | 29,419,200 | | | 99,889,889 |
| | | | |
|
|
| | | | | | 308,125,478 |
| NETHERLANDS - 5.3% | | | | | |
ASML Holding N.V.(1) | | 9,557,746 | | | 122,955,922 |
ASML Holding N.V., NY Shares(1)(4) | | 1,394,500 | | | 17,947,215 |
Fortis | | 12,360,376 | | | 293,770,260 |
Unilever N.V. | | 1,488,700 | | | 85,626,847 |
| | | | |
|
|
| | | | | | 520,300,244 |
| NORWAY - 1.0% | | | | | |
Telenor ASA | | 12,702,300 | | | 96,712,752 |
| | | | | | |
| REPUBLIC OF KOREA - 0.1% | | | | | |
Kookmin Bank(1) | | 288,900 | | | 9,144,946 |
| | | | | | |
| RUSSIA - 2.0% | | | | | |
Gazprom (ADR)(1) | | 637,709 | | | 22,829,982 |
LUKOIL (ADR) | | 897,700 | | | 111,988,075 |
Sibneft (ADR) | | 1,734,598 | | | 59,462,020 |
| | | | |
|
|
| | | | | | 194,280,077 |
| SINGAPORE - 2.3% | | | | | |
DBS Group Holdings Ltd. | | 10,968,734 | | | 104,200,531 |
Singapore Airlines Ltd. | | 5,808,000 | | | 37,587,769 |
Singapore Telecommunications Ltd. | | 55,724,970 | | | 77,421,065 |
| | | | |
|
|
| | | | | | 219,209,365 |
| | | | | |
| | | Shares Held
| | Value
|
| | | | | | |
| SPAIN - 5.4% | | | | | |
Altadis, S.A. | | 3,258,584 | | $ | 110,869,910 |
Amadeus Global Travel Distribution S.A. | | 3,900,272 | | | 30,850,950 |
Banco Bilbao Vizcaya Argentaria, S.A. | | 4,043,970 | | | 55,639,331 |
Industria de Diseno Textil, S.A. | | 1,823,613 | | | 45,062,986 |
Promotora de Informaciones, S.A. | | 8,307,954 | | | 153,198,583 |
Telefonica, S.A. | | 8,554,780 | | | 128,005,934 |
| | | | |
|
|
| | | | | | 523,627,694 |
| SWEDEN - 3.3% | | | | | |
Hennes & Mauritz AB, Class B | | 385,350 | | | 10,602,810 |
Telefonaktiebolaget LM Ericsson, Class B(1) | | 62,726,100 | | | 194,539,572 |
Telefonaktiebolaget LM Ericsson (ADR)(1) | | 3,795,000 | | | 118,555,800 |
| | | | |
|
|
| | | | | | 323,698,182 |
| SWITZERLAND - 11.5% | | | | | |
Clariant AG(5) | | 13,411,333 | | | 160,753,200 |
Credit Suisse Group | | 5,336,231 | | | 170,494,131 |
Julius Baer Holding, Ltd. Class B | | 270,024 | | | 74,149,705 |
Nestle S.A. | | 910,836 | | | 208,858,766 |
Roche Holding AG | | 1,194,000 | | | 123,492,483 |
Serono S.A. | | 161,556 | | | 99,867,449 |
UBS AG | | 4,033,081 | | | 284,231,565 |
| | | | |
|
|
| | | | | | 1,121,847,299 |
| TAIWAN - 1.0% | | | | | |
Chunghwa Telecom Co., Ltd. (ADR) | | 5,287,400 | | | 93,111,114 |
| | | | | | |
| THAILAND - 0.1% | | | | | |
Advanced Info Service PLC(2) | | 5,588,500 | | | 13,231,020 |
| | | | | | |
| UNITED KINGDOM - 16.7% | | | | | |
Allied Domecq PLC | | 5,276,513 | | | 44,784,349 |
AstraZeneca PLC | | 297,300 | | | 12,186,234 |
BP PLC | | 3,972,100 | | | 37,918,317 |
British American Tobacco PLC | | 414,500 | | | 6,008,464 |
British Sky Broadcasting Group PLC | | 20,130,407 | | | 174,590,692 |
Carnival PLC | | 470,701 | | | 23,144,147 |
Compass Group PLC | | 30,684,496 | | | 122,443,010 |
Diageo PLC | | 6,991,951 | | | 87,307,967 |
GlaxoSmithKline PLC | | 458,600 | | | 9,884,443 |
Imperial Chemical Industries PLC | | 33,483,520 | | | 127,855,664 |
ITV PLC | | 130,783,280 | | | 255,020,982 |
Kesa Electricals PLC | | 12,283,370 | | | 62,908,652 |
Kingfisher PLC | | 48,552,610 | | | 270,845,782 |
Marks & Spencer Group PLC | | 4,343,305 | | | 26,960,060 |
Pearson PLC | | 6,429,200 | | | 68,762,368 |
Tesco PLC | | 50,982,868 | | | 263,182,087 |
William Morrison Supermarkets PLC | | 9,694,000 | | | 33,770,708 |
| | | | |
|
|
| | | | | | 1,627,573,926 |
| | | | |
|
|
Total common and preferred stocks
(Cost $8,361,282,308) | | | | | 9,634,778,479 |
11
ELEVEN
SCHEDULE OF INVESTMENTS
| | | | | | |
| | | Par Amount
| | Value
|
| SHORT-TERM INVESTMENTS (CASH EQUIVALENTS) - 0.7% | | | | | | |
Repurchase agreement with State Street Bank and Trust Company, 1.50%, dated 9/30/04, due 10/1/04, maturity value $68,419,851, collateralized by $51,001,746 market value
Federal National Mortgage Association Note,
5.250%, due 6/15/06 and $18,786,437 market value
Federal National Mortgage Association Note,
1.875%, due 1/15/05
(Cost $68,417,000) | | $ | 68,417,000 | | $ | 68,417,000 |
| | | | | |
|
|
| | | | | | | |
Total investments - 99.5%
(Cost $8,429,699,308) | | | | | | 9,703,195,479 |
| | | | | | | |
Other assets less liabilities - 0.5% | | | | | | 49,084,544 |
| | | | | |
|
|
| | | | | | | |
Total net assets - 100.0%(6) | | | | | $ | 9,752,280,023 |
| | | | | |
|
|
| (1) | Non-income producing security. |
| (2) | Valued at a fair value in accordance with procedures established by the Board of Directors of Artisan Funds. |
| (3) | Private investment partnership which is restricted as to resale. Total investment cost of $10 million, made through capital contributions on 3/6/00, 7/10/00, and 5/15/01. Value at September 30, 2004 represents 0.0% of total net assets. |
| (4) | Principally traded in the United States. |
| (5) | Affiliated company as defined by the Investment Company Act of 1940. See Note 6 to the financial statements. |
| (6) | Percentages for the various classifications relate to total net assets. |
(ADR) American Depository Receipt
| | | | | | |
| PORTFOLIO DIVERSIFICATION - SEPTEMBER 30, 2004 | |
| | | Value
| | Percentage
| |
Consumer Discretionary | | $ | 2,331,291,745 | | 23.9 | % |
Consumer Staples | | | 1,158,440,150 | | 11.9 | |
Energy | | | 799,610,010 | | 8.2 | |
Financials | | | 2,618,834,659 | | 26.8 | |
Healthcare | | | 440,371,321 | | 4.5 | |
Industrials | | | 459,343,992 | | 4.7 | |
Information Technology | | | 619,642,341 | | 6.4 | |
Materials | | | 466,020,050 | | 4.8 | |
Telecommunication Services | | | 672,562,936 | | 6.9 | |
Utilities | | | 68,661,275 | | 0.7 | |
| | |
|
| |
|
|
Total common and preferred
stocks | | | 9,634,778,479 | | 98.8 | |
Total short-term investments | | | 68,417,000 | | 0.7 | |
| | |
|
| |
|
|
Total investments | | | 9,703,195,479 | | 99.5 | |
Other assets less liabilities | | | 49,084,544 | | 0.5 | |
| | |
|
| |
|
|
Total net assets | | $ | 9,752,280,023 | | 100.0 | % |
| | |
|
| |
|
|
The accompanying notes are an integral part of the financial statements.
12
TWELVE
ARTISAN MID CAP FUND
Schedule of Investments – September 30, 2004
| | | | | |
| | | Shares
Held
| | Value
|
| | | | | | |
| COMMON STOCKS - 97.3% | | | | | |
| | | | | | |
| AUTO & TRANSPORTATION - 4.0% | | | |
Air Transport - 2.5% | | | | | |
Expeditors International of Washington, Inc. | | 1,010,000 | | $ | 52,217,000 |
FedEx Corporation | | 535,800 | | | 45,912,702 |
JetBlue Airways Corporation(1) | | 1,474,600 | | | 30,848,632 |
| | | | |
|
|
| | | | | | 128,978,334 |
Auto Trucks & Parts - 1.5% | | | | | |
Gentex Corporation | | 355,600 | | | 12,492,228 |
PACCAR Inc. | | 952,600 | | | 65,843,712 |
| | | | |
|
|
| | | | | | 78,335,940 |
| CONSUMER DISCRETIONARY - 24.9% | | | |
Advertising Agencies - 1.7% | | | |
Dex Media, Inc.(1) | | 999,500 | | | 21,159,415 |
Lamar Advertising Company(1) | | 1,623,800 | | | 67,566,318 |
| | | | |
|
|
| | | | | | 88,725,733 |
Cable Television Services - 1.4% | | | |
EchoStar Communications Corporation(1) | | 2,352,600 | | | 73,212,912 |
| | | | | | |
Consumer Electronics - 1.8% | | | |
VeriSign, Inc.(1) | | 1,478,000 | | | 29,382,640 |
Yahoo! Inc.(1) | | 1,888,800 | | | 64,049,208 |
| | | | |
|
|
| | | | | | 93,431,848 |
Education Services - 0.5% | | | | | |
Corinthian Colleges, Inc.(1) | | 2,047,800 | | | 27,604,344 |
| | | | | | |
Leisure Time - 0.7% | | | | | |
Royal Caribbean Cruises Ltd. | | 858,100 | | | 37,413,160 |
| | | | | | |
Radio & TV Broadcasters - 1.4% | | | |
Entercom Communications Corp.(1) | | 450,600 | | | 14,716,596 |
Univision Communications Inc.(1) | | 1,815,600 | | | 57,391,116 |
| | | | |
|
|
| | | | | | 72,107,712 |
Restaurants - 1.7% | | | | | |
Starbucks Corporation(1) | | 595,000 | | | 27,048,700 |
YUM! Brands, Inc. | | 1,451,300 | | | 59,009,858 |
| | | | |
|
|
| | | | | | 86,058,558 |
Retail - 9.9% | | | | | |
Amazon.com, Inc.(1) | | 1,271,000 | | | 51,933,060 |
American Eagle Outfitters, Inc. | | 745,000 | | | 27,453,250 |
Bed Bath & Beyond Inc.(1) | | 448,500 | | | 16,643,835 |
| | | | | |
| | | Shares
Held
| | Value
|
| | | | | | |
| CONSUMER DISCRETIONARY (CONTINUED) | | | |
Retail (Continued) | | | | | |
CarMax, Inc.(1) | | 1,851,300 | | $ | 39,895,515 |
CDW Corporation | | 993,800 | | | 57,670,214 |
Chico’s FAS, Inc.(1) | | 700,900 | | | 23,970,780 |
Costco Wholesale Corporation | | 924,400 | | | 38,418,064 |
Fisher Scientific International Inc.(1) | | 1,060,400 | | | 61,853,132 |
Kohl’s Corporation(1) | | 1,399,100 | | | 67,422,629 |
Linens ‘n Things, Inc.(1) | | 793,600 | | | 18,387,712 |
Nordstrom, Inc. | | 664,300 | | | 25,402,832 |
Ross Stores, Inc. | | 727,100 | | | 17,043,224 |
Staples, Inc. | | 1,874,500 | | | 55,897,590 |
| | | | |
|
|
| | | | | | 501,991,837 |
Services: Commercial - 5.0% | | | | | |
Accenture Ltd., Class A(1) | | 1,961,400 | | | 53,055,870 |
Getty Images, Inc.(1) | | 962,000 | | | 53,198,600 |
Hewitt Associates, Inc.(1) | | 1,566,700 | | | 41,454,882 |
Iron Mountain Incorporated(1) | | 1,830,200 | | | 61,952,270 |
Robert Half International Inc. | | 1,802,196 | | | 46,442,591 |
| | | | |
|
|
| | | | | | 256,104,213 |
Textiles: Apparel
Manufacturers - 0.8% | | | | | |
Jones Apparel Group, Inc. | | 1,067,600 | | | 38,220,080 |
| | | | | | |
| CONSUMER STAPLES - 2.1% | | | | | |
Beverage: Brewers
(Wineries) - 1.3% | | | | | |
Constellation Brands, Inc.(1) | | 1,680,800 | | | 63,971,248 |
| | | | | | |
Beverage: Soft Drinks - 0.0%(2) | | | |
Cott Corporation(1) | | 40,900 | | | 1,179,556 |
| | | | | | |
Drug & Grocery Store Chains - 0.8% | | | |
Whole Foods Market, Inc. | | 453,300 | | | 38,888,607 |
| | | | | | |
| FINANCIAL SERVICES - 10.3% | | | |
Banks: Outside New York City - 0.9% | | | |
North Fork Bancorporation, Inc. | | 1,016,400 | | | 45,178,980 |
| | | | | | |
Diversified Financial Services - 1.4% | | | |
CIT Group Inc. | | 1,859,400 | | | 69,522,966 |
| | | | | | |
Finance: Small Loan - 0.0%(2) | | | |
The First Marblehead Corporation(1) | | 32,800 | | | 1,521,920 |
13
THIRTEEN
SCHEDULE OF INVESTMENTS
| | | | | |
| | | Shares
Held
| | Value
|
| | | | | | |
| FINANCIAL SERVICES (CONTINUED) | | | |
Financial Data Processing Services & Systems - 1.7% | | | | | |
CheckFree Corporation(1) | | 955,700 | | $ | 26,444,219 |
Paychex, Inc. | | 2,038,600 | | | 61,463,790 |
| | | | |
|
|
| | | | | | 87,908,009 |
Financial Miscellaneous - 3.4% | | | | | |
CapitalSource Inc.(1) | | 2,310,200 | | | 51,609,868 |
MGIC Investment Corporation | | 1,060,700 | | | 70,589,585 |
Willis Group Holdings Limited | | 1,283,600 | | | 48,006,640 |
| | | | |
|
|
| | | | | | 170,206,093 |
Insurance: Property-Casualty - 0.2% | | | |
RenaissanceRe Holdings Ltd. | | 214,700 | | | 11,074,226 |
| | | | | | |
Rental & Leasing Services: Commercial - 0.4% | | | | | |
GATX Corporation | | 780,700 | | | 20,813,462 |
| | | | | | |
Savings & Loans - 0.8% | | | | | |
Golden West Financial Corporation | | 376,800 | | | 41,805,960 |
| | | | | | |
Securities Brokerage &
Services - 1.5% | | | | | |
Ameritrade Holding Corporation(1) | | 3,739,500 | | | 44,911,395 |
The Bear Stearns Companies Inc. | | 302,800 | | | 29,120,276 |
| | | | |
|
|
| | | | | | 74,031,671 |
| HEALTHCARE - 16.6% | | | | | |
Biotechnology Research & Production - 3.5% | | | | | |
Chiron Corporation(1) | | 1,026,200 | | | 45,358,040 |
ICOS Corporation(1) | | 1,224,000 | | | 29,547,360 |
Invitrogen Corporation(1) | | 1,111,300 | | | 61,110,387 |
Millennium Pharmaceuticals, Inc.(1) | | 2,888,700 | | | 39,604,077 |
| | | | |
|
|
| | | | | | 175,619,864 |
Drugs & Pharmaceuticals - 4.3% | | | |
Allergan, Inc. | | 658,900 | | | 47,803,195 |
Barr Pharmaceuticals, Inc.(1) | | 599,000 | | | 24,816,570 |
Hospira, Inc.(1) | | 1,228,600 | | | 37,595,160 |
IVAX Corporation(1) | | 1,892,525 | | | 36,241,853 |
MedImmune, Inc.(1) | | 1,527,000 | | | 36,189,900 |
Mylan Laboratories Inc. | | 2,117,800 | | | 38,120,400 |
| | | | |
|
|
| | | | | | 220,767,078 |
Electronics: Medical Systems - 1.0% | | | |
Varian Medical Systems, Inc.(1) | | 1,468,200 | | | 50,755,674 |
| | | | | | |
Health Care Facilities - 0.5% | | | | | |
DaVita Inc.(1) | | 888,300 | | | 27,670,545 |
| | | | | | |
Health Care Management Services - 4.8% | | | | | |
Aetna Inc. | | 790,300 | | | 78,974,679 |
| | | | | |
| | | Shares
Held
| | Value
|
| | | | | | |
| HEALTHCARE (CONTINUED) | | | |
Health Care Management Services (Continued) | | | | | |
Caremark Rx, Inc.(1) | | 2,425,100 | | $ | 77,772,957 |
Cerner Corporation(1) | | 1,156,200 | | | 50,017,212 |
IMS Health Incorporated | | 1,561,700 | | | 37,355,864 |
| | | | |
|
|
| | | | | | 244,120,712 |
Health Care Services - 0.2% | | | | | |
Stericycle, Inc.(1) | | 221,200 | | | 10,153,080 |
| | | | | | |
Medical & Dental Instruments & Supplies - 2.3% | | | | | |
Boston Scientific Corporation(1) | | 1,590,100 | | | 63,174,673 |
Zimmer Holdings, Inc.(1) | | 645,700 | | | 51,036,128 |
| | | | |
|
|
| | | | | | 114,210,801 |
| MATERIALS & PROCESSING - 8.1% | | | |
Chemicals - 2.5% | | | | | |
Air Products and Chemicals, Inc. | | 1,214,000 | | | 66,017,320 |
Ecolab Inc. | | 1,858,100 | | | 58,418,664 |
| | | | |
|
|
| | | | | | 124,435,984 |
Containers & Packaging: Paper & Plastic - 1.1% | | | | | |
Smurfit-Stone Container Corporation(1) | | 2,867,200 | | | 55,537,664 |
| | | | | | |
Copper - 0.7% | | | | | |
Freeport-McMoRan Copper & Gold Inc. | | 841,200 | | | 34,068,600 |
| | | | | | |
Diversified Materials & Processing - 0.7% | | | | | |
American Standard Companies Inc.(1) | | 846,600 | | | 32,941,206 |
| | | | | | |
Metal Fabricating - 1.3% | | | | | |
Precision Castparts Corp. | | 1,136,700 | | | 68,258,835 |
| | | | | | |
Office Supplies - 0.8% | | | | | |
Avery Dennison Corporation | | 596,700 | | | 39,250,926 |
| | | | | | |
Real Estate - 1.0% | | | | | |
The St. Joe Company | | 1,096,600 | | | 52,384,582 |
| | | | | | |
| OTHER - 2.4% | | | | | |
Multi-Sector Companies - 2.4% | | | | | |
Brunswick Corporation(1) | | 495,000 | | | 22,651,200 |
Eaton Corporation | | 984,600 | | | 62,433,486 |
ITT Industries, Inc. | | 460,900 | | | 36,867,391 |
| | | | |
|
|
| | | | | | 121,952,077 |
| OTHER ENERGY - 5.0% | | | | | |
Coal - 0.3% | | | | | |
Peabody Energy Corporation | | 223,300 | | | 13,286,350 |
14
FOURTEEN
SCHEDULE OF INVESTMENTS
| | | | | |
| | | Shares
Held
| | Value
|
| | | | | | |
| OTHER ENERGY (CONTINUED) | | | |
Machinery: Oil Well Equipment & Services - 3.3% | | | | | |
Noble Corporation(1) | | 315,300 | | | $ 14,172,735 |
Smith International, Inc.(1) | | 1,250,400 | | | 75,936,792 |
Weatherford International Ltd.(1) | | 1,524,500 | | | 77,779,990 |
| | | | |
|
|
| | | | | | 167,889,517 |
Oil: Crude Producers - 1.4% | | | | | |
Devon Energy Corporation | | 350,100 | | | 24,860,601 |
EOG Resources, Inc. | | 721,700 | | | 47,523,945 |
| | | | |
|
|
| | | | | | 72,384,546 |
| | | | | | |
| PRODUCER DURABLES - 8.1% | | | | | |
Diversified Production - 1.2% | | | | | |
Danaher Corporation | | 1,225,300 | | | 62,833,384 |
| | | | | | |
Electrical Equipment & Components - 1.1% | | | | | |
Molex Incorporated | | 1,815,500 | | | 54,138,210 |
| | | | | | |
Electronics: Instruments Gauges & Meters - 1.2% | | | | | |
Thermo Electron Corporation(1) | | 2,311,700 | | | 62,462,134 |
| | | | | | |
Machinery: Industrial/
Specialty - 0.3% | | | |
Joy Global Inc. | | 390,300 | | | 13,418,514 |
| | | | | | |
Office Furniture & Business Equipment - 2.4% | | | | | |
Diebold, Incorporated | | 1,551,800 | | | 72,469,060 |
Lexmark International, Inc.(1) | | 556,700 | | | 46,768,367 |
| | | | |
|
|
| | | | | | 119,237,427 |
Production Technology Equipment - 1.0% | | | | | |
Lam Research Corporation(1) | | 2,241,000 | | | 49,033,080 |
| | | | | | |
Telecommunications
Equipment - 0.9% | | | | | |
Andrew Corporation(1) | | 3,523,000 | | | 43,121,520 |
| | | | | |
| | | Shares
Held
| | Value
|
| | | | | | |
| TECHNOLOGY - 14.9% | | | | | |
Communications Technology - 5.8% | | | |
Avaya Inc.(1) | | 3,837,200 | | $ | 53,490,568 |
Avocent Corporation(1) | | 1,091,900 | | | 28,422,157 |
Corning Incorporated(1) | | 4,568,500 | | | 50,618,980 |
Juniper Networks, Inc.(1) | | 1,670,600 | | | 39,426,160 |
Scientific-Atlanta, Inc. | | 1,440,000 | | | 37,324,800 |
Symbol Technologies, Inc. | | 3,541,200 | | | 44,760,768 |
TIBCO Software Inc.(1) | | 4,758,900 | | | 40,498,239 |
| | | | |
|
|
| | | | | | 294,541,672 |
Computer Services Software & Systems - 4.0% | | | | | |
Adobe Systems Incorporated | | 1,223,900 | | | 60,546,333 |
Cognos Incorporated(1) | | 989,200 | | | 35,136,384 |
Macromedia, Inc.(1) | | 2,017,600 | | | 40,513,408 |
Mercury Interactive Corporation(1) | | 282,000 | | | 9,836,160 |
Novell, Inc.(1) | | 3,711,500 | | | 23,419,565 |
Seagate Technology(1) | | 2,617,100 | | | 35,383,192 |
| | | | |
|
|
| | | | | | 204,835,042 |
Computer Technology - 0.7% | | | |
Network Appliance, Inc.(1) | | 1,512,500 | | | 34,787,500 |
| | | | | | |
Electronics: Semi-Conductors/ Components - 4.4% | | | | | |
Altera Corporation(1) | | 727,600 | | | 14,239,132 |
Broadcom Corporation(1) | | 1,363,600 | | | 37,212,644 |
Jabil Circuit, Inc.(1) | | 2,985,600 | | | 68,668,800 |
Linear Technology Corporation | | 1,050,100 | | | 38,055,624 |
National Semiconductor Corporation | | 1,422,600 | | | 22,036,074 |
Xilinx, Inc. | | 1,518,200 | | | 40,991,400 |
| | | | |
|
|
| | | | | | 221,203,674 |
| UTILITIES - 0.9% | | | | | |
Utilities: Telecommunications - 0.9% | | | |
Western Wireless Corporation(1) | | 1,848,300 | | | 47,519,793 |
| | | | |
|
|
Total common stocks
(Cost $4,342,901,088) | | | | | 4,941,107,360 |
15
FIFTEEN
SCHEDULE OF INVESTMENTS
| | | | | | | |
| | | Par
Amount
| | Value
| |
| | | | | | | | |
| SHORT-TERM INVESTMENTS (CASH EQUIVALENTS) - 2.8% | | | | | | | |
Repurchase agreement with State Street Bank and Trust Company, 1.50%, dated 9/30/04, due 10/1/04, maturity value $140,996,875, collateralized by $102,003,215 market value Federal National Mortgage Association Note,
1.875%, due 2/15/05, and $41,811,736 market value Federal National Mortgage Association Note,
1.875%, due 1/15/05
(Cost $140,991,000) | | $ | 140,991,000 | | $ | 140,991,000 | |
| | | | | |
|
|
|
| | | | | | | | |
Total investments - 100.1%
(Cost $4,483,892,088) | | | | | | 5,082,098,360 | |
| | | | | | | | |
Other assets less liabilities - (0.1%) | | | (3,399,851 | ) |
| | | | | |
|
|
|
| | | | | | | | |
Total net assets - 100.0%(3) | | | | | $ | 5,078,698,509 | |
| | | | | |
|
|
|
| (1) | Non-income producing security. |
| (2) | Represents less than 0.1% of total net assets. |
| (3) | Percentages for the various classifications relate to total net assets. |
The accompanying notes are an integral part of the financial statements.
16
SIXTEEN
ARTISAN FUNDS, INC.
Statements of Assets and Liabilities – September 30, 2004
| | | | | | | | |
| | | INTERNATIONAL
| | | MID CAP
| |
| ASSETS: | | | | | | | | |
Investments in securities, unaffiliated, at value | | $ | 9,474,025,279 | | | $ | 4,941,107,360 | |
Investments in securities, affiliated, at value | | | 160,753,200 | | | | - | |
Short-term investments (repurchase agreements), at value | | | 68,417,000 | | | | 140,991,000 | |
| | |
|
|
| |
|
|
|
Total investments | | | 9,703,195,479 | | | | 5,082,098,360 | |
Cash | | | 655 | | | | 830 | |
Receivable from investments sold | | | 50,676,433 | | | | 92,058,343 | |
Unrealized gain on foreign currency forward contracts | | | 40,569 | | | | - | |
Receivable from fund shares sold | | | 31,009,853 | | | | 24,482,859 | |
Dividends and interest receivable | | | 28,644,194 | | | | 1,096,897 | |
| | |
|
|
| |
|
|
|
Total assets | | | 9,813,567,183 | | | | 5,199,737,289 | |
| | |
| LIABILITIES: | | | | | | | | |
Payable for investments purchased | | | 51,669,681 | | | | 96,628,807 | |
Unrealized loss on foreign currency forward contracts | | | - | | | | - | |
Payable for fund shares redeemed | | | 3,589,320 | | | | 22,790,559 | |
Payable for operating expenses | | | 2,895,915 | | | | 1,619,414 | |
Payable for withholding taxes | | | 3,132,244 | | | | - | |
| | |
|
|
| |
|
|
|
Total liabilities | | | 61,287,160 | | | | 121,038,780 | |
| | |
|
|
| |
|
|
|
Total net assets | | $ | 9,752,280,023 | | | $ | 5,078,698,509 | |
| | |
|
|
| |
|
|
|
| NET ASSETS CONSIST OF: | | | | | | | | |
Fund shares issued and outstanding | | $ | 9,992,373,797 | | | $ | 4,682,338,103 | |
Net unrealized appreciation (depreciation) on investments and foreign currency related transactions | | | 1,273,610,357 | | | | 598,206,272 | |
Accumulated undistributed net investment income (loss) | | | 64,567,549 | | | | - | |
Accumulated undistributed net realized gains (losses) on investments and foreign currency related transactions | | | (1,578,271,680 | ) | | | (201,845,866 | ) |
| | |
|
|
| |
|
|
|
| | | $ | 9,752,280,023 | | | $ | 5,078,698,509 | |
| | |
|
|
| |
|
|
|
| SUPPLEMENTARY INFORMATION: | | | | | | | | |
Net assets | | | | | | | | |
Investor Shares | | $ | 6,130,171,325 | | | $ | 4,042,685,752 | |
Institutional Shares | | $ | 3,622,108,698 | | | $ | 1,036,012,757 | |
Shares outstanding | | | | | | | | |
Investor Shares | | | 317,155,993 | | | | 154,716,643 | |
Institutional Shares | | | 186,360,705 | | | | 39,269,285 | |
Net asset value, offering price and redemption price per share | | | | | | | | |
Investor Shares | | $ | 19.33 | | | $ | 26.13 | |
Institutional Shares | | $ | 19.44 | | | $ | 26.38 | |
Cost of securities of unaffiliated issuers held | | $ | 8,226,982,845 | | | $ | 4,483,892,088 | |
Cost of securities of affiliated issuers held | | $ | 202,716,463 | | | $ | - | |
The accompanying notes are an integral part of the financial statements.
17
SEVENTEEN
ARTISAN FUNDS, INC.
Statements of Operations – For the Year Ended September 30, 2004
| | | | | | | | |
| | | INTERNATIONAL
| | | MID CAP
| |
| INVESTMENT INCOME: | | | | | | | | |
Interest | | $ | 1,161,567 | | | $ | 1,663,670 | |
Dividends, from unaffiliated issuers(1) | | | 170,620,936 | | | | 16,629,469 | |
Dividends, from affiliated issuers(1) | | | 6,626,007 | | | | - | |
Securities lending | | | 2,820,813 | | | | - | |
| | |
|
|
| |
|
|
|
Total investment income | | | 181,229,323 | | | | 18,293,139 | |
| | |
| EXPENSES: | | | | | | | | |
Advisory fees | | | 90,708,425 | | | | 42,817,855 | |
Transfer agent fees | | | | | | | | |
Investor Shares | | | 11,534,259 | | | | 7,257,052 | |
Institutional Shares | | | 29,530 | | | | 23,013 | |
Shareholder communications | | | | | | | | |
Investor Shares | | | 1,283,973 | | | | 768,224 | |
Institutional Shares | | | 20,020 | | | | 7,200 | |
Custodian fees | | | 5,715,663 | | | | 406,825 | |
Accounting fees | | | 78,097 | | | | 68,480 | |
Professional fees | | | 1,200,590 | | | | 167,825 | |
Registration fees | | | | | | | | |
Investor Shares | | | 37,551 | | | | 124,973 | |
Institutional Shares | | | 23,169 | | | | 11,355 | |
Directors’ fees | | | 236,558 | | | | 129,480 | |
Other operating expenses | | | 286,285 | | | | 123,966 | |
| | |
|
|
| |
|
|
|
Total operating expenses | | | 111,154,120 | | | | 51,906,248 | |
| | |
|
|
| |
|
|
|
Net investment income (loss) | | | 70,075,203 | | | | (33,613,109 | ) |
| | |
| NET REALIZED AND UNREALIZED GAINS (LOSSES) ON INVESTMENTS: | | | | | | | | |
Net realized gain (loss) on: | | | | | | | | |
Investments(1) | | | (91,940,847 | ) | | | 330,560,106 | |
Foreign currency related transactions | | | (5,531,519 | ) | | | - | |
| | |
|
|
| |
|
|
|
| | | | (97,472,366 | ) | | | 330,560,106 | |
Net increase (decrease) in unrealized appreciation or depreciation on: | | | | | | | | |
Investments | | | 1,580,915,556 | | | | 172,866,182 | |
Foreign currency related transactions | | | (820,070 | ) | | | - | |
| | |
|
|
| |
|
|
|
| | | | 1,580,095,486 | | | | 172,866,182 | |
| | |
|
|
| |
|
|
|
Net gain (loss) on investments and foreign currency related transactions | | | 1,482,623,120 | | | | 503,426,288 | |
| | |
|
|
| |
|
|
|
Net increase (decrease) in net assets resulting from operations | | $ | 1,552,698,323 | | | $ | 469,813,179 | |
| | |
|
|
| |
|
|
|
| | | | | | | |
(1) Fund
| | Net of foreign taxes
withheld on dividends,
unaffiliated issuers
| | Net of foreign taxes
withheld on dividends,
affiliated issuers
| | Including net realized
gain (loss) on investments
from affiliated issuers
| |
International | | $22,455,295 | | $810,975 | | $(87,986,262 | ) |
The accompanying notes are an integral part of the financial statements.
18
EIGHTEEN
ARTISAN FUNDS, INC.
Statements of Changes in Net Assets
| | | | | | | | | | | | | | |
| | | INTERNATIONAL
| | | |
| | | Year Ended
9/30/04
| | | Period Ended
9/30/03(1)
| | | Year Ended
6/30/03
| | | |
| OPERATIONS: | | | | | | | | | | | | | | |
Net investment income (loss) | | $ | 70,075,203 | | | $ | 12,639,412 | | | $ | 103,725,637 | | | |
Net realized gain (loss) on: | | | | | | | | | | | | | | |
Investments | | | (91,940,847 | ) | | | 74,854,666 | | | | (529,007,531 | ) | | |
Foreign currency related transactions | | | (5,531,519 | ) | | | (1,317,643 | ) | | | (10,809,131 | ) | | |
Net increase (decrease) in unrealized appreciation or depreciation on: | | | | | | | | | | | | | | |
Investments | | | 1,580,915,556 | | | | 409,874,381 | | | | (423,541,570 | ) | | |
Foreign currency related transactions | | | (820,070 | ) | | | 538,027 | | | | 52,282 | | | |
| | |
|
|
| |
|
|
| |
|
|
| |
|
Net increase (decrease) in net assets resulting from operations | | | 1,552,698,323 | | | | 496,588,843 | | | | (859,580,313 | ) | | |
| | | | |
| DISTRIBUTIONS PAID TO SHAREHOLDERS: | | | | | | | | | | | | | | |
Net investment income: | | | | | | | | | | | | | | |
Investor Shares | | | (59,414,982 | ) | | | - | | | | (31,901,533 | ) | | |
Institutional Shares | | | (42,472,917 | ) | | | - | | | | (18,341,682 | ) | | |
Net realized gains on investment transactions: | | | | | | | | | | | | | | |
Investor Shares | | | - | | | | - | | | | - | | | |
Institutional Shares | | | - | | | | - | | | | - | | | |
| | |
|
|
| |
|
|
| |
|
|
| |
|
Total distributions paid to shareholders | | | (101,887,899 | ) | | | - | | | | (50,243,215 | ) | | |
| | | | |
| FUND SHARE ACTIVITIES: | | | | | | | | | | | | | | |
Net increase (decrease) in net assets
resulting from fund share activities | | | (597,923,467 | ) | | | 244,966,499 | | | | 1,716,020,036 | | | |
| | |
|
|
| |
|
|
| |
|
|
| |
|
Total increase (decrease) in net assets | | | 852,886,957 | | | | 741,555,342 | | | | 806,196,508 | | | |
| | |
|
|
| |
|
|
| |
|
|
| |
|
Net assets, beginning of period | | | 8,899,393,066 | | | | 8,157,837,724 | | | | 7,351,641,216 | | | |
| | |
|
|
| |
|
|
| |
|
|
| |
|
Net assets, end of period | | $ | 9,752,280,023 | | | $ | 8,899,393,066 | | | $ | 8,157,837,724 | | | |
| | |
|
|
| |
|
|
| |
|
|
| |
|
| | | | | | | | | | | | | | | |
Accumulated undistributed net investment income (loss) | | $ | 64,567,549 | | | $ | 101,915,854 | | | $ | 90,594,085 | | | |
| | |
|
|
| |
|
|
| |
|
|
| |
|
| (1) | For the period from July 1, 2003 through September 30, 2003. Artisan Funds changed its fiscal year-end from June 30 to September 30 effective September 30, 2003. |
The accompanying notes are an integral part of the financial statements.
19
NINETEEN
ARTISAN FUNDS, INC.
Statements of Changes in Net Assets (Continued)
| | | | | | | | | | | | | | |
| | | MID CAP
| | | |
| | | Year Ended
9/30/04
| | | Period Ended
9/30/03(1)
| | | Year Ended
6/30/03
| | | |
| OPERATIONS: | | | | | | | | | | | | | | |
Net investment income (loss) | | $ | (33,613,109 | ) | | $ | (6,409,147 | ) | | $ | (12,208,186 | ) | | |
Net realized gain (loss) on: | | | | | | | | | | | | | | |
Investments | | | 330,560,106 | | | | 105,075,097 | | | | (325,149,190 | ) | | |
Foreign currency related transactions | | | - | | | | - | | | | - | | | |
Net increase (decrease) in unrealized appreciation or depreciation on: | | | | | | | | | | | | | | |
Investments | | | 172,866,182 | | | | 90,208,363 | | | | 376,988,686 | | | |
Foreign currency related transactions | | | - | | | | - | | | | - | | | |
| | |
|
|
| |
|
|
| |
|
|
| |
|
Net increase (decrease) in net assets resulting from operations | | | 469,813,179 | | | | 188,874,313 | | | | 39,631,310 | | | |
| | | | |
| DISTRIBUTIONS PAID TO SHAREHOLDERS: | | | | | | | | | | | | | | |
Net investment income: | | | | | | | | | | | | | | |
Investor Shares | | | - | | | | - | | | | - | | | |
Institutional Shares | | | - | | | | - | | | | - | | | |
Net realized gains on investment transactions: | | | | | | | | | | | | | | |
Investor Shares | | | - | | | | - | | | | - | | | |
Institutional Shares | | | - | | | | - | | | | - | | | |
| | |
|
|
| |
|
|
| |
|
|
| |
|
Total distributions paid to shareholders | | | - | | | | - | | | | - | | | |
| | | | |
| FUND SHARE ACTIVITIES: | | | | | | | | | | | | | | |
Net increase (decrease) in net assets
resulting from fund share activities | | | 1,096,126,727 | | | | 208,283,211 | | | | 770,633,859 | | | |
| | |
|
|
| |
|
|
| |
|
|
| |
|
Total increase (decrease) in net assets | | | 1,565,939,906 | | | | 397,157,524 | | | | 810,265,169 | | | |
| | |
|
|
| |
|
|
| |
|
|
| |
|
Net assets, beginning of period | | | 3,512,758,603 | | | | 3,115,601,079 | | | | 2,305,335,910 | | | |
| | |
|
|
| |
|
|
| |
|
|
| |
|
Net assets, end of period | | $ | 5,078,698,509 | | | $ | 3,512,758,603 | | | $ | 3,115,601,079 | | | |
| | |
|
|
| |
|
|
| |
|
|
| |
|
| | | | | | | | | | | | | | | |
Accumulated undistributed net investment income (loss) | | $ | - | | | $ | - | | | $ | - | | | |
| | |
|
|
| |
|
|
| |
|
|
| |
|
| (1) | For the period from July 1, 2003 through September 30, 2003. Artisan Funds changed its fiscal year-end from June 30 to September 30 effective September 30, 2003. | |
The accompanying notes are an integral part of the financial statements.
20
TWENTY
[THIS PAGE INTENTIONALLY LEFT BLANK]
21
TWENTY-ONE
ARTISAN FUNDS, INC.
Financial Highlights – For a share outstanding throughout each period
| | | | | | | | | | | | | | | | | | | | | | | | | | |
Year or
Period
Ended | | | Net Asset
Value
Beginning
of Period | | Net
Investment
Income
(Loss)(1) | | | Net Realized
and Unrealized
Gain (Loss) on
Investments | | | Total Income
(Loss) from
Investment
Operations | | | Dividends
from Net
Investment
Income | | | Distributions
from Net
Realized
Gains | | | |
| | | | | | | | | | | | | | | | | | | | | | | | | | | |
| ARTISAN INTERNATIONAL FUND | | | | | | | |
| Institutional Shares | | | | | | | | | | | | | | | | | | | | | | | | | | |
| 9/30/2004 | | | $ | 16.63 | | $ | 0.16 | | | $ | 2.86 | | | $ | 3.02 | | | $ | (0.21 | ) | | $ | - | | | |
| 9/30/2003 | (4) | | | 15.71 | | | 0.03 | | | | 0.89 | | | | 0.92 | | | | - | | | | - | | | |
| 6/30/2003 | | | | 18.24 | | | 0.25 | | | | (2.65 | ) | | | (2.40 | ) | | | (0.13 | ) | | | - | | | |
| 6/30/2002 | | | | 19.62 | | | 0.18 | | | | (1.46 | ) | | | (1.28 | ) | | | (0.10 | ) | | | - | | | |
| 6/30/2001 | | | | 30.22 | | | 0.16 | | | | (7.21 | ) | | | (7.05 | ) | | | - | | | | (3.55 | ) | | |
| 6/30/2000 | | | | 18.70 | | | 0.03 | | | | 12.09 | | | | 12.12 | | | | (0.06 | ) | | | (0.54 | ) | | |
| | | | | | | | | | | | | | | | | | | | | | | | | | | |
| ARTISAN MID CAP FUND | | | | | | | | | | | | | | | | | | | | | | | | | | |
| Institutional Shares | | | | | | | | | | | | | | | | | | | | | | | | | | |
| 9/30/2004 | | | $ | 23.28 | | $ | (0.14 | ) | | $ | 3.24 | | | $ | 3.10 | | | $ | - | | | $ | - | | | |
| 9/30/2003 | (4) | | | 21.96 | | | (0.03 | ) | | | 1.35 | | | | 1.32 | | | | - | | | | - | | | |
| 6/30/2003 | | | | 22.24 | | | (0.07 | ) | | | (0.21 | )(6) | | | (0.28 | ) | | | - | | | | - | | | |
| 6/30/2002 | | | | 26.48 | | | (0.13 | ) | | | (4.11 | ) | | | (4.24 | ) | | | - | | | | - | | | |
| 6/30/2001 | | | | 27.57 | | | (0.08 | ) | | | 0.02 | (6) | | | (0.06 | ) | | | - | | | | (1.03 | ) | | |
| (1) | Computed based on average shares outstanding. |
| (2) | Periods less than 12 months (where applicable) are not annualized. |
| (3) | Periods less than 12 months (where applicable) are annualized. |
| (4) | For the period from July 1, 2003 to September 30, 2003. Artisan Funds changed its fiscal year-end from June 30 to September 30 effective September 30, 2003. | |
| (5) | The ratios of expenses to average net assets and net investment income (loss) to average net assets exclude expenses waived or paid by the Adviser. Absent expenses waived or paid by the Adviser, the ratios of expenses to average net assets and net investment income (loss) to average net assets would have been as follows: | |
| | | | | | | | |
| Fund | | Period Ended | | Ratio of Expenses to
Average Net Assets | | | Ratio of Net Investment Income
(Loss) to Average Net Assets | |
International Institutional Shares | | 9/30/2003 | | 1.00 | % | | 0.73 | % |
Mid Cap Institutional Shares | | 9/30/2003 | | 0.98 | | | (0.59 | ) |
| (6) | The amount shown may not correlate with the aggregate gains and losses of portfolio securities due to the timing of subscriptions and redemptions of fund shares. | |
22
TWENTY-TWO
| | | | | | | | | | | | | | | | | | | | | | |
| | | Total
Distributions | | | Net Asset
Value
End
of Period | | Total
Return(2) | | | Net Assets
End of
Period
(millions) | | Ratio of
Expenses
to Average
Net Assets(3) | | | Ratio of Net
Investment
Income (Loss)
to Average
Net Assets(3) | | | Portfolio
Turnover
Rate(2) | |
| | | | | | | | | | | | | | | | | | | | | | | |
| | | | | | | | | | | | | | | | | | | | | | | |
| | | | | | | | | | | | | | | | | | | | | | | |
| | | $ | (0.21 | ) | | $ | 19.44 | | 18.3 | % | | $ | 3,622.1 | | 1.01 | % | | 0.85 | % | | 54.96 | % |
| | | | - | | | | 16.63 | | 5.9 | | | | 3,354.7 | | 1.00 | (5) | | 0.73 | (5) | | 15.23 | |
| | | | (0.13 | ) | | | 15.71 | | (13.1 | ) | | | 2,975.0 | | 1.01 | | | 1.68 | | | 37.13 | |
| | | | (0.10 | ) | | | 18.24 | | (6.5 | ) | | | 2,062.0 | | 1.01 | | | 1.01 | | | 50.67 | |
| | | | (3.55 | ) | | | 19.62 | | (24.5 | ) | | | 1,486.6 | | 1.03 | | | 0.70 | | | 72.01 | |
| | | | (0.60 | ) | | | 30.22 | | 66.0 | | | | 1,136.2 | | 1.08 | | | 0.09 | | | 99.02 | |
| | | | | | | | | | | | | | | | | | | | | | | |
| | | | | | | | | | | | | | | | | | | | |
| | | | | | | | | | | | | | | | | | | | | | | |
| | | $ | - | | | $ | 26.38 | | 13.3 | % | | $ | 1,036.0 | | 0.96 | % | | (0.54 | )% | | 101.09 | % |
| | | | - | | | | 23.28 | | 6.1 | | | | 929.6 | | 0.98 | (5) | | (0.59 | )(5) | | 26.52 | |
| | | | - | | | | 21.96 | | (1.3 | ) | | | 829.0 | | 1.00 | | | (0.36 | ) | | 102.85 | |
| | | | - | | | | 22.24 | | (16.0 | ) | | | 449.8 | | 1.02 | | | (0.56 | ) | | 121.14 | |
| | | | (1.03 | ) | | | 26.48 | | (0.4 | ) | | | 212.2 | | 1.08 | | | (0.29 | ) | | 153.95 | |
The accompanying notes are an integral part of the financial statements.
23
TWENTY-THREE
Artisan Funds, Inc.
INSTITUTIONAL SHARES
Notes to Financial Statements – September 30, 2004
Artisan Funds, Inc. (“Artisan Funds”) was incorporated on January 5, 1995, as a Wisconsin corporation and is registered under the Investment Company Act of 1940, as amended. Artisan Funds is a series comprised of seven open-end, diversified mutual funds. Artisan International Fund (“International Fund” or “International”) and Artisan Mid Cap Fund (“Mid Cap Fund” or “Mid Cap”), two series of Artisan Funds (each a “Fund” and collectively the “Funds”), commenced operations on December 28, 1995 and June 27, 1997, respectively. Each Fund’s investment objective is to seek long-term capital growth.
The Funds offer shares of capital stock of two classes - Institutional Shares and Investor Shares. International Fund and Mid Cap Fund began offering Institutional Shares effective July 1, 1997 and July 1, 2000, respectively. Institutional Shares are sold to institutional investors meeting certain minimum investment requirements. Each class of shares has equal rights with respect to portfolio assets and voting privileges. Each class has exclusive voting rights with respect to any matters involving only that class. Income, non-class specific expenses and realized and unrealized gains and losses are allocated daily to each class of shares based upon the relative net asset value of outstanding shares. Expenses attributable to a particular class of shares, such as transfer agency fees, shareholder communication expenses and registration fees, are allocated directly to that class.
Each class of the Funds has an indefinite number of shares authorized with a $0.01 par value.
| (2) | Summary of significant accounting policies: |
The following is a summary of significant accounting policies of the Funds in effect during the period covered by the financial statements, which are in accordance with U.S. generally accepted accounting principles.
| | (a) | Security valuation – The net asset value (“NAV”) of the shares of each class of each Fund was determined as of the close of regular session trading on the New York Stock Exchange (“NYSE”) (usually 3:00 p.m., Central time, but sometimes earlier) each day the NYSE was open for regular session trading. The NAV of each class of shares was determined by dividing the value of each Fund’s securities and other assets attributed to that class, less its liabilities attributed to that class, by the number of outstanding shares of that class of that Fund. |
24
TWENTY-FOUR
NOTES TO FINANCIAL STATEMENTS
In determining NAV, each equity security traded on a securities exchange, including the Nasdaq Stock Market, was valued at the closing price as of the time of valuation on the exchange or market on which the security was principally traded (the “principal exchange”). The closing price provided by each exchange may differ and may represent information such as last sales price, an official closing price, a closing auction price or other information, depending on exchange or market convention. Absent closing price information for a security from the principal exchange as of the time of valuation, the security was valued using the most recent bid quotation on the principal exchange, except that securities listed on the London Stock Exchange were valued at the mean of the most recent bid and asked quotations as of the time of valuation. Short-term investments maturing within sixty days of the valuation date were valued at amortized cost, which approximates market.
Securities for which prices were not readily available were valued by the Funds’ valuation committee (the “valuation committee”) at a fair value determined in good faith under procedures established by and under the general supervision of Artisan Funds’ Board of Directors (the “Board of Directors”). A price was considered not to be readily available if, among other things, the valuation committee believed that the price determined as described in the preceding paragraph did not reflect a fair value of the security.
International Fund generally invests a significant portion, and perhaps as much as substantially all, of its total assets in securities principally traded in markets outside the U.S. Mid Cap Fund has the ability to invest in securities principally traded outside the U.S., but did not do so in the period covered by these financial statements. The foreign markets in which the Funds may invest are sometimes open on days when the NYSE is not open and the Funds do not calculate their NAVs, and sometimes are not open on days when the Funds do calculate their NAVs. Even on days on which both the foreign market and the NYSE are open, several hours may have passed between the time when trading in the foreign market closed and the time as of which the Funds calculate their NAVs. That is generally the case for markets in Europe, Asia, Australia and other far eastern markets; the regular closing time of foreign markets in North and South America is generally the same as the closing time of the NYSE and the time as of which the Funds calculate their NAVs.
The valuation committee concluded that a price determined under the Funds’ valuation procedures was not readily available if, among other things, the valuation committee believed that the value of the security might have been
25
TWENTY-FIVE
NOTES TO FINANCIAL STATEMENTS
materially affected by events occurring after the close of the market in which the security was principally traded but before the time for determination of NAV (“subsequent event”). A subsequent event might include a company-specific development (for example, announcement of a merger that is made after the close of the foreign market), a development that might affect an entire market or region (for example, imposition of foreign exchange controls by a foreign government) or a potentially global development (such as a terrorist attack that may be expected to have an impact on investor expectations worldwide). Artisan Funds monitored for subsequent events using several tools, including reviewing changes in certain U.S. market indexes and, before May 19, 2004, a statistical model developed by a third party used by the Funds to make broad projections of NAV fluctuation based on changes in certain U.S. market indexes and securities prices weighted to reflect each Fund’s geographic weightings. An indication by any of those tools of a potential material change in the value of securities resulted in a meeting of the valuation committee, which considered whether a subsequent event had occurred and whether local market closing prices continued to represent fair values for potentially affected non-U.S. securities. Effective May 19, 2004, a third party research service was retained to assist in determining estimates of fair values for foreign securities. That service utilized statistical data based on historical performance of securities, markets and other data in developing factors used to estimate a fair value.
Estimates of fair values utilized by the Funds as described above may differ from the value realized on the sale of those securities and the differences may be material to the NAV of the applicable Fund or to the financial statements presented.
| | (b) | Income taxes – No provision has been made for federal income taxes since each Fund intends to (i) comply with the provisions of subchapter M of the Internal Revenue Code applicable to regulated investment companies and (ii) distribute to its shareholders substantially all of its taxable income as well as net realized gains from the sale of investment securities. The Funds may utilize earnings and profits distributed to shareholders on redemptions of Fund shares as part of the dividends paid deduction. |
| | (c) | Portfolio transactions – Security and shareholder transactions are recorded on trade date. Net realized gains and losses on securities are computed on specific security lot identification. |
| | (d) | Foreign currency translation – Values of investments and other assets and liabilities denominated in foreign currencies were converted into U.S. dollars using a spot market rate of exchange as of noon (eastern time) on the day of |
26
TWENTY-SIX
NOTES TO FINANCIAL STATEMENTS
| | valuation, unless the valuation committee determined that exchange rates as of that time did not fairly reflect exchange rates as of the time of calculation of the Funds’ NAV. Purchases and sales of investments and dividend and interest income are translated into U.S. dollars using a spot market rate of exchange prevailing on the respective dates of such transactions. The portion of security gains or losses resulting from changes in foreign exchange rates is included with net realized and unrealized gain or loss from investments, as appropriate, for both financial reporting and tax purposes. |
International Fund may enter into foreign currency forward contracts to hedge the foreign currency exposure on open payables and receivables. The foreign currency forward contracts are recorded at market value and any related realized and unrealized gains and losses are reported as foreign currency related transactions for financial reporting purposes. For tax purposes, these foreign exchange gains and losses are treated as ordinary income or loss. International Fund could be exposed to loss if the counterparties fail to perform under these contracts.
Other foreign currency related transaction gains and losses may result from currency gains and losses realized from the difference between the amounts of dividends and foreign withholding taxes recorded on the Funds’ books and the U.S. dollar equivalent of the amounts actually received or paid. The net increase (decrease) in unrealized appreciation or depreciation on foreign currency related transactions arise from changes in the values of assets and liabilities, other than investments in securities, resulting from changes in foreign exchange rates.
| | (e) | Repurchase agreements – Each Fund may enter into repurchase agreements with institutions that Artisan Partners Limited Partnership (“the Adviser”) has determined are creditworthy pursuant to criteria adopted by the Board of Directors. Repurchase agreements are recorded at cost plus accrued interest and are collateralized in an amount greater than or equal to the repurchase price plus accrued interest. If the proceeds from any sale of such collateral upon a default on the obligation to repurchase were less than the repurchase price, the Fund would suffer a loss. |
| | (f) | Securities lending – Each Fund may enter into securities lending transactions with borrowers approved by the Board of Directors. During the year ended September 30, 2004, International Fund earned $2,820,813 from securities lending transactions. As of September 30, 2004, there were no securities on loan. Each Fund’s risks in entering into securities lending arrangements are that the borrower may not provide additional collateral when required or return the securities when due, or, if the borrower defaults, the Fund may |
27
TWENTY-SEVEN
NOTES TO FINANCIAL STATEMENTS
| | experience delays in selling collateral or the collateral may not be sufficient to cover the value of securities lent. |
| | (g) | Commission recapture – Each of the Funds may direct portfolio trades, subject to obtaining best price and execution, to various brokers who have agreed to rebate a portion of the commissions generated. Such rebates are made directly to the applicable Fund as cash payments and are included in net realized gain or loss on investments in the Statements of Operations as follows: |
| | | |
International | | $ | 3,277,082 |
Mid Cap | | | 882,381 |
| | (h) | Use of estimates – The preparation of financial statements in conformity with U.S. generally accepted accounting principles requires management to make estimates and assumptions that affect the reported amounts and disclosures in the financial statements. Actual results could differ from those estimates. |
| | (i) | Indemnifications – In the normal course of business, the Funds enter into contracts in which the Funds agree to indemnify the other party or parties against various potential costs or liabilities. The Funds’ maximum exposure under these arrangements is unknown. No claim has been made for indemnification pursuant to any such agreement. |
| | (j) | Other – Dividend income less foreign taxes withheld, if any, is recorded on the ex-dividend date, except that certain dividends from private placements and foreign securities are recorded as soon after the ex-dividend date as the information becomes available to the Funds. Interest income is reported on the accrual basis. Distributions to shareholders are recorded on the ex-dividend date. Expenses attributable to the Artisan Funds are generally allocated to each Fund based on net assets. Expenses attributable to a particular Fund are allocated directly to that Fund. |
The character of income and net realized gains and losses may differ for financial statement and tax purposes and may result in reclassification of permanent differences among certain capital accounts to more appropriately conform financial accounting to tax characterizations of dividend distributions.
International Fund generally imposes a 2% redemption fee on shares held 90 days or less. Those redemption fees are recorded as a reduction in the cost of shares redeemed and have the primary effect of increasing paid-in capital.
28
TWENTY-EIGHT
NOTES TO FINANCIAL STATEMENTS
| (3) | Transactions with affiliates: |
The Adviser, with which the officers and certain directors of Artisan Funds are affiliated, provides investment advisory and administrative services to the Funds. In exchange for those services, each Fund pays a monthly management fee to the Adviser as follows:
| | | | | |
Average Daily Net Assets
| | | | Annual Rate
| |
Less than $500 million | | | | 1.000 | % |
$500 million to $750 million | | | | 0.975 | |
$750 million to $1 billion | | | | 0.950 | |
Greater than $1 billion | | | | 0.925 | |
Shares of Artisan Funds are offered for sale by Artisan Distributors LLC (“Distributors”). Distributors is wholly owned by the Adviser. All distribution expenses relating to the Funds are paid by the Adviser.
Each Fund also incurs other expenses for services such as maintaining shareholder records and furnishing shareholder statements and reports.
Each director who is not an interested person of Artisan Funds or the Adviser received an annual retainer of $60,000, plus a fee for each board or committee meeting attended (other than a committee meeting held on the same day as a board meeting) of $3,000 for an in-person meeting and $500 for a telephonic meeting, as well as reimbursement of expenses related to his duties as a director of Artisan Funds. In addition, each chairman of a board committee who is a non-interested director and each non-interested director performing services deemed by the Board of Directors to be substantially equivalent to those of a committee chair received a supplemental annual retainer of $5,000. Those fees were generally allocated to each Fund based on net assets.
| (4) | Line of credit arrangements: |
Artisan Funds is party to a line of credit agreement with State Street Bank and Trust Company, under which each Fund may borrow up to the lesser of (a) $75 million or (b) the lesser of (i) 10% of its total assets (after giving effect to the loan) or (ii) the maximum amount the Fund may borrow under the Investment Company Act, the limitations included in the Fund’s prospectus, or any limit or restriction under any law or regulation to which the Fund is subject or any agreement to which the Fund or Artisan Funds is a party; provided that the aggregate borrowings by all Funds may not exceed $100 million. Artisan Funds pays a commitment fee at the annual rate of 0.10% on the unused portion of the line of credit. Interest is charged on any borrowings at the current Federal Funds rate plus 0.50%. The use of the line of credit is generally restricted to temporary borrowing for extraordinary or emergency purposes.
29
TWENTY-NINE
NOTES TO FINANCIAL STATEMENTS
| (5) | Investment transactions: |
The cost of securities purchased and the proceeds from the sale of securities (excluding short-term securities) for the year ended September 30, 2004 were as follows:
| | | | | | |
| Fund | | Security Purchases | | Security Sales |
International | | $ | 5,254,614,327 | | $ | 5,803,949,808 |
Mid Cap | | | 5,499,926,725 | | | 4,433,180,680 |
| (6) | Transactions in securities of affiliates: |
If one or more of the Funds owns, in the aggregate, 5% or more of the outstanding voting securities of a portfolio company, that company is deemed to be an affiliate of the Funds under the Investment Company Act of 1940. During the year ended September 30, 2004, International Fund held securities of affiliates or purchased and sold securities of affiliates in open market transactions and received dividends from affiliates as summarized below:
| | | | | | | | | | | | | | | | | | | | |
Security | | Share
Balance
9/30/03 | | Purchase
Cost | | Sales
Cost | | Net Realized
Gain (Loss) | | | Dividend
Income | | As of 9/30/04 |
| | | | | | | Share
Balance | | Value |
| Clariant AG | | 8,999,193 | | $ | 52,219,024 | | $ | 18,846,723 | | $ | (7,923,084 | ) | | $ | 1,143,704 | | 13,411,333 | | $ | 160,753,200 |
| Imperial Chemical Industries PLC(1) | | 59,764,246 | | | - | | | 121,455,540 | | | (25,462,736 | ) | | | 5,482,303 | | 33,483,520 | | | 127,855,664 |
| Rhodia S.A.(1) | | 9,177,312 | | | - | | | 80,897,347 | | | (54,600,442 | ) | | | - | | - | | | - |
| | (1) | Issuer was no longer an affiliate as of September 30, 2004. |
| (7) | Information for Federal income tax purposes: |
| | | | | | | | | | | | | | | | | | | |
Fund | | Cost of
Investments | | Gross
Unrealized
Appreciation | | Gross
Unrealized
Depreciation | | | Net Unrealized
Appreciation
(Depreciation)
on Investments | | 9/30/04 |
| | | | | | Undistributed
Ordinary
Income | | Undistributed
Long-Term
Gain |
International | | $ | 8,554,931,114 | | $ | 1,599,836,484 | | $ | (451,572,119 | ) | | $ | 1,148,264,365 | | $ | 69,318,695 | | $ | - |
Mid Cap | | | 4,507,234,051 | | | 725,808,221 | | | (150,943,912 | ) | | | 574,864,309 | | | - | | | - |
The difference between cost amounts for financial reporting and tax purposes is due primarily to timing differences in recognizing certain gains and losses on security transactions.
The tax basis of dividends and long-term capital gain distributions paid during the fiscal years ended September 30, 2004 and June 30, 2003, capital loss carryovers as of September 30, 2004 and capital loss carryovers utilized during the year ended
30
THIRTY
NOTES TO FINANCIAL STATEMENTS
September 30, 2004, and tax basis post-October loss deferrals as of September 30, 2004 (recognized for tax purposes on October 1, 2004) were as follows:
| | | | | | | | | | | | | | | | | | | | | | | |
| | | Year Ended 9/30/04 | | Year Ended 6/30/03 | | As of 9/30/04 | | Year Ended 9/30/04 |
| Fund | | Ordinary Income Dividends | | Long-Term Capital Gain Distributions | | Ordinary Income Dividends | | Long-Term Capital Gain Distributions | | Net Capital
Loss Carryforward(1) | | Capital Loss Carryforward Expiration | | Capital Loss Carryforward Utilized | | Post-October
Losses |
International | | $ | 101,887,899 | | $ | - | | $ | 50,243,215 | | $ | - | | $ | 74,827,358 | | 2008 | | $ | 41,400,656 | | $ | 101,585,966 |
| | | | | | | | | | | | | | | | 694,241,382 | | 2009 | | | | | | |
| | | | | | | | | | | | | | | | 384,841,928 | | 2010 | | | | | | |
| | | | | | | | | | | | | | | | 202,299,105 | | 2011 | | | | | | |
Mid Cap | | | - | | | - | | | - | | | - | | | 178,503,906 | | 2010 | | | 321,169,449 | | | - |
| | (1) | Capital gain distributions will resume in the future to the extent gains are realized in excess of the available carryforwards. |
There were no dividends or long-term capital gain distributions paid during the period ended September 30, 2003.
| (8) | Fund share activities: |
Capital share transactions for the Funds were as follows:
| | | | | | | | | | | | | | | | |
| | | INTERNATIONAL
| | | MID CAP
| |
Year ended September 30, 2004
| | Investor Shares
| | | Institutional Shares
| | | Investor
Shares
| | | Institutional
Shares
| |
Proceeds from shares issued | | $ | 2,536,272,455 | | | $ | 334,559,000 | | | $ | 1,972,432,516 | | | $ | 69,966,247 | |
Net asset value of shares issued in reinvestment of dividends and distributions | | | 54,531,342 | | | | 38,442,969 | | | | - | | | | - | |
Cost of shares redeemed(1) | | | (2,903,431,496 | ) | | | (658,297,737 | ) | | | (855,149,594 | ) | | | (91,122,442 | ) |
| | |
|
|
| |
|
|
| |
|
|
| |
|
|
|
Net increase (decrease) from fund share transactions | | $ | (312,627,699 | ) | | $ | (285,295,768 | ) | | $ | 1,117,282,922 | | | $ | (21,156,195 | ) |
| | |
|
|
| |
|
|
| |
|
|
| |
|
|
|
| | | | |
Shares sold | | | 134,972,302 | | | | 17,620,515 | | | | 75,836,138 | | | | 2,793,091 | |
Shares issued in reinvestment of dividends and distributions | | | 3,107,199 | | | | 2,183,019 | | | | - | | | | - | |
Shares redeemed | | | (156,104,065 | ) | | | (35,129,349 | ) | | | (32,884,883 | ) | | | (3,449,277 | ) |
| | |
|
|
| |
|
|
| |
|
|
| |
|
|
|
Net increase (decrease) in capital shares | | | (18,024,564 | ) | | | (15,325,815 | ) | | | 42,951,255 | | | | (656,186 | ) |
| | |
|
|
| |
|
|
| |
|
|
| |
|
|
|
| | |
| | | INTERNATIONAL
| | | MID CAP
| |
Period ended September 30, 2003
| | Investor Shares
| | | Institutional Shares
| | | Investor
Shares
| | | Institutional
Shares
| |
Proceeds from shares issued | | $ | 1,653,682,408 | | | $ | 222,370,761 | | | $ | 320,410,216 | | | $ | 56,462,660 | |
Net asset value of shares issued in reinvestment of dividends and distributions | | | - | | | | - | | | | - | | | | - | |
Cost of shares redeemed | | | (1,607,024,622 | ) | | | (24,062,048 | ) | | | (161,733,175 | ) | | | (6,856,490 | ) |
| | |
|
|
| |
|
|
| |
|
|
| |
|
|
|
Net increase (decrease) from fund share transactions | | $ | 46,657,786 | | | $ | 198,308,713 | | | $ | 158,677,041 | | | $ | 49,606,170 | |
| | |
|
|
| |
|
|
| |
|
|
| |
|
|
|
| | | | |
Shares sold | | | 102,140,758 | | | | 13,738,314 | | | | 13,957,902 | | | | 2,468,566 | |
Shares issued in reinvestment of dividends and distributions | | | - | | | | - | | | | - | | | | - | |
Shares redeemed | | | (98,579,720 | ) | | | (1,477,132 | ) | | | (7,041,572 | ) | | | (296,096 | ) |
| | |
|
|
| |
|
|
| |
|
|
| |
|
|
|
Net increase (decrease) in capital shares | | | 3,561,038 | | | | 12,261,182 | | | | 6,916,330 | | | | 2,172,470 | |
| | |
|
|
| |
|
|
| |
|
|
| |
|
|
|
| (1) | Net of redemption fees of $74,205 and $41,388 for International-Investor Shares and International-Institutional Shares, respectively. |
31
THIRTY-ONE
NOTES TO FINANCIAL STATEMENTS
| (8) | Fund share activities (continued): |
| | | | | | | | | | | | | | | | |
| | | INTERNATIONAL
| | | MID CAP
| |
Year ended June 30, 2003
| | Investor Shares
| | | Institutional Shares
| | | Investor
Shares
| | | Institutional
Shares
| |
Proceeds from shares issued | | $ | 6,609,449,427 | | | $ | 1,265,372,555 | | | $ | 1,165,389,769 | | | $ | 364,499,717 | |
Net asset value of shares issued in
reinvestment of dividends and distributions | | | 29,416,168 | | | | 16,663,234 | | | | - | | | | - | |
Cost of shares redeemed | | | (6,063,741,583 | ) | | | (141,139,765 | ) | | | (740,991,149 | ) | | | (18,264,478 | ) |
| | |
|
|
| |
|
|
| |
|
|
| |
|
|
|
Net increase (decrease) from fund share transactions | | $ | 575,124,012 | | | $ | 1,140,896,024 | | | $ | 424,398,620 | | | $ | 346,235,239 | |
| | |
|
|
| |
|
|
| |
|
|
| |
|
|
|
| | | | |
Shares sold | | | 448,720,763 | | | | 84,658,208 | | | | 58,902,392 | | | | 18,444,267 | |
Shares issued in reinvestment of dividends and distributions | | | 1,986,215 | | | | 1,121,348 | | | | - | | | | - | |
Shares redeemed | | | (410,530,756 | ) | | | (9,434,864 | ) | | | (37,879,947 | ) | | | (921,013 | ) |
| | |
|
|
| |
|
|
| |
|
|
| |
|
|
|
Net increase (decrease) in capital shares | | | 40,176,222 | | | | 76,344,692 | | | | 21,022,445 | | | | 17,523,254 | |
| | |
|
|
| |
|
|
| |
|
|
| |
|
|
|
Artisan Funds and the Adviser are defendants in a lawsuit that seeks certification of a plaintiff class consisting of all persons in the United States who held shares in International Fund for a period of more than 14 days during the five years prior to the filing of the lawsuit. The suit seeks compensatory and punitive damages, as well as interest, costs and attorney’s fees. The lawsuit alleges, in summary, that Artisan Funds and the Adviser exposed long-term International Fund shareholders to trading by market timers by allegedly (a) failing to properly evaluate daily whether a significant event affecting the value of International Fund’s securities had occurred after foreign markets had closed but before the calculation of the Fund’s NAV; (b) failing to implement the Fund’s portfolio valuation and share pricing policies and procedures; (c) allowing portfolio valuation and share policies and procedures that benefited market timers at the expense of long-term shareholders; and (d) failing to know and implement applicable rules and regulations concerning the calculation of NAV. Artisan Funds and the Adviser intend to defend the lawsuit vigorously. Legal fees incurred by Artisan Funds in defense of the lawsuit have been allocated to International Fund and are included in Professional fees in the Statement of Operations. Artisan Funds does not believe that the pending action will have a material effect on the financial condition of any Fund.
32
THIRTY-TWO
Report of Independent Registered Public Accounting Firm
To the Board of Directors and Shareholders of Artisan Funds, Inc.
We have audited the accompanying statements of assets and liabilities, including the schedules of investments, of Artisan International Fund and Artisan Mid Cap Fund, two series constituting Artisan Funds, Inc. (“the Funds”) as of September 30, 2004, and the related statements of operations for the year then ended, and the statements of changes in net assets and the financial highlights for the year then ended and for the period from July 1, 2003 to September 30, 2003. These financial statements and financial highlights are the responsibility of the Funds’ management. Our responsibility is to express an opinion on these financial statements and financial highlights based on our audits. The statements of changes in net assets and the financial highlights of the Funds for the periods ended prior to September 30, 2003, were audited by other auditors whose report dated July 31, 2003, expressed an unqualified opinion on those statements of changes in net assets and financial highlights.
We conducted our audits in accordance with the standards of the Public Company Accounting Oversight Board (United States). Those standards require that we plan and perform the audit to obtain reasonable assurance about whether the financial statements and financial highlights are free of material misstatement. An audit includes examining, on a test basis, evidence supporting the amounts and disclosures in the financial statements and financial highlights. Our procedures included confirmation of securities owned as of September 30, 2004, by correspondence with the custodian and brokers or by other appropriate auditing procedures where replies from brokers were not received. An audit also includes assessing the accounting principles used and significant estimates made by management, as well as evaluating the overall financial statement presentation. We believe that our audits provide a reasonable basis for our opinion.
In our opinion, the financial statements and financial highlights referred to above present fairly, in all material respects, the financial position of Artisan International Fund and Artisan MidCap Fund of Artisan Funds, Inc. at September 30, 2004, the results of their operations for the year then ended, and the changes in their net assets and the financial highlights for the year then ended and for the period from July 1, 2003 to September 30, 2003, in conformity with U.S. generally accepted accounting principles.

Milwaukee, Wisconsin
November 4, 2004
33
THIRTY-THREE
NOTES TO FINANCIAL STATEMENTS
Other Federal tax information (unaudited):
The Internal Revenue Code requires that shareholders be notified within 60 days of the Funds’ fiscal year-end of certain information regarding long-term capital gains, qualified dividend income, the dividends received deduction for corporate shareholders and the foreign tax credit. This data is informational only. Every year in January, shareholders are sent a Form 1099-DIV which provides the federal tax status of dividends and distributions received during the calendar year. Shareholders are advised to consult their own tax advisor with respect to the specific tax consequences of investment in the Funds.
The International Fund hereby designates 100% of ordinary dividends paid during the fiscal year ended September 30, 2004 as qualified dividend income as defined in the Jobs and Growth Tax Relief Reconciliation Act of 2003.
During the year ended September 30, 2004, International Fund generated $200,513,212 of foreign source income on which $23,603,794 of foreign taxes were paid. International Fund elects to pass foreign taxes through to shareholders for their 2004 tax returns. The Fund will provide final information with Form 1099 in January 2005 to permit shareholders either to claim a foreign tax credit or to take a deduction for foreign taxes paid on shareholders’ 2004 income tax returns. For the year ended September 30, 2004 the gross income and related foreign taxes paid by country were as follows (in each case, expressed as a percentage of total income and total qualified foreign taxes paid, respectively):
| | | | | | |
| | | International
| |
| | | Income | | | Foreign Tax | |
Australia | | 1.95 | % | | 0.00 | % |
Austria | | 0.09 | | | 0.11 | |
Belgium | | 1.04 | | | 1.35 | |
Brazil | | 3.18 | | | 3.87 | |
Canada | | 0.88 | | | 1.14 | |
China | | 1.48 | | | 0.00 | |
Czech Republic | | 2.24 | | | 2.90 | |
Denmark | | 0.75 | | | 0.97 | |
Finland | | 0.47 | | | 0.61 | |
France | | 2.63 | | | 3.40 | |
Germany | | 8.52 | | | 11.02 | |
Hong Kong | | 1.33 | | | 0.00 | |
Italy | | 2.39 | | | 3.09 | |
Japan | | 7.05 | | | 4.34 | |
34
THIRTY-FOUR
NOTES TO FINANCIAL STATEMENTS
Other Federal tax information (unaudited) (continued):
| | | | | | |
| | | International
| |
| | | Income | | | Foreign Tax | |
Luxembourg | | 0.40 | % | | 0.53 | % |
Mexico | | 4.59 | | | 0.00 | |
Netherlands | | 6.71 | | | 8.69 | |
Norway | | 0.92 | | | 1.19 | |
Republic of Korea | | 1.64 | | | 2.22 | |
Russia | | 1.64 | | | 2.13 | |
Singapore | | 2.53 | | | 3.74 | |
Spain | | 4.79 | | | 6.06 | |
Switzerland | | 9.57 | | | 12.39 | |
Taiwan | | 3.42 | | | 5.90 | |
Thailand | | 0.15 | | | 0.13 | |
United Kingdom | | 28.05 | | | 24.22 | |
United States | | 1.59 | | | 0.00 | |
35
THIRTY-FIVE
SHAREHOLDER EXPENSE EXAMPLE
As a shareholder of Artisan Funds, you incur two types of costs: (1) transaction costs, including redemption fees; and (2) ongoing costs, including management fees, and other Fund expenses. This example is intended to help you understand your ongoing costs (in dollars) of investing in a Fund and to compare these costs with the ongoing costs of investing in other mutual funds.
The example is based on an investment of $1,000 invested at the beginning of the period and held for the entire period from April 1, 2004 to September 30, 2004.
Actual Expenses
The first line of the table below provides information about actual account values and actual expenses. You may use the information in this line, together with the amount you invested, to estimate the expenses that you paid over the period. Simply divide your account value by $1,000 (for example, an $8,600 account value divided by $1,000 = 8.6), then multiply the result by the number in the first line under the heading entitled “Expenses Paid During Period” to estimate the expenses you paid on your account during this period.
Hypothetical Example for Comparison Purposes
The second line of the table below provides information about hypothetical account values and hypothetical expenses based on each Fund’s actual expense ratio and an assumed rate of return of 5% per year before expenses, which is not the Fund’s actual return. The hypothetical account values and expenses may not be used to estimate the actual ending account balances or expenses you paid for the period. You may use this information to compare the ongoing costs of investing in each Fund and other funds. To do so, compare the 5% hypothetical example with the 5% hypothetical examples that appear in the shareholder reports of the other funds.
Please note that the expenses shown in the table are meant to highlight your ongoing costs only and do not reflect any transactional costs, such as redemption fees. Therefore, the second line of the table is useful in comparing ongoing costs only, and will not help you determine the relative costs of owning different funds. In addition, if these transactional costs were included, your costs would have been higher.
| | | | | | | | | |
| | | Beginning
Account Value
4/1/2004 | | Ending
Account Value
9/30/2004 | | Expenses Paid During
Period*
4/1/2004-9/30/2004 |
Artisan International Fund - Institutional Shares | | | | | | | | | |
Actual | | $ | 1,000.00 | | $ | 964.80 | | $ | 5.01 |
Hypothetical (5% return before expenses) | | $ | 1,000.00 | | $ | 1,019.90 | | $ | 5.15 |
Artisan Mid Cap Fund - Institutional Shares | | | | | | | | | |
Actual | | $ | 1,000.00 | | $ | 965.90 | | $ | 4.72 |
Hypothetical (5% return before expenses) | | $ | 1,000.00 | | $ | 1,020.20 | | $ | 4.85 |
| * | Expenses are equal to the Fund’s ratio of expenses to average net assets for the six-month period ended September 30, 2004 (shown below); multiplied by the average account value over the period; multiplied by 183/366 (to reflect the one-half year period). |
| | | |
| Fund | | Annualized Ratio of Expenses to Average Net Assets for the Six-Month
Period Ended September 30, 2004 | |
Artisan International Fund - Institutional Shares | | 1.02 | % |
Artisan Mid Cap Fund - Institutional Shares | | 0.96 | |
36
THIRTY-SIX
NOTES ON MANAGEMENT’S DISCUSSION OF FUND PERFORMANCE
The discussions of each Fund included in this Annual Report include statistical information about the portfolios of each of the Artisan Funds. Except as otherwise noted, that information is as of September 30, 2004; it varies with changes in a Fund’s portfolio investments. The performance information for each Fund relative to its benchmark index discussed in this Report was prepared by the Adviser using information reported by FactSet Databases (“FactSet”). Artisan Funds may consider an issuer to be from a particular country if (i) its principal securities trading market is in that country; (ii) alone or on a consolidated basis it derives more of its annual revenue from goods produced, sales made or services performed in that country than any other country; or (iii) it is organized under the laws of, or has a principal office in that country. By applying these tests, it is possible that Artisan Funds could deem a particular issuer to be from more than one country.
Definitions of Portfolio Statistics
Median Market Cap provides a measure of the market capitalization value of the companies in a portfolio. Market capitalization is the aggregate value of all a company’s outstanding common stock. Market Capitalization is calculated by FactSet using the price as of the most recent month-end multiplied by the number of shares outstanding as shown in the financial statements of the issuer. Equal numbers of companies in the portfolio have market capitalizations higher and lower than the median. Weighted Average Market Cap is the average of the market capitalizations of the companies in the portfolio weighted by the size of each company’s position within the portfolio. Weighted Average Growth Rate is a measure of the rate at which a company’s earnings are expected to grow and is the average of the 3-5 year forecasted growth rates of each company in the portfolio, weighted by the size of the company’s position within the portfolio. Weighted Harmonic Average P/E is the harmonic average, which measures the price/earnings ratio (a measure of how expensive a stock is) of the Fund, excluding negative earners, weighted by the size of the company’s position within the portfolio. The earnings figures used are estimates for the current calendar year.
Descriptions of Indices
Each Fund’s performance is compared in this report to changes in two indices, including a broad-based index of changes in prices of securities in the market in which the Fund invests. All of the indices are unmanaged and their returns include reinvested dividends. Unlike the Funds’ returns, the returns of each index do not include the payment of sales commissions or other expenses that would be incurred in the purchase or sale of the securities included in that index.
The indices to which the Funds are compared are:
Artisan International Fund – Morgan Stanley Capital International EAFE® Index (MSCI EAFE) is a market-weighted index of companies in developed markets, excluding the U.S. and Canada. The Morgan Stanley Capital International EAFE® Growth Index (MSCI EAFE Growth) is a market-weighted index of companies in developed markets, excluding the U.S. and Canada, with higher price-to-book ratios. MSCI EAFE and MSCI EAFE Growth’s average annual return since inception of the International Fund - Institutional Shares is based upon a starting date July 1, 1997.
Artisan Mid Cap Fund – Russell Midcap® Index is a market-weighted index of about 800 medium-sized U.S. companies. The Russell Midcap® Growth Index is a market-weighted index of those medium-sized companies included in the Russell Midcap® Index with higher price-to-book and higher forecasted growth values.
Trademarks
Trademarks and copyrights relating to the indices and products of portfolio companies mentioned in this report are owned by their respective owners. Except as otherwise indicated, the trademarks, including names, logos, slogans and service marks appearing in this report are the property of Artisan Partners Limited Partnership and may not be copied, reproduced, published or in any way used without written permission.
37
THIRTY-SEVEN
PROXY VOTING POLICIES AND PROCEDURES
You may obtain a description of the Artisan Funds’ proxy voting policies and procedures, without charge, upon request by calling 800.399.1770. That information also is included in Artisan Funds’ statement of additional information, which is available on the Funds’ website at www.artisanfunds.com and the Securities and Exchange Commission’s website at www.sec.gov.
Information relating to how each Artisan Fund voted proxies relating to portfolio securities held during the twelve months ended June 30, 2004 is available on the Funds’ website at www.artisanfunds.com and on the Securities and Exchange Commission’s website at www.sec.gov.
INFORMATION ABOUT PORTFOLIO SECURITIES
Artisan Funds will file a complete schedule of portfolio holdings with the Securities and Exchange Commission for the quarters ending December 31 and June 30 (the Funds’ first and third quarters of its fiscal year) on Form N-Q. The Funds’ Forms N-Q, when filed, will be available on the Securities and Exchange Commission’s website at www.sec.gov. You may also review and copy those documents by visiting the Securities and Exchange Commission’s Public Reference Room in Washington, D.C. Information on the operation of the Public Reference Room may be obtained by calling the Securities and Exchange Commission at 800.SEC.0330.
DIRECTORS AND OFFICERS
The Board of Directors has overall responsibility for the conduct of the affairs of Artisan Funds. Each director serves an indefinite term of unlimited duration until the next annual meeting of shareholders and until the election and qualification of his or her successor. The Board of Directors may fill any vacancy on the board provided that after such appointment at least two-thirds of the directors have been elected by the shareholders. The shareholders may remove a director by a vote of a majority of the outstanding shares of the Funds at any meeting of shareholders called for the purpose of removing such director.
The Board of Directors elects the officers of Artisan Funds. Each officer serves until the election and qualification of his or her successor, or until he or she sooner dies, resigns, or is removed or disqualified. The Board of Directors may remove any officer with or without cause at any time.
38
THIRTY-EIGHT
DIRECTORS AND OFFICERS
The names and ages of the directors and officers as of November 15, 2004, the position each holds with the Funds, the date each was first elected to office, their principal business occupations and other directorships they have held during the last five years are shown below.
| | | | | | | | |
| | | | | |
Name and Age at 11/15/04 | | Positions Held with Funds | | Date First
Elected or
Appointed to Office | | Principal Occupations during Past 5 Years | | Other Directorships Held |
| Directors who are not “interested persons” |
David A. Erne – 61 | | Director | | 3/27/95 | | Partner of the law firm Reinhart Boerner Van Deuren s.c., Milwaukee, WI | | Trustee, Northwestern Mutual Life Insurance Company (individual life insurance, disability insurance and annuity company) |
Thomas R. Hefty – 57 | | Director | | 3/27/95 | | Retired; Adjunct Faculty, Department of Business and Economics, Ripon College; Of Counsel to the law firm Reinhart Boerner Van Deuren s.c., Milwaukee, WI; until December 2002, Chairman of the Board and Chief Executive Officer of Cobalt Corporation (provider of managed care and specialty business services) | | None |
Jeffrey A. Joerres – 44 | | Director | | 8/9/01 | | Chairman of the Board (since May 2001), President and Chief Executive Officer of Manpower Inc. (non-governmental employment service organization); formerly, Senior Vice President, European Operations and Global Account Management and Development of Manpower Inc. | | Director, Johnson Controls, Inc. (manufacturer of automotive systems and building controls) |
Patrick S. Pittard – 58 | | Director | | 8/9/01 | | Distinguished Executive in Residence (teaching position), University of Georgia. Until November 2001, Chairman of the Board, President and Chief Executive Officer of Heidrick & Struggles International, Inc. (executive search firm) | | Director, Jefferson Pilot Corporation (individual and group life insurance and annuity company); Former Chairman of the Board, The University of Georgia Foundation; Member, Board of Regents of the University System of Georgia |
Howard B. Witt – 64 | | Director | | 3/27/95 | | Chairman of the Board, President and Chief Executive Officer of Littelfuse, Inc. (manufacturer of advanced circuit protection devices) | | Director, Franklin Electric Co., Inc. (manufacturer of electric motors) |
39
THIRTY-NINE
DIRECTORS AND OFFICERS
| | | | | | | | |
| | | | | |
Name and Age at 11/15/04 | | Positions Held with Funds | | Date First
Elected or
Appointed to Office | | Principal Occupations during Past 5 Years | | Other Directorships Held |
| Directors who are “interested persons”* |
Andrew A. Ziegler – 47 | | Director and President | | 1/5/95; 12/19/03 elected President | | Managing Director of Artisan Partners; Chairman and President of Artisan Distributors; until December 2003, Chairman of Artisan Funds | | None |
Carlene M. Ziegler – 48 | | Director and Vice President | | 3/27/95 | | Managing Director of Artisan Partners and Portfolio Co-Manager of Artisan Small Cap Fund | | None |
| Officers of Artisan Funds |
Lawrence A. Totsky – 45 | | Chief Financial Officer and Treasurer | | 1/22/98 | | Managing Director and Chief Financial Officer of Artisan Partners; Vice President, Chief Financial Officer and Treasurer of Artisan Distributors | | None |
Janet D. Olsen – 48 | | General Counsel and Secretary | | 1/18/01 | | Managing Director and General Counsel of Artisan Partners; Vice President and Secretary of Artisan Distributors; prior to joining Artisan Partners in November 2000, Member of the law firm Bell, Boyd & Lloyd LLC, Chicago, IL | | None |
Brooke J. Billick – 50 | | Chief Compliance Officer | | 8/19/04 | | Chief Compliance Officer and Associate Counsel of Artisan Partners; Chief Compliance Officer of Artisan Distributors; prior to joining Artisan Partners in February 2004, Vice President, Securities Counsel and Corporate Secretary of Marshall & Ilsley Trust Company, N.A. (bank) and M&I Investment Management Corp. (investment adviser) and Chief Legal Officer and Secretary of Marshall Funds, Inc. (mutual fund company) | | None |
Michael C. Roos – 46 | | Vice President | | 12/19/03 | | Managing Director of Artisan Partners; Vice President of Artisan Distributors; until December 2003, President of Artisan Funds | | None |
Mark L. Yockey – 48 | | Vice President | | 4/23/96 | | Managing Director of Artisan Partners and Portfolio Manager of Artisan International Fund and Artisan International Small Cap Fund | | None |
| * | Mr. and Ms. Ziegler are married to each other. Mr. and Ms. Ziegler are “interested persons” of Artisan Funds, as defined in the Investment Company Act of 1940, because each is a Managing Director of Artisan Partners, the investment adviser to Artisan Funds. As officers of Artisan Investment Corporation (an entity incorporated for the sole purpose of acting as general partner to Artisan Partners), Mr. and Ms. Ziegler manage Artisan Partners. Mr. Ziegler is also President of Artisan Distributors, Artisan Funds’ principal underwriter. |
40
FORTY
DIRECTORS AND OFFICERS
| | | | | | | | |
| | | | | |
Name and Age at 11/15/04 | | Positions Held with Funds | | Date First
Elected or
Appointed to Office | | Principal Occupations during Past 5 Years | | Other Directorships Held |
Scott C. Satterwhite – 47 | | Vice President | | 7/31/97 | | Managing Director of Artisan Partners and Portfolio Co-Manager of Artisan Mid Cap Value Fund and Artisan Small Cap Value Fund | | None |
Andrew C. Stephens – 41 | | Vice President | | 7/31/97 | | Managing Director of Artisan Partners and Portfolio Manager of Artisan Mid Cap Fund | | None |
Marina T. Carlson – 40 | | Vice President | | 8/5/99 | | Managing Director of Artisan Partners and Portfolio Co-Manager of Artisan Small Cap Fund | | None |
James C. Kieffer – 39 | | Vice President | | 1/27/00 | | Managing Director of Artisan Partners and Portfolio Co-Manager of Artisan Mid Cap Value Fund and Artisan Small Cap Value Fund; until 2000, Research Analyst for Artisan Partners | | None |
N. David Samra – 40 | | Vice President | | 6/5/02 | | Managing Director of Artisan Partners and Portfolio Manager of Artisan International Value Fund; until 2002, Portfolio Manager and Analyst for Harris Associates L.P. (investment management firm) | | None |
Gregory K. Ramirez – 34 | | Assistant Secretary and Assistant Treasurer | | 1/22/98 | | Managing Director of Client Accounting and Administration of Artisan Partners since January 2003, Director of Client Accounting and Administration from January 2000 to December 2002 and Controller of Artisan Partners prior thereto; Assistant Treasurer of Artisan Distributors | | None |
41
FORTY-ONE
DIRECTORS AND OFFICERS
| | | | | | | | |
| | | | | |
Name and Age at 11/15/04 | | Positions Held with Funds | | Date First
Elected or
Appointed to Office | | Principal Occupations during Past 5 Years | | Other Directorships Held |
Sarah A. Johnson – 32 | | Assistant Secretary | | 2/5/03 | | Associate Counsel of Artisan Partners; prior to joining Artisan Partners in July 2002, Associate of the law firm Bell, Boyd & Lloyd LLC, Chicago, IL | | None |
The business address of the directors and officers affiliated with Artisan Partners is 875 E. Wisconsin Avenue, Suite 800, Milwaukee, Wisconsin 53202. The addresses of the other directors are: Mr. Erne – 1000 N. Water Street, Milwaukee, Wisconsin 53202; Mr. Hefty – W233 N2080 Ridgeview Parkway, Waukesha, Wisconsin 53188; Mr. Joerres – 5301 North Ironwood, Milwaukee, Wisconsin 53217; Mr. Pittard – c/o Artisan Funds, 875 E. Wisconsin Avenue, Suite 800, Milwaukee, Wisconsin 53202; and Mr. Witt – 800 E. Northwest Highway, Des Plaines, Illinois 60016.
Artisan Funds’ statement of additional information (SAI) contains further information about the directors. Please call 800.399.1770 for a free copy of the SAI.
42
FORTY-TWO
Item 2. Code of Ethics.
(a) Registrant has adopted a code of ethics (the “Code”) that applies to its principal executive officer, principal financial officer and principal accounting officer (the “Covered Officers”).
(b) No disclosures are required pursuant to this Item 2(b).
(c) During the period covered by the report, registrant amended the Code to clarify that the prohibition against the Covered Officers serving as director of a public or private company did not preclude serving on the board of a civic or charitable organization.
(d) During the period covered by the report, registrant did not grant any waivers, including implicit waivers, from the provisions of the Code.
(e) Not applicable.
(f) A copy of the Code is filed as Exhibit (a)(1) to this Form N-CSR.
Item 3. Audit Committee Financial Expert.
Registrant’s board of directors has determined that Thomas R. Hefty, member and chairman of the registrant’s audit committee, qualifies as an “audit committee financial expert,” as such term is defined in Instruction 2(b) to Item 3 of Form N-CSR. Mr. Hefty is “independent” as such term is defined in paragraph (a)(2) of Item 3 of Form N-CSR.
Under applicable securities laws, a person who is determined to be an audit committee financial expert will not be deemed an “expert” for any purpose, including without limitation for the purposes of Section 11 of the Securities Act of 1933, as a result of being designated or identified as an audit committee financial expert. The designation or identification of a person as an audit committee financial expert does not impose on such person any duties, obligations, or liabilities that are greater than the duties, obligations, and liabilities imposed on such person as a member of the audit committee and board of directors in the absence of such designation or identification.
Item 4. Principal Accountant Fees and Services.
Aggregate fees billed to the registrant for professional services rendered by the registrant’s accountant are summarized in the tables below. The tables summarize fees billed (or to be billed) by the registrant’s principal accountant for work performed relating to each applicable period identified below. PricewaterhouseCoopers LLP served as the registrant’s principal accountant through and including the fiscal year ended June 30, 2003. Ernst & Young LLP served as the registrant’s principal accountant for subsequent fiscal periods.
Fees billed by Ernst & Young LLP:
| | | | | | | | |
| | | Fiscal Year
Ended
September 30,
2004
| | Fiscal Period
Ended
September 30,
2003
| | Fiscal Year
Ended
June 30,
2003
|
Audit Fees (a) | | $ | 112,500 | | $ | 103,000 | | — |
Audit-Related Fees (b) | | $ | 18,200 | | | — | | — |
Tax Fees (c) | | $ | 79,700 | | $ | 56,400 | | — |
All Other Fees (d) | | | — | | | — | | — |
Fees billed by PricewaterhouseCoopers LLP:
| | | | | | | | | |
| | | Fiscal Year
Ended
September 30,
2004
| | Fiscal Period
Ended
September 30,
2003
| | Fiscal Year
Ended
June 30,
2003
|
Audit Fees (a) | | | — | | | — | | $ | 131,395 |
Audit-Related Fees (b) | | | — | | | — | | | — |
Tax Fees (c) | | $ | 27,100 | | $ | 1,450 | | $ | 33,025 |
All Other Fees (d) | | | — | | | — | | | — |
| (a) | “Audit Fees” include amounts for professional services rendered by the principal accountant for the audit of the registrant’s annual financial statements and services that are normally provided by the accountant in connection with statutory and regulatory filings or engagements, including fees billed for review of a post-effective amendment to the Funds’ registration statement filed on January 28, 2004. |
| (b) | “Audit-Related Fees” include amounts for assurance and related services by the principal accountant that are reasonably related to the performance of the audit of the registrant’s financial statements. Audit-related fees have not been reported under the item “audit fees” in the chart above. |
The fees billed by Ernst & Young LLP during the fiscal year ended September 30, 2004 include fees billed for services for certain agreed upon procedures performed in conjunction with a review of the semi-annual report to shareholders at March 31, 2004.
| (c) | “Tax Fees” include amounts for professional services rendered by the principal accountant for tax compliance, tax advice and tax planning. |
The fees billed by Ernst & Young LLP during the fiscal year ended September 30, 2004 include fees billed for (1) the review and preparation of the Funds’
income tax returns for the fiscal year ended September 30, 2004, which have not been billed as of the time of this filing; (2) the review of excise tax calculations and preparation of excise tax returns for the calendar year ended December 31, 2004, which also have not yet been billed as of the time of this filing; (3) the use of a PFIC database supplied by Ernst & Young LLP for the fiscal year ended September 30, 2003 and excise year ended December 31, 2003 (these fees were billed during the fiscal year ended September 30, 2004). The amounts shown for the fiscal year ended September 30, 2003 include fees for the review and preparation of the Funds’ income tax returns for the fiscal year ended September 30, 2003 and the review of excise tax calculations and preparation of excise tax returns for the calendar year ended December 31, 2003.
The fees billed by PricewaterhouseCoopers LLP during the fiscal year ended September 30, 2004 include fees billed for (1) services for analysis of foreign companies’ ability to pay qualified dividend income for the calendar year ended December 31, 2003; and (2) assistance with responding to a request from the Wisconsin Department of Revenue regarding the Artisan Funds, Inc. tax return for the year ended June 30, 2003. The fees billed by PricewaterhouseCoopers LLP during the fiscal period ended September 30, 2003 include fees billed for review of the eligibility of the registrant to change its fiscal year end to September 30. The fees billed by PricewaterhouseCoopers LLP during the fiscal year ended June 30, 2003 include fees billed for (1) review and preparation of the registrant’s income tax returns for the fiscal year ended June 30, 2003; (2) reviewing Artisan International Value Fund’s ability to invest in Canadian income trusts; and (3) review of tax equalization calculations for Artisan International Small Cap Fund, Artisan Small Cap Fund and Artisan Small Cap Value Fund.
| (e)(1) | During its regularly scheduled periodic meetings, the registrant’s audit committee considers any requests to pre-approve any audit, audit-related, tax and other services to be provided by the principal accountants of the registrant. The audit committee has authorized its chairman to exercise that authority in the intervals between meetings; and the chairman presents any such pre-approvals to the audit committee at its next regularly scheduled meeting. Under paragraph (c)(7)(i)(C) of Rule 2-01 of Regulation S-X, pre-approval of non-audit services may be waived provided that: 1) the aggregate fees for all such services provided constitutes no more than five percent of the total amount of fees paid by the registrant to its principal accountant during the fiscal year in which services are provided, 2) such services were not recognized by the registrant at the time of engagement as non-audit services and 3) such services are promptly brought to the attention of the audit committee of the registrant and approved prior to the completion of the audit. |
| (e)(2) | No services included in Items 4(b) - (d) above were approved pursuant to paragraph (c)(7)(i)(C) of Rule 2-01 of Regulation
S-X. |
| (f) | Less than 50 percent of the hours expended on the principal accountant’s engagement to audit the registrant’s financial statements for the most recent fiscal year were attributed to work performed by persons other than the principal accountant’s full-time, permanent employees. |
(g) The aggregate fees billed for the fiscal year ended September 30, 2004, the fiscal period ended September 30, 2003 and the fiscal year ended June 30, 2003 by the registrant’s principal accountant for non-audit services rendered to the registrant are shown in the tables above and described under Items 4(b) – (d) above. The registrant’s principal accountant during the fiscal year ended June 30, 2003 was PricewaterhouseCoopers LLP. During that period, PricewaterhouseCoopers LLP also served as the principal accountant to the registrant’s adviser and entities controlling, controlled by or under common control with the adviser. The aggregate fees billed by PricewaterhouseCoopers LLP for non-audit services rendered to the registrant’s adviser and entities controlling, controlled by or under common control with the adviser during the registrant’s fiscal year ended June 30, 2003 (which includes fees relating to the adviser’s fiscal year ended December 31, 2002) was $98,050. For the registrant’s fiscal period ended September 30, 2003 and fiscal year ended September 30, 2004, Ernst & Young LLP served as the registrant’s principal accountant and provided no services and billed no fees, for non-audit services rendered to the registrant’s adviser or entities controlling, controlled by or under common control with the adviser.
(h) The audit committee of the registrant’s board of directors has considered whether the provision of non-audit services that were rendered to the registrant’s investment adviser, and any entity controlling, controlled by or under common control with the investment adviser that provides ongoing services to the registrant that were not pre-approved pursuant to paragraph (c)(7)(ii) of Rule 2-01 of Regulation S-X is compatible with maintaining the principal account’s independence. The provisions of Rule 2-01(c)(7) were effective on May 6, 2003. No such services were rendered on or after May 6, 2003.
Item 5. Audit Committee of Listed Registrants.
Not applicable.
Item 6. Schedule of Investments.
The Schedule of Investments in securities of unaffiliated issuers is included as part of the annual report to shareholders filed under Item 1 of this Form.
Item 7. Disclosure of Proxy Voting Policies and Procedures for Closed-End Management Investment Companies.
Not applicable.
Item 8. Purchases of Equity Securities by Closed-End Management Investment Company and Affiliated Purchasers.
Not applicable.
Item 9. Submission of Matters to a Vote of Security Holders.
The registrant has a governance and nominating committee, which is responsible for selecting and nominating persons for election or appointment as members of registrant’s board of directors. Prior to August 19, 2004, the committee did not have a formalized policy with respect to consideration of shareholder nominees or a procedure by which security holders may make their submissions. At a meeting of the committee held on August 19, 2004, the committee adopted guidelines by which the committee, which is
comprised entirely of independent directors, will consider any candidates for board membership (whether recommended by a shareholder, the committee, the board of directors or management personnel).
On August 19, 2004 the committee also adopted procedures to be followed by a shareholder wishing to propose a candidate for consideration by the committee. Under those procedures, a shareholder may recommend a candidate for election to the board by: (a) mailing the recommendation in writing to the attention of the secretary of Artisan Funds, Inc. at 875 East Wisconsin Avenue, Suite 800, Milwaukee, Wisconsin 53202; and (b) including in the recommendation: (i) the class or series and number of all shares of each Fund owned beneficially or of record by the nominating shareholder at the time the recommendation is submitted and the dates on which such shares were acquired, specifying the number of shares owned beneficially, (ii) a full listing of the proposed candidate’s education, experience (including knowledge of the investment company industry, experience as a director or senior officer of public or private companies, and directorships on other boards of other public companies, identifying any other registered investment companies), current employment, date of birth, business and residence addresses, and the names and addresses of at least three professional references, (iii) information as to whether the candidate is or may be an “interested person” (as such term is defined in the Investment Company Act of 1940, as amended) of the registrant, Artisan Partners Limited Partnership or Artisan Distributors LLC, and, if believed not to be an “interested person,” information regarding the candidate that will be sufficient for the registrant to make such determination, (iv) the written and signed consent of the candidate to be named as a nominee and to serve as a director of the registrant, if elected, (v) a description of all arrangements or understandings between the nominating shareholder, the candidate and/or any other person or persons (including their names) pursuant to which the recommendation is being made, and if none, a statement to that effect; (vi) the class or series and number of all shares of each Fund owned of record or beneficially by the candidate, as reported by the candidate, and (vii) any other information that would be helpful to the committee in evaluating the candidate.
The committee also may require the nominating shareholder to furnish such other information as it may reasonably require or deem necessary to verify any information submitted in the recommendation or to determine the qualifications and eligibility of the candidate proposed by the nominating shareholder to serve as a director of the registrant, and if the nominating shareholder fails to provide such other information in writing within seven days of receipt of a written request from the committee, the recommendation of such candidate as a nominee will be deemed not properly submitted for consideration, and the committee will not be required to consider such candidate.
Recommendations for candidates as directors of the registrant will be evaluated, among other things, in light of whether the number of directors is expected to change and whether the directors expect any vacancies on the board. The committee need not consider any shareholder recommendation received fewer than 90 days before the date of an anticipated nomination. When the committee is not actively recruiting new directors, shareholder recommendations will be kept on file until active recruitment is under way.
A shareholder recommendation considered by the committee in connection with the committee’s nomination of any candidate(s) for appointment or election as an independent director need not be considered again by the committee in connection with any subsequent nomination(s).
Item 10. Controls and Procedures.
(a) The registrant’s principal executive and principal financial officers have concluded, based on an evaluation of the registrant’s disclosure controls and procedures (as defined in Rule 30a-3(c) under the Investment Company Act of 1940, the “Disclosure Controls”) as of a date within 90 days prior to the filing date (the “Filing Date”) of this Form N-CSR (the “Report”), the Disclosure Controls are effectively designed to ensure that information required to be disclosed by the registrant in the Report is recorded, processed, summarized and reported by the Filing Date, including ensuring that information required to be disclosed in the Report is accumulated and communicated to the registrant’s management, including the registrant’s principal executive officer and principal financial officer, as appropriate to allow timely decisions regarding required disclosure.
(b) There were no changes in the registrant’s internal controls over financial reporting (as defined in Rule 30a-3(d) under the Investment Company Act of 1940) that occurred during the registrant’s most recent fiscal year that have materially affected, or are reasonably likely to materially affect, the registrant’s internal control over financial reporting.
Item 11. Exhibits.
| | | | |
(a) | | (1) | | Code of Ethics for Principal Executive Officer, Principal Financial Officer and Principal Accounting Officer (as referenced in Item 2 above), attached hereto as Exhibit (a)(1) |
| | |
| | | (2) | | Certifications of Andrew A. Ziegler, Principal Executive Officer and Lawrence A. Totsky, Principal Financial Officer pursuant to Rule 30a-2(a) under the Investment Company Act of 1940 (17 CFR 270.30a-2(a)), attached hereto as Exhibits (a)(2)(i) and (a)(2)(ii) |
| | |
(b) | | | | Certification of Andrew A. Ziegler, Principal Executive Officer and Lawrence A. Totsky, Principal Financial Officer pursuant to Section 906 of the Sarbanes-Oxley Act of 2002, attached hereto as Exhibit (b) |
SIGNATURES
Pursuant to the requirements of the Securities Exchange Act of 1934 and the Investment Company Act of 1940, the registrant has duly caused this report to be signed on its behalf by the undersigned, thereunto duly authorized.
Artisan Funds, Inc.
| | |
By: | | /s/ Andrew A. Ziegler
|
| | | Andrew A. Ziegler |
| | | Principal Executive Officer |
| |
Date: | | November 30, 2004 |
Pursuant to the requirements of the Securities Exchange Act of 1934 and the Investment Company Act of 1940, this report has been signed below by the following persons on behalf of the registrant and in the capacities and on the dates indicated.
| | |
By: | | /s/ Andrew A. Ziegler
|
| | | Andrew A. Ziegler |
| | | Principal Executive Officer |
| |
Date: | | November 30, 2004 |
| |
By: | | /s/ Lawrence A. Totsky
|
| | | Lawrence A. Totsky |
| | | Principal Financial Officer |
| |
Date: | | November 30, 2004 |