UNITED STATES
SECURITIES AND EXCHANGE COMMISSION
Washington, D.C. 20549
FORM N-CSR
CERTIFIED SHAREHOLDER REPORT OF REGISTERED
MANAGEMENT INVESTMENT COMPANIES
Investment Company Act file number 811-08932
Artisan Funds, Inc.
(Exact name of registrant as specified in charter)
875 East Wisconsin Avenue, Suite 800
Milwaukee, WI 53202
(Address of principal executive offices) (Zip Code)
| | |
| Janet D. Olsen | | Alyssa Albertelli |
| Artisan Funds, Inc. | | Ropes & Gray LLP |
| 875 East Wisconsin Avenue, #800 | | One Metro Center |
| Milwaukee, Wisconsin 53202 | | 700 12th Street, N.W., Suite 900 |
| | Washington, D.C. 20005-3948 |
(Name and address of agents for service)
Registrant’s telephone number, including area code: (414) 390-6100
Date of fiscal year end: 09/30/08
Date of reporting period: 09/30/08
| Item 1. | Reports to Shareholders. |
A N N U A L
R E P O R T
SEPTEMBER 30, 2008
ARTISAN GLOBAL VALUE FUND
ARTISAN INTERNATIONAL FUND
ARTISAN INTERNATIONAL SMALL CAP FUND
ARTISAN INTERNATIONAL VALUE FUND
ARTISAN MID CAP FUND
ARTISAN MID CAP VALUE FUND
ARTISAN OPPORTUNISTIC GROWTH FUND
ARTISAN OPPORTUNISTIC VALUE FUND
ARTISAN SMALL CAP FUND
ARTISAN SMALL CAP VALUE FUND

ARTISAN
ARTISAN FUNDS, INC.
INVESTOR SHARES
ARTISAN FUNDS
P.O. BOX 8412
BOSTON, MA 02266-8412
This report and the audited financial statements contained herein are provided for the general information of the shareholders of Artisan Funds. Before investing, investors should consider carefully each Fund’s investment objective, risks and charges and expenses. For a prospectus, which contains that information and more information about each Fund, please call 800.344.1770 or visit our website at www.artisanfunds.com. Read it carefully before you invest or send money.
Company discussions are for illustration only and are not intended as recommendations of individual stocks. The discussions present information about the companies believed to be accurate, and the views of the portfolio managers, as of September 30, 2008. That information and those views may change, and the Funds disclaim any obligation to advise shareholders of any such changes. Artisan Emerging Markets Fund, Artisan International Fund, Artisan International Value Fund and Artisan Mid Cap Fund offer institutional classes of shares for institutional investors meeting certain minimum investment requirements. A report on each institutional class is available under separate cover. Artisan Emerging Markets Fund also offers an advisor class of shares for certain institutional investors. A report on the advisor class is available under separate cover.
Artisan Funds offered through Artisan Distributors LLC, member FINRA.
TABLE OF CONTENTS
AVERAGE ANNUAL TOTAL RETURNS (as of 9/30/2008)
| | | | | | | | | | | | | | | | | |
| | | Inception
Date | | 1-Year | | | 3-Year | | | 5-Year | | | 10-Year | | | Since
Inception | |
Artisan Global Value Fund | | 12/10/07 | | NA | | | NA | | | NA | | | NA | | | -16.80 | % |
Artisan International Fund | | 12/28/95 | | -29.99 | % | | 2.59 | % | | 10.10 | % | | 9.59 | % | | 10.75 | |
Artisan International Small Cap Fund | | 12/21/01 | | -38.44 | | | 2.33 | | | 13.31 | | | NA | | | 15.10 | |
Artisan International Value Fund | | 9/23/02 | | -19.10 | | | 4.74 | | | 13.37 | | | NA | | | 17.81 | |
Artisan Mid Cap Fund | | 6/27/97 | | -22.47 | | | 2.64 | | | 7.61 | | | 12.66 | | | 13.84 | |
Artisan Mid Cap Value Fund | | 3/28/01 | | -11.16 | | | 2.91 | | | 12.65 | | | NA | | | 11.31 | |
Artisan Opportunistic Growth Fund | | 9/22/08 | | NA | | | NA | | | NA | | | NA | | | -6.80 | |
Artisan Opportunistic Value Fund | | 3/27/06 | | -22.88 | | | NA | | | NA | | | NA | | | -1.91 | |
Artisan Small Cap Fund | | 3/28/95 | | -26.64 | | | -5.05 | | | 4.85 | | | 5.48 | | | 6.64 | |
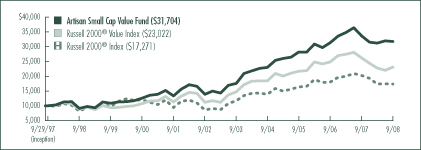
Artisan Small Cap Value Fund | | 9/29/97 | | -5.77 | | | 4.10 | | | 12.55 | | | 13.32 | | | 11.06 | |
The performance quoted represents past performance, which does not guarantee future results. The investment return and principal value of an investment in a Fund will fluctuate, so that an investor’s shares in the Fund, when redeemed, may be worth more or less than their original cost. Current performance may be lower or higher than the performance data quoted. For current to most recent month-end performance information, visit www.artisanfunds.com or call 800.344.1770. The performance information shown for Artisan Global Value Fund, Artisan International Fund, Artisan International Small Cap Fund and Artisan International Value Fund does not reflect the deduction of a 2% redemption fee on shares held by an investor for 90 days or less and, if reflected, the fee would reduce the performance quoted. Artisan International Small Cap Fund’s investments in initial public offerings (IPOs) made a material contribution to the Fund’s performance. IPO investments are not an integral component of the Fund’s investment process and may not be available in the future. The performance shown for Artisan Global Value Fund and Artisan Opportunistic Growth Fund is not annualized and may vary greatly over short periods, and current performance may be materially lower or higher than the performance data quoted. The performance information shown for Artisan Global Value Fund and Artisan Opportunistic Growth Fund reflects Artisan Partners’ voluntary undertaking to limit each Fund’s expenses when they exceed 1.50%, which may be terminated at any time, has been in effect since each Fund’s inception and has had a material impact on each Fund’s performance. In addition, the outside directors of Artisan Funds have waived that portion of their fees allocable to Artisan Global Value Fund for the fiscal year ended September 30, 2008 and Artisan Opportunistic Growth Fund for the fiscal years ending September 30, 2008 and September 30, 2009. Absent that expense waiver, each Fund’s performance would have been lower.
Artisan Global Value, Artisan International, Artisan International Small Cap, Artisan International Value, Artisan Opportunistic Growth & Artisan Opportunistic Value: International investments involve special risks, including currency fluctuation, lower liquidity, different accounting methods and economic and political systems and higher transaction costs. These risks are typically greater in emerging markets.
Artisan International, Artisan International Small Cap, Artisan Mid Cap, Artisan Opportunistic Growth & Artisan Small Cap: Growth stocks may underperform other asset types during a given period.
Artisan Global Value, Artisan International Value, Artisan Opportunistic Value, Artisan Mid Cap Value & Artisan Small Cap Value: Value stocks may underperform other asset types during a given period.
Artisan International Small Cap, Artisan International Value, Artisan Small Cap & Artisan Small Cap Value: Stocks of smaller companies tend to be more volatile and less liquid than those of large companies, have underperformed the stocks of larger companies during some periods and tend to have a shorter history of operations than larger companies.
Artisan International Value, Artisan Mid Cap, Artisan Mid Cap Value, Artisan Opportunistic Growth & Artisan Opportunistic Value: Stocks of medium-sized companies tend to be more volatile than those of large companies, and have underperformed the stocks of small and large companies during some periods.
ARTISAN GLOBAL VALUE FUND (ARTGX)
INVESTMENT PROCESS HIGHLIGHTS
Artisan Global Value Fund uses a bottom-up investment process to construct a diversified portfolio of securities of undervalued U.S. and non-U.S. companies. The Fund’s investment process is focused on identifying what the investment team considers to be high quality, undervalued businesses that offer the potential for superior risk/reward outcomes. The team’s in-depth research process focuses on four key investment characteristics:
Undervaluation. Determining the intrinsic value of the business is the heart of the team’s research process. The team believes that intrinsic value represents the amount that a buyer would pay to own a company’s future cash flows. The team seeks to invest at a significant discount to the team’s estimate of the intrinsic value of a business.
Business quality. The team seeks to invest in companies with histories of generating strong free cash flow, improving returns on capital and strong competitive positions in their industries.
Financial strength. The team believes that investing in companies with strong balance sheets helps to reduce the potential for capital risk and provides company management the ability to build value when attractive opportunities are available.
Shareholder-oriented management. The team’s research process attempts to identify management teams with a history of building value for shareholders.
PERFORMANCE HISTORY
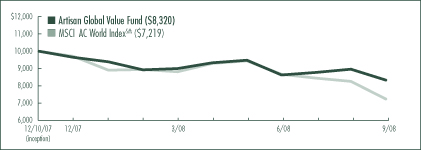
GROWTH OF AN ASSUMED $10,000 INVESTMENT (12/10/2007 to 9/30/2008)
TOTAL RETURNS (as of 9/30/2008)
| | | |
| Fund / Index | | Since(1)
Inception | |
Artisan Global Value Fund | | -16.80 | % |
MSCI ACWI (All Country World Index) IndexSM | | -27.81 | |
(1) | For the period from commencement of operations (December 10, 2007) through September 30, 2008; not annualized. |
The performance quoted represents past performance, which does not guarantee future results. The investment return and principal value of an investment in the Fund will fluctuate, so that an investor’s shares in the Fund, when redeemed, may be worth more or less than their original cost. The Fund’s return may vary greatly over short periods, and current performance may be materially lower or higher than the performance data quoted. For current to most recent month-end performance information, visit www.artisanfunds.com or call 800.344.1770. The graph and table above do not reflect the deduction of taxes that a shareholder would pay on distributions or sale of Fund shares. The performance shown does not reflect the deduction of a 2% redemption fee on shares held by an investor for 90 days or less and, if reflected, the fee would reduce the performance quoted. The Fund’s performance information reflects Artisan Partners’ voluntary undertaking to limit the Fund’s expenses when they exceed 1.50%, which may be terminated at any time, has been in effect since the Fund’s inception and has had a material impact on the Fund’s performance, which would have been lower in its absence. In addition, the outside directors of Artisan Funds have waived that portion of their fees allocable to the Fund until September 30, 2008. Absent that expense waiver, the Fund’s performance would have been lower. See page 94 for a description of each index.
2
INVESTING ENVIRONMENT
The Fund’s first fiscal year was a tough period for equity investors as stock markets were down across the board. Regionally, all markets declined during the period, and even the energy sector, which had been a holdout, declined considerably over the last several months of our fiscal year. Economic indicators from Europe as well as emerging markets started to follow the slowdown that was already underway in the U.S. This slowdown accelerated as the liquidity crunch reached crisis levels. In response, governments around the world have intervened to an unprecedented degree to shore up confidence in their respective banking industries.
SECTOR DIVERSIFICATION
| | | |
| Sector | | 9/30/2008 | |
Consumer Discretionary | | 26.7 | % |
Consumer Staples | | 10.4 | |
Financials | | 19.4 | |
Healthcare | | 15.6 | |
Industrials | | 11.0 | |
Information Technology | | 11.1 | |
Telecommunication Services | | 1.8 | |
Other assets less liabilities | | 4.0 | |
Total | | 100.0 | % |
As a percentage of total net assets.
PERFORMANCE DISCUSSION
Artisan Global Value Fund declined -16.80% since its December 10, 2007 inception, holding up better than its primary benchmark, the MSCI ACWI (All Country World) IndexSM, which decreased -27.81% over the same period.
Our aversion to the extreme leverage that became commonplace in the financial services industry served us well during the fiscal year. We have thus far avoided some of the value destruction that has occurred in this environment. We remain focused on the intersection of balance sheet strength, business quality and valuation. We believe that this focus has helped us to manage risk in times such as these, while helping us to position the Fund for the opportunity to compound wealth over the long-term.
The performance of the following companies had a positive impact on the portfolio during the period: Marsh & McLennan Companies, Inc., an insurance broker; Wal-Mart Stores, Inc., a discount retailer; SANKYO CO., LTD., a Japanese pachinko machine manufacturer; Covidien Ltd., a U.S. medical instruments maker that spun off from Tyco International Ltd. in 2007; and Johnson & Johnson, a healthcare conglomerate. Our worst performers included: Motorola, Inc., a U.S. handset and equipment maker; Wolters Kluwer NV, a Dutch-based professional publishing company; SK Telecom Co., Ltd., an operator in the South Korean wireless market; Home Retail Group plc, a U.K. home and general merchandise retailer; and Credit Saison Co., Ltd., a Japanese credit card company.
REGION ALLOCATION
| | | |
| Region | | 9/30/2008 | |
Americas | | 47.3 | % |
Europe | | 38.5 | |
Pacific Basin | | 7.2 | |
Emerging Markets | | 3.0 | |
As a percentage of total net assets.
FUND CHANGES
Unsurprisingly, we found many compelling values amidst the general decline in stock prices. We added several new U.S. holdings to the portfolio during the fiscal year including Microsoft Corporation, a software company; WellPoint, Inc., a health insurer; American Express Company, a credit card and business services company; and The Bank of New York Mellon Corporation, a custodian of financial assets. We also added Finland-based mobile phone maker, Nokia Corporation.
Our list of sales included Motorola, Inc., Samsung Electronics Co., Ltd., The Washington Post Company, Givaudan SA, Covidien Ltd. and The Home Depot, Inc.
3
ARTISAN INTERNATIONAL FUND (ARTIX)
INVESTMENT PROCESS HIGHLIGHTS
Artisan International Fund uses a fundamental stock selection process focused on identifying long-term growth opportunities.
Themes. The investment team’s thematic approach identifies catalysts for change and develops investment themes with the objective of capitalizing on them globally. Changing demographics, developing technology, privatization of economic resources and outsourcing are among the long-term catalysts for change that currently form the basis for the team’s investment themes. The team incorporates these catalysts along with sector and regional fundamentals into a long-term global framework for investment analysis and decision-making.
Sustainable Growth. The team applies a fundamental approach to identifying the long term, sustainable growth characteristics of potential investments. The team seeks high quality companies that are well managed, have a dominant or improving market position and competitive advantages compared to industry and regional peers.
Valuation. The team assesses the relationship between its estimate of a company’s sustainable growth prospects and the company’s stock price. The team uses multiple valuation metrics to establish price targets.
The Fund primarily invests in non-U.S. growth companies of all market capitalizations in developed and emerging markets.
PERFORMANCE HISTORY
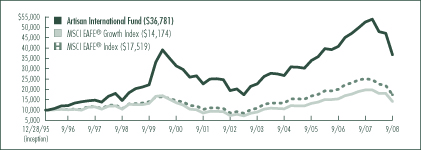
GROWTH OF AN ASSUMED $10,000 INVESTMENT (12/28/1995 to 9/30/2008)
AVERAGE ANNUAL TOTAL RETURNS (as of 9/30/2008)
| | | | | | | | | | | | | | | |
| Fund / Index | | 1-Year | | | 3-Year | | | 5-Year | | | 10-Year | | | Since
Inception | |
Artisan International Fund | | -29.99 | % | | 2.59 | % | | 10.10 | % | | 9.59 | % | | 10.75 | % |
MSCI EAFE® Growth Index | | -28.48 | | | 2.16 | | | 9.23 | | | 2.97 | | | 2.77 | |
MSCI EAFE® Index | | -30.50 | | | 1.12 | | | 9.69 | | | 5.02 | | | 4.49 | |
The performance quoted represents past performance, which does not guarantee future results. The investment return and principal value of an investment in the Fund will fluctuate, so that an investor’s shares in the Fund, when redeemed, may be worth more or less than their original cost. Current performance may be lower or higher than the performance data quoted. For current to most recent month-end performance information, visit www.artisanfunds.com or call 800.344.1770. The graph and table above do not reflect the deduction of taxes that a shareholder would pay on distributions or sale of Fund shares. The performance shown does not reflect the deduction of a 2% redemption fee on shares held by an investor for 90 days or less and, if reflected, the fee would reduce the performance quoted. See page 94 for a description of each index.
4
INVESTING ENVIRONMENT
International equities broadly struggled throughout the fiscal year. As the U.S. financial crisis spread across the economy and around the world, trading volatility surged to a record high. Amid this backdrop, the MSCI EAFE® Index declined -30.50%. There were no safe havens as every sector declined by double digits, although traditionally defensive sectors such as healthcare, utilities and consumer staples held up best. Financial and material stocks were the biggest decliners. Amid the worldwide financial crisis, housing market debacle and volatile commodity environment, it is not surprising that many of these stocks struggled. Results were also disappointing on a regional basis. Every country in the EAFE Index dropped by more than -20%. Emerging markets also suffered – the MSCI Emerging Markets IndexSM declined more than -30% over the twelve-month period ended September 30, 2008.
SECTOR DIVERSIFICATION
| | | | | | |
| Sector | | 9/30/2007 | | | 9/30/2008 | |
Consumer Discretionary | | 8.4 | % | | 11.2 | % |
Consumer Staples | | 9.1 | | | 9.8 | |
Energy | | 6.4 | | | 9.1 | |
Financials | | 23.4 | | | 14.2 | |
Healthcare | | 2.5 | | | 7.9 | |
Industrials | | 16.1 | | | 17.4 | |
Information Technology | | 3.8 | | | 4.7 | |
Materials | | 7.6 | | | 7.4 | |
Telecommunication Services | | 10.7 | | | 3.1 | |
Utilities | | 8.8 | | | 9.4 | |
Other assets less liabilities | | 3.2 | | | 5.8 | |
Total | | 100.0 | % | | 100.0 | % |
As a percentage of total net assets.
PERFORMANCE DISCUSSION
The Fund declined -29.99% during the fiscal year. We benefited from positive security selection in the telecom, materials and technology sectors. Our top contributors included telecom companies China Mobile Limited, China Unicom Limited and China Netcom Group Corporation (Hong Kong) Limited. Retail banker Standard Chartered plc, consumer holdings Grupo Televisa S.A. and Carrefour SA, and automobile manufacturer HONDA MOTOR CO., LTD also performed well.
Relative results were held back by weaknesses among our financial, energy and utilities holdings. Commercial bank Lloyds TSB Group plc, Gazprom, the largest natural gas producing company in the world, and utilities Electricite de France and RAO Unified Energy System were among our biggest detractors in these sectors. ASML Holding N.V., Wacker Chemie AG, Orkla ASA, Daimler AG and Vinci SA were other weak performers.
FUND CHANGES
Our fundamental stock selection process focuses on companies with sustainable growth characteristics, trading at reasonable valuations with exposure to the secular themes we have identified. We have used this period of extreme volatility to critically evaluate our holdings and focus capital in our highest conviction positions. As of the period’s end we held 79 positions, marking the first time in 11 years that we have held fewer than 80 stocks.
We added capital to those positions that we believe offer the strongest potential for outperformance on a long-term basis. These included Gazprom, Lloyds TSB Group plc, Orkla ASA, Vinci SA and ASML Holding N.V.
We also initiated new positions in Cadbury PLC, one of the world’s largest confectionary companies, and Petroleo Brasileiro S.A., one of the world’s largest oil and natural gas producers.
As the weakness in the market highlighted long-term risks to growth, we sold our positions in China Unicom Limited, Deutsche Telekom AG, Swire Pacific Limited, Kookmin Bank, Swiss Re, Mitsubishi Heavy Industries, Ltd. and RWE AG.
REGION ALLOCATION
| | | | | | |
| Region | | 9/30/2007 | | | 9/30/2008 | |
Europe | | 58.9 | % | | 61.0 | % |
Emerging Markets | | 19.1 | | | 15.5 | |
Pacific Basin | | 17.6 | | | 15.0 | |
Americas | | 1.2 | | | 2.2 | |
Middle East | | — | | | 0.5 | |
As a percentage of total net assets.
5
ARTISAN INTERNATIONAL SMALL CAP FUND (ARTJX)
INVESTMENT PROCESS HIGHLIGHTS
Artisan International Small Cap Fund uses a fundamental stock selection process focused on identifying long-term growth opportunities among small non-U.S. companies.
Themes. The investment team’s thematic approach identifies catalysts for change and develops investment themes with the objective of capitalizing on them globally. Changing demographics, developing technology, privatization of economic resources and outsourcing are among the long-term catalysts for change that currently form the basis for the team’s investment themes. The team incorporates these catalysts along with sector and regional fundamentals into a long-term global framework for investment analysis and decision-making.
Sustainable Growth. The team applies a fundamental approach to identifying the long term, sustainable growth characteristics of potential investments. The team seeks high quality companies that are well managed, have a dominant or improving market position and competitive advantages compared to industry and regional peers.
Valuation. The team assesses the relationship between its estimate of a company’s sustainable growth prospects and the company’s stock price. The team uses multiple valuation metrics to establish price targets.
The Fund primarily invests in non-U.S. small-cap growth companies in developed and emerging markets with market capitalizations less than $3 billion at the time of investment.
PERFORMANCE HISTORY
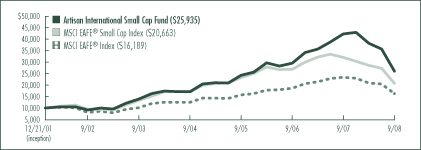
GROWTH OF AN ASSUMED $10,000 INVESTMENT (12/21/2001 to 9/30/2008)
AVERAGE ANNUAL TOTAL RETURNS (as of 9/30/2008)
| | | | | | | | | | | | |
| Fund / Index | | 1-Year | | | 3-Year | | | 5-Year | | | Since
Inception | |
Artisan International Small Cap Fund | | -38.44 | % | | 2.33 | % | | 13.31 | % | | 15.10 | % |
MSCI EAFE® Small Cap Index | | -35.24 | | �� | -3.88 | | | 9.17 | | | 11.31 | |
MSCI EAFE® Index | | -30.50 | | | 1.12 | | | 9.69 | | | 7.37 | |
The performance quoted represents past performance, which does not guarantee future results. The investment return and principal value of an investment in the Fund will fluctuate, so that an investor’s shares in the Fund, when redeemed, may be worth more or less than their original cost. Current performance may be lower or higher than the performance data quoted. For current to most recent month-end performance information, visit www.artisanfunds.com or call 800.344.1770. The graph and table above do not reflect the deduction of taxes that a shareholder would pay on distributions or sale of Fund shares. The performance shown does not reflect the deduction of a 2% redemption fee on shares held by an investor for 90 days or less and, if reflected, the fee would reduce the performance quoted. The Fund’s investments in initial public offerings (IPOs) made a material contribution to the Fund’s performance. IPO investments are not an integral component of the Fund’s investment process and may not be available in the future. See page 94 for a description of each index.
6
INVESTING ENVIRONMENT
International small-cap equities broadly struggled throughout the fiscal year. As the U.S. financial crisis spread into the economy and around the world, trading volatility surged to a record high. Amid this backdrop, the MSCI EAFE® Small Cap Index declined
-35.24%. There were no safe havens as every sector declined. Only traditionally defensive consumer staples stocks were able to avoid a decline of more than 30%. Results were also disappointing on a regional basis. Every country in the MSCI EAFE® Small Cap Index dropped by double digits, with some falling more than 50%. Emerging markets also suffered. Stocks in China and Russia have lost more than half of their value over the twelve-month period ended September 30, 2008.
SECTOR DIVERSIFICATION
| | | | | | |
| Sector | | 9/30/2007 | | | 9/30/2008 | |
Consumer Discretionary | | 10.7 | % | | 8.5 | % |
Consumer Staples | | 7.6 | | | 15.8 | |
Energy | | 7.7 | | | 6.1 | |
Financials | | 30.0 | | | 22.4 | |
Healthcare | | 0.7 | | | 1.6 | |
Industrials | | 27.0 | | | 21.3 | |
Information Technology | | 2.0 | | | 9.9 | |
Materials | | 2.5 | | | 2.6 | |
Telecommunication Services | | 1.2 | | | — | |
Utilities | | 1.9 | | | — | |
Other assets less liabilities | | 8.7 | | | 11.8 | |
Total | | 100.0 | % | | 100.0 | % |
As a percentage of total net assets.
PERFORMANCE DISCUSSION
On a relative basis, we benefited from our overweight in energy and consumer staples stocks, as these sectors held up best in the benchmark. On a regional basis, returns were boosted by our European holdings. Our top contributors included Netherlands-based digital map maker Tele Atlas NV, Indian financial firm Indiabulls Financial Services Ltd., retail property fund VastNed Retail NV, Norwegian drilling rig company Ocean Rig ASA, Norwegian energy company Seawell Ltd., German construction and civil engineering firm Strabag AG and Swiss dental implants provider Straumann Holding AG.
Our financials, industrials and consumer discretionary holdings were the main sources of weakness in the portfolio. Results were also broadly held back by our stocks in Germany, China and a struggling Hong Kong market. Our worst performers included home improvement retailer Praktiker Bau- und Heimwerkermaerkte AG, electronic payment processing firm Wirecard AG, real estate developer Tian An China Investments Company Limited, construction and infrastructure company Empresas ICA S.A.B. de C.V. and cultivator KWS Saat AG.
REGION ALLOCATION
| | | | | | |
| Region | | 9/30/2007 | | | 9/30/2008 | |
Europe | | 42.0 | % | | 50.0 | % |
Emerging Markets | | 25.9 | | | 24.8 | |
Pacific Basin | | 21.9 | | | 12.3 | |
Americas | | 1.5 | | | 1.1 | |
As a percentage of total net assets.
FUND CHANGES
Our fundamental stock selection process focuses on companies with sustainable growth characteristics, trading at reasonable valuations with exposure to the secular themes we have identified. During this twelve-month period we initiated positions in Gmarket Inc., an e-commerce retailer in South Korea, Praktiker Bau- und Heimwerkermaerkte AG, tobacco producer Eastern Tobacco, and exchanges Hellenic Exchanges S.A. Holding Clearing Set and Bursa Malaysia Bhd.
In order to fund these new positions, we sold many of our top contributors. These sales included Tele Atlas NV, Ocean Rig ASA, Indiabulls Financial Services Ltd., VastNed Retail NV and Seawell Ltd.
7
ARTISAN INTERNATIONAL VALUE FUND (ARTKX)
INVESTMENT PROCESS HIGHLIGHTS
Artisan International Value Fund uses a bottom-up investment process focused on identifying what the investment team believes are high quality, undervalued businesses that offer the potential for superior risk/reward outcomes.
The team’s in-depth research process focuses on four key investment characteristics:
Undervaluation. Determining the intrinsic value of the business is the heart of the team’s research process. The team believes that intrinsic value represents the amount that a buyer would pay to own a company’s future cash flows. The team seeks to invest at a significant discount to its estimate of the intrinsic value of a business.
Business quality. The team seeks to invest in companies with histories of generating strong free cash flow, improving returns on capital and strong competitive positions in their industries.
Financial strength. The team believes that investing in companies with strong balance sheets helps to reduce the potential for capital risk and provides company management the ability to build value when attractive opportunities are available.
Shareholder-oriented management. The team’s research process attempts to identify management teams with a history of building value for shareholders.
The Fund primarily invests in common stocks and other equity securities of non-U.S. companies of all market capitalizations in developed and emerging markets.
PERFORMANCE HISTORY
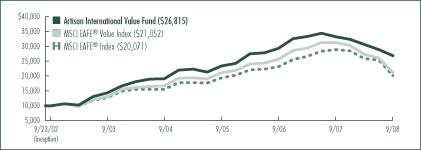
GROWTH OF AN ASSUMED $10,000 INVESTMENT (9/23/2002 to 9/30/2008)
AVERAGE ANNUAL TOTAL RETURNS (as of 9/30/2008)
| | | | | | | | | | | | |
| Fund / Index | | 1-Year | | | 3-Year | | | 5-Year | | | Since
Inception | |
Artisan International Value Fund | | -19.10 | % | | 4.74 | % | | 13.37 | % | | 17.81 | % |
MSCI EAFE® Value Index | | -32.58 | | | 0.00 | | | 10.05 | | | 13.16 | |
MSCI EAFE® Index | | -30.50 | | | 1.12 | | | 9.69 | | | 12.27 | |
The performance quoted represents past performance, which does not guarantee future results. The investment return and principal value of an investment in the Fund will fluctuate, so that an investor’s shares in the Fund, when redeemed, may be worth more or less than their original cost. Current performance may be lower or higher than the performance data quoted. For current to most recent month-end performance information, visit www.artisanfunds.com or call 800.344.1770. The graph and table above do not reflect the deduction of taxes that a shareholder would pay on distributions or sale of Fund shares. The performance shown does not reflect the deduction of a 2% redemption fee on shares held by an investor for 90 days or less and, if reflected, the fee would reduce the performance quoted. See page 94 for a description of each index.
8
INVESTING ENVIRONMENT
The fiscal year ended September 30, 2008, was a tough year for international equity investors as stock markets were down across the board. Regionally, all markets declined during the period, and even the energy sector, which had been a holdout, declined considerably over the last several months of our fiscal year. Economic indicators from Europe as well as emerging markets started to follow the slowdown that was already underway in the U.S. This slowdown accelerated as the liquidity crunch reached crisis levels. In response, governments around the world intervened to an unprecedented degree to shore up confidence in their respective banking industries.
SECTOR DIVERSIFICATION
| | | | | | |
| Sector | | 9/30/2007 | | | 9/30/2008 | |
Consumer Discretionary | | 23.5 | % | | 22.3 | % |
Consumer Staples | | 14.5 | | | 13.0 | |
Financials | | 16.1 | | | 19.0 | |
Healthcare | | 8.7 | | | 13.5 | |
Industrials | | 14.5 | | | 15.1 | |
Information Technology | | 5.9 | | | 8.3 | |
Materials | | 2.8 | | | 2.2 | |
Telecommunication Services | | 7.9 | | | 1.6 | |
Other assets less liabilities | | 6.1 | | | 5.0 | |
Total | | 100.0 | % | | 100.0 | % |
As a percentage of total net assets.
PERFORMANCE DISCUSSION
Artisan International Value Fund declined -19.10% during the twelve-month period ended September 30, 2008, holding up much better than the MSCI EAFE® Index, which decreased -30.50% over the same period.
Our aversion to the leverage that became commonplace in the financial services industry served us well during the fiscal year. We have thus far avoided some of the value destruction that has occurred in this environment. We remain focused on the intersection of balance sheet strength, business quality and valuation. We believe that this focus has helped us to manage risk in times such as these, while helping us to position the Fund for the opportunity to compound wealth over the long-term.
The following stocks had a meaningful positive impact on the portfolio during the fiscal year: SANKYO CO., LTD., a Japanese pachinko machine manufacturer; Covidien Ltd., a U.S. medical instruments maker that spun off from Tyco International Ltd. in 2007; Gemalto NV, a French smartcard maker; Benfield Group Plc, a U.K. reinsurance broker; and UNICHARM CORPORATION, a Japanese manufacturer of diapers and feminine products. Notable detractors during the period included Galiform Plc, a U.K. kitchen business; CanWest Global Communications Corp., a holding company that owns one of Canada’s television networks; Wolters Kluwer NV, a Dutch-based professional publishing company; Credit Saison Co., Ltd., a Japanese credit card company; and Esprinet S.p.A., an Italian computer and electronics distributor.
FUND CHANGES
Our hurdle rate for new investments moved up during the period as almost all of the stocks in our portfolio fell further from our estimates of their intrinsic value. We added to many of the companies we already owned as the existing portfolio got cheaper. We also added new names to the portfolio as we found some compelling values amid the general decline in stock prices. Two of the purchases we made during the fiscal year were French catering company Sodexo and Finland-based mobile phone maker Nokia Corporation.
We exited our positions in CanWest Global Communications Corp., Galiform Plc, Heidelberger Druckmaschinen AG and Esprinet S.p.A.
REGION ALLOCATION
| | | | | | |
| Region | | 9/30/2007 | | | 9/30/2008 | |
Europe | | 55.5 | % | | 63.8 | % |
Pacific Basin | | 19.4 | | | 14.2 | |
Americas | | 10.3
|
| | 10.7 | |
Emerging Markets | | 8.7 | | | 6.3 | |
As a percentage of total net assets.
9
ARTISAN MID CAP FUND (ARTMX)
INVESTMENT PROCESS HIGHLIGHTS
Artisan Mid Cap Fund uses a bottom-up investment process to construct a diversified portfolio of U.S. mid-cap growth companies. The Fund’s investment process focuses on two distinct areas – security selection and capital allocation. The investment team believes that adhering to this process increases the likelihood of delivering upside participation with downside protection.
Artisan’s Mid Cap Fund investment team attempts to identify companies that possess franchise characteristics that are selling at attractive valuations and benefiting from an accelerating profit cycle.
Franchise characteristics. These are characteristics that the team believes help to protect a company’s stream of cash flow from the effects of competition. The team looks for companies with at least two of the following characteristics: low cost production capability, possession of a proprietary asset, dominant market share or a defensible brand name.
Attractive valuations. Through its own fundamental research, the team estimates the amount a private market buyer would pay to buy the entire company and considers whether to purchase a stock if it sells at a discount to that estimate.
Accelerating profit cycle. The team tries to invest in companies that are well positioned for long-term growth, at an early enough stage in their profit cycle to benefit from the increased cash flows produced by the emerging profit cycle.
Based on the investment team’s fundamental analysis of a company’s profit cycle, portfolio holdings develop through three stages. GardenSM investments are small positions in the early part of their profit cycle that will warrant a more sizeable allocation once their profit cycle accelerates. CropSM investments are positions that are being increased to a full weight because they are moving through the strongest part of their profit cycle. HarvestSM investments are positions that are being reduced as they near the team’s estimate of full valuation or their profit cycle begins to decelerate.
PERFORMANCE HISTORY
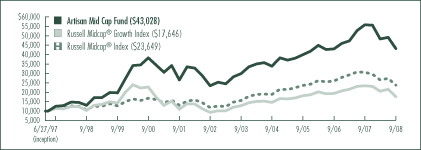
GROWTH OF AN ASSUMED $10,000 INVESTMENT (6/27/1997 to 9/30/2008)
AVERAGE ANNUAL TOTAL RETURNS (as of 9/30/2008)
| | | | | | | | | | | | | | | |
| Fund / Index | | 1-Year | | | 3-Year | | | 5-Year | | | 10-Year | | | Since
Inception | |
Artisan Mid Cap Fund | | -22.47 | % | | 2.64 | % | | 7.61 | % | | 12.66 | % | | 13.84 | % |
Russell MidCap® Growth Index | | -24.65 | | | -0.75 | | | 6.53 | | | 5.51 | | | 5.17 | |
Russell MidCap® Index | | -22.36 | | | 0.09 | | | 8.62 | | | 8.34 | | | 7.94 | |
The performance quoted represents past performance, which does not guarantee future results. The investment return and principal value of an investment in the Fund will fluctuate, so that an investor’s shares in the Fund, when redeemed, may be worth more or less than their original cost. Current performance may be lower or higher than the performance data quoted. For current to most recent month-end performance information, visit www.artisanfunds.com or call 800.344.1770. The graph and table above do not reflect the deduction of taxes that a shareholder would pay on distributions or sale of Fund shares. See page 94 for a description of each index.
10
INVESTING ENVIRONMENT
During the fiscal year ended September 30, 2008, mid-cap stocks struggled along with the broader market as the Russell Midcap® Index declined -22.36%. The year was marked by weak economic conditions, volatile energy prices and a deep credit crisis. Value stocks outperformed growth names as the Russell Midcap® Growth Index fell -24.65%, while its value counterpart retreated -20.50%. Within the growth index, all sectors closed lower, with utilities, telecommunication services and consumer discretionary stocks down the most. Traditionally defensive sectors, such as consumer staples and healthcare, held up best, but also posted losses.
SECTOR DIVERSIFICATION
| | | | | | |
| Sector | | 9/30/2007 | | | 9/30/2008 | |
Consumer Discretionary | | 9.9 | % | | 7.7 | % |
Consumer Staples | | 4.9 | | | 4.8 | |
Energy | | 3.7 | | | 4.0 | |
Financials | | 6.5 | | | 8.0 | |
Healthcare | | 22.7 | | | 25.4 | |
Industrials | | 13.1 | | | 14.9 | |
Information Technology | | 31.1 | | | 28.5 | |
Materials | | 1.3 | | | 1.6 | |
Telecommunication Services | | 1.7 | | | 0.4 | |
Utilities | | — | | | 2.0 | |
Other assets less liabilities | | 5.1 | | | 2.7 | |
Total | | 100.0 | % | | 100.0 | % |
As a percentage of total net assets.
PERFORMANCE DISCUSSION
The Fund held up better than the Russell Midcap® Growth Index and underperformed the Russell Midcap® Index as it returned
-22.47% for the fiscal year. Relative to the benchmarks, the Fund benefited most from our healthcare holdings, but security selection results were also strong in the industrials and materials sectors. Top performers within the healthcare sector included robotic surgery systems manufacturer Intuitive Surgical, Inc., biopharmaceutical company Celgene Corporation, radiation therapy systems provider Varian Medical Systems, Inc. and biopharmaceutical company ImClone Systems Incorporated. In the industrials sector, much of our performance advantage came from the construction and engineering industry with contracting services company Quanta Services, Inc., one of our top performers. Our success in the materials sectors was largely due to fertilizer producer The Mosaic Company.
The key sources of weakness compared to the benchmark were our relatively low weight in energy stocks and select holdings in the consumer staples and consumer discretionary sectors. Our underperformance in the consumer staples sector was driven mostly by a decline in alternative beverage producer Hansen Natural Corporation. Footwear company Crocs, Inc. and auto components manufacturer BorgWarner Inc. were among our worst performing consumer discretionary holdings.
FUND CHANGES
Our security selection process is focused on identifying companies that possess franchise characteristics and an attractive valuation that are benefiting from an accelerating profit cycle. Our transaction activity was not concentrated in any one sector. Our largest new positions included beauty product marketer Avon Products Inc., investment manager Invesco Ltd., and healthcare diagnostics developer Gen-Probe Incorporated. We also added capital to many existing positions, most notably to services provider Cerner Corporation and network infrastructure company Juniper Networks, Inc.
We funded our new purchases with sales from a broad range of sectors. Patterson Companies, Inc., McDermott International Inc., Applied Biosystems Inc. and NAVTEQ Corporation were all CropSM positions at the beginning of the fiscal year and were sold during the year. Ventana Medical Systems Inc. was the subject of a takeover by Swiss pharmaceutical and diagnostics company Roche Holding AG. The transaction was completed during the period.
11
ARTISAN MID CAP VALUE FUND (ARTQX)
INVESTMENT PROCESS HIGHLIGHTS
Artisan Mid Cap Value Fund uses a bottom-up investment process to construct a diversified portfolio of stocks of medium-sized U.S. companies that the investment team believes are undervalued, in solid financial condition and have attractive business economics. The team believes companies with these characteristics are less likely to experience eroding values over the long term.
Attractive valuation. The team values a business using what it believes are reasonable expectations for the long-term earnings power and capitalization rates of that business. This results in a range of values for the company that the team believes would be reasonable. The team generally will purchase a security if the stock price falls below or toward the lower end of that range.
Sound financial condition. The team favors companies with an acceptable level of debt and positive cash flow. At a minimum, the team tries to avoid companies that have so much debt that management may be unable to make decisions that would be in the best interests of the companies’ shareholders.
Attractive business economics. The team favors cash-producing businesses that it believes are capable of earning acceptable returns on capital over the company’s business cycle.
The Fund will generally not initiate a position in a company unless it has a market capitalization between $2 billion and $15 billion.
PERFORMANCE HISTORY
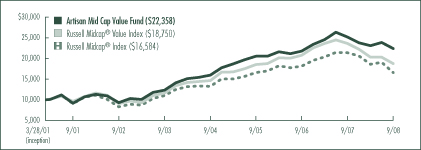
GROWTH OF AN ASSUMED $10,000 INVESTMENT (3/28/2001 to 9/30/2008)
AVERAGE ANNUAL TOTAL RETURNS (as of 9/30/2008)
| | | | | | | | | | | | |
| Fund / Index | | 1-Year | | | 3-Year | | | 5-Year | | | Since
Inception | |
Artisan Mid Cap Value Fund | | -11.16 | % | | 2.91 | % | | 12.65 | % | | 11.31 | % |
Russell Midcap® Value Index | | -20.50 | | | 0.51 | | | 9.97 | | | 8.73 | |
Russell Midcap® Index | | -22.36 | | | 0.09 | | | 8.62 | | | 6.97 | |
The performance quoted represents past performance, which does not guarantee future results. The investment return and principal value of an investment in the Fund will fluctuate, so that an investor’s shares in the Fund, when redeemed, may be worth more or less than their original cost. Current performance may be lower or higher than the performance data quoted. For current to most recent month-end performance information, visit www.artisanfunds.com or call 800.344.1770. The graph and table above do not reflect the deduction of taxes that a shareholder would pay on distributions or sale of Fund shares. See page 94 for a description of each index.
12
INVESTING ENVIRONMENT
For the twelve-month period ended September 30, 2008, the Russell Midcap® Value and Russell Midcap® indices returned -20.50% and -22.36%, respectively. The first six months of the period were challenging as investors grappled with a slowing economy and continued stress in the capital markets, but the second half of the period got progressively worse as few areas of the market were able to avoid the turmoil and volatility driven by the financial crisis. In the Russell Midcap® Value Index, all sectors declined over the fiscal year. The telecommunications, technology, consumer discretionary and financials sectors all declined more than -28%. Areas of the market that held up better included the materials and energy sectors, which were buoyed in the first half of the period by rising commodity prices, and the traditionally defensive healthcare sector.
SECTOR DIVERSIFICATION
| | | | | | |
| Sector | | 9/30/2007 | | | 9/30/2008 | |
Consumer Discretionary | | 14.5 | % | | 18.3 | % |
Consumer Staples | | 2.6 | | | 0.8 | |
Energy | | 18.6 | | | 4.4 | |
Financials | | 23.6 | | | 19.4 | |
Healthcare | | — | | | 2.0 | |
Industrials | | 12.2 | | | 27.6 | |
Information Technology | | 18.7 | | | 20.5 | |
Utilities | | 2.8 | | | 0.8 | |
Other assets less liabilities | | 7.0 | | | 6.2 | |
Total | | 100.0 | % | | 100.0 | % |
As a percentage of total net assets.
PERFORMANCE DISCUSSION
The Fund returned -11.16% during the twelve-month period ended September 30, 2008. Strong stock selection in the technology, consumer discretionary and industrials sectors added significant value to the Fund’s relative performance. We also benefited from strength among our energy holdings during the period. Our leading performers included Cimarex Energy Co., Pioneer Natural Resources Company, Mariner Energy, Inc., Ryder System, Inc., and Marvel Entertainment, Inc. A number of our weakest performers during the fiscal year were in the technology and financials sectors. Arrow Electronics, Inc. and Avnet, Inc. were among our biggest decliners in the technology sector, while MBIA Inc., The Student Loan Corporation and IndyMac Bancorp, Inc. were among our financial holdings that hurt performance.
FUND CHANGES
One of the biggest changes to the portfolio over the past twelve months was a decrease in our weight in the energy sector. Our reduced exposure to the energy sector was due in large part to our exit from our exploration and production companies in the latter half of the period. Pioneer Natural Resources, Cimarex Energy, Mariner Energy, Noble Energy, Inc. and St. Mary Land & Exploration Company were sold because their share prices were being supported by commodity prices that we believed were unsustainable. Other sales during the period included Broadridge Financial Solutions, Inc., which was sold as its share price reached our target selling range, and Zale Corporation, Leggett & Platt, Incorporated and Foot Locker, Inc., which we sold due to deteriorating fundamentals.
One positive outcome of the weak environment is the emergence of new investment opportunities. Some of our more recent purchases included electronic communications and avionics manufacturer Rockwell Collins, Inc., marketing and advertising firm Omnicom Group Inc., hard disk drive manufacturer Seagate Technology, home retail store Bed Bath & Beyond Inc., temporary staffing services provider Robert Half International Inc., department store operator Kohl’s Corporation, and apparel retailer Limited Brands, Inc. We were attracted to all of our new positions based on the key characteristics of our investment process.
13
ARTISAN OPPORTUNISTIC GROWTH FUND (ARTRX)
INVESTMENT PROCESS HIGHLIGHTS
Artisan Opportunistic Growth Fund uses a bottom-up investment process to construct a diversified portfolio of growth companies across a broad capitalization range. The Fund’s investment process focuses on two distinct areas – security selection and capital allocation. The investment team believes that adhering to this process increases the likelihood of delivering upside participation with downside protection.
Artisan’s Opportunistic Growth Fund investment team attempts to identify companies that possess franchise characteristics that are selling at attractive valuations and benefiting from an accelerating profit cycle.
Franchise characteristics. These are characteristics that the team believes help to protect a company’s stream of cash flow from the effects of competition. The team looks for companies with at least two of the following characteristics: low cost production capability, possession of a proprietary asset, dominant market share or a defensible brand name.
Attractive valuations. Through its own fundamental research, the team estimates the amount a private market buyer would pay to buy the entire company and considers whether to purchase a stock if it sells at a discount to that estimate.
Accelerating profit cycle. The team tries to invest in companies that are well positioned for long-term growth, at an early enough stage in their profit cycle to benefit from the increased cash flows produced by the emerging profit cycle.
Based on the investment team’s fundamental analysis of a company’s profit cycle, portfolio holdings develop through three stages. GardenSM investments are small positions in the early part of their profit cycle that will warrant a more sizeable allocation once their profit cycle accelerates. CropSM investments are positions that are being increased to a full weight because they are moving through the strongest part of their profit cycle. HarvestSM investments are positions that are being reduced as they near the team’s estimate of full valuation or their profit cycle begins to decelerate.
PERFORMANCE HISTORY
TOTAL RETURNS (as of 9/30/2008)
| | | |
| Fund / Index | | Since(1)
Inception | |
Artisan Opportunistic Growth Fund | | -6.80 | % |
Russell 1000® Growth Index | | -4.18 | |
Russell 1000® Index | | -3.69 | |
(1) | For the period from commencement of operations (September 22, 2008) through September 30, 2008; not annualized. |
The performance quoted represents past performance, which does not guarantee future results. The investment return and principal value of an investment in the Fund will fluctuate, so that an investor’s shares in the Fund, when redeemed, may be worth more or less than their original cost. The Fund’s return may vary greatly over short periods, and current performance may be materially lower or higher than the performance data quoted. For current to most recent month-end performance information, visit www.artisanfunds.com or call 800.344.1770. The table above does not reflect the deduction of taxes that a shareholder would pay on distributions or sale of Fund shares. The Fund’s performance information reflects Artisan Partners’ voluntary undertaking to limit the Fund’s expenses when they exceed 1.50%, which may be terminated at any time, has been in effect since the Fund’s inception and has had a material impact on the Fund’s performance, which would have been lower in its absence. In addition, the outside directors of Artisan Funds have waived that portion of their fees allocable to the Fund until September 30, 2009. Absent that expense waiver, the Fund’s performance would have been lower. See page 94 for a description of each index. The growth of an assumed $10,000 investment chart has been omitted due to the Fund’s short performance history, but will be included in the March 2009 semiannual report.
14
EXAMPLE HOLDING
Gamesa Corporacion Tecnologica, S.A. is a holding that we purchased at inception. Gamesa is a vertically integrated wind energy company. The firm is a leading manufacturer of wind turbines and also owns and develops wind farms around the globe.
Our investment thesis is summarized below.
Franchise Characteristics. Gamesa has a dominant market position as the second largest wind turbine manufacturer with approximately 15% global market share. The company possesses a global footprint and portfolio totaling 21,000 megawatts of installations.
Valuation. At our initial purchase, the private market value of Gamesa was driven by its current earnings power and the value of its growth opportunities within its existing franchise. At that time, Gamesa was trading at a price that we believe understated the value of the company’s earnings power and growth opportunities within its franchise.
Profit Cycle. Our investment thesis for Gamesa at the time of our initial purchase, was based on our belief that Gamesa is well-positioned to benefit from growing demand for wind power, a clean, scalable and cost competitive renewable energy source. All of the company’s 32 production sites are located in key growth markets – U.S., China and Spain. From our perspective, Gamesa has excellent earnings visibility over the next three years with an existing order book covering production capacity through 2010.
SECTOR DIVERSIFICATION
| | | |
| Sector | | 9/30/2008 | |
Consumer Discretionary | | 6.4 | % |
Consumer Staples | | 10.2 | |
Energy | | 2.0 | |
Financials | | 12.2 | |
Healthcare | | 19.2 | |
Industrials | | 10.2 | |
Information Technology | | 31.3 | |
Materials | | 1.9 | |
Telecommunication Services | | 1.1 | |
Other assets less liabilities | | 5.5 | |
Total | | 100.0 | % |
As a percentage of total net assets.
FLEXIBLE PORTFOLIO CONSTRUCTION
Artisan Opportunistic Growth Fund is structured to provide the investment team with broad flexibility to build a high value-added, bottom-up investment portfolio.
The Fund typically holds between 30 and 50 stocks. The Fund can invest up to 25% of its assets in non-U.S. securities. The Fund primarily invests in securities with market capitalizations greater than $3 billion at the time of purchase. The Fund can invest up to 15% of its assets in cash. The Fund’s maximum position size is 5% at the time of purchase in 75% of portfolio, but in the remaining 25% of portfolio the team can invest up to 10% of Fund assets at the time of purchase in a single position.
15
ARTISAN OPPORTUNISTIC VALUE FUND (ARTLX)
INVESTMENT PROCESS HIGHLIGHTS
Artisan Opportunistic Value Fund uses a bottom-up investment process to construct a diversified portfolio of stocks that the team believes are undervalued, in solid financial condition with attractive business economics and that offer the potential for superior risk/reward outcomes. The team believes companies with these characteristics are less likely to experience eroding values over the long term.
Attractive valuation. The team values a business using what it believes are reasonable expectations for the long-term earnings power and capitalization rates of that business. This results in a range of values for the company that the team believes would be reasonable. The team generally will purchase a security if the stock price falls below or toward the lower end of that range.
Sound financial condition. The team favors companies with an acceptable level of debt and positive cash flow. At a minimum, the team tries to avoid companies that have so much debt that management may be unable to make decisions that would be in the best interest of the companies’ shareholders.
Attractive business economics. The team favors cash-producing businesses that it believes are capable of earning acceptable returns on capital over the company’s business cycle.
The Fund will invest in U.S. companies with market capitalizations of at least $2 billion at the time of initial purchase, and may invest up to 25% of its net assets at market value at the time of purchase in non-U.S. securities.
PERFORMANCE HISTORY
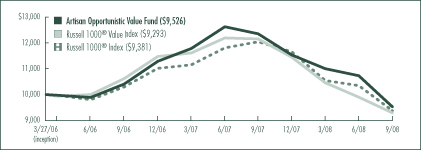
GROWTH OF AN ASSUMED $10,000 INVESTMENT (3/27/2006 to 9/30/2008)
AVERAGE ANNUAL TOTAL RETURNS (as of 9/30/2008)
| | | | | | |
| Fund / Index | | 1-Year | | | Since
Inception | |
Artisan Opportunistic Value Fund | | -22.88 | % | | -1.91 | % |
Russell 1000® Value Index | | -23.56 | | | -2.88 | |
Russell 1000® Index | | -22.10 | | | -2.51 | |
The performance quoted represents past performance, which does not guarantee future results. The investment return and principal value of an investment in the Fund will fluctuate, so that an investor’s shares in the Fund, when redeemed, may be worth more or less than their original cost. Current performance may be lower or higher than the performance data quoted. For current to most recent month-end performance information, visit www.artisanfunds.com or call 800.344.1770. The graph and table above do not reflect the deduction of taxes that a shareholder would pay on distributions or sale of Fund shares. See page 94 for a description of each index.
16
INVESTING ENVIRONMENT
Stocks of all sizes suffered losses during the twelve-month period ended September 30, 2008. It was a challenging period as a slowing economy and continued stress in the capital markets weighed on the minds of investors. The environment got progressively worse in the second half of the fiscal year as the turmoil and volatility driven by the financial crisis reverberated across global markets. The Russell 1000® and Russell 1000® Value indices returned -22.10% and -23.56%, respectively, during the period. Weakness in the market was broad across sectors. Financials, telecommunications, industrials and consumer discretionary stocks were among the weakest performers with declines of more than -24%. In contrast, the traditionally defensive consumer staples and healthcare sectors held up the best in the weak market.
SECTOR DIVERSIFICATION
| | | | | | |
| Sector | | 9/30/2007 | | | 9/30/2008 | |
Consumer Discretionary | | 9.2 | % | | 11.9 | % |
Consumer Staples | | 5.8 | | | 0.8 | |
Energy | | 11.2 | | | 4.7 | |
Financials | | 47.9 | | | 18.0 | |
Healthcare | | 4.3 | | | 2.6 | |
Industrials | | 3.5 | | | 13.8 | |
Information Technology | | 13.9 | | | 44.0 | |
Other assets less liabilities | | 4.2 | | | 4.2 | |
Total | | 100.0 | % | | 100.0 | % |
As a percentage of total net assets.
PERFORMANCE DISCUSSION
Artisan Opportunistic Value Fund is constructed from the bottom up without concern for the characteristics of a benchmark, so the success of our security selection is the primary driver of portfolio returns. For the twelve-month period ended September 30, 2008, the Fund returned -22.88%. Our strongest positive contributors to performance included Apache Corporation, Tenaris S.A., Wal-Mart Stores, Inc., Berkshire Hathaway Inc., Comcast Corporation and Kohl’s Corporation. The Fund’s largest decliners were concentrated in the financials and technology sectors. They included insurance provider American International Group, Inc., banking and financial services provider Wachovia Corporation, commercial and investment banking firm Barclays PLC, mobile phone operator Nokia Corporation, hard disk drive manufacturer Seagate Technology Inc. and electronic components manufacturer Avnet, Inc.
FUND CHANGES
Two of the most notable changes in the portfolio over the past twelve months were in the financials and technology sectors. Our overall weight in the financials sector fell from nearly 48% twelve months ago to approximately 18% as of September 30, 2008. We sold several holdings and trimmed a few others. Our sales in this area included BNP Paribas, Barclays PLC, Wachovia Corp., Bank of America Corporation and American International Group, Inc.
Consistent with our process, we often find opportunities in the downtrodden, unloved areas of the market. From time to time, these opportunities will cluster, and they did so in the technology sector over the past twelve months. We ended the period with a 44% weight in the technology sector, up from approximately 14% twelve months ago. The increase in our exposure was due to a combination of increasing some of our existing positions and adding a few new ones to the mix. The new additions were Corning Incorporated, Texas Instruments Incorporated, Arrow Electronics, Inc., Cisco Systems, Inc., and Hewlett-Packard Company. We also added a few names to the portfolio in the industrials sector, including employment services provider Manpower Inc., commercial aircraft manufacturer The Boeing Company and electronic communications and avionics manufacturer Rockwell Collins, Inc.
17
ARTISAN SMALL CAP FUND (ARTSX)
INVESTMENT PROCESS HIGHLIGHTS
Artisan Small Cap Fund uses a bottom-up investment process to construct a diversified portfolio of U.S. small-cap growth companies.
Competitive advantages. A sustainable competitive advantage is critical to producing above-average growth and profitability. Identifying the source of a company’s competitive advantage lends confidence to the team’s assessment of intrinsic value.
Return on invested capital. The team believes that, over time, a company with improving returns on its invested capital will be rewarded with a higher valuation. The team determines how much capital investment is needed to achieve a company’s continued growth and analyzes management’s ability to use that capital in the most effective way to support that growth.
Intrinsic value. The team estimates a company’s intrinsic value—the value it thinks a buyer would pay to buy the entire company. The team bases its buy and sell targets for a company’s stock on its intrinsic value estimates.
The Fund will not initiate a position in a company unless it has a market capitalization between $300 million and $2.5 billion and meets the team’s standards for earnings growth and sustainable growth prospects.
PERFORMANCE HISTORY
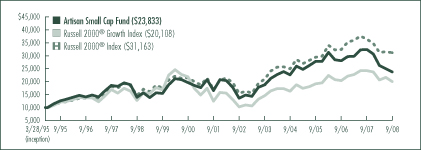
GROWTH OF AN ASSUMED $10,000 INVESTMENT (3/28/1995 to 9/30/2008)
AVERAGE ANNUAL TOTAL RETURNS (as of 9/30/2008)
| | | | | | | | | | | | | | | |
| Fund / Index | | 1-Year | | | 3-Year | | | 5-Year | | | 10-Year | | | Since
Inception | |
Artisan Small Cap Fund | | -26.64 | % | | -5.05 | % | | 4.85 | % | | 5.48 | % | | 6.64 | % |
Russell 2000® Growth Index | | -17.07 | | | 1.45 | | | 6.64 | | | 4.67 | | | 5.31 | |
Russell 2000® Index | | -14.48 | | | 1.83 | | | 8.15 | | | 7.81 | | | 8.78 | |
The performance quoted represents past performance, which does not guarantee future results. The investment return and principal value of an investment in the Fund will fluctuate, so that an investor’s shares in the Fund, when redeemed, may be worth more or less than their original cost. Current performance may be lower or higher than the performance data quoted. For current to most recent month-end performance information, visit www.artisanfunds.com or call 800.344.1770. The graph and table above do not reflect the deduction of taxes that a shareholder would pay on distributions or sale of Fund shares. See page 94 for a description of each index.
18
INVESTING ENVIRONMENT
During the fiscal year ended September 30, 2008, small-cap stocks, as measured by the Russell 2000® Index, lost -14.48%. A weak economic backdrop, volatile energy prices and difficult conditions in the credit markets contributed to investor anxiety. The Russell 2000® Growth Index declined -17.07%. Within the Index, energy was the only sector to post a gain as the price of oil achieved record highs with a peak of $147 per barrel, before retreating late in the period. Utilities and consumer staples stocks held up relatively well. The benchmark’s principal sources of weakness were the telecommunication services, consumer discretionary, information technology and materials sectors, as each fell more than 20%.
SECTOR DIVERSIFICATION
| | | | | | |
| Sector | | 9/30/2007 | | | 9/30/2008 | |
Consumer Discretionary | | 16.1 | % | | 10.6 | % |
Consumer Staples | | 2.1 | | | 2.7 | |
Energy | | 5.3 | | | 7.1 | |
Financials | | 10.0 | | | 5.4 | |
Healthcare | | 17.4 | | | 18.0 | |
Industrials | | 19.7 | | | 25.8 | |
Information Technology | | 23.0 | | | 23.6 | |
Materials | | — | | | 0.6 | |
Telecommunication Services | | 0.7 | | | 0.7 | |
Utilities | | 1.6 | | | 1.2 | |
Other assets less liabilities | | 4.1 | | | 4.3 | |
Total | | 100.0 | % | | 100.0 | % |
As a percentage of total net assets.
PERFORMANCE DISCUSSION
The Fund returned -26.64% this period, underperforming the Russell 2000® and Russell 2000® Growth indices. Our overall return was hindered primarily by the negative returns of select holdings in the industrials and information technology sectors. Our list of underperformers in the industrials sector included low-fare airliner AirTran Holdings, Inc., aviation products and service provider AAR CORP., metal parts manufacturer Ladish Co. Inc., and The GEO Group, Inc., a correctional facilities operator. In the information technology sector, performance was held back by enterprise wireless systems provider Aruba Networks, Inc., GPS technology supplier SiRF Technology Holdings, Inc., and Global Cash Access Holdings, Inc., a provider of cash access products to the gaming industry.
This period’s top performers came from various sectors. W-H Energy Services, Inc. and LifeCell Corporation were beneficiaries of premium takeout offers. Other winners included contract research organization ICON PLC, trucking company Old Dominion Freight Line, Inc., boutique investment bank Greenhill & Co., Inc., and employee spend management software company Concur Technologies, Inc.
FUND CHANGES
The high volatility of the period created many new purchase opportunities. We invested in a number of positions that met our security selection criteria. Our largest purchases were Omniture, Inc., an online business analytics company, Psychiatric Solutions, Inc., a behavioral healthcare services provider, Healthcare Services Group Inc., which provides housekeeping, laundry, linen and food services to the healthcare industry, and Aegean Marine Petroleum Network Inc., a ship refueling services company.
We funded our purchases in part with the sale of previously mentioned SiRF Technology Holdings, Inc. The Advisory Board Company, National Financial Partners Corp., Bright Horizons Family Solutions, Inc., optionsXpress Holdings, Inc. and ACI Worldwide, Inc. were also sold during the period.
19
ARTISAN SMALL CAP VALUE FUND (ARTVX)
INVESTMENT PROCESS HIGHLIGHTS
Artisan Small Cap Value Fund uses a bottom-up investment process to construct a diversified portfolio of small-cap U.S. companies that the team believes are undervalued, in solid financial condition and have attractive business economics. The team believes companies with these characteristics are less likely to experience eroding values over the long term.
Attractive valuation. The team values a business using what it believes are reasonable expectations for the long-term earnings power and capitalization rates of that business. This results in a range of values for the company that the team believes would be reasonable. The team generally will purchase a security if the stock price falls below or toward the lower end of that range.
Sound financial condition. The team favors companies with an acceptable level of debt and positive cash flow. At a minimum, the team tries to avoid companies that have so much debt that management may be unable to make decisions that would be in the best interest of the companies’ shareholders.
Attractive business economics. The team favors cash-producing businesses that it believes are capable of earning acceptable returns on capital over the company’s business cycle.
The Fund will not initiate a position in a company unless it has a market capitalization below $2 billion.
PERFORMANCE HISTORY
GROWTH OF AN ASSUMED $10,000 INVESTMENT (9/29/1997 to 9/30/2008)
AVERAGE ANNUAL TOTAL RETURNS (as of 9/30/2008)
| | | | | | | | | | | | | | | |
| Fund / Index | | 1-Year | | | 3-Year | | | 5-Year | | | 10-Year | | | Since
Inception | |
Artisan Small Cap Value Fund | | -5.77 | % | | 4.10 | % | | 12.55 | % | | 13.32 | % | | 11.06 | % |
Russell 2000® Value Index | | -12.25 | | | 2.00 | | | 9.45 | | | 10.14 | | | 7.87 | |
Russell 2000® Index | | -14.48 | | | 1.83 | | | 8.15 | | | 7.81 | | | 5.09 | |
The performance quoted represents past performance, which does not guarantee future results. The investment return and principal value of an investment in the Fund will fluctuate, so that an investor’s shares in the Fund, when redeemed, may be worth more or less than their original cost. Current performance may be lower or higher than the performance data quoted. For current to most recent month-end performance information, visit www.artisanfunds.com or call 800.344.1770. The graph and table above do not reflect the deduction of taxes that a shareholder would pay on distributions or sale of Fund shares. See page 94 for a description of each index.
20
INVESTING ENVIRONMENT
For the twelve-month period ended September 30, 2008, the Russell 2000® Value and Russell 2000® indices returned -12.25% and
-14.48%, respectively. The first six months of the fiscal year were challenging as investors grappled with a slowing economy and continued stress in the capital markets, but the second half of the period got progressively worse as few areas of the market were able to avoid the turmoil and volatility driven by the financial crisis. In the Russell 2000® Value Index, most sectors declined over the fiscal year. The technology, consumer discretionary and telecommunications sectors were the worst performing sectors, with declines of more than -23%. The energy sector posted a small gain as stocks in this sector were buoyed in the first half of the fiscal year by rising commodity prices. The utilities sector also held up relatively well during the period.
SECTOR DIVERSIFICATION
| | | | | | |
| Sector | | 9/30/2007 | | | 9/30/2008 | |
Consumer Discretionary | | 15.2 | % | | 13.1 | % |
Consumer Staples | | 1.5 | | | 3.1 | |
Energy | | 17.4 | | | 6.3 | |
Financials | | 11.0 | | | 11.8 | |
Healthcare | | 7.7 | | | 5.6 | |
Industrials | | 11.2 | | | 20.3 | |
Information Technology | | 24.7 | | | 28.1 | |
Materials | | 3.0 | | | 2.3 | |
Telecommunication Services | | 0.4 | | | — | |
Utilities | | 5.1 | | | 3.2 | |
Other assets less liabilities | | 2.8 | | | 6.2 | |
Total | | 100.0 | % | | 100.0 | % |
As a percentage of total net assets.
PERFORMANCE DISCUSSION
The Fund returned -5.77% for the twelve-month period ended September 30, 2008. Strong stock selection was the primary reason for our outperformance relative to the Russell 2000® Value Index. The Fund mainly benefited from its holdings in the energy and industrials sectors, and also from a few select consumer discretionary stocks. Our leading gainers during the fiscal year included Cimarex Energy Co., Comstock Resources, Inc. and Mariner Energy, Inc., The Genlyte Group Incorporated, EMCOR Group, Inc. and Rent-A-Center, Inc. The largest negative impact to the portfolio over the period was the technology sector, where our outsized position in the semiconductor and semiconductor-equipment industry hurt relative performance. Several of our holdings in this industry suffered declines during the fiscal year, including Ultra Clean Holdings, Inc., Entegris, Inc., ATMI, Inc., Rudolph Technologies, Inc. and Standard Microsystems Corporation. We also experienced weakness in Orbotech, Ltd.
FUND CHANGES
One of the biggest changes to the portfolio over the past twelve months was a decrease in our weight in the energy sector due in large part to our exit from our exploration and production companies in the latter half of the period. Cimarex Energy Co., Mariner Energy, Co., Comstock Resources, Inc., Rosetta Resources Inc., and St. Mary Land & Exploration Company were sold when their share prices began to reflect earnings from commodity prices that we believed were unsustainable.
One positive outcome of the weak environment is the emergence of new investment opportunities. Some of our more recent purchases included program management and consulting services provider MAXIMUS, Inc., publishing and broadcasting firm Meredith Corporation, specialty chemical manufacturer H.B. Fuller Company, civil construction and transportation contractor Granite Construction Incorporated and motorsports track operator International Speedway Corporation. We reestablished positions in a few former holdings, including Universal Corporation, Sensient Technologies Corporation and Regal-Beloit Corporation. We were attracted to our new positions based on the key characteristics of our investment process: attractive valuation, sound financial condition and attractive business economics.
21
ARTISAN GLOBAL VALUE FUND
Schedule of Investments – September 30, 2008
| | | | | |
| | | Shares
Held | | Value |
| | | | | |
COMMON AND
PREFERRED STOCKS - 96.0% | | | | | |
| | | | | |
| FINLAND - 1.6% | | | | | |
Nokia Corporation (DR) | | 8,366 | | $ | 156,026 |
| | | | | |
| FRANCE - 3.6% | | | | | |
Neopost SA(1) | | 1,111 | | | 104,596 |
Sanofi-Aventis(1) | | 1,378 | | | 90,578 |
Societe Television Francaise 1(1) | | 5,218 | | | 92,324 |
Sodexo(1) | | 963 | | | 57,064 |
| | | | | |
| | | | | 344,562 |
| HONG KONG - 2.0% | | | | | |
Guoco Group Limited(1) | | 21,850 | | | 186,719 |
| | | | | |
| JAPAN - 5.2% | | | | | |
Credit Saison Co., Ltd.(1) | | 11,400 | | | 185,456 |
SANKYO CO., LTD.(1) | | 2,148 | | | 109,552 |
Sekisui House, Ltd.(1) | | 22,450 | | | 206,130 |
| | | | | |
| | | | | 501,138 |
| KOREA - 1.9% | | | | | |
SK Telecom Co., Ltd. (DR) | | 9,435 | | | 177,567 |
| | | | | |
| MEXICO - 1.1% | | | | | |
Grupo Modelo, S.A. de C.V., Series C | | 25,912 | | | 110,173 |
| | | | | |
| NETHERLANDS - 3.7% | | | | | |
Wolters Kluwer NV(1) | | 17,296 | | | 352,562 |
| | | | | |
| SWITZERLAND - 12.2% | | | | | |
Adecco SA(1) | | 5,390 | | | 235,513 |
Novartis AG(1) | | 10,707 | | | 560,034 |
Panalpina Welttransport Holding AG(1) | | 1,743 | | | 115,344 |
Pargesa Holding SA(1) | | 3,007 | | | 256,516 |
| | | | | |
| | | | | 1,167,407 |
| UNITED KINGDOM - 17.4% | | | | | |
Cadbury PLC(1) | | 8,198 | | | 82,551 |
Cadbury PLC (DR) | | 1,054 | | | 43,151 |
Diageo plc(1) | | 14,433 | | | 244,322 |
Experian PLC(1) | | 58,339 | | | 386,837 |
Home Retail Group plc(1) | | 60,070 | | | 255,672 |
Signet Jewelers Ltd. | | 15,204 | | | 355,450 |
Unilever plc (DR) | | 11,033 | | | 300,208 |
| | | | | |
| | | | | 1,668,191 |
| UNITED STATES - 47.3% | | | | | |
American Express Company | | 9,042 | | | 320,358 |
| | | | | | |
| | | Shares
Held | | Value |
| | | | | | |
| UNITED STATES (CONTINUED) | | | | | | |
Arch Capital Group Ltd., Series A Preferred, 8.00% | | | 1,452 | | $ | 29,476 |
Arch Capital Group Ltd. Series B Preferred, 7.875% | | | 5,492 | | | 101,327 |
The Bank of New York Mellon Corporation | | | 7,665 | | | 249,726 |
Cintas Corporation | | | 10,917 | | | 313,427 |
Dell Inc.(2) | | | 13,033 | | | 214,784 |
International Speedway Corporation, Class A | | | 7,580 | | | 294,938 |
Johnson & Johnson | | | 6,691 | | | 463,552 |
Marsh & McLennan Companies, Inc. | | | 16,648 | | | 528,740 |
Mattel, Inc. | | | 11,029 | | | 198,963 |
Microsoft Corporation | | | 16,104 | | | 429,816 |
Mohawk Industries, Inc.(2) | | | 6,490 | | | 437,361 |
The Sherwin-Williams Company | | | 3,398 | | | 194,230 |
Tyco Electronics Ltd. | | | 5,632 | | | 155,781 |
Wal-Mart Stores, Inc. | | | 3,538 | | | 211,891 |
WellPoint Inc.(2) | | | 8,056 | | | 376,779 |
| | | | | | |
| | | | | | 4,521,149 |
| | | | | | |
Total common and preferred stocks
(Cost $10,445,004) | | | | | | 9,185,494 |
| | | Par
Amount | | |
| SHORT-TERM INVESTMENTS (CASH EQUIVALENTS) - 2.7% | | | | | | |
Repurchase agreement with Fixed Income Clearing Corporation,
0.05%, dated 9/30/08, due
10/1/08, maturity value $252,000(3)
(Cost $252,000) | | $ | 252,000 | | | 252,000 |
| | | | | | |
| | | | | | |
Total investments - 98.7%
(Cost $10,697,004) | | | | | | 9,437,494 |
| | | | | | |
Other assets less liabilities - 1.3% | | | | | | 128,002 |
| | | | | | |
| | | | | | |
Total net assets - 100.0%(4) | | | | | $ | 9,565,496 |
| | | | | | |
(1) | Valued at a fair value in accordance with procedures established by the board of directors of Artisan Funds. In total, securities valued at a fair value were $3,521,770 or 36.8% of total net assets. |
(2) | Non-income producing security. |
| | | | | | | | |
Issuer | | Rate | | | Maturity | | Value |
U.S. Treasury Bond | | 4.50 | % | | 2/15/2036 | | $ | 259,700 |
(4) | Percentages for the various classifications relate to total net assets. |
Company names are as reported by a data service provider and in some cases are translations; a company’s legal name may be different.
(DR) Depository Receipt, voting rights may vary.
22
| | | | | | |
| PORTFOLIO DIVERSIFICATION - September 30, 2008 | |
| | | Value | | Percentage
of Total
Net Assets | |
Consumer Discretionary | | $ | 2,554,246 | | 26.7 | % |
Consumer Staples | | | 992,296 | | 10.4 | |
Financials | | | 1,858,318 | | 19.4 | |
Healthcare | | | 1,490,943 | | 15.6 | |
Industrials | | | 1,051,121 | | 11.0 | |
Information Technology | | | 1,061,003 | | 11.1 | |
Telecommunication Services | | | 177,567 | | 1.8 | |
| | | | | | |
Total common and preferred stocks | | | 9,185,494 | | 96.0 | |
Short-term investments | | | 252,000 | | 2.7 | |
| | | | | | |
Total investments | | | 9,437,494 | | 98.7 | |
Other assets less liabilities | | | 128,002 | | 1.3 | |
| | | | | | |
Total net assets | | $ | 9,565,496 | | 100.0 | % |
| | | | | | |
| | | | | | |
| CURRENCY EXPOSURE - September 30, 2008 | |
| | | Value | | Percentage
of Total
Investments | |
British pound | | $ | 1,324,832 | | 14.0 | % |
Euro | | | 697,124 | | 7.4 | |
Hong Kong dollar | | | 186,719 | | 2.0 | |
Japanese yen | | | 501,138 | | 5.3 | |
Mexican peso | | | 110,173 | | 1.2 | |
Swiss franc | | | 1,167,407 | | 12.4 | |
US dollar | | | 5,450,101 | | 57.7 | |
| | | | | | |
Total investments | | $ | 9,437,494 | | 100.0 | % |
| | | | | | |
| | | | | |
| TOP TEN HOLDINGS - September 30, 2008 | |
Company Name | | Country | | Percentage
of Total
Net Assets | |
Novartis AG | | Switzerland | | 5.9 | % |
Marsh & McLennan Companies, Inc. | | United States | | 5.5 | |
Johnson & Johnson | | United States | | 4.8 | |
Mohawk Industries, Inc. | | United States | | 4.6 | |
Microsoft Corporation | | United States | | 4.5 | |
Experian PLC | | United Kingdom | | 4.0 | |
WellPoint Inc. | | United States | | 3.9 | |
Signet Jewelers Ltd. | | United Kingdom | | 3.7 | |
Wolters Kluwer NV | | Netherlands | | 3.7 | |
American Express Company | | United States | | 3.3 | |
| | | | | |
Total | | | | 43.9 | % |
| | | | | |
For the purpose of determining the Fund’s top ten holdings, securities of the same issuer are aggregated to determine the weight in the Fund.
23
ARTISAN INTERNATIONAL FUND
Schedule of Investments – September 30, 2008
| | | | | |
| | | Shares
Held | | Value |
| | | | | |
COMMON AND PREFERRED
STOCKS - 94.2% | | | | | |
| | | | | |
| BELGIUM - 0.5% | | | | | |
Delhaize Group(1) | | 791,898 | | $ | 46,147,043 |
Umicore(1) | | 514,070 | | | 15,958,763 |
| | | | | |
| | | | | 62,105,806 |
| BRAZIL - 2.4% | | | | | |
Petroleo Brasileiro S.A., Preferred (DR) | | 3,618,266 | | | 135,395,514 |
Redecard SA | | 6,536,789 | | | 85,467,082 |
Vivo Participacoes S.A., Preferred (DR)(2) | | 13,449,768 | | | 55,682,039 |
| | | | | |
| | | | | 276,544,635 |
| CANADA - 2.2% | | | | | |
Canadian Pacific Railway Limited | | 4,755,184 | | | 256,114,210 |
| | | | | |
| CHINA - 5.6% | | | | | |
Angang Steel Company Limited, H Shares(1) | | 32,269,187 | | | 29,519,853 |
China Construction Bank, H Shares(1) | | 227,217,200 | | | 150,814,211 |
China Life Insurance Co., Limited, H Shares(1) | | 37,784,900 | | | 139,893,346 |
China Merchants Holdings International Company Limited(1) | | 21,392,900 | | | 68,801,066 |
China Petroleum and Chemical Corporation, H Shares(1) | | 144,146,900 | | | 114,415,884 |
China Resources Land Limited(1) | | 109,479,100 | | | 114,941,811 |
Shanghai Electric Group Company Limited, Series H(1)(2)(3) | | 150,931,921 | | | 45,393,696 |
| | | | | |
| | | | | 663,779,867 |
| FINLAND - 3.2% | | | | | |
Fortum Oyj(1) | | 11,122,431 | | | 375,268,008 |
| | | | | |
| FRANCE - 12.1% | | | | | |
Alstom, S.A.(1) | | 2,588,153 | | | 195,172,350 |
Bouygues SA(1) | | 3,998,062 | | | 182,316,700 |
Electricite de France(1) | | 4,455,105 | | | 322,811,220 |
LVMH Moet Hennessy Louis Vuitton SA(1) | | 2,630,185 | | | 232,237,725 |
Technip SA(1) | | 2,854,266 | | | 160,342,506 |
Vinci SA(1) | | 7,197,215 | | | 340,043,899 |
| | | | | |
| | | | | 1,432,924,400 |
| GERMANY - 12.8% | | | | | |
Allianz SE(1) | | 1,010,749 | | | 139,010,853 |
| | | | | |
| | | Shares
Held | | Value |
| | | | | |
| GERMANY (CONTINUED) | | | | | |
Bayer AG(1) | | 5,545,201 | | $ | 404,760,289 |
Daimler AG(1) | | 5,047,009 | | | 255,075,671 |
Fraport AG(1) | | 2,232,563 | | | 133,523,930 |
Linde AG(1) | | 2,550,125 | | | 273,477,747 |
Merck KGaA(1) | | 225,768 | | | 24,237,311 |
Wacker Chemie AG(1) | | 1,994,739 | | | 285,269,306 |
| | | | | |
| | | | | 1,515,355,107 |
| HONG KONG - 3.7% | | | | | |
The Bank of East Asia, Ltd.(1) | | 27,342,500 | | | 85,285,655 |
Hutchison Whampoa Limited(1) | | 26,073,245 | | | 198,487,558 |
NWS Holdings Limited(1) | | 40,157,746 | | | 71,988,363 |
Sun Hung Kai Properties Limited(1) | | 7,853,234 | | | 80,636,241 |
| | | | | |
| | | | | 436,397,817 |
| INDIA - 1.0% | | | | | |
Housing Development Finance Corporation Ltd.(1) | | 1,248,822 | | | 57,322,751 |
ICICI Bank Limited(1) | | 1,084,277 | | | 12,854,108 |
ICICI Bank Limited (DR) | | 1,853,652 | | | 43,597,895 |
| | | | | |
| | | | | 113,774,754 |
| IRELAND - 0.5% | | | | | |
Elan Corporation plc (DR)(2) | | 5,405,458 | | | 57,676,237 |
| | | | | |
| ITALY - 2.2% | | | | | |
Fiat S.p.A.(1) | | 7,433,997 | | | 99,049,998 |
Intesa Sanpaolo(1) | | 28,661,783 | | | 156,457,590 |
| | | | | |
| | | | | 255,507,588 |
| JAPAN - 11.3% | | | | | |
Credit Saison Co., Ltd.(1) | | 1,897,823 | | | 30,873,858 |
DENSO CORPORATION(1) | | 5,451,200 | | | 133,880,758 |
JAPAN TOBACCO INC.(1) | | 74,252 | | | 279,547,473 |
Jupiter Telecommunications Co., Ltd.(1) | | 79,412 | | | 57,215,870 |
Mitsubishi Estate Company Ltd.(1) | | 3,797,600 | | | 74,629,286 |
Mitsubishi UFJ Financial Group, Inc.(1) | | 21,009,100 | | | 182,120,253 |
Mitsui & Co., Ltd.(1) | | 12,373,103 | | | 152,890,420 |
Mitsui Fudosan Co., Ltd.(1) | | 4,603,601 | | | 88,627,267 |
Mizuho Financial Group, Inc.(1) | | 39,155 | | | 171,786,740 |
SUZUKI MOTOR CORPORATION(1) | | 8,736,450 | | | 162,231,166 |
| | | | | |
| | | | | 1,333,803,091 |
| KOREA - 1.2% | | | | | |
NHN Corp.(1)(2) | | 1,104,272 | | | 142,374,509 |
| | | | | |
| LUXEMBOURG - 0.4% | | | | | |
RTL Group(1) | | 736,222 | | | 45,718,732 |
24
| | | | | |
| | | Shares
Held | | Value |
| | | | | |
| MEXICO - 0.5% | | | | | |
Grupo Modelo, S.A. de C.V., Series C | | 14,714,102 | | $ | 62,561,674 |
| | | | | |
| NETHERLANDS - 2.6% | | | | | |
ASML Holding N.V.(1) | | 16,950,048 | | | 302,650,828 |
| | | | | |
| NORWAY - 3.6% | | | | | |
Acergy SA(1) | | 1,096,914 | | | 11,020,914 |
Orkla ASA(1) | | 16,442,189 | | | 151,115,876 |
SeaDrill Ltd.(1) | | 12,588,799 | | | 258,741,622 |
| | | | | |
| | | | | 420,878,412 |
| QATAR - 0.5% | | | | | |
Industries Qatar | | 1,406,183 | | | 55,103,545 |
Industries Qatar, Equity Linked Security, 144A(1)(4)(5) | | 222,077 | | | 8,703,198 |
| | | | | |
| | | | | 63,806,743 |
| RUSSIA - 4.1% | | | | | |
Gazprom (DR)(1) | | 8,479,286 | | | 272,487,477 |
LUKOIL (DR)(1) | | 1,972,700 | | | 118,760,422 |
Novorossiysk Sea Trade Port (DR)(1) | | 87,150 | | | 558,208 |
RAO Unified Energy System, Equity Linked Security, 144A(1)(4)(5)(6) | | 2,065,483 | | | 96,148,234 |
| | | | | |
| | | | | 487,954,341 |
| SOUTH AFRICA - 0.5% | | | | | |
Naspers Limited(1) | | 2,962,546 | | | 58,588,590 |
| | | | | |
| SPAIN - 5.2% | | | | | |
Gamesa Corporacion Tecnologica, S.A.(1) | | 3,164,078 | | | 108,692,129 |
Iberdrola S.A.(1) | | 5,401,279 | | | 55,208,666 |
Industria de Diseno Textil, S.A.(1) | | 3,126,622 | | | 133,379,738 |
Telefonica S.A.(1) | | 13,178,652 | | | 315,040,800 |
| | | | | |
| | | | | 612,321,333 |
| SWEDEN - 0.3% | | | | | |
SSAB Svenskt Stal AB, Series A(1) | | 2,038,041 | | | 32,498,695 |
| | | | | |
| SWITZERLAND - 9.8% | | | | | |
Adecco SA(1) | | 2,042,657 | | | 89,252,942 |
Holcim Ltd.(1) | | 3,157,782 | | | 231,057,336 |
Nestle SA(1) | | 9,137,346 | | | 395,209,047 |
Roche Holding AG(1) | | 404,147 | | | 63,102,472 |
Roche Holding AG - Genussscheine(1)(4) | | 2,448,230 | | | 381,647,046 |
| | | | | |
| | | | | 1,160,268,843 |
| TAIWAN - 0.2% | | | | | |
Taiwan Semiconductor Manufacturing Company Ltd. (DR)(4) | | 2,988,809 | | | 28,005,140 |
| | | | | | |
| | | Shares
Held | | Value |
| | | | | | |
| UNITED KINGDOM - 7.8% | | | | | | |
Cadbury PLC(1) | | | 13,609,068 | | $ | 137,039,362 |
Kingfisher PLC(1) | | | 31,418,061 | | | 74,498,145 |
Lloyds TSB Group plc(1) | | | 36,473,033 | | | 151,719,497 |
National Grid PLC(1) | | | 20,137,580 | | | 255,844,292 |
Next Plc(1) | | | 3,778,934 | | | 69,297,008 |
Tesco plc(1) | | | 7,889,507 | | | 54,867,222 |
William Morrison Supermarkets PLC(1) | | | 39,227,825 | | | 182,089,550 |
| | | | | | |
| | | | | | 925,355,076 |
| | | | | | |
Total common and preferred stocks
(Cost $12,403,463,800) | | | 11,122,234,436 |
| | | Par
Amount | | |
| SHORT-TERM INVESTMENTS (CASH EQUIVALENTS) - 5.2% | | | | | | |
Repurchase agreement with Fixed
Income Clearing Corporation,
0.05%, dated 9/30/08, due
10/1/08, maturity value
$609,594,847(7)
(Cost $609,594,000) | | $ | 609,594,000 | | | 609,594,000 |
| | | | | | |
| | | | | | |
Total investments - 99.4%
(Cost $13,013,057,800) | | | | | | 11,731,828,436 |
| | | | | | |
Other assets less liabilities - 0.6% | | | 71,901,944 |
| | | | | | |
| | | | | | |
Total net assets - 100.0%(8) | | | | | $ | 11,803,730,380 |
| | | | | | |
(1) | Valued at a fair value in accordance with procedures established by the board of directors of Artisan Funds. In total, securities valued at a fair value were $10,342,631,100 or 87.6% of total net assets. |
(2) | Non-income producing security. |
(3) | Affiliated company as defined by the Investment Company Act of 1940. See Note (6) in Notes to Financial Statements. |
(5) | Security is an equity-linked participation certificate issued by Merrill Lynch. As described in Note 2(h) in Notes to Financial Statements, equity-linked participation certificates are subject to counterparty risk with respect to the bank or broker-dealer that issues them. |
(6) | Security has been determined to be illiquid under procedures established by the board of directors. |
| | | | | | | | |
Issuer | | Rate | | | Maturity | | Value |
U.S. Treasury Bill | | | | | 7/30/2009 | | $ | 310,790,938 |
U.S. Treasury Bond | | 2.675 | % | | 5/31/2010 | | | 168,804,525 |
U.S. Treasury Bond | | 2.125 | | | 1/31/2010 | | | 141,985,800 |
U.S. Treasury Bond | | 4.750 | | | 2/28/2009 | | | 213,675 |
| | | | | | | | |
| | | | | | | | 621,794,938 |
| | | | | | | | |
(8) | Percentages for the various classifications relate to total net assets. |
| | Company names are as reported by a data service provider and in some cases are translations; a company’s legal name may be different. |
(DR) Depository Receipt, voting rights may vary.
25
| | | | | | |
| PORTFOLIO DIVERSIFICATION - September 30, 2008 | |
| | | Value | | Percentage
of Total
Net Assets | |
Consumer Discretionary | | $ | 1,321,173,401 | | 11.2 | % |
Consumer Staples | | | 1,157,461,371 | | 9.8 | |
Energy | | | 1,071,164,339 | | 9.1 | |
Financials | | | 1,680,571,362 | | 14.2 | |
Healthcare | | | 931,423,355 | | 7.9 | |
Industrials | | | 2,058,158,090 | | 17.4 | |
Information Technology | | | 558,497,559 | | 4.7 | |
Materials | | | 867,781,700 | | 7.4 | |
Telecommunication Services | | | 370,722,839 | | 3.1 | |
Utilities | | | 1,105,280,420 | | 9.4 | |
| | | | | | |
Total common and preferred stocks | | | 11,122,234,436 | | 94.2 | |
Short-term investments | | | 609,594,000 | | 5.2 | |
| | | | | | |
Total investments | | | 11,731,828,436 | | 99.4 | |
Other assets less liabilities | | | 71,901,944 | | 0.6 | |
| | | | | | |
Total net assets | | $ | 11,803,730,380 | | 100.0 | % |
| | | | | | |
| | | | | | |
| CURRENCY EXPOSURE - September 30, 2008 | |
| | | Value | | Percentage
of Total
Investments | |
Brazilian real | | $ | 85,467,082 | | 0.7 | % |
British pound | | | 925,355,076 | | 7.9 | |
Euro | | | 4,601,851,802 | | 39.2 | |
Hong Kong dollar | | | 1,100,177,684 | | 9.4 | |
Indian rupee | | | 70,176,859 | | 0.6 | |
Japanese yen | | | 1,333,803,091 | | 11.4 | |
Korean won | | | 142,374,509 | | 1.2 | |
Mexican peso | | | 62,561,674 | | 0.5 | |
Norwegian krone | | | 420,878,412 | | 3.6 | |
Qatari riyal | | | 55,103,545 | | 0.5 | |
South African rand | | | 58,588,590 | | 0.5 | |
Swedish krona | | | 32,498,695 | | 0.3 | |
Swiss franc | | | 1,160,268,843 | | 9.9 | |
US dollar | | | 1,682,722,574 | | 14.3 | |
| | | | | | |
Total investments | | $ | 11,731,828,436 | | 100.0 | % |
| | | | | | |
| | | | | |
| TOP TEN HOLDINGS - September 30, 2008 | |
Company Name | | Country | | Percentage
of Total
Net Assets | |
Roche Holding AG | | Switzerland | | 3.8 | % |
Bayer AG | | Germany | | 3.4 | |
Nestle SA | | Switzerland | | 3.3 | |
Fortum Oyj | | Finland | | 3.2 | |
Vinci SA | | France | | 2.9 | |
Electricite de France | | France | | 2.7 | |
Telefonica S.A. | | Spain | | 2.7 | |
ASML Holding N.V. | | Netherlands | | 2.6 | |
Wacker Chemie AG | | Germany | | 2.4 | |
JAPAN TOBACCO INC. | | Japan | | 2.4 | |
| | | | | |
Total | | | | 29.4 | % |
| | | | | |
For the purpose of determining the Fund’s top ten holdings, securities of the same issuer are aggregated to determine the weight in the Fund.
The accompanying notes are an integral part of the financial statements.
26
ARTISAN INTERNATIONAL SMALL CAP FUND
Schedule of Investments – September 30, 2008
| | | | | |
| | | Shares
Held | | Value |
| | | | | |
| COMMON STOCKS - 88.2% | | | | | |
| | | | | |
| AUSTRIA - 2.0% | | | | | |
Flughafen Wien AG(1) | | 185,895 | | $ | 11,718,591 |
Wienerberger AG(1) | | 120,409 | | | 3,272,875 |
| | | | | |
| | | | | 14,991,466 |
| CANADA - 1.1% | | | | | |
Great Canadian Gaming Corporation(2) | | 1,335,664 | | | 7,969,431 |
| | | | | |
| CHINA - 5.7% | | | | | |
China Everbright International Limited(1) | | 26,438,700 | | | 4,388,919 |
China Everbright Limited(1) | | 5,308,600 | | | 8,316,950 |
China National Building Material Company Ltd., H Shares(1) | | 5,510,000 | | | 6,384,287 |
Hengan International Group Company Limited(1) | | 4,934,900 | | | 14,085,924 |
New World Department Store China(1)(2) | | 1,128,000 | | | 618,698 |
Tian An China Investments Company Limited(1) | | 20,932,480 | | | 7,790,910 |
Tian An China Investments Company Limited Warrants(1)(2)(3)(5) | | 1,877,080 | | | 2,921 |
| | | | | |
| | | | | 41,588,609 |
| DENMARK - 0.6% | | | | | |
TK Development A/S(1)(2) | | 791,313 | | | 4,268,078 |
| | | | | |
| EGYPT - 4.7% | | | | | |
Commercial International Bank (DR)(1) | | 3,106,995 | | | 20,051,579 |
Eastern Tobacco(1) | | 295,593 | | | 14,675,724 |
| | | | | |
| | | | | 34,727,303 |
| FRANCE - 1.5% | | | | | |
Guyenne et Gascogne SA(1) | | 119,377 | | | 10,652,940 |
| | | | | |
| GERMANY - 16.1% | | | | | |
Aixtron AG(1) | | 1,040,772 | | | 6,112,174 |
C.A.T. oil AG(1)(2) | | 304,049 | | | 1,423,769 |
KWS Saat AG(1) | | 173,828 | | | 22,960,477 |
Praktiker Bau- und Heimwerkermaerkte Holding AG(1) | | 1,673,818 | | | 15,545,610 |
Vossloh AG(1) | | 296,606 | | | 30,524,471 |
Wacker Construction Equipment AG(1) | | 697,819 | | | 6,646,313 |
Wirecard AG(1)(2) | | 4,821,666 | | | 34,973,308 |
| | | | | |
| | | | | 118,186,122 |
| GREECE - 1.2% | | | | | |
Hellenic Exchanges S.A.(1) | | 755,108 | | | 8,838,645 |
| | | | | |
| | | Shares
Held | | Value |
| | | | | |
| HONG KONG - 8.6% | | | | | |
Cafe De Coral Holdings Limited(1) | | 4,358,000 | | $ | 7,603,590 |
Hong Kong Exchanges & Clearing Limited(1) | | 1,031,800 | | | 12,822,065 |
I.T. Ltd.(1) | | 37,840,000 | | | 4,634,722 |
Industrial and Commercial Bank of China (Asia) Limited(1) | | 13,523,000 | | | 24,540,517 |
Industrial and Commercial Bank of China (Asia) Limited Warrants(1)(2)(3) | | 591,222 | | | 1,542 |
Kowloon Development Company Limited(1) | | 7,965,900 | | | 7,153,131 |
Sun Hung Kai & Co. Limited(1) | | 8,497,000 | | | 3,904,674 |
Town Health International Holdings Company Limited(1)(2) | | 443,900,000 | | | 2,253,272 |
| | | | | |
| | | | | 62,913,513 |
| ITALY - 11.9% | | | | | |
Ansaldo STS SpA(1) | | 2,540,450 | | | 36,108,114 |
Davide Campari-Milano S.p.A.(1) | | 1,950,637 | | | 15,922,659 |
Socotherm S.p.A.(1)(2) | | 1,144,547 | | | 4,506,018 |
Spazio Investment NV(1)(4) | | 1,600,055 | | | 19,013,051 |
Tod’s S.p.A.(1) | | 231,935 | | | 11,591,154 |
| | | | | |
| | | | | 87,140,996 |
| JAPAN - 0.8% | | | | | |
USJ Co., Ltd.(1) | | 10,377 | | | 5,807,263 |
| | | | | |
| KOREA - 5.2% | | | | | |
Gmarket Inc. (DR)(2) | | 1,359,019 | | | 31,583,602 |
Kangwon Land Inc.(1) | | 534,356 | | | 6,471,868 |
| | | | | |
| | | | | 38,055,470 |
| MALAYSIA - 1.1% | | | | | |
Bursa Malaysia Bhd(1) | | 4,104,800 | | | 7,678,575 |
| | | | | |
| MEXICO - 1.8% | | | | | |
Empresas ICA S.A.B. de C.V.(2) | | 4,427,350 | | | 12,873,381 |
| | | | | |
| NETHERLANDS - 2.2% | | | | | |
Advanced Metallurgical Group NV(1)(2) | | 230,723 | | | 9,483,990 |
SBM Offshore NV(1) | | 319,898 | | | 6,888,122 |
| | | | | |
| | | | | 16,372,112 |
| NORWAY - 2.5% | | | | | |
SeaDrill Ltd.(1) | | 906,530 | | | 18,632,202 |
| | | | | |
| OMAN - 1.2% | | | | | |
Bank Muscat SAOG (DR)(1) | | 455,985 | | | 5,471,820 |
Bank Muscat SAOG, Reg S (DR) | | 267,159 | | | 3,205,908 |
| | | | | |
| | | | | 8,677,728 |
27
| | | | | | |
| | | Shares
Held | | Value |
| | | | | | |
| PORTUGAL - 0.5% | | | | | | |
CIMPOR-Cimentos de Portugal, SGPS, SA(1) | | | 564,221 | | $ | 3,620,278 |
| | | | | | |
| SINGAPORE - 2.9% | | | | | | |
Fraser & Neave Limited(1) | | | 2,783,900 | | | 6,986,241 |
Jaya Holdings Limited(1) | | | 10,971,200 | | | 7,860,735 |
SIA Engineering Company(1) | | | 4,214,200 | | | 6,684,275 |
| | | | | | |
| | | | | | 21,531,251 |
| SWEDEN - 0.2% | | | | | | |
KABE Husvagnar AB, Class B(1) | | | 254,900 | | | 1,809,556 |
| | | | | | |
| SWITZERLAND - 8.1% | | | | | | |
Bank Sarasin & Cie AG, B Shares(1) | | | 716,985 | | | 27,414,339 |
Banque Cantonale Vaudoise(1) | | | 11,371 | | | 3,374,265 |
Schindler Holding AG, Participation Certificates(1)(3) | | | 319,396 | | | 19,087,994 |
Straumann Holding AG(1) | | | 33,588 | | | 9,220,421 |
| | | | | | |
| | | | | | 59,097,019 |
| TURKEY - 5.1% | | | | | | |
Coca-Cola Icecek AS (Unit)(1) | | | 4,622,033 | | | 37,448,075 |
| | | | | | |
| UNITED KINGDOM - 3.2% | | | | | | |
Intertek Group plc(1) | | | 255,071 | | | 3,836,020 |
Robert Walters plc(1) | | | 3,236,209 | | | 6,241,266 |
Sibir Energy PLC(1)(2) | | | 1,891,177 | | | 13,103,602 |
| | | | | | |
| | | | | | 23,180,888 |
| | | | | | |
Total common stocks
(Cost $751,796,137) | | | | | | 646,060,901 |
| | | Par
Amount | | |
SHORT-TERM INVESTMENTS
(CASH EQUIVALENTS) - 10.8% | | | | | | |
Repurchase agreement with Fixed
Income Clearing Corporation,
0.05%, dated 9/30/08, due
10/1/08, maturity value $79,278,110(6)
(Cost $79,278,000) | | $ | 79,278,000 | | | 79,278,000 |
| | | | | | |
| | | | | | |
Total investments - 99.0%
(Cost $831,074,137) | | | | | | 725,338,901 |
| | | | | | |
Other assets less liabilities - 1.0% | | | | | | 7,067,100 |
| | | | | | |
| | | | | | |
Total net assets - 100.0%(7) | | | | | $ | 732,406,001 |
| | | | | | |
(1) | Valued at a fair value in accordance with procedures established by the board of directors of Artisan Funds. In total, securities valued at a fair value were $590,428,579 or 80.6% of total net assets. |
(2) | Non-income producing security. |
(4) | Affiliated company as defined by the Investment Company Act of 1940. See Note (6) in Notes to Financial Statements. |
(5) | Security has been determined to be illiquid under procedures established by the board of directors. |
| | | | | |
Issuer | | Maturity | | Value |
U.S. Treasury Bill | | 7/2/2009 | | $ | 80,866,375 |
(7) | Percentages for the various classifications relate to total net assets. |
Company names are as reported by a data service provider and in some cases are translations; a company’s legal name may be different.
(DR) Depository Receipt, voting rights may vary.
28
| | | | | | |
| PORTFOLIO DIVERSIFICATION - September 30, 2008 | |
| | | Value | | Percentage
of Total
Net Assets | |
Consumer Discretionary | | $ | 62,051,892 | | 8.5 | % |
Consumer Staples | | | 115,745,799 | | 15.8 | |
Energy | | | 44,553,713 | | 6.1 | |
Financials | | | 163,848,970 | | 22.4 | |
Healthcare | | | 11,473,693 | | 1.6 | |
Industrials | | | 156,229,195 | | 21.3 | |
Information Technology | | | 72,669,084 | | 9.9 | |
Materials | | | 19,488,555 | | 2.6 | |
| | | | | | |
Total common stocks | | | 646,060,901 | | 88.2 | |
Short-term investments | | | 79,278,000 | | 10.8 | |
| | | | | | |
Total investments | | | 725,338,901 | | 99.0 | |
Other assets less liabilities | | | 7,067,100 | | 1.0 | |
| | | | | | |
Total net assets | | $ | 732,406,001 | | 100.0 | % |
| | | | | | |
| | | | | | |
| CURRENCY EXPOSURE - September 30, 2008 | |
| | | Value | | Percentage
of Total
Investments | |
British pound | | $ | 23,180,888 | | 3.2 | % |
Canadian dollar | | | 7,969,431 | | 1.1 | |
Danish krone | | | 4,268,078 | | 0.6 | |
Egyptian pound | | | 14,675,724 | | 2.0 | |
Euro | | | 259,802,559 | | 35.8 | |
Hong Kong dollar | | | 104,502,122 | | 14.4 | |
Japanese yen | | | 5,807,263 | | 0.8 | |
Korean won | | | 6,471,868 | | 0.9 | |
Malaysian ringgit | | | 7,678,575 | | 1.1 | |
Mexican peso | | | 12,873,381 | | 1.8 | |
Norwegian krone | | | 18,632,202 | | 2.6 | |
Singapore dollar | | | 21,531,251 | | 3.0 | |
Swedish krona | | | 1,809,556 | | 0.2 | |
Swiss franc | | | 59,097,019 | | 8.1 | |
Turkish lira | | | 37,448,075 | | 5.2 | |
US dollar | | | 139,590,909 | | 19.2 | |
| | | | | | |
Total investments | | $ | 725,338,901 | | 100.0 | % |
| | | | | | |
| | | | | |
| TOP TEN HOLDINGS - September 30, 2008 | |
Company Name | | Country | | Percentage
of Total
Net Assets | |
Coca-Cola Icecek AS | | Turkey | | 5.1 | % |
Ansaldo STS SpA | | Italy | | 4.9 | |
Wirecard AG | | Germany | | 4.8 | |
Gmarket Inc. | | Korea | | 4.3 | |
Vossloh AG | | Germany | | 4.2 | |
Bank Sarasin & Cie AG | | Switzerland | | 3.7 | |
Industrial and Commercial Bank of China (Asia) Limited | | Hong Kong | | 3.4 | |
KWS Saat AG | | Germany | | 3.1 | |
Commercial International Bank | | Egypt | | 2.7 | |
Schindler Holding AG | | Switzerland | | 2.6 | |
| | | | | |
Total | | | | 38.8 | % |
| | | | | |
For the purpose of determining the Fund’s top ten holdings, securities of the same issuer are aggregated to determine the weight in the Fund.
The accompanying notes are an integral part of the financial statements.
29
ARTISAN INTERNATIONAL VALUE FUND
Schedule of Investments – September 30, 2008
| | | | | |
| | | Shares
Held | | Value |
| | | | | |
| COMMON STOCKS - 95.0% | | | | | |
| | | | | |
| FINLAND - 1.1% | | | | | |
Nokia Corporation (DR) | | 691,671 | | $ | 12,899,664 |
| | | | | |
| FRANCE - 11.1% | | | | | |
Gemalto NV(1)(2) | | 825,937 | | | 29,872,679 |
Neopost SA(1) | | 235,351 | | | 22,157,363 |
Sanofi-Aventis(1) | | 413,992 | | | 27,212,277 |
Societe Television Francaise 1(1) | | 2,143,799 | | | 37,930,899 |
Sodexo(1) | | 309,531 | | | 18,341,685 |
| | | | | |
| | | | | 135,514,903 |
| GERMANY - 1.0% | | | | | |
Pfeiffer Vacuum Technology AG(1) | | 149,681 | | | 11,986,107 |
| | | | | |
| HONG KONG - 2.0% | | | | | |
Guoco Group Limited(1) | | 2,872,900 | | | 24,550,283 |
| | | | | |
| IRELAND - 0.6% | | | | | |
Ryanair Holdings PLC, Equity-Linked Security, 144A(1)(2)(4) | | 2,231,800 | | | 7,250,167 |
| | | | | |
| JAPAN - 12.2% | | | | | |
Credit Saison Co., Ltd.(1) | | 2,433,169 | | | 39,582,887 |
MEITEC CORPORATION(1) | | 1,273,695 | | | 34,095,888 |
SANKYO CO., LTD.(1) | | 319,387 | | | 16,289,286 |
SEINO HOLDINGS CO., LTD.(1) | | 1,048,800 | | | 4,941,667 |
Sekisui House, Ltd.(1) | | 3,858,700 | | | 35,429,649 |
UNICHARM CORPORATION(1) | | 226,400 | | | 17,366,778 |
| | | | | |
| | | | | 147,706,155 |
| KOREA - 2.9% | | | | | |
Lotte Chilsung Beverage Co., Ltd.(1) | | 10,323 | | | 7,579,987 |
Samsung Electronics Co., Ltd.(1) | | 19,336 | | | 8,903,730 |
SK Telecom Co., Ltd. (DR) | | 1,030,178 | | | 19,387,950 |
| | | | | |
| | | | | 35,871,667 |
| MEXICO - 3.4% | | | | | |
Grupo Modelo, S.A. de C.V., Series C | | 2,934,581 | | | 12,477,302 |
Kimberly-Clark de Mexico, S.A. de C.V., Class A | | 6,708,872 | | | 29,138,337 |
| | | | | |
| | | | | 41,615,639 |
| NETHERLANDS - 4.4% | | | | | |
Wolters Kluwer NV(1) | | 2,654,482 | | | 54,109,025 |
| | | | | |
| SWITZERLAND - 17.4% | | | | | |
Adecco SA(1) | | 837,982 | | | 36,615,231 |
Givaudan SA(1) | | 32,577 | | | 27,014,611 |
Novartis AG(1) | | 1,465,900 | | | 76,674,454 |
| | | | | | | |
| | | Shares
Held | | Value | |
| | | | | | | |
| SWITZERLAND (CONTINUED) | | | | | | | |
Panalpina Welttransport Holding AG(1) | | | 444,229 | | $ | 29,397,192 | |
Pargesa Holding SA(1) | | | 403,982 | | | 34,462,240 | |
Tamedia AG(1) | | | 70,228 | | | 6,973,600 | |
| | | | | | | |
| | | | | | 211,137,328 | |
| UNITED KINGDOM - 28.2% | | | | | | | |
Benfield Group Plc(1)(3) | | | 11,241,209 | | | 66,922,543 | |
Cadbury PLC(1) | | | 2,107,947 | | | 21,226,414 | |
Carpetright PLC(1) | | | 1,088,402 | | | 11,804,281 | |
Diageo plc(1) | | | 2,051,297 | | | 34,724,360 | |
Experian PLC(1) | | | 8,947,268 | | | 59,327,950 | |
Home Retail Group plc(1) | | | 5,843,614 | | | 24,871,833 | |
Lancashire Holdings Ltd(1) | | | 2,897,486 | | | 15,859,421 | |
Rightmove PLC(1) | | | 1,143,024 | | | 5,226,536 | |
Savills Plc(1) | | | 1,458,324 | | | 6,856,952 | |
Signet Jewelers Ltd. | | | 2,342,442 | | | 54,763,328 | |
Unilever plc (DR) | | | 1,302,339 | | | 35,436,644 | |
Vitec Group PLC(1) | | | 859,067 | | | 5,374,961 | |
| | | | | | | |
| | | | | | 342,395,223 | |
| UNITED STATES - 10.7% | | | | | | | |
Arch Capital Group Ltd.(2) | | | 297,930 | | | 21,757,828 | |
Covidien Ltd. | | | 1,117,505 | | | 60,077,069 | |
Tyco Electronics Ltd. | | | 959,457 | | | 26,538,581 | |
Willis Group Holdings Limited | | | 667,830 | | | 21,544,196 | |
| | | | | | | |
| | | | | | 129,917,674 | |
| | | | | | | |
Total common stocks
(Cost $1,264,483,409) | | | | | | 1,154,953,835 | |
| | |
| | | Par
Amount | | | |
SHORT-TERM INVESTMENTS
(CASH EQUIVALENTS) - 5.7% | | | | | | | |
Repurchase agreement with Fixed Income Clearing Corporation, 0.05%, dated 9/30/08, due 10/1/08, maturity value $68,665,095(5)
(Cost $68,665,000) | | $ | 68,665,000 | | | 68,665,000 | |
| | | | | | | |
| | | | | | | |
Total investments - 100.7%
(Cost $1,333,148,409) | | | | | | 1,223,618,835 | |
| | | | | | | |
Other assets less liabilities - (0.7%) | | | | | | (8,095,493 | ) |
| | | | | | | |
| | | | | | | |
Total net assets - 100.0%(6) | | | | | $ | 1,215,523,342 | |
| | | | | | | |
30
(1) | Valued at a fair value in accordance with procedures established by the board of directors of Artisan Funds. In total, securities valued at a fair value were $860,932,936 or 70.8% of total net assets. |
(2) | Non-income producing security. |
(3) | Affiliated company as defined by the Investment Company Act of 1940. See Note (6) in Notes to Financial Statements. |
(4) | Security is an equity-linked participation certificate issued by HSBC Bank plc. As described in Note 2(h) in Notes to Financial Statements, equity-linked participation certificates are subject to counterparty risk with respect to the bank or broker-dealer that issues them. |
| | | | | |
Issuer | | Maturity | | Value |
U.S. Treasury Bill | | 7/30/2009 | | $ | 70,038,438 |
(6) | Percentages for the various classifications relate to total net assets. |
| | Company names are as reported by a data service provider and in some cases are translations; a company’s legal name may be different. |
(DR) Depository Receipt, voting rights may vary.
| | | | | | | |
| PORTFOLIO DIVERSIFICATION - September 30, 2008 | |
| | | Value | | | Percentage
of Total
Net Assets | |
Consumer Discretionary | | $ | 271,115,083 | | | 22.3 | % |
Consumer Staples | | | 157,949,822 | | | 13.0 | |
Financials | | | 231,536,350 | | | 19.0 | |
Healthcare | | | 163,963,800 | | | 13.5 | |
Industrials | | | 183,614,202 | | | 15.1 | |
Information Technology | | | 100,372,017 | | | 8.3 | |
Materials | | | 27,014,611 | | | 2.2 | |
Telecommunication Services | | | 19,387,950 | | | 1.6 | |
| | | | | | | |
Total common stocks | | | 1,154,953,835 | | | 95.0 | |
Short-term investments | | | 68,665,000 | | | 5.7 | |
| | | | | | | |
Total investments | | | 1,223,618,835 | | | 100.7 | |
Other assets less liabilities | | | (8,095,493 | ) | | (0.7 | ) |
| | | | | | | |
Total net assets | | $ | 1,215,523,342 | | | 100.0 | % |
| | | | | | | |
| | | | | | |
| CURRENCY EXPOSURE - September 30, 2008 | |
| | | Value | | Percentage
of Total
Investments | |
British pound | | $ | 306,958,579 | | 25.1 | % |
Euro | | | 201,610,035 | | 16.5 | |
Hong Kong dollar | | | 24,550,283 | | 2.0 | |
Japanese yen | | | 147,706,155 | | 12.1 | |
Korean won | | | 16,483,717 | | 1.3 | |
Mexican peso | | | 41,615,639 | | 3.4 | |
Swiss franc | | | 211,137,328 | | 17.2 | |
US dollar | | | 273,557,099 | | 22.4 | |
| | | | | | |
Total investments | | $ | 1,223,618,835 | | 100.0 | % |
| | | | | | |
| | | | | |
| TOP TEN HOLDINGS - September 30, 2008 | |
Company Name | | Country | | Percentage
of Total
Net Assets | |
Novartis AG | | Switzerland | | 6.3 | % |
Benfield Group Plc | | United Kingdom | | 5.5 | |
Covidien Ltd. | | United States | | 4.9 | |
Experian PLC | | United Kingdom | | 4.9 | |
Signet Jewelers Ltd. | | United Kingdom | | 4.5 | |
Wolters Kluwer NV | | Netherlands | | 4.5 | |
Credit Saison Co., Ltd. | | Japan | | 3.3 | |
Societe Television Francaise 1 | | France | | 3.1 | |
Adecco SA | | Switzerland | | 3.0 | |
Unilever plc | | United Kingdom | | 2.9 | |
| | | | | |
Total | | | | 42.9 | % |
| | | | | |
For the purpose of determining the Fund’s top ten holdings, securities of the same issuer are aggregated to determine the weight in the Fund.
| | | | | | | | | | | | | | |
| FORWARD CURRENCY CONTRACTS - September 30, 2008 | | | | | | | | | | |
Forward Currency | | Transaction
Type | | Expiration
Date | | Cost on
Origination
Date | | Value | | Unrealized
Depreciation | |
British Pound | | Sell | | 12/4/08 | | $ | 68,243,560 | | $ | 68,627,497 | | $ | (383,937 | ) |
The accompanying notes are an integral part of the financial statements.
31
ARTISAN MID CAP FUND
Schedule of Investments – September 30, 2008
| | | | | |
| | | Shares
Held | | Value |
| | | | | |
| COMMON STOCKS - 97.3% | | | | | |
| | | | | |
| CONSUMER DISCRETIONARY - 7.7% | | | |
Auto Components - 2.9% | | | | | |
BorgWarner Inc. | | 2,400,351 | | $ | 78,659,502 |
Johnson Controls, Inc. | | 1,466,000 | | | 44,463,780 |
| | | | | |
| | | | | 123,123,282 |
Distributors - 0.5% | | | | | |
LKQ Corporation(1) | | 1,399,019 | | | 23,741,352 |
| | | | | |
Diversified Consumer Services - 0.3% | | | | | |
New Oriental Education & Technology Group Inc. (DR)(1)(2) | | 171,200 | | | 10,997,888 |
| | | | | |
Hotels, Restaurants & Leisure - 1.1% | | | | | |
Panera Bread Company, Class A(1) | | 170,500 | | | 8,678,450 |
Starbucks Corporation(1) | | 609,658 | | | 9,065,614 |
Starwood Hotels & Resorts Worldwide, Inc. | | 980,500 | | | 27,591,270 |
| | | | | |
| | | | | 45,335,334 |
Internet & Catalog Retail - 0.5% | | | |
Amazon.com, Inc.(1) | | 290,822 | | | 21,160,209 |
| | | | | |
Multiline Retail - 1.3% | | | | | |
Kohl’s Corporation(1) | | 1,199,700 | | | 55,282,176 |
| | | | | |
Specialty Retail - 1.1% | | | | | |
Best Buy Co., Inc. | | 650,676 | | | 24,400,350 |
GameStop Corp.(1) | | 635,200 | | | 21,730,192 |
| | | | | |
| | | | | 46,130,542 |
| CONSUMER STAPLES - 4.8% | | | | | |
Beverages - 1.3% | | | | | |
Hansen Natural Corporation(1) | | 1,878,300 | | | 56,818,575 |
| | | | | |
Food Products - 0.8% | | | | | |
Bunge Limited | | 419,221 | | | 26,486,383 |
H.J. Heinz Company | | 116,400 | | | 5,816,508 |
| | | | | |
| | | | | 32,302,891 |
Personal Products - 2.7% | | | | | |
Avon Products, Inc. | | 2,536,064 | | | 105,424,180 |
Bare Escentuals, Inc.(1) | | 1,063,618 | | | 11,561,528 |
| | | | | |
| | | | | 116,985,708 |
| | | | | |
| | | Shares
Held | | Value |
| | | | | |
| ENERGY - 4.0% | | | | | |
Energy Equipment &
Services - 3.5% | | | |
Dresser-Rand Group Inc.(1) | | 1,893,775 | | $ | 59,597,099 |
Helix Energy Solutions Group, Inc.(1) | | 671,401 | | | 16,301,616 |
Smith International, Inc. | | 890,200 | | | 52,201,328 |
Weatherford International Ltd.(1) | | 852,644 | | | 21,435,470 |
| | | | | |
| | | | | 149,535,513 |
Oil, Gas & Consumable
Fuels - 0.5% | | | |
Peabody Energy Corporation | | 452,300 | | | 20,353,500 |
| | | | | |
| FINANCIALS - 8.0% | | | | | |
Capital Markets - 2.8% | | | | | |
Affiliated Managers Group, Inc.(1) | | 492,356 | | | 40,791,695 |
Invesco Ltd. | | 3,690,230 | | | 77,421,025 |
| | | | | |
| | | | | 118,212,720 |
Commercial Banks - 0.8% | | | | | |
HDFC Bank Limited (DR)(2) | | 267,600 | | | 22,732,620 |
M&T Bank Corporation | | 139,100 | | | 12,414,675 |
| | | | | |
| | | | | 35,147,295 |
Consumer Finance - 1.3% | | | | | |
Discover Financial Services | | 3,473,000 | | | 47,996,860 |
SLM Corporation(1) | | 647,000 | | | 7,983,980 |
| | | | | |
| | | | | 55,980,840 |
Diversified Financial
Services - 1.2% | | | |
CME Group Inc., Class A | | 136,125 | | | 50,571,799 |
| | | | | |
Real Estate Management & Development - 1.6% | | | | | |
The St. Joe Company(1) | | 1,751,181 | | | 68,453,665 |
| | | | | |
Thrifts & Mortgage Finance - 0.3% | | | |
New York Community Bancorp, Inc. | | 674,000 | | | 11,316,460 |
| | | | | |
| HEALTHCARE - 25.4% | | | | | |
Biotechnology - 2.4% | | | | | |
Celgene Corporation(1) | | 1,106,801 | | | 70,038,367 |
ImClone Systems Incorporated(1) | | 491,055 | | | 30,661,474 |
| | | | | |
| | | | | 100,699,841 |
Health Care Equipment & Supplies - 8.9% | | | | | |
C.R. Bard, Inc. | | 1,523,141 | | | 144,500,387 |
32
| | | | | |
| | | Shares
Held | | Value |
| | | | | |
| HEALTHCARE (CONTINUED) | | | | | |
Health Care Equipment &
Supplies (Continued) | | | | | |
Gen-Probe Incorporated(1) | | 1,345,800 | | $ | 71,394,690 |
Intuitive Surgical, Inc.(1) | | 180,656 | | | 43,534,483 |
Mindray Medical International Limited, Class A (DR)(2) | | 667,100 | | | 22,501,283 |
NuVasive, Inc.(1) | | 682,652 | | | 33,675,223 |
Varian Medical Systems, Inc.(1) | | 1,098,522 | | | 62,758,562 |
| | | | | |
| | | | | 378,364,628 |
Health Care Technology - 4.1% | | | |
Cerner Corporation(1) | | 3,973,247 | | | 177,365,746 |
| | | | | |
Life Sciences Tools & Services - 5.0% | | | | | |
Thermo Fisher Scientific Inc.(1) | | 3,917,671 | | | 215,471,905 |
| | | | | |
Pharmaceuticals - 5.0% | | | | | |
Allergan, Inc. | | 3,887,718 | | | 200,217,477 |
Shire Limited (DR) | | 272,000 | | | 12,988,000 |
| | | | | |
| | | | | 213,205,477 |
| INDUSTRIALS - 14.9% | | | | | |
Aerospace & Defense - 2.1% | | | |
Hexcel Corporation(1) | | 1,650,615 | | | 22,596,919 |
Precision Castparts Corp. | | 862,322 | | | 67,933,727 |
| | | | | |
| | | | | 90,530,646 |
Air Freight & Logistics - 0.8% | | | |
C.H. Robinson Worldwide, Inc. | | 322,513 | | | 16,435,262 |
Expeditors International of Washington, Inc. | | 561,703 | | | 19,569,733 |
| | | | | |
| | | | | 36,004,995 |
Airlines - 0.5% | | | | | |
Southwest Airlines Co. | | 1,528,674 | | | 22,181,060 |
| | | | | |
Construction & Engineering - 2.5% | | | |
Fluor Corporation | | 614,912 | | | 34,250,598 |
Quanta Services, Inc.(1) | | 2,464,916 | | | 66,577,381 |
URS Corporation(1) | | 143,300 | | | 5,254,811 |
| | | | | |
| | | | | 106,082,790 |
Electrical Equipment - 4.9% | | | | | |
Cooper Industries, Ltd. | | 2,381,404 | | | 95,137,090 |
First Solar, Inc.(1) | | 42,089 | | | 7,951,033 |
Roper Industries, Inc. | | 1,349,860 | | | 76,888,026 |
SunPower Corporation(1) | | 440,600 | | | 31,251,758 |
| | | | | |
| | | | | 211,227,907 |
Machinery - 2.8% | | | | | |
AGCO Corporation(1) | | 1,642,361 | | | 69,981,002 |
Cummins Inc. | | 202,600 | | | 8,857,672 |
Harsco Corporation | | 189,622 | | | 7,052,042 |
PACCAR Inc | | 889,100 | | | 33,954,729 |
| | | | | |
| | | | | 119,845,445 |
| | | | | |
| | | Shares
Held | | Value |
| | | | | |
| INDUSTRIALS (CONTINUED) | | | | | |
Professional Services - 1.3% | | | | | |
Robert Half International Inc. | | 2,236,500 | | $ | 55,353,375 |
| | | | | |
| INFORMATION TECHNOLOGY - 28.5% | | | |
Communications Equipment - 2.7% | | | |
Juniper Networks, Inc.(1) | | 5,385,808 | | | 113,478,975 |
| | | | | |
Computers & Peripherals - 2.0% | | | |
Intermec, Inc.(1)(3) | | 3,481,619 | | | 68,378,997 |
NetApp, Inc.(1) | | 987,787 | | | 18,007,357 |
| | | | | |
| | | | | 86,386,354 |
Electronic Equipment & Instruments - 1.4% | | | | | |
Itron, Inc.(1) | | 229,400 | | | 20,308,782 |
Molex Incorporated | | 977,700 | | | 21,949,365 |
Trimble Navigation Limited(1) | | 641,477 | | | 16,588,595 |
| | | | | |
| | | | | 58,846,742 |
Internet Software &
Services - 0.5% | | | |
Ariba, Inc.(1) | | 688,700 | | | 9,731,331 |
VeriSign, Inc.(1) | | 410,420 | | | 10,703,754 |
| | | | | |
| | | | | 20,435,085 |
IT Services - 5.8% | | | | | |
Affiliated Computer Services, Inc.(1) | | 932,200 | | | 47,197,286 |
Cognizant Technology Solutions Corporation, Class A(1) | | 927,700 | | | 21,179,391 |
Paychex, Inc. | | 250,368 | | | 8,269,655 |
SRA International, Inc., Class A(1) | | 493,800 | | | 11,174,694 |
The Western Union Company | | 6,514,719 | | | 160,718,118 |
| | | | | |
| | | | | 248,539,144 |
Office Electronics - 0.5% | | | | | |
Zebra Technologies Corporation(1) | | 781,003 | | | 21,750,934 |
| | | | | |
Semiconductors & Semiconductor Equipment - 6.5% | | | | | |
Analog Devices, Inc. | | 3,412,854 | | | 89,928,703 |
Broadcom Corporation, Class A(1) | | 4,635,080 | | | 86,351,540 |
Cree, Inc.(1) | | 1,713,000 | | | 39,022,140 |
MEMC Electronic Materials, Inc.(1) | | 458,400 | | | 12,954,384 |
NVIDIA Corporation(1) | | 4,429,083 | | | 47,435,479 |
| | | | | |
| | | | | 275,692,246 |
Software - 9.1% | | | | | |
Autodesk, Inc.(1) | | 1,422,200 | | | 47,714,810 |
Electronic Arts Inc.(1) | | 5,485,285 | | | 202,900,692 |
Intuit Inc.(1) | | 1,310,300 | | | 41,418,583 |
Mc Afee, Inc.(1) | | 704,600 | | | 23,928,216 |
33
| | | | | | |
| | | Shares
Held | | Value |
| | | | | | |
INFORMATION TECHNOLOGY
(CONTINUED) | | | |
Software (Continued) | | | | | | |
Red Hat, Inc.(1) | | | 3,391,195 | | $ | 51,105,309 |
Shanda Interactive Entertainment Limited (DR)(1)(2) | | | 814,000 | | | 20,797,700 |
| | | | | | |
| | | | | | 387,865,310 |
| MATERIALS - 1.6% | | | | | | |
Chemicals - 1.6% | | | | | | |
Ecolab Inc. | | | 507,400 | | | 24,619,048 |
The Mosaic Company | | | 406,928 | | | 27,679,243 |
Olin Corporation | | | 808,400 | | | 15,682,960 |
| | | | | | |
| | | | | | 67,981,251 |
| TELECOMMUNICATION SERVICES - 0.4% | | | | | | |
Wireless Telecommunication Services - 0.4% | | | | | | |
American Tower Corporation(1) | | | 368,000 | | | 13,236,960 |
NII Holdings, Inc.(1) | | | 156,155 | | | 5,921,398 |
| | | | | | |
| | | | | | 19,158,358 |
| UTILITIES - 2.0% | | | | | | |
Independent Power Producers & Energy Traders - 2.0% | | | | | | |
Calpine Corporation(1) | | | 5,143,000 | | | 66,859,000 |
Dynegy Inc.(1) | | | 5,053,000 | | | 18,089,740 |
| | | | | | |
| | | | | | 84,948,740 |
| | | | | | |
Total common stocks
(Cost $4,276,490,706) | | | | | | 4,152,866,703 |
| | | Par
Amount | | |
SHORT-TERM INVESTMENTS
(CASH EQUIVALENTS) - 2.6% | | | | | | |
Repurchase agreement with Fixed
Income Clearing Corporation,
0.05%, dated 9/30/08, due
10/1/08, maturity value
$112,027,156(4)
(Cost $112,027,000) | | $ | 112,027,000 | | | 112,027,000 |
| | | | | | |
| | | | | | |
Total investments - 99.9%
(Cost $4,388,517,706) | | | | | | 4,264,893,703 |
| | | | | | |
Other assets less liabilities - 0.1% | | | | | | 4,616,134 |
| | | | | | |
| | | | | | |
Total net assets - 100.0%(5) | | | | | $ | 4,269,509,837 |
| | | | | | |
(1) | Non-income producing security. |
(2) | The Fund considers the company to be from outside of the United States. See the Fund’s Statement of Additional Information for information on how a country is assigned. |
| | | | |
Security | | Country | | Trading Currency |
HDFC Bank Limited (DR) | | India | | US dollar |
Mindray Medical International Limited, Class A (DR) | | China | | US dollar |
New Oriental Education & Technology Group Inc. (DR) | | China | | US dollar |
Shanda Interactive Entertainment Limited (DR) | | China | | US dollar |
(3) | Affiliated company as defined by the Investment Company Act of 1940. See Note (6) in Notes to Financial Statements. |
| | | | | |
Issuer | | Maturity | | Value |
U.S. Treasury Bill | | 7/2/2009 | | $ | 1,347,938 |
U.S. Treasury Bill | | 7/30/2009 | | | 112,920,625 |
| | | | | |
| | | | | 114,268,563 |
| | | | | |
(5) | Percentages for the various classifications relate to total net assets. |
Company names are as reported by a data service provider and in some cases are translations; a company’s legal name may be different.
(DR) Depository Receipt, voting rights may vary.
| | | | | |
| TOP TEN HOLDINGS - September 30, 2008 | |
Company Name | | Country | | Percentage
of Total
Net Assets | |
Thermo Fisher Scientific, Inc. | | United States | | 5.0 | % |
Electronic Arts Inc. | | United States | | 4.8 | |
Allergan, Inc. | | United States | | 4.7 | |
Cerner Corporation | | United States | | 4.2 | |
The Western Union Company | | United States | | 3.8 | |
C.R. Bard, Inc. | | United States | | 3.4 | |
Juniper Networks, Inc. | | United States | | 2.7 | |
Avon Products, Inc. | | United States | | 2.5 | |
Cooper Industries, Ltd. | | United States | | 2.2 | |
Analog Devices, Inc. | | United States | | 2.1 | |
| | | | | |
Total | | | | 35.4 | % |
| | | | | |
For the purpose of determining the Fund’s top ten holdings, securities of the same issuer are aggregated to determine the weight in the Fund.
The accompanying notes are an integral part of the financial statements.
34
ARTISAN MID CAP VALUE FUND
Schedule of Investments – September 30, 2008
| | | | | |
| | | Shares
Held | | Value |
| | | | | |
| COMMON STOCKS - 93.8% | | | | | |
| | | | | |
| CONSUMER DISCRETIONARY - 18.3% | | | |
Automobiles - 2.1% | | | | | |
Thor Industries, Inc.(1) | | 2,682,100 | | $ | 66,569,722 |
| | | | | |
Household Durables - 3.0% | | | | | |
Mohawk Industries, Inc.(2) | | 1,437,800 | | | 96,893,342 |
| | | | | |
Leisure Equipment & Products - 0.1% | | | | | |
Mattel, Inc. | | 209,000 | | | 3,770,360 |
| | | | | |
Media - 4.6% | | | | | |
Marvel Entertainment, Inc.(2) | | 2,140,100 | | | 73,063,014 |
Omnicom Group Inc. | | 1,941,100 | | | 74,848,816 |
| | | | | |
| | | | | 147,911,830 |
Multiline Retail - 1.3% | | | | | |
Kohl’s Corporation(2) | | 923,500 | | | 42,554,880 |
| | | | | |
Specialty Retail - 7.2% | | | | | |
AutoZone, Inc.(2) | | 497,700 | | | 61,386,318 |
Bed Bath & Beyond Inc.(2) | | 1,576,100 | | | 49,505,301 |
Limited Brands, Inc. | | 2,278,400 | | | 39,461,888 |
Rent-A-Center, Inc.(1)(2) | | 2,455,300 | | | 54,704,084 |
Williams-Sonoma, Inc. | | 1,786,200 | | | 28,900,716 |
| | | | | |
| | | | | 233,958,307 |
| CONSUMER STAPLES - 0.8% | | | | | |
Food Products - 0.8% | | | | | |
Smithfield Foods, Inc.(2) | | 1,653,500 | | | 26,257,580 |
| | | | | |
| ENERGY - 4.4% | | | | | |
Energy Equipment & Services - 2.9% | | | | | |
BJ Services Company | | 2,095,900 | | | 40,094,567 |
Nabors Industries Ltd.(2) | | 2,167,800 | | | 54,021,576 |
| | | | | |
| | | | | 94,116,143 |
Oil, Gas & Consumable Fuels - 1.5% | | | | | |
Holly Corporation | | 1,625,800 | | | 47,018,136 |
| | | | | |
| FINANCIALS - 19.4% | | | | | |
Consumer Finance - 2.0% | | | | | |
The Student Loan Corporation | | 679,300 | | | 63,174,900 |
| | | | | |
Insurance - 16.3% | | | | | |
Alleghany Corporation(2) | | 353,575 | | | 129,054,875 |
| | | | | |
| | | Shares
Held | | Value |
| | | | | |
| FINANCIALS (CONTINUED) | | | | | |
Insurance (Continued) | | | | | |
Allied World Assurance Company Holdings, Ltd | | 1,426,800 | | $ | 50,679,936 |
Arch Capital Group Ltd.(2) | | 385,973 | | | 28,187,608 |
Brown & Brown, Inc. | | 5,046,600 | | | 109,107,492 |
Fidelity National Financial, Inc. | | 4,322,831 | | | 63,545,616 |
The Progressive Corporation | | 3,782,600 | | | 65,817,240 |
White Mountains Insurance Group, Ltd. | | 172,500 | | | 81,031,875 |
| | | | | |
| | | | | 527,424,642 |
Real Estate Investment Trusts (REITS) - 1.1% | | | | | |
Annaly Capital Management, Inc. | | 2,731,500 | | | 36,738,675 |
| | | | | |
| HEALTHCARE - 2.0% | | | | | |
Health Care Providers & Services - 2.0% | | | | | |
CIGNA Corporation | | 1,924,500 | | | 65,394,510 |
| | | | | |
| INDUSTRIALS - 27.6% | | | | | |
Aerospace & Defense - 3.6% | | | |
Rockwell Collins, Inc. | | 2,389,000 | | | 114,887,010 |
| | | | | |
Commercial Services & Supplies - 2.0% | | | | | |
Cintas Corporation | | 2,283,900 | | | 65,570,769 |
| | | | | |
Electrical Equipment - 7.5% | | | | | |
Acuity Brands, Inc.(1) | | 2,806,700 | | | 117,207,792 |
Hubbell Inc., Class B | | 1,498,600 | | | 52,525,930 |
Thomas & Betts Corporation(2) | | 1,880,200 | | | 73,459,414 |
| | | | | |
| | | | | 243,193,136 |
Machinery - 1.3% | | | | | |
Dover Corporation | | 1,034,100 | | | 41,932,755 |
| | | | | |
Marine - 1.8% | | | | | |
Alexander & Baldwin, Inc. | | 1,321,700 | | | 58,194,451 |
| | | | | |
Professional Services - 4.5% | | | |
Manpower Inc. | | 2,344,700 | | | 101,197,252 |
Robert Half International Inc. | | 1,797,300 | | | 44,483,175 |
| | | | | |
| | | | | 145,680,427 |
Road & Rail - 5.2% | | | | | |
Con-way Inc.(1) | | 2,001,900 | | | 88,303,809 |
Ryder System, Inc. | | 1,271,900 | | | 78,857,800 |
| | | | | |
| | | | | 167,161,609 |
35
| | | | | | |
| | | Shares
Held | | Value |
| | | | | | |
| INDUSTRIALS (CONTINUED) | | | | | | |
Trading Companies & Distributors - 1.7% | | | | | | |
GATX Corporation | | | 1,343,800 | | $ | 53,174,166 |
| | | | | | |
| INFORMATION TECHNOLOGY - 20.5% | | | | | | |
Computers & Peripherals - 1.8% | | | |
Seagate Technology | | | 4,888,600 | | | 59,249,832 |
| | | | | | |
Electronic Equipment & Instruments - 9.2% | | | | | | |
Arrow Electronics, Inc.(2) | | | 3,334,600 | | | 87,433,212 |
Avnet, Inc.(2) | | | 3,981,600 | | | 98,066,808 |
Ingram Micro Inc., Class A(2) | | | 6,923,600 | | | 111,262,252 |
| | | | | | |
| | | | | | 296,762,272 |
IT Services - 3.4% | | | | | | |
Hewitt Associates, Inc.(2) | | | 774,200 | | | 28,211,848 |
SAIC, Inc.(2) | | | 4,036,900 | | | 81,666,487 |
| | | | | | |
| | | | | | 109,878,335 |
Semiconductors & Semiconductor Equipment - 6.1% | | | | | | |
Analog Devices, Inc. | | | 3,058,100 | | | 80,580,935 |
Lam Research Corporation(2) | | | 1,847,000 | | | 58,162,030 |
National Semiconductor Corporation | | | 3,389,900 | | | 58,340,179 |
| | | | | | |
| | | | | | 197,083,144 |
| UTILITIES - 0.8% | | | | | | |
Multi-Utilities - 0.8% | | | | | | |
TECO Energy, Inc. | | | 1,719,900 | | | 27,054,027 |
| | | | | | |
Total common stocks
(Cost $3,258,613,021) | | | | | | 3,031,604,960 |
| | |
| | | Par
Amount | | |
SHORT-TERM INVESTMENTS
(CASH EQUIVALENTS) - 5.8% | | | |
Repurchase agreement with Fixed
Income Clearing Corporation,
0.05%, dated 9/30/08, due
10/1/08, maturity value
$186,879,260(3)
(Cost $186,879,000) | | $ | 186,879,000 | | | 186,879,000 |
| | | | | | |
| | | | | | |
Total investments - 99.6%
(Cost $3,445,492,021) | | | | | | 3,218,483,960 |
| | | | | | |
Other assets less liabilities - 0.4% | | | | | | 12,978,091 |
| | | | | | |
| | | | | | |
Total net assets - 100.0%(4) | | | | | $ | 3,231,462,051 |
| | | | | | |
(1) | Affiliated company as defined by the Investment Company Act of 1940. See Note (6) in Notes to Financial Statements. |
(2) | Non-income producing security. |
| | | | | | | | |
Issuer | | Rate | | | Maturity | | Value |
U.S. Treasury Bond | | 8.875 | % | | 2/15/2019 | | $ | 190,617,063 |
(4) | Percentages for the various classifications relate to total net assets. |
Company names are as reported by a data service provider and in some cases are translations; a company’s legal name may be different.
| | | | | |
| TOP TEN HOLDINGS - September 30, 2008 | |
Company Name | | Country | | Percentage
of Total
Net Assets | |
Alleghany Corporation | | United States | | 4.0 | % |
Acuity Brands, Inc. | | United States | | 3.6 | |
Rockwell Collins, Inc. | | United States | | 3.6 | |
Ingram Micro Inc. | | United States | | 3.4 | |
Brown & Brown, Inc. | | United States | | 3.4 | |
Manpower Inc. | | United States | | 3.1 | |
Avnet, Inc. | | United States | | 3.0 | |
Mohawk Industries, Inc. | | United States | | 3.0 | |
Con-way Inc. | | United States | | 2.7 | |
Arrow Electronics, Inc. | | United States | | 2.7 | |
| | | | | |
Total | | | | 32.5 | % |
| | | | | |
For the purpose of determining the Fund’s top ten holdings, securities of the same issuer are aggregated to determine the weight in the Fund.
The accompanying notes are an integral part of the financial statements.
36
ARTISAN OPPORTUNISTIC GROWTH FUND
Schedule of Investments – September 30, 2008
| | | | | |
| | | Shares
Held | | Value |
| | | | | |
| COMMON STOCKS - 94.5% | | | | | |
| | | | | |
| CONSUMER DISCRETIONARY - 6.4% | | | | | |
Auto Components - 1.7% | | | | | |
BorgWarner Inc. | | 2,900 | | $ | 95,033 |
| | | | | |
Hotels, Restaurants & Leisure - 0.8% | | | | | |
Starwood Hotels & Resorts Worldwide, Inc. | | 1,700 | | | 47,838 |
| | | | | |
Multiline Retail - 2.2% | | | | | |
Kohl’s Corporation(1) | | 1,300 | | | 59,904 |
Target Corporation | | 1,300 | | | 63,765 |
| | | | | |
| | | | | 123,669 |
Specialty Retail - 1.7% | | | | | |
Best Buy Co., Inc. | | 2,500 | | | 93,750 |
| | | | | |
| CONSUMER STAPLES - 10.2% | | | | | |
Food Products - 2.6% | | | | | |
Bunge Limited | | 1,500 | | | 94,770 |
H.J. Heinz Company | | 1,000 | | | 49,970 |
| | | | | |
| | | | | 144,740 |
Personal Products - 2.4% | | | | | |
Avon Products, Inc. | | 3,300 | | | 137,181 |
| | | | | |
Tobacco - 5.2% | | | | | |
Philip Morris International Inc.(2) | | 6,136 | | | 295,142 |
| | | | | |
| ENERGY - 2.0% | | | | | |
Energy Equipment & Services - 2.0% | | | | | |
Smith International, Inc. | | 1,900 | | | 111,416 |
| | | | | |
| FINANCIALS - 12.2% | | | | | |
Capital Markets - 3.8% | | | | | |
Invesco Ltd. | | 10,400 | | | 218,192 |
| | | | | |
Consumer Finance - 3.3% | | | | | |
Discover Financial Services | | 13,700 | | | 189,334 |
| | | | | |
Diversified Financial Services - 5.1% | | | | | |
CME Group Inc., Class A | | 775 | | | 287,920 |
| | | | | |
| HEALTHCARE - 19.2% | | | | | |
Biotechnology - 2.4% | | | | | |
Celgene Corporation(1) | | 1,000 | | | 63,280 |
Genzyme Corporation(1) | | 900 | | | 72,801 |
| | | | | |
| | | | | 136,081 |
| | | | | |
| | | Shares
Held | | Value |
| | | | | |
| HEALTHCARE (CONTINUED) | | | | | |
Health Care Equipment & Supplies - 3.2% | | | | | |
C.R. Bard, Inc. | | 1,900 | | $ | 180,253 |
| | | | | |
Health Care Technology - 4.7% | | | | | |
Cerner Corporation(1) | | 6,000 | | | 267,840 |
| | | | | |
Life Sciences Tools & Services - 4.8% | | | | | |
Thermo Fisher Scientific Inc.(1) | | 4,900 | | | 269,500 |
| | | | | |
Pharmaceuticals - 4.1% | | | | | |
Allergan, Inc. | | 4,500 | | | 231,750 |
| | | | | |
| INDUSTRIALS - 10.2% | | | | | |
Aerospace & Defense - 1.3% | | | | | |
Precision Castparts Corp. | | 900 | | | 70,902 |
| | | | | |
Electrical Equipment - 6.6% | | | | | |
Alstom, S.A.(3)(4) | | 800 | | | 60,328 |
Cooper Industries, Ltd. | | 2,500 | | | 99,875 |
First Solar, Inc.(1) | | 300 | | | 56,673 |
Gamesa Corporacion Tecnologica, S.A.(3)(4) | | 4,600 | | | 158,019 |
| | | | | |
| | | | | 374,895 |
Machinery - 2.3% | | | | | |
AGCO Corporation(1) | | 3,100 | | | 132,091 |
| | | | | |
| INFORMATION TECHNOLOGY - 31.3% | | | | | |
Communications Equipment - 9.3% | | | | | |
Cisco Systems, Inc.(1) | | 8,300 | | | 187,248 |
Corning Incorporated | | 8,700 | | | 136,068 |
QUALCOMM Incorporated | | 4,800 | | | 206,256 |
| | | | | |
| | | | | 529,572 |
IT Services - 4.4% | | | | | |
The Western Union Company | | 10,000 | | | 246,700 |
| | | | | |
Semiconductors & Semiconductor Equipment - 3.5% | | | | | |
Analog Devices, Inc. | | 3,500 | | | 92,225 |
Broadcom Corporation, Class A(1) | | 5,800 | | | 108,054 |
| | | | | |
| | | | | 200,279 |
Software - 14.1% | | | | | |
Electronic Arts Inc.(1) | | 9,800 | | | 362,502 |
Microsoft Corporation | | 8,600 | | | 229,534 |
Oracle Corporation(1) | | 10,200 | | | 207,162 |
| | | | | |
| | | | | 799,198 |
37
| | | | | | | |
| | | Shares
Held | | Value | |
| | | | | | | |
| MATERIALS - 1.9% | | | | | | | |
Chemicals - 1.9% | | | | | | | |
Monsanto Company | | | 1,100 | | $ | 108,878 | |
| | | | | | | |
| TELECOMMUNICATION SERVICES - 1.1% | | | | | | | |
Wireless Telecommunication Services - 1.1% | | | | | | | |
America Movil SAB de C.V., Series L (DR)(4) | | | 1,400 | | | 64,904 | |
| | | | | | | |
Total common stocks
(Cost $5,744,314) | | | | | | 5,357,058 | |
| | |
| | | Par
Amount | | | |
| SHORT-TERM INVESTMENTS (CASH EQUIVALENTS) - 6.1% | | | | | | | |
Repurchase agreement with Fixed Income Clearing Corporation, 0.05%, dated 9/30/08, due 10/1/08, maturity value $344,000(5)
(Cost $344,000) | | $ | 344,000 | | | 344,000 | |
| | | | | | | |
| | | | | | | |
Total investments - 100.6%
(Cost $6,088,314) | | | | | | 5,701,058 | |
| | | | | | | |
Other assets less liabilities - (0.6%) | | | | | | (35,575 | ) |
| | | | | | | |
| | | | | | | |
Total net assets - 100.0%(6) | | | | | $ | 5,665,483 | |
| | | | | | | |
(1) | Non-income producing security. |
(3) | Valued at a fair value in accordance with procedures established by the board of directors of Artisan Funds. In total, securities valued at a fair value were $218,347 or 3.9% of total net assets. |
(4) | The Fund considers the company to be from outside of the United States. See the Fund’s Statement of Additional Information for information on how a country is assigned. |
| | | | |
Security | | Country | | Trading Currency |
Alstom, S.A. | | France | | Euro |
America Movil SAB de C.V., Series L (DR) | | Mexico | | US dollar |
Gamesa Corporacion Tecnologica, S.A. | | Spain | | Euro |
| | | | | |
Issuer | | Maturity | | Value |
U.S. Treasury Bill | | 12/26/2008 | | $ | 354,556 |
(6) | Percentages for the various classifications relate to total net assets. |
Company names are as reported by a data service provider and in some cases are translations; a company’s legal name may be different.
(DR) Depository Receipt, voting rights may vary.
| | | | | | |
| CURRENCY EXPOSURE - September 30, 2008 | |
| | | Value | | Percentage
of Total
Investments | |
Euro | | $ | 218,347 | | 3.8 | % |
US dollar | | | 5,482,711 | | 96.2 | |
| | | | | | |
Total investments | | $ | 5,701,058 | | 100.0 | % |
| | | | | | |
| | | | | |
| TOP TEN HOLDINGS - September 30, 2008 | |
Company Name | | Country | | Percentage
of Total
Net Assets | |
Electronic Arts Inc. | | United States | | 6.4 | % |
Philip Morris International Inc. | | United States | | 5.2 | |
CME Group Inc. | | United States | | 5.1 | |
Thermo Fisher Scientific, Inc. | | United States | | 4.8 | |
Cerner Corporation | | United States | | 4.7 | |
The Western Union Company | | United States | | 4.4 | |
Allergan, Inc. | | United States | | 4.1 | |
Microsoft Corporation | | United States | | 4.1 | |
Invesco Limited | | United States | | 3.9 | |
Oracle Corporation | | United States | | 3.7 | |
| | | | | |
Total | | | | 46.4 | % |
| | | | | |
For the purpose of determining the Fund’s top ten holdings, securities of the same issuer are aggregated to determine the weight in the Fund.
The accompanying notes are an integral part of the financial statements.
38
ARTISAN OPPORTUNISTIC VALUE FUND
Schedule of Investments – September 30, 2008
| | | | | |
| | | Shares
Held | | Value |
| | | | | |
| COMMON STOCKS - 95.8% | | | | | |
| | | | | |
| CONSUMER DISCRETIONARY - 11.9% | | | |
Hotels, Restaurants & Leisure - 3.6% | | | | | |
Carnival Corporation | | 235,400 | | $ | 8,321,390 |
| | | | | |
Household Durables - 3.7% | | | | | |
Mohawk Industries, Inc.(1) | | 125,500 | | | 8,457,445 |
| | | | | |
Media - 4.6% | | | | | |
Comcast Corporation, Class A(2) | | 244,200 | | | 4,815,624 |
Omnicom Group Inc. | | 150,100 | | | 5,787,856 |
| | | | | |
| | | | | 10,603,480 |
| CONSUMER STAPLES - 0.8% | | | | | |
Food Products - 0.8% | | | | | |
Smithfield Foods, Inc.(1) | | 121,900 | | | 1,935,772 |
| | | | | |
| ENERGY - 4.7% | | | | | |
Energy Equipment & Services - 2.1% | | | |
Nabors Industries Ltd.(1) | | 190,500 | | | 4,747,260 |
| | | | | |
Oil, Gas & Consumable Fuels - 2.6% | | | |
Valero Energy Corporation | | 194,100 | | | 5,881,230 |
| | | | | |
| FINANCIALS - 18.0% | | | | | |
Capital Markets - 2.1% | | | | | |
AllianceBernstein Holding L.P. | | 132,700 | | | 4,911,227 |
| | | | | |
Insurance - 14.3% | | | | | |
Allied World Assurance Company Holdings, Ltd | | 111,500 | | | 3,960,480 |
The Allstate Corporation | | 217,550 | | | 10,033,406 |
Berkshire Hathaway Inc., Class B(1) | | 1,900 | | | 8,350,500 |
Fidelity National Financial, Inc. | | 300,500 | | | 4,417,350 |
The Progressive Corporation | | 354,400 | | | 6,166,560 |
| | | | | |
| | | | | 32,928,296 |
Real Estate Investment Trusts (REITS) - 1.6% | | | | | |
Annaly Capital Management, Inc. | | 267,600 | | | 3,599,220 |
| | | | | |
| HEALTHCARE - 2.6% | | | | | |
Health Care Providers & Services - 2.6% | | | | | |
CIGNA Corporation | | 172,900 | | | 5,875,142 |
| | | | | |
| | | | | |
| | | Shares
Held | | Value |
| | | | | |
| INDUSTRIALS - 13.8% | | | | | |
Aerospace & Defense - 8.0% | | | | | |
The Boeing Company | | 159,800 | | $ | 9,164,530 |
Rockwell Collins, Inc. | | 194,600 | | | 9,358,314 |
| | | | | |
| | | | | 18,522,844 |
Industrial Conglomerates - 2.5% | | | | | |
3M Company | | 84,400 | | | 5,765,364 |
| | | | | |
Professional Services - 3.3% | | | | | |
Manpower Inc. | | 177,000 | | | 7,639,320 |
| | | | | |
| INFORMATION TECHNOLOGY - 44.0% | | | |
Communications Equipment - 10.1% | | | |
Cisco Systems, Inc.(1) | | 216,200 | | | 4,877,472 |
Corning Incorporated | | 536,300 | | | 8,387,732 |
Nokia Corporation (DR)(3) | | 538,500 | | | 10,043,025 |
| | | | | |
| | | | | 23,308,229 |
Computers & Peripherals - 6.7% | | | | | |
Dell Inc.(1) | | 407,700 | | | 6,718,896 |
Hewlett-Packard Company | | 86,600 | | | 4,004,384 |
Seagate Technology | | 388,700 | | | 4,711,044 |
| | | | | |
| | | | | 15,434,324 |
Electronic Equipment & Instruments - 11.8% | | | | | |
Arrow Electronics, Inc.(1) | | 288,400 | | | 7,561,848 |
Avnet, Inc.(1) | | 399,000 | | | 9,827,370 |
Ingram Micro Inc., Class A(1) | | 607,600 | | | 9,764,132 |
| | | | | |
| | | | | 27,153,350 |
IT Services - 4.8% | | | | | |
Accenture Ltd, Class A | | 291,600 | | | 11,080,800 |
| | | | | |
Semiconductors & Semiconductor Equipment - 6.5% | | | |
Taiwan Semiconductor Manufacturing Company Ltd. (DR)(2)(3) | | 724,260 | | | 6,786,316 |
Texas Instruments Incorporated | | 380,100 | | | 8,172,150 |
| | | | | |
| | | | | 14,958,466 |
Software - 4.1% | | | | | |
Microsoft Corporation | | 355,300 | | | 9,482,957 |
| | | | | |
Total common stocks
(Cost $254,226,884) | | | | | 220,606,116 |
39
| | | | | | |
| | | Par
Amount | | Value |
| | | | | | |
SHORT-TERM INVESTMENTS
(CASH EQUIVALENTS) - 3.7% | | | | | | |
Repurchase agreement with Fixed Income Clearing Corporation, 0.05%, dated 9/30/08, due 10/1/08, maturity value $8,489,012(4)
(Cost $8,489,000) | | $ | 8,489,000 | | $ | 8,489,000 |
| | | | | | |
| | | | | | |
Total investments - 99.5%
(Cost $262,715,884) | | | | | | 229,095,116 |
| | | | | | |
Other assets less liabilities - 0.5% | | | | | | 1,188,559 |
| | | | | | |
| | | | | | |
Total net assets - 100.0%(5) | | | | | $ | 230,283,675 |
| | | | | | |
(1) | Non-income producing security. |
(3) | The Fund considers the company to be from outside of the United States. See the Fund’s Statement of Additional Information for information on how a country is assigned. |
| | | | |
Security | | Country | | Trading Currency |
Nokia Corporation (DR) | | Finland | | US dollar |
Taiwan Semiconductor Manufacturing Company Ltd. (DR) | | Taiwan | | US dollar |
| | | | | |
Issuer | | Maturity | | Value |
U.S. Treasury Bill | | 7/2/2009 | | $ | 8,660,375 |
(5) | Percentages for the various classifications relate to total net assets. |
Company names are as reported by a data service provider and in some cases are translations; a company’s legal name may be different.
(DR) Depository Receipt, voting rights may vary.
| | | | | |
| TOP TEN HOLDINGS - September 30, 2008 | |
Company Name | | Country | | Percentage
of Total
Net Assets | |
Accenture Ltd | | United States | | 4.8 | % |
Nokia Corporation | | Finland | | 4.4 | |
The Allstate Corporation | | United States | | 4.4 | |
Avnet, Inc. | | United States | | 4.3 | |
Ingram Micro Inc. | | United States | | 4.2 | |
Microsoft Corporation | | United States | | 4.1 | |
Rockwell Collins, Inc. | | United States | | 4.1 | |
The Boeing Company | | United States | | 4.0 | |
Mohawk Industries, Inc. | | United States | | 3.7 | |
Corning Incorporated | | United States | | 3.6 | |
| | | | | |
Total | | | | 41.6 | % |
| | | | | |
For the purpose of determining the Fund’s top ten holdings, securities of the same issuer are aggregated to determine the weight in the Fund.
The accompanying notes are an integral part of the financial statements.
40
ARTISAN SMALL CAP FUND
Schedule of Investments – September 30, 2008
| | | | | |
| | | Shares
Held | | Value |
| | | | | |
| COMMON STOCKS - 95.7% | | | | | |
| | | | | |
| CONSUMER DISCRETIONARY - 10.6% | | | |
Distributors - 2.0% | | | | | |
LKQ Corporation(1) | | 707,500 | | $ | 12,006,275 |
| | | | | |
Diversified Consumer Services - 0.3% | | | |
Capella Education Company(1) | | 35,800 | | | 1,534,388 |
| | | | | |
Hotels, Restaurants & Leisure - 2.7% | | | |
Life Time Fitness, Inc.(1) | | 265,800 | | | 8,311,566 |
Morgans Hotel Group Co.(1) | | 717,800 | | | 7,831,198 |
| | | | | |
| | | | | 16,142,764 |
Specialty Retail - 2.8% | | | | | |
Coldwater Creek Inc.(1) | | 472,200 | | | 2,734,038 |
Hibbett Sports, Inc.(1) | | 341,850 | | | 6,843,837 |
Tween Brands, Inc.(1) | | 696,600 | | | 6,819,714 |
| | | | | |
| | | | | 16,397,589 |
Textiles, Apparel & Luxury Goods - 2.8% | | | | | |
Carter’s, Inc.(1) | | 360,100 | | | 7,104,773 |
Iconix Brand Group, Inc.(1) | | 693,100 | | | 9,065,748 |
| | | | | |
| | | | | 16,170,521 |
| CONSUMER STAPLES - 2.7% | | | | | |
Food & Staples Retailing - 1.3% | | | |
The Andersons, Inc. | | 214,400 | | | 7,551,168 |
| | | | | |
Personal Products - 1.4% | | | | | |
Bare Escentuals, Inc.(1) | | 785,400 | | | 8,537,298 |
| | | | | |
| ENERGY - 7.1% | | | | | |
Energy Equipment & Services - 4.9% | | | |
Core Laboratories N.V. | | 99,300 | | | 10,061,076 |
Dril-Quip, Inc.(1) | | 203,900 | | | 8,847,221 |
Hercules Offshore, Inc.(1) | | 665,000 | | | 10,081,400 |
| | | | | |
| | | | | 28,989,697 |
Oil, Gas & Consumable Fuels - 2.2% | | | |
Carrizo Oil & Gas, Inc.(1) | | 213,400 | | | 7,740,018 |
Goodrich Petroleum Corporation(1) | | 52,800 | | | 2,301,552 |
Penn Virginia Corporation | | 56,800 | | | 3,035,392 |
| | | | | |
| | | | | 13,076,962 |
| FINANCIALS - 5.4% | | | | | |
Capital Markets - 3.8% | | | | | |
Ares Capital Corporation | | 813,076 | | | 8,480,383 |
FCStone Group, Inc.(1) | | 434,600 | | | 7,818,454 |
Investment Technology Group, Inc.(1) | | 195,000 | | | 5,933,850 |
| | | | | |
| | | | | 22,232,687 |
| | | | | |
| | | Shares
Held | | Value |
| | | | | |
| FINANCIALS (CONTINUED) | | | | | |
Commercial Banks - 0.5% | | | | | |
Wintrust Financial Corporation | | 98,900 | | $ | 2,902,715 |
| | | | | |
Insurance - 1.1% | | | | | |
Selective Insurance Group, Inc. | | 290,900 | | | 6,667,428 |
| | | | | |
| HEALTHCARE - 18.0% | | | | | |
Biotechnology - 0.8% | | | | | |
Cepheid(1) | | 330,800 | | | 4,574,964 |
| | | | | |
Health Care Equipment & Supplies - 3.3% | | | | | |
ArthroCare Corporation(1) | | 237,200 | | | 6,575,184 |
Volcano Corporation(1) | | 199,800 | | | 3,454,542 |
Wright Medical Group, Inc.(1) | | 313,900 | | | 9,555,116 |
| | | | | |
| | | | | 19,584,842 |
Health Care Providers & Services - 8.4% | | | | | |
athenahealth, Inc.(1) | | 128,100 | | | 4,261,887 |
Catalyst Health Solutions Inc(1) | | 394,100 | | | 10,293,892 |
Genoptix, Inc.(1) | | 178,300 | | | 5,825,061 |
PSS World Medical, Inc.(1) | | 603,000 | | | 11,758,500 |
Psychiatric Solutions, Inc.(1) | | 268,200 | | | 10,178,190 |
VCA Antech, Inc.(1) | | 237,400 | | | 6,996,178 |
| | | | | |
| | | | | 49,313,708 |
Health Care Technology - 1.7% | | | | | |
Phase Forward Incorporated(1) | | 471,900 | | | 9,867,429 |
| | | | | |
Life Sciences Tools & Services - 2.4% | | | |
ICON PLC (DR)(1)(2) | | 288,500 | | | 11,035,125 |
Kendle International Inc.(1) | | 63,900 | | | 2,856,969 |
| | | | | |
| | | | | 13,892,094 |
Pharmaceuticals - 1.4% | | | | | |
K-V Pharmaceutical Company, Class A(1) | | 367,900 | | | 8,355,009 |
| | | | | |
| INDUSTRIALS - 25.8% | | | | | |
Aerospace & Defense - 3.4% | | | | | |
AAR CORP.(1) | | 754,800 | | | 12,522,132 |
Ladish Co., Inc.(1) | | 366,000 | | | 7,411,500 |
| | | | | |
| | | | | 19,933,632 |
Air Freight & Logistics - 1.3% | | | | | |
UTi Worldwide Inc. | | 437,500 | | | 7,446,250 |
| | | | | |
41
| | | | | |
| | | Shares
Held | | Value |
| | | | | |
| INDUSTRIALS (CONTINUED) | | | | | |
Commercial Services &
Supplies - 8.3% | | | |
The GEO Group, Inc.(1) | | 602,300 | | $ | 12,172,483 |
Healthcare Services Group, Inc. | | 510,500 | | | 9,337,045 |
Innerworkings, Inc.(1) | | 830,100 | | | 9,205,809 |
Mobile Mini, Inc.(1) | | 405,400 | | | 7,836,382 |
Waste Connections, Inc.(1) | | 291,925 | | | 10,013,027 |
| | | | | |
| | | | | 48,564,746 |
Electrical Equipment - 0.7% | | | | | |
General Cable Corporation(1) | | 122,600 | | | 4,368,238 |
| | | | | |
Machinery - 5.1% | | | | | |
Actuant Corporation | | 396,000 | | | 9,995,040 |
Astec Industries, Inc.(1) | | 214,200 | | | 6,603,786 |
Dynamic Materials Corporation | | 239,300 | | | 5,554,153 |
The Middleby Corporation(1) | | 140,900 | | | 7,652,279 |
| | | | | |
| | | | | 29,805,258 |
Marine - 1.6% | | | | | |
Eagle Bulk Shipping Inc. | | 591,100 | | | 8,239,934 |
Seaspan Corporation(2) | | 77,300 | | | 1,398,357 |
| | | | | |
| | | | | 9,638,291 |
Professional Services - 0.4% | | | | | |
CRA International, Inc.(1) | | 86,000 | | | 2,363,280 |
| | | | | |
Road & Rail - 1.5% | | | | | |
Old Dominion Freight Line, Inc.(1) | | 313,100 | | | 8,873,254 |
| | | | | |
Trading Companies & Distributors - 1.9% | | | | | |
Interline Brands, Inc.(1) | | 693,400 | | | 11,240,014 |
| | | | | |
Transportation Infrastructure - 1.6% | | | |
Aegean Marine Petroleum Network Inc.(2) | | 411,900 | | | 9,205,965 |
| | | | | |
| INFORMATION TECHNOLOGY - 23.6% | | | |
Communications Equipment - 2.5% | | | |
Aruba Networks, Inc.(1) | | 1,145,900 | | | 5,878,467 |
Avocent Corporation(1) | | 430,000 | | | 8,797,800 |
| | | | | |
| | | | | 14,676,267 |
Electronic Equipment & Instruments - 1.5% | | | | | |
Brightpoint, Inc.(1) | | 1,235,400 | | | 8,894,880 |
| | | | | |
Internet Software & Services - 1.9% | | | |
Omniture, Inc.(1) | | 603,300 | | | 11,076,588 |
| | | | | |
IT Services - 2.2% | | | | | |
Euronet Worldwide, Inc.(1) | | 776,800 | | | 12,995,864 |
| | | | | |
| | | | | | | |
| | | Shares
Held | | Value | |
| | | | | | | |
| INFORMATION TECHNOLOGY (CONTINUED) | | | | | | | |
Semiconductors & Semiconductor Equipment - 5.5% | | | | |
Atheros Communications, Inc.(1) | | | 372,700 | | $ | 8,788,266 | |
Microsemi Corporation(1) | | | 336,800 | | | 8,581,664 | |
Tessera Technologies, Inc.(1) | | | 611,900 | | | 9,998,446 | |
Varian Semiconductor Equipment Associates, Inc.(1) | | | 191,700 | | | 4,815,504 | |
| | | | | | | |
| | | | | | 32,183,880 | |
Software - 10.0% | | | | | | | |
Blackbaud, Inc. | | | 383,900 | | | 7,082,955 | |
CommVault Systems, Inc.(1) | | | 716,100 | | | 8,629,005 | |
Concur Technologies, Inc.(1) | | | 150,400 | | | 5,754,304 | |
Informatica Corporation(1) | | | 527,200 | | | 6,848,328 | |
Kenexa Corporation(1) | | | 540,700 | | | 8,537,653 | |
Macrovision Corporation(1) | | | 679,400 | | | 10,449,172 | |
Progress Software Corporation(1) | | | 303,600 | | | 7,890,564 | |
Quest Software, Inc.(1) | | | 282,900 | | | 3,590,001 | |
| | | | | | | |
| | | | | | 58,781,982 | |
| MATERIALS - 0.6% | | | | | | | |
Chemicals - 0.6% | | | | | | | |
Solutia Inc.(1)(3) | | | 236,200 | | | 3,306,800 | |
| | | | | | | |
| TELECOMMUNICATION SERVICES - 0.7% | | | | | | | |
Diversified Telecommunication Services - 0.7% | | | | | | | |
Cogent Communications Group, Inc.(1) | | | 500,500 | | | 3,863,860 | |
| | | | | | | |
| UTILITIES - 1.2% | | | | | | | |
Electrical Utilities - 1.2% | | | | | | | |
ITC Holdings Corp. | | | 138,700 | | | 7,180,499 | |
| | | | | | | |
Total common stocks
(Cost $599,753,088) | | | | | | 562,197,086 | |
| | |
| | | Par
Amount | | | |
| SHORT-TERM INVESTMENTS (CASH EQUIVALENTS) - 6.6% | | | | | | | |
Repurchase agreement with Fixed Income Clearing Corporation, 0.05%, dated 9/30/08, due 10/1/08, maturity value $38,583,054(4) (Cost $38,583,000) | | $ | 38,583,000 | | | 38,583,000 | |
| | | | | | | |
| | | | | | | |
Total investments - 102.3%
(Cost $638,336,088) | | | | | | 600,780,086 | |
| | | | | | | |
Other assets less liabilities - (2.3%) | | | | | | (13,653,281 | ) |
| | | | | | | |
| | | | | | | |
Total net assets - 100.0%(5) | | | | | $ | 587,126,805 | |
| | | | | | | |
42
(1) | Non-income producing security. |
(2) | The Fund considers the company to be from outside of the United States. See the Fund’s Statement of Additional Information for information on how a country is assigned. |
| | | | |
Security | | Country | | Trading Currency |
Aegean Marine Petroleum Network Inc. | | Greece | | US dollar |
ICON PLC (DR) | | Ireland | | US dollar |
Seaspan Corporation | | China | | US dollar |
| | | | | | | | |
Issuer | | Rate | | | Maturity | | Value |
U.S. Treasury Bond | | 8.750 | % | | 8/15/2020 | | $ | 39,360,281 |
(5) | Percentages for the various classifications relate to total net assets. |
Company names are as reported by a data service provider and in some cases are translations; a company’s legal name may be different.
(DR) Depository Receipt, voting rights may vary.
| | | | | |
| TOP TEN HOLDINGS - September 30, 2008 | |
Company Name | | Country | | Percentage
of Total
Net Assets | |
Euronet Worldwide, Inc. | | United States | | 2.2 | % |
AAR CORP. | | United States | | 2.1 | |
The GEO Group, Inc. | | United States | | 2.1 | |
LKQ Corporation | | United States | | 2.0 | |
PSS World Medical, Inc. | | United States | | 2.0 | |
Interline Brands, Inc. | | United States | | 1.9 | |
Omniture, Inc. | | United States | | 1.9 | |
ICON PLC | | Ireland | | 1.9 | |
Macrovision Corporation | | United States | | 1.8 | |
Catalyst Health Solutions Inc | | United States | | 1.8 | |
| | | | | |
Total | | | | 19.7 | % |
| | | | | |
For the purpose of determining the Fund’s top ten holdings, securities of the same issuer are aggregated to determine the weight in the Fund.
The accompanying notes are an integral part of the financial statements.
43
ARTISAN SMALL CAP VALUE FUND
Schedule of Investments – September 30, 2008
| | | | | |
| | | Shares
Held | | Value |
| | | | | |
| COMMON STOCKS - 93.8% | | | | | |
| | | | | |
| CONSUMER DISCRETIONARY - 13.1% | | | |
Automobiles - 1.3% | | | | | |
Thor Industries, Inc.(1) | | 1,019,300 | | $ | 25,299,026 |
| | | | | |
Hotels, Restaurants & Leisure - 1.5% | | | | | |
International Speedway Corporation, Class A | | 512,200 | | | 19,929,702 |
Jack in the Box Inc.(2) | | 409,400 | | | 8,638,340 |
| | | | | |
| | | | | 28,568,042 |
Household Durables - 1.7% | | | | | |
Ethan Allen Interiors Inc. | | 1,178,800 | | | 33,029,976 |
| | | | | |
Media - 3.9% | | | | | |
Belo Corp., Class A | | 1,609,900 | | | 9,595,004 |
The E.W. Scripps Company, Class A(3) | | 939,466 | | | 6,642,025 |
Marvel Entertainment, Inc.(2) | | 683,400 | | | 23,331,276 |
Meredith Corporation, Class B | | 949,300 | | | 26,618,372 |
World Wrestling Entertainment, Inc., Class A | | 520,700 | | | 8,050,022 |
| | | | | |
| | | | | 74,236,699 |
Specialty Retail - 3.9% | | | | | |
AnnTaylor Stores Corporation(2) | | 866,900 | | | 17,892,816 |
The Men’s Wearhouse, Inc. | | 970,900 | | | 20,621,916 |
Rent-A-Center, Inc.(1)(2) | | 1,638,400 | | | 36,503,552 |
| | | | | |
| | | | | 75,018,284 |
Textiles, Apparel & Luxury Goods - 0.8% | | | | | |
Columbia Sportswear Company | | 385,900 | | | 16,192,364 |
| | | | | |
| CONSUMER STAPLES - 3.1% | | | | | |
Food Products - 2.0% | | | | | |
Sanderson Farms, Inc.(1) | | 1,045,200 | | | 38,400,648 |
| | | | | |
Tobacco - 1.1% | | | | | |
Universal Corporation | | 429,900 | | | 21,103,791 |
| | | | | |
| ENERGY - 6.3% | | | | | |
Energy Equipment & Services - 5.5% | | | | | |
Cal Dive International, Inc.(2) | | 1,865,587 | | | 19,775,222 |
Complete Production Services, Inc.(2) | | 533,400 | | | 10,737,342 |
Grey Wolf, Inc.(2) | | 3,943,800 | | | 30,682,764 |
| | | | | |
| | | Shares
Held | | Value |
| | | | | |
| ENERGY (CONTINUED) | | | | | |
Energy Equipment & Services (Continued) | | | | | |
Parker Drilling Company(2) | | 2,782,000 | | $ | 22,311,640 |
RPC, Inc. | | 1,448,200 | | | 20,361,692 |
| | | | | |
| | | | | 103,868,660 |
Oil, Gas & Consumable Fuels - 0.8% | | | | | |
Holly Corporation | | 519,400 | | | 15,021,048 |
| | | | | |
| FINANCIALS - 11.8% | | | | | |
Consumer Finance - 0.5% | | | | | |
The Student Loan Corporation | | 97,400 | | | 9,058,200 |
| | | | | |
Diversified Financial Services - 0.6% | | | | | |
PICO Holdings, Inc.(2) | | 298,000 | | | 10,701,180 |
| | | | | |
Insurance - 8.6% | | | | | |
Assured Guaranty Ltd. | | 642,800 | | | 10,451,928 |
Hilb Rogal & Hobbs Company | | 1,089,800 | | | 50,937,252 |
Max Capital Group Ltd. | | 798,900 | | | 18,558,447 |
Platinum Underwriters Holdings, Ltd. | | 357,800 | | | 12,694,744 |
Stewart Information Services Corporation(1) | | 1,447,400 | | | 43,060,150 |
Zenith National Insurance Corp. | | 770,700 | | | 28,238,448 |
| | | | | |
| | | | | 163,940,969 |
Real Estate Investment Trusts (REITS) - 2.1% | | | | | |
Cousins Properties Incorporated | | 1,096,900 | | | 27,674,787 |
Hatteras Financial Corp. | | 526,045 | | | 12,204,244 |
| | | | | |
| | | | | 39,879,031 |
| HEALTHCARE - 5.6% | | | | | |
Health Care Equipment & Supplies - 0.6% | | | | | |
CONMED Corporation(2) | | 273,500 | | | 8,752,000 |
National Dentex Corporation(1)(2) | | 415,800 | | | 2,536,380 |
| | | | | |
| | | | | 11,288,380 |
Health Care Providers & Services - 5.0% | | | | | |
America Service Group Inc.(2) | | 115,600 | | | 1,100,512 |
AMN Healthcare Services, Inc.(1)(2) | | 2,009,800 | | | 35,312,186 |
Cross Country Healthcare, Inc.(1)(2) | | 2,155,000 | | | 35,104,950 |
HealthSpring, Inc.(2) | | 943,200 | | | 19,958,112 |
44
| | | | | |
| | | Shares
Held | | Value |
| | | | | |
| HEALTHCARE (CONTINUED) | | | | | |
Health Care Providers & Services (Continued) | | | | | |
Medical Staffing Network Holdings, Inc.(1)(2) | | 1,760,100 | | $ | 2,904,165 |
| | | | | |
| | | | | 94,379,925 |
Life Sciences Tools & Services - 0.0%(4) | | | | | |
Varian, Inc.(2) | | 20,000 | | | 858,000 |
| | | | | |
| INDUSTRIALS - 20.3% | | | | | |
Building Products - 1.5% | | | | | |
Quanex Building Products Corporation(3) | | 1,838,375 | | | 28,016,835 |
| | | | | |
Commercial Services & Supplies - 2.2% | | | | | |
ABM Industries Incorporated | | 951,300 | | | 20,776,392 |
Comfort Systems USA, Inc. | | 659,100 | | | 8,805,576 |
United Stationers Inc.(2) | | 241,200 | | | 11,536,596 |
| | | | | |
| | | | | 41,118,564 |
Construction & Engineering - 2.4% | | | | | |
EMCOR Group, Inc.(2) | | 861,000 | | | 22,661,520 |
Granite Construction Incorporated | | 646,300 | | | 23,150,466 |
| | | | | |
| | | | | 45,811,986 |
Electrical Equipment - 3.2% | | | | | |
Acuity Brands, Inc.(1) | | 1,000,800 | | | 41,793,408 |
Regal-Beloit Corporation | | 469,300 | | | 19,954,636 |
| | | | | |
| | | | | 61,748,044 |
Machinery - 0.9% | | | | | |
Astec Industries, Inc.(2) | | 550,800 | | | 16,981,164 |
| | | | | |
Professional Services - 6.6% | | | | | |
Diamond Management & Technology Consultants, Inc.(1) | | 1,897,400 | | | 8,898,806 |
Hudson Highland Group, Inc.(1)(2) | | 1,563,500 | | | 10,866,325 |
Kforce Inc.(1)(2) | | 2,284,400 | | | 23,323,724 |
Korn/Ferry International(2) | | 1,351,300 | | | 24,080,166 |
MPS Group, Inc.(2) | | 2,496,600 | | | 25,165,728 |
School Specialty, Inc.(2) | | 607,900 | | | 18,960,401 |
TrueBlue, Inc.(2) | | 932,600 | | | 15,070,816 |
| | | | | |
| | | | | 126,365,966 |
Road & Rail - 3.5% | | | | | |
Arkansas Best Corporation | | 1,211,600 | | | 40,818,804 |
Con-way Inc.(1) | | 572,700 | | | 25,261,797 |
| | | | | |
| | | | | 66,080,601 |
| INFORMATION TECHNOLOGY - 28.1% | | | | | |
Computers & Peripherals - 2.5% | | | |
Imation Corp. | | 963,700 | | | 21,769,983 |
| | | | | |
| | | Shares
Held | | Value |
| | | | | |
| INFORMATION TECHNOLOGY (CONTINUED) | | | | | |
Computers & Peripherals (Continued) | | | | | |
Intevac, Inc.(1)(2) | | 1,139,100 | | $ | 12,120,024 |
Xyratex Ltd(2) | | 1,179,400 | | | 13,126,722 |
| | | | | |
| | | | | 47,016,729 |
Electronic Equipment & Instruments - 3.1% | | | | | |
Benchmark Electronics, Inc.(2) | | 1,391,800 | | | 19,596,544 |
Orbotech, Ltd.(1)(2)(5) | | 2,635,500 | | | 21,057,645 |
Photon Dynamics, Inc.(2) | | 666,300 | | | 10,227,705 |
RadiSys Corporation(2) | | 873,800 | | | 7,514,680 |
| | | | | |
| | | | | 58,396,574 |
Internet Software & Services - 1.0% | | | | | |
EarthLink, Inc.(2) | | 2,279,700 | | | 19,377,450 |
| | | | | |
IT Services - 6.1% | | | | | |
CACI International Inc(2) | | 833,200 | | | 41,743,320 |
MAXIMUS, Inc. | | 730,300 | | | 26,904,252 |
SI International Inc.(1)(2) | | 834,500 | | | 25,076,725 |
SRA International, Inc., Class A(2) | | 972,100 | | | 21,998,623 |
| | | | | |
| | | | | 115,722,920 |
Semiconductors & Semiconductor Equipment - 7.6% | | | | | |
Actel Corporation(2) | | 997,600 | | | 12,450,048 |
ATMI, Inc.(2) | | 927,900 | | | 16,683,642 |
Cymer, Inc.(2) | | 817,600 | | | 20,709,808 |
DSP Group, Inc.(2) | | 647,600 | | | 4,954,140 |
Entegris, Inc.(2) | | 1,324,500 | | | 6,410,580 |
LTX-Credence Corp(2) | | 3,769,700 | | | 6,559,278 |
OmniVision Technologies, Inc.(2) | | 585,100 | | | 6,675,991 |
Rudolph Technologies, Inc.(1)(2) | | 1,771,000 | | | 14,840,980 |
Silicon Image, Inc.(2) | | 1,658,500 | | | 8,856,390 |
Standard Microsystems Corporation(2) | | 995,700 | | | 24,872,586 |
Ultra Clean Holdings, Inc.(1)(2) | | 1,327,900 | | | 6,692,616 |
Ultratech, Inc.(1)(2) | | 1,176,300 | | | 14,233,230 |
| | | | | |
| | | | | 143,939,289 |
Software - 7.8% | | | | | |
Fair Isaac Corporation | | 798,800 | | | 18,412,340 |
Jack Henry and Associates, Inc. | | 320,000 | | | 6,505,600 |
Lawson Software, Inc.(2) | | 4,230,500 | | | 29,613,500 |
Manhattan Associates, Inc.(1)(2) | | 1,244,700 | | | 27,806,598 |
MicroStrategy Incorporated, Class A(1)(2) | | 462,000 | | | 27,502,860 |
SPSS Inc.(2) | | 375,600 | | | 11,027,616 |
TIBCO Software Inc.(2) | | 2,142,600 | | | 15,683,832 |
Tyler Technologies, Inc.(2) | | 782,500 | | | 11,870,525 |
| | | | | |
| | | | | 148,422,871 |
45
| | | | | | | |
| | | Shares
Held | | Value | |
| | | | | | | |
| MATERIALS - 2.3% | | | | | | | |
Chemicals - 2.3% | | | | | | | |
H.B. Fuller Company | | | 1,127,600 | | $ | 23,533,012 | |
Sensient Technologies Corporation | | | 714,200 | | | 20,090,446 | |
| | | | | | | |
| | | | | | 43,623,458 | |
| UTILITIES - 3.2% | | | | | | | |
Electrical Utilities - 3.2% | | | | | | | |
ALLETE, Inc. | | | 613,300 | | | 27,291,850 | |
El Paso Electric Company(2) | | | 920,600 | | | 19,332,600 | |
UIL Holdings Corporation | | | 430,700 | | | 14,785,931 | |
| | | | | | | |
| | | | | | 61,410,381 | |
| | | | | | | |
Total common stocks
(Cost $1,910,306,019) | | | | | | 1,784,877,055 | |
| | |
| | | Par
Amount | | | |
| SHORT-TERM INVESTMENTS (CASH EQUIVALENTS) - 7.9% | | | | |
Repurchase agreement with Fixed Income Clearing Corporation, 0.05%, dated 9/30/08, due 10/1/08, maturity value $149,649,208(6)
(Cost $149,649,000) | | $ | 149,649,000 | | | 149,649,000 | |
| | | | | | | |
| | | | | | | |
Total investments - 101.7%
(Cost $2,059,955,019) | | | | | | 1,934,526,055 | |
| | | | | | | |
Other assets less liabilities - (1.7%) | | | (32,446,063 | ) |
| | | | | | | |
| | | | | | | |
Total net assets - 100.0%(7) | | | | | $ | 1,902,079,992 | |
| | | | | | | |
(1) | Affiliated company as defined by the Investment Company Act of 1940. See Note (6) in Notes to Financial Statements. |
(2) | Non-income producing security. |
(4) | Represents less than 0.1% of total net assets. |
(5) | The Fund considers the company to be from Israel. See the Fund’s Statement of Additional Information for information on how a country is assigned. The security trades in U.S. dollars. |
| | | | | | | | |
Issuer | | Rate | | | Maturity | | Value |
U.S. Treasury Bond | | 8.875 | % | | 2/15/2019 | | $ | 83,229,188 |
U.S. Treasury Bond | | 2.625 | | | 5/31/2010 | | | 69,417,525 |
| | | | | | | | |
| | | | | | | | 152,646,713 |
| | | | | | | | |
(7) | Percentages for the various classifications relate to total net assets. |
Company names are as reported by a data service provider and in some cases are translations; a company’s legal name may be different.
| | | | | |
| TOP TEN HOLDINGS - September 30, 2008 | |
Company Name | | Country | | Percentage
of Total
Net Assets | |
Hilb Rogal & Hobbs Company | | United States | | 2.7 | % |
Stewart Information Services Corporation | | United States | | 2.3 | |
Acuity Brands, Inc. | | United States | | 2.2 | |
CACI International Inc | | United States | | 2.2 | |
Arkansas Best Corporation | | United States | | 2.1 | |
Sanderson Farms, Inc. | | United States | | 2.0 | |
Rent-A-Center, Inc. | | United States | | 1.9 | |
AMN Healthcare Services, Inc. | | United States | | 1.9 | |
Cross Country Healthcare, Inc. | | United States | | 1.8 | |
Ethan Allen Interiors Inc. | | United States | | 1.7 | |
| | | | | |
Total | | | | 20.8 | % |
| | | | | |
For the purpose of determining the Fund’s top ten holdings, securities of the same issuer are aggregated to determine the weight in the Fund.
The accompanying notes are an integral part of the financial statements.
46
[THIS PAGE INTENTIONALLY LEFT BLANK]
47
ARTISAN FUNDS, INC.
Statements of Assets and Liabilities – September 30, 2008
| | | | |
| | | GLOBAL VALUE | |
| ASSETS: | | | | |
Investments in securities, unaffiliated, at value | | $ | 9,185,494 | |
Investments in securities, affiliated, at value | | | - | |
Short-term investments (repurchase agreements), at value | | | 252,000 | |
| | | | |
Total investments | | | 9,437,494 | |
Cash | | | 995 | |
Foreign currency | | | 16 | |
Net unrealized gain on foreign currency forward contracts | | | 3,140 | |
Receivable from investments sold | | | 209,697 | |
Receivable from fund shares sold | | | 128,001 | |
Dividends and interest receivable | | | 20,992 | |
Receivable from Adviser | | | 151,862 | |
Other assets | | | - | |
| | | | |
Total assets | | | 9,952,197 | |
| |
| LIABILITIES: | | | | |
Net unrealized loss on foreign currency forward contracts | | | - | |
Payable for investments purchased | | | 113,569 | |
Payable for fund shares redeemed | | | 16,579 | |
Payable for operating expenses | | | 183,658 | |
Payable for withholding taxes | | | 300 | |
Payable for advisory fees | | | 72,595 | |
Payable for deferred directors’ compensation | | | - | |
| | | | |
Total liabilities | | | 386,701 | |
| | | | |
Total net assets | | $ | 9,565,496 | |
| | | | |
| NET ASSETS CONSIST OF: | | | | |
Fund shares issued and outstanding | | $ | 10,989,365 | |
Net unrealized depreciation on investments and foreign currency related transactions | | | (1,259,927 | ) |
Accumulated undistributed net investment income (loss) | | | 94,954 | |
Accumulated undistributed net realized gains (losses) on investments and foreign currency related transactions | | | (258,896 | ) |
| | | | |
| | $ | 9,565,496 | |
| | | | |
| SUPPLEMENTARY INFORMATION: | | | | |
Net assets | | | | |
Investor Shares | | $ | 9,565,496 | |
Institutional Shares | | | | |
Shares outstanding (Indefinite number of shares authorized, $0.01 par value) | | | | |
Investor Shares | | | 1,149,660 | |
Institutional Shares | | | | |
Net asset value, offering price and redemption price per share | | | | |
Investor Shares | | $ | 8.32 | |
Institutional Shares | | | | |
Cost of securities of unaffiliated issuers held | | $ | 10,697,004 | |
Cost of securities of affiliated issuers held | | $ | - | |
Cost of foreign currency | | $ | 12 | |
48
| | | | | | | | | | | | | | |
| INTERNATIONAL | | | INTERNATIONAL SMALL CAP | | | INTERNATIONAL VALUE | | | MID CAP | |
| | | | | | | | | | | | | | |
| $ | 11,076,840,740 | | | $ | 627,047,850 | | | $ | 1,088,031,292 | | | $ | 4,084,487,706 | |
| | 45,393,696 | | | | 19,013,051 | | | | 66,922,543 | | | | 68,378,997 | |
| | 609,594,000 | | | | 79,278,000 | | | | 68,665,000 | | | | 112,027,000 | |
| | | | | | | | | | | | | | | |
| | 11,731,828,436 | | | | 725,338,901 | | | | 1,223,618,835 | | | | 4,264,893,703 | |
| | 422 | | | | 660 | | | | 769 | | | | 729 | |
| | 569,748 | | | | 23 | | | | 30 | | | | - | |
| | 1,139,806 | | | | 22,223 | | | | - | | | | - | |
| | 113,728,503 | | | | 6,188,270 | | | | - | | | | 66,351,764 | |
| | 20,757,123 | | | | 897,173 | | | | 739,974 | | | | 4,020,994 | |
| | 47,005,349 | | | | 3,364,212 | | | | 4,749,523 | | | | 2,054,469 | |
| | - | | | | - | | | | - | | | | - | |
| | 159,434 | | | | 11,337 | | | | 14,694 | | | | 59,286 | |
| | | | | | | | | | | | | | | |
| | 11,915,188,821 | | | | 735,822,799 | | | | 1,229,123,825 | | | | 4,337,380,945 | |
| | | |
| | | | | | | | | | | | | | |
| | - | | | | - | | | | 426,794 | | | | - | |
| | 80,970,681 | | | | - | | | | 7,664,699 | | | | 56,783,911 | |
| | 19,603,246 | | | | 2,466,933 | | | | 4,552,231 | | | | 7,827,723 | |
| | 8,296,547 | | | | 698,389 | | | | 852,399 | | | | 3,200,188 | |
| | 2,428,533 | | | | 240,139 | | | | 89,666 | | | | - | |
| | - | | | | - | | | | - | | | | - | |
| | 159,434 | | | | 11,337 | | | | 14,694 | | | | 59,286 | |
| | | | | | | | | | | | | | | |
| | 111,458,441 | | | | 3,416,798 | | | | 13,600,483 | | | | 67,871,108 | |
| | | | | | | | | | | | | | | |
| $ | 11,803,730,380 | | | $ | 732,406,001 | | | $ | 1,215,523,342 | | | $ | 4,269,509,837 | |
| | | | | | | | | | | | | | | |
| | | | | | | | | | | | | | |
| $ | 12,651,200,812 | | | $ | 823,197,890 | | | $ | 1,332,433,919 | | | $ | 4,368,874,864 | |
| | (1,283,052,215 | ) | | | (105,778,576 | ) | | | (110,017,609 | ) | | | (123,624,003 | ) |
| | 109,355,577 | | | | 6,711,234 | | | | 5,072,824 | | | | (74,763 | ) |
| | 326,226,206 | | | | 8,275,453 | | | | (11,965,792 | ) | | | 24,333,739 | |
| | | | | | | | | | | | | | | |
| $ | 11,803,730,380 | | | $ | 732,406,001 | | | $ | 1,215,523,342 | | | $ | 4,269,509,837 | |
| | | | | | | | | | | | | | | |
| | | | | | | | | | | | | | |
| | | | | | | | | | | | | | |
| $ | 8,759,967,297 | | | $ | 732,406,001 | | | $ | 1,029,408,703 | | | $ | 3,732,293,539 | |
| $ | 3,043,763,083 | | | | | | | $ | 186,114,639 | | | $ | 537,216,298 | |
| | | | | | | | | | | | | | |
| | 430,699,781 | | | | 51,303,422 | | | | 48,550,327 | | | | 154,997,600 | |
| | 148,395,294 | | | | | | | | 8,771,373 | | | | 21,742,869 | |
| | | | | | | | | | | | | | |
| $ | 20.34 | | | $ | 14.28 | | | $ | 21.20 | | | $ | 24.08 | |
| $ | 20.51 | | | | | | | $ | 21.22 | | | $ | 24.71 | |
| $ | 12,903,018,920 | | | $ | 806,070,277 | | | $ | 1,266,619,196 | | | $ | 4,299,634,887 | |
| $ | 110,038,880 | | | $ | 25,003,860 | | | $ | 66,529,213 | | | $ | 88,882,819 | |
| $ | 569,631 | | | $ | 23 | | | $ | 31 | | | $ | - | |
The accompanying notes are an integral part of the financial statements.
49
ARTISAN FUNDS, INC.
Statements of Assets and Liabilities – September 30, 2008 (Continued)
| | | | |
| | | MID CAP VALUE | |
| ASSETS: | | | | |
Investments in securities, unaffiliated, at value | | $ | 2,704,819,553 | |
Investments in securities, affiliated, at value | | | 326,785,407 | |
Short-term investments (repurchase agreements), at value | | | 186,879,000 | |
| | | | |
Total investments | | | 3,218,483,960 | |
Cash | | | 381 | |
Net unrealized gain on foreign currency forward contracts | | | - | |
Receivable from investments sold | | | 3,459,095 | |
Receivable from fund shares sold | | | 20,450,339 | |
Dividends and interest receivable | | | 3,216,408 | |
Receivable from Adviser | | | - | |
Other assets | | | 31,415 | |
| | | | |
Total assets | | | 3,245,641,598 | |
| |
| LIABILITIES: | | | | |
Payable for investments purchased | | | 3,759,659 | |
Payable for fund shares redeemed | | | 8,470,558 | |
Payable for operating expenses | | | 1,917,915 | |
Payable for advisory fees | | | - | |
Payable for deferred directors’ compensation | | | 31,415 | |
| | | | |
Total liabilities | | | 14,179,547 | |
| | | | |
Total net assets | | $ | 3,231,462,051 | |
| | | | |
| NET ASSETS CONSIST OF: | | | | |
Fund shares issued and outstanding | | $ | 3,437,145,559 | |
Net unrealized depreciation on investments and foreign currency related transactions | | | (227,008,061 | ) |
Accumulated undistributed net investment income (loss) | | | 4,613,686 | |
Accumulated undistributed net realized gains (losses) on investments and foreign currency related transactions | | | 16,710,867 | |
| | | | |
| | $ | 3,231,462,051 | |
| | | | |
| SUPPLEMENTARY INFORMATION: | | | | |
Net assets | | | | |
Investor Shares | | $ | 3,231,462,051 | |
Shares outstanding (Indefinite number of shares authorized, $0.01 par value) | | | | |
Investor Shares | | | 189,990,021 | |
Net asset value, offering price and redemption price per share | | | | |
Investor Shares | | $ | 17.01 | |
Cost of securities of unaffiliated issuers held | | $ | 3,104,382,931 | |
Cost of securities of affiliated issuers held | | $ | 341,109,090 | |
50
| | | | | | | | | | | | | | |
| OPPORTUNISTIC GROWTH | | | OPPORTUNISTIC VALUE | | | SMALL CAP | | | SMALL CAP VALUE | |
| | | | | | | | | | | | | | |
| $ | 5,357,058 | | | $ | 220,606,116 | | | $ | 562,197,086 | | | $ | 1,306,281,260 | |
| | - | | | | - | | | | - | | | | 478,595,795 | |
| | 344,000 | | | | 8,489,000 | | | | 38,583,000 | | | | 149,649,000 | |
| | | | | | | | | | | | | | | |
| | 5,701,058 | | | | 229,095,116 | | | | 600,780,086 | | | | 1,934,526,055 | |
| | 626 | | | | 645 | | | | 167 | | | | 419 | |
| | 7 | | | | - | | | | - | | | | - | |
| | 163,249 | | | | 244,323 | | | | 10,835,637 | | | | 1,939,551 | |
| | 36,647 | | | | 1,122,888 | | | | 98,003 | | | | 4,884,801 | |
| | 822 | | | | 443,427 | | | | 152,676 | | | | 415,686 | |
| | 51,536 | | | | - | | | | - | | | | - | |
| | - | | | | 1,370 | | | | 12,046 | | | | 102,879 | |
| | | | | | | | | | | | | | | |
| | 5,953,945 | | | | 230,907,769 | | | | 611,878,615 | | | | 1,941,869,391 | |
| | | |
| | | | | | | | | | | | | | |
| | 235,278 | | | | - | | | | 21,743,855 | | | | 36,378,000 | |
| | - | | | | 443,140 | | | | 2,427,577 | | | | 2,207,424 | |
| | 52,195 | | | | 179,584 | | | | 568,332 | | | | 1,182,931 | |
| | 989 | | | | - | | | | - | | | | - | |
| | - | | | | 1,370 | | | | 12,046 | | | | 21,044 | |
| | | | | | | | | | | | | | | |
| | 288,462 | | | | 624,094 | | | | 24,751,810 | | | | 39,789,399 | |
| | | | | | | | | | | | | | | |
| $ | 5,665,483 | | | $ | 230,283,675 | | | $ | 587,126,805 | | | $ | 1,902,079,992 | |
| | | | | | | | | | | | | | | |
| | | | | | | | | | | | | | |
| $ | 6,063,957 | | | $ | 297,786,150 | | | $ | 715,632,223 | | | $ | 1,993,980,307 | |
| | (387,245 | ) | | | (33,620,768 | ) | | | (37,556,002 | ) | | | (125,428,964 | ) |
| | - | | | | 1,357,614 | | | | (15,052 | ) | | | (26,685 | ) |
| | (11,229 | ) | | | (35,239,321 | ) | | | (90,934,364 | ) | | | 33,555,334 | |
| | | | | | | | | | | | | | | |
| $ | 5,665,483 | | | $ | 230,283,675 | | | $ | 587,126,805 | | | $ | 1,902,079,992 | |
| | | | | | | | | | | | | | | |
| | | | | | | | | | | | | | |
| | | | | | | | | | | | | | |
| $ | 5,665,483 | | | $ | 230,283,675 | | | $ | 587,126,805 | | | $ | 1,902,079,992 | |
| | | | | | | | | | | | | | |
| | 607,693 | | | | 26,834,996 | | | | 44,718,737 | | | | 136,548,701 | |
| | | | | | | | | | | | | | |
| $ | 9.32 | | | $ | 8.58 | | | $ | 13.13 | | | $ | 13.93 | |
| $ | 6,088,314 | | | $ | 262,715,884 | | | $ | 638,336,088 | | | $ | 1,496,759,261 | |
| $ | - | | | $ | - | | | $ | - | | | $ | 563,195,758 | |
The accompanying notes are an integral part of the financial statements.
51
ARTISAN FUNDS, INC.
Statements of Operations – For the Year Ended September 30, 2008
| | | | |
| | | GLOBAL VALUE(1) | |
| INVESTMENT INCOME: | | | | |
Dividends, from unaffiliated issuers(2) | | $ | 191,353 | |
Dividends, from affiliated issuers(2) | | | 2,390 | |
Interest | | | 11,358 | |
Securities lending | | | - | |
| | | | |
Total investment income | | | 205,101 | |
| EXPENSES: | | | | |
Advisory fees | | | 72,595 | |
Transfer agent fees | | | | |
Investor Shares | | | 58,367 | |
Institutional Shares | | | | |
Shareholder communications | | | | |
Investor Shares | | | 11,249 | |
Institutional Shares | | | | |
Custodian fees | | | 15,000 | |
Accounting fees | | | 22,897 | |
Professional fees | | | 32,734 | |
Less insurance recoveries(3) | | | - | |
| | | | |
Net professional fees | | | 32,734 | |
Registration fees | | | | |
Investor Shares | | | 37,473 | |
Institutional Shares | | | | |
Directors’ fees | | | 4,500 | |
Other operating expenses | | | 1,438 | |
| | | | |
Total operating expenses | | | 256,253 | |
Less amounts waived or paid by the Adviser or the board of directors | | | (151,862 | ) |
| | | | |
Net expenses | | | 104,391 | |
| | | | |
Net investment income (loss) | | | 100,710 | |
| NET REALIZED AND UNREALIZED GAINS (LOSSES) ON INVESTMENTS: | | | | |
Net realized gain (loss) on: | | | | |
Investments(2) | | | (258,896 | ) |
Foreign currency related transactions | | | (5,756 | ) |
| | | | |
| | | (264,652 | ) |
Net increase (decrease) in unrealized appreciation or depreciation on: | | | | |
Investments | | | (1,259,510 | ) |
Foreign currency related transactions | | | (417 | ) |
| | | | |
| | | (1,259,927 | ) |
| | | | |
Net (loss) on investments and foreign currency related transactions | | | (1,524,579 | ) |
| | | | |
Net (decrease) in net assets resulting from operations | | $ | (1,423,869 | ) |
| | | | |
(1) | For the period from commencement of operations (December 10, 2007) through September 30, 2008. |
| | | | | | | | | | | | |
| | | Fund | | Net of foreign taxes
withheld on dividends,
unaffiliated issuers | | Net of foreign taxes
withheld on dividends,
affiliated issuers | | Including net realized
gain (loss) on investments
from affiliated issuers | |
| | Global Value | | $ | 12,740 | | $ | 180 | | $ | (5,104 | ) |
| | International | | | 42,466,408 | | | 129,739 | | | (74,860,419 | ) |
| | International Small Cap | | | 1,894,328 | | | 529,149 | | | (9,805,361 | ) |
| | International Value | | | 2,812,383 | | | 272,264 | | | 28,078,821 | |
| | Mid Cap | | | - | | | - | | | (65,165,460 | ) |
(3) | For the year ended September 30, 2008, International Fund incurred $980,022 in total professional fees. As described in Note (9) in Notes to Financial Statements, $357,858 in insurance recoveries were received relating to reimbursement of litigation defense costs, and were recorded as a reduction to professional fees during the year ended September 30, 2008. |
52
| | | | | | | | | | | | | | |
| INTERNATIONAL | | | INTERNATIONAL SMALL CAP | | | INTERNATIONAL VALUE | | | MID CAP | |
| | | | | | | | | | | | | | |
| $ | 388,797,017 | | | $ | 23,915,524 | | | $ | 38,424,853 | | | $ | 18,893,301 | |
| | 1,578,042 | | | | 2,304,249 | | | | 5,509,883 | | | | - | |
| | 9,427,233 | | | | 2,682,310 | | | | 2,778,113 | | | | 7,659,487 | |
| | 5,642,452 | | | | - | | | | - | | | | - | |
| | | | | | | | | | | | | | | |
| | 405,444,744 | | | | 28,902,083 | | | | 46,712,849 | | | | 26,552,788 | |
| | | | | | | | | | | | | | |
| | 150,037,798 | | | | 14,643,825 | | | | 14,645,235 | | | | 50,517,929 | |
| | | | | | | | | | | | | | |
| | 27,106,651 | | | | 1,990,774 | | | | 2,421,236 | | | | 12,828,644 | |
| | 32,716 | | | | | | | | 12,791 | | | | 18,684 | |
| | | | | | | | | | | | | | |
| | 1,520,619 | | | | 105,068 | | | | 333,979 | | | | 899,562 | |
| | 54,559 | | | | | | | | 9,927 | | | | 11,959 | |
| | 6,966,846 | | | | 617,824 | | | | 491,746 | | | | 114,884 | |
| | 76,134 | | | | 56,526 | | | | 71,788 | | | | 64,162 | |
| | 980,022 | | | | 92,799 | | | | 102,311 | | | | 205,017 | |
| | (357,858 | ) | | | - | | | | - | | | | - | |
| | | | | | | | | | | | | | | |
| | 622,164 | | | | 92,799 | | | | 102,311 | | | | 205,017 | |
| | | | | | | | | | | | | | |
| | 195,547 | | | | 53,339 | | | | 66,185 | | | | 69,665 | |
| | 34,307 | | | | | | | | 13,308 | | | | 15,486 | |
| | 481,741 | | | | 35,312 | | | | 44,948 | | | | 157,886 | |
| | 409,367 | | | | 117,329 | | | | 47,315 | | | | 145,703 | |
| | | | | | | | | | | | | | | |
| | 187,538,449 | | | | 17,712,796 | | | | 18,260,769 | | | | 65,049,581 | |
| | - | | | | - | | | | - | | | | - | |
| | | | | | | | | | | | | | | |
| | 187,538,449 | | | | 17,712,796 | | | | 18,260,769 | | | | 65,049,581 | |
| | | | | | | | | | | | | | | |
| | 217,906,295 | | | | 11,189,287 | | | | 28,452,080 | | | | (38,496,793 | ) |
| | | | | | | | | | | | | | |
| | | | | | | | | | | | | | |
| | 660,360,491 | | | | 44,166,209 | | | | 4,267,300 | | | | 258,568,758 | |
| | (5,330,672 | ) | | | (297,054 | ) | | | (125,520 | ) | | | 638 | |
| | | | | | | | | | | | | | | |
| | 655,029,819 | | | | 43,869,155 | | | | 4,141,780 | | | | 258,569,396 | |
| | | | | | | | | | | | | | |
| | (6,035,684,040 | ) | | | (553,734,650 | ) | | | (339,642,758 | ) | | | (1,548,010,123 | ) |
| | (1,742,370 | ) | | | 103,035 | | | | (559,100 | ) | | | (227 | ) |
| | | | | | | | | | | | | | | |
| | (6,037,426,410 | ) | | | (553,631,615 | ) | | | (340,201,858 | ) | | | (1,548,010,350 | ) |
| | | | | | | | | | | | | | | |
| | (5,382,396,591 | ) | | | (509,762,460 | ) | | | (336,060,078 | ) | | | (1,289,440,954 | ) |
| | | | | | | | | | | | | | | |
| $ | (5,164,490,296 | ) | | $ | (498,573,173 | ) | | $ | (307,607,998 | ) | | $ | (1,327,937,747 | ) |
| | | | | | | | | | | | | | | |
The accompanying notes are an integral part of the financial statements.
53
ARTISAN FUNDS, INC.
Statements of Operations – For the Year Ended September 30, 2008 (Continued)
| | | | |
| | | MID CAP VALUE | |
| INVESTMENT INCOME: | | | | |
Dividends, from unaffiliated issuers(2) | | $ | 36,510,025 | |
Dividends, from affiliated issuers(2) | | | 2,021,870 | |
Interest | | | 5,257,252 | |
| | | | |
Total investment income | | | 43,789,147 | |
| |
| EXPENSES: | | | | |
Advisory fees | | | 29,770,304 | |
Transfer agent fees | | | | |
Investor Shares | | | 7,119,746 | |
Shareholder communications | | | | |
Investor Shares | | | 664,964 | |
Custodian fees | | | 64,893 | |
Accounting fees | | | 42,259 | |
Professional fees | | | 126,237 | |
Registration fees | | | | |
Investor Shares | | | 108,364 | |
Directors’ fees | | | 89,932 | |
Other operating expenses | | | 79,824 | |
| | | | |
Total operating expenses | | | 38,065,563 | |
Less amounts waived or paid by the Adviser or the board of directors | | | - | |
| | | | |
Net expenses | | | 38,065,563 | |
| | | | |
Net investment income (loss) | | | 5,723,584 | |
| |
| NET REALIZED AND UNREALIZED GAINS (LOSSES) ON INVESTMENTS: | | | | |
Net realized gain (loss) on: | | | | |
Investments(2) | | | 100,480,649 | |
Foreign currency related transactions | | | - | |
| | | | |
| | | 100,480,649 | |
Net increase (decrease) in unrealized appreciation or depreciation on: | | | | |
Investments | | | (515,679,265 | ) |
Foreign currency related transactions | | | - | |
| | | | |
| | | (515,679,265 | ) |
| | | | |
Net (loss) on investments and foreign currency related transactions | | | (415,198,616 | ) |
| | | | |
Net (decrease) in net assets resulting from operations | | $ | (409,475,032 | ) |
| | | | |
(1) | For the period from commencement of operations (September 22, 2008) through September 30, 2008. |
| | | | | | | | | | | | |
| | | Fund | | Net of foreign taxes
withheld on dividends,
unaffiliated issuers | | Net of foreign taxes
withheld on dividends,
affiliated issuers | | Including net realized
(loss) on investments
from affiliated issuers | |
| | Mid Cap Value | | $ | - | | $ | - | | $ | (39,739,045 | ) |
| | Opportunistic Growth | | | - | | | - | | | - | |
| | Opportunistic Value | | | 174,254 | | | - | | | (2,349,531 | ) |
| | Small Cap | | | 8,316 | | | - | | | (6,934,140 | ) |
| | Small Cap Value | | | - | | | - | | | (77,631,132 | ) |
54
| | | | | | | | | | | | | | |
| OPPORTUNISTIC GROWTH(1) | | | OPPORTUNISTIC VALUE | | | SMALL CAP | | | SMALL CAP VALUE | |
| | | | | | | | | | | | | | |
| $ | 822 | | | $ | 4,429,368 | | | $ | 4,406,192 | | | $ | 13,139,917 | |
| | - | | | | - | | | | - | | | | 4,328,139 | |
| | 72 | | | | 497,837 | | | | 1,122,864 | | | | 2,101,767 | |
| | | | | | | | | | | | | | | |
| | 894 | | | | 4,927,205 | | | | 5,529,056 | | | | 19,569,823 | |
| | | |
| | | | | | | | | | | | | | |
| | 989 | | | | 2,216,480 | | | | 8,548,972 | | | | 17,919,694 | |
| | | | | | | | | | | | | | |
| | 3,124 | | | | 585,093 | | | | 1,572,663 | | | | 3,993,847 | |
| | | | | | | | | | | | | | |
| | 1,925 | | | | 50,381 | | | | 215,935 | | | | 314,143 | |
| | 152 | | | | 13,641 | | | | 32,641 | | | | 49,692 | |
| | 2,947 | | | | 41,789 | | | | 43,881 | | | | 46,373 | |
| | 16,540 | | | | 39,367 | | | | 66,113 | | | | 91,066 | |
| | | | | | | | | | | | | | |
| | 26,837 | | | | 54,500 | | | | 40,641 | | | | 62,776 | |
| | - | | | | 7,127 | | | | 26,154 | | | | 53,900 | |
| | 670 | | | | 11,597 | | | | 30,333 | | | | 51,147 | |
| | | | | | | | | | | | | | | |
| | 53,184 | | | | 3,019,975 | | | | 10,577,333 | | | | 22,582,638 | |
| | (51,536 | ) | | | - | | | | - | | | | - | |
| | | | | | | | | | | | | | | |
| | 1,648 | | | | 3,019,975 | | | | 10,577,333 | | | | 22,582,638 | |
| | | | | | | | | | | | | | | |
| | (754 | ) | | | 1,907,230 | | | | (5,048,277 | ) | | | (3,012,815 | ) |
| | | |
| | | | | | | | | | | | | | |
| | | | | | | | | | | | | | |
| | (11,229 | ) | | | (28,949,448 | ) | | | (68,978,644 | ) | | | 82,299,823 | |
| | 244 | | | | 19,392 | | | | - | | | | - | |
| | | | | | | | | | | | | | | |
| | (10,985 | ) | | | (28,930,056 | ) | | | (68,978,644 | ) | | | 82,299,823 | |
| | | | | | | | | | | | | | |
| | (387,256 | ) | | | (37,237,206 | ) | | | (195,897,458 | ) | | | (213,271,509 | ) |
| | 11 | | | | (11,067 | ) | | | - | | | | - | |
| | | | | | | | | | | | | | | |
| | (387,245 | ) | | | (37,248,273 | ) | | | (195,897,458 | ) | | | (213,271,509 | ) |
| | | | | | | | | | | | | | | |
| | (398,230 | ) | | | (66,178,329 | ) | | | (264,876,102 | ) | | | (130,971,686 | ) |
| | | | | | | | | | | | | | | |
| $ | (398,984 | ) | | $ | (64,271,099 | ) | | $ | (269,924,379 | ) | | $ | (133,984,501 | ) |
| | | | | | | | | | | | | | | |
The accompanying notes are an integral part of the financial statements.
55
ARTISAN FUNDS, INC.
Statements of Changes in Net Assets
| | | | |
| | | GLOBAL VALUE | |
| | | Period Ended
9/30/2008(1) | |
| OPERATIONS: | | | | |
Net investment income (loss) | | $ | 100,710 | |
Net realized gain (loss) on: | | | | |
Investments | | | (258,896 | ) |
Foreign currency related transactions | | | (5,756 | ) |
Net increase (decrease) in unrealized appreciation or depreciation on: | | | | |
Investments | | | (1,259,510 | ) |
Foreign currency related transactions | | | (417 | ) |
| | | | |
Net increase (decrease) in net assets resulting from operations | | | (1,423,869 | ) |
| |
| DISTRIBUTIONS PAID TO SHAREHOLDERS: | | | | |
Net investment income: | | | | |
Investor Shares | | | - | |
Institutional Shares | | | | |
Net realized gains on investment transactions: | | | | |
Investor Shares | | | - | |
Institutional Shares | | | | |
| | | | |
Total distributions paid to shareholders | | | - | |
| |
| FUND SHARE ACTIVITIES: | | | | |
Net increase (decrease) in net assets resulting from fund share activities | | | 10,989,365 | |
| | | | |
Total increase (decrease) in net assets | | | 9,565,496 | |
| | | | |
Net assets, beginning of period | | | - | |
| | | | |
Net assets, end of period | | $ | 9,565,496 | |
| | | | |
| |
Accumulated undistributed net investment income (loss) | | $ | 94,954 | |
| | | | |
(1) | For the period from commencement of operations (December 10, 2007) through September 30, 2008. |
56
| | | | | | | | | | | | | | | | | | | | | | | | | | | | | | |
| INTERNATIONAL | | | INTERNATIONAL SMALL CAP | | | INTERNATIONAL VALUE | | | MID CAP | |
Year Ended
9/30/2008 | | | Year Ended
9/30/2007 | | | Year Ended
9/30/2008 | | | Year Ended
9/30/2007 | | | Year Ended
9/30/2008 | | | Year Ended
9/30/2007 | | | Year Ended
9/30/2008 | | | Year Ended
9/30/2007 | |
| | | | | | | | | | | | | | | | | | | | | | | | | | | | | | |
| $ | 217,906,295 | | | $ | 170,443,080 | | | $ | 11,189,287 | | | $ | 5,151,532 | | | $ | 28,452,080 | | | $ | 25,017,010 | | | $ | (38,496,793 | ) | | $ | (38,619,173 | ) |
| | | | | | | | | | | | | | | | | | | | | | | | | | | | | | |
| | 660,360,491 | | | | 2,377,934,207 | | | | 44,166,209 | | | | 177,334,361 | | | | 4,267,300 | | | | 123,912,908 | | | | 258,568,758 | | | | 1,029,163,034 | |
| | (5,330,672 | ) | | | (2,590,790 | ) | | | (297,054 | ) | | | (358,707 | ) | | | (125,520 | ) | | | (479,568 | ) | | | 638 | | | | - | |
| | | | | | | | | | | | | | | | | | | | | | | | | | | | | | |
| | (6,035,684,040 | ) | | | 1,463,335,658 | | | | (553,734,650 | ) | | | 221,183,457 | | | | (339,642,758 | ) | | | 54,992,214 | | | | (1,548,010,123 | ) | | | 460,018,755 | |
| | (1,742,370 | ) | | | (11,135 | ) | | | 103,035 | | | | 662,223 | | | | (559,100 | ) | | | 90,080 | | | | (227 | ) | | | 227 | |
| | | | | | | | | | | | | | | | | | | | | | | | | | | | | | | |
| | (5,164,490,296 | ) | | | 4,009,111,020 | | | | (498,573,173 | ) | | | 403,972,866 | | | | (307,607,998 | ) | | | 203,532,644 | | | | (1,327,937,747 | ) | | | 1,450,562,843 | |
| | | | | | | |
| | | | | | | | | | | | | | | | | | | | | | | | | | | | | | |
| | | | | | | | | | | | | | | | | | | | | | | | | | | | | | |
| | (77,647,652 | ) | | | (149,579,440 | ) | | | (10,029,807 | ) | | | (29,082,285 | ) | | | (26,380,830 | ) | | | (24,384,272 | ) | | | - | | | | - | |
| | (38,324,885 | ) | | | (69,406,627 | ) | | | | | | | | | | | (4,772,229 | ) | | | (1,768,836 | ) | | | - | | | | - | |
| | | | | | | | | | | | | | | | | | | | | | | | | | | | | | |
| | (1,707,284,385 | ) | | | (800,807,381 | ) | | | (168,397,767 | ) | | | (156,285,811 | ) | | | (86,616,796 | ) | | | (70,469,856 | ) | | | (883,929,699 | ) | | | (480,601,368 | ) |
| | (637,085,303 | ) | | | (332,232,670 | ) | | | | | | | | | | | (13,775,532 | ) | | | (4,994,818 | ) | | | (121,786,964 | ) | | | (82,408,794 | ) |
| | | | | | | | | | | | | | | | | | | | | | | | | | | | | | | |
| | (2,460,342,225 | ) | | | (1,352,026,118 | ) | | | (178,427,574 | ) | | | (185,368,096 | ) | | | (131,545,387 | ) | | | (101,617,782 | ) | | | (1,005,716,663 | ) | | | (563,010,162 | ) |
| | | | | | | |
| | | | | | | | | | | | | | | | | | | | | | | | | | | | | | |
| | 1,569,193,725 | | | | 1,284,431,884 | | | | 53,398,186 | | | | 197,641,908 | | | | (158,902,687 | ) | | | 399,089,514 | | | | 498,434,390 | | | | (152,617,669 | ) |
| | | | | | | | | | | | | | | | | | | | | | | | | | | | | | | |
| | (6,055,638,796 | ) | | | (3,941,516,786 | ) | | | (623,602,561 | ) | | | 416,246,678 | | | | (598,056,072 | ) | | | 501,004,376 | | | | (1,835,220,020 | ) | | | 734,935,012 | |
| | | | | | | | | | | | | | | | | | | | | | | | | | | | | | | |
| | 17,859,369,176 | | | | 13,917,852,390 | | | | 1,356,008,562 | | | | 939,761,884 | | | | 1,813,579,414 | | | | 1,312,575,038 | | | | 6,104,729,857 | | | | 5,369,794,845 | |
| | | | | | | | | | | | | | | | | | | | | | | | | | | | | | | |
| $ | 11,803,730,380 | | | $ | 17,859,369,176 | | | $ | 732,406,001 | | | $ | 1,356,008,562 | | | $ | 1,215,523,342 | | | $ | 1,813,579,414 | | | $ | 4,269,509,837 | | | $ | 6,104,729,857 | |
| | | | | | | | | | | | | | | | | | | | | | | | | | | | | | | |
| | | | | | | |
| $ | 109,355,577 | | | $ | 10,487,437 | | | $ | 6,711,234 | | | $ | (3,599,767 | ) | | $ | 5,072,824 | | | $ | 8,775,647 | | | $ | (74,763 | ) | | $ | (47,262 | ) |
| | | | | | | | | | | | | | | | | | | | | | | | | | | | | | | |
The accompanying notes are an integral part of the financial statements.
57
ARTISAN FUNDS, INC.
Statements of Changes in Net Assets (Continued)
| | | | | | | | |
| | | MID CAP VALUE | |
| | | Year Ended
9/30/2008 | | | Year Ended
9/30/2007 | |
| OPERATIONS: | | | | | | | | |
Net investment income (loss) | | $ | 5,723,584 | | | $ | 13,008,457 | |
Net realized gain (loss) on: | | | | | | | | |
Investments | | | 100,480,649 | | | | 317,739,061 | |
Foreign currency related transactions | | | - | | | | - | |
Net increase (decrease) in unrealized appreciation or depreciation on: | | | | | | | | |
Investments | | | (515,679,265 | ) | | | 85,514,899 | |
Foreign currency related transactions | | | - | | | | - | |
| | | | | | | | |
Net increase (decrease) in net assets resulting from operations | | | (409,475,032 | ) | | | 416,262,417 | |
| | |
| DISTRIBUTIONS PAID TO SHAREHOLDERS: | | | | | | | | |
Net investment income: | | | | | | | | |
Investor Shares | | | (12,115,617 | ) | | | (7,420,350 | ) |
Net realized gains on investment transactions: | | | | | | | | |
Investor Shares | | | (350,592,517 | ) | | | (156,158,979 | ) |
| | | | | | | | |
Total distributions paid to shareholders | | | (362,708,134 | ) | | | (163,579,329 | ) |
| | |
| FUND SHARE ACTIVITIES: | | | | | | | | |
Net increase (decrease) in net assets resulting from fund share activities | | | 582,895,533 | | | | 524,744,904 | |
| | | | | | | | |
Total increase (decrease) in net assets | | | (189,287,633 | ) | | | 777,427,992 | |
| | | | | | | | |
Net assets, beginning of period | | | 3,420,749,684 | | | | 2,643,321,692 | |
| | | | | | | | |
Net assets, end of period | | $ | 3,231,462,051 | | | $ | 3,420,749,684 | |
| | | | | | | | |
| | |
Accumulated undistributed net investment income (loss) | | $ | 4,613,686 | | | $ | 12,084,630 | |
| | | | | | | | |
(1) | For the period from commencement of operations (September 22, 2008) through September 30, 2008. |
58
| | | | | | | | | | | | | | | | | | | | | | | | | | |
| OPPORTUNISTIC GROWTH | | | OPPORTUNISTIC VALUE | | | SMALL CAP | | | SMALL CAP VALUE | |
Period Ended
9/30/2008(1) | | | Year Ended
9/30/2008 | | | Year Ended
9/30/2007 | | | Year Ended
9/30/2008 | | | Year Ended
9/30/2007 | | | Year Ended
9/30/2008 | | | Year Ended
9/30/2007 | |
| | | | | | | | | | | | | | | | | | | | | | | | | | |
| $ | (754 | ) | | $ | 1,907,230 | | | $ | 2,939,253 | | | $ | (5,048,277 | ) | | $ | (8,568,183 | ) | | $ | (3,012,815 | ) | | $ | (770,350 | ) |
| | | | | | | | | | | | | | | | | | | | | | | | | | |
| | (11,229 | ) | | | (28,949,448 | ) | | | 13,870,866 | | | | (68,978,644 | ) | | | 109,659,733 | | | | 82,299,823 | | | | 343,307,580 | |
| | 244 | | | | 19,392 | | | | 11,094 | | | | - | | | | - | | | | - | | | | - | |
| | | | | | | | | | | | | | | | | | | | | | | | | | |
| | (387,256 | ) | | | (37,237,206 | ) | | | 1,188,389 | | | | (195,897,458 | ) | | | 79,718,569 | | | | (213,271,509 | ) | | | (189,772,843 | ) |
| | 11 | | | | (11,067 | ) | | | 11,587 | | | | - | | | | - | | | | - | | | | - | |
| | | | | | | | | | | | | | | | | | | | | | | | | | | |
| | (398,984 | ) | | | (64,271,099 | ) | | | 18,021,189 | | | | (269,924,379 | ) | | | 180,810,119 | | | | (133,984,501 | ) | | | 152,764,387 | |
| | | | | | |
| | | | | | | | | | | | | | | | | | | | | | | | | | |
| | | | | | | | | | | | | | | | | | | | | | | | | | |
| | - | | | | (2,875,226 | ) | | | (262,233 | ) | | | - | | | | - | | | | - | | | | - | |
| | | | | | | | | | | | | | | | | | | | | | | | | | |
| | - | | | | (18,663,452 | ) | | | (938,254 | ) | | | (103,275,284 | ) | | | (24,611,864 | ) | | | (339,487,445 | ) | | | (264,220,232 | ) |
| | | | | | | | | | | | | | | | | | | | | | | | | | | |
| | - | | | | (21,538,678 | ) | | | (1,200,487 | ) | | | (103,275,284 | ) | | | (24,611,864 | ) | | | (339,487,445 | ) | | | (264,220,232 | ) |
| | | | | | |
| | | | | | | | | | | | | | | | | | | | | | | | | | |
| | 6,064,467 | | | | 37,433,913 | | | | 186,882,742 | | | | (191,180,954 | ) | | | (268,510,179 | ) | | | 224,312,677 | | | | 223,212,983 | |
| | | | | | | | | | | | | | | | | | | | | | | | | | | |
| | 5,665,483 | | | | (48,375,864 | ) | | | 203,703,444 | | | | (564,380,617 | ) | | | (112,311,924 | ) | | | (249,159,269 | ) | | | 111,757,138 | |
| | | | | | | | | | | | | | | | | | | | | | | | | | | |
| | - | | | | 278,659,539 | | | | 74,956,095 | | | | 1,151,507,422 | | | | 1,263,819,346 | | | | 2,151,239,261 | | | | 2,039,482,123 | |
| | | | | | | | | | | | | | | | | | | | | | | | | | | |
| $ | 5,665,483 | | | $ | 230,283,675 | | | $ | 278,659,539 | | | $ | 587,126,805 | | | $ | 1,151,507,422 | | | $ | 1,902,079,992 | | | $ | 2,151,239,261 | |
| | | | | | | | | | | | | | | | | | | | | | | | | | | |
| | | | | | |
| $ | - | | | $ | 1,357,614 | | | $ | 2,666,773 | | | $ | (15,052 | ) | | $ | (10,497 | ) | | $ | (26,685 | ) | | $ | (17,297 | ) |
| | | | | | | | | | | | | | | | | | | | | | | | | | | |
The accompanying notes are an integral part of the financial statements.
59
ARTISAN FUNDS, INC.
Financial Highlights – For a share outstanding throughout each period
The financial highlights table is intended to help you understand the Funds’ financial performance for the past 5 years or, if shorter, the period of a Fund’s operations. Certain information reflects financial results for a single Fund share. The total returns in the table represent the rate that an investor would have earned or lost on an investment in the Fund (assuming reinvestment of all dividends and distributions). This information has been audited by Ernst & Young LLP, whose report, along with each Fund’s financial statements, are included in this annual report.
| | | | | | | | | | | | | | | | | | | | | | | |
Year or
Period
Ended | | |
Net Asset
Value
Beginning
of Period | | Net
Investment
Income(1) | | Net Realized
and Unrealized
Gain (Loss) on
Investments | | | Total Income
(Loss) from
Investment
Operations | | | Dividends
from Net
Investment
Income | | | Distributions
from Net
Realized
Gains | |
| | | | | | | | | | | | | | | | | | | | | | | |
| ARTISAN GLOBAL VALUE FUND | | | | | | | | | | | | | | | | | | | |
| Investor Shares | | | | | | | | | | | | | | | | | | | | | | | |
| 9/30/2008 | (5) | | $ | 10.00 | | $ | 0.10 | | $ | (1.78 | ) | | $ | (1.68 | ) | | $ | - | | | $ | - | |
| | | | | | | | | | | | | | | | | | | | | | | |
| ARTISAN INTERNATIONAL FUND | | | | | | | | | | | | | | | | | | | |
| Investor Shares | | | | | | | | | | | | | | | | | | | | | | | |
| 9/30/2008 | | | $ | 33.75 | | $ | 0.36 | | $ | (9.10 | ) | | $ | (8.74 | ) | | $ | (0.20 | ) | | $ | (4.47 | ) |
| 9/30/2007 | | | | 28.75 | | | 0.31 | | | 7.45 | | | | 7.76 | | | | (0.43 | ) | | | (2.33 | ) |
| 9/30/2006 | | | | 24.40 | | | 0.18 | | | 4.58 | | | | 4.76 | | | | (0.41 | ) | | | - | |
| 9/30/2005 | | | | 19.33 | | | 0.21 | | | 4.98 | | | | 5.19 | | | | (0.12 | ) | | | - | |
| 9/30/2004 | | | | 16.54 | | | 0.12 | | | 2.85 | | | | 2.97 | | | | (0.18 | ) | | | - | |
| Institutional Shares | | | | | | | | | | | | | | | | | | | | | | | |
| 9/30/2008 | | | $ | 33.99 | | $ | 0.42 | | $ | (9.16 | ) | | $ | (8.74 | ) | | $ | (0.27 | ) | | $ | (4.47 | ) |
| 9/30/2007 | | | | 28.92 | | | 0.37 | | | 7.52 | | | | 7.89 | | | | (0.49 | ) | | | (2.33 | ) |
| 9/30/2006 | | | | 24.54 | | | 0.22 | | | 4.62 | | | | 4.84 | | | | (0.46 | ) | | | - | |
| 9/30/2005 | | | | 19.44 | | | 0.25 | | | 5.01 | | | | 5.26 | | | | (0.16 | ) | | | - | |
| 9/30/2004 | | | | 16.63 | | | 0.16 | | | 2.86 | | | | 3.02 | | | | (0.21 | ) | | | - | |
| | | | | | | | | | | | | | | | | | | | | | | |
| ARTISAN INTERNATIONAL SMALL CAP FUND | | | | | | | | | | | | | | | | |
| Investor Shares | | | | | | | | | | | | | | | | | | | | | | | |
| 9/30/2008 | | | $ | 26.96 | | $ | 0.21 | | $ | (9.26 | ) | | $ | (9.05 | ) | | $ | (0.20 | ) | | $ | (3.43 | ) |
| 9/30/2007 | | | | 22.77 | | | 0.11 | | | 8.54 | | | | 8.65 | | | | (0.70 | ) | | | (3.76 | ) |
| 9/30/2006 | | | | 20.86 | | | 0.09 | | | 3.90 | | | | 3.99 | | | | (0.20 | ) | | | (1.88 | ) |
| 9/30/2005 | | | | 16.40 | | | 0.19 | | | 6.16 | | | | 6.35 | | | | (0.12 | ) | | | (1.77 | ) |
| 9/30/2004 | | | | 13.84 | | | 0.15 | | | 2.93 | | | | 3.08 | | | | (0.03 | ) | | | (0.49 | ) |
(1) | Computed based on average shares outstanding. |
(2) | Periods less than twelve months (where applicable) are not annualized. |
(3) | Periods less than twelve months (where applicable) are annualized. |
(4) | The ratios of expenses to average net assets and net investment income (loss) to average net assets exclude expenses waived or paid by the Adviser or the board of directors. Absent expenses waived or paid by the Adviser or the board of directors, the ratios of expenses to average net assets and net investment income (loss) to average net assets would have been as follows: |
| | | | | | | | |
| | | Year or
Period Ended | | Ratio of Expenses to
Average Net Assets | | | Ratio of Net Investment
(Loss) to Average Net Assets | |
Global Value Investor Shares | | 9/30/2008 | | 3.53 | % | | (0.70 | )% |
(5) | For the period from commencement of operations (December 10, 2007) through September 30, 2008. |
60
| | | | | | | | | | | | | | | | | | | | |
Total
Distributions | | | Net Asset
Value
End
of Period | | Total
Return(2) | | | Net Assets
End of
Period
(millions) | | Ratio of
Expenses
to Average
Net Assets(3)(4) | | | Ratio of Net
Investment
Income
to Average
Net Assets(3)(4) | | | Portfolio
Turnover
Rate(2) | |
| | | | | | | | | | | | | | | | | | | | |
| | | | | | | | | | | | | | | | | | | | | |
| | | | | | | | | | | | | | | | | | | | | |
| $ | - | | | $ | 8.32 | | (16.80 | )% | | $ | 9.6 | | 1.44 | % | | 1.39 | % | | 42.27 | % |
| | | | | | | | | | | | | | | | | | | | |
| | | | | | | | | | | | | | | | | | | | | |
| | | | | | | | | | | | | | | | | | | | | |
| $ | (4.67 | ) | | $ | 20.34 | | (29.99 | )% | | $ | 8,760.0 | | 1.22 | % | | 1.28 | % | | 54.42 | % |
| | (2.76 | ) | | | 33.75 | | 28.69 | | | | 12,810.0 | | 1.21 | | | 1.01 | | | 66.30 | |
| | (0.41 | ) | | | 28.75 | | 19.84 | | | | 9,801.9 | | 1.20 | | | 0.66 | | | 57.80 | |
| | (0.12 | ) | | | 24.40 | | 26.97 | | | | 7,686.9 | | 1.19 | | | 0.94 | | | 56.15 | |
| | (0.18 | ) | | | 19.33 | | 18.04 | | | | 6,130.2 | | 1.22 | | | 0.64 | | | 54.96 | |
| | | | | | | | | | | | | | | | | | | | | |
| $ | (4.74 | ) | | $ | 20.51 | | (29.83 | )% | | $ | 3,043.8 | | 0.98 | % | | 1.50 | % | | 54.42 | % |
| | (2.82 | ) | | | 33.99 | | 28.99 | | | | 5,049.3 | | 0.98 | | | 1.22 | | | 66.30 | |
| | (0.46 | ) | | | 28.92 | | 20.07 | | | | 4,116.0 | | 1.00 | | | 0.82 | | | 57.80 | |
| | (0.16 | ) | | | 24.54 | | 27.21 | | | | 3,988.1 | | 0.99 | | | 1.11 | | | 56.15 | |
| | (0.21 | ) | | | 19.44 | | 18.31 | | | | 3,622.1 | | 1.01 | | | 0.85 | | | 54.96 | |
| | | | | | | | | | | | | | | | | | | | |
| | | | | | | | | | | | | | | | | | | | | |
| | | | | | | | | | | | | | | | | | | | | |
| $ | (3.63 | ) | | $ | 14.28 | | (38.44 | )% | | $ | 732.4 | | 1.51 | % | | 0.96 | % | | 42.80 | % |
| | (4.46 | ) | | | 26.96 | | 43.10 | | | | 1,356.0 | | 1.52 | | | 0.45 | | | 49.85 | |
| | (2.08 | ) | | | 22.77 | | 21.63 | | | | 939.8 | | 1.53 | | | 0.41 | | | 62.21 | |
| | (1.89 | ) | | | 20.86 | | 42.13 | | | | 781.1 | | 1.53 | | | 1.03 | | | 57.25 | |
| | (0.52 | ) | | | 16.40 | | 22.66 | | | | 515.0 | | 1.57 | | | 0.95 | | | 81.03 | |
The accompanying notes are an integral part of the financial statements.
61
ARTISAN FUNDS, INC.
Financial Highlights – For a share outstanding throughout each period (Continued)
| | | | | | | | | | | | | | | | | | | | | | | |
Year or
Period
Ended | |
Net Asset
Value
Beginning
of Period | | Net
Investment
Income
(Loss)(1) | | | Net Realized
and Unrealized
Gain (Loss) on
Investments | | | Total Income
(Loss) from
Investment
Operations | | | Dividends
from Net
Investment
Income | | | Distributions
from Net
Realized Gains | |
| | | | | | | | | | | | | | | | | | | | | | | |
| ARTISAN INTERNATIONAL VALUE FUND | | | | | | | | | | | | | | | | | | | | |
| Investor Shares | | | | | | | | | | | | | | | | | | | | | | | |
| 9/30/2008 | | $ | 28.49 | | $ | 0.45 | | | $ | (5.56 | ) | | $ | (5.11 | ) | | $ | (0.51 | ) | | $ | (1.67 | ) |
| 9/30/2007 | | | 26.71 | | | 0.38 | | | | 3.12 | | | | 3.50 | | | | (0.44 | ) | | | (1.28 | ) |
| 9/30/2006 | | | 22.38 | | | 0.53 | | | | 4.87 | | | | 5.40 | | | | (0.47 | ) | | | (0.60 | ) |
| 9/30/2005 | | | 18.54 | | | 0.28 | | | | 3.88 | | | | 4.16 | | | | (0.11 | ) | | | (0.21 | ) |
| 9/30/2004 | | | 14.32 | | | 0.28 | | | | 4.33 | | | | 4.61 | | | | (0.09 | ) | | | (0.30 | ) |
| Institutional Shares | | | | | | | | | | | | | | | | | | | | | | | |
| 9/30/2008 | | $ | 28.53 | | $ | 0.52 | | | $ | (5.58 | ) | | $ | (5.06 | ) | | $ | (0.58 | ) | | $ | (1.67 | ) |
| 9/30/2007 | | | 26.71 | | | 0.41 | | | | 3.14 | | | | 3.55 | | | | (0.45 | ) | | | (1.28 | ) |
| | | | | | | | | | | | | | | | | | | | | | | |
| ARTISAN MID CAP FUND | | | | | | | | | | | | | | | | | | | | |
| Investor Shares | | | | | | | | | | | | | | | | | | | | | | | |
| 9/30/2008 | | $ | 37.06 | | $ | (0.22 | ) | | $ | (6.86 | ) | | $ | (7.08 | ) | | $ | - | | | $ | (5.90 | ) |
| 9/30/2007 | | | 31.77 | | | (0.24 | ) | | | 9.00 | | | | 8.76 | | | | - | | | | (3.47 | ) |
| 9/30/2006 | | | 30.84 | | | (0.17 | ) | | | 2.43 | | | | 2.26 | | | | - | | | | (1.33 | ) |
| 9/30/2005 | | | 26.13 | | | (0.18 | ) | | | 4.89 | | | | 4.71 | | | | - | | | | - | |
| 9/30/2004 | | | 23.11 | | | (0.20 | ) | | | 3.22 | | | | 3.02 | | | | - | | | | - | |
| Institutional Shares | | | | | | | | | | | | | | | | | | | | | | | |
| 9/30/2008 | | $ | 37.78 | | $ | (0.14 | ) | | $ | (7.03 | ) | | $ | (7.17 | ) | | $ | - | | | $ | (5.90 | ) |
| 9/30/2007 | | | 32.24 | | | (0.16 | ) | | | 9.17 | | | | 9.01 | | | | - | | | | (3.47 | ) |
| 9/30/2006 | | | 31.21 | | | (0.10 | ) | | | 2.46 | | | | 2.36 | | | | - | | | | (1.33 | ) |
| 9/30/2005 | | | 26.38 | | | (0.12 | ) | | | 4.95 | | | | 4.83 | | | | - | | | | - | |
| 9/30/2004 | | | 23.28 | | | (0.14 | ) | | | 3.24 | | | | 3.10 | | | | - | | | | - | |
| | | | | | | | | | | | | | | | | | | | | | | |
| ARTISAN MID CAP VALUE FUND | | | | | | | | | | | | | | | | | | | | |
| Investor Shares | | | | | | | | | | | | | | | | | | | | | | | |
| 9/30/2008 | | $ | 21.70 | | $ | 0.03 | | | $ | (2.31 | ) | | $ | (2.28 | ) | | $ | (0.08 | ) | | $ | (2.33 | ) |
| 9/30/2007 | | | 19.87 | | | 0.09 | | | | 2.98 | | | | 3.07 | | | | (0.06 | ) | | | (1.18 | ) |
| 9/30/2006 | | | 19.60 | | | 0.06 | | | | 1.04 | | | | 1.10 | | | | (0.01 | ) | | | (0.82 | ) |
| 9/30/2005 | | | 15.55 | | | (0.01 | ) | | | 4.36 | | | | 4.35 | | | | - | (4) | | | (0.30 | ) |
| 9/30/2004 | | | 12.22 | | | 0.10 | | | | 3.47 | | | | 3.57 | | | | - | | | | (0.24 | ) |
(1) | Computed based on average shares outstanding. |
(2) | Periods less than twelve months (where applicable) are not annualized. |
(3) | Periods less than twelve months (where applicable) are annualized. |
(4) | Amount is between $0.005 and $(0.005) per share. |
62
| | | | | | | | | | | | | | | | | | | | |
Total
Distributions | | | Net Asset
Value
End
of Period | | Total
Return(2) | | | Net Assets
End of
Period
(millions) | | Ratio of
Expenses
to Average
Net Assets(3) | | | Ratio of Net
Investment
Income (Loss)
to Average
Net Assets(3) | | | Portfolio
Turnover
Rate(2) | |
| | | | | | | | | | | | | | | | | | | | |
| | | | | | | | | | | | | | | | | | | | | |
| | | | | | | | | | | | | | | | | | | | | |
| $ | (2.18 | ) | | $ | 21.20 | | (19.10 | )% | | $ | 1,029.4 | | 1.23 | % | | 1.83 | % | | 44.72 | % |
| | (1.72 | ) | | | 28.49 | | 13.28 | | | | 1,594.7 | | 1.23 | | | 1.34 | | | 45.60 | |
| | (1.07 | ) | | | 26.71 | | 25.38 | | | | 1,312.6 | | 1.25 | | | 2.18 | | | 42.52 | |
| | (0.32 | ) | | | 22.38 | | 22.71 | | | | 601.2 | | 1.31 | | | 1.33 | | | 53.15 | |
| | (0.39 | ) | | | 18.54 | | 32.81 | | | | 217.5 | | 1.56 | | | 1.61 | | | 14.66 | |
| | | | | | | | | | | | | | | | | | | | | |
| $ | (2.25 | ) | | $ | 21.22 | | (18.92 | )% | | $ | 186.1 | | 1.03 | % | | 2.10 | % | | 44.72 | % |
| | (1.73 | ) | | | 28.53 | | 13.48 | | | | 218.9 | | 1.06 | | | 1.47 | | | 45.60 | |
| | | | | | | | | | | | | | | | | | | | |
| | | | | | | | | | | | | | | | | | | | | |
| | | | | | | | | | | | | | | | | | | | | |
| $ | (5.90 | ) | | $ | 24.08 | | (22.47 | )% | | $ | 3,732.3 | | 1.24 | % | | (0.75 | )% | | 79.76 | % |
| | (3.47 | ) | | | 37.06 | | 29.83 | | | | 5,319.3 | | 1.22 | | | (0.73 | ) | | 71.04 | |
| | (1.33 | ) | | | 31.77 | | 7.42 | | | | 4,571.9 | | 1.18 | | | (0.55 | ) | | 73.59 | |
| | - | | | | 30.84 | | 18.06 | | | | 4,874.0 | | 1.18 | | | (0.63 | ) | | 83.00 | |
| | - | | | | 26.13 | | 13.02 | | | | 4,042.7 | | 1.19 | | | (0.77 | ) | | 101.09 | |
| | | | | | | | | | | | | | | | | | | | | |
| $ | (5.90 | ) | | $ | 24.71 | | (22.23 | )% | | $ | 537.2 | | 0.95 | % | | (0.46 | )% | | 79.76 | % |
| | (3.47 | ) | | | 37.78 | | 30.17 | | | | 785.4 | | 0.95 | | | (0.47 | ) | | 71.04 | |
| | (1.33 | ) | | | 32.24 | | 7.66 | | | | 797.9 | | 0.95 | | | (0.31 | ) | | 73.59 | |
| | - | | | | 31.21 | | 18.35 | | | | 981.3 | | 0.95 | | | (0.40 | ) | | 83.00 | |
| | - | | | | 26.38 | | 13.27 | | | | 1,036.0 | | 0.96 | | | (0.54 | ) | | 101.09 | |
| | | | | | | | | | | | | | | | | | | | |
| | | | | | | | | | | | | | | | | | | | | |
| | | | | | | | | | | | | | | | | | | | | |
| $ | (2.41 | ) | | $ | 17.01 | | (11.16 | )% | | $ | 3,231.5 | | 1.21 | % | | 0.18 | % | | 69.77 | % |
| | (1.24 | ) | | | 21.70 | | 15.88 | | | | 3,420.7 | | 1.20 | | | 0.41 | | | 53.62 | |
| | (0.83 | ) | | | 19.87 | | 5.87 | | | | 2,643.3 | | 1.20 | | | 0.33 | | | 47.73 | |
| | (0.30 | ) | | | 19.60 | | 28.42 | | | | 2,771.2 | | 1.22 | | | (0.04 | ) | | 51.60 | |
| | (0.24 | ) | | | 15.55 | | 29.60 | | | | 312.3 | | 1.39 | | | 0.73 | | | 53.79 | |
63
ARTISAN FUNDS, INC.
Financial Highlights – For a share outstanding throughout each period (Continued)
| | | | | | | | | | | | | | | | | | | | | | | | |
| | | | | | |
Year or
Period
Ended | | | Net Asset
Value
Beginning
of Period | | Net
Investment
Income
(Loss)(1) | | | Net Realized
and Unrealized
Gain (Loss) on
Investments | | | Total Income
(Loss) from
Investment
Operations | | | Dividends
from Net
Investment
Income | | | Distributions
from Net
Realized
Gains | |
| | | | | | | | | | | | | | | | | | | | | | | | |
| ARTISAN OPPORTUNISTIC GROWTH FUND | | | | | | | | | | | | | | | | | |
| Investor Shares | | | | | | | | | | | | | | | | | | | | | | | | |
| 9/30/2008 | (5) | | $ | 10.00 | | $ | - | (6) | | $ | (0.68 | ) | | $ | (0.68 | ) | | $ | - | | | $ | - | |
| | | | | | | | | | | | | | | | | | | | | | | | |
| ARTISAN OPPORTUNISTIC VALUE FUND | | | | | | | | | | | | | | | | | |
| Investor Shares | | | | | | | | | | | | | | | | | | | | | | | | |
| 9/30/2008 | | | $ | 12.22 | | $ | 0.08 | | | $ | (2.70 | ) | | $ | (2.62 | ) | | $ | (0.14 | ) | | $ | (0.88 | ) |
| 9/30/2007 | | | | 10.41 | | | 0.20 | | | | 1.73 | | | | 1.93 | | | | (0.03 | ) | | | (0.09 | ) |
| 9/30/2006 | (7) | | | 10.00 | | | 0.03 | | | | 0.38 | | | | 0.41 | | | | - | | | | - | |
| | | | | | | | | | | | | | | | | | | | | | | | |
| ARTISAN SMALL CAP FUND | | | | | | | | | | | | | | | | | | | | |
| Investor Shares | | | | | | | | | | | | | | | | | | | | | | | | |
| 9/30/2008 | | | $ | 19.89 | | $ | (0.09 | ) | | $ | (4.82 | ) | | $ | (4.91 | ) | | $ | - | | | $ | (1.85 | ) |
| 9/30/2007 | | | | 17.51 | | | (0.13 | ) | | | 2.87 | | | | 2.74 | | | | - | | | | (0.36 | ) |
| 9/30/2006 | | | | 17.95 | | | (0.13 | ) | | | 0.26 | | | | 0.13 | | | | - | | | | (0.57 | ) |
| 9/30/2005 | | | | 15.12 | | | (0.13 | ) | | | 3.49 | | | | 3.36 | | | | - | | | | (0.53 | ) |
| 9/30/2004 | | | | 12.53 | | | (0.14 | ) | | | 2.73 | | | | 2.59 | | | | - | | | | - | |
| | | | | | | | | | | | | | | | | | | | | | | | |
| ARTISAN SMALL CAP VALUE FUND | | | | | | | | | | | | | | | | | | | | |
| Investor Shares | | | | | | | | | | | | | | | | | | | | | | | | |
| 9/30/2008 | | | $ | 18.13 | | $ | (0.02 | ) | | $ | (1.09 | ) | | $ | (1.11 | ) | | $ | - | | | $ | (3.09 | ) |
| 9/30/2007 | | | | 19.17 | | | (0.01 | ) | | | 1.44 | | | | 1.43 | | | | - | | | | (2.47 | ) |
| 9/30/2006 | | | | 19.51 | | | (0.02 | ) | | | 2.00 | | | | 1.98 | | | | - | | | | (2.32 | ) |
| 9/30/2005 | | | | 17.63 | | | (0.03 | ) | | | 3.69 | | | | 3.66 | | | | - | | | | (1.78 | ) |
| 9/30/2004 | | | | 13.67 | | | (0.03 | ) | | | 4.19 | | | | 4.16 | | | | - | | | | (0.20 | ) |
(1) | Computed based on average shares outstanding. |
(2) | Periods less than twelve months (where applicable) are not annualized. |
(3) | Periods less than twelve months (where applicable) are annualized. |
(4) | The ratios of expenses to average net assets and net investment income (loss) to average net assets exclude expenses waived or paid by the Adviser or the board of directors. Absent expenses waived or paid by the Adviser or the board of directors, the ratios of expenses to average net assets and net investment income (loss) to average net assets would have been as follows: |
| | | | | | | | |
| | | Year or
Period Ended | | Ratio of Expenses to
Average Net Assets | | | Ratio of Net Investment Income
(Loss) to Average Net Assets | |
Opportunistic Growth Investor Shares | | 9/30/2008 | | 48.41 | % | | (47.60 | )% |
Opportunistic Value Investor Shares | | 9/30/2006 | | 1.64 | % | | 0.39 | % |
(5) | For the period from commencement of operations (September 22, 2008) through September 30, 2008. |
(6) | Amount is between $0.005 and $(0.005) per share. |
(7) | For the period from commencement of operations (March 27, 2006) through September 30, 2006. |
64
| | | | | | | | | | | | | | | | | | | | |
Total
Distributions | | | Net Asset
Value
End
of Period | | Total
Return(2) | | | Net Assets
End of
Period
(millions) | | Ratio of
Expenses
to Average
Net Assets(3)(4) | | | Ratio of Net
Investment
Income (Loss)
to Average
Net Assets(3)(4) | | | Portfolio
Turnover
Rate(2) | |
| | | | | | | | | | | | | | | | | | | | |
| | | | | | | | | | | | | | | | | | | | | |
| | | | | | | | | | | | | | | | | | | | | |
| $ | - | | | $ | 9.32 | | (6.80 | )% | | $ | 5.7 | | 1.50 | % | | (0.69 | )% | | 3.05 | % |
| | | | | | | | | | | | | | | | | | | | |
| | | | | | | | | | | | | | | | | | | | | |
| | | | | | | | | | | | | | | | | | | | | |
| $ | (1.02 | ) | | $ | 8.58 | | (22.88 | )% | | $ | 230.3 | | 1.23 | % | | 0.77 | % | | 99.24 | % |
| | (0.12 | ) | | | 12.22 | | 18.65 | | | | 278.7 | | 1.24 | | | 1.71 | | | 50.79 | |
| | - | | | | 10.41 | | 4.10 | | | | 75.0 | | 1.49 | | | 0.55 | | | 34.07 | |
| | | | | | | | | | | | | | | | | | | | |
| | | | | | | | | | | | | | | | | | | | | |
| | | | | | | | | | | | | | | | | | | | | |
| $ | (1.85 | ) | | $ | 13.13 | | (26.64 | )% | | $ | 587.1 | | 1.22 | % | | (0.58 | )% | | 96.90 | % |
| | (0.36 | ) | | | 19.89 | | 15.84 | | | | 1,151.5 | | 1.18 | | | (0.70 | ) | | 74.32 | |
| | (0.57 | ) | | | 17.51 | | 0.74 | | | | 1,263.8 | | 1.15 | | | (0.70 | ) | | 101.98 | |
| | (0.53 | ) | | | 17.95 | | 22.64 | | | | 1,103.3 | | 1.18 | | | (0.80 | ) | | 78.60 | |
| | - | | | | 15.12 | | 20.67 | | | | 239.6 | | 1.27 | | | (0.95 | ) | | 119.40 | |
| | | | | | | | | | | | | | | | | | | | |
| | | | | | | | | | | | | | | | | | | | | |
| | | | | | | | | | | | | | | | | | | | | |
| $ | (3.09 | ) | | $ | 13.93 | | (5.77 | )% | | $ | 1,902.1 | | 1.20 | % | | (0.16 | )% | | 75.49 | % |
| | (2.47 | ) | | | 18.13 | | 7.48 | | | | 2,151.2 | | 1.19 | | | (0.03 | ) | | 72.38 | |
| | (2.32 | ) | | | 19.17 | | 11.40 | | | | 2,039.5 | | 1.17 | | | (0.09 | ) | | 58.88 | |
| | (1.78 | ) | | | 19.51 | | 22.42 | | | | 1,720.9 | | 1.18 | | | (0.16 | ) | | 56.03 | |
| | (0.20 | ) | | | 17.63 | | 30.76 | | | | 1,192.8 | | 1.18 | | | (0.17 | ) | | 41.31 | |
65
ARTISAN FUNDS, INC.
Notes to Financial Statements – September 30, 2008
Artisan Funds, Inc. (“Artisan Funds”) was incorporated on January 5, 1995, as a Wisconsin corporation and is registered under the Investment Company Act of 1940, as amended. Artisan Funds is a series comprised of eleven open-end, diversified mutual funds. The following funds (each a “Fund,” and collectively, the “Funds”) are covered by this report:
| | |
| Fund Name | | Inception Date |
Artisan Global Value Fund (“Global Value Fund” or “Global Value”) | | December 10, 2007 |
Artisan International Fund (“International Fund” or “International”) | | December 28, 1995 |
Artisan International Small Cap Fund (“International Small Cap Fund” or “International Small Cap”) | | December 21, 2001 |
Artisan International Value Fund (“International Value Fund” or “International Value”) | | September 23, 2002 |
Artisan Mid Cap Fund (“Mid Cap Fund” or “Mid Cap”) | | June 27, 1997 |
Artisan Mid Cap Value Fund (“Mid Cap Value Fund” or “Mid Cap Value”) | | March 28, 2001 |
Artisan Opportunistic Growth Fund (“Opportunistic Growth Fund” or “Opportunistic Growth”) | | September 22, 2008 |
Artisan Opportunistic Value Fund (“Opportunistic Value Fund” or “Opportunistic Value”) | | March 27, 2006 |
Artisan Small Cap Fund (“Small Cap Fund” or “Small Cap”) | | March 28, 1995 |
Artisan Small Cap Value Fund (“Small Cap Value Fund” or “Small Cap Value”) | | September 29, 1997 |
Each Fund’s investment objective is to seek long-term capital growth. Each Fund has offered shares of capital stock of the class designated Investor Shares since the commencement of its operations. International Fund, International Value Fund and Mid Cap Fund began offering Institutional Shares on July 1, 1997, October 1, 2006 and July 1, 2000, respectively. Institutional Shares are sold to institutional investors meeting certain minimum investment requirements.
Each class of shares has equal rights with respect to portfolio assets and voting privileges. Each class has exclusive voting rights with respect to any matters involving only that class.
Income, expenses not specific to either class and realized and unrealized gains and losses were allocated daily to each class of shares based upon the relative net asset value of outstanding shares. Expenses attributable to a particular class of shares, such as transfer agency fees, shareholder communication expenses and registration fees, were allocated directly to that class.
Artisan Emerging Markets Fund, also a series of Artisan Funds, Inc., which commenced operations June 26, 2006 and offered only Institutional Shares. It began offering Advisor Shares on June 2, 2008. The financial statements of Artisan Emerging Markets Fund are presented in a separate report.
| (2) | Summary of significant accounting policies: |
The following is a summary of significant accounting policies of the Funds in effect during the period covered by the financial statements, which were in accordance with United States generally accepted accounting principles.
| (a) | Security valuation – The net asset value (“NAV”) of the shares of each class of each Fund was determined as of the close of regular session trading on the New York Stock Exchange (“NYSE”) (usually 4:00 p.m., Eastern Time, but sometimes earlier) each day |
66
NOTES TO FINANCIAL STATEMENTS
| | the NYSE was open for regular session trading. The NAV of each class of shares was determined by dividing the value of each Fund’s securities and other assets attributed to that class, less its liabilities attributed to that class, by the number of outstanding shares of that class of that Fund. |
| | In determining NAV, each equity security traded on a securities exchange, including the Nasdaq Stock Market and over-the-counter securities, was valued at the closing price as of the time of valuation on the exchange or market designated by the Fund’s accounting agent or pricing vendor as the principal exchange (the “principal exchange”). The closing price provided by the pricing vendor for a principal exchange may differ and may represent information such as last sales price, an official closing price, a closing auction price or other information, depending on exchange or market convention. Absent closing price information from the principal exchange as of the time of valuation, the security was valued using the closing price on another exchange on which the security traded (if such price is made available by the pricing vendor) or the most recent bid quotation on the principal exchange or, if not available, another exchange or in the over-the-counter market, except that securities listed on the London Stock Exchange were valued at the mean of the most recent bid and asked quotations as of the time of valuation. Short-term investments, other than repurchase agreements, maturing within sixty days from the valuation date were valued at amortized cost, which approximates market value. |
| | Securities for which prices were not readily available were valued by Artisan Funds’ valuation committee (the “valuation committee”) at a fair value determined in good faith under procedures established by and under the general supervision of Artisan Funds’ board of directors (the “board of directors”). A price was considered to be not readily available if, among other things, the valuation committee believed that the price determined as described in the preceding paragraph did not reflect a fair value of the security. |
| | Global Value Fund, International Fund, International Small Cap Fund and International Value Fund generally invested a significant portion, and perhaps as much as substantially all, of their total assets in securities principally traded in markets outside the U.S. Each of the other Funds had the ability to invest, and some Funds did invest, in securities principally traded outside the U.S. The foreign markets in which the Funds invested were sometimes open on days when the NYSE was not open and the Funds did not calculate their NAVs, and sometimes were not open on days when the Funds did calculate their NAVs. Even on days on which both the foreign market and the NYSE were open, several hours may have passed between the time when trading in the foreign market closed and the time as of which the Funds calculate their NAVs. That was generally the case for markets in Europe, Asia, Australia and other far eastern markets; the regular closing time of foreign markets in North and South America was generally the same as the closing time of the NYSE and the time as of which the Funds calculated their NAVs. |
| | The valuation committee concluded that a price determined under the Funds’ valuation procedures was not readily available if, among other things, the valuation committee believed that the value of the security might have been materially affected by events occurring after the close of the market in which the security was principally traded but before the time for determination of NAV (“subsequent event”). A subsequent event might include a company-specific development (for example, announcement of a merger that is made after the close of the foreign market), a development that might affect an entire market or region (for example, imposition of foreign exchange controls by a foreign |
67
NOTES TO FINANCIAL STATEMENTS
| | government), a potentially global development (such as a terrorist attack that may be expected to have an impact on investor expectations worldwide) or a significant change in one or more U.S. securities indices. Artisan Funds monitored for subsequent events using several tools. An indication by any of those tools of a potential material change in the value of securities resulted in either a meeting of the valuation committee, which considered whether a subsequent event had occurred and whether local market closing prices continued to represent fair values for potentially affected non-U.S. securities, and/or a valuation based on information provided by a third party research service. This third party research service was used to assist in determining estimates of fair values for foreign securities. That service utilized statistical data based on historical performance of securities, markets and other data in developing factors used to estimate a fair value. |
| | Estimates of fair values utilized by the Funds as described above may differ from the value realized on the subsequent sale of those securities and from quoted or published prices for those securities. The differences may have been material to the NAV of the applicable Fund or to the information presented. |
| | There are certain risks involved in investing in foreign securities. These risks include those resulting from future adverse political, social, and economic developments, fluctuations in currency exchange rates, the possible imposition of exchange controls, and other foreign laws or restrictions. |
| (b) | Income taxes – No provision was made for federal income taxes or excise taxes since each Fund intends to (i) comply with the provisions of Subchapter M of the Internal Revenue Code applicable to regulated investment companies and (ii) distribute to its shareholders substantially all of its taxable income as well as net realized gains from the sale of investment securities. The Funds may utilize earnings and profits distributed to shareholders on redemptions of Fund shares as part of the dividends paid deduction. |
| | The Funds may be subject to taxes on realized gains from the sale of investment securities imposed by certain countries in which the Funds invest. The Funds recorded the foreign tax expense, if any, on an accrual basis. The taxes were included in “Payable for withholding taxes” on the accompanying Statements of Assets and Liabilities. |
| (c) | Portfolio transactions – In determining a Fund’s NAV, security transactions and shareholder transactions were accounted for no later than one business day after trade date, in accordance with applicable law. However, for financial reporting purposes, security transactions and shareholder transactions were recorded on trade date in accordance with United States generally accepted accounting principles. Net realized gains and losses on securities were computed on specific security lot identification. |
| (d) | Foreign currency translation – Values of foreign investments, open foreign currency forward contracts, payables for capital gains taxes and cash denominated in foreign currencies were translated into U.S. dollars using a spot market rate of exchange as of the time of determination of each Fund’s NAV on the day of valuation. Payables and receivables for securities transactions, dividend and reclaim receivables and other receivables and payables denominated in a foreign currency were translated into U.S. dollars using a spot market rate of exchange as of 12:00 p.m. (Eastern Time) on the day of valuation. Purchases and sales of investments and dividend and interest income were translated into U.S. dollars using a spot market rate of exchange as of 12:00 p.m. (Eastern Time) on the date of such transactions. The portion of security gains or losses resulting from changes in foreign exchange rates was included with net realized and unrealized gain or loss from investments, as appropriate, for both financial reporting and tax purposes. |
68
NOTES TO FINANCIAL STATEMENTS
| | The Funds may enter into foreign currency forward contracts to hedge the foreign currency exposure on open payables and receivables. These foreign currency forward contracts, or spot contracts, generally settle within two business days. The Funds also may enter into foreign currency forward contracts to hedge against foreign currency exchange rate risks on its non-U.S. dollar denominated investment securities. At September 30, 2008, International Value Fund held a foreign currency forward contract to hedge against foreign currency exchange rate risk on a non-U.S. dollar denominated investment security. Foreign currency forward contracts were recorded at market value and any related realized and unrealized gains and losses were reported as foreign currency related transactions for financial reporting purposes. For tax purposes, these foreign exchange gains and losses were treated as ordinary income or loss. The Funds could be exposed to loss if the counterparties fail to perform under these contracts. |
| | Other foreign currency related transaction gains and losses may result from currency gains and losses realized from the difference between the amounts of dividends and foreign withholding taxes recorded on the Funds’ books and the U.S. dollar equivalent of the amounts actually received or paid. The net increase (decrease) in unrealized appreciation or depreciation on foreign currency related transactions arose from changes in the values of assets and liabilities, other than investments in securities, resulting from changes in foreign exchange rates. |
| (e) | Repurchase agreements – Each Fund may enter into repurchase agreements with institutions that Artisan Partners Limited Partnership (“the Adviser”) determined were creditworthy pursuant to criteria adopted by the board of directors. Repurchase agreements were recorded at cost plus accrued interest and were collateralized in an amount greater than or equal to the repurchase price plus accrued interest. Collateral was held by the Funds’ custodian and in the event of default on the obligation of the counterparty to repurchase, the Funds had the right to liquidate the collateral and apply the proceeds in satisfaction of the obligation. If the proceeds from any sale of such collateral were less than the repurchase price, the Fund would have suffered a loss. |
| (f) | Depository receipts – Each of the Funds may invest in depository receipts. Depository receipts are typically issued by a financial institution (a “depository”), evidencing ownership interests in a security issued by an issuer and deposited with the depository. |
| (g) | Securities lending – Each of the Funds may enter into securities lending transactions secured by collateral in the form of U.S. Government securities at least equal to, at all times, the fair value of the securities loaned. When securities are on loan, the Fund does not receive dividends on the securities loaned, but receives compensation from the borrower in lieu of such dividends. Gain or loss in the fair value of the securities loaned that may occur during the term of the loan will be for the account of the applicable Fund. In entering into securities lending arrangements, the Fund takes the risk that the borrower may not provide additional collateral when required or return the securities when due or, if the borrower defaults, the Fund may experience delays in selling collateral or the collateral may not be sufficient to cover the value of securities lent. There were no securities on loan as of September 30, 2008. |
| | During the year ended September 30, 2008, International Fund earned $5,642,452 from securities lending transactions, which was included in the accompanying Statement of Operations. |
| (h) | Equity-linked participation certificates – The Funds may invest in equity-linked participation certificates. Equity-linked participation certificates are derivative securities which are |
69
NOTES TO FINANCIAL STATEMENTS
| | designed to combine the characteristics of one or more underlying securities and their equity derivatives in a single note form. An investment in equity-linked participation certificates creates exposure to the credit risk of the issuing financial institution, as well as to the market risk of the underlying securities. There is no guaranteed return of principal with these securities and the appreciation potential of these securities may be limited by a maximum payment or call right. Equity-linked participation certificates may be more volatile and less liquid than equity securities. |
| (i) | Transfer agent fees – Each Fund paid fees to, and reimbursed expenses of, the Funds’ transfer agent. In addition, the Funds have authorized certain financial services companies, broker-dealers, banks or other authorized agents, and in some cases, other organizations designated by an authorized agent (with their designees, collectively “authorized agents”) to accept purchase, exchange and redemption orders for Investor Shares on the Funds’ behalf. Many authorized agents charged a fee for accounting and shareholder services that the agent provided to Fund shareholders on the Fund’s behalf. Those services typically included recordkeeping, transaction processing for shareholders’ accounts and other services. The fee was either based on the number of accounts to which the intermediary provided such services, or a percentage, as of September 30, 2008, up to 0.40% annually of the average value of Fund shares held in such accounts. Each Fund paid a portion of such fees, which are intended to compensate the authorized agent for its provision of services of the type that would be provided by the Funds’ transfer agent or other service providers if the shares were registered on the books of the Funds’ transfer agent. The balance of the fees incurred was paid by the Adviser. The Funds’ expenses incurred for services provided by authorized agents were included in “Transfer agent fees” in the Statements of Operations. The table below shows the fees and expenses to the Funds’ transfer agent and the fees to authorized agents incurred by each class of each Fund during the year ended September 30, 2008: |
| | | | | | | | | |
| | | Year Ended 9/30/08 |
| Fund | | Fees and Expenses
to Transfer Agent | | Fees to
Authorized
Agents | | Total |
Global Value - Investor Shares(1) | | $ | 41,696 | | $ | 16,671 | | $ | 58,367 |
International - Investor Shares | | | 658,105 | | | 26,448,546 | | | 27,106,651 |
International - Institutional Shares | | | 32,716 | | | - | | | 32,716 |
International Small Cap - Investor Shares | | | 100,814 | | | 1,889,960 | | | 1,990,774 |
International Value - Investor Shares | | | 139,782 | | | 2,281,454 | | | 2,421,236 |
International Value - Institutional Shares | | | 12,791 | | | - | | | 12,791 |
Mid Cap - Investor Shares | | | 236,499 | | | 12,592,145 | | | 12,828,644 |
Mid Cap - Institutional Shares | | | 18,684 | | | - | | | 18,684 |
Mid Cap Value - Investor Shares | | | 352,586 | | | 6,767,160 | | | 7,119,746 |
Opportunistic Growth - Investor Shares(2) | | | 3,000 | | | 124 | | | 3,124 |
Opportunistic Value - Investor Shares | | | 86,703 | | | 498,390 | | | 585,093 |
Small Cap - Investor Shares | | | 162,007 | | | 1,410,656 | | | 1,572,663 |
Small Cap Value - Investor Shares | | | 103,172 | | | 3,890,675 | | | 3,993,847 |
|
(1)For the period from commencement of operations (December 10, 2007) through September 30, 2008. |
(2)For the period from commencement of operations (September 22, 2008) through September 30, 2008. |
70
NOTES TO FINANCIAL STATEMENTS
| (j) | Commission recapture – Each of the Funds had the ability to direct portfolio trades to various brokers that have agreed to rebate a portion of the commissions generated. Such cash rebates were made directly to the applicable Fund and were included in net realized gain or loss on investments in the Statements of Operations as follows: |
| | | |
Global Value | | $ | - |
International | | | - |
International Small Cap | | | 4,774 |
International Value | | | 5,066 |
Mid Cap | | | 478,970 |
Mid Cap Value | | | 305,663 |
Opportunistic Growth | | | - |
Opportunistic Value | | | 25,175 |
Small Cap | | | 158,154 |
Small Cap Value | | | 249,755 |
| (k) | Use of estimates – The preparation of financial statements in conformity with United States generally accepted accounting principles requires management to make estimates and assumptions that affect the reported amounts and disclosures in the financial statements. Actual results could differ from those estimates. |
| (l) | Indemnifications – In the normal course of business, the Funds have entered into contracts in which the Funds agree to indemnify the other party or parties against various potential costs or liabilities. The Funds’ maximum exposure under these arrangements is unknown. No claim had been made for indemnification pursuant to any such agreement of the Funds. |
| (m) | Other – Dividend income less foreign taxes withheld, if any, was generally recorded on the ex-dividend date. In some cases, the information was not available to the Fund on the ex-dividend date. In such cases, which may have included dividends from private placements or foreign securities, dividends were recorded as soon after the ex-dividend date as reliable information became available to the Funds. Non-cash dividends included in dividend income, if any, were generally recorded at the fair market value of securities received. Interest income was recorded on the accrual basis. Distributions to shareholders were recorded on the ex-dividend date. Expenses attributable to Artisan Funds were generally allocated to each Fund based on net assets. However, other expense allocation methodologies were used, depending on the nature of the expense item. Expenses attributable to a particular Fund or class were allocated directly to that Fund or class. |
| | The character of income and net realized gains and losses may differ in some instances for financial statement and tax purposes and may result in reclassification of permanent differences among certain capital accounts to more appropriately conform financial accounting to tax characterizations of dividend and capital gain distributions. |
| | Global Value Fund, International Fund, International Small Cap Fund and International Value Fund generally imposed a 2% redemption fee on shares held 90 days or less. Those redemption fees were recorded as a reduction in the cost of shares redeemed and had the primary effect of increasing paid-in capital. Each Fund reserved the right to waive or reduce the 2% redemption fee on shares held 90 days or less at its discretion when the Fund believed such waiver was in the best interests of the Fund, including but not limited to when it determined that imposition of the redemption fee was not |
71
NOTES TO FINANCIAL STATEMENTS
| | necessary to protect the Fund from the effects of short-term trading. The Funds waived the fee on redemption of shares held by certain authorized agents or other Fund intermediaries. |
| (3) | Transactions with affiliates: |
The Adviser, with which the officers and a director of Artisan Funds were affiliated, provided investment advisory and administrative services to the Funds. In exchange for those services, each Fund (with the exception of Global Value Fund, International Fund, International Small Cap Fund, Opportunistic Growth Fund and Opportunistic Value Fund) paid a monthly management fee to the Adviser as follows:
| | | |
Average Daily Net Assets | | Annual Rate | |
Less than $500 million | | 1.000 | % |
$500 million to $750 million | | 0.975 | |
$750 million to $1 billion | | 0.950 | |
Greater than $1 billion | | 0.925 | |
Global Value Fund pays a monthly management fee to the Adviser as follows:
| | | |
Average Daily Net Assets | | Annual Rate | |
Less than $1 billion | | 1.000 | % |
$1 billion to $4 billion | | 0.975 | |
$4 billion to $8 billion | | 0.950 | |
$8 billion to $12 billion | | 0.925 | |
Greater than $12 billion | | 0.900 | |
International Fund pays a monthly management fee to the Adviser as follows:
| | | |
Average Daily Net Assets | | Annual Rate | |
Less than $500 million | | 1.000 | % |
$500 million to $750 million | | 0.975 | |
$750 million to $1 billion | | 0.950 | |
$1 billion to $12 billion | | 0.925 | |
Greater than $12 billion | | 0.900 | |
International Small Cap Fund pays a monthly management fee to the Adviser at an annual rate of 1.250% of average daily net assets.
Opportunistic Growth Fund and Opportunistic Value Fund pay a monthly management fee to the Adviser as follows:
| | | |
Average Daily Net Assets | | Annual Rate | |
Less than $1 billion | | 0.900 | % |
$1 billion to $4 billion | | 0.875 | |
$4 billion to $8 billion | | 0.850 | |
$8 billion to $12 billion | | 0.825 | |
Greater than $12 billion | | 0.800 | |
The Adviser has voluntarily undertaken to reimburse Global Value Fund and Opportunistic Growth Fund for any ordinary operating expenses in excess of 1.50% of average daily net assets, annually.
72
NOTES TO FINANCIAL STATEMENTS
The officers and director of Artisan Funds who are affiliated with the Adviser receive no compensation from the Funds.
Prior to January 1, 2008, each director who was not an interested person of Artisan Funds or the Adviser received an annual retainer of $150,000, payable quarterly, as well as reimbursement of expenses related to his duties as a director of Artisan Funds. In addition, the non-interested chair of the board of directors received an additional annual retainer of $60,000, payable quarterly, and each chair of a board committee who was a non-interested director received an additional annual retainer of $30,000, payable quarterly. Effective January 1, 2008, each director who is not an interested person of Artisan Funds or the Adviser receives an annual retainer of $160,000, payable quarterly. The other additional annual retainer fees were unchanged. These fees were generally allocated to each of the Artisan Funds based on net assets, subject to a minimum allocation of $1,500 to each Fund per quarter. Directors fees for Global Value Fund have been waived through September 30, 2008.
Artisan Funds has adopted a deferred compensation plan for independent directors that enables directors to elect to defer receipt of all or a portion of the annual compensation they are entitled to receive from the Funds. For purposes of determining the amount owed to the directors under the plan, deferred amounts were invested in shares of Artisan Funds as selected by the individual directors. Each Fund purchased shares of Artisan Funds selected for deferral by the director in amounts equal to his investment, resulting in a Fund asset equal to the deferred compensation liability. Such assets were included as a component of “Other assets” on the Statements of Assets and Liabilities. Deferral of directors’ fees under the plan did not affect the net assets of the Funds, and did not materially affect the Funds’ assets, liabilities or net investment income per share. Amounts will be deferred until distributed in accordance with the plan.
Shares of Artisan Funds were offered for sale by Artisan Distributors LLC (“Distributors”). Distributors is wholly owned by the Adviser. All distribution expenses relating to the Funds were paid by the Adviser.
| (4) | Line of credit arrangement: |
Artisan Funds is party to a line of credit agreement with State Street Bank and Trust Company, which expires August 2009, under which each Fund may borrow up to the lesser of (a) $75 million or (b) the lesser of (i) 10% of its total adjusted net assets (after giving effect to the loan) or (ii) the maximum amount the Fund may have borrowed under the Investment Company Act of 1940, the limitations included in the Fund’s prospectus, or any limit or restriction under any law or regulation to which the Fund was subject or any agreement to which the Fund or Artisan Funds is a party; provided that the aggregate borrowings by all Artisan Funds may not exceed $100 million. Artisan Funds paid a commitment fee at the annual rate of 0.10% on the unused portion of the line of credit. Interest would have been charged on any borrowings at the current Federal Funds rate plus 0.50%. The use of the line of credit was generally restricted to temporary borrowing for extraordinary or emergency purposes. During the year ended September 30, 2008, there were no borrowings under the line of credit.
73
NOTES TO FINANCIAL STATEMENTS
| (5) | Investment transactions: |
The cost of securities purchased and the proceeds from the sale of securities (excluding short-term securities) for the year ended September 30, 2008 were as follows:
| | | | | | |
| Fund | | Security Purchases | | Security Sales |
Global Value(1) | | $ | 14,373,909 | | $ | 3,669,752 |
International | | | 8,654,310,407 | | | 9,451,556,705 |
International Small Cap | | | 456,811,158 | | | 538,773,072 |
International Value | | | 638,571,345 | | | 850,317,792 |
Mid Cap | | | 4,117,160,113 | | | 4,464,623,882 |
Mid Cap Value | | | 2,343,794,229 | | | 2,077,751,021 |
Opportunistic Growth(2) | | | 5,918,792 | | | 163,249 |
Opportunistic Value | | | 247,905,569 | | | 228,029,549 |
Small Cap | | | 805,088,280 | | | 1,081,837,058 |
Small Cap Value | | | 1,350,589,131 | | | 1,525,336,921 |
(1) | For the period from commencement of operations (December 10, 2007) through September 30, 2008. |
(2) | For the period from commencement of operations (September 22, 2008) through September 30, 2008. |
| (6) | Transactions in securities of affiliates: |
The table below shows information about securities of the Funds’ “affiliates” (as defined below) that were held by the Funds, purchased or sold by the Funds, or from which dividends were received by the Funds during the year ended September 30, 2008. The Funds identify a company as an affiliate for the purpose of this report if one or more of the Funds owned, in the aggregate, voting securities that it believed represented 5% or more of that company’s outstanding voting securities (as defined by the Investment Company Act of 1940) during the year ended September 30, 2008.
| | | | | | | | | | | | | | | | | | | | | | |
| | | | | As of
9/30/07 | | | | | | | | | | | As of 9/30/08 |
| Fund | | Security | | Share
Balance | | Purchase
Cost | | Sales
Cost | | Net
Realized
Gain (Loss) | | | Dividend
Income(1) | | Share
Balance | | Value |
| Global Value(2) | | | | | | | | | | | | | | | | | | | | | | |
| | | Credit Saison Co., Ltd.(3)(4) | | - | | $ | 311,637 | | $ | 15,190 | | $ | (5,104 | ) | | $ | 2,390 | | 11,400 | | $ | 185,456 |
| | | Total(5) | | | | $ | 311,637 | | $ | 15,190 | | $ | (5,104 | ) | | $ | 2,390 | | | | | |
| International | | | | | | | | | | | | | | | | | | | | | | |
| | | Credit Saison Co., Ltd.(3) | | 8,625,200 | | $ | - | | $ | 217,423,551 | | $ | (74,860,419 | ) | | $ | 1,578,042 | | 1,897,823 | | $ | 30,873,858 |
| | | Shanghai Electric Group Company Limited, Series H(4)(6) | | - | | | 110,038,880 | | | - | | | - | | | | - | | 150,931,921 | | | 45,393,696 |
| | | Total(5) | | | | $ | 110,038,880 | | $ | 217,423,551 | | $ | (74,860,419 | ) | | $ | 1,578,042 | | | | $ | 45,393,696 |
| International Small Cap | | | | | | | | | | | | | | | | | | | | | | |
| | | CDNetworks Co., Ltd.(3)(6) | | 533,656 | | $ | - | | $ | 17,320,963 | | $ | (9,343,122 | ) | | $ | - | | - | | $ | - |
| | | Spazio Investment NV | | 1,718,422 | | | - | | | 1,849,706 | | | (462,239 | ) | | | 2,304,249 | | 1,600,055 | | | 19,013,051 |
| | | Total(5) | | | | $ | - | | $ | 19,170,669 | | $ | (9,805,361 | ) | | $ | 2,304,249 | | | | $ | 19,013,051 |
See notes on page 76.
74
NOTES TO FINANCIAL STATEMENTS
| | | | | | | | | | | | | | | | | | | | | | |
| | | | | As of
9/30/07 | | | | | | | | | | | As of 9/30/08 |
| Fund | | Security | | Share
Balance | | Purchase
Cost | | Sales
Cost | | Net
Realized
Gain (Loss) | | | Dividend
Income(1) | | Share
Balance | | Value |
| International Value | | | | | | | | | | | | | | | | | | | | | | |
| | | Benfield Group Plc | | 11,229,422 | | $ | 3,313,540 | | $ | 4,493,080 | | $ | (811,351 | ) | | $ | 3,752,750 | | 11,241,209 | | $ | 66,922,543 |
| | | Credit Saison Co., Ltd.(3) | | 2,009,500 | | | 21,021,690 | | | 12,237,407 | | | 1,524,515 | | | | 538,043 | | 2,433,169 | | | 39,582,887 |
| | | Pfeiffer Vacuum Technology AG(3) | | 499,995 | | | - | | | 15,826,849 | | | 17,793,153 | | | | 1,219,090 | | 149,681 | | | 11,986,107 |
| | | SurfControl PLC(3) | | 1,622,708 | | | - | | | 13,618,504 | | | 9,572,504 | | | | - | | - | | | - |
| | | Total(5) | | | | $ | 24,335,230 | | $ | 46,175,840 | | $ | 28,078,821 | | | $ | 5,509,883 | | | | $ | 66,922,543 |
| Mid Cap | | | | | | | | | | | | | | | | | | | | | | |
| | | Chico’s FAS, Inc.(3) | | 5,456,168 | | $ | 2,547,668 | | $ | 57,624,668 | | $ | (61,355,627 | ) | | $ | - | | - | | $ | - |
| | | Intermec, Inc.(6) | | 3,770,200 | | | 5,518,693 | | | 11,075,242 | | | (3,809,833 | ) | | | - | | 3,481,619 | | | 68,378,997 |
| | | Total(5) | | | | $ | 8,066,361 | | $ | 68,699,910 | | $ | (65,165,460 | ) | | $ | - | | | | $ | 68,378,997 |
| Mid Cap Value | | | | | | | | | | | | | | | | | | | | | | |
| | | Acuity Brands, Inc.(4) | | - | | $ | 129,384,332 | | $ | 3,495,285 | | $ | (76,959 | ) | | $ | 1,036,777 | | 2,806,700 | | $ | 117,207,792 |
| | | Benchmark Electronics, Inc.(3)(4)(6) | | 2,045,800 | | | 7,939,586 | | | 51,998,288 | | | (7,650,380 | ) | | | - | | - | | | - |
| | | Chico’s FAS, Inc.(3)(6) | | 3,359,400 | | | 3,230,774 | | | 57,506,156 | | | (32,065,927 | ) | | | - | | - | | | - |
| | | Con-way Inc.(4) | | 1,101,600 | | | 40,432,644 | | | 1,694,888 | | | (256,400 | ) | | | 635,310 | | 2,001,900 | | | 88,303,809 |
| | | Rent-A-Center, Inc.(6) | | 3,768,900 | | | 8,359,215 | | | 45,464,486 | | | 14,899,118 | | | | - | | 2,455,300 | | | 54,704,084 |
| | | Thor Industries, Inc.(4) | | 1,222,800 | | | 64,037,036 | | | 30,436,760 | | | 2,221,011 | | | | 349,783 | | 2,682,100 | | | 66,569,722 |
| | | Zale Corporation(3)(6) | | 2,323,600 | | | - | | | 60,643,522 | | | (16,809,508 | ) | | | - | | - | | | - |
| | | Total(5) | | | | $ | 253,383,587 | | $ | 251,239,385 | | $ | (39,739,045 | ) | | $ | 2,021,870 | | | | $ | 326,785,407 |
| Opportunistic Value | | | | | | | | | | | | | | | | | | | | | | |
| | | Chico’s FAS, Inc.(3) | | 260,400 | | $ | 1,941,560 | | $ | 4,291,090 | | $ | (2,349,531 | ) | | $ | - | | - | | $ | - |
| | | Total(5) | | | | $ | 1,941,560 | | $ | 4,291,090 | | $ | (2,349,531 | ) | | $ | - | | | | $ | - |
| Small Cap | | | | | | | | | | | | | | | | | | | | | | |
| | | DSP Group, Inc.(3)(4) | | 763,600 | | $ | 471,743 | | $ | 16,728,651 | | $ | (6,934,140 | ) | | $ | - | | - | | $ | - |
| | | Total(5) | | | | $ | 471,743 | | $ | 16,728,651 | | $ | (6,934,140 | ) | | $ | - | | | | $ | - |
| Small Cap Value | | | | | | | | | | | | | | | | | | | | | | |
| | | Acuity Brands, Inc.(4) | | - | | $ | 43,304,382 | | $ | 145,010 | | $ | (1,602 | ) | | $ | 251,563 | | 1,000,800 | | $ | 41,793,408 |
| | | America Service Group Inc.(3)(6) | | 603,600 | | | 638,417 | | | 10,447,472 | | | (4,828,215 | ) | | | - | | 115,600 | | | 1,100,512 |
| | | AMN Healthcare Services, Inc.(6) | | 2,114,100 | | | 1,525,042 | | | 4,313,995 | | | (1,248,817 | ) | | | - | | 2,009,800 | | | 35,312,186 |
| | | Benchmark Electronics, Inc.(3)(4)(6) | | 1,183,900 | | | 8,672,758 | | | 4,433,205 | | | (1,030,958 | ) | | | - | | 1,391,800 | | | 19,596,544 |
| | | Celadon Group, Inc.(3) | | 1,304,800 | | | - | | | 21,340,969 | | | (12,687,690 | ) | | | - | | - | | | - |
| | | Chico’s FAS, Inc.(3)(4) | | - | | | 9,583,996 | | | 9,583,996 | | | (3,095,306 | ) | | | - | | - | | | - |
| | | Commercial Vehicle Group, Inc(3) | | 1,253,500 | | | - | | | 24,460,780 | | | 11,987,391 | | | | - | | - | | | - |
| | | Con-way Inc.(4) | | - | | | 22,732,008 | | | 197,937 | | | 20,340 | | | | 169,250 | | 572,700 | | | 25,261,797 |
| | | Cross Country Healthcare, Inc.(6) | | 2,363,300 | | | 1,476,562 | | | 5,524,859 | | | (1,174,277 | ) | | | - | | 2,155,000 | | | 35,104,950 |
| | | Diamond Management & Technology Consultants, Inc.(4) | | 1,107,900 | | | 7,851,386 | | | 1,810,715 | | | (822,919 | ) | | | 625,555 | | 1,897,400 | | | 8,898,806 |
See notes on page 76.
75
NOTES TO FINANCIAL STATEMENTS
| | | | | | | | | | | | | | | | | | | | | | |
| | | | | As of
9/30/07 | | | | | | | | | | | As of 9/30/08 |
| Fund | | Security | | Share
Balance | | Purchase
Cost | | Sales
Cost | | Net
Realized
Gain (Loss) | | | Dividend
Income(1) | | Share
Balance | | Value |
| | | DSP Group, Inc.(3)(4)(6) | | 634,900 | | | 1,030,440 | | | 1,770,432 | | | (678,610 | ) | | | - | | 647,600 | | | 4,954,140 |
| | | Ethan Allen Interiors Inc.(3) | | 1,554,100 | | | 2,037,657 | | | 16,056,309 | | | (3,331,520 | ) | | | 1,267,948 | | 1,178,800 | | | 33,029,976 |
| | | Gevity HR, Inc.(3) | | 1,428,600 | | | - | | | 30,568,505 | | | (20,671,081 | ) | | | 240,021 | | - | | | - |
| | | Hudson Highland Group, Inc.(4)(6) | | 797,500 | | | 8,220,908 | | | 1,644,962 | | | (794,945 | ) | | | - | | 1,563,500 | | | 10,866,325 |
| | | Intevac, Inc.(6) | | 1,121,800 | | | 2,934,985 | | | 3,553,957 | | | (1,193,008 | ) | | | - | | 1,139,100 | | | 12,120,024 |
| | | Kforce Inc.(4)(6) | | 978,900 | | | 16,669,336 | | | 2,421,591 | | | (900,368 | ) | | | - | | 2,284,400 | | | 23,323,724 |
| | | LTX-Credence Corp(3)(6) | | 3,758,100 | | | 1,503,806 | | | 3,276,121 | | | (1,734,670 | ) | | | - | | 3,769,700 | | | 6,559,278 |
| | | Manhattan Associates, Inc.(4)(6) | | - | | | 28,849,794 | | | - | | | - | | | | - | | 1,244,700 | | | 27,806,598 |
| | | MarineMax, Inc.(3) | | 1,231,200 | | | 1,043,010 | | | 30,147,751 | | | (15,008,422 | ) | | | - | | - | | | - |
| | | Medical Staffing Network Holdings, Inc.(6) | | 1,639,200 | | | 683,655 | | | 210,612 | | | (74,236 | ) | | | - | | 1,760,100 | | | 2,904,165 |
| | | MicroStrategy Incorporated, Class A(4)(6) | | - | | | 32,056,978 | | | - | | | - | | | | - | | 462,000 | | | 27,502,860 |
| | | National Dentex Corporation(6) | | 413,500 | | | 238,956 | | | 381,278 | | | (137,055 | ) | | | - | | 415,800 | | | 2,536,380 |
| | | Orbotech, Ltd.(6) | | 2,537,400 | | | 4,306,949 | | | 4,285,955 | | | (1,519,634 | ) | | | - | | 2,635,500 | | | 21,057,645 |
| | | Rent-A-Center, Inc.(6) | | 1,821,100 | | | 1,545,193 | | | 6,766,214 | | | (2,953,352 | ) | | | - | | 1,638,400 | | | 36,503,552 |
| | | Rudolph Technologies, Inc.(4)(6) | | 516,700 | | | 17,013,235 | | | 1,827,257 | | | (426,869 | ) | | | - | | 1,771,000 | | | 14,840,980 |
| | | Sanderson Farms, Inc.(4) | | 752,900 | | | 14,111,678 | | | 4,066,178 | | | (719,557 | ) | | | 461,104 | | 1,045,200 | | | 38,400,648 |
| | | SI International Inc.(6) | | 1,127,900 | | | 1,713,326 | | | 11,833,986 | | | (1,310,622 | ) | | | - | | 834,500 | | | 25,076,725 |
| | | Stewart Information Services Corporation | | 1,615,500 | | | 2,304,210 | | | 11,953,341 | | | (4,761,726 | ) | | | 1,211,625 | | 1,447,400 | | | 43,060,150 |
| | | Thor Industries, Inc.(4) | | - | | | 30,818,479 | | | 570,826 | | | (20,132 | ) | | | 101,073 | | 1,019,300 | | | 25,299,026 |
| | | Ultra Clean Holdings, Inc.(4)(6) | | - | | | 17,914,493 | | | 1,433,482 | | | (291,222 | ) | | | - | | 1,327,900 | | | 6,692,616 |
| | | Ultratech, Inc.(4)(6) | | 915,600 | | | 5,278,074 | | | 3,578,222 | | | 220,950 | | | | - | | 1,176,300 | | | 14,233,230 |
| | | Xyratex Ltd(3)(4)(6) | | 1,400,700 | | | 2,477,656 | | | 7,665,889 | | | (2,751,457 | ) | | | - | | 1,179,400 | | | 13,126,722 |
| | | Zale Corporation(3) | | 1,586,600 | | | 636,861 | | | 30,432,718 | | | (5,691,543 | ) | | | - | | - | | | - |
| | | Total(5) | | | | $ | 289,174,230 | | $ | 256,704,524 | | $ | (77,631,132 | ) | | $ | 4,328,139 | | | | $ | 478,595,795 |
(1) | Net of foreign taxes withheld, if any. |
(2) | For the period from commencement of operations (December 10, 2007) through September 30, 2008. |
(3) | Issuer was no longer an affiliate as of September 30, 2008. |
(4) | Issuer was not an affiliate as of September 30, 2007. |
(5) | Total value as of 9/30/08 is presented for only those issuers that were affiliates as of September 30, 2008. |
(6) | Non-income producing security. |
76
NOTES TO FINANCIAL STATEMENTS
| (7) | Information for Federal income tax purposes: |
For Federal income tax purposes, the cost of investments, gross unrealized appreciation, gross unrealized depreciation and net unrealized depreciation on investments as of September 30, 2008 were as follows:
| | | | | | | | | | | | | | |
| Fund | | Cost of
Investments | | Gross Unrealized
Appreciation | | Gross
Unrealized
Depreciation | | | Net
Unrealized
(Depreciation)
on Investments | |
Global Value | | $ | 10,763,452 | | $ | 192,646 | | $ | (1,518,604 | ) | | $ | (1,325,958 | ) |
International | | | 13,062,854,979 | | | 4,434,734,176 | | | (5,765,760,719 | ) | | | (1,331,026,543 | ) |
International Small Cap | | | 831,143,089 | | | 104,181,088 | | | (209,985,276 | ) | | | (105,804,188 | ) |
International Value | | | 1,348,898,536 | | | 83,449,394 | | | (208,729,095 | ) | | | (125,279,701 | ) |
Mid Cap | | | 4,408,176,452 | | | 379,193,878 | | | (522,476,627 | ) | | | (143,282,749 | ) |
Mid Cap Value | | | 3,452,632,006 | | | 146,241,483 | | | (380,389,529 | ) | | | (234,148,046 | ) |
Opportunistic Growth | | | 6,088,314 | | | 15,749 | | | (403,005 | ) | | | (387,256 | ) |
Opportunistic Value | | | 263,992,876 | | | 3,420,673 | | | (38,318,433 | ) | | | (34,897,760 | ) |
Small Cap | | | 658,770,790 | | | 49,437,761 | | | (107,428,465 | ) | | | (57,990,704 | ) |
Small Cap Value | | | 2,068,267,545 | | | 116,626,542 | | | (250,368,032 | ) | | | (133,741,490 | ) |
The difference between cost of investments for financial reporting and cost of investments for Federal income tax purposes was due primarily to timing differences in recognizing certain gains and losses on security transactions (e.g., wash sale loss deferrals and passive foreign investment company transactions).
The tax characterization of ordinary income dividends and long-term capital gain distributions paid during the year ended September 30, 2008 and the year ended September 30, 2007 were as follows:
| | | | | | | | | | | | |
| | | Year Ended 9/30/08 | | Year Ended 9/30/07 |
| Fund | | Ordinary
Income
Dividends | | Long-Term
Capital Gain
Distributions | | Ordinary
Income
Dividends | | Long-Term
Capital Gain
Distributions |
Global Value(1) | | $ | - | | $ | - | | | NA | | | NA |
International | | | 361,370,744 | | | 2,098,971,481 | | $ | 218,986,067 | | $ | 1,133,040,051 |
International Small Cap | | | 35,072,445 | | | 143,355,129 | | | 50,533,801 | | | 134,834,295 |
International Value | | | 75,430,570 | | | 56,114,817 | | | 58,575,572 | | | 43,042,210 |
Mid Cap | | | 127,054,050 | | | 878,662,613 | | | 26,122,960 | | | 536,887,202 |
Mid Cap Value | | | 133,648,047 | | | 229,060,087 | | | 80,938,738 | | | 82,640,591 |
Opportunistic Growth(2) | | | - | | | - | | | NA | | | NA |
Opportunistic Value | | | 17,623,743 | | | 3,914,935 | | | 1,200,487 | | | - |
Small Cap | | | 30,590,323 | | | 72,684,961 | | | 16,675,263 | | | 7,936,601 |
Small Cap Value | | | 101,945,017 | | | 237,542,428 | | | 86,156,248 | | | 178,063,984 |
(1) | For the period from commencement of operations (December 10, 2007) through September 30, 2008. |
(2) | For the period from commencement of operations (September 22, 2008) through September 30, 2008. |
77
NOTES TO FINANCIAL STATEMENTS
Ordinary income dividends and long-term capital gain distributions were determined in accordance with income tax regulations that may differ from U.S. generally accepted accounting principles. These differences were due to differing treatments for items such as net short-term gains, wash sale loss deferrals, passive foreign investment company transactions, foreign currency transactions, net investment losses and post-October losses. Gains on redemptions-in-kind for Mid Cap Fund of $75,771,221 were included in net realized gain (loss) on investments in the Statement of Operations for the year ended September 30, 2008, and were not recognized for Federal income tax purposes.
Additional tax information as of and for the year ended September 30, 2008 follows:
| | | | | | | | | |
| | | As of 9/30/08 |
| | | Undistributed
Ordinary Income | | Undistributed
Long-Term Gain | | Post-October
Losses |
Global Value | | $ | 98,096 | | $ | - | | $ | 188,442 |
International | | | 168,511,911 | | | 318,081,129 | | | - |
International Small Cap | | | 8,258,118 | | | 6,812,109 | | | - |
International Value | | | 8,591,143 | | | - | | | - |
Mid Cap | | | - | | | 46,098,021 | | | - |
Mid Cap Value | | | 4,653,715 | | | 23,959,223 | | | - |
Opportunistic Growth | | | - | | | - | | | 9,348 |
Opportunistic Value | | | 1,235,962 | | | - | | | 33,825,163 |
Small Cap | | | - | | | - | | | 70,339,287 |
Small Cap Value | | | - | | | 41,867,860 | | | - |
As of September 30, 2008, none of the Funds had capital loss carryovers.
78
NOTES TO FINANCIAL STATEMENTS
[THIS PAGE INTENTIONALLY LEFT BLANK]
79
NOTES TO FINANCIAL STATEMENTS
| (8) | Fund share activities: |
Capital share transactions for the Funds were as follows:
| | | | | | | | | | | | | | | | |
| | | GLOBAL
VALUE | | | INTERNATIONAL | | | INTERNATIONAL
SMALL CAP | |
Year ended September 30, 2008 | | Investor
Shares(1) | | | Investor
Shares | | | Institutional
Shares | | | Investor
Shares | |
Proceeds from shares issued | | $ | 12,217,315 | | | $ | 2,769,106,273 | | | $ | 154,759,460 | | | $ | 338,978,430 | |
Net asset value of shares issued in reinvestment of dividends and distributions | | | - | | | | 1,711,689,210 | | | | 659,043,481 | | | | 168,476,300 | |
Cost of shares redeemed(3) | | | (1,227,950 | ) | | | (2,910,764,948 | ) | | | (814,639,751 | ) | | | (454,056,544 | ) |
| | | | | | | | | | | | | | | | |
Net increase (decrease) from fund share transactions | | $ | 10,989,365 | | | $ | 1,570,030,535 | | | $ | (836,810 | ) | | $ | 53,398,186 | |
| | | | | | | | | | | | | | | | |
| | | | |
Shares sold | | | 1,289,375 | | | | 99,755,202 | | | | 5,745,726 | | | | 15,891,243 | |
Shares issued in reinvestment of dividends and distributions | | | - | | | | 59,207,513 | | | | 22,647,542 | | | | 7,514,554 | |
Shares redeemed | | | (139,715 | ) | | | (107,847,385 | ) | | | (28,563,145 | ) | | | (22,390,636 | ) |
| | | | | | | | | | | | | | | | |
Net increase (decrease) in capital shares | | | 1,149,660 | | | | 51,115,330 | | | | (169,877 | ) | | | 1,015,161 | |
| | | | | | | | | | | | | | | | |
| | | |
| | | | | | INTERNATIONAL | | | INTERNATIONAL
SMALL CAP | |
Year ended September 30, 2007 | | | | | Investor
Shares | | | Institutional
Shares | | | Investor
Shares | |
Net asset value of share transferred | | | | | | | | | | | | | | | | |
Proceeds from shares issued | | | | | | $ | 2,337,197,971 | | | $ | 345,075,492 | | | $ | 252,969,681 | |
Net asset value of shares issued in reinvestment of dividends and distributions | | | | | | | 914,418,120 | | | | 375,581,486 | | | | 175,371,857 | |
Cost of shares redeemed(3) | | | | | | | (2,130,141,244 | ) | | | (557,699,941 | ) | | | (230,699,630 | ) |
| | | | | | | | | | | | | | | | |
Net increase (decrease) from fund share transactions | | | | | | $ | 1,121,474,847 | | | $ | 162,957,037 | | | $ | 197,641,908 | |
| | | | | | | | | | | | | | | | |
| | | | |
Shares sold | | | | | | | 76,830,902 | | | | 11,130,276 | | | | 10,654,264 | |
Shares issued in reinvestment of dividends and distributions | | | | | | | 31,850,161 | | | | 13,013,912 | | | | 8,191,119 | |
Shares redeemed | | | | | | | (70,075,745 | ) | | | (17,906,695 | ) | | | (9,835,896 | ) |
| | | | | | | | | | | | | | | | |
Net increase (decrease) in capital shares | | | | | | | 38,605,318 | | | | 6,237,493 | | | | 9,009,487 | |
| | | | | | | | | | | | | | | | |
(1) | For the period from commencement of operations (December 10, 2007) through September 30, 2008. |
(2) | For the period from commencement of operations (September 22, 2008) through September 30, 2008. |
(3) | Net of redemption fees of: |
| | | | | | |
| Fund | | 9/30/2008 | | 9/30/2007 |
Global Value - Investor Shares | | $ | 614 | | $ | - |
International - Investor Shares | | | 1,068,938 | | | 645,159 |
International - Institutional Shares | | | 381,010 | | | 282,110 |
International Small Cap - Investor Shares | | | 78,867 | | | 20,881 |
International Value - Investor Shares | | | 76,325 | | | 345,305 |
International Value - Institutional Shares | | | 13,231 | | | 25,764 |
80
NOTES TO FINANCIAL STATEMENTS
| | | | | | | | | | | | | | | | | | | | | | | | | | | | | | | | | |
| INTERNATIONAL VALUE | | | MID CAP | | | MID CAP
VALUE | | | OPPORTUNISTIC
GROWTH | | OPPORTUNISTIC
VALUE | | | SMALL CAP | | | SMALL CAP
VALUE | |
Investor
Shares | | | Institutional
Shares | | | Investor
Shares | | | Institutional
Shares | | | Investor
Shares | | | Investor
Shares(2) | | Investor
Shares | | | Investor
Shares | | | Investor
Shares | |
| $ | 303,006,196 | | | $ | 50,740,000 | | | $ | 1,053,457,971 | | | $ | 18,291,682 | | | $ | 1,282,164,200 | | | $ | 6,064,467 | | $ | 134,089,246 | | | $ | 114,409,460 | | | $ | 497,079,274 | |
| | | | | | | | |
| | 98,499,399 | | | | 15,729,244 | | | | 874,718,712 | | | | 120,999,695 | | | | 353,880,575 | | | | - | | | 21,453,072 | | | | 88,840,327 | | | | 336,773,337 | |
| | (592,204,517 | ) | | | (34,673,009 | ) | | | (1,467,033,037 | ) | | | (102,000,633 | ) | | | (1,053,149,242 | ) | | | - | | | (118,108,405 | ) | | | (394,430,741 | ) | | | (609,539,934 | ) |
| | | | | | | | | | | | | | | | | | | | | | | | | | | | | | | | | | |
| $ | (190,698,922 | ) | | $ | 31,796,235 | | | $ | 461,143,646 | | | $ | 37,290,744 | | | $ | 582,895,533 | | | $ | 6,064,467 | | $ | 37,433,913 | | | $ | (191,180,954 | ) | | $ | 224,312,677 | |
| | | | | | | | | | | | | | | | | | | | | | | | | | | | | | | | | | |
| | | | | | | | |
| | 12,372,002 | | | | 1,981,408 | | | | 33,783,896 | | | | 611,019 | | | | 69,665,295 | | | | 607,693 | | | 13,272,801 | | | | 7,289,087 | | | | 34,187,741 | |
| | 3,939,976 | | | | 629,926 | | | | 28,651,121 | | | | 3,870,752 | | | | 19,573,041 | | | | - | | | 2,084,847 | | | | 5,335,755 | | | | 24,653,978 | |
| | (23,733,942 | ) | | | (1,513,600 | ) | | | (50,970,079 | ) | | | (3,530,702 | ) | | | (56,912,215 | ) | | | - | | | (11,319,002 | ) | | | (25,799,968 | ) | | | (40,922,503 | ) |
| | | | | | | | | | | | | | | | | | | | | | | | | | | | | | | | | | |
| | (7,421,964 | ) | | | 1,097,734 | | | | 11,464,938 | | | | 951,069 | | | | 32,326,121 | | | | 607,693 | | | 4,038,646 | | | | (13,175,126 | ) | | | 17,919,216 | |
| | | | | | | | | | | | | | | | | | | | | | | | | | | | | | | | | | |
| | | | | | |
| INTERNATIONAL VALUE | | | MID CAP | | | MID CAP
VALUE | | | | | OPPORTUNISTIC
VALUE | | | SMALL CAP | | | SMALL CAP
VALUE | |
Investor
Shares | | | Institutional
Shares | | | Investor
Shares | | | Institutional
Shares | | | Investor
Shares | | | | | Investor
Shares | | | Investor
Shares | | | Investor
Shares | |
| $ | (78,194,778 | ) | | $ | 78,194,778 | | | | | | | | | | | | | | | | | | | | | | | | | | | | |
| | 957,403,055 | | | | 142,979,398 | | | $ | 876,970,575 | | | $ | 29,536,850 | | | $ | 1,046,343,046 | | | | | | $ | 237,762,506 | | | $ | 172,716,388 | | | $ | 431,174,415 | |
| | | | | | | | |
| | 88,578,891 | | | | 6,278,901 | | | | 474,031,867 | | | | 81,886,968 | | | | 157,266,155 | | | | | | | 1,195,855 | | | | 20,175,067 | | | | 261,614,625 | |
| | (783,018,312 | ) | | | (13,132,419 | ) | | | (1,365,376,527 | ) | | | (249,667,402 | ) | | | (678,864,297 | ) | | | | | | (52,075,619 | ) | | | (461,401,634 | ) | | | (469,576,057 | ) |
| | | | | | | | | | | | | | | | | | | | | | | | | | | | | | | | | | |
| $ | 262,963,634 | | | $ | 136,125,880 | | | $ | (14,374,085 | ) | | $ | (138,243,584 | ) | | $ | 524,744,904 | | | | | | $ | 186,882,742 | | | $ | (268,510,179 | ) | | $ | 223,212,983 | |
| | | | | | | | | | | | | | | | | | | | | | | | | | | | | | | | | | |
| | | | | | | | |
| | 34,002,714 | | | | 4,976,598 | | | | 25,859,207 | | | | 865,002 | | | | 48,644,407 | | | | | | | 19,849,521 | | | | 9,186,678 | | | | 22,800,221 | |
| | 3,182,856 | | | | 225,616 | | | | 15,430,725 | | | | 2,620,383 | | | | 7,766,230 | | | | | | | 107,251 | | | | 1,113,414 | | | | 14,477,843 | |
| | (27,424,433 | ) | | | (456,122 | ) | | | (41,649,602 | ) | | | (7,437,100 | ) | | | (31,795,526 | ) | | | | | | (4,363,409 | ) | | | (24,580,898 | ) | | | (25,022,187 | ) |
| | | | | | | | | | | | | | | | | | | | | | | | | | | | | | | | | | |
| | 9,761,137 | | | | 4,746,092 | | | | (359,670 | ) | | | (3,951,715 | ) | | | 24,615,111 | | | | | | | 15,593,363 | | | | (14,280,806 | ) | | | 12,255,877 | |
| | | | | | | | | | | | | | | | | | | | | | | | | | | | | | | | | | |
81
NOTES TO FINANCIAL STATEMENTS
Artisan Funds and the Adviser were defendants in a lawsuit filed in the Circuit Court of the Third Judicial Circuit, Madison County, Illinois that sought certification of a plaintiff class consisting of all persons in the United States who held shares in Artisan International Fund for a period of more than 14 days during the five year period prior to the filing of the lawsuit in September 2003. The basic allegations in the case were that Artisan Funds and the Adviser did not make appropriate price adjustments to the foreign securities owned by Artisan International Fund prior to calculating that Fund’s NAV, thereby allegedly enabling market timing traders to trade Artisan International Fund’s shares in such a way as to disadvantage long-term investors. Following years of procedural litigation in state and federal courts, the case was resolved and dismissed with prejudice in May 2008.
Certain legal fees incurred by Artisan Funds in defense of the lawsuit prior to its resolution and related insurance recoveries of $357,858 have been allocated to Artisan International Fund and were included in professional fees in the Statement of Operations. The resolution of the lawsuit did not have a material effect on the financial condition or results of operations of any Artisan Fund.
| (10) | Recent Accounting Pronouncements: |
On July 13, 2006, the Financial Accounting Standards Board (FASB) released FASB Interpretation No. 48 “Accounting for Uncertainty in Income Taxes” (“FIN 48”). FIN 48 provides guidance for how uncertain tax positions should be recognized, measured, presented and disclosed in the financial statements. Management has evaluated the implications of FIN 48 for all open tax years, and has determined there is no impact to the Funds’ financial statements.
In September 2006, FASB issued Statement on Financial Accounting Standards No. 157, “Fair Value Measurements” (FAS 157). This standard clarifies the definition of fair value for financial reporting, establishes a framework for measuring fair value and requires additional disclosures about the use of fair value measurements. FAS 157 is effective for financial statements issued for fiscal years beginning after November 15, 2007 and interim periods within those fiscal years. As of September 30, 2008, the Funds did not believe the adoption of FAS 157 would impact the amounts reported in the financial statements, however, additional disclosures would be required about the information used to develop the measurements of fair value and the effect of certain of the measurements reported in the statement of operations for a fiscal period.
In March 2008, the FASB issued Statement of Financial Accounting Standards No. 161, “Disclosures about Derivative Instruments and Hedging Activities” (FAS 161). FAS 161 requires enhanced disclosure relating to an entity’s use of derivatives, how derivatives are accounted for, and how derivative instruments affect an entity’s results of operations and financial position. This standard was issued and is effective for fiscal years beginning after November 15, 2008. Management is currently evaluating the implications of FAS 161 and the impact on the Funds’ financial statement disclosures, if any.
82
Report of Independent Registered Public Accounting Firm
To the Board of Directors and Shareholders of Artisan Funds, Inc.
We have audited the accompanying statements of assets and liabilities, including the schedules of investments, of Artisan Global Value Fund, Artisan International Fund, Artisan International Small Cap Fund, Artisan International Value Fund, Artisan Mid Cap Fund, Artisan Opportunistic Growth Fund, Artisan Mid Cap Value Fund, Artisan Opportunistic Value Fund, Artisan Small Cap Fund, and Artisan Small Cap Value Fund (ten of eleven portfolios constituting Artisan Funds, Inc.) (the “Funds”) as of September 30, 2008, and the related statements of operations for the year then ended, the statements of changes in net assets for each of the two years in the period then ended, and the financial highlights for each of the five years in the period indicated therein. These financial statements and financial highlights are the responsibility of the Funds’ management. Our responsibility is to express an opinion on these financial statements and financial highlights based on our audits.
We conducted our audits in accordance with the standards of the Public Company Accounting Oversight Board (United States). Those standards require that we plan and perform the audit to obtain reasonable assurance about whether the financial statements and financial highlights are free of material misstatement. We were not engaged to perform an audit of the Funds’ internal control over financial reporting. Our audits included consideration of internal control over financial reporting as a basis for designing audit procedures that are appropriate in the circumstances, but not for the purpose of expressing an opinion on the effectiveness of the Funds’ internal control over financial reporting. Accordingly, we express no such opinion. An audit also includes examining, on a test basis, evidence supporting the amounts and disclosures in the financial statements and financial highlights, assessing the accounting principles used and significant estimates made by management, and evaluating the overall financial statement presentation. Our procedures included confirmation of securities owned as of September 30, 2008, by correspondence with the custodian and brokers. We believe that our audits provide a reasonable basis for our opinion.
In our opinion, the financial statements and financial highlights referred to above present fairly, in all material respects, the financial position of Artisan Global Value Fund, Artisan International Fund, Artisan International Small Cap Fund, Artisan International Value Fund, Artisan Mid Cap Fund, Artisan Opportunistic Growth Fund, Artisan Mid Cap Value Fund, Artisan Opportunistic Value Fund, Artisan Small Cap Fund, and Artisan Small Cap Value Fund of Artisan Funds, Inc. at September 30, 2008, the results of their operations for the year then ended, the changes in their net assets for each of the two years in the period then ended, and the financial highlights for each of the five years in the period indicated therein, in conformity with U.S. generally accepted accounting principles.

Milwaukee, Wisconsin
November 10, 2008
83
NOTES TO FINANCIAL STATEMENTS
Other Federal tax information (unaudited):
The Internal Revenue Code requires that shareholders be notified within 60 days of the Funds’ fiscal year-end of certain information regarding long-term capital gains, qualified dividend income and the dividends received deduction for corporate shareholders. This data is informational only. Every year in January, shareholders are sent a Form 1099-DIV which provides the federal tax status of dividends and distributions received during the calendar year. Shareholders are advised to consult their own tax advisor with respect to the specific tax consequences of investment in the Funds.
Each Fund hereby designates the following amounts as (i) long-term capital gain distributions for purposes of the dividends paid deduction (including earnings and profits distributed to shareholders on redemption of Fund shares), (ii) the amount of ordinary dividends paid during the fiscal year ended September 30, 2008 that are considered qualified dividend income as defined in the Jobs and Growth Tax Relief Reconciliation Act of 2003, and (iii) the amount of ordinary dividends paid during the fiscal year ended September 30, 2008 that are eligible for the dividends received deduction available to certain corporate shareholders.
| | | | | | | | | |
| Fund | | Long-Term Capital Gains | | Qualified Dividend Income | | | Dividends Received Deduction | |
Global Value | | $ | - | | - | % | | - | % |
International | | | 2,160,068,879 | | 59.87 | | | - | |
International Small Cap | | | 158,299,621 | | 29.40 | | | - | |
International Value | | | 58,010,849 | | 45.69 | | | - | |
Mid Cap | | | 896,241,667 | | 29.06 | | | 27.55 | |
Mid Cap Value | | | 235,126,828 | | 43.52 | | | 40.36 | |
Opportunistic Growth | | | - | | - | | | - | |
Opportunistic Value | | | 3,914,935 | | 37.23 | | | 21.54 | |
Small Cap | | | 73,113,394 | | 9.43 | | | 9.09 | |
Small Cap Value | | | 241,424,943 | | 27.38 | | | 26.50 | |
84
SHAREHOLDER EXPENSE EXAMPLE (UNAUDITED)
As a shareholder of Artisan Funds, you may incur transaction costs, including redemption fees, and you will incur ongoing costs, including management fees and other Fund expenses. This example is intended to help you understand your ongoing costs (in dollars) of investing in a Fund and to compare these costs with the ongoing costs of investing in other mutual funds.
The example is based on an investment of $1,000 invested at the beginning of the period and held for the entire period from April 1, 2008 to September 30, 2008.
Actual Expenses
The first line below each Fund’s name in the table below provides information about actual account values and actual expenses. You may use the information in this line, together with the amount you invested, to estimate the expenses that you paid over the period. Simply divide your account value by $1,000 (for example, an $8,600 account value divided by $1,000 = 8.6), then multiply the result by the number in the first line under the name of your Fund under the heading entitled “Expenses Paid During Period” to estimate the expenses you paid on your account during this period.
Hypothetical Example for Comparison Purposes
The second line below each Fund’s name in the table below provides information about hypothetical account values and hypothetical expenses based on each Fund’s actual expense ratio for the six-month period ended September 30, 2008 and an assumed rate of return of 5% per year before expenses, which is not the Fund’s actual return. The hypothetical account values and expenses may not be used to estimate the actual ending account balances or expenses you paid for the period. You may use this information to compare the ongoing costs of investing in each Fund and other funds. To do so, compare the 5% hypothetical example with the 5% hypothetical examples that appear in the shareholder reports of the other funds.
Please note that the expenses shown in the table are meant to highlight your ongoing costs only and do not reflect any transactional costs, such as redemption fees. Therefore, the second line below each Fund’s name in the table is useful in comparing ongoing costs only, and will not help you determine the relative costs of owning different funds. If these transactional costs were included, your costs would have been higher.
| | | | | | | | | |
| | | Beginning
Account Value
4/1/2008 | | Ending
Account Value
9/30/2008 | | Expenses Paid
During Period
4/1/2008-
9/30/2008(1) |
Artisan Global Value Fund - Investor Shares | | | | | | | | | |
Actual | | $ | 1,000.00 | | $ | 926.50 | | $ | 6.94 |
Hypothetical (5% return before expenses) | | $ | 1,000.00 | | $ | 1,017.80 | | $ | 7.26 |
Artisan International Fund - Investor Shares | | | | | | | | | |
Actual | | $ | 1,000.00 | | $ | 767.84 | | $ | 5.39 |
Hypothetical (5% return before expenses) | | $ | 1,000.00 | | $ | 1,018.90 | | $ | 6.16 |
Artisan International Fund - Institutional Shares | | | | | | | | | |
Actual | | $ | 1,000.00 | | $ | 768.74 | | $ | 4.33 |
Hypothetical (5% return before expenses) | | $ | 1,000.00 | | $ | 1,020.10 | | $ | 4.95 |
85
SHAREHOLDER EXPENSE EXAMPLE (UNAUDITED)
| | | | | | | | | |
| | | Beginning
Account Value
4/1/2008 | | Ending
Account Value
9/30/2008 | | Expenses Paid
During Period
4/1/2008-
9/30/2008(1) |
Artisan International Small Cap Fund - Investor Shares | | | | | | | | | |
Actual | | $ | 1,000.00 | | $ | 681.95 | | $ | 6.35 |
Hypothetical (5% return before expenses) | | $ | 1,000.00 | | $ | 1,017.45 | | $ | 7.62 |
Artisan International Value Fund - Investor Shares | | | | | | | | | |
Actual | | $ | 1,000.00 | | $ | 877.12 | | $ | 5.77 |
Hypothetical (5% return before expenses) | | $ | 1,000.00 | | $ | 1,018.85 | | $ | 6.21 |
Artisan International Value Fund - Institutional Shares | | | | | | | | | |
Actual | | $ | 1,000.00 | | $ | 877.95 | | $ | 4.84 |
Hypothetical (5% return before expenses) | | $ | 1,000.00 | | $ | 1,019.85 | | $ | 5.20 |
Artisan Mid Cap Fund - Investor Shares | | | | | | | | | |
Actual | | $ | 1,000.00 | | $ | 894.50 | | $ | 5.87 |
Hypothetical (5% return before expenses) | | $ | 1,000.00 | | $ | 1,018.80 | | $ | 6.26 |
Artisan Mid Cap Fund - Institutional Shares | | | | | | | | | |
Actual | | $ | 1,000.00 | | $ | 895.61 | | $ | 4.50 |
Hypothetical (5% return before expenses) | | $ | 1,000.00 | | $ | 1,020.25 | | $ | 4.80 |
Artisan Mid Cap Value Fund - Investor Shares | | | | | | | | | |
Actual | | $ | 1,000.00 | | $ | 968.68 | | $ | 5.96 |
Hypothetical (5% return before expenses) | | $ | 1,000.00 | | $ | 1,018.95 | | $ | 6.11 |
Artisan Opportunistic Growth Fund - Investor Shares(2) | | | | | | | | | |
Actual | | $ | 1,000.00 | | $ | 932.00 | | $ | 0.32 |
Hypothetical (5% return before expenses) | | $ | 1,000.00 | | $ | 1,000.77 | | $ | 0.33 |
Artisan Opportunistic Value Fund - Investor Shares | | | | | | | | | |
Actual | | $ | 1,000.00 | | $ | 865.79 | | $ | 5.74 |
Hypothetical (5% return before expenses) | | $ | 1,000.00 | | $ | 1,018.85 | | $ | 6.21 |
Artisan Small Cap Fund - Investor Shares | | | | | | | | | |
Actual | | $ | 1,000.00 | | $ | 907.39 | | $ | 5.82 |
Hypothetical (5% return before expenses) | | $ | 1,000.00 | | $ | 1,018.90 | | $ | 6.16 |
Artisan Small Cap Value Fund - Investor Shares | | | | | | | | | |
Actual | | $ | 1,000.00 | | $ | 1,016.05 | | $ | 6.05 |
Hypothetical (5% return before expenses) | | $ | 1,000.00 | | $ | 1,019.00 | | $ | 6.06 |
(1) | Expenses are equal to the Fund’s ratio of expenses to average net assets for the six-month period ended September 30, 2008 (shown in the table that follows), multiplied by the average account value over the period, multiplied by 183/366 (to reflect the one-half year period). |
86
SHAREHOLDER EXPENSE EXAMPLE (UNAUDITED)
| | | |
| Fund | | Annualized Ratio of Expenses to Average
Net Assets for the Six-Month
Period Ended September 30, 2008 | |
Global Value - Investor Shares(a) | | 1.44 | % |
International - Investor Shares | | 1.22 | % |
International - Institutional Shares | | 0.98 | % |
International Small Cap - Investor Shares | | 1.51 | % |
International Value - Investor Shares | | 1.23 | % |
International Value - Institutional Shares | | 1.03 | % |
Mid Cap - Investor Shares | | 1.24 | % |
Mid Cap - Institutional Shares | | 0.95 | % |
Mid Cap Value - Investor Shares | | 1.21 | % |
Opportunistic Growth - Investor Shares(a)(b) | | 1.50 | % |
Opportunistic Value - Investor Shares | | 1.23 | % |
Small Cap - Investor Shares | | 1.22 | % |
Small Cap Value - Investor Shares | | 1.20 | % |
| | (a) | The annualized ratio of expenses to average net assets excludes expenses waived or paid by the Adviser or the board of directors. |
| | (b) | For the period from commencement of operations (September 22, 2008) through September 30, 2008. |
(2) | The account value and the expenses paid for Opportunistic Growth Fund have been presented for the period from commencement of operations (September 22, 2008) through September 30, 2008. Assuming a six month period, the actual account value as of September 30, 2008 and the expenses paid during period 4/1/2008 – 9/30/2008 would have been as follows: |
| | | | | | | | | |
| | | Beginning
Account Value
4/1/2008 | | Ending
Account Value
9/30/2008 | | Expenses Paid
During Period
4/1/2008-
9/30/2008 |
Artisan Opportunistic Growth Fund | | | | | | | | | |
Actual | | $ | 1,000.00 | | $ | 932.00 | | $ | 7.25 |
Hypothetical (5% return before expenses) | | $ | 1,000.00 | | $ | 1,017.50 | | $ | 7.57 |
87
FACTORS CONSIDERED IN APPROVING ARTISAN OPPORTUNISTIC GROWTH FUND’S ADVISORY AGREEMENT
Artisan Partners Limited Partnership (“Artisan Partners”) is responsible for management of Artisan Opportunistic Growth Fund’s (the “Fund”) investment portfolio and for overall management of the Fund’s business and affairs pursuant to an Investment Advisory Agreement dated May 15, 2008 (the “Advisory Agreement”). Artisan Partners is a Delaware limited partnership the sole general partner of which is Artisan Investment Corporation. Artisan Investment Corporation was incorporated on December 7, 1994 for the sole purpose of acting as general partner of Artisan Partners. Artisan Investment Corporation is owned by ZFIC, Inc., a Wisconsin corporation, which is controlled by Andrew A. Ziegler and Carlene M. Ziegler, who together control 100% of its voting stock. The principal address of Artisan Partners is 875 E. Wisconsin Avenue, Suite 800, Milwaukee, Wisconsin 53202. Artisan Partners also has offices at 100 Pine Street, Suite 2950, San Francisco, California 94111; One Maritime Plaza, Suite 1450, San Francisco, California 94111; Five Concourse Parkway NE, Suite 2200, Atlanta, Georgia 30328; 1350 Avenue of the Americas, Suite 3005, New York, New York 10019; and 800 Delaware Avenue, Suite 800, Wilmington, Delaware 19801.
The Advisory Agreement for the Fund must be approved initially (a) by the vote of a majority of the directors of Artisan Funds who are not “interested persons” of the Fund or Artisan Partners cast in person at a meeting called for the purpose of voting on such approval, and (b) by the board of directors or by the vote of a majority (as defined in the Investment Company Act of 1940) of the outstanding shares of the Fund. The Advisory Agreement provides that Artisan Partners shall not be liable for any loss suffered by the Fund or its shareholders as a consequence of any act or omission in connection with or pursuant to the Advisory Agreement, except by reason of willful misfeasance, bad faith or gross negligence on the part of Artisan Partners in the performance of its duties or from reckless disregard by Artisan Partners of its obligations and duties under the Advisory Agreement. The Advisory Agreement will be in effect until November 30, 2009 and will terminate automatically in the event of its assignment (as defined in the Investment Company Act of 1940).
The Fund’s board of directors, including the independent directors, formally considered the initial approval of the Advisory Agreement at a meeting held on May 15, 2008.
Prior to the May 15, 2008 meeting, independent counsel to the independent directors sent to Artisan Partners a request for information to be provided to the directors in connection with the initial approval of the Advisory Agreement. Artisan Partners provided materials to the directors that included responses to that request, other information Artisan Partners believed was useful in evaluating the Advisory Agreement and reports prepared by Lipper Inc. (“Lipper”), an independent source of investment company data, relating to the Fund’s management fees and expenses compared to the management fees and expenses of a relatively small peer group determined by Lipper to be comparable. The directors also received and reviewed a memorandum from their independent counsel regarding the directors’ responsibilities in evaluating the Fund’s investment advisory agreement.
88
FACTORS CONSIDERED IN APPROVING ARTISAN OPPORTUNISTIC GROWTH FUND’S ADVISORY AGREEMENT
In evaluating the Advisory Agreement, the directors, including the independent directors, reviewed the available information and discussed with representatives of Artisan Partners the nature, extent and quality of the advisory and other services to be provided by Artisan Partners to the Fund, the anticipated overall expense ratios of the Fund, and the prospect for economies of scale and other benefits being derived by Artisan Partners from its relationship with the Fund. In addition to the third party reports by Lipper and the memorandum from independent counsel, the directors reviewed the information provided prior to the meeting concerning the following:
| • | | The terms of the Advisory Agreement, which were generally the same as those of investment advisory agreements for other Artisan Funds, with the exception of the fees, including: a list of services performed by Artisan Partners; Artisan Partners’ responsibility for making investment decisions and for observing investment objectives, policies and restrictions of the Fund; Artisan Partners’ standard of care; and termination provisions; |
| • | | Artisan Partners’ personnel and operations, including: the education, experience and number of Artisan Partners’ investment personnel; Artisan Partners’ assessment of its ability to attract and retain capable investment and business professionals through compensation programs and equity participation and recent hiring and retention information; Artisan Partners’ research and decision-making processes, including methods adopted to ensure compliance with investment objectives, policies and restrictions of the Fund; the compensation of Artisan Partners’ personnel with primary responsibility for managing the Fund; the time and attention of Artisan Partners’ personnel devoted to the Fund; and the adequacy and sophistication of Artisan Partners’ technology and systems with respect to investment and administrative matters; |
| • | | Potential for conflicts of interest between the Fund and Artisan Partners and circumstances and actions addressing or bearing on potential conflicts of interest, including: the type and number of other clients served by Artisan Partners; the basis of sharing personnel, services, research and advice among clients; the basis of decisions by Artisan Partners to buy or sell securities for the Fund and other clients where the same security might be bought or sold for a number of clients; Artisan Partners’ methodology of allocating investment opportunities, among the Fund and other clients; potential advantages and disadvantages in having an investment adviser that has other clients; Artisan Partners’ own investments and possible conflicts with the Fund; Artisan Partners’ code of ethics; and litigation pending, threatened or settled involving Artisan Partners, and results of any regulatory examinations; |
| • | | Potential “fall-out” benefits gained by Artisan Partners or its affiliates from their proposed relationship with the Fund, including: benefits to Artisan Partners in attracting and retaining other clients and the method of estimating other benefits; |
| • | | Brokerage and portfolio transactions, including: the standards and performance in seeking best execution; commissions paid, including commissions by purpose; allocation of brokerage for research products and services (“soft dollars”); and Artisan Partners’ practices in light of SEC guidance under Section 28(e) of the Securities Exchange Act of 1934; |
| • | | The structure of advisory fees charged, including: the method of computing fees; recognition of economies of scale through breakpoints in the fees; the frequency of the payment of fees; and potential cost savings by Artisan Partners, incentives to effect savings and the sharing of savings with the Fund; |
89
FACTORS CONSIDERED IN APPROVING ARTISAN OPPORTUNISTIC GROWTH FUND’S ADVISORY AGREEMENT
| • | | The effect of advisory and other fees on the Fund’s total expenses, including: comparisons of expenses and expense ratios with those of other mutual funds, taking into account comparability factors such as size, account-level charges and investment objective; voluntary expense limitations or reductions and relationship of expenses to expense limitations; the allocation of certain expenses between Artisan Partners, Artisan Distributors, LLC, the Fund’s distributor, and the Fund; and fees paid to service providers other than Artisan Partners, including custodial, transfer agent and shareholder servicing fees; and |
| • | | The financial condition and stability of Artisan Partners. |
In the course of reviewing and discussing the relevant information regarding the initial approval of the Fund’s Advisory Agreement, the directors, including the independent directors, reviewed and discussed the following information:
The nature, extent and quality of Artisan Partners’ services. The directors, including the independent directors, reviewed the nature, extent and the quality of Artisan Partners’ services to the Fund and considered the following:
| • | | Besides investment management, Artisan Partners will provide the Fund with general administration services, including the preparation of regulatory filings, supervision of the pricing of the Fund’s portfolios and calculation of net asset value, and management of the Fund’s relationships with third parties, including its custodian, transfer agent and other service providers. |
| • | | The quality of Artisan Partners’ services to the Fund in absolute terms and relative to mutual fund industry standards. |
| • | | The sufficiency and quality of Artisan Partners personnel. |
| • | | Artisan Partners’ financial condition. |
The investment performance of the Fund. Because the Fund is not yet operational, it had no performance history of its own to review. However, the directors reviewed the performance history of Artisan Partners’ opportunistic growth investment strategy for the period from its inception in February 2007 through March 31, 2008 and took into account that the opportunistic growth strategy, in which the Fund’s portfolio would be invested, had outperformed its benchmarks over that period. In addition, the directors, including the independent directors, took into account the Fund’s investment management team and the team’s positive performance record on behalf of Artisan Mid Cap Fund.
Cost of services, economies of scale and benefits derived by Artisan Partners. The directors, including the independent directors, reviewed the overall estimated expense ratio of the Fund in comparison to the expense ratios of the peers selected by Lipper in relation to the nature and quality of services provided. In this regard, the directors considered Artisan Partners’ agreement to reimburse the Fund for any ordinary operating expenses in excess of 1.50% of the Fund’s average net asset annually. The directors, including the independent directors, also considered whether shareholders of the Fund will benefit from economies of scale under the management fee structure in the Advisory Agreement. In their review, the directors, including the independent directors, considered the following:
| • | | Under the proposed fee schedule, the Fund would pay Artisan Partners a monthly fee at the annual rate of 0.900 of 1% of the Fund’s average daily net assets up to $1 billion; 0.875 |
90
FACTORS CONSIDERED IN APPROVING ARTISAN OPPORTUNISTIC GROWTH FUND’S ADVISORY AGREEMENT
| | of 1% of the Fund’s average daily net assets from $1 billion up to $4 billion; 0.850 of 1% of the Fund’s average daily net assets from $4 billion to $8 billion; 0.825 of 1% of the Fund’s average daily net assets from $8 billion up to $12 billion; and 0.800 of 1% of the Fund’s average daily net assets over $12 billion. |
| • | | The contractual management fee paid to Artisan Partners by the Fund is in line with those paid by other funds in Lipper’s peer group for the Fund and will be lower after expense reimbursement. |
| • | | The expense cap, while voluntary, is expected to remain in place indefinitely. |
Profitability of Artisan Partners. Because the Fund is not yet operational, the directors did not review the profitability of Artisan Partners. However, the directors, including the independent directors, noted that Artisan Partners does not expect to be profitable with respect to the Fund for a period of time until the Fund reaches an asset level that is sufficient to cover the expected expense level.
Other benefits derived by the Fund or Artisan Partners. The directors, including the independent directors, then reviewed the potential benefits that Artisan Partners may derive as a result of its relationship with the Fund, other than the services provided by Artisan Partners pursuant to the Advisory Agreement and the management fees paid in return. For Artisan Partners, the directors, including the independent directors, considered two potential benefits to Artisan Partners: (1) the potential conversion of a Fund shareholder to a separate account client; and (2) the acquisition of research products and services in return for commissions (soft dollars). The directors, including the independent directors, noted that, although Artisan Partners may derive those additional benefits, the Fund also benefits in similar fashion. In reaching those conclusions, the directors, including the independent directors, considered the following:
| • | | Artisan Partners does not solicit the Fund’s shareholders to become separate account clients nor to purchase other goods or services provided by Artisan Partners or its affiliates. Artisan Partners refers potential separate account clients that do not meet Artisan Partners’ minimum separate account size requirements to the Fund. |
| • | | Artisan Partners utilizes third-party research products and services and proprietary research from executing brokers paid for with soft dollars paid by the Fund and by other clients of Artisan Partners. Artisan Partners’ use of soft dollars provides Artisan Partners, and thereby the Fund, with access to third party and proprietary research and also helps Artisan Partners maintain important and open relationships with brokers. Use of the Fund’s commissions for soft dollar purposes is on the same terms as every other client account managed by Artisan Partners in the same investment strategy. |
Based on the foregoing, the directors then reached the following conclusions:
The nature, extent and quality of Artisan Partners’ services. The directors concluded that the nature and extent of Artisan Partners’ services to the Fund would be appropriate and consistent with, and in some cases more advantageous to the Fund than, the terms of the Advisory Agreement. The directors also concluded that Artisan Partners has sufficient personnel, with appropriate education and experience, to serve the Fund effectively and has demonstrated its continuing ability to attract and retain well qualified personnel.
91
FACTORS CONSIDERED IN APPROVING ARTISAN OPPORTUNISTIC GROWTH FUND’S ADVISORY AGREEMENT
The investment performance of the Fund. The directors concluded that while the Fund had not yet begun operations and had no performance history, the proposed investment management team had produced positive historical performance for Artisan Mid Cap Fund and had achieved results outperforming the benchmark in Artisan Partners’ opportunistic growth strategy, in which the Fund’s portfolio would be managed, over the period since the strategy’s inception in February 2007 through March 31, 2008. Based on that information, the prospects for the performance of the Fund were favorable.
Cost of services, economies of scale and benefits derived by Artisan Partners. The directors concluded that the overall estimated expense ratio of the Fund (after giving effect to Artisan Partners’ undertaking to reimburse the Fund for ordinary operating expenses in excess of 1.50% of the Fund’s average net assets annually) was within an acceptable range of the expense ratios of the peer group of funds selected by Lipper. The directors concluded that the fees to be paid by the Fund to Artisan Partners would be fair and reasonable in relation to the nature, extent and quality of services to be provided to the Fund and in comparison to fees Artisan Partners charges to accounts with similar investment strategies. It was also concluded that Artisan Partners is not likely to benefit from economies of scale beyond those subsumed in the breakpoints included in the proposed fee schedule.
Other benefits derived by the Fund or Artisan Partners. The directors concluded that, other than the services provided by Artisan Partners pursuant to the Advisory Agreement and the management fees paid in return, the Fund and Artisan Partners may potentially benefit from their relationship with each other in several ways. For Artisan Partners, the directors concluded there were two principal benefits: (1) the potential conversion of a Fund shareholder to a separate account client; and (2) the acquisition of research products and services in return for commissions (“soft dollars”). The directors concluded that, although Artisan Partners derives or may derive those additional benefits, the Fund also could benefit from conversions of separate account clients to Fund shareholders and would benefit from Artisan Partners’ use of soft dollars with respect to its separate account clients.
Following those discussions, the board approved the Fund’s Advisory Agreement by the unanimous vote of all directors and also by the unanimous vote of all the independent directors.
92
NOTES ON MANAGEMENT’S DISCUSSION OF FUND PERFORMANCE AND PORTFOLIO HOLDINGS’ CLASSIFICATION
The discussions of each Fund included in this report include statistical information about the portfolios of each of the Funds. Except as otherwise noted, that information is as of September 30, 2008. That information will vary with changes in a Fund’s portfolio investments. The performance information for each Fund relative to its benchmark index discussed in this report was prepared by the Adviser using information reported by FactSet Databases (“FactSet”). For the purposes of assigning portfolio securities to a particular country, the Adviser considers an issuer to be from a particular country as designated by its securities information vendors. The Adviser currently uses MSCI as its primary source and FactSet as a secondary source for this information. In the event (i) the Adviser’s securities information vendors do not assign a security to a particular country or if the published classification appears to be erroneous, or (ii) its primary vendor does not assign a security to a particular country and the secondary vendor has assigned a security to a particular country by using a methodology that is not the same as the methodology the primary vendor uses to assign a country, the Adviser assigns the security to a country using the primary vendor’s published criteria (to the extent available) or the Adviser’s own judgment. The primary information vendor’s criteria include the identity of the jurisdiction of the issuer’s incorporation, the main equity trading market for the issuer’s securities, the geographical distribution of the issuer’s operations and the location of the issuer’s headquarters. Country designations may change over time.
For the purposes of assigning portfolio securities to a particular sector and industry, the Adviser assigns securities in accordance with the sector and industry classifications of the Global Industry Classification Standard (GICS®) developed by MSCI and Standard & Poor’s (to the extent available) as a primary source and FactSet (to the extent available) as a secondary source for this information. In the event the Adviser’s securities information vendors do not classify a security to a particular sector or industry or if the published classification appears to be erroneous, the Adviser classifies the security according to its own judgment, using other securities information vendors, the company description and other publicly available information about the company’s peer group. Sector and industry classifications may change over time.
The names of portfolio securities reflected in this report are as reported by the Funds’ data providers, may not represent the legal name of the entity and, in some cases, are translations of non-English names.
Definitions of Portfolio Statistics
Market Capitalization is the aggregate value of all of a company’s outstanding equity securities.
Weighted Average Market Cap is the average of the market capitalizations of the companies in the portfolio weighted by the size of each company’s position within the portfolio.
Descriptions of Indices
Each Fund’s performance is compared in this report to changes in one or more indices, including in all cases a broad-based index of changes in prices of securities in the market in which the Fund invests. All of the indices are unmanaged and their returns include reinvested dividends. Unlike the Funds’ returns, the returns of each index do not include the payment of sales commissions or other expenses that would be incurred in the purchase or sale of the securities included in that index. An investment cannot be made directly in an index. Fair value pricing is not employed by market indices.
93
NOTES ON MANAGEMENT’S DISCUSSION OF FUND PERFORMANCE AND PORTFOLIO HOLDINGS’ CLASSIFICATION
The indices to which the Funds are compared are:
Artisan Global Value Fund – Morgan Stanley Capital International All Country World IndexSM (MSCI ACWISM) is a market-weighted index of global developed and emerging markets.
Artisan International, Artisan International Small Cap and Artisan International Value Funds – Morgan Stanley Capital International EAFE® Index (MSCI EAFE®) is a market-weighted index of companies in developed markets, excluding the U.S. and Canada. MSCI EAFE®’s average annual return since inception of the International Fund is based upon a starting date of December 31, 1995.
Artisan International Fund – Morgan Stanley Capital International EAFE® Growth Index (MSCI EAFE® Growth) is a market-weighted index of companies in developed markets, excluding the U.S. and Canada, with higher price-to-book ratios. MSCI EAFE® Growth’s average annual return since inception of the International Fund is based upon a starting date of December 31, 1995.
Artisan International Small Cap Fund – Morgan Stanley Capital International EAFE® Small Cap Index (MSCI EAFE® Small Cap) is a market-weighted index of small companies in developed markets, excluding the U.S. and Canada.
Artisan International Value Fund – Morgan Stanley Capital International EAFE® Value Index (MSCI EAFE® Value) is a market-weighted index of companies in developed markets, excluding the U.S. and Canada, with lower price-to-book ratios.
Artisan Mid Cap and Artisan Mid Cap Value Funds – Russell Midcap® Index is a market-weighted index of about 800 medium-sized U.S. companies.
Artisan Mid Cap Fund – Russell Midcap® Growth Index is a market-weighted index of those medium-sized companies included in the Russell Midcap® Index with higher price-to-book and higher forecasted growth values.
Artisan Mid Cap Value Fund – Russell Midcap® Value Index is a market-weighted index of those medium-sized companies included in the Russell Midcap® Index with lower price-to-book ratios and lower forecasted growth values.
Artisan Opportunistic Growth and Artisan Opportunistic Value Funds – Russell 1000® Index is a market-weighted index of about 1,000 large U.S. companies.
Artisan Opportunistic Growth Fund – Russell 1000® Growth Index is a market-weighted index of those companies included in the Russell 1000® Index with higher price-to-book ratios and higher forecasted growth values.
Artisan Opportunistic Value Fund – Russell 1000® Value Index is a market-weighted index of those large companies included in the Russell 1000® Index with lower price-to-book ratios and lower forecasted growth values.
Artisan Small Cap and Artisan Small Cap Value Funds – Russell 2000® Index is a market-weighted index of about 2,000 small U.S. companies.
Artisan Small Cap Fund – Russell 2000® Growth Index is a market-weighted index of those small companies included in the Russell 2000® Index with higher price-to-book ratios and higher forecasted growth values.
Artisan Small Cap Value Fund – Russell 2000® Value Index is a market-weighted index of those small companies included in the Russell 2000® Index with lower price-to-book ratios and lower forecasted growth values.
94
NOTES ON MANAGEMENT’S DISCUSSION OF FUND PERFORMANCE AND PORTFOLIO HOLDINGS’ CLASSIFICATION
Trademarks
Trademarks and copyrights relating to the indices and products of portfolio companies mentioned in this report are owned by their respective owners. Except as otherwise indicated, the trademarks, including names, logos, slogans and service marks appearing in this report are the property of the Adviser and may not be copied, reproduced, published or in any way used without written permission.
The Global Industry Classification Standard (“GICS”) was developed by and is the exclusive property and a service mark of MSCI Inc. (“MSCI”) and Standard & Poor’s, a division of The McGraw-Hill Companies, Inc. (“S&P”) and is licensed for use by Artisan Partners Limited Partnership. Neither MSCI, S&P nor any third party involved in making or compiling the GICS or any GICS classifications makes any express or implied warranties or representations with respect to such standard or classification (or the results to be obtained by the use thereof), and all such parties hereby expressly disclaim all warranties of originality, accuracy, completeness, merchantability and fitness for a particular purpose with respect to any of such standard or classification. Without limiting any of the foregoing, in no event shall MSCI, S&P, any of their affiliates or any third party involved in making or compiling the GICS or any GICS classifications have any liability for any direct, indirect, special, punitive, consequential or any other damages (including lost profits) even if notified of the possibility of such damages.
The MSCI information may only be used by the reader, may not be reproduced or redisseminated in any form and may not be used to create any financial instruments or products or any indices. The MSCI information is provided on an “as is” basis and the reader of this information assumes the entire risk of any use made of this information. MSCI, each of its affiliates and each other person involved in or related to compiling, computing or creating any MSCI information (collectively, the “MSCI Parties”) expressly disclaims all warranties (including, without limitation, any warranties of originality, accuracy, completeness, timeliness, non-infringement, merchantability and fitness for a particular purpose) with respect to this information. Without limiting any of the foregoing, in no event shall MSCI Parties have any liability for any direct, indirect, special, incidental, punitive, consequential (including, without limitation, lost profits) or any other damages.
Russell Investment Group is the source and owner of the Russell Index data contained or reflected in this material and all trademarks and copyrights related thereto. The presentation may contain confidential information and unauthorized use, disclosure, copying, dissemination or redistribution is strictly prohibited. This is a presentation of Artisan Distributors LLC. Russell Investment Group is not responsible for the formatting or configuration of this material or for any inaccuracy in Artisan Distributors’ presentation thereof.
PROXY VOTING POLICIES AND PROCEDURES
You may obtain a description of Artisan Funds’ proxy voting policies and procedures, without charge, upon request by calling 800.344.1770. That information also is included in Artisan Funds’ statement of additional information, which is available without charge, on the Funds’ website at www.artisanfunds.com and on the Securities and Exchange Commission’s website at www.sec.gov.
Information relating to how each Artisan Fund, except Artisan Opportunistic Growth Fund, voted proxies relating to portfolio securities held during the twelve-month period ended June 30 is available without charge, on the Funds’ website at www.artisanfunds.com and on the Securities and Exchange Commission’s website at www.sec.gov. Artisan
95
PROXY VOTING POLICIES AND PROCEDURES
Opportunistic Growth Fund’s proxy voting record for the twelve-month period ending June 30, 2009 will be available by August 31, 2009, without charge, on the Funds’ website and on the Securities and Exchange Commission’s website.
INFORMATION ABOUT PORTFOLIO SECURITIES
Artisan Funds files a complete schedule of portfolio holdings with the Securities and Exchange Commission for the quarters ending December 31 and June 30 (the first and third quarters of the Funds’ fiscal year) on Form N-Q. The Funds’ Forms N-Q are available on the Securities and Exchange Commission’s website at www.sec.gov. You also may review and copy those documents by visiting the Securities and Exchange Commission’s Public Reference Room in Washington, D.C. Information on the operation of the Public Reference Room may be obtained by calling the Securities and Exchange Commission at 800.SEC.0330.
96
DIRECTORS AND OFFICERS
The board of directors has overall responsibility for the conduct of the affairs of Artisan Funds. Each director serves an indefinite term of unlimited duration until the next annual meeting of shareholders and until the election and qualification of his or her successor. The board of directors may fill any vacancy on the board provided that after such appointment at least two-thirds of the directors have been elected by the shareholders. The shareholders may remove a director by a vote of a majority of the outstanding shares of the Funds at any meeting of shareholders called for the purpose of removing such director.
The board of directors elects the officers of Artisan Funds. Each officer serves until the election and qualification of his or her successor, or until he or she sooner dies, resigns, or is removed or disqualified. The board of directors may remove any officer with or without cause at any time.
The names and ages of the directors and officers as of November 14, 2008, the position each holds with the Funds, the date each was first elected to office, their principal business occupations and other directorships they have held during the last five years are shown below. Each director oversees all eleven series of Artisan Funds.
| | | | | | | | |
| | | | | |
Name and Age at 11/14/08 | | Position(s)
Held with
Artisan Funds | | Date First Elected
or Appointed to Office | | Principal Occupation(s) during Past 5 Years | | Other Public Company or
Registered Investment
Company Directorships Held |
| Directors who are not “interested persons” of Artisan Funds: |
| David A. Erne – 65 | | Director and Independent Chair of the Board of Directors | | Director since 3/27/95; Independent Chair since 2/4/05 | | Of counsel to the law firm Reinhart Boerner Van Deuren s.c., Milwaukee, WI. | | Trustee, Northwestern Mutual Life Insurance Company. |
| Thomas R. Hefty – 61 | | Director | | 3/27/95 | | Retired; from January 2007 to February 2008, President, Kern Family Foundation (private, grant-making organization); until December 2006, of counsel to the law firm Reinhart Boerner Van Deuren s.c., Milwaukee, WI; until December 2006, Adjunct Faculty, Department of Business and Economics, Ripon College. | | None. |
| Jeffrey A. Joerres – 48 | | Director | | 8/9/01 | | Chairman of the Board, President and Chief Executive Officer of Manpower Inc. (non-governmental employment service organization). | | Director, Johnson Controls, Inc. (manufacturer of automotive systems and building controls). |
| Patrick S. Pittard – 62 | | Director | | 8/9/01 | | Distinguished Executive in Residence (teaching position), University of Georgia. | | Director, Cbeyond, Inc. (telecommunications company); Director, Lincoln National Corporation (insurance and investment management company). |
| Howard B. Witt – 68 | | Director | | 3/27/95 | | Retired; until December 2004, Chairman of the Board, President and Chief Executive Officer of Littelfuse, Inc. (manufacturer of advanced circuit protection devices). | | Director, Franklin Electric Co., Inc. (manufacturer of electric motors). |
97
DIRECTORS AND OFFICERS
| | | | | | | | |
| | | | | |
Name and Age at 11/14/08 | | Position(s)
Held with
Artisan Funds | | Date First Elected
or Appointed to Office | | Principal Occupation(s) during Past 5 Years | | Other Public Company or
Registered Investment
Company Directorships Held |
| Director who is an “interested person” of Artisan Funds: |
| Andrew A. Ziegler – 51* | | Director, President and Chief Executive Officer | | Director since 1/5/95 and Chairman of the Board 1/5/95 – 12/19/03; President since 12/19/03 (Chief Executive Officer continuously since 1/5/95) | | Managing Director of Artisan Partners; Chairman and President of Artisan Distributors LLC; until December 2003, Chairman of Artisan Funds. | | None. |
| Officers: |
| Lawrence A. Totsky – 49 | | Chief Financial Officer and Treasurer | | 1/22/98 | | Managing Director and Chief Financial Officer of Artisan Partners; Vice President, Chief Financial Officer and Treasurer of Artisan Distributors LLC. | | None. |
| Janet D. Olsen – 52 | | General Counsel and Secretary | | 1/18/01 | | Managing Director and General Counsel of Artisan Partners; Vice President and Secretary of Artisan Distributors LLC. | | None. |
| Brooke J. Billick – 54 | | Chief Compliance Officer | | 8/19/04 | | Chief Compliance Officer and Associate Counsel of Artisan Partners; Chief Compliance Officer of Artisan Distributors LLC; prior to joining Artisan Partners in February 2004, Vice President, Securities Counsel and Corporate Secretary of Marshall & Ilsley Trust Company, N.A. (bank) and M&I Investment Management Corp. (investment adviser) and Chief Legal Officer and Secretary of Marshall Funds, Inc. (mutual fund company). | | None. |
| Carlene M. Ziegler – 52 | | Vice President | | 3/27/95 | | Managing Director of Artisan Partners; until April 2008, Portfolio Co-Manager of Artisan small-cap growth strategy, including Artisan Small Cap Fund; until February 2005, Director of Artisan Funds. | | None. |
| Michael C. Roos – 50 | | Vice President | | 12/19/03 | | Managing Director of Artisan Partners; Vice President of Artisan Distributors LLC; until December 2003, President of Artisan Funds. | | None. |
| * | Mr. Ziegler is an “interested person” of Artisan Funds, as defined in the Investment Company Act of 1940, because he is a Managing Director of Artisan Partners and an officer and director of Artisan Investment Corporation (the general partner of Artisan Partners). Mr. Ziegler and Carlene M. Ziegler (who are married to each other) control Artisan Partners. Mr. Ziegler is also President of Artisan Distributors LLC, Artisan Funds’ principal underwriter. |
98
DIRECTORS AND OFFICERS
| | | | | | | | |
| | | | | |
Name and Age at 11/14/08 | | Position(s)
Held with
Artisan Funds | | Date First Elected
or Appointed to Office | | Principal Occupation(s) during Past 5 Years | | Other Public Company or
Registered Investment
Company Directorships Held |
| Gregory K. Ramirez – 38 | | Assistant Secretary and Assistant Treasurer | | 1/22/98 | | Managing Director of Artisan Partners; Assistant Treasurer of Artisan Distributors LLC. | | None. |
| Sarah A. Johnson – 36 | | Assistant Secretary | | 2/5/03 | | Associate Counsel of Artisan Partners. | | None. |
The business address of the officers and directors affiliated with Artisan Partners is 875 E. Wisconsin Avenue, Suite 800, Milwaukee, Wisconsin 53202. The addresses of the other directors are: Mr. Erne – 1000 North Water Street, Suite 2100, Milwaukee, Wisconsin 53202; Mr. Joerres – 100 Manpower Place, Milwaukee, Wisconsin 53212; and Mr. Hefty, Mr. Pittard and Mr. Witt – c/o Artisan Funds, 875 E. Wisconsin Avenue, Suite 800, Milwaukee, Wisconsin 53202.
Artisan Funds’ statement of additional information (SAI) contains further information about the directors. Please call 800.344.1770 or visit our website at www.artisanfunds.com for a free copy of the SAI.
99
| | | | |
 | | ARTISAN FUNDS P.O. BOX 8412 BOSTON, MA 02266-8412 800.344.1770 WWW.ARTISANFUNDS.COM | | |


ARTISAN
ANNUAL
REPORT
SEPTEMBER 30, 2008
ARTISAN EMERGING
MARKETS FUND
_________
ARTISAN INTERNATIONAL
FUND
_________
ARTISAN INTERNATIONAL
VALUE FUND
_________
ARTISAN MID CAP FUND
ARTISAN FUNDS, INC.
INSTITUTIONAL SHARES
TABLE OF CONTENTS
ARTISAN FUNDS
P.O. BOX 8412
BOSTON, MA 02266-8412
This report and the audited financial statements contained herein are provided for the general information of the shareholders of the Institutional Shares of Artisan Emerging Markets Fund, Artisan International Fund, Artisan International Value Fund and Artisan Mid Cap Fund. Before investing, investors should consider carefully each Fund’s investment objective, risks and charges and expenses. For more complete information on any Fund, including fees and expenses, please call 800.399.1770 for a free prospectus. Read it carefully before you invest or send money.
Company discussions are for illustration only and are not intended as recommendations of individual stocks. The discussions present information about the companies believed to be accurate, and the views of the portfolio managers, as of September 30, 2008. That information and those views may change, and the Funds disclaim any obligation to advise shareholders of any such changes.
Artisan Funds offered through Artisan Distributors LLC, member FINRA.
ARTISAN EMERGING MARKETS FUND
INSTITUTIONAL SHARES
INVESTMENT PROCESS HIGHLIGHTS
| | |
Artisan Emerging Markets Fund uses a fundamental research process to construct a diversified portfolio of emerging market companies. The team’s investment process is focused on identifying companies that are priced at a discount relative to the team’s estimate of their sustainable earnings. • Sustainable Earnings. The team believes that over the long term a stock’s price is directly related to the company’s sustainable earnings. The team determines a company’s sustainable earnings based upon financial and business analysis. The team’s financial analysis focuses on a company’s balance sheet, income statement, and statement of cash flows within a normalized return on equity model to assess earnings potential. The team’s business analysis examines a company’s competitive advantages and financial strength to assess sustainability. • Valuation. The team believes that investment opportunities develop when businesses with sustainable earnings are undervalued relative to historical, industry and regional valuations. The team values a business and develops a price target based on the team’s assessment of the company’s sustainable earnings and cash flow expectations and the team’s risk analysis. • Risk Analysis. The team believes that a disciplined risk framework allows greater focus on fundamental stock selection. The team incorporates its assessment of company-specific and macroeconomic risks into its valuation analysis to develop a risk-adjusted target price. The team’s risk-rating assessment includes a review of the currency, interest rate, monetary and fiscal policy and political risks to which a company is exposed. |
|
| PERFORMANCE HISTORY | | |
GROWTH OF AN ASSUMED $1,000,000 INVESTMENT (6/26/2006 to 9/30/2008)
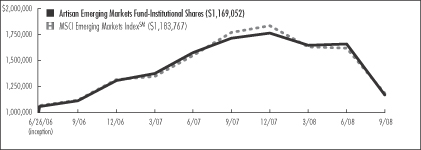
AVERAGE ANNUAL TOTAL RETURNS (as of 9/30/2008)
| | | | | | |
| Fund / Index | | 1-Year | | | Since
Inception | |
Artisan Emerging Markets Fund - Institutional Shares | | -31.91 | % | | 7.15 | % |
MSCI Emerging Markets IndexSM | | -33.20 | | | 7.74 | |
The performance quoted represents past performance, which does not guarantee future results. The investment return and principal value of an investment in the Fund will fluctuate, so that an investor’s shares in the Fund, when redeemed, may be worth more or less than their original cost. Current performance may be lower or higher than the performance data quoted. The Fund’s investments in initial public offerings (IPOs) made a material contribution to the Fund’s performance. IPO investments are not an integral component of the Fund’s investment process and may not be available in the future. For current to most recent month-end performance information call 800.399.1770. The graph and table above do not reflect the deduction of taxes that a shareholder would pay on distributions or sale of Fund shares. The performance shown does not reflect the deduction of a 2% redemption fee on shares held by an investor for 90 days or less and, if reflected, the fee would reduce the performance quoted. The Fund’s performance information reflects Artisan Partners’ voluntary undertaking to limit the Fund’s expenses, when they exceed 1.50%, which may be terminated at any time, has been in effect since the Fund’s inception and has had a material impact on the Fund’s performance. Absent that expense waiver, the Fund’s performance would have been lower. See page 47 for a description of each index.
2
INVESTING ENVIRONMENT
Global equities struggled over the twelve-month period ended September 30, 2008, and emerging markets were among the hardest hit as the MSCI Emerging Markets IndexSM declined -33.20%. During the first half of the period, emerging markets declined -7.76%, but there were still several pockets of positive performance, including Brazil and Russia where rising commodity prices supported these resource-heavy markets. The second half of the period, however, showed a marked difference in performance as emerging markets stocks declined -27.58%. A sharp reversal in commodity prices and the financial crisis in the U.S. were two of the leading causes of the directional turn of global markets. From a regional perspective, Asia suffered the largest declines over the whole period, as China and Korea fell more than -41%. In Latin America, stocks in Brazil and Mexico pulled back more than -20%. In the EMEA (Europe, Middle East & Africa) region, Russia was the worst performing market with a -37% decline, while South Africa held up slightly better in comparison, falling approximately -25%.
SECTOR DIVERSIFICATION
| | | | | | |
| Sector | | 9/30/07 | | | 9/30/08 | |
Consumer Discretionary | | 13.8 | % | | 10.6 | % |
Consumer Staples | | 8.0 | | | 8.4 | |
Energy | | 8.1 | | | 14.8 | |
Financials | | 17.8 | | | 13.6 | |
Healthcare | | 2.5 | | | 2.6 | |
Industrials | | 15.3 | | | 12.6 | |
Information Technology | | 11.2 | | | 10.2 | |
Materials | | 13.3 | | | 13.0 | |
Telecommunication Services | | 8.2 | | | 9.5 | |
Utilities | | 1.4 | | | 1.5 | |
Other assets less liabilities | | 0.4 | | | 3.2 | |
Total | | 100.0 | % | | 100.0 | % |
As a percentage of total net assets.
PERFORMANCE DISCUSSION
The Fund returned -31.91% for the twelve-month period. Our holdings in Brazil were one of the leading sources of weakness in the portfolio. Companhia Vale do Rio Doce, Dufry South America Ltd, and Rodobens Negocios Imobiliarios SA all posted double-digit losses. Helping to offset some of this weakness was strength in Petroleo Brasileiro S.A. and Companhia Brasileira de Distribuicao Grupo Pao de Acucar. Elsewhere in the portfolio, weakness in PIK Group, KazMunaiGas Exploration Production and Zhuzhou CSR Times Electric Co., Ltd. negatively impacted performance during the period. On the positive side, the portfolio benefited from strength in Eurasian Natural Resources Corporation, Razguliay Group and Orascom Construction Industries. On a relative basis, our underweight position in China, and more specifically our lack of investment in Chinese financials, was a positive. We continued to avoid Chinese financials as the combination of our valuation and risk analysis left most Chinese financials looking relatively unappealing to us.
FUND CHANGES
Our activity over the past twelve months was fairly broad-based, but all the purchases possessed, in our view, the potential to sustain earnings growth and were trading at attractive prices. Some of the more recent additions to the portfolio included Cairn India Ltd., Hypermarcas SA, Globaltrans Investment PLC and Antofagasta plc. We also repurchased Turkcell Iletisim Hizmetleri AS. Our purchases were funded in part by sales of Kookmin Bank (Korea), Manila Water Company (Philippines), ABSA Group Limited (South Africa) and Anhanguera Educacional Participacoes SA (Brazil).
REGION ALLOCATION
| | | | | | |
| Region | | 9/30/07 | | | 9/30/08 | |
Emerging Asia | | 43.9 | % | | 36.2 | % |
Emerging Europe, Middle East & Africa | | 26.7 | | | 27.5 | |
Latin America | | 22.7 | | | 27.9 | |
Developed Markets | | 6.3 | | | 5.2 | |
As a percentage of total net assets.
3
ARTISAN INTERNATIONAL FUND
INSTITUTIONAL SHARES
INVESTMENT PROCESS HIGHLIGHTS
Artisan International Fund uses a fundamental stock selection process focused on identifying long-term growth opportunities.
Themes. The investment team’s thematic approach identifies catalysts for change and develops investment themes with the objective of capitalizing on them globally. Changing demographics, developing technology, privatization of economic resources and outsourcing are among the long-term catalysts for change that currently form the basis for the team’s investment themes. The team incorporates these catalysts along with sector and regional fundamentals into a long-term global framework for investment analysis and decision-making.
Sustainable Growth. The team applies a fundamental approach to identifying the long term, sustainable growth characteristics of potential investments. The team seeks high quality companies that are well managed, have a dominant or improving market position and competitive advantages compared to industry and regional peers.
Valuation. The team assesses the relationship between its estimate of a company’s sustainable growth prospects and the company’s stock price. The team uses multiple valuation metrics to establish price targets.
The Fund primarily invests in non-U.S. growth companies of all market capitalizations in developed and emerging markets.
PERFORMANCE HISTORY
GROWTH OF AN ASSUMED $5,000,000 INVESTMENT (7/1/1997 to 9/30/2008)
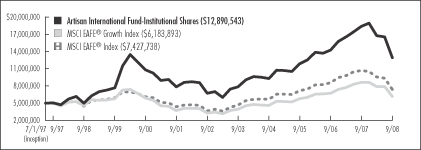
AVERAGE ANNUAL TOTAL RETURNS (as of 9/30/2008)
| | | | | | | | | | | | | | | |
| Fund / Index | | 1-Year | | | 3-Year | | | 5-Year | | | 10-Year | | | Since
Inception | |
Artisan International Fund – Institutional Shares | | -29.83 | % | | 2.81 | % | | 10.34 | % | | 9.83 | % | | 8.78 | % |
MSCI EAFE® Growth Index | | -28.48 | | | 2.16 | | | 9.23 | | | 2.97 | | | 1.91 | |
MSCI EAFE® Index | | -30.50 | | | 1.12 | | | 9.69 | | | 5.02 | | | 3.58 | |
The performance quoted represents past performance, which does not guarantee future results. The investment return and principal value of an investment in the Fund will fluctuate, so that an investor’s shares in the Fund, when redeemed, may be worth more or less than their original cost. Current performance may be lower or higher than the performance data quoted. For current to most recent month-end performance information, visit www.artisanfunds.com or call 800.399.1770. The graph and table above do not reflect the deduction of taxes that a shareholder would pay on distributions or sale of Fund shares. The performance shown does not reflect the deduction of a 2% redemption fee on shares held by an investor for 90 days or less and, if reflected, the fee would reduce the performance quoted. See page 48 for a description of each index.
4
INVESTING ENVIRONMENT
International equities broadly struggled throughout the fiscal year. As the U.S. financial crisis spread across the economy and around the world, trading volatility surged to a record high. Amid this backdrop, the MSCI EAFE® Index declined -30.50%. There were no safe havens as every sector declined by double digits, although traditionally defensive sectors such as healthcare, utilities and consumer staples held up best. Financial and material stocks were the biggest decliners. Amid the worldwide financial crisis, housing market debacle and volatile commodity environment, it is not surprising that many of these stocks struggled. Results were also disappointing on a regional basis. Every country in the EAFE Index dropped by more than -20%. Emerging markets also suffered — the MSCI Emerging Markets IndexSM declined more than -30% over the twelve-month period ended September 30, 2008.
SECTOR DIVERSIFICATION
| | | | | | |
| Sector | | 9/30/2007 | | | 9/30/2008 | |
Consumer Discretionary | | 8.4 | % | | 11.2 | % |
Consumer Staples | | 9.1 | | | 9.8 | |
Energy | | 6.4 | | | 9.1 | |
Financials | | 23.4 | | | 14.2 | |
Healthcare | | 2.5 | | | 7.9 | |
Industrials | | 16.1 | | | 17.4 | |
Information Technology | | 3.8 | | | 4.7 | |
Materials | | 7.6 | | | 7.4 | |
Telecommunication Services | | 10.7 | | | 3.1 | |
Utilities | | 8.8 | | | 9.4 | |
Other assets less liabilities | | 3.2 | | | 5.8 | |
Total | | 100.0 | % | | 100.0 | % |
As a percentage of total net assets.
PERFORMANCE DISCUSSION
The Fund declined -29.83% during the fiscal year. We benefited from positive security selection in the telecom, materials and technology sectors. Our top contributors included telecom companies China Mobile Limited, China Unicom Limited and China Netcom Group Corporation (Hong Kong) Limited. Retail banker Standard Chartered plc, consumer holdings Grupo Televisa S.A. and Carrefour SA, and automobile manufacturer HONDA MOTOR CO., LTD also performed well.
Relative results were held back by weaknesses among our financial, energy and utilities holdings. Commercial bank Lloyds TSB Group plc, Gazprom, the largest natural gas producing company in the world, and utilities Electricite de France and RAO Unified Energy System were among our biggest detractors in these sectors. ASML Holding N.V., Wacker Chemie AG, Orkla ASA, Daimler AG and Vinci SA were other weak performers.
FUND CHANGES
Our fundamental stock selection process focuses on companies with sustainable growth characteristics, trading at reasonable valuations with exposure to the secular themes we have identified. We have used this period of extreme volatility to critically evaluate our holdings and focus capital in our highest conviction positions. As of the period’s end we held 79 positions, marking the first time in 11 years that we have held fewer than 80 stocks.
We added capital to those positions that we believe offer the strongest potential for outperformance on a long-term basis. These included Gazprom, Lloyds TSB Group plc, Orkla ASA, Vinci SA and ASML Holding N.V.
We also initiated new positions in Cadbury PLC, one of the world’s largest confectionary companies, and Petroleo Brasileiro S.A., one of the world’s largest oil and natural gas producers.
As the weakness in the market highlighted long-term risks to growth, we sold our positions in China Unicom Limited, Deutsche Telekom AG, Swire Pacific Limited, Kookmin Bank, Swiss Re, Mitsubishi Heavy Industries, Ltd. and RWE AG.
REGION ALLOCATION
| | | | | | |
| Region | | 9/30/2007 | | | 9/30/2008 | |
Europe | | 58.9 | % | | 61.0 | % |
Emerging Markets | | 19.1 | | | 15.5 | |
Pacific Basin | | 17.6 | | | 15.0 | |
Americas | | 1.2 | | | 2.2 | |
Middle East | | — | | | 0.5 | |
As a percentage of total net assets.
5
ARTISAN INTERNATIONAL VALUE FUND
INSTITUTIONAL SHARES
INVESTMENT PROCESS HIGHLIGHTS
Artisan International Value Fund uses a bottom-up investment process focused on identifying what the investment team believes are high quality, undervalued businesses that offer the potential for superior risk/reward outcomes.
The team’s in-depth research process focuses on four key investment characteristics:
Undervaluation. Determining the intrinsic value of the business is the heart of the team’s research process. The team believes that intrinsic value represents the amount that a buyer would pay to own a company’s future cash flows. The team seeks to invest at a significant discount to its estimate of the intrinsic value of a business.
Business quality. The team seeks to invest in companies with histories of generating strong free cash flow, improving returns on capital and strong competitive positions in their industries.
Financial strength. The team believes that investing in companies with strong balance sheets helps to reduce the potential for capital risk and provides company management the ability to build value when attractive opportunities are available.
Shareholder-oriented management. The team’s research process attempts to identify management teams with a history of building value for shareholders.
The Fund primarily invests in common stocks and other equity securities of non-U.S. companies of all market capitalizations in developed and emerging markets.
PERFORMANCE HISTORY
GROWTH OF AN ASSUMED $5,000,000 INVESTMENT (10/1/2006 to 9/30/2008)
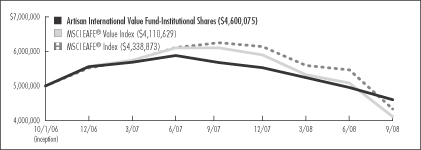
AVERAGE ANNUAL TOTAL RETURNS (as of 9/30/2008)
| | | | | | |
| Fund / Index | | 1-Year | | | Since
Inception | |
Artisan International Value Fund – Institutional Shares | | -18.92 | % | | -4.08 | % |
MSCI EAFE® Value Index | | -32.58 | | | -9.33 | |
MSCI EAFE® Index | | -30.50 | | | -6.85 | |
The performance quoted represents past performance, which does not guarantee future results. The investment return and principal value of an investment in the Fund will fluctuate, so that an investor’s shares in the Fund, when redeemed, may be worth more or less than their original cost. Current performance may be lower or higher than the performance data quoted. For current to most recent month-end performance information, visit www.artisanfunds.com or call 800.399.1770. The graph and table above do not reflect the deduction of taxes that a shareholder would pay on distributions or sale of Fund shares. The performance shown does not reflect the deduction of a 2% redemption fee on shares held by an investor for 90 days or less and, if reflected, the fee would reduce the performance quoted. See page 48 for a description of each index.
6
INVESTING ENVIRONMENT
The fiscal year ended September 30, 2008, was a tough year for international equity investors as stock markets were down across the board. Regionally all markets declined during the period, and even the energy sector, which had been a holdout, declined considerably over the last several months of our fiscal year. Economic indicators from Europe as well as emerging markets started to follow the slowdown that was already underway in the U.S. This slowdown accelerated as the liquidity crunch reached crisis levels. In response, governments around the world intervened to an unprecedented degree to shore up confidence in their respective banking industries.
SECTOR DIVERSIFICATION
| | | | | | |
| Sector | | 9/30/2007 | | | 9/30/2008 | |
Consumer Discretionary | | 23.5 | % | | 22.3 | % |
Consumer Staples | | 14.5 | | | 13.0 | |
Financials | | 16.1 | | | 19.0 | |
Healthcare | | 8.7 | | | 13.5 | |
Industrials | | 14.5 | | | 15.1 | |
Information Technology | | 5.9 | | | 8.3 | |
Materials | | 2.8 | | | 2.2 | |
Telecommunication Services | | 7.9 | | | 1.6 | |
Other assets less liabilities | | 6.1 | | | 5.0 | |
Total | | 100.0 | % | | 100.0 | % |
As a percentage of total net assets.
PERFORMANCE DISCUSSION
Artisan International Value Fund declined -18.92% during the twelve-month period ended September 30, 2008, holding up much better than the MSCI EAFE® Index, which decreased -30.50% over the same period.
Our aversion to the leverage that became commonplace in the financial services industry served us well during the fiscal year. We have thus far avoided some of the value destruction that has occurred in this environment. We remain focused on the intersection of balance sheet strength, business quality and valuation. We believe that this focus has helped us to manage risk in times such as these, while helping us to position the Fund for the opportunity to compound wealth over the long-term.
The following stocks had a meaningful positive impact on the portfolio during the fiscal year: SANKYO CO., LTD., a Japanese pachinko machine manufacturer; Covidien Ltd., a U.S. medical instruments maker that spun off from Tyco International Ltd. in 2007; Gemalto NV, a French smartcard maker; Benfield Group Plc, a U.K. reinsurance broker; and UNICHARM CORPORATION, a Japanese manufacturer of diapers and feminine products. Notable detractors during the period included Galiform Plc, a U.K. kitchen business; CanWest Global Communications Corp., a holding company that owns one of Canada’s television networks; Wolters Kluwer NV, a Dutch-based professional publishing company; Credit Saison Co., Ltd., a Japanese credit card company; and Esprinet S.p.A., an Italian computer and electronics distributor.
FUND CHANGES
Our hurdle rate for new investments moved up during the period as almost all of the stocks in our portfolio fell further from our estimates of their intrinsic value. We added to many of the companies we already owned as the existing portfolio got cheaper. We also added new names to the portfolio as we found some compelling values amid the general decline in stock prices. Two of the purchases we made during the fiscal year were French catering company Sodexo and Finland-based mobile phone maker Nokia Corporation.
We exited our positions in CanWest Global Communications Corp., Galiform Plc, Heidelberger Druckmaschinen AG and Esprinet S.p.A.
REGION ALLOCATION
| | | | | | |
| Region | | 9/30/2007 | | | 9/30/2008 | |
Europe | | 55.5 | % | | 63.8 | % |
Pacific Basin | | 19.4 | | | 14.2 | |
Americas | | 10.3 | | | 10.7 | |
Emerging Markets | | 8.7 | | | 6.3 | |
As a percentage of total net assets.
7
ARTISAN MID CAP FUND
INSTITUTIONAL SHARES
INVESTMENT PROCESS HIGHLIGHTS
Artisan Mid Cap Fund uses a bottom-up investment process to construct a diversified portfolio of U.S. mid-cap growth companies. The Fund’s investment process focuses on two distinct areas – security selection and capital allocation. The investment team believes that adhering to this process increases the likelihood of delivering upside participation with downside protection.
Artisan’s Mid Cap Fund investment team attempts to identify companies that possess franchise characteristics that are selling at attractive valuations and benefiting from an accelerating profit cycle.
Franchise characteristics. These are characteristics that the team believes help to protect a company’s stream of cash flow from the effects of competition. The team looks for companies with at least two of the following characteristics: low cost production capability, possession of a proprietary asset, dominant market share or a defensible brand name.
Attractive valuations. Through its own fundamental research, the team estimates the amount a private market buyer would pay to buy the entire company and considers whether to purchase a stock if it sells at a discount to that estimate.
Accelerating profit cycle. The team tries to invest in companies that are well positioned for long-term growth, at an early enough stage in their profit cycle to benefit from the increased cash flows produced by the emerging profit cycle.
Based on the investment team’s fundamental analysis of a company’s profit cycle, portfolio holdings develop through three stages. GardenSM investments are small positions in the early part of their profit cycle that will warrant a more sizeable allocation once their profit cycle accelerates. CropSM investments are positions that are being increased to a full weight because they are moving through the strongest part of their profit cycle. HarvestSM investments are positions that are being reduced as they near the team’s estimate of full valuation or their profit cycle begins to decelerate.
PERFORMANCE HISTORY
GROWTH OF AN ASSUMED $5,000,000 INVESTMENT (7/1/2000 to 9/30/2008)
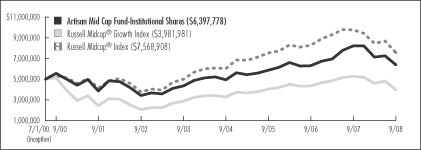
AVERAGE ANNUAL TOTAL RETURNS (as of 9/30/2008)
| | | | | | | | | | | | |
| Fund / Index | | 1-Year | | | 3-Year | | | 5-Year | | | Since
Inception | |
Artisan Mid Cap Fund – Institutional Shares | | -22.23 | % | | 2.91 | % | | 7.88 | % | | 3.03 | % |
Russell MidCap® Growth Index | | -24.65 | | | -0.75 | | | 6.53 | | | -2.72 | |
Russell MidCap® Index | | -22.36 | | | 0.09 | | | 8.62 | | | 5.15 | |
The performance quoted represents past performance, which does not guarantee future results. The investment return and principal value of an investment in the Fund will fluctuate, so that an investor’s shares in the Fund, when redeemed, may be worth more or less than their original cost. Current performance may be lower or higher than the performance data quoted. For current to most recent month-end performance information, visit www.artisanfunds.com or call 800.399.1770. The graph and table above do not reflect the deduction of taxes that a shareholder would pay on distributions or sale of Fund shares. See page 48 for a description of each index.
8
INVESTING ENVIRONMENT
During the fiscal year ended September 30, 2008, mid-cap stocks struggled along with the broader market as the Russell Midcap® Index declined -22.36%. The year was marked by weak economic conditions, volatile energy prices and a deep credit crisis. Value stocks outperformed growth names as the Russell Midcap® Growth Index fell -24.65%, while its value counterpart retreated -20.50%. Within the growth index, all sectors closed lower, with utilities, telecommunication services and consumer discretionary stocks down the most. Traditionally defensive sectors, such as consumer staples and healthcare, held up best, but also posted losses.
SECTOR DIVERSIFICATION
| | | | | | |
| Sector | | 9/30/2007 | | | 9/30/2008 | |
Consumer Discretionary | | 9.9 | % | | 7.7 | % |
Consumer Staples | | 4.9 | | | 4.8 | |
Energy | | 3.7 | | | 4.0 | |
Financials | | 6.5 | | | 8.0 | |
Healthcare | | 22.7 | | | 25.4 | |
Industrials | | 13.1 | | | 14.9 | |
Information Technology | | 31.1 | | | 28.5 | |
Materials | | 1.3 | | | 1.6 | |
Telecommunication Services | | 1.7 | | | 0.4 | |
Utilities | | — | | | 2.0 | |
Other assets less liabilities | | 5.1 | | | 2.7 | |
Total | | 100.0 | % | | 100.0 | % |
As a percentage of total net assets.
PERFORMANCE DISCUSSION
The Fund held up better than the Russell Midcap® Growth Index and underperformed the Russell Midcap® Index as it returned
-22.23% for the fiscal year. Relative to the benchmarks, the Fund benefited most from our healthcare holdings, but security selection results were also strong in the industrials and materials sectors. Top performers within the healthcare sector included robotic surgery systems manufacturer Intuitive Surgical, Inc., biopharmaceutical company Celgene Corporation, radiation therapy systems provider Varian Medical Systems, Inc. and biopharmaceutical company ImClone Systems Incorporated. In the industrials sector, much of our performance advantage came from the construction and engineering industry with contracting services company Quanta Services, Inc., one of our top performers. Our success in the materials sectors was largely due to fertilizer producer The Mosaic Company.
The key sources of weakness compared to the benchmark were our relatively low weight in energy stocks and select holdings in the consumer staples and consumer discretionary sectors. Our underperformance in the consumer staples sector was driven mostly by a decline in alternative beverage producer Hansen Natural Corporation. Footwear company Crocs, Inc. and auto components manufacturer BorgWarner Inc. were among our worst performing consumer discretionary holdings.
FUND CHANGES
Our security selection process is focused on identifying companies that possess franchise characteristics and an attractive valuation that are benefiting from an accelerating profit cycle. Our transaction activity was not concentrated in any one sector. Our largest new positions included beauty product marketer Avon Products Inc., investment manager Invesco Ltd., and healthcare diagnostics developer Gen-Probe Incorporated. We also added capital to many existing positions, most notably to services provider Cerner Corporation and network infrastructure company Juniper Networks, Inc.
We funded our new purchases with sales from a broad range of sectors. Patterson Companies, Inc., McDermott International Inc., Applied Biosystems Inc. and NAVTEQ Corporation were all CropSM positions at the beginning of the fiscal year and were sold during the year. Ventana Medical Systems Inc. was the subject of a takeover by Swiss pharmaceutical and diagnostics company Roche Holding AG. The transaction was completed during the period.
9
ARTISAN EMERGING MARKETS FUND
Schedule of Investments – September 30, 2008
| | | | | |
| | | Shares
Held | | Value |
| | | | | |
COMMON AND PREFERRED STOCKS - 96.8% | | | |
| | | | | |
| ARGENTINA - 1.2% | | | | | |
Tenaris S.A. (DR) | | 22,713 | | $ | 846,968 |
| | | | | |
| BRAZIL - 18.2% | | | | | |
Companhia Energetica de Minas Gerais- CEMIG, Preferred(1) | | 32,858 | | | 649,252 |
Companhia Vale do Rio Doce | | 132,500 | | | 2,499,737 |
Dufry South America Ltd (DR) | | 32,700 | | | 271,512 |
Empresa Brasileira de Aeronautica S.A. | | 83,500 | | | 574,833 |
Hypermarcas SA(1)(2) | | 77,200 | | | 526,188 |
Marcopolo S.A., Preferred(1) | | 168,600 | | | 442,122 |
Net Servicos de Comunicacao SA, Preferred(1)(2) | | 67,800 | | | 578,272 |
OGX Petroleo e Gas Participacoes SA(2) | | 1,153 | | | 234,490 |
Petroleo Brasileiro S.A. | | 185,400 | | | 4,113,505 |
Randon SA Implementos e Participacoes, Preferred(1) | | 83,600 | | | 472,718 |
Rodobens Negocios Imobiliarios SA | | 63,400 | | | 436,460 |
SEB - Sistema Educacional Brasileiro SA (Units)(1)(2) | | 63,000 | | | 430,396 |
Tim Participacoes S.A., Preferred(1) | | 242,400 | | | 503,169 |
Unibanco - Uniao de Bancos Brasileiros S.A. (Units)(1) | | 79,500 | | | 812,589 |
Votorantim Celulose e Papel S.A., Preferred(1) | | 19,300 | | | 292,101 |
Wilson Sons Limited (DR) | | 62,000 | | | 469,179 |
| | | | | |
| | | | | 13,306,523 |
| CHILE - 0.7% | | | | | |
Empresa Nacional de
Telecomunicaciones S.A. | | 39,409 | | | 489,446 |
| | | | | |
| CHINA - 8.8% | | | | | |
Airmedia Group, Inc. (DR)(2) | | 66,622 | | | 496,334 |
Chaoda Modern Agriculture (Holdings) Limited(3) | | 1,289,900 | | | 1,082,218 |
China Dongxiang Group Company(3) | | 1,797,000 | | | 519,962 |
China Railway Construction Corporation, H Shares(1)(2)(3) | | 468,500 | | | 620,444 |
GOME Electrical Appliances Holdings Limited(3) | | 2,644,752 | | | 772,044 |
Mindray Medical International Limited, Class A (DR) | | 13,365 | | | 450,801 |
New Oriental Education & Technology Group Inc. (DR)(2) | | 7,705 | | | 494,969 |
| | | | | |
| | | Shares
Held | | Value |
| | | | | |
| CHINA (CONTINUED) | | | | | |
Tingyi (Cayman Islands) Holding Corporation(3) | | 780,300 | | $ | 908,761 |
Weichai Power Co., Ltd., H Shares(3) | | 113,100 | | | 425,607 |
Zhuzhou CSR Times Electric Co., Ltd., H Shares(3) | | 904,200 | | | 641,621 |
| | | | | |
| | | | | 6,412,761 |
| COLOMBIA - 0.7% | | | | | |
Almacenes Exito S.A. (DR)(3) | | 95,394 | | | 477,613 |
| | | | | |
| EGYPT - 1.1% | | | | | |
Egyptian Financial Group-Hermes Holding(3) | | 124,090 | | | 769,044 |
| | | | | |
| HONG KONG - 2.3% | | | | | |
Huabao International Holdings Limited(3) | | 1,491,900 | | | 1,143,856 |
Samson Holding Ltd.(2)(3) | | 4,063,000 | | | 572,426 |
| | | | | |
| | | | | 1,716,282 |
| INDIA - 4.0% | | | | | |
Cairn India Ltd.(2)(3) | | 166,142 | | | 765,629 |
Dr. Reddy’s Laboratories Limited(3) | | 68,029 | | | 752,440 |
Satyam Computer Services Limited(3) | | 143,304 | | | 907,192 |
Tata Motors Limited(3) | | 63,097 | | | 470,298 |
Tata Motors Limited, Class A Rights(1)(2)(3)(4) | | 10,333 | | | 804 |
Tata Motors Limited, Rights(1)(2)(3)(4) | | 10,333 | | | 896 |
| | | | | |
| | | | | 2,897,259 |
| ISRAEL - 1.3% | | | | | |
Bank Hapoalim B.M.(3) | | 135,569 | | | 431,666 |
Strauss Group Ltd.(3) | | 49,979 | | | 522,318 |
| | | | | |
| | | | | 953,984 |
| KAZAKSTAN - 1.2% | | | | | |
KazMunaiGas Exploration Production (DR)(3) | | 57,795 | | | 911,763 |
| | | | | |
| KOREA - 8.8% | | | | | |
Daewoo Shipbuilding & Marine Engineering Co., Ltd.(3) | | 15,254 | | | 385,465 |
Hyundai Development Company(3) | | 14,261 | | | 537,061 |
MegaStudy Co., Ltd.(3) | | 3,685 | | | 559,969 |
Samsung Electronics Co., Ltd.(3) | | 7,271 | | | 3,348,108 |
Shinhan Financial Group Co., Ltd.(3) | | 22,527 | | | 812,202 |
Shinsegae Co., Ltd.(3) | | 1,694 | | | 798,691 |
| | | | | |
| | | | | 6,441,496 |
| LUXEMBOURG - 0.6% |
Ternium S.A. (DR) | | 25,766 | | | 454,512 |
| | | | | |
| MEXICO - 7.2% |
America Movil SAB de C.V., Series L | | 880,405 | | | 2,041,519 |
10
| | | | | |
| | | Shares
Held | | Value |
| | | | | |
| MEXICO (CONTINUED) | | | | | |
Banco Compartamos SA de CV | | 182,025 | | $ | 515,958 |
Fomento Economico Mexicano SAB, Series UBD (Units) | | 184,995 | | | 707,570 |
Grupo Financiero Banorte S.A. de C.V. | | 235,431 | | | 751,295 |
Grupo Televisa S.A. | | 182,181 | | | 801,753 |
Urbi, Desarrollos Urbanos, S.A. de C.V.(2) | | 181,950 | | | 424,741 |
| | | | | |
| | | | | 5,242,836 |
| NETHERLANDS - 1.2% | | | | | |
Kardan NV(3) | | 62,326 | | | 472,316 |
Plaza Centers (Europe) BV(3) | | 309,764 | | | 402,748 |
| | | | | |
| | | | | 875,064 |
| PHILIPPINES - 1.0% | | | | | |
Philippine Long Distance Telephone Company(3) | | 13,070 | | | 740,860 |
| | | | | |
| POLAND - 0.9% | | | | | |
Polski Koncern Naftowy Orlen S.A.(3) | | 47,614 | | | 685,757 |
| | | | | |
| RUSSIA - 7.9% | | | | | |
Globaltrans Investment PLC (DR)(2)(3) | | 57,096 | | | 517,139 |
LUKOIL (DR)(3) | | 28,237 | | | 1,699,923 |
Mining and Metallurgical Company Norilsk Nickel (DR)(3) | | 62,743 | | | 879,556 |
Mobile TeleSystems (DR) | | 16,137 | | | 903,833 |
OAO TMK (DR)(3) | | 25,826 | | | 646,339 |
PIK Group (DR)(3) | | 4,259 | | | 22,419 |
PIK Group, Reg S (DR)(3) | | 37,309 | | | 196,392 |
Razguliay Group(2)(3) | | 103,399 | | | 374,429 |
VTB Bank OJSC (DR)(3) | | 123,795 | | | 515,734 |
| | | | | |
| | | | | 5,755,764 |
| SINGAPORE - 0.6% | | | | | |
Epure International Ltd.(3) | | 1,882,000 | | | 459,890 |
| | | | | |
| SOUTH AFRICA - 9.6% | | | | | |
African Bank Investments Limited(3) | | 261,710 | | | 808,353 |
Gold Fields Limited(3) | | 89,680 | | | 866,990 |
Grindrod Limited(3) | | 187,786 | | | 408,159 |
Impala Platinum Holdings Limited(3) | | 60,232 | | | 1,223,454 |
Mondi Limited(3) | | 107,395 | | | 585,235 |
Mr. Price Group Limited(3) | | 187,461 | | | 522,807 |
MTN Group Limited(3) | | 88,113 | | | 1,247,871 |
Reunert Limited(3) | | 83,769 | | | 588,208 |
Tiger Brands Limited(3) | | 42,271 | | | 729,467 |
| | | | | |
| | | | | 6,980,544 |
| SWEDEN - 1.3% | | | | | |
West Siberian Resources Ltd (DR)(2)(3) | | 1,146,282 | | | 931,115 |
| | | | | |
| TAIWAN - 8.8% | | | | | |
Acer Inc.(3) | | 345,148 | | | 589,363 |
Cathay Financial Holding Co., Ltd.(3) | | 537,292 | | | 753,381 |
China Airlines(2)(3) | | 1,856,000 | | | 406,001 |
| | | | | | | |
| | | Shares
Held | | Value | |
| | | | | | | |
| TAIWAN (CONTINUED) | | | | | | | |
Chinatrust Financial Holding Company Ltd.(3) | | | 1,212,962 | | $ | 651,694 | |
Far Eastern Textile Ltd.(3) | | | 854,077 | | | 602,043 | |
Hon Hai Precision Industry Co., Ltd.(3) | | | 287,156 | | | 1,021,700 | |
Taishin Financial Holdings Co., Ltd.(3) | | | 1,978,000 | | | 392,984 | |
Taiwan Fertilizer Co., Ltd.(3) | | | 226,000 | | | 425,815 | |
Taiwan Semiconductor Manufacturing Company Ltd.(3) | | | 964,441 | | | 1,585,749 | |
| | | | | | | |
| | | | | | 6,428,730 | |
| THAILAND - 3.2% | | | | | | | |
Bumrungrad Hospital Public Company Limited (DR)(1)(3) | | | 693,300 | | | 662,574 | |
Krung Thai Bank Public Company Limited (DR)(1)(3) | | | 2,959,500 | | | 535,327 | |
Siam Commercial Bank Public Company Limited (DR)(1)(3) | | | 348,500 | | | 719,349 | |
Total Access Communication Public Company Limited(3) | | | 373,800 | | | 411,096 | |
| | | | | | | |
| | | | | | 2,328,346 | |
| TURKEY - 5.0% | | | | | | | |
Cimsa Cimento Sanayi ve Ticaret A.S.(3) | | | 158,344 | | | 611,826 | |
Tekfen Holding A.S.(3) | | | 89,163 | | | 495,148 | |
Turk Hava Yollari Anonim Ortakligi(2)(3) | | | 141,398 | | | 720,700 | |
Turk Sise ve Cam Fabrikalari AS(2)(3) | | | 540,388 | | | 659,117 | |
Turkcell Iletisim Hizmetleri AS(3) | | | 98,504 | | | 604,639 | |
Turkiye Sinai Kalkinma Bankasi A.S.(2)(3) | | | 710,479 | | | 571,486 | |
| | | | | | | |
| | | | | | 3,662,916 | |
| UNITED ARAB EMIRATES - 0.5% | |
Depa, Ltd. (DR)(2)(3) | | | 90,100 | | | 382,925 | |
| | | | | | | |
| UNITED KINGDOM - 0.7% | | | | | | | |
Antofagasta plc(3) | | | 68,448 | | | 493,496 | |
| | | | | | | |
Total common and preferred stocks (Cost $101,290,922) | | | | | | 70,645,894 | |
| | |
| | | Par
Amount | | | |
SHORT-TERM INVESTMENTS (CASH EQUIVALENTS) - 3.7% | | | | | | | |
Repurchase agreement with Fixed Income Clearing Corporation, 0.05%, dated 9/30/08, due 10/1/08, maturity value $2,722,004(5) (Cost $2,722,000) | | $ | 2,722,000 | | | 2,722,000 | |
| | | | | | | |
| | | | | | | |
| | | | | | | |
Total investments - 100.5% (Cost $104,012,922) | | | | | | 73,367,894 | |
| | | | | | | |
Other assets less liabilities - (0.5%) | | | | | | (358,482 | ) |
| | | | | | | |
| | | | | | | |
Total net assets - 100.0%(6) | | | | | $ | 73,009,412 | |
| | | | | | | |
11
(2) | Non-income producing security. |
(3) | Valued at a fair value in accordance with procedures established by the board of directors of Artisan Funds. In total, securities valued at a fair value were $47,959,672 or 65.7% of total net assets. |
(4) | Security has been determined to be illiquid under procedures established by the board of directors. |
| | | | | | | | |
Issuer | | Rate | | | Maturity | | Value |
U.S. Treasury Bond | | 6.25 | % | | 5/15/2030 | | $ | 2,777,200 |
(6) | Percentages for the various classifications relate to total net assets. |
Company names are as reported by a data service provider and in some cases are translations; a company's legal name may be different.
(DR) Depository Receipt, voting rights may vary.
| | | | | | | |
| PORTFOLIO DIVERSIFICATION - SEPTEMBER 30,2008 | |
| | | Value | | | Percentage
of Total
Net Assets | |
Consumer Discretionary | | $ | 7,759,573 | | | 10.6 | % |
Consumer Staples | | | 6,127,255 | | | 8.4 | |
Energy | | | 10,835,489 | | | 14.8 | |
Financials | | | 9,916,126 | | | 13.6 | |
Healthcare | | | 1,865,815 | | | 2.6 | |
Industrials | | | 9,161,371 | | | 12.6 | |
Information Technology | | | 7,452,112 | | | 10.2 | |
Materials | | | 9,476,578 | | | 13.0 | |
Telecommunication Services | | | 6,942,433 | | | 9.5 | |
Utilities | | | 1,109,142 | | | 1.5 | |
| | | | | | | |
Total common and preferred stocks | | | 70,645,894 | | | 96.8 | |
Short-term investments | | | 2,722,000 | | | 3.7 | |
| | | | | | | |
Total investments | | | 73,367,894 | | | 100.5 | |
Other assets less liabilities | | | (358,482 | ) | | (0.5 | ) |
| | | | | | | |
Total net assets | | $ | 73,009,412 | | | 100.0 | % |
| | | | | | | |
| | | | | | |
| CURRENCY EXPOSURE - SEPTEMBER 30, 2008 | |
| | | Value | | Percentage
of Total
Investments | |
Brazilian real | | $ | 13,306,523 | | 18.1 | % |
British pound | | | 896,244 | | 1.2 | |
Chilean peso | | | 489,446 | | 0.7 | |
Egyptian pound | | | 769,044 | | 1.1 | |
Euro | | | 472,316 | | 0.6 | |
Hong Kong dollar | | | 6,686,939 | | 9.1 | |
Indian rupee | | | 2,897,259 | | 4.0 | |
Israeli shekel | | | 953,984 | | 1.3 | |
Korean won | | | 6,441,496 | | 8.8 | |
Mexican peso | | | 5,242,836 | | 7.1 | |
Philippine peso | | | 740,860 | | 1.0 | |
Polish zloty | | | 685,757 | | 0.9 | |
Singapore dollar | | | 459,890 | | 0.6 | |
South African rand | | | 6,980,544 | | 9.5 | |
Swedish krona | | | 931,115 | | 1.3 | |
Taiwan dollar | | | 6,428,730 | | 8.8 | |
Thai baht | | | 1,917,250 | | 2.6 | |
Turkish lira | | | 3,662,916 | | 5.0 | |
US dollar | | | 13,404,745 | | 18.3 | |
| | | | | | |
Total investments | | $ | 73,367,894 | | 100.0 | % |
| | | | | | |
| | | | | |
| TOP TEN HOLDINGS - SEPTEMBER 30, 2008 | |
Company Name | | Country | | Percentage
of Total
Net Assets | |
Petroleo Brasileiro S.A. | | Brazil | | 5.6 | % |
Samsung Electronics Co., Ltd. | | Korea | | 4.6 | |
Companhia Vale do Rio Doce | | Brazil | | 3.4 | |
America Movil SAB de C.V. | | Mexico | | 2.8 | |
LUKOIL | | Russia | | 2.3 | |
Taiwan Semiconductor Manufacturing Company Ltd. | | Taiwan | | 2.2 | |
MTN Group Limited | | South Africa | | 1.7 | |
Impala Platinum Holdings Limited | | South Africa | | 1.7 | |
Huabao International Holdings Limited | | Hong Kong | | 1.6 | |
Chaoda Modern Agriculture (Holdings) Limited | | China | | 1.5 | |
| | | | | |
Total | | | | 27.4 | % |
| | | | | |
For the purpose of determining the Fund’s top ten holdings, securities of the same issuer are aggregated to determine the weight in the Fund.
The accompanying notes are an integral part of the financial statements.
12
ARTISAN INTERNATIONAL FUND
Schedule of Investments – September 30, 2008
| | | | | |
| | | Shares
Held | | Value |
| | | | | |
COMMON AND
PREFERRED STOCKS - 94.2% | | | | | |
| | | | | |
| BELGIUM - 0.5% | | | | | |
Delhaize Group(1) | | 791,898 | | $ | 46,147,043 |
Umicore(1) | | 514,070 | | | 15,958,763 |
| | | | | |
| | | | | 62,105,806 |
| BRAZIL - 2.4% | | | | | |
Petroleo Brasileiro S.A., Preferred (DR) | | 3,618,266 | | | 135,395,514 |
Redecard SA | | 6,536,789 | | | 85,467,082 |
Vivo Participacoes S.A., Preferred (DR)(2) | | 13,449,768 | | | 55,682,039 |
| | | | | |
| | | | | 276,544,635 |
| CANADA - 2.2% | | | | | |
Canadian Pacific Railway Limited | | 4,755,184 | | | 256,114,210 |
| | | | | |
| CHINA - 5.6% | | | | | |
Angang Steel Company Limited, H Shares(1) | | 32,269,187 | | | 29,519,853 |
China Construction Bank, H Shares(1) | | 227,217,200 | | | 150,814,211 |
China Life Insurance Co., Limited, H Shares(1) | | 37,784,900 | | | 139,893,346 |
China Merchants Holdings International Company Limited(1) | | 21,392,900 | | | 68,801,066 |
China Petroleum and Chemical Corporation, H Shares(1) | | 144,146,900 | | | 114,415,884 |
China Resources Land Limited(1) | | 109,479,100 | | | 114,941,811 |
Shanghai Electric Group Company Limited, Series H(1)(2)(3) | | 150,931,921 | | | 45,393,696 |
| | | | | |
| | | | | 663,779,867 |
| FINLAND - 3.2% | | | | | |
Fortum Oyj(1) | | 11,122,431 | | | 375,268,008 |
| | | | | |
| FRANCE - 12.1% | | | | | |
Alstom, S.A.(1) | | 2,588,153 | | | 195,172,350 |
Bouygues SA(1) | | 3,998,062 | | | 182,316,700 |
Electricite de France(1) | | 4,455,105 | | | 322,811,220 |
LVMH Moet Hennessy Louis Vuitton SA(1) | | 2,630,185 | | | 232,237,725 |
Technip SA(1) | | 2,854,266 | | | 160,342,506 |
Vinci SA(1) | | 7,197,215 | | | 340,043,899 |
| | | | | |
| | | | | 1,432,924,400 |
| GERMANY - 12.8% | | | | | |
Allianz SE(1) | | 1,010,749 | | | 139,010,853 |
| | | | | |
| | | Shares
Held | | Value |
| | | | | |
| GERMANY (CONTINUED) | | | | | |
Bayer AG(1) | | 5,545,201 | | $ | 404,760,289 |
Daimler AG(1) | | 5,047,009 | | | 255,075,671 |
Fraport AG(1) | | 2,232,563 | | | 133,523,930 |
Linde AG(1) | | 2,550,125 | | | 273,477,747 |
Merck KGaA(1) | | 225,768 | | | 24,237,311 |
Wacker Chemie AG(1) | | 1,994,739 | | | 285,269,306 |
| | | | | |
| | | | | 1,515,355,107 |
| HONG KONG - 3.7% | | | | | |
The Bank of East Asia, Ltd.(1) | | 27,342,500 | | | 85,285,655 |
Hutchison Whampoa Limited(1) | | 26,073,245 | | | 198,487,558 |
NWS Holdings Limited(1) | | 40,157,746 | | | 71,988,363 |
Sun Hung Kai Properties Limited(1) | | 7,853,234 | | | 80,636,241 |
| | | | | |
| | | | | 436,397,817 |
| INDIA - 1.0% | | | | | |
Housing Development Finance Corporation Ltd.(1) | | 1,248,822 | | | 57,322,751 |
ICICI Bank Limited(1) | | 1,084,277 | | | 12,854,108 |
ICICI Bank Limited (DR) | | 1,853,652 | | | 43,597,895 |
| | | | | |
| | | | | 113,774,754 |
| IRELAND - 0.5% | | | | | |
Elan Corporation plc (DR)(2) | | 5,405,458 | | | 57,676,237 |
| | | | | |
| ITALY - 2.2% | | | | | |
Fiat S.p.A.(1) | | 7,433,997 | | | 99,049,998 |
Intesa Sanpaolo(1) | | 28,661,783 | | | 156,457,590 |
| | | | | |
| | | | | 255,507,588 |
| JAPAN - 11.3% | | | | | |
Credit Saison Co., Ltd.(1) | | 1,897,823 | | | 30,873,858 |
DENSO CORPORATION(1) | | 5,451,200 | | | 133,880,758 |
JAPAN TOBACCO INC.(1) | | 74,252 | | | 279,547,473 |
Jupiter Telecommunications Co., Ltd.(1) | | 79,412 | | | 57,215,870 |
Mitsubishi Estate Company Ltd.(1) | | 3,797,600 | | | 74,629,286 |
Mitsubishi UFJ Financial Group, Inc.(1) | | 21,009,100 | | | 182,120,253 |
Mitsui & Co., Ltd.(1) | | 12,373,103 | | | 152,890,420 |
Mitsui Fudosan Co., Ltd.(1) | | 4,603,601 | | | 88,627,267 |
Mizuho Financial Group, Inc.(1) | | 39,155 | | | 171,786,740 |
SUZUKI MOTOR CORPORATION(1) | | 8,736,450 | | | 162,231,166 |
| | | | | |
| | | | | 1,333,803,091 |
| KOREA - 1.2% | | | | | |
NHN Corp.(1)(2) | | 1,104,272 | | | 142,374,509 |
| | | | | |
| LUXEMBOURG - 0.4% | | | | | |
RTL Group(1) | | 736,222 | | | 45,718,732 |
13
| | | | | |
| | | Shares
Held | | Value |
| | | | | |
| MEXICO - 0.5% | | | | | |
Grupo Modelo, S.A. de C.V., Series C | | 14,714,102 | | $ | 62,561,674 |
| | | | | |
| NETHERLANDS - 2.6% | | | | | |
ASML Holding N.V.(1) | | 16,950,048 | | | 302,650,828 |
| | | | | |
| NORWAY - 3.6% | | | | | |
Acergy SA(1) | | 1,096,914 | | | 11,020,914 |
Orkla ASA(1) | | 16,442,189 | | | 151,115,876 |
SeaDrill Ltd.(1) | | 12,588,799 | | | 258,741,622 |
| | | | | |
| | | | | 420,878,412 |
| QATAR - 0.5% | | | | | |
Industries Qatar | | 1,406,183 | | | 55,103,545 |
Industries Qatar, Equity Linked Security, 144A(1)(4)(5) | | 222,077 | | | 8,703,198 |
| | | | | |
| | | | | 63,806,743 |
| RUSSIA - 4.1% | | | | | |
Gazprom (DR)(1) | | 8,479,286 | | | 272,487,477 |
LUKOIL (DR)(1) | | 1,972,700 | | | 118,760,422 |
Novorossiysk Sea Trade Port (DR)(1) | | 87,150 | | | 558,208 |
RAO Unified Energy System, Equity Linked Security, 144A(1)(4)(5)(6) | | 2,065,483 | | | 96,148,234 |
| | | | | |
| | | | | 487,954,341 |
| SOUTH AFRICA - 0.5% | | | | | |
Naspers Limited(1) | | 2,962,546 | | | 58,588,590 |
| | | | | |
| SPAIN - 5.2% | | | | | |
Gamesa Corporacion Tecnologica, S.A.(1) | | 3,164,078 | | | 108,692,129 |
Iberdrola S.A.(1) | | 5,401,279 | | | 55,208,666 |
Industria de Diseno Textil, S.A.(1) | | 3,126,622 | | | 133,379,738 |
Telefonica S.A.(1) | | 13,178,652 | | | 315,040,800 |
| | | | | |
| | | | | 612,321,333 |
| SWEDEN - 0.3% | | | | | |
SSAB Svenskt Stal AB, Series A(1) | | 2,038,041 | | | 32,498,695 |
| | | | | |
| SWITZERLAND - 9.8% | | | | | |
Adecco SA(1) | | 2,042,657 | | | 89,252,942 |
Holcim Ltd.(1) | | 3,157,782 | | | 231,057,336 |
Nestle SA(1) | | 9,137,346 | | | 395,209,047 |
Roche Holding AG(1) | | 404,147 | | | 63,102,472 |
Roche Holding AG - Genussscheine(1)(4) | | 2,448,230 | | | 381,647,046 |
| | | | | |
| | | | | 1,160,268,843 |
| TAIWAN - 0.2% | | | | | |
Taiwan Semiconductor Manufacturing Company Ltd. (DR)(4) | | 2,988,809 | | | 28,005,140 |
| | | | | | |
| | | Shares
Held | | Value |
| | | | | | |
| UNITED KINGDOM - 7.8% | | | | | | |
Cadbury PLC(1) | | | 13,609,068 | | $ | 137,039,362 |
Kingfisher PLC(1) | | | 31,418,061 | | | 74,498,145 |
Lloyds TSB Group plc(1) | | | 36,473,033 | | | 151,719,497 |
National Grid PLC(1) | | | 20,137,580 | | | 255,844,292 |
Next Plc(1) | | | 3,778,934 | | | 69,297,008 |
Tesco plc(1) | | | 7,889,507 | | | 54,867,222 |
William Morrison Supermarkets PLC(1) | | | 39,227,825 | | | 182,089,550 |
| | | | | | |
| | | | | | 925,355,076 |
| | | | | | |
Total common and preferred stocks
(Cost $12,403,463,800) | | | 11,122,234,436 |
| | |
| | | Par
Amount | | |
| SHORT-TERM INVESTMENTS (CASH EQUIVALENTS) - 5.2% | | | | | | |
Repurchase agreement with Fixed
Income Clearing Corporation,
0.05%, dated 9/30/08, due
10/1/08, maturity value
$609,594,846(7)
(Cost $609,594,000) | | $ | 609,594,000 | | | 609,594,000 |
| | | | | | |
| | | | | | |
Total investments - 99.4%
(Cost $13,013,057,800) | | | | | | 11,731,828,436 |
| | | | | | |
Other assets less liabilities - 0.6% | | | 71,901,944 |
| | | | | | |
| | | | | | |
Total net assets - 100.0%(8) | | | | | $ | 11,803,730,380 |
| | | | | | |
(1) | Valued at a fair value in accordance with procedures established by the board of directors of Artisan Funds. In total, securities valued at a fair value were $10,342,631,100 or 87.6% of total net assets. |
(2) | Non-income producing security. |
(3) | Affiliated company as defined by the Investment Company Act of 1940. See Note (6) in Notes to Financial Statements. |
(5) | Security is an equity-linked participation certificate issued by Merrill Lynch. As described in Note 2(h) in Notes to Financial Statements, equity-linked participation certificates are subject to counterparty risk with respect to the bank or broker-dealer that issues them. |
(6) | Security has been determined to be illiquid under procedures established by the board of directors. |
| | | | | | | | |
Issuer | | Rate | | | Maturity | | Value |
U.S. Treasury Bill | | | | | 7/30/2009 | | $ | 310,790,938 |
U.S. Treasury Bond | | 2.675 | % | | 5/31/2010 | | | 168,804,525 |
U.S. Treasury Bond | | 2.125 | | | 1/31/2010 | | | 141,985,800 |
U.S. Treasury Bond | | 4.750 | | | 2/28/2009 | | | 213,675 |
| | | | | | | | |
| | | | | | | $ | 621,794,938 |
| | | | | | | | |
(8) | Percentages for the various classifications relate to total net assets. |
Company names are as reported by a data service provider and in some cases are translations; a company’s legal name may be different.
(DR) Depository Receipt, voting rights may vary.
14
| | | | | | |
| PORTFOLIO DIVERSIFICATION - SEPTEMBER 30, 2008 | |
| | | Value | | Percentage
of Total
Net Assets | |
Consumer Discretionary | | $ | 1,321,173,401 | | 11.2 | % |
Consumer Staples | | | 1,157,461,371 | | 9.8 | |
Energy | | | 1,071,164,339 | | 9.1 | |
Financials | | | 1,680,571,362 | | 14.2 | |
Healthcare | | | 931,423,355 | | 7.9 | |
Industrials | | | 2,058,158,090 | | 17.4 | |
Information Technology | | | 558,497,559 | | 4.7 | |
Materials | | | 867,781,700 | | 7.4 | |
Telecommunication Services | | | 370,722,839 | | 3.1 | |
Utilities | | | 1,105,280,420 | | 9.4 | |
| | | | | | |
Total common and preferred stocks | | | 11,122,234,436 | | 94.2 | |
Short-term investments | | | 609,594,000 | | 5.2 | |
| | | | | | |
Total investments | | | 11,731,828,436 | | 99.4 | |
Other assets less liabilities | | | 71,901,944 | | 0.6 | |
| | | | | | |
Total net assets | | $ | 11,803,730,380 | | 100.0 | % |
| | | | | | |
| | | | | | |
| CURRENCY EXPOSURE - SEPTEMBER 30, 2008 | |
| | | Value | | Percentage
of Total
Investments | |
Brazilian real | | $ | 85,467,082 | | 0.7 | % |
British pound | | | 925,355,076 | | 7.9 | |
Euro | | | 4,601,851,802 | | 39.2 | |
Hong Kong dollar | | | 1,100,177,684 | | 9.4 | |
Indian rupee | | | 70,176,859 | | 0.6 | |
Japanese yen | | | 1,333,803,091 | | 11.4 | |
Korean won | | | 142,374,509 | | 1.2 | |
Mexican peso | | | 62,561,674 | | 0.5 | |
Norwegian krone | | | 420,878,412 | | 3.6 | |
Qatari riyal | | | 55,103,545 | | 0.5 | |
South African rand | | | 58,588,590 | | 0.5 | |
Swedish krona | | | 32,498,695 | | 0.3 | |
Swiss franc | | | 1,160,268,843 | | 9.9 | |
US dollar | | | 1,682,722,574 | | 14.3 | |
| | | | | | |
Total investments | | $ | 11,731,828,436 | | 100.0 | % |
| | | | | | |
| | | | | |
| TOP TEN HOLDINGS - SEPTEMBER 30, 2008 | |
Company Name | | Country | | Percentage
of Total
Net Assets | |
Roche Holding AG | | Switzerland | | 3.8 | % |
Bayer AG | | Germany | | 3.4 | |
Nestle SA | | Switzerland | | 3.3 | |
Fortum Oyj | | Finland | | 3.2 | |
Vinci SA | | France | | 2.9 | |
Electricite de France | | France | | 2.7 | |
Telefonica S.A. | | Spain | | 2.7 | |
ASML Holding N.V. | | Netherlands | | 2.6 | |
Wacker Chemie AG | | Germany | | 2.4 | |
JAPAN TOBACCO INC. | | Japan | | 2.4 | |
| | | | | |
Total | | | | 29.4 | % |
| | | | | |
For the purpose of determining the Fund’s top ten holdings, securities of the same issuer are aggregated to determine the weight in the Fund.
The accompanying notes are an integral part of the financial statements.
15
ARTISAN INTERNATIONAL VALUE FUND
Schedule of Investments – September 30, 2008
| | | | | |
| | | Shares
Held | | Value |
| | | | | |
| COMMON STOCKS - 95.0% | | | | | |
| | | | | |
| FINLAND - 1.1% | | | | | |
Nokia Corporation (DR) | | 691,671 | | $ | 12,899,664 |
| | | | | |
| FRANCE - 11.1% | | | | | |
Gemalto NV(1)(2) | | 825,937 | | | 29,872,679 |
Neopost SA(1) | | 235,351 | | | 22,157,363 |
Sanofi-Aventis(1) | | 413,992 | | | 27,212,277 |
Societe Television Francaise 1(1) | | 2,143,799 | | | 37,930,899 |
Sodexo(1) | | 309,531 | | | 18,341,685 |
| | | | | |
| | | | | 135,514,903 |
| GERMANY - 1.0% | | | | | |
Pfeiffer Vacuum Technology AG(1) | | 149,681 | | | 11,986,107 |
| | | | | |
| HONG KONG - 2.0% | | | | | |
Guoco Group Limited(1) | | 2,872,900 | | | 24,550,283 |
| | | | | |
| IRELAND - 0.6% | | | | | |
Ryanair Holdings PLC, Equity-Linked Security, 144A(1)(2)(4) | | 2,231,800 | | | 7,250,167 |
| | | | | |
| JAPAN - 12.2% | | | | | |
Credit Saison Co., Ltd.(1) | | 2,433,169 | | | 39,582,887 |
MEITEC CORPORATION(1) | | 1,273,695 | | | 34,095,888 |
SANKYO CO., LTD.(1) | | 319,387 | | | 16,289,286 |
SEINO HOLDINGS CO., LTD.(1) | | 1,048,800 | | | 4,941,667 |
Sekisui House, Ltd.(1) | | 3,858,700 | | | 35,429,649 |
UNICHARM CORPORATION(1) | | 226,400 | | | 17,366,778 |
| | | | | |
| | | | | 147,706,155 |
| KOREA - 2.9% | | | | | |
Lotte Chilsung Beverage Co., Ltd.(1) | | 10,323 | | | 7,579,987 |
Samsung Electronics Co., Ltd.(1) | | 19,336 | | | 8,903,730 |
SK Telecom Co., Ltd. (DR) | | 1,030,178 | | | 19,387,950 |
| | | | | |
| | | | | 35,871,667 |
| MEXICO - 3.4% | | | | | |
Grupo Modelo, S.A. de C.V., Series C | | 2,934,581 | | | 12,477,302 |
Kimberly-Clark de Mexico, S.A. de C.V., Class A | | 6,708,872 | | | 29,138,337 |
| | | | | |
| | | | | 41,615,639 |
| NETHERLANDS - 4.4% | | | | | |
Wolters Kluwer NV(1) | | 2,654,482 | | | 54,109,025 |
| | | | | |
| SWITZERLAND - 17.4% | | | | | |
Adecco SA(1) | | 837,982 | | | 36,615,231 |
Givaudan SA(1) | | 32,577 | | | 27,014,611 |
Novartis AG(1) | | 1,465,900 | | | 76,674,454 |
| | | | | | | |
| | | Shares
Held | | Value | |
| | | | | | | |
| SWITZERLAND (CONTINUED) | | | | | | | |
Panalpina Welttransport Holding AG(1) | | | 444,229 | | $ | 29,397,192 | |
Pargesa Holding SA(1) | | | 403,982 | | | 34,462,240 | |
Tamedia AG(1) | | | 70,228 | | | 6,973,600 | |
| | | | | | | |
| | | | | | 211,137,328 | |
| UNITED KINGDOM - 28.2% | | | | | | | |
Benfield Group Plc(1)(3) | | | 11,241,209 | | | 66,922,543 | |
Cadbury PLC(1) | | | 2,107,947 | | | 21,226,414 | |
Carpetright PLC(1) | | | 1,088,402 | | | 11,804,281 | |
Diageo plc(1) | | | 2,051,297 | | | 34,724,360 | |
Experian PLC(1) | | | 8,947,268 | | | 59,327,950 | |
Home Retail Group plc(1) | | | 5,843,614 | | | 24,871,833 | |
Lancashire Holdings Ltd(1) | | | 2,897,486 | | | 15,859,421 | |
Rightmove PLC(1) | | | 1,143,024 | | | 5,226,536 | |
Savills Plc(1) | | | 1,458,324 | | | 6,856,952 | |
Signet Jewelers Ltd. | | | 2,342,442 | | | 54,763,328 | |
Unilever plc (DR) | | | 1,302,339 | | | 35,436,644 | |
Vitec Group PLC(1) | | | 859,067 | | | 5,374,961 | |
| | | | | | | |
| | | | | | 342,395,223 | |
| UNITED STATES - 10.7% | | | | | | | |
Arch Capital Group Ltd.(2) | | | 297,930 | | | 21,757,828 | |
Covidien Ltd. | | | 1,117,505 | | | 60,077,069 | |
Tyco Electronics Ltd. | | | 959,457 | | | 26,538,581 | |
Willis Group Holdings Limited | | | 667,830 | | | 21,544,196 | |
| | | | | | | |
| | | | | | 129,917,674 | |
| | | | | | | |
Total common stocks
(Cost $1,264,483,409) | | | | | | 1,154,953,835 | |
| | |
| | | Par
Amount | | | |
SHORT-TERM INVESTMENTS
(CASH EQUIVALENTS) - 5.7% | | | | | | | |
Repurchase agreement with Fixed Income Clearing Corporation, 0.05%, dated 9/30/08, due 10/1/08, maturity value $68,665,095(5)
(Cost $68,665,000) | | $ | 68,665,000 | | | 68,665,000 | |
| | | | | | | |
| | | | | | | |
Total investments - 100.7%
(Cost $1,333,148,409) | | | | | | 1,223,618,835 | |
| | | | | | | |
Other assets less liabilities - (0.7%) | | | | | | (8,095,493 | ) |
| | | | | | | |
| | | | | | | |
Total net assets - 100.0%(6) | | | | | $ | 1,215,523,342 | |
| | | | | | | |
16
(1) | Valued at a fair value in accordance with procedures established by the board of directors of Artisan Funds. In total, securities valued at a fair value were $860,932,936 or 70.8% of total net assets. |
(2) | Non-income producing security. |
(3) | Affiliated company as defined by the Investment Company Act of 1940. See Note (6) in Notes to Financial Statements. |
(4) | Security is an equity-linked participation certificate issued by HSBC Bank plc. As described in Note 2(h) in Notes to Financial Statements, equity-linked participation certificates are subject to counterparty risk with respect to the bank or broker-dealer that issues them. |
| | | | | |
Issuer | | Maturity | | Value |
U.S. Treasury Bill | | 7/30/2009 | | $ | 70,038,438 |
(6) | Percentages for the various classifications relate to total net assets. |
Company names are as reported by a data service provider and in some cases are translations; a company’s legal name may be different.
(DR) Depository Receipt, voting rights may vary.
| | | | | | | |
| PORTFOLIO DIVERSIFICATION - SEPTEMBER 30, 2008 | |
| | | Value | | | Percentage
of Total
Net Assets | |
Consumer Discretionary | | $ | 271,115,083 | | | 22.3 | % |
Consumer Staples | | | 157,949,822 | | | 13.0 | |
Financials | | | 231,536,350 | | | 19.0 | |
Healthcare | | | 163,963,800 | | | 13.5 | |
Industrials | | | 183,614,202 | | | 15.1 | |
Information Technology | | | 100,372,017 | | | 8.3 | |
Materials | | | 27,014,611 | | | 2.2 | |
Telecommunication Services | | | 19,387,950 | | | 1.6 | |
| | | | | | | |
Total common stocks | | | 1,154,953,835 | | | 95.0 | |
Short-term investments | | | 68,665,000 | | | 5.7 | |
| | | | | | | |
Total investments | | | 1,223,618,835 | | | 100.7 | |
Other assets less liabilities | | | (8,095,493 | ) | | (0.7 | ) |
| | | | | | | |
Total net assets | | $ | 1,215,523,342 | | | 100.0 | % |
| | | | | | | |
| | | | | | |
| CURRENCY EXPOSURE - SEPTEMBER 30, 2008 | |
| | | Value | | Percentage
of Total
Investments | |
British pound | | $ | 306,958,579 | | 25.1 | % |
Euro | | | 201,610,035 | | 16.5 | |
Hong Kong dollar | | | 24,550,283 | | 2.0 | |
Japanese yen | | | 147,706,155 | | 12.1 | |
Korean won | | | 16,483,717 | | 1.3 | |
Mexican peso | | | 41,615,639 | | 3.4 | |
Swiss franc | | | 211,137,328 | | 17.2 | |
US dollar | | | 273,557,099 | | 22.4 | |
| | | | | | |
Total investments | | $ | 1,223,618,835 | | 100.0 | % |
| | | | | | |
| | | | | |
| TOP TEN HOLDINGS - SEPTEMBER 30, 2008 | |
Company Name | | Country | | Percentage
of Total
Net Assets | |
Novartis AG | | Switzerland | | 6.3 | % |
Benfield Group Plc | | United Kingdom | | 5.5 | |
Covidien Ltd. | | United States | | 4.9 | |
Experian PLC | | United Kingdom | | 4.9 | |
Signet Jewelers Ltd. | | United Kingdom | | 4.5 | |
Wolters Kluwer NV | | Netherlands | | 4.5 | |
Credit Saison Co., Ltd. | | Japan | | 3.3 | |
Societe Television Francaise 1 | | France | | 3.1 | |
Adecco SA | | Switzerland | | 3.0 | |
Unilever plc | | United Kingdom | | 2.9 | |
| | | | | |
Total | | | | 42.9 | % |
| | | | | |
For the purpose of determining the Fund’s top ten holdings, securities of the same issuer are aggregated to determine the weight in the Fund.
| | | | | | | | | | | | | | |
| FORWARD CURRENCY CONTRACTS - SEPTEMBER 30, 2008 | | | | | | | | | | |
Forward Currency | | Transaction
Type | | Expiration
Date | | Cost on
Origination
Date | | Value | | Unrealized
Depreciation | |
British Pound | | Sell | | 12/4/08 | | $ | 68,243,560 | | $ | 68,627,497 | | $ | (383,937 | ) |
The accompanying notes are an integral part of the financial statements.
17
ARTISAN MID CAP FUND
Schedule of Investments – September 30, 2008
| | | | | |
| | | Shares
Held | | Value |
| | | | | |
| COMMON STOCKS - 97.3% | | | | | |
| | | | | |
| CONSUMER DISCRETIONARY - 7.7% | | | |
Auto Components - 2.9% | | | | | |
BorgWarner Inc. | | 2,400,351 | | $ | 78,659,502 |
Johnson Controls, Inc. | | 1,466,000 | | | 44,463,780 |
| | | | | |
| | | | | 123,123,282 |
Distributors - 0.5% | | | | | |
LKQ Corporation(1) | | 1,399,019 | | | 23,741,352 |
| | | | | |
Diversified Consumer Services - 0.3% | | | | | |
New Oriental Education & Technology Group Inc. (DR)(1)(2) | | 171,200 | | | 10,997,888 |
| | | | | |
Hotels, Restaurants & Leisure - 1.1% | | | | | |
Panera Bread Company, Class A(1) | | 170,500 | | | 8,678,450 |
Starbucks Corporation(1) | | 609,658 | | | 9,065,614 |
Starwood Hotels & Resorts Worldwide, Inc. | | 980,500 | | | 27,591,270 |
| | | | | |
| | | | | 45,335,334 |
Internet & Catalog Retail - 0.5% | | | |
Amazon.com, Inc.(1) | | 290,822 | | | 21,160,209 |
| | | | | |
Multiline Retail - 1.3% | | | | | |
Kohl’s Corporation(1) | | 1,199,700 | | | 55,282,176 |
| | | | | |
Specialty Retail - 1.1% | | | | | |
Best Buy Co., Inc. | | 650,676 | | | 24,400,350 |
GameStop Corp.(1) | | 635,200 | | | 21,730,192 |
| | | | | |
| | | | | 46,130,542 |
| CONSUMER STAPLES - 4.8% | | | | | |
Beverages - 1.3% | | | | | |
Hansen Natural Corporation(1) | | 1,878,300 | | | 56,818,575 |
| | | | | |
Food Products - 0.8% | | | | | |
Bunge Limited | | 419,221 | | | 26,486,383 |
H.J. Heinz Company | | 116,400 | | | 5,816,508 |
| | | | | |
| | | | | 32,302,891 |
Personal Products - 2.7% | | | | | |
Avon Products, Inc. | | 2,536,064 | | | 105,424,180 |
Bare Escentuals, Inc.(1) | | 1,063,618 | | | 11,561,528 |
| | | | | |
| | | | | 116,985,708 |
| | | | | |
| | | Shares
Held | | Value |
| | | | | |
| ENERGY - 4.0% | | | | | |
Energy Equipment &
Services - 3.5% | | | |
Dresser-Rand Group Inc.(1) | | 1,893,775 | | $ | 59,597,099 |
Helix Energy Solutions Group, Inc.(1) | | 671,401 | | | 16,301,616 |
Smith International, Inc. | | 890,200 | | | 52,201,328 |
Weatherford International Ltd.(1) | | 852,644 | | | 21,435,470 |
| | | | | |
| | | | | 149,535,513 |
Oil, Gas & Consumable
Fuels - 0.5% | | | |
Peabody Energy Corporation | | 452,300 | | | 20,353,500 |
| | | | | |
| FINANCIALS - 8.0% | | | | | |
Capital Markets - 2.8% | | | | | |
Affiliated Managers Group, Inc.(1) | | 492,356 | | | 40,791,695 |
Invesco Ltd. | | 3,690,230 | | | 77,421,025 |
| | | | | |
| | | | | 118,212,720 |
Commercial Banks - 0.8% | | | | | |
HDFC Bank Limited (DR)(2) | | 267,600 | | | 22,732,620 |
M&T Bank Corporation | | 139,100 | | | 12,414,675 |
| | | | | |
| | | | | 35,147,295 |
Consumer Finance - 1.3% | | | | | |
Discover Financial Services | | 3,473,000 | | | 47,996,860 |
SLM Corporation(1) | | 647,000 | | | 7,983,980 |
| | | | | |
| | | | | 55,980,840 |
Diversified Financial
Services - 1.2% | | | |
CME Group Inc., Class A | | 136,125 | | | 50,571,799 |
| | | | | |
Real Estate Management & Development - 1.6% | | | | | |
The St. Joe Company(1) | | 1,751,181 | | | 68,453,665 |
| | | | | |
Thrifts & Mortgage Finance - 0.3% | | | |
New York Community Bancorp, Inc. | | 674,000 | | | 11,316,460 |
| | | | | |
| HEALTHCARE - 25.4% | | | | | |
Biotechnology - 2.4% | | | | | |
Celgene Corporation(1) | | 1,106,801 | | | 70,038,367 |
ImClone Systems Incorporated(1) | | 491,055 | | | 30,661,474 |
| | | | | |
| | | | | 100,699,841 |
Health Care Equipment & Supplies - 8.9% | | | | | |
C.R. Bard, Inc. | | 1,523,141 | | | 144,500,387 |
18
| | | | | |
| | | Shares
Held | | Value |
| | | | | |
| HEALTHCARE (CONTINUED) | | | | | |
Health Care Equipment &
Supplies (Continued) | | | | | |
Gen-Probe Incorporated(1) | | 1,345,800 | | $ | 71,394,690 |
Intuitive Surgical, Inc.(1) | | 180,656 | | | 43,534,483 |
Mindray Medical International Limited, Class A (DR)(2) | | 667,100 | | | 22,501,283 |
NuVasive, Inc.(1) | | 682,652 | | | 33,675,223 |
Varian Medical Systems, Inc.(1) | | 1,098,522 | | | 62,758,562 |
| | | | | |
| | | | | 378,364,628 |
Health Care Technology - 4.1% | | | |
Cerner Corporation(1) | | 3,973,247 | | | 177,365,746 |
| | | | | |
Life Sciences Tools & Services - 5.0% | | | | | |
Thermo Fisher Scientific Inc.(1) | | 3,917,671 | | | 215,471,905 |
| | | | | |
Pharmaceuticals - 5.0% | | | | | |
Allergan, Inc. | | 3,887,718 | | | 200,217,477 |
Shire Limited (DR) | | 272,000 | | | 12,988,000 |
| | | | | |
| | | | | 213,205,477 |
| INDUSTRIALS - 14.9% | | | | | |
Aerospace & Defense - 2.1% | | | |
Hexcel Corporation(1) | | 1,650,615 | | | 22,596,919 |
Precision Castparts Corp. | | 862,322 | | | 67,933,727 |
| | | | | |
| | | | | 90,530,646 |
Air Freight & Logistics - 0.8% | | | |
C.H. Robinson Worldwide, Inc. | | 322,513 | | | 16,435,262 |
Expeditors International of Washington, Inc. | | 561,703 | | | 19,569,733 |
| | | | | |
| | | | | 36,004,995 |
Airlines - 0.5% | | | | | |
Southwest Airlines Co. | | 1,528,674 | | | 22,181,060 |
| | | | | |
Construction & Engineering - 2.5% | | | |
Fluor Corporation | | 614,912 | | | 34,250,598 |
Quanta Services, Inc.(1) | | 2,464,916 | | | 66,577,381 |
URS Corporation(1) | | 143,300 | | | 5,254,811 |
| | | | | |
| | | | | 106,082,790 |
Electrical Equipment - 4.9% | | | | | |
Cooper Industries, Ltd. | | 2,381,404 | | | 95,137,090 |
First Solar, Inc.(1) | | 42,089 | | | 7,951,033 |
Roper Industries, Inc. | | 1,349,860 | | | 76,888,026 |
SunPower Corporation(1) | | 440,600 | | | 31,251,758 |
| | | | | |
| | | | | 211,227,907 |
Machinery - 2.8% | | | | | |
AGCO Corporation(1) | | 1,642,361 | | | 69,981,002 |
Cummins Inc. | | 202,600 | | | 8,857,672 |
Harsco Corporation | | 189,622 | | | 7,052,042 |
PACCAR Inc | | 889,100 | | | 33,954,729 |
| | | | | |
| | | | | 119,845,445 |
| | | | | |
| | | Shares
Held | | Value |
| | | | | |
| INDUSTRIALS (CONTINUED) | | | | | |
Professional Services - 1.3% | | | | | |
Robert Half International Inc. | | 2,236,500 | | $ | 55,353,375 |
| | | | | |
| INFORMATION TECHNOLOGY - 28.5% | | | |
Communications Equipment - 2.7% | | | |
Juniper Networks, Inc.(1) | | 5,385,808 | | | 113,478,975 |
| | | | | |
Computers & Peripherals - 2.0% | | | |
Intermec, Inc.(1)(3) | | 3,481,619 | | | 68,378,997 |
NetApp, Inc.(1) | | 987,787 | | | 18,007,357 |
| | | | | |
| | | | | 86,386,354 |
Electronic Equipment & Instruments - 1.4% | | | | | |
Itron, Inc.(1) | | 229,400 | | | 20,308,782 |
Molex Incorporated | | 977,700 | | | 21,949,365 |
Trimble Navigation Limited(1) | | 641,477 | | | 16,588,595 |
| | | | | |
| | | | | 58,846,742 |
Internet Software &
Services - 0.5% | | | |
Ariba, Inc.(1) | | 688,700 | | | 9,731,331 |
VeriSign, Inc.(1) | | 410,420 | | | 10,703,754 |
| | | | | |
| | | | | 20,435,085 |
IT Services - 5.8% | | | | | |
Affiliated Computer Services, Inc.(1) | | 932,200 | | | 47,197,286 |
Cognizant Technology Solutions Corporation, Class A(1) | | 927,700 | | | 21,179,391 |
Paychex, Inc. | | 250,368 | | | 8,269,655 |
SRA International, Inc., Class A(1) | | 493,800 | | | 11,174,694 |
The Western Union Company | | 6,514,719 | | | 160,718,118 |
| | | | | |
| | | | | 248,539,144 |
Office Electronics - 0.5% | | | | | |
Zebra Technologies Corporation(1) | | 781,003 | | | 21,750,934 |
| | | | | |
Semiconductors & Semiconductor Equipment - 6.5% | | | | | |
Analog Devices, Inc. | | 3,412,854 | | | 89,928,703 |
Broadcom Corporation, Class A(1) | | 4,635,080 | | | 86,351,540 |
Cree, Inc.(1) | | 1,713,000 | | | 39,022,140 |
MEMC Electronic Materials, Inc.(1) | | 458,400 | | | 12,954,384 |
NVIDIA Corporation(1) | | 4,429,083 | | | 47,435,479 |
| | | | | |
| | | | | 275,692,246 |
Software - 9.1% | | | | | |
Autodesk, Inc.(1) | | 1,422,200 | | | 47,714,810 |
Electronic Arts Inc.(1) | | 5,485,285 | | | 202,900,692 |
Intuit Inc.(1) | | 1,310,300 | | | 41,418,583 |
Mc Afee, Inc.(1) | | 704,600 | | | 23,928,216 |
19
| | | | | | |
| | | Shares
Held | | Value |
| | | | | | |
INFORMATION TECHNOLOGY
(CONTINUED) | | | |
Software (Continued) | | | | | | |
Red Hat, Inc.(1) | | | 3,391,195 | | $ | 51,105,309 |
Shanda Interactive Entertainment Limited (DR)(1)(2) | | | 814,000 | | | 20,797,700 |
| | | | | | |
| | | | | | 387,865,310 |
| MATERIALS - 1.6% | | | | | | |
Chemicals - 1.6% | | | | | | |
Ecolab Inc. | | | 507,400 | | | 24,619,048 |
The Mosaic Company | | | 406,928 | | | 27,679,243 |
Olin Corporation | | | 808,400 | | | 15,682,960 |
| | | | | | |
| | | | | | 67,981,251 |
| TELECOMMUNICATION SERVICES - 0.4% | | | | | | |
Wireless Telecommunication Services - 0.4% | | | | | | |
American Tower Corporation(1) | | | 368,000 | | | 13,236,960 |
NII Holdings, Inc.(1) | | | 156,155 | | | 5,921,398 |
| | | | | | |
| | | | | | 19,158,358 |
| UTILITIES - 2.0% | | | | | | |
Independent Power Producers & Energy Traders - 2.0% | | | | | | |
Calpine Corporation(1) | | | 5,143,000 | | | 66,859,000 |
Dynegy Inc.(1) | | | 5,053,000 | | | 18,089,740 |
| | | | | | |
| | | | | | 84,948,740 |
| | | | | | |
Total common stocks
(Cost $4,276,490,706) | | | | | | 4,152,866,703 |
| | |
| | | Par
Amount | | |
SHORT-TERM INVESTMENTS
(CASH EQUIVALENTS) - 2.6% | | | | | | |
Repurchase agreement with Fixed
Income Clearing Corporation,
0.05%, dated 9/30/08, due
10/1/08, maturity value
$112,027,156(4)
(Cost $112,027,000) | | $ | 112,027,000 | | | 112,027,000 |
| | | | | | |
| | | | | | |
Total investments - 99.9%
(Cost $4,388,517,706) | | | | | | 4,264,893,703 |
| | | | | | |
Other assets less liabilities - 0.1% | | | | | | 4,616,134 |
| | | | | | |
| | | | | | |
Total net assets - 100.0%(5) | | | | | $ | 4,269,509,837 |
| | | | | | |
(1) | Non-income producing security. |
(2) | The Fund considers the company to be from outside of the United States. See the Fund’s Statement of Additional Information for information on how a country is assigned. |
| | | | |
Security | | Country | | Trading Currency |
HDFC Bank Limited (DR) | | India | | US dollar |
Mindray Medical International Limited, Class A (DR) | | China | | US dollar |
New Oriental Education & Technology Group Inc. (DR) | | China | | US dollar |
Shanda Interactive Entertainment Limited (DR) | | China | | US dollar |
(3) | Affiliated company as defined by the Investment Company Act of 1940. See Note (6) in Notes to Financial Statements. |
| | | | | |
Issuer | | Maturity | | Value |
U.S. Treasury Bill | | 7/2/2009 | | $ | 1,347,938 |
U.S. Treasury Bill | | 7/30/2009 | | | 112,920,625 |
| | | | | |
| | | | $ | 114,268,563 |
| | | | | |
(5) | Percentages for the various classifications relate to total net assets. |
Company names are as reported by a data service provider and in some cases are translations; a company’s legal name may be different.
(DR) Depository Receipt, voting rights may vary.
| | | | | |
| TOP TEN HOLDINGS - SEPTEMBER 30, 2008 | |
Company Name | | Country | | Percentage
of Total
Net Assets | |
Thermo Fisher Scientific, Inc. | | United States | | 5.0 | % |
Electronic Arts Inc. | | United States | | 4.8 | |
Allergan, Inc. | | United States | | 4.7 | |
Cerner Corporation | | United States | | 4.2 | |
The Western Union Company | | United States | | 3.8 | |
C.R. Bard, Inc. | | United States | | 3.4 | |
Juniper Networks, Inc. | | United States | | 2.7 | |
Avon Products, Inc. | | United States | | 2.5 | |
Cooper Industries, Ltd. | | United States | | 2.2 | |
Analog Devices, Inc. | | United States | | 2.1 | |
| | | | | |
Total | | | | 35.4 | % |
| | | | | |
For the purpose of determining the Fund’s top ten holdings, securities of the same issuer are aggregated to determine the weight in the Fund.
The accompanying notes are an integral part of the financial statements.
20
[THIS PAGE INTENTIONALLY LEFT BLANK]
21
ARTISAN FUNDS, INC.
Statements of Assets and Liabilities – September 30, 2008
| | | | |
| | | EMERGING MARKETS | |
| ASSETS: | | | | |
Investments in securities, unaffiliated, at value | | $ | 70,645,894 | |
Investments in securities, affiliated, at value | | | - | |
Short-term investments (repurchase agreements), at value | | | 2,722,000 | |
| | | | |
Total investments | | | 73,367,894 | |
Cash | | | 291 | |
Foreign currency | | | 1,064,489 | |
Net unrealized gain on foreign currency forward contracts | | | - | |
Receivable from investments sold | | | 156,545 | |
Receivable from fund shares sold | | | 3,967 | |
Dividends and interest receivable | | | 193,676 | |
Receivable from Adviser | | | 40,678 | |
Other assets | | | 260 | |
| | | | |
Total assets | | | 74,827,800 | |
| |
| LIABILITIES: | | | | |
Net unrealized loss on foreign currency forward contracts | | | 2,219 | |
Payable for investments purchased | | | 1,616,472 | |
Payable for fund shares redeemed | | | - | |
Payable for operating expenses | | | 175,159 | |
Payable for withholding taxes | | | 24,278 | |
Payable for deferred directors’ compensation | | | 260 | |
| | | | |
Total liabilities | | | 1,818,388 | |
| | | | |
Total net assets | | $ | 73,009,412 | |
| | | | |
| NET ASSETS CONSIST OF: | | | | |
Fund shares issued and outstanding | | $ | 104,495,427 | |
Net unrealized depreciation on investments and foreign currency related transactions | | | (30,746,025 | ) |
Accumulated undistributed net investment income (loss) | | | 805,727 | |
Accumulated undistributed net realized gains (losses) on investments and foreign currency related transactions | | | (1,545,717 | ) |
| | | | |
| | $ | 73,009,412 | |
| | | | |
| SUPPLEMENTARY INFORMATION: | | | | |
Net assets | | | | |
Investor Shares | | | | |
Institutional Shares | | $ | 69,799,317 | |
Advisor Shares | | $ | 3,210,095 | |
Shares outstanding (Indefinite number of shares authorized, $0.01 par value) | | | | |
Investor Shares | | | | |
Institutional Shares | | | 6,260,244 | |
Advisor Shares | | | 287,690 | |
Net asset value, offering price and redemption price per share | | | | |
Investor Shares | | | | |
Institutional Shares | | $ | 11.15 | |
Advisor Shares | | $ | 11.16 | |
Cost of securities of unaffiliated issuers held | | $ | 104,012,922 | |
Cost of securities of affiliated issuers held | | $ | - | |
Cost of foreign currency | | $ | 1,180,777 | |
22
| | | | | | | | | | |
| INTERNATIONAL | | | INTERNATIONAL VALUE | | | MID CAP | |
| | | | | | | | | | |
| $ | 11,076,840,740 | | | $ | 1,088,031,292 | | | $ | 4,084,487,706 | |
| | 45,393,696 | | | | 66,922,543 | | | | 68,378,997 | |
| | 609,594,000 | | | | 68,665,000 | | | | 112,027,000 | |
| | | | | | | | | | | |
| | 11,731,828,436 | | | | 1,223,618,835 | | | | 4,264,893,703 | |
| | 422 | | | | 769 | | | | 729 | |
| | 569,748 | | | | 30 | | | | - | |
| | 1,139,806 | | | | - | | | | - | |
| | 113,728,503 | | | | - | | | | 66,351,764 | |
| | 20,757,123 | | | | 739,974 | | | | 4,020,994 | |
| | 47,005,349 | | | | 4,749,523 | | | | 2,054,469 | |
| | - | | | | - | | | | - | |
| | 159,434 | | | | 14,694 | | | | 59,286 | |
| | | | | | | | | | | |
| | 11,915,188,821 | | | | 1,229,123,825 | | | | 4,337,380,945 | |
| | |
| | | | | | | | | | |
| | - | | | | 426,794 | | | | - | |
| | 80,970,681 | | | | 7,664,699 | | | | 56,783,911 | |
| | 19,603,246 | | | | 4,552,231 | | | | 7,827,723 | |
| | 8,296,547 | | | | 852,399 | | | | 3,200,188 | |
| | 2,428,533 | | | | 89,666 | | | | - | |
| | 159,434 | | | | 14,694 | | | | 59,286 | |
| | | | | | | | | | | |
| | 111,458,441 | | | | 13,600,483 | | | | 67,871,108 | |
| | | | | | | | | | | |
| $ | 11,803,730,380 | | | $ | 1,215,523,342 | | | $ | 4,269,509,837 | |
| | | | | | | | | | | |
| | | | | | | | | | |
| $ | 12,651,200,812 | | | $ | 1,332,433,919 | | | $ | 4,368,874,864 | |
| | (1,283,052,215 | ) | | | (110,017,609 | ) | | | (123,624,003 | ) |
| | 109,355,577 | | | | 5,072,824 | | | | (74,763 | ) |
| | 326,226,206 | | | | (11,965,792 | ) | | | 24,333,739 | |
| | | | | | | | | | | |
| $ | 11,803,730,380 | | | $ | 1,215,523,342 | | | $ | 4,269,509,837 | |
| | | | | | | | | | | |
| | | | | | | | | | |
| | | | | | | | | | |
| $ | 8,759,967,297 | | | $ | 1,029,408,703 | | | $ | 3,732,293,539 | |
| $ | 3,043,763,083 | | | $ | 186,114,639 | | | $ | 537,216,298 | |
| | | | | | | | | | |
| | | | | | | | | | |
| | 430,699,781 | | | | 48,550,327 | | | | 154,997,600 | |
| | 148,395,294 | | | | 8,771,373 | | | | 21,742,869 | |
| | | | | | | | | | |
| | | | | | | | | | |
| $ | 20.34 | | | $ | 21.20 | | | $ | 24.08 | |
| $ | 20.51 | | | $ | 21.22 | | | $ | 24.71 | |
| | | | | | | | | | |
| $ | 12,903,018,920 | | | $ | 1,266,619,196 | | | $ | 4,299,634,887 | |
| $ | 110,038,880 | | | $ | 66,529,213 | | | $ | 88,882,819 | |
| $ | 569,631 | | | $ | 31 | | | $ | - | |
The accompanying notes are an integral part of the financial statements.
23
ARTISAN FUNDS, INC.
Statements of Operations – For the Year Ended September 30, 2008
| | | | |
| | | EMERGING MARKETS | |
| INVESTMENT INCOME: | | | | |
Dividends, from unaffiliated issuers(1) | | $ | 1,934,788 | |
Dividends, from affiliated issuers(1) | | | - | |
Interest | | | 65,169 | |
Securities lending | | | - | |
| | | | |
Total investment income | | | 1,999,957 | |
| EXPENSES: | | | | |
Advisory fees | | | 787,254 | |
Transfer agent fees | | | | |
Investor Shares | | | | |
Institutional Shares | | | 20,857 | |
Advisor Shares | | | 16,992 | |
Shareholder communications | | | | |
Investor Shares | | | | |
Institutional Shares | | | 13,935 | |
Advisor Shares | | | 2,240 | |
Custodian fees | | | 129,718 | |
Accounting fees | | | 61,023 | |
Professional fees | | | 67,632 | |
Less insurance recoveries(2) | | | - | |
| | | | |
Net professional fees | | | 67,632 | |
Registration fees | | | | |
Investor Shares | | | | |
Institutional Shares | | | 34,659 | |
Advisor Shares | | | 17,519 | |
Directors’ fees | | | 6,000 | |
Other operating expenses | | | 7,498 | |
| | | | |
Total operating expenses | | | 1,165,327 | |
Less amounts waived or paid by the Adviser or the board of directors | | | (40,678 | ) |
| | | | |
Net expenses | | | 1,124,649 | |
| | | | |
Net investment income (loss) | | | 875,308 | |
| NET REALIZED AND UNREALIZED GAINS (LOSSES) ON INVESTMENTS: | | | | |
Net realized gain (loss) on: | | | | |
Investments(1) | | | (1,369,976 | ) |
Foreign currency related transactions | | | (80,293 | ) |
| | | | |
| | | (1,450,269 | ) |
Net increase (decrease) in unrealized appreciation or depreciation on: | | | | |
Investments | | | (33,499,682 | ) |
Foreign currency related transactions | | | (82,858 | ) |
| | | | |
| | | (33,582,540 | ) |
| | | | |
Net (loss) on investments and foreign currency related transactions | | | (35,032,809 | ) |
| | | | |
Net (decrease) in net assets resulting from operations | | $ | (34,157,501 | ) |
| | | | |
| | | | | | | | | | | | |
| (1) | | Fund | | Net of foreign taxes
withheld on dividends,
unaffiliated issuers | | Net of foreign taxes
withheld on dividends,
affiliated issuers | | Including net realized
gain (loss) on investments
from affiliated issuers | |
| | Emerging Markets | | $ | 180,826 | | $ | - | | $ | - | |
| | International | | | 42,466,408 | | | 129,739 | | | (74,860,419 | ) |
| | International Value | | | 2,812,383 | | | 272,264 | | | 28,078,821 | |
| | Mid Cap | | | - | | | - | | | (65,165,460 | ) |
(2) | For the year ended September 30, 2008, the International Fund incurred $980,022 in total professional fees. As described in Note (9) in Notes to Financial Statements, $357,858 in insurance recoveries were received relating to reimbursement of litigation defense costs, and were recorded as a reduction to professional fees during the year ended September 30, 2008. |
24
| | | | | | | | | | |
| INTERNATIONAL | | | INTERNATIONAL VALUE | | | MID CAP | |
| | | | | | | | | | |
| $ | 388,797,017 | | | $ | 38,424,853 | | | $ | 18,893,301 | |
| | 1,578,042 | | | | 5,509,883 | | | | - | |
| | 9,427,233 | | | | 2,778,113 | | | | 7,659,487 | |
| | 5,642,452 | | | | - | | | | - | |
| | | | | | | | | | | |
| | 405,444,744 | | | | 46,712,849 | | | | 26,552,788 | |
| | | | | | | | | | |
| | 150,037,798 | | | | 14,645,235 | | | | 50,517,929 | |
| | | | | | | | | | |
| | 27,106,651 | | | | 2,421,236 | | | | 12,828,644 | |
| | 32,716 | | | | 12,791 | | | | 18,684 | |
| | | | | | | | | | |
| | | | | | | | | | |
| | 1,520,619 | | | | 333,979 | | | | 899,562 | |
| | 54,559 | | | | 9,927 | | | | 11,959 | |
| | | | | | | | | | |
| | 6,966,846 | | | | 491,746 | | | | 114,884 | |
| | 76,134 | | | | 71,788 | | | | 64,162 | |
| | 980,022 | | | | 102,311 | | | | 205,017 | |
| | (357,858 | ) | | | - | | | | - | |
| | | | | | | | | | | |
| | 622,164 | | | | 102,311 | | | | 205,017 | |
| | | | | | | | | | |
| | 195,547 | | | | 66,185 | | | | 69,665 | |
| | 34,307 | | | | 13,308 | | | | 15,486 | |
| | | | | | | | | | |
| | 481,741 | | | | 44,948 | | | | 157,886 | |
| | 409,367 | | | | 47,315 | | | | 145,703 | |
| | | | | | | | | | | |
| | 187,538,449 | | | | 18,260,769 | | | | 65,049,581 | |
| | - | | | | - | | | | - | |
| | | | | | | | | | | |
| | 187,538,449 | | | | 18,260,769 | | | | 65,049,581 | |
| | | | | | | | | | | |
| | 217,906,295 | | | | 28,452,080 | | | | (38,496,793 | ) |
| | | | | | | | | | |
| | | | | | | | | | |
| | 660,360,491 | | | | 4,267,300 | | | | 258,568,758 | |
| | (5,330,672 | ) | | | (125,520 | ) | | | 638 | |
| | | | | | | | | | | |
| | 655,029,819 | | | | 4,141,780 | | | | 258,569,396 | |
| | | | | | | | | | |
| | (6,035,684,040 | ) | | | (339,642,758 | ) | | | (1,548,010,123 | ) |
| | (1,742,370 | ) | | | (559,100 | ) | | | (227 | ) |
| | | | | | | | | | | |
| | (6,037,426,410 | ) | | | (340,201,858 | ) | | | (1,548,010,350 | ) |
| | | | | | | | | | | |
| | (5,382,396,591 | ) | | | (336,060,078 | ) | | | (1,289,440,954 | ) |
| | | | | | | | | | | |
| $ | (5,164,490,296 | ) | | $ | (307,607,998 | ) | | $ | (1,327,937,747 | ) |
| | | | | | | | | | | |
The accompanying notes are an integral part of the financial statements.
25
ARTISAN FUNDS, INC.
Statements of Changes in Net Assets
| | | | | | | | |
| | | EMERGING MARKETS | |
| | | Year Ended
9/30/2008 | | | Year Ended
9/30/2007 | |
| | |
| OPERATIONS: | | | | | | | | |
Net investment income (loss) | | $ | 875,308 | | | $ | 63,262 | |
Net realized gain (loss) on: | | | | | | | | |
Investments | | | (1,369,976 | ) | | | 1,381,724 | |
Foreign currency related transactions | | | (80,293 | ) | | | (36,234 | ) |
Net increase (decrease) in unrealized appreciation or depreciation on: | | | | | | | | |
Investments | | | (33,499,682 | ) | | | 2,411,591 | |
Foreign currency related transactions | | | (82,858 | ) | | | (14,136 | ) |
| | | | | | | | |
Net increase (decrease) in net assets resulting from operations | | | (34,157,501 | ) | | | 3,806,207 | |
| | |
| DISTRIBUTIONS PAID TO SHAREHOLDERS: | | | | | | | | |
Net investment income: | | | | | | | | |
Investor Shares | | | | | | | | |
Institutional Shares | | | (39,728 | ) | | | (15,593 | ) |
Advisor Shares | | | - | | | | | |
Net realized gains on investment transactions: | | | | | | | | |
Investor Shares | | | | | | | | |
Institutional Shares | | | (1,484,717 | ) | | | (166,242 | ) |
Advisor Shares | | | - | | | | | |
| | | | | | | | |
Total distributions paid to shareholders | | | (1,524,445 | ) | | | (181,835 | ) |
| | |
| FUND SHARE ACTIVITIES: | | | | | | | | |
Net increase (decrease) in net assets resulting from fund share activities | | | 90,274,995 | | | | 8,910,431 | |
| | | | | | | | |
Total increase (decrease) in net assets | | | 54,593,049 | | | | 12,534,803 | |
| | | | | | | | |
Net assets, beginning of period | | | 18,416,363 | | | | 5,881,560 | |
| | | | | | | | |
Net assets, end of period | | $ | 73,009,412 | | | $ | 18,416,363 | |
| | | | | | | | |
| | | | | | | | |
Accumulated undistributed net investment income (loss) | | $ | 805,727 | | | $ | 28,456 | |
| | | | | | | | |
26
| | | | | | | | | | | | | | | | | | | | | | |
| | INTERNATIONAL | | | | INTERNATIONAL VALUE | | | | MID CAP | |
Year Ended
9/30/2008 | | | Year Ended
9/30/2007 | | | Year Ended
9/30/2008 | | | Year Ended
9/30/2007 | | | Year Ended
9/30/2008 | | | Year Ended
9/30/2007 | |
| | | | | |
| | | | | | | | | | | | | | | | | | | | | | |
| $ | 217,906,295 | | | $ | 170,443,080 | | | $ | 28,452,080 | | | $ | 25,017,010 | | | $ | (38,496,793 | ) | | $ | (38,619,173 | ) |
| | | | | | | | | | | | | | | | | | | | | | |
| | 660,360,491 | | | | 2,377,934,207 | | | | 4,267,300 | | | | 123,912,908 | | | | 258,568,758 | | | | 1,029,163,034 | |
| | (5,330,672 | ) | | | (2,590,790 | ) | | | (125,520 | ) | | | (479,568 | ) | | | 638 | | | | - | |
| | | | | | | | | | | | | | | | | | | | | | |
| | (6,035,684,040 | ) | | | 1,463,335,658 | | | | (339,642,758 | ) | | | 54,992,214 | | | | (1,548,010,123 | ) | | | 460,018,755 | |
| | (1,742,370 | ) | | | (11,135 | ) | | | (559,100 | ) | | | 90,080 | | | | (227 | ) | | | 227 | |
| | | | | | | | | | | | | | | | | | | | | | | |
| | (5,164,490,296 | ) | | | 4,009,111,020 | | | | (307,607,998 | ) | | | 203,532,644 | | | | (1,327,937,747 | ) | | | 1,450,562,843 | |
| | | | | |
| | | | | | | | | | | | | | | | | | | | | | |
| | | | | | | | | | | | | | | | | | | | | | |
| | (77,647,652 | ) | | | (149,579,440 | ) | | | (26,380,830 | ) | | | (24,384,272 | ) | | | - | | | | - | |
| | (38,324,885 | ) | | | (69,406,627 | ) | | | (4,772,229 | ) | | | (1,768,836 | ) | | | - | | | | - | |
| | | | | | | | | | | | | | | | | | | | | | |
| | | | | | | | | | | | | | | | | | | | | | |
| | (1,707,284,385 | ) | | | (800,807,381 | ) | | | (86,616,796 | ) | | | (70,469,856 | ) | | | (883,929,699 | ) | | | (480,601,368 | ) |
| | (637,085,303 | ) | | | (332,232,670 | ) | | | (13,775,532 | ) | | | (4,994,818 | ) | | | (121,786,964 | ) | | | (82,408,794 | ) |
| | | | | | | | | | | | | | | | | | | | | | |
| | | | | | | | | | | | | | | | | | | | | | | |
| | (2,460,342,225 | ) | | | (1,352,026,118 | ) | | | (131,545,387 | ) | | | (101,617,782 | ) | | | (1,005,716,663 | ) | | | (563,010,162 | ) |
| | | | | |
| | | | | | | | | | | | | | | | | | | | | | |
| | 1,569,193,725 | | | | 1,284,431,884 | | | | (158,902,687 | ) | | | 399,089,514 | | | | 498,434,390 | | | | (152,617,669 | ) |
| | | | | | | | | | | | | | | | | | | | | | | |
| | (6,055,638,796 | ) | | | (3,941,516,786 | ) | | | (598,056,072 | ) | | | 501,004,376 | | | | (1,835,220,020 | ) | | | 734,935,012 | |
| | | | | | | | | | | | | | | | | | | | | | | |
| | 17,859,369,176 | | | | 13,917,852,390 | | | | 1,813,579,414 | | | | 1,312,575,038 | | | | 6,104,729,857 | | | | 5,369,794,845 | |
| | | | | | | | | | | | | | | | | | | | | | | |
| $ | 11,803,730,380 | | | $ | 17,859,369,176 | | | $ | 1,215,523,342 | | | $ | 1,813,579,414 | | | $ | 4,269,509,837 | | | $ | 6,104,729,857 | |
| | | | | | | | | | | | | | | | | | | | | | | |
| | | | | | | | | | | | | | | | | | | | | | |
| $ | 109,355,577 | | | $ | 10,487,437 | | | $ | 5,072,824 | | | $ | 8,775,647 | | | $ | (74,763 | ) | | $ | (47,262 | ) |
| | | | | | | | | | | | | | | | | | | | | | | |
The accompanying notes are an integral part of the financial statements.
27
ARTISAN FUNDS, INC.
Financial Highlights – For a share outstanding throughout each period
| | | | | | | | | | | | | | | | | | | | | | | | |
Year or
Period
Ended | | | Net Asset
Value
Beginning
of Period | | Net
Investment
Income(1) | | | Net Realized
and Unrealized
Gain (Loss) on
Investments | | | Total Income
(Loss) from
Investment
Operations | | |
Dividends
from Net
Investment
Income | | | Distributions
from Net
Realized
Gains | |
| | | | | | | | | | | | | | | | | | | | | | | | |
| ARTISAN EMERGING MARKETS FUND | | | | | | | | | | | | | |
| Institutional Shares | | | | | | | | | | | | | | | | | | | | | | | | |
| 9/30/2008 | | | $ | 16.71 | | $ | 0.18 | | | $ | (5.41 | ) | | $ | (5.23 | ) | | $ | (0.01 | ) | | $ | (0.32 | ) |
| 9/30/2007 | | | | 11.15 | | | 0.09 | | | | 5.81 | | | | 5.90 | | | | (0.03 | ) | | | (0.31 | ) |
| 9/30/2006 | (5) | | | 10.00 | | | 0.03 | | | | 1.12 | | | | 1.15 | | | | - | | | | - | |
| | | | | | | | | | | | | | | | | | | | | | | | |
| ARTISAN INTERNATIONAL FUND | | | | | | | | | | | | | |
| Institutional Shares | | | | | | | | | | | | | | | | | | | | | | | | |
| 9/30/2008 | | | $ | 33.99 | | $ | 0.42 | | | $ | (9.16 | ) | | $ | (8.74 | ) | | $ | (0.27 | ) | | $ | (4.47 | ) |
| 9/30/2007 | | | | 28.92 | | | 0.37 | | | | 7.52 | | | | 7.89 | | | | (0.49 | ) | | | (2.33 | ) |
| 9/30/2006 | | | | 24.54 | | | 0.22 | | | | 4.62 | | | | 4.84 | | | | (0.46 | ) | | | - | |
| 9/30/2005 | | | | 19.44 | | | 0.25 | | | | 5.01 | | | | 5.26 | | | | (0.16 | ) | | | - | |
| 9/30/2004 | | | | 16.63 | | | 0.16 | | | | 2.86 | | | | 3.02 | | | | (0.21 | ) | | | - | |
| | | | | | | | | | | | | | | | | | | | | | | | |
| ARTISAN INTERNATIONAL VALUE FUND | | | | | | | | | | | | | | | | | | | | |
| Institutional Shares | | | | | | | | | | | | | | | | | | | | | | | | |
| 9/30/2008 | | | $ | 28.53 | | $ | 0.52 | | | $ | (5.58 | ) | | $ | (5.06 | ) | | $ | (0.58 | ) | | $ | (1.67 | ) |
| 9/30/2007 | | | | 26.71 | | | 0.41 | | | | 3.14 | | | | 3.55 | | | | (0.45 | ) | | | (1.28 | ) |
| | | | | | | | | | | | | | | | | | | | | | | | |
| ARTISAN MID CAP FUND | | | | | | | | | | | | | | | | | | | | |
| Institutional Shares | | | | | | | | | | | | | | | | | | | | | | | | |
| 9/30/2008 | | | $ | 37.78 | | $ | (0.14 | ) | | $ | (7.03 | ) | | $ | (7.17 | ) | | $ | - | | | $ | (5.90 | ) |
| 9/30/2007 | | | | 32.24 | | | (0.16 | ) | | | 9.17 | | | | 9.01 | | | | - | | | | (3.47 | ) |
| 9/30/2006 | | | | 31.21 | | | (0.10 | ) | | | 2.46 | | | | 2.36 | | | | - | | | | (1.33 | ) |
| 9/30/2005 | | | | 26.38 | | | (0.12 | ) | | | 4.95 | | | | 4.83 | | | | - | | | | - | |
| 9/30/2004 | | | | 23.28 | | | (0.14 | ) | | | 3.24 | | | | 3.10 | | | | - | | | | - | |
(1) | Computed based on average shares outstanding. |
(2) | Periods less than twelve months (where applicable) are not annualized. |
(3) | Periods less than twelve months (where applicable) are annualized. |
(4) | The ratios of expenses to average net assets and net investment income (loss) to average net assets exclude expenses waived or paid by the Adviser or the board of directors. Absent expenses waived or paid by the Adviser or the board of directors, the ratios of expenses to average net assets and net investment income (loss) to average net assets would have been as follows: |
| | | | | | | | |
| Fund | | Year or
Period Ended | | Ratio of Expenses to
Average Net Assets | | | Ratio of Net Investment Income
(Loss) to Average Net Assets | |
Emerging Markets Institutional Shares | | 9/30/2008 | | 1.51 | % | | 1.16 | % |
| | 9/30/2007 | | 3.19 | | | (1.08 | ) |
| | 9/30/2006 | | 7.58 | | | (5.11 | ) |
(5) | For the period from commencement of operations (June 26, 2006) through September 30, 2006. |
28
| | | | | | | | | | | | | | | | | | | | |
Total
Distributions | | | Net Asset
Value
End of
Period | | Total
Return(2) | | | Net Assets
End of
Period
(millions) | | Ratio of
Expenses
to Average
Net Assets(3)(4) | | | Ratio of Net
Investment
Income to
Average Net Assets(3)(4) | | | Portfolio
Turnover
Rate(2) | |
| | | | | | | | | | | | | | | | | | | | |
| | | | | | | | | | | | | | | | | | | | | |
| | | | | | | | | | | | | | | | | | | | | |
| $ | (0.33 | ) | | $ | 11.15 | | (31.91 | )% | | $ | 69.8 | | 1.50 | % | | 1.17 | % | | 42.24 | % |
| | (0.34 | ) | | | 16.71 | | 53.99 | | | | 18.4 | | 1.44 | | | 0.67 | | | 71.28 | |
| | - | | | | 11.15 | | 11.50 | | | | 5.9 | | 1.40 | | | 1.07 | | | 24.26 | |
| | | | | | | | | | | | | | | | | | | | |
| | | | | | | | | | | | | | | | | | | | | |
| | | | | | | | | | | | | | | | | | | | | |
| $ | (4.74 | ) | | $ | 20.51 | | (29.83 | )% | | $ | 3,043.8 | | 0.98 | % | | 1.50 | % | | 54.42 | % |
| | (2.82 | ) | | | 33.99 | | 28.99 | | | | 5,049.3 | | 0.98 | | | 1.22 | | | 66.30 | |
| | (0.46 | ) | | | 28.92 | | 20.07 | | | | 4,116.0 | | 1.00 | | | 0.82 | | | 57.80 | |
| | (0.16 | ) | | | 24.54 | | 27.21 | | | | 3,988.1 | | 0.99 | | | 1.11 | | | 56.15 | |
| | (0.21 | ) | | | 19.44 | | 18.31 | | | | 3,622.1 | | 1.01 | | | 0.85 | | | 54.96 | |
| | | | | | | | | | | | | | | | | | | | |
| | | | | | | | | | | | | | | | | | | | | |
| | | | | | | | | | | | | | | | | | | | | |
| $ | (2.25 | ) | | $ | 21.22 | | (18.92 | )% | | $ | 186.1 | | 1.03 | % | | 2.10 | % | | 44.72 | % |
| | (1.73 | ) | | | 28.53 | | 13.48 | | | | 218.9 | | 1.06 | | | 1.47 | | | 45.60 | |
| | | | | | | | | | | | | | | | | | | | |
| | | | | | | | | | | | | | | | | | | | | |
| | | | | | | | | | | | | | | | | | | | | |
| $ | (5.90 | ) | | $ | 24.71 | | (22.23 | )% | | $ | 537.2 | | 0.95 | % | | (0.46 | )% | | 79.76 | % |
| | (3.47 | ) | | | 37.78 | | 30.17 | | | | 785.4 | | 0.95 | | | (0.47 | ) | | 71.04 | |
| | (1.33 | ) | | | 32.24 | | 7.66 | | | | 797.9 | | 0.95 | | | (0.31 | ) | | 73.59 | |
| | - | | | | 31.21 | | 18.35 | | | | 981.3 | | 0.95 | | | (0.40 | ) | | 83.00 | |
| | - | | | | 26.38 | | 13.27 | | | | 1,036.0 | | 0.96 | | | (0.54 | ) | | 101.09 | |
The accompanying notes are an integral part of the financial statements.
29
ARTISAN FUNDS, INC.
Notes to Financial Statements – September 30, 2008
Artisan Funds, Inc. (“Artisan Funds”) was incorporated on January 5, 1995, as a Wisconsin corporation and is registered under the Investment Company Act of 1940, as amended. Artisan Funds is a series comprised of eleven open-end, diversified mutual funds. Artisan Emerging Markets Fund (“Emerging Markets Fund” or “Emerging Markets”), Artisan International Fund (“International Fund” or “International”), Artisan International Value Fund (“International Value Fund” or “International Value”) and Artisan Mid Cap Fund (“Mid Cap Fund” or “Mid Cap”), each a series of Artisan Funds (each a “Fund,” and collectively, the “Funds”), commenced operations on June 26, 2006, December 28, 1995, September 23, 2002 and June 27, 1997, respectively. Each Fund’s investment objective is to seek long-term capital growth.
Emerging Markets Fund offers shares of capital stock of two classes – Institutional Shares and Advisor Shares – and has offered Institutional Shares since the commencement of operations and began offering Advisor Shares on June 2, 2008. International Fund, International Value Fund and Mid Cap Fund offer shares of capital stock of two classes – Institutional Shares and Investor Shares – and have offered Investor Shares since the commencement of operations. International Fund, International Value Fund and Mid Cap Fund began offering Institutional Shares on July 1, 1997, October 1, 2006 and July 1, 2000, respectively. Institutional Shares are sold to institutional investors meeting certain minimum investment requirements.
Each class of shares has equal rights with respect to portfolio assets and voting privileges. Each class has exclusive voting rights with respect to any matters involving only that class.
Income, expenses not specific to either class and realized and unrealized gains and losses were allocated daily to each class of shares based upon the relative net asset value of outstanding shares. Expenses attributable to a particular class of shares, such as transfer agency fees, shareholder communication expenses and registration fees, were allocated directly to that class.
| (2) | Summary of significant accounting policies: |
The following is a summary of significant accounting policies of the Funds in effect during the period covered by the financial statements, which were in accordance with United States generally accepted accounting principles.
| (a) | Security valuation – The net asset value (“NAV”) of the shares of each class of each Fund was determined as of the close of regular session trading on the New York Stock Exchange (“NYSE”) (usually 4:00 p.m., Eastern Time, but sometimes earlier) each day the NYSE was open for regular session trading. The NAV of each class of shares was determined by dividing the value of each Fund’s securities and other assets attributed to that class, less its liabilities attributed to that class, by the number of outstanding shares of that class of that Fund. |
| | In determining NAV, each equity security traded on a securities exchange, including the Nasdaq Stock Market and over-the-counter securities, was valued at the closing price as of the time of valuation on the exchange or market designated by the Fund’s |
30
NOTES TO FINANCIAL STATEMENTS
| | accounting agent or pricing vendor as the principal exchange (the “principal exchange”). The closing price provided by the pricing vendor for a principal exchange may differ and may represent information such as last sales price, an official closing price, a closing auction price or other information, depending on exchange or market convention. Absent closing price information from the principal exchange as of the time of valuation, the security was valued using the closing price on another exchange on which the security traded (if such price is made available by the pricing vendor) or the most recent bid quotation on the principal exchange or, if not available, another exchange or in the over-the-counter market, except that securities listed on the London Stock Exchange were valued at the mean of the most recent bid and asked quotations as of the time of valuation. Short-term investments, other than repurchase agreements, maturing within sixty days from the valuation date were valued at amortized cost, which approximates market value. |
| | Securities for which prices were not readily available were valued by Artisan Funds’ valuation committee (the “valuation committee”) at a fair value determined in good faith under procedures established by and under the general supervision of Artisan Funds’ board of directors (the “board of directors”). A price was considered to be not readily available if, among other things, the valuation committee believed that the price determined as described in the preceding paragraph did not reflect a fair value of the security. |
| | Emerging Markets Fund, International Fund, and International Value Fund generally invested a significant portion, and perhaps as much as substantially all, of their total assets in securities principally traded in markets outside the U.S. Mid Cap Fund had the ability to invest in securities principally traded outside the U.S. The foreign markets in which the Funds invested were sometimes open on days when the NYSE was not open and the Funds did not calculate their NAVs, and sometimes were not open on days when the Funds did calculate their NAVs. Even on days on which both the foreign market and the NYSE were open, several hours may have passed between the time when trading in the foreign market closed and the time as of which the Funds calculate their NAVs. That was generally the case for markets in Europe, Asia, Australia and other far eastern markets; the regular closing time of foreign markets in North and South America was generally the same as the closing time of the NYSE and the time as of which the Funds calculated their NAVs. |
| | The valuation committee concluded that a price determined under the Funds’ valuation procedures was not readily available if, among other things, the valuation committee believed that the value of the security might have been materially affected by events occurring after the close of the market in which the security was principally traded but before the time for determination of NAV (“subsequent event”). A subsequent event might include a company-specific development (for example, announcement of a merger that is made after the close of the foreign market), a development that might affect an entire market or region (for example, imposition of foreign exchange controls by a foreign government), a potentially global development (such as a terrorist attack that may be expected to have an impact on investor expectations worldwide) or a significant change in one or more U.S. securities indices. Artisan Funds monitored for subsequent events using several tools. An indication by any of those tools of a potential material change in the value of securities resulted in either a meeting of the valuation |
31
NOTES TO FINANCIAL STATEMENTS
| | committee, which considered whether a subsequent event had occurred and whether local market closing prices continued to represent fair values for potentially affected non-U.S. securities, and/or a valuation based on information provided by a third party research service. This third party research service was used to assist in determining estimates of fair values for foreign securities. That service utilized statistical data based on historical performance of securities, markets and other data in developing factors used to estimate a fair value. |
| | Estimates of fair values utilized by the Funds as described above may differ from the value realized on the subsequent sale of those securities and from quoted or published prices for those securities. The differences may have been material to the NAV of the applicable Fund or to the information presented. |
| | There are certain risks involved in investing in foreign securities. These risks include those resulting from future adverse political, social, and economic developments, fluctuations in currency exchange rates, the possible imposition of exchange controls, and other foreign laws or restrictions. The risks of foreign investments typically are greater in emerging markets. |
| (b) | Income taxes – No provision was made for federal income taxes or excise taxes since each Fund intends to (i) comply with the provisions of Subchapter M of the Internal Revenue Code applicable to regulated investment companies and (ii) distribute to its shareholders substantially all of its taxable income as well as net realized gains from the sale of investment securities. The Funds may utilize earnings and profits distributed to shareholders on redemptions of Fund shares as part of the dividends paid deduction. |
| | The Funds may be subject to taxes on realized gains from the sale of investment securities imposed by certain countries in which the Funds invest. The Funds recorded the foreign tax expense, if any, on an accrual basis. The taxes were included in “Payable for withholding taxes” on the accompanying Statements of Assets and Liabilities. |
| (c) | Portfolio transactions – In determining a Fund’s NAV, security transactions and shareholder transactions were accounted for no later than one business day after trade date, in accordance with applicable law. However, for financial reporting purposes, security transactions and shareholder transactions were recorded on trade date in accordance with United States generally accepted accounting principles. Net realized gains and losses on securities were computed on specific security lot identification. |
| (d) | Foreign currency translation – Values of foreign investments, open foreign currency forward contracts, payables for capital gains taxes and cash denominated in foreign currencies were translated into U.S. dollars using a spot market rate of exchange as of the time of determination of each Fund’s NAV on the day of valuation. Payables and receivables for securities transactions, dividend and reclaim receivables and other receivables and payables denominated in a foreign currency were translated into U.S. dollars using a spot market rate of exchange as of 12:00 p.m. (Eastern Time) on the day of valuation. Purchases and sales of investments and dividend and interest income were translated into U.S. dollars using a spot market rate of exchange as of 12:00 p.m. (Eastern Time) on the date of such transactions. The portion of security gains or losses resulting from changes in foreign exchange rates was included with net realized and unrealized gain or loss from investments, as appropriate, for both financial reporting and tax purposes. |
32
NOTES TO FINANCIAL STATEMENTS
| | The Funds may enter into foreign currency forward contracts to hedge the foreign currency exposure on open payables and receivables. These foreign currency forward contracts, or spot contracts, generally settle within two business days. The Funds also may enter into foreign currency forward contracts to hedge against foreign currency exchange rate risks on its non-U.S. dollar denominated investment securities. At September 30, 2008, International Value Fund held a foreign currency forward contract to hedge against foreign currency exchange rate risk on a non-U.S. dollar denominated investment security. Foreign currency forward contracts were recorded at market value and any related realized and unrealized gains and losses were reported as foreign currency related transactions for financial reporting purposes. For tax purposes, these foreign exchange gains and losses were treated as ordinary income or loss. The Funds could be exposed to loss if the counterparties fail to perform under these contracts. |
| | Other foreign currency related transaction gains and losses may result from currency gains and losses realized from the difference between the amounts of dividends and foreign withholding taxes recorded on the Funds’ books and the U.S. dollar equivalent of the amounts actually received or paid. The net increase (decrease) in unrealized appreciation or depreciation on foreign currency related transactions arose from changes in the values of assets and liabilities, other than investments in securities, resulting from changes in foreign exchange rates. |
| (e) | Repurchase agreements – Each Fund may enter into repurchase agreements with institutions that Artisan Partners Limited Partnership (“the Adviser”) determined were creditworthy pursuant to criteria adopted by the board of directors. Repurchase agreements were recorded at cost plus accrued interest and were collateralized in an amount greater than or equal to the repurchase price plus accrued interest. Collateral was held by the Funds’ custodian and in the event of default on the obligation of the counterparty to repurchase, the Funds had the right to liquidate the collateral and apply the proceeds in satisfaction of the obligation. If the proceeds from any sale of such collateral were less than the repurchase price, the Fund would have suffered a loss. |
| (f) | Depository receipts – Each of the Funds may invest in depository receipts. Depository receipts are typically issued by a financial institution (a “depository”), evidencing ownership interests in a security issued by an issuer and deposited with the depository. |
| (g) | Securities lending – Each of the Funds may enter into securities lending transactions secured by collateral in the form of U.S. Government securities at least equal to, at all times, the fair value of the securities loaned. When securities are on loan, the Fund does not receive dividends on the securities loaned, but receives compensation from the borrower in lieu of such dividends. Gain or loss in the fair value of the securities loaned that may occur during the term of the loan will be for the account of the applicable Fund. In entering into securities lending arrangements, the Fund takes the risk that the borrower may not provide additional collateral when required or return the securities when due or, if the borrower defaults, the Fund may experience delays in selling collateral or the collateral may not be sufficient to cover the value of securities lent. There were no securities on loan as of September 30, 2008. |
| | During the year ended September 30, 2008, International Fund earned $5,642,452 from securities lending transactions, which was included in the accompanying Statement of Operations. |
33
NOTES TO FINANCIAL STATEMENTS
| (h) | Equity-linked participation certificates – The Funds may invest in equity-linked participation certificates. Equity-linked participation certificates are derivative securities which are specially designed to combine the characteristics of one or more underlying securities and their equity derivatives in a single note form. An investment in equity-linked participation certificates creates exposure to the credit risk of the issuing financial institution, as well as to the market risk of the underlying securities. There is no guaranteed return of principal with these securities and the appreciation potential of these securities may be limited by a maximum payment or call right. Equity-linked participation certificates may be more volatile and less liquid than equity securities. |
| (i) | Commission recapture – Each of the Funds had the ability to direct portfolio trades to various brokers that have agreed to rebate a portion of the commissions generated. Such cash rebates were made directly to the applicable Fund and were included in net realized gain or loss on investments in the Statements of Operations as follows: |
| | | |
Emerging Markets | | $ | - |
International | | | - |
International Value | | | 5,066 |
Mid Cap | | | 478,970 |
| (j) | Use of estimates – The preparation of financial statements in conformity with United States generally accepted accounting principles requires management to make estimates and assumptions that affect the reported amounts and disclosures in the financial statements. Actual results could differ from those estimates. |
| (k) | Indemnifications – In the normal course of business, the Funds have entered into contracts in which the Funds agree to indemnify the other party or parties against various potential costs or liabilities. The Funds’ maximum exposure under these arrangements is unknown. No claim had been made for indemnification pursuant to any such agreement of the Funds. |
| (l) | Other – Dividend income less foreign taxes withheld, if any, was generally recorded on the ex-dividend date. In some cases, the information was not available to the Fund on the ex-dividend date. In such cases, which may have included dividends from private placements or foreign securities, dividends were recorded as soon after the ex-dividend date as reliable information became available to the Funds. Non-cash dividends included in dividend income, if any, were generally recorded at the fair market value of securities received. Interest income was recorded on the accrual basis. Distributions to shareholders were recorded on the ex-dividend date. Expenses attributable to Artisan Funds were generally allocated to each Fund based on net assets. However, other expense allocation methodologies were used, depending on the nature of the expense item. Expenses attributable to a particular Fund or class were allocated directly to that Fund or class. |
| | The character of income and net realized gains and losses may differ in some instances for financial statement and tax purposes and may result in reclassification of permanent differences among certain capital accounts to more appropriately conform financial accounting to tax characterizations of dividend and capital gain distributions. |
| | Emerging Markets Fund, International Fund, and International Value Fund generally imposed a 2% redemption fee on shares held 90 days or less. Those redemption fees |
34
NOTES TO FINANCIAL STATEMENTS
| | were recorded as a reduction in the cost of shares redeemed and had the primary effect of increasing paid-in capital. Each Fund reserved the right to waive or reduce the 2% redemption fee on shares held 90 days or less at its discretion when the Fund believed such waiver was in the best interests of the Fund, including but not limited to when it determined that imposition of the redemption fee was not necessary to protect the Fund from the effects of short-term trading. The Funds waived the fee on redemption of shares held by certain authorized agents or other Fund intermediaries. |
| (3) | Transactions with affiliates: |
The Adviser, with which the officers and a director of Artisan Funds were affiliated, provided investment advisory and administrative services to the Funds. In exchange for those services, each Fund paid a monthly management fee to the Adviser as follows:
Emerging Markets Fund
| | | |
Average Daily Net Assets | | Annual Rate | |
All | | 1.050 | % |
International Fund
| | | |
Average Daily Net Assets | | Annual Rate | |
Less than $500 million | | 1.000 | % |
$500 million to $750 million | | 0.975 | |
$750 million to $1 billion | | 0.950 | |
$1 billion to $12 billion | | 0.925 | |
Greater than $12 billion | | 0.900 | |
International Value Fund and Mid Cap Fund
| | | |
Average Daily Net Assets | | Annual Rate | |
Less than $500 million | | 1.000 | % |
$500 million to $750 million | | 0.975 | |
$750 million to $1 billion | | 0.950 | |
Greater than $1 billion | | 0.925 | |
The Adviser has voluntarily undertaken to reimburse Emerging Markets Fund for any ordinary operating expenses in excess of 1.50% of average daily net assets, annually.
The officers and director of Artisan Funds who are affiliated with the Adviser receive no compensation from the Funds.
Prior to January 1, 2008, each director who was not an interested person of Artisan Funds or the Adviser received an annual retainer of $150,000, payable quarterly, as well as reimbursement of expenses related to his duties as a director of Artisan Funds. In addition, the non-interested chair of the board of directors received an additional annual retainer of $60,000, payable quarterly, and each chair of a board committee who was a non-interested director received an additional annual retainer of $30,000, payable quarterly. Effective January 1, 2008, each director who is not an interested person of Artisan Funds or the Adviser receives an annual retainer of $160,000, payable quarterly. The other additional annual retainer fees were unchanged. These fees were generally allocated to each of the
35
NOTES TO FINANCIAL STATEMENTS
Artisan Funds based on net assets, subject to a minimum allocation of $1,500 to each Fund per quarter.
Artisan Funds has adopted a deferred compensation plan for independent directors that enables directors to elect to defer receipt of all or a portion of the annual compensation they are entitled to receive from the Funds. For purposes of determining the amount owed to the directors under the plan, deferred amounts were invested in shares of Artisan Funds as selected by the individual directors. Each Fund purchased shares of Artisan Funds selected for deferral by the director in amounts equal to his investment, resulting in a Fund asset equal to the deferred compensation liability. Such assets were included as a component of “Other assets” on the Statements of Assets and Liabilities. Deferral of directors’ fees under the plan did not affect the net assets of the Funds, and did not materially affect the Funds’ assets, liabilities or net investment income per share. Amounts will be deferred until distributed in accordance with the plan.
Shares of Artisan Funds were offered for sale by Artisan Distributors LLC (“Distributors”). Distributors is wholly owned by the Adviser. All distribution expenses relating to the Funds were paid by the Adviser.
| (4) | Line of credit arrangement: |
Artisan Funds is party to a line of credit agreement with State Street Bank and Trust Company, which expires August 2009, under which each Fund may borrow up to the lesser of (a) $75 million or (b) the lesser of (i) 10% of its total adjusted net assets (after giving effect to the loan) or (ii) the maximum amount the Fund may have borrowed under the Investment Company Act of 1940, the limitations included in the Fund’s prospectus, or any limit or restriction under any law or regulation to which the Fund was subject or any agreement to which the Fund or Artisan Funds is a party; provided that the aggregate borrowings by all Artisan Funds may not exceed $100 million. Artisan Funds paid a commitment fee at the annual rate of 0.10% on the unused portion of the line of credit. Interest would have been charged on any borrowings at the current Federal Funds rate plus 0.50%. The use of the line of credit was generally restricted to temporary borrowing for extraordinary or emergency purposes. During the year ended September 30, 2008, there were no borrowings under the line of credit.
| (5) | Investment transactions: |
The cost of securities purchased and the proceeds from the sale of securities (excluding short-term securities) for the year ended September 30, 2008 were as follows:
| | | | | | |
| Fund | | Security Purchases | | Security Sales |
Emerging Markets | | $ | 118,004,923 | | $ | 30,829,271 |
International | | | 8,654,310,407 | | | 9,451,556,705 |
International Value | | | 638,571,345 | | | 850,317,792 |
Mid Cap | | | 4,117,160,113 | | | 4,464,623,882 |
36
NOTES TO FINANCIAL STATEMENTS
| (6) | Transactions in securities of affiliates: |
The table below shows information about securities of the Funds’ “affiliates” (as defined below) that were held by the Funds, purchased or sold by the Funds, or from which dividends were received by the Funds during the year ended September 30, 2008. The Funds identify a company as an affiliate for the purpose of this report if one or more of the Funds owned, in the aggregate, voting securities that it believed represented 5% or more of that company’s outstanding voting securities (as defined by the Investment Company Act of 1940) during the year ended September 30, 2008.
| | | | | | | | | | | | | | | | | | | | | | |
| | | | | As of
9/30/07 | | | | | | | | | | | As of 9/30/08 |
| Fund | | Security | | Share
Balance | | Purchase
Cost | | Sales
Cost | | Net
Realized
Gain (Loss) | | | Dividend
Income(1) | | Share
Balance | | Value |
| International | | | | | | | | | | | | | | | | | | | | | | |
| | | Credit Saison Co., Ltd.(2) | | 8,625,200 | | $ | - | | $ | 217,423,551 | | $ | (74,860,419 | ) | | $ | 1,578,042 | | 1,897,823 | | $ | 30,873,858 |
| | | Shanghai Electric Group Company Limited, Series H(3)(5) | | - | | | 110,038,880 | | | - | | | - | | | | - | | 150,931,921 | | | 45,393,696 |
| | | Total(4) | | | | $ | 110,038,880 | | $ | 217,423,551 | | $ | (74,860,419 | ) | | $ | 1,578,042 | | | | $ | 45,393,696 |
| International Value | | | | | | | | | | | | | | | | | | | | | | |
| | | Benfield Group Plc | | 11,229,422 | | $ | 3,313,540 | | $ | 4,493,080 | | $ | (811,351 | ) | | $ | 3,752,750 | | 11,241,209 | | $ | 66,922,543 |
| | | Credit Saison Co., Ltd.(2) | | 2,009,500 | | | 21,021,690 | | | 12,237,407 | | | 1,524,515 | | | | 538,043 | | 2,433,169 | | | 39,582,887 |
| | | Pfeiffer Vacuum Technology AG(2) | | 499,995 | | | - | | | 15,826,849 | | | 17,793,153 | | | | 1,219,090 | | 149,681 | | | 11,986,107 |
| | | SurfControl PLC(2) | | 1,622,708 | | | - | | | 13,618,504 | | | 9,572,504 | | | | - | | - | | | - |
| | | Total(4) | | | | $ | 24,335,230 | | $ | 46,175,840 | | $ | 28,078,821 | | | $ | 5,509,883 | | | | $ | 66,922,543 |
| Mid Cap | | | | | | | | | | | | | | | | | | | | | | |
| | | Chico’s FAS, Inc.(2) | | 5,456,168 | | $ | 2,547,668 | | $ | 57,624,668 | | $ | (61,355,627 | ) | | $ | - | | - | | $ | - |
| | | Intermec, Inc.(5) | | 3,770,200 | | | 5,518,693 | | | 11,075,242 | | | (3,809,833 | ) | | | - | | 3,481,619 | | | 68,378,997 |
| | | Total(4) | | | | $ | 8,066,361 | | $ | 68,699,910 | | $ | (65,165,460 | ) | | $ | - | | | | $ | 68,378,997 |
(1) | Net of foreign taxes withheld, if any. |
(2) | Issuer was no longer an affiliate as of September 30, 2008. |
(3) | Issuer was not an affiliate as of September 30, 2007. |
(4) | Total value as of 9/30/08 is presented for only those issuers that were affiliates as of September 30, 2008. |
(5) | Non-income producing security. |
| (7) | Information for Federal income tax purposes: |
For Federal income tax purposes, the cost of investments, gross unrealized appreciation, gross unrealized depreciation and net unrealized depreciation on investments as of September 30, 2008 were as follows:
| | | | | | | | | | | | | | |
| Fund | | Cost of
Investments | | Gross Unrealized
Appreciation | | Gross
Unrealized
Depreciation | | | Net Unrealized
(Depreciation) on
Investments | |
Emerging Markets | | $ | 104,430,587 | | $ | 415,005 | | $ | (31,477,698 | ) | | $ | (31,062,693 | ) |
International | | | 13,062,854,979 | | | 4,434,734,176 | | | (5,765,760,719 | ) | | | (1,331,026,543 | ) |
International Value | | | 1,348,898,536 | | | 83,449,394 | | | (208,729,095 | ) | | | (125,279,701 | ) |
Mid Cap | | | 4,408,176,452 | | | 379,193,878 | | | (522,476,627 | ) | | | (143,282,749 | ) |
37
NOTES TO FINANCIAL STATEMENTS
The difference between cost of investments for financial reporting and cost of investments for Federal income tax purposes was due primarily to timing differences in recognizing certain gains and losses on security transactions (e.g., wash sale loss deferrals and passive foreign investment company transactions).
The tax characterization of ordinary income dividends and long-term capital gain distributions paid during the year ended September 30, 2008 and the year ended September 30, 2007 were as follows:
| | | | | | | | | | | | |
| | | Year Ended 9/30/08 | | Year Ended 9/30/07 |
| Fund | | Ordinary
Income
Dividends | | Long-Term
Capital Gain
Distributions | | Ordinary
Income
Dividends | | Long-Term
Capital Gain
Distributions |
Emerging Markets | | $ | 1,241,033 | | $ | 283,412 | | $ | 181,835 | | $ | - |
International | | | 361,370,744 | | | 2,098,971,481 | | | 218,986,067 | | | 1,133,040,051 |
International Value | | | 75,430,570 | | | 56,114,817 | | | 58,575,572 | | | 43,042,210 |
Mid Cap | | | 127,054,050 | | | 878,662,613 | | | 26,122,960 | | | 536,887,202 |
Ordinary income dividends and long-term capital gain distributions were determined in accordance with income tax regulations that may differ from U.S. generally accepted accounting principles. These differences were due to differing treatments for items such as net short-term gains, wash sale loss deferrals, passive foreign investment company transactions, foreign currency transactions, net investment losses and post-October losses. Gains on redemptions-in-kind for Mid Cap Fund of $75,771,221 were included in net realized gain (loss) on investments in the Statement of Operations for the year ended September 30, 2008, and were not recognized for Federal income tax purposes.
Additional tax information as of and for the year ended September 30, 2008 follows:
| | | | | | | | | |
| | | As of 9/30/08 |
| | | Undistributed
Ordinary
Income | | Undistributed
Long-Term Gain | | Post-October
Losses |
Emerging Markets | | $ | 861,738 | | $ | - | | $ | 1,191,524 |
International | | | 168,511,911 | | | 318,081,129 | | | - |
International Value | | | 8,591,143 | | | - | | | - |
Mid Cap | | | - | | | 46,098,021 | | | - |
As of September 30, 2008, none of the Funds had capital loss carryovers.
38
NOTES TO FINANCIAL STATEMENTS
[THIS PAGE INTENTIONALLY LEFT BLANK]
39
NOTES TO FINANCIAL STATEMENTS
| (8) | Fund share activities: |
Capital share transactions for the Funds were as follows:
| | | | | | | | |
| | | EMERGING
MARKETS | |
Year ended September 30, 2008 | | Institutional
Shares | | | Advisor
Shares(1) | |
Proceeds from shares issued | | $ | 86,328,968 | | | $ | 3,862,647 | |
Net asset value of shares issued in reinvestment of dividends and distributions | | | 1,510,191 | | | | - | |
Cost of shares redeemed(2) | | | (1,424,727 | ) | | | (2,084 | ) |
| | | | | | | | |
Net increase (decrease) from fund share transactions | | $ | 86,414,432 | | | $ | 3,860,563 | |
| | | | | | | | |
| | |
Shares sold | | | 5,178,178 | | | | 287,867 | |
Shares issued in reinvestment of dividends and distributions | | | 93,337 | | | | - | |
Shares redeemed | | | (113,088 | ) | | | (177 | ) |
| | | | | | | | |
Net increase (decrease) in capital shares | | | 5,158,427 | | | | 287,690 | |
| | | | | | | | |
| | |
| | | EMERGING
MARKETS | | | | |
Year ended September 30, 2007 | | Institutional
Shares | | | | |
Net asset value of share transferred | | | | | | | | |
Proceeds from shares issued | | $ | 8,740,000 | | | | | |
Net asset value of shares issued in reinvestment of dividends and distributions | | | 181,510 | | | | | |
Cost of shares redeemed(2) | | | (11,079 | ) | | | | |
| | | | | | | | |
Net increase (decrease) from fund share transactions | | $ | 8,910,431 | | | | | |
| | | | | | | | |
| | |
Shares sold | | | 560,831 | | | | | |
Shares issued in reinvestment of dividends and distributions | | | 14,521 | | | | | |
Shares redeemed | | | (946 | ) | | | | |
| | | | | | | | |
Net increase (decrease) in capital shares | | | 574,406 | | | | | |
| | | | | | | | |
(1) | For the period from commencement of operations (June 2, 2008) through September 30, 2008. |
(2) | Net of redemption fees of: |
| | | | | | |
| Fund | | 9/30/2008 | | 9/30/2007 |
Emerging Markets - Institutional Shares | | $ | 420 | | $ | - |
Emerging Markets - Advisor Shares | | | 8 | | | |
International - Investor Shares | | | 1,068,938 | | | 645,159 |
International - Institutional Shares | | | 381,010 | | | 282,110 |
International Value - Investor Shares | | | 76,325 | | | 345,305 |
International Value - Institutional Shares | | | 13,231 | | | 25,764 |
40
NOTES TO FINANCIAL STATEMENTS
| | | | | | | | | | | | | | | | | | | | | | |
| INTERNATIONAL | | | INTERNATIONAL
VALUE | | | MID CAP | |
Investor
Shares | | | Institutional
Shares | | | Investor
Shares | | | Institutional
Shares | | | Investor
Shares | | | Institutional
Shares | |
| $ | 2,769,106,273 | | | $ | 154,759,460 | | | $ | 303,006,196 | | | $ | 50,740,000 | | | $ | 1,053,457,971 | | | $ | 18,291,682 | |
| | 1,711,689,210 | | | | 659,043,481 | | | | 98,499,399 | | | | 15,729,244 | | | | 874,718,712 | | | | 120,999,695 | |
| | (2,910,764,948 | ) | | | (814,639,751 | ) | | | (592,204,517 | ) | | | (34,673,009 | ) | | | (1,467,033,037 | ) | | | (102,000,633 | ) |
| | | | | | | | | | | | | | | | | | | | | | | |
| $ | 1,570,030,535 | | | $ | (836,810 | ) | | $ | (190,698,922 | ) | | $ | 31,796,235 | | | $ | 461,143,646 | | | $ | 37,290,744 | |
| | | | | | | | | | | | | | | | | | | | | | | |
| | | | | |
| | 99,755,202 | | | | 5,745,726 | | | | 12,372,002 | | | | 1,981,408 | | | | 33,783,896 | | | | 611,019 | |
| | 59,207,513 | | | | 22,647,542 | | | | 3,939,976 | | | | 629,926 | | | | 28,651,121 | | | | 3,870,752 | |
| | (107,847,385 | ) | | | (28,563,145 | ) | | | (23,733,942 | ) | | | (1,513,600 | ) | | | (50,970,079 | ) | | | (3,530,702 | ) |
| | | | | | | | | | | | | | | | | | | | | | | |
| | 51,115,330 | | | | (169,877 | ) | | | (7,421,964 | ) | | | 1,097,734 | | | | 11,464,938 | | | | 951,069 | |
| | | | | | | | | | | | | | | | | | | | | | | |
| | |
| INTERNATIONAL | | | INTERNATIONAL
VALUE | | | MID CAP | |
Investor
Shares | | | Institutional
Shares | | | Investor
Shares | | | Institutional
Shares | | | Investor
Shares | | | Institutional
Shares | |
| | | | | | | | $ | (78,194,778 | ) | | $ | 78,194,778 | | | | | | | | | |
| $ | 2,337,197,971 | | | $ | 345,075,492 | | | | 957,403,055 | | | | 142,979,398 | | | $ | 876,970,575 | | | $ | 29,536,850 | |
| | 914,418,120 | | | | 375,581,486 | | | | 88,578,891 | | | | 6,278,901 | | | | 474,031,867 | | | | 81,886,968 | |
| | (2,130,141,244 | ) | | | (557,699,941 | ) | | | (783,018,312 | ) | | | (13,132,419 | ) | | | (1,365,376,527 | ) | | | (249,667,402 | ) |
| | | | | | | | | | | | | | | | | | | | | | | |
| $ | 1,121,474,847 | | | $ | 162,957,037 | | | $ | 262,963,634 | | | $ | 136,125,880 | | | $ | (14,374,085 | ) | | $ | (138,243,584 | ) |
| | | | | | | | | | | | | | | | | | | | | | | |
| | | | | |
| | 76,830,902 | | | | 11,130,276 | | | | 34,002,714 | | | | 4,976,598 | | | | 25,859,207 | | | | 865,002 | |
| | 31,850,161 | | | | 13,013,912 | | | | 3,182,856 | | | | 225,616 | | | | 15,430,725 | | | | 2,620,383 | |
| | (70,075,745 | ) | | | (17,906,695 | ) | | | (27,424,433 | ) | | | (456,122 | ) | | | (41,649,602 | ) | | | (7,437,100 | ) |
| | | | | | | | | | | | | | | | | | | | | | | |
| | 38,605,318 | | | | 6,237,493 | | | | 9,761,137 | | | | 4,746,092 | | | | (359,670 | ) | | | (3,951,715 | ) |
| | | | | | | | | | | | | | | | | | | | | | | |
41
NOTES TO FINANCIAL STATEMENTS
Artisan Funds and the Adviser were defendants in a lawsuit filed in the Circuit Court of the Third Judicial Circuit, Madison County, Illinois that sought certification of a plaintiff class consisting of all persons in the United States who held shares in Artisan International Fund for a period of more than 14 days during the five year period prior to the filing of the lawsuit in September 2003. The basic allegations in the case were that Artisan Funds and the Adviser did not make appropriate price adjustments to the foreign securities owned by Artisan International Fund prior to calculating the Fund’s NAV, thereby allegedly enabling market timing traders to trade the Fund’s shares in such a way as to disadvantage long-term investors. Following years of procedural litigation in state and federal courts, the case was resolved and dismissed with prejudice in May 2008.
Certain legal fees incurred by Artisan Funds in defense of the lawsuit prior to its resolution and related insurance recoveries of $357,858 have been allocated to Artisan International Fund and were included in professional fees in the Statement of Operations. The resolution of the lawsuit did not have a material effect on the financial condition or results of operations of any Fund.
| (10) | Recent Accounting Pronouncements: |
On July 13, 2006, the Financial Accounting Standards Board (FASB) released FASB Interpretation No. 48 “Accounting for Uncertainty in Income Taxes” (“FIN 48”). FIN 48 provides guidance for how uncertain tax positions should be recognized, measured, presented and disclosed in the financial statements. Management has evaluated the implications of FIN 48 for all open tax years, and has determined there is no impact to the Funds’ financial statements.
In September 2006, FASB issued Statement on Financial Accounting Standards No. 157, “Fair Value Measurements” (FAS 157). This standard clarifies the definition of fair value for financial reporting, establishes a framework for measuring fair value and requires additional disclosures about the use of fair value measurements. FAS 157 is effective for financial statements issued for fiscal years beginning after November 15, 2007 and interim periods within those fiscal years. As of September 30, 2008, the Funds did not believe the adoption of FAS 157 would impact the amounts reported in the financial statements, however, additional disclosures would be required about the information used to develop the measurements of fair value and the effect of certain of the measurements reported in the statement of operations for a fiscal period.
In March 2008, the FASB issued Statement of Financial Accounting Standards No. 161, “Disclosures about Derivative Instruments and Hedging Activities” (FAS 161). FAS 161 requires enhanced disclosure relating to an entity’s use of derivatives, how derivatives are accounted for, and how derivative instruments affect an entity’s results of operations and financial position. This standard was issued and is effective for fiscal years beginning after November 15, 2008. Management is currently evaluating the implications of FAS 161 and the impact on the Funds’ financial statement disclosures, if any.
42
Report of Independent Registered Public Accounting Firm
To the Board of Directors and Shareholders of Artisan Funds, Inc.
We have audited the accompanying statements of assets and liabilities, including the schedules of investments, of Artisan Emerging Markets Fund, Artisan International Fund, Artisan International Value Fund, and Artisan Mid Cap Fund (four of eleven portfolios constituting Artisan Funds, Inc.) (the “Funds”) as of September 30, 2008, and the related statements of operations for the year then ended, the statements of changes in net assets for each of the two years in the period then ended, and the financial highlights for each of the periods indicated therein. These financial statements and financial highlights are the responsibility of the Funds’ management. Our responsibility is to express an opinion on these financial statements and financial highlights based on our audits.
We conducted our audits in accordance with the standards of the Public Company Accounting Oversight Board (United States). Those standards require that we plan and perform the audit to obtain reasonable assurance about whether the financial statements and financial highlights are free of material misstatement. We were not engaged to perform an audit of the Funds’ internal control over financial reporting. Our audits included consideration of internal control over financial reporting as a basis for designing audit procedures that are appropriate in the circumstances, but not for the purpose of expressing an opinion on the effectiveness of the Funds’ internal control over financial reporting. Accordingly, we express no such opinion. An audit also includes examining, on a test basis, evidence supporting the amounts and disclosures in the financial statements and financial highlights, assessing the accounting principles used and significant estimates made by management, and evaluating the overall financial statement presentation. Our procedures included confirmation of securities owned as of September 30, 2008, by correspondence with the custodian and brokers. We believe that our audits provide a reasonable basis for our opinion.
In our opinion, the financial statements and financial highlights referred to above present fairly, in all material respects, the financial position of Artisan Emerging Markets Fund, Artisan International Fund, Artisan International Value Fund, and Artisan Mid Cap Fund of Artisan Funds, Inc. at September 30, 2008, the results of their operations for the year then ended, the changes in their net assets for each of the two years in the period then ended, and the financial highlights for each of the periods indicated therein, in conformity with U.S. generally accepted accounting principles.

Milwaukee, Wisconsin
November 10, 2008
43
NOTES TO FINANCIAL STATEMENTS
Other Federal tax information (unaudited):
The Internal Revenue Code requires that shareholders be notified within 60 days of the Funds’ fiscal year-end of certain information regarding long-term capital gains, qualified dividend income and the dividends received deduction for corporate shareholders. This data is informational only. Every year in January, shareholders are sent a Form 1099-DIV which provides the federal tax status of dividends and distributions received during the calendar year. Shareholders are advised to consult their own tax advisor with respect to the specific tax consequences of investment in the Funds.
Each Fund hereby designates the following amounts as (i) long-term capital gain distributions for purposes of the dividends paid deduction (including earnings and profits distributed to shareholders on redemption of Fund shares), (ii) the amount of ordinary dividends paid during the fiscal year ended September 30, 2008 that are considered qualified dividend income as defined in the Jobs and Growth Tax Relief Reconciliation Act of 2003, and (iii) the amount of ordinary dividends paid during the fiscal year ended September 30, 2008 that are eligible for the dividends received deduction available to certain corporate shareholders.
| | | | | | | | | |
| Fund | | Long-Term Capital Gains | | Qualified Dividend Income | | | Dividends Received Deduction | |
Emerging Markets | | $ | 283,412 | | 16.85 | % | | - | % |
International | | | 2,160,068,879 | | 59.87 | | | - | |
International Value | | | 58,010,849 | | 45.69 | | | - | |
Mid Cap | | | 896,241,667 | | 29.06 | | | 27.55 | |
44
SHAREHOLDER EXPENSE EXAMPLE (UNAUDITED)
As a shareholder of Artisan Funds, you may incur transaction costs, including redemption fees, and you will incur ongoing costs, including management fees and other Fund expenses. This example is intended to help you understand your ongoing costs (in dollars) of investing in a Fund and to compare these costs with the ongoing costs of investing in other mutual funds.
The example is based on an investment of $1,000 invested at the beginning of the period and held for the entire period from April 1, 2008 to September 30, 2008.
Actual Expenses
The first line below each Fund’s name in the table below provides information about actual account values and actual expenses. You may use the information in this line, together with the amount you invested, to estimate the expenses that you paid over the period. Simply divide your account value by $1,000 (for example, an $8,600 account value divided by $1,000 = 8.6), then multiply the result by the number in the first line under the name of your Fund under the heading entitled “Expenses Paid During Period” to estimate the expenses you paid on your account during this period.
Hypothetical Example for Comparison Purposes
The second line below each Fund’s name in the table below provides information about hypothetical account values and hypothetical expenses based on each Fund’s actual expense ratio for the six-month period ended September 30, 2008 and an assumed rate of return of 5% per year before expenses, which is not the Fund’s actual return. The hypothetical account values and expenses may not be used to estimate the actual ending account balances or expenses you paid for the period. You may use this information to compare the ongoing costs of investing in each Fund and other funds. To do so, compare the 5% hypothetical example with the 5% hypothetical examples that appear in the shareholder reports of the other funds.
Please note that the expenses shown in the table are meant to highlight your ongoing costs only and do not reflect any transactional costs, such as redemption fees. Therefore, the second line below each Fund’s name in the table is useful in comparing ongoing costs only, and will not help you determine the relative costs of owning different funds. If these transactional costs were included, your costs would have been higher.
| | | | | | | | | |
| | | Beginning
Account Value
4/1/2008 | | Ending
Account Value
9/30/2008 | | Expenses Paid During
Period
4/1/2008-9/30/2008(1) |
Artisan Emerging Markets Fund - Institutional Shares | | | | | | | | | |
Actual | | $ | 1,000.00 | | $ | 708.80 | | $ | 6.41 |
Hypothetical (5% return before expenses) | | $ | 1,000.00 | | $ | 1,017.50 | | $ | 7.57 |
Artisan International Fund - Institutional Shares | | | | | | | | | |
Actual | | $ | 1,000.00 | | $ | 768.74 | | $ | 4.33 |
Hypothetical (5% return before expenses) | | $ | 1,000.00 | | $ | 1,020.10 | | $ | 4.95 |
Artisan International Value Fund - Institutional Shares | | | | | | | | | |
Actual | | $ | 1,000.00 | | $ | 877.95 | | $ | 4.84 |
Hypothetical (5% return before expenses) | | $ | 1,000.00 | | $ | 1,019.85 | | $ | 5.20 |
45
SHAREHOLDER EXPENSE EXAMPLE (UNAUDITED)
| | | | | | | | | |
| | | Beginning
Account Value
4/1/2008 | | Ending
Account Value
9/30/2008 | | Expenses Paid During
Period
4/1/2008-9/30/2008(1) |
Artisan Mid Cap Fund - Institutional Shares | | | | | | | | | |
Actual | | $ | 1,000.00 | | $ | 895.61 | | $ | 4.50 |
Hypothetical (5% return before expenses) | | $ | 1,000.00 | | $ | 1,020.25 | | $ | 4.80 |
(1) | Expenses are equal to the Fund’s ratio of expenses to average net assets for the six-month period ended September 30, 2008 (shown below), multiplied by the average account value over the period, multiplied by 183/366 (to reflect the one-half year period). |
| | | |
| Fund | | Annualized Ratio of Expenses to Average
Net Assets for the Six-Month
Period Ended September 30, 2008 | |
Emerging Markets - Institutional Shares(a) | | 1.50 | % |
International - Institutional Shares | | 0.98 | % |
International Value - Institutional Shares | | 1.03 | % |
Mid Cap - Institutional Shares | | 0.95 | % |
| | (a) | The annualized ratio of expenses to average net assets excludes expenses waived or paid by the Adviser or the board of directors. |
46
NOTES ON MANAGEMENT’S DISCUSSION OF FUND PERFORMANCE AND PORTFOLIO HOLDINGS’ CLASSIFICATION
The discussions of each Fund included in this report include statistical information about the portfolios of each of the Funds. Except as otherwise noted, that information is as of September 30, 2008. That information will vary with changes in a Fund’s portfolio investments. The performance information for each Fund relative to its benchmark index discussed in this report was prepared by the Adviser using information reported by FactSet Databases (“FactSet”). For the purposes of assigning portfolio securities to a particular country, the Adviser considers an issuer to be from a particular country as designated by its securities information vendors. The Adviser currently uses MSCI as its primary source and FactSet as a secondary source for this information. In the event (i) the Adviser’s securities information vendors do not assign a security to a particular country or if the published classification appears to be erroneous, or (ii) its primary vendor does not assign a security to a particular country and the secondary vendor has assigned a security to a particular country by using a methodology that is not the same as the methodology the primary vendor uses to assign a country, the Adviser assigns the security to a country using the primary vendor’s published criteria (to the extent available) or the Adviser’s own judgment. The primary information vendor’s criteria include the identity of the jurisdiction of the issuer’s incorporation, the main equity trading market for the issuer’s securities, the geographical distribution of the issuer’s operations and the location of the issuer’s headquarters. Country designations may change over time.
For the purposes of assigning portfolio securities to a particular sector and industry, the Adviser assigns securities in accordance with the sector and industry classifications of the Global Industry Classification Standard (GICS®) developed by MSCI and Standard & Poor’s (to the extent available) as a primary source and FactSet (to the extent available) as a secondary source for this information. In the event the Adviser’s securities information vendors do not classify a security to a particular sector or industry or if the published classification appears to be erroneous, the Adviser classifies the security according to its own judgment, using other securities information vendors, the company description and other publicly available information about the company’s peer group. Sector and industry classifications may change over time.
The names of portfolio securities reflected in this report are as reported by the Funds’ data providers, may not represent the legal name of the entity and, in some cases, are translations of non-English names.
Definitions of Portfolio Statistics
Market Capitalization is the aggregate value of all of a company’s outstanding equity securities.
Descriptions of Indices
Each Fund’s performance is compared in this report to changes in one or more indices, including in all cases a broad-based index of changes in prices of securities in the market in which the Fund invests. All of the indices are unmanaged and their returns include reinvested dividends. Unlike the Funds’ returns, the returns of each index do not include the payment of sales commissions or other expenses that would be incurred in the purchase or sale of the securities included in that index. An investment cannot be made directly in an index. Fair value pricing is not employed by market indices.
The indices to which the Funds are compared are:
Artisan Emerging Markets Fund – Morgan Stanley Capital International Emerging Markets IndexSM is a market-weighted index of companies in emerging markets.
47
NOTES ON MANAGEMENT’S DISCUSSION OF FUND PERFORMANCE AND PORTFOLIO HOLDINGS’ CLASSIFICATION
Artisan International and Artisan International Value Funds – Morgan Stanley Capital International EAFE® Index (MSCI EAFE®) is a market-weighted index of companies in developed markets, excluding the U.S. and Canada. MSCI EAFE®’s average annual return since inception of the International Fund is based upon a starting date of December 31, 1995.
Artisan International Fund – Morgan Stanley Capital International EAFE® Growth Index (MSCI EAFE® Growth) is a market-weighted index of companies in developed markets, excluding the U.S. and Canada, with higher price-to-book ratios. MSCI EAFE® Growth’s average annual return since inception of the International Fund is based upon a starting date of December 31, 1995.
Artisan International Value Fund – Morgan Stanley Capital International EAFE® Value Index (MSCI EAFE® Value) is a market-weighted index of companies in developed markets, excluding the U.S. and Canada, with lower price-to-book ratios.
Artisan Mid Cap Fund – Russell Midcap® Index is a market-weighted index of about 800 medium-sized U.S. companies. The Russell Midcap® Growth Index is a market-weighted index of those medium-sized companies included in the Russell Midcap® Index with higher price-to-book and higher forecasted growth values.
Trademarks
Trademarks and copyrights relating to the indices and products of portfolio companies mentioned in this report are owned by their respective owners. Except as otherwise indicated, the trademarks, including names, logos, slogans and service marks appearing in this report are the property of the Adviser and may not be copied, reproduced, published or in any way used without written permission.
The Global Industry Classification Standard (“GICS”) was developed by and is the exclusive property and a service mark of MSCI Inc. (“MSCI”) and Standard & Poor’s, a division of The McGraw-Hill Companies, Inc. (“S&P”) and is licensed for use by Artisan Partners Limited Partnership. Neither MSCI, S&P nor any third party involved in making or compiling the GICS or any GICS classifications makes any express or implied warranties or representations with respect to such standard or classification (or the results to be obtained by the use thereof), and all such parties hereby expressly disclaim all warranties of originality, accuracy, completeness, merchantability and fitness for a particular purpose with respect to any of such standard or classification. Without limiting any of the foregoing, in no event shall MSCI, S&P, any of their affiliates or any third party involved in making or compiling the GICS or any GICS classifications have any liability for any direct, indirect, special, punitive, consequential or any other damages (including lost profits) even if notified of the possibility of such damages.
The MSCI information may only be used by the reader, may not be reproduced or redisseminated in any form and may not be used to create any financial instruments or products or any indices. The MSCI information is provided on an “as is” basis and the reader of this information assumes the entire risk of any use made of this information. MSCI, each of its affiliates and each other person involved in or related to compiling, computing or creating any MSCI information (collectively, the “MSCI Parties”) expressly disclaims all warranties (including, without limitation, any warranties of originality, accuracy, completeness, timeliness, non-infringement, merchantability and fitness for a particular purpose) with respect to this information. Without limiting any of the foregoing, in no event
48
NOTES ON MANAGEMENT’S DISCUSSION OF FUND PERFORMANCE AND PORTFOLIO HOLDINGS’ CLASSIFICATION
shall MSCI Parties have any liability for any direct, indirect, special, incidental, punitive, consequential (including, without limitation, lost profits) or any other damages.
Russell Investment Group is the source and owner of the Russell Index data contained or reflected in this material and all trademarks and copyrights related thereto. The presentation may contain confidential information and unauthorized use, disclosure, copying, dissemination or redistribution is strictly prohibited. This is a presentation of Artisan Distributors LLC. Russell Investment Group is not responsible for the formatting or configuration of this material or for any inaccuracy in Artisan Distributors’ presentation thereof.
PROXY VOTING POLICIES AND PROCEDURES
You may obtain a description of Artisan Funds’ proxy voting policies and procedures, without charge, upon request by calling 800.399.1770. That information also is included in Artisan Funds’ statement of additional information, which is available without charge, upon request, by calling 800.399.1770 and on the Securities and Exchange Commission’s website at www.sec.gov.
Information relating to how each Fund voted proxies relating to portfolio securities held during the twelve-month period ended June 30 is available without charge, on the Funds’ website at www.artisanfunds.com and on the Securities and Exchange Commission’s website at www.sec.gov. Information relating to Artisan Emerging Markets Fund also is available without charge on its website at www.artemf.com and on the Securities and Exchange Commission’s website.
INFORMATION ABOUT PORTFOLIO SECURITIES
Artisan Funds files a complete schedule of portfolio holdings with the Securities and Exchange Commission for the quarters ending December 31 and June 30 (the first and third quarters of the Funds’ fiscal year) on Form N-Q. The Funds’ Forms N-Q are available on the Securities and Exchange Commission’s website at www.sec.gov. You also may review and copy those documents by visiting the Securities and Exchange Commission’s Public Reference Room in Washington, D.C. Information on the operation of the Public Reference Room may be obtained by calling the Securities and Exchange Commission at 800.SEC.0330.
DIRECTORS AND OFFICERS
The board of directors has overall responsibility for the conduct of the affairs of Artisan Funds. Each director serves an indefinite term of unlimited duration until the next annual meeting of shareholders and until the election and qualification of his or her successor. The board of directors may fill any vacancy on the board provided that after such appointment at least two-thirds of the directors have been elected by the shareholders. The shareholders may remove a director by a vote of a majority of the outstanding shares of the Funds at any meeting of shareholders called for the purpose of removing such director.
The board of directors elects the officers of Artisan Funds. Each officer serves until the election and qualification of his or her successor, or until he or she sooner dies, resigns, or is removed or disqualified. The board of directors may remove any officer with or without cause at any time.
49
DIRECTORS AND OFFICERS
The names and ages of the directors and officers as of November 14, 2008, the position each holds with the Funds, the date each was first elected to office, their principal business occupations and other directorships they have held during the last five years are shown below. Each director oversees all eleven series of Artisan Funds.
| | | | | | | | |
| | | | | |
Name and Age
at 11/14/08 | | Position(s)
Held with
Artisan Funds | | Date First Elected
or Appointed
to Office | | Principal Occupation(s)
during Past 5 Years | | Other Public Company
or Registered Investment
Company Directorships Held |
| Directors who are not “interested persons” of Artisan Funds: |
| David A. Erne – 65 | | Director and Independent Chair of the Board of Directors | | Director since 3/27/95; Independent Chair since 2/4/05 | | Of counsel to the law firm Reinhart Boerner Van Deuren s.c., Milwaukee, WI. | | Trustee, Northwestern Mutual Life Insurance Company. |
| Thomas R. Hefty – 61 | | Director | | 3/27/95 | | Retired; from January 2007 to February 2008, President, Kern Family Foundation (private, grant-making organization); until December 2006, of counsel to the law firm Reinhart Boerner Van Deuren s.c., Milwaukee, WI; until December 2006, Adjunct Faculty, Department of Business and Economics, Ripon College. | | None. |
| Jeffrey A. Joerres – 48 | | Director | | 8/9/01 | | Chairman of the Board, President and Chief Executive Officer of Manpower Inc. (non-governmental employment service organization). | | Director, Johnson Controls, Inc. (manufacturer of automotive systems and building controls). |
| Patrick S. Pittard – 62 | | Director | | 8/9/01 | | Distinguished Executive in Residence (teaching position), University of Georgia. | | Director, Cbeyond, Inc. (telecommunications company); Director, Lincoln National Corporation (insurance and investment management company). |
| Howard B. Witt – 68 | | Director | | 3/27/95 | | Retired; until December 2004, Chairman of the Board, President and Chief Executive Officer of Littelfuse, Inc. (manufacturer of advanced circuit protection devices). | | Director, Franklin Electric Co., Inc. (manufacturer of electric motors). |
50
DIRECTORS AND OFFICERS
| | | | | | | | |
| | | | | |
Name and Age
at 11/14/08 | | Position(s)
Held with
Artisan Funds | | Date First Elected
or Appointed
to Office | | Principal Occupation(s)
during Past 5 Years | | Other Public Company
or Registered Investment
Company Directorships Held |
| Director who is an “interested person” of Artisan Funds: |
| Andrew A. Ziegler – 51* | | Director, President and Chief Executive Officer | | Director since 1/5/95 and Chairman of the Board 1/5/95 - 12/19/03; President since 12/19/03 (Chief Executive Officer continuously since 1/5/95) | | Managing Director of Artisan Partners; Chairman and President of Artisan Distributors LLC; until December 2003, Chairman of Artisan Funds. | | None. |
| Officers: |
| Lawrence A. Totsky – 49 | | Chief Financial Officer and Treasurer | | 1/22/98 | | Managing Director and Chief Financial Officer of Artisan Partners; Vice President, Chief Financial Officer and Treasurer of Artisan Distributors LLC. | | None. |
| Janet D. Olsen – 52 | | General Counsel and Secretary | | 1/18/01 | | Managing Director and General Counsel of Artisan Partners; Vice President and Secretary of Artisan Distributors LLC. | | None. |
| Brooke J. Billick – 54 | | Chief Compliance Officer | | 8/19/04 | | Chief Compliance Officer and Associate Counsel of Artisan Partners; Chief Compliance Officer of Artisan Distributors LLC; prior to joining Artisan Partners in February 2004, Vice President, Securities Counsel and Corporate Secretary of Marshall & Ilsley Trust Company, N.A. (bank) and M&I Investment Management Corp. (investment adviser) and Chief Legal Officer and Secretary of Marshall Funds, Inc. (mutual fund company). | | None. |
| Carlene M. Ziegler – 52 | | Vice President | | 3/27/95 | | Managing Director of Artisan Partners; until April 2008, Portfolio Co-Manager of Artisan small-cap growth strategy, including Artisan Small Cap Fund; until February 2005, Director of Artisan Funds. | | None. |
| Michael C. Roos – 50 | | Vice President | | 12/19/03 | | Managing Director of Artisan Partners; Vice President of Artisan Distributors LLC; until December 2003, President of Artisan Funds. | | None. |
| * | Mr. Ziegler is an “interested person” of Artisan Funds, as defined in the Investment Company Act of 1940, because he is a Managing Director of Artisan Partners and an officer and director of Artisan Investment Corporation (the general partner of Artisan Partners). Mr. Ziegler and Carlene M. Ziegler (who are married to each other) control Artisan Partners. Mr. Ziegler is also President of Artisan Distributors LLC, Artisan Funds’ principal underwriter. |
51
DIRECTORS AND OFFICERS
| | | | | | | | |
| | | | | |
Name and Age
at 11/14/08 | | Position(s)
Held with
Artisan Funds | | Date First Elected
or Appointed
to Office | | Principal Occupation(s)
during Past 5 Years | | Other Public Company
or Registered Investment
Company Directorships Held |
| Gregory K. Ramirez – 38 | | Assistant Secretary and Assistant Treasurer | | 1/22/98 | | Managing Director of Artisan Partners; Assistant Treasurer of Artisan Distributors LLC. | | None. |
| Sarah A. Johnson – 36 | | Assistant Secretary | | 2/5/03 | | Associate Counsel of Artisan Partners. | | None. |
The business address of the officers and directors affiliated with Artisan Partners is 875 E. Wisconsin Avenue, Suite 800, Milwaukee, Wisconsin 53202. The addresses of the other directors are: Mr. Erne – 1000 North Water Street, Suite 2100, Milwaukee, Wisconsin 53202; Mr. Joerres – 100 Manpower Place, Milwaukee, Wisconsin 53212; and Mr. Hefty, Mr. Pittard and Mr. Witt – c/o Artisan Funds, 875 E. Wisconsin Avenue, Suite 800, Milwaukee, Wisconsin 53202.
Artisan Funds’ statement of additional information (SAI) contains further information about the directors. Please call 800.399.1770 for a free copy of the SAI.
52
| | | | |

| | ARTISAN FUNDS P.O. BOX 8412 BOSTON, MA 02266-8412 800.399.1770 | | |

ARTISAN
ANNUAL
REPORT
SEPTEMBER 30, 2008
ARTISAN EMERGING
MARKETS FUND
_________
ARTISAN FUNDS, INC.
ADVISOR SHARES
TABLE OF CONTENTS
ARTISAN FUNDS
P.O. BOX 8412
BOSTON, MA 02266-8412
This report and the audited financial statements contained herein are provided for the general information of the shareholders of the Advisor Shares of Artisan Emerging Markets Fund. Before investing, investors should consider carefully the Fund’s investment objective, risks and charges and expenses. For more complete information on the Fund, including fees and expenses, please call 866.574.1770 for a free prospectus. Read it carefully before you invest or send money.
Company discussions are for illustration only and are not intended as recommendations of individual stocks. The discussion presents information about the companies believed to be accurate, and the views of the portfolio managers, as of September 30, 2008. That information and those views may change, and the Fund disclaims any obligation to advise shareholders of any such changes. Artisan Emerging Markets Fund also offers an institutional class of shares for institutional investors meeting certain minimum investment requirements. A report on the institutional class is available under separate cover.
Artisan Funds offered through Artisan Distributors LLC, member FINRA.
ARTISAN EMERGING MARKETS FUND (ARTZX)
INVESTMENT PROCESS HIGHLIGHTS
| | |
Artisan Emerging Markets Fund uses a fundamental research process to construct a diversified portfolio of emerging market companies. The team’s investment process is focused on identifying companies that are priced at a discount relative to the team’s estimate of their sustainable earnings. • Sustainable Earnings. The team believes that over the long term a stock’s price is directly related to the company’s sustainable earnings. The team determines a company’s sustainable earnings based upon financial and business analysis. The team’s financial analysis focuses on a company’s balance sheet, income statement, and statement of cash flows within a normalized return on equity model to assess earnings potential. The team’s business analysis examines a company’s competitive advantages and financial strength to assess sustainability. • Valuation. The team believes that investment opportunities develop when businesses with sustainable earnings are undervalued relative to historical, industry and regional valuations. The team values a business and develops a price target based on the team’s assessment of the company’s sustainable earnings and cash flow expectations and the team’s risk analysis. • Risk Analysis. The team believes that a disciplined risk framework allows greater focus on fundamental stock selection. The team incorporates its assessment of company-specific and macroeconomic risks into its valuation analysis to develop a risk-adjusted target price. The team’s risk-rating assessment includes a review of the currency, interest rate, monetary and fiscal policy and political risks to which a company is exposed. |
|
| PERFORMANCE HISTORY | | |
GROWTH OF AN ASSUMED $10,000 INVESTMENT (6/2/2008 to 9/30/2008)
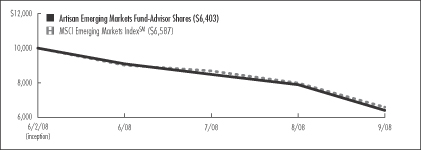
TOTAL RETURNS (as of 9/30/2008)
| | | |
| Fund / Index | | Since
Inception(1) | |
Artisan Emerging Markets Fund - Advisor Shares | | -35.97 | % |
MSCI Emerging Markets IndexSM | | -34.13 | |
(1) | For the period from commencement of operations (June 2, 2008) through September 30, 2008; not annualized. |
The performance quoted represents past performance, which does not guarantee future results. The investment return and principal value of an investment in the Fund will fluctuate, so that an investor’s shares in the Fund, when redeemed, may be worth more or less than their original cost. Current performance may be lower or higher than the performance data quoted. For current to most recent month-end performance information call 866.574.1770. The graph and table above do not reflect the deduction of taxes that a shareholder would pay on distributions or sale of Fund shares. The performance shown does not reflect the deduction of a 2% redemption fee on shares held by an investor for 90 days or less and, if reflected, the fee would reduce the performance quoted. The Fund’s performance information reflects Artisan Partners’ voluntary undertaking to limit the Fund’s expenses, when they exceed 1.50%, which may be terminated at any time, has been in effect since the Fund’s inception and has had a material impact on the Fund’s performance. Absent that expense waiver, the Fund’s performance would have been lower. See page 25 for a description of each index.
2
INVESTING ENVIRONMENT
Global equities struggled over the four-month period ended September 30, 2008, and emerging markets were among the hardest hit as the MSCI Emerging Markets IndexSM declined -34.13%. A sharp reversal in commodity prices and the financial crisis in the U.S. were two of the leading causes of the overall weakness in global markets. All of the emerging markets regions suffered large declines during the period. Chinese, Korean and Taiwanese stocks fell more than -30%. Mexican stocks pulled back about -25% and stocks in South Africa declined nearly -23%. Resource-heavy markets such as Brazil and Russia suffered the sharpest declines of more than
-40% due to the fall in commodity prices during the period.
SECTOR DIVERSIFICATION
| | | |
| Sector | | 9/30/08 | |
Consumer Discretionary | | 10.6 | % |
Consumer Staples | | 8.4 | |
Energy | | 14.8 | |
Financials | | 13.6 | |
Healthcare | | 2.6 | |
Industrials | | 12.6 | |
Information Technology | | 10.2 | |
Materials | | 13.0 | |
Telecommunication Services | | 9.5 | |
Utilities | | 1.5 | |
Other assets less liabilities | | 3.2 | |
Total | | 100.0 | % |
As a percentage of total net assets.
PERFORMANCE DISCUSSION
The Fund returned -35.97% during the period. Our holdings in Brazil were one of the leading sources of weakness in the portfolio. Companhia Vale do Rio Doce, Dufry South America Ltd, Hypermarcas SA, and Rodobens Negocios Imobiliarios SA all posted losses of more than -50%. Our holdings in Taiwan, India and Korea were also among those that detracted from our performance. Elsewhere in the portfolio, weakness in Russian homebuilder PIK Group and Kazakhstan-based oil and natural gas company KazMunaiGas Exploration Production negatively impacted performance. On the positive side, our holdings in Turkey and South Africa held up the best during the period. A few of our leading performers were Turkcell Iletisim Hizmetleri AS, Mr. Price Group Limited, Tiger Brands Limited and African Bank Investments Limited.
FUND CHANGES
Our activity over the past four months was fairly broad-based, but all the purchases possessed, in our view, the potential to sustain earnings growth and were trading at attractive prices. The new additions to the portfolio included Indian oil and gas exploration and production company Cairn India Ltd., Turkish mobile phone company Turkcell Iletisim Hizmetleri AS, Chilean copper mining company Antofagasta plc, Chilean telecom services provider Empresa Nacional de Telecomunicaciones S.A., Brazilian educational services provider SEB – Sistema Educacional Brasileiro SA, and Russian sugar and grain producer Razguliay Group. Our purchases were funded in part by sales of Kookmin Bank (Korea), Anhanguera Educacional Participacoes SA (Brazil), Duratex S.A. (Brazil), Vinda International Holdings Limited (China) and ABSA Group Limited (South Africa).
REGION ALLOCATION
| | | |
| Region | | 9/30/08 | |
Emerging Asia | | 36.2 | % |
Emerging Europe, Middle East & Africa | | 27.5 | |
Latin America | | 27.9 | |
Developed Markets | | 5.2 | |
As a percentage of total net assets.
3
ARTISAN EMERGING MARKETS FUND
Schedule of Investments – September 30, 2008
| | | | | |
| | | Shares
Held | | Value |
| | | | | |
COMMON AND PREFERRED STOCKS - 96.8% | | | |
| | | | | |
| ARGENTINA - 1.2% | | | | | |
Tenaris S.A. (DR) | | 22,713 | | $ | 846,968 |
| | | | | |
| BRAZIL - 18.2% | | | | | |
Companhia Energetica de Minas Gerais- CEMIG, Preferred(1) | | 32,858 | | | 649,252 |
Companhia Vale do Rio Doce | | 132,500 | | | 2,499,737 |
Dufry South America Ltd (DR) | | 32,700 | | | 271,512 |
Empresa Brasileira de Aeronautica S.A. | | 83,500 | | | 574,833 |
Hypermarcas SA(1)(2) | | 77,200 | | | 526,188 |
Marcopolo S.A., Preferred(1) | | 168,600 | | | 442,122 |
Net Servicos de Comunicacao SA, Preferred(1)(2) | | 67,800 | | | 578,272 |
OGX Petroleo e Gas Participacoes SA(2) | | 1,153 | | | 234,490 |
Petroleo Brasileiro S.A. | | 185,400 | | | 4,113,505 |
Randon SA Implementos e Participacoes, Preferred(1) | | 83,600 | | | 472,718 |
Rodobens Negocios Imobiliarios SA | | 63,400 | | | 436,460 |
SEB - Sistema Educacional Brasileiro SA (Units)(1)(2) | | 63,000 | | | 430,396 |
Tim Participacoes S.A., Preferred(1) | | 242,400 | | | 503,169 |
Unibanco - Uniao de Bancos Brasileiros S.A. (Units)(1) | | 79,500 | | | 812,589 |
Votorantim Celulose e Papel S.A., Preferred(1) | | 19,300 | | | 292,101 |
Wilson Sons Limited (DR) | | 62,000 | | | 469,179 |
| | | | | |
| | | | | 13,306,523 |
| CHILE - 0.7% | | | | | |
Empresa Nacional de
Telecomunicaciones S.A. | | 39,409 | | | 489,446 |
| | | | | |
| CHINA - 8.8% | | | | | |
Airmedia Group, Inc. (DR)(2) | | 66,622 | | | 496,334 |
Chaoda Modern Agriculture (Holdings) Limited(3) | | 1,289,900 | | | 1,082,218 |
China Dongxiang Group Company(3) | | 1,797,000 | | | 519,962 |
China Railway Construction Corporation, H Shares(1)(2)(3) | | 468,500 | | | 620,444 |
GOME Electrical Appliances Holdings Limited(3) | | 2,644,752 | | | 772,044 |
Mindray Medical International Limited, Class A (DR) | | 13,365 | | | 450,801 |
New Oriental Education & Technology Group Inc. (DR)(2) | | 7,705 | | | 494,969 |
| | | | | |
| | | Shares
Held | | Value |
| | | | | |
| CHINA (CONTINUED) | | | | | |
Tingyi (Cayman Islands) Holding Corporation(3) | | 780,300 | | $ | 908,761 |
Weichai Power Co., Ltd., H Shares(3) | | 113,100 | | | 425,607 |
Zhuzhou CSR Times Electric Co., Ltd., H Shares(3) | | 904,200 | | | 641,621 |
| | | | | |
| | | | | 6,412,761 |
| COLOMBIA - 0.7% | | | | | |
Almacenes Exito S.A. (DR)(3) | | 95,394 | | | 477,613 |
| | | | | |
| EGYPT - 1.1% | | | | | |
Egyptian Financial Group-Hermes Holding(3) | | 124,090 | | | 769,044 |
| | | | | |
| HONG KONG - 2.3% | | | | | |
Huabao International Holdings Limited(3) | | 1,491,900 | | | 1,143,856 |
Samson Holding Ltd.(2)(3) | | 4,063,000 | | | 572,426 |
| | | | | |
| | | | | 1,716,282 |
| INDIA - 4.0% | | | | | |
Cairn India Ltd.(2)(3) | | 166,142 | | | 765,629 |
Dr. Reddy’s Laboratories Limited(3) | | 68,029 | | | 752,440 |
Satyam Computer Services Limited(3) | | 143,304 | | | 907,192 |
Tata Motors Limited(3) | | 63,097 | | | 470,298 |
Tata Motors Limited, Class A Rights(1)(2)(3)(4) | | 10,333 | | | 804 |
Tata Motors Limited, Rights(1)(2)(3)(4) | | 10,333 | | | 896 |
| | | | | |
| | | | | 2,897,259 |
| ISRAEL - 1.3% | | | | | |
Bank Hapoalim B.M.(3) | | 135,569 | | | 431,666 |
Strauss Group Ltd.(3) | | 49,979 | | | 522,318 |
| | | | | |
| | | | | 953,984 |
| KAZAKSTAN - 1.2% | | | | | |
KazMunaiGas Exploration Production (DR)(3) | | 57,795 | | | 911,763 |
| | | | | |
| KOREA - 8.8% | | | | | |
Daewoo Shipbuilding & Marine Engineering Co., Ltd.(3) | | 15,254 | | | 385,465 |
Hyundai Development Company(3) | | 14,261 | | | 537,061 |
MegaStudy Co., Ltd.(3) | | 3,685 | | | 559,969 |
Samsung Electronics Co., Ltd.(3) | | 7,271 | | | 3,348,108 |
Shinhan Financial Group Co., Ltd.(3) | | 22,527 | | | 812,202 |
Shinsegae Co., Ltd.(3) | | 1,694 | | | 798,691 |
| | | | | |
| | | | | 6,441,496 |
| LUXEMBOURG - 0.6% |
Ternium S.A. (DR) | | 25,766 | | | 454,512 |
| | | | | |
| MEXICO - 7.2% |
America Movil SAB de C.V., Series L | | 880,405 | | | 2,041,519 |
4
| | | | | |
| | | Shares
Held | | Value |
| | | | | |
| MEXICO (CONTINUED) | | | | | |
Banco Compartamos SA de CV | | 182,025 | | $ | 515,958 |
Fomento Economico Mexicano SAB, Series UBD (Units) | | 184,995 | | | 707,570 |
Grupo Financiero Banorte S.A. de C.V. | | 235,431 | | | 751,295 |
Grupo Televisa S.A. | | 182,181 | | | 801,753 |
Urbi, Desarrollos Urbanos, S.A. de C.V.(2) | | 181,950 | | | 424,741 |
| | | | | |
| | | | | 5,242,836 |
| NETHERLANDS - 1.2% | | | | | |
Kardan NV(3) | | 62,326 | | | 472,316 |
Plaza Centers (Europe) BV(3) | | 309,764 | | | 402,748 |
| | | | | |
| | | | | 875,064 |
| PHILIPPINES - 1.0% | | | | | |
Philippine Long Distance Telephone Company(3) | | 13,070 | | | 740,860 |
| | | | | |
| POLAND - 0.9% | | | | | |
Polski Koncern Naftowy Orlen S.A.(3) | | 47,614 | | | 685,757 |
| | | | | |
| RUSSIA - 7.9% | | | | | |
Globaltrans Investment PLC (DR)(2)(3) | | 57,096 | | | 517,139 |
LUKOIL (DR)(3) | | 28,237 | | | 1,699,923 |
Mining and Metallurgical Company Norilsk Nickel (DR)(3) | | 62,743 | | | 879,556 |
Mobile TeleSystems (DR) | | 16,137 | | | 903,833 |
OAO TMK (DR)(3) | | 25,826 | | | 646,339 |
PIK Group (DR)(3) | | 4,259 | | | 22,419 |
PIK Group, Reg S (DR)(3) | | 37,309 | | | 196,392 |
Razguliay Group(2)(3) | | 103,399 | | | 374,429 |
VTB Bank OJSC (DR)(3) | | 123,795 | | | 515,734 |
| | | | | |
| | | | | 5,755,764 |
| SINGAPORE - 0.6% | | | | | |
Epure International Ltd.(3) | | 1,882,000 | | | 459,890 |
| | | | | |
| SOUTH AFRICA - 9.6% | | | | | |
African Bank Investments Limited(3) | | 261,710 | | | 808,353 |
Gold Fields Limited(3) | | 89,680 | | | 866,990 |
Grindrod Limited(3) | | 187,786 | | | 408,159 |
Impala Platinum Holdings Limited(3) | | 60,232 | | | 1,223,454 |
Mondi Limited(3) | | 107,395 | | | 585,235 |
Mr. Price Group Limited(3) | | 187,461 | | | 522,807 |
MTN Group Limited(3) | | 88,113 | | | 1,247,871 |
Reunert Limited(3) | | 83,769 | | | 588,208 |
Tiger Brands Limited(3) | | 42,271 | | | 729,467 |
| | | | | |
| | | | | 6,980,544 |
| SWEDEN - 1.3% | | | | | |
West Siberian Resources Ltd (DR)(2)(3) | | 1,146,282 | | | 931,115 |
| | | | | |
| TAIWAN - 8.8% | | | | | |
Acer Inc.(3) | | 345,148 | | | 589,363 |
Cathay Financial Holding Co., Ltd.(3) | | 537,292 | | | 753,381 |
China Airlines(2)(3) | | 1,856,000 | | | 406,001 |
| | | | | | | |
| | | Shares
Held | | Value | |
| | | | | | | |
| TAIWAN (CONTINUED) | | | | | | | |
Chinatrust Financial Holding Company Ltd.(3) | | | 1,212,962 | | $ | 651,694 | |
Far Eastern Textile Ltd.(3) | | | 854,077 | | | 602,043 | |
Hon Hai Precision Industry Co., Ltd.(3) | | | 287,156 | | | 1,021,700 | |
Taishin Financial Holdings Co., Ltd.(3) | | | 1,978,000 | | | 392,984 | |
Taiwan Fertilizer Co., Ltd.(3) | | | 226,000 | | | 425,815 | |
Taiwan Semiconductor Manufacturing Company Ltd.(3) | | | 964,441 | | | 1,585,749 | |
| | | | | | | |
| | | | | | 6,428,730 | |
| THAILAND - 3.2% | | | | | | | |
Bumrungrad Hospital Public Company Limited (DR)(1)(3) | | | 693,300 | | | 662,574 | |
Krung Thai Bank Public Company Limited (DR)(1)(3) | | | 2,959,500 | | | 535,327 | |
Siam Commercial Bank Public Company Limited (DR)(1)(3) | | | 348,500 | | | 719,349 | |
Total Access Communication Public Company Limited(3) | | | 373,800 | | | 411,096 | |
| | | | | | | |
| | | | | | 2,328,346 | |
| TURKEY - 5.0% | | | | | | | |
Cimsa Cimento Sanayi ve Ticaret A.S.(3) | | | 158,344 | | | 611,826 | |
Tekfen Holding A.S.(3) | | | 89,163 | | | 495,148 | |
Turk Hava Yollari Anonim Ortakligi(2)(3) | | | 141,398 | | | 720,700 | |
Turk Sise ve Cam Fabrikalari AS(2)(3) | | | 540,388 | | | 659,117 | |
Turkcell Iletisim Hizmetleri AS(3) | | | 98,504 | | | 604,639 | |
Turkiye Sinai Kalkinma Bankasi A.S.(2)(3) | | | 710,479 | | | 571,486 | |
| | | | | | | |
| | | | | | 3,662,916 | |
| UNITED ARAB EMIRATES - 0.5% | |
Depa, Ltd. (DR)(2)(3) | | | 90,100 | | | 382,925 | |
| | | | | | | |
| UNITED KINGDOM - 0.7% | | | | | | | |
Antofagasta plc(3) | | | 68,448 | | | 493,496 | |
| | | | | | | |
Total common and preferred stocks (Cost $101,290,922) | | | | | | 70,645,894 | |
| | |
| | | Par
Amount | | | |
SHORT-TERM INVESTMENTS (CASH EQUIVALENTS) - 3.7% | | | | | | | |
Repurchase agreement with Fixed Income Clearing Corporation, 0.05%, dated 9/30/08, due 10/1/08, maturity value $2,722,004(5) (Cost $2,722,000) | | $ | 2,722,000 | | | 2,722,000 | |
| | | | | | | |
| | | | | | | |
| | | | | | | |
Total investments - 100.5% (Cost $104,012,922) | | | | | | 73,367,894 | |
| | | | | | | |
Other assets less liabilities - (0.5%) | | | | | | (358,482 | ) |
| | | | | | | |
| | | | | | | |
Total net assets - 100.0%(6) | | | | | $ | 73,009,412 | |
| | | | | | | |
5
(2) | Non-income producing security. |
(3) | Valued at a fair value in accordance with procedures established by the board of directors of Artisan Funds. In total, securities valued at a fair value were $47,959,672 or 65.7% of total net assets. |
(4) | Security has been determined to be illiquid under procedures established by the board of directors. |
| | | | | | | | |
Issuer | | Rate | | | Maturity | | Value |
U.S. Treasury Bond | | 6.25 | % | | 5/15/2030 | | $ | 2,777,200 |
(6) | Percentages for the various classifications relate to total net assets. |
Company names are as reported by a data service provider and in some cases are translations; a company's legal name may be different.
(DR) Depository Receipt, voting rights may vary.
| | | | | | | |
| PORTFOLIO DIVERSIFICATION - September 30,2008 | |
| | | Value | | | Percentage
of Total
Net Assets | |
Consumer Discretionary | | $ | 7,759,573 | | | 10.6 | % |
Consumer Staples | | | 6,127,255 | | | 8.4 | |
Energy | | | 10,835,489 | | | 14.8 | |
Financials | | | 9,916,126 | | | 13.6 | |
Healthcare | | | 1,865,815 | | | 2.6 | |
Industrials | | | 9,161,371 | | | 12.6 | |
Information Technology | | | 7,452,112 | | | 10.2 | |
Materials | | | 9,476,578 | | | 13.0 | |
Telecommunication Services | | | 6,942,433 | | | 9.5 | |
Utilities | | | 1,109,142 | | | 1.5 | |
| | | | | | | |
Total common and preferred stocks | | | 70,645,894 | | | 96.8 | |
Short-term investments | | | 2,722,000 | | | 3.7 | |
| | | | | | | |
Total investments | | | 73,367,894 | | | 100.5 | |
Other assets less liabilities | | | (358,482 | ) | | (0.5 | ) |
| | | | | | | |
Total net assets | | $ | 73,009,412 | | | 100.0 | % |
| | | | | | | |
| | | | | | |
| CURRENCY EXPOSURE - September 30, 2008 | |
| | | Value | | Percentage
of Total
Investments | |
Brazilian real | | $ | 13,306,523 | | 18.1 | % |
British pound | | | 896,244 | | 1.2 | |
Chilean peso | | | 489,446 | | 0.7 | |
Egyptian pound | | | 769,044 | | 1.1 | |
Euro | | | 472,316 | | 0.6 | |
Hong Kong dollar | | | 6,686,939 | | 9.1 | |
Indian rupee | | | 2,897,259 | | 4.0 | |
Israeli shekel | | | 953,984 | | 1.3 | |
Korean won | | | 6,441,496 | | 8.8 | |
Mexican peso | | | 5,242,836 | | 7.1 | |
Philippine peso | | | 740,860 | | 1.0 | |
Polish zloty | | | 685,757 | | 0.9 | |
Singapore dollar | | | 459,890 | | 0.6 | |
South African rand | | | 6,980,544 | | 9.5 | |
Swedish krona | | | 931,115 | | 1.3 | |
Taiwan dollar | | | 6,428,730 | | 8.8 | |
Thai baht | | | 1,917,250 | | 2.6 | |
Turkish lira | | | 3,662,916 | | 5.0 | |
US dollar | | | 13,404,745 | | 18.3 | |
| | | | | | |
Total investments | | $ | 73,367,894 | | 100.0 | % |
| | | | | | |
| | | | | |
| TOP TEN HOLDINGS - September 30, 2008 | |
Company Name | | Country | | Percentage
of Total
Net Assets | |
Petroleo Brasileiro S.A. | | Brazil | | 5.6 | % |
Samsung Electronics Co., Ltd. | | Korea | | 4.6 | |
Companhia Vale do Rio Doce | | Brazil | | 3.4 | |
America Movil SAB de C.V. | | Mexico | | 2.8 | |
LUKOIL | | Russia | | 2.3 | |
Taiwan Semiconductor Manufacturing Company Ltd. | | Taiwan | | 2.2 | |
MTN Group Limited | | South Africa | | 1.7 | |
Impala Platinum Holdings Limited | | South Africa | | 1.7 | |
Huabao International Holdings Limited | | Hong Kong | | 1.6 | |
Chaoda Modern Agriculture (Holdings) Limited | | China | | 1.5 | |
| | | | | |
Total | | | | 27.4 | % |
| | | | | |
For the purpose of determining the Fund’s top ten holdings, securities of the same issuer are aggregated to determine the weight in the Fund.
The accompanying notes are an integral part of the financial statements.
6
ARTISAN FUNDS, INC.
Statement of Assets and Liabilities – September 30, 2008
| | | | |
| | | EMERGING MARKETS | |
| ASSETS: | | | | |
Investments in securities, at value | | $ | 70,645,894 | |
Short-term investments (repurchase agreements), at value | | | 2,722,000 | |
| | | | |
Total investments | | | 73,367,894 | |
Cash | | | 291 | |
Foreign currency | | | 1,064,489 | |
Receivable from investments sold | | | 156,545 | |
Receivable from fund shares sold | | | 3,967 | |
Dividends and interest receivable | | | 193,676 | |
Receivable from Adviser | | | 40,678 | |
Other assets | | | 260 | |
| | | | |
Total assets | | | 74,827,800 | |
| |
| LIABILITIES: | | | | |
Net unrealized loss on foreign currency forward contracts | | | 2,219 | |
Payable for investments purchased | | | 1,616,472 | |
Payable for operating expenses | | | 175,159 | |
Payable for withholding taxes | | | 24,278 | |
Payable for deferred directors’ compensation | | | 260 | |
| | | | |
Total liabilities | | | 1,818,388 | |
| | | | |
Total net assets | | $ | 73,009,412 | |
| | | | |
| NET ASSETS CONSIST OF: | | | | |
Fund shares issued and outstanding | | $ | 104,495,427 | |
Net unrealized depreciation on investments and foreign currency related transactions | | | (30,746,025 | ) |
Accumulated undistributed net investment income | | | 805,727 | |
Accumulated undistributed net realized (losses) on investments and foreign currency related transactions | | | (1,545,717 | ) |
| | | | |
| | $ | 73,009,412 | |
| | | | |
| SUPPLEMENTARY INFORMATION: | | | | |
Net assets | | | | |
Institutional Shares | | $ | 69,799,317 | |
Advisor Shares | | $ | 3,210,095 | |
Shares outstanding (Indefinite number of shares authorized, $0.01 par value) | | | | |
Institutional Shares | | | 6,260,244 | |
Advisor Shares | | | 287,690 | |
Net asset value, offering price and redemption price per share | | | | |
Institutional Shares | | $ | 11.15 | |
Advisor Shares | | $ | 11.16 | |
Cost of securities held | | $ | 104,012,922 | |
Cost of foreign currency | | $ | 1,180,777 | |
The accompanying notes are an integral part of the financial statements.
7
ARTISAN FUNDS, INC.
Statement of Operations – For the Year Ended September 30, 2008
| | | | |
| | | EMERGING MARKETS | |
| INVESTMENT INCOME: | | | | |
Dividends, from unaffiliated issuers(1) | | $ | 1,934,788 | |
Interest | | | 65,169 | |
| | | | |
Total investment income | | | 1,999,957 | |
| |
| EXPENSES: | | | | |
Advisory fees | | | 787,254 | |
Transfer agent fees | | | | |
Institutional Shares | | | 20,857 | |
Advisor Shares | | | 16,992 | |
Shareholder communications | | | | |
Institutional Shares | | | 13,935 | |
Advisor Shares | | | 2,240 | |
Custodian fees | | | 129,718 | |
Accounting fees | | | 61,023 | |
Professional fees | | | 67,632 | |
Registration fees | | | | |
Institutional Shares | | | 34,659 | |
Advisor Shares | | | 17,519 | |
Directors’ fees | | | 6,000 | |
Other operating expenses | | | 7,498 | |
| | | | |
Total operating expenses | | | 1,165,327 | |
Less amounts waived or paid by the Adviser or the board of directors | | | (40,678 | ) |
| | | | |
Net expenses | | | 1,124,649 | |
| | | | |
Net investment income | | | 875,308 | |
| |
| NET REALIZED AND UNREALIZED GAINS (LOSSES) ON INVESTMENTS: | | | | |
Net realized (loss) on: | | | | |
Investments | | | (1,369,976 | ) |
Foreign currency related transactions | | | (80,293 | ) |
| | | | |
| | | (1,450,269 | ) |
Net (decrease) in unrealized appreciation or depreciation on: | | | | |
Investments | | | (33,499,682 | ) |
Foreign currency related transactions | | | (82,858 | ) |
| | | | |
| | | (33,582,540 | ) |
| | | | |
Net (loss) on investments and foreign currency related transactions | | | (35,032,809 | ) |
| | | | |
Net (decrease) in net assets resulting from operations | | | (34,157,501 | ) |
| | | | |
(1) | Net of foreign taxes withheld of $180,826. |
The accompanying notes are an integral part of the financial statements.
8
ARTISAN FUNDS, INC.
Statement of Changes in Net Assets
| | | | | | | | |
| | | EMERGING MARKETS | |
| | | Year Ended
9/30/2008 | | | Year Ended
9/30/2007 | |
| OPERATIONS: | | | | | | | | |
Net investment income | | $ | 875,308 | | | $ | 63,262 | |
Net realized gain (loss) on: | | | | | | | | |
Investments | | | (1,369,976 | ) | | | 1,381,724 | |
Foreign currency related transactions | | | (80,293 | ) | | | (36,234 | ) |
Net increase (decrease) in unrealized appreciation or depreciation on: | | | | | | | | |
Investments | | | (33,499,682 | ) | | | 2,411,591 | |
Foreign currency related transactions | | | (82,858 | ) | | | (14,136 | ) |
| | | | | | | | |
Net increase (decrease) in net assets resulting from operations | | | (34,157,501 | ) | | | 3,806,207 | |
| | |
| DISTRIBUTIONS PAID TO SHAREHOLDERS: | | | | | | | | |
Net investment income: | | | | | | | | |
Institutional Shares | | | (39,728 | ) | | | (15,593 | ) |
Advisor Shares | | | - | | | | | |
Net realized gains on investment transactions: | | | | | | | | |
Institutional Shares | | | (1,484,717 | ) | | | (166,242 | ) |
Advisor Shares | | | - | | | | | |
| | | | | | | | |
Total distributions paid to shareholders | | | (1,524,445 | ) | | | (181,835 | ) |
| | |
| FUND SHARE ACTIVITIES: | | | | | | | | |
Net increase in net assets resulting from fund share activities | | | 90,274,995 | | | | 8,910,431 | |
| | | | | | | | |
Total increase in net assets | | | 54,593,049 | | | | 12,534,803 | |
| | | | | | | | |
Net assets, beginning of period | | | 18,416,363 | | | | 5,881,560 | |
| | | | | | | | |
Net assets, end of period | | $ | 73,009,412 | | | $ | 18,416,363 | |
| | | | | | | | |
| | | | | | | | |
Accumulated undistributed net investment income | | $ | 805,727 | | | $ | 28,456 | |
| | | | | | | | |
The accompanying notes are an integral part of the financial statements.
9
ARTISAN FUNDS, INC.
Financial Highlights – For a share outstanding throughout each period
| | | | | | | | | | | | | | | | | | | | | |
Period
Ended | | | Net Asset
Value
Beginning
of Period | | Net
Investment
Income(1) | | Net Realized
and Unrealized
Gain (Loss) on
Investments | | | Total Income
(Loss) from
Investment
Operations | | |
Dividends
from Net
Investment
Income | | Distributions
from Net
Realized
Gains |
| | | | | | | | | | | | | | | | | | | | | |
| ARTISAN EMERGING MARKETS FUND | | | | | | | | | | | |
| Advisor Shares | | | | | | | | | | | | | | | | | | | | | |
| 9/30/2008 | (5) | | $ | 17.43 | | $ | 0.04 | | $ | (6.31 | ) | | $ | (6.27 | ) | | $ | - | | $ | - |
(1) | Computed based on average shares outstanding. |
(2) | Periods less than twelve months (where applicable) are not annualized. |
(3) | Periods less than twelve months (where applicable) are annualized. |
(4) | The ratios of expenses to average net assets and net investment income (loss) to average net assets exclude expenses waived or paid by the Adviser or the board of directors. Absent expenses waived or paid by the Adviser or the board of directors, the ratios of expenses to average net assets and net investment income (loss) to average net assets would have been as follows: |
| | | | | | | | |
| Fund | | Period Ended | | Ratio of Expenses to
Average Net Assets | | | Ratio of Net Investment
(Loss) to Average Net Assets | |
Emerging Markets Advisor Shares | | 9/30/2008 | | 9.73 | % | | (7.30 | )% |
(5) | For the period from commencement of operations (June 2, 2008) through September 30, 2008. |
10
| | | | | | | | | | | | | | | | | | | |
Total
Distributions | | Net Asset
Value
End of
Period | | Total Return(2) | | | Net Assets
End of
Period
(millions) | | Ratio of Expenses to Average Net Assets(3)(4) | | | Ratio of Net
Investment
Income to
Average Net Assets(3)(4) | | | Portfolio
Turnover
Rate(2) | |
| | | | | | | | | | | | | | | | | | | |
| | | | | | | | | | | | | | | | | | | | |
| | | | | | | | | | | | | | | | | | | | |
| $ | - | | $ | 11.16 | | (35.97 | )% | | $ | 3.2 | | 1.50 | % | | 0.93 | % | | 42.24 | % |
The accompanying notes are an integral part of the financial statements.
11
ARTISAN FUNDS, INC.
Notes to Financial Statements – September 30, 2008
Artisan Funds, Inc. (“Artisan Funds”) was incorporated on January 5, 1995, as a Wisconsin corporation and is registered under the Investment Company Act of 1940, as amended. Artisan Funds is a series comprised of eleven open-end, diversified mutual funds. Artisan Emerging Markets Fund (“Emerging Markets Fund” or “Emerging Markets” or “Fund”), commenced operations on June 26, 2006. The Fund’s investment objective is to seek long-term capital growth.
Emerging Markets Fund offers shares of capital stock of two classes – Institutional Shares and Advisor Shares – and began offering Advisor Shares on June 2, 2008. Advisor Shares are sold to certain institutional investors.
Each class of shares has equal rights with respect to portfolio assets and voting privileges. Each class has exclusive voting rights with respect to any matters involving only that class.
Income, expenses not specific to either class and realized and unrealized gains and losses were allocated daily to each class of shares based upon the relative net asset value of outstanding shares. Expenses attributable to a particular class of shares, such as transfer agency fees, shareholder communication expenses and registration fees, were allocated directly to that class.
| (2) | Summary of significant accounting policies: |
The following is a summary of significant accounting policies of the Fund in effect during the period covered by the financial statements, which were in accordance with United States generally accepted accounting principles.
| (a) | Security valuation – The net asset value (“NAV”) of the shares of each class of the Fund was determined as of the close of regular session trading on the New York Stock Exchange (“NYSE”) (usually 4:00 p.m., Eastern Time, but sometimes earlier) each day the NYSE was open for regular session trading. The NAV of each class of shares was determined by dividing the value of each Fund’s securities and other assets attributed to that class, less its liabilities attributed to that class, by the number of outstanding shares of that class of that Fund. |
| | In determining NAV, each equity security traded on a securities exchange, including the Nasdaq Stock Market and over-the-counter securities, was valued at the closing price as of the time of valuation on the exchange or market designated by the Fund’s accounting agent or pricing vendor as the principal exchange (the “principal exchange”). The closing price provided by the pricing vendor for a principal exchange may differ and may represent information such as last sales price, an official closing price, a closing auction price or other information, depending on exchange or market convention. Absent closing price information from the principal exchange as of the time of valuation, the security was valued using the closing price on another exchange on which the security traded (if such price is made available by the pricing vendor) or the most recent bid quotation on the principal exchange or, if not available, another exchange or in the over-the-counter market, except that securities listed on the London |
12
NOTES TO FINANCIAL STATEMENTS
| | Stock Exchange were valued at the mean of the most recent bid and asked quotations as of the time of valuation. Short-term investments, other than repurchase agreements, maturing within sixty days from the valuation date were valued at amortized cost, which approximates market value. |
| | Securities for which prices were not readily available were valued by Artisan Funds’ valuation committee (the “valuation committee”) at a fair value determined in good faith under procedures established by and under the general supervision of Artisan Funds’ board of directors (the “board of directors”). A price was considered to be not readily available if, among other things, the valuation committee believed that the price determined as described in the preceding paragraph did not reflect a fair value of the security. |
| | Emerging Markets Fund generally invested a significant portion, and perhaps as much as substantially all, of its total assets in securities principally traded in markets outside the U.S. The foreign markets in which the Fund invested were sometimes open on days when the NYSE was not open and the Fund did not calculate its NAV, and sometimes were not open on days when the Fund did calculate its NAV. Even on days on which both the foreign market and the NYSE were open, several hours may have passed between the time when trading in the foreign market closed and the time as of which the Fund calculates its NAV. That was generally the case for markets in Europe, Asia, Australia and other far eastern markets; the regular closing time of foreign markets in North and South America was generally the same as the closing time of the NYSE and the time as of which the Fund calculated its NAV. |
| | The valuation committee concluded that a price determined under the Fund’s valuation procedures was not readily available if, among other things, the valuation committee believed that the value of the security might have been materially affected by events occurring after the close of the market in which the security was principally traded but before the time for determination of NAV (“subsequent event”). A subsequent event might include a company-specific development (for example, announcement of a merger that is made after the close of the foreign market), a development that might affect an entire market or region (for example, imposition of foreign exchange controls by a foreign government), a potentially global development (such as a terrorist attack that may be expected to have an impact on investor expectations worldwide) or a significant change in one or more U.S. securities indices. Artisan Funds monitored for subsequent events using several tools. An indication by any of those tools of a potential material change in the value of securities resulted in either a meeting of the valuation committee, which considered whether a subsequent event had occurred and whether local market closing prices continued to represent fair values for potentially affected non-U.S. securities, and/or a valuation based on information provided by a third party research service. This third party research service was used to assist in determining estimates of fair values for foreign securities. That service utilized statistical data based on historical performance of securities, markets and other data in developing factors used to estimate a fair value. |
| | Estimates of fair values utilized by the Fund as described above may differ from the value realized on the subsequent sale of those securities and from quoted or published prices for those securities. The differences may have been material to the NAV of the Fund or to the information presented. |
13
NOTES TO FINANCIAL STATEMENTS
| | There are certain risks involved in investing in foreign securities. These risks include those resulting from future adverse political, social, and economic developments, fluctuations in currency exchange rates, the possible imposition of exchange controls, and other foreign laws or restrictions. The risks of foreign investments typically are greater in emerging markets. |
| (b) | Income taxes – No provision was made for federal income taxes or excise taxes since the Fund intends to (i) comply with the provisions of Subchapter M of the Internal Revenue Code applicable to regulated investment companies and (ii) distribute to its shareholders substantially all of its taxable income as well as net realized gains from the sale of investment securities. The Fund may utilize earnings and profits distributed to shareholders on redemptions of Fund shares as part of the dividends paid deduction. |
| | The Fund may be subject to taxes on realized gains from the sale of investment securities imposed by certain countries in which the Fund invests. The Fund recorded the foreign tax expense, if any, on an accrual basis. The taxes were included in “Payable for withholding taxes” on the accompanying Statement of Assets and Liabilities. |
| (c) | Portfolio transactions – In determining the Fund’s NAV, security transactions and shareholder transactions were accounted for no later than one business day after trade date, in accordance with applicable law. However, for financial reporting purposes, security transactions and shareholder transactions were recorded on trade date in accordance with United States generally accepted accounting principles. Net realized gains and losses on securities were computed on specific security lot identification. |
| (d) | Foreign currency translation – Values of foreign investments, open foreign currency forward contracts, payables for capital gains taxes and cash denominated in foreign currencies were translated into U.S. dollars using a spot market rate of exchange as of the time of determination of the Fund’s NAV on the day of valuation. Payables and receivables for securities transactions, dividend and reclaim receivables and other receivables and payables denominated in a foreign currency were translated into U.S. dollars using a spot market rate of exchange as of 12:00 p.m. (Eastern Time) on the day of valuation. Purchases and sales of investments and dividend and interest income were translated into U.S. dollars using a spot market rate of exchange as of 12:00 p.m. (Eastern Time) on the date of such transactions. The portion of security gains or losses resulting from changes in foreign exchange rates was included with net realized and unrealized gain or loss from investments, as appropriate, for both financial reporting and tax purposes. |
| | The Fund may enter into foreign currency forward contracts to hedge the foreign currency exposure on open payables and receivables. These foreign currency forward contracts, or spot contracts, generally settle within two business days. The Fund also may enter into foreign currency forward contracts to hedge against foreign currency exchange rate risks on its non-U.S. dollar denominated investment securities. Foreign currency forward contracts, if any, were recorded at market value and any related realized and unrealized gains and losses were reported as foreign currency related transactions for financial reporting purposes. For tax purposes, these foreign exchange gains and losses were treated as ordinary income or loss. The Fund could be exposed to loss if the counterparties fail to perform under these contracts. |
| | Other foreign currency related transaction gains and losses may result from currency gains and losses realized from the difference between the amounts of dividends and foreign withholding taxes recorded on the Fund’s books and the U.S. dollar equivalent |
14
NOTES TO FINANCIAL STATEMENTS
| | of the amounts actually received or paid. The net increase (decrease) in unrealized appreciation or depreciation on foreign currency related transactions arose from changes in the values of assets and liabilities, other than investments in securities, resulting from changes in foreign exchange rates. |
| (e) | Repurchase agreements – The Fund may enter into repurchase agreements with institutions that Artisan Partners Limited Partnership (“the Adviser”) determined were creditworthy pursuant to criteria adopted by the board of directors. Repurchase agreements were recorded at cost plus accrued interest and were collateralized in an amount greater than or equal to the repurchase price plus accrued interest. Collateral was held by the Fund’s custodian and in the event of default on the obligation of the counterparty to repurchase, the Fund had the right to liquidate the collateral and apply the proceeds in satisfaction of the obligation. If the proceeds from any sale of such collateral were less than the repurchase price, the Fund would have suffered a loss. |
| (f) | Depository receipts – The Fund may invest in depository receipts. Depository receipts are typically issued by a financial institution (a “depository”), evidencing ownership interests in a security issued by an issuer and deposited with the depository. |
| (g) | Securities lending – The Fund may enter into securities lending transactions secured by collateral in the form of U.S. Government securities at least equal to, at all times, the fair value of the securities loaned. When securities are on loan, the Fund does not receive dividends on the securities loaned, but receives compensation from the borrower in lieu of such dividends. Gain or loss in the fair value of the securities loaned that may occur during the term of the loan will be for the account of the Fund. In entering into securities lending arrangements, the Fund takes the risk that the borrower may not provide additional collateral when required or return the securities when due or, if the borrower defaults, the Fund may experience delays in selling collateral or the collateral may not be sufficient to cover the value of securities lent. There were no securities on loan as of and during the year ended September 30, 2008. |
| (h) | Equity-linked participation certificates – The Fund may invest in equity-linked participation certificates. Equity-linked participation certificates are derivative securities which are specially designed to combine the characteristics of one or more underlying securities and their equity derivatives in a single note form. An investment in equity-linked participation certificates creates exposure to the credit risk of the issuing financial institution, as well as to the market risk of the underlying securities. There is no guaranteed return of principal with these securities and the appreciation potential of these securities may be limited by a maximum payment or call right. Equity-linked participation certificates may be more volatile and less liquid than equity securities. The Fund did not invest in participation certificates during the year ended September 30, 2008. |
| (i) | Transfer agent fees – The Fund paid fees to, and reimbursed expenses of, the Fund’s transfer agent. In addition, the Fund has authorized certain financial services companies, broker-dealers, banks or other authorized agents, and in some cases, other organizations designated by an authorized agent (with their designees, collectively “authorized agents”) to accept purchase, exchange and redemption orders for Advisor Shares on the Fund’s behalf. Many authorized agents charged a fee for accounting and shareholder services that the agent provided to Fund shareholders on the Fund’s behalf. Those services typically included recordkeeping, transaction processing for shareholders’ accounts and |
15
NOTES TO FINANCIAL STATEMENTS
| | other services. The fee was either based on the number of accounts to which the intermediary provided such services, or a percentage, as of September 30, 2008, up to 0.40% annually of the average value of Fund shares held in such accounts. The Fund paid a portion of such fees, which are intended to compensate the authorized agent for its provision of services of the type that would be provided by the Fund’s transfer agent or other service providers if the shares were registered on the books of the Fund’s transfer agent. The balance of the fees incurred was paid by the Adviser. The Fund’s expenses incurred for services provided by authorized agents were included in “Transfer agent fees” in the Statement of Operations. The table below shows the fees and expenses to the Fund’s transfer agent and the fees to authorized agents incurred by each class of the Fund during the year ended September 30, 2008: |
| | | | | | | | | |
| | | Year Ended 9/30/08 |
| | | Fees and Expenses
to Transfer Agent | | Fees to
Authorized
Agents | | Total |
Institutional Shares | | $ | 20,857 | | $
| -
| | $ | 20,857 |
Advisor Shares(1) | | | 15,649 | | | 1,343 | | | 16,992 |
|
(1)For the period from commencement of operations (June 2, 2008) through September 30, 2008. |
| (j) | Commission recapture – The Fund had the ability to direct portfolio trades to various brokers that have agreed to rebate a portion of the commissions generated. The Fund received no commission recapture rebates for the year ended September 30, 2008. |
| (k) | Use of estimates – The preparation of financial statements in conformity with United States generally accepted accounting principles requires management to make estimates and assumptions that affect the reported amounts and disclosures in the financial statements. Actual results could differ from those estimates. |
| (l) | Indemnifications – In the normal course of business, the Fund has entered into contracts in which the Fund agrees to indemnify the other party or parties against various potential costs or liabilities. The Fund’s maximum exposure under these arrangements is unknown. No claim had been made for indemnification pursuant to any such agreement of the Fund. |
| (m) | Other – Dividend income less foreign taxes withheld, if any, was generally recorded on the ex-dividend date. In some cases, the information was not available to the Fund on the ex-dividend date. In such cases, which may have included dividends from private placements or foreign securities, dividends were recorded as soon after the ex-dividend date as reliable information became available to the Fund. Non-cash dividends included in dividend income, if any, were generally recorded at the fair market value of securities received. Interest income was recorded on the accrual basis. Distributions to shareholders were recorded on the ex-dividend date. Expenses attributable to Artisan Funds were generally allocated to each Artisan Fund based on net assets. However, other expense allocation methodologies were used, depending on the nature of the expense item. Expenses attributable to a particular Fund or class were allocated directly to that Fund or class. |
| | The character of income and net realized gains and losses may differ in some instances for financial statement and tax purposes and may result in reclassification of permanent |
16
NOTES TO FINANCIAL STATEMENTS
| | differences among certain capital accounts to more appropriately conform financial accounting to tax characterizations of dividend and capital gain distributions. |
| | Emerging Markets Fund generally imposed a 2% redemption fee on shares held 90 days or less. Those redemption fees were recorded as a reduction in the cost of shares redeemed and had the primary effect of increasing paid-in capital. The Fund reserved the right to waive or reduce the 2% redemption fee on shares held 90 days or less at its discretion when the Fund believed such waiver was in the best interests of the Fund, including but not limited to when it determined that imposition of the redemption fee was not necessary to protect the Fund from the effects of short-term trading. The Fund waived the fee on redemption of shares held by certain authorized agents or other Fund intermediaries. |
| (3) | Transactions with affiliates: |
The Adviser, with which the officers and a director of Artisan Funds were affiliated, provided investment advisory and administrative services to the Fund. In exchange for those services, Emerging Markets Fund paid a monthly management fee to the Adviser at the annual rate of 1.05% of the Fund’s average daily net assets.
The Adviser has voluntarily undertaken to reimburse Emerging Markets Fund for any ordinary operating expenses in excess of 1.50% of average daily net assets, annually.
The officers and director of Artisan Funds who are affiliated with the Adviser receive no compensation from the Fund.
Prior to January 1, 2008, each director who was not an interested person of Artisan Funds or the Adviser received an annual retainer of $150,000, payable quarterly, as well as reimbursement of expenses related to his duties as a director of Artisan Funds. In addition, the non-interested chair of the board of directors received an additional annual retainer of $60,000, payable quarterly, and each chair of a board committee who was a non-interested director received an additional annual retainer of $30,000, payable quarterly. Effective January 1, 2008, each director who is not an interested person of Artisan Funds or the Adviser receives an annual retainer of $160,000, payable quarterly. The other additional annual retainer fees were unchanged. These fees were generally allocated to each of the Artisan Funds based on net assets, subject to a minimum allocation of $1,500 to each Fund per quarter.
Artisan Funds has adopted a deferred compensation plan for independent directors that enables directors to elect to defer receipt of all or a portion of the annual compensation they are entitled to receive from the Funds. For purposes of determining the amount owed to the directors under the plan, deferred amounts were invested in shares of Artisan Funds as selected by the individual directors. The Fund purchased shares of Artisan Funds selected for deferral by the director in amounts equal to his investment, resulting in a Fund asset equal to the deferred compensation liability. Such assets were included as a component of “Other assets” on the Statement of Assets and Liabilities. Deferral of directors’ fees under the plan did not affect the net assets of the Fund, and did not materially affect the Fund’s assets, liabilities or net investment income per share. Amounts will be deferred until distributed in accordance with the plan.
Shares of Artisan Funds were offered for sale by Artisan Distributors LLC (“Distributors”). Distributors is wholly owned by the Adviser. All distribution expenses relating to the Fund were paid by the Adviser.
17
NOTES TO FINANCIAL STATEMENTS
| (4) | Line of credit arrangement: |
Artisan Funds is party to a line of credit agreement with State Street Bank and Trust Company, which expires August 2009, under which the Fund may borrow up to the lesser of (a) $75 million or (b) the lesser of (i) 10% of its total adjusted net assets (after giving effect to the loan) or (ii) the maximum amount the Fund may have borrowed under the Investment Company Act of 1940, the limitations included in the Fund’s prospectus, or any limit or restriction under any law or regulation to which the Fund was subject or any agreement to which the Fund or Artisan Funds is a party; provided that the aggregate borrowings by all Artisan Funds may not exceed $100 million. Artisan Funds paid a commitment fee at the annual rate of 0.10% on the unused portion of the line of credit. Interest would have been charged on any borrowings at the current Federal Funds rate plus 0.50%. The use of the line of credit was generally restricted to temporary borrowing for extraordinary or emergency purposes. During the year ended September 30, 2008, there were no borrowings under the line of credit.
| (5) | Investment transactions: |
The cost of securities purchased and the proceeds from the sale of securities (excluding short-term securities) for the year ended September 30, 2008 were as follows:
| | |
| Security Purchases | | Security Sales |
| $118,004,923 | | $30,829,271 |
| (6) | Information for Federal income tax purposes: |
For Federal income tax purposes, the cost of investments, gross unrealized appreciation, gross unrealized depreciation and net unrealized depreciation on investments as of September 30, 2008 were as follows:
| | | | | | |
Cost of
Investments | | Gross Unrealized
Appreciation | | Gross
Unrealized
Depreciation | | Net Unrealized
(Depreciation) on
Investments |
| $104,430,587 | | $415,005 | | $(31,477,698) | | $(31,062,693) |
The difference between cost of investments for financial reporting and cost of investments for Federal income tax purposes was due primarily to timing differences in recognizing certain gains and losses on security transactions (e.g., wash sale loss deferrals and passive foreign investment company transactions).
The tax characterization of ordinary income dividends and long-term capital gain distributions paid during the year ended September 30, 2008 and the year ended September 30, 2007 were as follows:
| | | | | | |
Year Ended 9/30/08 | | Year Ended 9/30/07 |
Ordinary
Income
Dividends | | Long-Term
Capital Gain
Distributions | | Ordinary
Income
Dividends | | Long-Term
Capital Gain
Distributions |
| $1,241,033 | | $283,412 | | $181,835 | | $ - |
Ordinary income dividends and long-term capital gain distributions were determined in accordance with income tax regulations that may differ from U.S. generally accepted
18
NOTES TO FINANCIAL STATEMENTS
accounting principles. These differences were due to differing treatments for items such as net short-term gains, wash sale loss deferrals, passive foreign investment company transactions, foreign currency transactions, net investment losses and post-October losses.
Additional tax information as of and for the year ended September 30, 2008 as follows:
| | | | |
As of 9/30/08 |
Undistributed Ordinary
Income | | Undistributed
Long-Term Gain | | Post-October
Losses |
| $861,738 | | $ - | | $1,191,524 |
As of September 30, 2008, the Fund did not have a capital loss carryover.
| (7) | Fund share activities: |
Capital share transactions for the Fund were follows:
| | | | | | | | |
Year ended September 30, 2008 | | Institutional
Shares | | | Advisor
Shares(1) | |
Proceeds from shares issued | | $ | 86,328,968 | | | $ | 3,862,647 | |
Net asset value of shares issued in reinvestment of dividends and distributions | | | 1,510,191 | | | | - | |
Cost of shares redeemed(2) | | | (1,424,727 | ) | | | (2,084 | ) |
| | | | | | | | |
Net increase from fund share transactions | | $ | 86,414,432 | | | $ | 3,860,563 | |
| | | | | | | | |
| | |
Shares sold | | | 5,178,178 | | | | 287,867 | |
Shares issued in reinvestment of dividends and distributions | | | 93,337 | | | | - | |
Shares redeemed | | | (113,088 | ) | | | (177 | ) |
| | | | | | | | |
Net increase in capital shares | | | 5,158,427 | | | | 287,690 | |
| | | | | | | | |
| | |
Year ended September 30, 2007 | | Institutional
Shares | | | | |
Net asset value of share transferred | | | | | | | | |
Proceeds from shares issued | | $ | 8,740,000 | | | | | |
Net asset value of shares issued in reinvestment of dividends and distributions | | | 181,510 | | | | | |
Cost of shares redeemed(2) | | | (11,079 | ) | | | | |
| | | | | | | | |
Net increase from fund share transactions | | $ | 8,910,431 | | | | | |
| | | | | | | | |
| | |
Shares sold | | | 560,831 | | | | | |
Shares issued in reinvestment of dividends and distributions | | | 14,521 | | | | | |
Shares redeemed | | | (946 | ) | | | | |
| | | | | | | | |
Net increase in capital shares | | | 574,406 | | | | | |
| | | | | | | | |
(1) | For the period from commencement of operations (June 2, 2008) through September 30, 2008. |
(2) | Net of redemption fees of: |
| | | | | | |
| | | 9/30/2008 | | 9/30/2007 |
Institutional Shares | | $ | 420 | | $ | - |
Advisor Shares | | | 8 | | | |
19
NOTES TO FINANCIAL STATEMENTS
Artisan Funds and the Adviser were defendants in a lawsuit filed in the Circuit Court of the Third Judicial Circuit, Madison County, Illinois that sought certification of a plaintiff class consisting of all persons in the United States who held shares in Artisan International Fund for a period of more than 14 days during the five year period prior to the filing of the lawsuit in September 2003. The basic allegations in the case were that Artisan Funds and the Adviser did not make appropriate price adjustments to the foreign securities owned by Artisan International Fund prior to calculating that Fund’s NAV, thereby allegedly enabling market timing traders to trade Artisan International Fund’s shares in such a way as to disadvantage long-term investors. Following years of procedural litigation in state and federal courts, the case was resolved and dismissed with prejudice in May 2008. The resolution of the lawsuit did not have a material effect on the financial condition or results of operations of any Artisan Fund.
| (9) | Recent Accounting Pronouncements: |
On July 13, 2006, the Financial Accounting Standards Board (FASB) released FASB Interpretation No. 48 “Accounting for Uncertainty in Income Taxes” (“FIN 48”). FIN 48 provides guidance for how uncertain tax positions should be recognized, measured, presented and disclosed in the financial statements. Management has evaluated the implications of FIN 48 for all open tax years, and has determined there is no impact to the Fund’s financial statements.
In September 2006, FASB issued Statement on Financial Accounting Standards No. 157, “Fair Value Measurements” (FAS 157). This standard clarifies the definition of fair value for financial reporting, establishes a framework for measuring fair value and requires additional disclosures about the use of fair value measurements. FAS 157 is effective for financial statements issued for fiscal years beginning after November 15, 2007 and interim periods within those fiscal years. As of September 30, 2008, the Fund did not believe the adoption of FAS 157 would impact the amounts reported in the financial statements, however, additional disclosures would be required about the information used to develop the measurements of fair value and the effect of certain of the measurements reported in the statement of operations for a fiscal period.
In March 2008, the FASB issued Statement of Financial Accounting Standards No. 161, “Disclosures about Derivative Instruments and Hedging Activities” (FAS 161). FAS 161 requires enhanced disclosure relating to an entity’s use of derivatives, how derivatives are accounted for, and how derivative instruments affect an entity’s results of operations and financial position. This standard was issued and is effective for fiscal years beginning after November 15, 2008. Management is currently evaluating the implications of FAS 161 and the impact on the Fund’s financial statement disclosures, if any.
20
Report of Independent Registered Public Accounting Firm
To the Board of Directors and Shareholders of Artisan Funds, Inc.
We have audited the accompanying statement of assets and liabilities, including the schedule of investments, of Artisan Emerging Markets Fund (one of eleven portfolios constituting Artisan Funds, Inc. (the “Fund”)) as of September 30, 2008, and the related statement of operations for the year ended then ended, the statements of changes in net assets for each of the two years in the period then ended, and the financial highlights for the period from June 2, 2008 (commencement of operations) through September 30, 2008. These financial statements and financial highlights are the responsibility of the Fund’s management. Our responsibility is to express an opinion on these financial statements and financial highlights based on our audits.
We conducted our audit in accordance with the standards of the Public Company Accounting Oversight Board (United States). Those standards require that we plan and perform the audit to obtain reasonable assurance about whether the financial statements and financial highlights are free of material misstatement. We were not engaged to perform an audit of the Fund’s internal control over financial reporting. Our audits included consideration of internal control over financial reporting as a basis for designing audit procedures that are appropriate in the circumstances, but not for the purpose of expressing an opinion on the effectiveness of the Fund’s internal control over financial reporting. Accordingly, we express no such opinion. An audit also includes examining, on a test basis, evidence supporting the amounts and disclosures in the financial statements and financial highlights, assessing the accounting principles used and significant estimates made by management, and evaluating the overall financial statement presentation. Our procedures included confirmation of securities owned as of September 30, 2008, by correspondence with the custodian and brokers. We believe that our audits provide a reasonable basis for our opinion.
In our opinion, the financial statements and financial highlights referred to above present fairly, in all material respects, the financial position of Artisan Emerging Markets Fund of Artisan Funds, Inc. at September 30, 2008, the results of its operations for the year then ended , changes in its net assets for the two years in the period then ended, and the financial highlights for the period from June 2, 2008 (commencement of operations) through September 30, 2008, in conformity with U.S. generally accepted accounting principles.

Milwaukee, Wisconsin
November 10, 2008
21
NOTES TO FINANCIAL STATEMENTS
Other Federal tax information (unaudited):
The Internal Revenue Code requires that shareholders be notified within 60 days of the Fund’s fiscal year-end of certain information regarding long-term capital gains, qualified dividend income and the dividends received deduction for corporate shareholders. This data is informational only. Every year in January, shareholders are sent a Form 1099-DIV which provides the federal tax status of dividends and distributions received during the calendar year. Shareholders are advised to consult their own tax advisor with respect to the specific tax consequences of investment in the Fund.
The Fund hereby designates the following amounts as (i) long-term capital gain distributions for purposes of the dividends paid deduction (including earnings and profits distributed to shareholders on redemption of Fund shares), (ii) the amount of ordinary dividends paid during the fiscal year ended September 30, 2008 that are considered qualified dividend income as defined in the Jobs and Growth Tax Relief Reconciliation Act of 2003, and (iii) the amount of ordinary dividends paid during the fiscal year ended September 30, 2008 that are eligible for the dividends received deduction available to certain corporate shareholders.
| | | | | | | |
| Long-Term Capital Gains | | Qualified Dividend Income | | | Dividends Received Deduction | |
| $ | 283,412 | | 16.85 | % | | - | % |
22
SHAREHOLDER EXPENSE EXAMPLE (UNAUDITED)
As a shareholder of Artisan Funds, you may incur transaction costs, including redemption fees, and you will incur ongoing costs, including management fees and other Fund expenses. This example is intended to help you understand your ongoing costs (in dollars) of investing in the Fund and to compare these costs with the ongoing costs of investing in other mutual funds.
The example is based on an investment of $1,000 invested at the beginning of the period and held for the entire period from April 1, 2008 to September 30, 2008.
Actual Expenses
The first line below the Fund’s name in the table below provides information about actual account values and actual expenses. You may use the information in this line, together with the amount you invested, to estimate the expenses that you paid over the period. Simply divide your account value by $1,000 (for example, an $8,600 account value divided by $1,000 = 8.6), then multiply the result by the number in the first line under the name of the Fund under the heading entitled “Expenses Paid During Period” to estimate the expenses you paid on your account during this period.
Hypothetical Example for Comparison Purposes
The second line below the Fund’s name in the table below provides information about hypothetical account values and hypothetical expenses based on the Fund’s actual expense ratio for the six-month period ended September 30, 2008 and an assumed rate of return of 5% per year before expenses, which is not the Fund’s actual return. The hypothetical account values and expenses may not be used to estimate the actual ending account balances or expenses you paid for the period. You may use this information to compare the ongoing costs of investing in the Fund and other funds. To do so, compare the 5% hypothetical example with the 5% hypothetical examples that appear in the shareholder reports of the other funds.
Please note that the expenses shown in the table are meant to highlight your ongoing costs only and do not reflect any transactional costs, such as redemption fees. Therefore, the second line below the Fund’s name in the table is useful in comparing ongoing costs only, and will not help you determine the relative costs of owning different funds. If these transactional costs were included, your costs would have been higher.
| | | | | | | | | |
| | | Beginning
Account Value
4/1/2008 | | Ending
Account Value
9/30/2008 | | Expenses Paid During
Period
4/1/2008-9/30/2008(1) |
Artisan Emerging Markets Fund - Advisor Shares(2) | | | | | | | | | |
Actual | | $ | 1,000.00 | | $ | 640.30 | | $ | 4.03 |
Hypothetical (5% return before expenses) | | $ | 1,000.00 | | $ | 1,011.48 | | $ | 4.95 |
(1) | Expenses are equal to the Fund's ratio of expenses to average net assets for the six-month period ended September 30, 2008 (shown below), multiplied by the average account value over the period, multiplied by 183/366 (to reflect the one-half year period). |
| | | |
| Fund | | Annualized Ratio of Expenses to Average
Net Assets for the Six-Month
Period Ended September 30, 2008 | |
Emerging Markets - Advisor Shares(a)(b) | | 1.50 | % |
| | (a) | For the period from commencement of operations (June 2, 2008) through September 30, 2008. |
| | (b) | The annualized ratio of expenses to average net assets excludes expenses waived or paid by the Adviser or the board of directors. |
23
SHAREHOLDER EXPENSE EXAMPLE (UNAUDITED)
(2) | The account value and the expenses paid for Emerging Markets Fund - Advisor Shares have been presented for the period from commencement of operations (June 2, 2008) through September 30, 2008. Assuming a six month period, the actual account value as of September 30, 2008 and the expenses paid during period 4/1/2008 - 9/30/2008 would have been as follows: |
| | | | | | | | | |
| | | Beginning
Account Value
4/1/2008 | | Ending
Account Value
9/30/2008 | | Expenses Paid During
Period
4/1/2008-9/30/2008 |
Artisan Emerging Markets Fund - Advisor Shares | | | | | | | | | |
Actual | | $ | 1,000.00 | | $ | 640.30 | | $ | 6.15 |
Hypothetical (5% return before expenses) | | $ | 1,000.00 | | $ | 1,017.50 | | $ | 7.57 |
24
NOTES ON MANAGEMENT’S DISCUSSION OF FUND PERFORMANCE AND PORTFOLIO HOLDINGS’ CLASSIFICATION
The discussion of the Fund included in this report includes statistical information about the portfolio of the Fund. Except as otherwise noted, that information is as of September 30, 2008. That information will vary with changes in the Fund’s portfolio investments. The performance information for the Fund relative to its benchmark index discussed in this report was prepared by the Adviser using information reported by FactSet Databases (“FactSet”). For the purposes of assigning portfolio securities to a particular country, the Adviser considers an issuer to be from a particular country as designated by its securities information vendors. The Adviser currently uses MSCI as its primary source and FactSet as a secondary source for this information. In the event (i) the Adviser’s securities information vendors do not assign a security to a particular country or if the published classification appears to be erroneous, or (ii) its primary vendor does not assign a security to a particular country and the secondary vendor has assigned a security to a particular country by using a methodology that is not the same as the methodology the primary vendor uses to assign a country, the Adviser assigns the security to a country using the primary vendor’s published criteria (to the extent available) or the Adviser’s own judgment. The primary information vendor’s criteria include the identity of the jurisdiction of the issuer’s incorporation, the main equity trading market for the issuer’s securities, the geographical distribution of the issuer’s operations and the location of the issuer’s headquarters. Country designations may change over time.
For the purposes of assigning portfolio securities to a particular sector and industry, the Adviser assigns securities in accordance with the sector and industry classifications of the Global Industry Classification Standard (GICS®) developed by MSCI and Standard & Poor’s (to the extent available) as a primary source and FactSet (to the extent available) as a secondary source for this information. In the event the Adviser’s securities information vendors do not classify a security to a particular sector or industry or if the published classification appears to be erroneous, the Adviser classifies the security according to its own judgment, using other securities information vendors, the company description and other publicly available information about the company’s peer group. Sector and industry classifications may change over time.
The names of portfolio securities reflected in this report are as reported by the Fund’s data providers, may not represent the legal name of the entity and, in some cases, are translations of non-English names.
Description of Index
The Fund’s performance is compared in this report to changes in a broad-based index of changes in prices of securities in the market in which the Fund invests. The index is unmanaged and its returns include reinvested dividends. Unlike the Fund’s returns, the returns of the index do not include the payment of sales commissions or other expenses that would be incurred in the purchase or sale of the securities included in the index. An investment cannot be made directly in an index. Fair value pricing is not employed by market indices.
The index to which the Fund is compared is the Morgan Stanley Capital International Emerging Markets IndexSM, a market-weighted index of companies in emerging markets.
Trademarks
Trademarks and copyrights relating to the index and products of portfolio companies mentioned in this report are owned by their respective owners. Except as otherwise indicated, the trademarks, including names, logos, slogans and service marks appearing in
25
NOTES ON MANAGEMENT’S DISCUSSION OF FUND PERFORMANCE AND PORTFOLIO HOLDINGS’ CLASSIFICATION
this report are the property of the Adviser and may not be copied, reproduced, published or in any way used without written permission.
The Global Industry Classification Standard (“GICS”) was developed by and is the exclusive property and a service mark of MSCI Inc. (“MSCI”) and Standard & Poor’s, a division of The McGraw-Hill Companies, Inc. (“S&P”) and is licensed for use by Artisan Partners Limited Partnership. Neither MSCI, S&P nor any third party involved in making or compiling the GICS or any GICS classifications makes any express or implied warranties or representations with respect to such standard or classification (or the results to be obtained by the use thereof), and all such parties hereby expressly disclaim all warranties of originality, accuracy, completeness, merchantability and fitness for a particular purpose with respect to any of such standard or classification. Without limiting any of the foregoing, in no event shall MSCI, S&P, any of their affiliates or any third party involved in making or compiling the GICS or any GICS classifications have any liability for any direct, indirect, special, punitive, consequential or any other damages (including lost profits) even if notified of the possibility of such damages.
The MSCI information may only be used by the reader, may not be reproduced or redisseminated in any form and may not be used to create any financial instruments or products or any indices. The MSCI information is provided on an “as is” basis and the reader of this information assumes the entire risk of any use made of this information. MSCI, each of its affiliates and each other person involved in or related to compiling, computing or creating any MSCI information (collectively, the “MSCI Parties”) expressly disclaims all warranties (including, without limitation, any warranties of originality, accuracy, completeness, timeliness, non-infringement, merchantability and fitness for a particular purpose) with respect to this information. Without limiting any of the foregoing, in no event shall MSCI Parties have any liability for any direct, indirect, special, incidental, punitive, consequential (including, without limitation, lost profits) or any other damages.
PROXY VOTING POLICIES AND PROCEDURES
You may obtain a description of Artisan Funds’ proxy voting policies and procedures, without charge, upon request by calling 866.574.1770. That information also is included in the Fund’s statement of additional information, which is available without charge, upon request, by calling 866.574.1770 and on the Securities and Exchange Commission’s website at www.sec.gov.
Information relating to how the Fund voted proxies relating to portfolio securities held during the twelve-month period ended June 30 is available without charge, on the Fund’s website at www.artemf.com and on the Securities and Exchange Commission’s website at www.sec.gov.
INFORMATION ON PORTFOLIO SECURITIES
Artisan Funds files a complete schedule of portfolio holdings with the Securities and Exchange Commission for the quarters ending December 31 and June 30 (the first and third quarters of the Fund’s fiscal year) on Form N-Q. The Fund’s Forms N-Q are available on the Securities and Exchange Commission’s website at www.sec.gov. You also may review and copy those documents by visiting the Securities and Exchange Commission’s Public Reference Room in Washington, D.C. Information on the operation of the Public Reference Room may be obtained by calling the Securities and Exchange Commission at 800.SEC.0330.
26
DIRECTORS AND OFFICERS
The board of directors has overall responsibility for the conduct of the affairs of Artisan Funds. Each director serves an indefinite term of unlimited duration until the next annual meeting of shareholders and until the election and qualification of his or her successor. The board of directors may fill any vacancy on the board provided that after such appointment at least two-thirds of the directors have been elected by the shareholders. The shareholders may remove a director by a vote of a majority of the outstanding shares of the Funds at any meeting of shareholders called for the purpose of removing such director.
The board of directors elects the officers of Artisan Funds. Each officer serves until the election and qualification of his or her successor, or until he or she sooner dies, resigns, or is removed or disqualified. The board of directors may remove any officer with or without cause at any time.
The names and ages of the directors and officers as of November 14, 2008, the position each holds with the Funds, the date each was first elected to office, their principal business occupations and other directorships they have held during the last five years are shown below. Each director oversees all eleven series of Artisan Funds.
| | | | | | | | |
| | | | | |
Name and Age
at 11/14/08 | | Position(s)
Held with
Artisan Funds | | Date First Elected
or Appointed
to Office | | Principal Occupation(s)
during Past 5 Years | | Other Public Company
or Registered Investment
Company Directorships Held |
| Directors who are not “interested persons” of Artisan Funds: |
| David A. Erne – 65 | | Director and Independent Chair of the Board of Directors | | Director since 3/27/95; Independent Chair since 2/4/05 | | Of counsel to the law firm Reinhart Boerner Van Deuren s.c., Milwaukee, WI. | | Trustee, Northwestern Mutual Life Insurance Company. |
| Thomas R. Hefty – 61 | | Director | | 3/27/95 | | Retired; from January 2007 to February 2008, President, Kern Family Foundation (private, grant-making organization); until December 2006, of counsel to the law firm Reinhart Boerner Van Deuren s.c., Milwaukee, WI; until December 2006, Adjunct Faculty, Department of Business and Economics, Ripon College. | | None. |
| Jeffrey A. Joerres – 48 | | Director | | 8/9/01 | | Chairman of the Board, President and Chief Executive Officer of Manpower Inc. (non-governmental employment service organization). | | Director, Johnson Controls, Inc. (manufacturer of automotive systems and building controls). |
| Patrick S. Pittard – 62 | | Director | | 8/9/01 | | Distinguished Executive in Residence (teaching position), University of Georgia. | | Director, Cbeyond, Inc. (telecommunications company); Director, Lincoln National Corporation (insurance and investment management company). |
| Howard B. Witt – 68 | | Director | | 3/27/95 | | Retired; until December 2004, Chairman of the Board, President and Chief Executive Officer of Littelfuse, Inc. (manufacturer of advanced circuit protection devices). | | Director, Franklin Electric Co., Inc. (manufacturer of electric motors). |
27
DIRECTORS AND OFFICERS
| | | | | | | | |
| | | | | |
Name and Age
at 11/14/08 | | Position(s)
Held with
Artisan Funds | | Date First Elected
or Appointed
to Office | | Principal Occupation(s)
during Past 5 Years | | Other Public Company
or Registered Investment
Company Directorships Held |
| Director who is an “interested person” of Artisan Funds: |
| Andrew A. Ziegler – 51* | | Director, President and Chief Executive Officer | | Director since 1/5/95 and Chairman of the Board 1/5/95 - 12/19/03; President since 12/19/03 (Chief Executive Officer continuously since 1/5/95) | | Managing Director of Artisan Partners; Chairman and President of Artisan Distributors LLC; until December 2003, Chairman of Artisan Funds. | | None. |
| Officers: |
| Lawrence A. Totsky – 49 | | Chief Financial Officer and Treasurer | | 1/22/98 | | Managing Director and Chief Financial Officer of Artisan Partners; Vice President, Chief Financial Officer and Treasurer of Artisan Distributors LLC. | | None. |
| Janet D. Olsen – 52 | | General Counsel and Secretary | | 1/18/01 | | Managing Director and General Counsel of Artisan Partners; Vice President and Secretary of Artisan Distributors LLC. | | None. |
| Brooke J. Billick – 54 | | Chief Compliance Officer | | 8/19/04 | | Chief Compliance Officer and Associate Counsel of Artisan Partners; Chief Compliance Officer of Artisan Distributors LLC; prior to joining Artisan Partners in February 2004, Vice President, Securities Counsel and Corporate Secretary of Marshall & Ilsley Trust Company, N.A. (bank) and M&I Investment Management Corp. (investment adviser) and Chief Legal Officer and Secretary of Marshall Funds, Inc. (mutual fund company). | | None. |
| Carlene M. Ziegler – 52 | | Vice President | | 3/27/95 | | Managing Director of Artisan Partners; until April 2008, Portfolio Co-Manager of Artisan small-cap growth strategy, including Artisan Small Cap Fund; until February 2005, Director of Artisan Funds. | | None. |
| Michael C. Roos – 50 | | Vice President | | 12/19/03 | | Managing Director of Artisan Partners; Vice President of Artisan Distributors LLC; until December 2003, President of Artisan Funds. | | None. |
| * | Mr. Ziegler is an “interested person” of Artisan Funds, as defined in the Investment Company Act of 1940, because he is a Managing Director of Artisan Partners and an officer and director of Artisan Investment Corporation (the general partner of Artisan Partners). Mr. Ziegler and Carlene M. Ziegler (who are married to each other) control Artisan Partners. Mr. Ziegler is also President of Artisan Distributors LLC, Artisan Funds’ principal underwriter. |
28
DIRECTORS AND OFFICERS
| | | | | | | | |
| | | | | |
Name and Age
at 11/14/08 | | Position(s)
Held with
Artisan Funds | | Date First Elected
or Appointed
to Office | | Principal Occupation(s)
during Past 5 Years | | Other Public Company
or Registered Investment
Company Directorships Held |
| Gregory K. Ramirez – 38 | | Assistant Secretary and Assistant Treasurer | | 1/22/98 | | Managing Director of Artisan Partners; Assistant Treasurer of Artisan Distributors LLC. | | None. |
| Sarah A. Johnson – 36 | | Assistant Secretary | | 2/5/03 | | Associate Counsel of Artisan Partners. | | None. |
The business address of the officers and directors affiliated with Artisan Partners is 875 E. Wisconsin Avenue, Suite 800, Milwaukee, Wisconsin 53202. The addresses of the other directors are: Mr. Erne – 1000 North Water Street, Suite 2100, Milwaukee, Wisconsin 53202; Mr. Joerres – 100 Manpower Place, Milwaukee, Wisconsin 53212; and Mr. Hefty, Mr. Pittard and Mr. Witt – c/o Artisan Funds, 875 E. Wisconsin Avenue, Suite 800, Milwaukee, Wisconsin 53202.
The Fund’s statement of additional information (SAI) contains further information about the directors. Please call 866.574.1770 for a free copy of the SAI.
29
| | | | |

| | ARTISAN FUNDS P.O. BOX 8412 BOSTON, MA 02266-8412 866.574.1770 | | |
(a) Registrant has adopted a code of ethics (the “Code”) that applies to its principal executive officer, principal financial officer and principal accounting officer (the “Covered Officers”).
(b) No disclosures are required pursuant to this Item 2(b).
(c) During the period covered by the report, registrant did not make any substantive amendments to the Code.
(d) During the period covered by the report, registrant did not grant any waivers, including implicit waivers, from the provisions of the Code.
(e) Not applicable.
(f) A copy of the Code is filed as Exhibit (a)(1) to this Form N-CSR.
| Item 3. | Audit Committee Financial Expert. |
Registrant’s board of directors has determined that Thomas R. Hefty, member and chairman of the registrant’s audit committee, qualifies as an “audit committee financial expert,” as such term is defined in Instruction 2(b) to Item 3 of Form N-CSR. Mr. Hefty is “independent” as such term is defined in paragraph (a)(2) of Item 3 of Form N-CSR.
Under applicable securities laws, a person who is determined to be an audit committee financial expert will not be deemed an “expert” for any purpose, including, without limitation, for the purposes of Section 11 of the Securities Act of 1933, as a result of being designated or identified as an audit committee financial expert. The designation or identification of a person as an audit committee financial expert does not impose on such person any duties, obligations, or liabilities that are greater than the duties, obligations, and liabilities imposed on such person as a member of the audit committee and board of directors in the absence of such designation or identification.
| Item 4. | Principal Accountant Fees and Services. |
Aggregate fees billed to the registrant for professional services rendered by the registrant’s principal accountant, Ernst & Young LLP, are summarized in the tables
below. The tables summarize fees billed (or to be billed) by the registrant’s principal accountant for work performed relating to each applicable period identified below.
Fees:
| | | | | | |
| | | Fiscal Year Ended
September 30, 2008 | | Fiscal Year Ended
September 30, 2007 |
Audit Fees (a) | | $ | 236,000 | | $ | 190,200 |
Audit-Related Fees (b) | | $ | 40,300 | | $ | 23,300 |
Tax Fees (c) | | $ | 182,550 | | $ | 154,150 |
All Other Fees (d) | | | — | | | — |
(a) “Audit Fees” include amounts for professional services rendered by the principal accountant for the audit of the registrant’s annual financial statements and services that are normally provided by the accountant in connection with statutory and regulatory filings or engagements, including for 2008, portions of which have not been billed at the time of this filing and fees billed for consents issued in conjunction with the registrant’s post-effective amendments to the Funds’ registration statements filed for each of the last two fiscal years.
(b) “Audit-Related Fees” include amounts for assurance and related services by the principal accountant that are reasonably related to the performance of the audit of the registrant’s financial statements. Audit-related fees have not been reported under the item “audit fees” in the chart above.
The fees billed by Ernst & Young LLP during the fiscal years ended September 30, 2008 and September 30, 2007 include fees incurred for services for review procedures performed in conjunction with the semiannual reports to shareholders as of March 31, 2008 and for certain agreed upon procedures performed in conjunction with the semiannual reports to shareholders as of March 31, 2007.
(c) “Tax Fees” include amounts for professional services rendered by the principal accountant for tax compliance, tax advice and tax planning.
The fees shown in the table above for the fiscal year ended September 30, 2008 include fees for (1) the review and preparation of the Funds’ income tax returns for the fiscal year ended September 30, 2008, which have not been billed as of the time of this filing; (2) the review of excise tax calculations and preparation of excise tax returns for the calendar year ended December 31, 2008, which also have not yet been billed as of the time of this filing; (3) the use of a PFIC database supplied by Ernst & Young LLP for the fiscal year ended September 30, 2007 and the excise year ended December 31, 2007; and (4) the use of a Qualified Foreign Corporation (QFC) Database supplied by Ernst & Young LLP for the calendar year ended December 31, 2007.
The fees shown in the table above for the fiscal year ended September 30, 2007 include fees for (1) the review and preparation of the Funds’ income tax returns for the fiscal year ended September 30, 2007; (2) the review of excise tax calculations and preparation of excise tax returns for the calendar year ended December 31, 2007; (3) the use of a PFIC database supplied by Ernst & Young LLP for the fiscal year ended September 30, 2006 and the excise year ended December 31, 2006; and (4) the use of a Qualified Foreign Corporation (QFC) Database supplied by Ernst & Young LLP for the calendar year ended December 31, 2006.
(d) None.
(e)(1) During its regularly scheduled periodic meetings, the registrant’s audit committee considers any requests to pre-approve any audit, audit-related, tax and other services to be provided by the principal accountants of the registrant. The audit committee has authorized its chairman to exercise that authority in the intervals between meetings; and the chairman presents any such pre-approvals to the audit committee at its next regularly scheduled meeting. Under paragraph (c)(7)(i)(C) of Rule 2-01 of Regulation S-X, pre-approval of non-audit services may be waived provided that: 1) the aggregate fees for all such services provided constitutes no more than five percent of the total amount of fees paid by the registrant to its principal accountant during the fiscal year in which services are provided, 2) such services were not recognized by the registrant at the time of engagement as non-audit services and 3) such services are promptly brought to the attention of the audit committee of the registrant and approved prior to the completion of the audit.
(e)(2) No services included in Items 4(b) – (d) above were approved pursuant to paragraph (c)(7)(i)(C) of Rule 2-01 of Regulation S-X.
(f) Less than 50 percent of the hours expended on the principal accountant’s engagement to audit the registrant’s financial statements for the most recent fiscal year were attributed to work performed by persons other than the principal accountant’s full-time, permanent employees.
(g) The aggregate fees for the fiscal years ended September 30, 2008 and September 30, 2007 by the registrant’s principal accountant for non-audit services rendered to the registrant are shown in the tables above and described under Items 4(b) – (d) above. For the registrant’s fiscal years ended September 30, 2008 and September 30, 2007, Ernst & Young LLP served as the registrant’s principal accountant and provided no services and billed no fees for non-audit services rendered to the registrant’s adviser or entities controlling, controlled by or under common control with the adviser.
(h) The audit committee of the registrant’s board of directors has considered whether the provision of non-audit services that were rendered to the registrant’s investment adviser, and any entity controlling, controlled by or under common control with the investment adviser that provides ongoing services to the registrant that were not pre-approved pursuant to paragraph (c)(7)(ii) of Rule 2-01 of Regulation S-X is compatible with
maintaining the principal accountant’s independence. The provisions of Rule 2-01(c)(7) were effective on May 6, 2003. No such services were rendered on or after May 6, 2003.
| Item 5. | Audit Committee of Listed Registrants. |
Not applicable.
| Item 6. | Schedule of Investments. |
The Schedule of Investments in securities of unaffiliated issuers as of September 30, 2008 is included as part of the annual reports to shareholders filed under Item 1 of this Form N-CSR.
| Item 7. | Disclosure of Proxy Voting Policies and Procedures for Closed-End Management Investment Companies. |
Not applicable.
| Item 8. | Portfolio Managers of Closed-End Management Investment Companies. |
Not applicable.
| Item 9. | Purchases of Equity Securities by Closed-End Management Investment Company and Affiliated Purchasers. |
Not applicable.
| Item 10. | Submission of Matters to a Vote of Security Holders. |
The registrant has a governance and nominating committee, which is responsible for selecting and nominating persons for election or appointment as members of registrant’s board of directors. At a meeting of the committee held on August 19, 2004, the committee adopted guidelines by which the committee, which is comprised entirely of independent directors, will consider any candidates for board membership (whether recommended by a shareholder, the committee, the board of directors or management personnel). The procedures were disclosed in response to Item 9 of Form N-CSR filed by the registrant on November 30, 2004. At a meeting of the committee held on February 8, 2007, the committee revised the guidelines to include the consideration of the effect of the registrant’s retirement policy on the potential length of service of any candidate.
| Item 11. | Controls and Procedures. |
(a) The registrant’s principal executive and principal financial officers have concluded, based on an evaluation of the registrant’s disclosure controls and procedures (as defined in Rule 30a-3(c) under the Investment Company Act of 1940, the “Disclosure Controls”) as of a date within 90 days prior to the filing date (the “Filing Date”) of this Form N-CSR
(the “Report”), the Disclosure Controls are effectively designed to ensure that information required to be disclosed by the registrant in the Report is recorded, processed, summarized and reported by the Filing Date, including ensuring that information required to be disclosed in the Report is accumulated and communicated to the registrant’s management, including the registrant’s principal executive officer and principal financial officer, as appropriate to allow timely decisions regarding required disclosure.
(b) There were no changes in the registrant’s internal controls over financial reporting (as defined in Rule 30a-3(d) under the Investment Company Act of 1940) that occurred during the registrant’s most recent fiscal year that have materially affected, or are reasonably likely to materially affect, the registrant’s internal control over financial reporting.
| | | | |
| (a) | | (1) | | Code of Ethics for Principal Executive Officer, Principal Financial Officer and Principal Accounting Officer (as referenced in Item 2 above), attached hereto as Exhibit (a)(1) |
| | |
| | (2) | | Certifications of Andrew A. Ziegler, Principal Executive Officer and Lawrence A. Totsky, Principal Financial Officer pursuant to Rule 30a-2(a) under the Investment Company Act of 1940 (17 CFR 270.30a-2(a)), attached hereto as Exhibits (a)(2)(i) and (a)(2)(ii) |
| | |
| (b) | | | | Certification of Andrew A. Ziegler, Principal Executive Officer and Lawrence A. Totsky, Principal Financial Officer pursuant to Section 906 of the Sarbanes-Oxley Act of 2002, attached hereto as Exhibit (b) |
SIGNATURES
Pursuant to the requirements of the Securities Exchange Act of 1934 and the Investment Company Act of 1940, the registrant has duly caused this report to be signed on its behalf by the undersigned, thereunto duly authorized.
| | |
| Artisan Funds, Inc. |
| |
| By: | | /s/ Andrew A. Ziegler |
| | Andrew A. Ziegler |
| | Principal Executive Officer |
| |
| Date: | | December 5, 2008 |
Pursuant to the requirements of the Securities Exchange Act of 1934 and the Investment Company Act of 1940, this report has been signed below by the following persons on behalf of the registrant and in the capacities and on the dates indicated.
| | |
| |
| By: | | /s/ Andrew A. Ziegler |
| | Andrew A. Ziegler |
| | Principal Executive Officer |
| |
| Date: | | December 5, 2008 |
| | |
| |
| By: | | /s/ Lawrence A. Totsky |
| | Lawrence A. Totsky |
| | Principal Financial Officer |
| |
| Date: | | December 5, 2008 |