Item 2. Code of Ethics.
(a) Registrant has adopted a code of ethics (the “Code”) that applies to its principal executive officer, principal financial officer and principal accounting officer (the “Covered Officers”).
(b) No disclosures are required pursuant to this Item 2(b).
(c) During the period covered by the report, registrant did not make any amendments to the Code.
(d) During the period covered by the report, registrant did not grant any waivers, including implicit waivers, from the provisions of the Code.
(e) Not applicable.
(f) A copy of the Code is filed as Exhibit (a)(1) to this Form N-CSR.
Item 3. Audit Committee Financial Expert.
Registrant’s board of directors has determined that Gail L. Hanson, member of the registrant’s audit committee, William J. Kelly, member of the registrant’s audit committee, Peter M. Lebovitz, member of the registrant’s audit committee, and Bonnie L. Howard, member and chair of the registrant’s audit committee, each qualify as an audit committee financial expert, as such term is defined in Instruction 2(b) to Item 3 of Form N-CSR. Ms. Hanson, Mr. Kelly, Mr. Lebovitz and Ms. Howard are “independent” as such term is defined in paragraph (a)(2) of Item 3 of Form N-CSR.
Under applicable securities laws, a person who is determined to be an audit committee financial expert will not be deemed an “expert” for any purpose, including, without limitation, for the purposes of Section 11 of the Securities Act of 1933, as a result of being designated or identified as an audit committee financial expert. The designation or identification of a person as an audit committee financial expert does not impose on such person any duties, obligations, or liabilities that are greater than the duties, obligations, and liabilities imposed on such person as a member of the audit committee and board of directors in the absence of such designation or identification.
Item 4. Principal Accountant Fees and Services.
Aggregate fees billed to the Corporation for professional services rendered by Ernst & Young for the 2023 and 2022 fiscal years of the Corporation are summarized in the table below. The table summarizes fees billed (or to be billed) by Ernst & Young for work performed relating to each applicable period identified below.
Fees:
| | | | | | | | |
| | | Fiscal Year Ended
September 30, 2024 | | | Fiscal Year Ended
September 30, 2023 | |
| Audit Fees (a) | | $ | 754,200 | | | $ | 649,319 | |
| Audit-Related Fees (b) | | $ | — | | | $ | — | |
| Tax Fees (c) | | $ | 698,924 | | | $ | 535,410 | |
| All Other Fees (d) | | | — | | | | — | |
(a) “Audit Fees” include amounts for professional services rendered by Ernst & Young for the audit of the Corporation’s annual financial statements and services that are normally provided by Ernst & Young in connection with statutory and regulatory filings or engagements, including for 2024, portions of which had not been billed as of September 30, 2024.
(b) “Audit-Related Fees” include amounts for assurance and related services by Ernst & Young that are reasonably related to the performance of the audit of the Corporation’s financial statements. Audit-related fees have not been reported under the item “audit fees” in the chart above.
(c) “Tax Fees” include amounts for professional services rendered by Ernst & Young for tax compliance, tax advice and tax planning.
The fees shown in the table above for the fiscal year ended September 30, 2024 include fees for (1) the review and preparation of the Funds’ income tax returns for the fiscal year ended September 30, 2024, which had not been billed as of September 30, 2024; (2) the review of excise tax calculations and preparation of excise tax returns for the calendar year ended December 31, 2024, which also had not been billed as of September 30, 2024; (3) the use of a PFIC database supplied by Ernst & Young for the fiscal year ended September 30, 2022, the excise year ended December 31, 2022 and the semiannual period ended March 31, 2024; the use of a Global Withholding Tax Reporter Database, AIS Content and RS Analyzer supplied by Ernst & Young for the fiscal year ended September 30, 2024; and EU reclaim filing fees.
The fees shown in the table above for the fiscal year ended September 30, 2023 include fees for (1) the review and preparation of the Funds’ income tax returns for the fiscal year ended September 30, 2023, which had not been billed as of September 30, 2023; (2) the review of excise tax calculations and preparation of excise tax returns for the calendar year ended December 31, 2023, which also had not been billed as of September 30, 2023; (3) the use of a PFIC database supplied by Ernst & Young for the fiscal year ended September 30, 2023, the excise year ended December 31, 2022 and the semiannual period ended March 31, 2023; the use of a Global Withholding Tax Reporter Database, AIS Content and RS Analyzer supplied by Ernst & Young for the fiscal year ended September 30, 2023; and EU reclaim filing fees.
(d) None.
(e)(1) During its regularly scheduled periodic meetings, the registrant’s audit committee considers any requests to pre-approve any audit, audit-related, tax and other services to be provided by the principal accountants of the registrant. The audit committee has authorized its chair to exercise that authority in the intervals between meetings; and the chair presents any such pre-approvals to the audit committee at its next regularly scheduled meeting. Under paragraph (c)(7)(i)(C) of Rule 2-01 of SEC Regulation S-X, pre-approval of non-audit services may be waived provided that: 1) the aggregate fees for all such services provided constitutes no more than five percent of the total amount of fees paid by the registrant to its principal accountant during the fiscal year in which services are provided, 2) such services were not recognized by the registrant at the time of engagement as non-audit services and 3) such services are promptly brought to the attention of the audit committee of the registrant and approved prior to the completion of the audit.
(e)(2) No services included in Items 4(b) – (d) above were approved pursuant to paragraph (c)(7)(i)(C) of Rule 2-01 of Regulation S-X.
(f) Not applicable.
(g) The aggregate fees for the fiscal years ended September 30, 2024 and September 30, 2023 by the registrant’s principal accountant for non-audit services rendered to the registrant are shown in the tables above and described under Items 4(b) – (d) above. For the registrant’s fiscal years ended September 30, 2024 and September 30, 2023, Ernst & Young LLP served as the registrant’s principal accountant and provided no services and billed no fees for non-audit services rendered to the registrant’s adviser or entities controlling, controlled by or under common control with the adviser that provides ongoing services to the registrant.
(h) The audit committee of the registrant’s board of directors has considered whether the provision of non-audit services that were rendered to the registrant’s investment adviser, and any entity controlling, controlled by or under common control with the investment adviser that provides ongoing services to the registrant that were not pre-approved pursuant to paragraph (c)(7)(ii) of Rule 2-01 of Regulation S-X is compatible with maintaining the principal accountant’s independence. The provisions of Rule 2-01(c)(7) were effective on May 6, 2003. No such services were rendered on or after May 6, 2003.
Item 5. Audit Committee of Listed Registrants.
Not applicable.
Item 6. Investments.
(a) Please see schedule of investments contained in the Financial Statements included under Item 7 of this Form N-CSR.
(b) Not applicable.
Item 7. Financial Statements and Financial Highlights for Open-End Management Investment Companies
(a) The registrant’s Financial Statements are attached herewith.
(b) The registrant’s Financial Highlights are attached herewith.

ARTISAN PARTNERS FUNDS
| | | Share Class | |
| | Investor | Advisor | Institutional |
| Artisan Developing World Fund | ARTYX | APDYX | APHYX |
| Artisan Emerging Markets Debt Opportunities Fund | APFOX | APDOX | APHOX |
| Artisan Floating Rate Fund | ARTUX | APDUX | APHUX |
| Artisan Focus Fund | ARTTX | APDTX | APHTX |
| Artisan Global Discovery Fund | APFDX | APDDX | APHDX |
| Artisan Global Equity Fund | ARTHX | APDHX | APHHX |
| Artisan Global Opportunities Fund | ARTRX | APDRX | APHRX |
| Artisan Global Unconstrained Fund | APFPX | APDPX | APHPX |
| Artisan Global Value Fund | ARTGX | APDGX | APHGX |
| Artisan High Income Fund | ARTFX | APDFX | APHFX |
| Artisan International Fund | ARTIX | APDIX | APHIX |
| Artisan International Explorer Fund | N/A | ARDBX | ARHBX |
| Artisan International Small-Mid Fund | ARTJX | APDJX | APHJX |
| Artisan International Value Fund | ARTKX | APDKX | APHKX |
| Artisan Mid Cap Fund | ARTMX | APDMX | APHMX |
| Artisan Mid Cap Value Fund | ARTQX | APDQX | APHQX |
| Artisan Select Equity Fund | ARTNX | APDNX | APHNX |
| Artisan Small Cap Fund | ARTSX | APDSX | APHSX |
| Artisan Sustainable Emerging Markets Fund | ARTZX | APDEX | APHEX |
| Artisan Value Fund | ARTLX | APDLX | APHLX |
| Artisan Value Income Fund | APFWX | APDWX | APHWX |
The information contained herein includes the financial statements and certain other information as required by Items 7-11 of Form N-CSR.
| | ITEM 7 FINANCIAL STATEMENTS AND FINANCIAL HIGHLIGHTS | |
| | |
ARTISAN PARTNERS FUNDS, INC
DEFINITIONS OF ABBREVIATIONS AND FOOTNOTES
Schedules of Investments
Investment Footnotes
| * | Non-income producing security. |
| # | Percentages for the various classifications relate to total net assets. |
| ^ | Amount rounds to less than $1 or 0.1% or 1 share. |
| ‡ | One contract is equal to 100 shares. |
Company names are as reported by a data service provider and in some cases are translations; a company’s legal name may be different.
Investment Abbreviations
| ADR | American Depositary Receipt |
| BOA | Bank of America |
| BUBOR | Budapest Interbank Offered Rate |
| CGM | Citigroup Global Markets |
| CITI | Citibank, N.A. |
| CAONREPO | Canadian Overnight Repo Rate |
| DB | Deutsche Bank AG |
| GDR | Global Depositary Receipt |
| GS | Goldman Sachs International |
| ICBCSB | ICBC Standard Bank Plc |
| IO | Interest Only |
| JIBAR | Johannesburg Interbank Average Rate |
| JPM | JPMorganChase Bank, N.A. |
| KLIBOR | Kuala Lumpur Interbank Offered Rate |
| MIBOR | Mumbai Interbank Offered Rate |
| MS | Morgan Stanley & Co International plc |
| OMO | Open Market Operation |
| OTC | Over-the-Counter |
| PIK | Payment-In-Kind |
| Preference | A special type of equity investment that shares in the earnings of the company and may have a dividend preference. Preference shares may also have liquidation preference. |
| PRIBOR | Prague Interbank Offered Rate |
| REIT | Real Estate Investment Trust |
| SCB | Standard Chartered Bank |
| SG | Societe Generale |
| SOFR | Secured Overnight Financing Rate |
| TDB | Toronto Dominion Bank |
| TELBOR | Tel Aviv Interbank Offered Rate |
| TIIE | Mexican Interbank Equilibrium Interest Rate |
| THOR | Thai Overnight Repurchase Rate |
| TONAR | Tokyo Overnight Average Rate |
| WIBOR | Warsaw Interbank Offer Rate |
Currency Abbreviations
| ALL | Albanian lek |
| AMD | Armenian dram |
| BRL | Brazilian real |
| CAD | Canadian dollar |
| CNH | Chinese yuan |
| COP | Colombian peso |
| CZK | Czech koruna |
| DOP | Dominican peso |
| EGP | Egyptian pound |
| EUR | Euro |
| GBP | British pound |
| GEL | Georgian lari |
| GTQ | Guatemala quetzal |
| HKD | Hong Kong dollar |
| HUF | Hungarian forint |
| IDR | Indonesian rupiah |
| ILS | Israel new shekel |
| INR | Indian rupee |
| ISK | Iceland krona |
| JMD | Jamaica dollar |
| JPY | Japanese yen |
| KES | Kenyan shilling |
| KRW | Korean won |
| KZT | Kazakhstan tenge |
| MXN | Mexican peso |
| MYR | Malaysia ringgit |
| NGN | Nigerian naira |
| PEN | Peru nuevo sol |
| PLN | Polish zloty |
| PYG | Paraguay guarani |
| RSD | Serbian dinar |
| THB | Thailand baht |
| TJS | Tajikistani somoni |
| TRY | Turkish Lira |
| TWD | New Taiwan dollar |
| USD | U.S. dollar |
| UZS | Uzbekistani som |
| ZAR | South African rand |
ARTISAN DEVELOPING WORLD FUND
Schedule of Investments — September 30, 2024
Principal amount, shares and dollar values in thousands
| | | Shares
Held | | Value |
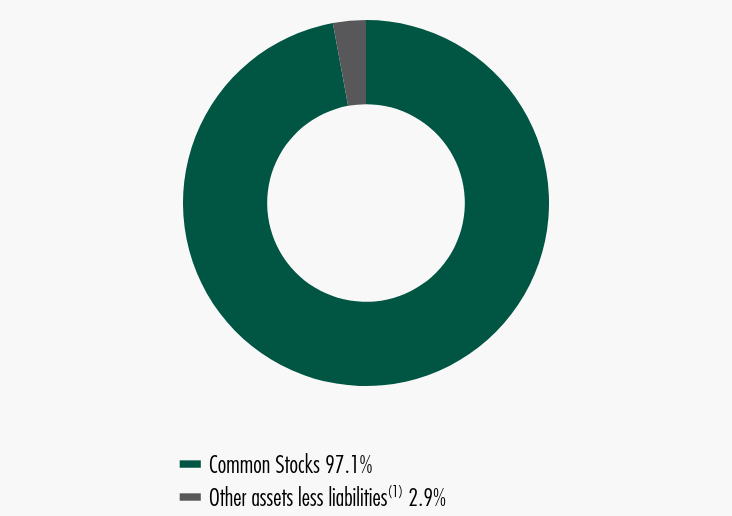
| COMMON STOCKS - 97.2% | | | | | | | | |
| | | | | | | | | |
| AUSTRALIA - 1.7% | | | | | | | | |
| WiseTech Global Ltd. | | | 661 | | | $ | 62,660 | |
| | | | | | | | | |
| BRAZIL - 9.4% | | | | | | | | |
| MercadoLibre, Inc.* | | | 96 | | | | 196,434 | |
| NU Holdings Ltd., Class A* | | | 10,306 | | | | 140,681 | |
| | | | | | | | 337,115 | |
| CHINA - 18.6% | | | | | | | | |
| Kanzhun Ltd., ADR | | | 4,287 | | | | 74,418 | |
| KE Holdings, Inc., ADR | | | 3,694 | | | | 73,550 | |
| Kweichow Moutai Co. Ltd., Class A | | | 368 | | | | 91,657 | |
| Meituan, Class B(1)* | | | 7,794 | | | | 172,438 | |
| PDD Holdings, Inc., ADR* | | | 512 | | | | 69,054 | |
| Shenzhen Mindray Bio-Medical Electronics Co. Ltd., Class A | | | 1,596 | | | | 66,649 | |
| Tencent Holdings Ltd. | | | 2,137 | | | | 122,215 | |
| | | | | | | | 669,981 | |
| FRANCE - 4.1% | | | | | | | | |
| Hermes International SCA | | | 17 | | | | 42,072 | |
| LVMH Moet Hennessy Louis Vuitton SE | | | 140 | | | | 107,355 | |
| | | | | | | | 149,427 | |
| INDIA - 14.0% | | | | | | | | |
| Apollo Hospitals Enterprise Ltd. | | | 978 | | | | 84,046 | |
| HDFC Bank Ltd., ADR | | | 1,712 | | | | 107,091 | |
| MakeMyTrip Ltd.* | | | 1,911 | | | | 177,647 | |
| One 97 Communications Ltd.* | | | 3,822 | | | | 31,392 | |
| PB Fintech Ltd.* | | | 1,745 | | | | 33,739 | |
| Zomato Ltd.* | | | 22,241 | | | | 72,534 | |
| | | | | | | | 506,449 | |
| NETHERLANDS - 7.2% | | | | | | | | |
| Adyen NV(1)* | | | 103 | | | | 160,578 | |
| ASML Holding NV, ADR | | | 121 | | | | 100,507 | |
| | | | | | | | 261,085 | |
| SINGAPORE - 9.6% | | | | | | | | |
| Grab Holdings Ltd., Class A* | | | 33,179 | | | | 126,080 | |
| Sea Ltd., ADR* | | | 2,321 | | | | 218,849 | |
| | | | | | | | 344,929 | |
| UNITED STATES - 32.6% | | | | | | | | |
| Airbnb, Inc., Class A* | | | 1,211 | | | | 153,589 | |
| Cadence Design Systems, Inc.* | | | 416 | | | | 112,654 | |
| Coca-Cola Co. (The) | | | 1,581 | | | | 113,581 | |
| Crowdstrike Holdings, Inc., Class A* | | | 594 | | | | 166,609 | |
| Mastercard, Inc., Class A | | | 83 | | | | 41,031 | |
| Netflix, Inc.* | | | 146 | | | | 103,547 | |
| NVIDIA Corp. | | | 1,221 | | | | 148,277 | |
| Snowflake, Inc., Class A* | | | 555 | | | | 63,803 | |
| Veeva Systems, Inc., Class A* | | | 537 | | | | 112,656 | |
| Visa, Inc., Class A | | | 578 | | | | 158,839 | |
| | | | | | | | 1,174,586 | |
| Total common stocks | | | | | | | | |
| (Cost $1,873,410) | | | | | | | 3,506,232 | |
| | | | | | | | | |
| SHORT-TERM INVESTMENT - 2.2% | | | | | | | | |
| | | | | | | | | |
| INVESTMENT COMPANY - 2.2% | | | | | | | | |
| BlackRock Liquidity Funds Treasury Trust Fund - Institutional Class, 4.85%(2) (Cost $80,325) | | | 80,325 | | | | 80,325 | |
| | | Shares
Held | | Value |
| Total investments - 99.4% | | | | | | | | |
| (Cost $1,953,735) | | | | | | $ | 3,586,557 | |
| | | | | | | | | |
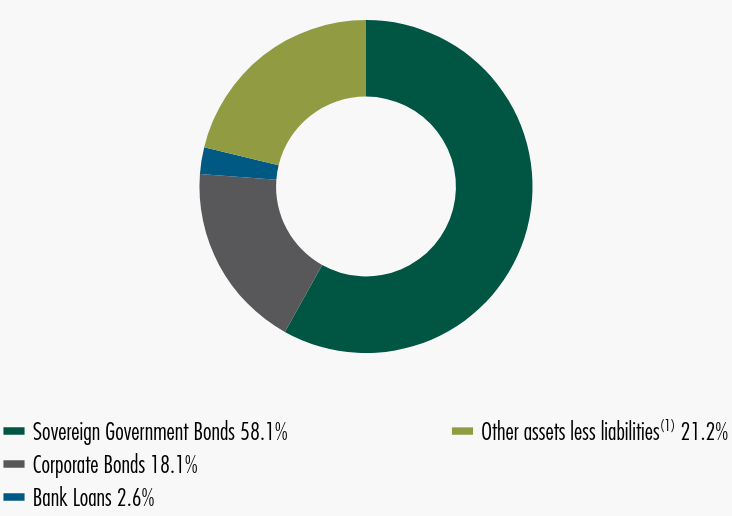
| Other assets less liabilities - 0.6% | | | | | | | 21,158 | |
| | | | | | | | | |
| Total net assets - 100.0%# | | | | | | $ | 3,607,715 | |
| (1) | Regulation S is an exemption for securities offerings that are made outside of the United States and do not involve direct selling efforts in the United States. Resale restrictions may apply for purposes of the Securities Act of 1933. At September 30, 2024, the value of these securities was $333,016 or 9.2% of net assets. |
| (2) | Represents the current yield as of September 30, 2024. |
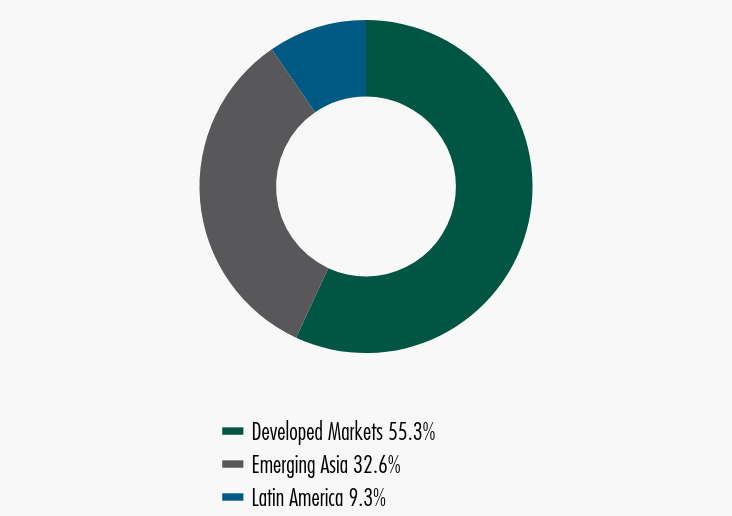
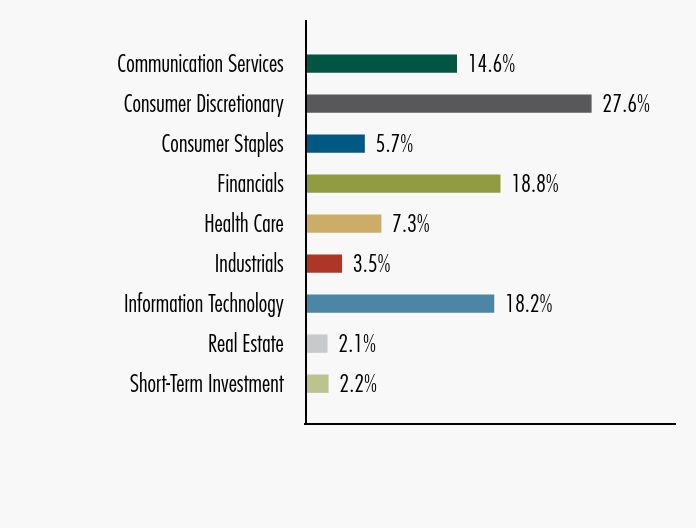
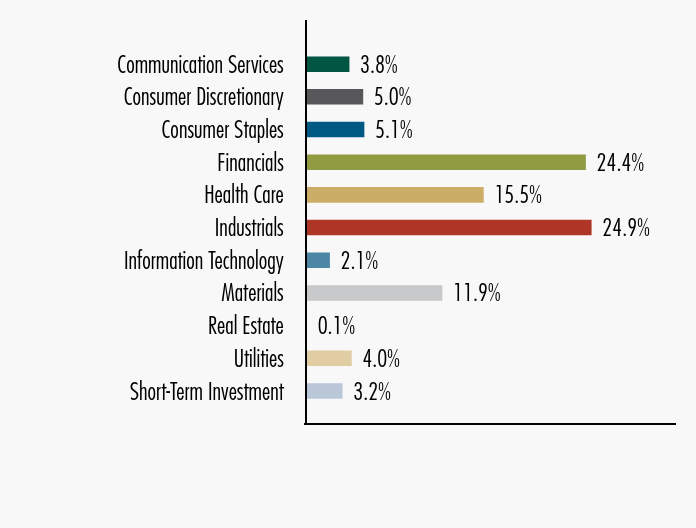
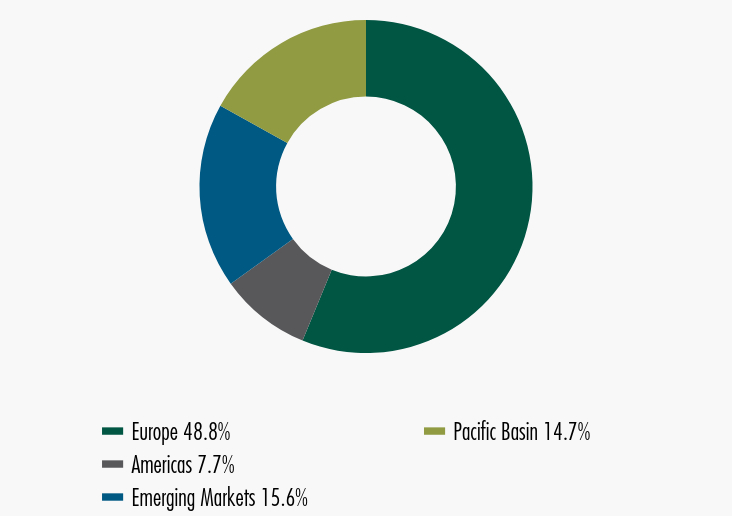
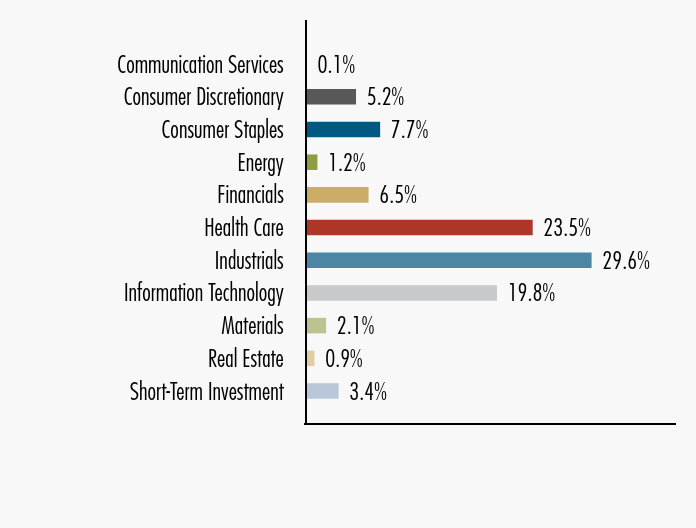
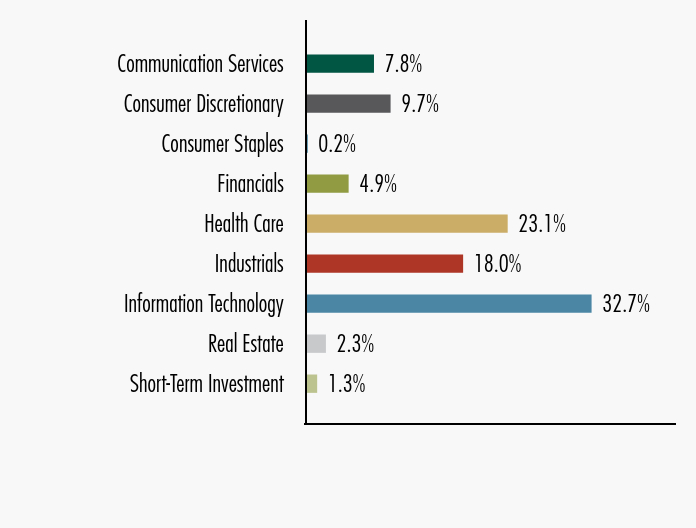
PORTFOLIO DIVERSIFICATION
Dollar values in thousands
| | | Value | | Percentage of
Total Investments |
| Communication Services | | $ | 519,029 | | | | 14.6 | % |
| Consumer Discretionary | | | 991,123 | | | | 27.6 | |
| Consumer Staples | | | 205,238 | | | | 5.7 | |
| Financials | | | 673,351 | | | | 18.8 | |
| Health Care | | | 263,351 | | | | 7.3 | |
| Industrials | | | 126,080 | | | | 3.5 | |
| Information Technology | | | 654,510 | | | | 18.2 | |
| Real Estate | | | 73,550 | | | | 2.1 | |
| Short-Term Investment | | | 80,325 | | | | 2.2 | |
| Total investments | | $ | 3,586,557 | | | | 100.0 | % |
Definitions of abbreviations and footnotes are detailed on page 2-3.
The accompanying notes are an integral part of the financial statements.
ARTISAN EMERGING MARKETS DEBT OPPORTUNITIES FUND
Consolidated Schedule of Investments — September 30, 2024
Principal amount, shares and dollar values in thousands and reported in USD unless otherwise stated
| | | | | | Principal
Amount | | Value |
| SOVEREIGN GOVERNMENT BONDS AND | | | | | | | | | | | |
| CREDIT-LINKED NOTES - 58.1% | | | | | | | | | | | |
| | | | | | | | | | | | |
| ALBANIA - 2.1% | | | | | | | | | | | |
| Albanian Government Bond | | | | | | | | | | | |
| 4.21%, 1/15/2026 | | ALL | | | | 14,000 | | | $ | 159 | |
| 5.00%, 2/24/2026 | | ALL | | | | 13,000 | | | | 149 | |
| 6.00%, 2/13/2028 | | ALL | | | | 9,500 | | | | 113 | |
| 5.25%, 1/26/2029 | | ALL | | | | 21,500 | | | | 249 | |
| 5.63%, 11/8/2030 | | ALL | | | | 19,000 | | | | 224 | |
| Republic of Albania | | | | | | | | | | | |
| 5.90%, 6/9/2028(1) | | EUR | | | | 620 | | | | 722 | |
| | | | | | | | | | | 1,616 | |
| ANGOLA - 1.4% | | | | | | | | | | | |
| Republic of Angola | | | | | | | | | | | |
| 6.93%, 2/19/2027(1) | | | | | | 104 | | | | 101 | |
| 8.25%, 5/9/2028(1) | | | | | | 550 | | | | 522 | |
| 9.13%, 11/26/2049(1) | | | | | | 550 | | | | 455 | |
| | | | | | | | | | | 1,078 | |
| ARMENIA - 0.2% | | | | | | | | | | | |
| Republic of Armenia | | | | | | | | | | | |
| 9.25%, 4/29/2028 | | AMD | | | | 70,000 | | | | 178 | |
| | | | | | | | | | | | |
| BAHAMAS - 5.6% | | | | | | | | | | | |
| Commonwealth of the Bahamas | | | | | | | | | | | |
| 6.00%, 11/21/2028(1) | | | | | | 2,145 | | | | 2,011 | |
| 9.00%, 6/16/2029(1) | | | | | | 420 | | | | 433 | |
| 6.95%, 11/20/2029(1) | | | | | | 253 | | | | 238 | |
| 8.95%, 10/15/2032(1) | | | | | | 1,530 | | | | 1,558 | |
| | | | | | | | | | | 4,240 | |
| BENIN - 3.6% | | | | | | | | | | | |
| Benin Government Bond | | | | | | | | | | | |
| 4.88%, 1/19/2032(1) | | EUR | | | | 1,880 | | | | 1,867 | |
| 4.95%, 1/22/2035(1) | | EUR | | | | 370 | | | | 345 | |
| 6.88%, 1/19/2052(1) | | EUR | | | | 515 | | | | 479 | |
| | | | | | | | | | | 2,691 | |
| CAMEROON - 2.4% | | | | | | | | | | | |
| Republic of Cameroon | | | | | | | | | | | |
| 9.50%, 11/19/2025(1) | | | | | | 920 | | | | 919 | |
| 5.95%, 7/7/2032(1) | | EUR | | | | 1,005 | | | | 906 | |
| | | | | | | | | | | 1,825 | |
| DOMINICAN REPUBLIC - 0.0%^ | | | | | | | | | | | |
| Dominican Republic Government Bond | | | | | | | | | | | |
| 6.50%, 11/27/2026(1) | | DOP | | | | 1,450 | | | | 22 | |
| | | | | | | | | | | | |
| EGYPT - 1.0% | | | | | | | | | | | |
| Arab Republic of Egypt | | | | | | | | | | | |
| 7.50%, 2/16/2061(1) | | | | | | 1,000 | | | | 723 | |
| | | | | | | | | | | | |
| EL SALVADOR - 0.0%^ | | | | | | | | | | | |
| Republic of El Salvador | | | | | | | | | | | |
| 0.25%, 4/17/2030 IO(1) | | | | | | 726 | | | | 15 | |
| | | | | | | | | | | | |
| GABON - 1.5% | | | | | | | | | | | |
| Gabonese Republic | | | | | | | | | | | |
| 6.95%, 6/16/2025(1) | | | | | | 1,200 | | | | 1,126 | |
| | | | | | | | | | | | |
| GEORGIA - 1.0% | | | | | | | | | | | |
| Republic of Georgia | | | | | | | | | | | |
| 2.75%, 4/22/2026(1) | | | | | | 780 | | | | 738 | |
| | | | | | Principal
Amount | | Value |
| INDIA - 1.9% | | | | | | | | | |
| Asian Infrastructure Investment Bank (The) | | | | | | | | | | | |
| 7.00%, 3/1/2029(1) | | INR | | | | 76,000 | | | $ | 913 | |
| International Bank for Reconstruction & Development | | | | | | | | | | | |
| 6.50%, 4/17/2030 | | INR | | | | 45,000 | | | | 530 | |
| | | | | | | | | | | 1,443 | |
| INDONESIA - 6.8% | | | | | | | | | | | |
| Republic of Indonesia | | | | | | | | | | | |
| 6.38%, 4/15/2032 | | IDR | | | | 4,100,000 | | | | 270 | |
| 7.50%, 8/15/2032 | | IDR | | | | 4,500,000 | | | | 315 | |
| 6.63%, 2/15/2034 | | IDR | | | | 17,000,000 | | | | 1,136 | |
| 8.25%, 5/15/2036 | | IDR | | | | 9,854,000 | | | | 737 | |
| 7.13%, 6/15/2042 | | IDR | | | | 25,000,000 | | | | 1,715 | |
| 7.13%, 6/15/2043 | | IDR | | | | 13,985,000 | | | | 955 | |
| | | | | | | | | | | 5,128 | |
| IRAQ - 3.9% | | | | | | | | | | | |
| Republic of Iraq | | | | | | | | | | | |
| 5.80%, 1/15/2028(1) | | | | | | 3,065 | | | | 2,970 | |
| | | | | | | | | | | | |
| IVORY COAST - 2.7% | | | | | | | | | | | |
| Republic of Cote d’Ivoire | | | | | | | | | | | |
| 5.25%, 3/22/2030(1) | | EUR | | | | 845 | | | | 896 | |
| 6.88%, 10/17/2040(1) | | EUR | | | | 1,170 | | | | 1,149 | |
| | | | | | | | | | | 2,045 | |
| JAMAICA - 0.7% | | | | | | | | | | | |
| Jamaica Government Bond | | | | | | | | | | | |
| 9.63%, 11/3/2030 | | JMD | | | | 79,000 | | | | 532 | |
| | | | | | | | | | | | |
| NIGERIA - 0.9% | | | | | | | | | | | |
| Federal Republic of Nigeria | | | | | | | | | | | |
| 7.63%, 11/21/2025(1) | | | | | | 716 | | | | 716 | |
| | | | | | | | | | | | |
| PAKISTAN - 1.7% | | | | | | | | | | | |
| Islamic Republic of Pakistan | | | | | | | | | | | |
| 6.88%, 12/5/2027(1) | | | | | | 470 | | | | 427 | |
| 7.38%, 4/8/2031(1) | | | | | | 1,040 | | | | 881 | |
| | | | | | | | | | | 1,308 | |
| PAPUA NEW GUINEA - 2.0% | | | | | | | | | | | |
| Papua New Guinea Government International Bond | | | | | | | | | | | |
| 8.38%, 10/4/2028(1) | | | | | | 1,525 | | | | 1,487 | |
| | | | | | | | | | | | |
| PARAGUAY - 2.0% | | | | | | | | | | | |
| Paraguay Treasury Credit-Linked Note | | | | | | | | | | | |
| 9.03%, 2/15/2030(2)(3)(4) | | | | | | 654 | | | | 621 | |
| 8.00%, 3/3/2036(2)(3)(4) | | | | | | 211 | | | | 196 | |
| Republic of Paraguay | | | | | | | | | | | |
| 7.90%, 2/9/2031(1) | | PYG | | | | 5,045,000 | | | | 659 | |
| | | | | | | | | | | 1,476 | |
| PERU - 6.5% | | | | | | | | | | | |
| Bonos de la Tesoreria | | | | | | | | | | | |
| 7.30%, 8/12/2033(1) | | PEN | | | | 2,200 | | | | 642 | |
| 5.40%, 8/12/2034 | | PEN | | | | 16,960 | | | | 4,295 | |
| | | | | | | | | | | 4,937 | |
| RWANDA - 0.7% | | | | | | | | | | | |
| Republic of Rwanda | | | | | | | | | | | |
| 5.50%, 8/9/2031(1) | | | | | | 650 | | | | 537 | |
| | | | | | Principal
Amount | | Value |
| SOUTH AFRICA - 1.5% | | | | | | | | | | | |
| Republic of South Africa | | | | | | | | | | | |
| 8.25%, 3/31/2032 | | ZAR | | | | 20,800 | | | $ | 1,127 | |
| | | | | | | | | | | | |
| SURINAME - 1.6% | | | | | | | | | | | |
| Suriname Government International Bond | | | | | | | | | | | |
| 4.95% Cash, 3.00% PIK, 7/15/2033(1) | | | | | | 1,237 | | | | 1,188 | |
| | | | | | | | | | | | |
| TAJIKISTAN - 1.5% | | | | | | | | | | | |
| Republic of Tajikistan | | | | | | | | | | | |
| 7.13%, 9/14/2027(1) | | | | | | 1,140 | | | | 1,118 | |
| | | | | | | | | | | | |
| TUNISIA - 2.0% | | | | | | | | | | | |
| Tunisian Republic | | | | | | | | | | | |
| 5.75%, 1/30/2025(1) | | | | | | 740 | | | | 717 | |
| 6.38%, 7/15/2026(1) | | EUR | | | | 755 | | | | 759 | |
| | | | | | | | | | | 1,476 | |
| UZBEKISTAN - 0.5% | | | | | | | | | | | |
| Republic of Uzbekistan International Bond | | | | | | | | | | | |
| 5.38%, 5/29/2027(1) | | EUR | | | | 330 | | | | 370 | |
| | | | | | | | | | | | |
| ZAMBIA - 2.4% | | | | | | | | | | | |
| Republic of Zambia | | | | | | | | | | | |
| 5.75%, 6/30/2033(1)(5) | | | | | | 1,462 | | | | 1,288 | |
| 0.50%, 12/31/2053(1) | | | | | | 1,031 | | | | 507 | |
| | | | | | | | | | | 1,795 | |
| Total Sovereign government bonds and credit-linked notes | | | | | | | | | | | |
| (Cost $41,848) | | | | | | | | | | 43,905 | |
| | | | | | | | | | | | |
| CORPORATE BONDS - 18.1% | | | | | | | | | | | |
| BRAZIL - 3.2% | | | | | | | | | | | |
| Karoon USA Finance, Inc. | | | | | | | | | | | |
| 10.50%, 5/14/2029(1) | | | | | | 650 | | | | 668 | |
| MC Brazil Downstream Trading SARL | | | | | | | | | | | |
| 7.25%, 6/30/2031(1) | | | | | | 842 | | | | 721 | |
| OHI Group SA | | | | | | | | | | | |
| 13.00%, 7/22/2029(1) | | | | | | 610 | | | | 607 | |
| Trident Energy Finance plc | | | | | | | | | | | |
| 12.50%, 11/30/2029(1) | | | | | | 350 | | | | 368 | |
| Unigel Luxembourg SA | | | | | | | | | | | |
| 8.75%, 10/1/2026(1)(6) | | | | | | 253 | | | | 63 | |
| | | | | | | | | | | 2,427 | |
| CAMEROON - 1.1% | | | | | | | | | | | |
| Golar LNG Ltd. | | | | | | | | | | | |
| 7.75%, 9/19/2029(1) | | | | | | 800 | | | | 798 | |
| | | | | | | | | | | | |
| CHILE - 0.5% | | | | | | | | | | | |
| ATP Tower Holdings LLC | | | | | | | | | | | |
| 4.05%, 4/27/2026(1) | | | | | | 420 | | | | 410 | |
| | | | | | | | | | | | |
| COLOMBIA - 2.2% | | | | | | | | | | | |
| Aris Mining Corp. | | | | | | | | | | | |
| 6.88%, 8/9/2026(1) | | | | | | 877 | | | | 875 | |
| EnfraGen Energia Sur SA | | | | | | | | | | | |
| 5.38%, 12/30/2030(1) | | | | | | 460 | | | | 396 | |
| Gran Tierra Energy, Inc. | | | | | | | | | | | |
| 9.50%, 10/15/2029(1) | | | | | | 370 | | | | 351 | |
| | | | | | | | | | | 1,622 | |
| CZECH REPUBLIC - 1.1% | | | | | | | | | | | |
| Energo-Pro A/S | | | | | | | | | | | |
| 8.50%, 2/4/2027(1) | | | | | | 200 | | | | 201 | |
| 11.00%, 11/2/2028(1) | | | | | | 570 | | | | 617 | |
| | | | | | | | | | | 818 | |
| | | | | | Principal
Amount | | Value |
| DOMINICAN REPUBLIC - 3.8% | | | | | | | | | | | |
| Banco Central de la Republica Dominicana | | | | | | | | | | | |
| 13.00%, 12/5/2025(1) | | DOP | | | | 87,270 | | | $ | 1,476 | |
| 13.00%, 1/30/2026(1) | | DOP | | | | 80,020 | | | | 1,360 | |
| 9.00%, 12/11/2026(1) | | DOP | | | | 4,360 | | | | 70 | |
| | | | | | | | | | | 2,906 | |
| MEXICO - 1.0% | | | | | | | | | | | |
| Petroleos Mexicanos | | | | | | | | | | | |
| 6.95%, 1/28/2060 | | | | | | 1,020 | | | | 731 | |
| | | | | | | | | | | | |
| MOLDOVA, REPUBLIC OF - 0.4% | | | | | | | | | | | |
| Aragvi Finance International DAC | | | | | | | | | | | |
| 8.45%, 4/29/2026(1) | | | | | | 360 | | | | 332 | |
| | | | | | | | | | | | |
| NETHERLANDS - 0.5% | | | | | | | | | | | |
| VEON Holdings BV | | | | | | | | | | | |
| 3.38%, 11/25/2027(1) | | | | | | 430 | | | | 377 | |
| | | | | | | | | | | | |
| NIGERIA - 0.5% | | | | | | | | | | | |
| SEPLAT Energy plc | | | | | | | | | | | |
| 7.75%, 4/1/2026(1) | | | | | | 410 | | | | 411 | |
| | | | | | | | | | | | |
| PARAGUAY - 0.3% | | | | | | | | | | | |
| Frigorifico Concepcion SA | | | | | | | | | | | |
| 7.70%, 7/21/2028(1)(7) | | | | | | 310 | | | | 217 | |
| | | | | | | | | | | | |
| SINGAPORE - 0.5% | | | | | | | | | | | |
| Yinson Production Financial Services Pte. Ltd. | | | | | | | | | | | |
| 9.63%, 5/3/2029(1) | | | | | | 350 | | | | 358 | |
| | | | | | | | | | | | |
| TURKEY - 0.9% | | | | | | | | | | | |
| Limak Iskenderun Uluslararasi Liman Isletmeciligi A/S | | | | | | | | | | | |
| 9.50%, 7/10/2036(1) | | | | | | 757 | | | | 712 | |
| | | | | | | | | | | | |
| UNITED KINGDOM - 0.5% | | | | | | | | | | | |
| 3T Global Holdco Ltd. | | | | | | | | | | | |
| 11.25%, 5/22/2028 | | | | | | 375 | | | | 380 | |
| | | | | | | | | | | | |
| UZBEKISTAN - 1.6% | | | | | | | | | | | |
| Uzbek Industrial and Construction Bank ATB | | | | | | | | | | | |
| 21.00%, 7/24/2027(1) | | UZS | | | | 15,500,000 | | | | 1,200 | |
| | | | | | | | | | | | |
| Total corporate bonds | | | | | | | | | | | |
| (Cost $13,687) | | | | | | | | | | 13,699 | |
| | | | | | | | | | | | |
| BANK LOANS - 2.6% | | | | | | | | | | | |
| | | | | | | | | | | | |
| PARAGUAY - 0.7% | | | | | | | | | | | |
| Frigorifico Concepcion First Lien Term Loan B | | | | | | | | | | | |
| (SOFR + 5.50%), 10.43%, 12/8/2026(2)(3)(8) | | | | | | 600 | | | | 504 | |
| | | | | | | | | | | | |
| TANZANIA - 1.9% | | | | | | | | | | | |
| Tanzania (United Republic of) First Lien Term Loan | | | | | | | | | | | |
| (SOFR + 5.45%), 10.32%, 3/6/2031(2)(3)(8) | | | | | | 1,450 | | | | 1,435 | |
| | | | | | | | | | | | |
| Total bank loans | | | | | | | | | | | |
| (Cost $2,050) | | | | | | | | | | 1,939 | |
| | | | | | | | | | | | |
| SHORT-TERM INVESTMENTS - 11.2% | | | | | | | | | | | |
| | | | | | | | | | | | |
| SOVEREIGN GOVERNMENT TREASURY BILLS - 9.1% | | | | | | | | | | | |
| Arab Republic of Egypt | | | | | | | | | | | |
| 28.80%, 11/26/2024(9) | | EGP | | | | 52,025 | | | | 1,031 | |
| 28.85%, 12/10/2024(9) | | EGP | | | | 16,300 | | | | 320 | |
| 28.95%, 12/17/2024(9) | | EGP | | | | 94,000 | | | | 1,833 | |
| 28.95%, 12/24/2024(9) | | EGP | | | | 43,150 | | | | 837 | |
| 28.78%, 2/25/2025(9) | | EGP | | | | 28,875 | | | | 536 | |
| 28.74%, 3/18/2025(9) | | EGP | | | | 23,500 | | | | 430 | |
| | | | | | Principal
Amount | | Value |
| Federal Republic of Nigeria | | | | | | | | | | | |
| 26.76%, 3/6/2025(9) | | NGN | | | | 160,000 | | | $ | 86 | |
| 27.19%, 3/27/2025(9) | | NGN | | | | 940,000 | | | | 497 | |
| Nigeria OMO Bill | | | | | | | | | | | |
| 28.18%, 5/20/2025(9) | | NGN | | | | 210,000 | | | | 107 | |
| 28.68%, 6/17/2025(9) | | NGN | | | | 242,000 | | | | 120 | |
| Republic of Albania | | | | | | | | | | | |
| 3.21%, 11/28/2024(9) | | ALL | | | | 9,100 | | | | 102 | |
| 3.12%, 12/12/2024(9) | | ALL | | | | 15,000 | | | | 168 | |
| 3.36%, 1/30/2025(9) | | ALL | | | | 12,000 | | | | 134 | |
| 3.37%, 2/13/2025(9) | | ALL | | | | 27,800 | | | | 309 | |
| 3.17%, 4/17/2025(9) | | ALL | | | | 7,500 | | | | 83 | |
| 3.44%, 5/1/2025(9) | | ALL | | | | 16,800 | | | | 186 | |
| Republic of Armenia | | | | | | | | | | | |
| 8.99%, 12/2/2024(9) | | AMD | | | | 59,000 | | | | 150 | |
| Total sovereign government treasury bills | | | | | | | | | | | |
| (Cost $7,044) | | | | | | | | | | 6,929 | |
| | | | | | | | | | | | |
| U.S. TREASURY OBLIGATION - 1.6% | | | | | | | | | | | |
| U.S. Treasury Bill | | | | | | | | | | | |
| 4.59%, 10/29/2024 (Cost $1,196)(9) | | | | | | 1,200 | | | | 1,195 | |
| | | Shares
Held | | | |
| | | | | | | |
| INVESTMENT COMPANIES - 0.5% | | | | | | | | |
| BlackRock Liquidity Funds Treasury Trust Fund - Institutional Class, 4.85%(10) | | | 380 | | | | 380 | |
| Federated Treasury Obligations Fund - Institutional Class, 4.81%(10) | | | 3 | | | | 3 | |
| Fidelity Investments Money Market Treasury Portfolio - Institutional Class, 4.87%(10) | | | 3 | | | | 3 | |
| | | | | | | | | |
| Total investment companies | | | | | | | | |
| (Cost $386) | | | | | | | 386 | |
| | | | | | | | | |
| Total short-term investments | | | | | | | | |
| (Cost $8,626) | | | | | | | 8,510 | |
| | | | | | | | | |
| Total investments - 90.0% | | | | | | | | |
| (Cost $66,211) | | | | | | | 68,053 | |
| | | | | | | | | |
| REVERSE REPURCHASE AGREEMENT - (0.2)% | | | | | | | | |
| (Proceeds $(163)) | | | | | | | (163 | ) |
| | | | | | | | | |
| Other assets less liabilities - 10.2% | | | | | | | 7,699 | |
| | | | | | | | | |
| Total net assets - 100.0%# | | | | | | $ | 75,589 | |
| (1) | Regulation S is an exemption for securities offerings that are made outside of the United States and do not involve direct selling efforts in the United States. Resale restrictions may apply for purposes of the Securities Act of 1933. At September 30, 2024, the value of these securities was $42,992 or 56.9% of net assets. |
| (2) | Valued at a fair value in accordance with procedures established by the board of directors of Artisan Partners Funds. In total, securities valued at a fair value were $2,756, or 3.6% of total net assets. See notes 2(b) and 4 in Notes to Financial Statements for additional information. |
| (3) | Security is valued using significant unobservable inputs and is classified as Level 3 in the fair value hierarchy. |
| (4) | Security is restricted. |
| Security | | Acquisition Date | | Cost | | Value | | Percentage of
Total Net Assets | |
| Paraguay Treasury Credit-Linked Note, 9.03%, 2/15/2030 | | 8/17/2023 - 3/4/2024 | | $ | 651 | | | $ | 621 | | | 0.8% | |
| Paraguay Treasury Credit-Linked Note, 8.00%, 3/3/2036 | | 3/27/2024 | | | 211 | | | | 196 | | | 0.3% | |
| (5) | Step bond. Interest rate is a fixed rate for an initial period that either resets at a specific date or may reset in the future at a contingent upon predetermined trigger. The interest rate shown was the current rate as of September 30, 2024. |
| (7) | All or a position of the security has been pledge as collateral in connection with outstanding reverse repurchase agreements. |
| (8) | Variable or floating rate security, linked to the referenced benchmark. Interest rates reset periodically. Certain variable rate securities are not based on a published reference rate and spread but are determined by the issuer or agent and are based on current market conditions. The interest rate shown is the rate in effect as of September 30, 2024. |
| (10) | Represents the current yield as of September 30, 2024. |
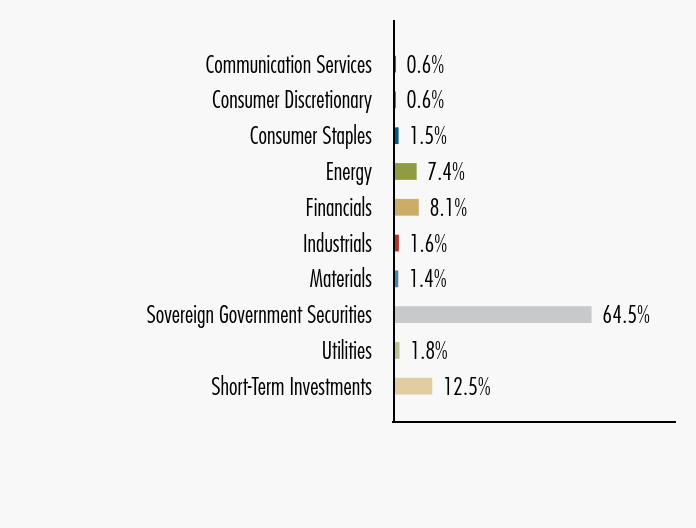
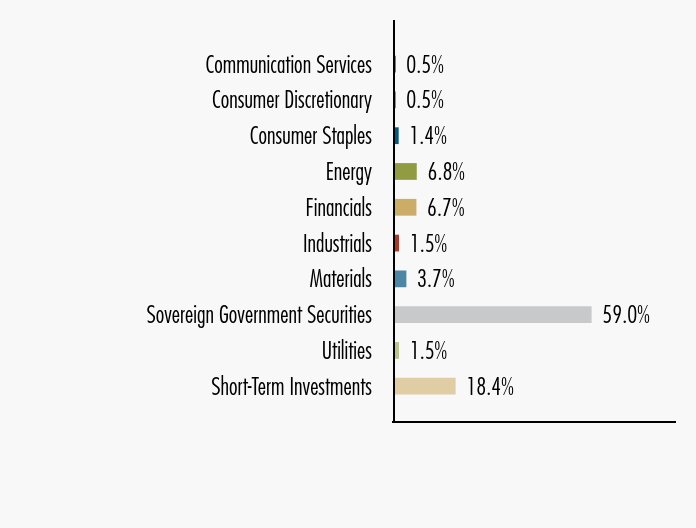
PORTFOLIO DIVERSIFICATION
Dollar values in thousands
| | | Value | | Percentage of
Total Investments |
| Communication Services | | $ | 377 | | | | 0.6 | % |
| Consumer Discretionary | | | 380 | | | | 0.6 | |
| Consumer Staples | | | 1,053 | | | | 1.5 | |
| Energy | | | 5,013 | | | | 7.4 | |
| Financials | | | 5,541 | | | | 8.1 | |
| Industrials | | | 1,122 | | | | 1.6 | |
| Materials | | | 938 | | | | 1.4 | |
| Sovereign Government Securities | | | 43,905 | | | | 64.5 | |
| Utilities | | | 1,214 | | | | 1.8 | |
| Short-Term Investments | | | 8,510 | | | | 12.5 | |
| Total investments | | $ | 68,053 | | | | 100.0 | % |
FOREIGN CURRENCY FORWARD CONTRACTS
Values in thousands
| Currency Purchased | | Currency Sold | | Counterparty | | | Settlement
Date | | Unrealized
Appreciation
(Depreciation) |
| BRL** | | | 48,677 | | | USD | | | 8,882 | | | CGM | | | 10/2/2024 | | $ | 54 | |
| BRL** | | | 5,737 | | | USD | | | 1,022 | | | SCB | | | 10/2/2024 | | | 31 | |
| IDR** | | | 3,200,000 | | | USD | | | 208 | | | CGM | | | 10/7/2024 | | | 3 | |
| IDR** | | | 5,701,860 | | | USD | | | 367 | | | SCB | | | 10/7/2024 | | | 8 | |
| INR** | | | 172,376 | | | USD | | | 2,051 | | | CGM | | | 10/9/2024 | | | 6 | |
| TRY | | | 137,020 | | | USD | | | 3,875 | | | SCB | | | 10/10/2024 | | | 99 | |
| KZT** | | | 121,000 | | | USD | | | 251 | | | SG | | | 10/11/2024 | | | 1 | |
| KES** | | | 46,000 | | | USD | | | 335 | | | CITI | | | 10/15/2024 | | | 21 | |
| KES** | | | 4,000 | | | USD | | | 30 | | | ICBCSB | | | 10/15/2024 | | | 1 | |
| PEN** | | | 3,000 | | | USD | | | 786 | | | CGM | | | 10/16/2024 | | | 23 | |
| INR** | | | 30,200 | | | USD | | | 359 | | | SCB | | | 10/17/2024 | | | 1 | |
| AMD** | | | 97,000 | | | USD | | | 245 | | | ICBCSB | | | 10/18/2024 | | | 5 | |
| RSD | | | 500,736 | | | EUR | | | 4,261 | | | SCB | | | 10/18/2024 | | | 17 | |
| TRY | | | 12,000 | | | USD | | | 333 | | | SCB | | | 10/24/2024 | | | 10 | |
| KZT** | | | 116,000 | | | USD | | | 240 | | | ICBCSB | | | 11/12/2024 | | | — | ^ |
| UZS** | | | 2,800,000 | | | USD | | | 216 | | | CITI | | | 11/20/2024 | | | 2 | |
| MYR** | | | 3,150 | | | USD | | | 730 | | | GS | | | 12/6/2024 | | | 35 | |
| PEN** | | | 480 | | | USD | | | 126 | | | CGM | | | 12/12/2024 | | | 4 | |
| USD | | | 772 | | | EUR | | | 691 | | | SCB | | | 12/18/2024 | | | — | ^ |
| UZS** | | | 200,000 | | | USD | | | 14 | | | SCB | | | 2/7/2025 | | | 1 | |
| Total unrealized appreciation | | | | 322 | |
| BRL** | | | 4,093 | | | USD | | | 757 | | | SCB | | | 10/2/2024 | | | (5 | ) |
| INR** | | | 23,579 | | | USD | | | 282 | | | CGM | | | 10/9/2024 | | | (— | )^ |
| USD | | | 251 | | | KZT** | | | 121,000 | | | CITI | | | 10/11/2024 | | | (— | )^ |
| KZT** | | | 326,000 | | | USD | | | 677 | | | ICBCSB | | | 10/15/2024 | | | (— | )^ |
| USD | | | 385 | | | KES** | | | 50,000 | | | CITI | | | 10/15/2024 | | | (2 | ) |
| USD | | | 675 | | | KZT** | | | 326,000 | | | CITI | | | 10/15/2024 | | | (1 | ) |
| USD | | | 2,654 | | | PEN** | | | 10,128 | | | CGM | | | 10/16/2024 | | | (77 | ) |
| USD | | | 1,070 | | | ZAR | | | 19,148 | | | TDB | | | 10/16/2024 | | | (37 | ) |
| MXN | | | 4,992 | | | USD | | | 257 | | | TDB | | | 10/17/2024 | | | (4 | ) |
| EUR | | | 4,271 | | | RSD | | | 500,736 | | | SCB | | | 10/18/2024 | | | (7 | ) |
| KZT** | | | 534,504 | | | USD | | | 1,112 | | | SG | | | 10/28/2024 | | | (5 | ) |
| USD | | | 45 | | | KZT** | | | 21,700 | | | CITI | | | 10/28/2024 | | | (— | )^ |
| BRL** | | | 29,254 | | | USD | | | 5,355 | | | CGM | | | 11/4/2024 | | | (7 | ) |
| USD | | | 737 | | | IDR** | | | 11,540,419 | | | CGM | | | 11/18/2024 | | | (21 | ) |
| KZT** | | | 823,586 | | | USD | | | 1,700 | | | ICBCSB | | | 11/26/2024 | | | (1 | ) |
| INR** | | | 36,884 | | | USD | | | 440 | | | CGM | | | 11/29/2024 | | | (1 | ) |
| EUR | | | 648 | | | USD | | | 725 | | | SCB | | | 12/18/2024 | | | (1 | ) |
| USD | | | 9,586 | | | EUR | | | 8,587 | | | SCB | | | 12/18/2024 | | | (3 | ) |
| UZS** | | | 5,300,000 | | | USD | | | 409 | | | DB | | | 12/23/2024 | | | (1 | ) |
| INR** | | | 20,800 | | | USD | | | 248 | | | CGM | | | 12/24/2024 | | | (1 | ) |
| USD | | | 14 | | | UZS** | | | 200,000 | | | SCB | | | 2/7/2025 | | | (1 | ) |
| TJS** | | | 2,560 | | | USD | | | 232 | | | JPM | | | 3/14/2025 | | | (1 | ) |
| UZS** | | | 5,260,000 | | | USD | | | 397 | | | ICBCSB | | | 4/2/2025 | | | (4 | ) |
| GTQ** | | | 5,650 | | | USD | | | 714 | | | CITI | | | 9/3/2025 | | | (4 | ) |
| Total unrealized depreciation | | | | (184 | ) |
| Net unrealized appreciation | | | $ | 138 | |
FUTURES CONTRACTS
Values in thousands
| Description | | No. of
Contracts | | | Expiration Date | | Trading
Currency | | Notional
Amount | | Notional
Value | | Unrealized
Appreciation/
(Depreciation) |
| Short Positions Contracts | | | | | | | | | | | | | | | | | | | |
| Euro-Bobl | | (18 | ) | | 12/6/2024 | | EUR | | $ | (1,800 | ) | | $ | (2,405 | ) | | $ | (12 | ) |
| Euro-Bund | | (24 | ) | | 12/6/2024 | | EUR | | | (2,400 | ) | | | (3,604 | ) | | | (37 | ) |
| Euro-Schatz | | (11 | ) | | 12/6/2024 | | EUR | | | (1,100 | ) | | | (1,312 | ) | | | (4 | ) |
| U.S. Treasury 2 Year Note | | (41 | ) | | 12/31/2024 | | USD | | | (8,200 | ) | | | (8,538 | ) | | | (7 | ) |
| U.S. Treasury 5 Year Note | | (92 | ) | | 12/31/2024 | | USD | | | (9,200 | ) | | | (10,109 | ) | | | 6 | |
| U.S. Treasury 10 Year Note | | (46 | ) | | 12/19/2024 | | USD | | | (4,600 | ) | | | (5,257 | ) | | | (7 | ) |
| U.S. Treasury 10 Year Ultra Note | | (11 | ) | | 12/19/2024 | | USD | | | (1,100 | ) | | | (1,301 | ) | | | (1 | ) |
| Net unrealized depreciation | | | | | | | | | | | | | | | | | $ | (62 | ) |
| | | | | | | | | | | | | | | | | | | | |
| The Fund has recorded an asset of $72 as of September 30, 2024, related to the current day’s variation margin associated with these contracts. |
CENTRALLY CLEARED CREDIT DEFAULT SWAPS - SELL PROTECTION
Notional amounts and values in thousands and reported in USD unless otherwise stated
| Reference Entity | | Financing Rate
Received by the
Fund (%) | | Frequency of Payment
Made/Received | | Termination
Date | | Notional
Amount*** | | Upfront (Payments)
Receipts
($) | | Unrealized Appreciation
(Depreciation)
($) | | Value
($) |
| Arab Republic of Egypt | | 1.00 | | Quarterly | | 6/20/2029 | | 515 | | (102) | | 8 | | (94) |
| Republic of Colombia | | 1.00 | | Quarterly | | 6/20/2034 | | 2,550 | | (330) | | (45) | | (375) |
| Republic of Turkey | | 1.00 | | Quarterly | | 12/20/2028 | | 1,520 | | (106) | | 32 | | (74) |
| Total sell protection | | | | | | | | (538) | | (5) | | (543) |
| *** | If the Fund is the seller of credit protection, the notional amount is the maximum potential amount of future payments the Fund could be required to make if a credit event, as defined in the credit default swap agreement, were to occur. At September 30, 2024, such maximum potential amount for all open credit default swaps in which the Fund is the seller was $4,585. |
CENTRALLY CLEARED INTEREST RATE SWAPS
Notional amounts and values in thousands and reported in USD unless otherwise stated
| Floating Rate Index (Frequency) | | Fixed Rate (%) (Frequency) | | Fund Pays/
Receives
Floating
Rate | | Termination Date | | Notional Amount | | Upfront Payments
(Receipts)
($) | | Unrealized
Appreciation
(Depreciation)
($) | | Value
($) |
| 4 week TIIE monthly | | 9.52 monthly | | Pay | | 9/14/2033 | | MXN 16,900 | | 17 | | 30 | | 47 |
| 6 month PRIBOR semi-annually | | 3.95 annually | | Pay | | 12/1/2030 | | CZK 31,850 | | 8 | | 79 | | 87 |
| 3 month JIBAR quarterly | | 9.80 quarterly | | Pay | | 4/3/2034 | | ZAR 15,200 | | 25 | | 64 | | 89 |
| 4 week TIIE monthly | | 9.47 monthly | | Pay | | 3/31/2027 | | MXN 50,600 | | (21) | | 57 | | 36 |
| 6 month PRIBOR semi-annually | | 3.82 annually | | Pay | | 4/5/2034 | | CZK 79,500 | | (54) | | 188 | | 134 |
| 4 week TIIE monthly | | 10.53 monthly | | Pay | | 6/15/2026 | | MXN 283,100 | | 53 | | 263 | | 316 |
| 6 month PRIBOR semi-annually | | 3.36 annually | | Pay | | 8/9/2034 | | CZK 18,000 | | — | | 3 | | 3 |
| 1 day MIBOR semi-annually | | 6.06 semi-annually | | Pay | | 8/9/2029 | | INR 235,000 | | — | | 2 | | 2 |
| 1 day MIBOR semi-annually | | 6.19 semi-annually | | Pay | | 5/26/2033 | | INR 81,000 | | (8) | | 13 | | 5 |
| | | | | | | | | | | | | | | |
| Total | | | | | | | | | | 20 | | 699 | | 719 |
The Fund has recorded a liability of $32 as of September 30, 2024, related to the current day’s variation margin associated with all centrally cleared swap contracts.
REVERSE REPURCHASE AGREEMENT
Values in thousands
| Counterparty | | Interest
Rate | | Trade Date | | Maturity Date | | Face value
($) | | Face Value
Including Accrued
Interest
($) | | Type of Non Cash
Underlying Collateral | | Remaining
Contractual Maturity
of Agreement |
| Morgan Stanley & Co International Plc | | (3.00)% | | 9/23/2024 | | 12/31/2049 | | (163) | | (163) | | Frigorifico Concepcion SA | | Up to 25 Years* |
| * | Reverse repurchase agreement with no specific maturity date. Either party may terminate the agreement upon demand. |
Definitions of abbreviations and footnotes are detailed on page 2-3.
The accompanying notes are an integral part of the financial statements.
ARTISAN FLOATING RATE FUND
Schedule of Investments — September 30, 2024
Principal amount, shares and dollar values in thousands
| | | Principal
Amount | | Value |
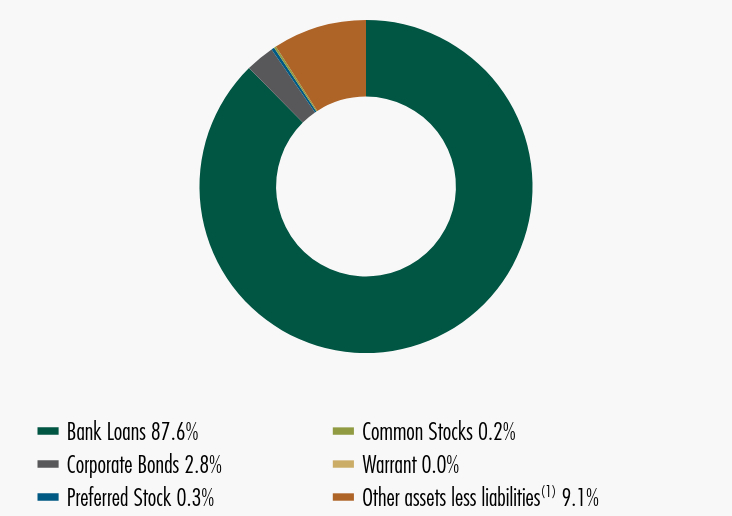
| BANK LOANS - 87.6% | | | | | | | | |
| | | | | | | | | |
| AUTOMOBILE COMPONENTS - 0.1% | | | | | | | | |
| Wheel Pros, Inc. First Lien Term Loan | | | | | | | | |
| (SOFR + 8.88%), 14.42%, 5/11/2028(1) | | | 93 | | | $ | 106 | |
| | | | | | | | | |
| BROADLINE RETAIL - 1.4% | | | | | | | | |
| Oculus Acquisition Corp. First Lien Term Loan | | | | | | | | |
| (SOFR + 3.50%), 8.75%, 11/8/2027(1) | | | 993 | | | | 994 | |
| | | | | | | | | |
| BUILDING PRODUCTS - 0.5% | | | | | | | | |
| CP Atlas Buyer, Inc. First Lien Term Loan B | | | | | | | | |
| (SOFR + 3.75%), 8.70%, 11/23/2027(1) | | | 403 | | | | 397 | |
| | | | | | | | | |
| CAPITAL MARKETS - 3.5% | | | | | | | | |
| Edelman Financial Engines Center LLC First Lien Term Loan | | | | | | | | |
| (SOFR + 3.25%), 8.10%, 4/7/2028(1) | | | 1,336 | | | | 1,333 | |
| Edelman Financial Engines Center LLC Second Lien Term Loan | | | | | | | | |
| (SOFR + 5.25%), 10.10%, 10/20/2028(1) | | | 1,250 | | | | 1,244 | |
| | | | | | | | 2,577 | |
| COMMERCIAL SERVICES - 0.7% | | | | | | | | |
| Digital Room Holdings, Inc. First Lien Term Loan | | | | | | | | |
| (SOFR + 5.25%), 10.20%, 12/21/2028(1) | | | 566 | | | | 546 | |
| | | | | | | | | |
| COMMERCIAL SERVICES & SUPPLIES - 1.6% | | | | | | | | |
| OMNIA Partners LLC First Lien Term Loan B | | | | | | | | |
| (SOFR + 3.25%), 8.53%, 7/25/2030(1) | | | 474 | | | | 475 | |
| Ryan LLC First Lien Term Loan | | | | | | | | |
| (SOFR + 3.50%), 8.35%, 11/14/2030(1) | | | 674 | | | | 667 | |
| | | | | | | | 1,142 | |
| COMMUNICATIONS EQUIPMENT - 6.4% | | | | | | | | |
| Delta Topco, Inc. First Lien Term Loan | | | | | | | | |
| (SOFR + 3.50%), 8.20%, 11/30/2029(1) | | | 3,458 | | | | 3,450 | |
| Delta Topco, Inc. Second Lien Term Loan | | | | | | | | |
| (SOFR + 5.25%), 9.95%, 12/24/2030(1) | | | 1,199 | | | | 1,204 | |
| | | | | | | | 4,654 | |
| CONTAINERS & PACKAGING - 1.4% | | | | | | | | |
| Ring Container Technologies Group LLC First Lien Term Loan | | | | | | | | |
| (SOFR + 2.75%), 7.60%, 8/14/2028(1) | | | 998 | | | | 996 | |
| | | | | | | | | |
| DISTRIBUTORS - 1.6% | | | | | | | | |
| Core & Main LP First Lien Term Loan D | | | | | | | | |
| (SOFR + 2.00%), 6.86%, 7/27/2028(1) | | | 1,192 | | | | 1,190 | |
| | | | | | | | | |
| DIVERSIFIED CONSUMER SERVICES - 2.8% | | | | | | | | |
| Kuehg Corp. First Lien Term Loan C | | | | | | | | |
| (SOFR + 4.50%), 9.10%, 6/12/2030(1) | | | 1,486 | | | | 1,490 | |
| Wand Newco 3, Inc. First Lien Term Loan | | | | | | | | |
| (SOFR + 3.25%), 8.01%, 1/30/2031(1) | | | 611 | | | | 610 | |
| | | | | | | | 2,100 | |
| DIVERSIFIED TELECOMMUNICATION SERVICES - 0.8% | | | | | | | | |
| Zayo Group Holdings, Inc. First Lien Term Loan | | | | | | | | |
| (SOFR + 3.00%), 7.96%, 3/9/2027(1) | | | 649 | | | | 592 | |
| | | | | | | | | |
| ENTERTAINMENT - 0.7% | | | | | | | | |
| J&J Ventures Gaming LLC Delayed Draw Term Loan | | | | | | | | |
| (SOFR + 4.25%), 9.21%, 4/26/2028(1) | | | 503 | | | | 500 | |
| | | | | | | | | |
| FINANCIAL SERVICES - 0.8% | | | | | | | | |
| Kestra Advisor Services Holdings A, Inc. First Lien Term Loan | | | | | | | | |
| (SOFR + 4.00%), 9.06%, 3/19/2031(1) | | | 187 | | | | 187 | |
| | | Principal
Amount | | Value |
| FINANCIAL SERVICES (continued) | | | | | | | | |
| Trans Union LLC First Lien Term Loan B5 | | | | | | | | |
| (SOFR + 1.75%), 7.10%, 11/16/2026(1) | | | 328 | | | $ | 328 | |
| | | | | | | | 515 | |
| FOOD - 0.7% | | | | | | | | |
| Chefs’ Warehouse, Inc. First Lien Term Loan | | | | | | | | |
| (SOFR + 4.00%), 8.85%, 8/23/2029(1) | | | 479 | | | | 479 | |
| | | | | | | | | |
| FOOD PRODUCTS - 2.2% | | | | | | | | |
| B&G Foods, Inc. First Lien Term Loan B5 | | | | | | | | |
| (SOFR + 3.50%), 8.56%, 10/10/2029(1) | | | 257 | | | | 255 | |
| Fiesta Purchaser, Inc. First Lien Term Loan | | | | | | | | |
| (SOFR + 4.00%), 8.85%, 2/12/2031(1) | | | 545 | | | | 545 | |
| H-Food Holdings LLC First Lien Term Loan | | | | | | | | |
| (SOFR + 3.69%), 9.01%, 5/23/2025(1) | | | 479 | | | | 357 | |
| H-Food Holdings LLC First Lien Term Loan B2 | | | | | | | | |
| (SOFR + 4.00%), 9.32%, 5/23/2025(1) | | | 296 | | | | 221 | |
| H-Food Holdings LLC First Lien Term Loan B3 | | | | | | | | |
| (SOFR + 5.00%), 10.32%, 5/23/2025(1) | | | 353 | | | | 263 | |
| | | | | | | | 1,641 | |
| FOOD SERVICE - 1.9% | | | | | | | | |
| TKC Holdings, Inc. First Lien Term Loan | | | | | | | | |
| (SOFR + 5.00%), 10.34%, 5/15/2028(1) | | | 1,179 | | | | 1,174 | |
| TKC Midco 1 LLC First Lien Term Loan | | | | | | | | |
| 12.00% Cash, 13.50% PIK, 2/16/2027 | | | 241 | | | | 200 | |
| | | | | | | | 1,374 | |
| HEALTH CARE EQUIPMENT & SUPPLIES - 0.5% | | | | | | | | |
| Medline Borrower LP First Lien Term Loan | | | | | | | | |
| (SOFR + 2.75%), 7.60%, 10/23/2028(1) | | | 396 | | | | 396 | |
| | | | | | | | | |
| HEALTH CARE PROVIDERS & SERVICES - 3.5% | | | | | | | | |
| GoodRx First Lien Term Loan B | | | | | | | | |
| (SOFR + 3.75%), 8.60%, 7/10/2029(1) | | | 250 | | | | 250 | |
| Mamba Purchaser, Inc. First Lien Term Loan | | | | | | | | |
| (SOFR + 3.25%), 8.35%, 10/16/2028(1) | | | 807 | | | | 805 | |
| Surgery Center Holdings, Inc. First Lien Term Loan | | | | | | | | |
| (SOFR + 2.75%), 7.67%, 12/19/2030(1) | | | 1,559 | | | | 1,559 | |
| | | | | | | | 2,614 | |
| HOTEL & RESORT REITS - 1.4% | | | | | | | | |
| OEG Borrower LLC First Lien Term Loan | | | | | | | | |
| (SOFR + 3.50%), 8.36%, 6/25/2031(1) | | | 1,000 | | | | 997 | |
| | | | | | | | | |
| HOTELS, RESTAURANTS & LEISURE - 4.3% | | | | | | | | |
| BCPE Grill Parent, Inc. First Lien Term Loan | | | | | | | | |
| (SOFR + 4.75%), 10.00%, 9/30/2030(1) | | | 1,744 | | | | 1,673 | |
| Motion Finco SARL First Lien B3 | | | | | | | | |
| (SOFR + 3.50%), 8.10%, 11/13/2029(1)(2) | | | 1,494 | | | | 1,436 | |
| | | | | | | | 3,109 | |
| HOUSEHOLD DURABLES - 2.1% | | | | | | | | |
| TGP Holdings III LLC First Lien Term Loan | | | | | | | | |
| (SOFR + 3.25%), 8.20%, 6/29/2028(1) | | | 1,637 | | | | 1,538 | |
| | | | | | | | | |
| INSURANCE - 19.8% | | | | | | | | |
| Acrisure LLC First Lien Term Loan B1 | | | | | | | | |
| (SOFR + 3.00%), 7.96%, 2/16/2027(1) | | | 1,166 | | | | 1,161 | |
| AmWINS Group, Inc. First Lien Term Loan | | | | | | | | |
| (SOFR + 2.25%), 7.21%, 2/21/2028(1) | | | 1,202 | | | | 1,199 | |
| Amynta Agency Borrower, Inc. First Lien Term Loan B | | | | | | | | |
| (SOFR + 3.75%), 9.00%, 2/28/2028(1) | | | 1,485 | | | | 1,484 | |
| | | Principal
Amount | | Value |
| INSURANCE (continued) | | | | | | | | |
| Ardonagh Group Finance Pty Ltd. First Lien Term Loan B | | | | | | | | |
| (SOFR + 3.75%), 8.52%, 2/18/2031(1)(2) | | | 1,000 | | | $ | 1,001 | |
| AssuredPartners, Inc. First Lien Term Loan | | | | | | | | |
| (SOFR + 3.50%), 8.35%, 2/14/2031(1) | | | 210 | | | | 210 | |
| Baldwin Insurance Group Holdings LLC First Lien Term Loan | | | | | | | | |
| (SOFR + 3.25%), 8.10%, 5/26/2031(1) | | | 1,228 | | | | 1,228 | |
| BroadStreet Partners, Inc. First Lien Term Loan B | | | | | | | | |
| (SOFR + 3.25%), 8.10%, 5/9/2031(1) | | | 1,555 | | | | 1,548 | |
| Cross Financial Corp. First Lien Term Loan B2 | | | | | | | | |
| (SOFR + 3.50%), 8.35%, 9/15/2027(1) | | | 995 | | | | 994 | |
| Hub International Ltd. First Lien Term Loan | | | | | | | | |
| (SOFR + 3.00%), 8.26%, 6/20/2030(1) | | | 1,115 | | | | 1,113 | |
| IMA Financial Group, Inc. First Lien Term Loan | | | | | | | | |
| (SOFR + 3.25%), 8.10%, 11/1/2028(1) | | | 1,183 | | | | 1,181 | |
| Jones DesLauriers Insurance Management, Inc. First Lien Term Loan | | | | | | | | |
| (SOFR + 3.25%), 8.40%, 3/15/2030(1)(2) | | | 995 | | | | 994 | |
| OneDigital Borrower LLC First Lien Term Loan | | | | | | | | |
| (SOFR + 3.25%), 8.10%, 6/13/2031(1) | | | 499 | | | | 494 | |
| Truist Insurance Holdings, Inc. Second Lien Term Loan | | | | | | | | |
| (SOFR + 4.75%), 9.35%, 5/6/2032(1) | | | 678 | | | | 688 | |
| USI, Inc. First Lien Term Loan B | | | | | | | | |
| (SOFR + 2.75%), 7.35%, 11/21/2029(1) | | | 1,165 | | | | 1,161 | |
| | | | | | | | 14,456 | |
| INVESTMENT COMPANIES - 4.4% | | | | | | | | |
| Nexus Buyer LLC First Lien Term Loan B | | | | | | | | |
| (SOFR + 4.00%), 9.25%, 7/31/2031(1) | | | 1,950 | | | | 1,932 | |
| Nexus Buyer LLC Second Lien Term Loan | | | | | | | | |
| (SOFR + 6.25%), 11.20%, 11/1/2029(1) | | | 1,211 | | | | 1,205 | |
| | | | | | | | 3,137 | |
| IT SERVICES - 1.5% | | | | | | | | |
| Arches Buyer, Inc. First Lien Term Loan | | | | | | | | |
| (SOFR + 3.25%), 8.20%, 12/6/2027(1) | | | 780 | | | | 747 | |
| StubHub Holdco Sub LLC First Lien Term Loan B | | | | | | | | |
| (SOFR + 4.75%), 9.60%, 3/15/2030(1) | | | 360 | | | | 359 | |
| | | | | | | | 1,106 | |
| LEISURE PRODUCTS - 2.6% | | | | | | | | |
| Bulldog Purchaser, Inc. First Lien Term Loan | | | | | | | | |
| (SOFR + 4.25%), 8.85%, 6/27/2031(1) | | | 140 | | | | 141 | |
| GSM Holdings, Inc. Term Loan First Lien | | | | | | | | |
| (SOFR + 5.00%), 9.20%, 9/29/2031(1) | | | 1,000 | | | | 930 | |
| Peloton Interactive, Inc. First Lien Term Loan | | | | | | | | |
| (SOFR + 6.00%), 10.85%, 5/30/2029(1) | | | 804 | | | | 805 | |
| | | | | | | | 1,876 | |
| MACHINERY - 0.7% | | | | | | | | |
| Madison Safety & Flow LLC First Lien Term Loan B | | | | | | | | |
| (SOFR + 3.25%), 7.45%, 9/19/2031(1) | | | 500 | | | | 499 | |
| | | | | | | | | |
| MEDIA - 1.3% | | | | | | | | |
| Virgin Media Bristol LLC First Lien Term Loan | | | | | | | | |
| (SOFR + 2.50%), 7.71%, 1/31/2028(1) | | | 1,000 | | | | 956 | |
| | | | | | | | | |
| MORTGAGE REAL ESTATE INVESTMENT TRUSTS (REITS) - 1.7% | | | | | | | | |
| Forest City Enterprises LP First Lien Term Loan | | | | | | | | |
| (SOFR + 3.50%), 8.46%, 12/8/2025(1) | | | 1,294 | | | | 1,250 | |
| | | | | | | | | |
| PROFESSIONAL SERVICES - 1.2% | | | | | | | | |
| VT Topco, Inc. First Lien Term Loan | | | | | | | | |
| (SOFR + 3.50%), 8.35%, 8/9/2030(1) | | | 845 | | | | 846 | |
| | | | | | | | | |
| SOFTWARE - 10.2% | | | | | | | | |
| Applied Systems, Inc. First Lien Term Loan | | | | | | | | |
| (SOFR + 3.00%), 7.60%, 2/24/2031(1) | | | 1,338 | | | | 1,338 | |
| Applied Systems, Inc. Second Lien Term Loan | | | | | | | | |
| (SOFR + 5.25%), 9.85%, 2/23/2032(1) | | | 471 | | | | 485 | |
| | | Principal
Amount | | Value |
| SOFTWARE (continued) | | | | | | | | |
| CommerceHub, Inc. First Lien Term Loan | | | | | | | | |
| (SOFR + 4.00%), 9.20%, 12/29/2027(1) | | | 699 | | | $ | 649 | |
| CommerceHub, Inc. Second Lien Term Loan | | | | | | | | |
| (SOFR + 7.00%), 12.20%, 12/29/2028(1) | | | 60 | | | | 47 | |
| Epicor Software Corp. First Lien Term Loan E | | | | | | | | |
| (SOFR + 3.25%), 8.10%, 5/30/2031(1) | | | 1,036 | | | | 1,036 | |
| Mobileum Acquisitionco LLC First Lien Term Loan | | | | | | | | |
| (SOFR + 1.00%), 5.95%, 9/11/2029(1) | | | 338 | | | | 323 | |
| Orchid Merger Sub II LLC Term Loan | | | | | | | | |
| (SOFR + 4.75%), 10.10%, 7/27/2027(1) | | | 737 | | | | 461 | |
| Renaissance Holding Corp. First Lien Term Loan | | | | | | | | |
| (SOFR + 4.25%), 9.10%, 4/8/2030(1) | | | 773 | | | | 772 | |
| UKG, Inc. First Lien Term Loan | | | | | | | | |
| (SOFR + 3.25%), 8.55%, 2/10/2031(1) | | | 2,313 | | | | 2,313 | |
| | | | | | | | 7,424 | |
| SPECIALTY RETAIL - 1.0% | | | | | | | | |
| Evergreen Acqco 1 LP First Lien Term Loan | | | | | | | | |
| (SOFR + 3.75%), 8.39%, 4/26/2028(1) | | | 710 | | | | 710 | |
| | | | | | | | | |
| TECHNOLOGY HARDWARE, STORAGE & PERIPHERALS - 1.1% | | | | | | | | |
| Ivanti Software, Inc. First Lien Term Loan | | | | | | | | |
| (SOFR + 4.00%), 9.57%, 12/1/2027(1) | | | 870 | | | | 724 | |
| Ivanti Software, Inc. First Lien Term Loan B1 | | | | | | | | |
| (SOFR + 4.25%), 9.83%, 12/1/2027(1) | | | 43 | | | | 37 | |
| | | | | | | | 761 | |
| TRANSPORTATION - 1.3% | | | | | | | | |
| SIRVA Worldwide, Inc. First Lien Term Loan | | | | | | | | |
| (SOFR + 8.00%), 12.81%, 8/20/2029(1) | | | 345 | | | | 335 | |
| (SOFR + 8.00%), 13.13%, 8/20/2029(1) | | | 812 | | | | 609 | |
| | | | | | | | 944 | |
| WIRELESS TELECOMMUNICATION SERVICES - 1.9% | | | | | | | | |
| CCI Buyer, Inc. First Lien Term Loan | | | | | | | | |
| (SOFR + 4.00%), 8.60%, 12/17/2027(1) | | | 1,363 | | | | 1,361 | |
| | | | | | | | | |
| Total bank loans | | | | | | | | |
| (Cost $64,559) | | | | | | | 63,783 | |
| | | | | | | | | |
| CORPORATE BONDS - 2.8% | | | | | | | | |
| | | | | | | | | |
| BANKS - 0.8% | | | | | | | | |
| Goldman Sachs Capital II | | | | | | | | |
| (SOFR + 1.03%), 6.04%, 10/28/2024(1)(3) | | | 720 | | | | 606 | |
| | | | | | | | | |
| DIVERSIFIED TELECOMMUNICATION SERVICES - 0.3% | | | | | | | | |
| Zayo Group Holdings, Inc. | | | | | | | | |
| 4.00%, 3/1/2027(4) | | | 226 | | | | 202 | |
| | | | | | | | | |
| FOOD PRODUCTS - 0.0%^ | | | | | | | | |
| H-Food Holdings LLC | | | | | | | | |
| 8.50%, 6/1/2026(4) | | | 5 | | | | — | ^ |
| | | | | | | | | |
| HOTELS, RESTAURANTS & LEISURE - 1.4% | | | | | | | | |
| TKC Holdings, Inc. | | | | | | | | |
| 6.88%, 5/15/2028(4) | | | 274 | | | | 271 | |
| 10.50%, 5/15/2029(4) | | | 718 | | | | 722 | |
| | | | | | | | 993 | |
| TEXTILES, APPAREL & LUXURY GOODS - 0.3% | | | | | | | | |
| S&S Holdings LLC | | | | | | | | |
| 8.38%, 10/1/2031(4) | | | 209 | | | | 211 | |
| | | | | | | | | |
| Total corporate bonds | | | | | | | | |
| (Cost $2,052) | | | | | | | 2,012 | |
| | | Shares
Held | | | |
| PREFERRED STOCK - 0.3% | | | | | | | | |
| | | Shares
Held | | Value |
| TRANSPORTATION - 0.3% | | | | | | |
| Sirva Worldwide Preferred Stock (Cost $41)* | | | – | ^ | | $ | 182 | |
| | | | | | | | | |
| COMMON STOCKS - 0.2% | | | | | | | | |
| | | | | | | | | |
| SOFTWARE - 0.2% | | | | | | | | |
| Matrix Exit Equity | | | 16 | | | | 156 | |
| | | | | | | | | |
| TRANSPORTATION - 0.0%^ | | | | | | | | |
| SIRVA Worldwide, Inc.* | | | 2 | | | | 5 | |
| | | | | | | | | |
| Total common stocks | | | | | | | | |
| (Cost $93) | | | | | | | 161 | |
| | | No. of
Warrants‡ | | | |
| WARRANTS - 0.0% | | | | | | |
| | | | | | | |
| FINANCIAL SERVICES - 0.0% | | | | | | | | |
Carnelian Point Holdings LP, expiring 6/30/2027,
strike price 10 | | | | | | | | |
| (Cost $—)(5)(6)(7)* | | | 1 | | | | — | |
| | | Shares
Held | | | |
| SHORT-TERM INVESTMENT - 1.0% | | | | | | | | |
| | | | | | | | | |
| INVESTMENT COMPANY - 1.0% | | | | | | | | |
| BlackRock Liquidity Funds Treasury Trust Fund - Institutional Class, 4.85%(8) (Cost $755) | | | 755 | | | | 755 | |
| | | | | | | | | |
| Total investments - 91.9% | | | | | | | | |
| (Cost $67,500) | | | | | | | 66,893 | |
| | | | | | | | | |
| Other assets less liabilities - 8.1% | | | | | | | 5,922 | |
| Total net assets - 100.0%# | | | | | | $ | 72,815 | |
| (1) | Variable or floating rate security, linked to the referenced benchmark. Interest rates reset periodically. Certain variable rate securities are not based on a published reference rate and spread but are determined by the issuer or agent and are based on current market conditions. The interest rate shown is the current rate as of September 30, 2024. |
| (2) | The Fund considers the company to be from outside the United States. |
| | | | | Trading |
| Security | | Country | | Currency |
| Ardonagh Group Finance Pty Ltd. First Lien Term Loan B, 8.52%, 2/18/2031 | | Australia | | USD |
| Jones DesLauriers Insurance Management, Inc. First Lien Term Loan, 8.40%, 3/15/2030 | | Canada | | USD |
| Motion Finco SARL First Lien B3, 8.10%, 11/13/2029 | | Luxembourg | | USD |
| (3) | Perpetual security. The rate reflected was the rate in effect on September 30, 2024. The maturity date reflects the next call date. |
| (4) | Security exempt from registration pursuant to Rule 144A under the Securities Act of 1933. May be resold in transactions exempt from registration, normally to qualified institutional buyers. |
| (6) | Security is valued using significant unobservable inputs and is classified as Level 3 in the fair value hierarchy. |
| (7) | Valued at a fair value in accordance with procedures established by the board of directors of Artisan Partners Funds. In total, securities valued at a fair value were $0, or 0.0% of total net assets. See notes 2(b) and 4 in Notes to Financial Statements for additional information. |
| (8) | Represents the current yield as of September 30, 2024. |
UNFUNDED LOAN COMMITMENTS
Pursuant to the terms of the following bank loan agreements, the portfolio had unfunded loan commitments of $184 or 0.3% of the total net assets as of September 30, 2024, which could be drawn at the option of the borrower:
| Borrower | | Unfunded
Commitment
Amount | | Unfunded
Value | | Unrealized
Appreciation
(Depreciation) |
| Epicor Software Corp. Delayed Draw Term Loan | | $121 | | | $121 | | | $– | ^ |
| Ryan LLC Delayed Draw Term Loan | | 63 | | | 62 | | | (1) | |
| | | $184 | | | $183 | | | $(1 | ) |
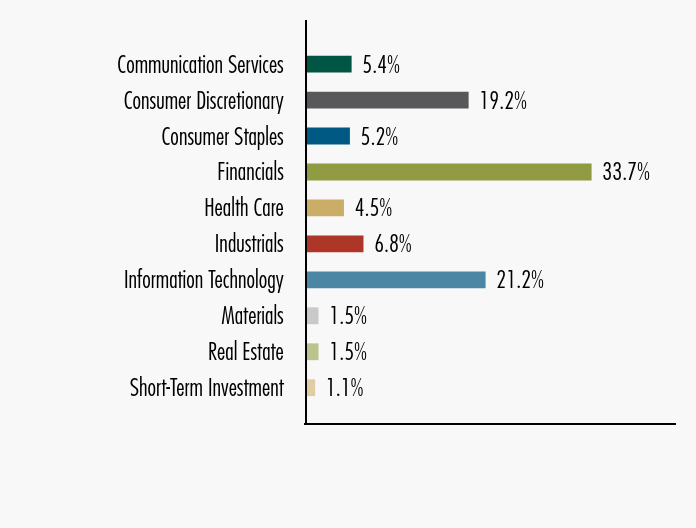
PORTFOLIO DIVERSIFICATION
Dollar values in thousands
| | | Value | | Percentage of
Total Investments |
| Communication Services | | $ | 3,611 | | | | 5.4 | % |
| Consumer Discretionary | | | 12,827 | | | | 19.2 | |
| Consumer Staples | | | 3,494 | | | | 5.2 | |
| Financials | | | 22,541 | | | | 33.7 | |
| Health Care | | | 3,010 | | | | 4.5 | |
| Industrials | | | 4,561 | | | | 6.8 | |
| Information Technology | | | 14,101 | | | | 21.1 | |
| Materials | | | 996 | | | | 1.5 | |
| Real Estate | | | 997 | | | | 1.5 | |
| Short-Term Investment | | | 755 | | | | 1.1 | |
| Total investments | | $ | 66,893 | | | | 100.0 | % |
Definitions of abbreviations and footnotes are detailed on page 2-3.
The accompanying notes are an integral part of the financial statements.
ARTISAN FOCUS FUND
Schedule of Investments — September 30, 2024
Shares and dollar values in thousands except per share amounts
| | | Shares
Held | | Value |
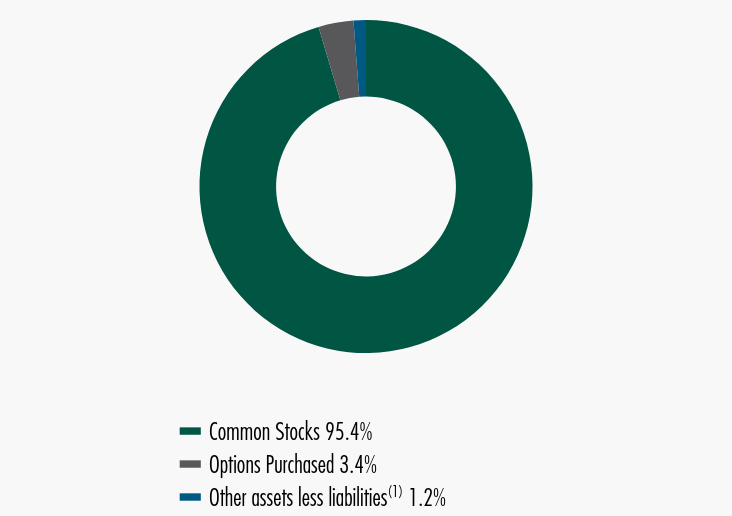
| COMMON STOCKS - 95.4% | | | | | | | | |
| | | | | | | | | |
| AEROSPACE & DEFENSE - 15.0% | | | | | | | | |
| General Electric Co. | | | 532 | | | $ | 100,349 | |
| Safran SA(1) | | | 150 | | | | 35,150 | |
| TransDigm Group, Inc. | | | 27 | | | | 38,347 | |
| | | | | | | | 173,846 | |
| CAPITAL MARKETS - 10.0% | | | | | | | | |
| Moody’s Corp. | | | 61 | | | | 29,151 | |
| Nasdaq, Inc. | | | 623 | | | | 45,494 | |
| S&P Global, Inc. | | | 80 | | | | 41,413 | |
| | | | | | | | 116,058 | |
| CHEMICALS - 4.0% | | | | | | | | |
| Linde plc | | | 98 | | | | 46,606 | |
| | | | | | | | | |
| COMMUNICATIONS EQUIPMENT - 3.1% | | | | | | | | |
| Motorola Solutions, Inc. | | | 79 | | | | 35,469 | |
| | | | | | | | | |
| ELECTRIC UTILITIES - 5.3% | | | | | | | | |
| Constellation Energy Corp. | | | 238 | | | | 62,006 | |
| | | | | | | | | |
| ELECTRICAL EQUIPMENT - 2.3% | | | | | | | | |
| Siemens Energy AG(1)* | | | 724 | | | | 26,637 | |
| | | | | | | | | |
| ENTERTAINMENT - 2.6% | | | | | | | | |
| Spotify Technology SA* | | | 81 | | | | 29,959 | |
| | | | | | | | | |
| GROUND TRANSPORTATION - 2.6% | | | | | | | | |
| Canadian Pacific Kansas City Ltd.(1) | | | 348 | | | | 29,757 | |
| | | | | | | | | |
| HEALTH CARE EQUIPMENT & SUPPLIES - 2.9% | | | | | | | | |
| Intuitive Surgical, Inc.* | | | 69 | | | | 33,729 | |
| | | | | | | | | |
| LIFE SCIENCES TOOLS & SERVICES - 4.5% | | | | | | | | |
| Danaher Corp. | | | 63 | | | | 17,478 | |
| Mettler-Toledo International, Inc.* | | | 23 | | | | 35,090 | |
| | | | | | | | 52,568 | |
| PHARMACEUTICALS - 1.5% | | | | | | | | |
| Eli Lilly & Co. | | | 20 | | | | 17,615 | |
| | | | | | | | | |
| SEMICONDUCTORS & SEMICONDUCTOR EQUIPMENT - 14.4% | | | | | | | | |
| NVIDIA Corp.(2) | | | 759 | | | | 92,198 | |
| Taiwan Semiconductor Manufacturing Co. Ltd., ADR(1) | | | 434 | | | | 75,355 | |
| | | | | | | | 167,553 | |
| SOFTWARE - 11.8% | | | | | | | | |
| Microsoft Corp.(2) | | | 262 | | | | 112,738 | |
| ServiceNow, Inc.* | | | 27 | | | | 24,371 | |
| | | | | | | | 137,109 | |
| SPECIALIZED REITS - 7.4% | | | | | | | | |
| American Tower Corp. | | | 143 | | | | 33,159 | |
| Digital Realty Trust, Inc. | | | 36 | | | | 5,795 | |
| Equinix, Inc. | | | 53 | | | | 46,624 | |
| | | | | | | | 85,578 | |
| TECHNOLOGY HARDWARE, STORAGE & PERIPHERALS - 8.0% | | | | | | | | |
| Apple, Inc. | | | 399 | | | | 92,868 | |
| | | | | | | | | |
| Total common stocks | | | | | | | | |
| (Cost $838,620) | | | | | | | 1,107,358 | |
| | | No. of
Contracts‡ | | Value |
| OPTIONS PURCHASED - 3.4% | | | | | | | | |
| | | | | | | | | |
| CALL OPTIONS - 3.0% | | | | | | | | |
| ELECTRIC UTILITIES - 0.7% | | | | | | | | |
| Constellation Energy Corp. | | | | | | | | |
| 12/20/2024 at USD 200.00; Notional Amount: | | | | | | | | |
| USD 29,668 | | | 1,141 | | | $ | 7,485 | |
| | | | | | | | | |
| INTERACTIVE MEDIA & SERVICES - 2.2% | | | | | | | | |
| Meta Platforms, Inc. | | | | | | | | |
| 12/20/2024 at USD 350.00; Notional Amount: | | | | | | | | |
| USD 64,285 | | | 1,123 | | | | 25,501 | |
| | | | | | | | | |
| LIFE SCIENCES TOOLS & SERVICES - 0.1% | | | | | | | | |
| Danaher Corp. | | | | | | | | |
| 12/20/2024 at USD 280.00; Notional Amount: | | | | | | | | |
| USD 35,448 | | | 1,275 | | | | 1,657 | |
| Total Call Options | | | | | | | 34,643 | |
| | | | | | | | | |
| PUT OPTIONS - 0.4% | | | | | | | | |
| ENTERTAINMENT - 0.1% | | | | | | | | |
| Spotify Technology SA | | | | | | | | |
| 11/15/2024 at USD 350.00; Notional Amount: | | | | | | | | |
| USD 28,229 | | | 766 | | | | 1,187 | |
| | | | | | | | | |
| SOFTWARE - 0.3% | | | | | | | | |
| Microsoft Corp. | | | | | | | | |
| 11/15/2024 at USD 425.00; Notional Amount: | | | | | | | | |
| USD 114,460 | | | 2,660 | | | | 3,279 | |
| | | | | | | | | |
| SPECIALIZED REITS - 0.0%^ | | | | | | | | |
| American Tower Corp. | | | | | | | | |
| 10/18/2024 at USD 230.00; Notional Amount: | | | | | | | | |
| USD 31,582 | | | 1,358 | | | | 523 | |
| Total Put Options | | | | | | | 4,989 | |
| Total Options Purchased | | | | | | | | |
| (Cost $27,809) | | | | | | | 39,632 | |
| | | Shares
Held | | | |
| SHORT-TERM INVESTMENT - 0.9% | | | | | | | | |
| | | | | | | | | |
| INVESTMENT COMPANY - 0.9% | | | | | | | | |
| BlackRock Liquidity Funds Treasury Trust Fund - Institutional Class, 4.85%(3) (Cost $10,467) | | | 10,467 | | | | 10,467 | |
| | | | | | | | | |
| Total investments - 99.7% | | | | | | | | |
| (Cost $876,896) | | | | | | | 1,157,457 | |
| | | | | | | | | |
| WRITTEN OPTION CONTRACTS - (0.3)% | | | | | | | | |
| (Premiums received $(3,811)) | | | | | | | (3,263 | ) |
| | | | | | | | | |
| Other assets less liabilities - 0.6% | | | | | | | 6,808 | |
| Total net assets - 100.0%# | | | | | | $ | 1,161,002 | |
| (1) | The Fund considers the company to be from outside the United States. |
| Security | | Country | | Trading
Currency |
| Canadian Pacific Kansas City Ltd. | | Canada | | USD |
| Safran SA | | France | | EUR |
| Siemens Energy AG | | Germany | | EUR |
| Taiwan Semiconductor Manufacturing Co. Ltd. | | Taiwan | | USD |
| (2) | At September 30, 2024, all or a portion of this security was pledged to cover collateral requirements for written options. |
| (3) | Represents the current yield as of September 30, 2024. |
PORTFOLIO DIVERSIFICATION
Dollar values in thousands
| | | Value | | Percentage of
Total Investments |
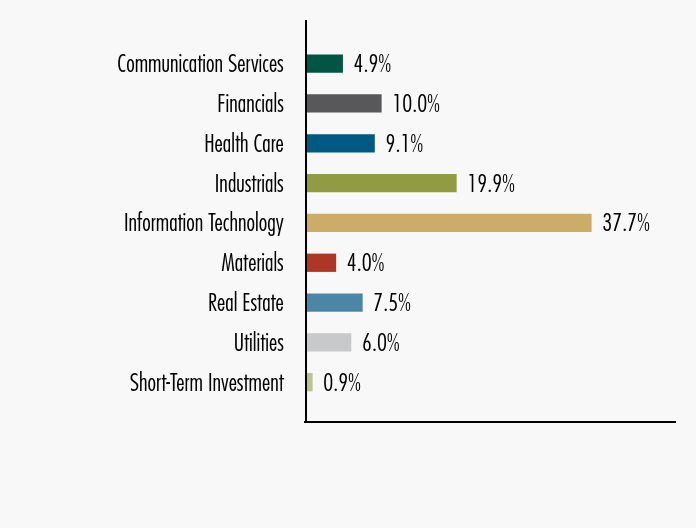
| Communication Services | | $ | 56,647 | | | | 4.9 | % |
| Financials | | | 116,058 | | | | 10.0 | |
| Health Care | | | 105,569 | | | | 9.1 | |
| Industrials | | | 230,239 | | | | 19.9 | |
| Information Technology | | | 436,279 | | | | 37.7 | |
| Materials | | | 46,606 | | | | 4.0 | |
| Real Estate | | | 86,101 | | | | 7.5 | |
| Utilities | | | 69,491 | | | | 6.0 | |
| Short-Term Investment | | | 10,467 | | | | 0.9 | |
| Total investments | | $ | 1,157,457 | | | | 100.0 | % |
FOREIGN CURRENCY FORWARD CONTRACTS
Values in thousands
| Currency Purchased | | Currency Sold | | Counterparty | | | Settlement
Date | | Unrealized
Appreciation
(Depreciation) |
| CAD | | | 50,076 | | | USD | | | 36,512 | | | JPM | | | 10/15/2024 | | $ | 525 | |
| EUR | | | 44,753 | | | USD | | | 49,217 | | | JPM | | | 10/15/2024 | | | 628 | |
| USD | | | 27,553 | | | CAD | | | 37,079 | | | JPM | | | 10/15/2024 | | | 128 | |
| USD | | | 8,244 | | | EUR | | | 7,376 | | | JPM | | | 10/15/2024 | | | 29 | |
| Total unrealized appreciation | | | | 1,310 | |
| EUR | | | 36,075 | | | USD | | | 40,398 | | | JPM | | | 10/15/2024 | | | (218 | ) |
| USD | | | 36,668 | | | CAD | | | 50,076 | | | JPM | | | 10/15/2024 | | | (370 | ) |
| USD | | | 138,784 | | | EUR | | | 126,607 | | | JPM | | | 10/15/2024 | | | (2,227 | ) |
| Total unrealized depreciation | | | | (2,815 | ) |
| Net unrealized depreciation | | | $ | (1,505 | ) |
WRITTEN OPTION CONTRACTS
Dollar values in thousands except exercise price
Call Options
Number of
Contracts‡ | | | Description | | Exercise
Price | | Notional
Amount | | Expiration Date | | Premiums Paid/
(Received)
by Fund | | Market
Value | | Unrealized
Appreciation/
(Depreciation) |
| 1,358 | | | American Tower Corp. | | $ | 240.00 | | | $ | 31,582 | | | 11/15/24 | | $ | (582 | ) | | $ | (693 | ) | | $ | (110 | ) |
| 3,621 | | | Constellation Energy Corp. | | | 300.00 | | | | 94,153 | | | 11/15/24 | | | (2,351 | ) | | | (1,810 | ) | | | 540 | |
| 766 | | | Spotify Technology SA | | | 410.00 | | | | 28,229 | | | 11/15/24 | | | (878 | ) | | | (760 | ) | | | 118 | |
| Total written option contracts | | | $ | (3,811 | ) | | $ | (3,263 | ) | | $ | 548 | |
Definitions of abbreviations and footnotes are detailed on page 2-3.
The accompanying notes are an integral part of the financial statements.
ARTISAN GLOBAL DISCOVERY FUND
Schedule of Investments — September 30, 2024
Shares and dollar values in thousands
| | | Shares
Held | | Value | |
| COMMON STOCKS - 94.1% |
| |
| CANADA - 1.3% |
| Altus Group Ltd. | | | 38 | | | $ | 1,554 | |
| Colliers International Group, Inc. | | | 11 | | | | 1,715 | |
| | | | | | | | 3,269 | |
| CHINA - 0.9% |
| Trip.com Group Ltd., ADR* | | | 38 | | | | 2,251 | |
| |
| DENMARK - 4.0% |
| Ascendis Pharma A/S, ADR* | | | 45 | | | | 6,750 | |
| Novonesis (Novozymes) B, Class B | | | 42 | | | | 3,027 | |
| | | | | | | | 9,777 | |
| GERMANY - 7.9% |
| adidas AG | | | 26 | | | | 6,982 | |
| Douglas AG* | | | 67 | | | | 1,543 | |
| Gerresheimer AG | | | 42 | | | | 3,755 | |
| Nemetschek SE | | | 37 | | | | 3,811 | |
| Sartorius AG (Preference) | | | 11 | | | | 3,075 | |
| | | | | | | | 19,166 | |
| HONG KONG - 2.8% |
| Techtronic Industries Co. Ltd. | | | 447 | | | | 6,789 | |
| |
| ITALY - 1.0% |
| Brunello Cucinelli SpA | | | 22 | | | | 2,422 | |
| NETHERLANDS - 5.3% |
| Argenx SE, ADR* | | | 19 | | | | 10,064 | |
| Redcare Pharmacy NV(1)* | | | 20 | | | | 2,816 | |
| | | | | | | | 12,880 | |
| SINGAPORE - 1.6% |
| Sea Ltd., ADR* | | | 40 | | | | 3,802 | |
| |
| SWEDEN - 1.7% |
| MIPS AB(1) | | | 78 | | | | 4,176 | |
| SWITZERLAND - 2.5% |
| Galderma Group AG* | | | 39 | | | | 3,642 | |
| Sandoz Group AG | | | 57 | | | | 2,374 | |
| | | | | | | | 6,016 | |
| UNITED KINGDOM - 9.0% |
| Babcock International Group plc | | | 800 | | | | 5,054 | |
| London Stock Exchange Group plc | | | 61 | | | | 8,325 | |
| Melrose Industries plc | | | 714 | | | | 4,347 | |
| Smiths Group plc | | | 186 | | | | 4,164 | |
| | | | | | | | 21,890 | |
| UNITED STATES - 56.1% |
| Advanced Micro Devices, Inc.* | | | 16 | | | | 2,556 | |
| Arista Networks, Inc.* | | | 4 | | | | 1,716 | |
| Atlassian Corp., Class A* | | | 17 | | | | 2,693 | |
| Bentley Systems, Inc., Class B | | | 57 | | | | 2,879 | |
| CCC Intelligent Solutions Holdings, Inc.* | | | 272 | | | | 3,004 | |
| Clearwater Analytics Holdings, Inc., Class A* | | | 200 | | | | 5,047 | |
| Coherent Corp.* | | | 11 | | | | 992 | |
| Elastic NV* | | | 23 | | | | 1,753 | |
| Equifax, Inc. | | | 12 | | | | 3,423 | |
| Flex Ltd.* | | | 59 | | | | 1,968 | |
| Gitlab, Inc., Class A* | | | 29 | | | | 1,498 | |
| GoDaddy, Inc., Class A* | | | 12 | | | | 1,942 | |
| Guidewire Software, Inc.* | | | 28 | | | | 5,069 | |
| Hubbell, Inc., Class B | | | 10 | | | | 4,393 | |
| HubSpot, Inc.* | | | 6 | | | | 2,931 | |
| | | Shares
Held | | Value | |
| UNITED STATES (continued) |
| Illumina, Inc.* | | | 14 | | | $ | 1,769 | |
| Ingersoll Rand, Inc. | | | 30 | | | | 2,910 | |
| Insmed, Inc.* | | | 27 | | | | 1,981 | |
| iRhythm Technologies, Inc.* | | | 42 | | | | 3,090 | |
| Lattice Semiconductor Corp.* | | | 100 | | | | 5,313 | |
| Liberty Media Corp-Liberty Formula One, Class C* | | | 47 | | | | 3,611 | |
| Live Nation Entertainment, Inc.* | | | 28 | | | | 3,021 | |
| MACOM Technology Solutions Holdings, Inc.* | | | 64 | | | | 7,176 | |
| Monday.com Ltd.* | | | 9 | | | | 2,458 | |
| Monolithic Power Systems, Inc. | | | 3 | | | | 2,805 | |
| ON Semiconductor Corp.* | | | 45 | | | | 3,294 | |
| Onto Innovation, Inc.* | | | 15 | | | | 3,147 | |
| Pool Corp. | | | 6 | | | | 2,224 | |
| Quanta Services, Inc. | | | 13 | | | | 3,830 | |
| Saia, Inc.* | | | 9 | | | | 4,068 | |
| Samsara, Inc., Class A* | | | 25 | | | | 1,201 | |
| Spotify Technology SA* | | | 15 | | | | 5,501 | |
| Tetra Tech, Inc. | | | 46 | | | | 2,180 | |
| Tradeweb Markets, Inc., Class A | | | 27 | | | | 3,331 | |
| Trex Co., Inc.* | | | 44 | | | | 2,943 | |
| Twist Bioscience Corp.* | | | 97 | | | | 4,364 | |
| Tyler Technologies, Inc.* | | | 17 | | | | 9,749 | |
| Veeva Systems, Inc., Class A* | | | 16 | | | | 3,305 | |
| Veracyte, Inc.* | | | 84 | | | | 2,874 | |
| West Pharmaceutical Services, Inc. | | | 17 | | | | 5,229 | |
| Westinghouse Air Brake Technologies Corp. | | | 18 | | | | 3,303 | |
| | | | | | | | 136,541 | |
| Total common stocks |
| (Cost $163,112) | | | | | | | 228,979 | |
| | | | | | | | | |
| SHORT-TERM INVESTMENT - 4.9% |
| 2 | | | | | | | | |
| INVESTMENT COMPANY - 4.9% |
| BlackRock Liquidity Funds Treasury Trust Fund - Institutional Class, 4.85%(2) (Cost $12,033) | | | 12,033 | | | | 12,033 | |
| | | | | | | | | |
Total investments - 99.0%
(Cost $175,145) | | | | | | | 241,012 | |
| | | | | | | | | |
| Other assets less liabilities - 1.0% | | | | | | | 2,383 | |
| | | | | | | | | |
| Total net assets - 100.0%# | | | | | | $ | 243,395 | |
| (1) | Regulation S is an exemption for securities offerings that are made outside of the United States and do not involve direct selling efforts in the United States. Resale restrictions may apply for purposes of the Securities Act of 1933. At September 30, 2024, the value of these securities was $6,992 or 2.9% of net assets. |
| (2) | Represents the current yield as of September 30, 2024. |
PORTFOLIO DIVERSIFICATION
Dollar values in thousands
| | | Value | | | Percentage of
Total Investments | |
| Communication Services | | $ | 15,935 | | | | 6.6 | % |
| Consumer Discretionary | | | 19,598 | | | | 8.1 | |
| Consumer Staples | | | 2,816 | | | | 1.2 | |
| Financials | | | 11,656 | | | | 4.8 | |
| Health Care | | | 52,272 | | | | 21.7 | |
| Industrials | | | 47,404 | | | | 19.7 | |
| Information Technology | | | 73,002 | | | | 30.2 | |
| Materials | | | 3,027 | | | | 1.3 | |
| Real Estate | | | 3,269 | | | | 1.4 | |
| Short-Term Investment | | | 12,033 | | | | 5.0 | |
| Total investments | | $ | 241,012 | | | | 100.0 | % |
Definitions of abbreviations and footnotes are detailed on page 2-3.
The accompanying notes are an integral part of the financial statements.
ARTISAN GLOBAL EQUITY FUND
Schedule of Investments — September 30, 2024
Shares and dollar values in thousands
| | | Shares
Held | | Value | |
| COMMON STOCKS - 97.7% |
| |
| BELGIUM - 3.2% |
| Financiere de Tubize SA | | | 18 | | | $ | 2,668 | |
| UCB SA | | | 18 | | | | 3,229 | |
| | | | | | | | 5,897 | |
| CANADA - 1.2% |
| Shopify, Inc., Class A* | | | 28 | | | | 2,206 | |
| | | | | | | | | |
| CHILE - 0.7% |
| Holding Bursatil Regional SA | | | 320 | | | | 1,288 | |
| | | | | | | | | |
| CHINA - 1.1% |
| Innovent Biologics, Inc.(1)* | | | 341 | | | | 2,066 | |
| | | | | | | | | |
| DENMARK - 5.0% |
| NKT A/S* | | | 35 | | | | 3,263 | |
| Novo Nordisk A/S, Class B | | | 43 | | | | 5,026 | |
| Novonesis (Novozymes) B, Class B | | | 11 | | | | 812 | |
| | | | | | | | 9,101 | |
| FRANCE - 8.3% |
| Accor SA | | | 27 | | | | 1,152 | |
| Air Liquide SA | | | 38 | | | | 7,342 | |
| BNP Paribas SA | | | 13 | | | | 874 | |
| Bureau Veritas SA | | | 14 | | | | 454 | |
| Dassault Aviation SA | | | 6 | | | | 1,287 | |
| Engie SA | | | 153 | | | | 2,651 | |
| Pernod Ricard SA | | | 9 | | | | 1,321 | |
| | | | | | | | 15,081 | |
| GERMANY - 3.3% |
| flatexDEGIRO AG | | | 68 | | | | 979 | |
| TUI AG* | | | 647 | | | | 4,922 | |
| | | | | | | | 5,901 | |
| ITALY - 9.3% |
| BFF Bank SpA(1) | | | 792 | | | | 8,685 | |
| Leonardo SpA | | | 73 | | | | 1,632 | |
| Mediobanca Banca di Credito Finanziario SpA | | | 143 | | | | 2,442 | |
| UniCredit SpA | | | 62 | | | | 2,725 | |
| Wizz Air Holdings plc(1)* | | | 68 | | | | 1,312 | |
| | | | | | | | 16,796 | |
| JAPAN - 4.3% |
| Mitsui Fudosan Co. Ltd. | | | 8 | | | | 76 | |
| Nippon Sanso Holdings Corp. | | | 53 | | | | 1,938 | |
| Otsuka Holdings Co. Ltd. | | | 43 | | | | 2,424 | |
| Resona Holdings, Inc. | | | 74 | | | | 511 | |
| Sumitomo Mitsui Financial Group, Inc. | | | 106 | | | | 2,239 | |
| Takeuchi Manufacturing Co. Ltd. | | | 20 | | | | 607 | |
| | | | | | | | 7,795 | |
| NETHERLANDS - 0.5% |
| Heineken NV | | | 10 | | | | 855 | |
| | | | | | | | | |
| RUSSIA - 0.0% |
| Sberbank of Russia PJSC(2)(3)(4) | | | 1,137 | | | | — | |
| |
| SOUTH KOREA - 2.4% |
| Hanwha Aerospace Co. Ltd. | | | 7 | | | | 1,552 | |
| Hanwha Industrial Solutions Co. Ltd.* | | | 8 | | | | 193 | |
| LIG Nex1 Co. Ltd. | | | 16 | | | | 2,520 | |
| | | | | | | | 4,265 | |
| SPAIN - 1.8% |
| Aena SME SA(1) | | | 15 | | | | 3,303 | |
| | | Shares
Held | | Value | |
| SWITZERLAND - 7.5% |
| Galderma Group AG* | | | 11 | | | $ | 977 | |
| Medacta Group SA(1) | | | 5 | | | | 788 | |
| SGS SA | | | 31 | | | | 3,407 | |
| UBS Group AG | | | 275 | | | | 8,472 | |
| | | | | | | | 13,644 | |
| UNITED KINGDOM - 12.9% |
| 3i Group plc | | | 38 | | | | 1,677 | |
| Babcock International Group plc | | | 573 | | | | 3,619 | |
| BAE Systems plc | | | 341 | | | | 5,646 | |
| British American Tobacco plc | | | 37 | | | | 1,345 | |
| Domino’s Pizza Group plc | | | 523 | | | | 2,105 | |
| Melrose Industries plc | | | 575 | | | | 3,500 | |
| National Grid plc | | | 320 | | | | 4,405 | |
| Reckitt Benckiser Group plc | | | 17 | | | | 1,026 | |
| | | | | | | | 23,323 | |
| UNITED STATES - 36.2% |
| Amazon.com, Inc.* | | | 39 | | | | 7,300 | |
| Aon plc, Class A | | | 10 | | | | 3,552 | |
| Arthur J Gallagher & Co. | | | 13 | | | | 3,785 | |
| Cigna Group (The) | | | 8 | | | | 2,763 | |
| Coca-Cola Co. (The) | | | 50 | | | | 3,583 | |
| CoStar Group, Inc.* | | | 31 | | | | 2,347 | |
| FactSet Research Systems, Inc. | | | 4 | | | | 1,853 | |
| Geron Corp.* | | | 393 | | | | 1,784 | |
| Halozyme Therapeutics, Inc.* | | | 135 | | | | 7,713 | |
| Intuit, Inc. | | | 2 | | | | 1,282 | |
| Legend Biotech Corp., ADR* | | | 24 | | | | 1,176 | |
| Linde plc | | | 2 | | | | 1,006 | |
| Meta Platforms, Inc., Class A | | | 7 | | | | 3,945 | |
| Microsoft Corp. | | | 5 | | | | 1,996 | |
| Natera, Inc.* | | | 64 | | | | 8,150 | |
| Netflix, Inc.* | | | 3 | | | | 1,922 | |
| S&P Global, Inc. | | | 3 | | | | 1,761 | |
| Stryker Corp. | | | 7 | | | | 2,499 | |
| TransUnion | | | 19 | | | | 1,950 | |
| Visa, Inc., Class A | | | 20 | | | | 5,398 | |
| | | | | | | | 65,765 | |
| Total common stocks |
| (Cost $144,825) | | | | | | | 177,286 | |
| | | | | | | | | |
| SHORT-TERM INVESTMENT - 0.8% |
| 2 | | | | | | | | |
| INVESTMENT COMPANY - 0.8% |
| BlackRock Liquidity Funds Treasury Trust Fund - Institutional Class, 4.85%(5) (Cost $1,539) | | | 1,539 | | | | 1,539 | |
| | | | | | | | | |
Total investments - 98.5%
(Cost $146,364) | | | | | | | 178,825 | |
| | | | | | | | | |
| Other assets less liabilities - 1.5% | | | | | | | 2,671 | |
| | | | | | | | | |
| Total net assets - 100.0%# | | | | | | $ | 181,496 | |
| (1) | Regulation S is an exemption for securities offerings that are made outside of the United States and do not involve direct selling efforts in the United States. Resale restrictions may apply for purposes of the Securities Act of 1933. At September 30, 2024, the value of these securities was $16,154 or 8.9% of net assets. |
| (2) | Valued at a fair value in accordance with procedures established by the board of directors of Artisan Partners Funds. In total, securities valued at a fair value were $0, or 0.0% of total net assets. See notes 2(b) and 4 in Notes to Financial Statements for additional information. |
| (3) | Security is valued using significant unobservable inputs and is classified as Level 3 in the fair value hierarchy. |
| (4) | Security is restricted. |
| Security | | Acquisition Date | | Cost | | | Value | | | Percentage of
Total Net Assets | |
| Sberbank of Russia PJSC | | 9/16/2021 - 2/11/2022 | | $ | 4,750 | | | $ | — | | | | 0.0% | |
| (5) | Represents the current yield as of September 30, 2024. |
PORTFOLIO DIVERSIFICATION
Dollar values in thousands
| | | Value | | | Percentage of
Total Investments | |
| Communication Services | | $ | 5,867 | | | | 3.3 | % |
| Consumer Discretionary | | | 15,479 | | | | 8.7 | |
| Consumer Staples | | | 8,130 | | | | 4.5 | |
| Financials | | | 46,241 | | | | 25.7 | |
| Health Care | | | 41,263 | | | | 23.1 | |
| Industrials | | | 34,245 | | | | 19.2 | |
| Information Technology | | | 5,484 | | | | 3.1 | |
| Materials | | | 11,098 | | | | 6.2 | |
| Real Estate | | | 2,423 | | | | 1.4 | |
| Utilities | | | 7,056 | | | | 3.9 | |
| Short-Term Investment | | | 1,539 | | | | 0.9 | |
| Total investments | | $ | 178,825 | | | | 100.0 | % |
Definitions of abbreviations and footnotes are detailed on page 2-3.
The accompanying notes are an integral part of the financial statements.
ARTISAN GLOBAL OPPORTUNITIES FUND
Schedule of Investments — September 30, 2024
Shares and dollar values in thousands
| | | Shares
Held | | Value | |
| COMMON STOCKS - 96.1% |
| |
| BRAZIL - 1.1% |
| NU Holdings Ltd., Class A* | | | 2,028 | | | $ | 27,678 | |
| | | | | | | | | |
| CANADA - 1.8% |
| Shopify, Inc., Class A* | | | 569 | | | | 45,581 | |
| | | | | | | | | |
| CHINA - 3.7% |
| Meituan, Class B(1)* | | | 720 | | | | 15,930 | |
| Tencent Holdings Ltd. | | | 1,366 | | | | 78,113 | |
| | | | | | | | 94,043 | |
| DENMARK - 3.6% |
| Novo Nordisk A/S, Class B | | | 791 | | | | 92,930 | |
| | | | | | | | | |
| GERMANY - 2.9% |
| adidas AG | | | 282 | | | | 74,606 | |
| | | | | | | | | |
| HONG KONG - 3.6% |
| Techtronic Industries Co. Ltd. | | | 6,110 | | | | 92,826 | |
| | | | | | | | | |
| JAPAN - 3.8% |
| Hoya Corp. | | | 268 | | | | 36,934 | |
| Keyence Corp. | | | 125 | | | | 59,216 | |
| | | | | | | | 96,150 | |
| NETHERLANDS - 3.3% |
| Argenx SE, ADR* | | | 157 | | | | 85,165 | |
| | | | | | | | | |
| SINGAPORE - 1.0% |
| Sea Ltd., ADR* | | | 272 | | | | 25,645 | |
| | | | | | | | | |
| SWITZERLAND - 2.7% |
| Lonza Group AG | | | 108 | | | | 68,437 | |
| | | | | | | | | |
| TAIWAN - 4.0% |
| Taiwan Semiconductor Manufacturing Co. Ltd., ADR | | | 579 | | | | 100,627 | |
| | | | | | | | | |
| UNITED KINGDOM - 9.7% |
| AstraZeneca plc | | | 331 | | | | 51,252 | |
| BAE Systems plc | | | 3,064 | | | | 50,699 | |
| London Stock Exchange Group plc | | | 653 | | | | 89,223 | |
| RELX plc | | | 676 | | | | 31,716 | |
| Unilever plc | | | 398 | | | | 25,769 | |
| | | | | | | | 248,659 | |
| UNITED STATES - 54.9% |
| Advanced Micro Devices, Inc.* | | | 766 | | | | 125,734 | |
| Alphabet, Inc., Class A | | | 340 | | | | 56,458 | |
| Amazon.com, Inc.* | | | 357 | | | | 66,512 | |
| Apple, Inc. | | | 276 | | | | 64,381 | |
| Arista Networks, Inc.* | | | 109 | | | | 41,860 | |
| ARM Holdings plc, ADR* | | | 199 | | | | 28,445 | |
| Atlassian Corp., Class A* | | | 158 | | | | 25,017 | |
| Boston Scientific Corp.* | | | 1,485 | | | | 124,403 | |
| Chipotle Mexican Grill, Inc., Class A* | | | 469 | | | | 27,020 | |
| CoStar Group, Inc.* | | | 403 | | | | 30,417 | |
| Danaher Corp. | | | 257 | | | | 71,420 | |
| Eaton Corp. plc | | | 114 | | | | 37,814 | |
| Ecolab, Inc. | | | 161 | | | | 41,175 | |
| Ferguson Enterprises, Inc. | | | 97 | | | | 19,174 | |
| GE Vernova, Inc.* | | | 41 | | | | 10,358 | |
| Ingersoll Rand, Inc. | | | 315 | | | | 30,900 | |
| Intuit, Inc. | | | 107 | | | | 66,659 | |
| Linde plc | | | 117 | | | | 55,677 | |
| Microsoft Corp. | | | 103 | | | | 44,429 | |
| | | Shares
Held | | Value | |
| UNITED STATES (continued) |
| Netflix, Inc.* | | | 145 | | | $ | 102,867 | |
| NIKE, Inc., Class B | | | 235 | | | | 20,808 | |
| ON Semiconductor Corp.* | | | 419 | | | | 30,453 | |
| Oracle Corp. | | | 293 | | | | 49,912 | |
| Quanta Services, Inc. | | | 159 | | | | 47,359 | |
| S&P Global, Inc. | | | 80 | | | | 41,263 | |
| Veeva Systems, Inc., Class A* | | | 113 | | | | 23,673 | |
| Vertex Pharmaceuticals, Inc.* | | | 66 | | | | 30,593 | |
| West Pharmaceutical Services, Inc. | | | 162 | | | | 48,679 | |
| Xylem, Inc. | | | 297 | | | | 40,065 | |
| | | | | | | | 1,403,525 | |
| Total common stocks |
| (Cost $1,645,505) | | | | | | | 2,455,872 | |
| | | | | | | | | |
| SHORT-TERM INVESTMENT - 3.4% |
| 2 | | | | | | | | |
| INVESTMENT COMPANY - 3.4% |
| BlackRock Liquidity Funds Treasury Trust Fund - Institutional Class, 4.85%(2) (Cost $87,572) | | | 87,572 | | | | 87,572 | |
| | | | | | | | | |
Total investments - 99.5%
(Cost $1,733,077) | | | | | | | 2,543,444 | |
| | | | | | | | | |
| Other assets less liabilities - 0.5% | | | | | | | 13,560 | |
| | | | | | | | | |
| Total net assets - 100.0%# | | | | | | $ | 2,557,004 | |
| (1) | Regulation S is an exemption for securities offerings that are made outside of the United States and do not involve direct selling efforts in the United States. Resale restrictions may apply for purposes of the Securities Act of 1933. At September 30, 2024, the value of these securities was $15,930 or 0.6% of net assets. |
| (2) | Represents the current yield as of September 30, 2024. |
PORTFOLIO DIVERSIFICATION
Dollar values in thousands
| | | Value | | | Percentage of
Total Investments |
| Communication Services | | $ | 263,083 | | | | 10.3 | % |
| Consumer Discretionary | | | 204,876 | | | | 8.1 | |
| Consumer Staples | | | 25,769 | | | | 1.0 | |
| Financials | | | 158,164 | | | | 6.2 | |
| Health Care | | | 633,486 | | | | 24.9 | |
| Industrials | | | 360,911 | | | | 14.2 | |
| Information Technology | | | 682,314 | | | | 26.9 | |
| Materials | | | 96,852 | | | | 3.8 | |
| Real Estate | | | 30,417 | | | | 1.2 | |
| Short-Term Investment | | | 87,572 | | | | 3.4 | |
| Total investments | | $ | 2,543,444 | | | | 100.0 | % |
Definitions of abbreviations and footnotes are detailed on page 2-3.
The accompanying notes are an integral part of the financial statements.
ARTISAN GLOBAL UNCONSTRAINED FUND
Consolidated Schedule of Investments — September 30, 2024
Principal amount, shares and dollar values in thousands and reported in USD unless otherwise stated
| | | | | | Principal
Amount | | Value | |
| SOVEREIGN GOVERNMENT BONDS AND CREDIT-LINKED NOTES - 55.5% | |
| |
| ALBANIA - 1.7% |
| Albanian Government Bond |
| 4.21%, 1/15/2026 | | | ALL | | | | 23,100 | | | $ | 262 | |
| 5.00%, 2/24/2026 | | | ALL | | | | 16,200 | | | | 186 | |
| 6.00%, 2/13/2028 | | | ALL | | | | 12,500 | | | | 149 | |
| 5.25%, 1/26/2029 | | | ALL | | | | 21,500 | | | | 249 | |
| 5.63%, 11/8/2030 | | | ALL | | | | 26,000 | | | | 307 | |
| Republic of Albania |
| 5.90%, 6/9/2028(1) | | | EUR | | | | 720 | | | | 838 | |
| | | | | | | | | | | | 1,991 | |
| ANGOLA - 0.9% |
| Republic of Angola |
| 6.93%, 2/19/2027(1) | | | | | | | 57 | | | | 56 | |
| 8.25%, 5/9/2028(1) | | | | | | | 290 | | | | 275 | |
| 9.13%, 11/26/2049(1) | | | | | | | 850 | | | | 703 | |
| | | | | | | | | | | | 1,034 | |
| ARMENIA - 0.2% |
| Republic of Armenia |
| 9.25%, 4/29/2028 | | | AMD | | | | 75,000 | | | | 191 | |
| | | | | | | | | | | | | |
| BAHAMAS - 5.5% |
| Commonwealth of the Bahamas |
| 6.00%, 11/21/2028(1) | | | | | | | 3,679 | | | | 3,448 | |
| 9.00%, 6/16/2029(1) | | | | | | | 902 | | | | 931 | |
| 6.95%, 11/20/2029(1) | | | | | | | 404 | | | | 380 | |
| 8.95%, 10/15/2032(1) | | | | | | | 1,746 | | | | 1,779 | |
| | | | | | | | | | | | 6,538 | |
| BENIN - 2.1% |
| Benin Government Bond |
| 4.88%, 1/19/2032(1) | | | EUR | | | | 1,560 | | | | 1,550 | |
| 6.88%, 1/19/2052(1) | | | EUR | | | | 1,000 | | | | 930 | |
| | | | | | | | | | | | 2,480 | |
| CAMEROON - 1.5% |
| Republic of Cameroon |
| 9.50%, 11/19/2025(1) | | | | | | | 1,167 | | | | 1,165 | |
| 5.95%, 7/7/2032(1) | | | EUR | | | | 720 | | | | 649 | |
| | | | | | | | | | | | 1,814 | |
| COLOMBIA - 1.8% |
| Republic of Colombia |
| 8.00%, 11/14/2035 | | | | | | | 2,006 | | | | 2,138 | |
| | | | | | | | | | | | | |
| DOMINICAN REPUBLIC - 0.0%^ |
| Dominican Republic Government Bond |
| 6.50%, 11/27/2026(1) | | | DOP | | | | 1,230 | | | | 19 | |
| | | | | | | | | | | | | |
| EGYPT - 0.9% |
| Arab Republic of Egypt |
| 6.38%, 4/11/2031(1) | | | EUR | | | | 240 | | | | 224 | |
| 7.50%, 2/16/2061(1) | | | | | | | 1,200 | | | | 867 | |
| | | | | | | | | | | | 1,091 | |
| EL SALVADOR - 0.0%^ |
| Republic of El Salvador |
| 0.25%, 4/17/2030 IO(1) | | | | | | | 747 | | | | 15 | |
| | | Principal
Amount | | Value | |
| GABON - 1.2% |
| Gabonese Republic |
| 6.95%, 6/16/2025(1) | | | | | | | 1,580 | | | $ | 1,482 | |
| | | | | | | | | | | | | |
| GEORGIA - 0.9% |
| Republic of Georgia |
| 2.75%, 4/22/2026(1) | | | | | | | 1,070 | | | | 1,013 | |
| | | | | | | | | | | | | |
| GUATEMALA - 0.5% |
| Republic of Guatemala |
| 4.50%, 5/3/2026(1) | | | | | | | 550 | | | | 541 | |
| | | | | | | | | | | | | |
| ICELAND - 3.7% |
| Republic of Iceland |
| 8.00%, 6/12/2025 | | | ISK | | | | 181,500 | | | | 1,333 | |
| 6.75%, 10/15/2026 | | | ISK | | | | 428,443 | | | | 3,090 | |
| | | | | | | | | | | | 4,423 | |
| INDIA - 2.4% |
| Asian Infrastructure Investment Bank (The) |
| 7.00%, 3/1/2029(1) | | | INR | | | | 80,000 | | | | 961 | |
| International Bank for Reconstruction & Development |
| 6.50%, 4/17/2030 | | | INR | | | | 63,000 | | | | 742 | |
| Republic of India |
| 7.54%, 5/23/2036 | | | INR | | | | 88,000 | | | | 1,108 | |
| | | | | | | | | | | | 2,811 | |
| INDONESIA - 3.3% |
| Republic of Indonesia |
| 6.88%, 4/15/2029 | | | IDR | | | | 15,900,000 | | | | 1,078 | |
| 7.50%, 8/15/2032 | | | IDR | | | | 19,200,000 | | | | 1,343 | |
| 7.13%, 6/15/2042 | | | IDR | | | | 21,250,000 | | | | 1,458 | |
| | | | | | | | | | | | 3,879 | |
| IRAQ - 3.8% |
| Republic of Iraq |
| 5.80%, 1/15/2028(1) | | | | | | | 4,630 | | | | 4,486 | |
| | | | | | | | | | | | | |
| IVORY COAST - 1.0% |
| Republic of Cote d’Ivoire |
| 5.25%, 3/22/2030(1) | | | EUR | | | | 186 | | | | 197 | |
| 5.88%, 10/17/2031(1) | | | EUR | | | | 380 | | | | 400 | |
| 6.88%, 10/17/2040(1) | | | EUR | | | | 600 | | | | 590 | |
| | | | | | | | | | | | 1,187 | |
| JAMAICA - 0.7% |
| Jamaica Government Bond |
| 9.63%, 11/3/2030 | | | JMD | | | | 119,500 | | | | 804 | |
| | | | | | | | | | | | | |
| KENYA - 0.0%^ |
| Republic of Kenya |
| 9.75%, 2/16/2031(1) | | | | | | | 5 | | | | 5 | |
| | | | | | | | | | | | | |
| NAMIBIA - 0.4% |
| Republic of Namibia |
| 5.25%, 10/29/2025(1) | | | | | | | 500 | | | | 495 | |
| | | | | | | | | | | | | |
| NIGERIA - 0.5% |
| Federal Republic of Nigeria |
| 7.63%, 11/21/2025(1) | | | | | | | 610 | | | | 610 | |
| | | | | | | | | | | | | |
| PAKISTAN - 1.5% |
| Islamic Republic of Pakistan |
| 6.88%, 12/5/2027(1) | | | | | | | 1,130 | | | | 1,026 | |
| 7.38%, 4/8/2031(1) | | | | | | | 825 | | | | 699 | |
| | | | | | | | | | | | 1,725 | |
| | | Principal
Amount | | Value | |
| PAPUA NEW GUINEA - 1.2% |
| Papua New Guinea Government International Bond |
| 8.38%, 10/4/2028(1) | | | | | | | 1,495 | | | $ | 1,458 | |
| | | | | | | | | | | | | |
| PARAGUAY - 1.5% |
| Paraguay Treasury Credit-Linked Note |
| 9.03%, 2/15/2030(2)(3)(4) | | | | | | | 843 | | | | 802 | |
| 8.00%, 3/3/2036(2)(3)(4) | | | | | | | 298 | | | | 276 | |
| Republic of Paraguay |
| 7.90%, 2/9/2031(5) | | | PYG | | | | 1,800,000 | | | | 235 | |
| 7.90%, 2/9/2031(1) | | | PYG | | | | 3,984,000 | | | | 520 | |
| | | | | | | | | | | | 1,833 | |
| PERU - 6.1% |
| Bonos de la Tesoreria |
| 5.94%, 2/12/2029 | | | PEN | | | | 16,160 | | | | 4,518 | |
| 7.30%, 8/12/2033(1) | | | PEN | | | | 4,650 | | | | 1,356 | |
| 5.40%, 8/12/2034 | | | PEN | | | | 5,400 | | | | 1,368 | |
| | | | | | | | | | | | 7,242 | |
| RWANDA - 0.7% |
| Republic of Rwanda |
| 5.50%, 8/9/2031(1) | | | | | | | 990 | | | | 819 | |
| | | | | | | | | | | | | |
| SERBIA - 4.1% |
| Republic of Serbia |
| 7.00%, 10/26/2031 | | | RSD | | | | 222,900 | | | | 2,353 | |
| 4.50%, 8/20/2032 | | | RSD | | | | 276,330 | | | | 2,499 | |
| | | | | | | | | | | | 4,852 | |
| SURINAME - 1.5% |
| Suriname Government International Bond |
| 4.95% Cash, 3.00% PIK, 7/15/2033(1) | | | | | | | 1,815 | | | | 1,742 | |
| | | | | | | | | | | | | |
| TAJIKISTAN - 0.9% |
| Republic of Tajikistan |
| 7.13%, 9/14/2027(1) | | | | | | | 1,030 | | | | 1,010 | |
| | | | | | | | | | | | | |
| TUNISIA - 1.9% |
| Tunisian Republic |
| 5.75%, 1/30/2025(1) | | | | | | | 1,110 | | | | 1,075 | |
| 6.38%, 7/15/2026(1) | | | EUR | | | | 1,155 | | | | 1,161 | |
| | | | | | | | | | | | 2,236 | |
| UZBEKISTAN - 0.5% |
| Republic of Uzbekistan International Bond |
| 5.38%, 5/29/2027(1) | | | EUR | | | | 500 | | | | 560 | |
| | | | | | | | | | | | | |
| VIETNAM - 1.0% |
| Socialist Republic of Vietnam |
| 4.80%, 11/19/2024(1) | | | | | | | 1,180 | | | | 1,178 | |
| | | | | | | | | | | | | |
| ZAMBIA - 1.6% |
| Republic of Zambia |
| 5.75%, 6/30/2033(1)(6) | | | | | | | 1,483 | | | | 1,306 | |
| 0.50%, 12/31/2053(1) | | | | | | | 1,284 | | | | 631 | |
| | | | | | | | | | | | 1,937 | |
Total Sovereign government bonds and credit-linked notes
(Cost $62,987) | | | | | | | | | | | 65,639 | |
| | | | | | | | | | | | | |
| CORPORATE BONDS - 14.7% |
| |
| BRAZIL - 2.9% |
| Karoon USA Finance, Inc. |
| 10.50%, 5/14/2029(1) | | | | | | | 900 | | | | 925 | |
| MC Brazil Downstream Trading SARL |
| 7.25%, 6/30/2031(1) | | | | | | | 1,123 | | | | 961 | |
| | | Principal
Amount | | Value | |
| OHI Group SA |
| 13.00%, 7/22/2029(1) | | | | | | | 900 | | | $ | 895 | |
| Trident Energy Finance plc |
| 12.50%, 11/30/2029(1) | | | | | | | 490 | | | | 515 | |
| Unigel Luxembourg SA |
| 8.75%, 10/1/2026(1)(7) | | | | | | | 340 | | | | 85 | |
| | | | | | | | | | | | 3,381 | |
| CAMEROON - 1.0% |
| Golar LNG Ltd. |
| 7.75%, 9/19/2029(1) | | | | | | | 1,200 | | | | 1,197 | |
| CHILE - 0.5% |
| ATP Tower Holdings LLC |
| 4.05%, 4/27/2026(1) | | | | | | | 540 | | | | 527 | |
| | | | | | | | | | | | | |
| COLOMBIA - 0.9% |
| EnfraGen Energia Sur SA |
| 5.38%, 12/30/2030(1) | | | | | | | 655 | | | | 564 | |
| Gran Tierra Energy, Inc. |
| 9.50%, 10/15/2029(1) | | | | | | | 560 | | | | 532 | |
| | | | | | | | | | | | 1,096 | |
| CZECH REPUBLIC - 0.9% |
| Energo-Pro A/S |
| 8.50%, 2/4/2027(1) | | | | | | | 600 | | | | 605 | |
| 11.00%, 11/2/2028(1) | | | | | | | 455 | | | | 492 | |
| | | | | | | | | | | | 1,097 | |
| DOMINICAN REPUBLIC - 2.5% |
| Banco Central de la Republica Dominicana |
| 12.00%, 10/3/2025(1) | | | DOP | | | | 22,700 | | | | 379 | |
| 13.00%, 12/5/2025(1) | | | DOP | | | | 64,500 | | | | 1,091 | |
| 13.00%, 1/30/2026(1) | | | DOP | | | | 58,270 | | | | 991 | |
| 9.00%, 12/11/2026(1) | | | DOP | | | | 33,750 | | | | 537 | |
| | | | | | | | | | | | 2,998 | |
| MEXICO - 1.0% |
| Petroleos Mexicanos |
| 6.95%, 1/28/2060 | | | | | | | 1,630 | | | | 1,169 | |
| | | | | | | | | | | | | |
| MOLDOVA, REPUBLIC OF - 0.6% |
| Aragvi Finance International DAC |
| 8.45%, 4/29/2026(1) | | | | | | | 701 | | | | 647 | |
| | | | | | | | | | | | | |
| NETHERLANDS - 0.5% |
| VEON Holdings BV |
| 3.38%, 11/25/2027(1) | | | | | | | 660 | | | | 579 | |
| | | | | | | | | | | | | |
| NIGERIA - 0.4% |
| SEPLAT Energy plc |
| 7.75%, 4/1/2026(1) | | | | | | | 490 | | | | 491 | |
| | | | | | | | | | | | | |
| PARAGUAY - 0.2% |
| Frigorifico Concepcion SA |
| 7.70%, 7/21/2028(1)(8) | | | | | | | 380 | | | | 266 | |
| | | | | | | | | | | | | |
| SINGAPORE - 0.5% |
| Yinson Production Financial Services Pte. Ltd. |
| 9.63%, 5/3/2029(1) | | | | | | | 550 | | | | 563 | |
| | | | | | | | | | | | | |
| TURKEY - 0.9% |
| Limak Iskenderun Uluslararasi Liman Isletmeciligi A/S |
| 9.50%, 7/10/2036(1) | | | | | | | 1,186 | | | | 1,115 | |
| | | | | | | | | | | | | |
| UNITED KINGDOM - 0.4% |
| 3T Global Holdco Ltd. |
| 11.25%, 5/22/2028 | | | | | | | 500 | | | | 506 | |
| | | | | | | | | | | | | |
| UZBEKISTAN - 1.5% |
| Uzbek Industrial and Construction Bank ATB |
| 21.00%, 7/24/2027(1) | | | UZS | | | | 22,900,000 | | | | 1,773 | |
| | | Principal
Amount | | Value | |
Total corporate bonds
(Cost $17,381) | | | | | | $ | 17,405 | |
| | | | | | | | | |
| | | Shares
Held | | | |
| COMMON STOCKS - 4.2% |
| |
| AUSTRALIA - 0.2% |
| Emerald Resources NL* | | | 36 | | | | 96 | |
| OceanaGold Corp. | | | 17 | | | | 48 | |
| Resolute Mining Ltd.* | | | 100 | | | | 51 | |
| West African Resources Ltd.* | | | 50 | | | | 45 | |
| | | | | | | | 240 | |
| CANADA - 1.3% |
| Africa Oil Corp. | | | 210 | | | | 272 | |
| Allied Gold Corp.* | | | 43 | | | | 101 | |
| Asante Gold Corp.* | | | 50 | | | | 53 | |
| Centerra Gold, Inc. | | | 25 | | | | 179 | |
| Dundee Precious Metals, Inc. | | | 10 | | | | 95 | |
| G Mining Ventures Corp. | | | 26 | | | | 179 | |
| Galiano Gold, Inc.* | | | 30 | | | | 43 | |
| K92 Mining, Inc.* | | | 17 | | | | 96 | |
| Lundin Gold, Inc. | | | 5 | | | | 97 | |
| New Gold, Inc.* | | | 66 | | | | 190 | |
| Orla Mining Ltd.* | | | 22 | | | | 86 | |
| Thor Explorations Ltd.* | | | 100 | | | | 22 | |
| Torex Gold Resources, Inc.* | | | 9 | | | | 172 | |
| | | | | | | | 1,585 | |
| COLOMBIA - 1.9% |
| Aris Mining Corp.* | | | 478 | | | | 2,197 | |
| | | | | | | | | |
| GEORGIA - 0.6% |
| Georgia Capital plc* | | | 58 | | | | 721 | |
| | | | | | | | | |
| PERU - 0.0%^ |
| Hochschild Mining plc* | | | 20 | | | | 49 | |
| | | | | | | | | |
| UNITED STATES - 0.2% |
| Aura Minerals, Inc. | | | 17 | | | | 203 | |
Total common stocks
(Cost $4,415) | | | | | | | 4,995 | |
| | | Principal
Amount | | | |
| BANK LOANS - 2.2% |
| |
| PARAGUAY - 0.5% |
| Frigorifico Concepcion First Lien Term Loan B |
| (SOFR + 5.50%), 10.43%, 12/8/2026(2)(3)(9) | | | 800 | | | | 672 | |
| | | | | | | | | |
| TANZANIA - 1.7% |
| Tanzania (United Republic of) First Lien Term Loan |
| (SOFR + 5.45%), 10.32%, 3/6/2031(2)(3)(9) | | | 2,000 | | | | 1,980 | |
| | | | | | | | | |
Total bank loans
(Cost $2,800) | | | | | | | 2,652 | |
| | | No. of
Contracts‡ | | | |
| OPTION PURCHASED - 0.0%^ |
| |
| Put Option - 0.0%^ |
| Future Equity Index Options - 0.0%^ |
| S&P 500 E-Mini Index |
| 12/20/2024 at USD 4,600.00; Notional Amount: USD 172(10) (Cost $64) | | | 6 | | | | 4 | |
| | | | | | | | | |
Total Option Purchased
(Cost $64) | | | | | | | 4 | |
| | | | | | Principal
Amount | | Value | |
| SHORT-TERM INVESTMENTS - 17.2% |
| |
| SOVEREIGN GOVERNMENT TREASURY BILLS - 10.5% |
| Arab Republic of Egypt |
| 28.67%, 11/19/2024(11) | | | EGP | | | | 13,775 | | | $ | 274 | |
| 28.80%, 11/26/2024(11) | | | EGP | | | | 40,300 | | | | 799 | |
| 28.85%, 12/10/2024(11) | | | EGP | | | | 51,800 | | | | 1,016 | |
| 28.95%, 12/17/2024(11) | | | EGP | | | | 118,000 | | | | 2,302 | |
| 28.95%, 12/24/2024(11) | | | EGP | | | | 79,900 | | | | 1,550 | |
| 28.78%, 2/25/2025(11) | | | EGP | | | | 43,125 | | | | 800 | |
| 28.74%, 3/18/2025(11) | | | EGP | | | | 29,500 | | | | 539 | |
| Federal Republic of Nigeria |
| 26.76%, 3/6/2025(11) | | | NGN | | | | 920,000 | | | | 494 | |
| 27.46%, 4/10/2025(11) | | | NGN | | | | 420,000 | | | | 220 | |
| Nigeria OMO Bill |
| 28.31%, 5/27/2025(11) | | | NGN | | | | 480,000 | | | | 242 | |
| 28.68%, 6/17/2025(11) | | | NGN | | | | 456,000 | | | | 227 | |
| Republic of Albania |
| 3.21%, 11/28/2024(11) | | | ALL | | | | 11,800 | | | | 132 | |
| 3.12%, 12/12/2024(11) | | | ALL | | | | 23,000 | | | | 258 | |
| 3.36%, 1/30/2025(11) | | | ALL | | | | 16,000 | | | | 178 | |
| 3.37%, 2/13/2025(11) | | | ALL | | | | 22,000 | | | | 245 | |
| 3.17%, 4/17/2025(11) | | | ALL | | | | 30,500 | | | | 338 | |
| 3.44%, 5/1/2025(11) | | | ALL | | | | 28,000 | | | | 310 | |
| Republic of Armenia |
| 8.99%, 12/2/2024(11) | | | AMD | | | | 78,000 | | | | 198 | |
| 8.53%, 2/3/2025(11) | | | AMD | | | | 72,000 | | | | 181 | |
| Republic of Iceland |
| 8.24%, 10/16/2024(11) | | | ISK | | | | 168,000 | | | | 1,238 | |
| 9.04%, 11/20/2024(11) | | | ISK | | | | 128,005 | | | | 935 | |
Total sovereign government treasury bills
(Cost $12,508) | | | | | | | | | | | 12,476 | |
| | | | | | | | | | | | | |
| U.S. TREASURY OBLIGATION - 2.3% |
| U.S. Treasury Bill |
| 4.59%, 11/19/2024 (Cost $2,782)(11) | | | | | | | 2,800 | | | | 2,782 | |
| | | | | | | | | | | | | |
| REPURCHASE AGREEMENTS - 3.3% |
| |
| JPMorgan Chase Bank, N.A., Dated 9/19/24, with an interest rate of 4.10% payable by the Fund, collateralized by Par USD 250 Republic of Costa Rica, 6.55% due 4/3/2034 and a market value of $267(12) | | | | | | | 274 | | | | 274 | |
| JPMorgan Chase Bank, N.A., Dated 9/19/24, with an interest rate of 4.20% payable by the Fund, collateralized by Par USD 500 Republic of Costa Rica, 6.55% due 4/3/2034 and a market value of $535(12) | | | | | | | 549 | | | | 549 | |
| JPMorgan Chase Bank, N.A., Dated 9/19/24, with an interest rate of 4.30% payable by the Fund, collateralized by Par USD 950 Republic of Paraguay, 2.74% due 1/29/2033 and a market value of $814(12) | | | | | | | 822 | | | | 822 | |
| JPMorgan Chase Bank, N.A., Dated 9/19/24, with an interest rate of 4.60% payable by the Fund, collateralized by Par USD 865 Dominican Republic Government Bond, 4.88% due 9/23/2032 and a market value of $828(12) | | | | | | | 849 | | | | 849 | |
| | | Principal
Amount | | Value | |
| REPURCHASE AGREEMENTS (continued) |
| JPMorgan Chase Bank, N.A., Dated 9/30/24, with an interest rate of 3.00% payable by the Fund, collateralized by Par USD 1,540 Republic of Senegal, 6.25% due 5/23/2033 and a market value of $1,333(12) | | | 1,362 | | | $ | 1,362 | |
Total Repurchase Agreements
(Cost $3,856) | | | | | | | 3,856 | |
| | | Shares
Held | | | |
| INVESTMENT COMPANIES - 1.1% |
| BlackRock Liquidity Funds Treasury Trust Fund - Institutional Class, 4.85%(13) | | | 1,274 | | | | 1,274 | |
| Federated Treasury Obligations Fund - Institutional Class, 4.81%(13) | | | 4 | | | | 4 | |
| Fidelity Investments Money Market Treasury Portfolio - Institutional Class, 4.87%(13) | | | 4 | | | | 4 | |
| | | | | | | | | |
Total investment companies
(Cost $1,282) | | | | | | | 1,282 | |
| | | | | | | | | |
Total short-term investments
(Cost $20,428) | | | | | | | 20,396 | |
| | | | | | | | | |
Total investments - 93.8%
(Cost $108,075) | | | | | | | 111,091 | |
| | | | | | | | | |
| SECURITIES SOLD SHORT - (5.5)% |
| |
| COMMON STOCKS - (2.3)% |
| |
| AUSTRALIA - (0.2)% |
| Evolution Mining Ltd. | | | (86 | ) | | | (276 | ) |
| | | | | | | | | |
| BURKINA FASO - (0.2)% |
| IAMGOLD Corp. | | | (46 | ) | | | (241 | ) |
| | | | | | | | | |
| CANADA - (0.4)% |
| Agnico Eagle Mines Ltd. | | | (3 | ) | | | (241 | ) |
| Barrick Gold Corp. | | | (12 | ) | | | (229 | ) |
| | | | | | | | (470 | ) |
| GEORGIA - (0.4)% |
| Bank of Georgia Group plc | | | (4 | ) | | | (196 | ) |
| TBC Bank Group plc | | | (6 | ) | | | (213 | ) |
| | | | | | | | (409 | ) |
| UNITED KINGDOM - (0.9)% |
| Ashmore Group plc | | | (396 | ) | | | (1,084 | ) |
| | | | | | | | | |
| UNITED STATES - (0.2)% |
| Newmont Corp. | | | (5 | ) | | | (240 | ) |
| | | | | | | | | |
Total common stocks
(Proceeds $(2,484)) | | | | | | | (2,720 | ) |
| | | | | | | | | |
| | | Principal
Amount | | | |
| SOVEREIGN GOVERNMENT BONDS - (3.2)% |
| |
| COSTA RICA - (0.7)% |
| Republic of Costa Rica |
| 6.55%, 4/3/2034(1)(14) | | | (750 | ) | | | (802 | ) |
| | | | | | | | | |
| DOMINICAN REPUBLIC - (0.7)% |
| Dominican Republic Government Bond |
| 4.88%, 9/23/2032(1)(14) | | | (865 | ) | | | (828 | ) |
| | | | | | | | | |
| PARAGUAY - (0.7)% |
| Republic of Paraguay |
| 2.74%, 1/29/2033(1)(14) | | | (950 | ) | | | (814 | ) |
| | | Principal
Amount | | Value | |
| SENEGAL - (1.1)% |
| Republic of Senegal |
| 6.25%, 5/23/2033(1)(14) | | | (1,540 | ) | | $ | (1,333 | ) |
| | | | | | | | | |
Total Sovereign government bonds
(Proceeds $(3,633)) | | | | | | | (3,777 | ) |
| | | | | | | | | |
Total securities sold short
(Proceeds $(6,117)) | | | | | | | (6,497 | ) |
| | | | | | | | | |
Total investments after securities sold short - 88.3%
(Cost $101,958) | | | | | | | 104,594 | |
| | | | | | | | | |
REVERSE REPURCHASE AGREEMENT - (0.2)%
(Proceeds $(200)) | | | | | | | (200 | ) |
| | | | | | | | | |
| Other assets less liabilities - 11.9% | | | | | | | 13,975 | |
| | | | | | | | | |
| Total net assets - 100.0%# | | | | | | $ | 118,369 | |
| | | | | | | | | |
| (1) | Regulation S is an exemption for securities offerings that are made outside of the United States and do not involve direct selling efforts in the United States. Resale restrictions may apply for purposes of the Securities Act of 1933. At September 30, 2024, the value of these securities was $51,103 or 43.2% of net assets. |
| (2) | Valued at a fair value in accordance with procedures established by the board of directors of Artisan Partners Funds. In total, securities valued at a fair value were $3,730, or 3.2% of total net assets. See notes 2(b) and 4 in Notes to Financial Statements for additional information. |
| (3) | Security is valued using significant unobservable inputs and is classified as Level 3 in the fair value hierarchy. |
| (4) | Security is restricted. |
| Security | | Acquisition Date | | Cost | | | Value | | | Percentage of
Total Net Assets | |
| Paraguay Treasury Credit-Linked Note, 9.03%, 2/15/2030 | | 8/17/2023 - 3/4/2024 | | $ | 841 | | | $ | 802 | | | | 0.7% | |
| Paraguay Treasury Credit-Linked Note, 8.00%, 3/3/2036 | | 3/27/2024 | | | 298 | | | | 276 | | | | 0.2% | |
| (5) | Security exempt from registration pursuant to Rule 144A under the Securities Act of 1933. May be resold in transactions exempt from registration, normally to qualified institutional buyers. |
| (6) | Step bond. Interest rate is a fixed rate for an initial period that either resets at a specific date or may reset in the future at a contingent upon predetermined trigger. The interest rate shown was the current rate as of September 30, 2024. |
| (7) | Defaulted security. |
| (8) | All or a position of the security has been pledge as collateral in connection with outstanding reverse repurchase agreements. |
| (9) | Variable or floating rate security, linked to the referenced benchmark. Interest rates reset periodically. Certain variable rate securities are not based on a published reference rate and spread but are determined by the issuer or agent and are based on current market conditions. The interest rate shown is the rate in effect as of September 30, 2024. |
| (10) | One contract is equal to 50 shares. |
| (11) | Yield to maturity. |
| (12) | Open repurchase agreement with no specific maturity date. Either party may terminate the agreement upon demand. |
| (13) | Represents the current yield as of September 30, 2024. |
| (14) | At September 30, 2024, all or a portion of this security was pledged to cover collateral requirements for repurchase agreements. See note 2(o) in Notes to Financial Statements for additional information. |
PORTFOLIO DIVERSIFICATION
Dollar values in thousands
| | | Value | | | Percentage of
Total Investments |
| Communication Services | | $ | 579 | | | | 0.5 | % |
| Consumer Discretionary | | | 506 | | | | 0.5 | |
| Consumer Staples | | | 1,585 | | | | 1.4 | |
| Energy | | | 7,520 | | | | 6.8 | |
| Financials | | | 7,476 | | | | 6.7 | |
| Industrials | | | 1,642 | | | | 1.5 | |
| Materials | | | 4,087 | | | | 3.7 | |
| Sovereign Government Securities | | | 65,639 | | | | 59.0 | |
| Utilities | | | 1,661 | | | | 1.5 | |
| Short-Term Investments | | | 20,396 | | | | 18.4 | |
| Total investments | | $ | 111,091 | | | | 100.0 | % |
FOREIGN CURRENCY FORWARD CONTRACTS
Values in thousands
| Currency Purchased | | Currency Sold | | Counterparty | | | Settlement
Date | | Unrealized
Appreciation
(Depreciation) |
| BRL** | | | 30,065 | | | USD | | | 5,492 | | | | JPM | | | 10/2/2024 | | $ | 28 | |
| BRL** | | | 1,363 | | | USD | | | 248 | | | | SCB | | | 10/2/2024 | | | 2 | |
| EUR | | | 1,957 | | | HUF | | | 770,000 | | | | SCB | | | 10/2/2024 | | | 21 | |
| INR** | | | 44,433 | | | USD | | | 529 | | | | JPM | | | 10/9/2024 | | | 1 | |
| TRY | | | 180,020 | | | USD | | | 5,092 | | | | SCB | | | 10/10/2024 | | | 130 | |
| USD | | | 1,085 | | | COP** | | | 4,519,959 | | | | JPM | | | 10/10/2024 | | | 12 | |
| KES** | | | 56,000 | | | USD | | | 412 | | | | CITI | | | 10/15/2024 | | | 22 | |
| KES** | | | 14,000 | | | USD | | | 104 | | | | ICBCSB | | | 10/15/2024 | | | 4 | |
| INR** | | | 41,208 | | | USD | | | 490 | | | | SCB | | | 10/17/2024 | | | 1 | |
| USD | | | 1,136 | | | MXN | | | 22,039 | | | | TDB | | | 10/17/2024 | | | 19 | |
| AMD** | | | 62,000 | | | USD | | | 154 | | | | ICBCSB | | | 10/18/2024 | | | 5 | |
| RSD | | | 296,400 | | | EUR | | | 2,523 | | | | SCB | | | 10/18/2024 | | | 10 | |
| TRY | | | 28,000 | | | USD | | | 775 | | | | SCB | | | 10/24/2024 | | | 24 | |
| TWD** | | | 54,405 | | | USD | | | 1,707 | | | | SCB | | | 10/24/2024 | | | 15 | |
| EUR | | | 1,934 | | | HUF | | | 770,000 | | | | JPM | | | 11/5/2024 | | | 2 | |
| KZT** | | | 380,000 | | | USD | | | 785 | | | | ICBCSB | | | 11/12/2024 | | | 1 | |
| UZS** | | | 4,300,000 | | | USD | | | 331 | | | | CITI | | | 11/20/2024 | | | 3 | |
| USD | | | 831 | | | EUR | | | 744 | | | | SCB | | | 12/18/2024 | | | — | ^ |
| UZS** | | | 1,700,000 | | | USD | | | 120 | | | | SCB | | | 2/7/2025 | | | 9 | |
| Total unrealized appreciation | | | | | | | | | 309 | |
| BRL** | | | 6,239 | | | USD | | | 1,153 | | | | SCB | | | 10/2/2024 | | | (9 | ) |
| HUF | | | 770,000 | | | EUR | | | 1,939 | | | | JPM | | | 10/2/2024 | | | (1 | ) |
| INR** | | | 56,547 | | | USD | | | 675 | | | | JPM | | | 10/9/2024 | | | (1 | ) |
| KZT** | | | 536,100 | | | USD | | | 1,113 | | | | ICBCSB | | | 10/15/2024 | | | (— | )^ |
| USD | | | 541 | | | KES** | | | 70,000 | | | | DB | | | 10/15/2024 | | | (1 | ) |
| USD | | | 986 | | | KZT** | | | 476,000 | | | | CITI | | | 10/15/2024 | | | (2 | ) |
| USD | | | 6,960 | | | PEN** | | | 26,556 | | | | JPM | | | 10/16/2024 | | | (202 | ) |
| USD | | | 2,263 | | | ZAR | | | 40,508 | | | | TDB | | | 10/16/2024 | | | (79 | ) |
| USD | | | 362 | | | RSD | | | 38,432 | | | | SCB | | | 10/18/2024 | | | (3 | ) |
| KZT** | | | 120,000 | | | USD | | | 250 | | | | SCB | | | 10/24/2024 | | | (2 | ) |
| USD | | | 1,706 | | | TWD** | | | 54,405 | | | | SCB | | | 10/24/2024 | | | (15 | ) |
| KZT** | | | 203,044 | | | USD | | | 423 | | | | SG | | | 10/28/2024 | | | (2 | ) |
| BRL** | | | 18,834 | | | USD | | | 3,448 | | | | JPM | | | 11/4/2024 | | | (4 | ) |
| USD | | | 1,747 | | | GEL** | | | 4,800 | | | | CITI | | | 11/8/2024 | | | (7 | ) |
| USD | | | 1,087 | | | GEL** | | | 3,000 | | | | CITI | | | 11/18/2024 | | | (8 | ) |
| USD | | | 908 | | | GEL** | | | 2,600 | | | | ICBCSB | | | 11/18/2024 | | | (41 | ) |
| USD | | | 2,614 | | | IDR** | | | 40,760,755 | | | | JPM | | | 11/18/2024 | | | (65 | ) |
| KZT** | | | 730,366 | | | USD | | | 1,507 | | | | ICBCSB | | | 11/26/2024 | | | (1 | ) |
| EUR | | | 77 | | | USD | | | 87 | | | | SCB | | | 12/18/2024 | | | (— | )^ |
| USD | | | 22,321 | | | EUR | | | 19,994 | | | | SCB | | | 12/18/2024 | | | (6 | ) |
| KZT** | | | 225,000 | | | USD | | | 463 | | | | CITI | | | 12/19/2024 | | | (1 | ) |
| UZS** | | | 9,000,000 | | | USD | | | 694 | | | | DB | | | 12/23/2024 | | | (1 | ) |
| INR** | | | 46,700 | | | USD | | | 557 | | | | JPM | | | 12/24/2024 | | | (2 | ) |
| USD | | | 2,155 | | | CNH | | | 15,300 | | | | SCB | | | 2/4/2025 | | | (50 | ) |
| USD | | | 119 | | | UZS** | | | 1,700,000 | | | | SCB | | | 2/7/2025 | | | (10 | ) |
| TJS** | | | 3,660 | | | USD | | | 332 | | | | JPM | | | 3/14/2025 | | | (1 | ) |
| USD | | | 5,715 | | | CNH | | | 40,630 | | | | SCB | | | 3/18/2025 | | | (154 | ) |
| USD | | | 1,740 | | | TWD** | | | 54,405 | | | | JPM | | | 3/24/2025 | | | (19 | ) |
| UZS** | | | 9,300,000 | | | USD | | | 702 | | | | ICBCSB | | | 4/2/2025 | | | (7 | ) |
| INR** | | | 22,600 | | | USD | | | 267 | | | | JPM | | | 5/27/2025 | | | (1 | ) |
| GTQ** | | | 8,550 | | | USD | | | 1,081 | | | | CITI | | | 9/3/2025 | | | (6 | ) |
| Total unrealized depreciation | | | | | | | | | (701 | ) |
| Net unrealized depreciation | | | | | | | | $ | (392 | ) |
| | | | | | | | | | | | | | | | | | | | | |
FUTURES CONTRACTS
Values in thousands
| Description | | No. of
Contracts | | | Expiration Date | | Trading
Currency | | Notional
Amount | | | Notional
Value | | | Unrealized
Appreciation/
(Depreciation) |
| Long Positions Contracts |
| U.S. Treasury 2 Year Note | | | 16 | | | 12/31/2024 | | USD | | $ | 3,200 | | | $ | 3,332 | | | $ | 6 | |
| | | | | | | | | | | | | | | | | | | | 6 | |
| Short Positions Contracts |
| Euro-Bobl | | | (32 | ) | | 12/6/2024 | | EUR | | | (3,200 | ) | | | (4,276 | ) | | | (30 | ) |
| Euro-BTP | | | (11 | ) | | 12/6/2024 | | EUR | | | (1,100 | ) | | | (1,487 | ) | | | (32 | ) |
| Euro-Bund | | | (18 | ) | | 12/6/2024 | | EUR | | | (1,800 | ) | | | (2,703 | ) | | | (24 | ) |
| Euro-Schatz | | | (16 | ) | | 12/6/2024 | | EUR | | | (1,600 | ) | | | (1,909 | ) | | | (6 | ) |
| S&P 500 E-Mini Index | | | (11 | ) | | 12/20/2024 | | USD | | | (1 | ) | | | (3,198 | ) | | | (68 | ) |
| U.S. Treasury 5 Year Note | | | (77 | ) | | 12/31/2024 | | USD | | | (7,700 | ) | | | (8,461 | ) | | | 25 | |
| U.S. Treasury 10 Year Note | | | (35 | ) | | 12/19/2024 | | USD | | | (3,500 | ) | | | (4,000 | ) | | | (3 | ) |
| U.S. Treasury 10 Year Ultra Note | | | (17 | ) | | 12/19/2024 | | USD | | | (1,700 | ) | | | (2,011 | ) | | | (2 | ) |
| | | | | | | | | | | | | | | | | | | | (140 | ) |
| Net unrealized depreciation | | | | | | | $ | (134 | ) |
| | | | | | | | | | | | | | | | | | | | | |
The Fund has recorded an asset of $31 as of September 30, 2024, related to the current day’s variation margin associated with these contracts.
CENTRALLY CLEARED CREDIT DEFAULT SWAPS - BUY PROTECTION
Notional amounts and values in thousands and reported in USD unless otherwise stated
| Reference Entity | | Financing Rate Paid
by the Fund (%) | | | Frequency of Payments
Made/Received | | Termination Date | | | Notional Amount | | | Upfront (Payments)
Receipts
($) | | Unrealized Appreciation
(Depreciation)
($) | | Value
($) |
| Bank of China Ltd. | | | 1.00 | | | Quarterly | | | 6/20/2029 | | | | 550 | | | | (4 | ) | | | (6 | ) | | | (10 | ) |
| Export-Import Bank of China (The) | | | 1.00 | | | Quarterly | | | 6/20/2029 | | | | 550 | | | | (6 | ) | | | (5 | ) | | | (11 | ) |
| Federative Republic of Brazil | | | 1.00 | | | Quarterly | | | 6/20/2028 | | | | 1,650 | | | | 50 | | | | (45 | ) | | | 5 | |
| Federative Republic of Brazil | | | 1.00 | | | Quarterly | | | 12/20/2028 | | | | 3,280 | | | | 40 | | | | (14 | ) | | | 26 | |
| French Republic | | | 0.25 | | | Quarterly | | | 6/20/2034 | | | | 4,800 | | | | 76 | | | | 36 | | | | 112 | |
| Hungary | | | 1.00 | | | Quarterly | | | 6/20/2027 | | | | 965 | | | | 23 | | | | (30 | ) | | | (7 | ) |
| Hungary | | | 1.00 | | | Quarterly | | | 6/20/2028 | | | | 300 | | | | 7 | | | | (8 | ) | | | (1 | ) |
| Hungary | | | 1.00 | | | Quarterly | | | 12/20/2028 | | | | 1,600 | | | | 22 | | | | (20 | ) | | | 2 | |
| Hungary | | | 1.00 | | | Quarterly | | | 6/20/2029 | | | | 1,300 | | | | 14 | | | | (7 | ) | | | 7 | |
| Kingdom of Saudi Arabia | | | 1.00 | | | Quarterly | | | 6/20/2029 | | | | 6,700 | | | | (122 | ) | | | (3 | ) | | | (125 | ) |
| Kingdom of Saudi Arabia | | | 1.00 | | | Quarterly | | | 6/20/2032 | | | | 1,070 | | | | (10 | ) | | | (4 | ) | | | (14 | ) |
| Kingdom of Saudi Arabia | | | 1.00 | | | Quarterly | | | 6/20/2033 | | | | 2,220 | | | | (25 | ) | | | 4 | | | | (21 | ) |
| Kingdom of Saudi Arabia | | | 1.00 | | | Quarterly | | | 12/20/2033 | | | | 2,235 | | | | (22 | ) | | | 6 | | | | (16 | ) |
| Kingdom of Spain | | | 1.00 | | | Quarterly | | | 6/20/2032 | | | | 570 | | | | (9 | ) | | | (10 | ) | | | (19 | ) |
| Kingdom of Spain | | | 1.00 | | | Quarterly | | | 6/20/2033 | | | | 1,170 | | | | (21 | ) | | | (16 | ) | | | (37 | ) |
| Kingdom of Spain | | | 1.00 | | | Quarterly | | | 12/20/2033 | | | | 915 | | | | (20 | ) | | | (9 | ) | | | (29 | ) |
| Malaysia | | | 1.00 | | | Quarterly | | | 12/20/2027 | | | | 500 | | | | (5 | ) | | | (7 | ) | | | (12 | ) |
| Malaysia | | | 1.00 | | | Quarterly | | | 6/20/2028 | | | | 1,290 | | | | (21 | ) | | | (12 | ) | | | (33 | ) |
| Penerbangan Malaysia Bhd. | | | 1.00 | | | Quarterly | | | 12/20/2028 | | | | 330 | | | | (7 | ) | | | (2 | ) | | | (9 | ) |
| Petrobras Global Finance BV | | | 1.00 | | | Quarterly | | | 12/20/2027 | | | | 390 | | | | 20 | | | | (20 | ) | | | — | ^ |
| Republic of Chile | | | 1.00 | | | Quarterly | | | 6/20/2028 | | | | 750 | | | | (5 | ) | | | (12 | ) | | | (17 | ) |
| Republic of Chile | | | 1.00 | | | Quarterly | | | 12/20/2028 | | | | 3,710 | | | | (71 | ) | | | (15 | ) | | | (86 | ) |
| Republic of Chile | | | 1.00 | | | Quarterly | | | 6/20/2032 | | | | 950 | | | | 43 | | | | (54 | ) | | | (11 | ) |
| Republic of Colombia | | | 1.00 | | | Quarterly | | | 6/20/2028 | | | | 100 | | | | 6 | | | | (4 | ) | | | 2 | |
| Republic of Indonesia | | | 1.00 | | | Quarterly | | | 12/20/2027 | | | | 690 | | | | 3 | | | | (15 | ) | | | (12 | ) |
| Republic of Indonesia | | | 1.00 | | | Quarterly | | | 6/20/2028 | | | | 2,050 | | | | (15 | ) | | | (21 | ) | | | (36 | ) |
| Republic of Indonesia | | | 1.00 | | | Quarterly | | | 12/20/2028 | | | | 5,520 | | | | (63 | ) | | | (32 | ) | | | (95 | ) |
| Republic of Italy | | | 1.00 | | | Quarterly | | | 6/20/2034 | | | | 1,800 | | | | 29 | | | | (11 | ) | | | 18 | |
| Republic of Kazakhstan | | | 1.00 | | | Quarterly | | | 6/20/2028 | | | | 2,085 | | | | 35 | | | | (50 | ) | | | (15 | ) |
| Republic of Peru | | | 1.00 | | | Quarterly | | | 6/20/2028 | | | | 280 | | | | (1 | ) | | | (4 | ) | | | (5 | ) |
| Republic of Peru | | | 1.00 | | | Quarterly | | | 12/20/2028 | | | | 2,850 | | | | (40 | ) | | | (5 | ) | | | (45 | ) |
| Republic of Peru | | | 1.00 | | | Quarterly | | | 6/20/2032 | | | | 300 | | | | 12 | | | | (10 | ) | | | 2 | |
| Republic of Peru | | | 1.00 | | | Quarterly | | | 12/20/2032 | | | | 660 | | | | 35 | | | | (29 | ) | | | 6 | |
| Republic of Poland | | | 1.00 | | | Quarterly | | | 6/20/2027 | | | | 325 | | | | 1 | | | | (6 | ) | | | (5 | ) |
| Republic of Poland | | | 1.00 | | | Quarterly | | | 12/20/2027 | | | | 160 | | | | 2 | | | | (5 | ) | | | (3 | ) |
| Republic of Poland | | | 1.00 | | | Quarterly | | | 6/20/2028 | | | | 1,110 | | | | (9 | ) | | | (9 | ) | | | (18 | ) |
| Republic of Poland | | | 1.00 | | | Quarterly | | | 12/20/2028 | | | | 1,100 | | | | (14 | ) | | | (4 | ) | | | (18 | ) |
| Republic of Poland | | | 1.00 | | | Quarterly | | | 6/20/2029 | | | | 1,250 | | | | (17 | ) | | | (2 | ) | | | (19 | ) |
| Republic of South Africa | | | 1.00 | | | Quarterly | | | 6/20/2028 | | | | 600 | | | | 33 | | | | (28 | ) | | | 5 | |
| Republic of South Africa | | | 1.00 | | | Quarterly | | | 6/20/2029 | | | | 9,850 | | | | 467 | | | | (220 | ) | | | 247 | |
| Republic of South Africa | | | 1.00 | | | Quarterly | | | 6/20/2032 | | | | 765 | | | | 87 | | | | (19 | ) | | | 68 | |
| Republic of South Africa | | | 1.00 | | | Quarterly | | | 12/20/2032 | | | | 220 | | | | 30 | | | | (9 | ) | | | 21 | |
| Republic of South Africa | | | 1.00 | | | Quarterly | | | 6/20/2033 | | | | 2,445 | | | | 370 | | | | (108 | ) | | | 262 | |
| Republic of South Africa | | | 1.00 | | | Quarterly | | | 12/20/2033 | | | | 2,235 | | | | 352 | | | | (93 | ) | | | 259 | |
| Republic of Turkey | | | 1.00 | | | Quarterly | | | 6/20/2034 | | | | 3,350 | | | | 555 | | | | 24 | | | | 579 | |
| State of Qatar | | | 1.00 | | | Quarterly | | | 6/20/2029 | | | | 5,900 | | | | (132 | ) | | | (31 | ) | | | (163 | ) |
| State of Qatar | | | 1.00 | | | Quarterly | | | 12/20/2032 | | | | 200 | | | | (3 | ) | | | (2 | ) | | | (5 | ) |
| State of Qatar | | | 1.00 | | | Quarterly | | | 6/20/2033 | | | | 1,500 | | | | (29 | ) | | | (13 | ) | | | (42 | ) |
| United Mexican States | | | 1.00 | | | Quarterly | | | 12/20/2027 | | | | 175 | | | | 1 | | | | (3 | ) | | | (2 | ) |
| United Mexican States | | | 1.00 | | | Quarterly | | | 6/20/2028 | | | | 2,960 | | | | 7 | | | | (21 | ) | | | (14 | ) |
| United Mexican States | | | 1.00 | | | Quarterly | | | 12/20/2028 | | | | 4,865 | | | | (19 | ) | | | 11 | | | | (8 | ) |
| United Mexican States | | | 1.00 | | | Quarterly | | | 6/20/2029 | | | | 1,700 | | | | (5 | ) | | | 12 | | | | 7 | |
| Total buy protection | | | | | | | | | | | | | | | | | 1,625 | | | | (960 | ) | | | 665 | |
| – | | | | | | | | | — | | | | | | | | — | | | | | | | | | |
CENTRALLY CLEARED CREDIT DEFAULT SWAPS - SELL PROTECTION
Notional amounts and values in thousands and reported in USD unless otherwise stated
| Reference Entity | | Financing Rate
Received by the
Fund (%) | | Frequency of Payment
Made/Received | | Termination
Date | | Notional
Amount*** | | Upfront (Payments)
Receipts
($) | | Unrealized Appreciation
(Depreciation)
($) | | Value
($) |
| Federative Republic of Brazil | | 1.00 | | Quarterly | | 6/20/2026 | | 2,050 | | 10 | | 4 | | 14 |
| Republic of Colombia | | 1.00 | | Quarterly | | 6/20/2026 | | 2,050 | | 10 | | (2) | | 8 |
| Republic of Turkey | | 1.00 | | Quarterly | | 6/20/2025 | | 2,050 | | 1 | | 5 | | 6 |
| Total sell protection | | | | | | | | | | 21 | | 7 | | 28 |
| *** | If the Fund is the seller of credit protection, the notional amount is the maximum potential amount of future payments the Fund could be required to make if a credit event, as defined in the credit default swap agreement, were to occur. At September 30, 2024, such maximum potential amount for all open credit default swaps in which the Fund is the seller was $6,150. |
CENTRALLY CLEARED INTEREST RATE SWAPS
Notional amounts and values in thousands and reported in USD unless otherwise stated
| Floating Rate Index (Frequency) | | Fixed Rate (%) (Frequency) | | Fund Pays/
Receives
Floating
Rate | | Termination Date | | Notional Amount | | Upfront Payments
(Receipts)
($) | | Unrealized
Appreciation
(Depreciation)
($) | | Value
($) |
| | | | | | | | | | | | | | | |
| 4 week TIIE monthly | | 9.88 monthly | | Pay | | 3/18/2026 | | MXN 172,100 | | (31) | | 95 | | 64 |
| 6 month PRIBOR semi-annually | | 3.90 annually | | Pay | | 4/10/2034 | | CZK 13,000 | | (8) | | 35 | | 27 |
| 6 month PRIBOR semi-annually | | 3.95 annually | | Pay | | 12/1/2030 | | CZK 11,400 | | 1 | | 30 | | 31 |
| 1 day MIBOR semi-annually | | 6.19 semi-annually | | Pay | | 5/26/2033 | | INR 45,100 | | — | | 3 | | 3 |
| 1 day CAONREPO semi-annually | | 4.20 semi-annually | | Pay | | 3/20/2026 | | CAD 11,150 | | —^ | | 147 | | 147 |
| Total positive value | | | | | | | | | | (38) | | 310 | | 272 |
| – | | | | | | — | | | | — | | | | |
| 6 month BUBOR semi-annually | | 6.03 annually | | Receive | | 2/20/2033 | | HUF 160,000 | | 1 | | (25) | | (24) |
| 6 month WIBOR semi-annually | | 5.11 annually | | Receive | | 3/28/2034 | | PLN 5,400 | | (28) | | (79) | | (107) |
| 6 month BUBOR semi-annually | | 6.46 annually | | Receive | | 3/28/2034 | | HUF 48,000 | | — | | (11) | | (11) |
| 6 month BUBOR semi-annually | | 6.65 annually | | Receive | | 4/10/2034 | | HUF 41,000 | | — | | (7) | | (7) |
| 6 month WIBOR semi-annually | | 5.30 annually | | Receive | | 4/15/2032 | | PLN 1,491 | | (3) | | (18) | | (21) |
| 6 month WIBOR semi-annually | | 6.45 annually | | Receive | | 5/13/2032 | | PLN 225 | | — | | (8) | | (8) |
| 6 month BUBOR semi-annually | | 7.25 annually | | Receive | | 5/13/2032 | | HUF 38,300 | | (10) | | (1) | | (11) |
| 6 month BUBOR semi-annually | | 8.16 annually | | Receive | | 6/17/2032 | | HUF 174,000 | | 9 | | (88) | | (79) |
| 6 month WIBOR semi-annually | | 7.45 annually | | Receive | | 6/20/2032 | | PLN 3,625 | | (136) | | (53) | | (189) |
| 6 month WIBOR semi-annually | | 4.54 annually | | Receive | | 10/2/2028 | | PLN 5,100 | | 6 | | (35) | | (29) |
| 3 month TELBOR quarterly | | 4.00 annually | | Receive | | 10/25/2028 | | ILS 3,350 | | — | | (22) | | (22) |
| 3 month TELBOR quarterly | | 4.33 annually | | Receive | | 10/25/2033 | | ILS 4,285 | | (13) | | (19) | | (32) |
| 1 day THOR quarterly | | 2.89 quarterly | | Receive | | 6/17/2032 | | THB 2,750 | | — | | (4) | | (4) |
| 1 day THOR quarterly | | 2.59 quarterly | | Receive | | 9/1/2032 | | THB 7,450 | | (1) | | (5) | | (6) |
| 1 day THOR quarterly | | 2.99 quarterly | | Receive | | 9/26/2032 | | THB 5,300 | | — | | (9) | | (9) |
| 1 day TONAR annually | | 0.92 annually | | Receive | | 1/5/2033 | | JPY 308,800 | | (20) | | (17) | | (37) |
| 1 day THOR quarterly | | 2.83 quarterly | | Receive | | 8/17/2033 | | THB 3,600 | | — | | (5) | | (5) |
| 1 day THOR quarterly | | 2.95 quarterly | | Receive | | 10/2/2028 | | THB 23,260 | | — | | (27) | | (27) |
| Total negative value | | | | | | | | | | (195) | | (433) | | (628) |
| | | | | | | | | | | | | | | |
| Total | | | | | | | | | | (233) | | (123) | | (356) |
| | | | | | | | | | | | | | | |
The Fund has recorded an asset of $20 as of September 30, 2024, related to the current day’s variation margin associated with all centrally cleared swap contracts.
OTC Credit Default Swaps - Buy Protection
Notional amounts and values in thousands and reported in USD unless otherwise stated
| Reference Entity | | Financing Rate Paid
by the Fund (%) | | Frequency of
Payments Made/ Received | | Counterparty | | Termination
Date | | Notional Amount | | Upfront (Payments) Receipts
($) | | Unrealized
Appreciation (Depreciation)
($) | | Value
($) |
| China Construction Bank Corp. | | 1.00 | | Quarterly | | JPM | | 6/20/2029 | | 550 | | (5) | | (6) | | (11) |
| Industrial & Commercial Bank of China Ltd. | | 1.00 | | Quarterly | | JPM | | 6/20/2029 | | 450 | | (3) | | (6) | | (9) |
| Industrial & Commercial Bank of China Ltd. | | 1.00 | | Quarterly | | MS | | 6/20/2029 | | 100 | | (2) | | (—)^ | | (2) |
| Total | | | | | | | | | | | | (10) | | (12) | | (22) |
| | | | | | | | | | | | | | | | | |
OTC INTEREST RATE SWAPS
Values in thousands
| Floating Rate Index (Frequency) | | Fixed Rate (%) (Frequency) | | Fund Pays/
Receives
Floating
Rate | | Counterparty | | | Termination
Date | | Notional Amount | | Upfront Payments (Receipts)
($) | | Unrealized
Appreciation
(Depreciation)
($) | | Value
($) |
| 3 month KLIBOR quarterly | | 3.78 quarterly | | Receive | | | GS | | | 3/14/2033 | | MYR 2,210 | | | 6 | | | | (13 | ) | | | (7 | ) |
| 3 month KLIBOR quarterly | | 3.98 quarterly | | Receive | | | GS | | | 8/15/2033 | | MYR 1,550 | | | 1 | | | | (12 | ) | | | (11 | ) |
| Total | | | | | | | | | | | | | | | 7 | | | | (25 | ) | | | (18 | ) |
| | | | | | | | | | | | | | | | | | | | | | | | | |
REVERSE REPURCHASE AGREEMENT
Values in thousands
| Counterparty | | Interest
Rate | | Trade Date | | Maturity Date | | Face value
($) | | Face Value
Including Accrued
Interest
($) | | Type of Non Cash
Underlying Collateral | | Remaining
Contractual Maturity
of Agreement |
| Morgan Stanley & Co International Plc | | (3.00)% | | 9/23/2024 | | 12/31/2049 | | (200) | | (200) | | Frigorifico Concepcion SA | | Up to 25 Years* |
| * | Reverse repurchase agreement with no specific maturity date. Either party may terminate the agreement upon demand. |
Definitions of abbreviations and footnotes are detailed on page 2-3.
The accompanying notes are an integral part of the financial statements.
ARTISAN GLOBAL VALUE FUND
Schedule of Investments — September 30, 2024
Shares and dollar values in thousands
| | | Shares
Held | | Value | |
| COMMON STOCKS AND EQUITY-LINKED SECURITY - 93.2% | |
| |
| BELGIUM - 1.0% |
| Groupe Bruxelles Lambert NV | | | 320 | | | $ | 24,928 | |
| | | | | | | | | |
| CHINA - 2.9% |
| Alibaba Group Holding Ltd. | | | 5,172 | | | | 73,189 | |
| | | | | | | | | |
| FRANCE - 7.5% |
| Danone SA | | | 1,589 | | | | 115,588 | |
| Sodexo SA | | | 389 | | | | 31,911 | |
| TotalEnergies SE | | | 621 | | | | 40,409 | |
| | | | | | | | 187,908 | |
| GERMANY - 5.5% |
| Daimler Truck Holding AG | | | 638 | | | | 23,865 | |
| Heidelberg Materials AG | | | 1,055 | | | | 114,628 | |
| | | | | | | | 138,493 | |
| IRELAND - 0.7% |
| Ryanair Holdings plc, Equity-Linked Security(1)(2)(3)* | | | 973 | | | | 17,827 | |
| | | | | | | | | |
| NETHERLANDS - 6.7% |
| Heineken NV | | | 566 | | | | 50,143 | |
| Koninklijke Philips NV* | | | 3,282 | | | | 107,467 | |
| Universal Music Group NV | | | 397 | | | | 10,387 | |
| | | | | | | | 167,997 | |
| SOUTH KOREA - 3.8% |
| Samsung Electronics Co. Ltd. | | | 2,028 | | | | 95,385 | |
| | | | | | | | | |
| SWITZERLAND - 9.0% |
| Cie Financiere Richemont SA | | | 350 | | | | 55,379 | |
| Novartis AG | | | 941 | | | | 108,038 | |
| UBS Group AG | | | 2,017 | | | | 62,101 | |
| | | | | | | | 225,518 | |
| UNITED KINGDOM - 10.7% |
| BAE Systems plc | | | 3,011 | | | | 49,822 | |
| Compass Group plc | | | 3,085 | | | | 98,754 | |
| Diageo plc | | | 1,134 | | | | 39,469 | |
| Lloyds Banking Group plc | | | 54,071 | | | | 42,507 | |
| Reckitt Benckiser Group plc | | | 626 | | | | 38,296 | |
| | | | | | | | 268,848 | |
| UNITED STATES - 45.4% |
| Alphabet, Inc., Class A | | | 590 | | | | 97,865 | |
| American Express Co. | | | 404 | | | | 109,572 | |
| Aon plc, Class A | | | 91 | | | | 31,556 | |
| Bank of New York Mellon Corp. (The) | | | 1,355 | | | | 97,389 | |
| Berkshire Hathaway, Inc., Class B* | | | 207 | | | | 95,352 | |
| Charles Schwab Corp. (The) | | | 1,515 | | | | 98,183 | |
| Citigroup, Inc. | | | 934 | | | | 58,487 | |
| Elevance Health, Inc. | | | 202 | | | | 105,262 | |
| Henry Schein, Inc.* | | | 526 | | | | 38,347 | |
| Lam Research Corp. | | | 40 | | | | 32,464 | |
| Marsh & McLennan Cos., Inc. | | | 289 | | | | 64,407 | |
| Meta Platforms, Inc., Class A | | | 182 | | | | 104,325 | |
| Progressive Corp. (The) | | | 408 | | | | 103,443 | |
| Shell plc | | | 2,323 | | | | 75,310 | |
| Southwest Airlines Co. | | | 905 | | | | 26,824 | |
| | | | | | | | 1,138,786 | |
| Total common stocks and equity-linked security |
| (Cost $1,429,168) | | | | | | | 2,338,879 | |
| | | Shares
Held | | Value | |
| SHORT-TERM INVESTMENT - 5.9% |
| 2 | | | | | | | | |
| INVESTMENT COMPANY - 5.9% |
| BlackRock Liquidity Funds Treasury Trust Fund - Institutional Class, 4.85%(4) (Cost $148,083) | | | 148,083 | | | $ | 148,083 | |
| | | | | | | | | |
Total investments - 99.1%
(Cost $1,577,251) | | | | | | | 2,486,962 | |
| | | | | | | | | |
| Other assets less liabilities - 0.9% | | | | | | | 22,822 | |
| | | | | | | | | |
| Total net assets - 100.0%# | | | | | | $ | 2,509,784 | |
| (1) | Valued at a fair value in accordance with procedures established by the board of directors of Artisan Partners Funds. In total, securities valued at a fair value were $17,827, or 0.7% of total net assets. See notes 2(b) and 4 in Notes to Financial Statements for additional information. |
| (2) | Security is restricted. Security was acquired in a transaction pursuant to Rule 144A under the Securities Act of 1933, as amended, on the date or during the period noted below. |
| Security | | Acquisition Date | | Cost | | | Value | | | Percentage of
Total Net Assets | |
| Ryanair Holdings plc, Equity-Linked Security | | 7/3/2024 - 8/13/2024 | | $ | 17,251 | | | $ | 17,827 | | | | 0.7% | |
| (3) | Security is an equity-linked security issued by HSBC Bank plc. As described in 2(h) in Notes to Financial Statements, equity-linked securities are subject to counterparty risk with respect to the bank or broker-dealer that issues them. |
| (4) | Represents the current yield as of September 30, 2024. |
PORTFOLIO DIVERSIFICATION
Dollar values in thousands
| | | Value | | | Percentage of
Total Investments |
| Communication Services | | $ | 212,577 | | | | 8.5 | % |
| Consumer Discretionary | | | 259,233 | | | | 10.4 | |
| Consumer Staples | | | 243,496 | | | | 9.8 | |
| Energy | | | 115,719 | | | | 4.7 | |
| Financials | | | 787,925 | | | | 31.7 | |
| Health Care | | | 359,114 | | | | 14.4 | |
| Industrials | | | 118,338 | | | | 4.8 | |
| Information Technology | | | 127,849 | | | | 5.1 | |
| Materials | | | 114,628 | | | | 4.6 | |
| Short-Term Investment | | | 148,083 | | | | 6.0 | |
| Total investments | | $ | 2,486,962 | | | | 100.0 | % |
Definitions of abbreviations and footnotes are detailed on page 2-3.
The accompanying notes are an integral part of the financial statements.
ARTISAN HIGH INCOME FUND
Schedule of Investments — September 30, 2024
Principal amount, shares and values in thousands and reported in USD unless otherwise stated
| | | Principal
Amount | | Value | |
| CORPORATE BONDS - 74.3% |
| |
| AEROSPACE & DEFENSE - 0.2% |
| TransDigm, Inc. |
| 6.63%, 3/1/2032(1) | | | | | | | 16,145 | | | $ | 16,812 | |
| | | | | | | | | | | | | |
| BROADLINE RETAIL - 1.8% |
| Nordstrom, Inc. |
| 4.00%, 3/15/2027 | | | | | | | 14,636 | | | | 14,099 | |
| 4.25%, 8/1/2031 | | | | | | | 21,278 | | | | 18,742 | |
| 4.38%, 4/1/2030 | | | | | | | 56,341 | | | | 51,688 | |
| 5.00%, 1/15/2044 | | | | | | | 98,226 | | | | 75,776 | |
| | | | | | | | | | | | 160,305 | |
| BUILDING PRODUCTS - 0.4% |
| Eco Material Technologies, Inc. |
| 7.88%, 1/31/2027(1) | | | | | | | 35,525 | | | | 35,888 | |
| | | | | | | | | | | | | |
| CAPITAL MARKETS - 0.1% |
| AG Issuer LLC |
| 6.25%, 3/1/2028(1) | | | | | | | 12,225 | | | | 11,952 | |
| |
| CHEMICALS - 1.8% |
| Methanex Corp. |
| 5.13%, 10/15/2027(2) | | | | | | | 28,114 | | | | 27,819 | |
| 5.25%, 12/15/2029(2) | | | | | | | 91,452 | | | | 90,282 | |
| 5.65%, 12/1/2044(2) | | | | | | | 4,854 | | | | 4,377 | |
| SK Invictus Intermediate II SARL |
| 5.00%, 10/30/2029(1) | | | | | | | 35,487 | | | | 34,068 | |
| | | | | | | | | | | | 156,546 | |
| CONSTRUCTION & ENGINEERING - 0.3% |
| Signature Aviation US Holdings, Inc. |
| 4.00%, 3/1/2028(1) | | | | | | | 32,372 | | | | 28,973 | |
| | | | | | | | | | | | | |
| CONSUMER FINANCE - 0.1% |
| OneMain Finance Corp. |
| 7.88%, 3/15/2030 | | | | | | | 8,312 | | | | 8,689 | |
| | | | | | | | | | | | | |
| CONTAINERS & PACKAGING - 1.7% |
| Ardagh Metal Packaging Finance USA LLC |
| 3.00%, 9/1/2029 | | | EUR | | | | 8,242 | | | | 7,814 | |
| 3.25%, 9/1/2028(1) | | | | | | | 41,534 | | | | 38,020 | |
| 4.00%, 9/1/2029(1) | | | | | | | 45,034 | | | | 40,198 | |
| 6.00%, 6/15/2027(1) | | | | | | | 6,023 | | | | 6,066 | |
| Canpack SA |
| 3.88%, 11/15/2029(1)(2) | | | | | | | 3,536 | | | | 3,311 | |
| Iris Holding, Inc. |
| 10.00%, 12/15/2028(1) | | | | | | | 39,938 | | | | 34,750 | |
| Pactiv Evergreen Group Issuer, Inc. |
| 4.00%, 10/15/2027(1) | | | | | | | 26,608 | | | | 25,585 | |
| | | | | | | | | | | | 155,744 | |
| DISTRIBUTORS - 1.2% |
| American Builders & Contractors Supply Co., Inc. |
| 3.88%, 11/15/2029(1) | | | | | | | 4,150 | | | | 3,880 | |
| Gates Corp. |
| 6.88%, 7/1/2029(1) | | | | | | | 28,074 | | | | 29,081 | |
| Verde Purchaser LLC |
| 10.50%, 11/30/2030(1) | | | | | | | 29,753 | | | | 32,289 | |
| Windsor Holdings III LLC |
| 8.50%, 6/15/2030(1) | | | | | | | 43,264 | | | | 46,279 | |
| | | | | | | | | | | | 111,529 | |
| | | Principal
Amount | | Value | |
| DIVERSIFIED CONSUMER SERVICES - 0.4% |
| Wand NewCo 3, Inc. |
| 7.63%, 1/30/2032(1) | | | 32,851 | | | $ | 34,608 | |
| | | | | | | | | |
| DIVERSIFIED REITS - 0.9% |
| Global Net Lease, Inc. |
| 3.75%, 12/15/2027(1) | | | 53,117 | | | | 49,515 | |
| Necessity Retail REIT, Inc. (The) |
| 4.50%, 9/30/2028(1) | | | 31,343 | | | | 29,415 | |
| | | | | | | | 78,930 | |
| DIVERSIFIED TELECOMMUNICATION SERVICES - 8.8% |
| Altice France SA |
| 5.13%, 1/15/2029(1)(2) | | | 8,119 | | | | 5,702 | |
| 5.13%, 7/15/2029(1)(2) | | | 52,694 | | | | 37,055 | |
| 5.50%, 1/15/2028(1)(2) | | | 7,974 | | | | 5,798 | |
| 5.50%, 10/15/2029(1)(2) | | | 118,339 | | | | 82,878 | |
| CCO Holdings LLC |
| 4.25%, 2/1/2031(1) | | | 95,593 | | | | 84,287 | |
| 4.25%, 1/15/2034(1) | | | 24,208 | | | | 19,857 | |
| 4.50%, 8/15/2030(1) | | | 108,069 | | | | 97,962 | |
| 4.50%, 5/1/2032 | | | 94,019 | | | | 81,294 | |
| 4.75%, 3/1/2030(1) | | | 39,605 | | | | 36,430 | |
| 5.00%, 2/1/2028(1) | | | 18,210 | | | | 17,714 | |
| 5.13%, 5/1/2027(1) | | | 26,053 | | | | 25,642 | |
| 6.38%, 9/1/2029(1) | | | 19,741 | | | | 19,764 | |
| Virgin Media Finance plc |
| 5.00%, 7/15/2030(1)(2) | | | 147,527 | | | | 129,754 | |
| Virgin Media Secured Finance plc |
| 4.50%, 8/15/2030(1)(2) | | | 25,800 | | | | 22,950 | |
| 5.50%, 5/15/2029(1)(2) | | | 27,393 | | | | 26,273 | |
| Zayo Group Holdings, Inc. |
| 4.00%, 3/1/2027(1) | | | 53,705 | | | | 48,036 | |
| 6.13%, 3/1/2028(1) | | | 45,226 | | | | 37,538 | |
| | | | | | | | 778,934 | |
| ELECTRICAL EQUIPMENT - 1.3% |
| Regal Rexnord Corp. |
| 6.05%, 2/15/2026 | | | 1,768 | | | | 1,795 | |
| 6.05%, 4/15/2028 | | | 3,998 | | | | 4,157 | |
| 6.30%, 2/15/2030 | | | 52,835 | | | | 56,194 | |
| 6.40%, 4/15/2033 | | | 46,270 | | | | 49,487 | |
| | | | | | | | 111,633 | |
| ELECTRONIC EQUIPMENT, INSTRUMENTS & COMPONENTS - 0.1% |
| Insight Enterprises, Inc. |
| 6.63%, 5/15/2032(1) | | | 7,247 | | | | 7,564 | |
| | | | | | | | | |
| FINANCIAL SERVICES - 0.4% |
| Block, Inc. |
| 3.50%, 6/1/2031 | | | 7,513 | | | | 6,851 | |
| 6.50%, 5/15/2032(1) | | | 20,070 | | | | 20,899 | |
| Shift4 Payments LLC |
| 6.75%, 8/15/2032(1) | | | 11,704 | | | | 12,219 | |
| | | | | | | | 39,969 | |
| FOOD PRODUCTS - 0.2% |
| Fiesta Purchaser, Inc. |
| 9.63%, 9/15/2032(1) | | | 4,659 | | | | 4,823 | |
| H-Food Holdings LLC |
| 8.50%, 6/1/2026(1) | | | 78,005 | | | | 5,559 | |
| | | | | | | | 10,382 | |
| | | Principal Amount | | Value |
| HEALTH CARE EQUIPMENT & SUPPLIES - 2.9% | | | | | | | | |
| Medline Borrower LP | | | | | | | | |
| 3.88%, 4/1/2029(1) | | | 175,967 | | | $ | 166,599 | |
| 5.25%, 10/1/2029(1) | | | 59,998 | | | | 58,869 | |
| 6.25%, 4/1/2029(1) | | | 30,184 | | | | 31,100 | |
| | | | | | | | 256,568 | |
| HEALTH CARE PROVIDERS & SERVICES - 0.3% | | | | | | | | |
| HCA, Inc. | | | | | | | | |
| 3.50%, 9/1/2030 | | | 14,382 | | | | 13,553 | |
| Surgery Center Holdings, Inc. | | | | | | | | |
| 7.25%, 4/15/2032(1) | | | 6,505 | | | | 6,790 | |
| | | | | | | | 20,343 | |
| HOTEL & RESORT REITS - 0.6% | | | | | | | | |
| XHR LP | | | | | | | | |
| 4.88%, 6/1/2029(1) | | | 56,701 | | | | 54,347 | |
| | | | | | | | | |
| HOTELS, RESTAURANTS & LEISURE - 14.5% | | | | | | | | |
| Allwyn Entertainment Financing UK plc | | | | | | | | |
| 7.88%, 4/30/2029(1)(2) | | | 4,660 | | | | 4,900 | |
| Brinker International, Inc. | | | | | | | | |
| 5.00%, 10/1/2024(1) | | | 26,345 | | | | 26,345 | |
| 8.25%, 7/15/2030(1) | | | 3,399 | | | | 3,653 | |
| Carnival Corp. | | | | | | | | |
| 4.00%, 8/1/2028(1) | | | 13,445 | | | | 12,985 | |
| 5.75%, 3/1/2027(1) | | | 120,587 | | | | 122,125 | |
| 6.00%, 5/1/2029(1) | | | 147,473 | | | | 149,420 | |
| 7.63%, 3/1/2026(1) | | | 7,882 | | | | 7,955 | |
| 10.50%, 6/1/2030(1) | | | 18,945 | | | | 20,569 | |
| Carnival Holdings Bermuda Ltd. | | | | | | | | |
| 10.38%, 5/1/2028(1) | | | 4,169 | | | | 4,499 | |
| Churchill Downs, Inc. | | | | | | | | |
| 4.75%, 1/15/2028(1) | | | 18,039 | | | | 17,687 | |
| 5.75%, 4/1/2030(1) | | | 8,334 | | | | 8,343 | |
| Flutter Treasury DAC | | | | | | | | |
| 6.38%, 4/29/2029(1)(2) | | | 16,286 | | | | 16,863 | |
| Lindblad Expeditions Holdings, Inc. | | | | | | | | |
| 9.00%, 5/15/2028(1) | | | 21,875 | | | | 22,888 | |
| Lindblad Expeditions LLC | | | | | | | | |
| 6.75%, 2/15/2027(1) | | | 39,985 | | | | 40,257 | |
| Merlin Entertainments Group US Holdings, Inc. | | | | | | | | |
| 7.38%, 2/15/2031(1)(2) | | | 39,437 | | | | 39,590 | |
| MGM Resorts International | | | | | | | | |
| 4.63%, 9/1/2026 | | | 4,758 | | | | 4,728 | |
| 4.75%, 10/15/2028 | | | 40,099 | | | | 39,297 | |
| 5.50%, 4/15/2027 | | | 2,484 | | | | 2,492 | |
| Motion Bondco DAC | | | | | | | | |
| 6.63%, 11/15/2027(1)(2) | | | 42,716 | | | | 40,625 | |
| NCL Corp. Ltd. | | | | | | | | |
| 3.63%, 12/15/2024(1) | | | 7,722 | | | | 7,684 | |
| 5.88%, 3/15/2026(1) | | | 54,925 | | | | 54,929 | |
| 5.88%, 2/15/2027(1) | | | 6,824 | | | | 6,848 | |
| 7.75%, 2/15/2029(1) | | | 72,482 | | | | 77,672 | |
| 8.13%, 1/15/2029(1) | | | 16,983 | | | | 18,158 | |
| NCL Finance Ltd. | | | | | | | | |
| 6.13%, 3/15/2028(1) | | | 135,465 | | | | 138,174 | |
| Royal Caribbean Cruises Ltd. | | | | | | | | |
| 4.25%, 7/1/2026(1) | | | 19,431 | | | | 19,212 | |
| 5.38%, 7/15/2027(1) | | | 8,553 | | | | 8,629 | |
| 5.50%, 8/31/2026(1) | | | 26,365 | | | | 26,623 | |
| 5.50%, 4/1/2028(1) | | | 49,465 | | | | 50,092 | |
| 6.00%, 2/1/2033(1) | | | 12,378 | | | | 12,690 | |
| 6.25%, 3/15/2032(1) | | | 13,336 | | | | 13,834 | |
| SeaWorld Parks & Entertainment, Inc. | | | | | | | | |
| 5.25%, 8/15/2029(1) | | | 27,708 | | | | 27,039 | |
| | | Principal Amount | | Value |
| HOTELS, RESTAURANTS & LEISURE (continued) | | | | | | | | |
| Station Casinos LLC | | | | | | | | |
| 4.63%, 12/1/2031(1) | | | 29,589 | | | $ | 27,438 | |
| TKC Holdings, Inc. | | | | | | | | |
| 6.88%, 5/15/2028(1) | | | 60,254 | | | | 59,527 | |
| 10.50%, 5/15/2029(1) | | | 103,265 | | | | 103,828 | |
| Vail Resorts, Inc. | | | | | | | | |
| 6.50%, 5/15/2032(1) | | | 32,460 | | | | 33,918 | |
| | | | | | | | 1,271,516 | |
| HOUSEHOLD DURABLES - 0.2% | | | | | | | | |
| Tempur Sealy International, Inc. | | | | | | | | |
| 3.88%, 10/15/2031(1) | | | 19,694 | | | | 17,555 | |
| | | | | | | | | |
| INSURANCE - 13.4% | | | | | | | | |
| Acrisure LLC | | | | | | | | |
| 4.25%, 2/15/2029(1) | | | 20,011 | | | | 18,904 | |
| 6.00%, 8/1/2029(1) | | | 95,434 | | | | 92,043 | |
| 7.50%, 11/6/2030(1) | | | 37,584 | | | | 38,678 | |
| 8.25%, 2/1/2029(1) | | | 50,006 | | | | 51,599 | |
| 8.50%, 6/15/2029(1) | | | 35,984 | | | | 37,573 | |
| Alliant Holdings Intermediate LLC | | | | | | | | |
| 4.25%, 10/15/2027(1) | | | 11,678 | | | | 11,179 | |
| 5.88%, 11/1/2029(1) | | | 29,048 | | | | 27,894 | |
| 6.50%, 10/1/2031(1) | | | 54,287 | | | | 54,856 | |
| 6.75%, 10/15/2027(1) | | | 36,263 | | | | 36,127 | |
| 7.00%, 1/15/2031(1) | | | 16,488 | | | | 16,943 | |
| 7.38%, 10/1/2032(1) | | | 13,184 | | | | 13,367 | |
| AmWINS Group, Inc. | | | | | | | | |
| 4.88%, 6/30/2029(1) | | | 7,360 | | | | 7,057 | |
| 6.38%, 2/15/2029(1) | | | 11,301 | | | | 11,577 | |
| Ardonagh Finco Ltd. | | | | | | | | |
| 7.75%, 2/15/2031(1)(2) | | | 86,056 | | | | 88,958 | |
| Ardonagh Group Finance Ltd. | | | | | | | | |
| 8.88%, 2/15/2032(1)(2) | | | 245,066 | | | | 253,278 | |
| AssuredPartners, Inc. | | | | | | | | |
| 5.63%, 1/15/2029(1) | | | 1,469 | | | | 1,414 | |
| Baldwin Insurance Group Holdings LLC | | | | | | | | |
| 7.13%, 5/15/2031(1) | | | 49,691 | | | | 52,285 | |
| BroadStreet Partners, Inc. | | | | | | | | |
| 5.88%, 4/15/2029(1) | | | 65,204 | | | | 62,212 | |
| GTCR AP Finance, Inc. | | | | | | | | |
| 8.00%, 5/15/2027(1) | | | 60,606 | | | | 60,595 | |
| Highlands Holdings Bond Issuer Ltd. | | | | | | | | |
| 7.63% Cash, 8.38% PIK, 10/15/2025(1)(2) | | | 10,803 | | | | 10,782 | |
| Howden UK Refinance plc | | | | | | | | |
| 7.25%, 2/15/2031(1)(2) | | | 6,502 | | | | 6,747 | |
| HUB International Ltd. | | | | | | | | |
| 7.25%, 6/15/2030(1) | | | 54,194 | | | | 56,464 | |
| Jones Deslauriers Insurance Management, Inc. | | | | | | | | |
| 8.50%, 3/15/2030(1)(2) | | | 82,197 | | | | 87,943 | |
| 10.50%, 12/15/2030(1)(2) | | | 60,806 | | | | 66,125 | |
| Ryan Specialty LLC | | | | | | | | |
| 4.38%, 2/1/2030(1) | | | 7,638 | | | | 7,361 | |
| 5.88%, 8/1/2032(1) | | | 11,650 | | | | 11,844 | |
| | | | | | | | 1,183,805 | |
| IT SERVICES - 1.8% | | | | | | | | |
| Arches Buyer, Inc. | | | | | | | | |
| 4.25%, 6/1/2028(1) | | | 173,635 | | | | 159,795 | |
| | | | | | | | | |
| MACHINERY - 2.5% | | | | | | | | |
| Calderys Financing II LLC | | | | | | | | |
| 11.75% Cash, 12.50% PIK, 6/1/2028(1) | | | 32,672 | | | | 33,180 | |
| Calderys Financing LLC | | | | | | | | |
| 11.25%, 6/1/2028(1)(2) | | | 38,672 | | | | 41,573 | |
| | | Principal Amount | | Value |
| MACHINERY (continued) | | | | | | | | |
| Chart Industries, Inc. | | | | | | | | |
| 7.50%, 1/1/2030(1) | | | 18,527 | | | $ | 19,526 | |
| 9.50%, 1/1/2031(1) | | | 12,093 | | | | 13,181 | |
| Werner FinCo. LP | | | | | | | | |
| 8.75% Cash, 5.75% PIK, 10/15/2028(1) | | | 49,035 | | | | 48,571 | |
| 11.50%, 6/15/2028(1) | | | 55,221 | | | | 60,823 | |
| | | | | | | | 216,854 | |
| | | | | | | | | |
| MEDIA - 4.1% | | | | | | | | |
| CSC Holdings LLC | | | | | | | | |
| 3.38%, 2/15/2031(1) | | | 2,366 | | | | 1,678 | |
| 4.13%, 12/1/2030(1) | | | 3,919 | | | | 2,856 | |
| 4.50%, 11/15/2031(1) | | | 16,836 | | | | 12,256 | |
| 4.63%, 12/1/2030(1) | | | 103,809 | | | | 52,682 | |
| 5.38%, 2/1/2028(1) | | | 8,953 | | | | 7,542 | |
| 5.50%, 4/15/2027(1) | | | 12,343 | | | | 10,855 | |
| 6.50%, 2/1/2029(1) | | | 21,242 | | | | 17,592 | |
| 7.50%, 4/1/2028(1) | | | 57,856 | | | | 38,674 | |
| 11.25%, 5/15/2028(1) | | | 16,145 | | | | 15,585 | |
| 11.75%, 1/31/2029(1) | | | 11,465 | | | | 11,082 | |
| DISH Network Corp. | | | | | | | | |
| 11.75%, 11/15/2027(1) | | | 33,558 | | | | 35,220 | |
| Sinclair Television Group, Inc. | | | | | | | | |
| 5.13%, 2/15/2027(1) | | | 42,744 | | | | 37,199 | |
| 5.50%, 3/1/2030(1) | | | 45,261 | | | | 32,701 | |
| Virgin Media Vendor Financing Notes IV DAC | | | | | | | | |
| 5.00%, 7/15/2028(1)(2) | | | 22,722 | | | | 21,898 | |
| Ziggo Bond Co. BV | | | | | | | | |
| 5.13%, 2/28/2030(1)(2) | | | 18,989 | | | | 17,504 | |
| 6.00%, 1/15/2027(1)(2) | | | 27,070 | | | | 27,057 | |
| Ziggo BV | | | | | | | | |
| 4.88%, 1/15/2030(1)(2) | | | 24,246 | | | | 23,039 | |
| | | | | | | | 365,420 | |
| METALS & MINING - 1.3% | | | | | | | | |
| Commercial Metals Co. | | | | | | | | |
| 3.88%, 2/15/2031 | | | 3,702 | | | | 3,419 | |
| 4.13%, 1/15/2030 | | | 12,069 | | | | 11,460 | |
| Compass Minerals International, Inc. | | | | | | | | |
| 6.75%, 12/1/2027(1) | | | 94,942 | | | | 94,485 | |
| | | | | | | | 109,364 | |
| OIL, GAS & CONSUMABLE FUELS - 1.9% | | | | | | | | |
| Comstock Resources, Inc. | | | | | | | | |
| 6.75%, 3/1/2029(1) | | | 36,594 | | | | 35,615 | |
| CrownRock LP | | | | | | | | |
| 5.00%, 5/1/2029(1) | | | 29,058 | | | | 29,400 | |
| MEG Energy Corp. | | | | | | | | |
| 5.88%, 2/1/2029(1)(2) | | | 66,098 | | | | 64,661 | |
| Strathcona Resources Ltd. | | | | | | | | |
| 6.88%, 8/1/2026(1)(2) | | | 28,417 | | | | 28,282 | |
| Venture Global LNG, Inc. | | | | | | | | |
| 9.88%, 2/1/2032(1) | | | 15,551 | | | | 17,280 | |
| | | | | | | | 175,238 | |
| | | | | | | | | |
| PAPER & FOREST PRODUCTS - 0.4% | | | | | | | | |
| Ahlstrom Holding 3 Oy | | | | | | | | |
| 4.88%, 2/4/2028(1)(2) | | | 33,404 | | | | 31,445 | |
| | | | | | | | | |
| PASSENGER AIRLINES - 4.3% | | | | | | | | |
| Delta Air Lines, Inc. | | | | | | | | |
| 3.75%, 10/28/2029 | | | 54,212 | | | | 51,244 | |
| 4.38%, 4/19/2028 | | | 9,849 | | | | 9,752 | |
| 7.38%, 1/15/2026 | | | 37,312 | | | | 38,385 | |
| VistaJet Malta Finance plc | | | | | | | | |
| 6.38%, 2/1/2030(1)(2)(3) | | | 237,841 | | | | 204,338 | |
| 7.88%, 5/1/2027(1)(2)(3) | | | 57,489 | | | | 56,110 | |
| | | Principal Amount | | Value |
| PASSENGER AIRLINES (continued) | | | | | | | | |
| VistaJet Malta Finance plc (continued) | | | | | | | | |
| 9.50%, 6/1/2028(1)(2)(3) | | | 19,631 | | | $ | 19,187 | |
| | | | | | | | 379,016 | |
| PERSONAL CARE PRODUCTS - 1.1% | | | | | | | | |
| BellRing Brands, Inc. | | | | | | | | |
| 7.00%, 3/15/2030(1) | | | 77,724 | | | | 81,343 | |
| Prestige Brands, Inc. | | | | | | | | |
| 3.75%, 4/1/2031(1) | | | 22,886 | | | | 20,960 | |
| | | | | | | | 102,303 | |
| REAL ESTATE MANAGEMENT & DEVELOPMENT - 0.3% | | | | | | | | |
| Anywhere Real Estate Group LLC | | | | | | | | |
| 5.75%, 1/15/2029(1) | | | 36,031 | | | | 30,054 | |
| | | | | | | | | |
| SOFTWARE - 1.0% | | | | | | | | |
| Castle US Holding Corp. | | | | | | | | |
| 9.50%, 2/15/2028(1) | | | 25,953 | | | | 11,160 | |
| SS&C Technologies, Inc. | | | | | | | | |
| 6.50%, 6/1/2032(1) | | | 20,066 | | | | 20,744 | |
| UKG, Inc. | | | | | | | | |
| 6.88%, 2/1/2031(1) | | | 56,607 | | | | 58,492 | |
| | | | | | | | 90,396 | |
| SPECIALIZED REITS - 0.2% | | | | | | | | |
| Iron Mountain, Inc. | | | | | | | | |
| 5.00%, 7/15/2028(1) | | | 2,053 | | | | 2,026 | |
| 5.25%, 7/15/2030(1) | | | 16,752 | | | | 16,541 | |
| | | | | | | | 18,567 | |
| SPECIALTY RETAIL - 2.0% | | | | | | | | |
| Asbury Automotive Group, Inc. | | | | | | | | |
| 4.63%, 11/15/2029(1) | | | 27,360 | | | | 26,093 | |
| Bath & Body Works, Inc. | | | | | | | | |
| 6.63%, 10/1/2030(1) | | | 9,413 | | | | 9,596 | |
| 6.75%, 7/1/2036 | | | 10,753 | | | | 11,082 | |
| 6.88%, 11/1/2035 | | | 26,806 | | | | 27,932 | |
| Cougar JV Subsidiary LLC | | | | | | | | |
| 8.00%, 5/15/2032(1) | | | 20,809 | | | | 22,001 | |
| Evergreen Acqco 1 LP | | | | | | | | |
| 9.75%, 4/26/2028(1) | | | 15,068 | | | | 15,889 | |
| Gap, Inc. (The) | | | | | | | | |
| 3.63%, 10/1/2029(1) | | | 38,970 | | | | 35,248 | |
| 3.88%, 10/1/2031(1) | | | 26,947 | | | | 23,556 | |
| | | | | | | | 171,397 | |
| TEXTILES, APPAREL & LUXURY GOODS - 0.3% | | | | | | | | |
| S&S Holdings LLC | | | | | | | | |
| 8.38%, 10/1/2031(1) | | | 23,096 | | | | 23,254 | |
| | | | | | | | | |
| TRADING COMPANIES & DISTRIBUTORS - 0.3% | | | | | | | | |
| United Rentals North America, Inc. | | | | | | | | |
| 6.00%, 12/15/2029(1) | | | 23,069 | | | | 23,813 | |
| | | | | | | | | |
| WIRELESS TELECOMMUNICATION SERVICES - 1.2% | | | | | | | | |
| Altice France Holding SA | | | | | | | | |
| 6.00%, 2/15/2028(1)(2) | | | 89,835 | | | | 27,743 | |
| 10.50%, 5/15/2027(1)(2) | | | 25,971 | | | | 8,961 | |
| Vmed O2 UK Financing I plc | | | | | | | | |
| 4.25%, 1/31/2031(1)(2) | | | 42,712 | | | | 37,811 | |
| 7.75%, 4/15/2032(1)(2) | | | 32,524 | | | | 33,385 | |
| | | | | | | | 107,900 | |
| Total corporate bonds | | | | | | | | |
| (Cost $6,693,118) | | | | | | | 6,557,408 | |
| | | | | | | | | |
| BANK LOANS - 17.2% | | | | | | | | |
| | | Principal Amount | | Value |
| AUTOMOBILE COMPONENTS - 0.2% | | | | | | | | |
| Wheel Pros, Inc. First Lien Term Loan | | | | | | | | |
| (SOFR + 8.88%), 14.42%, 5/11/2028(4) | | | 15,534 | | | $ | 17,748 | |
| | | | | | | | | |
| COMMERCIAL SERVICES - 0.3% | | | | | | | | |
| Digital Room Holdings, Inc. First Lien Term Loan | | | | | | | | |
| (SOFR + 5.25%), 10.20%, 12/21/2028(4) | | | 28,470 | | | | 27,474 | |
| | | | | | | | | |
| COMMERCIAL SERVICES & SUPPLIES - 0.2% | | | | | | | | |
| OMNIA Partners LLC First Lien Term Loan B | | | | | | | | |
| (SOFR + 3.25%), 8.53%, 7/25/2030(4) | | | 15,819 | | | | 15,850 | |
| | | | | | | | | |
| COMMUNICATIONS EQUIPMENT - 0.9% | | | | | | | | |
| Delta Topco, Inc. First Lien Term Loan | | | | | | | | |
| (SOFR + 3.50%), 8.20%, 11/30/2029(4) | | | 25,697 | | | | 25,632 | |
| Delta Topco, Inc. Second Lien Term Loan | | | | | | | | |
| (SOFR + 5.25%), 9.95%, 12/24/2030(4) | | | 51,167 | | | | 51,380 | |
| | | | | | | | 77,012 | |
| CONTAINERS & PACKAGING - 0.7% | | | | | | | | |
| Iris Holding, Inc. First Lien Term Loan | | | | | | | | |
| (SOFR + 4.75%), 10.10%, 6/28/2028(4) | | | 65,067 | | | | 61,394 | |
| | | | | | | | | |
| DISTRIBUTORS - 0.4% | | | | | | | | |
| Verde Purchaser LLC First Lien Term Loan | | | | | | | | |
| (SOFR + 4.50%), 9.10%, 11/30/2030(4) | | | 33,798 | | | | 33,467 | |
| | | | | | | | | |
| DIVERSIFIED CONSUMER SERVICES - 0.6% | | | | | | | | |
| Wand Newco 3, Inc. First Lien Term Loan | | | | | | | | |
| (SOFR + 3.25%), 8.01%, 1/30/2031(4) | | | 51,377 | | | | 51,290 | |
| | | | | | | | | |
| DIVERSIFIED TELECOMMUNICATION SERVICES - 0.6% | | | | | | | | |
| Zayo Group Holdings, Inc. First Lien Term Loan | | | | | | | | |
| (SOFR + 3.00%), 7.96%, 3/9/2027(4) | | | 55,986 | | | | 51,052 | |
| | | | | | | | | |
| ELECTRONIC EQUIPMENT, INSTRUMENTS & COMPONENTS - 0.2% | | | | | | | | |
| Roper Industrial Products Investment Co. LLC First Lien Term Loan C | | | | | | | | |
| (SOFR + 3.25%), 7.85%, 11/22/2029(4) | | | 17,527 | | | | 17,552 | |
| | | | | | | | | |
| ENTERTAINMENT - 0.6% | | | | | | | | |
| J&J Ventures Gaming LLC Delayed Draw Term Loan | | | | | | | | |
| (SOFR + 4.25%), 9.21%, 4/26/2028(4) | | | 41,256 | | | | 41,067 | |
| J&J Ventures Gaming LLC First Lien Term Loan | | | | | | | | |
| (SOFR + 4.00%), 8.96%, 4/26/2028(4) | | | 13,173 | | | | 13,129 | |
| | | | | | | | 54,196 | |
| FINANCIAL SERVICES - 0.3% | | | | | | | | |
| Kestra Advisor Services Holdings A, Inc. First Lien Term Loan | | | | | | | | |
| (SOFR + 4.00%), 9.06%, 3/19/2031(4) | | | 24,296 | | | | 24,364 | |
| | | | | | | | | |
| FOOD PRODUCTS - 0.8% | | | | | | | | |
| H-Food Holdings LLC First Lien Term Loan | | | | | | | | |
| (SOFR + 3.69%), 9.01%, 5/23/2025(4) | | | 50,697 | | | | 37,791 | |
| H-Food Holdings LLC First Lien Term Loan B2 | | | | | | | | |
| (SOFR + 4.00%), 9.32%, 5/23/2025(4) | | | 32,831 | | | | 24,473 | |
| H-Food Holdings LLC First Lien Term Loan B3 | | | | | | | | |
| (SOFR + 5.00%), 10.32%, 5/23/2025(4) | | | 11,004 | | | | 8,202 | |
| | | | | | | | 70,466 | |
| FOOD SERVICE - 1.0% | | | | | | | | |
| TKC Holdings, Inc. First Lien Term Loan | | | | | | | | |
| (SOFR + 5.00%), 10.34%, 5/15/2028(4) | | | 71,548 | | | | 71,236 | |
| TKC Midco 1 LLC First Lien Term Loan | | | | | | | | |
| 12.00% Cash, 13.50% PIK, 2/16/2027 | | | 23,235 | | | | 19,285 | |
| | | | | | | | 90,521 | |
| HEALTH CARE PROVIDERS & SERVICES - 0.3% | | | | | | | | |
| Surgery Center Holdings, Inc. First Lien Term Loan | | | | | | | | |
| (SOFR + 2.75%), 7.67%, 12/19/2030(4) | | | 23,618 | | | | 23,622 | |
| | | Principal Amount | | Value |
| HOTELS, RESTAURANTS & LEISURE - 0.5% | | | | | | | | |
| BCPE Grill Parent, Inc. First Lien Term Loan | | | | | | | | |
| (SOFR + 4.75%), 10.00%, 9/30/2030(4) | | | 40,813 | | | $ | 39,138 | |
| LC Ahab US Bidco LLC First Lien Term Loan | | | | | | | | |
| (SOFR + 3.50%), 8.35%, 5/1/2031(4) | | | 8,008 | | | | 8,033 | |
| | | | | | | | 47,171 | |
| INSURANCE - 2.7% | | | | | | | | |
| Amynta Agency Borrower, Inc. First Lien Term Loan B | | | | | | | | |
| (SOFR + 3.75%), 9.00%, 2/28/2028(4) | | | 115,281 | | | | 115,209 | |
| Ardonagh Group Finance Pty Ltd. First Lien Term Loan B | | | | | | | | |
| (SOFR + 3.75%), 8.52%, 2/18/2031(2)(4) | | | 39,731 | | | | 39,756 | |
| AssuredPartners, Inc. First Lien Term Loan | | | | | | | | |
| (SOFR + 3.50%), 8.35%, 2/14/2031(4) | | | 3,081 | | | | 3,077 | |
| Hub International Ltd. First Lien Term Loan | | | | | | | | |
| (SOFR + 3.00%), 8.26%, 6/20/2030(4) | | | 5,714 | | | | 5,705 | |
| Hyperion Refinance SARL First Lien Term Loan B | | | | | | | | |
| (SOFR + 3.50%), 8.35%, 2/14/2031(2)(4) | | | 10,650 | | | | 10,651 | |
| OneDigital Borrower LLC Second Lien Term Loan | | | | | | | | |
| (SOFR + 5.25%), 10.10%, 7/2/2032(4) | | | 14,040 | | | | 13,886 | |
| Truist Insurance Holdings, Inc. Second Lien Term Loan | | | | | | | | |
| (SOFR + 4.75%), 9.35%, 5/6/2032(4) | | | 48,334 | | | | 49,059 | |
| | | | | | | | 237,343 | |
| INVESTMENT COMPANIES - 1.3% | | | | | | | | |
| Nexus Buyer LLC First Lien Term Loan B | | | | | | | | |
| (SOFR + 4.00%), 9.25%, 7/31/2031(4) | | | 49,901 | | | | 49,441 | |
| Nexus Buyer LLC Second Lien Term Loan | | | | | | | | |
| (SOFR + 6.25%), 11.20%, 11/1/2029(4) | | | 62,871 | | | | 62,557 | |
| | | | | | | | 111,998 | |
| IT SERVICES - 0.1% | | | | | | | | |
| Arches Buyer, Inc. First Lien Term Loan | | | | | | | | |
| (SOFR + 3.25%), 8.20%, 12/6/2027(4) | | | 9,129 | | | | 8,741 | |
| | | | | | | | |
| LEISURE PRODUCTS - 1.7% | | | | | | | | |
| Bulldog Purchaser, Inc. First Lien Term Loan | | | | | | | | |
| (SOFR + 4.25%), 8.85%, 6/27/2031(4) | | | 11,117 | | | | 11,159 | |
| Bulldog Purchaser, Inc. Second Lien Term Loan | | | | | | | | |
| (SOFR + 6.75%), 12.08%, 6/28/2032(4) | | | 9,545 | | | | 9,467 | |
| GSM Holdings, Inc. Term Loan First Lien | | | | | | | | |
| (SOFR + 5.00%), 9.20%, 9/29/2031(4) | | | 143,267 | | | | 133,238 | |
| | | | | | | | 153,864 | |
| RETAIL - CONSUMER STAPLES - 0.0%^ | | | | | | | | |
| Arthur US Finco, Inc. First Lien Term Loan | | | | | | | | |
| (SOFR + 5.25%), 9.85%, 12/14/2029(4) | | | 8 | | | | 7 | |
| | | | | | | | | |
| SOFTWARE - 3.3% | | | | | | | | |
| Applied Systems, Inc. First Lien Term Loan | | | | | | | | |
| (SOFR + 3.00%), 7.60%, 2/24/2031(4) | | | 44,519 | | | | 44,525 | |
| Applied Systems, Inc. Second Lien Term Loan | | | | | | | | |
| (SOFR + 5.25%), 9.85%, 2/23/2032(4) | | | 19,044 | | | | 19,592 | |
| Castle US Holding Corp. First Lien Term Loan | | | | | | | | |
| (SOFR + 3.75%), 9.07%, 1/29/2027(4) | | | 4,812 | | | | 3,181 | |
| CommerceHub, Inc. Second Lien Term Loan | | | | | | | | |
| (SOFR + 7.00%), 12.20%, 12/29/2028(4) | | | 10,610 | | | | 8,400 | |
| Constant Contact, Inc. Second Lien Term Loan | | | | | | | | |
| (SOFR + 7.50%), 13.07%, 2/12/2029(4) | | | 28,018 | | | | 25,590 | |
| Mobileum Acquisitionco LLC First Lien Term Loan | | | | | | | | |
| (SOFR + 1.00%), 5.95%, 9/11/2029(4) | | | 7,709 | | | | 7,362 | |
| Orchid Merger Sub II LLC Term Loan | | | | | | | | |
| (SOFR + 4.75%), 10.10%, 7/27/2027(4) | | | 22,142 | | | | 13,839 | |
| Renaissance Holding Corp. First Lien Term Loan | | | | | | | | |
| (SOFR + 4.25%), 9.10%, 4/8/2030(4) | | | 61,201 | | | | 61,139 | |
| UKG, Inc. First Lien Term Loan | | | | | | | | |
| (SOFR + 3.25%), 8.55%, 2/10/2031(4) | | | 105,478 | | | | 105,478 | |
| | | | | | | | 289,106 | |
| | | Principal Amount | | Value |
| TECHNOLOGY HARDWARE, STORAGE & PERIPHERALS - 0.2% | | | | | | | | |
| Ivanti Software, Inc. First Lien Term Loan | | | | | | | | |
| (SOFR + 4.00%), 9.57%, 12/1/2027(4) | | | 24,021 | | | $ | 19,979 | |
| Ivanti Software, Inc. First Lien Term Loan B1 | | | | | | | | |
| (SOFR + 4.25%), 9.83%, 12/1/2027(4) | | | 4,686 | | | | 3,966 | |
| Ivanti Software, Inc. Second Lien Term Loan | | | | | | | | |
| (SOFR + 7.25%), 12.83%, 12/1/2028(4) | | | 6,435 | | | | 4,011 | |
| | | | | | | | 27,956 | |
| TRANSPORTATION - 0.3% | | | | | | | | |
| SIRVA Worldwide, Inc. First Lien Term Loan | | | | | | | | |
| (SOFR + 8.00%), 12.81%, 8/20/2029(4) | | | 10,330 | | | | 10,020 | |
| (SOFR + 8.00%), 13.13%, 8/20/2029(4) | | | 24,280 | | | | 18,210 | |
| | | | | | | | 28,230 | |
| Total bank loans | | | | | | | | |
| (Cost $1,558,029) | | | | | | | 1,520,424 | |
| | | | | | | | | |
| | | | Shares Held | | | | | |
| COMMON STOCKS - 0.2% | | | | | | | | |
| | | | | | | | | |
| MACHINERY - 0.2% | | | | | | | | |
| Utex Equity(5)* | | | 364 | | | | 12,921 | |
| | | | | | | | | |
| SOFTWARE - 0.0%^ | | | | | | | | |
| Matrix Exit Equity | | | 355 | | | | 3,549 | |
| | | | | | | | | |
| TRANSPORTATION - 0.0%^ | | | | | | | | |
| SIRVA Worldwide, Inc.* | | | 47 | | | | 154 | |
| | | | | | | | | |
| Total common stocks | | | | | | | | |
| (Cost $12,310) | | | | | | | 16,624 | |
| | | | | | | | | |
| PREFERRED STOCK - 0.1% | | | | | | | | |
| | | | | | | | | |
| TRANSPORTATION - 0.1% | | | | | | | | |
| Sirva Worldwide Preferred Stock (Cost $1,216)* | | | 11 | | | | 5,435 | |
| | | | | | | | | |
| | | | No. of Warrants‡ | | | | | |
| | | | | | | | | |
| WARRANTS - 0.0% | | | | | | | | |
| | | | | | | | | |
| FINANCIAL SERVICES - 0.0% | | | | | | | | |
| Carnelian Point Holdings LP, expiring 6/30/2027, | | | | | | | | |
| strike price 10 | | | | | | | | |
(Cost $—)(5)(6)(7)* | | | 71 | | | | — | |
| | | | | | | | | |
| | | | Shares Held | | | | | |
| | | | | | | | | |
| SHORT-TERM INVESTMENT - 7.5% | | | | | | | | |
| | | | | | | | | |
| INVESTMENT COMPANY - 7.5% | | | | | | | | |
| BlackRock Liquidity Funds Treasury Trust Fund - Institutional Class, | | | | | | | | |
| 4.85%(8)(9) (Cost $663,934) | | | 663,934 | | | | 663,934 | |
| | | | | | | | | |
| Total investments - 99.3% | | | | | | | | |
| (Cost $8,928,607) | | | | | | | 8,763,825 | |
| | | | | | | | | |
| Other assets less liabilities - 0.7% | | | | | | | 61,513 | |
| Total net assets - 100.0%# | | | | | | $ | 8,825,338 | |
| (1) | Security exempt from registration pursuant to Rule 144A under the Securities Act of 1933. May be resold in transactions exempt from registration, normally to qualified institutional buyers. |
| | (2) | The Fund considers the company to be from outside the United States. |
| | Security | | Country | | Trading Currency |
| | Ahlstrom Holding 3 Oy, 4.88%, 2/4/2028 | | Finland | | USD |
| | Allwyn Entertainment Financing UK plc, 7.88%, 4/30/2029 | | Czech Republic | | USD |
| | Altice France Holding SA, 10.50%, 5/15/2027 | | Luxembourg | | USD |
| | Altice France Holding SA, 6.00%, 2/15/2028 | | Luxembourg | | USD |
| | Altice France SA, 5.50%, 1/15/2028 | | France | | USD |
| | Altice France SA, 5.13%, 1/15/2029 | | France | | USD |
| | Altice France SA, 5.13%, 7/15/2029 | | France | | USD |
| | Altice France SA, 5.50%, 10/15/2029 | | France | | USD |
| | Ardonagh Finco Ltd., 7.75%, 2/15/2031 | | United Kingdom | | USD |
| | Ardonagh Group Finance Ltd., 8.88%, 2/15/2032 | | United Kingdom | | USD |
| | Ardonagh Group Finance Pty Ltd. First Lien Term Loan B, 8.52%, 2/18/2031 | | Australia | | USD |
| | Calderys Financing LLC, 11.25%, 6/1/2028 | | France | | USD |
| | Canpack SA, 3.88%, 11/15/2029 | | Poland | | USD |
| | Flutter Treasury DAC, 6.38%, 4/29/2029 | | Ireland | | USD |
| | Highlands Holdings Bond Issuer Ltd., 7.63% Cash, 8.38% PIK, 10/15/2025 | | Bermuda | | USD |
| | Howden UK Refinance plc, 7.25%, 2/15/2031 | | United Kingdom | | USD |
| | Hyperion Refinance SARL First Lien Term Loan B, 8.35%, 2/14/2031 | | Luxembourg | | USD |
| | Jones Deslauriers Insurance Management, Inc., 8.50%, 3/15/2030 | | Canada | | USD |
| | Jones Deslauriers Insurance Management, Inc., 10.50%, 12/15/2030 | | Canada | | USD |
| | MEG Energy Corp., 5.88%, 2/1/2029 | | Canada | | USD |
| | Merlin Entertainments Group US Holdings, Inc., 7.38%, 2/15/2031 | | United Kingdom | | USD |
| | Methanex Corp., 5.13%, 10/15/2027 | | Canada | | USD |
| | Methanex Corp., 5.25%, 12/15/2029 | | Canada | | USD |
| | Methanex Corp., 5.65%, 12/1/2044 | | Canada | | USD |
| | Motion Bondco DAC, 6.63%, 11/15/2027 | | United Kingdom | | USD |
| | Strathcona Resources Ltd., 6.88%, 8/1/2026 | | Canada | | USD |
| | Virgin Media Finance plc, 5.00%, 7/15/2030 | | United Kingdom | | USD |
| | Virgin Media Secured Finance plc, 5.50%, 5/15/2029 | | United Kingdom | | USD |
| | Virgin Media Secured Finance plc, 4.50%, 8/15/2030 | | United Kingdom | | USD |
| | Virgin Media Vendor Financing Notes IV DAC, 5.00%, 7/15/2028 | | United Kingdom | | USD |
| | VistaJet Malta Finance plc, 7.88%, 5/1/2027 | | Switzerland | | USD |
| | VistaJet Malta Finance plc, 9.50%, 6/1/2028 | | Switzerland | | USD |
| | VistaJet Malta Finance plc, 6.38%, 2/1/2030 | | Switzerland | | USD |
| | Vmed O2 UK Financing I plc, 4.25%, 1/31/2031 | | United Kingdom | | USD |
| | Vmed O2 UK Financing I plc, 7.75%, 4/15/2032 | | United Kingdom | | USD |
| | Ziggo Bond Co. BV, 6.00%, 1/15/2027 | | Netherlands | | USD |
| | Ziggo Bond Co. BV, 5.13%, 2/28/2030 | | Netherlands | | USD |
| | Ziggo BV, 4.88%, 1/15/2030 | | Netherlands | | USD |
| (3) | All or a portion of security is on loan at September 30, 2024. |
| (4) | Variable or floating rate security, linked to the referenced benchmark. Interest rates reset periodically. Certain variable rate securities are not based on a published reference rate and spread but are determined by the issuer or agent and are based on current market conditions. The interest rate shown is the current rate as of September 30, 2024. |
| (6) | Security is valued using significant unobservable inputs and is classified as Level 3 in the fair value hierarchy. |
| (7) | Valued at a fair value in accordance with procedures established by the board of directors of Artisan Partners Funds. In total, securities valued at a fair value were $0, or 0.0% of total net assets. See notes 2(b) and 4 in Notes to Financial Statements for additional information. |
| (8) | Security is partially used as collateral for securities lending. At September 30, 2024, the Fund had loaned securities with a total value of $34,130. This was collateralized by cash of $34,807 which was subsequently invested in an investment company. |
| (9) | Represents the current yield as of September 30, 2024. |
PORTFOLIO DIVERSIFICATION
Dollar values in thousands
| | | Value | | Percentage of Total Investments |
| Communication Services | | $ | 1,357,502 | | | | 15.4 | % |
| Consumer Discretionary | | | 2,093,704 | | | | 23.9 | |
| Consumer Staples | | | 273,679 | | | | 3.1 | |
| Energy | | | 175,238 | | | | 2.0 | |
| Financials | | | 1,618,120 | | | | 18.5 | |
| Health Care | | | 300,533 | | | | 3.4 | |
| Industrials | | | 903,053 | | | | 10.3 | |
| Information Technology | | | 681,671 | | | | 7.8 | |
| Materials | | | 514,493 | | | | 5.9 | |
| Real Estate | | | 181,898 | | | | 2.1 | |
| Short-Term Investment | | | 663,934 | | | | 7.6 | |
| Total investments | | $ | 8,763,825 | | | | 100.0 | % |
FOREIGN CURRENCY FORWARD CONTRACTS
Values in thousands
| Currency Purchased | | Currency Sold | | Counterparty | | Settlement Date | | Unrealized Depreciation |
| USD | 7,451 | | | EUR | 6,813 | | | BOA | | | | 10/16/2024 | | | $ | (138 | ) |
| Total unrealized depreciation | | (138 | ) |
Definitions of abbreviations and footnotes are detailed on page 2-3.
The accompanying notes are an integral part of the financial statements.
ARTISAN INTERNATIONAL FUND
Schedule of Investments — September 30, 2024
Shares and dollar values in thousands
| | | Shares Held | | Value |
| COMMON STOCKS AND EQUITY-LINKED SECURITY - 94.5% | | | | | | | | |
| | | | | | | | | |
| BELGIUM - 4.0% | | | | | | | | |
| UCB SA | | | 1,160 | | | $ | 209,202 | |
| | | | | | | | | |
| CANADA - 4.0% | | | | | | | | |
| Canadian Pacific Kansas City Ltd. | | | 1,716 | | | | 146,774 | |
| Shopify, Inc., Class A* | | | 804 | | | | 64,467 | |
| | | | | | | | 211,241 | |
| DENMARK - 6.6% | | | | | | | | |
| Danske Bank A/S | | | 3,626 | | | | 109,103 | |
| NKT A/S* | | | 431 | | | | 40,724 | |
| Novo Nordisk A/S, Class B | | | 1,508 | | | | 177,208 | |
| Novonesis (Novozymes) B, Class B | | | 331 | | | | 23,843 | |
| | | | | | | | 350,878 | |
| FRANCE - 11.4% | | | | | | | | |
| Accor SA | | | 773 | | | | 33,567 | |
| Air Liquide SA | | | 1,296 | | | | 250,031 | |
| AXA SA | | | 1,644 | | | | 63,185 | |
| BNP Paribas SA | | | 372 | | | | 25,495 | |
| Bureau Veritas SA | | | 399 | | | | 13,231 | |
| Engie SA | | | 4,476 | | | | 77,309 | |
| Pernod Ricard SA | | | 256 | | | | 38,659 | |
| Safran SA | | | 431 | | | | 101,229 | |
| | | | | | | | 602,706 | |
| GERMANY - 9.7% | | | | | | | | |
| Allianz SE | | | 371 | | | | 121,982 | |
| Deutsche Boerse AG | | | 737 | | | | 172,917 | |
| Deutsche Telekom AG | | | 6,660 | | | | 195,656 | |
| Rheinmetall AG | | | 38 | | | | 20,653 | |
| | | | | | | | 511,208 | |
| IRELAND - 2.4% | | | | | | | | |
| AerCap Holdings NV | | | 362 | | | | 34,315 | |
| Ryanair Holdings plc, Equity-Linked Security(1)(2)(3)* | | | 5,208 | | | | 95,414 | |
| | | | | | | | 129,729 | |
| ITALY - 4.7% | | | | | | | | |
| BFF Bank SpA(4) | | | 4,144 | | | | 45,410 | |
| Mediobanca Banca di Credito Finanziario SpA | | | 3,591 | | | | 61,266 | |
| UniCredit SpA | | | 2,147 | | | | 94,099 | |
| Wizz Air Holdings plc(4)(5)* | | | 2,553 | | | | 49,484 | |
| | | | | | | | 250,259 | |
| JAPAN - 6.2% | | | | | | | | |
| Coca-Cola Bottlers Japan Holdings, Inc. | | | 1,871 | | | | 25,959 | |
| Japan Post Bank Co. Ltd. | | | 2,838 | | | | 26,416 | |
| Mitsubishi UFJ Financial Group, Inc. | | | 2,727 | | | | 27,581 | |
| Mitsui Fudosan Co. Ltd. | | | 487 | | | | 4,532 | |
| Nippon Sanso Holdings Corp. | | | 2,078 | | | | 75,356 | |
| Otsuka Holdings Co. Ltd. | | | 1,204 | | | | 67,712 | |
| Resona Holdings, Inc. | | | 4,765 | | | | 33,071 | |
| Sumitomo Mitsui Financial Group, Inc. | | | 3,091 | | | | 65,485 | |
| | | | | | | | 326,112 | |
| MEXICO - 1.4% | | | | | | | | |
| Cemex SAB de CV, ADR | | | 5,823 | | | | 35,523 | |
| Wal-Mart de Mexico SAB de CV | | | 12,933 | | | | 39,021 | |
| | | | | | | | 74,544 | |
| NETHERLANDS - 4.5% | | | | | | | | |
| Argenx SE, ADR* | | | 288 | | | | 155,896 | |
| Argenx SE* | | | 107 | | | | 57,985 | |
| Heineken NV | | | 280 | | | | 24,864 | |
| | | | | | | | 238,745 | |
| | | Shares Held | | Value |
| RUSSIA - 0.0% | | | | |
| Sberbank of Russia PJSC(1)(6)(7) | | | 38,445 | | | $ | — | |
| | | | | | | | | |
| SOUTH KOREA - 2.9% | | | | | | | | |
| Hanwha Aerospace Co. Ltd. | | | 150 | | | | 34,135 | |
| Hanwha Industrial Solutions Co. Ltd.* | | | 166 | | | | 4,240 | |
| LIG Nex1 Co. Ltd. | | | 446 | | | | 71,895 | |
| Samsung Electronics Co. Ltd. | | | 908 | | | | 42,706 | |
| | | | | | | | 152,976 | |
| SPAIN - 1.8% | | | | | | | | |
| Aena SME SA(4) | | | 440 | | | | 96,701 | |
| | | | | | | | | |
| SWITZERLAND - 9.0% | | | | | | | | |
| Galderma Group AG* | | | 382 | | | | 35,492 | |
| Medacta Group SA(4) | | | 351 | | | | 51,851 | |
| SGS SA | | | 789 | | | | 87,926 | |
| UBS Group AG | | | 9,682 | | | | 298,111 | |
| | | | | | | | 473,380 | |
| UNITED KINGDOM - 16.1% | | | | | | | | |
| 3i Group plc | | | 1,106 | | | | 48,877 | |
| AstraZeneca plc | | | 289 | | | | 44,758 | |
| BAE Systems plc | | | 10,996 | | | | 181,925 | |
| British American Tobacco plc | | | 1,085 | | | | 39,497 | |
| London Stock Exchange Group plc | | | 495 | | | | 67,596 | |
| Melrose Industries plc | | | 30,339 | | | | 184,842 | |
| National Grid plc | | | 9,366 | | | | 128,975 | |
| Reckitt Benckiser Group plc | | | 492 | | | | 30,129 | |
| RELX plc | | | 2,641 | | | | 123,908 | |
| | | | | | | | 850,507 | |
| UNITED STATES - 9.8% | | | | | | | | |
| Amazon.com, Inc.* | | | 1,201 | | | | 223,716 | |
| Linde plc | | | 485 | | | | 231,377 | |
| Nestle SA | | | 654 | | | | 65,603 | |
| | | | | | | | 520,696 | |
| Total common stocks and equity-linked security | | | | | | | | |
| (Cost $3,692,688) | | | | | | | 4,998,884 | |
| | | | | | | | | |
| SHORT-TERM INVESTMENT - 3.2% | | | | | | | | |
| | | | | | | | | |
| INVESTMENT COMPANY - 3.2% | | | | | | | | |
| BlackRock Liquidity Funds Treasury Trust Fund - Institutional Class, | | | | | | | | |
| 4.85%(8)(9) (Cost $167,863) | | | 167,863 | | | | 167,863 | |
| | | | | | | | | |
| Total investments - 97.7% | | | | | | | | |
| (Cost $3,860,551) | | | | | | | 5,166,747 | |
| | | | | | | | | |
| Other assets less liabilities - 2.3% | | | | | | | 120,180 | |
| | | | | | | | | |
| Total net assets - 100.0%# | | | | | | $ | 5,286,927 | |
| (1) | Valued at a fair value in accordance with procedures established by the board of directors of Artisan Partners Funds. In total, securities valued at a fair value were $95,414, or 1.8% of total net assets. See notes 2(b) and 4 in Notes to Financial Statements for additional information. |
| (2) | Security is restricted. Security was acquired in a transaction pursuant to Rule 144A under the Securities Act of 1933, as amended, on the date or during the period noted below. |
| Security | | Acquisition Date | | Cost | | Value | | Percentage of Total Net Assets |
| Ryanair Holdings plc, Equity-Linked | | | | | | | | | | | | | | |
| Security | | 11/14/2013 - 7/22/2024 | | $ | 80,863 | | | $ | 95,414 | | | | 1.8% | |
| (3) | Security is an equity-linked security issued by HSBC Bank plc. As described in 2(h) in Notes to Financial Statements, equity-linked securities are subject to counterparty risk with respect to the bank or broker-dealer that issues them. |
| (4) | Regulation S is an exemption for securities offerings that are made outside of the United States and do not involve direct selling efforts in the United States. Resale restrictions may apply for purposes of the Securities Act of 1933. At September 30, 2024, the value of these securities was $243,446 or 4.6% of net assets. |
| (5) | All or a portion of security is on loan at September 30, 2024. |
| (6) | Security is valued using significant unobservable inputs and is classified as Level 3 in the fair value hierarchy. |
| (7) | Security is restricted. |
| | | | | | | | | Percentage of |
| Security | | Acquisition Date | | Cost | | Value | | Total Net Assets |
| Sberbank of Russia PJSC | | 9/16/2021 - 2/11/2022 | | $ | 159,810 | | | $ | – | | | | 0.0% | |
| (8) | Security is partially used as collateral for securities lending. At September 30, 2024, the Fund had loaned securities with a total value of $9,725. This was collateralized by cash of $10,725 which was subsequently invested in an investment company. |
| (9) | Represents the current yield as of September 30, 2024. |
PORTFOLIO DIVERSIFICATION
Dollar values in thousands
| | | Value | | Percentage of Total Investments |
| Communication Services | | $ | 195,656 | | | | 3.8 | % |
| Consumer Discretionary | | | 257,283 | | | | 5.0 | |
| Consumer Staples | | | 263,732 | | | | 5.1 | |
| Financials | | | 1,260,594 | | | | 24.4 | |
| Health Care | | | 800,104 | | | | 15.5 | |
| Industrials | | | 1,287,396 | | | | 24.9 | |
| Information Technology | | | 107,173 | | | | 2.1 | |
| Materials | | | 616,130 | | | | 11.9 | |
| Real Estate | | | 4,532 | | | | 0.1 | |
| Utilities | | | 206,284 | | | | 4.0 | |
| Short-Term Investment | | | 167,863 | | | | 3.2 | |
| Total investments | | $ | 5,166,747 | | | | 100.0 | % |
Definitions of abbreviations and footnotes are detailed on page 2-3.
The accompanying notes are an integral part of the financial statements.
ARTISAN INTERNATIONAL EXPLORER FUND
Schedule of Investments — September 30, 2024
Shares and dollar values in thousands
| | | Shares
Held | | | Value | |
| COMMON STOCKS - 86.8% | | | | | | | | |
| | | | | | | | | |
| ARGENTINA - 7.2% | | | | | | | | |
| Despegar.com Corp.* | | | 919 | | | $ | 11,391 | |
| | | | | | | | | |
| AUSTRALIA - 2.9% | | | | | | | | |
| Steadfast Group Ltd. | | | 1,184 | | | | 4,640 | |
| | | | | | | | | |
| BRAZIL - 1.2% | | | | | | | | |
| Pluxee NV* | | | 92 | | | | 1,937 | |
| | | | | | | | | |
| CANADA - 2.4% | | | | | | | | |
| Knight Therapeutics, Inc.* | | | 334 | | | | 1,464 | |
| Real Matters, Inc.* | | | 354 | | | | 2,397 | |
| | | | | | | | 3,861 | |
| CHINA - 0.1% | | | | | | | | |
| China Isotope & Radiation Corp. | | | 130 | | | | 188 | |
| | | | | | | | | |
| DENMARK - 0.5% | | | | | | | | |
| ALK-Abello A/S, Class B* | | | 33 | | | | 840 | |
| | | | | | | | | |
| FRANCE - 4.6% | | | | | | | | |
| Alten SA | | | 65 | | | | 7,233 | |
| | | | | | | | | |
| GERMANY - 3.9% | | | | | | | | |
| AlzChem Group AG | | | 76 | | | | 4,010 | |
| Hensoldt AG | | | 67 | | | | 2,200 | |
| | | | | | | | 6,210 | |
| INDIA - 2.1% | | | | | | | | |
| Care Ratings Ltd. | | | 274 | | | | 3,300 | |
| | | | | | | | | |
| INDONESIA - 2.0% | | | | | | | | |
| Mitra Adiperkasa Tbk. PT | | | 27,621 | | | | 3,211 | |
| | | | | | | | | |
| IRELAND - 9.8% | | | | | | | | |
| Glenveagh Properties plc(1)* | | | 9,011 | | | | 15,567 | |
| | | | | | | | | |
| ITALY - 1.2% | | | | | | | | |
| Sesa SpA | | | 18 | | | | 1,887 | |
| | | | | | | | | |
| JAPAN - 11.8% | | | | | | | | |
| Kansai Paint Co. Ltd. | | | 284 | | | | 5,034 | |
| Sato Holdings Corp. | | | 383 | | | | 5,582 | |
| Zuken, Inc. | | | 327 | | | | 8,169 | |
| | | | | | | | 18,785 | |
| NORWAY - 1.1% | | | | | | | | |
| Spir Group ASA* | | | 2,485 | | | | 1,785 | |
| | | | | | | | | |
| SOUTH AFRICA - 1.3% | | | | | | | | |
| Famous Brands Ltd. | | | 553 | | | | 2,032 | |
| | | | | | | | | |
| SOUTH KOREA - 1.7% | | | | | | | | |
| Vitzrocell Co. Ltd. | | | 190 | | | | 2,706 | |
| | | | | | | | | |
| SWITZERLAND - 0.7% | | | | | | | | |
| Medmix AG(1) | | | 96 | | | | 1,179 | |
| | | | | | | | | |
| UNITED KINGDOM - 25.9% | | | | | | | | |
| Allfunds Group plc | | | 274 | | | | 1,686 | |
| Essentra plc | | | 1,424 | | | | 2,910 | |
| FD Technologies plc* | | | 76 | | | | 1,673 | |
| FDM Group Holdings plc | | | 700 | | | | 3,604 | |
| IDOX plc | | | 4,572 | | | | 3,704 | |
| IQE plc* | | | 9,938 | | | | 2,221 | |
| Kingfisher plc | | | 1,074 | | | | 4,624 | |
| LSL Property Services plc | | | 370 | | | | 1,469 | |
| Luxfer Holdings plc | | | 299 | | | | 3,874 | |
| | | Shares
Held | | | Value | |
| UNITED KINGDOM (continued) | | | | | | | | |
| M&C Saatchi plc(2) | | | 6,358 | | | $ | 15,472 | |
| | | | | | | | 41,237 | |
| UNITED STATES - 5.3% | | | | | | | | |
| Impro Precision Industries Ltd.(1) | | | 14,455 | | | | 3,830 | |
| Signify NV(1) | | | 194 | | | | 4,578 | |
| | | | | | | | 8,408 | |
| VIRGIN ISLANDS, BRITISH - 1.1% | | | | | | | | |
| AdvancedAdvT Ltd.* | | | 993 | | | | 1,739 | |
| | | | | | | | | |
| Total common stocks | | | | | | | | |
| (Cost $122,354) | | | | | | | 138,136 | |
| | | | | | | | | |
| SHORT-TERM INVESTMENT - 13.0% | | | | | | | | |
| | | | | | | | | |
| INVESTMENT COMPANY - 13.0% | | | | | | | | |
| BlackRock Liquidity Funds Treasury Trust Fund - Institutional Class, 4.85%(3) (Cost $20,669) | | | 20,669 | | | | 20,669 | |
| | | | | | | | | |
| Total investments - 99.8% | | | | | | | | |
| (Cost $143,023) | | | | | | | 158,805 | |
| | | | | | | | | |
| Other assets less liabilities - 0.2% | | | | | | | 344 | |
| | | | | | | | | |
| Total net assets - 100.0% # | | | | | | $ | 159,149 | |
| (1) | Regulation S is an exemption for securities offerings that are made outside of the United States and do not involve direct selling efforts in the United States. Resale restrictions may apply for purposes of the Securities Act of 1933. At September 30, 2024, the value of these securities was $25,154 or 15.8% of net assets. |
| (2) | Affiliated company as defined under the Investment Company Act of 1940. See note 10 in Notes to Financial Statements for additional information. |
| (3) | Represents the current yield as of September 30, 2024. |
PORTFOLIO DIVERSIFICATION
Dollar values in thousands
| | | Value | | | Percentage of
Total Investments | |
| Communication Services | | $ | 15,472 | | | | 9.7 | % |
| Consumer Discretionary | | | 36,825 | | | | 23.2 | |
| Financials | | | 11,365 | | | | 7.2 | |
| Health Care | | | 3,671 | | | | 2.3 | |
| Industrials | | | 24,707 | | | | 15.6 | |
| Information Technology | | | 30,276 | | | | 19.1 | |
| Materials | | | 11,954 | | | | 7.5 | |
| Real Estate | | | 3,866 | | | | 2.4 | |
| Short-Term Investment | | | 20,669 | | | | 13.0 | |
| Total investments | | $ | 158,805 | | | | 100.0 | % |
Definitions of abbreviations and footnotes are detailed on page 2-3.
The accompanying notes are an integral part of the financial statements.
ARTISAN INTERNATIONAL SMALL-MID FUND
Schedule of Investments — September 30, 2024
Shares and dollar values in thousands
| | | Shares
Held | | | Value | |
| COMMON STOCKS - 95.1% | | | | | | | | |
| | | | | | | | | |
| BELGIUM - 1.0% | | | | | | | | |
| Azelis Group NV | | | 2,215 | | | $ | 48,544 | |
| | | | | | | | | |
| BRAZIL - 1.5% | | | | | | | | |
| Hapvida Participacoes e Investimentos SA(1)* | | | 18,923 | | | | 13,964 | |
| Rumo SA | | | 6,131 | | | | 22,597 | |
| Vibra Energia SA | | | 7,722 | | | | 33,072 | |
| | | | | | | | 69,633 | |
| CANADA - 5.0% | | | | | | | | |
| Altus Group Ltd. | | | 684 | | | | 27,765 | |
| CAE, Inc.* | | | 3,317 | | | | 62,271 | |
| Descartes Systems Group, Inc. (The)* | | | 235 | | | | 24,138 | |
| Kinaxis, Inc.* | | | 422 | | | | 50,093 | |
| Lightspeed Commerce, Inc.* | | | 3,041 | | | | 50,133 | |
| Whitecap Resources, Inc. | | | 3,052 | | | | 22,794 | |
| | | | | | | | 237,194 | |
| CHINA - 0.6% | | | | | | | | |
| BeiGene Ltd., ADR* | | | 129 | | | | 28,902 | |
| | | | | | | | | |
| DENMARK - 5.8% | | | | | | | | |
| ALK-Abello A/S, Class B* | | | 1,271 | | | | 32,595 | |
| Ambu A/S, Class B* | | | 5,129 | | | | 100,450 | |
| DSV A/S | | | 103 | | | | 21,311 | |
| FLSmidth & Co. A/S | | | 1,245 | | | | 70,517 | |
| Genmab A/S* | | | 103 | | | | 24,817 | |
| Vestas Wind Systems A/S* | | | 831 | | | | 18,345 | |
| Zealand Pharma A/S, Class A* | | | 78 | | | | 9,475 | |
| | | | | | | | 277,510 | |
| FINLAND - 2.6% | | | | | | | | |
| Cargotec OYJ, Class B | | | 290 | | | | 16,970 | |
| Huhtamaki OYJ | | | 875 | | | | 33,981 | |
| Kalmar OYJ, Class B* | | | 195 | | | | 6,313 | |
| Metso Oyj | | | 6,036 | | | | 64,506 | |
| | | | | | | | 121,770 | |
| FRANCE - 0.9% | | | | | | | | |
| Lectra | | | 1,313 | | | | 42,767 | |
| | | | | | | | | |
| GERMANY - 3.8% | | | | | | | | |
| AIXTRON SE | | | 1,729 | | | | 30,715 | |
| Brenntag SE | | | 388 | | | | 28,927 | |
| Fresenius Medical Care AG | | | 365 | | | | 15,522 | |
| Hannover Rueck SE | | | 125 | | | | 35,765 | |
| Hensoldt AG | | | 1,322 | | | | 43,340 | |
| Immatics NV* | | | 435 | | | | 4,962 | |
| Symrise AG, Class A | | | 155 | | | | 21,442 | |
| | | | | | | | 180,673 | |
| ICELAND - 0.4% | | | | | | | | |
| Embla Medical HF* | | | 4,141 | | | | 19,168 | |
| | | | | | | | | |
| INDIA - 1.9% | | | | | | | | |
| PB Fintech Ltd.* | | | 975 | | | | 18,844 | |
| WNS Holdings Ltd.* | | | 1,362 | | | | 71,807 | |
| | | | | | | | 90,651 | |
| IRELAND - 0.7% | | | | | | | | |
| AerCap Holdings NV | | | 344 | | | | 32,604 | |
| | | | | | | | | |
| ISRAEL - 5.9% | | | | | | | | |
| Kornit Digital Ltd.* | | | 2,258 | | | | 58,326 | |
| Nice Ltd., ADR* | | | 849 | | | | 147,502 | |
| Radware Ltd.* | | | 1,398 | | | | 31,137 | |
| | | Shares
Held | | | Value | |
| ISRAEL (continued) | | | | | | | | |
| Rami Levy Chain Stores Hashikma Marketing 2006 Ltd. | | | 176 | | | $ | 9,827 | |
| Tel Aviv Stock Exchange Ltd. | | | 3,448 | | | | 32,558 | |
| | | | | | | | 279,350 | |
| ITALY - 1.2% | | | | | | | | |
| Davide Campari-Milano NV | | | 2,703 | | | | 22,866 | |
| Ermenegildo Zegna NV | | | 2,278 | | | | 22,413 | |
| Moncler SpA | | | 186 | | | | 11,811 | |
| | | | | | | | 57,090 | |
| JAPAN - 16.9% | | | | | | | | |
| Ariake Japan Co. Ltd. | | | 232 | | | | 8,528 | |
| Azbil Corp. | | | 9,262 | | | | 74,786 | |
| CKD Corp. | | | 2,479 | | | | 50,806 | |
| Daikokutenbussan Co. Ltd. | | | 552 | | | | 44,995 | |
| DMG Mori Co. Ltd. | | | 2,077 | | | | 43,593 | |
| en Japan, Inc. | | | 537 | | | | 9,087 | |
| GMO Financial Gate, Inc. | | | 252 | | | | 12,536 | |
| GMO Payment Gateway, Inc. | | | 833 | | | | 50,991 | |
| Harmonic Drive Systems, Inc. | | | 1,019 | | | | 25,054 | |
| Japan Elevator Service Holdings Co. Ltd. | | | 1,812 | | | | 39,218 | |
| Jeol Ltd. | | | 407 | | | | 15,760 | |
| Mani, Inc. | | | 836 | | | | 10,590 | |
| MatsukiyoCocokara & Co. | | | 2,755 | | | | 45,104 | |
| Menicon Co. Ltd. | | | 197 | | | | 2,001 | |
| Money Forward, Inc.* | | | 737 | | | | 30,046 | |
| Morinaga Milk Industry Co. Ltd. | | | 1,854 | | | | 45,317 | |
| NOF Corp. | | | 2,558 | | | | 43,785 | |
| PILLAR Corp. | | | 31 | | | | 889 | |
| Rohm Co. Ltd. | | | 1,803 | | | | 20,148 | |
| Rohto Pharmaceutical Co. Ltd. | | | 2,734 | | | | 67,956 | |
| Sawai Group Holdings Co. Ltd. | | | 292 | | | | 4,132 | |
| SCSK Corp. | | | 2,004 | | | | 41,271 | |
| SG Holdings Co. Ltd. | | | 2,883 | | | | 30,913 | |
| Shiseido Co. Ltd. | | | 893 | | | | 24,084 | |
| Suntory Beverage & Food Ltd. | | | 1,117 | | | | 41,932 | |
| Toyo Suisan Kaisha Ltd. | | | 260 | | | | 16,887 | |
| | | | | | | | 800,409 | |
| MEXICO - 0.4% | | | | | | | | |
| Qualitas Controladora SAB de CV | | | 2,741 | | | | 21,440 | |
| | | | | | | | | |
| NETHERLANDS - 1.4% | | | | | | | | |
| IMCD NV | | | 231 | | | | 40,108 | |
| Koninklijke Philips NV* | | | 783 | | | | 25,651 | |
| | | | | | | | 65,759 | |
| SOUTH KOREA - 0.1% | | | | | | | | |
| Hanmi Pharm Co. Ltd. | | | 18 | | | | 4,311 | |
| | | | | | | | | |
| SPAIN - 0.5% | | | | | | | | |
| Fluidra SA | | | 948 | | | | 24,795 | |
| | | | | | | | | |
| SWEDEN - 4.2% | | | | | | | | |
| AAK AB | | | 1,018 | | | | 33,394 | |
| Beijer Ref AB, Class B | | | 1,681 | | | | 27,632 | |
| Fortnox AB | | | 4,934 | | | | 30,608 | |
| Swedish Orphan Biovitrum AB* | | | 3,296 | | | | 106,126 | |
| | | | | | | | 197,760 | |
| SWITZERLAND - 2.4% | | | | | | | | |
| Baloise Holding AG | | | 157 | | | | 32,071 | |
| Burckhardt Compression Holding AG | | | 26 | | | | 18,885 | |
| dormakaba Holding AG | | | 37 | | | | 27,083 | |
| | | Shares
Held | | | Value | |
| SWITZERLAND (continued) | | | | | | | | |
| Inficon Holding AG | | | 12 | | | $ | 17,797 | |
| On Holding AG, Class A* | | | 378 | | | | 18,966 | |
| | | | | | | | 114,802 | |
| THAILAND - 1.4% | | | | | | | | |
| Fabrinet* | | | 277 | | | | 65,379 | |
| | | | | | | | | |
| UNITED KINGDOM - 18.9% | | | | | | | | |
| Alphawave IP Group plc* | | | 16,968 | | | | 23,639 | |
| Balfour Beatty plc | | | 8,443 | | | | 48,628 | |
| Chemring Group plc | | | 8,060 | | | | 39,603 | |
| ConvaTec Group plc(1) | | | 42,702 | | | | 129,595 | |
| Direct Line Insurance Group plc | | | 18,431 | | | | 46,154 | |
| Howden Joinery Group plc | | | 3,788 | | | | 45,935 | |
| Intertek Group plc | | | 248 | | | | 17,084 | |
| ITM Power plc* | | | 4,194 | | | | 2,837 | |
| JD Sports Fashion plc | | | 16,943 | | | | 34,895 | |
| JET2 plc | | | 5,421 | | | | 101,469 | |
| LondonMetric Property plc, REIT | | | 4,790 | | | | 13,115 | |
| MONY Group plc | | | 2,315 | | | | 6,536 | |
| Pearson plc | | | 2,589 | | | | 35,075 | |
| Rotork plc | | | 16,985 | | | | 75,707 | |
| Smiths Group plc | | | 2,827 | | | | 63,376 | |
| Spirax Group plc | | | 197 | | | | 19,816 | |
| St. James’s Place plc | | | 5,482 | | | | 53,794 | |
| Subsea 7 SA | | | 2,126 | | | | 34,357 | |
| Taylor Wimpey plc | | | 12,377 | | | | 27,186 | |
| Trainline plc(1)* | | | 9,818 | | | | 43,237 | |
| Weir Group plc (The) | | | 861 | | | | 24,942 | |
| WH Smith plc | | | 586 | | | | 11,423 | |
| | | | | | | | 898,403 | |
| UNITED STATES - 17.6% | | | | | | | | |
| Agilysys, Inc.* | | | 525 | | | | 57,161 | |
| Agios Pharmaceuticals, Inc.* | | | 253 | | | | 11,231 | |
| Alcon, Inc. | | | 957 | | | | 95,312 | |
| Alkermes plc* | | | 1,256 | | | | 35,167 | |
| Alphatec Holdings, Inc.* | | | 792 | | | | 4,405 | |
| Avidity Biosciences, Inc.* | | | 859 | | | | 39,461 | |
| Calix, Inc.* | | | 739 | | | | 28,648 | |
| Celcuity, Inc.* | | | 270 | | | | 4,024 | |
| CyberArk Software Ltd.* | | | 243 | | | | 70,830 | |
| Denali Therapeutics, Inc.* | | | 486 | | | | 14,170 | |
| Disc Medicine, Inc.* | | | 69 | | | | 3,382 | |
| Edgewise Therapeutics, Inc.* | | | 649 | | | | 17,317 | |
| Five9, Inc.* | | | 484 | | | | 13,915 | |
| Glaukos Corp.* | | | 516 | | | | 67,229 | |
| Ingersoll Rand, Inc. | | | 373 | | | | 36,635 | |
| Inspire Medical Systems, Inc.* | | | 150 | | | | 31,589 | |
| Insulet Corp.* | | | 176 | | | | 41,069 | |
| Ionis Pharmaceuticals, Inc.* | | | 169 | | | | 6,774 | |
| Legend Biotech Corp., ADR* | | | 295 | | | | 14,365 | |
| Madrigal Pharmaceuticals, Inc.* | | | 199 | | | | 42,170 | |
| Myriad Genetics, Inc.* | | | 1,577 | | | | 43,198 | |
| Ocular Therapeutix, Inc.* | | | 683 | | | | 5,939 | |
| Penumbra, Inc.* | | | 87 | | | | 16,874 | |
| RxSight, Inc.* | | | 759 | | | | 37,517 | |
| STAAR Surgical Co.* | | | 294 | | | | 10,909 | |
| Tarsus Pharmaceuticals, Inc.* | | | 457 | | | | 15,037 | |
| UiPath, Inc., Class A* | | | 2,857 | | | | 36,574 | |
| ViewRay, Inc.* | | | 9,051 | | | | — | |
| WaVe Life Sciences Ltd.* | | | 1,270 | | | | 10,418 | |
| Wolfspeed, Inc.* | | | 2,411 | | | | 23,391 | |
| | | | | | | | 834,711 | |
| Total common stocks | | | | | | | | |
| (Cost $3,772,320) | | | | | | | 4,513,625 | |
| | | Shares
Held | | | Value | |
| SHORT-TERM INVESTMENT - 3.4% | | | | | | | | |
| | | | | | | | | |
| INVESTMENT COMPANY - 3.4% | | | | | | | | |
| BlackRock Liquidity Funds Treasury Trust Fund - Institutional Class, 4.85%(2) (Cost $163,613) | | | 163,613 | | | $ | 163,613 | |
| | | | | | | | | |
| Total investments - 98.5% | | | | | | | | |
| (Cost $3,935,933) | | | | | | | 4,677,238 | |
| | | | | | | | | |
| Other assets less liabilities - 1.5% | | | | | | | 70,243 | |
| | | | | | | | | |
| Total net assets - 100.0%# | | | | | | $ | 4,747,481 | |
| (1) | Regulation S is an exemption for securities offerings that are made outside of the United States and do not involve direct selling efforts in the United States. Resale restrictions may apply for purposes of the Securities Act of 1933. At September 30, 2024, the value of these securities was $186,796 or 3.9% of net assets. |
| (2) | Represents the current yield as of September 30, 2024. |
PORTFOLIO DIVERSIFICATION
Dollar values in thousands
| | | Value | | | Percentage of
Total Investments | |
| Communication Services | | $ | 6,536 | | | | 0.1 | % |
| Consumer Discretionary | | | 238,078 | | | | 5.2 | |
| Consumer Staples | | | 360,890 | | | | 7.7 | |
| Energy | | | 57,151 | | | | 1.2 | |
| Financials | | | 304,153 | | | | 6.5 | |
| Health Care | | | 1,099,818 | | | | 23.5 | |
| Industrials | | | 1,379,584 | | | | 29.6 | |
| Information Technology | | | 926,438 | | | | 19.8 | |
| Materials | | | 100,097 | | | | 2.1 | |
| Real Estate | | | 40,880 | | | | 0.9 | |
| Short-Term Investment | | | 163,613 | | | | 3.4 | |
| Total investments | | $ | 4,677,238 | | | | 100.0 | % |
Definitions of abbreviations and footnotes are detailed on page 2-3.
The accompanying notes are an integral part of the financial statements.
ARTISAN INTERNATIONAL VALUE FUND
Schedule of Investments — September 30, 2024
Shares and dollar values in thousands
| | | Shares
Held | | | Value | |
| COMMON STOCKS AND EQUITY-LINKED SECURITY - 86.7% | | | | | | | | |
| | | | | | | | | |
| BELGIUM - 1.2% | | | | | | | | |
| Groupe Bruxelles Lambert NV | | | 4,584 | | | $ | 356,915 | |
| Liberty Global Ltd., Class A* | | | 2,811 | | | | 59,341 | |
| | | | | | | | 416,256 | |
| BERMUDA - 0.4% | | | | | | | | |
| Voussoir RE Ltd. (Preferred Shares)(1)(2)(3)* | | | 1 | | | | 146,720 | |
| | | | | | | | | |
| BRAZIL - 1.2% | | | | | | | | |
| Pluxee NV* | | | 12,026 | | | | 253,519 | |
| Telefonica Brasil SA, ADR | | | 16,476 | | | | 169,213 | |
| | | | | | | | 422,732 | |
| CANADA - 3.5% | | | | | | | | |
| Alimentation Couche-Tard, Inc. | | | 10,602 | | | | 586,139 | |
| Suncor Energy, Inc. | | | 18,746 | | | | 691,942 | |
| | | | | | | | 1,278,081 | |
| CHINA - 3.6% | | | | | | | | |
| Alibaba Group Holding Ltd. | | | 75,557 | | | | 1,069,135 | |
| Anhui Conch Cement Co. Ltd., Class H | | | 47,565 | | | | 139,811 | |
| Hengan International Group Co. Ltd. | | | 30,000 | | | | 103,424 | |
| | | | | | | | 1,312,370 | |
| FINLAND - 1.6% | | | | | | | | |
| Nokia OYJ, ADR(4) | | | 80,868 | | | | 353,392 | |
| Nokia OYJ | | | 47,841 | | | | 208,968 | |
| | | | | | | | 562,360 | |
| FRANCE - 9.3% | | | | | | | | |
| Capgemini SE | | | 1,940 | | | | 418,765 | |
| Danone SA | | | 22,633 | | | | 1,646,196 | |
| Safran SA | | | 4,087 | | | | 960,306 | |
| Sodexo SA | | | 3,334 | | | | 273,354 | |
| Sodexo SA (Registered shares)(1)(3)* | | | 737 | | | | 60,444 | |
| | | | | | | | 3,359,065 | |
| GERMANY - 2.7% | | | | | | | | |
| Brenntag SE(5) | | | 9,844 | | | | 733,975 | |
| Fresenius Medical Care AG | | | 6,116 | | | | 259,991 | |
| | | | | | | | 993,966 | |
| INDIA - 3.5% | | | | | | | | |
| HCL Technologies Ltd. | | | 58,390 | | | | 1,251,470 | |
| | | | | | | | | |
| IRELAND - 1.9% | | | | | | | | |
| Ryanair Holdings plc | | | 1,846 | | | | 33,816 | |
| Ryanair Holdings plc, Equity-Linked Security(1)(6)(7)* | | | 36,160 | | | | 662,532 | |
| | | | | | | | 696,348 | |
| JAPAN - 1.7% | | | | | | | | |
| Nintendo Co. Ltd. | | | 4,450 | | | | 236,430 | |
| Seven & i Holdings Co. Ltd. | | | 26,505 | | | | 395,943 | |
| | | | | | | | 632,373 | |
| MEXICO - 0.5% | | | | | | | | |
| Gruma SAB de CV, Class B | | | 10,558 | | | | 195,641 | |
| | | | | | | | | |
| NETHERLANDS - 5.2% | | | | | | | | |
| Koninklijke Philips NV* | | | 45,331 | | | | 1,484,541 | |
| Universal Music Group NV | | | 15,074 | | | | 394,319 | |
| | | | | | | | 1,878,860 | |
| SOUTH KOREA - 5.4% | | | | | | | | |
| Naver Corp. | | | 2,211 | | | | 286,378 | |
| Samsung Electronics Co. Ltd. | | | 25,121 | | | | 1,181,430 | |
| Samsung Electronics Co. Ltd. (Preference) | | | 12,354 | | | | 480,852 | |
| | | | | | | | 1,948,660 | |
| | | Shares
Held | | | Value | |
| SWITZERLAND - 15.6% | | | | | | |
| ABB Ltd. | | | 26,682 | | | | 1,544,484 | |
| Barry Callebaut AG | | | 260 | | | | 480,483 | |
| Cie Financiere Richemont SA | | | 4,505 | | | | 712,143 | |
| DSM-Firmenich AG | | | 2,446 | | | | 336,660 | |
| Novartis AG | | | 12,195 | | | | 1,399,877 | |
| UBS Group AG | | | 38,100 | | | | 1,173,138 | |
| | | | | | | | 5,646,785 | |
| UNITED KINGDOM - 15.6% | | | | | | | | |
| Associated British Foods plc | | | 18,999 | | | | 592,599 | |
| Berkeley Group Holdings plc(5) | | | 5,739 | | | | 362,130 | |
| Compass Group plc | | | 26,939 | | | | 862,236 | |
| Lloyds Banking Group plc | | | 983,950 | | | | 773,509 | |
| Pearson plc | | | 30,381 | | | | 411,657 | |
| RELX plc | | | 20,718 | | | | 971,972 | |
| Unilever plc | | | 25,729 | | | | 1,664,557 | |
| | | | | | | | 5,638,660 | |
| UNITED STATES - 13.8% | | | | | | | | |
| Arch Capital Group Ltd.* | | | 16,615 | | | | 1,858,922 | |
| CNH Industrial NV | | | 24,620 | | | | 273,283 | |
| Garmin Ltd. | | | 4,964 | | | | 873,893 | |
| Holcim AG | | | 8,746 | | | | 853,174 | |
| Sensata Technologies Holding plc(5) | | | 9,305 | | | | 333,662 | |
| Willis Towers Watson plc | | | 2,698 | | | | 794,707 | |
| | | | | | | | 4,987,641 | |
| Total common stocks and equity-linked security | | | | | | | | |
| (Cost $20,690,942) | | | | | | | 31,367,988 | |
| | | | | | | | | |
| SHORT-TERM INVESTMENT - 12.2% | | | | | | | | |
| | | | | | | | | |
| INVESTMENT COMPANY - 12.2% | | | | | | | | |
| BlackRock Liquidity Funds Treasury Trust Fund - Institutional Class, 4.85%(8)(9) (Cost $4,434,581) | | | 4,434,581 | | | | 4,434,581 | |
| | | | | | | | | |
| MISCELLANEOUS SECURITIES - 0.4%(10) | | | | | | | | |
| Total Miscellaneous Securities | | | | | | | | |
| (Cost $167,687) | | | | | | | 160,143 | |
| | | | | | | | | |
| Total investments - 99.3% | | | | | | | | |
| (Cost $25,293,210) | | | | | | | 35,962,712 | |
| Other assets less liabilities - 0.7% | | | | | | | 254,228 | |
| Total net assets - 100.0%# | | | | | | $ | 36,216,940 | |
| (1) | Valued at a fair value in accordance with procedures established by the board of directors of Artisan Partners Funds. In total, securities valued at a fair value were $869,696, or 2.4% of total net assets. See notes 2(b) and 4 in Notes to Financial Statements for additional information. |
| (2) | Security is valued using significant unobservable inputs and is classified as Level 3 in the fair value hierarchy. |
| (3) | Security is restricted. |
| Security | | Acquisition Date | | Cost | | | Value | | | Percentage of
Total Net Assets | |
| Sodexo SA (Registered shares) | | 9/4/2020 | | $ | 46,862 | | | $ | 60,444 | | | | 0.2% | |
| Voussoir RE Ltd. (Preferred Shares) | | 1/13/2023 | | | 100,000 | | | | 146,720 | | | | 0.4% | |
| (4) | All or a portion of security is on loan at September 30, 2024. |
| (5) | Affiliated company as defined under the Investment Company Act of 1940. See note 10 in Notes to Financial Statements for additional information. |
| (6) | Security is restricted. Security was acquired in a transaction pursuant to Rule 144A under the Securities Act of 1933, as amended, on the date or during the period noted below. |
| Security | | Acquisition Date | | Cost | | | Value | | | Percentage of
Total Net Assets | |
| Ryanair Holdings plc, Equity-Linked Security | | 11/14/2013 - 7/22/2024 | | $ | 581,142 | | | $ | 662,532 | | | | 1.8% | |
| (7) | Security is an equity-linked security issued by HSBC Bank plc. As described in 2(h) in Notes to Financial Statements, equity-linked securities are subject to counterparty risk with respect to the bank or broker-dealer that issues them. |
| (8) | Security is partially used as collateral for securities lending. At September 30, 2024, the Fund had loaned securities with a total value of $71,450. This was collateralized by cash of $73,575 which was subsequently invested in an investment company. |
| (9) | Represents the current yield as of September 30, 2024. |
| (10) | Represents unrestricted previously undisclosed common stocks which the Fund has held for less than one year. |
PORTFOLIO DIVERSIFICATION
Dollar values in thousands
| | | Value | | | Percentage of
Total Investments | |
| Communication Services | | $ | 1,145,681 | | | | 3.2 | % |
| Consumer Discretionary | | | 4,624,992 | | | | 12.9 | |
| Consumer Staples | | | 5,664,982 | | | | 15.8 | |
| Energy | | | 691,942 | | | | 1.9 | |
| Financials | | | 5,103,911 | | | | 14.2 | |
| Health Care | | | 3,144,409 | | | | 8.7 | |
| Industrials | | | 5,767,549 | | | | 16.0 | |
| Information Technology | | | 3,894,877 | | | | 10.8 | |
| Materials | | | 1,329,645 | | | | 3.7 | |
| Miscellaneous Securities | | | 160,143 | | | | 0.5 | |
| Short-Term Investment | | | 4,434,581 | | | | 12.3 | |
| Total investments | | $ | 35,962,712 | | | | 100.0 | % |
Definitions of abbreviations and footnotes are detailed on page 2-3.
The accompanying notes are an integral part of the financial statements.
ARTISAN MID CAP FUND
Schedule of Investments — September 30, 2024
Shares and dollar values in thousands
| | | Shares
Held | | Value |
| COMMON STOCKS - 98.4% | | | | | | | | |
| | | | | | | | | |
| BANKS - 0.8% | | | | | | | | |
| NU Holdings Ltd., Class A(1)* | | | 2,442 | | | $ | 33,333 | |
| | | | | | | | | |
| BEVERAGES - 0.2% | | | | | | | | |
| Celsius Holdings, Inc.* | | | 297 | | | | 9,328 | |
| | | | | | | | | |
| BIOTECHNOLOGY - 13.2% | | | | | | | | |
| Argenx SE, ADR(1)* | | | 370 | | | | 200,758 | |
| Ascendis Pharma A/S, ADR(1)* | | | 1,032 | | | | 154,137 | |
| Exact Sciences Corp.* | | | 1,005 | | | | 68,470 | |
| Insmed, Inc.* | | | 745 | | | | 54,406 | |
| Ionis Pharmaceuticals, Inc.* | | | 496 | | | | 19,868 | |
| Twist Bioscience Corp.* | | | 1,130 | | | | 51,052 | |
| Veracyte, Inc.* | | | 528 | | | | 17,977 | |
| | | | | | | | 566,668 | |
| CAPITAL MARKETS - 2.9% | | | | | | | | |
| Ares Management Corp., Class A | | | 260 | | | | 40,500 | |
| Tradeweb Markets, Inc., Class A | | | 699 | | | | 86,412 | |
| | | | | | | | 126,912 | |
| COMMERCIAL SERVICES & SUPPLIES - 0.9% | | | | | | | | |
| Tetra Tech, Inc. | | | 831 | | | | 39,186 | |
| | | | | | | | | |
| COMMUNICATIONS EQUIPMENT - 1.7% | | | | | | | | |
| Arista Networks, Inc.* | | | 188 | | | | 72,162 | |
| | | | | | | | | |
| CONSTRUCTION & ENGINEERING - 2.0% | | | | | | | | |
| Quanta Services, Inc. | | | 281 | | | | 83,900 | |
| | | | | | | | | |
| ELECTRICAL EQUIPMENT - 2.2% | | | | | | | | |
| Hubbell, Inc., Class B | | | 170 | | | | 72,827 | |
| Vertiv Holdings Co., Class A | | | 235 | | | | 23,363 | |
| | | | | | | | 96,190 | |
| ELECTRONIC EQUIPMENT, INSTRUMENTS & COMPONENTS - 0.5% | | | | | | | | |
| Coherent Corp.* | | | 238 | | | | 21,163 | |
| | | | | | | | | |
| ENTERTAINMENT - 7.8% | | | | | | | | |
| Liberty Media Corp-Liberty Formula One, Class C* | | | 1,034 | | | | 80,040 | |
| Live Nation Entertainment, Inc.* | | | 714 | | | | 78,202 | |
| Spotify Technology SA* | | | 417 | | | | 153,749 | |
| Take-Two Interactive Software, Inc.* | | | 148 | | | | 22,769 | |
| | | | | | | | 334,760 | |
| GROUND TRANSPORTATION - 2.0% | | | | | | | | |
| Saia, Inc.* | | | 195 | | | | 85,454 | |
| | | | | | | | | |
| HEALTH CARE EQUIPMENT & SUPPLIES - 2.7% | | | | | | | | |
| Dexcom, Inc.* | | | 559 | | | | 37,486 | |
| Insulet Corp.* | | | 118 | | | | 27,466 | |
| iRhythm Technologies, Inc.* | | | 667 | | | | 49,527 | |
| | | | | | | | 114,479 | |
| HEALTH CARE TECHNOLOGY - 1.5% | | | | | | | | |
| Veeva Systems, Inc., Class A* | | | 317 | | | | 66,512 | |
| | | | | | | | | |
| HOTELS, RESTAURANTS & LEISURE - 4.7% | | | | | | | | |
| Chipotle Mexican Grill, Inc., Class A* | | | 1,342 | | | | 77,300 | |
| Domino’s Pizza, Inc. | | | 91 | | | | 39,086 | |
| DoorDash, Inc., Class A* | | | 433 | | | | 61,774 | |
| Wingstop, Inc. | | | 62 | | | | 25,708 | |
| | | | | | | | 203,868 | |
| | | Shares
Held | | Value |
| HOUSEHOLD DURABLES - 1.8% | | | | | | | | |
| NVR, Inc.* | | | 8 | | | $ | 77,101 | |
| | | | | | | | | |
| INSURANCE - 1.2% | | | | | | | | |
| Arthur J Gallagher & Co. | | | 180 | | | | 50,658 | |
| | | | | | | | | |
| IT SERVICES - 3.1% | | | | | | | | |
| GoDaddy, Inc., Class A* | | | 220 | | | | 34,464 | |
| MongoDB, Inc., Class A* | | | 92 | | | | 24,901 | |
| Shopify, Inc., Class A(1)* | | | 907 | | | | 72,660 | |
| | | | | | | | 132,025 | |
| LIFE SCIENCES TOOLS & SERVICES - 5.6% | | | | | | | | |
| Gerresheimer AG(1) | | | 617 | | | | 54,974 | |
| Illumina, Inc.* | | | 332 | | | | 43,239 | |
| West Pharmaceutical Services, Inc. | | | 478 | | | | 143,407 | |
| | | | | | | | 241,620 | |
| MACHINERY - 7.1% | | | | | | | | |
| Fortive Corp. | | | 1,063 | | | | 83,897 | |
| Ingersoll Rand, Inc. | | | 972 | | | | 95,434 | |
| Westinghouse Air Brake Technologies Corp. | | | 302 | | | | 54,887 | |
| Xylem, Inc. | | | 543 | | | | 73,379 | |
| | | | | | | | 307,597 | |
| PROFESSIONAL SERVICES - 2.9% | | | | | | | | |
| Equifax, Inc. | | | 219 | | | | 64,241 | |
| Parsons Corp.* | | | 151 | | | | 15,650 | |
| Verisk Analytics, Inc., Class A | | | 173 | | | | 46,426 | |
| | | | | | | | 126,317 | |
| REAL ESTATE MANAGEMENT & DEVELOPMENT - 2.3% | | | | |
| CBRE Group, Inc., Class A* | | | 351 | | | | 43,665 | |
| CoStar Group, Inc.* | | | 746 | | | | 56,265 | |
| | | | | | | | 99,930 | |
| SEMICONDUCTORS & SEMICONDUCTOR EQUIPMENT - 9.4% | | | | | | | | |
| Lattice Semiconductor Corp.* | | | 2,030 | | | | 107,720 | |
| MACOM Technology Solutions Holdings, Inc.* | | | 551 | | | | 61,334 | |
| Marvell Technology, Inc. | | | 700 | | | | 50,467 | |
| Monolithic Power Systems, Inc. | | | 80 | | | | 74,033 | |
| ON Semiconductor Corp.* | | | 835 | | | | 60,638 | |
| Onto Innovation, Inc.* | | | 244 | | | | 50,642 | |
| | | | | | | | 404,834 | |
| SOFTWARE - 18.0% | | | | | | | | |
| Atlassian Corp., Class A* | | | 523 | | | | 83,083 | |
| Bentley Systems, Inc., Class B | | | 1,151 | | | | 58,505 | |
| CCC Intelligent Solutions Holdings, Inc.* | | | 5,044 | | | | 55,731 | |
| Datadog, Inc., Class A* | | | 754 | | | | 86,796 | |
| Gitlab, Inc., Class A* | | | 571 | | | | 29,445 | |
| HubSpot, Inc.* | | | 132 | | | | 70,104 | |
| Monday.com Ltd.* | | | 195 | | | | 54,110 | |
| Samsara, Inc., Class A* | | | 887 | | | | 42,697 | |
| Synopsys, Inc.* | | | 184 | | | | 93,401 | |
| Tyler Technologies, Inc.* | | | 279 | | | | 162,752 | |
| Zscaler, Inc.* | | | 225 | | | | 38,541 | |
| | | | | | | | 775,165 | |
| SPECIALTY RETAIL - 2.0% | | | | | | | | |
| AutoZone, Inc.* | | | 15 | | | | 48,700 | |
| Best Buy Co., Inc. | | | 137 | | | | 14,185 | |
| Dick’s Sporting Goods, Inc. | | | 118 | | | | 24,700 | |
| | | | | | | | 87,585 | |
| | | Shares
Held | | Value |
| SPECIALTY RETAIL (continued) | | | | | | | | |
| | | | | | | | | |
| TEXTILES, APPAREL & LUXURY GOODS - 1.1% | | | | | | | | |
| Deckers Outdoor Corp.* | | | 290 | | | $ | 46,225 | |
| | | | | | | | | |
| TRADING COMPANIES & DISTRIBUTORS - 0.8% | | | | | | | | |
| Ferguson Enterprises, Inc. | | | 166 | | | | 33,003 | |
| | | | | | | | | |
| Total common stocks | | | | | | | | |
| (Cost $2,691,528) | | | | | | | 4,235,975 | |
| | | | | | | | | |
| SHORT-TERM INVESTMENT - 1.3% | | | | | | | | |
| | | | | | | | | |
| INVESTMENT COMPANY - 1.3% | | | | | | | | |
| BlackRock Liquidity Funds Treasury Trust Fund - Institutional Class, 4.85%(2) (Cost $55,168) | | | 55,168 | | | | 55,168 | |
| | | | | | | | | |
| Total investments - 99.7% | | | | | | | | |
| (Cost $2,746,696) | | | | | | | 4,291,143 | |
| | | | | | | | | |
| Other assets less liabilities - 0.3% | | | | | | | 13,653 | |
| Total net assets - 100.0%# | | | | | | $ | 4,304,796 | |
| (1) | The Fund considers the company to be from outside the United States. |
| Security | | Country | | Trading
Currency |
| Argenx SE | | Netherlands | | USD |
| Ascendis Pharma A/S | | Denmark | | USD |
| Gerresheimer AG | | Germany | | EUR |
| NU Holdings Ltd. | | Brazil | | USD |
| Shopify, Inc. | | Canada | | USD |
| (2) | Represents the current yield as of September 30, 2024. |
PORTFOLIO DIVERSIFICATION
Dollar values in thousands
| | | Value | | Percentage of
Total Investments |
| Communication Services | | $ | 334,760 | | | | 7.8 | % |
| Consumer Discretionary | | | 414,779 | | | | 9.7 | |
| Consumer Staples | | | 9,328 | | | | 0.2 | |
| Financials | | | 210,903 | | | | 4.9 | |
| Health Care | | | 989,279 | | | | 23.1 | |
| Industrials | | | 771,649 | | | | 18.0 | |
| Information Technology | | | 1,405,348 | | | | 32.7 | |
| Real Estate | | | 99,929 | | | | 2.3 | |
| Short-Term Investment | | | 55,168 | | | | 1.3 | |
| Total investments | | $ | 4,291,143 | | | | 100.0 | % |
Definitions of abbreviations and footnotes are detailed on page 2-3.
The accompanying notes are an integral part of the financial statements.
ARTISAN MID CAP VALUE FUND
Schedule of Investments — September 30, 2024
Shares and dollar values in thousands
| | | Shares
Held | | Value |
| COMMON STOCKS - 96.4% | | | | | | | | |
| | | | | | | | | |
| AEROSPACE & DEFENSE - 0.4% | | | | | | | | |
| CAE, Inc.(1)* | | | 238 | | | $ | 4,462 | |
| | | | | | | | | |
| AIR FREIGHT & LOGISTICS - 2.0% | | | | | | | | |
| Expeditors International of Washington, Inc. | | | 181 | | | | 23,830 | |
| | | | | | | | | |
| AUTOMOBILE COMPONENTS - 2.5% | | | | | | | | |
| BorgWarner, Inc. | | | 343 | | | | 12,455 | |
| Gentex Corp. | | | 585 | | | | 17,354 | |
| | | | | | | | 29,809 | |
| BANKS - 9.1% | | | | | | | | |
| Fifth Third Bancorp | | | 546 | | | | 23,406 | |
| First Citizens BancShares, Inc., Class A | | | 25 | | | | 46,594 | |
| M&T Bank Corp. | | | 123 | | | | 21,931 | |
| WaFd, Inc. | | | 445 | | | | 15,496 | |
| | | | | | | | 107,427 | |
| CAPITAL MARKETS - 1.2% | | | | | | | | |
| Moelis & Co., Class A | | | 205 | | | | 14,040 | |
| | | | | | | | | |
| CONSUMER STAPLES DISTRIBUTION & RETAIL - 4.8% | | | | | | | | |
| Dollar General Corp. | | | 141 | | | | 11,925 | |
| Kroger Co. (The) | | | 447 | | | | 25,637 | |
| Sysco Corp. | | | 240 | | | | 18,734 | |
| | | | | | | | 56,296 | |
| DISTRIBUTORS - 1.7% | | | | | | | | |
| LKQ Corp. | | | 492 | | | | 19,634 | |
| | | | | | | | | |
| ELECTRIC UTILITIES - 4.5% | | | | | | | | |
| Alliant Energy Corp. | | | 413 | | | | 25,065 | |
| OGE Energy Corp. | | | 691 | | | | 28,329 | |
| | | | | | | | 53,394 | |
| ELECTRICAL EQUIPMENT - 1.5% | | | | | | | | |
| nVent Electric plc | | | 257 | | | | 18,083 | |
| | | | | | | | | |
| ELECTRONIC EQUIPMENT, INSTRUMENTS & COMPONENTS - 2.6% | | | | | | | | |
| Vontier Corp. | | | 914 | | | | 30,825 | |
| | | | | | | | | |
| ENERGY EQUIPMENT & SERVICES - 2.0% | | | | | | | | |
| NOV, Inc. | | | 1,440 | | | | 22,992 | |
| | | | | | | | | |
| ENTERTAINMENT - 3.5% | | | | | | | | |
| Electronic Arts, Inc. | | | 147 | | | | 21,098 | |
| Warner Music Group Corp., Class A | | | 633 | | | | 19,806 | |
| | | | | | | | 40,904 | |
| FINANCIAL SERVICES - 2.1% | | | | | | | | |
| Corebridge Financial, Inc. | | | 831 | | | | 24,239 | |
| | | | | | | | | |
| FOOD PRODUCTS - 2.1% | | | | | | | | |
| Tyson Foods, Inc., Class A | | | 410 | | | | 24,422 | |
| | | | | | | | | |
| GROUND TRANSPORTATION - 3.4% | | | | | | | | |
| U-Haul Holding Co. | | | 549 | | | | 39,500 | |
| | | | | | | | | |
| HEALTH CARE EQUIPMENT & SUPPLIES - 4.2% | | | | | | | | |
| Baxter International, Inc. | | | 742 | | | | 28,170 | |
| Dentsply Sirona, Inc. | | | 784 | | | | 21,226 | |
| | | | | | | | 49,396 | |
| HEALTH CARE PROVIDERS & SERVICES - 2.3% | | | | | | | | |
| Centene Corp.* | | | 353 | | | | 26,601 | |
| | | Shares
Held | | Value |
| HOTELS, RESTAURANTS & LEISURE - 8.5% | | | | | | | | |
| Expedia Group, Inc.* | | | 244 | | | $ | 36,080 | |
| Marriott International, Inc., Class A | | | 82 | | | | 20,497 | |
| MGM Resorts International* | | | 478 | | | | 18,701 | |
| Vail Resorts, Inc. | | | 143 | | | | 24,922 | |
| | | | | | | | 100,200 | |
| INDUSTRIAL REITS - 0.2% | | | | | | | | |
| Lineage, Inc. | | | 36 | | | | 2,819 | |
| | | | | | | | | |
| INSURANCE - 5.8% | | | | | | | | |
| Arch Capital Group Ltd.* | | | 283 | | | | 31,696 | |
| Globe Life, Inc. | | | 282 | | | | 29,816 | |
| Progressive Corp. (The) | | | 26 | | | | 6,624 | |
| | | | | | | | 68,136 | |
| INTERACTIVE MEDIA & SERVICES - 1.7% | | | | | | | | |
| IAC, Inc.* | | | 373 | | | | 20,081 | |
| | | | | | | | | |
| LEISURE PRODUCTS - 1.1% | | | | | | | | |
| Polaris, Inc. | | | 157 | | | | 13,099 | |
| | | | | | | | | |
| LIFE SCIENCES TOOLS & SERVICES - 4.2% | | | | | | | | |
| Bio-Rad Laboratories, Inc., Class A* | | | 61 | | | | 20,447 | |
| Waters Corp.* | | | 81 | | | | 28,983 | |
| | | | | | | | 49,430 | |
| MACHINERY - 2.0% | | | | | | | | |
| Otis Worldwide Corp. | | | 224 | | | | 23,330 | |
| | | | | | | | | |
| MEDIA - 5.7% | | | | | | | | |
| Cable One, Inc. | | | 60 | | | | 20,829 | |
| News Corp., Class A | | | 838 | | | | 22,316 | |
| Omnicom Group, Inc. | | | 229 | | | | 23,676 | |
| | | | | | | | 66,821 | |
| PROFESSIONAL SERVICES - 2.4% | | | | | | | | |
| Genpact Ltd. | | | 704 | | | | 27,610 | |
| | | | | | | | | |
| RETAIL REITS - 2.1% | | | | | | | | |
| NNN REIT, Inc. | | | 516 | | | | 25,027 | |
| | | | | | | | | |
| SEMICONDUCTORS & SEMICONDUCTOR EQUIPMENT - 3.5% | | | | | | | | |
| Analog Devices, Inc. | | | 179 | | | | 41,134 | |
| | | | | | | | | |
| SOFTWARE - 2.4% | | | | | | | | |
| Check Point Software Technologies Ltd.(1)* | | | 125 | | | | 24,096 | |
| Dolby Laboratories, Inc., Class A | | | 55 | | | | 4,205 | |
| | | | | | | | 28,301 | |
| SPECIALIZED REITS - 5.1% | | | | | | | | |
| Lamar Advertising Co., Class A | | | 278 | | | | 37,194 | |
| Public Storage | | | 61 | | | | 22,291 | |
| | | | | | | | 59,485 | |
| SPECIALTY RETAIL - 1.8% | | | | | | | | |
| AutoNation, Inc.* | | | 116 | | | | 20,713 | |
| Vitamin Oldco Holdings, Inc. (escrow shares)(2)(3)* | | | 220 | | | | — | |
| | | | | | | | 20,713 | |
| Total common stocks | | | | | | | | |
| (Cost $698,856) | | | | | | | 1,132,040 | |
| | | Shares
Held | | Value |
| SHORT-TERM INVESTMENT - 2.7% | | | | | | | | |
| | | | | | | | | |
| INVESTMENT COMPANY - 2.7% | | | | | | | | |
| BlackRock Liquidity Funds Treasury Trust Fund - Institutional Class, 4.85%(4) (Cost $31,368) | | | 31,368 | | | $ | 31,368 | |
| | | | | | | | | |
| Total investments - 99.1% | | | | | | | | |
| (Cost $730,224) | | | | | | | 1,163,408 | |
| | | | | | | | | |
| Other assets less liabilities - 0.9% | | | | | | | 11,091 | |
| Total net assets - 100.0%# | | | | | | $ | 1,174,499 | |
| (1) | The Fund considers the company to be from outside the United States. |
| Security | | Country | | Trading Currency |
| CAE, Inc. | | Canada | | USD |
| Check Point Software Technologies Ltd. | | Israel | | USD |
| (2) | Valued at a fair value in accordance with procedures established by the board of directors of Artisan Partners Funds. In total, securities valued at a fair value were $0, or 0.0% of total net assets. See notes 2(b) and 4 in Notes to Financial Statements for additional information. |
| (3) | Security is valued using significant unobservable inputs and is classified as Level 3 in the fair value hierarchy. |
| (4) | Represents the current yield as of September 30, 2024. |
PORTFOLIO DIVERSIFICATION
Dollar values in thousands
| | | Value | | Percentage of
Total Investments |
| Communication Services | | $ | 127,806 | | | | 11.0 | % |
| Consumer Discretionary | | | 183,455 | | | | 15.7 | |
| Consumer Staples | | | 80,718 | | | | 6.9 | |
| Energy | | | 22,992 | | | | 2.0 | |
| Financials | | | 213,842 | | | | 18.4 | |
| Health Care | | | 125,428 | | | | 10.8 | |
| Industrials | | | 136,815 | | | | 11.8 | |
| Information Technology | | | 100,259 | | | | 8.6 | |
| Real Estate | | | 87,331 | | | | 7.5 | |
| Utilities | | | 53,394 | | | | 4.6 | |
| Short-Term Investment | | | 31,368 | | | | 2.7 | |
| Total investments | | $ | 1,163,408 | | | | 100.0 | % |
Definitions of abbreviations and footnotes are detailed on page 2-3.
The accompanying notes are an integral part of the financial statements.
ARTISAN SELECT EQUITY FUND
Schedule of Investments — September 30, 2024
Shares and dollar values in thousands
| | | Shares
Held | | Value | |
| COMMON STOCKS - 91.6% |
| |
| AUTOMOBILES - 2.2% |
| Harley-Davidson, Inc. | | | 30 | | | $ | 1,140 | |
| | | | | | | | | |
| BANKS - 3.5% |
| Citigroup, Inc. | | | 29 | | | | 1,838 | |
| | | | | | | | | |
| BROADLINE RETAIL - 4.2% |
| Alibaba Group Holding Ltd., ADR(1) | | | 21 | | | | 2,199 | |
| | | | | | | | | |
| CAPITAL MARKETS - 9.9% |
| Bank of New York Mellon Corp. (The) | | | 35 | | | | 2,524 | |
| Charles Schwab Corp. (The) | | | 41 | | | | 2,629 | |
| | | | | | | | 5,153 | |
| CHEMICALS - 4.4% |
| Axalta Coating Systems Ltd.* | | | 63 | | | | 2,281 | |
| | | | | | | | | |
| CONSTRUCTION MATERIALS - 5.2% |
| Heidelberg Materials AG(1) | | | 25 | | | | 2,720 | |
| | | | | | | | | |
| CONSUMER FINANCE - 5.3% |
| American Express Co. | | | 10 | | | | 2,771 | |
| | | | | | | | | |
| FINANCIAL SERVICES - 5.5% |
| Berkshire Hathaway, Inc., Class B* | | | 6 | | | | 2,857 | |
| | | | | | | | | |
| FOOD PRODUCTS - 4.9% |
| Danone SA(1) | | | 35 | | | | 2,549 | |
| | | | | | | | | |
| HEALTH CARE PROVIDERS & SERVICES - 10.2% |
| Elevance Health, Inc. | | | 5 | | | | 2,730 | |
| Henry Schein, Inc.* | | | 36 | | | | 2,593 | |
| | | | | | | | 5,323 | |
| HOTELS, RESTAURANTS & LEISURE - 5.4% |
| Aramark | | | 73 | | | | 2,816 | |
| | | | | | | | | |
| INSURANCE - 10.3% |
| Aon plc, Class A | | | 3 | | | | 912 | |
| Marsh & McLennan Cos., Inc. | | | 8 | | | | 1,763 | |
| Progressive Corp. (The) | | | 11 | | | | 2,696 | |
| | | | | | | | 5,371 | |
| INTERACTIVE MEDIA & SERVICES - 10.1% |
| Alphabet, Inc., Class A | | | 15 | | | | 2,532 | |
| Meta Platforms, Inc., Class A | | | 5 | | | | 2,731 | |
| | | | | | | | 5,263 | |
| MACHINERY - 2.3% |
| Snap-on, Inc. | | | 4 | | | | 1,205 | |
| | | | | | | | | |
| PASSENGER AIRLINES - 1.7% |
| Southwest Airlines Co. | | | 31 | | | | 910 | |
| | | | | | | | | |
| SEMICONDUCTORS & SEMICONDUCTOR EQUIPMENT - 2.4% |
| Lam Research Corp. | | | 2 | | | | 1,249 | |
| | | | | | | | | |
| TECHNOLOGY HARDWARE, STORAGE & PERIPHERALS - 4.1% |
| Samsung Electronics Co. Ltd.(1) | | | 45 | | | | 2,130 | |
| | | | | | | | | |
Total common stocks
(Cost $33,429) | | | | | | | 47,775 | |
| | | Shares
Held | | Value | |
| SHORT-TERM INVESTMENT - 8.1% |
| |
| INVESTMENT COMPANY - 8.1% |
| BlackRock Liquidity Funds Treasury Trust Fund - Institutional Class, 4.85%(2) (Cost $4,205) | | | 4,205 | | | $ | 4,205 | |
| | | | | | | | | |
Total investments - 99.7%
(Cost $37,634) | | | | | | | 51,980 | |
| | | | | | | | | |
| Other assets less liabilities - 0.3% | | | | | | | 133 | |
| | | | | | | | | |
| Total net assets - 100.0%# | | | | | | $ | 52,113 | |
| | (1) | The Fund considers the company to be from outside the United States. |
| Security | | Country | | Trading
Currency |
| Alibaba Group Holding Ltd. | | China | | USD |
| Danone SA | | France | | EUR |
| Heidelberg Materials AG | | Germany | | EUR |
| Samsung Electronics Co. Ltd. | | South Korea | | KRW |
| | (2) | Represents the current yield as of September 30, 2024. |
PORTFOLIO DIVERSIFICATION
Dollar values in thousands
| | | Value | | | Percentage of
Total Investments | |
| Communication Services | | $ | 5,263 | | | | 10.1 | % |
| Consumer Discretionary | | | 6,156 | | | | 11.8 | |
| Consumer Staples | | | 2,549 | | | | 4.9 | |
| Financials | | | 17,988 | | | | 34.7 | |
| Health Care | | | 5,323 | | | | 10.2 | |
| Industrials | | | 2,115 | | | | 4.1 | |
| Information Technology | | | 3,379 | | | | 6.5 | |
| Materials | | | 5,002 | | | | 9.6 | |
| Short-Term Investment | | | 4,205 | | | | 8.1 | |
| Total investments | | $ | 51,980 | | | | 100.0 | % |
Definitions of abbreviations and footnotes are detailed on page 2-3.
The accompanying notes are an integral part of the financial statements.
ARTISAN SMALL CAP FUND
Schedule of Investments — September 30, 2024
Shares and dollar values in thousands
| | | Shares
Held | | Value | |
| COMMON STOCKS - 97.1% |
| |
| AEROSPACE & DEFENSE - 0.7% |
| Loar Holdings, Inc.* | | | 131 | | | $ | 9,775 | |
| | | | | | | | | |
| AUTOMOBILE COMPONENTS - 2.0% |
| Modine Manufacturing Co.* | | | 205 | | | | 27,227 | |
| | | | | | | | | |
| BEVERAGES - 1.2% |
| Vita Coco Co., Inc. (The)* | | | 571 | | | | 16,171 | |
| | | | | | | | | |
| BIOTECHNOLOGY - 24.4% |
| Argenx SE, ADR(1)* | | | 94 | | | | 51,203 | |
| Ascendis Pharma A/S, ADR(1)* | | | 423 | | | | 63,173 | |
| Denali Therapeutics, Inc.* | | | 148 | | | | 4,306 | |
| Exact Sciences Corp.* | | | 351 | | | | 23,909 | |
| Halozyme Therapeutics, Inc.* | | | 1,307 | | | | 74,803 | |
| Insmed, Inc.* | | | 197 | | | | 14,387 | |
| Ionis Pharmaceuticals, Inc.* | | | 225 | | | | 9,010 | |
| Iovance Biotherapeutics, Inc.* | | | 2,034 | | | | 19,095 | |
| Twist Bioscience Corp.* | | | 836 | | | | 37,755 | |
| Veracyte, Inc.* | | | 1,226 | | | | 41,731 | |
| | | | | | | | 339,372 | |
| BUILDING PRODUCTS - 1.5% |
| Trex Co., Inc.* | | | 315 | | | | 20,970 | |
| | | | | | | | | |
| CAPITAL MARKETS - 3.4% |
| Hamilton Lane, Inc., Class A | | | 109 | | | | 18,357 | |
| MarketAxess Holdings, Inc. | | | 111 | | | | 28,523 | |
| | | | | | | | 46,880 | |
| CONSTRUCTION & ENGINEERING - 0.9% |
| MYR Group, Inc.* | | | 116 | | | | 11,837 | |
| | | | | | | | | |
| DIVERSIFIED CONSUMER SERVICES - 0.7% |
| Duolingo, Inc., Class A* | | | 37 | | | | 10,331 | |
| | | | | | | | | |
| ELECTRONIC EQUIPMENT, INSTRUMENTS & COMPONENTS - 4.7% |
| Flex Ltd.* | | | 782 | | | | 26,137 | |
| Novanta, Inc.* | | | 220 | | | | 39,362 | |
| | | | | | | | 65,499 | |
| GROUND TRANSPORTATION - 1.9% |
| Saia, Inc.* | | | 59 | | | | 25,882 | |
| | | | | | | | | |
| HEALTH CARE EQUIPMENT & SUPPLIES - 6.0% |
| Inspire Medical Systems, Inc.* | | | 135 | | | | 28,477 | |
| iRhythm Technologies, Inc.* | | | 209 | | | | 15,550 | |
| Lantheus Holdings, Inc.* | | | 107 | | | | 11,700 | |
| Penumbra, Inc.* | | | 67 | | | | 13,070 | |
| PROCEPT BioRobotics Corp.* | | | 192 | | | | 15,406 | |
| | | | | | | | 84,203 | |
| HOTELS, RESTAURANTS & LEISURE - 0.6% |
| Dutch Bros, Inc., Class A* | | | 270 | | | | 8,663 | |
| | | | | | | | | |
| HOUSEHOLD DURABLES - 5.7% |
| Installed Building Products, Inc. | | | 74 | | | | 18,274 | |
| SharkNinja, Inc. | | | 444 | | | | 48,233 | |
| Smith Douglas Homes Corp.* | | | 337 | | | | 12,747 | |
| | | | | | | | 79,254 | |
| LIFE SCIENCES TOOLS & SERVICES - 3.4% |
| Repligen Corp.* | | | 185 | | | | 27,578 | |
| | | Shares
Held | | Value | |
| LIFE SCIENCES TOOLS & SERVICES (continued) |
| Stevanato Group SpA(1) | | | 1,019 | | | $ | 20,379 | |
| | | | | | | | 47,957 | |
| MACHINERY - 4.1% |
| John Bean Technologies Corp. | | | 52 | | | | 5,131 | |
| SPX Technologies, Inc.* | | | 327 | | | | 52,095 | |
| | | | | | | | 57,226 | |
| PERSONAL CARE PRODUCTS - 0.5% |
| Inter Parfums, Inc. | | | 57 | | | | 7,408 | |
| | | | | | | | | |
| PROFESSIONAL SERVICES - 2.3% |
| Dayforce, Inc.* | | | 439 | | | | 26,886 | |
| Parsons Corp.* | | | 48 | | | | 5,024 | |
| | | | | | | | 31,910 | |
| REAL ESTATE MANAGEMENT & DEVELOPMENT - 1.0% |
| Colliers International Group, Inc.(1) | | | 92 | | | | 13,935 | |
| | | | | | | | | |
| SEMICONDUCTORS & SEMICONDUCTOR EQUIPMENT - 10.2% |
| Allegro MicroSystems, Inc.(1)* | | | 639 | | | | 14,895 | |
| Astera Labs, Inc.* | | | 185 | | | | 9,678 | |
| Lattice Semiconductor Corp.* | | | 1,036 | | | | 54,984 | |
| MACOM Technology Solutions Holdings, Inc.* | | | 368 | | | | 40,964 | |
| Onto Innovation, Inc.* | | | 105 | | | | 21,698 | |
| | | | | | | | 142,219 | |
| SOFTWARE - 17.6% |
| CCC Intelligent Solutions Holdings, Inc.* | | | 2,765 | | | | 30,552 | |
| Clearwater Analytics Holdings, Inc., Class A* | | | 1,330 | | | | 33,585 | |
| Confluent, Inc., Class A* | | | 472 | | | | 9,618 | |
| Elastic NV* | | | 146 | | | | 11,190 | |
| Gitlab, Inc., Class A* | | | 303 | | | | 15,614 | |
| Guidewire Software, Inc.* | | | 406 | | | | 74,252 | |
| Intapp, Inc.* | | | 290 | | | | 13,868 | |
| Procore Technologies, Inc.* | | | 338 | | | | 20,872 | |
| Tyler Technologies, Inc.* | | | 26 | | | | 15,221 | |
| Workiva, Inc., Class A* | | | 265 | | | | 20,945 | |
| | | | | | | | 245,717 | |
| TEXTILES, APPAREL & LUXURY GOODS - 2.3% |
| Crocs, Inc.* | | | 170 | | | | 24,620 | |
| On Holding AG, Class A(1)* | | | 141 | | | | 7,047 | |
| | | | | | | | 31,667 | |
| TRADING COMPANIES & DISTRIBUTORS - 2.0% |
| Applied Industrial Technologies, Inc. | | | 79 | | | | 17,720 | |
| SiteOne Landscape Supply, Inc.* | | | 68 | | | | 10,216 | |
| | | | | | | | 27,936 | |
Total common stocks
(Cost $898,401) | | | | | | | 1,352,039 | |
| | | | | | | | | |
| SHORT-TERM INVESTMENT - 2.2% |
| |
| INVESTMENT COMPANY - 2.2% |
| BlackRock Liquidity Funds Treasury Trust Fund - Institutional Class, 4.85%(2) (Cost $30,595) | | | 30,595 | | | | 30,595 | |
| | | | | | | | | |
Total investments - 99.3%
(Cost $928,996) | | | | | | | 1,382,634 | |
46 | Artisan Partners Funds
| | | Shares
Held | | Value | |
| Other assets less liabilities - 0.7% | | | | | | | 10,125 | |
| Total net assets - 100.0%# | | | | | | $ | 1,392,759 | |
| | (1) | The Fund considers the company to be from outside the United States. |
| Security | | Country | | Trading
Currency |
| Allegro MicroSystems, Inc. | | Japan | | USD |
| Argenx SE | | Netherlands | | USD |
| Ascendis Pharma A/S | | Denmark | | USD |
| Colliers International Group, Inc. | | Canada | | USD |
| On Holding AG | | Switzerland | | USD |
| Stevanato Group SpA | | Italy | | USD |
| | (2) | Represents the current yield as of September 30, 2024. |
PORTFOLIO DIVERSIFICATION
Dollar values in thousands
| | | Value | | | Percentage of Total Investments | |
| Consumer Discretionary | | $ | 157,141 | | | | 11.4 | % |
| Consumer Staples | | | 23,579 | | | | 1.7 | |
| Financials | | | 46,880 | | | | 3.4 | |
| Health Care | | | 471,534 | | | | 34.1 | |
| Industrials | | | 185,535 | | | | 13.4 | |
| Information Technology | | | 453,435 | | | | 32.8 | |
| Real Estate | | | 13,935 | | | | 1.0 | |
| Short-Term Investment | | | 30,595 | | | | 2.2 | |
| Total investments | | $ | 1,382,634 | | | | 100.0 | % |
Definitions of abbreviations and footnotes are detailed on page 2-3.
The accompanying notes are an integral part of the financial statements.
ARTISAN SUSTAINABLE EMERGING MARKETS FUND
Schedule of Investments — September 30, 2024
Shares and dollar values in thousands
| | | Shares
Held | | Value | |
| COMMON STOCKS - 99.4% |
| |
| BRAZIL - 9.7% |
| GPS Participacoes e Empreendimentos SA(1) | | | 748 | | | $ | 2,561 | |
| Itau Unibanco Holding SA (Preference) | | | 482 | | | | 3,211 | |
| Lojas Renner SA | | | 353 | | | | 1,167 | |
| MercadoLibre, Inc.* | | | 3 | | | | 6,328 | |
| Vale SA | | | 196 | | | | 2,293 | |
| VTEX, Class A* | | | 116 | | | | 867 | |
| | | | | | | | 16,427 | |
| CHINA - 17.9% |
| Alibaba Group Holding Ltd. | | | 494 | | | | 6,994 | |
| Baidu, Inc., Class A* | | | 122 | | | | 1,655 | |
| China Traditional Chinese Medicine Holdings Co. Ltd.* | | | 4,581 | | | | 2,581 | |
| Estun Automation Co. Ltd., Class A | | | 1,501 | | | | 3,313 | |
| Kingsoft Cloud Holdings Ltd., ADR* | | | 100 | | | | 294 | |
| NIO, Inc., ADR(2)* | | | 95 | | | | 636 | |
| Prosus NV | | | 107 | | | | 4,690 | |
| Trip.com Group Ltd.* | | | 54 | | | | 3,420 | |
| Wuxi Biologics Cayman, Inc.(3)* | | | 1,047 | | | | 2,356 | |
| Zhuzhou CRRC Times Electric Co. Ltd., Class H | | | 1,106 | | | | 4,369 | |
| | | | | | | | 30,308 | |
| EGYPT - 0.7% |
| Commercial International Bank - Egypt (CIB), GDR(3) | | | 720 | | | | 1,223 | |
| | | | | | | | | |
| GEORGIA - 0.4% |
| Bank of Georgia Group plc | | | 14 | | | | 700 | |
| | | | | | | | | |
| GREECE - 2.3% |
| Alpha Services and Holdings SA | | | 830 | | | | 1,439 | |
| Metlen Energy & Metals SA | | | 61 | | | | 2,419 | |
| | | | | | | | 3,858 | |
| HONG KONG - 1.6% |
| AIA Group Ltd. | | | 303 | | | | 2,719 | |
| | | | | | | | | |
| INDIA - 11.8% |
| Dabur India Ltd. | | | 229 | | | | 1,712 | |
| Havells India Ltd. | | | 157 | | | | 3,765 | |
| ICICI Bank Ltd. | | | 449 | | | | 6,815 | |
| Infosys Ltd. | | | 118 | | | | 2,636 | |
| Reliance Industries Ltd. | | | 141 | | | | 4,982 | |
| | | | | | | | 19,910 | |
| INDONESIA - 1.9% |
| Bank Rakyat Indonesia Persero Tbk. PT | | | 6,090 | | | | 1,991 | |
| Indofood CBP Sukses Makmur Tbk. PT | | | 1,555 | | | | 1,266 | |
| | | | | | | | 3,257 | |
| KAZAKHSTAN - 1.7% |
| Kaspi.KZ JSC, ADR(3) | | | 28 | | | | 2,959 | |
| | | | | | | | | |
| MALAYSIA - 1.7% |
| Frontken Corp. Bhd. | | | 1,470 | | | | 1,309 | |
| MR DIY Group M Bhd.(3) | | | 2,938 | | | | 1,510 | |
| | | | | | | | 2,819 | |
| MEXICO - 3.9% |
| Cemex SAB de CV | | | 2,334 | | | | 1,428 | |
| Gentera SAB de CV | | | 1,985 | | | | 2,217 | |
| Vista Energy SAB de CV, ADR* | | | 65 | | | | 2,892 | |
| | | | | | | | 6,537 | |
| PANAMA - 1.0% |
| Copa Holdings SA, Class A | | | 18 | | | | 1,712 | |
| | | Shares
Held | | Value | |
| PERU - 1.6% |
| Credicorp Ltd. | | | 15 | | | $ | 2,645 | |
| | | | | | | | | |
| POLAND - 1.6% |
| InPost SA* | | | 144 | | | | 2,716 | |
| | | | | | | | | |
| RUSSIA - 0.0% |
| Sberbank of Russia PJSC(4)(5)(6) | | | 265 | | | | — | |
| | | | | | | | | |
| SINGAPORE - 0.6% |
| Sea Ltd., ADR* | | | 10 | | | | 968 | |
| | | | | | | | | |
| SOUTH AFRICA - 3.1% |
| FirstRand Ltd. | | | 698 | | | | 3,356 | |
| MTN Group Ltd. | | | 356 | | | | 1,893 | |
| | | | | | | | 5,249 | |
| SOUTH KOREA - 11.8% |
| Cosmax, Inc. | | | 19 | | | | 2,106 | |
| Kia Corp. | | | 26 | | | | 1,997 | |
| LG Energy Solution Ltd.* | | | 4 | | | | 1,195 | |
| Samsung Biologics Co. Ltd.(3)* | | | 5 | | | | 3,906 | |
| Samsung Electronics Co. Ltd. | | | 198 | | | | 9,304 | |
| Shinhan Financial Group Co. Ltd. | | | 34 | | | | 1,427 | |
| | | | | | | | 19,935 | |
| TAIWAN - 19.9% |
| E Ink Holdings, Inc. | | | 701 | | | | 6,493 | |
| MediaTek, Inc. | | | 139 | | | | 5,153 | |
| Taiwan Semiconductor Manufacturing Co. Ltd. | | | 728 | | | | 22,006 | |
| | | | | | | | 33,652 | |
| THAILAND - 0.6% |
| Bangkok Bank PCL(4) | | | 237 | | | | 1,110 | |
| | | | | | | | | |
| TURKEY - 0.5% |
| BIM Birlesik Magazalar A/S | | | 64 | | | | 934 | |
| | | | | | | | | |
| UNITED ARAB EMIRATES - 1.3% |
| ADNOC Logistics & Services | | | 937 | | | | 1,366 | |
| Borouge plc | | | 1,369 | | | | 924 | |
| | | | | | | | 2,290 | |
| UNITED STATES - 1.4% |
| Globant SA* | | | 12 | | | | 2,313 | |
| | | | | | | | | |
| VIETNAM - 2.4% |
| Vietnam Technological & Commercial Joint Stock Bank | | | 4,111 | | | | 4,050 | |
| | | | | | | | | |
| Total common stocks |
| (Cost $125,600) | | | | | | | 168,291 | |
| | | | | | | | | |
| SHORT-TERM INVESTMENT - 2.4% |
| 2 | | | | | | | | |
| INVESTMENT COMPANY - 2.4% |
| BlackRock Liquidity Funds Treasury Trust Fund - Institutional Class, 4.85%(7)(8) (Cost $4,088) | | | 4,088 | | | | 4,088 | |
| | | | | | | | | |
Total investments - 101.8%
(Cost $129,688) | | | | | | | 172,379 | |
| | | | | | | | | |
| Other assets less liabilities - (1.8)% | | | | | | | (3,024 | ) |
| | | | | | | | | |
| Total net assets - 100.0%# | | | | | | $ | 169,355 | |
| (1) | Security exempt from registration pursuant to Rule 144A under the Securities Act of 1933. May be resold in transactions exempt from registration, normally to qualified institutional buyers. |
| (2) | All or a portion of security is on loan at September 30, 2024. |
48 | Artisan Partners Funds
| | (3) | Regulation S is an exemption for securities offerings that are made outside of the United States and do not involve direct selling efforts in the United States. Resale restrictions may apply for purposes of the Securities Act of 1933. At September 30, 2024, the value of these securities was $11,954 or 7.1% of net assets. |
| | (4) | Valued at a fair value in accordance with procedures established by the board of directors of Artisan Partners Funds. In total, securities valued at a fair value were $1,110, or 0.7% of total net assets. See notes 2(b) and 4 in Notes to Financial Statements for additional information. |
| | (5) | Security is valued using significant unobservable inputs and is classified as Level 3 in the fair value hierarchy. |
| | (6) | Security is restricted. |
| Security | | Acquisition Date | | Cost | | | Value | | | Percentage of Total Net Assets | |
| Sberbank of Russia PJSC | | 1/8/2019 - 3/25/2020 | | $ | 772 | | | $ | — | | | | 0.0% | |
| | (7) | Security is partially used as collateral for securities lending. At September 30, 2024, the Fund had loaned securities with a total value of $67. This was collateralized by cash of $67 which was subsequently invested in an investment company. |
| | (8) | Represents the current yield as of September 30, 2024. |
PORTFOLIO DIVERSIFICATION
Dollar values in thousands
| | | Value | | | Percentage of
Total Investments | |
| Communication Services | | $ | 5,383 | | | | 3.1 | % |
| Consumer Discretionary | | | 26,742 | | | | 15.5 | |
| Consumer Staples | | | 6,018 | | | | 3.5 | |
| Energy | | | 9,240 | | | | 5.4 | |
| Financials | | | 35,862 | | | | 20.8 | |
| Health Care | | | 8,843 | | | | 5.1 | |
| Industrials | | | 23,359 | | | | 13.6 | |
| Information Technology | | | 48,199 | | | | 27.9 | |
| Materials | | | 4,645 | | | | 2.7 | |
| Short-Term Investment | | | 4,088 | | | | 2.4 | |
| Total investments | | $ | 172,379 | | | | 100.0 | % |
Definitions of abbreviations and footnotes are detailed on page 2-3.
The accompanying notes are an integral part of the financial statements.
ARTISAN VALUE FUND
Schedule of Investments — September 30, 2024
Shares and dollar values in thousands
| | | Shares
Held | | Value | |
| COMMON STOCKS - 95.9% |
| |
| AEROSPACE & DEFENSE - 4.6% |
| Airbus SE(1) | | | 53 | | | $ | 7,753 | |
| Safran SA(1) | | | 35 | | | | 8,303 | |
| | | | | | | | 16,056 | |
| AIR FREIGHT & LOGISTICS - 3.7% |
| FedEx Corp. | | | 8 | | | | 2,270 | |
| United Parcel Service, Inc., Class B | | | 78 | | | | 10,693 | |
| | | | | | | | 12,963 | |
| BANKS - 6.7% |
| Bank of America Corp. | | | 171 | | | | 6,797 | |
| PNC Financial Services Group, Inc. (The) | | | 44 | | | | 8,074 | |
| US Bancorp | | | 184 | | | | 8,398 | |
| | | | | | | | 23,269 | |
| BEVERAGES - 5.9% |
| Diageo plc(1) | | | 325 | | | | 11,299 | |
| Heineken Holding NV(1) | | | 122 | | | | 9,223 | |
| | | | | | | | 20,522 | |
| CAPITAL MARKETS - 7.6% |
| CME Group, Inc. | | | 37 | | | | 8,165 | |
| Goldman Sachs Group, Inc. (The) | | | 20 | | | | 10,057 | |
| Morgan Stanley | | | 80 | | | | 8,307 | |
| | | | | | | | 26,529 | |
| CONSUMER STAPLES DISTRIBUTION & RETAIL - 1.1% |
| Dollar General Corp. | | | 44 | | | | 3,752 | |
| | | | | | | | | |
| ENERGY EQUIPMENT & SERVICES - 2.2% |
| Schlumberger NV | | | 183 | | | | 7,662 | |
| | | | | | | | | |
| ENTERTAINMENT - 3.7% |
| Electronic Arts, Inc. | | | 47 | | | | 6,793 | |
| Walt Disney Co. (The) | | | 62 | | | | 5,943 | |
| | | | | | | | 12,736 | |
| FINANCIAL SERVICES - 10.0% |
| Berkshire Hathaway, Inc., Class B* | | | 16 | | | | 7,553 | |
| Fiserv, Inc.* | | | 50 | | | | 8,927 | |
| PayPal Holdings, Inc.* | | | 148 | | | | 11,525 | |
| Visa, Inc., Class A | | | 25 | | | | 6,956 | |
| | | | | | | | 34,961 | |
| FOOD PRODUCTS - 3.3% |
| Kerry Group plc, Class A(1) | | | 112 | | | | 11,618 | |
| | | | | | | | | |
| HEALTH CARE EQUIPMENT & SUPPLIES - 7.1% |
| Baxter International, Inc. | | | 219 | | | | 8,321 | |
| Koninklijke Philips NV(1)* | | | 260 | | | | 8,513 | |
| Medtronic plc | | | 90 | | | | 8,076 | |
| | | | | | | | 24,910 | |
| HEALTH CARE PROVIDERS & SERVICES - 5.2% |
| Cigna Group (The) | | | 27 | | | | 9,410 | |
| Humana, Inc. | | | 27 | | | | 8,538 | |
| | | | | | | | 17,948 | |
| HOTELS, RESTAURANTS & LEISURE - 6.5% |
| Booking Holdings, Inc. | | | 2 | | | | 8,993 | |
| Compass Group plc(1) | | | 270 | | | | 8,644 | |
| Marriott International, Inc., Class A | | | 20 | | | | 5,081 | |
| | | | | | | | 22,718 | |
| | | Shares
Held | | Value | |
| INSURANCE - 3.2% |
| Arch Capital Group Ltd.* | | | 99 | | | $ | 11,130 | |
| | | | | | | | | |
| INTERACTIVE MEDIA & SERVICES - 7.8% |
| Alphabet, Inc., Class C | | | 75 | | | | 12,473 | |
| Meta Platforms, Inc., Class A | | | 26 | | | | 14,813 | |
| | | | | | | | 27,286 | |
| MEDIA - 2.8% |
| Comcast Corp., Class A | | | 236 | | | | 9,867 | |
| | | | | | | | | |
| OIL, GAS & CONSUMABLE FUELS - 2.6% |
| EOG Resources, Inc. | | | 74 | | | | 9,157 | |
| | | | | | | | | |
| PHARMACEUTICALS - 1.7% |
| Merck & Co., Inc. | | | 52 | | | | 5,916 | |
| | | | | | | | | |
| SEMICONDUCTORS & SEMICONDUCTOR EQUIPMENT - 4.2% |
| NXP Semiconductors NV(1) | | | 22 | | | | 5,294 | |
| Texas Instruments, Inc. | | | 44 | | | | 9,186 | |
| | | | | | | | 14,480 | |
| TECHNOLOGY HARDWARE, STORAGE & PERIPHERALS - 1.3% |
| Samsung Electronics Co. Ltd. (Preference)(1) | | | 113 | | | | 4,404 | |
| | | | | | | | | |
| TOBACCO - 4.7% |
| Altria Group, Inc. | | | 111 | | | | 5,677 | |
| Philip Morris International, Inc. | | | 87 | | | | 10,614 | |
| | | | | | | | 16,291 | |
Total common stocks
(Cost $214,634) | | | | | | | 334,175 | |
| | | | | | | | | |
| SHORT-TERM INVESTMENT - 3.3% |
| |
| INVESTMENT COMPANY - 3.3% |
| BlackRock Liquidity Funds Treasury Trust Fund - Institutional Class, 4.85%(2) (Cost $11,602) | | | 11,602 | | | | 11,602 | |
| | | | | | | | | |
Total investments - 99.2%
(Cost $226,236) | | | | | | | 345,777 | |
| | | | | | | | | |
| Other assets less liabilities - 0.8% | | | | | | | 2,779 | |
| Total net assets - 100.0%# | | | | | | $ | 348,556 | |
| (1) | The Fund considers the company to be from outside the United States. |
| | | | | Trading |
| Security | | Country | | Currency |
| Airbus SE | | France | | EUR |
| Compass Group plc | | United Kingdom | | GBP |
| Diageo plc | | United Kingdom | | GBP |
| Heineken Holding NV | | Netherlands | | EUR |
| Kerry Group plc | | Ireland | | EUR |
| Koninklijke Philips NV | | Netherlands | | EUR |
| NXP Semiconductors NV | | China | | USD |
| Safran SA | | France | | EUR |
| Samsung Electronics Co. Ltd. (Preference) | | South Korea | | KRW |
| (2) | Represents the current yield as of September 30, 2024. |
PORTFOLIO DIVERSIFICATION
Dollar values in thousands
| | | Value | | | Percentage of Total Investments |
| Communication Services | | $ | 49,888 | | | | 14.4 | % |
| Consumer Discretionary | | | 22,718 | | | | 6.6 | |
| Consumer Staples | | | 52,183 | | | | 15.1 | |
| Energy | | | 16,819 | | | | 4.9 | |
| Financials | | | 95,890 | | | | 27.7 | |
| Health Care | | | 48,774 | | | | 14.1 | |
| Industrials | | | 29,019 | | | | 8.4 | |
| Information Technology | | | 18,884 | | | | 5.5 | |
| Short-Term Investment | | | 11,602 | | | | 3.3 | |
| Total investments | | $ | 345,777 | | | | 100.0 | % |
Definitions of abbreviations and footnotes are detailed on page 2-3.
The accompanying notes are an integral part of the financial statements.
ARTISAN VALUE INCOME FUND
Schedule of Investments — September 30, 2024
Principal amount, shares and dollar values in thousands
| | | Shares
Held | | | Value | |
| COMMON STOCKS AND EQUITY-LINKED SECURITY - 91.8% |
| |
| AEROSPACE & DEFENSE - 1.6% |
| Airbus SE(1) | | | 1 | | | $ | 182 | |
| Safran SA(1) | | | — | ^ | | | 85 | |
| | | | | | | | 267 | |
| AIR FREIGHT & LOGISTICS - 2.1% |
| United Parcel Service, Inc., Class B | | | 2 | | | | 337 | |
| | | | | | | | | |
| AIRLINES - 1.8% |
| Ryanair Holdings plc, Equity-Linked Security(1)(2)(3)(4)* | | | 16 | | | | 301 | |
| | | | | | | | | |
| BANKS - 8.2% |
| Bank of America Corp. | | | 7 | | | | 262 | |
| Fifth Third Bancorp | | | 5 | | | | 206 | |
| M&T Bank Corp. | | | 1 | | | | 236 | |
| PNC Financial Services Group, Inc. (The) | | | 1 | | | | 255 | |
| US Bancorp | | | 6 | | | | 253 | |
| WaFd, Inc. | | | 4 | | | | 139 | |
| | | | | | | | 1,351 | |
| BEVERAGES - 5.8% |
| Coca-Cola Co. (The) | | | 4 | | | | 253 | |
| Diageo plc(1) | | | 10 | | | | 354 | |
| Heineken Holding NV(1) | | | 5 | | | | 347 | |
| | | | | | | | 954 | |
| CAPITAL MARKETS - 5.8% |
| CME Group, Inc. | | | 1 | | | | 315 | |
| Goldman Sachs Group, Inc. (The) | | | — | ^ | | | 210 | |
| Moelis & Co., Class A | | | 2 | | | | 159 | |
| Morgan Stanley | | | 3 | | | | 268 | |
| | | | | | | | 952 | |
| CONSUMER STAPLES DISTRIBUTION & RETAIL - 1.2% |
| Sysco Corp. | | | 3 | | | | 199 | |
| | | | | | | | | |
| DISTRIBUTORS - 1.3% |
| LKQ Corp. | | | 5 | | | | 211 | |
| | | | | | | | | |
| ELECTRIC UTILITIES - 9.5% |
| Alliant Energy Corp. | | | 5 | | | | 317 | |
| Evergy, Inc. | | | 4 | | | | 267 | |
| IDACORP, Inc. | | | 2 | | | | 232 | |
| OGE Energy Corp. | | | 9 | | | | 352 | |
| PPL Corp. | | | 12 | | | | 381 | |
| | | | | | | | 1,549 | |
| ELECTRICAL EQUIPMENT - 0.8% |
| nVent Electric plc | | | 2 | | | | 127 | |
| | | | | | | | | |
| ENERGY EQUIPMENT & SERVICES - 1.5% |
| Schlumberger NV | | | 6 | | | | 246 | |
| | | | | | | | | |
| ENTERTAINMENT - 1.4% |
| Warner Music Group Corp., Class A | | | 7 | | | | 228 | |
| | | | | | | | | |
| FINANCIAL SERVICES - 3.1% |
| Corebridge Financial, Inc. | | | 10 | | | | 277 | |
| Visa, Inc., Class A | | | 1 | | | | 232 | |
| | | | | | | | 509 | |
| FOOD PRODUCTS - 3.6% |
| Kerry Group plc, Class A(1) | | | 3 | | | | 277 | |
| | | Shares
Held | | | Value | |
| FOOD PRODUCTS (continued) |
| Tyson Foods, Inc., Class A | | | 5 | | | $ | 311 | |
| | | | | | | | 588 | |
| GAS UTILITIES - 1.0% |
| Atmos Energy Corp. | | | 1 | | | | 166 | |
| | | | | | | | | |
| HEALTH CARE EQUIPMENT & SUPPLIES - 6.2% |
| Baxter International, Inc. | | | 8 | | | | 311 | |
| Koninklijke Philips NV(1)* | | | 9 | | | | 303 | |
| Medtronic plc | | | 5 | | | | 407 | |
| | | | | | | | 1,021 | |
| HEALTH CARE REITS - 1.8% |
| Universal Health Realty Income Trust | | | 7 | | | | 299 | |
| | | | | | | | | |
| HOTELS, RESTAURANTS & LEISURE - 5.0% |
| Compass Group plc(1) | | | 8 | | | | 255 | |
| MGM China Holdings Ltd.(1) | | | 191 | | | | 304 | |
| Vail Resorts, Inc. | | | 1 | | | | 257 | |
| | | | | | | | 816 | |
| INDUSTRIAL REITS - 1.0% |
| Lineage, Inc. | | | 2 | | | | 156 | |
| | | | | | | | | |
| LEISURE PRODUCTS - 1.1% |
| Polaris, Inc. | | | 2 | | | | 177 | |
| | | | | | | | | |
| MACHINERY - 2.3% |
| Otis Worldwide Corp. | | | 4 | | | | 374 | |
| | | | | | | | | |
| MEDIA - 5.6% |
| Cable One, Inc. | | | — | ^ | | | 159 | |
| Comcast Corp., Class A(5) | | | 11 | | | | 457 | |
| Omnicom Group, Inc. | | | 3 | | | | 303 | |
| | | | | | | | 919 | |
| OIL, GAS & CONSUMABLE FUELS - 3.9% |
| Diamondback Energy, Inc. | | | 1 | | | | 234 | |
| EOG Resources, Inc. | | | 3 | | | | 412 | |
| | | | | | | | 646 | |
| PHARMACEUTICALS - 1.5% |
| Merck & Co., Inc. | | | 2 | | | | 239 | |
| | | | | | | | | |
| RETAIL REITS - 1.7% |
| NNN REIT, Inc. | | | 6 | | | | 279 | |
| | | | | | | | | |
| SEMICONDUCTORS & SEMICONDUCTOR EQUIPMENT - 1.7% |
| Texas Instruments, Inc. | | | 1 | | | | 274 | |
| | | | | | | | | |
| SPECIALIZED REITS - 5.4% |
| Lamar Advertising Co., Class A | | | 5 | | | | 632 | |
| Public Storage | | | 1 | | | | 246 | |
| | | | | | | | 878 | |
| TECHNOLOGY HARDWARE, STORAGE & PERIPHERALS - 0.6% |
| Samsung Electronics Co. Ltd. (Preference)(1) | | | 3 | | | | 104 | |
| | | | | | | | | |
| TOBACCO - 5.3% |
| Altria Group, Inc. | | | 6 | | | | 326 | |
| Philip Morris International, Inc.(5) | | | 5 | | | | 549 | |
| | | | | | | | 875 | |
Total common stocks and equity-linked security
(Cost $13,324) | | | | | | | 15,042 | |
| | | Principal Amount | | | Value | |
| CONVERTIBLE BONDS - 2.4% |
| |
| MEDIA - 1.1% |
| Cable One, Inc. |
| Zero Coupon, 3/15/2026 | | | 106 | | | $ | 97 | |
| 1.13%, 3/15/2028 | | | 97 | | | | 78 | |
| | | | | | | | 175 | |
| MORTGAGE REAL ESTATE INVESTMENT TRUSTS (REITS) - 1.3% |
| Redwood Trust, Inc. |
| 7.75%, 6/15/2027 | | | 215 | | | | 214 | |
| | | | | | | | | |
Total convertible bonds
(Cost $390) | | | | | | | 389 | |
| | | | | | | | | |
| CORPORATE BONDS - 2.3% |
| |
| BROADLINE RETAIL - 1.3% |
| ANGI Group LLC |
| 3.88%, 8/15/2028(6) | | | 228 | | | | 209 | |
| | | | | | | | | |
| MEDIA - 1.0% |
| Cable One, Inc. |
| 4.00%, 11/15/2030(6) | | | 209 | | | | 167 | |
| | | | | | | | | |
Total corporate bonds
(Cost $359) | | | | | | | 376 | |
| | | Shares Held | | | | | |
| PREFERRED STOCK - 2.0% |
| |
| BANKS - 2.0% |
| WaFd, Inc. Series A, 4.88%(7) (Cost $235) | | | 17 | | | | 337 | |
| | | | | | | | | |
| SHORT-TERM INVESTMENT - 1.3% |
| |
| INVESTMENT COMPANY - 1.3% |
| BlackRock Liquidity Funds Treasury Trust Fund - Institutional Class, 4.85%(8) (Cost $213) | | | 213 | | | | 213 | |
| | | | | | | | | |
Total investments - 99.8%
(Cost $14,521) | | | | | | | 16,357 | |
| | | | | | | | | |
WRITTEN OPTION CONTRACTS - (0.2)%
(Premiums received $(28)) | | | | | | | (33 | ) |
| | | | | | | | | |
| Other assets less liabilities - 0.4% | | | | | | | 62 | |
| Total net assets - 100.0%# | | | | | | $ | 16,386 | |
| (1) | The Fund considers the company to be from outside the United States. |
| | | | | Trading |
| Security | | Country | | Currency |
| Airbus SE | | France | | EUR |
| Compass Group plc | | United Kingdom | | GBP |
| Diageo plc | | United Kingdom | | GBP |
| Heineken Holding NV | | Netherlands | | EUR |
| Kerry Group plc | | Ireland | | EUR |
| Koninklijke Philips NV | | Netherlands | | EUR |
| MGM China Holdings Ltd. | | Macau | | HKD |
| Ryanair Holdings plc, Equity-Linked Security | | Ireland | | USD |
| Safran SA | | France | | EUR |
| Samsung Electronics Co. Ltd. (Preference) | | South Korea | | KRW |
| (2) | Valued at a fair value in accordance with procedures established by the board of directors of Artisan Partners Funds. In total, securities valued at a fair value were $301, or 1.8% of total net assets. See notes 2(b) and 4 in Notes to Financial Statements for additional information. |
| (3) | Security is restricted. Security was acquired in a transaction pursuant to Rule 144A under the Securities Act of 1933, as amended, on the date or during the period noted below. |
| | | | | | | | | | | Percentage of | |
| Security | | Acquisition Date | | Cost | | | Value | | | Total Net Assets | |
| Ryanair Holdings plc, Equity-Linked | | | | | | | | | | | | | | |
| Security | | 3/12/2024 - 7/25/2024 | | $ | 326 | | | $ | 301 | | | | 1.8% | |
| (4) | Security is an equity-linked security issued by HSBC Bank plc. As described in 2(h) in Notes to Financial Statements, equity-linked securities are subject to counterparty risk with respect to the bank or broker-dealer that issues them. |
| (5) | At September 30, 2024, all or a portion of this security was pledged to cover collateral requirements for written options. |
| (6) | Security exempt from registration pursuant to Rule 144A under the Securities Act of 1933. May be resold in transactions exempt from registration, normally to qualified institutional buyers. |
| (7) | Perpetual security. The rate reflected was the rate in effect on September 30, 2024. |
| (8) | Represents the current yield as of September 30, 2024. |
PORTFOLIO DIVERSIFICATION
Dollar values in thousands
| | | Value | | | Percentage of Total Investments | |
| Communication Services | | $ | 1,490 | | | | 9.1 | % |
| Consumer Discretionary | | | 1,414 | | | | 8.6 | |
| Consumer Staples | | | 2,616 | | | | 16.0 | |
| Energy | | | 892 | | | | 5.5 | |
| Financials | | | 3,361 | | | | 20.5 | |
| Health Care | | | 1,260 | | | | 7.7 | |
| Industrials | | | 1,406 | | | | 8.6 | |
| Information Technology | | | 378 | | | | 2.3 | |
| Real Estate | | | 1,612 | | | | 9.9 | |
| Utilities | | | 1,715 | | | | 10.5 | |
| Short-Term Investment | | | 213 | | | | 1.3 | |
| Total investments | | $ | 16,357 | | | | 100.0 | % |
WRITTEN OPTION CONTRACTS
Dollar values in thousands except exercise price
Call Options
| Number of Contracts‡ | | | Description | | Exercise Price | | Notional Amount | | Expiration Date | | Premiums Paid/ (Received)
by Fund | | Market Value | | Unrealized Appreciation/ (Depreciation) |
| 8 | | | Altria Group, Inc. | | $ | 52.50 | | | $ | 41 | | | 03/21/25 | | $ | (2 | ) | | $ | (1 | ) | | $ | — | ^ |
| 8 | | | Altria Group, Inc. | | | 55.00 | | | | 41 | | | 06/20/25 | | | (2 | ) | | | (1 | ) | | | 1 | |
| 2 | | | CME Group, Inc. | | | 210.00 | | | | 44 | | | 11/15/24 | | | (1 | ) | | | (3 | ) | | | (2 | ) |
| 7 | | | Coca-Cola Co. (The) | | | 70.00 | | | | 50 | | | 11/15/24 | | | (1 | ) | | | (2 | ) | | | (1 | ) |
| 4 | | | Coca-Cola Co. (The) | | | 72.50 | | | | 29 | | | 11/15/24 | | | (1 | ) | | | (1 | ) | | | — | ^ |
| 2 | | | Compass Group plc(1) | | GBP | 26.00 | | | | 64 | | | 06/20/25 | | | (3 | ) | | | (2 | ) | | | 1 | |
| 9 | | | Fifth Third Bancorp | | $ | 42.00 | | | | 39 | | | 11/15/24 | | | (1 | ) | | | (2 | ) | | | (1 | ) |
| 1 | | | Goldman Sachs Group, Inc. (The) | | | 530.00 | | | | 50 | | | 12/20/24 | | | (2 | ) | | | (1 | ) | | | 1 | |
| 10 | | | NNN REIT, Inc. | | | 50.00 | | | | 48 | | | 03/21/25 | | | (1 | ) | | | (1 | ) | | | — | ^ |
| 3 | | | Omnicom Group, Inc. | | | 100.00 | | | | 31 | | | 04/17/25 | | | (2 | ) | | | (3 | ) | | | (1 | ) |
| 5 | | | Otis Worldwide Corp. | | | 100.00 | | | | 52 | | | 12/20/24 | | | (2 | ) | | | (3 | ) | | | (1 | ) |
| 5 | | | Philip Morris International, Inc. | | | 120.00 | | | | 61 | | | 01/17/25 | | | (3 | ) | | | (3 | ) | | | (1 | ) |
| 2 | | | Safran SA | | EUR | 220.00 | | | | 42 | | | 12/20/24 | | | (1 | ) | | | (2 | ) | | | (1 | ) |
| 10 | | | US Bancorp | | $ | 45.00 | | | | 46 | | | 10/18/24 | | | (3 | ) | | | (2 | ) | | | 1 | |
| 10 | | | US Bancorp | | | 42.50 | | | | 46 | | | 11/15/24 | | | (2 | ) | | | (4 | ) | | | (2 | ) |
| 1 | | | Visa, Inc. | | | 290.00 | | | | 27 | | | 12/20/24 | | | (1 | ) | | | (1 | ) | | | — | ^ |
| 1 | | | Visa, Inc. | | | 280.00 | | | | 27 | | | 01/17/25 | | | (1 | ) | | | (1 | ) | | | — | ^ |
| Total written option contracts | | | | | | | | | | | | $ | (28 | ) | | $ | (33 | ) | | $ | (5 | ) |
| (1) | One contract is equal to 1000 shares. |
Definitions of abbreviations and footnotes are detailed on page 2-3.
The accompanying notes are an integral part of the financial statements.
ARTISAN PARTNERS FUNDS
Statements of Assets and Liabilities — September 30, 2024
Dollar values in thousands
| | | | | EMERGING MARKETS | | | | |
| | | DEVELOPING WORLD | | DEBT OPPORTUNITIES* | | FLOATING RATE | | FOCUS |
| ASSETS: | | | | | | | | |
| Investments in securities, unaffiliated, at value | | $ | 3,506,232 | | | $ | 59,543 | | | $ | 66,138 | | | $ | 1,146,990 | |
| Short-term investments, at value | | | 80,325 | | | | 8,510 | | | | 755 | | | | 10,467 | |
| Total investments | | | 3,586,557 | | | | 68,053 | | | | 66,893 | | | | 1,157,457 | |
| Cash | | | 23,509 | | | | 224 | | | | 878 | | | | 10,250 | |
| Cash pledged for centrally cleared swap contracts | | | — | | | | 2,961 | | | | — | | | | — | |
| Deposits with broker for forward contracts | | | — | | | | 1,548 | | | | — | | | | — | |
| Deposits with broker for futures contracts | | | — | | | | 479 | | | | — | | | | — | |
| Due from broker | | | — | | | | 76 | | | | — | | | | — | |
| Foreign currency | | | 4,450 | | | | 282 | | | | — | | | | 333 | |
| Unrealized appreciation on foreign currency forward contracts | | | — | | | | 322 | | | | — | | | | 1,310 | |
| Receivable from investments sold | | | 16,304 | | | | 665 | | | | 8,273 | | | | 15,776 | |
| Receivable from fund shares sold | | | 1,385 | | | | 160 | | | | 73 | | | | 1,266 | |
| Receivable for variation margin on futures contracts | | | — | | | | 72 | | | | — | | | | — | |
| Receivable from the Adviser | | | — | | | | 11 | | | | — | | | | — | |
| Dividends and interest receivable | | | 1,099 | | | | 1,370 | | | | 362 | | | | 614 | |
| Other assets | | | 455 | | | | 8 | | | | 10 | | | | 145 | |
| Total assets | | | 3,633,759 | | | | 76,231 | | | | 76,489 | | | | 1,187,151 | |
| LIABILITIES: | | | | | | | | | | | | | | | | |
| Written options, at value | | | — | | | | — | | | | — | | | | 3,263 | (1) |
| Swap contracts, at value | | | — | | | | — | ^ | | | — | | | | — | |
| Reverse repurchase agreements | | | — | | | | 163 | | | | — | | | | — | |
| Unrealized depreciation on unfunded loan commitments | | | — | | | | — | | | | 1 | | | | — | |
| Unrealized depreciation on foreign currency forward contracts | | | — | | | | 184 | | | | — | | | | 2,815 | |
| Dividends payable | | | — | | | | — | | | | 9 | | | | — | |
| Payable for investments purchased | | | 15,323 | | | | — | ^ | | | 2,698 | | | | 19,147 | |
| Payable for fund shares redeemed | | | 1,919 | | | | 26 | | | | 781 | | | | 383 | |
| Payable for variation margin on centrally cleared swap contracts | | | — | | | | 32 | | | | — | | | | — | |
| Payable for operating expenses | | | 615 | | | | 199 | | | | 174 | | | | 255 | |
| Payable for management fees | | | 500 | | | | — | | | | 2 | | | | 158 | |
| Payable for deferred director’s compensation | | | 437 | | | | 8 | | | | 9 | | | | 128 | |
| Payable for foreign taxes on unrealized gains | | | 7,250 | | | | 30 | | | | — | | | | — | |
| Total liabilities | | | 26,044 | | | | 642 | | | | 3,674 | | | | 26,149 | |
| Total net assets | | $ | 3,607,715 | | | $ | 75,589 | | | $ | 72,815 | | | $ | 1,161,002 | |
| NET ASSETS CONSIST OF: | | | | | | | | | | | | | | | | |
| Fund shares issued and outstanding | | $ | 2,686,582 | | | $ | 74,021 | | | $ | 74,900 | | | $ | 827,546 | |
| Total distributable earnings (loss) | | | 921,133 | | | | 1,568 | | | | (2,085 | ) | | | 333,456 | |
| Total net assets | | $ | 3,607,715 | | | $ | 75,589 | | | $ | 72,815 | | | $ | 1,161,002 | |
| SUPPLEMENTARY INFORMATION: | | | | | | | | | | | | | | | | |
| Net assets | | | | | | | | | | | | | | | | |
| Investor Shares | | $ | 348,562 | | | $ | 3,744 | | | $ | 12,805 | | | $ | 42,763 | |
| Advisor Shares | | $ | 1,716,768 | | | $ | 24,074 | | | $ | 24,111 | | | $ | 677,071 | |
| Institutional Shares | | $ | 1,542,385 | | | $ | 47,771 | | | $ | 35,899 | | | $ | 441,168 | |
| Shares outstanding (Indefinite number of shares authorized, $0.01 par value) | | | | | | | | | | | | | | | | |
| Investor Shares | | | 16,472,798 | | | | 359,150 | | | | 1,336,170 | | | | 1,809,597 | |
| Advisor Shares | | | 80,202,084 | | | | 2,310,615 | | | | 2,516,867 | | | | 28,462,459 | |
| Institutional Shares | | | 71,565,531 | | | | 4,581,910 | | | | 3,748,136 | | | | 18,479,592 | |
| Net asset value per share | | | | | | | | | | | | | | | | |
| Investor Shares | | $ | 21.16 | | | $ | 10.43 | | | $ | 9.58 | | | $ | 23.63 | |
| Advisor Shares | | $ | 21.41 | | | $ | 10.42 | | | $ | 9.58 | | | $ | 23.79 | |
| Institutional Shares | | $ | 21.55 | | | $ | 10.43 | | | $ | 9.58 | | | $ | 23.87 | |
| Cost of total investments | | $ | 1,953,735 | | | $ | 66,211 | | | $ | 67,500 | | | $ | 876,896 | |
| Cost of foreign currency held | | $ | 4,413 | | | $ | 281 | | | $ | — | | | $ | 332 | |
| * | Consolidated statement |
| (1) | Premiums received $3,811 |
| ^ | Amount rounds to less than $1 |
The accompanying notes are an integral part of the financial statements.
ARTISAN PARTNERS FUNDS
Statements of Assets and Liabilities — September 30, 2024 (Continued)
Dollar values in thousands
| | | | | | | GLOBAL | | GLOBAL |
| | | GLOBAL DISCOVERY | | GLOBAL EQUITY | | OPPORTUNITIES | | UNCONSTRAINED* |
| ASSETS: | | | | | | | | |
| Investments in securities, unaffiliated, at value | | $ | 228,979 | | | $ | 177,286 | | | $ | 2,455,872 | | | $ | 90,695 | | |
| Short-term investments, at value | | | 12,033 | | | | 1,539 | | | | 87,572 | | | | 20,396 | | |
| Total investments | | | 241,012 | | | | 178,825 | | | | 2,543,444 | | | | 111,091 | | |
| Cash | | | 1,939 | | | | 1,489 | | | | 21,356 | | | | 1,118 | | |
| Cash pledged for centrally cleared swap contracts | | | — | | | | — | | | | — | | | | 5,058 | | |
| Deposits with broker for forward contracts | | | — | | | | — | | | | — | | | | 3,021 | | |
| Deposits with broker for futures contracts | | | — | | | | — | | | | — | | | | 587 | | |
| Foreign currency | | | 244 | | | | 114 | | | | 2,311 | | | | 2,151 | | |
| Unrealized appreciation on foreign currency forward contracts | | | — | | | | — | | | | — | | | | 309 | | |
| Receivable from investments sold | | | 221 | | | | 1,489 | | | | 10,638 | | | | 2,468 | | |
| Receivable from fund shares sold | | | 5 | | | | 1 | | | | 2,254 | | | | 542 | | |
| Receivable for variation margin on futures contracts | | | — | | | | — | | | | — | | | | 31 | | |
| Receivable for variation margin on centrally cleared swap contracts | | | — | | | | — | | | | — | | | | 20 | | |
| Receivable from the Adviser | | | — | | | | — | | | | — | | | | 24 | | |
| Dividends and interest receivable | | | 154 | | | | 513 | | | | 2,467 | | | | 2,079 | | |
| Other assets | | | 24 | | | | 25 | | | | 398 | | | | 9 | | |
| Total assets | | | 243,599 | | | | 182,456 | | | | 2,582,868 | | | | 128,508 | | |
| LIABILITIES: | | | | | | | | | | | | | | | | | |
| Swap contracts, at value | | | — | | | | — | | | | — | | | | 40 | (1) | |
| Short positions in securities, at value | | | — | | | | — | | | | — | | | | 6,497 | | |
| Reverse repurchase agreements | | | — | | | | — | | | | — | | | | 200 | | |
| Unrealized depreciation on foreign currency forward contracts | | | — | | | | — | | | | — | | | | 701 | | |
| Payable for investments purchased | | | — | | | | 764 | | | | 9,504 | | | | 2,290 | | |
| Payable for fund shares redeemed | | | 28 | | | | — | ^ | | | 15,154 | | | | 73 | | |
| Payable for operating expenses | | | 121 | | | | 149 | | | | 513 | | | | 268 | | |
| Payable for management fees | | | 32 | | | | 22 | | | | 312 | | | | — | | |
| Payable for deferred director’s compensation | | | 23 | | | | 25 | | | | 381 | | | | 8 | | |
| Payable for foreign taxes on unrealized gains | | | — | | | | — | | | | — | | | | 62 | | |
| Total liabilities | | | 204 | | | | 960 | | | | 25,864 | | | | 10,139 | | |
| Total net assets | | $ | 243,395 | | | $ | 181,496 | | | $ | 2,557,004 | | | $ | 118,369 | | |
| NET ASSETS CONSIST OF: | | | | | | | | | | | | | | | | | |
| Fund shares issued and outstanding | | $ | 180,527 | | | $ | 139,268 | | | $ | 1,504,387 | | | $ | 118,545 | | |
| Total distributable earnings (loss) | | | 62,868 | | | | 42,228 | | | | 1,052,617 | | | | (176 | ) | |
| Total net assets | | $ | 243,395 | | | $ | 181,496 | | | $ | 2,557,004 | | | $ | 118,369 | | |
| SUPPLEMENTARY INFORMATION: | | | | | | | | | | | | | | | | | |
| Net assets | | | | | | | | | | | | | | | | | |
| Investor Shares | | $ | 33,480 | | | $ | 74,466 | | | $ | 707,994 | | | $ | 10,710 | | |
| Advisor Shares | | $ | 18,701 | | | $ | 4,387 | | | $ | 517,357 | | | $ | 75,963 | | |
| Institutional Shares | | $ | 191,214 | | | $ | 102,643 | | | $ | 1,331,653 | | | $ | 31,696 | | |
| Shares outstanding (Indefinite number of shares authorized, $0.01 par value) | | | | | | | | | | | | | | | | | |
| Investor Shares | | | 1,624,214 | | | | 3,478,786 | | | | 19,600,959 | | | | 1,062,059 | | |
| Advisor Shares | | | 903,535 | | | | 204,760 | | | | 14,136,409 | | | | 7,528,944 | | |
| Institutional Shares | | | 9,164,409 | | | | 4,722,329 | | | | 35,768,698 | | | | 3,141,061 | | |
| Net asset value per share | | | | | | | | | | | | | | | | | |
| Investor Shares | | $ | 20.61 | | | $ | 21.41 | | | $ | 36.12 | | | $ | 10.08 | | |
| Advisor Shares | | $ | 20.70 | | | $ | 21.42 | | | $ | 36.60 | | | $ | 10.09 | | |
| Institutional Shares | | $ | 20.86 | | | $ | 21.74 | | | $ | 37.23 | | | $ | 10.09 | | |
| Cost of total investments | | $ | 175,145 | | | $ | 146,364 | | | $ | 1,733,077 | | | $ | 108,075 | | |
| Cost of foreign currency held | | $ | 242 | | | $ | 114 | | | $ | 2,313 | | | $ | 2,064 | | |
| Proceeds from short positions in securities | | $ | — | | | $ | — | | | $ | — | | | $ | 6,117 | | |
| * | Consolidated statement |
| (1) | Net upfront payments paid of $3 |
| ^ | Amount rounds to less than $1 |
The accompanying notes are an integral part of the financial statements.
ARTISAN PARTNERS FUNDS
Statements of Assets and Liabilities — September 30, 2024 (Continued)
Dollar values in thousands
| | | | | | | | | INTERNATIONAL |
| | | GLOBAL VALUE | | HIGH INCOME | | INTERNATIONAL | | EXPLORER |
| ASSETS: | | | | | | | | |
| Investments in securities, unaffiliated, at value | | $ | 2,338,879 | | | $ | 8,099,891 | (1) | | $ | 4,998,884 | (2) | | $ | 122,664 | |
| Investments in securities, affiliated, at value | | | — | | | | — | | | | — | | | | 15,472 | |
| Short-term investments, at value | | | 148,083 | | | | 663,934 | | | | 167,863 | | | | 20,669 | |
| Total investments | | | 2,486,962 | | | | 8,763,825 | | | | 5,166,747 | | | | 158,805 | |
| Cash | | | 15,491 | | | | 59,601 | | | | 41,164 | | | | 350 | |
| Foreign currency | | | 6,773 | | | | 138 | | | | 10,850 | | | | 368 | |
| Security lending income receivable | | | — | | | | 24 | | | | 1 | | | | — | |
| Receivable from investments sold | | | 12 | | | | 114,939 | | | | 88,852 | | | | — | ^ |
| Receivable from fund shares sold | | | 1,274 | | | | 33,542 | | | | 1,086 | | | | 381 | |
| Dividends and interest receivable | | | 6,476 | | | | 131,965 | | | | 23,372 | | | | 341 | |
| Other assets | | | 273 | | | | 609 | | | | 903 | | | | 8 | |
| Total assets | | | 2,517,261 | | | | 9,104,643 | | | | 5,332,975 | | | | 160,253 | |
| LIABILITIES: | | | | | | | | | | | | | | | | |
| Unrealized depreciation on foreign currency forward contracts | | | — | | | | 138 | | | | — | | | | — | |
| Dividends payable | | | — | | | | 15,549 | | | | — | | | | — | |
| Payable for investments purchased | | | 6,255 | | | | 199,527 | | | | 22,379 | | | | 812 | |
| Payable for fund shares redeemed | | | 328 | | | | 26,986 | | | | 10,226 | | | | — | ^ |
| Payable upon return of securities loaned | | | — | | | | 34,807 | | | | 10,725 | | | | — | |
| Payable for operating expenses | | | 297 | | | | 930 | | | | 1,159 | | | | 105 | |
| Payable for management fees | | | 338 | | | | 803 | | | | 684 | | | | 24 | |
| Payable for deferred director’s compensation | | | 259 | | | | 565 | | | | 875 | | | | 7 | |
| Payable for foreign taxes on unrealized gains | | | — | | | | — | | | | — | | | | 156 | |
| Total liabilities | | | 7,477 | | | | 279,305 | | | | 46,048 | | | | 1,104 | |
| Total net assets | | $ | 2,509,784 | | | $ | 8,825,338 | | | $ | 5,286,927 | | | $ | 159,149 | |
| NET ASSETS CONSIST OF: | | | | | | | | | | | | | | | | |
| Fund shares issued and outstanding | | $ | 1,547,777 | | | $ | 9,103,101 | | | $ | 3,601,699 | | | $ | 139,807 | |
| Total distributable earnings (loss) | | | 962,007 | | | | (277,763 | ) | | | 1,685,228 | | | | 19,342 | |
| Total net assets | | $ | 2,509,784 | | | $ | 8,825,338 | | | $ | 5,286,927 | | | $ | 159,149 | |
| SUPPLEMENTARY INFORMATION: | | | | | | | | | | | | | | | | |
| Net assets | | | | | | | | | | | | | | | | |
| Investor Shares | | $ | 241,559 | | | $ | 609,401 | | | $ | 1,533,080 | | | | | |
| Advisor Shares | | $ | 337,314 | | | $ | 3,486,020 | | | $ | 870,424 | | | $ | 101,836 | |
| Institutional Shares | | $ | 1,930,911 | | | $ | 4,729,917 | | | $ | 2,883,423 | | | $ | 57,313 | |
| Shares outstanding (Indefinite number of shares authorized, $0.01 par value) | | | | | | | | | | | | | | | | |
| Investor Shares | | | 10,020,890 | | | | 66,288,838 | | | | 49,893,967 | | | | | |
| Advisor Shares | | | 14,007,141 | | | | 379,483,839 | | | | 28,453,702 | | | | 8,087,240 | |
| Institutional Shares | | | 79,923,805 | | | | 514,897,373 | | | | 93,286,832 | | | | 4,550,960 | |
| Net asset value per share | | | | | | | | | | | | | | | | |
| Investor Shares | | $ | 24.11 | | | $ | 9.19 | | | $ | 30.73 | | | | | |
| Advisor Shares | | $ | 24.08 | | | $ | 9.19 | | | $ | 30.59 | | | $ | 12.59 | |
| Institutional Shares | | $ | 24.16 | | | $ | 9.19 | | | $ | 30.91 | | | $ | 12.59 | |
| Cost of total investments excluding affiliated issuers | | $ | 1,577,251 | | | $ | 8,928,607 | | | $ | 3,860,551 | | | $ | 130,150 | |
| Cost of securities of affiliated issuers held | | $ | — | | | $ | — | | | $ | — | | | $ | 12,873 | |
| Cost of foreign currency held | | $ | 6,714 | | | $ | 135 | | | $ | 10,816 | | | $ | 367 | |
| (1) | Includes value of securities on loan of $34,130 |
| (2) | Includes value of securities on loan of $9,725 |
The accompanying notes are an integral part of the financial statements.
ARTISAN PARTNERS FUNDS
Statements of Assets and Liabilities — September 30, 2024 (Continued)
Dollar values in thousands
| | | INTERNATIONAL | | | | | | |
| | | SMALL-MID | | INTERNATIONAL VALUE | | MID CAP | | MID CAP VALUE |
| ASSETS: | | | | | | | | |
| Investments in securities, unaffiliated, at value | | $ | 4,513,625 | | | $ | 30,098,364 | (1) | | $ | 4,235,975 | | | $ | 1,132,040 | |
| Investments in securities, affiliated, at value | | | — | | | | 1,429,767 | | | | — | | | | — | |
| Short-term investments, at value | | | 163,613 | | | | 4,434,581 | | | | 55,168 | | | | 31,368 | |
| Total investments | | | 4,677,238 | | | | 35,962,712 | | | | 4,291,143 | | | | 1,163,408 | |
| Cash | | | 33,224 | | | | 201,897 | | | | 33,293 | | | | 9,391 | |
| Foreign currency | | | 3,431 | | | | 107,365 | | | | — | ^ | | | — | |
| Security lending income receivable | | | — | | | | 6 | | | | — | | | | — | |
| Receivable from investments sold | | | 24,290 | | | | 48,314 | | | | 1,464 | | | | 1,087 | |
| Receivable from fund shares sold | | | 3,987 | | | | 55,404 | | | | 3,025 | | | | 604 | |
| Dividends and interest receivable | | | 17,086 | | | | 92,686 | | | | 779 | | | | 859 | |
| Other assets | | | 376 | | | | 2,294 | | | | 597 | | | | 202 | |
| Total assets | | | 4,759,632 | | | | 36,470,678 | | | | 4,330,301 | | | | 1,175,551 | |
| LIABILITIES: | | | | | | | | | | | | | | | | |
| Payable for investments purchased | | | 6,782 | | | | 1 | | | | 16,300 | | | | — | |
| Payable for fund shares redeemed | | | 1,746 | | | | 71,049 | | | | 7,412 | | | | 382 | |
| Payable upon return of securities loaned | | | — | | | | 73,575 | | | | — | | | | — | |
| Payable for operating expenses | | | 651 | | | | 3,748 | | | | 670 | | | | 333 | |
| Payable for management fees | | | 663 | | | | 4,605 | | | | 554 | | | | 143 | |
| Payable for deferred director’s compensation | | | 352 | | | | 2,116 | | | | 569 | | | | 194 | |
| Payable for foreign taxes on unrealized gains | | | 1,957 | | | | 98,644 | | | | — | | | | — | |
| Total liabilities | | | 12,151 | | | | 253,738 | | | | 25,505 | | | | 1,052 | |
| Total net assets | | $ | 4,747,481 | | | $ | 36,216,940 | | | $ | 4,304,796 | | | $ | 1,174,499 | |
| NET ASSETS CONSIST OF: | | | | | | | | | | | | | | | | |
| Fund shares issued and outstanding | | $ | 4,012,132 | | | $ | 24,972,356 | | | $ | 2,344,845 | | | $ | 698,087 | |
| Total distributable earnings | | | 735,349 | | | | 11,244,584 | | | | 1,959,951 | | | | 476,412 | |
| Total net assets | | $ | 4,747,481 | | | $ | 36,216,940 | | | $ | 4,304,796 | | | $ | 1,174,499 | |
| SUPPLEMENTARY INFORMATION: | | | | | | | | | | | | | | | | |
| Net assets | | | | | | | | | | | | | | | | |
| Investor Shares | | $ | 203,785 | | | $ | 3,160,578 | | | $ | 1,184,394 | | | $ | 352,773 | |
| Advisor Shares | | $ | 1,176,167 | | | $ | 10,859,010 | | | $ | 616,589 | | | $ | 216,475 | |
| Institutional Shares | | $ | 3,367,529 | | | $ | 22,197,352 | | | $ | 2,503,813 | | | $ | 605,251 | |
| Shares outstanding (Indefinite number of shares authorized, $0.01 par value) | | | | | | | | | | | | | | | | |
| Investor Shares | | | 10,959,403 | | | | 60,749,203 | | | | 31,965,865 | | | | 20,949,750 | |
| Advisor Shares | | | 62,846,360 | | | | 209,171,104 | | | | 16,295,562 | | | | 12,931,126 | |
| Institutional Shares | | | 177,760,256 | | | | 425,400,972 | | | | 56,422,320 | | | | 36,099,386 | |
| Net asset value per share | | | | | | | | | | | | | | | | |
| Investor Shares | | $ | 18.59 | | | $ | 52.03 | | | $ | 37.05 | | | $ | 16.84 | |
| Advisor Shares | | $ | 18.71 | | | $ | 51.91 | | | $ | 37.84 | | | $ | 16.74 | |
| Institutional Shares | | $ | 18.94 | | | $ | 52.18 | | | $ | 44.38 | | | $ | 16.77 | |
| Cost of total investments excluding affiliated issuers | | $ | 3,935,933 | | | $ | 23,804,493 | | | $ | 2,746,696 | | | $ | 730,224 | |
| Cost of securities of affiliated issuers held | | $ | — | | | $ | 1,488,717 | | | $ | — | | | $ | — | |
| Cost of foreign currency held | | $ | 3,403 | | | $ | 105,991 | | | $ | — | ^ | | $ | — | |
| (1) | Includes value of securities on loan of $71,450 |
The accompanying notes are an integral part of the financial statements.
ARTISAN PARTNERS FUNDS
Statements of Assets and Liabilities — September 30, 2024 (Continued)
Dollar values in thousands
| | | | | | | SUSTAINABLE | | |
| | | SELECT EQUITY | | SMALL CAP | | EMERGING MARKETS | | VALUE |
| ASSETS: | | | | | | | | |
| Investments in securities, unaffiliated, at value | | $ | 47,775 | | | $ | 1,352,039 | | | $ | 168,291 | (1) | | $ | 334,175 | |
| Short-term investments, at value | | | 4,205 | | | | 30,595 | | | | 4,088 | | | | 11,602 | |
| Total investments | | | 51,980 | | | | 1,382,634 | | | | 172,379 | | | | 345,777 | |
| Cash | | | 288 | | | | 13,858 | | | | 629 | | | | 1,893 | |
| Foreign currency | | | 2 | | | | — | | | | 246 | | | | 75 | |
| Security lending income receivable | | | — | | | | 1 | | | | — | ^ | | | — | |
| Receivable from investments sold | | | — | | | | — | | | | 354 | | | | 23 | |
| Receivable from fund shares sold | | | — | | | | 307 | | | | 366 | | | | 175 | |
| Dividends and interest receivable | | | 32 | | | | 162 | | | | 206 | | | | 886 | |
| Other assets | | | 15 | | | | 242 | | | | 20 | | | | 39 | |
| Total assets | | | 52,317 | | | | 1,397,204 | | | | 174,200 | | | | 348,868 | |
| LIABILITIES: | | | | | | | | | | | | | | | | |
| Payable for investments purchased | | | 51 | | | | 1,193 | | | | 95 | | | | — | |
| Payable for fund shares redeemed | | | 34 | | | | 2,455 | | | | 3,265 | | | | 107 | |
| Payable upon return of securities loaned | | | — | | | | — | | | | 67 | | | | — | |
| Payable for operating expenses | | | 102 | | | | 380 | | | | 162 | | | | 139 | |
| Payable for management fees | | | 3 | | | | 183 | | | | 7 | | | | 30 | |
| Payable for deferred director’s compensation | | | 14 | | | | 234 | | | | 19 | | | | 36 | |
| Payable for foreign taxes on unrealized gains | | | — | | | | — | | | | 1,230 | | | | — | |
| Total liabilities | | | 204 | | | | 4,445 | | | | 4,845 | | | | 312 | |
| Total net assets | | $ | 52,113 | | | $ | 1,392,759 | | | $ | 169,355 | | | $ | 348,556 | |
| NET ASSETS CONSIST OF: | | | | | | | | | | | | | | | | |
| Fund shares issued and outstanding | | $ | 37,829 | | | $ | 946,526 | | | $ | 274,313 | | | $ | 208,279 | |
| Total distributable earnings (loss) | | | 14,284 | | | | 446,233 | | | | (104,958 | ) | | | 140,277 | |
| Total net assets | | $ | 52,113 | | | $ | 1,392,759 | | | $ | 169,355 | | | $ | 348,556 | |
| SUPPLEMENTARY INFORMATION: | | | | | | | | | | | | | | | | |
| Net assets | | | | | | | | | | | | | | | | |
| Investor Shares | | $ | 3,416 | | | $ | 515,060 | | | $ | 16,135 | | | $ | 84,289 | |
| Advisor Shares | | $ | 1,382 | | | $ | 284,862 | | | $ | 47,511 | | | $ | 95,835 | |
| Institutional Shares | | $ | 47,315 | | | $ | 592,837 | | | $ | 105,709 | | | $ | 168,432 | |
| Shares outstanding (Indefinite number of shares authorized, $0.01 par value) | | | | | | | | | | | | | | | | |
| Investor Shares | | | 216,849 | | | | 14,020,807 | | | | 872,253 | | | | 5,417,767 | |
| Advisor Shares | | | 87,499 | | | | 7,664,934 | | | | 2,570,171 | | | | 6,196,439 | |
| Institutional Shares | | | 3,012,644 | | | | 15,581,155 | | | | 5,611,242 | | | | 10,881,984 | |
| Net asset value per share | | | | | | | | | | | | | | | | |
| Investor Shares | | $ | 15.76 | | | $ | 36.74 | | | $ | 18.50 | | | $ | 15.56 | |
| Advisor Shares | | $ | 15.79 | | | $ | 37.16 | | | $ | 18.49 | | | $ | 15.47 | |
| Institutional Shares | | $ | 15.71 | | | $ | 38.05 | | | $ | 18.84 | | | $ | 15.48 | |
| Cost of total investments | | $ | 37,634 | | | $ | 928,996 | | | $ | 129,688 | | | $ | 226,236 | |
| Cost of foreign currency held | | $ | 2 | | | $ | — | | | $ | 243 | | | $ | 74 | |
| (1) | Includes value of securities on loan of $67 |
| ^ | Amount rounds to less than $1 |
The accompanying notes are an integral part of the financial statements.
ARTISAN PARTNERS FUNDS
Statements of Assets and Liabilities — September 30, 2024 (Continued)
Dollar values in thousands
| | | VALUE INCOME |
| ASSETS: | | |
| Investments in securities, unaffiliated, at value | | $ | 16,144 | |
| Short-term investments, at value | | | 213 | |
| Total investments | | | 16,357 | |
| Cash | | | 99 | |
| Foreign currency | | | 25 | |
| Receivable from fund shares sold | | | — | ^ |
| Dividends and interest receivable | | | 56 | |
| Other assets | | | 8 | |
| Total assets | | | 16,545 | |
| LIABILITIES: | | | | |
| Written options, at value | | | 33 | (1) |
| Payable for fund shares redeemed | | | 29 | |
| Payable for operating expenses | | | 88 | |
| Payable for management fees | | | 1 | |
| Payable for deferred director’s compensation | | | 8 | |
| Total liabilities | | | 159 | |
| Total net assets | | $ | 16,386 | |
| NET ASSETS CONSIST OF: | | | | |
| Fund shares issued and outstanding | | $ | 14,863 | |
| Total distributable earnings | | | 1,523 | |
| Total net assets | | $ | 16,386 | |
| SUPPLEMENTARY INFORMATION: | | | | |
| Net assets | | | | |
| Investor Shares | | $ | 1,032 | |
| Advisor Shares | | $ | 2,216 | |
| Institutional Shares | | $ | 13,138 | |
| Shares outstanding (Indefinite number of shares authorized, $0.01 par value) | | | | |
| Investor Shares | | | 95,851 | |
| Advisor Shares | | | 205,615 | |
| Institutional Shares | | | 1,218,303 | |
| Net asset value per share | | | | |
| Investor Shares | | $ | 10.77 | |
| Advisor Shares | | $ | 10.78 | |
| Institutional Shares | | $ | 10.78 | |
| Cost of total investments | | $ | 14,521 | |
| Cost of foreign currency held | | $ | 24 | |
| ^ | Amount rounds to less than $1 |
| (1) | Premiums received $28 |
The accompanying notes are an integral part of the financial statements.
ARTISAN PARTNERS FUNDS
Statements of Operations — For the Year Ended September 30, 2024
Dollar values in thousands
| | | | | | EMERGING MARKETS | | | | |
| | | | DEVELOPING WORLD | | DEBT OPPORTUNITIES * | | FLOATING RATE | | FOCUS |
| INVESTMENT INCOME: | | | | | | | | | | | | | | | | |
| Dividends, from unaffiliated issuers (1) | | $ | 19,178 | | | $ | 102 | | | $ | 534 | | | $ | 12,075 | |
| Interest | | | 2,115 | | | | 5,030 | | | | 6,545 | | | | 746 | |
| | Total investment income | | | 21,293 | | | | 5,132 | | | | 7,079 | | | | 12,821 | |
| EXPENSES: | | | | | | | | | | | | | | | | |
| Management fees | | | 32,368 | | | | 427 | | | | 481 | | | | 9,989 | |
| Transfer agent fees | | | | | | | | | | | | | | | | |
| | Investor | | | 763 | | | | 43 | | | | 57 | | | | 71 | |
| | Advisor | | | 1,126 | | | | 45 | | | | 52 | | | | 540 | |
| | Institutional | | | 42 | | | | 26 | | | | 26 | | | | 30 | |
| Shareholder Communications | | | 158 | | | | 63 | | | | 63 | | | | 95 | |
| Custodian fees | | | 148 | | | | 81 | | | | 5 | | | | 36 | |
| Accounting fees | | | 69 | | | | 117 | | | | 169 | | | | 62 | |
| Professional fees | | | 204 | | | | 119 | | | | 82 | | | | 105 | |
| ReFlow fees | | | — | | | | — | | | | — | | | | 61 | |
| Registration fees | | | | | | | | | | | | | | | | |
| | Investor | | | 23 | | | | 19 | | | | 18 | | | | 21 | |
| | Advisor | | | 61 | | | | 19 | | | | 17 | | | | 30 | |
| | Institutional | | | 30 | | | | 33 | | | | 17 | | | | 25 | |
| Director’s fees | | | 99 | | | | 6 | | | | 6 | | | | 31 | |
| Interest expense | | | — | | | | 18 | | | | — | | | | — | |
| Interest on securities sold short | | | — | | | | 3 | | | | — | | | | — | |
| Other operating expenses | | | 106 | | | | 14 | | | | 14 | | | | 40 | |
| | Total operating expenses | | | 35,197 | | | | 1,033 | | | | 1,007 | | | | 11,136 | |
| Less amounts waived or paid by the Adviser | | | — | | | | (375 | ) | | | (232 | ) | | | — | |
| | Total operating expenses | | | 35,197 | | | | 658 | | | | 775 | | | | 11,136 | |
| | Net investment income (loss) | | | (13,904 | ) | | | 4,474 | | | | 6,304 | | | | 1,685 | |
| NET REALIZED AND UNREALIZED GAINS (LOSSES) ON INVESTMENTS: | | | | | | | | | | |
| Net realized gain (loss) on: | | | | | | | | | | | | | | | | |
| | Investments, from unaffiliated issuers (2) | | | 212,756 | | | | 1,088 | | | | (1,196 | ) | | | 153,029 | |
| | Foreign currency forward contracts | | | (1 | ) | | | (316 | ) | | | — | | | | 2,947 | |
| | Foreign currency related transactions | | | (211 | ) | | | (135 | ) | | | — | | | | 31 | |
| | Futures contracts | | | — | | | | (614 | ) | | | — | | | | — | |
| | Written options | | | — | | | | — | | | | — | | | | (21,741 | ) |
| | Securities sold short | | | — | | | | – | ^ | | | — | | | | — | |
| | Swap contracts | | | — | | | | (513 | ) | | | — | | | | — | |
| | Total realized gain (loss) | | | 212,544 | | | | (490 | ) | | | (1,196 | ) | | | 134,266 | |
| Net increase (decrease) in unrealized appreciation or depreciation on: | | | | | | | | | | |
| | Investments, from unaffiliated issuers (3) | | | 932,085 | | | | 2,479 | | | | 395 | | | | 228,085 | |
| | Foreign currency forward contracts | | | 1 | | | | 407 | | | | — | | | | (3,219 | ) |
| | Foreign currency related transactions | | | 44 | | | | 46 | | | | — | | | | 2 | |
| | Futures contracts | | | — | | | | (218 | ) | | | — | | | | — | |
| | Written options | | | — | | | | — | | | | — | | | | 543 | |
| | Swap contracts | | | — | | | | 777 | | | | — | | | | — | |
| | Unfunded loan commitments | | | — | | | | — | | | | (1 | ) | | | — | |
| | Securities sold short | | | — | | | | (6 | ) | | | — | | | | — | |
| | Total increase in unrealized appreciation or depreciation | | | 932,130 | | | | 3,485 | | | | 394 | | | | 225,411 | |
| | Net gain (loss) on investments and foreign currency related transactions | | 1,144,674 | | | | 2,995 | | | | (802 | ) | | | 359,677 | |
| | Net increase in net assets resulting from operations | | $ | 1,130,770 | | | $ | 7,469 | | | $ | 5,502 | | | $ | 361,362 | |
| | | | | | | | | | | | | | | | | | |
| (1) | Net of foreign taxes withheld on dividends, unaffiliated issuers | | $ | 1,117 | | | $ | 118 | | | $ | — | | | $ | 247 | |
| (2) | Net of foreign taxes on realized gains | | | — | | | | 30 | | | | — | | | | — | |
| (3) | Net of increase(decrease) in foreign taxes on unrealized gains | | | 7,250 | | | | — | | | | — | | | | — | |
| | | | | | | | | | | | | | | | | | |
| * | Consolidated statement. | | | | | | | | | | | | | | | | |
| ^ | Amount rounds to less than $1. | | | | | | | | | | | | | | | | |
The accompanying notes are an integral part of the financial statements.
ARTISAN PARTNERS FUNDS
Statements of Operations — For the Year Ended September 30, 2024 (Continued)
Dollar values in thousands
| | | | GLOBAL DISCOVERY | | GLOBAL EQUITY | | GLOBAL OPPORTUNITIES | | GLOBAL
UNCONSTRAINED * |
| INVESTMENT INCOME: | | | | | | | | | | | | | | | | |
| Dividends, from unaffiliated issuers (1) | | $ | 1,263 | | | $ | 2,474 | | | $ | 17,978 | | | $ | 191 | |
| Interest | | | 100 | | | | 69 | | | | 1,252 | | | | 6,605 | |
| Income from securities lending | | | 2 | | | | – | ^ | | | — | | | | — | |
| | Total investment income | | | 1,365 | | | | 2,543 | | | | 19,230 | | | | 6,796 | |
| EXPENSES: | | | | | | | | | | | | | | | | |
| Management fees | | | 2,209 | | | | 1,567 | | | | 23,084 | | | | 763 | |
| Transfer agent fees | | | | | | | | | | | | | | | | |
| | Investor | | | 108 | | | | 197 | | | | 1,653 | | | | 43 | |
| | Advisor | | | 46 | | | | 30 | | | | 489 | | | | 73 | |
| | Institutional | | | 26 | | | | 26 | | | | 37 | | | | 26 | |
| Shareholder Communications | | | 25 | | | | 25 | | | | 96 | | | | 65 | |
| Custodian fees | | | 18 | | | | 41 | | | | 82 | | | | 94 | |
| Accounting fees | | | 69 | | | | 69 | | | | 69 | | | | 167 | |
| Professional fees | | | 74 | | | | 87 | | | | 225 | | | | 119 | |
| ReFlow fees | | | — | | | | — | | | | 813 | | | | — | |
| Registration fees | | | | | | | | | | | | | | | | |
| | Investor | | | 18 | | | | 18 | | | | 23 | | | | 21 | |
| | Advisor | | | 18 | | | | 17 | | | | 21 | | | | 19 | |
| | Institutional | | | 18 | | | | 18 | | | | 24 | | | | 18 | |
| Director’s fees | | | 7 | | | | 6 | | | | 84 | | | | 6 | |
| Interest expense | | | — | | | | — | | | | — | | | | 4 | |
| Dividends on securities sold short | | | — | | | | — | | | | — | | | | 59 | |
| Interest on securities sold short | | | — | | | | — | | | | — | | | | 216 | |
| Other operating expenses | | | 16 | | | | 24 | | | | 98 | | | | 14 | |
| | Total operating expenses | | | 2,652 | | | | 2,125 | | | | 26,798 | | | | 1,707 | |
| Less amounts waived or paid by the Adviser | | | (35 | ) | | | (39 | ) | | | — | | | | (431 | ) |
| | Net expenses | | | 2,617 | | | | 2,086 | | | | 26,798 | | | | 1,276 | |
| | Net investment income (loss) | | | (1,252 | ) | | | 457 | | | | (7,568 | ) | | | 5,520 | |
| NET REALIZED AND UNREALIZED GAINS (LOSSES) ON INVESTMENTS: | | | | | | | | | | |
| Net realized gain (loss) on: | | | | | | | | | | | | | | | | |
| | Investments, from unaffiliated issuers (2) | | | 31,510 | | | | 19,359 | | | | 742,723 | | | | 1,235 | |
| | Foreign currency forward contracts | | | — | | | | — | | | | — | | | | (355 | ) |
| | Foreign currency related transactions | | | 32 | | | | (1 | ) | | | 208 | | | | (304 | ) |
| | Futures contracts | | | — | | | | — | | | | — | | | | (889 | ) |
| | Securities sold short | | | — | | | | — | | | | — | | | | (94 | ) |
| | Swap contracts | | | — | | | | — | | | | — | | | | (921 | ) |
| | Total realized gain (loss) | | | 31,542 | | | | 19,358 | | | | 742,931 | | | | (1,328 | ) |
| Net increase (decrease) in unrealized appreciation or depreciation on: | | | | | | | | | | |
| | Investments, from unaffiliated issuers (3) | | | 19,344 | | | | 26,670 | | | | 5,691 | | | | 3,752 | |
| | Foreign currency forward contracts | | | — | | | | — | | | | — | | | | (277 | ) |
| | Foreign currency related transactions | | | 5 | | | | 44 | | | | 56 | | | | 147 | |
| | Futures contracts | | | — | | | | — | | | | — | | | | (350 | ) |
| | Swap contracts | | | — | | | | — | | | | — | | | | (820 | ) |
| | Securities sold short | | | — | | | | — | | | | — | | | | (469 | ) |
| | Total increase in unrealized appreciation or depreciation | | | 19,349 | | | | 26,714 | | | | 5,747 | | | | 1,983 | |
| | Net gain on investments and foreign currency related transactions | | | 50,891 | | | | 46,072 | | | | 748,678 | | | | 655 | |
| | Net increase in net assets resulting from operations | | $ | 49,639 | | | $ | 46,529 | | | $ | 741,110 | | | $ | 6,175 | |
| | | | | | | | | | | | | | | | | | |
| (1) | Net of foreign taxes withheld on dividends, unaffiliated issuers | | $ | 38 | | | $ | 210 | | | $ | 700 | | | $ | 165 | |
| (2) | Net of foreign taxes on realized gains | | | — | | | | — | | | | — | | | | 51 | |
| (3) | Net of increase(decrease) in foreign taxes on unrealized gains | | | — | | | | — | | | | — | | | | 11 | |
| | | | | | | | | | | | | | | | | | |
| * | Consolidated statement. | | | | | | | | | | | | | | | | |
| | | | | | | | | | | | | | | | | | |
| ^ | Amount rounds to less than $1. | | | | | | | | | | | | | | | | |
The accompanying notes are an integral part of the financial statements.
ARTISAN PARTNERS FUNDS
Statements of Operations — For the Year Ended September 30, 2024 (Continued)
Dollar values in thousands
| | | | | | | | | | INTERNATIONAL |
| | | | GLOBAL VALUE | | HIGH INCOME | | INTERNATIONAL | | EXPLORER |
| INVESTMENT INCOME: | | | | | | | | | | | | | | | | |
| Dividends, from unaffiliated issuers (1) | | $ | 52,757 | | | $ | 39,501 | | | $ | 87,215 | | | $ | 2,787 | |
| Dividends, from affiliated issuers | | | — | | | | — | | | | — | | | | 119 | |
| Interest | | | 2,311 | | | | 640,512 | | | | 12,244 | | | | 19 | |
| Income from securities lending | | | — | | | | 461 | | | | 140 | | | | — | |
| | Total investment income | | | 55,068 | | | | 680,474 | | | | 99,599 | | | | 2,925 | |
| EXPENSES: | | | | | | | | | | | | | | | | |
| Management fees | | | 22,638 | | | | 54,620 | | | | 48,089 | | | | 1,253 | |
| Transfer agent fees | | | | | | | | | | | | | | | | |
| | Investor | | | 531 | | | | 1,660 | | | | 3,478 | | | | | |
| | Advisor | | | 256 | | | | 3,144 | | | | 699 | | | | 90 | |
| | Institutional | | | 32 | | | | 53 | | | | 42 | | | | 26 | |
| Shareholder Communications | | | 53 | | | | 363 | | | | 153 | | | | 49 | |
| Custodian fees | | | 127 | | | | 73 | | | | 417 | | | | 36 | |
| Accounting fees | | | 69 | | | | 170 | | | | 69 | | | | 69 | |
| Professional fees | | | 205 | | | | 394 | | | | 304 | | | | 98 | |
| Registration fees | | | | | | | | | | | | | | | | |
| | Investor | | | 20 | | | | 37 | | | | 29 | | | | | |
| | Advisor | | | 22 | | | | 137 | | | | 23 | | | | 29 | |
| | Institutional | | | 25 | | | | 132 | | | | 36 | | | | 19 | |
| Director’s fees | | | 71 | | | | 252 | | | | 162 | | | | 6 | |
| Other operating expenses | | | 80 | | | | 244 | | | | 180 | | | | 12 | |
| | Total operating expenses | | | 24,129 | | | | 61,279 | | | | 53,681 | | | | 1,687 | |
| Less amounts waived or paid by the Adviser | | | — | | | | — | | | | — | | | | (50 | ) |
| | Total operating expenses | | | 24,129 | | | | 61,279 | | | | 53,681 | | | | 1,637 | |
| | Net investment income | | | 30,939 | | | | 619,195 | | | | 45,918 | | | | 1,288 | |
| NET REALIZED AND UNREALIZED GAINS (LOSSES) ON INVESTMENTS: | | | | | | | | | | |
| Net realized gain (loss) on: | | | | | | | | | | | | | | | | |
| | Investments, from unaffiliated issuers | | | 97,092 | | | | (34,521 | ) | | | 418,724 | | | | 2,474 | |
| | Foreign currency forward contracts | | | — | | | | (154 | ) | | | — | | | | — | |
| | Foreign currency related transactions | | | 348 | | | | 5 | | | | (37 | ) | | | 21 | |
| | Total realized gain (loss) | | | 97,440 | | | | (34,670 | ) | | | 418,687 | | | | 2,495 | |
| Net increase (decrease) in unrealized appreciation or depreciation on: | | | | | | | | | | |
| | Investments, from unaffiliated issuers (2) | | | 454,003 | | | | 536,385 | | | | 715,754 | | | | 14,812 | |
| | Investments, from affiliated issuers | | | — | | | | — | | | | — | | | | 3,329 | |
| | Foreign currency forward contracts | | | — | | | | (112 | ) | | | — | | | | — | |
| | Foreign currency related transactions | | | 239 | | | | 5 | | | | 1,641 | | | | 3 | |
| | Unfunded loan commitments | | | — | | | | 9 | | | | — | | | | — | |
| | Total increase in unrealized appreciation or depreciation | | | 454,242 | | | | 536,287 | | | | 717,395 | | | | 18,144 | |
| | Net gain on investments and foreign currency related transactions | | | 551,682 | | | | 501,617 | | | | 1,136,082 | | | | 20,639 | |
| | Net increase in net assets resulting from operations | | $ | 582,621 | | | $ | 1,120,812 | | | $ | 1,182,000 | | | $ | 21,927 | |
| (1) | Net of foreign taxes withheld on dividends, unaffiliated issuers | | $ | 3,099 | | | $ | — | | | $ | 9,964 | | | $ | 155 | |
| (2) | Net of increase(decrease) in foreign taxes on unrealized gains | | | — | | | | — | | | | — | | | | 38 | |
The accompanying notes are an integral part of the financial statements.
ARTISAN PARTNERS FUNDS
Statements of Operations — For the Year Ended September 30, 2024 (Continued)
Dollar values in thousands
| | | | INTERNATIONAL SMALL-MID | | | INTERNATIONAL VALUE | | | MID CAP | | | MID CAP VALUE | |
| INVESTMENT INCOME: |
| Dividends, from unaffiliated issuers (1) | | $ | 53,882 | | | $ | 788,430 | | | $ | 10,960 | | | $ | 22,290 | |
| Dividends, from affiliated issuers | | | 1,009 | | | | 24,324 | | | | — | | | | — | |
| Interest | | | 2,437 | | | | 23,395 | | | | 1,709 | | | | 517 | |
| Income from securities lending | | | — | | | | 151 | | | | — | | | | 16 | |
| | Total investment income | | | 57,328 | | | | 836,300 | | | | 12,669 | | | | 22,823 | |
| EXPENSES: |
| Management fees | | | 44,931 | | | | 300,850 | | | | 42,796 | | | | 10,873 | |
| Transfer agent fees |
| | Investor | | | 605 | | | | 6,960 | | | | 3,119 | | | | 803 | |
| | Advisor | | | 1,007 | | | | 8,514 | | | | 575 | | | | 210 | |
| | Institutional | | | 44 | | | | 67 | | | | 51 | | | | 31 | |
| Shareholder Communications | | | 449 | | | | 878 | | | | 209 | | | | 129 | |
| Custodian fees | | | 317 | | | | 2,536 | | | | 57 | | | | 14 | |
| Accounting fees | | | 69 | | | | 77 | | | | 49 | | | | 49 | |
| Professional fees | | | 423 | | | | 1,544 | | | | 222 | | | | 102 | |
| ReFlow fees | | | — | | | | — | | | | — | | | | 236 | |
| Registration fees |
| | Investor | | | 31 | | | | 39 | | | | 26 | | | | 19 | |
| | Advisor | | | 30 | | | | 231 | | | | 24 | | | | 19 | |
| | Institutional | | | 74 | | | | 226 | | | | 38 | | | | 21 | |
| Fund administration fees | | | — | | | | 50 | | | | — | | | | — | |
| Director’s fees | | | 138 | | | | 994 | | | | 148 | | | | 37 | |
| Other operating expenses | | | 141 | | | | 955 | | | | 165 | | | | 49 | |
| | Total operating expenses | | | 48,259 | | | | 323,921 | | | | 47,479 | | | | 12,592 | |
| | Net investment income (loss) | | | 9,069 | | | | 512,379 | | | | (34,810 | ) | | | 10,231 | |
| NET REALIZED AND UNREALIZED GAINS (LOSSES) ON INVESTMENTS: |
| Net realized gain (loss) on: |
| | Investments, from unaffiliated issuers | | | 200,231 | | | | 1,076,374 | | | | 598,564 | | | | 155,161 | |
| | Investments, from affiliated issuers | | | (280 | ) | | | 3,001 | | | | — | | | | — | |
| | Foreign currency related transactions | | | 358 | | | | 3,010 | | | | (9 | ) | | | — | |
| | Total realized gain | | | 200,309 | | | | 1,082,385 | | | | 598,555 | | | | 155,161 | |
| Net increase (decrease) in unrealized appreciation or depreciation on: |
| | Investments, from unaffiliated issuers (2) | | | 525,460 | | | | 5,940,606 | | | | 127,557 | | | | 53,400 | |
| | Investments, from affiliated issuers | | | 53,485 | | | | 89,591 | | | | — | | | | — | |
| | Foreign currency related transactions | | | 332 | | | | 4,498 | | | | 5 | | | | — | |
| | Total increase in unrealized appreciation or depreciation | | | 579,277 | | | | 6,034,695 | | | | 127,562 | | | | 53,400 | |
| | Net gain on investments and foreign currency related transactions | | | 779,586 | | | | 7,117,080 | | | | 726,117 | | | | 208,561 | |
| | Net increase in net assets resulting from operations | | $ | 788,655 | | | $ | 7,629,459 | | | $ | 691,307 | | | $ | 218,792 | |
| (1) | Net of foreign taxes withheld on dividends, unaffiliated issuers | | $ | 4,602 | | | $ | 59,735 | | | $ | 135 | | | $ | — | |
| (2) | Net of increase(decrease) in foreign taxes on unrealized gains | | | (1,945 | ) | | | 68,249 | | | | — | | | | — | |
The accompanying notes are an integral part of the financial statements.
ARTISAN PARTNERS FUNDS
Statements of Operations — For the Year Ended September 30, 2024 (Continued)
Dollar values in thousands
| | | | SELECT EQUITY | | | SMALL CAP | | | SUSTAINABLE EMERGING MARKETS | | | VALUE | |
| INVESTMENT INCOME: |
| Dividends, from unaffiliated issuers (1) | | $ | 785 | | | $ | 2,308 | | | $ | 3,365 | | | $ | 7,344 | |
| Interest | | | 15 | | | | 674 | | | | 32 | | | | 101 | |
| Income from securities lending | | | — | | | | 73 | | | | 4 | | | | — | |
| | Total investment income | | | 800 | | | | 3,055 | | | | 3,401 | | | | 7,445 | |
| EXPENSES: |
| Management fees | | | 340 | | | | 15,096 | | | | 1,207 | | | | 2,448 | |
| Transfer agent fees |
| | Investor | | | 43 | | | | 1,232 | | | | 63 | | | | 216 | |
| | Advisor | | | 26 | | | | 223 | | | | 60 | | | | 120 | |
| | Institutional | | | 26 | | | | 35 | | | | 29 | | | | 29 | |
| Shareholder Communications | | | 22 | | | | 189 | | | | 27 | | | | 49 | |
| Custodian fees | | | 4 | | | | 24 | | | | 70 | | | | 13 | |
| Accounting fees | | | 49 | | | | 49 | | | | 69 | | | | 49 | |
| Professional fees | | | 58 | | | | 121 | | | | 89 | | | | 80 | |
| ReFlow fees | | | — | | | | — | | | | — | | | | 24 | |
| Registration fees |
| | Investor | | | 18 | | | | 20 | | | | 18 | | | | 20 | |
| | Advisor | | | 18 | | | | 25 | | | | 18 | | | | 22 | |
| | Institutional | | | 18 | | | | 21 | | | | 20 | | | | 26 | |
| Director’s fees | | | 6 | | | | 52 | | | | 6 | | | | 10 | |
| Other operating expenses | | | 11 | | | | 62 | | | | 13 | | | | 18 | |
| | Total operating expenses | | | 639 | | | | 17,149 | | | | 1,689 | | | | 3,124 | |
| Less amounts waived or paid by the Adviser | | | (132 | ) | | | — | | | | (224 | ) | | | (196 | ) |
| | Net expenses | | | 507 | | | | 17,149 | | | | 1,465 | | | | 2,928 | |
| | Net investment income (loss) | | | 293 | | | | (14,094 | ) | | | 1,936 | | | | 4,517 | |
| NET REALIZED AND UNREALIZED GAINS (LOSSES) ON INVESTMENTS: |
| Net realized gain (loss) on: |
| | Investments, from unaffiliated issuers | | | 1,106 | | | | 357,340 | | | | (2,272 | ) | | | 29,702 | |
| | Foreign currency related transactions | | | 1 | | | | — | | | | (24 | ) | | | 63 | |
| | Total realized gain (loss) | | | 1,107 | | | | 357,340 | | | | (2,296 | ) | | | 29,765 | |
| Net increase (decrease) in unrealized appreciation or depreciation on: |
| | Investments, from unaffiliated issuers (2) | | | 10,915 | | | | (7,256 | ) | | | 32,093 | | | | 37,452 | |
| | Foreign currency related transactions | | | — | ^ | | | — | | | | 8 | | | | 8 | |
| | Total increase (decrease) in unrealized appreciation or depreciation | | 10,915 | | | | (7,256 | ) | | | 32,101 | | | | 37,460 | |
| | Net gain on investments and foreign currency related transactions | | | 12,022 | | | | 350,084 | | | | 29,805 | | | | 67,225 | |
| | Net increase in net assets resulting from operations | | $ | 12,315 | | | $ | 335,990 | | | $ | 31,741 | | | $ | 71,742 | |
| (1) | Net of foreign taxes withheld on dividends, unaffiliated issuers | | $ | 31 | | | $ | 14 | | | $ | 344 | | | $ | 106 | |
| (2) | Net of increase(decrease) in foreign taxes on unrealized gains | | | — | | | | — | | | | 944 | | | | — | |
| ^ | Amount rounds to less than $1. | | | | | | | | | | | | | | | | |
The accompanying notes are an integral part of the financial statements.
ARTISAN PARTNERS FUNDS
Statements of Operations — For the Year Ended September 30, 2024 (Continued)
Dollar values in thousands
| | | | VALUE INCOME | |
| INVESTMENT INCOME: |
| Dividends, from unaffiliated issuers (1) | | $ | 477 | |
| Interest | | | 90 | |
| Income from securities lending | | | — | ^ |
| | Total investment income | | | 567 | |
| EXPENSES: |
| Management fees | | | 99 | |
| Transfer agent fees |
| | Investor | | | 44 | |
| | Advisor | | | 28 | |
| | Institutional | | | 25 | |
| Shareholder Communications | | | 20 | |
| Custodian fees | | | 9 | |
| Accounting fees | | | 62 | |
| Professional fees | | | 56 | |
| Registration fees |
| | Investor | | | 17 | |
| | Advisor | | | 17 | |
| | Institutional | | | 17 | |
| Director’s fees | | | 6 | |
| Other operating expenses | | | 9 | |
| | Total operating expenses | | | 409 | |
| Less amounts waived or paid by the Adviser | | | (259 | ) |
| | Net expenses | | | 150 | |
| | Net investment income | | | 417 | |
| NET REALIZED AND UNREALIZED GAINS (LOSSES) ON INVESTMENTS: |
| Net realized gain (loss) on: |
| | Investments, from unaffiliated issuers | | | 191 | |
| | Foreign currency related transactions | | | 2 | |
| | Written options | | | 29 | |
| | Total realized gain | | | 222 | |
| Net increase (decrease) in unrealized appreciation or depreciation on: |
| | Investments, from unaffiliated issuers | | | 2,598 | |
| | Foreign currency related transactions | | | — | ^ |
| | Written options | | | (7 | ) |
| | Total increase in unrealized appreciation or depreciation | | | 2,591 | |
| | Net gain on investments and foreign currency related transactions | | | 2,813 | |
| | Net increase in net assets resulting from operations | | $ | 3,230 | |
| (1) | Net of foreign taxes withheld on dividends, unaffiliated issuers | | $ | 3 | |
| ^ | Amount rounds to less than $1. | | | | |
The accompanying notes are an integral part of the financial statements.
ARTISAN PARTNERS FUNDS
Statements of Changes in Net Assets
Dollar values in thousands
| | | DEVELOPING WORLD | | | EMERGING MARKETS DEBT
OPPORTUNITIES* | |
| | | Year Ended
9/30/2024 | | | Year Ended
9/30/2023 | | | Year Ended
9/30/2024 | | | Year Ended
9/30/2023 | |
| OPERATIONS: |
| Net investment income (loss) | | $ | (13,904 | ) | | $ | (17,333 | ) | | $ | 4,474 | | | $ | 1,930 | |
| Net realized gain (loss) on: |
| Investments, from unaffiliated issuers | | | 212,756 | | | | (9,295 | ) | | | 1,088 | | | | 295 | |
| Foreign currency forward contracts | | | (1 | ) | | | — | | | | (316 | ) | | | 647 | |
| Foreign currency related transactions | | | (211 | ) | | | 75 | | | | (135 | ) | | | (7 | ) |
| Securities sold short | | | — | | | | — | | | | — | ^ | | | — | |
| Futures contracts | | | — | | | | — | | | | (614 | ) | | | 670 | |
| Swap contracts | | | — | | | | — | | | | (513 | ) | | | (318 | ) |
| Net increase (decrease) in unrealized appreciation or depreciation on: |
| Investments, from unaffiliated issuers | | | 932,085 | | | | 694,937 | | | | 2,479 | | | | 887 | |
| Foreign currency forward contracts | | | 1 | | | | (1 | ) | | | 407 | | | | (304 | ) |
| Foreign currency related transactions | | | 44 | | | | 72 | | | | 46 | | | | 14 | |
| Securities sold short | | | — | | | | — | | | | (6 | ) | | | 6 | |
| Futures contracts | | | — | | | | — | | | | (218 | ) | | | 155 | |
| Swap contracts | | | — | | | | — | | | | 777 | | | | (35 | ) |
| Net increase in net assets resulting from operations | | | 1,130,770 | | | | 668,455 | | | | 7,469 | | | | 3,630 | |
| DISTRIBUTIONS TO SHAREHOLDERS: |
| Investor Shares | | | — | | | | (387 | ) | | | (397 | ) | | | (58 | ) |
| Advisor Shares | | | — | | | | (6,812 | ) | | | (1,792 | ) | | | (262 | ) |
| Institutional Shares | | | — | | | | (7,043 | ) | | | (3,582 | ) | | | (2,175 | ) |
| Total distributions to shareholders | | | — | | | | (14,242 | ) | | | (5,771 | ) | | | (2,495 | ) |
| FUND SHARE ACTIVITIES: |
| Net increase (decrease) in net assets resulting from fund share activities | | | (332,403 | ) | | | (1,096,471 | ) | | | 37,582 | | | | 13,975 | |
| Total increase (decrease) in net assets | | | 798,367 | | | | (442,258 | ) | | | 39,280 | | | | 15,110 | |
| Net assets, beginning of year | | | 2,809,348 | | | | 3,251,606 | | | | 36,309 | | | | 21,199 | |
| Net assets, end of year | | $ | 3,607,715 | | | $ | 2,809,348 | | | $ | 75,589 | | | $ | 36,309 | |
| * | Consolidated statement |
| ^ | Amount rounds to less than $1 |
The accompanying notes are an integral part of the financial statements.
ARTISAN PARTNERS FUNDS
Statements of Changes in Net Assets (Continued)
Dollar values in thousands
| | | FLOATING RATE | | | FOCUS | |
| | | Year Ended
9/30/2024 | | | Year Ended
9/30/2023 | | | Year Ended
9/30/2024 | | | Year Ended
9/30/2023 | |
| OPERATIONS: |
| Net investment income | | $ | 6,304 | | | $ | 4,070 | | | $ | 1,685 | | | $ | 934 | |
| Net realized gain (loss) on: |
| Investments, from unaffiliated issuers | | | (1,196 | ) | | | (106 | ) | | | 153,029 | | | | 103,875 | |
| Foreign currency forward contracts | | | — | | | | — | | | | 2,947 | | | | 4,903 | |
| Foreign currency related transactions | | | — | | | | — | | | | 31 | | | | (4 | ) |
| Written options | | | — | | | | — | | | | (21,741 | ) | | | (5,342 | ) |
| Net increase (decrease) in unrealized appreciation or depreciation on: |
| Investments, from unaffiliated issuers | | | 395 | | | | 1,848 | | | | 228,085 | | | | 61,278 | |
| Foreign currency forward contracts | | | — | | | | — | | | | (3,219 | ) | | | (7,266 | ) |
| Foreign currency related transactions | | | — | | | | — | | | | 2 | | | | (2 | ) |
| Written options | | | — | | | | — | | | | 543 | | | | 5 | |
| Unfunded loan commitments | | | (1 | ) | | | — | ^ | | | — | | | | — | |
| Net increase in net assets resulting from operations | | | 5,502 | | | | 5,812 | | | | 361,362 | | | | 158,381 | |
| DISTRIBUTIONS TO SHAREHOLDERS: |
| Investor Shares | | | (1,042 | ) | | | (293 | ) | | | — | | | | (757 | ) |
| Advisor Shares | | | (2,036 | ) | | | (1,313 | ) | | | — | | | | (3,709 | ) |
| Institutional Shares | | | (2,964 | ) | | | (2,306 | ) | | | — | | | | (3,577 | ) |
| Total distributions to shareholders | | | (6,042 | ) | | | (3,912 | ) | | | — | | | | (8,043 | ) |
| Tax return of capital: |
| Advisor Shares | | | (81 | ) | | | — | | | | — | | | | — | |
| Institutional Shares | | | (117 | ) | | | — | | | | — | | | | — | |
| Investor Shares | | | (41 | ) | | | — | | | | — | | | | — | |
| Total return of capital | | | (239 | ) | | | — | | | | — | | | | — | |
| FUND SHARE ACTIVITIES: |
| Net increase (decrease) in net assets resulting from fund share activities | | | 21,429 | | | | 3,032 | | | | (122,196 | ) | | | (836,944 | ) |
| Total increase (decrease) in net assets | | | 20,650 | | | | 4,932 | | | | 239,166 | | | | (686,606 | ) |
| Net assets, beginning of year | | | 52,165 | | | | 47,233 | | | | 921,836 | | | | 1,608,442 | |
| Net assets, end of year | | $ | 72,815 | | | $ | 52,165 | | | $ | 1,161,002 | | | $ | 921,836 | |
| * | Consolidated statement |
| ^ | Amount rounds to less than $1 |
The accompanying notes are an integral part of the financial statements.
ARTISAN PARTNERS FUNDS
Statements of Changes in Net Assets (Continued)
Dollar values in thousands
| | | GLOBAL DISCOVERY | | | GLOBAL EQUITY | |
| | | Year Ended
9/30/2024 | | | Year Ended
9/30/2023 | | | Year Ended
9/30/2024 | | | Year Ended
9/30/2023 | |
| OPERATIONS: |
| Net investment income (loss) | | $ | (1,252 | ) | | $ | (1,204 | ) | | $ | 457 | | | $ | 1,102 | |
| Net realized gain (loss) on: |
| Investments, from unaffiliated issuers | | | 31,510 | | | | (14,219 | ) | | | 19,359 | | | | 6,254 | |
| Foreign currency related transactions | | | 32 | | | | 13 | | | | (1 | ) | | | (54 | ) |
| Net increase (decrease) in unrealized appreciation or depreciation on: |
| Investments, from unaffiliated issuers | | | 19,344 | | | | 55,447 | | | | 26,670 | | | | 23,259 | |
| Foreign currency related transactions | | | 5 | | | | 12 | | | | 44 | | | | — | ^ |
| Net increase in net assets resulting from operations | | | 49,639 | | | | 40,049 | | | | 46,529 | | | | 30,561 | |
| DISTRIBUTIONS TO SHAREHOLDERS: |
| Investor Shares | | | — | | | | — | | | | (630 | ) | | | (654 | ) |
| Advisor Shares | | | — | | | | — | | | | (47 | ) | | | (44 | ) |
| Institutional Shares | | | — | | | | (233 | ) | | | (1,114 | ) | | | (1,376 | ) |
| Total distributions to shareholders | | | — | | | | (233 | ) | | | (1,791 | ) | | | (2,074 | ) |
| FUND SHARE ACTIVITIES: |
| Net decrease in net assets resulting from fund share activities | | | (25,815 | ) | | | (52,646 | ) | | | (49,304 | ) | | | (18,676 | ) |
| Total increase (decrease) in net assets | | | 23,824 | | | | (12,830 | ) | | | (4,566 | ) | | | 9,811 | |
| Net assets, beginning of year | | | 219,571 | | | | 232,401 | | | | 186,062 | | | | 176,251 | |
| Net assets, end of year | | $ | 243,395 | | | $ | 219,571 | | | $ | 181,496 | | | $ | 186,062 | |
| | | GLOBAL OPPORTUNITIES | | | GLOBAL UNCONSTRAINED* | |
| | | Year Ended
9/30/2024 | | | Year Ended
9/30/2023 | | | Year Ended
9/30/2024 | | | Year Ended
9/30/2023 | |
| OPERATIONS: |
| Net investment income (loss) | | $ | (7,568 | ) | | $ | (3,761 | ) | | $ | 5,520 | | | $ | 1,453 | |
| Net realized gain (loss) on: |
| Investments, from unaffiliated issuers | | | 742,723 | | | | 78,779 | | | | 1,235 | | | | 347 | |
| Foreign currency forward contracts | | | — | | | | — | | | | (355 | ) | | | 463 | |
| Foreign currency related transactions | | | 208 | | | | 38 | | | | (304 | ) | | | 68 | |
| Securities sold short | | | — | | | | — | | | | (94 | ) | | | 191 | |
| Futures contracts | | | — | | | | — | | | | (889 | ) | | | 381 | |
| Swap contracts | | | — | | | | — | | | | (921 | ) | | | (298 | ) |
| Net increase (decrease) in unrealized appreciation or depreciation on: |
| Investments, from unaffiliated issuers | | | 5,691 | | | | 371,808 | | | | 3,752 | | | | 129 | |
| Foreign currency forward contracts | | | — | | | | — | | | | (277 | ) | | | (188 | ) |
| Foreign currency related transactions | | | 56 | | | | 128 | | | | 147 | | | | (28 | ) |
| Securities sold short | | | — | | | | — | | | | (469 | ) | | | (35 | ) |
| Futures contracts | | | — | | | | — | | | | (350 | ) | | | 26 | |
| Swap contracts | | | — | | | | — | | | | (820 | ) | | | (462 | ) |
| Net increase in net assets resulting from operations | | | 741,110 | | | | 446,992 | | | | 6,175 | | | | 2,047 | |
| DISTRIBUTIONS TO SHAREHOLDERS: |
| Investor Shares | | | (16,515 | ) | | | — | | | | (327 | ) | | | (59 | ) |
| Advisor Shares | | | (11,043 | ) | | | — | | | | (3,527 | ) | | | (412 | ) |
| Institutional Shares | | | (35,857 | ) | | | — | | | | (2,140 | ) | | | (1,644 | ) |
| Total distributions to shareholders | | | (63,415 | ) | | | — | | | | (5,994 | ) | | | (2,115 | ) |
| FUND SHARE ACTIVITIES: |
| Net increase (decrease) in net assets resulting from fund share activities | | | (737,836 | ) | | | (1,003,912 | ) | | | 70,917 | | | | 32,304 | |
| Total increase (decrease) in net assets | | | (60,141 | ) | | | (556,920 | ) | | | 71,098 | | | | 32,236 | |
| Net assets, beginning of year | | | 2,617,145 | | | | 3,174,065 | | | | 47,271 | | | | 15,035 | |
| Net assets, end of year | | $ | 2,557,004 | | | $ | 2,617,145 | | | $ | 118,369 | | | $ | 47,271 | |
| * | Consolidated statement |
| ^ | Amount rounds to less than $1 |
The accompanying notes are an integral part of the financial statements.
ARTISAN PARTNERS FUNDS
Statements of Changes in Net Assets (Continued)
Dollar values in thousands
| | | GLOBAL VALUE | | | HIGH INCOME | |
| | | Year Ended
9/30/2024 | | | Year Ended
9/30/2023 | | | Year Ended
9/30/2024 | | | Year Ended
9/30/2023 | |
| OPERATIONS: |
| Net investment income | | $ | 30,939 | | | $ | 21,810 | | | $ | 619,195 | | | $ | 480,414 | |
| Net realized gain (loss) on: |
| Investments, from unaffiliated issuers | | | 97,092 | | | | 46,743 | | | | (34,521 | ) | | | (55,303 | ) |
| Foreign currency forward contracts | | | — | | | | — | | | | (154 | ) | | | (6 | ) |
| Foreign currency related transactions | | | 348 | | | | 535 | | | | 5 | | | | (449 | ) |
| Futures contracts | | | — | | | | — | | | | — | | | | 3,824 | |
| Net increase (decrease) in unrealized appreciation or depreciation on: |
| Investments, from unaffiliated issuers | | | 454,003 | | | | 430,631 | | | | 536,385 | | | | 203,334 | |
| Foreign currency forward contracts | | | — | | | | — | | | | (112 | ) | | | (74 | ) |
| Foreign currency related transactions | | | 239 | | | | 221 | | | | 5 | | | | 5 | |
| Futures contracts | | | — | | | | — | | | | — | | | | (4,289 | ) |
| Unfunded loan commitments | | | — | | | | — | | | | 9 | | | | (9 | ) |
| Net increase in net assets resulting from operations | | | 582,621 | | | | 499,940 | | | | 1,120,812 | | | | 627,447 | |
| DISTRIBUTIONS TO SHAREHOLDERS: |
| Investor Shares | | | (6,088 | ) | | | (8,029 | ) | | | (49,559 | ) | | | (57,902 | ) |
| Advisor Shares | | | (8,466 | ) | | | (10,883 | ) | | | (253,878 | ) | | | (229,274 | ) |
| Institutional Shares | | | (52,295 | ) | | | (62,232 | ) | | | (315,660 | ) | | | (232,715 | ) |
| Total distributions to shareholders | | | (66,849 | ) | | | (81,144 | ) | | | (619,097 | ) | | | (519,891 | ) |
| FUND SHARE ACTIVITIES: |
| Net increase (decrease) in net assets resulting from fund share activities | | | (57,705 | ) | | | (185,204 | ) | | | 1,164,556 | | | | 1,242,439 | |
| Total increase in net assets | | | 458,067 | | | | 233,592 | | | | 1,666,271 | | | | 1,349,995 | |
| Net assets, beginning of year | | | 2,051,717 | | | | 1,818,125 | | | | 7,159,067 | | | | 5,809,072 | |
| Net assets, end of year | | $ | 2,509,784 | | | $ | 2,051,717 | | | $ | 8,825,338 | | | $ | 7,159,067 | |
| | | INTERNATIONAL | | | INTERNATIONAL EXPLORER | |
| | | Year Ended
9/30/2024 | | | Year Ended
9/30/2023 | | | Year Ended
9/30/2024 | | | Year Ended
9/30/2023 | |
| OPERATIONS: |
| Net investment income | | $ | 45,918 | | | $ | 61,388 | | | $ | 1,288 | | | $ | 575 | |
| Net realized gain (loss) on: |
| Investments, from unaffiliated issuers | | | 418,724 | | | | 56,367 | | | | 2,474 | | | | 1,300 | |
| Foreign currency forward contracts | | | — | | | | — | | | | — | | | | (25 | ) |
| Foreign currency related transactions | | | (37 | ) | | | 280 | | | | 21 | | | | 2 | |
| Net increase (decrease) in unrealized appreciation or depreciation on: |
| Investments, from unaffiliated issuers | | | 715,754 | | | | 962,821 | | | | 14,812 | | | | 680 | |
| Investments, from affiliated issuers | | | — | | | | — | | | | 3,329 | | | | — | |
| Foreign currency related transactions | | | 1,641 | | | | 1,243 | | | | 3 | | | | (1 | ) |
| Net increase in net assets resulting from operations | | | 1,182,000 | | | | 1,082,099 | | | | 21,927 | | | | 2,531 | |
| DISTRIBUTIONS TO SHAREHOLDERS: |
| Investor Shares | | | (27,670 | ) | | | (43,596 | ) | | | — | | | | — | |
| Advisor Shares | | | (16,210 | ) | | | (23,884 | ) | | | (842 | ) | | | (8 | ) |
| Institutional Shares | | | (56,844 | ) | | | (80,781 | ) | | | (778 | ) | | | (39 | ) |
| Total distributions to shareholders | | | (100,724 | ) | | | (148,261 | ) | | | (1,620 | ) | | | (47 | ) |
| FUND SHARE ACTIVITIES: |
| Net increase (decrease) in net assets resulting from fund share activities | | | (680,964 | ) | | | (1,040,761 | ) | | | 63,153 | | | | 52,669 | |
| Total increase (decrease) in net assets | | | 400,312 | | | | (106,923 | ) | | | 83,460 | | | | 55,153 | |
| Net assets, beginning of year | | | 4,886,615 | | | | 4,993,538 | | | | 75,689 | | | | 20,536 | |
| Net assets, end of year | | $ | 5,286,927 | | | $ | 4,886,615 | | | $ | 159,149 | | | $ | 75,689 | |
The accompanying notes are an integral part of the financial statements.
ARTISAN PARTNERS FUNDS
Statements of Changes in Net Assets (Continued)
Dollar values in thousands
| | | INTERNATIONAL SMALL-MID | | | INTERNATIONAL VALUE | |
| | | Year Ended
9/30/2024 | | | Year Ended
9/30/2023 | | | Year Ended
9/30/2024 | | | Year Ended
9/30/2023 | |
| OPERATIONS: |
| Net investment income | | $ | 9,069 | | | $ | 2,278 | | | $ | 512,379 | | | $ | 343,356 | |
| Net realized gain (loss) on: |
| Investments, from unaffiliated issuers | | | 200,231 | | | | 4,446 | | | | 1,076,374 | | | | 197,465 | |
| Investments, from affiliated issuers | | | (280 | ) | | | (25,861 | ) | | | 3,001 | | | | 117,595 | |
| Foreign currency related transactions | | | 358 | | | | 410 | | | | 3,010 | | | | 1,823 | |
| Swap contracts | | | — | | | | — | | | | — | | | | 10,140 | |
| Net increase (decrease) in unrealized appreciation or depreciation on: |
| Investments, from unaffiliated issuers | | | 525,460 | | | | 516,267 | | | | 5,940,606 | | | | 5,000,364 | |
| Investments, from affiliated issuers | | | 53,485 | | | | (18,370 | ) | | | 89,591 | | | | 677,305 | |
| Foreign currency related transactions | | | 332 | | | | 550 | | | | 4,498 | | | | 3,865 | |
| Swap contracts | | | — | | | | — | | | | — | | | | 498 | |
| Net increase in net assets resulting from operations | | | 788,655 | | | | 479,720 | | | | 7,629,459 | | | | 6,352,411 | |
| DISTRIBUTIONS TO SHAREHOLDERS: |
| Investor Shares | | | — | | | | — | | | | (105,512 | ) | | | (43,449 | ) |
| Advisor Shares | | | (31 | ) | | | (297 | ) | | | (354,826 | ) | | | (104,292 | ) |
| Institutional Shares | | | (2,174 | ) | | | (3,176 | ) | | | (798,550 | ) | | | (278,867 | ) |
| Total distributions to shareholders | | | (2,205 | ) | | | (3,473 | ) | | | (1,258,888 | ) | | | (426,608 | ) |
| FUND SHARE ACTIVITIES: |
| Net increase (decrease) in net assets resulting from fund share activities | | | (118,697 | ) | | | (365,082 | ) | | | 1,705,622 | | | | 2,083,914 | |
| Total increase in net assets | | | 667,753 | | | | 111,165 | | | | 8,076,193 | | | | 8,009,717 | |
| Net assets, beginning of year | | | 4,079,728 | | | | 3,968,563 | | | | 28,140,747 | | | | 20,131,030 | |
| Net assets, end of year | | $ | 4,747,481 | | | $ | 4,079,728 | | | $ | 36,216,940 | | | $ | 28,140,747 | |
| | | MID CAP | | | MID CAP VALUE | |
| | | Year Ended
9/30/2024 | | | Year Ended
9/30/2023 | | | Year Ended
9/30/2024 | | | Year Ended
9/30/2023 | |
| OPERATIONS: |
| Net investment income (loss) | | $ | (34,810 | ) | | $ | (30,621 | ) | | $ | 10,231 | | | $ | 10,480 | |
| Net realized gain (loss) on: |
| Investments, from unaffiliated issuers | | | 598,564 | | | | (60,585 | ) | | | 155,161 | | | | 189,366 | |
| Foreign currency related transactions | | | (9 | ) | | | (63 | ) | | | — | | | | — | |
| Net increase (decrease) in unrealized appreciation or depreciation on: |
| Investments, from unaffiliated issuers | | | 127,557 | | | | 625,010 | | | | 53,400 | | | | 8,161 | |
| Foreign currency related transactions | | | 5 | | | | — | ^ | | | — | | | | — | |
| Net increase in net assets resulting from operations | | | 691,307 | | | | 533,741 | | | | 218,792 | | | | 208,007 | |
| DISTRIBUTIONS TO SHAREHOLDERS: |
| Investor Shares | | | — | | | | (3,829 | ) | | | (57,449 | ) | | | (70,676 | ) |
| Advisor Shares | | | — | | | | (2,663 | ) | | | (39,705 | ) | | | (73,203 | ) |
| Institutional Shares | | | — | | | | (10,835 | ) | | | (87,696 | ) | | | (100,129 | ) |
| Total distributions to shareholders | | | — | | | | (17,327 | ) | | | (184,850 | ) | | | (244,008 | ) |
| FUND SHARE ACTIVITIES: |
| Net decrease in net assets resulting from fund share activities | | | (862,606 | ) | | | (285,542 | ) | | | (6,330 | ) | | | (125,079 | ) |
| Total increase (decrease) in net assets | | | (171,299 | ) | | | 230,872 | | | | 27,612 | | | | (161,080 | ) |
| Net assets, beginning of year | | | 4,476,095 | | | | 4,245,223 | | | | 1,146,887 | | | | 1,307,967 | |
| Net assets, end of year | | $ | 4,304,796 | | | $ | 4,476,095 | | | $ | 1,174,499 | | | $ | 1,146,887 | |
| ^ | Amount rounds to less than $1 |
The accompanying notes are an integral part of the financial statements.
ARTISAN PARTNERS FUNDS
Statements of Changes in Net Assets (Continued)
Dollar values in thousands
| | | SELECT EQUITY | | | SMALL CAP | |
| | | Year Ended
9/30/2024 | | | Year Ended
9/30/2023 | | | Year Ended
9/30/2024 | | | Year Ended
9/30/2023 | |
| OPERATIONS: |
| Net investment income (loss) | | $ | 293 | | | $ | 196 | | | $ | (14,094 | ) | | $ | (16,140 | ) |
| Net realized gain (loss) on: |
| Investments, from unaffiliated issuers | | | 1,106 | | | | (840 | ) | | | 357,340 | | | | 13,732 | |
| Foreign currency related transactions | | | 1 | | | | — | ^ | | | — | | | | — | |
| Net increase (decrease) in unrealized appreciation or depreciation on: |
| Investments, from unaffiliated issuers | | | 10,915 | | | | 8,091 | | | | (7,256 | ) | | | 138,844 | |
| Foreign currency related transactions | | | — | ^ | | | — | ^ | | | — | | | | — | |
| Net increase in net assets resulting from operations | | | 12,315 | | | | 7,447 | | | | 335,990 | | | | 136,436 | |
| DISTRIBUTIONS TO SHAREHOLDERS: |
| Investor Shares | | | (13 | ) | | | (69 | ) | | | — | | | | (1,557 | ) |
| Advisor Shares | | | (9 | ) | | | (56 | ) | | | — | | | | (1,332 | ) |
| Institutional Shares | | | (228 | ) | | | (816 | ) | | | — | | | | (4,453 | ) |
| Total distributions to shareholders | | | (250 | ) | | | (941 | ) | | | — | | | | (7,342 | ) |
| FUND SHARE ACTIVITIES: |
| Net increase (decrease) in net assets resulting from fund share activities | | | 3,045 | | | | 941 | | | | (567,892 | ) | | | (319,960 | ) |
| Total increase (decrease) in net assets | | | 15,110 | | | | 7,447 | | | | (231,902 | ) | | | (190,866 | ) |
| Net assets, beginning of year | | | 37,003 | | | | 29,556 | | | | 1,624,661 | | | | 1,815,527 | |
| Net assets, end of year | | $ | 52,113 | | | $ | 37,003 | | | $ | 1,392,759 | | | $ | 1,624,661 | |
| | | SUSTAINABLE EMERGING
MARKETS | | | VALUE | |
| | | Year Ended
9/30/2024 | | | Year Ended
9/30/2023 | | | Year Ended
9/30/2024 | | | Year Ended
9/30/2023 | |
| OPERATIONS: |
| Net investment income | | $ | 1,936 | | | $ | 1,144 | | | $ | 4,517 | | | $ | 2,960 | |
| Net realized gain (loss) on: |
| Investments, from unaffiliated issuers | | | (2,272 | ) | | | (11,517 | ) | | | 29,702 | | | | 18,728 | |
| Foreign currency related transactions | | | (24 | ) | | | (60 | ) | | | 63 | | | | (16 | ) |
| Net increase (decrease) in unrealized appreciation or depreciation on: |
| Investments, from unaffiliated issuers | | | 32,093 | | | | 23,648 | | | | 37,452 | | | | 40,475 | |
| Foreign currency related transactions | | | 8 | | | | 26 | | | | 8 | | | | 3 | |
| Net increase in net assets resulting from operations | | | 31,741 | | | | 13,241 | | | | 71,742 | | | | 62,150 | |
| DISTRIBUTIONS TO SHAREHOLDERS: |
| Investor Shares | | | (60 | ) | | | (112 | ) | | | (4,354 | ) | | | (13,355 | ) |
| Advisor Shares | | | (202 | ) | | | (277 | ) | | | (4,951 | ) | | | (9,301 | ) |
| Institutional Shares | | | (363 | ) | | | (277 | ) | | | (7,352 | ) | | | (16,019 | ) |
| Total distributions to shareholders | | | (625 | ) | | | (666 | ) | | | (16,657 | ) | | | (38,675 | ) |
| FUND SHARE ACTIVITIES: |
| Net increase (decrease) in net assets resulting from fund share activities | | | 42,737 | | | | 20,196 | | | | (2,231 | ) | | | 45,132 | |
| Total increase in net assets | | | 73,853 | | | | 32,771 | | | | 52,854 | | | | 68,607 | |
| Net assets, beginning of year | | | 95,502 | | | | 62,731 | | | | 295,702 | | | | 227,095 | |
| Net assets, end of year | | $ | 169,355 | | | $ | 95,502 | | | $ | 348,556 | | | $ | 295,702 | |
| ^ | Amount rounds to less than $1 |
The accompanying notes are an integral part of the financial statements.
ARTISAN PARTNERS FUNDS
Statements of Changes in Net Assets (Continued)
Dollar values in thousands
| | | VALUE INCOME | |
| | | Year Ended
9/30/2024 | | | Year Ended
9/30/2023 | |
| OPERATIONS: |
| Net investment income | | $ | 417 | | | $ | 303 | |
| Net realized gain (loss) on: |
| Investments, from unaffiliated issuers | | | 191 | | | | (511 | ) |
| Foreign currency related transactions | | | 2 | | | | (1 | ) |
| Written options | | | 29 | | | | 19 | |
| Net increase (decrease) in unrealized appreciation or depreciation on: |
| Investments, from unaffiliated issuers | | | 2,598 | | | | 1,135 | |
| Foreign currency related transactions | | | — | ^ | | | — | ^ |
| Written options | | | (7 | ) | | | 5 | |
| Net increase in net assets resulting from operations | | | 3,230 | | | | 950 | |
| DISTRIBUTIONS TO SHAREHOLDERS: |
| Investor Shares | | | (25 | ) | | | (18 | ) |
| Advisor Shares | | | (55 | ) | | | (44 | ) |
| Institutional Shares | | | (318 | ) | | | (240 | ) |
| Total distributions to shareholders | | | (398 | ) | | | (302 | ) |
| FUND SHARE ACTIVITIES: |
| Net increase in net assets resulting from fund share activities | | | 2,468 | | | | 1,332 | |
| Total increase in net assets | | | 5,300 | | | | 1,980 | |
| Net assets, beginning of year | | | 11,086 | | | | 9,106 | |
| Net assets, end of year | | $ | 16,386 | | | $ | 11,086 | |
| ^ | Amount rounds to less than $1 |
The accompanying notes are an integral part of the financial statements.
ARTISAN PARTNERS FUNDS
Financial Highlights — For a share outstanding throughout each period
| | | | | | | Less Distributions From | | | | | | | | | |
| | Net Asset Value, Beginning of Period | Net Investment Income (Loss)(1) | Net Realized and Unrealized Gain (Loss) on Investments | Total from Operations | Net Investment Income | Net Realized Gains | Total Distributions | Net Asset Value, End of Period | Total Return(2) | Net Assets, End of Period (000) | Ratio of Expenses to Average Net Assets(3)(4) | Ratio of Expenses to Average Net Assets Excluding Waivers(3) | Ratio of Net Investment Income (Loss) to Average Net
Assets(3)(4) | Portfolio Turnover Rate(2) |
| DEVELOPING WORLD |
| Investor Shares |
| 9/30/2024 | $ | 14.84 | (0.11) | 6.43 | 6.32 | — | — | — | $ | 21.16 | 42.59% | $ | 348,562 | 1.31% | n/a | (0.64)% | 60.10% |
| 9/30/2023 | $ | 12.12 | (0.11) | 2.85 | 2.74 | (0.02) | — | (0.02) | $ | 14.84 | 22.60% | $ | 281,835 | 1.30% | n/a | (0.74)% | 67.53% |
| 9/30/2022 | $ | 25.55 | (0.17) | (11.19) | (11.36) | — | (2.07) | (2.07) | $ | 12.12 | (48.39)% | $ | 349,016 | 1.28% | n/a | (0.92)% | 87.26% |
| 9/30/2021 | $ | 22.98 | (0.29) | 3.97 | 3.68 | — | (1.11) | (1.11) | $ | 25.55 | 16.15% | $ | 899,701 | 1.26% | n/a | (1.09)% | 126.20% |
| 9/30/2020 | $ | 13.44 | (0.17) | 9.71 | 9.54 | — | — | — | $ | 22.98 | 71.06% | $ | 643,044 | 1.28% | n/a | (0.96)% | 138.63% |
| Advisor Shares |
| 9/30/2024 | $ | 14.98 | (0.08) | 6.51 | 6.43 | — | — | — | $ | 21.41 | 42.86% | $ | 1,716,768 | 1.13% | n/a | (0.46)% | 60.10% |
| 9/30/2023 | $ | 12.25 | (0.08) | 2.86 | 2.78 | (0.05) | — | (0.05) | $ | 14.98 | 22.80% | $ | 1,318,082 | 1.13% | n/a | (0.56)% | 67.53% |
| 9/30/2022 | $ | 25.77 | (0.14) | (11.31) | (11.45) | — | (2.07) | (2.07) | $ | 12.25 | (48.32)% | $ | 1,620,067 | 1.11% | n/a | (0.75)% | 87.26% |
| 9/30/2021 | $ | 23.13 | (0.24) | 3.99 | 3.75 | — | (1.11) | (1.11) | $ | 25.77 | 16.35% | $ | 4,648,125 | 1.09% | n/a | (0.92)% | 126.20% |
| 9/30/2020 | $ | 13.51 | (0.14) | 9.76 | 9.62 | — | — | — | $ | 23.13 | 71.28% | $ | 3,513,504 | 1.13% | n/a | (0.81)% | 138.63% |
| Institutional Shares |
| 9/30/2024 | $ | 15.07 | (0.07) | 6.55 | 6.48 | — | — | — | $ | 21.55 | 43.00% | $ | 1,542,385 | 1.05% | n/a | (0.38)% | 60.10% |
| 9/30/2023 | $ | 12.33 | (0.07) | 2.88 | 2.81 | (0.07) | — | (0.07) | $ | 15.07 | 22.88% | $ | 1,209,431 | 1.05% | n/a | (0.48)% | 67.53% |
| 9/30/2022 | $ | 25.90 | (0.12) | (11.38) | (11.50) | — | (2.07) | (2.07) | $ | 12.33 | (48.27)% | $ | 1,282,523 | 1.03% | n/a | (0.66)% | 87.26% |
| 9/30/2021 | $ | 23.22 | (0.22) | 4.01 | 3.79 | — | (1.11) | (1.11) | $ | 25.90 | 16.46% | $ | 3,178,364 | 1.00% | n/a | (0.83)% | 126.20% |
| 9/30/2020 | $ | 13.55 | (0.13) | 9.80 | 9.67 | —(5) | — | —(5) | $ | 23.22 | 71.45% | $ | 2,475,795 | 1.04% | n/a | (0.72)% | 138.63% |
| EMERGING MARKETS DEBT OPPORTUNITIES |
| Investor Shares |
| 9/30/2024 | $ | 10.14 | 0.79 | 0.60 | 1.39 | (0.89) | (0.21) | (1.10) | $ | 10.43 | 14.60% | $ | 3,744 | 1.28%* | 3.22%* | 7.67% | 101.04% |
| 9/30/2023 | $ | 9.60 | 0.68 | 0.81 | 1.49 | (0.72) | (0.23) | (0.95) | $ | 10.14 | 16.01% | $ | 2,646 | 1.30%* | 8.04%* | 6.64% | 147.67% |
| 4/7/2022 (commencement) - 9/30/2022 | $ | 10.00 | 0.24 | (0.41) | (0.17) | (0.23) | — | (0.23) | $ | 9.60 | (1.72)% | $ | 88 | 1.25% | 170.55% | 5.07% | 38.16% |
| Advisor Shares |
| 9/30/2024 | $ | 10.14 | 0.80 | 0.59 | 1.39 | (0.90) | (0.21) | (1.11) | $ | 10.42 | 14.61% | $ | 24,074 | 1.18%* | 1.85%* | 7.82% | 101.04% |
| 9/30/2023 | $ | 9.60 | 0.70 | 0.80 | 1.50 | (0.73) | (0.23) | (0.96) | $ | 10.14 | – | $ | 9,466 | 1.20%* | 2.99%* | 6.80% | 147.67% |
| 4/7/2022 (commencement) - 9/30/2022 | $ | 10.00 | 0.24 | (0.41) | (0.17) | (0.23) | — | (0.23) | $ | 9.60 | (1.78)% | $ | 433 | 1.15% | 28.37% | 5.02% | 38.16% |
| Institutional Shares |
| 9/30/2024 | $ | 10.15 | 0.81 | 0.59 | 1.40 | (0.91) | (0.21) | (1.12) | $ | 10.43 | 14.68% | $ | 47,771 | 1.13%* | 1.64%* | 7.91% | 101.04% |
| 9/30/2023 | $ | 9.60 | 0.71 | 0.81 | 1.52 | (0.74) | (0.23) | (0.97) | $ | 10.15 | – | $ | 24,197 | 1.13%* | 1.97%* | 6.99% | 147.67% |
| 4/7/2022 (commencement) - 9/30/2022 | $ | 10.00 | 0.23 | (0.39) | (0.16) | (0.24) | — | (0.24) | $ | 9.60 | (1.65)% | $ | 20,678 | 1.10% | 1.57% | 4.84% | 38.16% |
ARTISAN PARTNERS FUNDS
Financial Highlights — For a share outstanding throughout each period
| | | | | | | Less Distributions From | | | | | | | | | |
| | Net Asset Value, Beginning of Period | Net Investment Income (Loss)(1) | Net Realized and Unrealized Gain (Loss) on Investments | Total from Operations | Net Investment Income | Net Realized Gains | Return of Capital | Total Distributions | Net Asset Value, End of Period | Total Return(2) | Net Assets, End of Period (000) | Ratio of Expenses to Average Net Assets(3)(4) | Ratio of Expenses to Average Net Assets Excluding Waivers(3) | Ratio of Net Investment Income (Loss) to Average Net
Assets(3)(4) | Portfolio Turnover Rate(2) |
| FLOATING RATE |
| Investor Shares |
| 9/30/2024 | $ | 9.68 | 0.84 | (0.09) | 0.75 | (0.82) | — | (0.03) | (0.85) | $ | 9.58 | 8.09% | $ | 12,805 | 1.20% | 1.78% | 8.76% | 72.77% |
| 9/30/2023 | $ | 9.30 | 0.82 | 0.38 | 1.20 | (0.82) | — | — | (0.82) | $ | 9.68 | 12.97% | $ | 5,590 | 1.20% | 2.74% | 8.63% | 76.50% |
| 12/1/2021 (commencement) - 9/30/2022 | $ | 10.00 | 0.32 | (0.72) | (0.40) | (0.30) | — | — | (0.30) | $ | 9.30 | (4.17)% | $ | 2,451 | 1.20% | 7.19% | 4.02% | 48.90% |
| Advisor Shares |
| 9/30/2024 | $ | 9.68 | 0.85 | (0.09) | 0.76 | (0.83) | — | (0.03) | (0.86) | $ | 9.58 | 8.09% | $ | 24,111 | 1.10% | 1.45% | 8.89% | 72.77% |
| 9/30/2023 | $ | 9.30 | 0.82 | 0.40 | 1.22 | (0.84) | — | — | (0.84) | $ | 9.68 | 13.09% | $ | 18,031 | 1.10% | 1.57% | 8.66% | 76.50% |
| 12/1/2021 (commencement) - 9/30/2022 | $ | 10.00 | 0.33 | (0.72) | (0.39) | (0.31) | — | — | (0.31) | $ | 9.30 | (4.09)% | $ | 16,705 | 1.10% | 1.61% | 4.16% | 48.90% |
| Institutional Shares |
| 9/30/2024 | $ | 9.68 | 0.86 | (0.09) | 0.77 | (0.84) | — | (0.03) | (0.87) | $ | 9.58 | 8.15% | $ | 35,899 | 1.05% | 1.27% | 8.95% | 72.77% |
| 9/30/2023 | $ | 9.30 | 0.82 | 0.40 | 1.22 | (0.84) | — | — | (0.84) | $ | 9.68 | 13.15% | $ | 28,544 | 1.05% | 1.36% | 8.73% | 76.50% |
| 12/1/2021 (commencement) - 9/30/2022 | $ | 10.00 | 0.33 | (0.72) | (0.39) | (0.31) | — | — | (0.31) | $ | 9.30 | (4.07)% | $ | 28,077 | 1.05% | 1.27% | 4.10% | 48.90% |
| FOCUS | | | | | | | | | | | | | | | | | | |
| Investor Shares |
| 9/30/2024 | $ | 16.43 | —(5) | 7.20 | 7.20 | — | — | — | — | $ | 23.63 | 43.76% | $ | 42,763 | 1.29% | n/a | 0.02% | 401.50% |
| 9/30/2023 | $ | 15.19 | (0.02) | 1.31 | 1.29 | (0.05) | — | — | (0.05) | $ | 16.43 | 8.57% | $ | 47,959 | 1.30% | n/a | (0.14)% | 271.28% |
| 9/30/2022 | $ | 22.30 | (0.06) | (3.61) | (3.67) | — | (3.44) | — | (3.44) | $ | 15.19 | (20.76)% | $ | 237,102 | 1.24% | n/a | (0.31)% | 240.40% |
| 9/30/2021 | $ | 18.34 | (0.11) | 4.73 | 4.62 | — | (0.66) | — | (0.66) | $ | 22.30 | 25.70% | $ | 340,450 | 1.25% | n/a | (0.52)% | 316.74% |
| 9/30/2020 | $ | 15.63 | (0.06) | 3.35 | 3.29 | (0.04) | (0.54) | — | (0.58) | $ | 18.34 | 21.76% | $ | 262,246 | 1.30% | n/a | (0.39)% | 285.25% |
| Advisor Shares |
| 9/30/2024 | $ | 16.52 | 0.03 | 7.24 | 7.27 | — | — | — | — | $ | 23.79 | 43.95% | $ | 677,071 | 1.14% | n/a | 0.13% | 401.50% |
| 9/30/2023 | $ | 15.25 | 0.01 | 1.34 | 1.35 | (0.08) | — | — | (0.08) | $ | 16.52 | 8.83% | $ | 517,439 | 1.12% | n/a | 0.06% | 271.28% |
| 9/30/2022 | $ | 22.36 | (0.03) | (3.64) | (3.67) | — | (3.44) | — | (3.44) | $ | 15.25 | (20.60)% | $ | 817,890 | 1.10% | n/a | (0.17)% | 240.40% |
| 9/30/2021 | $ | 18.36 | (0.08) | 4.74 | 4.66 | — | (0.66) | — | (0.66) | $ | 22.36 | 25.84% | $ | 1,219,909 | 1.10% | n/a | (0.36)% | 316.74% |
| 9/30/2020 | $ | 15.66 | (0.04) | 3.35 | 3.31 | (0.07) | (0.54) | — | (0.61) | $ | 18.36 | 21.98% | $ | 735,871 | 1.13% | n/a | (0.26)% | 285.25% |
| Institutional Shares |
| 9/30/2024 | $ | 16.56 | 0.05 | 7.26 | 7.31 | — | — | — | — | $ | 23.87 | 44.08% | $ | 441,168 | 1.05% | n/a | 0.24% | 401.50% |
| 9/30/2023 | $ | 15.30 | 0.03 | 1.33 | 1.36 | (0.10) | — | — | (0.10) | $ | 16.56 | 8.94% | $ | 356,438 | 1.03% | n/a | 0.15% | 271.28% |
| 9/30/2022 | $ | 22.40 | (0.02) | (3.64) | (3.66) | — | (3.44) | — | (3.44) | $ | 15.30 | (20.56)% | $ | 553,450 | 1.01% | n/a | (0.08)% | 240.40% |
| 9/30/2021 | $ | 18.37 | (0.06) | 4.75 | 4.69 | — | (0.66) | — | (0.66) | $ | 22.40 | 25.93% | $ | 738,016 | 1.01% | n/a | (0.27)% | 316.74% |
| 2/3/2020 (commencement) - 9/30/2020 | $ | 16.37 | (0.01) | 2.01 | 2.00 | — | — | — | — | $ | 18.37 | 12.28% | $ | 437,948 | 1.04% | n/a | (0.14)% | 285.25% |
ARTISAN PARTNERS FUNDS
Financial Highlights — For a share outstanding throughout each period
| | | | | | | Less Distributions From | | | | | | | | | |
| | Net Asset Value, Beginning of Period | Net Investment Income (Loss)(1) | Net Realized and Unrealized Gain (Loss) on Investments | Total from Operations | Net Investment Income | Net Realized Gains | Total Distributions | Net Asset Value, End of Period | Total Return(2) | Net Assets, End of Period (000) | Ratio of Expenses to Average Net Assets(3)(4) | Ratio of Expenses to Average Net Assets Excluding Waivers(3) | Ratio of Net Investment Income (Loss) to Average Net
Assets(3)(4) | Portfolio Turnover Rate(2) |
| GLOBAL DISCOVERY |
| Investor Shares |
| 9/30/2024 | $ | 16.53 | (0.15) | 4.23 | 4.08 | — | — | — | $ | 20.61 | 24.68% | $ | 33,480 | 1.40% | 1.44% | (0.80)% | 58.22% |
| 9/30/2023 | $ | 14.15 | (0.12) | 2.50 | 2.38 | — | — | — | $ | 16.53 | 16.82% | $ | 32,117 | 1.40% | 1.43% | (0.76)% | 50.02% |
| 9/30/2022 | $ | 23.07 | (0.17) | (7.02) | (7.19) | — | (1.73) | (1.73) | $ | 14.15 | (33.87)% | $ | 36,925 | 1.38% | n/a | (0.91)% | 59.23% |
| 9/30/2021 | $ | 18.40 | (0.20) | 5.27 | 5.07 | — | (0.40) | (0.40) | $ | 23.07 | 27.93% | $ | 63,547 | 1.38% | n/a | (0.96)% | 47.02% |
| 9/30/2020 | $ | 13.39 | (0.13) | 5.14 | 5.01 | — | — | — | $ | 18.40 | 37.42% | $ | 106,480 | 1.35% | n/a | (0.89)% | 40.44% |
| Advisor Shares |
| 9/30/2024 | $ | 16.58 | (0.13) | 4.25 | 4.12 | — | — | — | $ | 20.70 | 24.85% | $ | 18,701 | 1.30% | 1.41% | (0.70)% | 58.22% |
| 9/30/2023 | $ | 14.18 | (0.10) | 2.50 | 2.40 | — | — | — | $ | 16.58 | 16.93% | $ | 17,886 | 1.30% | 1.41% | (0.61)% | 50.02% |
| 9/30/2022 | $ | 23.09 | (0.16) | (7.02) | (7.18) | — | (1.73) | (1.73) | $ | 14.18 | (33.79)% | $ | 13,438 | 1.30% | 1.41% | (0.84)% | 59.23% |
| 9/30/2021 | $ | 18.41 | (0.19) | 5.27 | 5.08 | — | (0.40) | (0.40) | $ | 23.09 | 27.97% | $ | 19,954 | 1.30% | 1.40% | (0.88)% | 47.02% |
| 2/3/2020 (commencement) - 9/30/2020 | $ | 14.96 | (0.08) | 3.53 | 3.45 | — | — | — | $ | 18.41 | 23.06% | $ | 19,698 | 1.30% | 1.74% | (0.73)% | 40.44% |
| Institutional Shares |
| 9/30/2024 | $ | 16.68 | (0.09) | 4.27 | 4.18 | — | — | — | $ | 20.86 | 25.06% | $ | 191,214 | 1.09% | n/a | (0.49)% | 58.22% |
| 9/30/2023 | $ | 14.25 | (0.07) | 2.52 | 2.45 | (0.02) | — | (0.02) | $ | 16.68 | 17.19% | $ | 169,568 | 1.09% | n/a | (0.42)% | 50.02% |
| 9/30/2022 | $ | 23.15 | (0.11) | (7.06) | (7.17) | — | (1.73) | (1.73) | $ | 14.25 | (33.65)% | $ | 182,038 | 1.06% | n/a | (0.58)% | 59.23% |
| 9/30/2021 | $ | 18.41 | (0.14) | 5.28 | 5.14 | — | (0.40) | (0.40) | $ | 23.15 | 28.30% | $ | 270,640 | 1.08% | n/a | (0.63)% | 47.02% |
| 2/3/2020 (commencement) - 9/30/2020 | $ | 14.96 | (0.07) | 3.52 | 3.45 | — | — | — | $ | 18.41 | 23.06% | $ | 84,267 | 1.20% | n/a | (0.62)% | 40.44% |
| GLOBAL EQUITY |
| Investor Shares |
| 9/30/2024 | $ | 16.48 | 0.02 | 5.07 | 5.09 | (0.16) | — | (0.16) | $ | 21.41 | 31.12% | $ | 74,466 | 1.35% | n/a | 0.11% | 136.55% |
| 9/30/2023 | $ | 14.19 | 0.07 | 2.36 | 2.43 | (0.14) | — | (0.14) | $ | 16.48 | 17.16% | $ | 66,468 | 1.30% | n/a | 0.40% | 131.91% |
| 9/30/2022 | $ | 24.46 | 0.06 | (6.59) | (6.53) | — | (3.74) | (3.74) | $ | 14.19 | (31.48)% | $ | 66,270 | 1.28% | n/a | 0.33% | 92.81% |
| 9/30/2021 | $ | 23.03 | (0.11) | 4.33 | 4.22 | — | (2.79) | (2.79) | $ | 24.46 | 19.70% | $ | 151,122 | 1.26% | n/a | (0.47)% | 119.10% |
| 9/30/2020 | $ | 20.60 | (0.05) | 4.26 | 4.21 | — | (1.78) | (1.78) | $ | 23.03 | 21.90% | $ | 134,498 | 1.26% | n/a | (0.27)% | 137.93% |
| Advisor Shares |
| 9/30/2024 | $ | 16.49 | 0.04 | 5.06 | 5.10 | (0.17) | — | (0.17) | $ | 21.42 | 31.20% | $ | 4,387 | 1.25% | 2.09% | 0.21% | 136.55% |
| 9/30/2023 | $ | 14.19 | 0.08 | 2.37 | 2.45 | (0.15) | — | (0.15) | $ | 16.49 | 17.26% | $ | 4,462 | 1.25% | 1.79% | 0.46% | 131.91% |
| 9/30/2022 | $ | 24.46 | 0.03 | (6.56) | (6.53) | — | (3.74) | (3.74) | $ | 14.19 | (31.48)% | $ | 4,027 | 1.25% | 1.61% | 0.14% | 92.81% |
| 9/30/2021 | $ | 23.04 | (0.11) | 4.32 | 4.21 | — | (2.79) | (2.79) | $ | 24.46 | 19.64% | $ | 14,273 | 1.25% | 1.62% | (0.46)% | 119.10% |
| 8/5/2020 (commencement) - 9/30/2020 | $ | 22.81 | (0.02) | 0.25 | 0.23 | — | — | — | $ | 23.04 | 1.01% | $ | 13,092 | 1.25% | 2.51% | (0.53)% | 137.93% |
| Institutional Shares |
| 9/30/2024 | $ | 16.73 | 0.07 | 5.15 | 5.22 | (0.21) | — | (0.21) | $ | 21.74 | 31.47% | $ | 102,643 | 1.09% | n/a | 0.37% | 136.55% |
| 9/30/2023 | $ | 14.40 | 0.11 | 2.41 | 2.52 | (0.19) | — | (0.19) | $ | 16.73 | 17.52% | $ | 115,132 | 1.04% | n/a | 0.67% | 131.91% |
| 9/30/2022 | $ | 24.72 | 0.13 | (6.71) | (6.58) | — | (3.74) | (3.74) | $ | 14.40 | (31.34)% | $ | 105,954 | 1.04% | n/a | 0.72% | 92.81% |
| 9/30/2021 | $ | 23.21 | (0.06) | 4.36 | 4.30 | — | (2.79) | (2.79) | $ | 24.72 | 19.91% | $ | 168,343 | 1.05% | n/a | (0.24)% | 119.10% |
| 9/30/2020 | $ | 20.71 | (0.03) | 4.32 | 4.29 | (0.01) | (1.78) | (1.79) | $ | 23.21 | 22.17% | $ | 109,307 | 1.05% | n/a | (0.12)% | 137.93% |
ARTISAN PARTNERS FUNDS
Financial Highlights — For a share outstanding throughout each period
| | | | | | | Less Distributions From | | | | | | | | | |
| | Net Asset Value, Beginning of Period | Net Investment Income (Loss)(1) | Net Realized and Unrealized Gain (Loss) on Investments | Total from Operations | Net Investment Income | Net Realized Gains | Total Distributions | Net Asset Value, End of Period | Total Return(2) | Net Assets, End of Period (000) | Ratio of Expenses to Average Net Assets(3)(4) | Ratio of Expenses to Average Net Assets Excluding Waivers(3) | Ratio of Net Investment Income (Loss) to Average Net
Assets(3)(4) | Portfolio Turnover Rate(2) |
| GLOBAL OPPORTUNITIES |
| Investor Shares |
| 9/30/2024 | $ | 28.01 | (0.14) | 8.96 | 8.82 | — | (0.71) | (0.71) | $ | 36.12 | 32.13% | $ | 707,994 | 1.18% | n/a | (0.44)% | 52.39% |
| 9/30/2023 | $ | 24.32 | (0.08) | 3.77 | 3.69 | — | — | — | $ | 28.01 | 15.17% | $ | 680,672 | 1.14% | n/a | (0.28)% | 34.14% |
| 9/30/2022 | $ | 39.09 | (0.08) | (10.71) | (10.79) | — | (3.98) | (3.98) | $ | 24.32 | (31.13)% | $ | 782,904 | 1.14% | n/a | (0.26)% | 37.32% |
| 9/30/2021 | $ | 34.89 | (0.10) | 6.70 | 6.60 | — | (2.40) | (2.40) | $ | 39.09 | 19.89% | $ | 1,514,576 | 1.13% | n/a | (0.27)% | 44.44% |
| 9/30/2020 | $ | 27.06 | (0.06) | 9.80 | 9.74 | — | (1.91) | (1.91) | $ | 34.89 | 38.37% | $ | 1,358,867 | 1.14% | n/a | (0.23)% | 44.27% |
| Advisor Shares |
| 9/30/2024 | $ | 28.34 | (0.10) | 9.07 | 8.97 | — | (0.71) | (0.71) | $ | 36.60 | 32.28% | $ | 517,357 | 1.05% | n/a | (0.30)% | 52.39% |
| 9/30/2023 | $ | 24.57 | (0.05) | 3.82 | 3.77 | — | — | — | $ | 28.34 | 15.34% | $ | 466,663 | 1.01% | n/a | (0.16)% | 34.14% |
| 9/30/2022 | $ | 39.40 | (0.04) | (10.81) | (10.85) | — | (3.98) | (3.98) | $ | 24.57 | (31.03)% | $ | 625,332 | 1.00% | n/a | (0.13)% | 37.32% |
| 9/30/2021 | $ | 35.10 | (0.05) | 6.75 | 6.70 | — | (2.40) | (2.40) | $ | 39.40 | 20.07% | $ | 1,253,950 | 0.99% | n/a | (0.12)% | 44.44% |
| 9/30/2020 | $ | 27.21 | (0.03) | 9.86 | 9.83 | (0.03) | (1.91) | (1.94) | $ | 35.10 | 38.52% | $ | 957,127 | 1.01% | n/a | (0.09)% | 44.27% |
| Institutional Shares |
| 9/30/2024 | $ | 28.78 | (0.07) | 9.23 | 9.16 | — | (0.71) | (0.71) | $ | 37.23 | 32.45% | $ | 1,331,653 | 0.94% | n/a | (0.21)% | 52.39% |
| 9/30/2023 | $ | 24.93 | (0.01) | 3.86 | 3.85 | — | — | — | $ | 28.78 | 15.44% | $ | 1,469,810 | 0.91% | n/a | (0.05)% | 34.14% |
| 9/30/2022 | $ | 39.89 | (0.01) | (10.97) | (10.98) | — | (3.98) | (3.98) | $ | 24.93 | (30.97)% | $ | 1,765,829 | 0.90% | n/a | (0.03)% | 37.32% |
| 9/30/2021 | $ | 35.47 | (0.01) | 6.83 | 6.82 | — | (2.40) | (2.40) | $ | 39.89 | 20.20% | $ | 2,970,987 | 0.89% | n/a | (0.03)% | 44.44% |
| 9/30/2020 | $ | 27.47 | —(5) | 9.96 | 9.96 | (0.05) | (1.91) | (1.96) | $ | 35.47 | 38.67% | $ | 2,466,599 | 0.90% | n/a | 0.01% | 44.27% |
| GLOBAL UNCONSTRAINED |
| Investor Shares |
| 9/30/2024 | $ | 10.04 | 0.71 | 0.13 | 0.84 | (0.61) | (0.19) | (0.80) | $ | 10.08 | 8.87% | $ | 10,710 | 1.63%(6)* | 3.43%* | 7.01% | 68.63% |
| 9/30/2023 | $ | 10.10 | 0.58 | 0.44 | 1.02 | (0.86) | (0.22) | (1.08) | $ | 10.04 | 10.82% | $ | 1,064 | 2.09%* | 9.88%* | 5.81% | 158.84% |
| 3/31/2022 (commencement) - 9/30/2022 | $ | 10.00 | 0.17 | 0.04 | 0.21 | (0.11) | — | (0.11) | $ | 10.10 | 2.10% | $ | 466 | 1.75%* | 54.50%* | 3.28% | 40.30% |
| Advisor Shares |
| 9/30/2024 | $ | 10.05 | 0.70 | 0.15 | 0.85 | (0.62) | (0.19) | (0.81) | $ | 10.09 | 8.87% | $ | 75,963 | 1.58%(6)* | 2.03%* | 6.92% | 68.63% |
| 9/30/2023 | $ | 10.11 | 0.57 | 0.46 | 1.03 | (0.87) | (0.22) | (1.09) | $ | 10.05 | 10.87% | $ | 22,848 | 1.88%* | 3.31%* | 5.67% | 158.84% |
| 3/31/2022 (commencement) - 9/30/2022 | $ | 10.00 | 0.18 | 0.04 | 0.22 | (0.11) | — | (0.11) | $ | 10.11 | 2.24% | $ | 2,011 | 1.62%* | 9.54%* | 3.66% | 40.30% |
| Institutional Shares |
| 9/30/2024 | $ | 10.05 | 0.68 | 0.18 | 0.86 | (0.63) | (0.19) | (0.82) | $ | 10.09 | 8.92% | $ | 31,696 | 1.60%(6)* | 2.06%* | 6.77% | 68.63% |
| 9/30/2023 | $ | 10.11 | 0.60 | 0.44 | 1.04 | (0.88) | (0.22) | (1.10) | $ | 10.05 | 10.97% | $ | 23,359 | 1.92%* | 2.91%* | 6.02% | 158.84% |
| 3/31/2022 (commencement) - 9/30/2022 | $ | 10.00 | 0.14 | 0.09 | 0.23 | (0.12) | — | (0.12) | $ | 10.11 | 2.27% | $ | 12,558 | 1.48%* | 2.57%* | 2.82% | 40.30% |
ARTISAN PARTNERS FUNDS
Financial Highlights — For a share outstanding throughout each period
| | | | | | | Less Distributions From | | | | | | | | | |
| | Net Asset Value, Beginning of Period | Net Investment Income(1) | Net Realized and Unrealized Gain (Loss) on Investments | Total from Operations | Net Investment Income | Net Realized Gains | Total Distributions | Net Asset Value, End of Period | Total Return(2) | Net Assets, End of Period (000) | Ratio of Expenses to Average Net Assets(3)(4) | Ratio of Expenses to Average Net Assets Excluding Waivers(3) | Ratio of Net Investment Income to Average Net
Assets(3)(4) | Portfolio Turnover Rate(2) |
| GLOBAL VALUE | | | | | |
| Investor Shares | | | | | |
| 9/30/2024 | $ | 19.22 | 0.25 | 5.24 | 5.49 | (0.16) | (0.44) | (0.60) | $ | 24.11 | 29.24% | $ | 241,559 | 1.26% | n/a | 1.13% | 16.35% |
| 9/30/2023 | $ | 15.56 | 0.16 | 4.15 | 4.31 | (0.05) | (0.60) | (0.65) | $ | 19.22 | 28.28% | $ | 209,160 | 1.26% | n/a | 0.86% | 13.77% |
| 9/30/2022 | $ | 21.58 | 0.16 | (4.26) | (4.10) | (0.19) | (1.73) | (1.92) | $ | 15.56 | (21.10)% | $ | 199,274 | 1.25% | n/a | 0.83% | 24.37% |
| 9/30/2021 | $ | 15.94 | 0.17 | 5.48 | 5.65 | (0.01) | — | (0.01) | $ | 21.58 | 35.46% | $ | 287,469 | 1.24% | n/a | 0.80% | 39.62% |
| 9/30/2020 | $ | 17.12 | 0.07 | (1.01) | (0.94) | (0.24) | — | (0.24) | $ | 15.94 | (5.63)% | $ | 242,744 | 1.26% | n/a | 0.42% | 37.09% |
| Advisor Shares | | | | | |
| 9/30/2024 | $ | 19.20 | 0.29 | 5.22 | 5.51 | (0.19) | (0.44) | (0.63) | $ | 24.08 | 29.43% | $ | 337,314 | 1.11% | n/a | 1.31% | 16.35% |
| 9/30/2023 | $ | 15.55 | 0.18 | 4.15 | 4.33 | (0.08) | (0.60) | (0.68) | $ | 19.20 | 28.46% | $ | 254,503 | 1.11% | n/a | 0.99% | 13.77% |
| 9/30/2022 | $ | 21.57 | 0.19 | (4.26) | (4.07) | (0.22) | (1.73) | (1.95) | $ | 15.55 | (21.01)% | $ | 254,970 | 1.11% | n/a | 0.97% | 24.37% |
| 9/30/2021 | $ | 15.91 | 0.19 | 5.49 | 5.68 | (0.02) | — | (0.02) | $ | 21.57 | 35.70% | $ | 324,013 | 1.10% | n/a | 0.95% | 39.62% |
| 9/30/2020 | $ | 17.09 | 0.09 | (1.01) | (0.92) | (0.26) | — | (0.26) | $ | 15.91 | (5.48)% | $ | 259,859 | 1.12% | n/a | 0.54% | 37.09% |
| Institutional Shares | | | | | |
| 9/30/2024 | $ | 19.26 | 0.30 | 5.25 | 5.55 | (0.21) | (0.44) | (0.65) | $ | 24.16 | 29.55% | $ | 1,930,911 | 1.01% | n/a | 1.38% | 16.35% |
| 9/30/2023 | $ | 15.60 | 0.20 | 4.16 | 4.36 | (0.10) | (0.60) | (0.70) | $ | 19.26 | 28.58% | $ | 1,588,054 | 1.01% | n/a | 1.11% | 13.77% |
| 9/30/2022 | $ | 21.63 | 0.21 | (4.27) | (4.06) | (0.24) | (1.73) | (1.97) | $ | 15.60 | (20.92)% | $ | 1,363,881 | 1.01% | n/a | 1.07% | 24.37% |
| 9/30/2021 | $ | 15.96 | 0.21 | 5.50 | 5.71 | (0.04) | — | (0.04) | $ | 21.63 | 35.80% | $ | 1,863,947 | 1.01% | n/a | 1.01% | 39.62% |
| 9/30/2020 | $ | 17.14 | 0.11 | (1.01) | (0.90) | (0.28) | — | (0.28) | $ | 15.96 | (5.37)% | $ | 1,321,157 | 1.02% | n/a | 0.67% | 37.09% |
| HIGH INCOME | | | | | |
| Investor Shares | | | | | |
| 9/30/2024 | $ | 8.63 | 0.66 | 0.56 | 1.22 | (0.66) | — | (0.66) | $ | 9.19 | 14.64% | $ | 609,401 | 0.95% | n/a | 7.43% | 32.01% |
| 9/30/2023 | $ | 8.46 | 0.63 | 0.28 | 0.91 | (0.68) | (0.06) | (0.74) | $ | 8.63 | 10.44% | $ | 698,504 | 0.94% | n/a | 7.29% | 18.46% |
| 9/30/2022 | $ | 10.28 | 0.51 | (1.58) | (1.07) | (0.53) | (0.22) | (0.75) | $ | 8.46 | (11.00)% | $ | 756,049 | 0.94% | n/a | 5.34% | 55.84% |
| 9/30/2021 | $ | 9.53 | 0.55 | 0.74 | 1.29 | (0.54) | — | (0.54) | $ | 10.28 | 13.79% | $ | 1,436,340 | 0.95% | n/a | 5.42% | 58.10% |
| 9/30/2020 | $ | 9.66 | 0.60 | (0.13) | 0.47 | (0.60) | — | (0.60) | $ | 9.53 | 5.14% | $ | 1,149,422 | 0.96% | n/a | 6.43% | 71.78% |
| Advisor Shares | | | | | |
| 9/30/2024 | $ | 8.62 | 0.67 | 0.58 | 1.25 | (0.68) | — | (0.68) | $ | 9.19 | 14.83% | $ | 3,486,020 | 0.79% | n/a | 7.56% | 32.01% |
| 9/30/2023 | $ | 8.45 | 0.64 | 0.28 | 0.92 | (0.69) | (0.06) | (0.75) | $ | 8.62 | 10.62% | $ | 3,021,295 | 0.79% | n/a | 7.46% | 18.46% |
| 9/30/2022 | $ | 10.27 | 0.53 | (1.59) | (1.06) | (0.54) | (0.22) | (0.76) | $ | 8.45 | (10.88)% | $ | 2,570,217 | 0.79% | n/a | 5.56% | 55.84% |
| 9/30/2021 | $ | 9.53 | 0.56 | 0.74 | 1.30 | (0.56) | — | (0.56) | $ | 10.27 | 13.86% | $ | 3,263,582 | 0.79% | n/a | 5.56% | 58.10% |
| 9/30/2020 | $ | 9.66 | 0.61 | (0.13) | 0.48 | (0.61) | — | (0.61) | $ | 9.53 | 5.29% | $ | 2,281,480 | 0.82% | n/a | 6.57% | 71.78% |
| Institutional Shares | | | | | |
| 9/30/2024 | $ | 8.62 | 0.68 | 0.57 | 1.25 | (0.68) | — | (0.68) | $ | 9.19 | 14.95% | $ | 4,729,917 | 0.69% | n/a | 7.65% | 32.01% |
| 9/30/2023 | $ | 8.45 | 0.65 | 0.28 | 0.93 | (0.70) | (0.06) | (0.76) | $ | 8.62 | 10.72% | $ | 3,439,268 | 0.70% | n/a | 7.56% | 18.46% |
| 9/30/2022 | $ | 10.27 | 0.54 | (1.59) | (1.05) | (0.55) | (0.22) | (0.77) | $ | 8.45 | (10.81)% | $ | 2,482,806 | 0.70% | n/a | 5.68% | 55.84% |
| 9/30/2021 | $ | 9.53 | 0.57 | 0.74 | 1.31 | (0.57) | — | (0.57) | $ | 10.27 | 13.97% | $ | 2,372,161 | 0.70% | n/a | 5.63% | 58.10% |
| 9/30/2020 | $ | 9.66 | 0.62 | (0.13) | 0.49 | (0.62) | — | (0.62) | $ | 9.53 | 5.40% | $ | 1,385,864 | 0.72% | n/a | 6.67% | 71.78% |
ARTISAN PARTNERS FUNDS
Financial Highlights — For a share outstanding throughout each period
| | | | | | | Less Distributions From | | | | | | | | | |
| | Net Asset Value, Beginning of Period | Net Investment Income(1) | Net Realized and Unrealized Gain (Loss) on Investments | Total from Operations | Net Investment Income | Net Realized Gains | Total Distributions | Net Asset Value, End of Period | Total Return(2) | Net Assets, End of Period (000) | Ratio of Expenses to Average Net Assets(3)(4) | Ratio of Expenses to Average Net Assets Excluding Waivers(3) | Ratio of Net Investment Income to Average Net
Assets(3)(4) | Portfolio Turnover Rate(2) |
| INTERNATIONAL | | | | | |
| Investor Shares | | | | | |
| 9/30/2024 | $ | 24.86 | 0.20 | 6.15 | 6.35 | (0.27) | (0.21) | (0.48) | $ | 30.73 | 25.92% | $ | 1,533,080 | 1.19% | n/a | 0.72% | 83.27% |
| 9/30/2023 | $ | 20.93 | 0.25 | 4.29 | 4.54 | (0.30) | (0.31) | (0.61) | $ | 24.86 | 21.79% | $ | 1,513,239 | 1.19% | n/a | 1.00% | 76.96% |
| 9/30/2022 | $ | 36.66 | 0.28 | (8.90) | (8.62) | (0.24) | (6.87) | (7.11) | $ | 20.93 | (29.32)% | $ | 1,575,634 | 1.19% | n/a | 1.03% | 50.49% |
| 9/30/2021 | $ | 32.86 | 0.24 | 4.68 | 4.92 | (0.08) | (1.04) | (1.12) | $ | 36.66 | 15.32% | $ | 3,019,360 | 1.18% | n/a | 0.69% | 67.41% |
| 9/30/2020 | $ | 32.52 | 0.08 | 2.00 | 2.08 | (0.30) | (1.44) | (1.74) | $ | 32.86 | 6.52% | $ | 3,142,072 | 1.19% | n/a | 0.27% | 53.82% |
| Advisor Shares | | | | | |
| 9/30/2024 | $ | 24.77 | 0.25 | 6.11 | 6.36 | (0.33) | (0.21) | (0.54) | $ | 30.59 | 26.07% | $ | 870,424 | 1.05% | n/a | 0.89% | 83.27% |
| 9/30/2023 | $ | 20.87 | 0.28 | 4.28 | 4.56 | (0.35) | (0.31) | (0.66) | $ | 24.77 | 21.99% | $ | 791,282 | 1.05% | n/a | 1.14% | 76.96% |
| 9/30/2022 | $ | 36.58 | 0.32 | (8.86) | (8.54) | (0.30) | (6.87) | (7.17) | $ | 20.87 | (29.24)% | $ | 829,517 | 1.05% | n/a | 1.18% | 50.49% |
| 9/30/2021 | $ | 32.80 | 0.30 | 4.65 | 4.95 | (0.13) | (1.04) | (1.17) | $ | 36.58 | 15.47% | $ | 1,718,258 | 1.04% | n/a | 0.84% | 67.41% |
| 9/30/2020 | $ | 32.46 | 0.15 | 1.98 | 2.13 | (0.35) | (1.44) | (1.79) | $ | 32.80 | 6.71% | $ | 1,799,962 | 1.04% | n/a | 0.48% | 53.82% |
| Institutional Shares | | | | | |
| 9/30/2024 | $ | 25.03 | 0.28 | 6.17 | 6.45 | (0.36) | (0.21) | (0.57) | $ | 30.91 | 26.19% | $ | 2,883,423 | 0.96% | n/a | 0.99% | 83.27% |
| 9/30/2023 | $ | 21.09 | 0.31 | 4.32 | 4.63 | (0.38) | (0.31) | (0.69) | $ | 25.03 | 22.04% | $ | 2,582,094 | 0.96% | n/a | 1.23% | 76.96% |
| 9/30/2022 | $ | 36.90 | 0.35 | (8.95) | (8.60) | (0.34) | (6.87) | (7.21) | $ | 21.09 | (29.14)% | $ | 2,588,387 | 0.97% | n/a | 1.28% | 50.49% |
| 9/30/2021 | $ | 33.08 | 0.33 | 4.69 | 5.02 | (0.16) | (1.04) | (1.20) | $ | 36.90 | 15.56% | $ | 4,920,404 | 0.95% | n/a | 0.93% | 67.41% |
| 9/30/2020 | $ | 32.72 | 0.17 | 2.01 | 2.18 | (0.38) | (1.44) | (1.82) | $ | 33.08 | 6.80% | $ | 4,718,706 | 0.96% | n/a | 0.55% | 53.82% |
| INTERNATIONAL EXPLORER | | | | | |
| Advisor Shares | | | | | |
| 9/30/2024 | $ | 10.47 | 0.13 | 2.21 | 2.34 | (0.07) | (0.15) | (0.22) | $ | 12.59 | 22.75% | $ | 101,836 | 1.40% | 1.44%(7) | 1.10% | 15.52% |
| 9/30/2023 | $ | 8.69 | 0.12 | 1.67 | 1.79 | (0.01) | — | (0.01) | $ | 10.47 | 20.62% | $ | 39,616 | 1.40% | 1.75% | 1.10% | 23.97% |
| 5/16/2022 (commencement) - 9/30/2022 | $ | 10.00 | 0.02 | (1.33) | (1.31) | — | — | — | $ | 8.69 | (13.10)% | $ | 5,811 | 1.40% | 6.08% | 0.64% | 11.60% |
| Institutional Shares | | | | | |
| 9/30/2024 | $ | 10.48 | 0.12 | 2.21 | 2.33 | (0.07) | (0.15) | (0.22) | $ | 12.59 | 22.70% | $ | 57,313 | 1.33% | 1.37%(7) | 1.05% | 15.52% |
| 9/30/2023 | $ | 8.69 | 0.14 | 1.67 | 1.81 | (0.02) | — | (0.02) | $ | 10.48 | 20.80% | $ | 36,073 | 1.35% | 1.59% | 1.31% | 23.97% |
| 5/16/2022 (commencement) - 9/30/2022 | $ | 10.00 | 0.01 | (1.32) | (1.31) | — | — | — | $ | 8.69 | (13.10)% | $ | 14,725 | 1.35% | 2.91% | 0.25% | 11.60% |
ARTISAN PARTNERS FUNDS
Financial Highlights — For a share outstanding throughout each period
| | | | | | | Less Distributions From | | | | | | | | | |
| | Net Asset Value, Beginning of Period | Net Investment Income (Loss)(1) | Net Realized and Unrealized Gain (Loss) on Investments | Total from Operations | Net Investment Income | Net Realized Gains | Total Distributions | Net Asset Value, End of Period | Total Return(2) | Net Assets, End of Period (000) | Ratio of Expenses to Average Net Assets(3)(4) | Ratio of Expenses to Average Net Assets Excluding Waivers(3) | Ratio of Net Investment Income (Loss) to Average Net
Assets(3)(4) | Portfolio Turnover Rate(2) |
| INTERNATIONAL SMALL-MID | | | | | |
| Investor Shares | | | | | |
| 9/30/2024 | $ | 15.55 | —(5) | 3.04 | 3.04 | — | — | — | $ | 18.59 | 19.55% | $ | 203,785 | 1.32% | n/a | (0.02)% | 33.05% |
| 9/30/2023 | $ | 13.90 | (0.03) | 1.68 | 1.65 | — | — | — | $ | 15.55 | 11.87% | $ | 264,373 | 1.30% | n/a | (0.16)% | 26.46% |
| 9/30/2022 | $ | 21.19 | (0.06) | (6.65) | (6.71) | — | (0.58) | (0.58) | $ | 13.90 | (32.53)% | $ | 301,480 | 1.28% | n/a | (0.32)% | 22.12% |
| 9/30/2021 | $ | 17.33 | (0.09) | 4.06 | 3.97 | (0.11) | — | (0.11) | $ | 21.19 | 22.99% | $ | 531,882 | 1.30% | n/a | (0.42)% | 28.29% |
| 9/30/2020 | $ | 13.61 | 0.16 | 3.58 | 3.74 | (0.02) | — | (0.02) | $ | 17.33 | 27.52% | $ | 400,490 | 1.33% | n/a | 1.06% | 27.84% |
| Advisor Shares | | | | | |
| 9/30/2024 | $ | 15.62 | 0.03 | 3.06 | 3.09 | —(5) | — | —(5) | $ | 18.71 | 19.85% | $ | 1,176,167 | 1.15% | n/a | 0.15% | 33.05% |
| 9/30/2023 | $ | 13.94 | —(5) | 1.68 | 1.68 | —(5) | — | —(5) | $ | 15.62 | 12.08% | $ | 1,142,603 | 1.14% | n/a | 0.01% | 26.46% |
| 9/30/2022 | $ | 21.23 | (0.03) | (6.68) | (6.71) | — | (0.58) | (0.58) | $ | 13.94 | (32.47)% | $ | 1,161,239 | 1.14% | n/a | (0.16)% | 22.12% |
| 9/30/2021 | $ | 17.35 | (0.05) | 4.06 | 4.01 | (0.13) | — | (0.13) | $ | 21.23 | 23.20% | $ | 1,856,538 | 1.14% | n/a | (0.26)% | 28.29% |
| 9/30/2020 | $ | 13.62 | 0.20 | 3.57 | 3.77 | (0.04) | — | (0.04) | $ | 17.35 | 27.70% | $ | 1,223,773 | 1.18% | n/a | 1.32% | 27.84% |
| Institutional Shares | | | | | |
| 9/30/2024 | $ | 15.81 | 0.04 | 3.10 | 3.14 | (0.01) | — | (0.01) | $ | 18.94 | 19.88% | $ | 3,367,529 | 1.07% | n/a | 0.25% | 33.05% |
| 9/30/2023 | $ | 14.12 | 0.02 | 1.69 | 1.71 | (0.02) | — | (0.02) | $ | 15.81 | 12.10% | $ | 2,672,752 | 1.07% | n/a | 0.09% | 26.46% |
| 9/30/2022 | $ | 21.47 | (0.01) | (6.76) | (6.77) | — | (0.58) | (0.58) | $ | 14.12 | (32.38)% | $ | 2,505,844 | 1.06% | n/a | (0.08)% | 22.12% |
| 9/30/2021 | $ | 17.54 | (0.04) | 4.11 | 4.07 | (0.14) | — | (0.14) | $ | 21.47 | 23.30% | $ | 3,897,436 | 1.06% | n/a | (0.17)% | 28.29% |
| 9/30/2020 | $ | 13.76 | 0.23 | 3.59 | 3.82 | (0.04) | — | (0.04) | $ | 17.54 | 27.85% | $ | 1,836,163 | 1.09% | n/a | 1.49% | 27.84% |
| INTERNATIONAL VALUE | | | | | |
| Investor Shares | | | | | |
| 9/30/2024 | $ | 42.69 | 0.65 | 10.40 | 11.05 | (0.88) | (0.83) | (1.71) | $ | 52.03 | 26.51% | $ | 3,160,578 | 1.19% | n/a | 1.37% | 14.78% |
| 9/30/2023 | $ | 32.96 | 0.47 | 9.98 | 10.45 | (0.08) | (0.64) | (0.72) | $ | 42.69 | 31.97% | $ | 2,661,694 | 1.18% | n/a | 1.13% | 19.48% |
| 9/30/2022 | $ | 44.49 | 0.45 | (7.77) | (7.32) | (1.17) | (3.04) | (4.21) | $ | 32.96 | (18.40)% | $ | 2,059,112 | 1.19% | n/a | 1.13% | 22.69% |
| 9/30/2021 | $ | 32.94 | 1.01 | 10.88 | 11.89 | (0.09) | (0.25) | (0.34) | $ | 44.49 | 36.13% | $ | 2,728,996 | 1.18% | n/a | 2.39% | 32.90% |
| 9/30/2020 | $ | 34.87 | 0.19 | (1.06) | (0.87) | (0.23) | (0.83) | (1.06) | $ | 32.94 | (2.71)% | $ | 1,983,618 | 1.19% | n/a | 0.57% | 28.06% |
| Advisor Shares | | | | | |
| 9/30/2024 | $ | 42.66 | 0.73 | 10.36 | 11.09 | (1.01) | (0.83) | (1.84) | $ | 51.91 | 26.68% | $ | 10,859,010 | 1.04% | n/a | 1.54% | 14.78% |
| 9/30/2023 | $ | 32.89 | 0.54 | 9.95 | 10.49 | (0.08) | (0.64) | (0.72) | $ | 42.66 | 32.17% | $ | 7,949,554 | 1.04% | n/a | 1.31% | 19.48% |
| 9/30/2022 | $ | 44.46 | 0.52 | (7.76) | (7.24) | (1.29) | (3.04) | (4.33) | $ | 32.89 | (18.27)% | $ | 4,705,187 | 1.05% | n/a | 1.29% | 22.69% |
| 9/30/2021 | $ | 32.90 | 1.14 | 10.78 | 11.92 | (0.11) | (0.25) | (0.36) | $ | 44.46 | 36.31% | $ | 6,072,617 | 1.04% | n/a | 2.70% | 32.90% |
| 9/30/2020 | $ | 34.81 | 0.27 | (1.09) | (0.82) | (0.26) | (0.83) | (1.09) | $ | 32.90 | (2.56)% | $ | 3,645,568 | 1.05% | n/a | 0.81% | 28.06% |
| Institutional Shares | | | | | |
| 9/30/2024 | $ | 42.89 | 0.77 | 10.44 | 11.21 | (1.09) | (0.83) | (1.92) | $ | 52.18 | 26.81% | $ | 22,197,352 | 0.95% | n/a | 1.63% | 14.78% |
| 9/30/2023 | $ | 33.04 | 0.56 | 10.01 | 10.57 | (0.08) | (0.64) | (0.72) | $ | 42.89 | 32.27% | $ | 17,529,499 | 0.95% | n/a | 1.36% | 19.48% |
| 9/30/2022 | $ | 44.69 | 0.55 | (7.80) | (7.25) | (1.36) | (3.04) | (4.40) | $ | 33.04 | (18.20)% | $ | 13,366,731 | 0.95% | n/a | 1.36% | 22.69% |
| 9/30/2021 | $ | 33.06 | 1.16 | 10.86 | 12.02 | (0.14) | (0.25) | (0.39) | $ | 44.69 | 36.45% | $ | 13,304,215 | 0.95% | n/a | 2.72% | 32.90% |
| 9/30/2020 | $ | 34.96 | 0.28 | (1.08) | (0.80) | (0.27) | (0.83) | (1.10) | $ | 33.06 | (2.48)% | $ | 7,944,724 | 0.96% | n/a | 0.85% | 28.06% |
ARTISAN PARTNERS FUNDS
Financial Highlights — For a share outstanding throughout each period
| | | | | | | Less Distributions From | | | | | | | | | |
| | Net Asset Value, Beginning of Period | Net Investment Income (Loss)(1) | Net Realized and Unrealized Gain (Loss) on Investments | Total from Operations | Net Investment Income | Net Realized Gains | Total Distributions | Net Asset Value, End of Period | Total Return(2) | Net Assets, End of Period (000) | Ratio of Expenses to Average Net Assets(3)(4) | Ratio of Expenses to Average Net Assets Excluding Waivers(3) | Ratio of Net Investment Income (Loss) to Average Net
Assets(3)(4) | Portfolio Turnover Rate(2) |
| MID CAP | | | | | | | | | | | | | | | | | |
| Investor Shares | | | | | |
| 9/30/2024 | $ | 31.95 | (0.32) | 5.42 | 5.10 | — | — | — | $ | 37.05 | 15.96% | $ | 1,184,394 | 1.19% | n/a | (0.92)% | 44.94% |
| 9/30/2023 | $ | 28.45 | (0.26) | 3.84 | 3.58 | (0.08) | — | (0.08) | $ | 31.95 | 12.62% | $ | 1,350,885 | 1.20% | n/a | (0.83)% | 46.87% |
| 9/30/2022 | $ | 53.28 | (0.37) | (15.87) | (16.24) | — | (8.59) | (8.59) | $ | 28.45 | (36.55)% | $ | 1,387,480 | 1.18% | n/a | (0.97)% | 34.12% |
| 9/30/2021 | $ | 47.75 | (0.49) | 13.20 | 12.71 | — | (7.18) | (7.18) | $ | 53.28 | 29.84% | $ | 2,495,355 | 1.18% | n/a | (0.98)% | 40.72% |
| 9/30/2020 | $ | 37.16 | (0.31) | 15.43 | 15.12 | — | (4.53) | (4.53) | $ | 47.75 | 45.66% | $ | 2,106,948 | 1.18% | n/a | (0.81)% | 44.52% |
| Advisor Shares | | | | | |
| 9/30/2024 | $ | 32.58 | (0.28) | 5.54 | 5.26 | — | — | — | $ | 37.84 | 16.14% | $ | 616,589 | 1.05% | n/a | (0.77)% | 44.94% |
| 9/30/2023 | $ | 29.02 | (0.22) | 3.91 | 3.69 | (0.13) | — | (0.13) | $ | 32.58 | 12.76% | $ | 619,561 | 1.05% | n/a | (0.69)% | 46.87% |
| 9/30/2022 | $ | 54.11 | (0.32) | (16.18) | (16.50) | — | (8.59) | (8.59) | $ | 29.02 | (36.46)% | $ | 572,155 | 1.05% | n/a | (0.83)% | 34.12% |
| 9/30/2021 | $ | 48.33 | (0.43) | 13.39 | 12.96 | — | (7.18) | (7.18) | $ | 54.11 | 30.02% | $ | 923,543 | 1.04% | n/a | (0.85)% | 40.72% |
| 9/30/2020 | $ | 37.52 | (0.27) | 15.61 | 15.34 | — | (4.53) | (4.53) | $ | 48.33 | 45.83% | $ | 667,057 | 1.05% | n/a | (0.68)% | 44.52% |
| Institutional Shares | | | | | |
| 9/30/2024 | $ | 38.17 | (0.29) | 6.50 | 6.21 | — | — | — | $ | 44.38 | 16.27% | $ | 2,503,813 | 0.96% | n/a | (0.68)% | 44.94% |
| 9/30/2023 | $ | 33.98 | (0.22) | 4.57 | 4.35 | (0.16) | — | (0.16) | $ | 38.17 | 12.86% | $ | 2,505,649 | 0.96% | n/a | (0.60)% | 46.87% |
| 9/30/2022 | $ | 61.87 | (0.33) | (18.97) | (19.30) | — | (8.59) | (8.59) | $ | 33.98 | (36.41)% | $ | 2,285,588 | 0.95% | n/a | (0.74)% | 34.12% |
| 9/30/2021 | $ | 54.25 | (0.43) | 15.23 | 14.80 | — | (7.18) | (7.18) | $ | 61.87 | 30.15% | $ | 4,000,122 | 0.95% | n/a | (0.75)% | 40.72% |
| 9/30/2020 | $ | 41.54 | (0.26) | 17.50 | 17.24 | — | (4.53) | (4.53) | $ | 54.25 | 45.98% | $ | 4,015,667 | 0.95% | n/a | (0.59)% | 44.52% |
| MID CAP VALUE | | | | | |
| Investor Shares | | | | | |
| 9/30/2024 | $ | 16.52 | 0.12 | 2.90 | 3.02 | (0.11) | (2.59) | (2.70) | $ | 16.84 | 20.67% | $ | 352,773 | 1.23% | n/a | 0.76% | 23.41% |
| 9/30/2023 | $ | 17.11 | 0.12 | 2.61 | 2.73 | (0.05) | (3.27) | (3.32) | $ | 16.52 | 16.19% | $ | 365,299 | 1.22% | n/a | 0.69% | 27.81% |
| 9/30/2022 | $ | 23.12 | 0.12 | (3.07) | (2.95) | (0.04) | (3.02) | (3.06) | $ | 17.11 | (15.39)% | $ | 391,804 | 1.20% | n/a | 0.57% | 15.17% |
| 9/30/2021 | $ | 16.26 | 0.12 | 7.10 | 7.22 | (0.09) | (0.27) | (0.36) | $ | 23.12 | 44.94% | $ | 693,149 | 1.20% | n/a | 0.56% | 16.04% |
| 9/30/2020 | $ | 19.81 | 0.15 | (1.71) | (1.56) | (0.12) | (1.87) | (1.99) | $ | 16.26 | (8.93)% | $ | 541,320 | 1.21% | n/a | 0.90% | 43.12% |
| Advisor Shares | | | | | |
| 9/30/2024 | $ | 16.44 | 0.14 | 2.88 | 3.02 | (0.13) | (2.59) | (2.72) | $ | 16.74 | 20.80% | $ | 216,475 | 1.11% | n/a | 0.89% | 23.41% |
| 9/30/2023 | $ | 17.06 | 0.14 | 2.61 | 2.75 | (0.10) | (3.27) | (3.37) | $ | 16.44 | 16.39% | $ | 247,854 | 1.07% | n/a | 0.83% | 27.81% |
| 9/30/2022 | $ | 23.07 | 0.15 | (3.07) | (2.92) | (0.07) | (3.02) | (3.09) | $ | 17.06 | (15.29)% | $ | 397,898 | 1.04% | n/a | 0.72% | 15.17% |
| 9/30/2021 | $ | 16.23 | 0.16 | 7.07 | 7.23 | (0.12) | (0.27) | (0.39) | $ | 23.07 | 45.12% | $ | 551,822 | 1.05% | n/a | 0.73% | 16.04% |
| 9/30/2020 | $ | 19.77 | 0.17 | (1.70) | (1.53) | (0.14) | (1.87) | (2.01) | $ | 16.23 | (8.76)% | $ | 518,198 | 1.06% | n/a | 1.02% | 43.12% |
| Institutional Shares | | | | | |
| 9/30/2024 | $ | 16.47 | 0.15 | 2.89 | 3.04 | (0.15) | (2.59) | (2.74) | $ | 16.77 | 20.90% | $ | 605,251 | 1.01% | n/a | 0.98% | 23.41% |
| 9/30/2023 | $ | 17.08 | 0.15 | 2.62 | 2.77 | (0.11) | (3.27) | (3.38) | $ | 16.47 | 16.53% | $ | 533,734 | 1.00% | n/a | 0.91% | 27.81% |
| 9/30/2022 | $ | 23.09 | 0.16 | (3.06) | (2.90) | (0.09) | (3.02) | (3.11) | $ | 17.08 | (15.21)% | $ | 518,265 | 0.98% | n/a | 0.78% | 15.17% |
| 9/30/2021 | $ | 16.24 | 0.17 | 7.08 | 7.25 | (0.13) | (0.27) | (0.40) | $ | 23.09 | 45.22% | $ | 783,375 | 0.98% | n/a | 0.79% | 16.04% |
| 9/30/2020 | $ | 19.80 | 0.18 | (1.71) | (1.53) | (0.16) | (1.87) | (2.03) | $ | 16.24 | (8.76)% | $ | 619,243 | 1.00% | n/a | 1.08% | 43.12% |
ARTISAN PARTNERS FUNDS
Financial Highlights — For a share outstanding throughout each period
| | | | | | | Less Distributions From | | | | | | | | | |
| | Net Asset Value, Beginning of Period | Net Investment Income (Loss)(1) | Net Realized and Unrealized Gain (Loss) on Investments | Total from Operations | Net Investment Income | Net Realized Gains | Total Distributions | Net Asset Value, End of Period | Total Return(2) | Net Assets, End of Period (000) | Ratio of Expenses to Average Net Assets(3)(4) | Ratio of Expenses to Average Net Assets Excluding Waivers(3) | Ratio of Net Investment Income (Loss) to Average Net
Assets(3)(4) | Portfolio Turnover Rate(2) |
| SELECT EQUITY |
| Investor Shares |
| 9/30/2024 | $ | 11.97 | 0.07 | 3.78 | 3.85 | (0.06) | — | (0.06) | $ | 15.76 | 32.32% | $ | 3,416 | 1.25% | 3.12% | 0.51% | 19.09% |
| 9/30/2023 | $ | 9.84 | 0.05 | 2.38 | 2.43 | (0.01) | (0.29) | (0.30) | $ | 11.97 | 24.93% | $ | 2,796 | 1.25% | 3.17% | 0.41% | 26.63% |
| 9/30/2022 | $ | 13.48 | 0.01 | (3.00) | (2.99) | — | (0.65) | (0.65) | $ | 9.84 | (23.43)% | $ | 2,345 | 1.25% | 3.16% | 0.05% | 20.96% |
| 9/30/2021 | $ | 10.17 | (0.01) | 3.32 | 3.31 | — | — | — | $ | 13.48 | 32.55% | $ | 2,919 | 1.25% | 4.35% | (0.05)% | 34.69% |
| 2/28/2020 (commencement) - 9/30/2020 | $ | 10.00 | —(5) | 0.17 | 0.17 | — | — | — | $ | 10.17 | 1.70% | $ | 983 | 1.25% | 17.96% | 0.03% | 26.96% |
| Advisor Shares |
| 9/30/2024 | $ | 11.99 | 0.09 | 3.79 | 3.88 | (0.08) | — | (0.08) | $ | 15.79 | 32.47% | $ | 1,382 | 1.15% | 3.83% | 0.62% | 19.09% |
| 9/30/2023 | $ | 9.87 | 0.05 | 2.38 | 2.43 | (0.02) | (0.29) | (0.31) | $ | 11.99 | 24.90% | $ | 1,239 | 1.15% | 3.66% | 0.44% | 26.63% |
| 9/30/2022 | $ | 13.49 | 0.02 | (2.99) | (2.97) | — | (0.65) | (0.65) | $ | 9.87 | (23.26)% | $ | 1,561 | 1.15% | 3.68% | 0.14% | 20.96% |
| 9/30/2021 | $ | 10.18 | 0.01 | 3.30 | 3.31 | — | — | — | $ | 13.49 | 32.51% | $ | 1,784 | 1.15% | 4.83% | 0.05% | 34.69% |
| 2/28/2020 (commencement) - 9/30/2020 | $ | 10.00 | 0.01 | 0.17 | 0.18 | — | — | — | $ | 10.18 | 1.80% | $ | 778 | 1.15% | 9.66% | 0.15% | 26.96% |
| Institutional Shares |
| 9/30/2024 | $ | 11.93 | 0.09 | 3.77 | 3.86 | (0.08) | — | (0.08) | $ | 15.71 | 32.54% | $ | 47,315 | 1.10% | 1.18% | 0.66% | 19.09% |
| 9/30/2023 | $ | 9.81 | 0.07 | 2.37 | 2.44 | (0.03) | (0.29) | (0.32) | $ | 11.93 | 25.12% | $ | 32,968 | 1.10% | 1.34% | 0.56% | 26.63% |
| 9/30/2022 | $ | 13.44 | 0.03 | (2.99) | (2.96) | (0.02) | (0.65) | (0.67) | $ | 9.81 | (23.33)% | $ | 25,650 | 1.10% | 1.39% | 0.22% | 20.96% |
| 9/30/2021 | $ | 10.18 | 0.02 | 3.30 | 3.32 | (0.06) | — | (0.06) | $ | 13.44 | 32.71% | $ | 19,903 | 1.10% | 1.56% | 0.16% | 34.69% |
| 2/28/2020 (commencement) - 9/30/2020 | $ | 10.00 | 0.01 | 0.17 | 0.18 | — | — | — | $ | 10.18 | 1.80% | $ | 11,266 | 1.10% | 2.36% | 0.20% | 26.96% |
| SMALL CAP |
| Investor Shares |
| 9/30/2024 | $ | 29.52 | (0.34) | 7.56 | 7.22 | — | — | — | $ | 36.74 | 24.46% | $ | 515,060 | 1.23% | n/a | (1.03)% | 46.72% |
| 9/30/2023 | $ | 27.82 | (0.31) | 2.09 | 1.78 | (0.08) | — | (0.08) | $ | 29.52 | 6.38% | $ | 526,681 | 1.23% | n/a | (1.01)% | 30.14% |
| 9/30/2022 | $ | 50.34 | (0.36) | (17.09) | (17.45) | — | (5.07) | (5.07) | $ | 27.82 | (38.24)% | $ | 571,380 | 1.20% | n/a | (1.00)% | 33.64% |
| 9/30/2021 | $ | 42.80 | (0.53) | 10.77 | 10.24 | — | (2.70) | (2.70) | $ | 50.34 | 24.45% | $ | 1,089,099 | 1.19% | n/a | (1.06)% | 39.79% |
| 9/30/2020 | $ | 33.17 | (0.38) | 12.66 | 12.28 | — | (2.65) | (2.65) | $ | 42.80 | 39.51% | $ | 896,297 | 1.20% | n/a | (1.05)% | 40.59% |
| Advisor Shares |
| 9/30/2024 | $ | 29.82 | (0.29) | 7.63 | 7.34 | — | — | — | $ | 37.16 | 24.61% | $ | 284,862 | 1.08% | n/a | (0.89)% | 46.72% |
| 9/30/2023 | $ | 28.08 | (0.26) | 2.10 | 1.84 | (0.10) | — | (0.10) | $ | 29.82 | 6.56% | $ | 262,669 | 1.07% | n/a | (0.86)% | 30.14% |
| 9/30/2022 | $ | 50.70 | (0.32) | (17.23) | (17.55) | — | (5.07) | (5.07) | $ | 28.08 | (38.16)% | $ | 361,941 | 1.06% | n/a | (0.87)% | 33.64% |
| 9/30/2021 | $ | 43.03 | (0.47) | 10.84 | 10.37 | — | (2.70) | (2.70) | $ | 50.70 | 24.63% | $ | 1,325,015 | 1.06% | n/a | (0.93)% | 39.79% |
| 9/30/2020 | $ | 33.30 | (0.34) | 12.72 | 12.38 | — | (2.65) | (2.65) | $ | 43.03 | 39.66% | $ | 999,213 | 1.08% | n/a | (0.94)% | 40.59% |
| Institutional Shares |
| 9/30/2024 | $ | 30.50 | (0.27) | 7.82 | 7.55 | — | — | — | $ | 38.05 | 24.75% | $ | 592,837 | 1.00% | n/a | (0.81)% | 46.72% |
| 9/30/2023 | $ | 28.74 | (0.25) | 2.16 | 1.91 | (0.15) | — | (0.15) | $ | 30.50 | 6.62% | $ | 835,311 | 1.00% | n/a | (0.78)% | 30.14% |
| 9/30/2022 | $ | 51.74 | (0.28) | (17.65) | (17.93) | — | (5.07) | (5.07) | $ | 28.74 | (38.12)% | $ | 882,206 | 0.98% | n/a | (0.78)% | 33.64% |
| 9/30/2021 | $ | 43.82 | (0.43) | 11.05 | 10.62 | — | (2.70) | (2.70) | $ | 51.74 | 24.76% | $ | 1,633,941 | 0.96% | n/a | (0.83)% | 39.79% |
| 9/30/2020 | $ | 33.83 | (0.31) | 12.95 | 12.64 | — | (2.65) | (2.65) | $ | 43.82 | 39.82% | $ | 1,106,482 | 0.99% | n/a | (0.84)% | 40.59% |
ARTISAN PARTNERS FUNDS
Financial Highlights — For a share outstanding throughout each period
| | | | | | | Less Distributions From | | | | | | | | | |
| | Net Asset Value, Beginning of Period | Net Investment Income(1) | Net Realized and Unrealized Gain (Loss) on Investments | Total from Operations | Net Investment Income | Net Realized Gains | Total Distributions | Net Asset Value, End of Period | Total Return(2) | Net Assets, End of Period (000) | Ratio of Expenses to Average Net Assets(3)(4) | Ratio of Expenses to Average Net Assets Excluding Waivers(3) | Ratio of Net Investment Income to Average Net
Assets(3)(4) | Portfolio Turnover Rate(2) |
| SUSTAINABLE EMERGING MARKETS |
| Investor Shares |
| 9/30/2024 | $ | 15.02 | 0.20 | 3.35 | 3.55 | (0.07) | — | (0.07) | $ | 18.50 | 23.70% | $ | 16,135 | 1.15% | 1.61% | 1.21% | 11.71% |
| 9/30/2023 | $ | 12.48 | 0.18 | 2.47 | 2.65 | (0.11) | — | (0.11) | $ | 15.02 | 21.37% | $ | 13,658 | 1.15% | 1.74% | 1.22% | 28.77% |
| 9/30/2022 | $ | 19.25 | 0.18 | (6.75) | (6.57) | (0.20) | — | (0.20) | $ | 12.48 | (34.51)% | $ | 12,297 | 1.26%(8) | 1.58% | 1.06% | 21.48% |
| 9/30/2021 | $ | 16.39 | 0.07 | 3.11 | 3.18 | (0.32) | — | (0.32) | $ | 19.25 | 19.50% | $ | 61,975 | 1.35% | 1.75% | 0.36% | 23.22% |
| 9/30/2020 | $ | 15.22 | 0.24 | 1.20 | 1.44 | (0.27) | — | (0.27) | $ | 16.39 | 9.58% | $ | 46,541 | 1.35% | 1.73% | 1.59% | 21.57% |
| Advisor Shares |
| 9/30/2024 | $ | 15.01 | 0.22 | 3.34 | 3.56 | (0.08) | — | (0.08) | $ | 18.49 | 23.83% | $ | 47,511 | 1.05% | 1.22% | 1.31% | 11.71% |
| 9/30/2023 | $ | 12.47 | 0.21 | 2.47 | 2.68 | (0.14) | — | (0.14) | $ | 15.01 | 21.58% | $ | 37,476 | 1.05% | 1.33% | 1.40% | 28.77% |
| 4/28/2022 (commencement) - 9/30/2022 | $ | 14.61 | 0.06 | (2.20) | (2.14) | — | — | — | $ | 12.47 | (14.65)% | $ | 26,872 | 1.05% | 1.97% | 0.96% | 21.48% |
| Institutional Shares |
| 9/30/2024 | $ | 15.29 | 0.24 | 3.39 | 3.63 | (0.08) | — | (0.08) | $ | 18.84 | 23.86% | $ | 105,709 | 1.00% | 1.10% | 1.42% | 11.71% |
| 9/30/2023 | $ | 12.71 | 0.23 | 2.50 | 2.73 | (0.15) | — | (0.15) | $ | 15.29 | 21.57% | $ | 44,368 | 1.00% | 1.26% | 1.51% | 28.77% |
| 9/30/2022 | $ | 19.55 | 0.18 | (6.85) | (6.67) | (0.17) | — | (0.17) | $ | 12.71 | (34.46)% | $ | 23,562 | 1.07%(8) | 1.45% | 1.13% | 21.48% |
| 9/30/2021 | $ | 16.56 | 0.10 | 3.14 | 3.24 | (0.25) | — | (0.25) | $ | 19.55 | 19.74% | $ | 9,794 | 1.20% | 1.89% | 0.51% | 23.22% |
| 9/30/2020 | $ | 15.25 | 0.27 | 1.21 | 1.48 | (0.17) | — | (0.17) | $ | 16.56 | 9.73% | $ | 6,695 | 1.20% | 2.29% | 1.72% | 21.57% |
| VALUE |
| Investor Shares |
| 9/30/2024 | $ | 13.21 | 0.18 | 2.87 | 3.05 | (0.13) | (0.57) | (0.70) | $ | 15.56 | 24.10% | $ | 84,289 | 0.98% | 1.09% | 1.26% | 25.33% |
| 9/30/2023 | $ | 12.02 | 0.13 | 3.14 | 3.27 | (0.03) | (2.05) | (2.08) | $ | 13.21 | 29.09% | $ | 83,594 | 1.06%(9) | 1.09% | 1.00% | 38.07% |
| 9/30/2022 | $ | 16.28 | 0.13 | (2.44) | (2.31) | (0.16) | (1.79) | (1.95) | $ | 12.02 | (16.50)% | $ | 82,183 | 1.06% | n/a | 0.86% | 27.96% |
| 9/30/2021 | $ | 12.41 | 0.10 | 4.82 | 4.92 | (0.06) | (0.99) | (1.05) | $ | 16.28 | 41.36% | $ | 108,551 | 1.05% | n/a | 0.67% | 25.99% |
| 9/30/2020 | $ | 12.88 | 0.09 | (0.02) | 0.07 | (0.11) | (0.43) | (0.54) | $ | 12.41 | 0.35% | $ | 78,717 | 1.08% | n/a | 0.73% | 39.07% |
| Advisor Shares |
| 9/30/2024 | $ | 13.14 | 0.19 | 2.86 | 3.05 | (0.15) | (0.57) | (0.72) | $ | 15.47 | 24.29% | $ | 95,835 | 0.88% | 0.97% | 1.36% | 25.33% |
| 9/30/2023 | $ | 11.97 | 0.15 | 3.12 | 3.27 | (0.05) | (2.05) | (2.10) | $ | 13.14 | 29.30% | $ | 87,610 | 0.88% | 0.97% | 1.20% | 38.07% |
| 9/30/2022 | $ | 16.21 | 0.15 | (2.42) | (2.27) | (0.18) | (1.79) | (1.97) | $ | 11.97 | (16.35)% | $ | 54,633 | 0.88% | 0.96% | 1.02% | 27.96% |
| 9/30/2021 | $ | 12.37 | 0.13 | 4.79 | 4.92 | (0.09) | (0.99) | (1.08) | $ | 16.21 | 41.53% | $ | 99,646 | 0.88% | 0.95% | 0.84% | 25.99% |
| 9/30/2020 | $ | 12.83 | 0.11 | (0.02) | 0.09 | (0.12) | (0.43) | (0.55) | $ | 12.37 | 0.54% | $ | 84,035 | 0.88% | 0.92% | 0.94% | 39.07% |
| Institutional Shares |
| 9/30/2024 | $ | 13.15 | 0.20 | 2.86 | 3.06 | (0.16) | (0.57) | (0.73) | $ | 15.48 | 24.33% | $ | 168,432 | 0.83% | 0.85% | 1.42% | 25.33% |
| 9/30/2023 | $ | 11.98 | 0.15 | 3.13 | 3.28 | (0.06) | (2.05) | (2.11) | $ | 13.15 | 29.35% | $ | 124,498 | 0.85%(10) | 0.85% | 1.20% | 38.07% |
| 9/30/2022 | $ | 16.24 | 0.15 | (2.43) | (2.28) | (0.19) | (1.79) | (1.98) | $ | 11.98 | (16.34)% | $ | 90,279 | 0.85% | n/a | 1.01% | 27.96% |
| 9/30/2021 | $ | 12.40 | 0.13 | 4.80 | 4.93 | (0.10) | (0.99) | (1.09) | $ | 16.24 | 41.61% | $ | 163,069 | 0.83% | n/a | 0.88% | 25.99% |
| 9/30/2020 | $ | 12.86 | 0.12 | (0.02) | 0.10 | (0.13) | (0.43) | (0.56) | $ | 12.40 | 0.64% | $ | 123,440 | 0.82% | n/a | 1.02% | 39.07% |
ARTISAN PARTNERS FUNDS
Financial Highlights — For a share outstanding throughout each period
| | | | | | | Less Distributions From | | | | | | | | | |
| | Net Asset Value, Beginning of Period | Net Investment Income(1) | Net Realized and Unrealized Gain (Loss) on Investments | Total from Operations | Net Investment Income | Net Realized Gains | Total Distributions | Net Asset Value, End of Period | Total Return(2) | Net Assets, End of Period (000) | Ratio of Expenses to Average Net Assets(3)(4) | Ratio of Expenses to Average Net Assets Excluding Waivers(3) | Ratio of Net Investment Income to Average Net
Assets(3)(4) | Portfolio Turnover Rate(2) |
| VALUE INCOME |
| Investor Shares |
| 9/30/2024 | $ | 8.77 | 0.28 | 1.98 | 2.26 | (0.26) | — | (0.26) | $ | 10.77 | 26.05% | $ | 1,032 | 1.20% | 8.59% | 2.84% | 29.11% |
| 9/30/2023 | $ | 8.15 | 0.24 | 0.63 | 0.87 | (0.25) | — | (0.25) | $ | 8.77 | 10.67% | $ | 754 | 1.20% | 9.07% | 2.67% | 30.15% |
| 2/28/2022 (commencement) - 9/30/2022 | $ | 10.00 | 0.15 | (1.86) | (1.71) | (0.14) | — | (0.14) | $ | 8.15 | (17.16)% | $ | 733 | 1.20% | 13.46% | 2.73% | 15.65% |
| Advisor Shares |
| 9/30/2024 | $ | 8.77 | 0.29 | 1.99 | 2.28 | (0.27) | — | (0.27) | $ | 10.78 | 26.27% | $ | 2,216 | 1.10% | 4.18% | 2.94% | 29.11% |
| 9/30/2023 | $ | 8.15 | 0.26 | 0.61 | 0.87 | (0.25) | — | (0.25) | $ | 8.77 | 10.68% | $ | 1,774 | 1.10% | 4.35% | 2.86% | 30.15% |
| 2/28/2022 (commencement) - 9/30/2022 | $ | 10.00 | 0.16 | (1.86) | (1.70) | (0.15) | — | (0.15) | $ | 8.15 | (17.11)% | $ | 1,178 | 1.10% | 9.98% | 2.86% | 15.65% |
| Institutional Shares |
| 9/30/2024 | $ | 8.78 | 0.29 | 1.98 | 2.27 | (0.27) | — | (0.27) | $ | 10.78 | 26.18% | $ | 13,138 | 1.05% | 2.21% | 2.97% | 29.11% |
| 9/30/2023 | $ | 8.15 | 0.26 | 0.62 | 0.88 | (0.25) | — | (0.25) | $ | 8.78 | 10.83% | $ | 8,558 | 1.05% | 2.42% | 2.88% | 30.15% |
| 2/28/2022 (commencement) - 9/30/2022 | $ | 10.00 | 0.16 | (1.86) | (1.70) | (0.15) | — | (0.15) | $ | 8.15 | (17.10)% | $ | 7,195 | 1.05% | 2.55% | 2.86% | 15.65% |
| (1) | Computed based on average shares outstanding. |
| (2) | Periods less than twelve months (where applicable) are not annualized. |
| (3) | Periods less than twelve months (where applicable) are annualized. |
| (4) | Includes the effect of expenses waived or paid by the Adviser, if applicable. |
| (5) | Amount is between $0.005 and $(0.005) per share. |
| (6) | Expense limit from October 1, 2023 to May 30, 2024 was 1.45% for Investor Shares, 1.35% for Advisor Shares and 1.30% for Institutional Shares. Expense limit was lowered effective May 31, 2024 to 1.24% for Investor Shares, 1.14% for Advisor Shares and 1.09% for Institutional Shares. |
| (7) | Adviser voluntarily waived expenses related to the proxy during the year. See Shareholder Meeting Results for additional information. |
| (8) | Expense limit from October 1, 2021 to February 28, 2022 was 1.35% for Investor Shares and 1.20% for Institutional Shares. Expense limit was lowered effective March 1, 2022 to 1.15% for Investor Shares and 1.00% for Institutional Shares. |
| (9) | There was no expense limit prior to July 1, 2023. Effective July 1, 2023, expense limit was 0.98%. |
| (10) | There was no expense limit prior to July 1, 2023. Effective July 1, 2023, expense limit was 0.83%. |
| * | Includes interest expense and dividend payments for securities sold short. The ratios excluding such expenses are listed below. Refer to 2(n) in Notes to Financial Statements for additional information. |
ARTISAN PARTNERS FUNDS
Financial Highlights — For a share outstanding throughout each period
| Fund | Ratio of Expenses to Average Net Assets@ (annualized) | Ratio of Expenses to Average Net Assets Excluding Waivers (annualized) |
| EMERGING MARKETS DEBT OPPORTUNITIES | | |
| Investor | | |
| 9/30/2024 | 1.25% | 3.18% |
| 9/30/2023 | 1.25% | 7.98% |
| Advisor | | |
| 9/30/2024 | 1.15% | 1.81% |
| 9/30/2023 | 1.15% | 2.95% |
| Institutional | | |
| 9/30/2024 | 1.10% | 1.60% |
| 9/30/2023 | 1.10% | 1.95% |
| GLOBAL UNCONSTRAINED | | |
| Investor | | |
| 9/30/2024 | 1.31% | 3.11% |
| 9/30/2023 | 1.45% | 9.23% |
| 3/31/2022 (Commencement) - 9/30/2022 | 1.45% | 53.92% |
| Advisor | | |
| 9/30/2024 | 1.24% | 1.69% |
| 9/30/2023 | 1.35% | 9.22% |
| 3/31/2022 (Commencement) - 9/30/2022 | 1.35% | 9.22% |
| Institutional | | |
| 9/30/2024 | 1.23% | 1.69% |
| 9/30/2023 | 1.30% | 2.26% |
| 3/31/2022 (Commencement) - 9/30/2022 | 1.30% | 2.38% |
| @ | Includes the effect of expenses waived or paid by the Adviser, if applicable. |
ARTISAN PARTNERS FUNDS
Notes to Financial Statements — September 30, 2024
(1) Organization
Artisan Partners Funds, Inc. (“Artisan Partners Funds”) was incorporated on January 5, 1995 as a Wisconsin corporation and is registered under the Investment Company Act of 1940, as amended (the “1940 Act”). As of September 30, 2024, Artisan Partners Funds is a series company comprised of twenty-one series and follows specialized accounting and reporting under FASB Accounting Standards Codification Topic 946, Financial Services – Investment Companies. The following funds (each a “Fund” and collectively the “Funds”) are included in this report:
| | | Investor Shares | | Advisor Shares | | Institutional Shares |
| Fund | | Inception Date | | Inception Date | | Inception Date |
| Artisan Developing World Fund (“Developing World Fund”) | | June 29, 2015 | | June 29, 2015 | | June 29, 2015 |
| Artisan Emerging Markets Debt Opportunities Fund (“Emerging Markets Debt Opportunities Fund”) | | April 7, 2022 | | April 7, 2022 | | April 7, 2022 |
| Artisan Floating Rate Fund (“Floating Rate Fund”) | | December 1, 2021 | | December 1, 2021 | | December 1, 2021 |
| Artisan Focus Fund (“Focus Fund”) | | April 24, 2017 | | July 31, 2018 | | February 3, 2020 |
| Artisan Global Discovery Fund (“Global Discovery Fund”) | | August 21, 2017 | | February 3, 2020 | | February 3, 2020 |
| Artisan Global Equity Fund (“Global Equity Fund”) | | March 29, 2010 | | August 5, 2020 | | October 15, 2015 |
| Artisan Global Opportunities Fund (“Global Opportunities Fund”) | | September 22, 2008 | | April 1, 2015 | | July 26, 2011 |
| Artisan Global Unconstrained Fund (“Global Unconstrained Fund”) | | March 31, 2022 | | March 31, 2022 | | March 31, 2022 |
| Artisan Global Value Fund (“Global Value Fund”) | | December 10, 2007 | | April 1, 2015 | | July 17, 2012 |
| Artisan High Income Fund (“High Income Fund”) | | March 19, 2014 | | March 19, 2014 | | October 3, 2016 |
| Artisan International Fund (“International Fund”) | | December 28, 1995 | | April 1, 2015 | | July 1, 1997 |
| Artisan International Explorer Fund (“International Explorer Fund”) | | N/A | | May 16, 2022 | | May 16, 2022 |
| Artisan International Small-Mid Fund (“International Small-Mid Fund”) | | December 21, 2001 | | December 4, 2018 | | April 12, 2016 |
| Artisan International Value Fund (“International Value Fund”) | | September 23, 2002 | | April 1, 2015 | | October 1, 2006 |
| Artisan Mid Cap Fund (“Mid Cap Fund”) | | June 27, 1997 | | April 1, 2015 | | July 1, 2000 |
| Artisan Mid Cap Value Fund (“Mid Cap Value Fund”) | | March 28, 2001 | | April 1, 2015 | | February 1, 2012 |
| Artisan Select Equity Fund (“Select Equity Fund”) | | February 28, 2020 | | February 28, 2020 | | February 28, 2020 |
| Artisan Small Cap Fund (“Small Cap Fund”) | | March 28, 1995 | | February 1, 2017 | | May 7, 2012 |
| Artisan Sustainable Emerging Markets Fund (“Sustainable Emerging Markets Fund”) | | June 2, 2008 | | April 25, 2022 | | June 26, 2006 |
| Artisan Value Fund (“Value Fund”) | | March 27, 2006 | | April 1, 2015 | | July 26, 2011 |
| Artisan Value Income Fund (“Value Income Fund”) | | February 28, 2022 | | February 28, 2022 | | February 28, 2022 |
During the reporting period, Developing World Fund, Floating Rate Fund, Global Discovery Fund, Global Equity Fund, Global Opportunities Fund, Global Value Fund, High Income Fund, International Fund, International Explorer Fund (October 1, 2023 - April 14, 2024), International Small-Mid Fund, International Value Fund, Mid Cap Fund, Mid Cap Value Fund, Small Cap Fund, Value Fund, and Value Income Fund operated as open-end, diversified mutual funds. During the reporting period, Emerging Markets Debt Opportunities Fund, Focus Fund, Global Unconstrained Fund, International Explorer Fund (April 15, 2024 - September 30, 2024), Select Equity Fund, and Sustainable Emerging Markets Fund operated as open-end, non-diversified mutual funds. At a special meeting of shareholders of International Explorer Fund held on April 15, 2024, shareholders approved a change in the sub-classification of International Explorer Fund from “diversified” to “non-diversified” for purposes of Section 5(b) of the 1940 Act and the elimination of a related fundamental investment restriction, which took effect on April 15, 2024. The investment objective of each Fund (except Developing World Fund, Emerging Markets Debt Opportunities Fund, Floating Rate Fund, Focus Fund, Global Unconstrained Fund, High Income Fund and Value Income Fund) is to seek long-term capital growth. Developing World Fund’s and Focus Fund’s investment objective is to seek long-term capital appreciation. Emerging Markets Debt Opportunities Fund’s, Floating Rate Fund’s and Global Unconstrained Fund’s investment objective is to provide total return through a combination of current income and long-term capital appreciation. High Income Fund’s investment objective is to provide total return through a combination of current income and capital appreciation. Value Income Fund’s investment objective is to provide total return through a combination of income and capital appreciation. Each Fund has offered shares of capital stock of the classes designated Investor Shares, Advisor Shares and Institutional Shares, since the inception dates listed above, except for International Explorer Fund which only offers Advisor Shares and Institutional Shares. Investor Shares of the Funds are generally available to members of the general public. Advisor Shares of the Funds are generally available for investment only by employee benefit plans, clients of certain financial intermediaries that trade through omnibus accounts and other investors that meet the minimum investment requirements. Institutional Shares are designed for certain employee benefit plans, clients of certain financial intermediaries that trade through omnibus accounts and institutional and other investors who are able to meet the minimum investment requirements.
Each class of shares has equal rights with respect to portfolio assets and voting privileges with respect to a Fund in general. Each class of shares has exclusive voting rights with respect to any matters involving only that class. The classes of a Fund pay
| | NOTES TO FINANCIAL STATEMENTS | |
| | |
pro rata the costs of management of that Fund’s portfolio, including the management fee. Each class of a Fund bears the cost of its own transfer agency and shareholder servicing arrangements, and any other class-specific expenses, which will result in differing expenses by class. Because of the different expenses, the Advisor Shares or Institutional Shares of a Fund typically will have a lower expense ratio and correspondingly higher total return than the Investor Shares of the same Fund.
The investment adviser for each Fund is Artisan Partners Limited Partnership (the “Adviser” or “Artisan Partners”). The Adviser is managed by its general partner, Artisan Investments GP LLC, a Delaware limited liability company wholly owned by Artisan Partners Holdings LP (“Artisan Holdings”). Artisan Holdings is a limited partnership organized under the laws of Delaware whose sole general partner is Artisan Partners Asset Management Inc., a publicly traded Delaware corporation.
Emerging Markets Debt Opportunities Fund and Global Unconstrained Fund may make investments in securities, derivatives and other instruments, directly or through one or more wholly-owned subsidiaries. References herein to each such Fund include references to a subsidiary in respect of the Fund’s investment exposure. The allocation of the Fund’s portfolio in a subsidiary will vary over time. Each such Fund will treat a subsidiary’s assets as assets of the Fund for purposes of determining compliance with various provisions of the 1940 Act applicable to the Fund.
| (2) | Summary of Significant Accounting Policies |
The following is a summary of significant accounting policies of the Funds in effect during the period covered by the financial statements, which were in accordance with United States generally accepted accounting principles (“US GAAP”).
| (a) | Investments in Subsidiaries – Emerging Markets Debt Opportunities Fund and Global Unconstrained Fund may make investments in securities, derivatives and other instruments, directly or through investments in Artisan Emerging Markets Debt Opportunities Subsidiary Ltd. and Artisan Global Unconstrained Subsidiary Ltd., respectively, each a wholly owned subsidiary of the respective Fund organized under the laws of the Cayman Islands (each referred to herein as the “Subsidiary” or collectively the “Subsidiaries”). The consolidated financial statements include the accounts of each Fund and its Subsidiary. All intercompany transactions and balances have been eliminated. As of September 30, 2024 Artisan Emerging Markets Debt Opportunities Subsidiary Ltd. had $3,441,400 in net assets, representing 4.55% of Emerging Markets Debt Opportunities Fund’s net assets and Artisan Global Unconstrained Subsidiary Ltd. had $4,733,349 in net assets, representing 4.00% of Global Unconstrained Fund’s net assets. |
| (b) | Valuation – The net asset value (“NAV”) of the shares of each class of each Fund was determined as of the close of regular session trading on the New York Stock Exchange (“NYSE”) (usually 4:00 p.m., Eastern Time) each day the NYSE was open for regular session trading. For financial reporting purposes, information available subsequent to the close of NYSE trading and up to the date of issuance of the financial statements was considered in determining a fair value for investments held in each Fund and the resulting NAV presented. The NAV of each class of shares was determined by dividing the value of each Fund’s securities and other assets attributed to that class, less its liabilities attributed to that class, by the number of outstanding shares of that class of that Fund. |
In determining each Fund’s NAV for financial reporting purposes, each equity security and exchange traded fund (“ETF”) held by the Fund traded on a securities exchange, or over-the-counter was valued at the closing price on the exchange or market designated by the Funds’ accounting agent or pricing vendor as the principal exchange (each, a “principal exchange”). The closing price provided by the pricing vendor for an exchange may differ from the price quoted elsewhere and may represent information such as last sales price, an official closing price, a closing auction price or other information, depending on exchange or market convention. Absent closing price information for an equity security from the principal exchange, the security was valued using (i) the closing price on another exchange on which the security traded (if such price was made available by a pricing vendor) or (ii) the most recent bid quotation on the principal exchange or, if such bid was not available, from a secondary exchange or in the over-the-counter market. Securities trading primarily outside the US may have fair value factors applied where the applicable trading market was closed or as a result of significant market movements following the close of local trading. Equity-linked securities, such as participation certificates, participation notes or access notes, are valued by referencing the underlying security if market quotations are not readily available. Repurchase agreements and reverse repurchase agreements are valued at cost plus accrued interest. Exchange traded option contracts were valued at the mid price (average of the bid price and ask price) as provided by the pricing vendor at the close of trading on the contract’s principal exchange. Exchange traded futures contracts were valued at the settlement price as provided by the pricing vendor at the close of trading on the principal exchange. Derivatives (including centrally cleared swaps, total return swaps, over-the-counter options on total return swaps, and certain other derivatives) are valued using prices provided by the Funds’ pricing vendors. Prices obtained from independent pricing services may use various observable and unobservable inputs, including, but not limited to, information provided by broker-dealers, pricing formulas, estimates of market values obtained from data relating to investments or securities with similar characteristics and/or discounted cash flow or spread
| | NOTES TO FINANCIAL STATEMENTS | |
| | |
curve models that might be applicable. Shares of open-end investment companies (excluding exchange traded funds) were valued at the latest net asset value reported by the investment company.
Fixed income securities, including loan participation notes, are fair valued using prices from the Funds' pricing vendors. Such prices were generally evaluations based on the judgment of the Funds’ pricing vendors, which may consider, among other factors, the prices at which securities actually trade, broker-dealer quotations, pricing formulas, estimates of market values obtained from yield data relating to investments or securities with similar characteristics and/or discounted cash flow models that might be applicable.
Rule 2a-5 under the 1940 Act (“Rule 2a-5”), established requirements for determining fair value in good faith for purposes of the 1940 Act. Rule 2a-5 permits fund boards to designate certain parties to perform fair value determinations, subject to board oversight and certain other conditions. Rule 2a-5 also defines when market quotations are “readily available” for purposes of Section 29(a)(41) of the 1940 Act, which requires a fund to fair value a security when market quotations are not readily available. Separately, Rule 31a-4 under the 1940 Act sets forth the recordkeeping requirements associated with fair value determinations. The Funds adopted a valuation policy compliant with Rule 2a-5 and Rule 31a-4, without resulting in a material impact to the Funds. Artisan Partners was designated by the board of directors as the valuation designee for the Funds pursuant to Rule 2a-5. In its capacity as valuation designee, Artisan Partners, among other things, is responsible for establishing a valuation committee to establish fair valuation methodologies and determining, in good faith, the fair value of all of the assets of the Funds for which there are no readily available market quotations. Securities or other assets for which market quotations are not readily available are valued by Artisan Partners, as valuation designee, in accordance with Procedures for Valuation of Portfolio Securities by Artisan Partners Limited Partnership and under the general oversight of Artisan Partners Funds’ board of directors. A market quotation will be considered not readily available, and a Fund may therefore use fair value pricing, if there are not quoted prices (unadjusted) in active markets for identical investments that a Fund can access at the measurement date, and/or any such quotation is not deemed reliable.
When fair value pricing is employed, the value of a security or asset used by a Fund to calculate its NAV may differ from quoted or published prices for the same security or asset. Estimates of fair value utilized by the Funds as described above could differ from the value realized on the sale of those securities or assets in the future and the differences may be material to the NAV of the applicable Fund.
| (c) | Taxes – No provision was made for federal income taxes or excise taxes since each Fund intends to (i) comply with the provisions of Subchapter M of the Internal Revenue Code applicable to regulated investment companies and (ii) distribute to its shareholders substantially all of its taxable income as well as net realized gains from the sale of investment securities. The Funds utilize earnings and profits distributed to shareholders on redemptions of Fund shares as part of the dividends paid deduction. |
The Funds have analyzed the tax positions taken or expected to be taken, on federal income tax returns for all remaining open tax years (fiscal years 2021 through 2024) and have concluded that, as of September 30, 2024, no provision for income tax would be required in the Funds’ financial statements. The Funds’ federal and state income and federal excise tax returns for tax years for which the applicable statutes of limitations have not expired are subject to examination by the Internal Revenue Service and Wisconsin Department of Revenue.
As of and during the year ended September 30, 2024, the Funds did not have any liabilities for unrecognized tax benefits. The Funds recognize interest and penalties, if any, related to unrecognized tax benefits as income tax expense in the Statements of Operations. During the year ended September 30, 2024, the Funds did not incur any material interest or penalties.
The Funds are subject to taxes imposed on foreign dividend income and realized and unrealized gains on securities traded in certain foreign countries in which the Funds invest. Withholding taxes on foreign dividends have been accrued based on the Funds' understanding of the applicable country’s tax rules and rates. Foreign taxes imposed on realized and unrealized gains was based on the Funds’ understanding of the applicable country’s tax rules and rates and, if applicable, was recorded on an accrual basis and is included in “Net realized gain (loss) on investments” and “Net increase (decrease) in unrealized appreciation or depreciation on investments”, as applicable, on the accompanying Statements of Operations. The amount of foreign tax owed, if any, is included in “Payable for foreign taxes” on the accompanying Statements of Assets and Liabilities and is comprised of withholding taxes on foreign dividends and taxes on realized and unrealized gains.
| (d) | Portfolio Transactions – For financial reporting purposes, security transactions and shareholder transactions were recorded on trade date in accordance with US GAAP. Net realized gains and losses on securities were computed on specific security lot identification. |
| | NOTES TO FINANCIAL STATEMENTS | |
| | |
| (e) | Restricted Securities – The Funds may invest in securities that are subject to restrictions on resale and there may be no liquid secondary market or ready purchaser for such securities. These securities generally may be resold in transactions exempt from registration or to the public if the securities are registered. Disposal of these securities may involve time consuming negotiations and expenses, and prompt sale at an acceptable price may be difficult. Information regarding restricted securities, if any, is included in the footnotes to each Fund’s Schedule of Investments. |
| (f) | Foreign Currency Translation – Values of foreign investments, open foreign currency forward contracts, payables for foreign taxes, payables and receivables for securities transactions, dividend and reclaim receivables, other receivables and payables, and cash denominated in a foreign currency were translated into US dollars using a spot market rate of exchange as of the time of determination of each Fund’s NAV on the day of valuation. Purchases and sales of investments and dividend and interest income were translated into US dollars using the current spot market rate of exchange on the date of such transactions. The portion of security gains or losses resulting from changes in foreign exchange rates was included with net realized and unrealized gain or loss from investments, as appropriate, for both financial reporting and tax purposes. |
The Funds may enter into foreign currency spot contracts and foreign currency forward contracts. Foreign currency spot contracts are typically used to facilitate the purchase and sale of non-US securities and generally settle within three business days. Foreign currency forward contracts are typically used to hedge against foreign currency exchange rate risks, which the Funds may face as a result of direct or indirect exposure to particular currencies (including through US dollar denominated depositary receipts and equity-linked securities). The Funds could be exposed to loss if the counterparties fail to perform under these contracts. Open foreign currency spot contracts and foreign currency forward contracts, if any, were recorded at market value and unrealized gains and losses on foreign currency forward contracts are presented separately on the Statements of Assets and Liabilities and included in other assets less liabilities in the Schedules of Investments. Realized and unrealized gains and losses were reported as foreign currency related transactions and are recorded in the Statements of Operations. For tax purposes, these foreign exchange gains and losses were treated as ordinary income or loss.
Other foreign currency related transaction gains and losses may result from currency gains and losses realized on the difference between the amounts of dividends and foreign taxes accrued on the Funds’ books and the US dollar equivalent of the amounts actually received or paid. The net increase (decrease) in unrealized appreciation or depreciation on foreign currency related transactions arose from changes in the values of assets and liabilities, other than investments in securities, resulting from changes in foreign exchange rates.
| (g) | Depositary Receipts – Each Fund may invest in depositary receipts. Depositary receipts are typically issued by a financial institution (a “depositary”), evidencing ownership interests in a security issued by an issuer and deposited with the depositary. |
| (h) | Equity-Linked Securities and Credit-Linked Notes – Each Fund, except Mid Cap Value Fund and Small Cap Fund, may invest in equity-linked securities. Emerging Markets Debt Opportunities Fund and Global Unconstrained Fund may invest in credit-linked notes. Equity-linked securities and credit-linked notes are designed to provide synthetic exposure to one or more underlying securities. An investment in an equity-linked security or credit-linked note typically entitles the holder to a return equal to the market return of the underlying security or securities. There is no off-balance sheet risk associated with the equity-linked securities or credit-linked notes that the Funds purchase and, in those cases, the Funds’ potential loss is limited to the purchase price of the securities. The Funds are exposed to credit risk associated with the counterparty to the transaction. |
| (i) | Use of Estimates – The preparation of financial statements in conformity with US GAAP requires management to make estimates and assumptions that affect the reported amounts and disclosures in the financial statements. Actual results could differ from those estimates. |
| (j) | Indemnifications – Artisan Partners Funds indemnifies its officers and directors for certain liabilities that may arise from the performance of their duties to Artisan Partners Funds. In the normal course of business, the Funds also enter into contracts in which the Funds agree to indemnify the other party or parties against various potential costs or liabilities. A Fund’s maximum exposure under such arrangements is unknown. As of September 30, 2024, no claim has been made for indemnification pursuant to any such agreement of the Funds. |
| (k) | When-Issued/Delayed Delivery Securities – Each Fund may purchase or sell when-issued and delayed delivery securities. Securities purchased on a when-issued or delayed delivery basis are purchased for delivery beyond the normal settlement date at a stated price, and no income accrues to the Fund on such securities prior to delivery date. Payment and delivery for when-issued and delayed delivery securities can take place a month or more after the date of the transaction. Purchasing securities on a when-issued or delayed delivery basis may involve a risk that the market price at the time of delivery may be lower than the agreed upon purchase price. |
| (l) | Unfunded Commitments – Pursuant to the terms of certain term loan agreements, Emerging Markets Debt Opportunities Fund, |
| | NOTES TO FINANCIAL STATEMENTS | |
| | |
Floating Rate Fund, Global Unconstrained Fund, and High Income Fund may be obligated to fund term loan commitments at the borrower’s discretion. During the year, Floating Rate Fund and High Income Fund had unfunded loan commitments, which were recorded at market value. Unrealized gains and losses are presented separately on the Statements of Operations. As of September 30, 2024, Floating Rate Fund had unfunded loan commitments in the amount of $183,690.
| (m) | Redemption Fees – Emerging Markets Debt Opportunities Fund, Floating Rate Fund, Global Unconstrained Fund and High Income Fund generally impose a 2% redemption fee on the redemption or exchange of shares owned for 90 days or less. Redemption fees were recorded as a reduction in the cost of shares redeemed and had the primary effect of increasing paid-in capital. Each Fund reserves the right to waive or reduce the 2% redemption fee on shares held 90 days or less at its discretion when the Fund believes such waiver is in the best interest of the Fund, including, but not limited to, when it determines that imposition of the redemption fee is not necessary to protect the Fund from the effects of short- term trading. During the year ended September 30, 2024, Emerging Markets Debt Opportunities Fund, Floating Rate Fund, Global Unconstrained Fund and High Income Fund waived the redemption fee for shares held by certain authorized agents or other Fund intermediaries and otherwise in accordance with the Funds’ prospectus. |
| (n) | Securities Sold Short – The Funds may sell securities short or maintain a short position in anticipation of the decline in the market value of a particular security (a short sale), including securities that the Funds do not own. To complete a short sale, the Funds must borrow the security to make delivery to the buyer. The Funds are required to pay the lender any dividends or interest on the security, which accrues during the period of the loan. |
In order to terminate the short sale, the Fund that borrowed the security is obligated to return the security borrowed by purchasing it at market price at the time of termination. The price of the security at termination may differ from the price at which the security was sold. The Fund will incur a loss, as a result of the short sale, if the price of the security increases between the date of the short sale and when the Fund terminates the short sale. This loss may be unlimited. The Fund will realize a gain if the security declines in price between those dates. The gain is limited to the price at which the Fund sold the security short. The amount of any economic gain will be decreased, and the amount of any economic loss increased, by the amount of any premium, dividends or interest the Fund may be required to pay in connection with a short sale.
The Funds may reinvest short sale proceeds. Because the Funds may invest the proceeds of a short sale, the effect of short selling is similar to the effect of leverage. The Funds incur expenses as a result of executing short sales.
During the year ended September 30, 2024, Emerging Markets Debt Opportunities Fund and Global Unconstrained Fund engaged in short sales and paid interest on securities sold short, which is included in Interest in the Statements of Operations. For the year ended September 30, 2024, Emerging Markets Debt Opportunities Fund and Global Unconstrained Fund incurred fees and expenses on short sales, which is included in other operating expenses in the Statements of Operations. As of September 30, 2024, Global Unconstrained Fund had open short sale positions.
| (o) | Repurchase Agreements - Repurchase agreements are transactions in which a Fund purchases a security from a bank or recognized securities dealer and simultaneously commits to resell that security to the bank or dealer at an agreed-upon price, date and market rate of interest unrelated to the coupon rate or maturity of the purchased security. Although repurchase agreements carry certain risks not associated with direct investments in securities, a Fund will enter into repurchase agreements only with banks and dealers believed by Artisan Partners to present acceptable credit risks. Artisan Partners will review and monitor the creditworthiness of such institutions and will consider the capitalization of the institution, Artisan Partners’ prior dealings with the institution, any rating of the institution’s senior long-term debt by independent rating agencies and other relevant factors. The terms of a repurchase agreement entered to settle a short sale may provide that the cash purchase price paid by the Fund is more than the value of purchased securities that effectively collateralize the repurchase price payable by the counterparty. |
To the extent that the proceeds from any sale of collateral upon a default in the obligation to repurchase were less than the repurchase price, the Fund would suffer a loss. If the financial institution that is party to the repurchase agreement petitions for bankruptcy or otherwise becomes subject to bankruptcy or other liquidation proceedings, there may be restrictions on the Fund’s ability to sell the collateral and the Fund could suffer a loss. However, with respect to financial institutions whose bankruptcy or liquidation proceedings are subject to the US Bankruptcy Code, each Fund intends to comply with provisions under the Bankruptcy Code that would allow it immediately to resell such collateral. Emerging Markets Debt Opportunities Fund and Global Unconstrained Fund held repurchase agreements during the year ended September 30, 2024.
| (p) | Reverse Repurchase Agreements - The Funds may enter into reverse repurchase agreements with banks and securities dealers. A reverse repurchase agreement is a repurchase agreement in which a Fund is the seller of, rather than the investor in, securities and agrees to repurchase them at an agreed-upon time and price. Use of a reverse repurchase agreement may be preferable to a regular sale and later repurchase of securities because it avoids certain market risks and transaction |
| | NOTES TO FINANCIAL STATEMENTS | |
| | |
costs. The gross amount of cash received in exchange for securities sold plus accrued interest payments to be made by the Fund to counterparties are reflected as a reverse repurchase agreements on the Statement of Assets and Liabilities. Reverse repurchase agreements are recorded at contract value. Fair value of such agreements is equivalent to contract value and would represent Level 2 Investments. Interest payments made on reverse repurchase agreements are recorded as a component of interest expense on the Statement of Operations.
For the year ended September 30, 2024, the average borrowings for Emerging Markets Debt Opportunities Fund and Global Unconstrained Fund were $778,031 over 83 days and $1,663,988 over 14 days, respectively. The average borrowing rate for each fund was 5.70% and 5.06%, respectively.
| (q) | Securities Lending – In order to generate incremental revenue, a Fund may participate in a securities lending program, in which securities from its portfolio may be loaned to third parties. As a matter of policy, securities loans by such Funds are made to broker-dealers or other financial institutions pursuant to agreements requiring that the loans be continuously secured by collateral consisting of cash or short-term debt obligations at least equal at all times to the value of the securities on loan, “marked-to-market” daily. The risks in lending portfolio securities, as with other extensions of credit, include possible delay in recovery of the securities or possible loss of rights in the collateral should the borrower fail financially. If a borrower defaults, the value of the collateral may decline before a Fund can dispose of it. The borrower pays to a participating Fund an amount equal to any dividends or interest received on securities lent (known as “manufactured payments” or “substitute payments”). Manufactured payments for dividends or interest received by a participating Fund while its securities are loaned out will not be considered qualified dividend income and will have other tax implications. To the extent that a Fund makes a distribution of income received by the Fund pursuant to loans of its portfolio securities, such income will not constitute qualified dividend income to noncorporate shareholders and will not be eligible for the dividends-received deduction for corporate shareholders. A participating Fund retains all or a portion of the interest or dividend received on investment of the cash collateral and/or receives a fee from the borrower. The Funds will typically invest cash collateral in government money market funds. A participating Fund bears the risk of any loss on the investment of the collateral; any such loss may exceed, potentially by a substantial amount, any profit to the Fund from its securities lending activities. A participating Fund may recall loaned securities on demand. |
Goldman Sachs Bank USA, doing business as Goldman Sachs Agency Lending (“GSAL”), currently serves as the securities lending agent for the Funds. GSAL receives as compensation for its services a portion of the amount earned by each Fund for lending securities.
Income from the securities lending program is recorded when earned or as soon as reliable information became available from the lending agent. Net income for each Fund is reflected in the Statements of Operations under “Income from securities lending.” During the year ended September 30, 2024, Global Discovery Fund, Global Equity Fund, High Income Fund, International Fund, International Value Fund, Mid Cap Value Fund, Small Cap Fund, Sustainable Emerging Markets Fund, and Value Income Fund participated in the securities lending program. As of September 30, 2024, International Fund, International Value Fund, High Income Fund, and Sustainable Emerging Markets Fund had securities on loan.
| (r) | ReFlow Liquidity Program – The Funds may participate in the ReFlow Fund, LLC (“ReFlow”) liquidity program (“Program”), which is designed to provide an alternative liquidity source for mutual funds experiencing net redemptions of their shares. Pursuant to the Program, ReFlow provides participating mutual funds (such as the Funds) with a source of cash to meet all, or a portion, of net shareholder redemptions. Following purchases of a Fund’s shares, ReFlow then generally redeems those shares when the Fund experiences net sales, at the end of a maximum holding period determined by ReFlow or at other times at ReFlow’s or Artisan Partners’ discretion. For use of the ReFlow service, a Fund pays a fee to ReFlow each time it purchases Fund shares, calculated by applying to the purchase amount a fee rate determined through an automated daily auction among participating mutual funds. The current minimum fee rate is 14 basis points of the value of the Fund shares purchased by ReFlow, although a Fund may submit a bid at a higher fee rate if it determines that doing so is in the best interest of the Fund and its shareholders. In accordance with federal securities laws, ReFlow is prohibited from acquiring more than 3% of the outstanding voting securities of a Fund. ReFlow will not be subject to the Funds’ investment minimums, redemption fees, if applicable, or trading that is considered inappropriate, which may include frequent or short-term trading. ReFlow will periodically redeem its entire share position in a Fund and request that such redemption be met in-kind in accordance with Artisan Partners Funds’ policy on purchases and redemptions in-kind. During the year ended September 30, 2024, Focus Fund, Global Opportunities Fund, Mid Cap Value Fund and Value Fund participated in the ReFlow program. Fees associated with ReFlow are disclosed in the Statement of Operations. Certain offsetting benefits of utilizing the ReFlow service, such as reduced transactions costs, may impact net increase in net assets resulting from operations in the Statements of Operations. The shares ReFlow subscribed to, redemptions-in-kind, fees and total expense ratio (“TER”) impact during the year were as follows: |
| | NOTES TO FINANCIAL STATEMENTS | |
| | |
| Fund | | | Shares ReFlow Subscribed to | | | | Redemptions-in-kind (in thousands) | | | | ReFlow Fees (in thousands) | | | | Impact to TER | |
| Focus | | | 1,967,948 | | | $ | 32,248 | | | $ | 61 | | | | .01% | |
| Global Opportunities | | | 17,337,884 | | | | 566,430 | | | | 813 | | | | .03 | |
| Mid Cap Value | | | 10,816,189 | | | | 165,365 | | | | 236 | | | | .02 | |
| Value | | | 1,180,411 | | | | 16,275 | | | | 24 | | | | .01 | |
| (s) | Other – Dividend income less foreign taxes accrued or withheld, if any, was generally recorded on the ex-dividend date. In some cases, information was not available to the Funds on the ex-dividend date. In such cases, which may have included private placements and foreign securities, dividends were recorded, revised or canceled as soon after the ex-dividend date as reliable information became available to the Funds. Non-cash dividends related to corporate actions, if any, were included in dividend income, and generally recorded at the fair market value of securities received. Interest income was recorded on the accrual basis and included accretion of discounts and amortization of premiums. Distributions to shareholders were recorded on the ex-dividend date. Expenses attributable to the Funds were generally allocated to each Fund based on net assets. However, other expense allocation methodologies were also used, depending on the nature of the expense item. Income and expenses not specific to a particular class and realized and unrealized gains and losses were allocated daily to each class of shares based upon the relative net asset value of outstanding shares. Expenses attributable to a particular Fund or class were allocated directly to that Fund or class, respectively. |
The character of income and net realized gains and losses may differ in some instances for financial statement and tax purposes and may result in reclassification of permanent differences among certain capital accounts to more appropriately conform financial accounting to tax characterizations of dividend and capital gain distributions.
Like all mutual funds, the Funds take investment risks and it is possible for a shareholder to lose money by investing in a Fund. Investors in each Fund should have a long-term perspective and be able to tolerate potentially sharp declines in value. This section describes certain of the principal risks associated with investing in each Fund, but is not a complete list of every risk involved in investing in each Fund and the Fund may be exposed to additional risks not listed below. An investment in a Fund is not a bank deposit, and is not insured or guaranteed by the Federal Deposit Insurance Corporation ("FDIC") or any other government agency.
The success of a Fund is dependent on such Fund’s investment team’s investment decisions, which are based, in part, on the research process employed by the Fund’s investment team. The portfolio securities selected by the investment team may decline in value or not increase in value when the market indices, including relevant benchmark indices, are rising, in which case the Fund could experience losses regardless of the performance of the market indices. To the extent an investment team considers environmental, social and governance factors in its research process, such Fund may forgo certain investment opportunities and underperform funds that do not consider environmental, social and governance factors.
Markets may perform poorly and the returns from the securities in which a Fund invests may underperform returns from the general securities markets. Securities markets may experience periods of high volatility and reduced liquidity in response to governmental actions, intervention and/or policies, economic or market developments, or other external factors. The value of a company’s securities may rise or fall in response to company, market, economic or other news.
A widespread health crisis such as a global pandemic could cause substantial market volatility, exchange-trading suspensions and closures, impact the ability to complete redemptions, impact Artisan Partners Funds and its service providers’ business functions and affect Fund performance. For example, the global outbreak of the 2019 novel coronavirus (“COVID-19”), together with resulting voluntary and governmental actions, including, without limitation, mandatory business closures, public gathering limitations, restrictions on travel and quarantines, meaningfully disrupted the global economy and markets.
Foreign securities may underperform US securities and may be more volatile than US securities. Risks relating to investments in foreign securities (including, but not limited to, depositary receipts and equity-linked securities) and to securities of issuers with significant exposure to foreign markets include: currency exchange rate fluctuation; less available public information about the issuers of securities; less stringent regulatory standards; lack of uniform accounting, auditing and financial reporting standards; and country risks including less liquidity, high inflation rates, unfavorable economic practices, political instability and expropriation and nationalization risks.
In addition, geopolitical events adversely affect global economies and securities markets, subjecting a Fund’s investments to related risks. War, terrorism, global health crises and pandemics, sanctions, tariffs, the imposition of exchange controls or other
| | NOTES TO FINANCIAL STATEMENTS | |
| | |
crossborder trade barriers and other geopolitical events have led, and in the future may lead, to increased market volatility and may have adverse short- or long-term effects on the US and world economies and markets generally.
Economists and others have expressed increasing concern about the potential effects of global climate change on property and security values. Certain issuers, industries and regions may be adversely affected by the impacts of climate change, including on the demand for and the development of goods and services and related production costs, and the impacts of legislation, regulation and international accords related to climate change, as well as any indirect consequences of regulation or business trends driven by climate change.
Investment risks typically are greater in emerging and developing markets. For example, in addition to the risks associated with investments in any foreign country, political, legal and economic structures in these less developed countries may be new and changing rapidly, which may cause instability and greater risk of loss. The securities markets may be less developed, and securities in those markets are generally more volatile and less liquid than those in developed markets. Investing in emerging market countries may involve substantial risk due to, among other reasons, limited information; higher brokerage costs; different accounting, auditing and financial reporting standards; less developed legal systems and thinner trading markets as compared to those in developed countries; different clearing and settlement procedures and custodial services; and currency blockages or transfer restrictions. Emerging market countries also are more likely to experience higher levels of inflation, deflation or currency devaluations, which could hurt their economies and securities markets. Certain emerging markets also may face other significant internal or external risks, including a heightened risk of war and ethnic, religious and racial conflicts. In addition, governments in many emerging market countries participate to a significant degree in their economies and securities markets, which may impair investment and economic growth of companies in those markets. Such markets may also be heavily reliant on foreign capital and, therefore, vulnerable to capital flight.
The values of debt securities change in response to various factors, including, for example, market related factors, such as changes in interest rates or changes in the actual or perceived ability of an issuer to meet its obligations. In general, the value of a debt security may fall in response to increases in interest rates. Each Fund that may invest in fixed income securities may invest in debt securities without considering the maturity of the investment. The value of a security with a longer duration will generally be more sensitive to changes in interest rates than a similar security with a shorter duration. As a result, changes in interest rates in the US and outside the US may affect each Fund’s debt investments unfavorably.
An issuer or counterparty may fail to pay its obligations to a Fund when they are due. Financial strength and solvency (or the perceived financial strength or solvency) of an issuer are the primary factors influencing credit risk. Changes in the financial condition of an issuer or counterparty, changes in specific economic, social or political conditions that affect a particular type of security or other instrument of an issuer, and changes in economic, social or political conditions generally can increase the risk of default by an issuer or counterparty, which can affect a security’s or other instrument’s credit quality or value and an issuer’s or counterparty’s ability to pay interest and principal when due. The values of lower quality debt, including loans, tend to be particularly sensitive to these changes.
Debt securities in which a Fund invests may be rated below investment grade or be unrated securities that are determined by the Adviser to be of comparable quality. Debt securities of below investment grade quality are high yield, high risk bonds, commonly known as “junk bonds.” These bonds are predominantly speculative. They are usually issued by companies without long track records of sales and earnings, or by companies with questionable credit strength. These bonds have a higher degree of default risk and may be less liquid than higher-rated bonds.
Investments in loans, including floating or adjustable rate loans, are generally subject to the same risks as investments in other types of debt obligations, including, among others, the credit risk of nonpayment of principal and interest. In addition, in many cases loans are subject to the risks associated with below investment grade securities. Floating Rate Fund and High Income Fund may invest in loans made in connection with highly leveraged transactions, which are subject to greater credit and liquidity risks than other types of loans. Although the loans in which a Fund invests may be secured by specific collateral, there can be no assurance that liquidation of such collateral would satisfy the borrower’s obligation in the event of nonpayment of scheduled interest or principal, or that such collateral could be readily liquidated. In the event of the bankruptcy of a borrower, a Fund could experience delays or limitations with respect to its ability to realize the benefits of the collateral securing a loan or could recover nothing of what it is owed on the loan. Uncollateralized (i.e., non-secured) loans are subject to greater risk of loss (i.e., nonpayment) in the event of default than secured loans since they do not afford a Fund recourse to collateral. Investments in loans may be difficult to value and may be illiquid, including due to legal or contractual restrictions on resale. Transactions in many loans settle on a delayed basis, and a Fund may not receive the proceeds from the sale of a loan for a substantial period after the sale. As a result, sale proceeds related to the sale of loans may not be available to make additional investments or meet redemption obligations until a substantial period after the sale of the loans.
| | NOTES TO FINANCIAL STATEMENTS | |
| | |
Although The London Interbank Offered Rate (“LIBOR”) is no longer published as of June 30, 2023, LIBOR and other inter-bank lending rates and indices (together with LIBOR, the “IBORs”) are the subject of ongoing national and international regulatory reform. Most, but not all, LIBOR settings are now transitioned to alternative near risk-free rates (“RFRs”). It is expected that the financing arrangements entered into by a Fund will therefore likely reference an RFR as the applicable interest rate. The RFRs are conceptually and operationally different from LIBOR. For example, overnight rate RFRs may only be determinable on a “backward” looking basis and therefore are only known at the end of an interest period, whereas LIBOR was a “forward” looking rate. Moreover, certain RFRs (such as Secured Overnight Financing Rate or “SOFR” for U.S. dollar debt) are not well established in the market, and all RFRs remain novel in comparison to LIBOR. There consequently remains some uncertainty as to what the economic, accounting, commercial, tax and legal implications of the use of RFRs will be and how they will perform over significant time periods, particularly as market participants are still becoming accustomed to the use of such benchmarks. Given the relative novelty of the use of RFRs in financial markets, the exact impact of the use of the RFRs remains to be seen. All of the aforementioned may adversely affect a Fund’s investments (including in respect of its volatility, value and liquidity) and, as a result, its performance and/or NAV.
As non-diversified funds, Emerging Markets Debt Opportunities Fund, Focus Fund, Global Unconstrained Fund, International Explorer Fund, Select Equity Fund, and Sustainable Emerging Markets Fund may invest a larger portion of their assets in securities of a smaller number of issuers than a diversified fund, which means a single issuer’s performance may affect Fund performance more than if the Fund were invested in a larger number of issuers.
Operational failures, cyber-attacks or other disruptions that affect the Funds’ service providers, the Funds’ counterparties, other market participants or the issuers of securities held by the Funds may adversely affect the Funds and their shareholders, including by causing losses for the Funds or impairing Fund operations.
A Fund’s use of derivatives may involve risks different from, or greater than, the risks associated with investing in more traditional investments, such as stocks and bonds. Derivatives can be highly complex and may perform in ways unanticipated by Artisan Partners. For example, changes in the value of a derivative may not correlate perfectly with, and may be more sensitive to market events than, the underlying asset, rate or index. The skills needed to successfully execute derivative strategies may be different from those needed for other types of transactions. If a Fund incorrectly forecasts the value and/or creditworthiness of securities, currencies, interest rates, counterparties or other economic factors involved in a derivative transaction, the Fund might have been in a better position if the Fund had not entered into such derivative transaction.
In addition to the risks of an adverse change in the value of the underlying reference asset, a Fund’s use of derivatives, including, but not limited to, over-the-counter (“OTC”) derivatives, involves the risk that the other party to the derivative contract will fail to make required payments or otherwise to comply with the terms of the contract. Derivatives transactions can create investment leverage and may be highly volatile, and a Fund could lose more than the amount it invests, especially in unusual or extreme market conditions. Derivatives may be difficult to value and highly illiquid, and a Fund may not be able to close out or sell a derivative position at a particular time or at an anticipated price.
US and non-US legislative and regulatory reforms, including those related to the Dodd-Frank Wall Street Reform and Consumer Protection Act, have resulted in, and may in the future result in, new regulation of derivative instruments and a Fund’s use of such instruments. New regulations could, among other things, restrict a Fund’s ability to engage in derivative transactions (for example, by making certain types of derivative instruments or transactions no longer available to the Fund) and/or increase the costs of such transactions, and a Fund may as a result be unable to execute its investment strategies in a manner Artisan Partners might otherwise choose. In connection with Rule 18f-4 under the 1940 Act, the Funds have adopted a derivatives risk management program that takes into account how a Fund’s derivatives use affects its investment portfolio strategy, including whether derivatives are used to increase or decrease portfolio risks or facilitate efficient portfolio management.
Emerging Markets Debt Opportunities Fund’s and Global Unconstrained Fund’s investments in debt obligations of sovereign governments may lose value due to the government entity’s unwillingness or inability to repay principal and interest when due in accordance with the terms of the debt or otherwise in a timely manner. Sovereign governments may default on their debt obligations for a number of reasons, including social, political, economic and diplomatic changes in countries issuing sovereign debt.
| (4) | Fair Value Measurements: |
Under US GAAP for fair value measurement, accounting standards clarify the definition of fair value for financial reporting, establish a framework for measuring fair value and require additional disclosures about the use of fair value measurements. In accordance with this standard, fair value is defined as the price that each Fund would receive upon selling an asset or purchasing a liability in an orderly transaction to/from an independent buyer in the principal or most advantageous market of the investment.
| | NOTES TO FINANCIAL STATEMENTS | |
| | |
The standard establishes a three-tier hierarchy to distinguish between (1) inputs that reflect the assumptions market participants would use in pricing an asset or liability developed based on the market data obtained from sources independent of the reporting entity (observable inputs) and (2) inputs that reflect the reporting entity’s own assumptions about the assumptions market participants would use in pricing an asset or liability developed based on the best information available in the circumstances (unobservable inputs) and to establish classification of fair value measurements for disclosure purposes. Various inputs are used in determining the value of the Funds’ investments. The three-tier hierarchy of inputs is summarized in three broad levels:
| ● | Level 1 – unadjusted quoted prices in active markets for identical investments |
| ● | Level 2 – other significant observable inputs (including but not limited to quoted prices for similar securities, interest rates, credit risks and securities trading primarily outside the US where the applicable trading market was closed or factors were applied to prices as a result of significant market movements following the close of local trading) |
| ● | Level 3 – significant unobservable inputs (including the Funds’ own assumptions in determining a fair value of investments and discounts for lack of marketability) |
The inputs or methodology used for valuing securities are not necessarily an indication of the risk or liquidity associated with investing in those securities. A description of the valuation techniques for the Funds’ major classes of assets are found in Note 2(b). A description of the fair value leveling techniques are described below:
Equity securities, ETFs, investment companies, exchange traded options contracts and exchange traded futures contracts are generally categorized as Level 1. Bank loans, corporate bonds, equity-linked securities, foreign currency forward contracts, treasury bills, other derivatives, foreign equity securities in which the closing price or bid quotation are adjusted for significant events, or local market holidays or other unscheduled market closures, are generally categorized as Level 2. Securities fair valued in good faith by the valuation committee are generally categorized as Level 2 or 3, depending on the observability of the inputs utilized.
The following table summarizes each Fund’s investments by major security type, based on the inputs used to determine their fair values as of September 30, 2024 (in thousands). Refer to each Fund's Schedule of Investments for industry or country classifications.
| Fund | | Level 1 - Unadjusted
Quoted Prices | | | Level 2 - Other Significant
Observable Inputs | | | Level 3 - Significant
Unobservable Inputs | | | Total | |
| Developing World | | | | | | | | | | | | |
| Common Stocks | | | | | | | | | | | | |
| Americas | | $ | 1,174,586 | | | $ | — | | | $ | — | | | $ | 1,174,586 | |
| Emerging Markets | | | 1,513,545 | | | | — | | | | — | | | | 1,513,545 | |
| Europe | | | 410,512 | | | | — | | | | — | | | | 410,512 | |
| Pacific Basin | | | 407,589 | | | | — | | | | — | | | | 407,589 | |
| Investment Company | | | 80,325 | | | | — | | | | — | | | | 80,325 | |
| Total Investments | | | 3,586,557 | | | | — | | | | — | | | | 3,586,557 | |
| | | | | | | | | | | | | | | | | |
| Emerging Markets Debt Opportunities | | | | | | | | | | | | | | | | |
| Sovereign Government Bonds and Credit-Linked Notes | | | — | | | | 43,088 | | | | 817 | | | | 43,905 | |
| Corporate Bonds | | | — | | | | 13,699 | | | | — | | | | 13,699 | |
| Bank loans | | | — | | | | — | | | | 1,939 | | | | 1,939 | |
| Sovereign Government Treasury Bills | | | — | | | | 6,929 | | | | — | | | | 6,929 | |
| U.S. Treasury Obligation | | | — | | | | 1,195 | | | | — | | | | 1,195 | |
| Investment Companies | | | 386 | | | | — | | | | — | | | | 386 | |
| Total Investments | | | 386 | | | | 64,911 | | | | 2,756 | | | | 68,053 | |
| Forward Currency Contracts(1)(2) | | | — | | | | 138 | | | | — | | | | 138 | |
| Futures(1)(3) | | | (62 | ) | | | — | | | | — | | | | (62 | ) |
| Centrally Cleared Credit Default Swaps(1)(4) | | | — | | | | (5 | ) | | | — | | | | (5 | ) |
| Centrally Cleared Interest Rate Swaps(1) | | | — | | | | 699 | | | | — | | | | 699 | |
| Total | | | 324 | | | | 65,743 | | | | 2,756 | | | | 68,823 | |
| | NOTES TO FINANCIAL STATEMENTS | |
| | |
| Fund | | Level 1 - Unadjusted
Quoted Prices | | | Level 2 - Other Significant
Observable Inputs | | | Level 3 - Significant
Unobservable Inputs | | | Total | |
| Floating Rate | | | | | | | | | | | | |
| Bank loans | | $ | — | | | $ | 63,783 | | | $ | — | | | $ | 63,783 | |
| Corporate Bonds | | | — | | | | 2,012 | | | | — | | | | 2,012 | |
| Preferred Stock | | | — | | | | 182 | | | | — | | | | 182 | |
| Common Stocks | | | — | | | | 161 | | | | — | | | | 161 | |
| Warrants | | | — | | | | — | | | | —(5) | | | | — | |
| Investment Company | | | 755 | | | | — | | | | — | | | | 755 | |
| Total Investments | | | 755 | | | | 66,138 | | | | —(5) | | | | 66,893 | |
| | | | | | | | | | | | | | | | | |
| Focus | | | | | | | | | | | | | | | | |
| Common Stocks | | | 1,107,358 | | | | — | | | | — | | | | 1,107,358 | |
| Options Purchased | | | 39,632 | | | | — | | | | — | | | | 39,632 | |
| Investment Company | | | 10,467 | | | | — | | | | — | | | | 10,467 | |
| Total Investments | | | 1,157,457 | | | | — | | | | — | | | | 1,157,457 | |
| Forward Currency Contracts(1)(6) | | | — | | | | (1,505 | ) | | | — | | | | (1,505 | ) |
| Written Options(1) | | | (3,263 | ) | | | — | | | | — | | | | (3,263 | ) |
| Total | | | 1,154,194 | | | | (1,505 | ) | | | — | | | | 1,152,689 | |
| | | | | | | | | | | | | | | | | |
| Global Discovery | | | | | | | | | | | | | | | | |
| Common Stocks | | | | | | | | | | | | | | | | |
| Americas | | | 139,810 | | | | — | | | | — | | | | 139,810 | |
| Emerging Markets | | | 2,251 | | | | — | | | | — | | | | 2,251 | |
| Europe | | | 76,327 | | | | — | | | | — | | | | 76,327 | |
| Pacific Basin | | | 10,591 | | | | — | | | | — | | | | 10,591 | |
| Investment Company | | | 12,033 | | | | — | | | | — | | | | 12,033 | |
| Total Investments | | | 241,012 | | | | — | | | | — | | | | 241,012 | |
| | | | | | | | | | | | | | | | | |
| Global Equity | | | | | | | | | | | | | | | | |
| Common Stocks | | | | | | | | | | | | | | | | |
| Americas | | | 67,971 | | | | — | | | | — | | | | 67,971 | |
| Emerging Markets | | | 7,619 | | | | — | | | | —(5) | | | | 7,619 | |
| Europe | | | 93,901 | | | | — | | | | — | | | | 93,901 | |
| Pacific Basin | | | 7,795 | | | | — | | | | — | | | | 7,795 | |
| Investment Company | | | 1,539 | | | | — | | | | — | | | | 1,539 | |
| Total Investments | | | 178,825 | | | | — | | | | —(5) | | | | 178,825 | |
| | | | | | | | | | | | | | | | | |
| Global Opportunities | | | | | | | | | | | | | | | | |
| Common Stocks | | | | | | | | | | | | | | | | |
| Americas | | | 1,449,106 | | | | — | | | | — | | | | 1,449,106 | |
| Emerging Markets | | | 222,348 | | | | — | | | | — | | | | 222,348 | |
| Europe | | | 569,797 | | | | — | | | | — | | | | 569,797 | |
| Pacific Basin | | | 214,621 | | | | — | | | | — | | | | 214,621 | |
| Investment Company | | | 87,572 | | | | — | | | | — | | | | 87,572 | |
| Total Investments | | | 2,543,444 | | | | — | | | | — | | | | 2,543,444 | |
| | | | | | | | | | | | | | | | | |
| Global Unconstrained | | | | | | | | | | | | | | | | |
| Sovereign Government Bonds | | | — | | | | 64,561 | | | | 1,078 | | | | 65,639 | |
| Corporate Bonds | | | — | | | | 17,405 | | | | — | | | | 17,405 | |
| Common Stocks | | | 4,995 | | | | — | | | | — | | | | 4,995 | |
| Bank loans | | | — | | | | — | | | | 2,652 | | | | 2,652 | |
| Option Purchased | | | 4 | | | | — | | | | — | | | | 4 | |
| Sovereign Government Treasury Bills | | | — | | | | 12,476 | | | | — | | | | 12,476 | |
| Repurchase Agreements | | | — | | | | 3,856 | | | | — | | | | 3,856 | |
| U.S. Treasury Obligation | | | — | | | | 2,782 | | | | — | | | | 2,782 | |
| Investment Companies | | | 1,282 | | | | — | | | | — | | | | 1,282 | |
| Total Investments before securities sold short | | | 6,281 | | | | 101,080 | | | | 3,730 | | | | 111,091 | |
| Common Stocks | | | (2,720 | ) | | | — | | | | — | | | | (2,720 | ) |
| Sovereign Government Bonds | | | — | | | | (3,777 | ) | | | — | | | | (3,777 | ) |
| | NOTES TO FINANCIAL STATEMENTS | |
| | |
| Fund | | Level 1 - Unadjusted
Quoted Prices | | | Level 2 - Other Significant
Observable Inputs | | | Level 3 - Significant
Unobservable Inputs | | | Total | |
| Global Unconstrained (continued) | | | | | | | | | | | | |
| Total Investments after securities sold short | | $ | 3,561 | | | $ | 97,303 | | | $ | 3,730 | | | $ | 104,594 | |
| Forward Currency Contracts(1)(7) | | | — | | | | (392 | ) | | | — | | | | (392 | ) |
| Futures(1)(8) | | | (134 | ) | | | — | | | | — | | | | (134 | ) |
| Centrally Cleared Credit Default Swaps(1)(9) | | | — | | | | (953 | ) | | | — | | | | (953 | ) |
| Centrally Cleared Interest Rate Swaps(1)(10) | | | — | | | | (123 | ) | | | — | | | | (123 | ) |
| OTC Credit Default Swaps(1) | | | — | | | | (12 | ) | | | — | | | | (12 | ) |
| OTC Interest Rate Swaps(1) | | | — | | | | (25 | ) | | | — | | | | (25 | ) |
| Total | | | 3,427 | | | | 95,798 | | | | 3,730 | | | | 102,955 | |
| | | | | | | | | | | | | | | | | |
| Global Value | | | | | | | | | | | | | | | | |
| Common Stocks and Equity-Linked Security | | | | | | | | | | | | | | | | |
| Americas | | | 1,138,786 | | | | — | | | | — | | | | 1,138,786 | |
| Emerging Markets | | | 168,574 | | | | — | | | | — | | | | 168,574 | |
| Europe | | | 1,013,692 | | | | 17,827 | | | | — | | | | 1,031,519 | |
| Investment Company | | | 148,083 | | | | — | | | | — | | | | 148,083 | |
| Total Investments | | | 2,469,135 | | | | 17,827 | | | | — | | | | 2,486,962 | |
| | | | | | | | | | | | | | | | | |
| High Income | | | | | | | | | | | | | | | | |
| Corporate Bonds | | | — | | | | 6,557,408 | | | | — | | | | 6,557,408 | |
| Bank loans | | | — | | | | 1,520,424 | | | | — | | | | 1,520,424 | |
| Common Stocks | | | — | | | | 16,624 | | | | — | | | | 16,624 | |
| Preferred Stock | | | — | | | | 5,435 | | | | — | | | | 5,435 | |
| Warrants | | | — | | | | — | | | | —(5) | | | | — | |
| Investment Company | | | 663,934 | | | | — | | | | — | | | | 663,934 | |
| Total Investments | | | 663,934 | | | | 8,099,891 | | | | —(5) | | | | 8,763,825 | |
| Forward Currency Contracts(1) | | | — | | | | (138 | ) | | | — | | | | (138 | ) |
| Total | | | 663,934 | | | | 8,099,753 | | | | — | | | | 8,763,687 | |
| | | | | | | | | | | | | | | | | |
| International | | | | | | | | | | | | | | | | |
| Common Stocks and Equity-Linked Security | | | | | | | | | | | | | | | | |
| Americas | | | 731,937 | | | | — | | | | — | | | | 731,937 | |
| Emerging Markets | | | 227,520 | | | | — | | | | —(5) | | | | 227,520 | |
| Europe | | | 3,617,901 | | | | 95,414 | | | | — | | | | 3,713,315 | |
| Pacific Basin | | | 326,112 | | | | — | | | | — | | | | 326,112 | |
| Investment Company | | | 167,863 | | | | — | | | | — | | | | 167,863 | |
| Total Investments | | | 5,071,333 | | | | 95,414 | | | | —(5) | | | | 5,166,747 | |
| | | | | | | | | | | | | | | | | |
| International Explorer | | | | | | | | | | | | | | | | |
| Common Stocks | | | | | | | | | | | | | | | | |
| Americas | | | 12,269 | | | | — | | | | — | | | | 12,269 | |
| Emerging Markets | | | 24,765 | | | | — | | | | — | | | | 24,765 | |
| Europe | | | 77,677 | | | | — | | | | — | | | | 77,677 | |
| Pacific Basin | | | 23,425 | | | | — | | | | — | | | | 23,425 | |
| Investment Company | | | 20,669 | | | | — | | | | — | | | | 20,669 | |
| Total Investments | | | 158,805 | | | | — | | | | — | | | | 158,805 | |
| | | | | | | | | | | | | | | | | |
| International Small-Mid | | | | | | | | | | | | | | | | |
| Common Stocks | | | | | | | | | | | | | | | | |
| Americas | | | 1,071,905 | | | | — | | | | — | | | | 1,071,905 | |
| Emerging Markets | | | 299,484 | | | | — | | | | — | | | | 299,484 | |
| Europe | | | 2,062,477 | | | | — | | | | — | | | | 2,062,477 | |
| Middle East | | | 279,350 | | | | — | | | | — | | | | 279,350 | |
| Pacific Basin | | | 800,409 | | | | — | | | | — | | | | 800,409 | |
| Investment Company | | | 163,613 | | | | — | | | | — | | | | 163,613 | |
| Total Investments | | | 4,677,238 | | | | — | | | | — | | | | 4,677,238 | |
| | NOTES TO FINANCIAL STATEMENTS | |
| | |
| Fund | | Level 1 - Unadjusted
Quoted Prices | | | Level 2 - Other Significant
Observable Inputs | | | Level 3 - Significant
Unobservable Inputs | | | Total | |
| International Value | | | | | | | | | | | | |
| Common Stocks and Equity-Linked Security | | | | | | | | | | | | |
| Americas | | $ | 6,265,722 | | | $ | — | | | $ | — | | | $ | 6,265,722 | |
| Emerging Markets | | | 5,130,873 | | | | — | | | | 146,720 | | | | 5,277,593 | |
| Europe | | | 18,469,324 | | | | 722,976 | | | | — | | | | 19,192,300 | |
| Pacific Basin | | | 632,373 | | | | — | | | | — | | | | 632,373 | |
| Investment Company | | | 4,434,581 | | | | — | | | | — | | | | 4,434,581 | |
| Miscellaneous Securities | | | 160,143 | | | | — | | | | — | | | | 160,143 | |
| Total Investments | | | 35,093,016 | | | | 722,976 | | | | 146,720 | | | | 35,962,712 | |
| | | | | | | | | | | | | | | | | |
| Mid Cap | | | | | | | | | | | | | | | | |
| Common Stocks | | | 4,235,975 | | | | — | | | | — | | | | 4,235,975 | |
| Investment Company | | | 55,168 | | | | — | | | | — | | | | 55,168 | |
| Total Investments | | | 4,291,143 | | | | — | | | | — | | | | 4,291,143 | |
| | | | | | | | | | | | | | | | | |
| Mid Cap Value | | | | | | | | | | | | | | | | |
| Common Stocks | | | 1,132,040 | | | | — | | | | —(5) | | | | 1,132,040 | |
| Investment Company | | | 31,368 | | | | — | | | | — | | | | 31,368 | |
| Total Investments | | | 1,163,408 | | | | — | | | | —(5) | | | | 1,163,408 | |
| | | | | | | | | | | | | | | | | |
| Select Equity | | | | | | | | | | | | | | | | |
| Common Stocks | | | 47,775 | | | | — | | | | — | | | | 47,775 | |
| Investment Company | | | 4,205 | | | | — | | | | — | | | | 4,205 | |
| Total Investments | | | 51,980 | | | | — | | | | — | | | | 51,980 | |
| | | | | | | | | | | | | | | | | |
| Small Cap | | | | | | | | | | | | | | | | |
| Common Stocks | | | 1,352,039 | | | | — | | | | — | | | | 1,352,039 | |
| Investment Company | | | 30,595 | | | | — | | | | — | | | | 30,595 | |
| Total Investments | | | 1,382,634 | | | | — | | | | — | | | | 1,382,634 | |
| | | | | | | | | | | | | | | | | |
| Sustainable Emerging Markets | | | | | | | | | | | | | | | | |
| Common Stocks | | | | | | | | | | | | | | | | |
| Americas | | | 2,313 | | | | — | | | | — | | | | 2,313 | |
| Emerging Markets | | | 161,181 | | | | 1,110 | | | | —(5) | | | | 162,291 | |
| Pacific Basin | | | 3,687 | | | | — | | | | — | | | | 3,687 | |
| Investment Company | | | 4,088 | | | | — | | | | — | | | | 4,088 | |
| Total Investments | | | 171,269 | | | | 1,110 | | | | —(5) | | | | 172,379 | |
| | | | | | | | | | | | | | | | | |
| Value | | | | | | | | | | | | | | | | |
| Common Stocks | | | 334,175 | | | | — | | | | — | | | | 334,175 | |
| Investment Company | | | 11,602 | | | | — | | | | — | | | | 11,602 | |
| Total Investments | | | 345,777 | | | | — | | | | — | | | | 345,777 | |
| | | | | | | | | | | | | | | | | |
| Value Income | | | | | | | | | | | | | | | | |
| Common Stocks and Equity-Linked Security | | | 14,741 | | | | 301 | | | | — | | | | 15,042 | |
| Convertible Bonds | | | — | | | | 389 | | | | — | | | | 389 | |
| Corporate Bonds | | | — | | | | 376 | | | | — | | | | 376 | |
| Preferred Stock | | | 337 | | | | — | | | | — | | | | 337 | |
| Investment Company | | | 213 | | | | — | | | | — | | | | 213 | |
| Total Investments | | | 15,291 | | | | 1,066 | | | | — | | | | 16,357 | |
| Written Options(1) | | | (33 | ) | | | — | | | | — | | | | (33 | ) |
| Total | | | 15,258 | | | | 1,066 | | | | — | | | | 16,324 | |
| (1) | Foreign currency forward contracts, futures contracts and centrally cleared swap contracts are valued at unrealized appreciation (depreciation). |
| (2) | Value is comprised of a $322 asset and a $184 liability. |
| (3) | Value is comprised of a $6 asset and a $68 liability. |
| (4) | Value is comprised of a $40 asset and a $45 liability. |
| (6) | Value is comprised of a $1,310 asset and a $2,815 liability. |
| | NOTES TO FINANCIAL STATEMENTS | |
| | |
| (7) | Value is comprised of a $309 asset and a $701 liability. |
| (8) | Value is comprised of a $31 asset and a $165 liability. |
| (9) | Value is comprised of a $102 asset and a $1,055 liability. |
| (10) | Value is comprised of a $310 asset and a $433 liability. |
Information about Level 3 fair value measurements (dollar value in thousands):
| Assets | Fair Value at
September 30, 2024 | Unobservable Input(s) | Range | Weighted
Average | Impact to Fair
Value from an
Increase in
Input |
| Emerging Markets Debt Opportunities | | | | | |
| Sovereign Government Bonds and Credit-Linked Notes | $ | 817 | Single broker quote | $92.21 - $102.74 | $99.00 | Increase |
| Bank loans | 1,939 | Single broker quote(1) | $84.00 - $99.50 | $95.66 | Increase |
| Total | 2,756 | | | | |
| Floating Rate | | | | | |
| Warrant | | | | | |
| | —(2) | 100% discount for uncertainty of liquidation value | N/A | N/A | N/A |
| Global Equity | | | | | |
| Common Stock | | | | | |
| | —(2) | Last quote in restricted market less 100% discount | N/A | N/A | N/A |
| Global Unconstrained | | | | | |
| Sovereign Government Bonds and Credit-Linked Notes | 1,078 | Single broker quote | $92.21 - $102.74 | $99.02 | Increase |
| Bank loans | 2,652 | Single broker quote(1) | $84.00 - $99.50 | $95.62 | Increase |
| Total | 3,730 | | | | |
| High Income | | | | | |
| Warrant | | | | | |
| | —(2) | 100% discount for uncertainty of liquidation value | N/A | N/A | N/A |
| International | | | | | |
| Common Stock | | | | | |
| | —(2) | Last quote in restricted market less 100% discount | N/A | N/A | N/A |
| International Value | | | | | |
| Common Stock | | | | | |
| | 146,720 | Net collateral, net earned premiums, and fair value of loss reserves | $118,830 - $147,190 | $131,506 | Increase |
| Mid Cap Value | | | | | |
| Common Stock | | | | | |
| | —(2) | 100% discount for uncertainty of liquidation value | N/A | N/A | N/A |
| Sustainable Emerging Markets | | | | | |
| Common Stock | | | | | |
| | —(2) | Last quote in restricted market less 100% discount | N/A | N/A | N/A |
| (1) | At times during the period, unobservable input(s) were model-derived based on change in option-adjusted spread of comparables with a range of $81.17 - $101.85 and weighted average of $96.28. |
| (2) | Includes one or more securities valued at $0. |
| | NOTES TO FINANCIAL STATEMENTS | |
| | |
As of September 30, 2024, the reconciliation of assets in which significant unobservable inputs (Level 3) were used in determining fair value is as follows (in thousands):
| | | Emerging Markets Debt Opportunities Fund | | | Floating Rate Fund | | | Global Equity Fund | | | Global Unconstrained Fund | | |
| Balance as of September 30, 2023 | | $ | 301 | | | $ | —(1) | | | $ | —(1) | | | $ | 374 | | |
| Transfers into Level 3 | | | — | | | | — | | | | — | | | | — | | |
| Net change in unrealized appreciation (depreciation) | | | (150) | | | | — | | | | 4,291 | | | | (201 | ) | |
| Purchases | | | 2,605 | | | | — | | | | — | | | | 3,557 | | |
| Sales | | | — | | | | — | | | | (492 | ) | | | — | | |
| Accrued Amortization | | | —(2) | | | | —(2) | | | | — | | | | — | (2) | |
| Realized Gain/Loss | | | — | | | | — | | | | (3,799 | ) | | | — | | |
| Transfers out of Level 3 | | | — | | | | — | | | | — | | | | — | | |
| Balance as of September 30, 2024 | | $ | 2,756 | | | $ | —(1) | | | $ | —(1) | | | $ | 3,730 | | |
| Net change in unrealized appreciation (depreciation) for | | | | | | | | | | | | | | | | | |
| investments held as of September 30, 2024 | | $ | (156 | ) | | $ | — | | | $ | — | | | $ | (209 | ) | |
| | | High Income Fund | | | International Fund | | | International Value Fund | | | Mid Cap Value Fund | | | Sustainable Emerging Markets Fund | |
| Balance as of September 30, 2023 | | $ | —(1) | | | $ | —(1) | | | $ | 118,830 | | | $ | —(1) | | | $ | —(1) | |
| Transfers into Level 3 | | | — | | | | — | | | | — | | | | — | | | | — | |
| Net change in unrealized appreciation (depreciation) | | | — | | | | 151,723 | | | | 27,890 | | | | — | | | | 736 | |
| Purchases | | | — | | | | — | | | | — | | | | — | | | | — | |
| Sales | | | — | | | | (17,621) | | | | — | | | | — | | | | (142) | |
| Accrued Amortization | | | — | | | | — | | | | — | | | | — | | | | — | |
| Realized Gain/Loss | | | — | | | | (134,102) | | | | — | | | | — | | | | (594) | |
| Transfers out of Level 3 | | | — | | | | — | | | | — | | | | — | | | | — | |
| Balance as of September 30, 2024 | | $ | —(1) | | | $ | —(1) | | | $ | 146,720 | | | $ | —(1) | | | $ | —(1) | |
| Net change in unrealized appreciation (depreciation) for | | | | | | | | | | | | | | | | | | | | |
| investments held as of September 30, 2024 | | $ | — | | | $ | — | | | $ | 27,890 | | | $ | — | | | $ | — | |
| (1) | Includes one or more securities valued at $0. |
| (2) | Amount rounds to less than $1 |
(5) Transfer Agent and Authorized Agent Fees:
Each Fund paid fees to, and reimbursed certain expenses of, the Funds’ transfer agent during the year. In addition, the Funds have authorized certain financial services companies, broker-dealers, banks or other authorized agents, and in some cases, other organizations designated by an authorized agent (with their designees, collectively “authorized agents”) to accept purchase, exchange and redemption orders on the Funds’ behalf. Some authorized agents charge a fee for accounting and shareholder services that the agent provided to Fund shareholders on the Fund’s behalf. Those services typically included recordkeeping, transaction processing for shareholders’ accounts and other services. Generally, the fee was either a per account charge based on the number of accounts to which the authorized agent provided such services, or was a percentage of the average value of Fund shares held in such accounts. For Investor Shares and Advisor Shares of the Funds, each Fund paid all or a portion of such fees, which are intended to compensate the authorized agent for its provision of services of the type that would be provided by the Funds’ transfer agent or other service providers if the shares were registered on the books of the Funds’ transfer agent. For Institutional Shares, the Funds do not pay fees to intermediaries in connection with recordkeeping, transaction processing for shareholders’ accounts or any other services that an intermediary may provide to its clients. Artisan Partners, at its own expense, pays certain authorized agents for accounting and shareholder services (to the extent those fees are not paid by a Fund), and for distribution and marketing services performed with respect to the Funds. The Funds’ expenses incurred for services provided by authorized agents are included in “Transfer agent fees” in the Statements of Operations. The table below shows the fees and expenses to the Funds’ transfer agent and the fees to authorized agents incurred by each class of each Fund during the year ended September 30, 2024 (in thousands):
| 100 | Artisan Partners Funds |
| | NOTES TO FINANCIAL STATEMENTS | |
| | |
| | | Year Ended 9/30/2024 |
| Fund | | Fees and Expenses
to Transfer Agent | | Fees to
Authorized
Agents | | Total |
| Developing World - Investor Shares | | $ | 45 | | | $ | 718 | | | $ | 763 | |
| Developing World - Advisor Shares | | | 35 | | | | 1,091 | | | | 1,126 | |
| Developing World - Institutional Shares | | | 42 | | | | — | | | | 42 | |
| Emerging Markets Debt Opportunities - Investor Shares | | | 28 | | | | 15 | | | | 43 | |
| Emerging Markets Debt Opportunities - Advisor Shares | | | 26 | | | | 19 | | | | 45 | |
| Emerging Markets Debt Opportunities - Institutional Shares | | | 26 | | | | — | | | | 26 | |
| Floating Rate - Investor Shares | | | 27 | | | | 30 | | | | 57 | |
| Floating Rate - Advisor Shares | | | 26 | | | | 26 | | | | 52 | |
| Floating Rate - Institutional Shares | | | 26 | | | | — | | | | 26 | |
| Focus - Investor Shares | | | 37 | | | | 34 | | | | 71 | |
| Focus - Advisor Shares | | | 30 | | | | 510 | | | | 540 | |
| Focus - Institutional Shares | | | 30 | | | | — | | | | 30 | |
| Global Discovery - Investor Shares | | | 33 | | | | 75 | | | | 108 | |
| Global Discovery - Advisor Shares | | | 26 | | | | 20 | | | | 46 | |
| Global Discovery - Institutional Shares | | | 26 | | | | — | | | | 26 | |
| Global Equity - Investor Shares | | | 35 | | | | 162 | | | | 197 | |
| Global Equity - Advisor Shares | | | 26 | | | | 4 | | | | 30 | |
| Global Equity - Institutional Shares | | | 26 | | | | — | | | | 26 | |
| Global Opportunities - Investor Shares | | | 60 | | | | 1,593 | | | | 1,653 | |
| Global Opportunities - Advisor Shares | | | 31 | | | | 458 | | | | 489 | |
| Global Opportunities - Institutional Shares | | | 37 | | | | — | | | | 37 | |
| Global Unconstrained - Investor Shares | | | 26 | | | | 17 | | | | 43 | |
| Global Unconstrained - Advisor Shares | | | 26 | | | | 47 | | | | 73 | |
| Global Unconstrained - Institutional Shares | | | 26 | | | | — | | | | 26 | |
| Global Value - Investor Shares | | | 45 | | | | 486 | | | | 531 | |
| Global Value - Advisor Shares | | | 29 | | | | 227 | | | | 256 | |
| Global Value - Institutional Shares | | | 32 | | | | — | | | | 32 | |
| High Income - Investor Shares | | | 37 | | | | 1,623 | | | | 1,660 | |
| High Income - Advisor Shares | | | 64 | | | | 3,080 | | | | 3,144 | |
| High Income - Institutional Shares | | | 53 | | | | — | | | | 53 | |
| International - Investor Shares | | | 218 | | | | 3,260 | | | | 3,478 | |
| International - Advisor Shares | | | 33 | | | | 666 | | | | 699 | |
| International - Institutional Shares | | | 42 | | | | — | | | | 42 | |
| International Explorer - Advisor Shares | | | 30 | | | | 60 | | | | 90 | |
| International Explorer - Institutional Shares | | | 26 | | | | — | | | | 26 | |
| International Small-Mid - Investor Shares | | | 52 | | | | 553 | | | | 605 | |
| International Small-Mid - Advisor Shares | | | 33 | | | | 974 | | | | 1,007 | |
| International Small-Mid - Institutional Shares | | | 44 | | | | — | | | | 44 | |
| International Value - Investor Shares | | | 93 | | | | 6,867 | | | | 6,960 | |
| International Value - Advisor Shares | | | 56 | | | | 8,458 | | | | 8,514 | |
| International Value - Institutional Shares | | | 67 | | | | — | | | | 67 | |
| Mid Cap - Investor Shares | | | 121 | | | | 2,998 | | | | 3,119 | |
| Mid Cap - Advisor Shares | | | 34 | | | | 541 | | | | 575 | |
| Mid Cap - Institutional Shares | | | 51 | | | | — | | | | 51 | |
| Mid Cap Value - Investor Shares | | | 99 | | | | 704 | | | | 803 | |
| Mid Cap Value - Advisor Shares | | | 31 | | | | 179 | | | | 210 | |
| Mid Cap Value - Institutional Shares | | | 31 | | | | — | | | | 31 | |
| Select Equity - Investor Shares | | | 28 | | | | 15 | | | | 43 | |
| Select Equity - Advisor Shares | | | 26 | | | | —^ | | | | 26 | |
| Select Equity - Institutional Shares | | | 26 | | | | — | | | | 26 | |
| Small Cap - Investor Shares | | | 105 | | | | 1,127 | | | | 1,232 | |
| Small Cap - Advisor Shares | | | 31 | | | | 192 | | | | 223 | |
| Small Cap - Institutional Shares | | | 35 | | | | — | | | | 35 | |
| Sustainable Emerging Markets - Investor Shares | | | 31 | | | | 32 | | | | 63 | |
| Sustainable Emerging Markets - Advisor Shares | | | 26 | | | | 34 | | | | 60 | |
| Sustainable Emerging Markets - Institutional Shares | | | 29 | | | | — | | | | 29 | |
| Artisan Partners Funds | 101 |
| | NOTES TO FINANCIAL STATEMENTS | |
| | |
| | | Year Ended 9/30/2024 |
| Fund | | Fees and Expenses
to Transfer Agent | | Fees to
Authorized
Agents | | Total |
| Value - Investor Shares | | $ | 44 | | | $ | 172 | | | $ | 216 | |
| Value - Advisor Shares | | | 28 | | | | 92 | | | | 120 | |
| Value - Institutional Shares | | | 29 | | | | — | | | | 29 | |
| Value Income - Investor Shares | | | 27 | | | | 17 | | | | 44 | |
| Value Income - Advisor Shares | | | 25 | | | | 3 | | | | 28 | |
| Value Income - Institutional Shares | | | 25 | | | | — | | | | 25 | |
| ^ | Amount rounds to less than $1 |
(6) Derivative Transactions
Each Fund may invest in derivatives for any purpose consistent with its investment objective and guidelines, including, without limitation, to improve expected risk-adjusted returns, to reduce exposure to certain risks, for hedging purposes and to obtain economic exposure to certain issuers.
In connection with Rule 18f-4 under the 1940 Act, the Funds have adopted a derivative risk management program that takes into account how its derivatives use affects its portfolio strategy, including whether derivatives are used to increase or decrease portfolio risks or facilitate efficient portfolio management. To the extent a Fund is not a limited derivatives user (as defined in Rule 18f-4), Rule 18f-4, among other things, limits a Fund’s derivatives exposure through a value-at-risk test and requires such Funds to adopt and implement a derivatives risk management program that is reasonably designed to manage the Funds’ derivatives risks. Subject to certain conditions, Funds that are limited derivatives users are not subject to the full requirements of Rule 18f-4. In order to qualify as a limited derivatives user, a Fund’s derivatives “exposure” (as defined in Rule 18f-4) cannot exceed 10% of its net assets, excluding certain currency or interest rate derivatives used for hedging purposes in accordance with specific requirements set out in Rule 18f-4. Emerging Markets Debt Opportunities Fund, Floating Rate Fund, Focus Fund, Global Unconstrained Fund and High Income Fund are full derivatives users while the remaining Funds are limited derivatives users.
Foreign Currency Forward Contracts
Foreign currency forward contracts are contractual agreements to purchase or sell a specified currency at a specified future date (or within a specified time period) and at a price set at the time of the contract. Forward contracts usually are entered into with banks and broker-dealers and are not exchange traded.
Forward currency transactions may involve currencies of the different countries to which a Fund may have exposure and serve as hedges against possible variations in the exchange rate between these currencies. Forward currency transactions may be used for transaction hedging and portfolio hedging involving either specific transactions or portfolio positions (including positions obtained through, among other instruments, participation certificates and depositary receipts that may be denominated in US dollars or foreign currencies). A Fund may not engage in speculative currency exchange transactions. Emerging Markets Debt Opportunities Fund, Focus Fund, Global Unconstrained Fund, and High Income Fund each used foreign currency contracts for hedging currency exposure during the year ended September 30, 2024.
At the maturity of a forward contract to deliver a particular currency, a Fund may either sell the portfolio security related to such contract and make delivery of the currency, or it may retain the security and either acquire the currency on the spot market or terminate its contractual obligation to deliver the currency by purchasing an offsetting contract with the same currency trader obligating it to purchase on the same maturity date the same amount of the currency. Hedging activity and/or use of forward foreign currency contracts may reduce or limit the opportunity for gain and involves counterparty risk, which is the risk that the contracting party will not fulfill its contractual obligation to deliver the currency contracted for at the agreed upon price to the Fund.
Futures Transactions
Each Fund may invest in futures contracts for hedging, risk management or portfolio management purposes, including to offset changes in the value of securities held or expected to be acquired or be disposed of, to minimize fluctuations in foreign currencies, or to gain exposure to a particular market or instrument. Emerging Markets Debt Opportunities Fund and Global Unconstrained Fund used futures contracts for hedging, risk management or portfolio management purposes, including to offset changes in the value of securities held or expected to be acquired or be disposed of, to minimize fluctuations in foreign currencies, or to gain exposure to a particular market or instrument during the year ended September 30, 2024.
| 102 | Artisan Partners Funds |
| | NOTES TO FINANCIAL STATEMENTS | |
| | |
A futures contract provides for the future sale by one party and purchase by another party of a specified amount of a financial instrument or money at a specified time and price. To the extent it uses futures contracts, a Fund will be required to deposit margin and other assets with its futures clearing brokers, shown as due from broker in the Statements of Assets and Liabilities.
There are risks associated with a Fund’s transactions in futures contracts, including that the success of an investment strategy may depend on the ability of the Fund’s portfolio managers to predict movements in the prices of individual securities, fluctuations in markets and movement in interest rates.
Options Transactions
Each Fund may purchase and write (sell) put options and call options on securities or indexes.
An option on a security (or index) is a contract that gives the purchaser (holder) of the option, in return for a premium, the right to buy from or sell to the seller of the option the security underlying the option at a specified exercise price at any time during the term of the option. Premiums paid on options purchased and premiums received on options written, as well as the daily fluctuation in market value, are included in investments in securities, at value and written options, at value, respectively, in the Statements of Assets and Liabilities. Focus Fund, Global Unconstrained Fund, and Value Income Fund held option contracts during the year ended September 30, 2024.
Each Fund may also enter into options on swap agreements (“swaptions”). A swaption is a contract that gives a counterparty the right (but not the obligation) to enter into a new swap agreement or to shorten, extend, cancel or otherwise modify an existing swap agreement, at some designated future time on specified terms. A Fund may write (sell) and purchase put and call swaptions to the same extent it may make use of standard options on securities or other instruments. Swaptions are generally subject to the same risks involved in a Fund’s use of options. None of the Funds invested in swaptions during the year.
If a written option expires, a Fund realizes a gain equal to the premium received at the time the option was written. If a purchased option expires, the Fund realizes a loss equal to the premium paid. A Fund will realize a gain from a closing purchase transaction if the cost of the closing option is less than the premium received from writing the option, or if it is more, the Fund will realize a loss. If the premium received from writing a closing sale transaction is more than the premium paid to purchase the option, the Fund will realize a gain, or if it is less, the Fund will realize a loss. Realized gain or loss on options purchased and options written are included in net realized gain (loss) on investments and net realized gain (loss) on written options, respectively, in the Statements of Operations. The Fund as writer of an option bears the market risk of an unfavorable change in the price of the security underlying the written option.
There are risks associated with a Fund investing in options contracts including significant differences between the securities markets, the currency markets, and the options markets that could result in an imperfect correlation between these markets, causing a given transaction not to achieve its objective. During the year ended September 30, 2024, Focus Fund and Value Income Fund used options transactions to enhance alpha and minimize downside market risk. Global Unconstrained Fund used options to create investment leverage.
Swap Transactions
Each Fund may enter into swap agreements and other types of over-the-counter transactions such as caps, floors and collars with broker-dealers or other financial institutions for hedging or investment purposes. An example of one type of swap involves the exchange by the Fund with another party of their respective commitments to pay or receive cash flows, for example, an exchange of floating rate payments for fixed-rate payments. The purchase of a cap entitles the purchaser, to the extent that a specified index or other underlying financial measure exceeds a predetermined value on a predetermined date or dates, to receive payments on a notional principal amount from the party selling the cap. The purchase of a floor entitles the purchaser, to the extent that a specified index or other underlying financial measure falls or other underlying measure below a predetermined value on a predetermined date or dates, to receive payments on a notional principal amount from the party selling the floor. A collar combines elements of a cap and a floor.
Swaps are fair valued daily and changes in value are recorded as unrealized appreciation or depreciation on the Statement of Operations. Upon entering a swap agreement, any payments received or made at the beginning of the measurement period are reflected in the Statements of Assets and Liabilities and represent a reconciling value to compensate for differences between the stated terms of the swap agreement and prevailing market factors. These upfront payments are recorded as realized gains or losses on the Statements of Operations upon termination or maturity of the swap. If a liquidation payment is received or made at the termination of the swap, it is recorded as realized gain or loss on the Statements of Operations. Net periodic payments received or paid by a Fund are included as part of realized gains or losses on the Statements of Operations. Daily changes to the fair value of centrally cleared swaps are recorded as Variation margin receivable or payable on centrally cleared swap
| Artisan Partners Funds | 103 |
| | NOTES TO FINANCIAL STATEMENTS | |
| | |
agreements in the Statements of Assets and Liabilities and are settled daily. An initial margin, typically in form of cash or qualifying highly liquid, high-quality short-term investments, is paid to the central clearing party or derivatives clearing organization when the swap contract is executed and is recorded as Due from brokers on the Statement of Assets and Liabilities.
Swap agreements and similar transactions can be individually negotiated and structured to include exposure to a variety of different types of investments or market factors. Depending on their structures, swap agreements may increase or decrease a Fund’s exposure to long-or short-term interest rates (in the United States or abroad), foreign currency values, mortgage securities, mortgage rates, corporate borrowing rates, or other factors such as security prices, inflation rates or the volatility of an index or one or more securities. For example, if a Fund agrees to exchange payments in US dollars for payments in a non-US currency, the swap agreement would tend to decrease a Fund’s exposure to US interest rates and increase its exposure to that non-US currency and interest rates.
A Fund’s ability to realize a profit from such transactions will depend on the ability of the financial institutions with which it enters into the transactions to meet their obligations to a Fund. If a counterparty’s creditworthiness declines, the value of the agreement would be likely to decline, potentially resulting in losses. If a default occurs by the other party to such transaction, a Fund will have contractual remedies pursuant to the agreements related to the transaction, which may be limited by applicable law in the case of a counterparty’s insolvency.
Under certain circumstances, suitable transactions may not be available to a Fund, or a Fund may be unable to close out its position under such transactions at the same time, or at the same price, as if it had purchased comparable publicly traded securities. Swaps carry counterparty risks that cannot be fully anticipated. Also, because swap transactions typically involve a contract between the two parties, such swap investments can be extremely illiquid, as it is uncertain as to whether another counterparty would wish to take assignment of the rights under the swap contract at a price acceptable to a Fund.
A credit default swap on a bond is an agreement between a Fund and a counterparty that enables a Fund to buy or sell protection against a credit event related to a particular issuer. One party, acting as a protection buyer, makes periodic payments, which may be based on, among other things, a fixed or floating rate of interest, to the other party, a protection seller, in exchange for a promise by the protection seller to make a payment to the protection buyer if a negative credit event (such as a delinquent payment or default) occurs with respect to a referenced bond or group of bonds. Credit default swaps may also be structured based on the debt of a basket of issuers, rather than a single issuer, and may be customized with respect to the default event that triggers purchase or other factors (for example, a specific default within a basket, or defaults by a particular combination of issuers within the basket, may trigger a payment obligation). As a credit protection seller in a credit default swap contract, a Fund would be required to pay the par (or other agreed-upon) value of a referenced debt obligation to the counterparty following certain negative credit events as to a specified third-party debtor, such as default by a US or non-US corporate issuer on its debt obligations. In return for its obligation, a Fund would receive from the counterparty a periodic stream of payments, which may be based on, among other things, a fixed or floating rate of interest, over the term of the contract provided that no event of default has occurred. If no default occurs, a Fund would keep the stream of payments, and would have no payment obligations to the counterparty. A Fund may sell credit protection in order to earn additional income and/or to take a synthetic long position in the underlying security or basket of securities.
Each Fund may enter into credit default swap contracts as protection buyer in order to hedge against the risk of default on the debt of a particular issuer or basket of issuers or attempt to profit from a deterioration or perceived deterioration in the creditworthiness of the particular issuer(s) (also known as buying credit protection).
Each Fund may enter into credit default swap contracts as seller protection. A protection seller may have to pay out amounts following a negative credit event greater than the value of the reference obligation delivered to it by its counterparty and the amount of periodic payments previously received by it from the counterparty. When a Fund acts as a seller of credit default swap protection, it is exposed to, among other things, leverage risk because if an event of default occurs the seller must pay the buyer up to the full notional value of the reference obligation. Based on credit spreads at September 30, 2024, we believe the performance/payout risk is low.
Each Fund may also engage in total return swaps, in which payments made by a Fund or the counterparty are based on the total return of a particular reference asset or assets (such as an equity or fixed-income security, a combination of such securities, or an index). Total return swap agreements may be used to obtain exposure to a security, commodity, or market without owning or taking physical custody of such security or investing directly in such market. Swaps carry counterparty risks that cannot be fully anticipated. Each Fund may also enter into swap agreements on futures contracts including, but not limited to, index futures contracts. Swap agreements on futures contracts are generally subject to the same risks involved in the fund’s use of futures contracts, in addition to the risks involved in the fund’s use of swap agreements. A total return swap, or a swap on a futures contract, may add leverage to a portfolio by providing investment exposure to an underlying asset or market where the Fund
| 104 | Artisan Partners Funds |
| | NOTES TO FINANCIAL STATEMENTS | |
| | |
does not own or take physical custody of such asset or invest directly in such market.
Many swaps are complex and often valued subjectively. Many over-the-counter derivatives are complex and their valuation often requires modeling and judgment, which increases the risk of mispricing or incorrect valuation. The pricing models used may not produce valuations that are consistent with the values a Fund realizes when it closes or sells an over-the-counter derivative. Valuation risk is more pronounced when a Fund enters into over-the-counter derivatives with specialized terms because the market value of those derivatives in some cases is determined in part by reference to similar derivatives with more standardized terms. Incorrect valuations may result in increased cash payment requirements to counterparties, undercollateralization and/or errors in calculation of the Fund’s NAV. During the year ended September 30, 2024, Emerging Markets Debt Opportunities Fund and Global Unconstrained Fund used swap transactions to create investment leverage.
The fair value of derivative instruments as reported in the Statements of Assets and Liabilities as of September 30, 2024 was as follows (in thousands):
| Fund | | Risk Exposure Category | | Derivative Instrument | | Statement of assets and Liabilities Location | | Value | |
| Emerging Markets Debt Opportunities | | Foreign currency | | Foreign currency forward contracts | | Unrealized appreciation on foreign currency forward contracts | | $ | 322 | |
| | | Foreign currency | | Foreign currency forward contracts | | Unrealized depreciation on foreign currency forward contracts | | | (184 | ) |
| | | Interest rate | | Futures contracts | | Payable for variation margin on futures contracts | | | (62 | )* |
| | | Credit | | Centrally cleared swap contracts | | Payable for variation margin on centrally cleared swap contracts | | | (5 | )* |
| | | Interest rate | | Centrally cleared swap contracts | | Receivable for variation margin on centrally cleared swap contracts | | | 699 | * |
| Focus | | Foreign currency | | Foreign currency forward contracts | | Unrealized appreciation on foreign currency forward contracts | | | 1,310 | |
| | | Foreign currency | | Foreign currency forward contracts | | Unrealized depreciation on foreign currency forward contracts | | | (2,815 | ) |
| | | Equity | | Written options contract | | Written options, at value | | | (3,263 | ) |
| | | Equity | | Purchased options contracts | | Investments in securities, unaffiliated, at value | | | 39,632 | |
| Global Unconstrained | | Foreign currency | | Foreign currency forward contracts | | Unrealized appreciation on foreign currency forward contracts | | | 309 | |
| | | Foreign currency | | Foreign currency forward contracts | | Unrealized depreciation on foreign currency forward contracts | | | (701 | ) |
| | | Interest rate | | Futures contracts | | Payable for variation margin on futures contracts | | | (66 | )* |
| | | Equity | | Futures contracts | | Payable for variation margin on futures contracts | | | (68 | )* |
| | | Credit | | Centrally cleared swap contracts | | Payable for variation margin on centrally cleared swap contracts | | | (953 | )* |
| | | Interest rate | | Centrally cleared swap contracts | | Payable for variation margin on centrally cleared swap contracts | | | (123 | )* |
| | | Credit | | Over the counter swap contracts | | Swap contracts, at value | | | (22 | ) |
| | | Interest rate | | Over the counter swap contracts | | Swap contracts, at value | | | (18 | ) |
| | | Equity | | Purchased options contracts | | Investments in securities, unaffiliated, at value | | | 4 | |
| High Income | | Foreign currency | | Foreign currency forward contracts | | Unrealized depreciation on foreign currency forward contracts | | | (138 | ) |
| Value Income | | Equity | | Written options contract | | Written options, at value | | | (33 | ) |
| * | Futures contracts and centrally cleared swap contracts are valued in this table at unrealized appreciation (depreciation). Amounts reported in the Statements of Assets and Liabilities reflect only the current day’s variation margin related to these contracts. |
The effect of derivative instruments in the amount of realized gain (loss) and net increase (decrease) in unrealized appreciation or depreciation recognized on the Statements of Operations for the year ended September 30, 2024 was as follows (in thousands):
| Fund | | Risk Exposure Category | | Derivative
Instrument | | Statement of
Operations Location | | Net Realized
Gain (Loss) | | | Statement of
Operations Location | | Unrealized Appreciation
(Depreciation) | |
| Emerging Markets Debt Opportunities | | Foreign currency | | Foreign currency forward contracts | | Net realized gain (loss) on foreign currency forward contracts | | $ | (316 | ) | | Net increase (decrease) in unrealized appreciation or depreciation on foreign currency forward contracts | | $ | 407 | |
| | | Interest rate | | Futures contracts | | Net realized gain (loss) on futures contracts | | | (614 | ) | | Net increase (decrease) in unrealized appreciation or depreciation on futures contracts | | | (218 | ) |
| | | Credit | | Centrally cleared swap contracts | | Net realized gain (loss) on swap contracts | | | 51 | | | Net increase (decrease) in unrealized appreciation or depreciation on swap contracts | | | (5 | ) |
| | | Interest rate | | Centrally cleared swap contracts | | Net realized gain (loss) on swap contracts | | | (564 | ) | | Net increase (decrease) in unrealized appreciation or depreciation on swap contracts | | | 782 | |
| Focus | | Foreign currency | | Foreign currency forward contracts | | Net realized gain (loss) on foreign currency forward contracts | | | 2,947 | | | Net increase (decrease) in unrealized appreciation or depreciation on foreign currency forward contracts | | | (3,219 | ) |
| | | Equity | | Written options contracts | | Net realized gain (loss) on written options | | | (21,741 | ) | | Net increase (decrease) in unrealized appreciation or depreciation on written options | | | 543 | |
| Artisan Partners Funds | 105 |
| | NOTES TO FINANCIAL STATEMENTS | |
| | |
| Fund | | Risk Exposure Category | | Derivative
Instrument | | Statement of
Operations Location | | Net Realized
Gain (Loss) | | | Statement of
Operations Location | | Unrealized Appreciation
(Depreciation) | |
| | | Equity | | Purchased option contracts | | Net realized gain (loss) on investments, from unaffiliated issuers | | | 44,095 | | | Net increase (decrease) in unrealized appreciation or depreciation on investments, from unaffiliated issuers | | | 11,938 | |
| Global Unconstrained | | Foreign currency | | Foreign currency forward contracts | | Net realized gain (loss) on foreign currency forward contracts | | | (355 | ) | | Net increase (decrease) in unrealized appreciation or depreciation on foreign currency forward contracts | | | (277 | ) |
| | | Interest rate | | Futures contracts | | Net realized gain (loss) on futures contracts | | | (645 | ) | | Net increase (decrease) in unrealized appreciation or depreciation on futures contracts | | | (106 | ) |
| | | Equity | | Futures contracts | | Net realized gain (loss) on futures contracts | | | (244 | ) | | Net increase (decrease) in unrealized appreciation or depreciation on futures contracts | | | (244 | ) |
| | | Equity | | Purchased option contracts | | Net realized gain (loss) on investments, from unaffiliated issuers | | | (84 | ) | | Net increase (decrease) in unrealized appreciation or depreciation on investments, from unaffiliated issuers | | | (17 | ) |
| | | Credit | | Centrally cleared swap contracts | | Net realized gain (loss) on swap contracts | | | (866 | ) | | Net increase (decrease) in unrealized appreciation or depreciation on swap contracts | | | (749 | ) |
| | | Interest rate | | Centrally cleared swap contracts | | Net realized gain (loss) on swap contracts | | | (55 | ) | | Net increase (decrease) in unrealized appreciation or depreciation on swap contracts | | | (71 | ) |
| High Income | | Foreign currency | | Foreign currency forward contracts | | Net realized gain (loss) on foreign currency forward contracts | | | (154 | ) | | Net increase (decrease) in unrealized appreciation or depreciation on foreign currency forward contracts | | | (112 | ) |
| | | Interest rate | | Futures contracts | | Net realized gain (loss) on futures contracts | | | — | | | Net increase (decrease) in unrealized appreciation or depreciation on futures contracts | | | — | |
| Value Income | | Equity | | Written options contracts | | Net realized gain (loss) on written options | | | 29 | | | Net increase (decrease) in unrealized appreciation or depreciation on written options | | | (7 | ) |
The average monthly amount outstanding for each derivative type for the year ended September 30, 2024 was as follows (dollar value in thousands):
| Fund | | Derivative Type | Average Monthly Notional Amount |
| Emerging Markets Debt Opportunities | | Centrally cleared credit default swaps | | $ | 2,139 | |
| | | Centrally cleared interest rate swaps | | | 13,067 | |
| | | Foreign currency forward contracts - purchased | | | 31,166 | |
| | | Foreign currency forward contracts - sold | | | 20,420 | |
| | | Futures contracts - short | | | 24,128 | |
| | | Overnight index swap | | | 5,127 | |
| | | Variable rate swap | | | 1,551 | |
| Focus | | Foreign currency forward contracts - purchased | | | 41,252 | |
| | | Foreign currency forward contracts - sold | | | 115,497 | |
| | | Purchased options contracts | | | 18,548 | |
| | | Written options contracts | | | 2,195 | |
| Global Unconstrained | | Centrally cleared credit default swaps | | | 60,731 | |
| | | Centrally cleared interest rate swaps | | | 14,009 | |
| | | Foreign currency forward contracts - purchased | | | 26,575 | |
| | | Foreign currency forward contracts - sold | | | 39,546 | |
| | | Futures contracts - long | | | 743 | |
| | | Futures contracts - short | | | 25,416 | |
| | | Overnight index swap | | | 12,323 | |
| | | Purchased options contracts | | | 26 | |
| | | Variable rate swap | | | 2,785 | |
| High Income | | Foreign currency forward contracts - purchased | | | 687 | |
| | | Foreign currency forward contracts - sold | | | 4,000 | |
| Value Income | | Written options contracts | | | 17 | |
| 106 | Artisan Partners Funds |
| | NOTES TO FINANCIAL STATEMENTS | |
| | |
Master Netting Agreements
Each Fund is a party to various master netting agreements. While the terms and conditions of these agreements may vary, all transactions under any such agreement constitute a single contractual relationship. Each party’s obligation to make any payments, deliveries or other transfers in respect of any transaction under such an agreement may be netted against the other party’s obligations under such agreement. A default by a party in performance with respect to one transaction under such an agreement would give the other party the right to terminate all transactions under such agreement and calculate one net amount owed from one party to the other.
The following tables present information about the offsetting of derivative instruments and collateral amounts (in thousands) for foreign currency forward contracts and over-the-counter swaps as of September 30, 2024:
| | | Gross Amounts Not Offset in the Statements of Assets and Liabilities | |
| Fund | | Counterparty | | Gross Asset Amounts
Presented in Statements of
Assets and Liabilities | | Financial Instrument | | Collateral Received* | | Net Amount
(Not Less Than $0) |
| Emerging Markets Debt Opportunities | | Citibank, N.A. | | $ | 23 | | | $ | (7 | ) | | $ | — | | | $ | 16 | |
| Emerging Markets Debt Opportunities | | Citigroup Global Markets | | | 90 | | | | (90 | ) | | | — | | | | — | |
| Emerging Markets Debt Opportunities | | Goldman Sachs International | | | 35 | | | | — | | | | — | | | | 35 | |
| Emerging Markets Debt Opportunities | | ICBC Standard Bank Plc | | | 6 | | | | (5 | ) | | | — | | | | 1 | |
| Emerging Markets Debt Opportunities | | Societe Generale | | | 1 | | | | (1 | ) | | | — | | | | — | |
| Emerging Markets Debt Opportunities | | Standard Chartered Bank | | | 167 | | | | (17 | ) | | | — | | | | 150 | |
| Focus | | JPMorgan Chase Bank, N.A. | | | 1,310 | | | | (1,310 | ) | | | — | | | | — | |
| Global Unconstrained | | Citibank, N.A. | | | 25 | | | | (24 | ) | | | — | | | | 1 | |
| Global Unconstrained | | ICBC Standard Bank Plc | | | 10 | | | | (10 | ) | | | — | | | | — | |
| Global Unconstrained | | JPMorgan Chase Bank, N.A. | | | 43 | | | | (43 | ) | | | — | | | | — | |
| Global Unconstrained | | Standard Chartered Bank | | | 212 | | | | (212 | ) | | | — | | | | — | |
| Global Unconstrained | | Toronto Dominion Bank | | | 19 | | | | (19 | ) | | | — | | | | — | |
| | | Gross Amounts Not Offset in the Statements of Assets and Liabilities | |
| Fund | | Counterparty | | Gross Liability Amounts
Presented in Statements of
Assets and Liabilities | | Financial Instrument | | Collateral Pledged* | | Net Amount
(Not Less Than $0) |
| Emerging Markets Debt Opportunities | | Citibank, N.A. | | $ | 7 | | | $ | (7 | ) | | $ | — | | | $ | — | |
| Emerging Markets Debt Opportunities | | Citigroup Global Markets | | | 107 | | | | (90 | ) | | | (17 | ) | | | — | |
| Emerging Markets Debt Opportunities | | Deutsche Bank AG | | | 1 | | | | — | | | | — | | | | 1 | |
| Emerging Markets Debt Opportunities | | ICBC Standard Bank Plc | | | 5 | | | | (5 | ) | | | — | | | | — | |
| Emerging Markets Debt Opportunities | | JPMorgan Chase Bank, N.A. | | | 1 | | | | — | | | | — | | | | 1 | |
| Emerging Markets Debt Opportunities | | Societe Generale | | | 5 | | | | (1 | ) | | | — | | | | 4 | |
| Emerging Markets Debt Opportunities | | Standard Chartered Bank | | | 17 | | | | (17 | ) | | | — | | | | — | |
| Emerging Markets Debt Opportunities | | Toronto Dominion Bank | | | 41 | | | | — | | | | — | | | | 41 | |
| Focus | | JPMorgan Chase Bank, N.A. | | | 2,815 | | | | (1,310 | ) | | | — | | | | 1,505 | |
| Global Unconstrained | | Citibank, N.A. | | | 24 | | | | (24 | ) | | | — | | | | — | |
| Global Unconstrained | | Deutsche Bank AG | | | 2 | | | | — | | | | — | | | | 2 | |
| Global Unconstrained | | Goldman Sachs International | | | 25 | | | | — | | | | — | | | | 25 | |
| Global Unconstrained | | ICBC Standard Bank Plc | | | 49 | | | | (10 | ) | | | (39 | ) | | | — | |
| Global Unconstrained | | JPMorgan Chase Bank, N.A. | | | 308 | | | | (43 | ) | | | (260 | ) | | | 5 | |
| Global Unconstrained | | Morgan Stanley & Co International plc | | | — | ^ | | | — | | | | — | | | | — | ^ |
| Global Unconstrained | | Societe Generale | | | 2 | | | | — | | | | — | | | | 2 | |
| Global Unconstrained | | Standard Chartered Bank | | | 249 | | | | (212 | ) | | | (37 | ) | | | — | |
| Global Unconstrained | | Toronto Dominion Bank | | | 79 | | | | (19 | ) | | | — | | | | 60 | |
| High Income | | Bank of America | | | 138 | | | | — | | | | — | | | | 138 | |
| * | The actual collateral received/pledged may be more than the amount reported due to over-collateralization. |
| ^ | Amount rounds to less than $1. |
The Funds enter into over-the-counter (OTC) derivatives that may contain provisions whereby the counterparty may terminate the contract under certain conditions, including but not limited to a decline in the Fund's net assets below a certain level over a certain period of time, which would trigger a payment by the Fund for those derivatives in a liability position.
| Artisan Partners Funds | 107 |
| | NOTES TO FINANCIAL STATEMENTS | |
| | |
| (7) | Related Party Transactions |
| (a) | Investment Advisory Agreement – The Adviser, with which the officers and one director of the Funds are affiliated, provided investment advisory and administrative services to the Funds during the year ended September 30, 2024. In exchange for those services, each Fund paid a monthly management fee to the Adviser as follows: |
| Developing World | | Emerging Markets Debt Opportunities
Select Equity | |
| Average Daily Net Assets | Annual Rate | | Average Daily Net Assets | Annual Rate | |
| Up to $1 billion | 1.050% | | Up to $1 billion | 0.750% | |
| $1 billion to $2 billion | 1.025 | | $1 billion to $2 billion | 0.725 | |
| $2 billion to $3.5 billion | 1.000 | | $2 billion to $3.5 billion | 0.700 | |
| $3.5 billion to $5 billion | 0.975 | | $3.5 billion to $5 billion | 0.675 | |
| Over $5 billion | 0.950 | | Over $5 billion | 0.650 | |
| | | | | | |
| Floating Rate | | Focus | |
| Average Daily Net Assets | Annual Rate | | Average Daily Net Assets | Annual Rate | |
| Up to $1 billion | 0.680% | | Up to $1 billion | 1.000% | |
| $1 billion to $2 billion | 0.660 | | $1 billion to $2 billion | 0.975 | |
| $2 billion to $3.5 billion | 0.640 | | $2 billion to $3.5 billion | 0.950 | |
| $3.5 billion to $10 billion | 0.620 | | $3.5 billion to $5 billion | 0.925 | |
| Over $10 billion | 0.600 | | Over $5 billion | 0.900 | |
| | | | | | |
| Global Discovery | | Global Equity | |
| Average Daily Net Assets | Annual Rate | | Average Daily Net Assets | Annual Rate | |
| Up to $1 billion | 0.975% | | Up to $1 billion | 0.900% | |
| $1 billion to $2 billion | 0.950 | | $1 billion to $2 billion | 0.875 | |
| $2 billion to $3.5 billion | 0.925 | | $2 billion to $3.5 billion | 0.850 | |
| $3.5 billion to $5 billion | 0.900 | | $3.5 billion to $5 billion | 0.825 | |
| Over $5 billion | 0.875 | | Over $5 billion | 0.800 | |
| | | | | | |
| Global Opportunities | | Global Unconstrained | |
| Average Daily Net Assets | Annual Rate | | Average Daily Net Assets | Annual Rate | |
| Up to $1 billion | 0.900% | | Up to $1 billion | 0.950% | |
| $1 billion to $4 billion | 0.875 | | $1 billion to $2 billion | 0.925 | |
| $4 billion to $8 billion | 0.850 | | $2 billion to $3.5 billion | 0.900 | |
| $8 billion to $12 billion | 0.825 | | $3.5 billion to $5 billion | 0.875 | |
| Over $12 billion | 0.800 | | Over $5 billion | 0.850 | |
| | | | | | |
| Global Value | | High Income | |
| Average Daily Net Assets | Annual Rate | | Average Daily Net Assets | Annual Rate | |
| Up to $1 billion | 1.000% | | Up to $1 billion | 0.725% | |
| $1 billion to $4 billion | 0.975 | | $1 billion to $2 billion | 0.700 | |
| $4 billion to $8 billion | 0.950 | | $2 billion to $3.5 billion | 0.675 | |
| $8 billion to $12 billion | 0.925 | | $3.5 billion to $10 billion | 0.650 | |
| Over $12 billion | 0.900 | | Over $10 billion | 0.625 | |
| | | | | | |
| International | | International Explorer | |
| Average Daily Net Assets | Annual Rate | | Average Daily Net Assets | Annual Rate | |
| Up to $500 million | 1.000% | | Up to $500 million | 1.050% | |
| $500 million to $750 million | 0.975 | | Over $500 million | 1.000 | |
| $750 million to $1 billion | 0.950 | | | |
| $1 billion to $12 billion | 0.925 | | | |
| Over $12 billion | 0.900 | | | |
| 108 | Artisan Partners Funds |
| | NOTES TO FINANCIAL STATEMENTS | |
| | |
| International Small-Mid | | International Value
Mid Cap
Mid Cap Value (Prior to May 31,2024)
Small Cap | |
| Average Daily Net Assets | Annual Rate | | Average Daily Net Assets | Annual Rate | |
| Up to $2 billion | 1.050% | | Up to $500 million | 1.000% | |
| $2 billion to $3 billion | 1.025 | | $500 million to $750 million | 0.975 | |
| $3 billion to $4 billion | 1.000 | | $750 million to $1 billion | 0.950 | |
| $4 billion to $5 billion | 0.975 | | Over $1 billion | 0.925 | |
| Over $5 billion | | 0.950 | |
| | | | |
| Mid Cap Value (Effective May 31,2024) | | Sustainable Emerging Markets | |
| Average Daily Net Assets | Annual Rate | | Average Daily Net Assets | Annual Rate | |
| Up to $500 million | 0.920% | | Up to $1 billion | 0.850% | |
| $500 million to $750 million | 0.895 | | $1 billion to $2 billion | 0.825 | |
| $750 million to $1 billion | 0.870 | | $2 billion to $3.5 billion | 0.800 | |
| Over $1 billion | 0.845 | | $3.5 billion to $5 billion | 0.775 | |
| Over $5 billion | | 0.750 | |
| | | | |
| Value | | Value Income | |
| Average Daily Net Assets | Annual Rate | | Average Daily Net Assets | Annual Rate | |
| Up to $50 million | 0.800% | | Up to $1 billion | 0.700% | |
| $50 million to $100 million | 0.760 | | $1 billion to $2 billion | 0.675 | |
| $100 million to $500 million | 0.720 | | $2 billion to $3.5 billion | 0.650 | |
| $500 million to $7.5 billion | 0.680 | | $3.5 billion to $5 billion | 0.625 | |
| Over $7.5 billion | 0.640 | | Over $5 billion | 0.600 | |
| (b) | Expense Waivers and Reimbursements – The Adviser has contractually or voluntarily agreed, to bear certain expenses and waive its management fees, and to the extent that the fee waiver is insufficient to reimburse any ordinary operating expenses, to the extent necessary to cause total annual fund operating expenses (excluding taxes, interest, all commissions and other normal charges incident to the purchase and sale of portfolio securities, acquired fund fees and expenses, borrowing costs such as dividends on securities sold short, and extraordinary charges such as litigation costs, but including management fees paid to the Adviser) not to exceed the percentages of average daily net assets indicated below. The contractual limits continue through January 31, 2026 at which time Artisan Partners will determine whether to renew, revise or discontinue it. The table below shows the current expense limit as a percent of average daily net assets and amounts waived by the Adviser during the year ended September 30, 2024 (dollar values in thousands). |
For the year ended September 30, 2024, Value Income Fund incurred operating expenses of approximately $160,000 that were reimbursed by the Adviser. The Funds had no material receivables from or payables to the Adviser at September 30, 2024.
| Fund | Expense Limit as a % of
Average Daily Net Assets | Expenses Waived |
| Emerging Markets Debt Opportunities - Investor Shares | 1.25% | 76 |
| Emerging Markets Debt Opportunities - Advisor Shares | 1.15% | 118 |
| Emerging Markets Debt Opportunities - Institutional Shares | 1.10% | 181 |
| Floating Rate - Investor Shares | 1.20% | 71 |
| Floating Rate - Advisor Shares | 1.10% | 84 |
| Floating Rate - Institutional Shares | 1.05% | 77 |
| Focus - Investor Shares** | 1.50% | — |
| Global Discovery - Investor Shares | 1.40% | 14 |
| Global Discovery - Advisor Shares | 1.30% | 21 |
| Global Discovery - Institutional Shares | 1.25% | — |
| Global Equity - Investor Shares | 1.35% | — |
| Global Equity - Advisor Shares | 1.25% | 39 |
| Global Equity - Institutional Shares | 1.20% | — |
| Global Unconstrained - Investor Shares* | 1.24% | 84 |
| Global Unconstrained - Advisor Shares* | 1.14% | 222 |
| Global Unconstrained - Institutional Shares* | 1.09% | 125 |
| International Explorer - Advisor Shares | 1.40% | 30 |
| International Explorer - Institutional Shares | 1.35% | 20 |
| Select Equity - Investor Shares | 1.25% | 57 |
| Artisan Partners Funds | 109 |
| | NOTES TO FINANCIAL STATEMENTS | |
| | |
| Fund | Expense Limit as a % of
Average Daily Net Assets | Expenses Waived |
| Select Equity - Advisor Shares | 1.15% | 44 |
| Select Equity - Institutional Shares | 1.10% | 31 |
| Sustainable Emerging Markets - Investor Shares | 1.15% | 68 |
| Sustainable Emerging Markets - Advisor Shares | 1.05% | 74 |
| Sustainable Emerging Markets - Institutional Shares | 1.00% | 82 |
| Value - Investor Shares | 0.98% | 91 |
| Value - Advisor Shares | 0.88% | 82 |
| Value - Institutional Shares | 0.83% | 23 |
| Value Income - Investor Shares | 1.20% | 68 |
| Value Income - Advisor Shares | 1.10% | 61 |
| Value Income - Institutional Shares | 1.05% | 130 |
| ** | Effective March 6, 2024, a voluntary expense limit was put in place at 1.50% of average daily net assets. Effective May 31, 2024, the expense limit became contractual. |
| * | Prior to May 31, 2024, expense limit, as a percentage of average daily net assets, was 1.45%, 1.35% and 1.30% for Investor Shares, Advisor Shares and Institutional Shares, respectively. |
| (c) | Officers and Directors – The officers and director of the Funds who are affiliated with the Adviser receive no compensation from the Funds. For the period of October 1, 2023 to December 31, 2023, directors of the Funds who are not affiliated persons of the Adviser (“independent directors”) received compensation for their services based on an annual fee of $300,000. Effective January 1, 2024, the annual fee was increased to $325,000. |
In addition, the independent chair and each committee chair receives an annual supplemental retainer as follows:
| | | | Amount |
| Independent board chair | $ | 125,000* |
| Audit committee chair | $ | 45,000 |
| Governance and nominating committee chair | $ | 30,000 |
| Education committee chair | $ | 30,000 |
| * | Effective January 1, 2024. Prior to January 1, 2024, the annual amount was $100,000. |
These fees were generally allocated to each of the Funds based on net assets, subject to a minimum allocation of $1,500 to each Fund per quarter. Additionally, each director is entitled to reimbursement of expenses related to his or her duties as a director of the Funds.
Artisan Partners Funds has adopted a deferred compensation plan for directors who are not affiliated persons of the Adviser that enables directors to elect to defer receipt of all or a portion of the annual compensation they are entitled to receive from the Funds. For purposes of determining the amount owed to the directors under the plan, deferred amounts were invested in shares of the Funds as selected by the individual directors. Each Fund purchased shares of the Funds selected for deferral by the directors in amounts equal to their investment, resulting in a Fund asset equal to the deferred compensation liability. Such assets were included as a component of “Other assets” on the Statements of Assets and Liabilities. Deferral of directors’ fees under the plan did not affect the net assets of the Funds, and did not materially affect the Funds’ assets, liabilities or net investment income per share. Amounts will be deferred until distributed in accordance with the plan.
| (d) | Distribution – Shares of the Funds are offered for sale by Artisan Partners Distributors LLC (“Distributors”). Distributors is wholly owned by Artisan Holdings. All distribution expenses relating to the Funds are paid by the Adviser. |
(8) Line of Credit Arrangement:
Artisan Partners Funds is party to a line of credit agreement with a syndicate of lenders, led by JPMorgan Chase Bank N.A., as lender and administrative agent that expires on June 4, 2025. Under the line of credit, each Fund can borrow an amount that would not exceed the lesser of (a) 33 1/3% of its adjusted net assets (20% for Floating Rate Fund) with adjusted net assets being total assets less total liabilities (excluding indebtedness for borrowed money) after giving effect to the borrowing, and (b) the maximum amount the Fund is permitted to borrow pursuant to applicable law, pursuant to the Fund’s prospectus limitations on indebtedness, pursuant to any vote of the shareholders of the Fund, or pursuant to any limitation on borrowings in any applicable agreement with any governmental authority or regulator or any other applicable agreement or document to which such Fund was a party; provided that the aggregate borrowings by all the Funds may not exceed $400 million ($350 million prior to June 5, 2024). The Funds paid a commitment fee at the annual rate of 0.15% on the unused portion of the line of credit and interest was charged on any borrowings at the highest of (i) Daily Simple SOFR in effect on such day plus 0.10% plus 1.00% (the Eurodollar Rate for a one month interest period commencing two business days after such day, and prior to June 5, 2024), (ii) the federal
| 110 | Artisan Partners Funds |
| | NOTES TO FINANCIAL STATEMENTS | |
| | |
funds effective rate in effect on such day plus 1.00% or (iii) the overnight bank funding rate in effect on such day plus 1.00%. The Funds also paid an agent’s fee and arrangement fee to JPMorgan Chase Bank N.A. and the Funds’ and administrative agent's legal expenses in connection with the line of credit, each as incurred. The fees were allocated to each Fund based on average net assets. The use of the line of credit was generally restricted to temporary borrowing for extraordinary or emergency purposes. During the year ended September 30, 2024, there were borrowings under the line of credit as follows:
| Fund | Number of Days Utilizing Line of Credit | Average Borrowings | Average Borrowings Rates |
| Global Equity | 9 | $ 6,183,000 | 6.42% |
| Mid Cap Value | 3 | 750,000 | 6.42% |
All fees and interest expense related to the line of credit are included in other operating expenses in the Statements of Operations. There were no borrowings outstanding at September 30, 2024.
(9) Investment Transactions:
The cost of securities purchased and the proceeds from the sale of securities (excluding securities sold short, derivatives and short-term securities) for the year ended September 30, 2024 were as follows (in thousands):
| Fund | | Security Purchases | | Security Sales |
| Developing World | | $ | 1,844,358 | | | $ | 2,249,290 | |
| Emerging Markets Debt Opportunities | | | 72,877 | | | | 46,670 | |
| Floating Rate | | | 88,591 | | | | 53,360 | |
| Focus | | | 3,715,937 | | | | 3,819,095 | |
| Global Discovery | | | 126,187 | | | | 158,753 | |
| Global Equity | | | 232,811 | | | | 282,169 | |
| Global Opportunities | | | 1,316,020 | | | | 1,597,977 | |
| Global Unconstrained | | | 97,391 | | | | 39,635 | |
| Global Value | | | 345,839 | | | | 447,221 | |
| High Income | | | 4,188,269 | | | | 2,347,188 | |
| International | | | 4,137,685 | | | | 4,843,703 | |
| International Explorer | | | 68,228 | | | | 15,931 | |
| International Small-Mid | | | 1,405,972 | | | | 1,663,280 | |
| International Value | | | 4,236,974 | | | | 5,961,060 | |
| Mid Cap | | | 2,009,813 | | | | 2,876,187 | |
| Mid Cap Value | | | 263,554 | | | | 307,140 | |
| Select Equity | | | 10,251 | | | | 7,847 | |
| Small Cap | | | 718,210 | | | | 1,331,017 | |
| Sustainable Emerging Markets | | | 62,074 | | | | 15,957 | |
| Value | | | 80,671 | | | | 84,336 | |
| Value Income | | | 6,626 | | | | 3,986 | |
(10) Transactions in Securities of Affiliates:
The table below shows information about securities of Fund “affiliates” (as defined below) that were held by a Fund, purchased or sold by a Fund, or from which dividends were received by a Fund during the year ended September 30, 2024 (shares and dollar values in thousands). Each Fund identifies a company as an affiliate for the purpose of this report if the Fund owned voting securities that it believed represented 5% or more of that company’s outstanding voting securities (as defined by the 1940 Act) during the year ended September 30, 2024.
| Artisan Partners Funds | 111 |
| | NOTES TO FINANCIAL STATEMENTS | |
| | |
| | | As of
09/30/2023 | | | | | | | | | | | | Net Increase (Decrease) in Unrealized | | | As of
09/30/2024 | | | | |
| Funds | | Shares
Balance | | | Value | | | Purchases at Cost | | | Proceeds from Sales | | | Net Realized
Gain (Loss) | | | Appreciation or
Depreciation | | | Share
Balance | | | Value | | | Dividend
Income@ | |
| International Explorer |
| M&C Saatchi plc‡ | | | 3,589 | | | $6,129 | | | $6,014 | | | $— | | | $— | | | $3,329 | | | 6,358 | | | $15,472 | | | $119 | |
| Total | | | | | | $6,129 | | | $6,014 | | | $— | | | $— | | | $3,329 | | | | | | $15,472 | | | $119 | |
| International Small-Mid |
| CKD Corp.† | | | 3,657 | | | 50,388 | | | — | | | (24,425 | ) | | (506 | ) | | 25,349 | | | 2,479 | | | 50,806 | | | 872 | |
| Daikokutenbussan Co. Ltd.† | | | 762 | | | 32,099 | | | — | | | (15,466 | ) | | 226 | | | 28,136 | | | 552 | | | 44,995 | | | 137 | |
| Total# | | | | | | $82,487 | | | $— | | | $(39,891 | ) | | $(280 | ) | | $53,485 | | | | | | $95,801 | | | $1,009 | |
| International Value | | | | | | | | | | | | | | | | | | | | |
| Berkeley Group Holdings plc | | | 5,947 | | | 296,654 | | | — | | | — | | | — | | | 65,476 | | | 5,739 | | | 362,130 | | | 18,522 | |
| Brenntag SE‡ | | | 748 | | | 58,061 | | | 644,876 | | | (15,885 | ) | | 3,001 | | | 43,922 | | | 9,844 | | | 733,975 | | | 2,095 | |
| Sensata Technologies Holding plc‡ | | | 7,196 | | | 272,168 | | | 81,301 | | | — | | | — | | | (19,807 | ) | | 9,305 | | | 333,662 | | | 3,707 | |
| Total | | | | | | $626,883 | | | $726,177 | | | $(15,885 | ) | | $3,001 | | | $89,591 | | | | | | $1,429,767 | | | $24,324 | |
| @ | Net of foreign taxes withheld, if any. |
| † | Issuer was not an affiliate as of September 30, 2024. |
| # | Total value as of September 30, 2024 is presented only for those issuers that were affiliates as of September 30, 2024. |
| ‡ | Issuer was not an affiliate as of September 30, 2023. |
(11) Information for Federal Income Tax Purposes:
For Federal income tax purposes, the cost of investments, gross unrealized appreciation, gross unrealized depreciation and net unrealized appreciation (depreciation) on investments as of September 30, 2024 was as follows (in thousands):
| Fund | | Cost
of Investments | | Gross
Unrealized
Appreciation | | Gross
Unrealized
Depreciation | | Net
Unrealized Appreciation
(Depreciation)
on Investments |
| Developing World | | $ | 2,080,798 | | | $ | 1,527,932 | | | $ | (22,173 | ) | | $ | 1,505,759 | |
| Emerging Markets Debt Opportunities | | | 66,451 | | | | 3,514 | | | | (1,305 | ) | | | 2,209 | |
| Floating Rate | | | 67,501 | | | | 608 | | | | (1,216 | ) | | | (608 | ) |
| Focus | | | 878,154 | | | | 277,785 | | | | (3,250 | ) | | | 274,535 | |
| Global Discovery | | | 177,028 | | | | 66,887 | | | | (2,903 | ) | | | 63,984 | |
| Global Equity | | | 150,731 | | | | 36,720 | | | | (8,626 | ) | | | 28,094 | |
| Global Opportunities | | | 1,750,852 | | | | 802,905 | | | | (10,313 | ) | | | 792,592 | |
| Global Unconstrained | | | 101,008 | | | | 5,338 | | | | (3,591 | ) | | | 1,747 | |
| Global Value | | | 1,632,257 | | | | 899,350 | | | | (44,645 | ) | | | 854,705 | |
| High Income | | | 8,940,350 | | | | 204,806 | | | | (381,469 | ) | | | (176,663 | ) |
| International | | | 3,895,946 | | | | 1,538,516 | | | | (267,715 | ) | | | 1,270,801 | |
| International Explorer | | | 143,387 | | | | 22,192 | | | | (6,774 | ) | | | 15,418 | |
| International Small-Mid | | | 3,970,074 | | | | 1,007,626 | | | | (300,462 | ) | | | 707,164 | |
| International Value | | | 25,602,667 | | | | 10,987,505 | | | | (627,460 | ) | | | 10,360,045 | |
| Mid Cap | | | 2,769,536 | | | | 1,571,112 | | | | (49,505 | ) | | | 1,521,607 | |
| Mid Cap Value | | | 731,854 | | | | 449,797 | | | | (18,243 | ) | | | 431,554 | |
| Select Equity | | | 38,073 | | | | 14,697 | | | | (790 | ) | | | 13,907 | |
| Small Cap | | | 954,426 | | | | 466,641 | | | | (38,433 | ) | | | 428,208 | |
| Sustainable Emerging Markets | | | 131,894 | | | | 48,988 | | | | (8,503 | ) | | | 40,485 | |
| Value | | | 226,870 | | | | 122,763 | | | | (3,856 | ) | | | 118,907 | |
| Value Income | | | 14,487 | | | | 2,158 | | | | (321 | ) | | | 1,837 | |
The difference between cost of investments for financial reporting and cost of investments for Federal income tax purposes was due primarily to timing differences in recognizing certain gains and losses on security transactions (e.g., wash sale loss deferrals and passive foreign investment company transactions).
| 112 | Artisan Partners Funds |
| | NOTES TO FINANCIAL STATEMENTS | |
| | |
The tax characterization of ordinary income dividends and long-term capital gain distributions paid during the year ended September 30, 2024 and the year ended September 30, 2023 were as follows (in thousands):
| | | 9/30/2024 | | | 9/30/2023 | |
| | | Ordinary | | Long-Term | | | Ordinary | | Long-Term | |
| | | Income | | Capital Gain | | | Income | | Capital Gain | |
| Fund | | Dividends | | Distributions | | | Dividends | | Distributions | |
| Developing World | | $ | — | | | $ | — | | | $ | 14,242 | | | $ | — | |
| Emerging Markets Debt Opportunities | | | 5,540 | | | | 231 | | | | 2,159 | | | | 336 | |
| Floating Rate | | | 6,042 | | | | — | | | | 3,912 | | | | — | |
| Focus | | | — | | | | — | | | | 8,043 | | | | — | |
| Global Discovery | | | — | | | | — | | | | 233 | | | | — | |
| Global Equity | | | 1,791 | | | | — | | | | 2,074 | | | | — | |
| Global Opportunities | | | — | | | | 63,415 | | | | — | | | | — | |
| Global Unconstrained | | | 5,784 | | | | 210 | | | | 1,938 | | | | 177 | |
| Global Value | | | 23,757 | | | | 43,092 | | | | 10,802 | | | | 70,342 | |
| High Income | | | 619,097 | | | | — | | | | 482,065 | | | | 37,826 | |
| International | | | 61,760 | | | | 38,964 | | | | 78,879 | | | | 69,382 | |
| International Explorer | | | 1,569 | | | | 51 | | | | 47 | | | | — | |
| International Small-Mid | | | 2,205 | | | | — | | | | 3,473 | | | | — | |
| International Value | | | 706,320 | | | | 552,568 | | | | 48,411 | | | | 378,197 | |
| Mid Cap | | | — | | | | — | | | | 17,327 | | | | — | |
| Mid Cap Value | | | 9,170 | | | | 175,680 | | | | 6,654 | | | | 237,354 | |
| Select Equity | | | 250 | | | | — | | | | 501 | | | | 440 | |
| Small Cap | | | — | | | | — | | | | 7,342 | | | | — | |
| Sustainable Emerging Markets | | | 625 | | | | — | | | | 666 | | | | — | |
| Value | | | 3,388 | | | | 13,269 | | | | 831 | | | | 37,844 | |
| Value Income | | | 398 | | | | — | | | | 302 | | | | — | |
Floating Rate Fund had a return of capital during the year ended September 30, 2024 in the amount of $239 (in thousands).
Ordinary income dividends and long-term capital gain distributions were determined in accordance with income tax regulations that impose treatment that is different from the treatment that would result from the application of US GAAP for such items as net short-term gains, wash sale loss deferrals, straddle loss deferrals, passive foreign investment company transactions, foreign currency transactions, net investment losses and qualified late year ordinary losses.
Gains on redemptions in-kind for Focus Fund, Global Opportunities Fund, Mid Cap Fund, Mid Cap Value Fund, and Value Fund of approximately $15,992, $402,827, $12,289, $100,660, and $8,580 (in thousands), respectively, were included in net realized gain on investments in the Statements of Operations for the year ended September 30, 2024, and were not recognized for Federal income tax purposes. These net realized gains represent permanent book/tax differences and have been reclassified to “Fund shares issued and outstanding” on the Statements of Assets and Liabilities at September 30, 2024.
In addition, the Funds may periodically record reclassifications among certain capital accounts to reflect differences between financial reporting and income tax basis distributions. The reclassifications were recorded in order to reflect the tax treatment for certain permanent differences that exist between income tax regulations and US GAAP. The reclassifications generally relate to net operating losses, dividends in excess and utilization of earnings and profits distributed to shareholders on redemption of Fund shares. These reclassifications have no impact on the net asset values of the Funds.
Permanent book and tax differences resulted in reclassifications to undistributed net investment income (loss), accumulated net realized gain (loss) and paid-in-capital at September 30, 2024 as follows:
| | | Undistributed Net | | Accumulated Net | | Fund Shares |
| | | Investment | | Realized | | Issued and |
| Fund | | Income (Loss) | | Gain (Loss) | | Outstanding |
| Developing World | | $ | 13,918 | | | $ | 212 | | | $ | (14,130) | |
| Emerging Markets Debt Opportunities | | | (1,165) | | | | 837 | | | | 328 | |
| Floating Rate | | | (113) | | | | 352 | | | | (239) | |
| Focus | | | 2,779 | | | | (26,975) | | | | 24,196 | |
| Global Discovery | | | 1,093 | | | | (32) | | | | (1,061) | |
| Global Equity | | | 8 | | | | (322) | | | | 314 | |
| Artisan Partners Funds | 113 |
| | NOTES TO FINANCIAL STATEMENTS | |
| | |
| | | Undistributed Net | Accumulated Net | Fund Shares |
| | | Investment | Realized | Issued and |
| Fund | | Income (Loss) | Gain (Loss) | Outstanding |
| Global Opportunities | | 7,549 | | (450,313) | | 442,764 | |
| Global Unconstrained | | (1,867) | | 1,462 | | 405 | |
| Global Value | | (1,862) | | (2,553) | | 4,415 | |
| High Income | | (5,008) | | 5,008 | | — | |
| International | | (3,851) | | (21,214) | | 25,065 | |
| International Explorer | | (49) | | 19 | | 30 | |
| International Small-Mid | | (19) | | (130) | | 149 | |
| International Value | | (35,400) | | (31,063) | | 66,463 | |
| Mid Cap | | 31,943 | | (51,382) | | 19,439 | |
| Mid Cap Value | | (2,043) | | (103,363) | | 105,406 | |
| Select Equity | | (1) | | (1) | | 2 | |
| Small Cap | | 15,325 | | (2) | | (15,323) | |
| Sustainable Emerging Markets | | 94 | | (94) | | — | |
| Value | | (297) | | (11,308) | | 11,605 | |
| Value Income | | (4) | | 8 | | (4) | |
In order to meet certain excise tax distribution requirements, the Funds are required to measure and distribute annually, net capital gains realized during a twelve-month period ending October 31 and net investment income earned during a twelve-month period ending December 31. In connection with these requirements, the Funds are permitted for tax purposes to defer into their next fiscal year qualified late year losses. Qualified late year capital losses are any net capital losses incurred between November 1 and the end of the Funds’ fiscal year, September 30, 2024. Qualified late year ordinary losses are specified losses generally incurred between January 1 and the end of the Funds’ fiscal year, September 30, 2024.
Additional tax information as of and for the year ended September 30, 2024 follows (in thousands):
| | | | | | | | | Qualified | | Qualified | | Other | | Tax Components of | | | |
| | | Undistributed | | Undistributed | | Late Year | | Late Year | | Deferred | | Net Assets | | Total |
| | | Ordinary | | Long-Term | | Capital | | Ordinary | | Gains | | Appreciation | | Distributable |
| Fund | | Income | | Gain | | Losses | | Losses | | (Losses)* | | (Depreciation) | | Earnings |
| Developing World | | $ | — | | | $ | — | | | $ | — | | | $ | (10,960) | | | $ | (566,464) | | | $ | 1,498,557 | | | $ | 921,133 | |
| Emerging Markets Debt Opportunities | | | 524 | | | | — | | | | — | | | | — | | | | (7) | | | | 1,051 | | | | 1,568 | |
| Floating Rate | | | — | | | | — | | | | — | | | | — | | | | (1,476) | | | | (609) | | | | (2,085) | |
| Focus | | | 120,847 | | | | — | | | | — | | | | — | | | | (108) | | | | 212,717 | | | | 333,456 | |
| Global Discovery | | | — | | | | — | | | | — | | | | (929) | | | | (196) | | | | 63,993 | | | | 62,868 | |
| Global Equity | | | 7,265 | | | | 6,891 | | | | — | | | | — | | | | (20) | | | | 28,092 | | | | 42,228 | |
| Global Opportunities | | | 28,608 | | | | 231,697 | | | | — | | | | — | | | | (309) | | | | 792,621 | | | | 1,052,617 | |
| Global Unconstrained | | | — | | | | — | | | | (52) | | | | (398) | | | | (7) | | | | 281 | | | | (176) | |
| Global Value | | | 30,394 | | | | 76,911 | | | | — | | | | — | | | | (202) | | | | 854,904 | | | | 962,007 | |
| High Income | | | 4,119 | | | | — | | | | — | | | | — | | | | (100,162) | | | | (181,720) | | | | (277,763) | |
| International | | | 107,008 | | | | 308,047 | | | | — | | | | — | | | | (682) | | | | 1,270,855 | | | | 1,685,228 | |
| International Explorer | | | 2,677 | | | | 1,407 | | | | — | | | | — | | | | (6) | | | | 15,264 | | | | 19,342 | |
| International Small-Mid | | | 30,299 | | | | — | | | | — | | | | — | | | | (303) | | | | 705,353 | | | | 735,349 | |
| International Value | | | 125,406 | | | | 855,052 | | | | — | | | | — | | | | (1,742) | | | | 10,265,868 | | | | 11,244,584 | |
| Mid Cap | | | — | | | | 464,642 | | | | — | | | | (25,842) | | | | (459) | | | | 1,521,610 | | | | 1,959,951 | |
| Mid Cap Value | | | 5,537 | | | | 39,467 | | | | — | | | | — | | | | (150) | | | | 431,558 | | | | 476,412 | |
| Select Equity | | | 208 | | | | 181 | | | | — | | | | — | | | | (13) | | | | 13,908 | | | | 14,284 | |
| Small Cap | | | — | | | | 28,810 | | | | — | | | | (10,590) | | | | (193) | | | | 428,206 | | | | 446,233 | |
| Sustainable Emerging Markets | | | 1,943 | | | | — | | | | — | | | | — | | | | (146,135) | | | | 39,234 | | | | (104,958) | |
| Value | | | 4,545 | | | | 16,850 | | | | — | | | | — | | | | (28) | | | | 118,910 | | | | 140,277 | |
| Value Income | | | 14 | | | | — | | | | — | | | | — | | | | (324) | | | | 1,833 | | | | 1,523 | |
| * | Other deferred gains and losses relate to (a) distribution payable at year end (b) other items including deferred compensation and capital loss carryforward. |
| 114 | Artisan Partners Funds |
| | NOTES TO FINANCIAL STATEMENTS | |
| | |
As of September 30, 2024, the Funds had capital loss carryovers shown in the table below (in thousands). To the extent the Funds realize future net capital gains, those gains will be offset by any unused capital loss carryover.
| Fund | | Unexpiring –ST | | Unexpiring –LT | | Utilized in CY |
| Developing World | | $ | 393,777 | | | $ | 172,319 | | | $ | — | |
| Floating Rate | | | 294 | | | | 1,165 | | | | 236 | |
| Focus | | | — | | | | — | | | | 17,995 | |
| Global Discovery | | | 177 | | | | — | | | | 29,741 | |
| Global Equity | | | — | | | | — | | | | 5,209 | |
| High Income | | | — | | | | 84,144 | | | | — | |
| International Small-Mid | | | — | | | | — | | | | 176,845 | |
| Mid Cap | | | — | | | | — | | | | 80,161 | |
| Select Equity | | | — | | | | — | | | | 626 | |
| Small Cap | | | — | | | | — | | | | 304,204 | |
| Sustainable Emerging Markets(1) | | | 6,622 | | | | 139,498 | | | | — | |
| Value Income | | | — | | | | 317 | | | | 231 | |
| (1) | Due to an equity shift in the ordinary course of business, the utilization of certain capital loss carryovers is subject to annual limitations of $1,323 pursuant to IRC Section 382-383. |
(12) Fund Share Activities:
Capital share transactions for the Funds were as follows (dollar values in thousands):
| | | DEVELOPING WORLD | |
| | | Year Ended | | | Year Ended | |
| | | 9/30/2024 | | | 9/30/2023 | |
| | | Shares | | | Amount | | | Shares | | | Amount | |
| | | | | | | | | | | | | | | | | |
| Proceeds from shares issued | | | | | | | | | | | | | | | | |
| Investor Shares | | | 2,260,629 | | | $ | 41,103 | | | | 2,527,652 | | | $ | 37,282 | |
| Advisor Shares | | | 17,209,611 | | | | 306,632 | | | | 29,662,988 | | | | 430,432 | |
| Institutional Shares | | | 9,470,471 | | | | 173,955 | | | | 12,816,130 | | | | 188,572 | |
| Net asset value of shares issued in reinvestment of dividends and distributions | | | | | | | | | | | | | | | | |
| Investor Shares | | | — | | | | — | | | | 28,334 | | | | 364 | |
| Advisor Shares | | | — | | | | — | | | | 496,274 | | | | 6,427 | |
| Institutional Shares | | | — | | | | — | | | | 360,707 | | | | 4,696 | |
| Cost of shares redeemed | | | | | | | | | | | | | | | | |
| Investor Shares | | | (4,782,636) | | | | (83,404 | ) | | | (12,356,110) | | | | (165,867 | ) |
| Advisor Shares | | | (24,979,183) | | | | (448,117 | ) | | | (74,404,045) | | | | (1,064,140 | ) |
| Institutional Shares | | | (18,139,548) | | | | (322,572 | ) | | | (36,944,380) | | | | (534,239 | ) |
| Net increase (decrease) from fund share transactions | | | | | | | | | | | | | | | | |
| Investor Shares | | | (2,522,007) | | | | (42,301 | ) | | | (9,800,124) | | | | (128,221 | ) |
| Advisor Shares | | | (7,769,572) | | | | (141,485 | ) | | | (44,244,783) | | | | (627,281 | ) |
| Institutional Shares | | | (8,669,077) | | | | (148,617 | ) | | | (23,767,543) | | | | (340,971 | ) |
| Redemption Fees | | | | | | | | | | | | | | | | |
| Institutional Shares | | | | | | | — | | | | | | | | — | ^ |
^ Amount rounds to less than $1
| Artisan Partners Funds | 115 |
| | NOTES TO FINANCIAL STATEMENTS | |
| | |
| | | | EMERGING MARKETS DEBT OPPORTUNITIES | |
| | | | Year Ended | | | | Year Ended | |
| | | | 9/30/2024 | | | | 9/30/2023 | |
| | | | Shares | | | | Amount | | | | Shares | | | | Amount | |
| | | | | | | | | | | | | | | | | |
| Proceeds from shares issued | | | | | | | | | | | | | | | | |
| Investor Shares | | | 299,520 | | | $ | 3,077 | | | | 257,539 | | | $ | 2,657 | |
| Advisor Shares | | | 1,434,347 | | | | 14,651 | | | | 876,904 | | | | 8,947 | |
| Institutional Shares | | | 2,018,080 | | | | 20,690 | | | | 48,266 | | | | 496 | |
| Net asset value of shares issued in reinvestment of dividends and distributions | | | | | | | | | | | | | | | | |
| Investor Shares | | | 38,979 | | | | 396 | | | | 5,672 | | | | 58 | |
| Advisor Shares | | | 176,170 | | | | 1,792 | | | | 25,698 | | | | 262 | |
| Institutional Shares | | | 351,850 | | | | 3,582 | | | | 217,742 | | | | 2,175 | |
| Cost of shares redeemed | | | | | | | | | | | | | | | | |
| Investor Shares | | | (240,227) | | | | (2,455 | ) | | | (11,469) | | | | (114 | ) |
| Advisor Shares | | | (233,702) | | | | (2,381 | ) | | | (13,973) | | | | (143 | ) |
| Institutional Shares | | | (172,971) | | | | (1,770 | ) | | | (35,886) | | | | (363 | ) |
| Net increase from fund share transactions | | | | | | | | | | | | | | | | |
| Investor Shares | | | 98,272 | | | | 1,018 | | | | 251,742 | | | | 2,601 | |
| Advisor Shares | | | 1,376,815 | | | | 14,062 | | | | 888,629 | | | | 9,066 | |
| Institutional Shares | | | 2,196,959 | | | | 22,502 | | | | 230,122 | | | | 2,308 | |
| Redemption Fees | | | | | | | | | | | | | | | | |
| Investor Shares | | | | | | | 1 | | | | | | | | 2 | |
| Advisor Shares | | | | | | | 4 | | | | | | | | — | |
| Institutional Shares | | | | | | | 12 | | | | | | | | — | ^ |
^ Amount rounds to less than $1
| | | | FLOATING RATE | |
| | | | Year Ended | | | | Year Ended | |
| | | | 9/30/2024 | | | | 9/30/2023 | |
| | | | Shares | | | | Amount | | | | Shares | | | | Amount | |
| | | | | | | | | | | | | | | | | |
| Proceeds from shares issued | | | | | | | | | | | | | | | | |
| Investor Shares | | | 1,152,100 | | | $ | 11,131 | | | | 390,239 | | | $ | 3,705 | |
| Advisor Shares | | | 1,439,602 | | | | 13,878 | | | | 654,222 | | | | 6,204 | |
| Institutional Shares | | | 1,138,330 | | | | 10,990 | | | | 322,906 | | | | 3,070 | |
| Net asset value of shares issued in reinvestment of dividends and distributions | | | | | | | | | | | | | | | | |
| Investor Shares | | | 106,570 | | | | 1,026 | | | | 30,900 | | | | 293 | |
| Advisor Shares | | | 220,116 | | | | 2,116 | | | | 138,715 | | | | 1,313 | |
| Institutional Shares | | | 320,090 | | | | 3,078 | | | | 242,639 | | | | 2,296 | |
| Cost of shares redeemed | | | | | | | | | | | | | | | | |
| Investor Shares | | | (499,829) | | | | (4,803 | ) | | | (107,278) | | | | (1,010 | ) |
| Advisor Shares | | | (1,005,725) | | | | (9,656 | ) | | | (726,162) | | | | (6,839 | ) |
| Institutional Shares | | | (659,762) | | | | (6,331 | ) | | | (635,120) | | | | (6,000 | ) |
| Net increase from fund share transactions | | | | | | | | | | | | | | | | |
| Investor Shares | | | 758,841 | | | | 7,354 | | | | 313,861 | | | | 2,988 | |
| Advisor Shares | | | 653,993 | | | | 6,338 | | | | 66,775 | | | | 678 | |
| Institutional Shares | | | 798,658 | | | | 7,737 | | | | (69,575) | | | | (634 | ) |
| Redemption Fees | | | | | | | | | | | | | | | | |
| Investor Shares | | | | | | | 1 | | | | | | | | 1 | |
| Advisor Shares | | | | | | | — | ^ | | | | | | | — | ^ |
^ Amount rounds to less than $1
| 116 | Artisan Partners Funds |
| | NOTES TO FINANCIAL STATEMENTS | |
| | |
| | | FOCUS | |
| | | Year Ended | | | Year Ended | |
| | | 9/30/2024 | | | 9/30/2023 | |
| | | Shares | | | Amount | | | Shares | | | Amount | |
| | | | | | | | | | | | | | | | | |
| Proceeds from shares issued | | | | | | | | | | | | | | | | |
| Investor Shares | | | 116,680 | | | $ | 2,405 | | | | 1,920,650 | | | $ | 31,100 | |
| Advisor Shares | | | 7,175,067 | | | | 148,818 | | | | 7,312,438 | | | | 120,080 | |
| Institutional Shares | | | 6,360,345 | | | | 133,164 | | | | 7,364,623 | | | | 119,613 | |
| Net asset value of shares issued in reinvestment of dividends and distributions | | | | | | | | | | | | | | | | |
| Investor Shares | | | — | | | | — | | | | 46,081 | | | | 752 | |
| Advisor Shares | | | — | | | | — | | | | 202,531 | | | | 3,317 | |
| Institutional Shares | | | — | | | | — | | | | 66,966 | | | | 1,099 | |
| Cost of shares redeemed | | | | | | | | | | | | | | | | |
| Investor Shares | | | (1,225,590) | | | | (22,951 | ) | | | (14,661,282) | | | | (251,855 | ) |
| Advisor Shares | | | (10,036,503) | | | | (190,731 | ) | | | (29,818,145) | | | | (489,779 | ) |
| Institutional Shares | | | (9,399,122) | | | | (192,901 | ) | | | (22,091,094) | | | | (371,271 | ) |
| Net increase (decrease) from fund share transactions | | | | | | | | | | | | | | | | |
| Investor Shares | | | (1,108,910) | | | | (20,546 | ) | | | (12,694,551) | | | | (220,003 | ) |
| Advisor Shares | | | (2,861,436) | | | | (41,913 | ) | | | (22,303,176) | | | | (366,382 | ) |
| Institutional Shares | | | (3,038,777) | | | | (59,737 | ) | | | (14,659,505) | | | | (250,559 | ) |
| | | GLOBAL DISCOVERY |
| | | Year Ended | | | Year Ended | |
| | | 9/30/2024 | | | 9/30/2023 | |
| | | Shares | | | Amount | | | Shares | | | Amount | |
| | | | | | | | | | | | | | | | | |
| Proceeds from shares issued | | | | | | | | | | | | | | | | |
| Investor Shares | | | 192,850 | | | $ | 3,688 | | | | 173,806 | | | $ | 2,857 | |
| Advisor Shares | | | 143,357 | | | | 2,762 | | | | 513,339 | | | | 8,223 | |
| Institutional Shares | | | 150,301 | | | | 2,884 | | | | 416,529 | | | | 6,827 | |
| Net asset value of shares issued in reinvestment of dividends and distributions | | | | | | | | | | | | | | | | |
| Institutional Shares | | | — | | | | — | | | | 14,979 | | | | 233 | |
| Cost of shares redeemed | | | | | | | | | | | | | | | | |
| Investor Shares | | | (511,082) | | | | (9,622 | ) | | | (841,514) | | | | (13,439 | ) |
| Advisor Shares | | | (318,321) | | | | (5,954 | ) | | | (382,839) | | | | (5,826 | ) |
| Institutional Shares | | | (1,149,526) | | | | (19,573 | ) | | | (3,045,585) | | | | (51,521 | ) |
| Net increase (decrease) from fund share transactions | | | | | | | | | | | | | | | | |
| Investor Shares | | | (318,232) | | | | (5,934 | ) | | | (667,708) | | | | (10,582 | ) |
| Advisor Shares | | | (174,964) | | | | (3,192 | ) | | | 130,500 | | | | 2,397 | |
| Institutional Shares | | | (999,225) | | | | (16,689 | ) | | | (2,614,077) | | | | (44,461 | ) |
| | | GLOBAL EQUITY | |
| | | Year Ended | | | Year Ended | |
| | | 9/30/2024 | | | 9/30/2023 | |
| | | Shares | | | Amount | | | Shares | | | Amount | |
| | | | | | | | | | | | | | | | | |
| Proceeds from shares issued | | | | | | | | | | | | | | | | |
| Investor Shares | | | 82,977 | | | $ | 1,628 | | | | 70,823 | | | $ | 1,184 | |
| Advisor Shares | | | 12,320 | | | | 238 | | | | 89,571 | | | | 1,437 | |
| Institutional Shares | | | 600,053 | | | | 11,382 | | | | 146,938 | | | | 2,524 | |
| Net asset value of shares issued in reinvestment of dividends and distributions | | | | | | | | | | | | | | | | |
| Investor Shares | | | 36,149 | | | | 626 | | | | 39,782 | | | | 651 | |
| Advisor Shares | | | 2,708 | | | | 47 | | | | 2,831 | | | | 46 | |
| Institutional Shares | | | 53,013 | | | | 931 | | | | 76,048 | | | | 1,262 | |
| Cost of shares redeemed | | | | | | | | | | | | | | | | |
| Investor Shares | | | (673,456) | | | | (12,850 | ) | | | (748,769) | | | | (12,396 | ) |
| Advisor Shares | | | (80,869) | | | | (1,608 | ) | | | (105,577) | | | | (1,751 | ) |
| Institutional Shares | | | (2,812,400) | | | | (49,698 | ) | | | (697,435) | | | | (11,633 | ) |
| Net increase (decrease) from fund share transactions | | | | | | | | | | | | | | | | |
| Investor Shares | | | (554,330) | | | | (10,596 | ) | | | (638,164) | | | | (10,561 | ) |
| Advisor Shares | | | (65,841) | | | | (1,323 | ) | | | (13,175) | | | | (268 | ) |
| Institutional Shares | | | (2,159,334) | | | | (37,385 | ) | | | (474,449) | | | | (7,847 | ) |
| Artisan Partners Funds | 117 |
| | NOTES TO FINANCIAL STATEMENTS | |
| | |
| | | | GLOBAL OPPORTUNITIES |
| | | | Year Ended | | | | Year Ended | |
| | | | 9/30/2024 | | | | 9/30/2023 | |
| | | | Shares | | | | Amount | | | | Shares | | | | Amount | |
| | | | | | | | | | | | | | | | | |
| Proceeds from shares issued | | | | | | | | | | | | | | | | |
| Investor Shares | | | 822,654 | | | $ | 26,429 | | | | 1,358,932 | | | $ | 37,517 | |
| Advisor Shares | | | 2,378,118 | | | | 77,151 | | | | 3,328,051 | | | | 92,328 | |
| Institutional Shares | | | 20,529,331 | | | | 684,447 | | | | 4,634,894 | | | | 133,992 | |
| Net asset value of shares issued in reinvestment of dividends and distributions | | | | | | | | | | | | | | | | |
| Investor Shares | | | 554,307 | | | | 16,042 | | | | — | | | | — | |
| Advisor Shares | | | 334,163 | | | | 9,791 | | | | — | | | | — | |
| Institutional Shares | | | 1,039,282 | | | | 30,950 | | | | — | | | | — | |
| Cost of shares redeemed | | | | | | | | | | | | | | | | |
| Investor Shares | | | (6,074,937) | | | | (194,959 | ) | | | (9,252,104) | | | | (250,802 | ) |
| Advisor Shares | | | (5,044,757) | | | | (161,436 | ) | | | (12,311,797) | | | | (333,265 | ) |
| Institutional Shares | | | (36,861,699) | | | | (1,226,251 | ) | | | (24,401,480) | | | | (683,682 | ) |
| Net increase (decrease) from fund share transactions | | | | | | | | | | | | | | | | |
| Investor Shares | | | (4,697,976) | | | | (152,488 | ) | | | (7,893,172) | | | | (213,285 | ) |
| Advisor Shares | | | (2,332,476) | | | | (74,494 | ) | | | (8,983,746) | | | | (240,937 | ) |
| Institutional Shares | | | (15,293,086) | | | | (510,854 | ) | | | (19,766,586) | | | | (549,690 | ) |
| | | | GLOBAL UNCONSTRAINED | |
| | | | Year Ended | | | | Year Ended | |
| | | | 9/30/2024 | | | | 9/30/2023 | |
| | | | Shares | | | | Amount | | | | Shares | | | | Amount | |
| | | | | | | | | | | | | | | | | |
| Proceeds from shares issued | | | | | | | | | | | | | | | | |
| Investor Shares | | | 1,037,276 | | | $ | 10,518 | | | | 56,917 | | | $ | 570 | |
| Advisor Shares | | | 5,918,584 | | | | 59,721 | | | | 2,048,763 | | | | 20,689 | |
| Institutional Shares | | | 660,536 | | | | 6,660 | | | | 1,006,560 | | | | 10,010 | |
| Net asset value of shares issued in reinvestment of dividends and distributions | | | | | | | | | | | | | | | | |
| Investor Shares | | | 32,526 | | | | 327 | | | | 6,022 | | | | 59 | |
| Advisor Shares | | | 352,013 | | | | 3,527 | | | | 41,512 | | | | 412 | |
| Institutional Shares | | | 214,436 | | | | 2,140 | | | | 166,724 | | | | 1,644 | |
| Cost of shares redeemed | | | | | | | | | | | | | | | | |
| Investor Shares | | | (113,739) | | | | (1,139 | ) | | | (3,103) | | | | (31 | ) |
| Advisor Shares | | | (1,015,780) | | | | (10,242 | ) | | | (15,087) | | | | (149 | ) |
| Institutional Shares | | | (59,306) | | | | (595 | ) | | | (90,099) | | | | (900 | ) |
| Net increase from fund share transactions | | | | | | | | | | | | | | | | |
| Investor Shares | | | 956,063 | | | | 9,706 | | | | 59,836 | | | | 598 | |
| Advisor Shares | | | 5,254,817 | | | | 53,006 | | | | 2,075,188 | | | | 20,952 | |
| Institutional Shares | | | 815,666 | | | | 8,205 | | | | 1,083,185 | | | | 10,754 | |
| Redemption Fees | | | | | | | | | | | | | | | | |
| Investor Shares | | | | | | | 4 | | | | | | | | — | ^ |
| Advisor Shares | | | | | | | 2 | | | | | | | | 2 | |
| Institutional Shares | | | | | | | — | ^ | | | | | | | 1 | |
^ Amount rounds to less than $1
| 118 | Artisan Partners Funds |
| | NOTES TO FINANCIAL STATEMENTS | |
| | |
| | | GLOBAL VALUE | |
| | | Year Ended | | | Year Ended | |
| | | | 9/30/2024 | | | | 9/30/2023 | |
| | | | Shares | | | | Amount | | | | Shares | | | | Amount | |
| | | | | | | | | | | | | | | | | |
| Proceeds from shares issued | | | | | | | | | | | | | | | | |
| Investor Shares | | | 986,048 | | | $ | 21,584 | | | | 732,006 | | | $ | 13,664 | |
| Advisor Shares | | | 3,291,289 | | | | 71,160 | | | | 2,384,302 | | | | 43,246 | |
| Institutional Shares | | | 6,890,935 | | | | 151,576 | | | | 6,844,758 | | | | 121,551 | |
| Net asset value of shares issued in reinvestment of dividends and distributions | | | | | | | | | | | | | | | | |
| Investor Shares | | | 291,866 | | | | 5,799 | | | | 454,863 | | | | 7,728 | |
| Advisor Shares | | | 402,727 | | | | 7,986 | | | | 606,275 | | | | 10,276 | |
| Institutional Shares | | | 2,171,350 | | | | 43,166 | | | | 3,080,893 | | | | 52,344 | |
| Cost of shares redeemed | | | | | | | | | | | | | | | | |
| Investor Shares | | | (2,139,890) | | | | (44,999 | ) | | | (3,106,831) | | | | (55,703 | ) |
| Advisor Shares | | | (2,941,207) | | | | (63,998 | ) | | | (6,128,230) | | | | (108,730 | ) |
| Institutional Shares | | | (11,588,417) | | | | (249,979 | ) | | | (14,880,258) | | | | (269,580 | ) |
| Net increase (decrease) from fund share transactions | | | | | | | | | | | | | | | | |
| Investor Shares | | | (861,976) | | | | (17,616 | ) | | | (1,919,962) | | | | (34,311 | ) |
| Advisor Shares | | | 752,809 | | | | 15,148 | | | | (3,137,653) | | | | (55,208 | ) |
| Institutional Shares | | | (2,526,132) | | | | (55,237 | ) | | | (4,954,607) | | | | (95,685 | ) |
| | | | HIGH INCOME | |
| | | | Year Ended | | | | Year Ended | |
| | | | 9/30/2024 | | | | 9/30/2023 | |
| | | | Shares | | | | Amount | | | | Shares | | | | Amount | |
| | | | | | | | | | | | | | | | | |
| Proceeds from shares issued | | | | | | | | | | | | | | | | |
| Investor Shares | | | 15,487,168 | | | $ | 137,626 | | | | 14,742,464 | | | $ | 127,769 | |
| Advisor Shares | | | 148,532,479 | | | | 1,325,782 | | | | 155,911,423 | | | | 1,346,556 | |
| Institutional Shares | | | 238,842,629 | | | | 2,126,920 | | | | 203,369,011 | | | | 1,757,120 | |
| Net asset value of shares issued in reinvestment of dividends and distributions | | | | | | | | | | | | | | | | |
| Investor Shares | | | 5,198,051 | | | | 46,415 | | | | 6,351,186 | | | | 54,887 | |
| Advisor Shares | | | 25,720,648 | | | | 229,790 | | | | 24,034,118 | | | | 207,595 | |
| Institutional Shares | | | 17,524,078 | | | | 156,630 | | | | 14,320,098 | | | | 123,691 | |
| Cost of shares redeemed | | | | | | | | | | | | | | | | |
| Investor Shares | | | (35,344,255 | ) | | | (315,745 | ) | | | (29,541,734 | ) | | | (255,028 | ) |
| Advisor Shares | | | (145,167,624 | ) | | | (1,292,153 | ) | | | (133,676,627 | ) | | | (1,151,478 | ) |
| Institutional Shares | | | (140,390,710 | ) | | | (1,250,709 | ) | | | (112,587,861 | ) | | | (968,673 | ) |
| Net increase from fund share transactions | | | | | | | | | | | | | | | | |
| Investor Shares | | | (14,659,036 | ) | | | (131,704 | ) | | | (8,448,084 | ) | | | (72,372 | ) |
| Advisor Shares | | | 29,085,503 | | | | 263,419 | | | | 46,268,914 | | | | 402,673 | |
| Institutional Shares | | | 115,975,997 | | | | 1,032,841 | | | | 105,101,248 | | | | 912,138 | |
| Redemption Fees | | | | | | | | | | | | | | | | |
| Investor Shares | | | | | | | 24 | | | | | | | | 34 | |
| Advisor Shares | | | | | | | 107 | | | | | | | | 222 | |
| Institutional Shares | | | | | | | 612 | | | | | | | | 78 | |
| Artisan Partners Funds | 119 |
| | NOTES TO FINANCIAL STATEMENTS | |
| | |
| | | INTERNATIONAL | |
| | | Year Ended | | | Year Ended | |
| | | | 9/30/2024 | | | | 9/30/2023 | |
| | | | Shares | | | | Amount | | | | Shares | | | | Amount | |
| | | | | | | | | | | | | | | | | |
| Proceeds from shares issued | | | | | | | | | | | | | | | | |
| Investor Shares | | | 2,580,564 | | | $ | 72,252 | | | | 3,940,583 | | | $ | 99,692 | |
| Advisor Shares | | | 2,965,904 | | | | 82,088 | | | | 4,413,558 | | | | 108,833 | |
| Institutional Shares | | | 7,996,945 | | | | 223,704 | | | | 9,318,300 | | | | 233,958 | |
| Net asset value of shares issued in reinvestment of dividends and distributions | | | | | | | | | | | | | | | | |
| Investor Shares | | | 1,054,796 | | | | 27,172 | | | | 1,787,579 | | | | 42,902 | |
| Advisor Shares | | | 527,203 | | | | 13,507 | | | | 786,542 | | | | 18,783 | |
| Institutional Shares | | | 1,798,773 | | | | 46,534 | | | | 2,804,345 | | | | 67,641 | |
| Cost of shares redeemed | | | | | | | | | | | | | | | | |
| Investor Shares | | | (14,608,791) | | | | (400,961 | ) | | | (20,128,269) | | | | (498,596 | ) |
| Advisor Shares | | | (6,987,804) | | | | (190,113 | ) | | | (13,006,089) | | | | (318,156 | ) |
| Institutional Shares | | | (19,672,549) | | | | (555,147 | ) | | | (31,708,451) | | | | (795,818 | ) |
| Net increase (decrease) from fund share transactions | | | | | | | | | | | | | | | | |
| Investor Shares | | | (10,973,431) | | | | (301,537 | ) | | | (14,400,108) | | | | (356,002 | ) |
| Advisor Shares | | | (3,494,697) | | | | (94,518 | ) | | | (7,805,989) | | | | (190,540 | ) |
| Institutional Shares | | | (9,876,831) | | | | (284,909 | ) | | | (19,585,806) | | | | (494,219 | ) |
| | | | INTERNATIONAL EXPLORER | |
| | | | Year Ended | | | | Year Ended | |
| | | | 9/30/2024 | | | | 9/30/2023 | |
| | | | Shares | | | | Amount | | | | Shares | | | | Amount | |
| | | | | | | | | | | | | | | | | |
| Proceeds from shares issued | | | | | | | | | | | | | | | | |
| Advisor Shares | | | 4,634,193 | | | $ | 54,396 | | | | 3,391,448 | | | $ | 37,575 | |
| Institutional Shares | | | 1,945,289 | | | | 22,115 | | | | 2,094,641 | | | | 21,612 | |
| Net asset value of shares issued in reinvestment of dividends and distributions | | | | | | | | | | | | | | | | |
| Advisor Shares | | | 79,668 | | | | 841 | | | | 796 | | | | 8 | |
| Institutional Shares | | | 28,336 | | | | 299 | | | | 1,280 | | | | 12 | |
| Cost of shares redeemed | | | | | | | | | | | | | | | | |
| Advisor Shares | | | (409,487) | | | | (4,661 | ) | | | (278,181) | | | | (2,852 | ) |
| Institutional Shares | | | (866,129) | | | | (9,837 | ) | | | (346,948) | | | | (3,686 | ) |
| Net increase from fund share transactions | | | | | | | | | | | | | | | | |
| Advisor Shares | | | 4,304,374 | | | | 50,576 | | | | 3,114,063 | | | | 34,731 | |
| Institutional Shares | | | 1,107,496 | | | | 12,577 | | | | 1,748,973 | | | | 17,938 | |
| | | | INTERNATIONAL SMALL-MID | |
| | | | Year Ended | | | | Year Ended | |
| | | | 9/30/2024 | | | | 9/30/2023 | |
| | | | Shares | | | | Amount | | | | Shares | | | | Amount | |
| | | | | | | | | | | | | | | | | |
| Proceeds from shares issued | | | | | | | | | | | | | | | | |
| Investor Shares | | | 2,079,964 | | | $ | 34,184 | | | | 2,881,446 | | | $ | 46,413 | |
| Advisor Shares | | | 10,186,802 | | | | 173,836 | | | | 13,883,595 | | | | 224,702 | |
| Institutional Shares | | | 39,508,760 | | | | 689,565 | | | | 28,639,076 | | | | 469,785 | |
| Net asset value of shares issued in reinvestment of dividends and distributions | | | | | | | | | | | | | | | | |
| Advisor Shares | | | 1,583 | | | | 28 | | | | 16,852 | | | | 264 | |
| Institutional Shares | | | 111,228 | | | | 1,970 | | | | 179,689 | | | | 2,848 | |
| Cost of shares redeemed | | | | | | | | | | | | | | | | |
| Investor Shares | | | (8,123,473) | | | | (138,710 | ) | | | (7,574,621) | | | | (122,535 | ) |
| Advisor Shares | | | (20,476,373) | | | | (345,004 | ) | | | (24,045,760) | | | | (378,778 | ) |
| Institutional Shares | | | (30,881,179) | | | | (534,566 | ) | | | (37,319,974) | | | | (607,781 | ) |
| Net increase (decrease) from fund share transactions | | | | | | | | | | | | | | | | |
| Investor Shares | | | (6,043,509) | | | | (104,526 | ) | | | (4,693,175) | | | | (76,122 | ) |
| Advisor Shares | | | (10,287,988) | | | | (171,140 | ) | | | (10,145,312) | | | | (153,810 | ) |
| Institutional Shares | | | 8,738,809 | | | | 156,969 | | | | (8,501,209) | | | | (135,148 | ) |
| 120 | Artisan Partners Funds |
| | NOTES TO FINANCIAL STATEMENTS | |
| | |
| | | INTERNATIONAL VALUE |
| | | Year Ended | | Year Ended |
| | | 9/30/2024 | | 9/30/2023 |
| | | | Shares | | | Amount | | | Shares | | | Amount |
| | | | | | | | | | | | | | | | | |
| Proceeds from shares issued | | | | | | | | | | | | | | | | |
| Investor Shares | | | 9,470,387 | | | $ | 442,765 | | | | 9,834,815 | | | $ | 406,440 | |
| Advisor Shares | | | 59,644,964 | | | | 2,795,835 | | | | 74,926,006 | | | | 3,082,648 | |
| Institutional Shares | | | 68,040,589 | | | | 3,197,211 | | | | 91,953,057 | | | | 3,783,574 | |
| Net asset value of shares issued in reinvestment of dividends and distributions | | | | | | | | | | | | | | | | |
| Investor Shares | | | 2,280,936 | | | | 103,630 | | | | 1,132,434 | | | | 42,772 | |
| Advisor Shares | | | 7,195,795 | | | | 327,592 | | | | 2,581,862 | | | | 97,310 | |
| Institutional Shares | | | 15,057,881 | | | | 687,839 | | | | 6,502,378 | | | | 246,239 | |
| Cost of shares redeemed | | | | | | | | | | | | | | | | |
| Investor Shares | | | (13,349,484) | | | | (626,202 | ) | | | (11,090,064) | | | | (439,709 | ) |
| Advisor Shares | | | (44,030,638) | | | | (2,057,122 | ) | | | (34,206,528) | | | | (1,383,817 | ) |
| Institutional Shares | | | (66,374,944) | | | | (3,165,926 | ) | | | (94,346,236) | | | | (3,751,543 | ) |
| Net increase from fund share transactions | | | | | | | | | | | | | | | | |
| Investor Shares | | | (1,598,161) | | | | (79,807 | ) | | | (122,815) | | | | 9,503 | |
| Advisor Shares | | | 22,810,121 | | | | 1,066,305 | | | | 43,301,340 | | | | 1,796,141 | |
| Institutional Shares | | | 16,723,526 | | | | 719,124 | | | | 4,109,199 | | | | 278,270 | |
| | | | | | | | | | | | | | | | | |
| | | MID CAP |
| | | Year Ended | | Year Ended |
| | | 9/30/2024 | | 9/30/2023 |
| | | | Shares | | | Amount | | | Shares | | | Amount |
| | | | | | | | | | | | | | | | | |
| Proceeds from shares issued | | | | | | | | | | | | | | | | |
| Investor Shares | | | 3,329,372 | | | $ | 117,517 | | | | 5,328,320 | | | $ | 161,999 | |
| Advisor Shares | | | 3,233,312 | | | | 113,324 | | | | 4,969,386 | | | | 151,177 | |
| Institutional Shares | | | 7,009,480 | | | | 292,864 | | | | 13,910,998 | | | | 506,242 | |
| Net asset value of shares issued in reinvestment of dividends and distributions | | | | | | | | | | | | | | | | |
| Investor Shares | | | — | | | | — | | | | 111,051 | | | | 3,217 | |
| Advisor Shares | | | — | | | | — | | | | 82,923 | | | | 2,447 | |
| Institutional Shares | | | — | | | | — | | | | 269,709 | | | | 9,318 | |
| Cost of shares redeemed | | | | | | | | | | | | | | | | |
| Investor Shares | | | (13,647,685) | | | | (485,712 | ) | | | (11,925,799) | | | | (363,848 | ) |
| Advisor Shares | | | (5,955,369) | | | | (213,333 | ) | | | (5,753,584) | | | | (177,492 | ) |
| Institutional Shares | | | (16,226,618) | | | | (687,266 | ) | | | (15,810,383) | | | | (578,602 | ) |
| Net increase (decrease) from fund share transactions | | | | | | | | | | | | | | | | |
| Investor Shares | | | (10,318,313) | | | | (368,195 | ) | | | (6,486,428) | | | | (198,632 | ) |
| Advisor Shares | | | (2,722,057) | | | | (100,009 | ) | | | (701,275) | | | | (23,868 | ) |
| Institutional Shares | | | (9,217,138) | | | | (394,402 | ) | | | (1,629,676) | | | | (63,042 | ) |
| | | | | | | | | | | | | | | | | |
| | | MID CAP VALUE |
| | | Year Ended | | Year Ended |
| | | 9/30/2024 | | 9/30/2023 |
| | | | Shares | | | Amount | | | Shares | | | Amount |
| | | | | | | | | | | | | | | | | |
| Proceeds from shares issued | | | | | | | | | | | | | | | | |
| Investor Shares | | | 1,010,946 | | | $ | 16,207 | | | | 844,727 | | | $ | 14,306 | |
| Advisor Shares | | | 2,269,193 | | | | 35,194 | | | | 2,185,290 | | | | 36,821 | |
| Institutional Shares | | | 13,197,761 | | | | 206,592 | | | | 2,233,627 | | | | 37,230 | |
| Net asset value of shares issued in reinvestment of dividends and distributions | | | | | | | | | | | | | | | | |
| Investor Shares | | | 3,832,202 | | | | 56,372 | | | | 4,249,487 | | | | 69,309 | |
| Advisor Shares | | | 2,685,677 | | | | 39,238 | | | | 4,464,196 | | | | 72,365 | |
| Institutional Shares | | | 5,642,336 | | | | 82,491 | | | | 5,860,535 | | | | 95,058 | |
| Cost of shares redeemed | | | | | | | | | | | | | | | | |
| Investor Shares | | | (6,000,108) | | | | (95,250 | ) | | | (5,888,215) | | | | (99,830 | ) |
| Advisor Shares | | | (7,096,336) | | | | (109,146 | ) | | | (14,894,769) | | | | (249,205 | ) |
| Institutional Shares | | | (15,153,968) | | | | (238,028 | ) | | | (6,018,631) | | | | (101,133 | ) |
| Net increase (decrease) from fund share transactions | | | | | | | | | | | | | | | | |
| Investor Shares | | | (1,156,960) | | | | (22,671 | ) | | | (794,001) | | | | (16,215 | ) |
| Advisor Shares | | | (2,141,466) | | | | (34,714 | ) | | | (8,245,283) | | | | (140,019 | ) |
| Institutional Shares | | | 3,686,129 | | | | 51,055 | | | | 2,075,531 | | | | 31,155 | |
| Artisan Partners Funds | 121 |
| | NOTES TO FINANCIAL STATEMENTS | |
| | |
| | | SELECT EQUITY |
| | | Year Ended | | Year Ended |
| | | 9/30/2024 | | 9/30/2023 |
| | | | Shares | | | Amount | | | Shares | | | Amount |
| | | | | | | | | | | | | | | | | |
| Proceeds from shares issued | | | | | | | | | | | | | | | | |
| Investor Shares | | | 21,504 | | | $ | 296 | | | | 37,336 | | | $ | 425 | |
| Advisor Shares | | | 25,509 | | | | 305 | | | | 25,352 | | | | 262 | |
| Institutional Shares | | | 240,969 | | | | 3,458 | | | | 107,453 | | | | 1,257 | |
| Net asset value of shares issued in reinvestment of dividends and distributions | | | | | | | | | | | | | | | | |
| Investor Shares | | | 1,049 | | | | 13 | | | | 6,388 | | | | 69 | |
| Advisor Shares | | | 717 | | | | 9 | | | | 5,163 | | | | 56 | |
| Institutional Shares | | | 17,886 | | | | 228 | | | | 75,440 | | | | 816 | |
| Cost of shares redeemed | | | | | | | | | | | | | | | | |
| Investor Shares | | | (39,340) | | | | (498 | ) | | | (48,366) | | | | (536 | ) |
| Advisor Shares | | | (42,024) | | | | (627 | ) | | | (85,455) | | | | (1,022 | ) |
| Institutional Shares | | | (9,941) | | | | (139 | ) | | | (32,754) | | | | (386 | ) |
| Net increase from fund share transactions | | | | | | | | | | | | | | | | |
| Investor Shares | | | (16,787) | | | | (189 | ) | | | (4,642) | | | | (42 | ) |
| Advisor Shares | | | (15,798) | | | | (313 | ) | | | (54,940) | | | | (704 | ) |
| Institutional Shares | | | 248,914 | | | | 3,547 | | | | 150,139 | | | | 1,687 | |
| | | | | | | | | | | | | | | | | |
| | | SMALL CAP |
| | | Year Ended | | Year Ended |
| | | 9/30/2024 | | 9/30/2023 |
| | | | Shares | | | Amount | | | Shares | | | Amount |
| | | | | | | | | | | | | | | | | |
| Proceeds from shares issued | | | | | | | | | | | | | | | | |
| Investor Shares | | | 922,931 | | | $ | 29,316 | | | | 1,440,464 | | | $ | 44,383 | |
| Advisor Shares | | | 1,637,662 | | | | 53,700 | | | | 2,588,754 | | | | 78,762 | |
| Institutional Shares | | | 2,047,850 | | | | 68,266 | | | | 5,146,391 | | | | 161,456 | |
| Net asset value of shares issued in reinvestment of dividends and distributions | | | | | | | | | | | | | | | | |
| Investor Shares | | | — | | | | — | | | | 49,814 | | | | 1,521 | |
| Advisor Shares | | | — | | | | — | | | | 42,554 | | | | 1,311 | |
| Institutional Shares | | | — | | | | — | | | | 123,394 | | | | 3,887 | |
| Cost of shares redeemed | | | | | | | | | | | | | | | | |
| Investor Shares | | | (4,745,541) | | | | (154,735 | ) | | | (4,188,990) | | | | (128,581 | ) |
| Advisor Shares | | | (2,781,650) | | | | (91,188 | ) | | | (6,713,602) | | | | (210,533 | ) |
| Institutional Shares | | | (13,851,029) | | | | (473,251 | ) | | | (8,580,993) | | | | (272,166 | ) |
| Net increase (decrease) from fund share transactions | | | | | | | | | | | | | | | | |
| Investor Shares | | | (3,822,610) | | | | (125,419 | ) | | | (2,698,712) | | | | (82,677 | ) |
| Advisor Shares | | | (1,143,988) | | | | (37,488 | ) | | | (4,082,294) | | | | (130,460 | ) |
| Institutional Shares | | | (11,803,179) | | | | (404,985 | ) | | | (3,311,208) | | | | (106,823 | ) |
| | | | | | | | | | | | | | | | | |
| | | SUSTAINABLE EMERGING MARKETS |
| | | Year Ended | | Year Ended |
| | | 9/30/2024 | | 9/30/2023 |
| | | | Shares | | | Amount | | | Shares | | | Amount |
| | | | | | | | | | | | | | | | | |
| Proceeds from shares issued | | | | | | | | | | | | | | | | |
| Investor Shares | | | 322,922 | | | $ | 5,264 | | | | 183,428 | | | $ | 2,763 | |
| Advisor Shares | | | 923,399 | | | | 14,416 | | | | 826,161 | | | | 11,807 | |
| Institutional Shares | | | 3,428,276 | | | | 54,783 | | | | 1,548,000 | | | | 23,775 | |
| Net asset value of shares issued in reinvestment of dividends and distributions | | | | | | | | | | | | | | | | |
| Investor Shares | | | 3,903 | | | | 60 | | | | 8,273 | | | | 112 | |
| Advisor Shares | | | 13,179 | | | | 202 | | | | 20,527 | | | | 277 | |
| Institutional Shares | | | 23,260 | | | | 363 | | | | 16,843 | | | | 232 | |
| Cost of shares redeemed | | | | | | | | | | | | | | | | |
| Investor Shares | | | (363,910) | | | | (5,971 | ) | | | (267,888) | | | | (3,943 | ) |
| Advisor Shares | | | (863,484) | | | | (13,722 | ) | | | (503,915) | | | | (7,191 | ) |
| Institutional Shares | | | (742,630) | | | | (12,658 | ) | | | (516,705) | | | | (7,636 | ) |
| Net increase from fund share transactions | | | | | | | | | | | | | | | | |
| Investor Shares | | | (37,085) | | | | (647 | ) | | | (76,187) | | | | (1,068 | ) |
| Advisor Shares | | | 73,094 | | | | 896 | | | | 342,773 | | | | 4,893 | |
| Institutional Shares | | | 2,708,906 | | | | 42,488 | | | | 1,048,138 | | | | 16,371 | |
| 122 | Artisan Partners Funds |
| | NOTES TO FINANCIAL STATEMENTS | |
| | |
| | | VALUE |
| | | Year Ended | | Year Ended |
| | | 9/30/2024 | | 9/30/2023 |
| | | | Shares | | | Amount | | | Shares | | | Amount |
| | | | | | | | | | | | | | | | | |
| Proceeds from shares issued | | | | | | | | | | | | | | | | |
| Investor Shares | | | 386,979 | | | $ | 5,496 | | | | 787,870 | | | $ | 10,314 | |
| Advisor Shares | | | 1,401,488 | | | | 19,521 | | | | 3,153,937 | | | | 40,437 | |
| Institutional Shares | | | 4,763,117 | | | | 67,010 | | | | 3,772,939 | | | | 49,224 | |
| Net asset value of shares issued in reinvestment of dividends and distributions | | | | | | | | | | | | | | | | |
| Investor Shares | | | 326,064 | | | | 4,268 | | | | 1,107,046 | | | | 13,130 | |
| Advisor Shares | | | 366,399 | | | | 4,763 | | | | 763,304 | | | | 8,999 | |
| Institutional Shares | | | 525,506 | | | | 6,832 | | | | 1,208,967 | | | | 14,254 | |
| Cost of shares redeemed | | | | | | | | | | | | | | | | |
| Investor Shares | | | (1,624,426 | ) | | | (23,225 | ) | | | (2,401,585 | ) | | | (31,001 | ) |
| Advisor Shares | | | (2,237,505 | ) | | | (31,773 | ) | | | (1,813,496 | ) | | | (23,078 | ) |
| Institutional Shares | | | (3,873,189 | ) | | | (55,123 | ) | | | (3,048,342 | ) | | | (37,147 | ) |
| Net increase from fund share transactions | | | | | | | | | | | | | | | | |
| Investor Shares | | | (911,383 | ) | | | (13,461 | ) | | | (506,669 | ) | | | (7,557 | ) |
| Advisor Shares | | | (469,618 | ) | | | (7,489 | ) | | | 2,103,745 | | | | 26,358 | |
| Institutional Shares | | | 1,415,434 | | | | 18,719 | | | | 1,933,562 | | | | 26,331 | |
| | | | | | | | | | | | | | | | | |
| | | VALUE INCOME |
| | | Year Ended | | Year Ended |
| | | 9/30/2024 | | 9/30/2023 |
| | | | Shares | | | Amount | | | Shares | | | Amount |
| | | | | | | | | | | | | | | | | |
| Proceeds from shares issued | | | | | | | | | | | | | | | | |
| Investor Shares | | | 15,985 | | | $ | 151 | | | | 52,711 | | | $ | 483 | |
| Advisor Shares | | | 305 | | | | 3 | | | | 53,850 | | | | 487 | |
| Institutional Shares | | | 250,053 | | | | 2,413 | | | | 88,223 | | | | 806 | |
| Net asset value of shares issued in reinvestment of dividends and distributions | | | | | | | | | | | | | | | | |
| Investor Shares | | | 2,493 | | | | 25 | | | | 2,008 | | | | 18 | |
| Advisor Shares | | | 5,485 | | | | 55 | | | | 4,952 | | | | 44 | |
| Institutional Shares | | | 31,642 | | | | 318 | | | | 26,806 | | | | 240 | |
| Cost of shares redeemed | | | | | | | | | | | | | | | | |
| Investor Shares | | | (8,596 | ) | | | (87 | ) | | | (58,633 | ) | | | (536 | ) |
| Advisor Shares | | | (2,406 | ) | | | (24 | ) | | | (1,091 | ) | | | (10 | ) |
| Institutional Shares | | | (38,517 | ) | | | (386 | ) | | | (22,368 | ) | | | (200 | ) |
| Net increase from fund share transactions | | | | | | | | | | | | | | | | |
| Investor Shares | | | 9,882 | | | | 89 | | | | (3,914 | ) | | | (35 | ) |
| Advisor Shares | | | 3,384 | | | | 34 | | | | 57,711 | | | | 521 | |
| Institutional Shares | | | 243,178 | | | | 2,345 | | | | 92,661 | | | | 846 | |
(13) Subsequent Events:
The Funds have evaluated subsequent events through the date of issuance of the Funds’ financial statements and have determined there is no impact to the Funds’ financial statements.
| Artisan Partners Funds | 123 |
REPORT OF INDEPENDENT REGISTERED PUBLIC ACCOUNTING FIRM
To the Shareholders and the Board of Directors of Artisan Partners Funds, Inc.
Opinion on the Financial Statements
We have audited the accompanying consolidated statements of assets and liabilities of Artisan Emerging Markets Debt Opportunities Fund and Artisan Global Unconstrained Fund (two of the funds comprising Artisan Partners Funds, Inc. (“Artisan Partners Funds”)), including the consolidated schedules of investments, as of September 30, 2024, and the related consolidated statements of operations and changes in net assets, and the consolidated financial highlights for each of the periods indicated in the table below and the related notes (collectively referred to as the “ consolidated financial statements”). We have also audited the accompanying statements of assets and liabilities of Artisan Developing World Fund, Artisan Floating Rate Fund, Artisan Focus Fund, Artisan Global Discovery Fund, Artisan Global Equity Fund, Artisan Global Opportunities Fund, Artisan Global Value Fund, Artisan High Income Fund, Artisan International Fund, Artisan International Explorer Fund, Artisan International Small-Mid Fund, Artisan International Value Fund, Artisan Mid Cap Fund, Artisan Mid Cap Value Fund, Artisan Select Equity Fund, Artisan Small Cap Fund, Artisan Sustainable Emerging Markets Fund, Artisan Value Fund and Artisan Value Income Fund (nineteen of the funds comprising Artisan Partner Funds), including the schedules of investments, as of September 30, 2024, and the related statements of operations and changes in net assets, and the financial highlights for each of the periods indicated in the table below and the related notes (collectively, together with the consolidated financial statements, referred to as the “financial statements”). In our opinion, the financial statements present fairly, in all material respects, the financial position of each of the funds comprising Artisan Partners Funds, Inc. at September 30, 2024, the results of their operations, changes in net assets and financial highlights for each of the periods indicated in the table below, in conformity with U.S. generally accepted accounting principles.
Funds comprising
Artisan Partners Funds, Inc. | Statements of
Operations* | Statements of changes
in net assets* | Financial
Highlights* |
Artisan Developing World Fund Artisan Focus Fund Artisan Global Discovery Fund Artisan Global Equity Fund Artisan Global Opportunities Fund Artisan Global Value Fund Artisan High Income Fund Artisan International Fund Artisan International Small-Mid Fund Artisan International Value Fund Artisan Mid Cap Fund Artisan Mid Cap Value Fund Artisan Small Cap Fund Artisan Sustainable Emerging Markets Fund Artisan Value Fund | For the year ended September 30, 2024 | For each of the two years in the period ended September 30, 2024 | For each of the five years in the period ended September 30, 2024 |
| Artisan Select Equity Fund | For the year ended September 30, 2024 | For each of the two years in the period ended September 30, 2024 | For each of the four years in the period ended September 30, 2024 and for the period from February 28, 2020 (commencement of operations) through September 30, 2020 |
| Artisan Floating Rate Fund | For the year ended September 30, 2024 | For each of the two years in the period ended September 30, 2024 | For each of the two years ended September 30, 2024, and for the period from December 1, 2021 (commencement of operations) through September 30, 2022 |
| Artisan Value Income Fund | For the year ended September 30, 2024 | For each of the two years in the period ended September 30, 2024 | For each of the two years ended September 30, 2024, and for the period from February 28, 2022 (commencement of operations) through September 30, 2022 |
| 124 | Artisan Partners Funds |
Funds comprising
Artisan Partners Funds, Inc. | Statements of
Operations* | Statements of changes
in net assets* | Financial
Highlights* |
| Artisan Global Unconstrained Fund | For the year ended September 30, 2024 | For each of the two years in the period ended September 30, 2024 | For each of the two years ended September 30, 2024, and for the period from March 31, 2022 (commencement of operations) through September 30, 2022 |
| Artisan Emerging Markets Debt Opportunities Fund | For the year ended September 30, 2024 | For each of the two years in the period ended September 30, 2024 | For each of the two years ended September 30, 2024, and for the period from April 7, 2022 (commencement of operations) through September 30, 2022 |
| Artisan International Explorer Fund | For the year ended September 30, 2024 | For each of the two years in the period ended September 30, 2024 | For each of the two years ended September 30, 2024, and for the period from May 16, 2022 (commencement of operations) through September 30, 2022 |
* Consolidated statements of operations and changes in net assets and consolidated financial highlights with respect to Artisan Emerging Markets Debt Opportunities Fund and Artisan Global Unconstrained Fund
Basis for Opinion
These financial statements are the responsibility of Artisan Partners Funds’ management. Our responsibility is to express an opinion on each of the Funds’ financial statements based on our audits. We are a public accounting firm registered with the Public Company Accounting Oversight Board (United States) (“PCAOB”) and are required to be independent with respect to Artisan Partners Funds in accordance with the U.S. federal securities laws and the applicable rules and regulations of the Securities and Exchange Commission and the PCAOB.
We conducted our audits in accordance with the standards of the PCAOB. Those standards require that we plan and perform the audit to obtain reasonable assurance about whether the financial statements are free of material misstatement, whether due to error or fraud. Artisan Partners Funds is not required to have, nor were we engaged to perform, an audit of Artisan Partners Funds’ internal control over financial reporting. As part of our audits, we are required to obtain an understanding of internal control over financial reporting but not for the purpose of expressing an opinion on the effectiveness of Artisan Partners Funds’ internal control over financial reporting. Accordingly, we express no such opinion.
Our audits included performing procedures to assess the risks of material misstatement of the financial statements, whether due to error or fraud, and performing procedures that respond to those risks. Such procedures included examining, on a test basis, evidence regarding the amounts and disclosures in the financial statements. Our procedures included confirmation of securities owned as of September 30, 2024, by correspondence with the custodian, brokers, counterparties and agent banks; when replies were not received from custodian, brokers, counterparties and agent banks, we performed other auditing procedures. Our audits also included evaluating the accounting principles used and significant estimates made by management, as well as evaluating the overall presentation of the financial statements. We believe that our audits provide a reasonable basis for our opinion.
We have served as the auditor of one or more Artisan Partners Funds investment companies since 2003.
New York, New York
November 26, 2024
| Artisan Partners Funds | 125 |
| | NOTES TO FINANCIAL STATEMENTS | |
| | |
Other Federal tax information (unaudited):
The Internal Revenue Code requires that shareholders be notified of certain information regarding long-term capital gains, qualified dividend income and the dividends received deduction for corporate shareholders. This data is informational only. Every year in January, shareholders are sent a Form 1099-DIV which provides the federal tax status of dividends and distributions received during the calendar year. Shareholders are advised to consult their own tax advisor with respect to the specific tax consequences of investing in the Funds.
Each Fund hereby designates the following amounts as (i) long-term capital gain distributions for purposes of the dividends paid deduction (including earnings and profits distributed to shareholders on redemption of Fund shares, in thousands), (ii) the amount of ordinary dividends paid during the year ended September 30, 2024 that are considered qualified dividend income as defined in the Jobs and Growth Tax Relief Reconciliation Act of 2003, and (iii) the amount of ordinary dividends paid during the year ended September 30, 2024 that are eligible for the dividends received deduction available to certain corporate shareholders.
| Fund | | Long-Term Capital Gains | | Qualified Dividend Income | | | Dividends Received Deduction | |
| Developing World | | $ | — | | | | N/A | | | | N/A | |
| Emerging Markets Debt Opportunities | | | 231 | | | | N/A | | | | N/A | |
| Floating Rate | | | — | | | | N/A | | | | N/A | |
| Focus | | | — | | | | N/A | | | | N/A | |
| Global Discovery | | | — | | | | N/A | | | | N/A | |
| Global Equity | | | — | | | | 100.00% | | | | 23.27% | |
| Global Opportunities | | | 101,199 | | | | N/A | | | | N/A | |
| Global Unconstrained | | | 210 | | | | N/A | | | | N/A | |
| Global Value | | | 44,926 | | | | 100.00 | | | | 47.12 | |
| High Income | | | — | | | | N/A | | | | N/A | |
| International | | | 55,617 | | | | 100.00 | | | | N/A | |
| International Explorer | | | — | | | | 100.00 | | | | N/A | |
| International Small-Mid | | | — | | | | 100.00 | | | | 2.26 | |
| International Value | | | 580,903 | | | | 100.00 | | | | N/A | |
| Mid Cap | | | 39,102 | | | | N/A | | | | N/A | |
| Mid Cap Value | | | 179,351 | | | | 100.00 | | | | 100.00 | |
| Select Equity | | | — | | | | 100.00 | | | | 100.00 | |
| Small Cap | | | 2 | | | | N/A | | | | N/A | |
| Sustainable Emerging Markets | | | — | | | | 100.00 | | | | N/A | |
| Value | | | 15,869 | | | | 100.00 | | | | 100.00 | |
| Value Income | | | — | | | | 100.00 | | | | 86.80 | |
| 126 | Artisan Partners Funds |
| | NOTES ON PORTFOLIO HOLDINGS’ CLASSIFICATION | |
| | |
The discussions of each Fund included in this report include statistical information about the portfolios of each of the Funds. Except as otherwise noted, that information is as of September 30, 2024. That information will vary with changes in a Fund’s portfolio investments.
For the purposes of assigning portfolio securities to a particular country in this report, the Adviser considers an issuer to be from a particular country as designated by its securities information vendors. However, the Adviser in its own judgment may consider an issuer to be from a country other than the country designated by the securities information vendors. A vendor’s criteria may include the identity of the jurisdiction of the issuer’s incorporation, the main equity trading market for the issuer’s securities, the geographical distribution of the issuer’s operations and the location of the issuer’s headquarters. The Adviser may also consider other criteria such as the source of a company’s revenues. Over time, country designations may change.
For the purposes of assigning portfolio securities to a particular sector and industry in this report, the Adviser assigns equity securities in accordance with the sector and industry classifications of the Global Industry Classification Standard (GICS®) developed by MSCI Inc. and Standard & Poor's (to the extent available) as primary sources for most Funds and FactSet Research Systems, Inc. (to the extent available) as a secondary source for this information. The Adviser uses the Sustainable Industry Classification System (“SICS®“), developed by the Sustainability Accounting Standards Board (“SASB”), as the primary source with respect to Sustainable Emerging Markets Fund. The Adviser assigns debt securities in accordance with the classifications developed by Bloomberg Finance L.P. In the event the Adviser’s securities information vendors do not classify a security to a particular sector or industry, or if the Adviser determines that a different classification is more appropriate, the Adviser classifies the security according to its own judgment, using other securities information vendors, the company description and/or other publicly available information. Sector and industry classifications may change over time.
The names of portfolio securities reflected in this report are as reported by the Funds’ data providers, may not represent the legal name of the entity and, in some cases, are translations of non-English names.
Trademarks (Unaudited)
Trademarks and copyrights relating to the indices and products of portfolio companies mentioned in this report, if any, are owned by their respective owners. Except as otherwise indicated, the trademarks, including names, logos, slogans and service marks appearing in this report are the property of the Adviser and may not be copied, reproduced, published or in any way used without written permission.
The Global Industry Classification Standard (GICS®) is the exclusive intellectual property of MSCI Inc. (MSCI) and Standard & Poor’s Financial Services, LLC (S&P). Neither MSCI, S&P, their affiliates, nor any of their third party providers (“GICS Parties”) makes any representations or warranties, express or implied, with respect to GICS or the results to be obtained by the use thereof, and expressly disclaim all warranties, including warranties of accuracy, completeness, merchantability and fitness for a particular purpose. The GICS Parties shall not have any liability for any direct, indirect, special, punitive, consequential or any other damages (including lost profits) even if notified of such damages.
The Sustainable Industry Classification System (SICS®) is the exclusive intellectual property of Sustainability Accounting Standards Board (SASB).
MSCI makes no express or implied warranties or representations and shall have no liability whatsoever with respect to any MSCI data contained herein. The MSCI data may not be further redistributed or used to create indices or financial products. This report is not approved or produced by MSCI.
Source ICE Data Indices, LLC is used with permission. ICE® is a registered trademark of ICE Data Indices, LLC or its affiliates and BofA® is a registered trademark of Bank of America Corporation licensed by Bank of America Corporation and its affiliates (“BofA”), and may not be used without BofA’s prior written approval. The index data referenced herein is the property of ICE Data Indices, LLC, its affiliates (“ICE Data”) and/or its third party suppliers and, along with the ICE BofA trademarks, has been licensed for use by Artisan Partners Limited Partnership. ICE Data and its Third Party Suppliers accept no liability in connection with the use of such index data or marks. See www.artisanpartners.com/ice-data.html for a full copy of the Disclaimer.
| Artisan Partners Funds | 127 |
| | ITEM 8. CHANGES IN AND DISAGREEMENTS WITH ACCOUNTANTS | |
| | |
None.
| | ITEM 9. PROXY DISCLOSURES | |
| | |
A special meeting of shareholders of Artisan International Explorer Fund (the “Fund”) was held on April 15, 2024 (the “Meeting”), at which shareholders of the Fund approved a change in the sub-classification of the Fund from “diversified” to “non-diversified” for purposes of Section 5(b) of the 1940 Act and the elimination of a related fundamental investment restriction (the “Proposal”). As a non-diversified fund, the Fund may invest a larger portion of its assets in securities of a smaller number of issuers than a diversified fund, which means a single issuer’s performance may affect Fund performance more than if the Fund were invested in a larger number of issuers. The change took effect on April 15, 2024.
The results of the votes are summarized below:
| | For | Withheld | Against |
| Proposal | 5,210,608 | 8,647 | 4,472 |
| | ITEM 10. REMUNERATION PAID TO DIRECTORS, OFFICERS, AND OTHERS | |
| | |
See Statement of Operations in Item 7
| 128 | Artisan Partners Funds |
| | ITEM 11. STATEMENT REGARDING BASIS FOR APPROVAL OF INVESTMENT ADVISORY CONTRACT | |
| | |
(Unaudited)
Artisan Partners is responsible for management of the Funds’ (as defined below) investment portfolios and for overall management of the Funds’ business and affairs pursuant to an investment advisory agreement (the “Advisory Agreement”) between Artisan Partners Funds and Artisan Partners. With respect to each Fund, the Advisory Agreement, after an initial two-year term, may be continued from year to year only so long as the continuation is approved at least annually (a) by the vote of a majority of the directors of Artisan Partners Funds who are not “interested persons” of Artisan Partners Funds or Artisan Partners (the “independent directors”), and (b) by the board of directors or by the vote of a majority (as defined in the Investment Company Act of 1940, as amended) of the outstanding shares of the Fund.
The directors of Artisan Partners Funds held a meeting on May 8-9, 2024 (the “May 8-9 Meeting”), at which they gave preliminary consideration to information bearing on the continuation of the Advisory Agreement with respect to each of Artisan Developing World Fund, Artisan Emerging Markets Debt Opportunities Fund, Artisan Floating Rate Fund, Artisan Focus Fund, Artisan Global Discovery Fund, Artisan Global Equity Fund, Artisan Global Opportunities Fund, Artisan Global Unconstrained Fund, Artisan Global Value Fund, Artisan High Income Fund, Artisan International Fund, Artisan International Explorer Fund, Artisan International Small-Mid Fund, Artisan International Value Fund, Artisan Mid Cap Fund, Artisan Mid Cap Value Fund, Artisan Select Equity Fund, Artisan Small Cap Fund, Artisan Sustainable Emerging Markets Fund, Artisan Value Fund and Artisan Value Income Fund (each, a “Fund,” and, together, the “Funds”) for the period from July 1, 2024 through June 30, 2025. The primary purpose of the May 8-9 Meeting was to allow the directors ample opportunity to consider matters they deemed relevant in connection with the continuation of the Advisory Agreement (including the information provided relating to their review of the Advisory Agreement, in addition to materials they reviewed at meetings over the course of the preceding year), and to request any additional information they considered reasonably necessary to their deliberations.
At their regular quarterly meeting held on May 30, 2024 (the “May 30 Meeting”), the directors, including the independent directors, considered and unanimously approved the continuation through June 30, 2025 of the Advisory Agreement with respect to each of the Funds. The independent directors were assisted in their evaluation of the Advisory Agreement and the factors that they deemed to be material, including those factors described below, by independent legal counsel, from whom they received separate legal advice and with whom they met separately from Artisan Partners in connection with the contract review meetings.
Prior to the May 8-9 Meeting, independent counsel to the independent directors sent to Artisan Partners requests for information to be provided to the directors in connection with their consideration of the Advisory Agreement. Artisan Partners provided materials to the directors in response to those requests as well as other information Artisan Partners believed was useful in evaluating the approval of the Advisory Agreement. Artisan Partners provided a report (the “Broadridge Report”) prepared by Broadridge Financial Solutions, Inc. (“Broadridge”) that included information relating to each Fund’s fees and expenses compared to the fees and expenses of a relatively small peer group (the “Broadridge Peer Group”) and a larger peer universe of mutual funds (the “Broadridge Universe”) selected by Broadridge. The Broadridge Report also contained information comparing each Fund’s investment performance to the performance of a relatively small performance peer group selected by Artisan Partners using a methodology developed by Artisan Partners in consultation with the independent directors, and to the performance of the Fund’s Broadridge Universe (and, in the case of Artisan Value Income Fund and Artisan International Value Fund, to the performance of peer universes with a different style classification that Artisan Partners believed was more appropriate for comparative purposes than the style classification used by Broadridge to compile the Broadridge Universes (the “Supplemental Universes”)).
The directors also received and reviewed a memorandum from independent counsel regarding the directors’ responsibilities in evaluating the Advisory Agreement. The directors recognized that the management and fee arrangements for the Funds are the result of years of review and discussion between the independent directors and Artisan Partners, that certain aspects of such arrangements may receive greater scrutiny from the directors in some years than in others and that the directors’ conclusions may be based, in part, on their consideration of these same arrangements and information received during the course of the year and in prior years.
In evaluating the Advisory Agreement, the directors reviewed the available information and discussed with representatives of Artisan Partners each Fund’s operations; the nature, extent and quality of the advisory and other services provided by Artisan Partners to the Funds; the management fee rates payable by each Fund; the total expense ratios of each class of shares of the Funds; possible economies of scale; and other benefits (in addition to advisory fee revenues) derived or potentially derived by Artisan Partners from its relationship with the Funds. In addition to the third-party reports by Broadridge and the memorandum from independent counsel, the directors reviewed information provided and presented at or prior to the May 8-9 Meeting and the May 30 Meeting, concerning, among other things, the following:
| ● | Artisan Partners’ organization and operations, financial condition and stability and ownership structure; |
| Artisan Partners Funds | 129 |
| | ITEM 11. STATEMENT REGARDING BASIS FOR APPROVAL OF INVESTMENT ADVISORY CONTRACT | |
| | |
| ● | Artisan Partners’ personnel and business and financial model and methods, including Artisan Partners’ assessment of its ability to attract and retain capable personnel, including with respect to incentive compensation offered to such personnel, Artisan Partners’ workforce diversity and inclusion practices and Artisan Partners’ succession planning processes with respect to, among other areas, the leadership of the Funds’ portfolio management teams and the senior management of Artisan Partners; Artisan Partners’ research, including with respect to its acquisition and use of traditional and alternative data, and decision-making processes; the adequacy and sophistication of technology and systems with respect to investment and administrative matters, including the use of and reliance on vendors in connection with the management or operations of the Funds; and Artisan Partners’ views on the effects of the evolving competitive landscape of the asset management industry, and certain industry and regulatory developments, on the Funds’ and/or Artisan Partners’ business; |
| ● | The terms of the Advisory Agreement, including the scope of services performed by Artisan Partners; and how the services performed by Artisan Partners under the Advisory Agreement differ from those performed for other investment companies and accounts; |
| ● | Each Fund’s short- and long-term investment performance (including past 1-, 3-, 5- and 10-year and since-inception periods, as applicable), including performance attribution and rolling 5-year excess return information for certain Funds and performance comparisons for various time periods with (a) other Artisan Partners client accounts managed with similar investment objectives, (b) other mutual funds having similar investment objectives and (c) appropriate market indices; |
| ● | Information on each Fund’s redemption rates relative to other accounts managed by Artisan Partners, including separate account strategies, and appropriate industry peer groups; |
| ● | Any litigation pending, threatened or settled involving Artisan Partners, and the results of any inspections, investigations or examinations thereof by the SEC or other governmental or regulatory authorities since January 1, 2023; |
| ● | Information regarding fee arrangements, including a comparison of the total expense ratio of each share class of each Fund with other mutual funds; the structure of the management fees, including the method of computing fees and the frequency of payment of fees and Artisan Partners’ process for determining proposed management fee rates for new funds; a comparison of the management fees with fees charged by other investment advisers for managing mutual funds with similar investment objectives; information regarding expense limitation arrangements and effective annual management fee rates for each of the Funds for the calendar year ended December 31, 2023; the expenses other than management fees that the Funds bear, either at the level of the Fund as a whole or on a class-specific basis; and Artisan Partners’ assessment of the reasonableness and current competitiveness of the Funds’ management fee rates and total expense ratios; |
| ● | Artisan Partners’ assessment of whether it is realizing economies of scale in providing services to the Funds and, if so, whether, how and, if quantifiable, to what extent the economies of scale are shared with the Funds, and the adequacy of existing breakpoints (reduced fee levels on assets in excess of stated thresholds) in advisory fees and whether further breakpoints are appropriate; |
| ● | Information regarding third-party intermediary and service arrangements and related payments by the Funds and Artisan Partners; |
| ● | Potential “fall-out” benefits to Artisan Partners or its affiliates from their relationships with the Funds, in addition to advisory fees, including any benefits to Artisan Partners or its affiliates in selling other products, and the method of estimating the value of any such benefits; |
| ● | Matters relating to brokerage and portfolio transactions, including Artisan Partners’ practices regarding selection of brokers and dealers to execute portfolio transactions and regarding negotiation of commission rates and allocation of brokerage for research and other services; |
| ● | The estimated profitability to Artisan Partners of its relationship with each Fund on both a pre-tax and post-tax basis for calendar years 2021, 2022 and 2023; and the assumptions and allocation methodologies utilized for such profitability analysis; |
| ● | Potential for conflicts of interest between the Funds and Artisan Partners or its other clients and circumstances and actions addressing or bearing on potential conflicts of interest; |
| ● | Legal, compliance and related matters, including Artisan Partners’ programs for monitoring compliance with federal and state securities and other applicable laws and regulations, the investment policies and restrictions of the Funds and Subchapter M of the Internal Revenue Code; and information regarding personnel who perform significant legal and compliance services for the Funds; |
| ● | Artisan Partners’ risk assessment and risk management processes; |
| ● | Artisan Partners’ cybersecurity framework and Artisan Partners’ approach to monitoring the cybersecurity systems of the Funds’ key service providers with respect to the services provided to the Funds; |
| 130 | Artisan Partners Funds |
| | ITEM 11. STATEMENT REGARDING BASIS FOR APPROVAL OF INVESTMENT ADVISORY CONTRACT | |
| | |
| ● | Artisan Partners’ views on environmental, social and governance (“ESG”) investing, including the extent to which and how Artisan Partners’ investment teams incorporate ESG factors into the investment process with the goal of helping enhance risk-adjusted portfolio returns; and |
| ● | Artisan Partners’ business continuity and disaster recovery procedures. |
Following the May 8-9 Meeting and executive sessions with their independent counsel, the independent directors requested certain follow-up information from Artisan Partners. Artisan Partners provided this follow-up information prior to the May 30 Meeting. At the May 30 Meeting, Artisan Partners presented certain additional information to the directors regarding the Funds, and the independent directors and their independent counsel reviewed with the full board the information discussed at the May 8-9 Meeting and during their executive sessions. The directors then considered whether any further discussion or review was necessary, concluding that the information reviewed by the independent directors prior to and at the May 30 Meeting provided a sufficient basis for taking action on the continuation of the Advisory Agreement with respect to each Fund for an additional year. The directors then reviewed and affirmed each of the following conclusions:
The nature, extent and quality of Artisan Partners’ services. The directors concluded that the nature and extent of Artisan Partners’ services to the Funds were appropriate and consistent with, and in some cases more advantageous to the Funds than, the terms of the Advisory Agreement. The directors concluded that the quality of Artisan Partners’ services has been consistently high, with no material deficiencies.
The investment performance of each Fund. With respect to each Fund, the directors concluded that the Fund’s performance (including absolute performance and, where applicable, outperformance of peers and relevant benchmarks over long-term periods) or other relevant factors supported continuation of the Fund’s advisory arrangements under the Advisory Agreement. In the case of each Fund that had performance that lagged that of a peer group or benchmark for certain (although not necessarily all) periods, the directors concluded that other factors relevant to performance supported continuation of the advisory arrangements. These factors included any or all of the following: (1) that underperformance was attributable, to a significant extent, to investment decisions (such as security selection, sector allocation or risk mitigation) by Artisan Partners that were reasonable and consistent with the Fund’s investment objective, strategies and policies; (2) that the Fund’s more recent or long-term performance, as applicable, was competitive when compared to relevant performance benchmarks or peer groups; and (3) the resources Artisan Partners made available to such Funds’ investment teams. The directors also considered Artisan Partners’ explanations of the Funds’ investment styles and their comparability to those of other funds in the Funds’ peer groups, including the Supplemental Universes.
The costs of the services and profitability of Artisan Partners. The directors concluded that the costs of the services provided by Artisan Partners, and the estimated profitability it realizes, are reasonable in relation to the nature and quality of services provided with respect to each Fund, based on the assumptions and methodology for calculating such costs and profitability presented to the directors by Artisan Partners.
Comparisons of the services rendered and the amounts payable under the Advisory Agreement with those under other investment advisory agreements. The directors concluded that the fees payable by the Funds to Artisan Partners are reasonable in relation to the nature and quality of the services provided. In reaching this conclusion, the directors compared the fees payable by the Funds to the fees paid by other mutual funds that are in the same Broadridge Peer Groups and Broadridge Universes (or Supplemental Universes, as applicable). The directors also considered the fees Artisan Partners receives from, and the scope of services it provides to, other Artisan Partners clients, including its private funds, separate account clients and UCITS funds, and the U.S. mutual funds and collective investment trust portfolios for which it serves as sub-adviser, noting the significantly broader scope of services that Artisan Partners provides to the Funds as compared to the other types of clients. In reaching their conclusion, among the various factors considered, the directors also took into account the costs and risks assumed by Artisan Partners in connection with launching and maintaining publicly-offered mutual funds, and how those costs and risks differ from those associated with other components of Artisan Partners’ business.
In addition, the directors noted that Artisan Partners has contractually agreed to maintain or modify, as applicable, certain expense limitations through January 31, 2026 for Artisan Emerging Market Debt Opportunities Fund (Investor, Advisor and Institutional Shares), Artisan Floating Rate Fund (Investor, Advisor and Institutional Shares), Artisan Focus Fund (Investor Shares), Artisan Global Discovery Fund (Investor, Advisor and Institutional Shares), Artisan Global Equity Fund (Investor, Advisor and Institutional Shares), Artisan Global Unconstrained Fund (Investor, Advisor and Institutional Shares), Artisan International Explorer Fund (Investor, Advisor and Institutional Shares), Artisan Select Equity Fund (Investor, Advisor and Institutional Shares), Artisan Sustainable Emerging Markets Fund (Investor, Advisor and Institutional Shares), Artisan Value Fund (Investor, Advisor and Institutional Shares) and Artisan Value Income Fund (Investor, Advisor and Institutional Shares).
The extent to which economies of scale would be realized as each Fund grows and whether fee levels reflect these economies of scale for the benefit of Fund investors. The directors concluded that the shareholders of Artisan Developing World Fund, Artisan Focus Fund, Artisan Global Opportunities Fund, Artisan Global Value Fund, Artisan High Income Fund, Artisan International Fund, Artisan International Small-Mid Fund, Artisan International Value Fund, Artisan Mid Cap Fund, Artisan Mid Cap Value Fund, Artisan Small Cap Fund and Artisan Value Fund have appropriately benefited from economies of scale under the management fee structures of their advisory arrangements. The directors concluded that the shareholders of each of Artisan Floating Rate Fund, Artisan International Explorer Fund, Artisan Emerging Markets Debt Opportunities Fund, Artisan Global Unconstrained Fund, Artisan Value Income Fund, Artisan Global Discovery Fund, Artisan Global Equity Fund, Artisan Select Equity Fund and Artisan Sustainable Emerging Markets Fund would likely benefit from economies of scale if the
| Artisan Partners Funds | 131 |
| | ITEM 11. STATEMENT REGARDING BASIS FOR APPROVAL OF INVESTMENT ADVISORY CONTRACT | |
| | |
Fund’s assets reach the level at which it will be able to take advantage of the investment advisory fee breakpoints in the Advisory Agreement.
Other benefits derived by the Funds or Artisan Partners. The directors concluded that, in addition to the services provided by Artisan Partners pursuant to the Advisory Agreement and the management fees to be paid in return, the Funds and Artisan Partners may potentially benefit from their relationship with each other in several ways. For Artisan Partners, the directors concluded the primary fall-out benefits include (1) the potential conversion of Fund shareholders to separate account clients of Artisan Partners, and the ability otherwise to attract new clients and investment talent to Artisan Partners, (2) the acquisition of research products and services by Artisan Partners, for the benefit of its clients including the Funds, in return for brokerage commissions paid by the Funds (“soft dollars”), (3) reputational benefits as a result of its association with the Funds and (4) the ability of Artisan Partners to leverage its relationships with service providers to obtain favorable terms for its clients. The directors concluded that the Funds could benefit from potential institutional shareholders who might choose to invest in the Funds because they want Artisan Partners’ services, but do not meet Artisan Partners’ minimum separate account size requirements. The directors also concluded that the Funds benefit from Artisan Partners’ use of research obtained through soft dollars generated with respect to its other clients, and from reputational benefits as a result of their association with Artisan Partners.
At the conclusion of the foregoing discussions, the board approved the Advisory Agreement for the period from July 1, 2024 through June 30, 2025 for each Fund by the unanimous vote of all directors and also by the unanimous vote of all the independent directors.
| 132 | Artisan Partners Funds |
Item 8. Changes in and Disagreements with Accountants for Open-End Management Investment Companies.
Not applicable.
Item 9. Proxy Disclosures for Open-End Management Investment Companies.
See Proxy Disclosures under Item 7(a) of this Form.
Item 10. Remuneration Paid to Directors, Officers, and Others of Open-End Management Investment Companies.
See Statement of Operations under Item 7(a) of this Form.
Item 11. Statement Regarding Basis for Approval of Investment Advisory Contract.
See Statement Regarding Basis for Approval of Investment Advisory Contract under Item 7(a) of this Form.
Item 12. Disclosure of Proxy Voting Policies and Procedures for Closed-End Management Investment Companies.
Not applicable.
Item 13. Portfolio Managers of Closed-End Management Investment Companies.
Not applicable.
Item 14. Purchases of Equity Securities by Closed-End Management Investment Company and Affiliated Purchasers.
Not applicable.
Item 15. Submission of Matters to a Vote of Security Holders.
No material changes to report.
Item 16. Controls and Procedures.
(a) The registrant’s principal executive and principal financial officers have concluded, based on an evaluation of the registrant’s disclosure controls and procedures (as defined in Rule 30a-3(c) under the Investment Company Act of 1940, the “Disclosure Controls”) as of a date within 90 days prior to the filing date (the “Filing Date”) of this Form N-CSR (the “Report”), that the Disclosure Controls are effectively designed to provide reasonable assurance that the information required to be disclosed by the registrant in the Report is recorded, processed, summarized and reported by the Filing Date, including ensuring that information required to be disclosed in the Report is accumulated and communicated to the registrant’s management, including the registrant’s principal executive officer and principal financial officer, as appropriate to allow timely decisions regarding required disclosure.
(b) There were no changes in the registrant’s internal controls over financial reporting (as defined in Rule 30a-3(d) under the Investment Company Act of 1940) that occurred during the second fiscal quarter of the period covered by this report that have materially affected, or are reasonably likely to materially affect, the registrant’s internal control over financial reporting.
Item 17. Disclosure of Securities Lending Activities for Closed-End Management Investment Companies.
Not applicable.
Item 18. Recovery of Erroneously Awarded Compensation.
Not applicable.
Item 19. Exhibits.
(2) Not applicable.
SIGNATURES
Pursuant to the requirements of the Securities Exchange Act of 1934 and the Investment Company Act of 1940, the registrant has duly caused this report to be signed on its behalf by the undersigned, thereunto duly authorized.
Artisan Partners Funds, Inc.
By: /s/Gregory K. Ramirez____
Gregory K. Ramirez
Principal Executive Officer
Date: December 27, 2024
Pursuant to the requirements of the Securities Exchange Act of 1934 and the Investment Company Act of 1940, this report has been signed below by the following persons on behalf of the registrant and in the capacities and on the dates indicated.
By: /s/Gregory K. Ramirez_____
Gregory K. Ramirez
Principal Executive Officer
Date: December 27, 2024
By: /s/Shannon K. Jagodinski___
Shannon K. Jagodinski
Principal Financial Officer
Date: December 27, 2024