Exhibit 99.2
Exhibit 99.2
ACI’s software underpins electronic payments throughout retail and wholesale banking, and commerce all the time.
trusted globally
September 30, 2011 Quarterly Results Presentation
October 27, 2011
Private Securities Litigation Reform Act of 1995 Safe Harbor For Forward-Looking Statements
This presentation contains forward-looking statements based on current expectations that involve a number of risks and uncertainties. The forward-looking statements are made pursuant to safe harbor provisions of the Private Securities Litigation Reform Act of 1995. A discussion of these forward-looking statements and risk factors that may affect them is set forth at the end of this presentation. The Company assumes no obligation to update any forward-looking statement in this presentation, except as required by law.

Quarterly Overview
Phil Heasley
Chief Executive Officer
trusted globally
Q3 2011 in Review
• Strong revenue growth driven by project completions converting to revenue from our backlog
• Strong growth in operating income and Adjusted EBITDA
• Agreed terms and conditions with S1 Corporation; both management teams working together to bring the acquisition to completion and satisfy closing conditions
• Strong year to date revenue and income performance and good visibility into pipeline across all geographies leads us to reaffirm our 2011 guidance
4

Business Overview
Ralph Dangelmaier
President, Global Markets
trusted globally
5
Sales Comparison year over year
Sales Type
Qtr Ended Qtr Ended % Growth or
Sales Type Sep 2010 Sep 2011 Decline
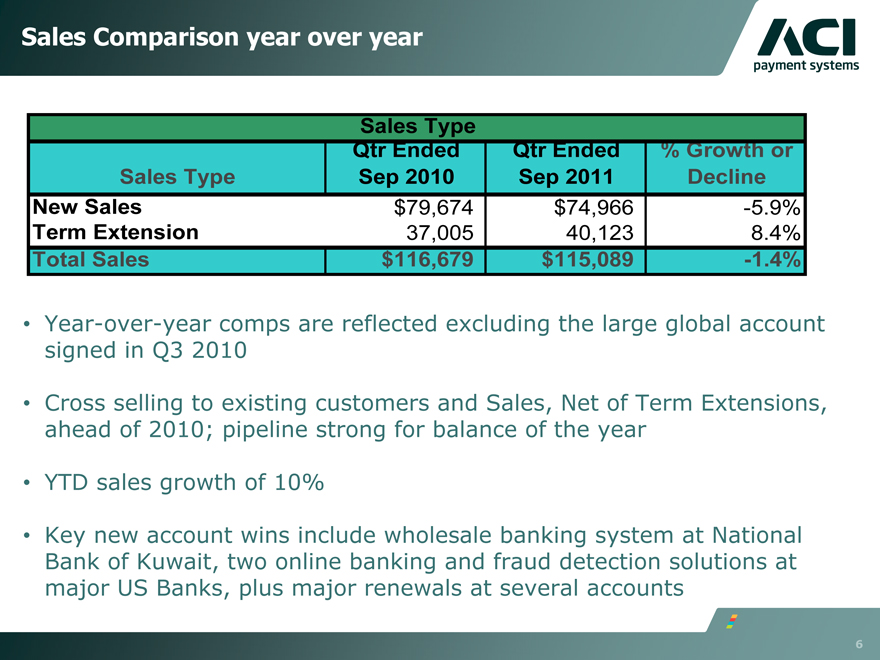
New Sales $79,674 $74,966 -5.9%
Term Extension 37,005 40,123 8.4%
Total Sales $116,679 $115,089 -1.4%
• Year-over-year comps are reflected excluding the large global account signed in Q3 2010
• Cross selling to existing customers and Sales, Net of Term Extensions, ahead of 2010; pipeline strong for balance of the year
• YTD sales growth of 10%
• Key new account wins include wholesale banking system at National Bank of Kuwait, two online banking and fraud detection solutions at major US Banks, plus major renewals at several accounts
6
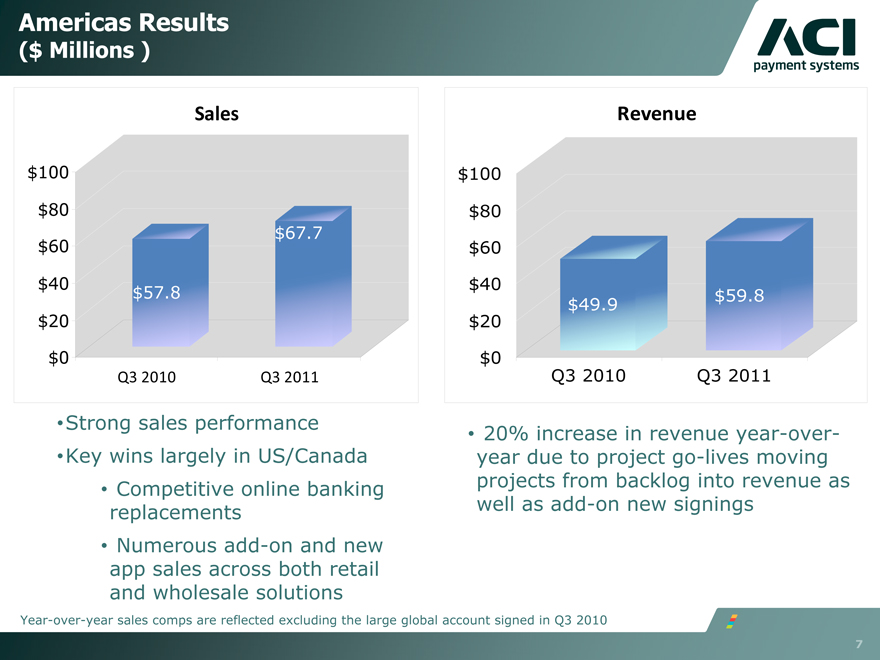
Americas Results
($ Millions)
Sales
$100 $80
$67.7 $60 $40
$57.8 $20 $0
Q3 2010 Q3 2011
Revenue
$100 $80 $60 $40
$59.8
$20 $49.9 $0
Q3 2010 Q3 2011
Strong sales performance
Key wins largely in US/Canada
Competitive online banking replacements
Numerous add-on and new app sales across both retail and wholesale solutions
20% increase in revenue year-over-year due to project go-lives moving projects from backlog into revenue as well as add-on new signings
Year-over-year sales comps are reflected excluding the large global account signed in Q3 2010
7
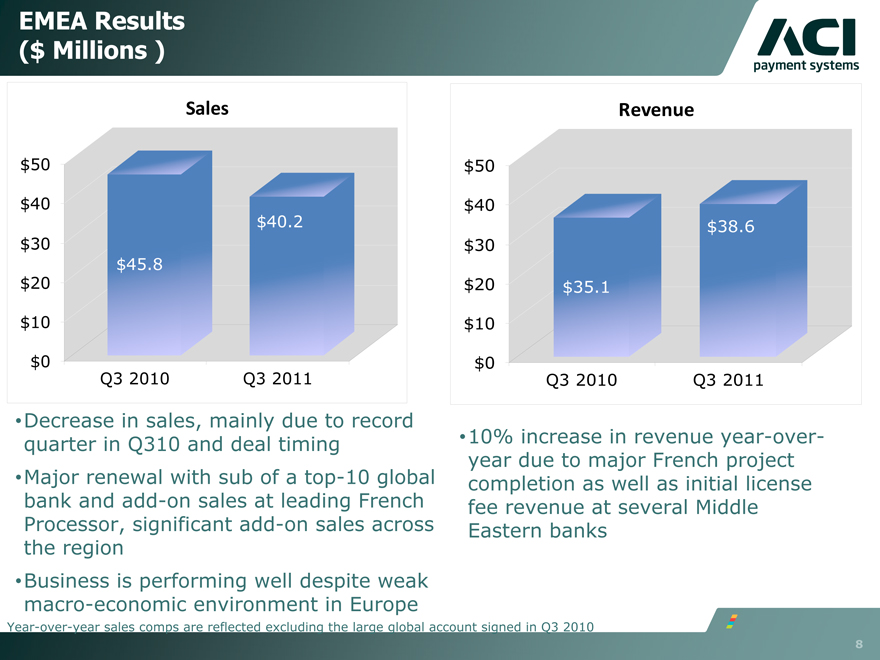
EMEA Results
($ Millions)
Sales
$50
$40
$40.2 $30
$45.8 $20
$10
$0
Q3 2010 Q3 2011
Revenue
$50
$40
$38.6 $30
$20 $35.1 $10
$0
Q3 2010 Q3 2011
Decrease in sales, mainly due to record quarter in Q310 and deal timing
Major renewal with sub of a top-10 global bank and add-on sales at leading French Processor, significant add-on sales across the region
Business is performing well despite weak macro-economic environment in Europe
•10% increase in revenue year-over-year due to major French project completion as well as initial license fee revenue at several Middle Eastern banks
Year-over-year sales comps are reflected excluding the large global account signed in Q3 2010
8
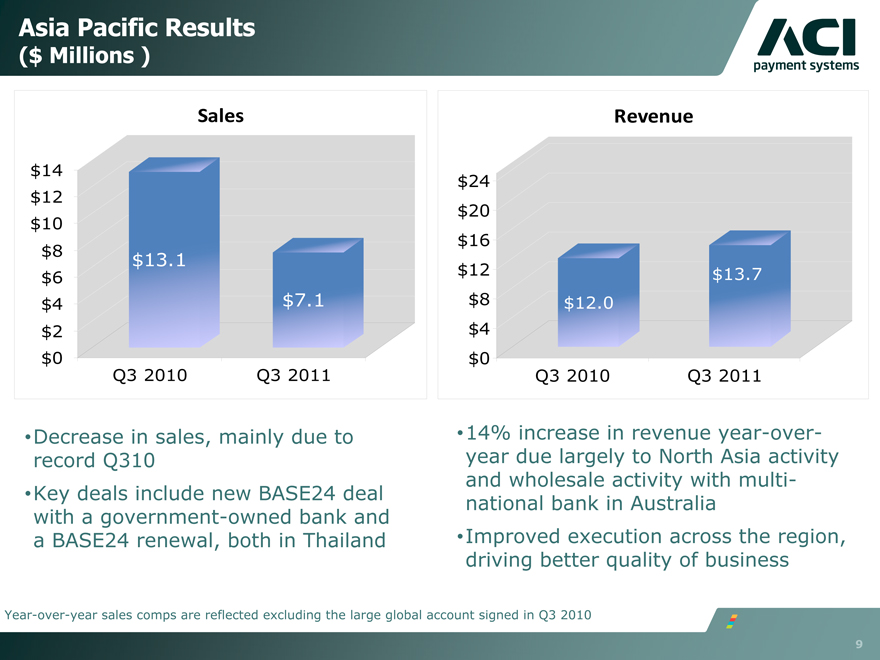
Asia Pacific Results
($ Millions)
Sales
$14 $12 $10
$8 $13.1 $6
$4 $7.1 $2 $0 Q3 2010 Q3 2011
Revenue
$24 $20 $16
$12 $13.7
$8 $12.0 $4 $0
Q3 2010 Q3 2011
•Decrease in sales, mainly due to record Q310 •Key deals include new BASE24 deal with a government-owned bank and a BASE24 renewal, both in Thailand
•14% increase in revenue year-over-year due largely to North Asia activity and wholesale activity with multinational bank in Australia •Improved execution across the region, driving better quality of business
Year-over-year sales comps are reflected excluding the large global account signed in Q3 2010
9

Financial Review
Scott Behrens
Chief Financial Officer
10
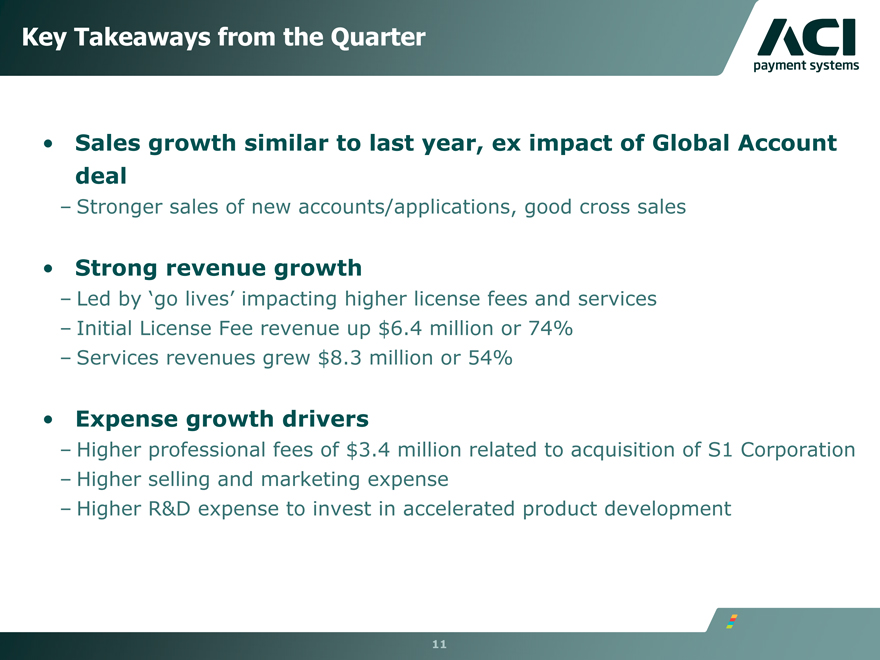
Key Takeaways from the Quarter
• Sales growth similar to last year, ex impact of Global Account deal
– Stronger sales of new accounts/applications, good cross sales
• Strong revenue growth
– Led by ‘go lives’ impacting higher license fees and services
– Initial License Fee revenue up $6.4 million or 74%
– Services revenues grew $8.3 million or 54%
• Expense growth drivers
– Higher professional fees of $3.4 million related to acquisition of S1 Corporation
– Higher selling and marketing expense
– Higher R&D expense to invest in accelerated product development
11
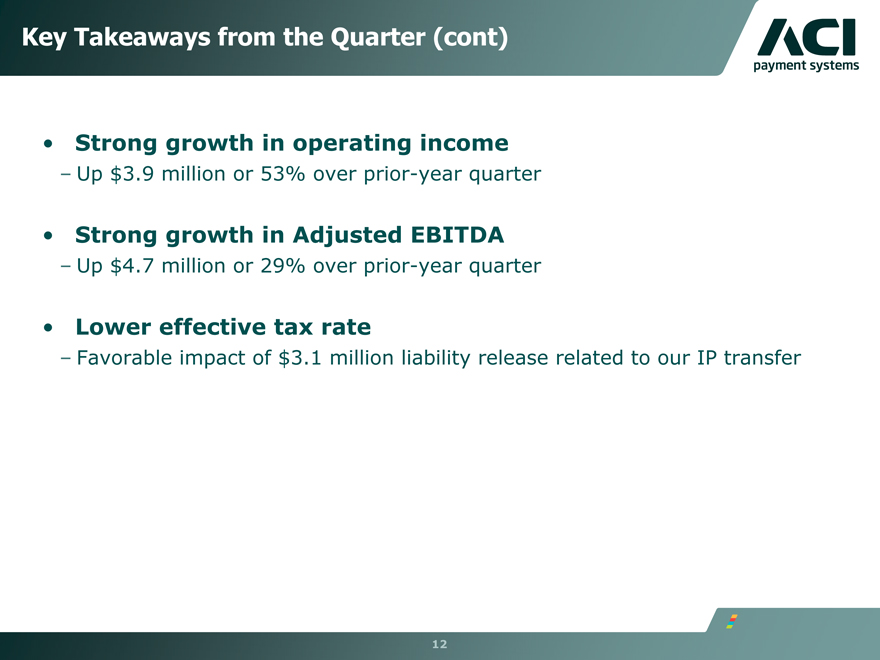
Key Takeaways from the Quarter (cont)
• Strong growth in operating income
– Up $3.9 million or 53% over prior-year quarter
• Strong growth in Adjusted EBITDA
– Up $4.7 million or 29% over prior-year quarter
• Lower effective tax rate
– Favorable impact of $3.1 million liability release related to our IP transfer
12
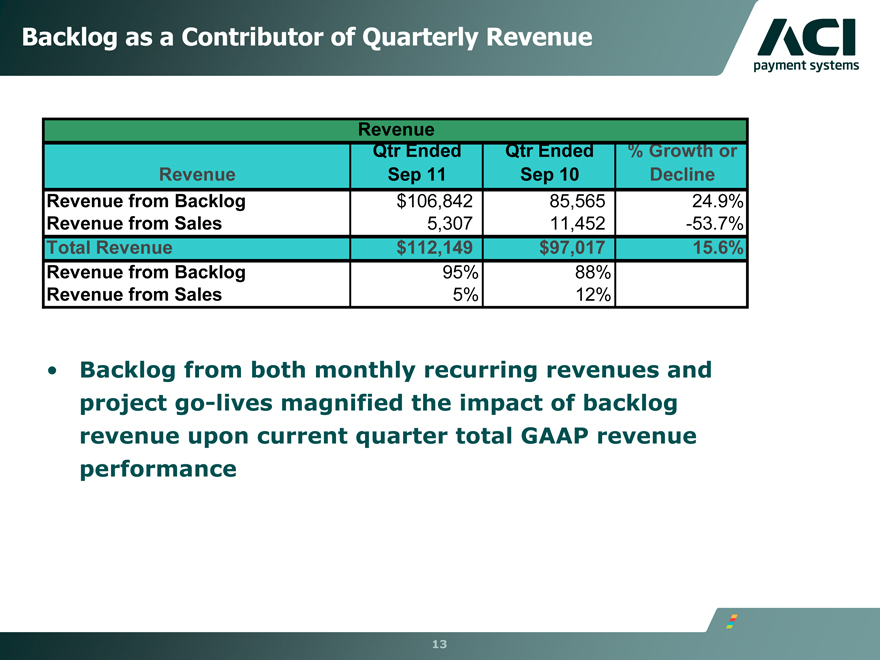
Backlog as a Contributor of Quarterly Revenue
Revenue
Qtr Ended Qtr Ended % Growth or
Revenue Sep 11 Sep 10 Decline
Revenue from Backlog $106,842 85,565 24.9%
Revenue from Sales 5,307 11,452 -53.7%
Total Revenue $112,149 $97,017 15.6%
Revenue from Backlog 95% 88%
Revenue from Sales 5% 12%
• Backlog from both monthly recurring revenues and project go-lives magnified the impact of backlog revenue upon current quarter total GAAP revenue performance
13
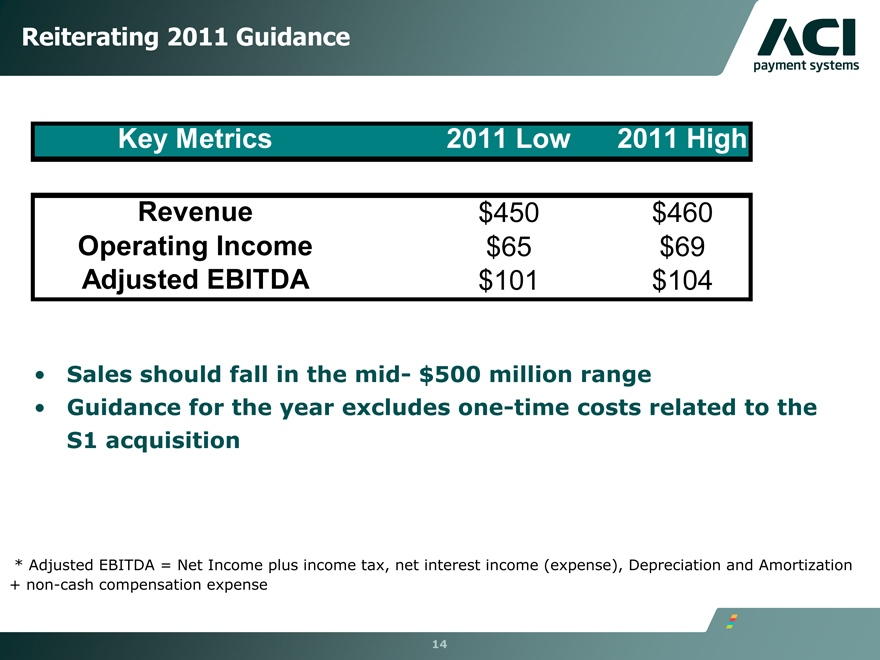
Reiterating 2011 Guidance
Key Metrics 2011 Low 2011 High
Revenue $450 $460
Operating Income $65 $69
Adjusted EBITDA $101 $104
• Sales should fall in the mid- $500 million range
• Guidance for the year excludes one-time costs related to the S1 acquisition
* Adjusted EBITDA = Net Income plus income tax, net interest income (expense), Depreciation and Amortization + non-cash compensation expense
14

Appendix
15
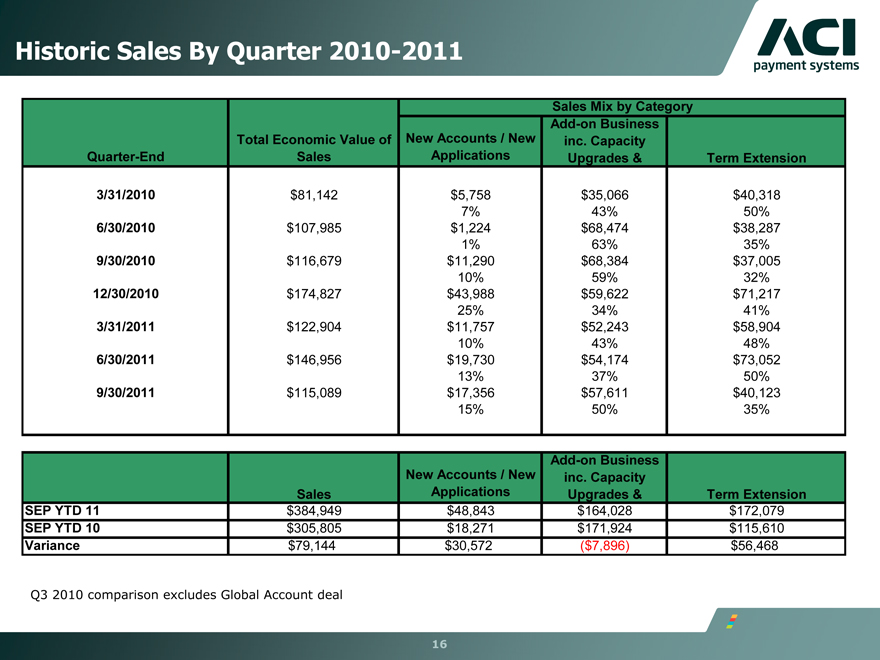
Historic Sales By Quarter 2010-2011
Sales Mix by Category
Add-on Business
Total Economic Value of New Accounts / New inc. Capacity
Quarter-End Sales Applications Upgrades & Term Extension
3/31/2010 $81,142 $5,758 $35,066 $40,318
7% 43% 50%
6/30/2010 $107,985 $1,224 $68,474 $38,287
1% 63% 35%
9/30/2010 $116,679 $11,290 $68,384 $37,005
10% 59% 32%
12/30/2010 $174,827 $43,988 $59,622 $71,217
25% 34% 41%
3/31/2011 $122,904 $11,757 $52,243 $58,904
10% 43% 48%
6/30/2011 $146,956 $19,730 $54,174 $73,052
13% 37% 50%
9/30/2011 $115,089 $17,356 $57,611 $40,123
15% 50% 35%
Add-on Business
New Accounts / New inc. Capacity
Sales Applications Upgrades & Term Extension
SEP YTD 11 $384,949 $48,843 $164,028 $172,079
SEP YTD 10 $305,805 $18,271 $171,924 $115,610
Variance $79,144 $30,572 ($7,896) $56,468
Q3 2010 comparison excludes Global Account deal
16
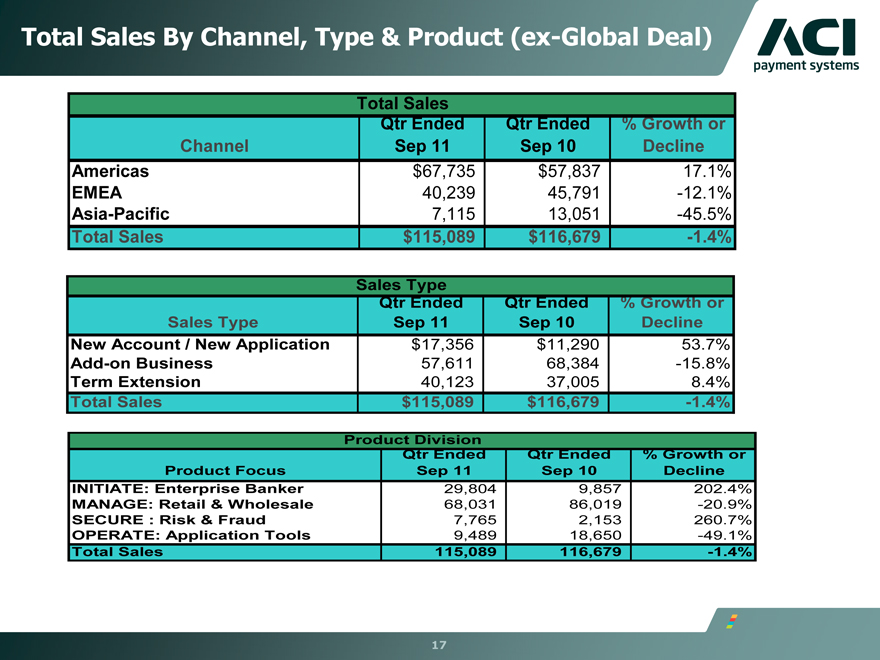
Total Sales By Channel, Type & Product (ex-Global Deal)
Total Sales
Qtr Ended Qtr Ended % Growth or
Channel Sep 11 Sep 10 Decline
Americas $67,735 $57,837 17.1%
EMEA 40,239 45,791 -12.1%
Asia-Pacific 7,115 13,051 -45.5%
Total Sales $115,089 $116,679 -1.4%
Sales Type
Qtr Ended Qtr Ended % Growth or
Sales Type Sep 11 Sep 10 Decline
New Account / New Application $17,356 $11,290 53.7%
Add-on Business 57,611 68,384 -15.8%
Term Extension 40,123 37,005 8.4%
Total Sales $115,089 $116,679 -1.4%
Product Division
Qtr Ended Qtr Ended % Growth or
Product Focus Sep 11 Sep 10 Decline
INITIATE: Enterprise Banker 29,804 9,857 202.4%
MANAGE: Retail & Wholesale 68,031 86,019 -20.9%
SECURE : Risk & Fraud 7,765 2,153 260.7%
OPERATE: Application Tools 9,489 18,650 -49.1%
Total Sales 115,089 116,679 -1.4%
17
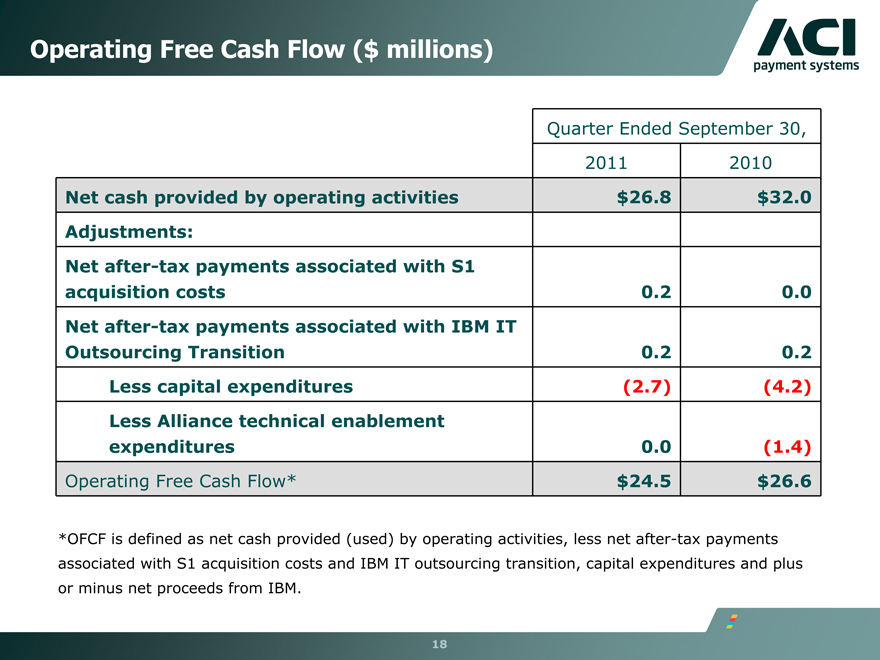
Operating Free Cash Flow ($ millions)
Quarter Ended September 30,
2011 2010
Net cash provided by operating activities $26.8 $32.0
Adjustments:
Net after-tax payments associated with S1
acquisition costs 0.2 0.0
Net after-tax payments associated with IBM IT
Outsourcing Transition 0.2 0.2
Less capital expenditures (2.7) (4.2)
Less Alliance technical enablement
expenditures 0.0 (1.4)
Operating Free Cash Flow* $24.5 $26.6
*OFCF is defined as net cash provided (used) by operating activities, less net after-tax payments associated with S1 acquisition costs and IBM IT outsourcing transition, capital expenditures and plus or minus net proceeds from IBM.
18
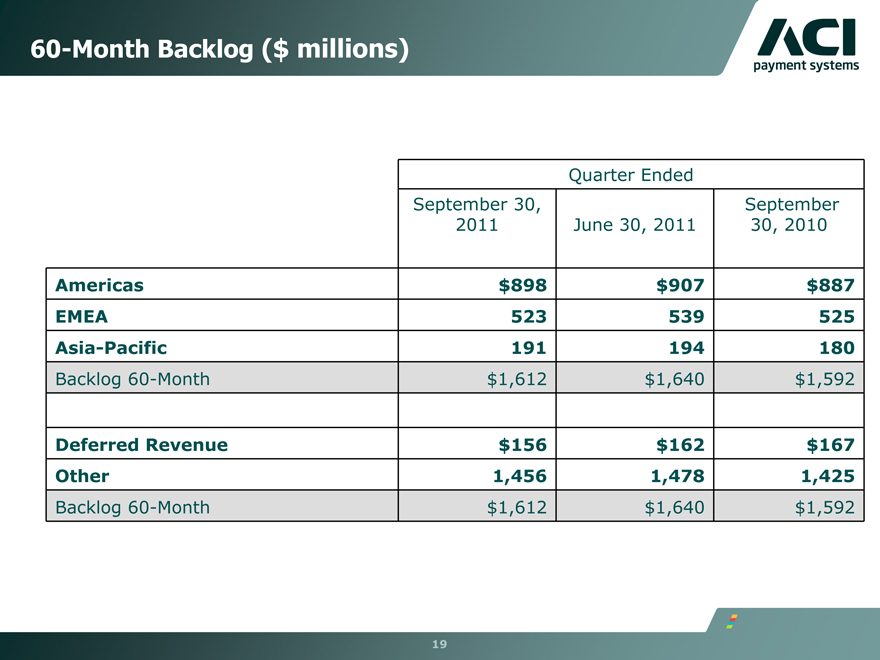
60-Month Backlog ($ millions)
Quarter Ended
September 30, September
2011 June 30, 2011 30, 2010
Americas $898 $907 $887
EMEA 523 539 525
Asia-Pacific 191 194 180
Backlog 60-Month $1,612 $1,640 $1,592
Deferred Revenue $156 $162 $167
Other 1,456 1,478 1,425
Backlog 60-Month $1,612 $1,640 $1,592
19
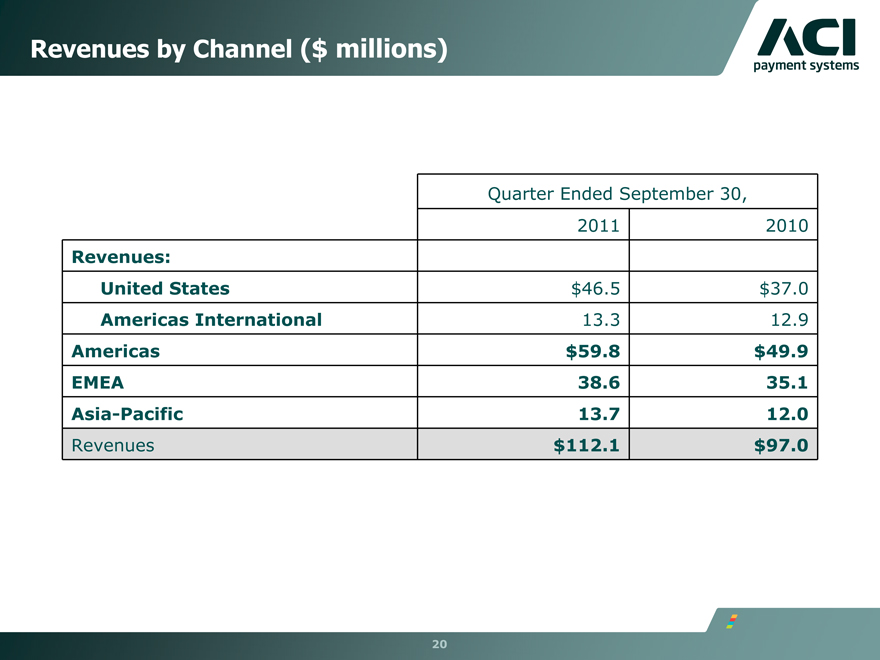
Revenues by Channel ($ millions)
Quarter Ended September 30, 2011 2010
Revenues:
United States $46.5 $37.0 Americas International 13.3 12.9 Americas $59.8 $49.9 EMEA 38.6 35.1 Asia-Pacific 13.7 12.0 Revenues $112.1 $97.0
20
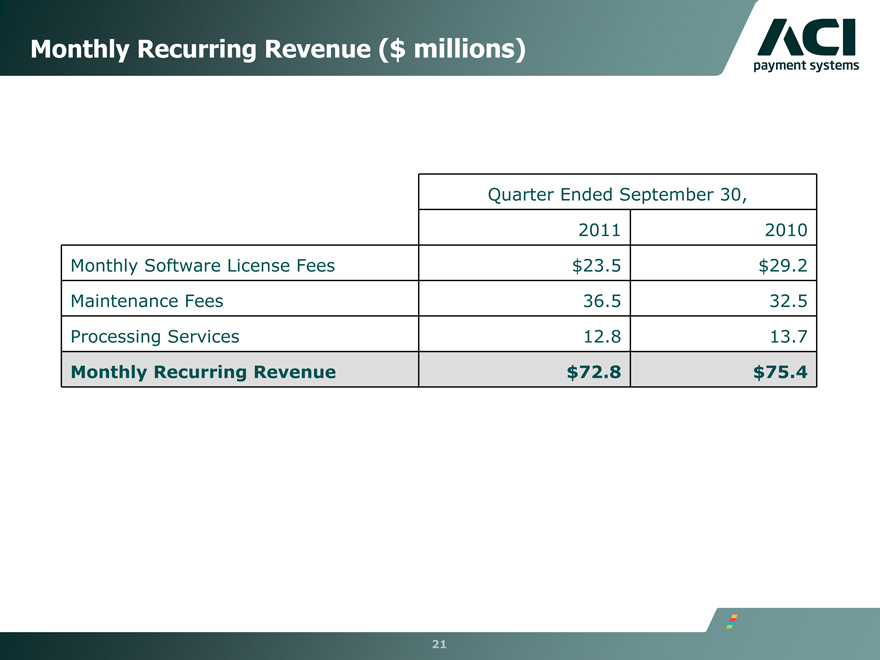
Monthly Recurring Revenue ($ millions)
Quarter Ended September 30, 2011 2010 Monthly Software License Fees $23.5 $29.2 Maintenance Fees 36.5 32.5 Processing Services 12.8 13.7
Monthly Recurring Revenue $72.8 $75.4
21
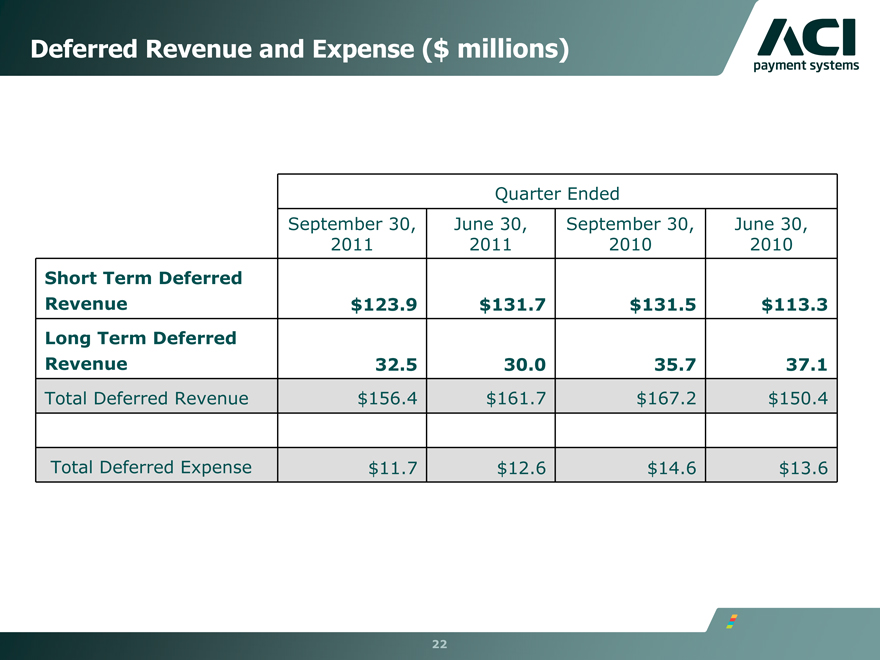
Deferred Revenue and Expense ($ millions)
Quarter Ended
September 30, June 30, September 30, June 30,
2011 2011 2010 2010
Short Term Deferred
Revenue $123.9 $131.7 $131.5 $113.3
Long Term Deferred
Revenue 32.5 30.0 35.7 37.1
Total Deferred Revenue $156.4 $161.7 $167.2 $150.4
Total Deferred Expense $11.7 $12.6 $14.6 $13.6
22
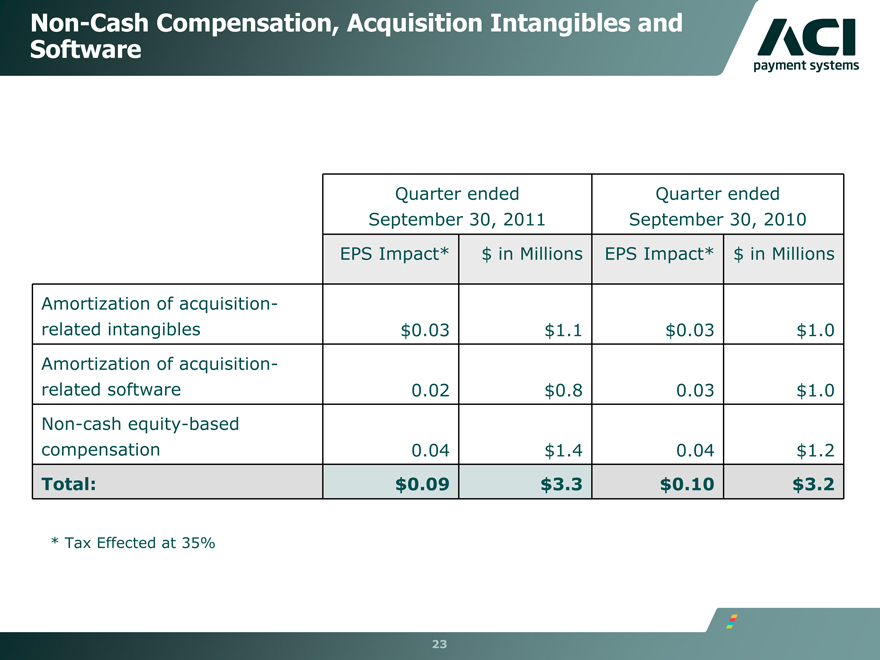
Non-Cash Compensation, Acquisition Intangibles and Software
Quarter ended Quarter ended
September 30, 2011 September 30, 2010
EPS Impact* $ in Millions EPS Impact* $ in Millions
Amortization of acquisition-
related intangibles $0.03 $1.1 $0.03 $1.0
Amortization of acquisition-
related software 0.02 $0.8 0.03 $1.0
Non-cash equity-based
compensation 0.04 $1.4 0.04 $1.2
Total: $0.09 $3.3 $0.10 $3.2
* Tax Effected at 35%
23
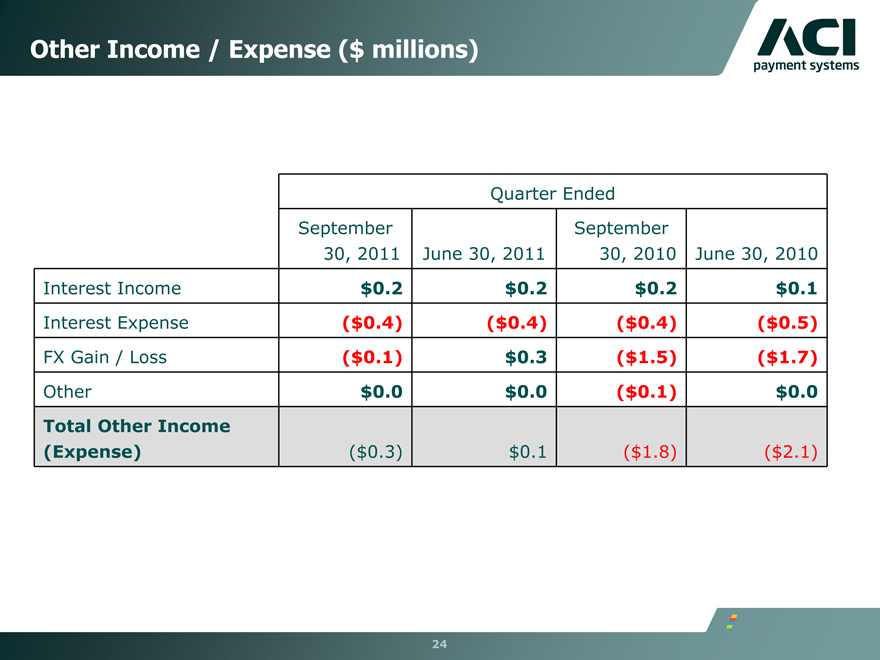
Other Income / Expense ($ millions)
Quarter Ended
September September
30, 2011 June 30, 2011 30, 2010 June 30, 2010
Interest Income $0.2 $0.2 $0.2 $0.1
Interest Expense ($0.4) ($0.4) ($0.4) ($0.5)
FX Gain / Loss ($0.1) $0.3 ($1.5) ($1.7)
Other $0.0 $0.0 ($0.1) $0.0
Total Other Income
(Expense) ($0.3) $0.1 ($1.8) ($2.1)
24
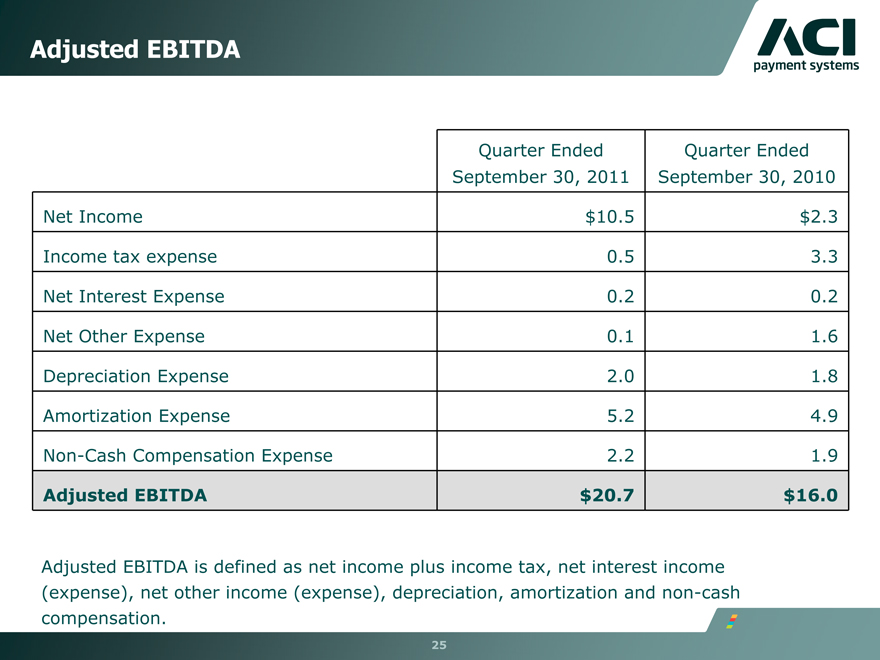
Adjusted EBITDA
Quarter Ended Quarter Ended
September 30, 2011 September 30, 2010
Net Income $10.5 $2.3
Income tax expense 0.5 3.3
Net Interest Expense 0.2 0.2
Net Other Expense 0.1 1.6
Depreciation Expense 2.0 1.8
Amortization Expense 5.2 4.9
Non-Cash Compensation Expense 2.2 1.9
Adjusted EBITDA $20.7 $16.0
Adjusted EBITDA is defined as net income plus income tax, net interest income (expense), net other income (expense), depreciation, amortization and non-cash compensation.
25
Non-GAAP Financial Measures
ACI is presenting operating free cash flow, which is defined as net cash provided (used) by operating activities, less net after-tax payments associated with S1 acquisition costs, net after-tax payments associated with IBM IT outsourcing transition, and capital expenditures and plus or minus net proceeds from IBM. Operating free cash flow is considered a non-GAAP financial measure as defined by SEC Regulation G. We utilize this non-GAAP financial measure, and believe it is useful to investors, as an indicator of cash flow available for debt repayment and other investing activities, such as capital investments and acquisitions. We utilize operating free cash flow as a further indicator of operating performance and for planning investing activities. Operating free cash flow should be considered in addition to, rather than as a substitute for, net cash provided (used) by operating activities. A limitation of operating free cash flow is that it does not represent the total increase or decrease in the cash balance for the period. This measure also does not exclude mandatory debt service obligations and, therefore, does not represent the residual cash flow available for discretionary expenditures. We believe that operating free cash flow is useful to investors to provide disclosures of our operating results on the same basis as that used by our management.
26
Non-GAAP Financial Measures
ACI also includes backlog estimates which are all software license fees, maintenance fees and services specified in executed contracts, as well as revenues from assumed contract renewals to the extent that we believe recognition of the related revenue will occur within the corresponding backlog period. We have historically included assumed renewals in backlog estimates based upon automatic renewal provisions in the executed contract and our historic experience with customer renewal rates.
Backlog is considered a non-GAAP financial measure as defined by SEC Regulation G. Our 60-month backlog estimate represents expected revenues from existing customers using the following key assumptions:
• Maintenance fees are assumed to exist for the duration of the license term for those contracts in which the committed maintenance term is less than the committed license term.
• License and facilities management arrangements are assumed to renew at the end of their committed term at a rate consistent with our historical experiences.
• Non-recurring license arrangements are assumed to renew as recurring revenue streams.
• Foreign currency exchange rates are assumed to remain constant over the 60-month backlog period for those contracts stated in currencies other than the U.S. dollar.
• Our pricing policies and practices are assumed to remain constant over the 60-month backlog period.
27
Non-GAAP Financial Measures
Estimates of future financial results are inherently unreliable. Our backlog estimates require substantial judgment and are based on a number of assumptions as described above. These assumptions may turn out to be inaccurate or wrong, including for reasons outside of management’s control. For example, our customers may attempt to renegotiate or terminate their contracts for a number of reasons, including mergers, changes in their financial condition, or general changes in economic conditions in the customer’s industry or geographic location, or we may experience delays in the development or delivery of products or services specified in customer contracts which may cause the actual renewal rates and amounts to differ from historical experiences. Changes in foreign currency exchange rates may also impact the amount of revenue actually recognized in future periods. Accordingly, there can be no assurance that contracts included in backlog estimates will actually generate the specified revenues or that the actual revenues will be generated within the corresponding 60-month period.
Backlog should be considered in addition to, rather than as a substitute for, reported revenue and deferred revenue.
ACI also includes Adjusted EBITDA, which is defined as net income (loss) plus income tax expense, net interest income (expense), net other income (expense), depreciation and amortization and non-cash compensation. Adjusted EBITDA is considered a non-GAAP financial measure as defined by SEC Regulation G. Adjusted EBITDA should be considered in addition to, rather than as a substitute for, operating income (loss).
28
Non-GAAP Financial Measures
The presentation of these non-GAAP financial measures should be considered in addition to our GAAP results and is not intended to be considered in isolation or as a substitute for the financial information prepared and presented in accordance with GAAP.
Management generally compensates for limitations in the use of non-GAAP financial measures by relying on comparable GAAP financial measures and providing investors with a reconciliation of non-GAAP financial measures only in addition to and in conjunction with results presented in accordance with GAAP. We believe that these non-GAAP financial measures reflect an additional way of viewing aspects of our operations that, when viewed with our GAAP results, provide a more complete understanding of factors and trends affecting our business.
29
Forward-Looking Statements
This presentation contains forward-looking statements based on current expectations that involve a number of risks and uncertainties. Generally, forward-looking statements do not relate strictly to historical or current facts and may include words or phrases such as “believes,” “ will,” “expects,” “anticipates,” “intends,” and words and phrases of similar impact. The forward-looking statements are made pursuant to safe harbor provisions of the Private Securities Litigation Reform Act of 1995.
Forward-looking statements in this presentation include, but are not limited to:
• Our belief that we have good visibility into the pipeline across all geographies leading us to reaffirm our 2011 guidance;
• Expectations and assumptions relating to our emphasis on cross-selling to existing customers;
• Assumptions regarding overall market conditions, including expectations and assumptions relating to (i) growth in electronic payment transaction volumes, (ii) consolidation creating large scale needs and inefficient platform redundancies, (iii) cost reductions and increased productivity, (iv) compliance with regulatory demands, and (v) best practices are resulting in better discipline and quality of business;
• Our belief that backlog from monthly recurring revenues and project go-lives continue to drive current quarter GAAP revenue, leading to predictable quarterly performance; as well as consistent revenue from current quarter sales;
• Expectations regarding 2011 financial guidance related to revenue, operating income and adjusted EBITDA;
• Expectations that sales should fall in the mid- $500 million range; and
• Assumptions that our business will not be negatively affected by the pending transaction with S1
30
Forward-Looking Statements
All of the foregoing forward-looking statements are expressly qualified by the risk factors discussed in our filings with the Securities and Exchange Commission. Such factors include but are not limited to, risks related to the global financial crisis and the continuing decline in the global economy, restrictions and other financial covenants in our credit facility, volatility and disruption of the capital and credit markets and adverse changes in the global economy, risks related to the completion and expected benefits to be achieved in the transaction with S1, the restatement of our financial statements, consolidations and failures in the financial services industry, the accuracy of management’s backlog estimates, the cyclical nature of our revenue and earnings and the accuracy of forecasts due to the concentration of revenue generating activity during the final weeks of each quarter, impairment of our goodwill or intangible assets, exposure to unknown tax liabilities, volatility in our stock price, risks from operating internationally, including fluctuations in currency exchange rates, increased competition, our offshore software development activities, customer reluctance to switch to a new vendor, the performance of our strategic product, BASE24-eps, the maturity of certain products, our strategy to migrate customers to our next generation products, ratable or deferred recognition of certain revenue associated with customer migrations and the maturity of certain of our products, demand for our products, failure to obtain renewals of customer contracts or to obtain such renewals on favorable terms, delay or cancellation of customer projects or inaccurate project completion estimates, business interruptions or failure of our information technology and communication systems, our alliance with International Business Machines Corporation (“IBM”), our outsourcing agreement with IBM, the complexity of our products and services and the risk that they may contain hidden defects or be subjected to security breaches or viruses, compliance of our products with applicable legislation, governmental regulations and industry standards, our compliance with privacy regulations, the protection of our intellectual property in intellectual property litigation, future acquisitions, strategic partnerships and investments and litigation. For a detailed discussion of these risk factors, parties that are relying on the forward-looking statements should review our filings with the Securities and Exchange Commission, including our most recently filed Annual Report on Form 10-K, Registration Statement on Form S4, and subsequent reports on Forms 10-Q and 8-K.
31

ACI’s software underpins electronic payments throughout retail and wholesale banking, and commerce all the time, without fail.
trusted globally
www.aciworldwide.com