 February 14, 2012 December 31, 2011 Quarterly and Year End Results Presentation 1 Exhibit 99.2 |
 2 This presentation contains forward-looking statements based on current expectations that involve a number of risks and uncertainties. The forward- looking statements are made pursuant to safe harbor provisions of the Private Securities Litigation Reform Act of 1995. A discussion of these forward- looking statements and risk factors that may affect them is set forth at the end of this presentation. The Company assumes no obligation to update any forward-looking statement in this presentation, except as required by law. Private Securities Litigation Reform Act of 1995 Safe Harbor For Forward-Looking Statements |
 Annual Overview and S1 Acquisition Phil Heasley Chief Executive Officer 3 |
 4 2011 Year in Review • Exceeded full year guidance targets • Record sales bookings of $556 million • Solid backlog growth • Strong revenue growth of 11% • Good Operating Free Cash Flow generation • Expanded operating income margin • Improved Adjusted EBITDA margin • Visibility into forward revenue and profitability attainment • Closed the exchange offer for S1 Corporation on Friday February 10, 2012 |
 5 ACI / S1 - Compelling Strategic Rationale • Combination creates an industry leader in financial and payments software serving financial institutions (“FI”), Processors and Merchant Retailers worldwide • Summary pro forma financials are compelling – Approximately $700 million in combined 2012E Revenue (1) – Approximately $165 million in combined 2012E Adj. EBITDA, including cost synergies (1) – Annual cost synergies of $30 million • Complementary products and customers expand breadth and features/functions • Enhanced global product capabilities to expand growth opportunities • Greater scale and cost synergies to drive margin expansion and earnings accretion Note: (1) 2012E pro forma combined ACI + S1 financial results are before one-time transaction expenses. |
 Financial Review Scott Behrens Chief Financial Officer 6 |
 Key Takeaways from the Fourth Quarter Solid Sales Performance in line with prior-year quarter • Strength in new add-on sales across the geographies Strong revenue quarter • Strong recurring revenue • Timing of ‘go-live’ events resulted in lower non-recurring revenues from backlog versus prior-year quarter Operating Expenses flat with prior-year quarter • Excluding $3.2 million of professional fees related to the S1 acquisition, operating expenses decreased $3.6 million or 4% Strong Operating Income and Adjusted EBITDA Strong Cash Quarter • OFCF of $30.0 million essentially in line with $28.0 million in Q4 2010 7 |
 ACI Organic Key Takeaways from the Year Record sales year with $556 million in bookings • Sales rise of $31 million over prior-year led by solid add-on business • Full-year sales growth of 6%, new sales growth of 5% • Excluding FDC deal, overall growth was 16%, new sales growth was 12% 60-Month Backlog growth of $62 million to $1,617 million Strong Revenue Growth, up 11% over prior year • Stable base of recurring revenues, representing 67% of total revenue Expense Growth Drivers • $6.7 million related to acquisition of S1 Corporation • Higher selling & marketing expenses • Higher R&D expense to invest in accelerated product development 8 • Strong growth in all revenue categories and geographies |
 ACI Organic Key Takeaways from the Year (cont) Operating Free Cash Flow of $67.2 million • Up $4.4 million or 7% over prior year • Ended the year with $197.1 million in cash Strong growth in operating income • Up $12.6 million or 24% over prior-year • Up $19.3 million or 36%, excluding S1 acquisition related expenses Strong growth in Adjusted EBITDA • Up $18.1 million or 21% over prior-year • Up $24.8 million or 28%, excluding S1 acquisition related expenses Lower effective tax rate • Favorable impact of $3.1 million liability release related to our IP transfer and $2.2 million release of tax reserves 9 |
 2011 Achieved Strong Performance vs Guidance • Revenue was greater than range for the year due to strong sales • Operating Income and Adjusted EBITDA higher than expectations *Operating Income and Adjusted EBITDA exclude $6.7 million in S1 Corporation-related acquisition costs incurred in 2011 10 Key Metrics 2010 Actuals 2011 Range 2011 Actuals ex Trans Fees Revenue $418.4 $450-460 $465.1 Operating Income* $53.6 $65-69 $72.9 Adjusted EBITDA* $87.8 $101-104 $112.6 |
 2012 Organic Guidance 11 • Revenue - Revenue growth rate in the mid to high single digit range - Revenue and margin phasing consistent with prior-year - Beginning 12-month backlog of $424 million represents 85% of mid-point revenue guidance • Operating Income - Growth rate of 3x revenue growth rate • Adjusted EBITDA - Growth rate of 2x revenue growth rate - Depreciation and amortization flat over prior year - Non-cash compensation expense consistent with prior-year at $11-12 million Notes: FX rates as of December 31, 2011 * Operating Income and Adjusted EBITDA exclude $6.7 million in S1 Corporation-related acquisition costs incurred in 2011 Key Metrics 2011 Actuals 2012 Low 2012 High Revenue $465.1 $490 $500 Operating Income* $72.9 $84 $89 Adjusted EBITDA* $112.6 $124 $129 |
 ACI / S1 12 |
 13 ACI / S1 - Transaction Update • Closed S1 exchange offer on Friday February 10 , 2012 • Integration plan underway – Annual cost synergies of $30 million to be achieved by end of Q1 – Additional cost synergies, including data center and facilities consolidation, to be provided in Q2 – S1’s Large FIs (LFIN) and Payments segments will be integrated immediately into ACI‘s global operating structure, methodologies and processes – S1’s Community FIs (CFIN) segment, a new market for ACI, will be managed as a separate business unit over the near-term until we complete assessment and fit within ACI’s operating structure – Status and progress of the S1 integration to be updated quarterly • Strong financial profile with approximately $183 million in cash post-closing and 2.2x leverage ratio th |
    14 ACI / S1 - Pro Forma 2011 ($ in Millions) • S1 2011E Revenue and Adjusted EBITDA represents midpoint of 2011 Guidance • ACI and S1 2011E Adjusted EBITDA exclude one-time transaction expenses • S1 60-Month Backlog (as of 12/31/11) is a preliminary estimate, subject to verification Stand-alone Stand-alone Illustrative ACI S1 (1) Combined Revenue 465 $ 245 $ 710 $ Adjusted EBITDA (2) (3) 113 $ 29 $ 142 $ Margin % 24% 12% 20% 60-Month Backlog 1,617 $ 685 $ 2,302 $ Notes: (1) S1 2011 Guidance: Revenue $240-$250M; Adj. EBITDA $27-$31M. (2) ACI Adjusted EBITDA excludes $6.7M in S1 transaction exps incurred in 2011. (3) S1 Adjusted EBITDA excludes $8.6M in FNDT & ACI transaction exps incurred in 2011. |
 15 ACI / S1 – Combined 2012 Guidance ($ in Millions) • ACI 2012E represents midpoint of organic Guidance • Combined Guidance before one-time transaction expenses: – Represents 10½ months of financial results of S1 – State Farm custom project completed in 2011 (revenue of ~$17 million in 2011) – Includes annual cost synergies of $23 million to be realized in 2012 – Includes estimates for non-cash purchase accounting adjustments (assumes deferred revenue haircut of $12M) • Before purchase accounting, combined adjusted EBITDA margin in-line with ACI organic margins • Fully diluted shares outstanding of approximately 40 million at close Note: (1) See Appendix for purchase accounting adjustments and one-time transaction expenses detail. Standalone ACI Revenue 495 $ 696 $ - 706 $ Adjusted EBITDA 127 $ 165 $ - 170 $ Margin % 26% 24% 24% Operating Income 87 $ 99 $ - 104 $ Margin % 17% 14% 15% Combined Guidance before One-Time Trans. Exps. |
 16 ACI / S1 - Pro Forma Credit Statistics 12/31/2011 ($ in Millions) • $370M in funded debt at close with interest rate of L+200 bps – $250M 5-year revolver with $80M in availability – $200M 5-year term loan • Free cash flow priorities – Reduce leverage – Fund growth – Buy-back shares ($75M authorization) Notes: (1) S1 12/31/11 cash balance is a preliminary estimate. (2) Illustrative ACI includes $30M of cost synergies. Stand-alone Stand-alone Trans. Illustrative ACI S1 (1) Adjustments Combined Cash 197 $ 96 $ (110) $ 183 $ Revolver 75 $ - $ 95 $ 170 $ Term Loan - - 200 200 Total Debt 75 $ - $ 295 $ 370 $ Total Debt / PF 2011 Adj. EBITDA (2) 0.7x NM 2.2x Net Debt / PF 2011 Adj. EBITDA (2) NM NM 1.1x |
 Appendix 17 |
 18 ACI / S1 – Combined 2012 Guidance ($ in Millions) • ACI 2012E represents midpoint of standalone Guidance • Includes cost synergies of $23M to be realized in 2012 • S1 2012E represents 10½ months of financial results – State Farm custom project completed in 2011 (revenue of ~$17M in 2011) • Non-cash purchase accounting adjustments and one-time transaction expenses are estimates and subject to revisions once 3 party valuation complete Standalone Cost Purchase One-Time ACI Synergies Acct. Adj. Trans. Exps. Revenue 495 $ 213 $ - 223 $ - $ (12) $ 696 $ - 706 $ - $ 696 $ - 706 $ Adjusted EBITDA 127 $ 28 $ - 33 $ 23 $ (12) $ 165 $ - 170 $ (16) $ 149 $ - 154 $ Margin % 26% 13% 15% 24% 24% 21% 22% Operating Income 87 $ 15 $ - 20 $ 23 $ (24) $ 99 $ - 104 $ (16) $ 83 $ - 88 $ Margin % 17% 7% 9% 14% 15% 12% 13% Incremental Combined before Combined after S1 One-Time Trans. Exps. One-Time Trans. Exps. rd |
 19 ACI / S1 - Pro Forma 2012E Purchase Accounting and One-Time Transaction Expenses Assumptions ($ in Millions) • Synergies reflect amount to be realized in 2012 (75% of $30M) • Non-cash deferred revenue adjustment estimated at 40% of S1 deferred revenue balance with 2/3 rd recognized in 2012 and 1/3 rd in 2013 (1) • Non-cash, incremental intangible asset amortization estimated at 30% premium over tangible book value with 7-year life offset by S1 non-cash stock compensation benefit (1) • One-time ACI transaction expenses represent investment banking, legal, and filing fees to be incurred in closing the acquisition Note: (1) 3 party valuation related non-cash purchase accounting adjustments to be completed by end of Q1 2012. Purchase One-Time Adjustments: Acct. Adj. Trans. Exps. Non-Cash Deferred Revenue Writedown (12) $ - $ (12) $ Non-Cash Intangibles Amortization & Non-Cash Cash Comp. (12) - (12) Change in Control / Severance Payments - (10) (10) One-Time ACI Transaction Expenses - (6) (6) Total (24) $ (16) $ (40) $ Total 2012E Adjustments rd |
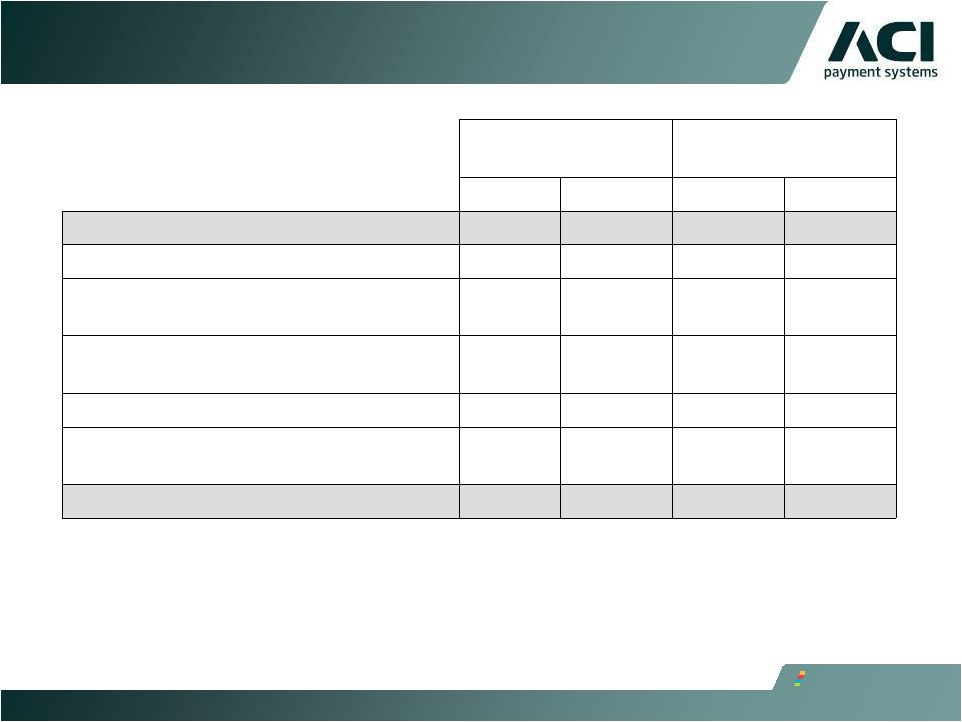
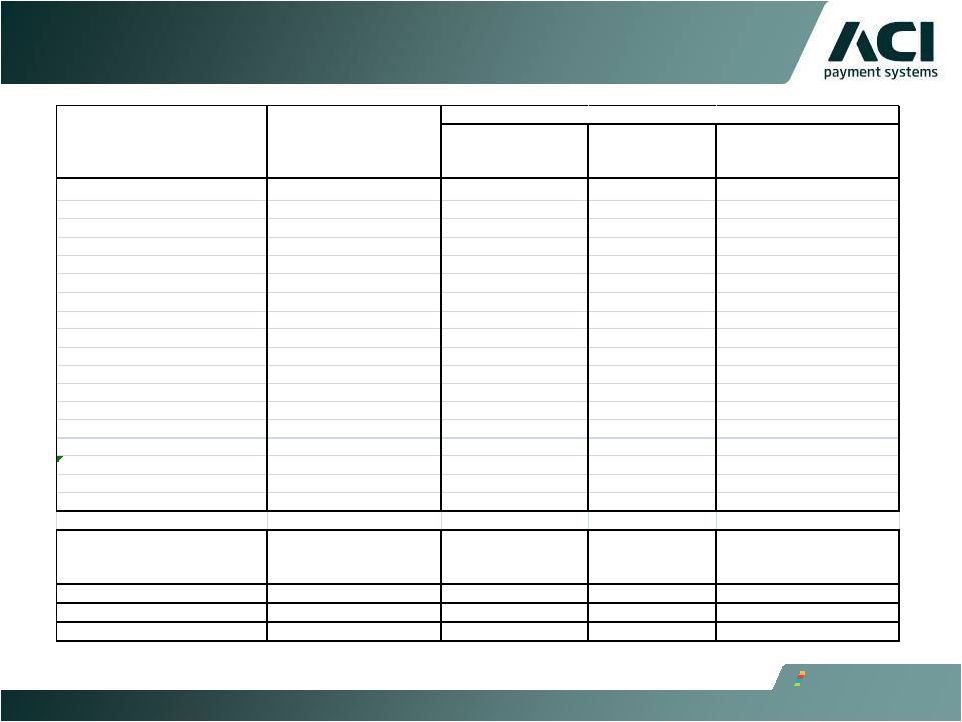   20 Historic Sales By Quarter 2010-2011 New Accounts / New Applications 3/31/2010 $81,142 $5,758 $35,066 $40,318 7% 43% 50% 6/30/2010 $107,985 $1,224 $68,474 $38,287 1% 63% 35% 9/30/2010 $161,269 $11,290 $89,364 $60,615 7% 55% 38% 12/30/2010 $174,827 $43,988 $59,622 $71,217 25% 34% 41% 3/31/2011 $122,904 $13,695 $50,305 $58,904 11% 41% 48% 6/30/2011 $146,956 $19,730 $54,174 $73,052 13% 37% 50% 9/30/2011 $115,089 $17,356 $57,611 $40,123 15% 50% 35% 12/31/11 $171,385 $12,906 $104,460 $54,019 8% 61% 32% New Accounts / New Applications DEC YTD 11 $556,334 $63,687 $266,550 $226,098 DEC YTD 10 $525,222 $62,259 $252,526 $210,438 Variance $31,112 $1,428 $14,024 $15,660 Quarter-End Sales Term Extension Add-on Business inc. Capacity Upgrades & Term Extension Add-on Business inc. Capacity Upgrades & Total Economic Value of Sales Sales Mix by Category |
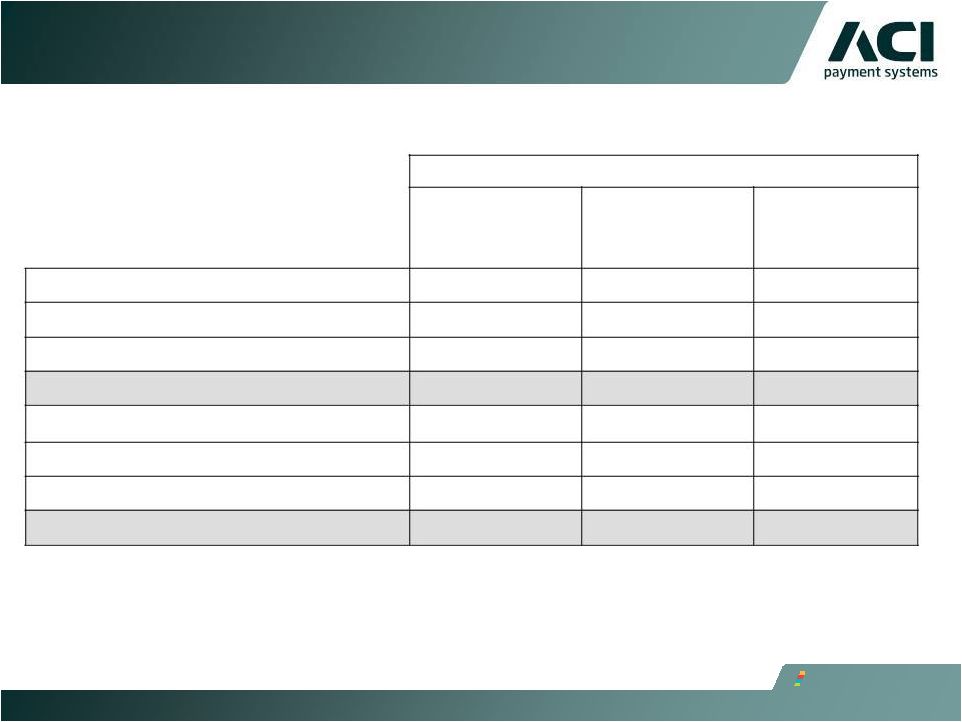
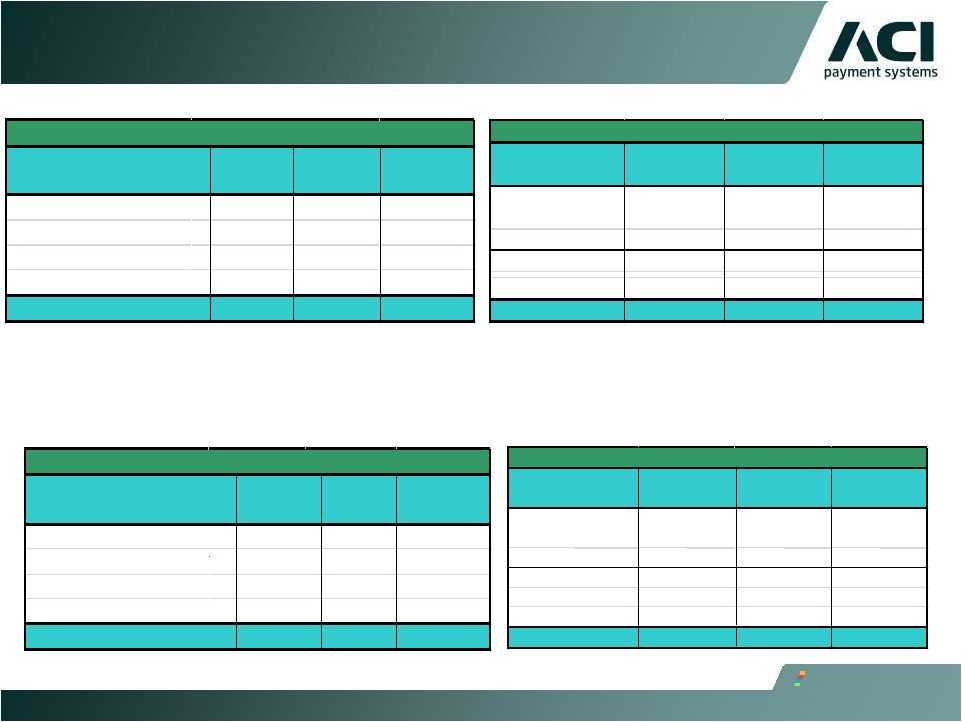 21 Sales Composition Product Focus Qtr Ended Dec 11 Qtr Ended Dec 10 Online Banking 19,881 19,757 0.6% Retail & Wholesale Payments 121,671 131,393 -7.4% Fraud Detection 7,889 7,172 10.0% Application & Tools 21,944 16,504 33.0% Total Sales 171,385 174,827 -2.0% Product Division ($MM) Qtr Ended Dec 11 Qtr Ended Dec 10 New Accounts / New Applications $12,906 $43,988 -70.7% Add-on Business 104,460 59,622 75.2% New Sales 117,366 103,609 13.3% Term Extension 54,019 71,217 -24.1% Total ACI Sales $171,385 $174,827 -2.0% Total Sales Product Focus CY 2011 CY 2010 Online Banking 76,297 44,576 71.2% 381,615 381,888 -0.1% Fraud Detection 22,631 29,571 -23.5% Application & Tools 75,792 69,187 9.5% Total Sales 556,335 525,222 5.9% Product Division ($MM) Year Ended Dec 11 Year Ended Dec 10 New Accounts / New Applications $63,687 $62,259 2.3% Add-on Business 266,550 252,525 5.6% New Sales 330,236 314,784 4.9% Term Extension 226,099 210,438 7.4% Total ACI Sales $556,335 $525,222 5.9% Total Sales Retail & Wholesale Payments % Growth or Decline % Growth or Decline % Growth or Decline %Growth or Decline |
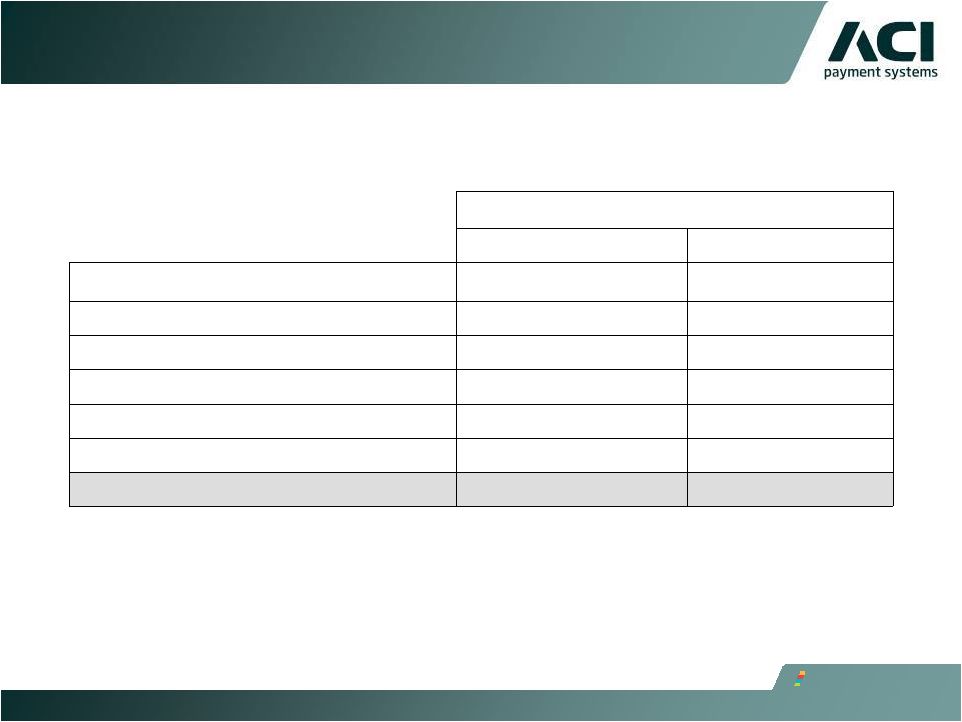
   Sales By Region by Quarter and Year Channel Qtr Ended Dec 11 Qtr Ended Dec 10 % Growth or Decline Americas $85,545 $75,451 13.4% EMEA 60,804 76,824 -20.9% Asia-Pacific 25,035 22,552 11.0% Total Sales $171,385 $174,827 -2.0% Total Sales Channel Yr Ended Dec 11 Yr Ended Dec 10 % Growth or Decline Americas $313,876 $263,292 19.2% EMEA 186,595 211,986 -12.0% Asia-Pacific 55,862 49,944 11.8% Total Sales $556,333 $525,222 5.9% Total Sales 22 |
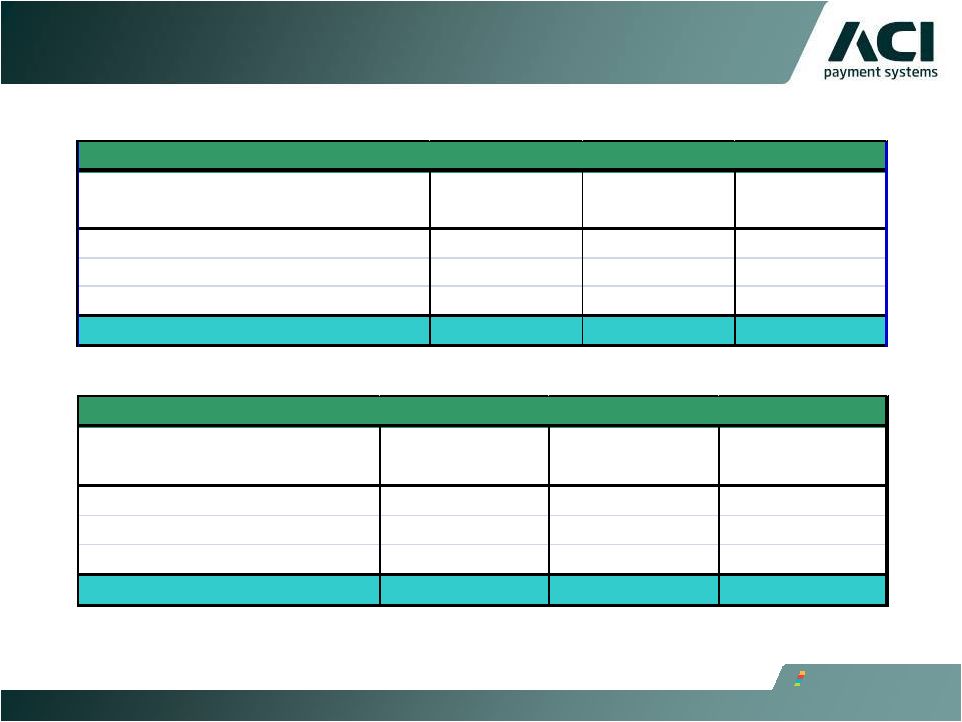
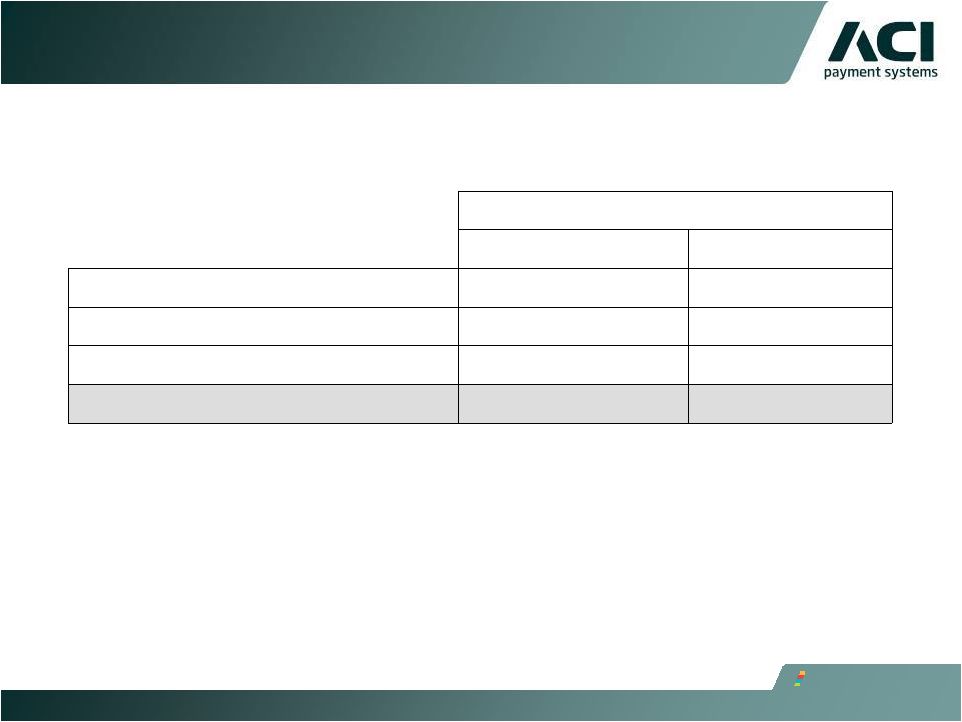
  Backlog as a Contributor of Quarterly Revenue • Backlog from monthly recurring revenues and project go-lives continues to drive current quarter GAAP revenue, leading to predictable quarterly performance • We expect backlog to contribute a similar percentage of 2012 revenue led by recurring revenue and project go-live events 23 Revenue Qtr Ended Dec 11 Qtr Ended Dec 10 % Growth or Decline Revenue from Backlog $122,374 130,927 -6.5% Revenue from Sales 12,662 10,314 22.8% Total Revenue $135,036 $141,241 -4.4% Revenue from Backlog 91% 93% Revenue from Sales 9% 7% Revenue |
 Operating Free Cash Flow ($ millions) 24 Quarter Ended December 31, Year Ended December 31, 2011 2010 2011 2010 Net cash provided by operating activities $31.2 $32.2 $83.5 $81.3 Adjustments: Net after-tax payments associated with S1 acquisition costs 3.3 - 3.7 - Net after-tax payments associated with IBM IT Outsourcing Transition costs 0.2 0.2 0.9 0.9 Less capital expenditures (3.1) (2.6) (19.0) (13.2) Less Alliance technical enablement expenditures (1.6) (1.8) (1.9) (6.2) Operating Free Cash Flow* $30.0 $28.0 $67.2 $62.8 *OFCF is defined as net cash provided (used) by operating activities, less net after-tax payments associated with S1 acquisition costs and IBM IT outsourcing transition costs, capital expenditures and plus or minus net proceeds from IBM. |
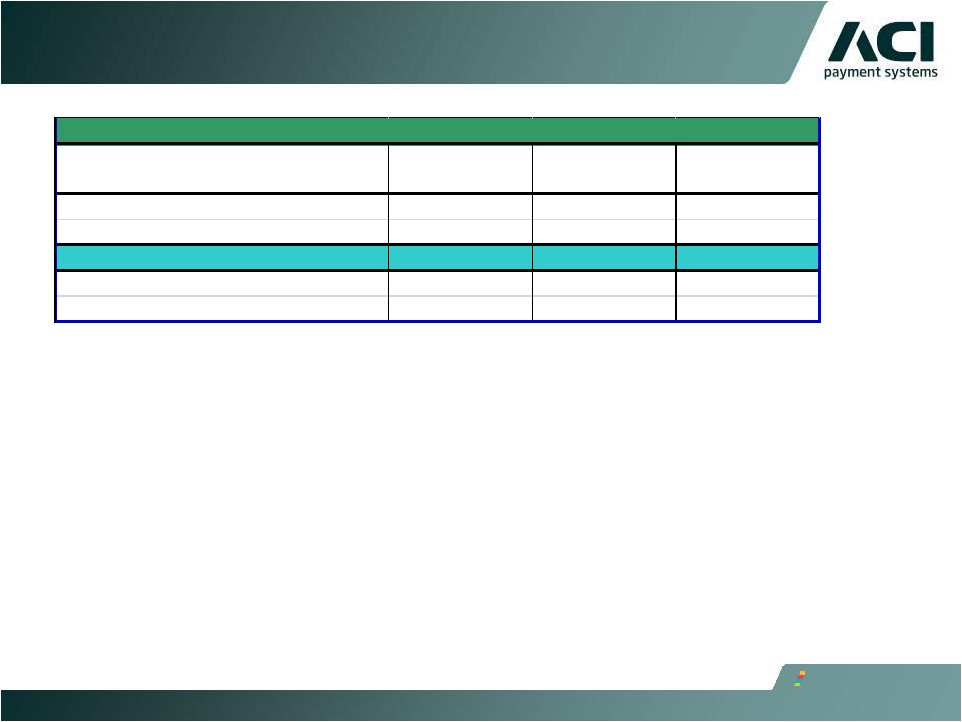
 60-Month Backlog ($ millions) 25 Quarter Ended December 31, September 30, December 31, 2011 2011 2010 Americas $912 $894 $866 EMEA 514 520 501 Asia/Pacific 191 189 188 Backlog 60-Month $1,617 $1,603 $1,555 Deferred Revenue $166 $156 $153 Other 1,451 1,447 1,402 Backlog 60-Month $1,617 $1,603 $1,555 |
 Revenues by Channel ($ millions) 26 Quarter Ended December 31, 2011 2010 Revenues: United States $59.1 $54.8 Americas International 16.5 20.3 Americas $75.6 $75.1 EMEA 42.2 53.1 Asia/Pacific 17.2 13.0 Revenues $135.0 $141.2 |
 Monthly Recurring Revenue ($ millions) 27 Quarter Ended December 31, 2011 2010 Monthly Software License Fees $26.1 $32.5 Maintenance Fees 38.3 34.4 Processing Services 14.3 13.7 Monthly Recurring Revenue $78.7 $80.6 |
 Deferred Revenue and Expense ($ millions) 28 Quarter Ended December 31, September 30, December 31, September 30, 2011 2011 2010 2010 Short Term Deferred Revenue $133.0 $123.9 $121.9 $131.5 Long Term Deferred Revenue 32.7 32.5 31.0 35.7 Total Deferred Revenue $165.7 $156.4 $152.9 $167.2 Total Deferred Expense $12.2 $11.7 $11.1 $14.6 |
 Non-Cash Compensation, Acquisition Intangibles and Software 29 Quarter ended December 31, 2011 Quarter ended December 31, 2010 EPS Impact* $ in Millions EPS Impact* $ in Millions Amortization of acquisition- related intangibles $0.03 $0.9 $0.03 $1.0 Amortization of acquisition- related software 0.03 0.9 0.03 0.9 Non-cash equity-based compensation 0.09 3.0 0.04 1.5 Total: $0.15 $4.8 $0.10 $3.4 * Tax Effected at 35% |
 Other Income / Expense ($ millions) 30 Quarter Ended December 31, 2011 September 30, 2011 December 31, 2010 September 30, 2010 Interest Income $0.7 $0.2 $0.2 $0.2 Interest Expense ($1.0) ($0.4) ($0.5) ($0.4) FX Gain / Loss ($0.8) ($0.1) ($0.1) ($1.5) Other $0.1 $0.0 $0.0 ($0.1) Total Other Income (Expense) ($1.0) ($0.3) ($0.4) ($1.8) |
 Adjusted EBITDA Quarter Ended December 31, Year Ended December 31, 2011 2011 2010 2011 2010 Net Income $23.9 $27.1 $45.9 $27.2 Plus: Income Tax Expense 12.1 15.3 18.5 21.5 Net Interest Expense 0.3 0.3 1.1 1.3 Net Other Expense 0.7 0.1 0.8 3.6 Depreciation Expense 2.0 1.6 7.5 6.7 Amortization Expense 5.0 5.0 20.8 19.7 Non-Cash Compensation Expense 4.6 2.3 11.3 7.8 Adjusted EBITDA $48.6 $51.7 $105.9 $87.8 31 |
 Non-GAAP Financial Measures 32 ACI is presenting operating free cash flow, which is defined as net cash provided (used) by operating activities, less net after-tax payments associated with S1 acquisition costs, net after-tax payments associated with IBM IT outsourcing transition costs, and capital expenditures and plus or minus net proceeds from IBM. Operating free cash flow is considered a non-GAAP financial measure as defined by SEC Regulation G. We utilize this non-GAAP financial measure, and believe it is useful to investors, as an indicator of cash flow available for debt repayment and other investing activities, such as capital investments and acquisitions. We utilize operating free cash flow as a further indicator of operating performance and for planning investing activities. Operating free cash flow should be considered in addition to, rather than as a substitute for, net cash provided (used) by operating activities. A limitation of operating free cash flow is that it does not represent the total increase or decrease in the cash balance for the period. This measure also does not exclude mandatory debt service obligations and, therefore, does not represent the residual cash flow available for discretionary expenditures. We believe that operating free cash flow is useful to investors to provide disclosures of our operating results on the same basis as that used by our management. We also believe that this measure can assist investors in comparing our performance to that of other companies on a consistent basis without regard to certain items, which do not directly affect our ongoing cash flow. |
 Non-GAAP Financial Measures 33 ACI also includes backlog estimates which are all software license fees, maintenance fees and services specified in executed contracts, as well as revenues from assumed contract renewals to the extent that we believe recognition of the related revenue will occur within the corresponding backlog period. We have historically included assumed renewals in backlog estimates based upon automatic renewal provisions in the executed contract and our historic experience with customer renewal rates. Backlog is considered a non-GAAP financial measure as defined by SEC Regulation G. Our 60-month backlog estimate represents expected revenues from existing customers using the following key assumptions: Maintenance fees are assumed to exist for the duration of the license term for those contracts in which the committed maintenance term is less than the committed license term. License and facilities management arrangements are assumed to renew at the end of their committed term at a rate consistent with our historical experiences. Non-recurring license arrangements are assumed to renew as recurring revenue streams. Foreign currency exchange rates are assumed to remain constant over the 60-month backlog period for those contracts stated in currencies other than the U.S. dollar. Our pricing policies and practices are assumed to remain constant over the 60-month backlog period. |
 Non-GAAP Financial Measures 34 Estimates of future financial results are inherently unreliable. Our backlog estimates require substantial judgment and are based on a number of assumptions as described above. These assumptions may turn out to be inaccurate or wrong, including for reasons outside of management’s control. For example, our customers may attempt to renegotiate or terminate their contracts for a number of reasons, including mergers, changes in their financial condition, or general changes in economic conditions in the customer’s industry or geographic location, or we may experience delays in the development or delivery of products or services specified in customer contracts which may cause the actual renewal rates and amounts to differ from historical experiences. Changes in foreign currency exchange rates may also impact the amount of revenue actually recognized in future periods. Accordingly, there can be no assurance that contracts included in backlog estimates will actually generate the specified revenues or that the actual revenues will be generated within the corresponding 60-month period. Backlog should be considered in addition to, rather than as a substitute for, reported revenue and deferred revenue. ACI also includes Adjusted EBITDA, which is defined as net income plus income tax expense, net interest expense, net other expenses, depreciation, amortization and non-cash compensation. Adjusted EBITDA is considered a non-GAAP financial measure as defined by SEC Regulation G. Adjusted EBITDA should be considered in addition to, rather than as a substitute for, net income. |
 Non-GAAP Financial Measures 35 The presentation of these non-GAAP financial measures should be considered in addition to our GAAP results and is not intended to be considered in isolation or as a substitute for the financial information prepared and presented in accordance with GAAP. Management generally compensates for limitations in the use of non-GAAP financial measures by relying on comparable GAAP financial measures and providing investors with a reconciliation of non-GAAP financial measures only in addition to and in conjunction with results presented in accordance with GAAP. We believe that these non-GAAP financial measures reflect an additional way of viewing aspects of our operations that, when viewed with our GAAP results, provide a more complete understanding of factors and trends affecting our business. |
 Forward-Looking Statements 36 This presentation contains forward-looking statements based on current expectations that involve a number of risks and uncertainties. Generally, forward-looking statements do not relate strictly to historical or current facts and may include words or phrases such as “believes,” “ will,” “expects,” “anticipates,” “intends,” and words and phrases of similar impact. The forward-looking statements are made pursuant to safe harbor provisions of the Private Securities Litigation Reform Act of 1995. Forward-looking statements in this presentation include, but are not limited to, statements regarding: Our belief that we have visibility into forward revenue and profitability attainment; Expectations and assumptions regarding the recent acquisition of S1 relating to (i) creating a worldwide industry leader in financial and payments software serving FIs, processors and merchant retailers, (ii) creating compelling pro forma financials, (iii) complementary products and customers expand breadth and features/ functions, (iv) enhanced global product capabilities to expand growth opportunities (v) greater scale and cost synergies to drive margin expansion and earnings accretion and (vi) strong financial cash profile post closing and leverage ratio; The company’s 12-month and 60-month backlog estimates and assumptions, including (i) our belief that backlog from monthly recurring revenues and project go-lives will continue to drive current quarter GAAP revenue and lead to predictable quarterly performance, and (ii) expectations for backlog to contribute a similar percentage of 2012 revenue led by recurring revenue and project go-live events as it did in 2011; and Expectations and assumptions regarding (i) ACI organic and ACI/S1 combined 2012 financial guidance related to revenue, operating income and adjusted EBITDA and (ii) expectations and assumptions regarding other factors impacting our 2012 financial guidance. |
 Forward-Looking Statements 37 All of the foregoing forward-looking statements are expressly qualified by the risk factors discussed in our filings with the Securities and Exchange Commission. Such factors include but are not limited to, risks related to the global financial crisis and the continuing decline in the global economy; volatility and disruption of the capital and credit markets and adverse changes in the global economy; consolidations and failures in the financial services industry; increased competition; restrictions and other financial covenants in our credit facility; the restatement of our financial statements; the accuracy of management’s backlog estimates; impairment of our goodwill or intangible assets; exposure to unknown tax liabilities; risks from operating internationally; our offshore software development activities; customer reluctance to switch to a new vendor; the performance of our strategic product, BASE24-eps; our strategy to migrate customers to our next generation products; ratable or deferred recognition of certain revenue associated with customer migrations and the maturity of certain of our products; demand for our products; failure to obtain renewals of customer contracts or to obtain such renewals on favorable terms; delay or cancellation of customer projects or inaccurate project completion estimates; business interruptions or failure of our information technology and communication systems; our alliance with International Business Machines Corporation (“IBM”); the complexity of our products and services and the risk that they may contain hidden defects or be subjected to security breaches or viruses; compliance of our products with applicable legislation, governmental regulations and industry standards; our compliance with privacy regulations; the protection of our intellectual property in intellectual property litigation; future acquisitions, strategic partnerships and investments and litigation; the risk that expected synergies, operational efficiencies and cost savings from our recent acquisition of S1 Corporation (“S1”) may not be fully realized or realized within the expected timeframe; the cyclical nature of our revenue and earnings and the accuracy of forecasts due to the concentration of revenue generating activity during the final weeks of each quarter; and volatility in our stock price. For a detailed discussion of these risk factors, parties that are relying on the forward-looking statements should review our filings with the Securities and Exchange Commission, including our most recently filed Annual Report on Form 10-K and subsequent reports on Forms 10-Q and 8-K. |
 ACI’s software underpins electronic payments throughout retail and wholesale banking, and commerce all the time, without fail. www.aciworldwide.com |