 July 26, 2012 June 30, 2012 Quarterly Results Presentation ACI’s software underpins electronic payments throughout retail and wholesale banking, and commerce all the time. Exhibit 99.2 |
 2 This presentation contains forward-looking statements based on current expectations that involve a number of risks and uncertainties. The forward- looking statements are made pursuant to safe harbor provisions of the Private Securities Litigation Reform Act of 1995. A discussion of these forward- looking statements and risk factors that may affect them is set forth at the end of this presentation. The Company assumes no obligation to update any forward-looking statement in this presentation, except as required by law. Private Securities Litigation Reform Act of 1995 Safe Harbor For Forward-Looking Statements |
 Quarterly Overview Phil Heasley Chief Executive Officer 3 |
 4 Q2 2012 in Review • Corporate consolidation of S1 and ACI now complete – Annualized savings of $53 million between the SG&A and facilities/IT rationalization – focus now on execution of facilities and IT rationalization • Rolled out product and solutions road maps to market and customers at key industry events • Repurchased approximately $38 million of shares in the quarter • Business goal remains growth in sales net of term extensions and building long-term backlog |
 Business Overview Ralph Dangelmaier President, Global Markets 5 |
 Q2 2012 Overview Americas • New Consumer On-line banking solution with leading regional bank holding company with 100+ branches • Term extension/add-on sale to leading Canadian Financial Institution • New PRM solution and term extension with Regional U.S. Financial Institution • Base24-eps migration with leading Brazilian processor • Leading specialty retailer in Northeast committed to ACI’s Retail Commerce Server Asia Pacific • Major re-commitment and new BASE24- eps migration by leading card processor in Taiwan • Professional Services and add-on sales with one of Asia’s leading financial services groups • Capacity upgrade with leading Japanese processor EMEA • Significant add-on and term extension with Major Global Financial Services Provider • Wholesale term extension with world premier Financial Institution headquartered in UK • Significant add-on and term extension with Leading Corporate Banking Services Provider in South Central Europe 6 |
 7 Key Market Drivers • Global trends - regulations, growth, cost reduction and innovation • Innovation • EMV – Americas • EMV will be a catalyst for change around system upgrades and BASE24- eps, Back Office, Token Mgr, and ACI Interchange/Acquirer opportunities • Mobile Initiative – Global • Early growth stage for mobile becoming a channel for Banking and Payments • ACI Mobile campaign kicked off with strong activities around customer engagements including webinar series and mobile white papers • Second half CY 2012 Outlook • Americas - Continued focus on large add-on sales and cross–sell activities • EMEA - Large major transformation projects • APAC - Pipeline very strong |
 Financial Review Scott Behrens Chief Financial Officer 8 |
 Key Takeaways from the Quarter Q2 Sales • Strong sales in EMEA, up 49%, led by large UK bank renewal • S1 Acquisition contributed approximately $39 million of sales • Sales, net of term extensions, increased $38.4 million and 52% over Q2-2011 Backlog Impacted by FX Movements • FX movements reduced 60-month backlog by $23.5 million • FX movements reduced 12-month backlog by $6.2 million Solid Revenue Quarter • S1 contributed $43.1 million in revenue for the second quarter • Q2 revenue impacted by $9.6 million of deferred revenue haircut • Monthly recurring revenue comprised 70% of the quarter’s revenue • Organic revenue decline of $6.7 million on timing of capacity and initial license fees • FX movement reduced revenues by $3 million compared to prior-year quarter • Approximately $10 million of non-recurring revenue from backlog moved into 2H-12 9 |
 10 Key Takeaways from the Quarter (cont) Operating Expense • S1 contributed $45.0 million in expenses for the period • Organic expenses up $2.1 million primarily from higher deferred costs recognized from project go-lives. • $7.6 million of IT-related infrastructure exit costs and severance expense Non-GAAP Operating Income & Adjusted EBITDA • Non-GAAP Operating Income of $9.4 million • Non-GAAP Adjusted EBITDA of $25.7 million • Non-GAAP amounts exclude S1 acquisition related one-time expenses and impact of deferred revenue haircut Debt & Liquidity Ended Q2 with $149.6 million in cash Repurchased 962K shares of stock for approximately $38 million during Q2 YTD repurchased 1.1 million shares of stock for approximately $44 million Acquired Latin American distributor for $4.5 million Reduced Term Loan debt by approximately $3.1 million in Q2 As of June 2012, debt outstanding of $363.8 million ($170 million in revolver and $193.8 million in term loan) |
 S1 Integration Update Corporate Consolidation now complete Additional cost savings expected to be achieved from facilities and data center consolidation Summary of additional actions as follows: • Close and consolidate 14 redundant offices worldwide • Consolidate Data Centers • 75% of actions complete by end of 2012 with remainder complete by end of 2013 Summary of additional one-time costs and savings as follows: • 2012: $15 million of one-time expenses related to IT and facilities exit costs; of which $7.6 million incurred in Q2 • 2013: $15 million of annualized savings • 2014 and thereafter: $20 million of annualized savings 11 When fully implemented, overall cost synergies from acquisition expected to be $53 million |
  Reaffirmation of 2012 Margin Guidance 12 Chart represents walk from Q1 2012 earnings (May 3 rd ) to current • Operating efficiencies offset margin impact of FX movements and incremental deferred revenue haircut from purchase accounting • No impact to prior guidance for Operating Income and Adjusted EBITDA • One time transaction expenses of $31 million inclusive of facilities and IT exit costs synergies quantified in Q2-12 • 2013 annualized cost synergy benefits of $48 million • 2014 annualized cost synergy benefits of $53 million $ Millions Prior Guidance Range Incremental Purchase Acct Adj Q2-12 FX Impact Current Guidance before One-Time Trans Exp Total One- Time Trans Exp Revenue $696- $706 (3) (10) $683-$693 Adjusted EBITDA $165- $170 - - $165- $170 (31) Operating Income $99- $104 - - $99- $104 (31) |
 Appendix 13 |
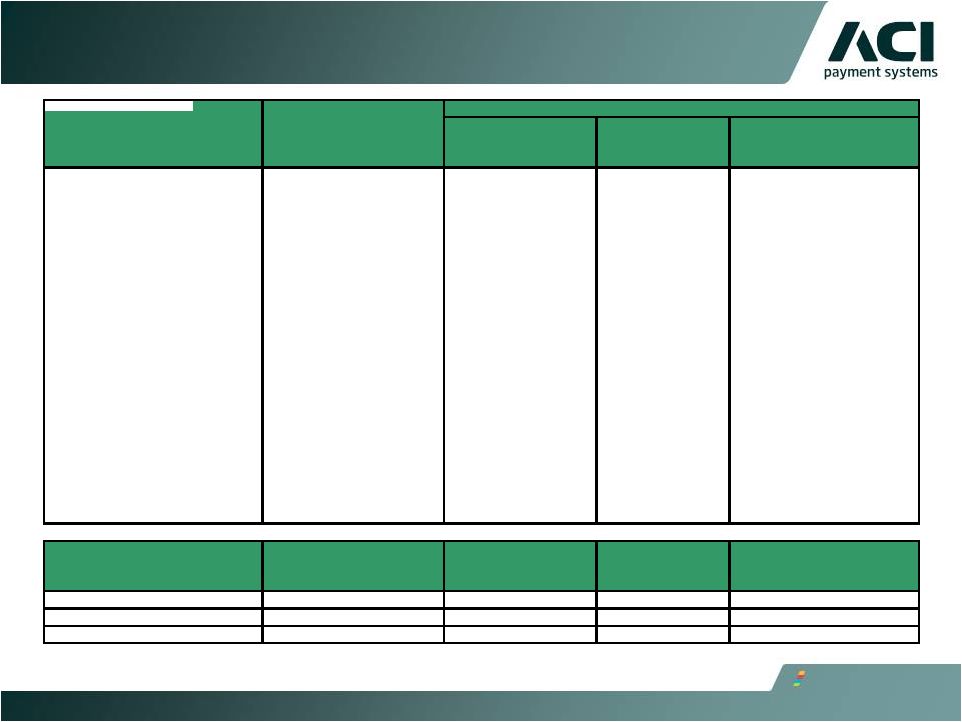  14 Historic Sales By Quarter 2010-2012 New Accounts / New Applications 3/31/2010 $81,142 $5,758 $35,066 $40,318 7% 43% 50% 6/30/2010 $107,985 $1,224 $68,474 $38,287 1% 63% 35% 9/30/2010 $161,269 $11,290 $89,364 $60,615 7% 55% 38% 12/30/2010 $174,827 $43,988 $59,622 $71,217 25% 34% 41% 3/31/2011 $122,904 $13,695 $50,305 $58,904 11% 41% 48% 6/30/2011 $146,956 $19,730 $54,174 $73,052 13% 37% 50% 9/30/2011 $115,089 $17,356 $57,611 $40,123 15% 50% 35% 12/31/2011 $171,385 $12,906 $104,460 $54,019 8% 61% 32% 3/31/2012 $108,462 $5,958 $58,602 $43,902 5% 54% 40% 6/31/2012 $156,188 $9,855 $102,417 $43,916 6% 66% 28% New Accounts / New Applications JUN YTD 12 $264,650 $15,813 $161,019 $87,818 JUN YTD 11 $269,860 $33,425 $104,479 $131,956 Variance ($5,210) ($17,612) $56,541 ($44,138) Quarter-End Sales Term Extension Add-on Business inc. Capacity Upgrades & Term Extension Add-on Business inc. Capacity Upgrades & Total Economic Value of Sales Sales Mix by Category |
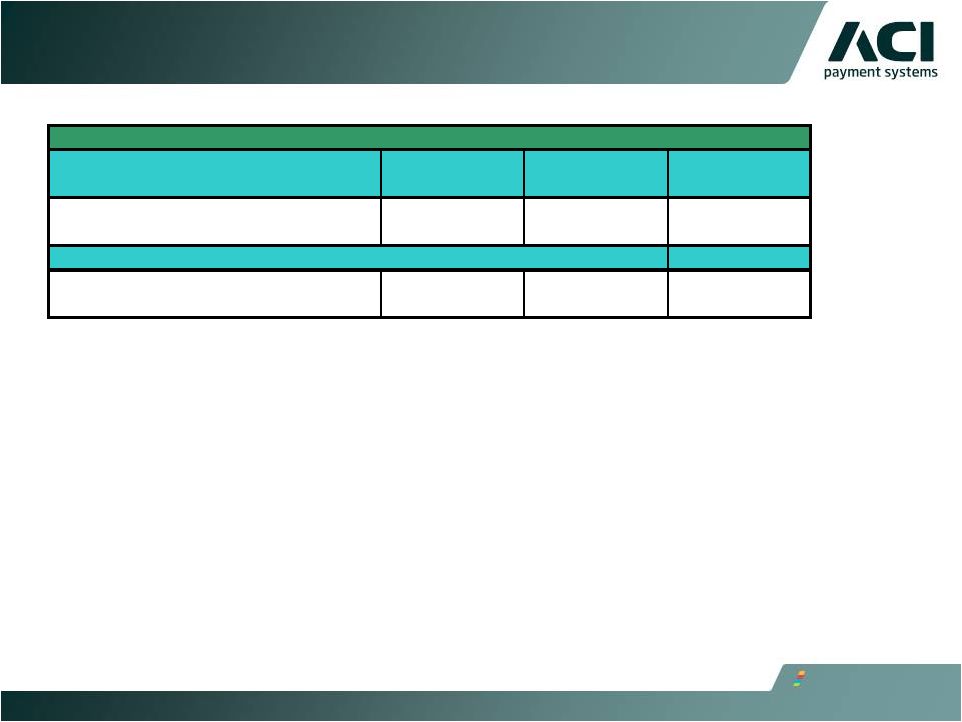
 Sales By Region by Geography and Type Channel Qtr Ended Jun 12 Qtr Ended Jun 11 % Growth or Decline Americas $68,908 $83,897 -17.9% EMEA 70,071 47,062 48.9% Asia-Pacific 17,209 15,997 7.6% Total Sales $156,188 $146,956 6.3% Total Sales Sales Type Qtr Ended Jun 12 Qtr Ended Jun 11 % Growth or Decline New Account / New Application $9,855 $19,730 -50.1% Add-on Business 102,417 54,174 89.1% Term Extension 43,916 73,052 -39.9% Total Sales $156,188 $146,956 6.3% Sales Type |
 Backlog as a Contributor of Quarterly Revenue • Backlog from monthly recurring revenues and project go-lives continues to drive current quarter GAAP revenue • Revenue from current quarter sales consistent with prior quarters 16 Revenue Qtr Ended Jun 12 Qtr Ended Jun 11 % Growth or Decline Revenue from Backlog $142,854 $103,219 38.4% Revenue from Sales 6,943 10,147 -31.6% Total Revenue $149,797 $113,366 32.1% Revenue from Backlog 95% 91% Revenue from Sales 5% 9% Revenue |
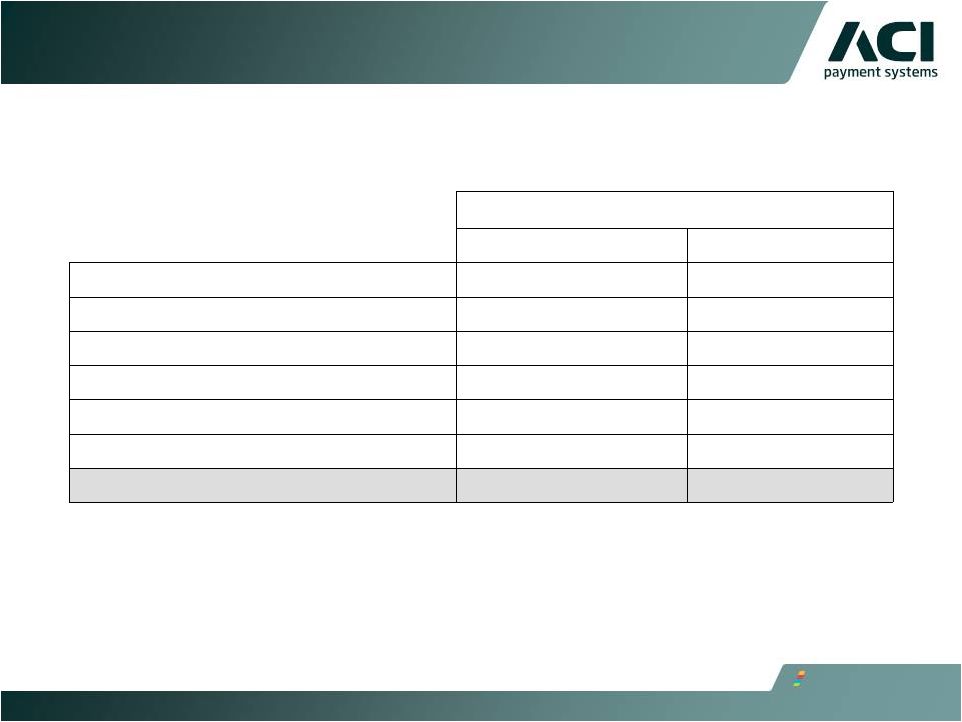
 Operating Free Cash Flow ($ millions) 17 Quarter Ended June 30, 2012 2011 Net cash provided (used) by operating activities $(5.5 ) $7.5 Adjustments: Net after-tax payments associated with employee-related actions* 3.9 - Net after-tax payments associated with S1 related transaction costs* 1.1 - Net after-tax payments associated with IBM IT Outsourcing Transition* 0.2 0.2 Less capital expenditures (3.5 ) (6.1) Operating Free Cash Flow $(3.8) $1.6 * Tax effected at 35% |
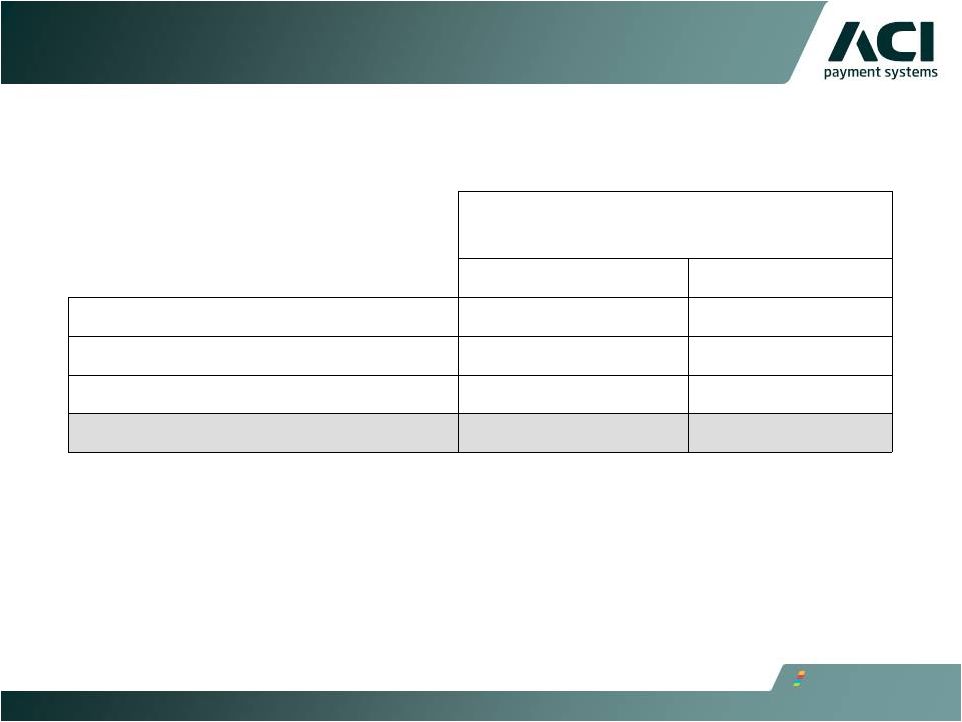
 60-Month Backlog ($ millions) 18 Quarter Ended June 30, March 31, June 30, 2012 2012 2011 Americas $1,414 $1,405 $902 EMEA 653 669 534 Asia/Pacific 239 243 193 Backlog 60-Month $2,306 $2,317 $1,629 Deferred Revenue $204 $207 $162 Other 2,102 2,110 1,467 Backlog 60-Month $2,306 $2,317 $1,629 |
 Revenues by Channel ($ millions) 19 Quarter Ended June 30, 2012 2011 Revenues: United States $65.3 $ 44.9 Americas International 16.4 13.1 Americas $81.7 $58.0 EMEA 49.6 41.9 Asia/Pacific 18.5 13.5 Revenues $149.8 $113.4 |
 Monthly Recurring Revenue ($ millions) 20 Quarter Ended June 30, 2012 2011 Monthly Software License Fees $24.5 $31.4 Maintenance Fees 49.4 35.6 Hosting Services 31.4 14.1 Monthly Recurring Revenue $105.3 $81.1 |
 Deferred Revenue and Expense ($ millions) 21 Quarter Ended June 30, March 31, June 30, March 31, 2012 2012 2011 2011 Short Term Deferred Revenue $165.1 $177.8 $131.7 $141.4 Long Term Deferred Revenue 38.7 29.5 30.0 33.2 Total Deferred Revenue $203.8 $207.3 $161.7 $174.6 Total Deferred Expense $9.9 $13.3 $12.6 $12.0 |
 Non-Cash Compensation, Acquisition Intangibles and Software, and Acquisition-Related Expenses 22 Quarter ended June 30, 2012 Quarter ended June 30, 2011 EPS Impact* $ in Millions EPS Impact* $ in Millions Amortization of acquisition- related intangibles 0.05 2.1 0.03 1.1 Amortization of acquisition- related software 0.05 2.1 0.03 1.0 Non-cash equity-based compensation 0.06 2.3 0.04 1.4 Total: $0.16 $6.5 $0.10 $3.5 * Tax Effected at 35% |
 Other Income / Expense ($ millions) 23 Quarter Ended June 30, 2012 March 31, 2012 June 30, 2011 March 31, 2011 Interest Income $0.2 $0.2 $0.2 $0.2 Interest Expense ($2.9) ($1.9) ($0.4) ($0.6) FX Gain / Loss ($0.3) ($0.6) $0.3 ($0.2) Other $0.0 $1.5 $0.0 ($0.1) Total Other Income (Expense) ($3.0) ($0.8) $0.1 ($0.7) |
 Adjusted EBITDA Quarter Ended June 30, 2012 Quarter Ended June 30, 2011 Net Income (Loss) $(4.7) $9.8 Income tax expense (benefit) (6.2) 0.7 Net Interest Expense 2.7 0.2 Net Other Expense 0.3 (0.3) Depreciation Expense 3.5 1.8 Amortization Expense 9.7 5.5 Non-Cash Compensation Expense 3.5 2.2 Adjusted EBITDA $8.8 $19.9 Deferred revenue 9.6 - Employee-related actions 3.3 - IT exit costs 3.1 - Other one-time S1 related expenses 0.9 - Adjusted EBITDA ex one-time expenses $25.7 19.9 24 |
 Non -GAAP Operating Income (loss) 25 Quarter Ended June 30, 2012 Quarter Ended June 30, 2011 Operating Income (Loss) $(7.9 ) $10.4 Plus Deferred Revenue 9.6 - Employee-related actions 3.6 - IT exit costs 3.1 - Other one-time S1 related expenses 0.9 - Non-GAAP Operating Income (loss) $9.3 $10.4 |
 Non-GAAP Financial Measures To supplement our financial results presented on a GAAP basis, we use the non-GAAP measure indicated in the tables, which exclude certain business combination accounting entries and expenses related to the acquisition of S1, as well as other significant non-cash expenses such as depreciation, amortization and share-based compensation, that we believe are helpful in understanding our past financial performance and our future results. The presentation of these non-GAAP financial measures should be considered in addition to our GAAP results and are not intended to be considered in isolation or as a substitute for the financial information prepared and presented in accordance with GAAP. Management generally compensates for limitations in the use of non-GAAP financial measures by relying on comparable GAAP financial measures and providing investors with a reconciliation of non-GAAP financial measures only in addition to and in conjunction with results presented in accordance with GAAP. We believe that these non-GAAP financial measures reflect an additional way of viewing aspects of our operations that, when viewed with our GAAP results, provide a more complete understanding of factors and trends affecting our business. • Non-GAAP operating income which is defined as operating income (loss) plus deferred revenue that would have been recognized in the normal course of business by S1 if not for GAAP purchase accounting requirements and one-time expense related to the acquisition of S1. Non-GAAP operating income should be considered in addition to, rather than as a substitute for, operating income. 26 |
 Non-GAAP Financial Measures • Adjusted EBITDA, which is defined as net income (loss) plus income tax expense, net interest income (expense), net other income (expense), depreciation, amortization and non-cash compensation, as well as deferred revenue that would have been recognized in the normal course of business by S1 if not for GAAP purchase accounting requirements and one-time expense related to the acquisition of S1. Adjusted EBITDA should be considered in addition to, rather than as a substitute for, operating income. • ACI is also presenting operating free cash flow, which is defined as net cash provided (used) by operating activities, less net after-tax payments associated with cash settlement of S1 stock options and S1 related transaction costs, net after-tax payments associated with IBM IT outsourcing transition, capital expenditures and plus or minus net proceeds from IBM. Operating free cash flow is considered a non-GAAP financial measure as defined by SEC Regulation G. We utilize this non- GAAP financial measure, and believe it is useful to investors, as an indicator of cash flow available for debt repayment and other investing activities, such as capital investments and acquisitions. We utilize operating free cash flow as a further indicator of operating performance and for planning investing activities. Operating free cash flow should be considered in addition to, rather than as a substitute for, net cash provided by operating activities. A limitation of operating free cash flow is that it does not represent the total increase or decrease in the cash balance for the period. This measure also does not exclude mandatory debt service obligations and, therefore, does not represent the residual cash flow available for discretionary expenditures. We believe that operating free cash flow is useful to investors to provide disclosures of our operating results on the same basis as that used by our management 27 |
 Non-GAAP Financial Measures • ACI also includes backlog estimates which are all software license fees, maintenance fees and services specified in executed contracts, as well as revenues from assumed contract renewals to the extent that we believe recognition of the related revenue will occur within the corresponding backlog period. We have historically included assumed renewals in backlog estimates based upon automatic renewal provisions in the executed contract and our historic experience with customer renewal rates. • Backlog is considered a non-GAAP financial measure as defined by SEC Regulation G. Our 60-month backlog estimate represents expected revenues from existing customers using the following key assumptions: • Maintenance fees are assumed to exist for the duration of the license term for those contracts in which the committed maintenance term is less than the committed license term. • License and facilities management arrangements are assumed to renew at the end of their committed term at a rate consistent with our historical experiences. • Non-recurring license arrangements are assumed to renew as recurring revenue streams. • Foreign currency exchange rates are assumed to remain constant over the 60-month backlog period for those contracts stated in currencies other than the U.S. dollar. • Our pricing policies and practices are assumed to remain constant over the 60-month backlog period. • Estimates of future financial results are inherently unreliable. Our backlog estimates require substantial judgment and are based on a number of assumptions as described above. These assumptions may turn out to be inaccurate or wrong, including for reasons outside of management’s control. For example, our customers may attempt to renegotiate or terminate their contracts for a number of reasons, including mergers, changes in their financial condition, or general changes in economic conditions in the customer’s industry or geographic location, or we may experience delays in the development or delivery of products or services specified in customer contracts which may cause the actual renewal rates and amounts to differ from historical experiences. Changes in foreign currency exchange rates may also impact the amount of revenue actually recognized in future periods. Accordingly, there can be no assurance that contracts included in backlog estimates will actually generate the specified revenues or that the actual revenues will be generated within the corresponding 60-month period. • Backlog should be considered in addition to, rather than as a substitute for, reported revenue and deferred revenue. 28 |
 Forward-Looking Statements This presentation contains forward-looking statements based on current expectations that involve a number of risks and uncertainties. Generally, forward-looking statements do not relate strictly to historical or current facts and may include words or phrases such as “believes,” “ will,” “expects,” “anticipates,” “intends,” and words and phrases of similar impact. The forward-looking statements are made pursuant to safe harbor provisions of the Private Securities Litigation Reform Act of 1995. Forward-looking statements in this presentation include, but are not limited to, statements regarding: • Annual cost savings expected from the S1 acquisition; • Business goal of growth in sales net of term extensions and building long-term backlog; • The company’s 12-month and 60-month backlog estimates and assumptions •Expectations regarding key market drivers, including EMV as a catalyst for change, and second half CY 2012 outlook; and • Expectations regarding 2012 financial guidance related to revenue, operating income and operating EBITDA, and overall cost synergies. 29 |
 Forward-Looking Statements • All of the foregoing forward-looking statements are expressly qualified by the risk factors discussed in our filings with the Securities and Exchange Commission. Such factors include but are not limited to, risks related to the global financial crisis and the continuing decline in the global economy, restrictions and other financial covenants in our credit facility, volatility and disruption of the capital and credit markets and adverse changes in the global economy, risks related to the expected benefits to be achieved in the transaction with S1, consolidations and failures in the financial services industry, the accuracy of management’s backlog estimates, the cyclical nature of our revenue and earnings and the accuracy of forecasts due to the concentration of revenue generating activity during the final weeks of each quarter, impairment of our goodwill or intangible assets, exposure to unknown tax liabilities, volatility in our stock price, risks from operating internationally, including fluctuations in currency exchange rates, increased competition, our offshore software development activities, customer reluctance to switch to a new vendor, the performance of our strategic product, BASE24-eps, the maturity of certain products, our strategy to migrate customers to our next generation products, ratable or deferred recognition of certain revenue associated with customer migrations and the maturity of certain of our products, demand for our products, failure to obtain renewals of customer contracts or to obtain such renewals on favorable terms, delay or cancellation of customer projects or inaccurate project completion estimates, business interruptions or failure of our information technology and communication systems, our alliance with International Business Machines Corporation (“IBM”), our outsourcing agreement with IBM, the complexity of our products and services and the risk that they may contain hidden defects or be subjected to security breaches or viruses, compliance of our products with applicable legislation, governmental regulations and industry standards, our compliance with privacy regulations, the protection of our intellectual property in intellectual property litigation, future acquisitions, strategic partnerships and investments and litigation, the risk that expected synergies, operational efficiencies and cost savings from the S1 acquisition may not be fully realized or realized within the expected time frame. For a detailed discussion of these risk factors, parties that are relying on the forward-looking statements should review our filings with the Securities and Exchange Commission, including our most recently filed Annual Report on Form 10-K, Registration Statement on Form S-4, and subsequent reports on Forms 10-Q and 8-K. 30 |
 ACI’s software underpins electronic payments throughout retail and wholesale banking, and commerce all the time, without fail. www.aciworldwide.com |