 May 2013 ACI Worldwide Investor Conferences May & June, 2013 Exhibit 99.1 |
 May 2013 Private Securities Litigation Reform Act of 1995 Safe Harbor for Forward-Looking Statements This presentation contains forward-looking statements based on current expectations that involve a number of risks and uncertainties. The forward-looking statements are made pursuant to safe harbor provisions of the Private Securities Litigation Reform Act of 1995. A discussion of these forward-looking statements and risk factors that may affect them is set forth at the end of this presentation. The Company assumes no obligation to update any forward-looking statement in this presentation, except as required by law. 1 |
 May 2013 About ACI Worldwide 24 of the top 25 and 67 of the top 100 global banks are customers 60-Month Backlog ~$3.1BN We are rated in the #1 or #2 position by industry analysts in nearly all categories We control 6% of the market spend 1/3 of all SWIFT transactions 65% of all fed wires ACI software enables $13 trillion in payments each day Revenue 2013 $895 - $915MM EBITDA 2013 $266 - $276MM Founded in 1975, ACI is a leading provider of electronic payments and transaction banking software solutions for financial institutions, retailers, processors and billers worldwide Leadership • Global payments company with a diversified, blue-chip customer base, >96% retention rates, and >70% annual recurring revenue • High quality products, ~20% of revenue invested in R&D, and substantial switching costs drive recurring revenue with strong renewal rates and significant competitive barriers • Provide mission critical software meeting increased regulatory demands • Market leader focused on increasing scale and improving competitive positioning within attractive markets • Low ongoing capital expenditures with a solid balance sheet and significant liquidity 1 Financial metrics represent 2013 guidance range 2 1 1 Op. Inc. 2013 $170 - $180MM 1 |
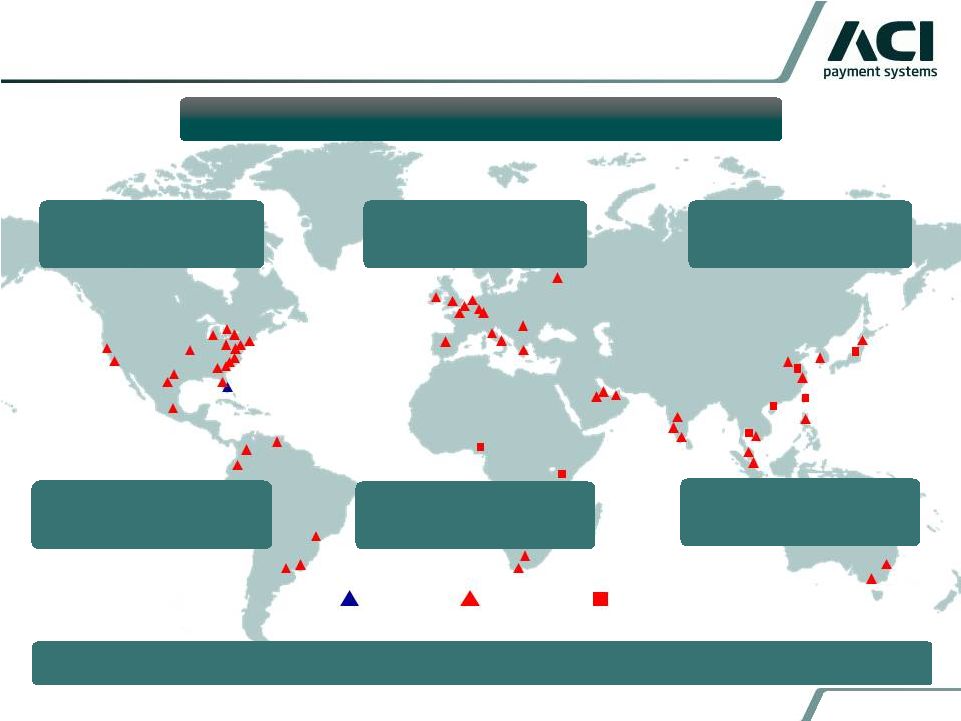 May 2013 Global Distribution and Customer Base Note: Figures include Online Resources 3 AMERICAS 1,950+ customers EMEA 500+ customers ASIA/PACIFIC 150+ customers ~ 2,600 customers in over 80 countries rely on ACI solutions ~ 4,200 employees in 36 countries Customers: ~ 180 processors globally Customers: ~ 290 retailers globally Customers: 600+ US billers Headquarters Regional Offices Distributors |
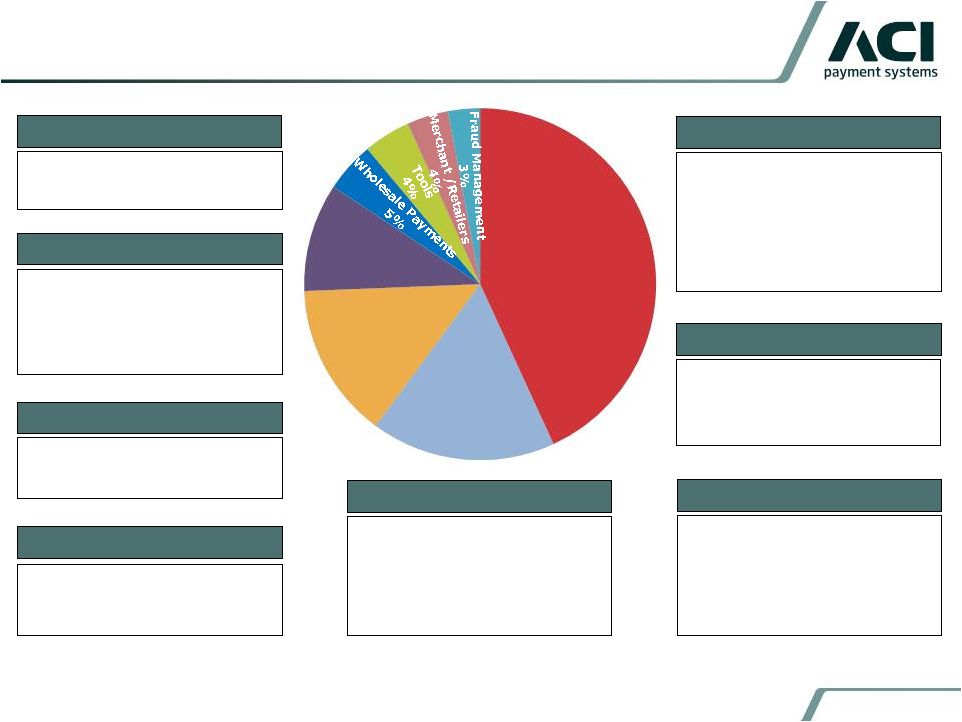 4 ACI is a Leading Provider of Electronic Payments and Transaction Banking Solutions Retail Payments 43% Online Banking 14% Community Banking 10% • U.S. and Int’l corporate online banking and cash management • U.S. and Int’l branch systems • Trade finance • Mobile banking • In-house or hosted solution • Sold to large FIs globally Online Banking • U.S. business and consumer online banking • U.S. branch system • Mobile banking • Hosted solutions • Sold to community FIs and credit unions Community Banking • U.S. and Int’l merchant retail payments engines • In-store integration • PCI compliance • Loyalty / stored value • Serves Retailers of all sizes Merchant Retail • Analytics • Payments Infrastructure • Testing tools Tools • Wholesale payments engines • Transaction banking • Serves FIs globally Wholesale Payments • Payments transaction fraud • Enterprise financial crimes • Case management Fraud Management Retail Payments • Retail payments engines • Card and account management • Authentication, authorization, acquiring, clearing and settlement • Single message format • Mobile payments • Sold to FIs and processors of all sizes globally • Bank Bill Pay (consolidator model) • Biller Direct (Biller Direct model) • Virtual Collections • Serves FIs, Billers, & Issuers • Hosted solutions Bill Pay / Collections ACI Product Family as % of 2012 Pro Forma Revenue Bill Pay / Collections 17% Note: Figures represent Pro Forma GAAP Revenue for Online Resources May 2013 |
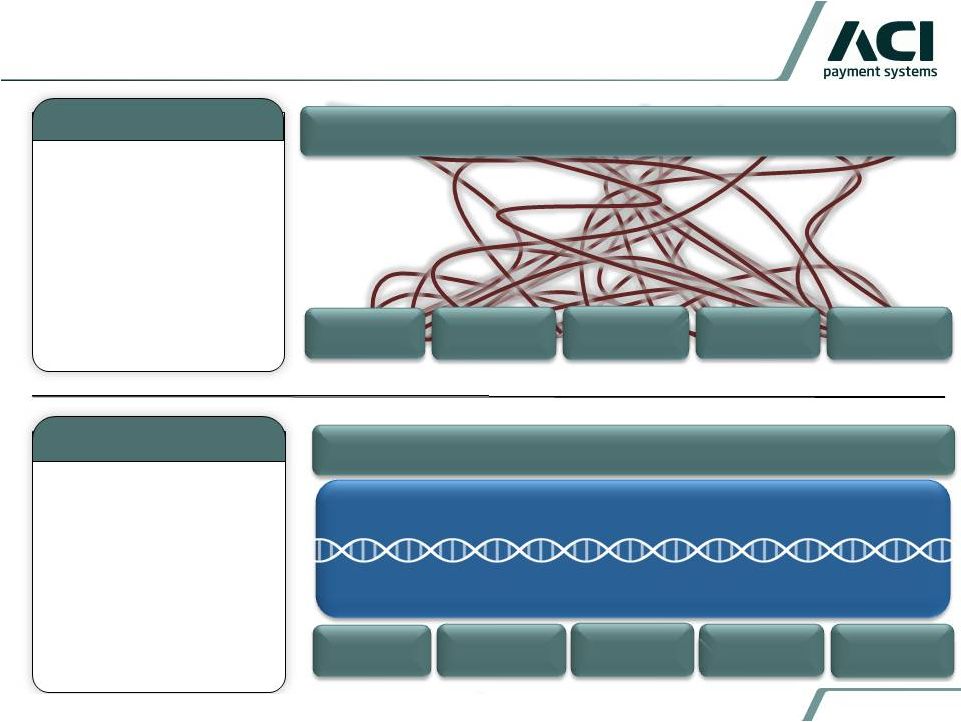 Universal Payments Platform (UPP) Strategy 5 Retail Wholesale Online Fraud Bill Pay Universal Payments Platform (UPP) Service Management and Orchestration Today Orchestrated integration: Past Customers burdened with integration issues: Retail Wholesale Online Fraud Bill Pay FI Core Systems Reference Architecture FI Core Systems Reference Architecture • Massive customization needs • High cost of maintenance • Slow time to market • Difficult to achieve differentiation • Simplified • Lower cost • Faster time to market • Increased differentiation May 2013 |
 May 2013 6 Our Customers are Top Global Banks, Processors and Retailers Customers are Top Global Banks, Processors, Billers, and Retailers |
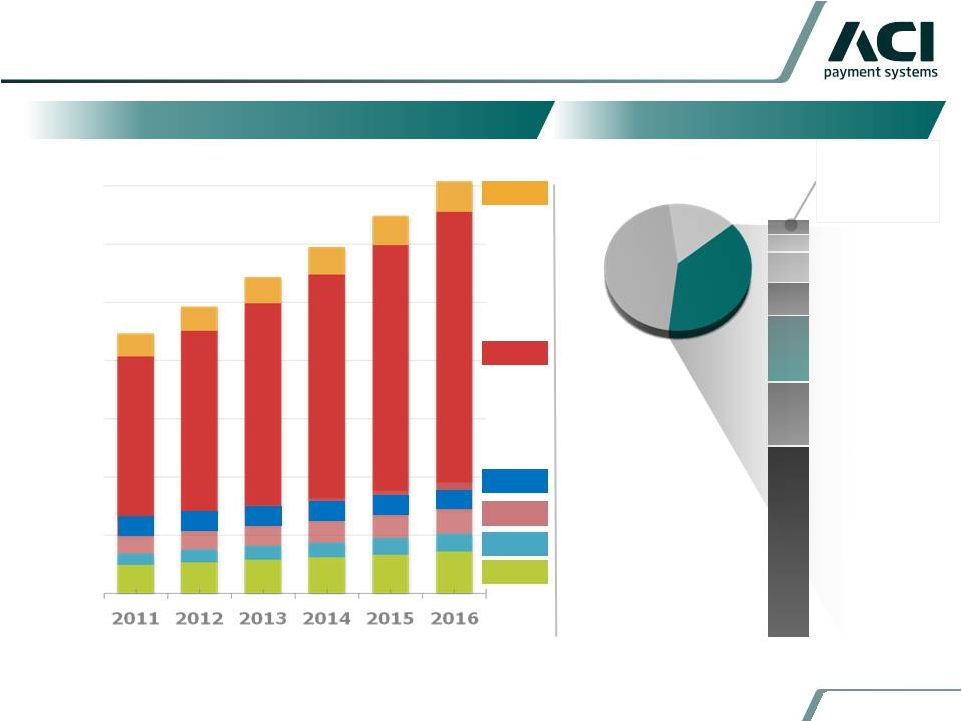 7 Large & Growing Worldwide Payment Opportunity Source: IDC Financial Insights 2011, ACI Internal Analysis 8,949 9,864 10,881 11,914 12,989 14,184 5.8% 10.6% 10.5% 10.2% 7.7% 7.2% 796 5,625 556 604 381 987 844 6,259 619 644 429 1,068 898 6,965 688 691 483 1,155 957 7,695 760 744 510 1,247 1,005 8,456 834 796 562 1,335 1,057 9,307 916 854 619 1,430 Retail Banking Payments Merchant Retailer Payments 5YR CAGR (2011-16)= 9.6% Wholesale Banking Payments 2011 ESTIMATED SHARE SERVICEABLE SOFTWARE INDUSTRY SPEND IN 2016 = $14.2B Tools and Infrastructure Online Banking and Cash Management Fraud Management ($ in millions) BPO (e.g.. processors) IT SERVICES SOFTWARE FundTech Bottomline NICE (Actimize) BAE (Norkom & Detica) Clear2Pay Dovetail FIS 16% 38% 46% OTHER (Homegrown & Regional) IBM ACI – 2011 Estimated Share of 8% FAIR ISAAC (FICO) INTUIT (Digital Insight) SAS Note: ACI market share pro forma for S1 acquisition Source: IDC Financial Insights, June 2011; Company reports and ACI analysis May 2013 |
 • Shift from paper to electronic • Compounding regulatory requirements • Revenue and profitability pressures • Complexity from globalization FIs looking to transform their businesses by: • Driving down unit costs • Launching new products quicker • Reducing risks • Improving customer satisfaction and loyalty • Vendor Consolidation 8 Favorable Industry and Customer Trends Customer Trends Industry Dynamics • Total addressable market growing 9.6% CAGR ~$10bn in 2012 • 50% of addressable market is in-sourced (homegrown) applications • Global transaction volume growth expected to be 9% CAGR through 2020 Market Sizing • Increasing fraud costs • Convergence of payments; real-time • Legacy systems increasingly difficult to update May 2013 |
 9 Strategy to Drive Superior Performance Continued focus on Control, Profitability and Growth • Continue to increase recurring revenue base while maintaining industry leading retention rates • Expand customer relationships by cross-selling (on average customers use less than 3 ACI products) • Lead payments transformation with Universal Payments Platform delivering technology-enabled efficiencies • Expand geographically Growth Drivers • Expand margins through operating leverage and process-driven operating philosophy • Realize cost synergies derived from recent acquisitions Continuous Improvements to Drive Margin Expansion • Buy, build or partner to fill-in product gaps or expand customer base • Recent acquisitions have added product, scale and market breadth Disciplined Acquisition/ Investment Strategy May 2013 |
 Financial Overview May 2013 |
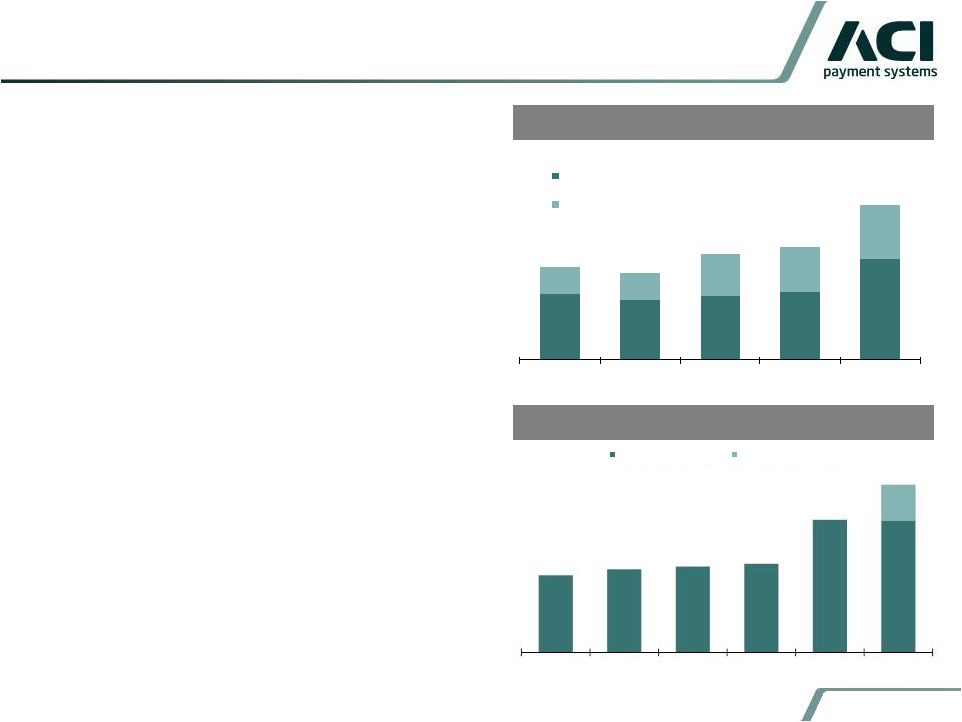
 May 2013 11 Financial Summary (2008 – 2013E) 17% CAGR Note: Dollars are in Millions. Total Revenue, Adjusted EBITDA and Operating Income are presented on a non-GAAP basis adding back deferred revenue haircuts and other one-time expenses. 2013 estimates assume the midpoint of company guidance. 39% CAGR 52% CAGR $28 $37 $65 $30 $63 $67 $24 $54 2008 2009 2010 2011 2012 LTM 3/31/2013 Operating Free Cash Flow IBM Alliance Prepayment $418 $406 $418 $465 $689 $905 2008 2009 2010 2011 2012 2013E Operating Free Cash Flow Non-GAAP Operating Income & Margin Adjusted EBITDA & Margin Non-GAAP Revenue $22 $42 $54 $73 $128 $175 5% 10% 13% 16% 19% 19% 2008 2009 2010 2011 2012 2013E Operating Income Operating Margin % $52 $73 $88 $113 $191 $271 12% 18% 21% 24% 28% 30% 2008 2009 2010 2011 2012 2013E Adjusted EBITDA % Margin |
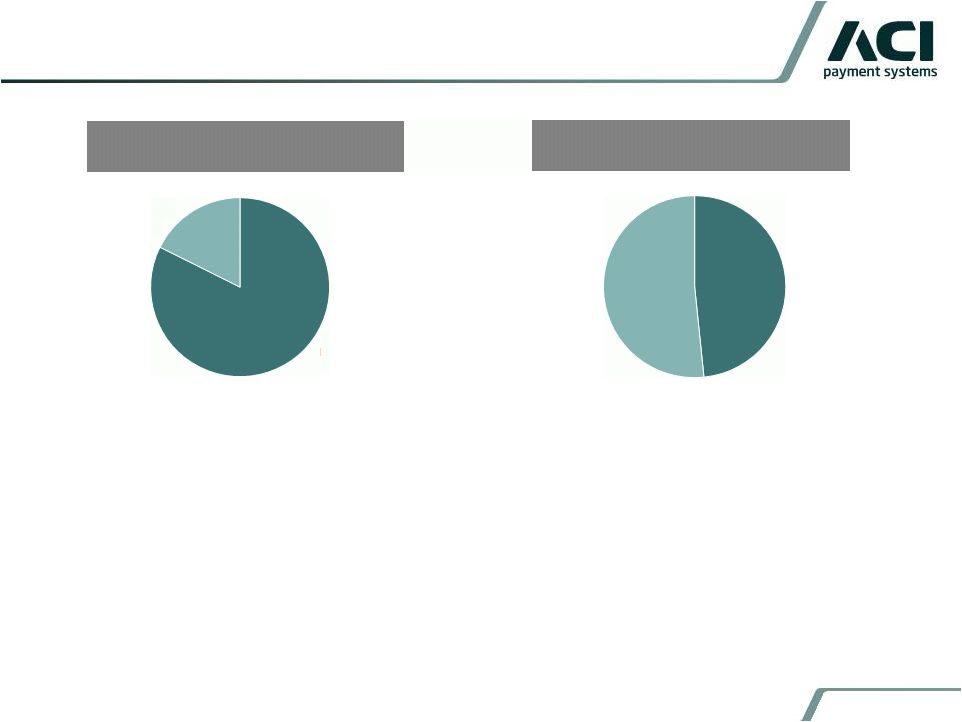 May 2013 12 Large & Growing Backlog Provides Revenue and Earnings Visibility Note: Dollars are in Millions, data as of 3/31/2013 • Backlog from monthly recurring revenues and scheduled project go-lives drives 80%+ of GAAP revenue, leading to very high visibility on an annual basis • Recurring revenues (maintenance, license, and hosting fees) comprise majority of 60-month backlog • Backlog assumes continued >96% retention and excludes growth in users and incidental capacity Monthly Recurring, 82% Non - Recurring, 18% Committed, 48% Renewal, 52% 12-Month Backlog - $743MM 60-Month Backlog - $3.1BN |
 13 Low Attrition & Fixed Term Licenses Produce Recurring Revenue Model 60 Month Backlog Sales Bookings Note: Dollars are in Millions. Revenue presented on a GAAP basis; Pro Forma includes Online Resources for full 12 months. • >70% recurring revenue (includes maintenance, license and hosting fees) • 80% of annual revenue comes from backlog • 95% of our contracts are transaction based • 5-year fixed term licenses – Legacy S1 contracts are generally perpetual license fees and 3-year fixed term for hosting – Legacy ORCC contracts are generally transaction- based and recurring • Renewal rates across ACI products >96% • New Account / New Product Sales – revenue generally split evenly among license, maintenance and service $323 $293 $315 $330 $501 $136 $132 $210 $226 $265 $460 $425 $525 $556 $766 2008 2009 2010 2011 2012 ACI Sales, Net of Term Extensions ACI Term Extensions $2,396 $660 $1,407 $1,517 $1,566 $1,617 $2,416 $3,056 2008 2009 2010 2011 2012 3/31/2013 ACI 60-Month Backlog ORCC 60-Month Backlog 13 May 2013 |
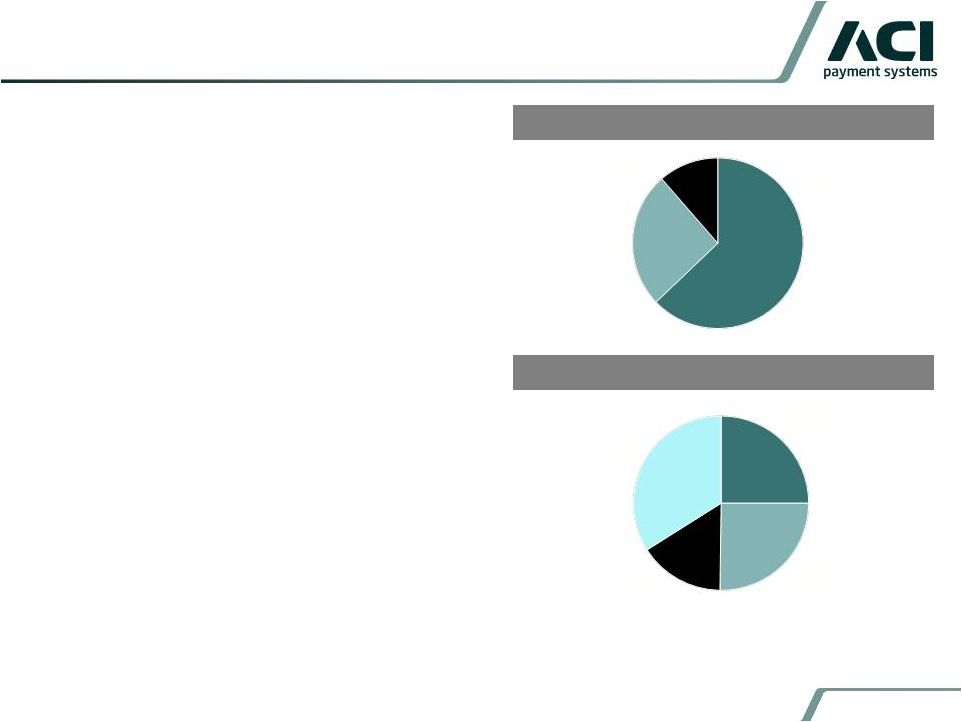 May 2013 14 Diversified Revenue Base by Geography & Type LTM 3/31/2013 Revenue by Region LTM 3/31/2013 Revenue by Type • Diversified global company with customers spanning more than 80 countries • Approximately 80% of business denominated in U.S. dollars • EMEA is comprised of ~30% UK- derived revenue, 20% Middle East/Africa and 50% Europe (inclusive of 32 countries) • Online Resources business is 100% U.S. focused and 95% hosting with the remainder split between maintenance / services • Higher margin revenues (maintenance, license and hosting fees) comprise >80% of revenue Note: Revenue percentages based on GAAP and includes Online Resources for full 12 months. Americas 63% EMEA 26% Asia/ Pacific 11% Licenses 25% Maintenance 25% Services 16% Hosting 34% |
 May 2013 15 Diversified Customer Base with Significant Cross Sales Opportunity • Historically, no ACI customer has accounted for more than 4% of total revenue • In FY 2012, the largest customer represented 3.3% of total pro forma revenue, utilizing 8 different products (includes a combination of legacy ACI, S1 and ORCC) • Average customers uses <3 products, representing large cross selling opportunity ACI Pro Forma FY 2012 Revenue by Customer Customer % of Total Customer #1 3.3% Customer #2 1.7% Customer #3 1.7% Customer #4 1.4% Customer #5 1.1% Customer #6 1.1% Customer #7 0.9% Customer #8 0.9% Customer #9 0.9% Customer #10 0.9% Customer #11 0.9% Customer #12 0.9% Customer #13 0.8% Customer #14 0.7% Customer #15 0.7% Customer #16 0.7% Customer #17 0.7% Customer #18 0.7% Customer #19 0.7% Customer #20 0.7% Top 20 21.4% All Others 78.6% Total ACI Pro Forma 2012 Revenue 100.0% No single customer represents more than 4% of pro forma 2012 revenue |
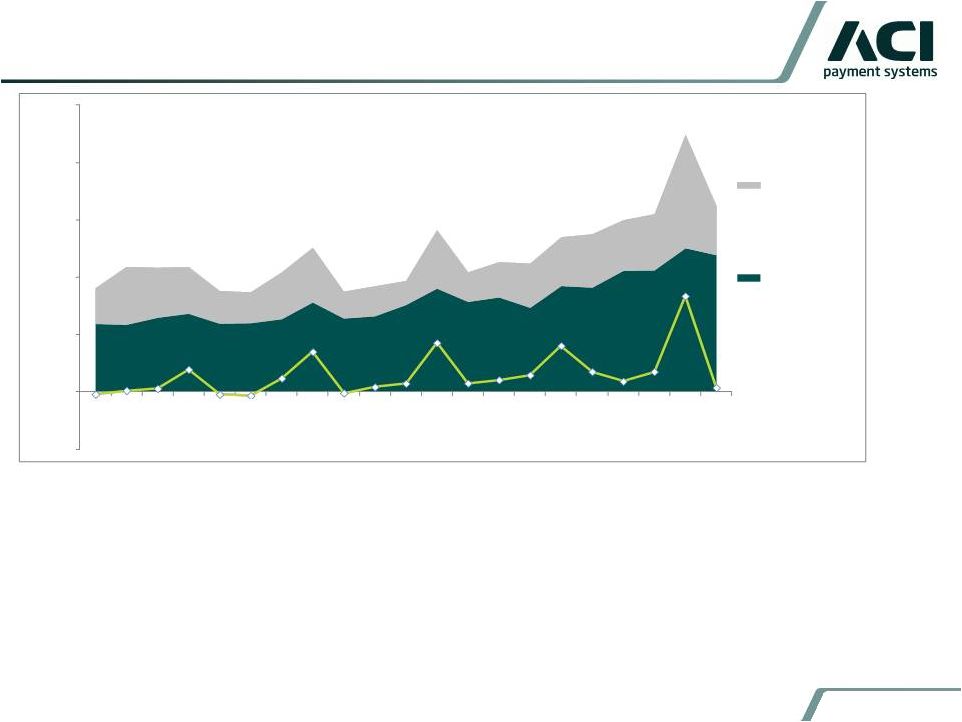 May 2013 >70% Annual Recurring Revenue and Growing Recurring revenue has increased in dollar amount and as a percent of revenue Virtually all components of revenue are seasonally stronger in the back half • Revenue have averaged 44% in 1H and 56% in 2H • Sales bookings higher in Q4 given customer’s “budget flush” • Project “Go Lives” often occur in Q4 • Recurring annual license payments mostly occur in Q4 • ~40% - 50% of incidental capacity revenues historically occur in Q4 • Implementation accounting causes quarter-quarter variability • Services for implementation projects are expensed as incurred, while revenue is often deferred until “Go-Live” events, which causes this revenue to be very high margin 16 (50,000) 50,000 100,000 150,000 200,000 250,000 Q108 Q208 Q308 Q408 Q109 Q209 Q309 Q409 Q110 Q210 Q310 Q410 Q111 Q211 Q311 Q411 Q112 Q212 Q312 Q412 Q113 Ongoing services, implementations, increased capacity sales and other Recurring revenue: (hosting, maintenance and license fees (paid monthly, quarterly or annually) - |
  May 2013 17 2013 Outlook Guidance • Represents 9 2/3 months of financial results of ORCC • Includes 7.5 months of annual cost synergies of $12 million to be realized in 2013 • Excludes impact of one-time transaction and integration expenses expected to be approximately $14 million • Excludes impact of deferred revenue haircut of approximately $6 million • Guidance assumes estimates for non-cash purchase accounting adjustments, intangible valuations and deferred revenue haircut First Half 2013 Revenue Outlook • Expected to be in a range of 41%-42% of full year revenue guidance Current Non-GAAP Guidance ORCC Guidance $'s in millions Range Impact* Range Revenue $765 - $785 $128 - $132 $895 - $915 Operating Income $150 - $160 $19 - $21 $170 - $180 Adjusted EBITDA $230 - $240 $35 - $37 $266 - $276 * ORCC results are for the period March 11, 2013 through December 31, 2013 and exclude the impact of deferred revenue haircut and one-time expenses |
 May 2013 Questions? |
 May 2013 Non-GAAP Financial Measures To supplement our financial results presented on a GAAP basis, we use the non-GAAP measure indicated in the tables, which exclude certain business combination accounting entries and expenses related to the acquisitions of ORCC and S1, as well as other significant non-cash expenses such as depreciation, amortization and share-based compensation, that we believe are helpful in understanding our past financial performance and our future results. The presentation of these non-GAAP financial measures should be considered in addition to our GAAP results and are not intended to be considered in isolation or as a substitute for the financial information prepared and presented in accordance with GAAP. Management generally compensates for limitations in the use of non-GAAP financial measures by relying on comparable GAAP financial measures and providing investors with a reconciliation of non-GAAP financial measures only in addition to and in conjunction with results presented in accordance with GAAP. We believe that these non- GAAP financial measures reflect an additional way of viewing aspects of our operations that, when viewed with our GAAP results, provide a more complete understanding of factors and trends affecting our business. Certain non-GAAP measures include: 19 • Non-GAAP revenue: revenue plus deferred revenue that would have been recognized in the normal course of business by S1 and ORCC if not for GAAP purchase accounting requirements. Non-GAAP revenue should be considered in addition to, rather than as a substitute for, revenue. • Non-GAAP operating income: operating income (loss) plus deferred revenue that would have been recognized in the normal course of business by S1 and ORCC if not for GAAP purchase accounting requirements and one-time expense related to the acquisitions of ORCC and S1. Non-GAAP operating income should be considered in addition to, rather than as a substitute for, operating income. • Adjusted EBITDA: net income (loss) plus income tax expense, net interest income (expense), net other income (expense), depreciation, amortization and non-cash compensation, as well as deferred revenue that would have been recognized in the normal course of business by S1 and ORCC if not for GAAP purchase accounting requirements and one-time expense related to the acquisitions of ORCC and S1. Adjusted EBITDA should be considered in addition to, rather than as a substitute for, operating income. |
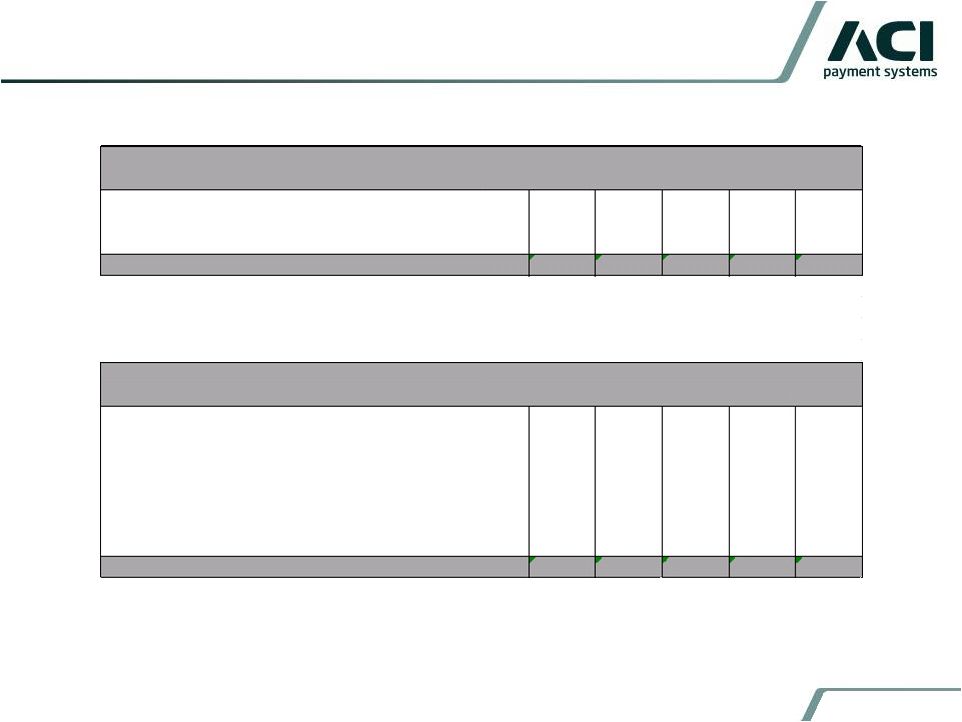 May 2013 Non-GAAP Financial Measures 20 Non-GAAP Revenue (millions) 2012 2011 2010 2009 2008 Revenue $ 667 $ 465 $ 418 $ 406 $ 418 Plus: Deferred revenue fair value adjustment 22 - - - - Non-GAAP Revenue $ 689 $ 465 $ 418 $ 406 $ 418 Non-GAAP Operating Income (millions) 2012 2011 2010 2009 2008 Operating income $ 74 $ 66 $ 54 $ 42 $ 22 Plus: Deferred revenue fair value adjustment 22 - - - - Employee related actions 15 - - - - Facility closure costs 5 - - - - IT exit costs 3 - - - - Other one-time S1 related expenses 9 7 - - - Non-GAAP Operating Income $ 128 $ 73 $ 54 $ 42 $ 22 For the Years ended December 31, For the Years ended December 31, |
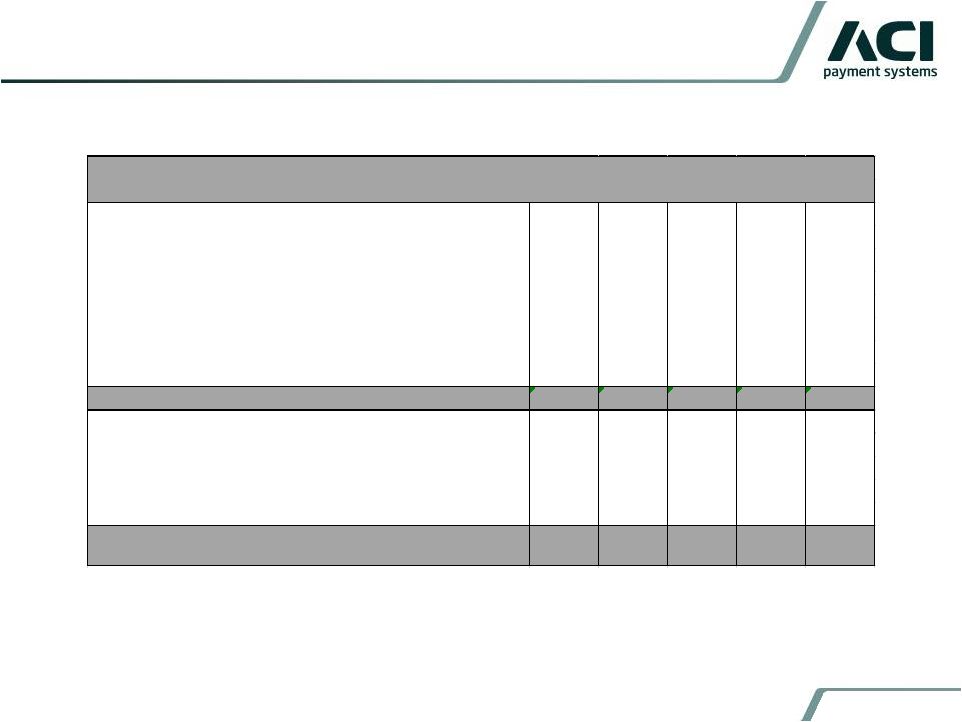 May 2013 21 Non-GAAP Financial Measures Adjusted EBITDA (millions) 2012 2011 2010 2009 2008 Net income $ 49 $ 46 $ 27 $ 20 $ 11 Plus: Income tax expense 16 18 22 13 17 Net interest expense 10 1 1 2 2 Net other expense (income) - 1 3 7 (8) Depreciation expense 13 8 7 6 6 Amortization expense 38 21 20 17 16 Non-cash compensation expense 15 11 8 8 8 Adjusted EBIDTA 141 106 88 73 52 Deferred revenue fair value adjustment 22 - - - - Employee related actions 11 - - - - Facility closure costs 5 - - - - IT exit costs 3 - - - - Other one-time S1 related expenses 9 7 - - - Adjusted EBIDTA excluding one-time transaction expenses $ 191 $ 113 $ 88 $ 73 $ 52 For the Years ended December 31, |
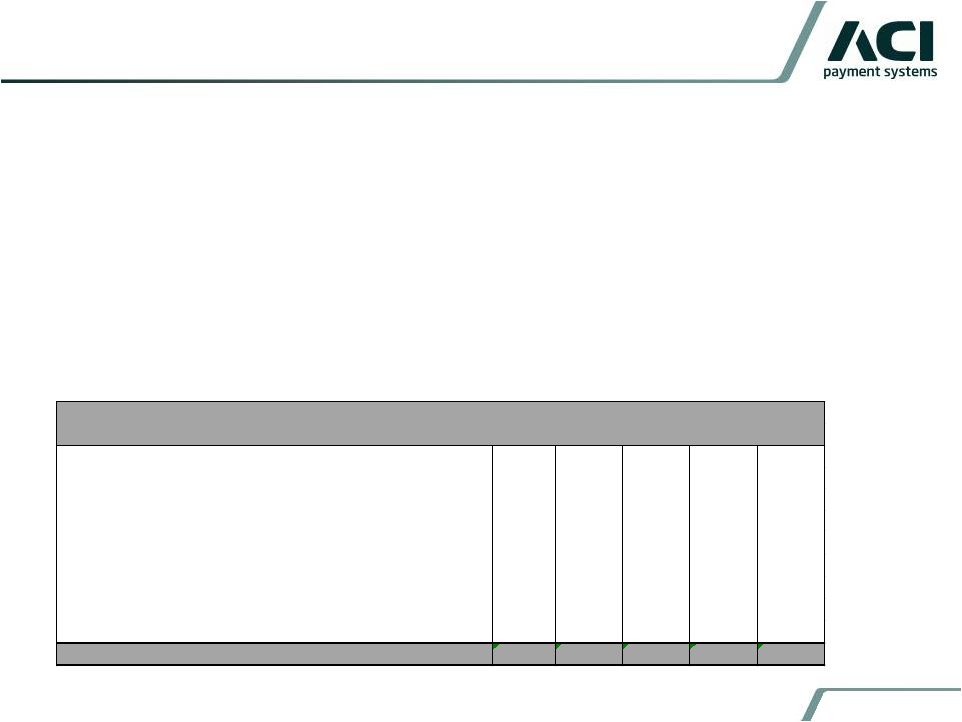 May 2013 Non-GAAP Financial Measures ACI is also presenting operating free cash flow, which is defined as net cash provided by operating activities, plus net after-tax payments associated with employee-related actions and facility closures, net after-tax payments associated with acquisition related transaction costs, net after-tax payments associated with IBM IT outsourcing transition and termination, and less capital expenditures. Operating free cash flow is considered a non-GAAP financial measure as defined by SEC Regulation G. We utilize this non-GAAP financial measure, and believe it is useful to investors, as an indicator of cash flow available for debt repayment and other investing activities, such as capital investments and acquisitions. We utilize operating free cash flow as a further indicator of operating performance and for planning investing activities. Operating free cash flow should be considered in addition to, rather than as a substitute for, net cash provided by operating activities. A limitation of operating free cash flow is that it does not represent the total increase or decrease in the cash balance for the period. This measure also does not exclude mandatory debt service obligations and, therefore, does not represent the residual cash flow available for discretionary expenditures. We believe that operating free cash flow is useful to investors to provide disclosures of our operating results on the same basis as that used by our management. 22 Reconciliation of Operating Free Cash Flow (millions) 2012 2011 2010 2009 2008 Net cash provided (used) by operating activities $ (9) $ 84 $ 81 $ 44 $ 78 Net after-tax payments associated with employee-related actions 6 - - 3 4 Net after-tax payments associated with lease terminations 3 - - - 1 Net after-tax payments associated with S1 related transaction costs 9 3 - - - Net after-tax payments associated with cash settlement of S1 options 10 - - - - Net after-tax payments associated with IBM IT Outsourcing Transition 1 1 1 - - Plus IBM Alliance liability repayment 21 - - - - Less capital expenditures (17) (19) (13) (10) (12) Less Alliance technical enablement expenditures - (2) (6) (7) (6) Operating Free Cash Flow $ 24 $ 67 $ 63 $ 30 $ 65 For the Years ended December 31, |
 May 2013 Non-GAAP Financial Measures ACI also includes backlog estimates, which include all software license fees, maintenance fees and services specified in executed contracts, as well as revenues from assumed contract renewals to the extent that we believe recognition of the related revenue will occur within the corresponding backlog period. We have historically included assumed renewals in backlog estimates based upon automatic renewal provisions in the executed contract and our historic experience with customer renewal rates. Backlog is considered a non-GAAP financial measure as defined by SEC Regulation G. Our 60-month backlog estimate represents expected revenues from existing customers using the following key assumptions: 23 • Maintenance fees are assumed to exist for the duration of the license term for those contracts in which the committed maintenance term is less than the committed license term. • License and facilities management arrangements are assumed to renew at the end of their committed term at a rate consistent with our historical experiences. • Non-recurring license arrangements are assumed to renew as recurring revenue streams. • Foreign currency exchange rates are assumed to remain constant over the 60-month backlog period for those contracts stated in currencies other than the U.S. dollar. • Our pricing policies and practices are assumed to remain constant over the 60-month backlog period. |
 May 2013 Non-GAAP Financial Measures Estimates of future financial results are inherently unreliable. Our backlog estimates require substantial judgment and are based on a number of assumptions as described above. These assumptions may turn out to be inaccurate or wrong, including for reasons outside of management’s control. For example, our customers may attempt to renegotiate or terminate their contracts for a number of reasons, including mergers, changes in their financial condition, or general changes in economic conditions in the customer’s industry or geographic location, or we may experience delays in the development or delivery of products or services specified in customer contracts which may cause the actual renewal rates and amounts to differ from historical experiences. Changes in foreign currency exchange rates may also impact the amount of revenue actually recognized in future periods. Accordingly, there can be no assurance that contracts included in backlog estimates will actually generate the specified revenues or that the actual revenues will be generated within the corresponding 60-month period. Backlog should be considered in addition to, rather than as a substitute for, reported revenue and deferred revenue. 24 |
 May 2013 Forward-Looking Statements 25 This presentation contains forward-looking statements based on current expectations that involve a number of risks and uncertainties. Generally, forward-looking statements do not relate strictly to historical or current facts and may include words or phrases such as “believes,” “ will,” “expects,” “anticipates,” “intends,” and words and phrases of similar impact. The forward-looking statements are made pursuant to safe harbor provisions of the Private Securities Litigation Reform Act of 1995. Forward-looking statements in this presentation include, but are not limited to, statements regarding: • Expectations that we will generate $19.5 million in annual cost synergies, of which $12 million will be realized in 2013, and that additional cost synergies will be realized from facilities and data center consolidation. • Expectations regarding 2013 financial guidance related to revenue, operating income and adjusted EBITDA. • Expectations of future growth by increasing our recurring revenue base, cross-selling more products, expanding geographically, utilizing our Universal Payment Platform, leveraging Online Resources’ base of biller connections, and capitalizing on industry and customer trends • Expectations that our margins will increase through operating leverage and cost savings synergies from recent acquisitions |
 May 2013 Forward-Looking Statements 26 All of the foregoing forward-looking statements are expressly qualified by the risk factors discussed in our filings with the Securities and Exchange Commission. Such factors include but are not limited to, increased competition, the performance of our strategic product, BASE24-eps, demand for our products, restrictions and other financial covenants in our credit facility, consolidations and failures in the financial services industry, customer reluctance to switch to a new vendor, the accuracy of management’s backlog estimates, the maturity of certain products, our strategy to migrate customers to our next generation products, ratable or deferred recognition of certain revenue associated with customer migrations and the maturity of certain of our products, failure to obtain renewals of customer contracts or to obtain such renewals on favorable terms, delay or cancellation of customer projects or inaccurate project completion estimates, volatility and disruption of the capital and credit markets and adverse changes in the global economy, our existing levels of debt, impairment of our goodwill or intangible assets, litigation, future acquisitions, strategic partnerships and investments, risks related to the expected benefits to be achieved in the transaction with Online Resources, the complexity of our products and services and the risk that they may contain hidden defects or be subjected to security breaches or viruses, compliance of our products with applicable legislation, governmental regulations and industry standards, our compliance with privacy regulations, the protection of our intellectual property in intellectual property litigation, the cyclical nature of our revenue and earnings and the accuracy of forecasts due to the concentration of revenue generating activity during the final weeks of each quarter, business interruptions or failure of our information technology and communication systems, our offshore software development activities, risks from operating internationally, including fluctuations in currency exchange rates, exposure to unknown tax liabilities, and volatility in our stock price. For a detailed discussion of these risk factors, parties that are relying on the forward-looking statements should review our filings with the Securities and Exchange Commission, including our most recently filed Annual Report on Form 10-K, Registration Statement on Form S-4, and subsequent reports on Forms 10-Q and 8-K. |
 May 2013 ACI’s software underpins electronic payments throughout retail and wholesale banking, and commerce all the time, without fail. www.aciworldwide.com |